UNITED STATES
SECURITIES AND EXCHANGE COMMISSION
Washington, DC 20549
FORM 10-Q
|
|
| [ X ] QUARTERLY REPORT UNDER SECTION 13 OR 15 (d) OF THE SECURITIES EXCHANGE ACT OF 1934 |
| |
| [ _ ] TRANSITION REPORT PURSUANT TO SECTION 13 OR 15 (d) OF THE SECURITIES EXCHANGE ACT OF 1934 |
|
| | |
For Quarter Ended SeptemberDecember 1, 2018 | | Commission File No. 001-15141 |
HERMAN MILLER, INC.
|
| | |
| A Michigan Corporation | | ID No. 38-0837640 |
| | | |
| 855 East Main Avenue, Zeeland, MI 49464-0302 | | Phone (616) 654 3000 |
Indicate by check mark whether the registrant:
(1) has filed all reports required to be filed by Section 13 or 15(d) of the Securities Exchange Act of 1934 during the preceding 12 months, and (2) has been subject to such filing requirements for the past 90 days.
Yes [ X ] No [_]
Indicate by check mark whether the registrant has submitted electronically and posted on its corporate Web site, if any, every Interactive Data File required to be submitted and posted pursuant to Rule 405 of Regulation S-T during the preceding 12 months (or for such shorter period that the registrant was required to submit and post such files).
Yes [ X ] No [_]
Indicate by check mark whether the registrant is a large accelerated filer, an accelerated filer, a non-accelerated filer, or a smaller reporting company. See definition of “large accelerated filer,” “accelerated filer,” and “smaller reporting company” in Rule 12b-2 of the Exchange Act.
|
| | | | |
| Large accelerated filer [ X ] | Accelerated filer [_] | Non-accelerated filer [_] | Smaller reporting company [_] | Emerging growth company [_] |
If an emerging growth company, indicate by check mark if the registrant has elected not to use the extended transition period for complying with any new or revised financial accounting standards provided pursuant to Section 13(a) of the Exchange Act [__]
Indicate by check mark whether the registrant is a shell company (as defined in Rule 12b-2 of the Exchange Act).
Yes [_] No [ X ]
Common Stock Outstanding at October 8, 2018January 7, 2019 - 59,336,29158,895,990 shares
Herman Miller, Inc. Form 10-Q
Table of Contents
|
| | |
| | | Page No. |
| Part I — Financial Information | |
| | Item 1 Financial Statements (Unaudited) | |
| | Condensed Consolidated Statements of Comprehensive Income — Three and Six Months Ended SeptemberDecember 1, 2018 and SeptemberDecember 2, 2017 | |
| | Condensed Consolidated Balance Sheets — SeptemberDecember 1, 2018 and June 2, 2018 | |
| | Condensed Consolidated Statements of Cash Flows — ThreeSix Months Ended SeptemberDecember 1, 2018 and SeptemberDecember 2, 2017 | |
| | Condensed Consolidated Statements of Stockholders' Equity — ThreeSix Months Ended SeptemberDecember 1, 2018 and SeptemberDecember 2, 2017 | |
| | Notes to Condensed Consolidated Financial Statements | |
| | | |
| | | |
| | | |
| | | |
| | | |
| | | |
| | | |
| | | |
| | | |
| | | |
| | | |
| | | |
| | | |
| | | |
| | | |
| | | |
| | | |
| | Item 2 Management's Discussion and Analysis of Financial Condition and Results of Operations | |
| | Item 3 Quantitative and Qualitative Disclosures about Market Risk | |
| | Item 4 Controls and Procedures | |
| Part II — Other Information | |
| | Item 1 Legal Proceedings | |
| | Item 1A Risk Factors | |
| | Item 2 Unregistered Sales of Equity Securities and Use of Proceeds | |
| | Item 3 Defaults upon Senior Securities | |
| | Item 4 Mine Safety Disclosures | |
| | Item 5 Other Information | |
| | Item 6 Exhibits | |
| | Signatures | |
Herman Miller, Inc.
Condensed Consolidated Statements of Comprehensive Income
(Dollars in millions, except per share data)
(Unaudited)
| | | | Three Months Ended | Three Months Ended | | Six Months Ended |
| | September 1, 2018 | | September 2, 2017 | December 1, 2018 | | December 2, 2017 | | December 1, 2018 | | December 2, 2017 |
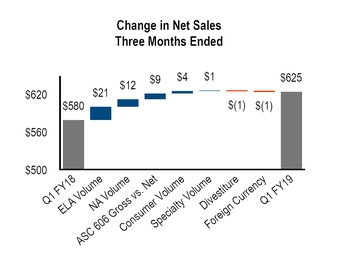
| Net sales | $ | 624.6 |
| | $ | 580.3 |
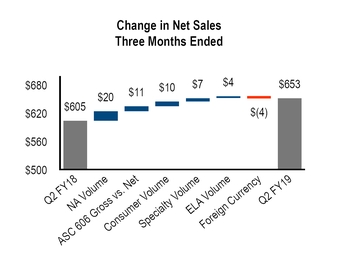
| $ | 652.6 |
| | $ | 604.6 |
| | $ | 1,277.3 |
| | $ | 1,184.8 |
|
| Cost of sales | 399.5 |
| | 363.4 |
| 417.0 |
| | 382.5 |
| | 816.6 |
| | 745.8 |
|
| Gross margin | 225.1 |
| | 216.9 |
| 235.6 |
| | 222.1 |
| | 460.7 |
| | 439.0 |
|
| Operating expenses: | | | | | | | | | | |
| Selling, general and administrative | 159.5 |
| | 146.8 |
| 163.2 |
| | 153.2 |
| | 322.7 |
| | 300.7 |
|
| Restructuring and impairment expenses | 1.1 |
| | 1.4 |
| 0.3 |
| | 0.5 |
| | 1.4 |
| | 1.9 |
|
| Design and research | 18.5 |
| | 19.2 |
| 19.0 |
| | 18.0 |
| | 37.5 |
| | 36.5 |
|
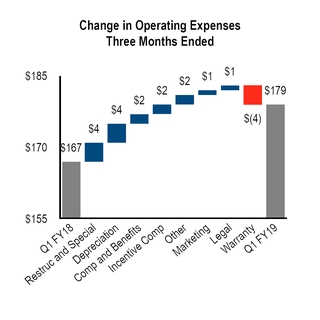
| Total operating expenses | 179.1 |
| | 167.4 |
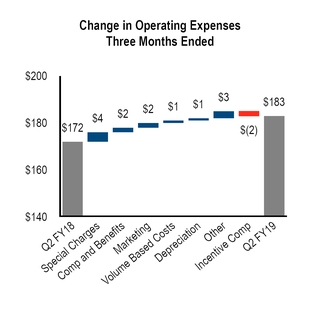
| 182.5 |
| | 171.7 |
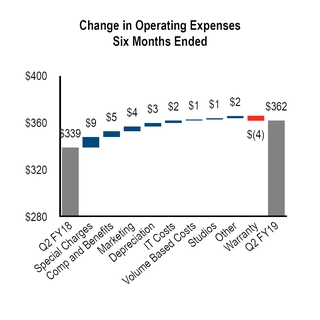
| | 361.6 |
| | 339.1 |
|
| Operating earnings | 46.0 |
| | 49.5 |
| 53.1 |
| | 50.4 |
| | 99.1 |
| | 99.9 |
|
| Other expenses: | | | | | | | | | | |
| Interest expense | 2.9 |
| | 3.7 |
| 3.1 |
| | 3.7 |
| | 6.0 |
| | 7.4 |
|
| Other, net | (1.0 | ) | | (0.7 | ) | 0.7 |
| | (0.3 | ) | | (0.3 | ) | | (1.0 | ) |
| Earnings before income taxes and equity income | 44.1 |
| | 46.5 |
| 49.3 |
| | 47.0 |
| | 93.4 |
| | 93.5 |
|
| Income tax expense | 8.9 |
| | 14.2 |
| 11.2 |
| | 14.3 |
| | 20.0 |
| | 28.5 |
|
| Equity income from nonconsolidated affiliates, net of tax | 0.7 |
| | 0.8 |
| 1.2 |
| | 0.8 |
| | 1.8 |
| | 1.5 |
|
| Net earnings | 35.9 |
| | 33.1 |
| 39.3 |
| | 33.5 |
| | 75.2 |
| | 66.5 |
|
| Net earnings attributable to noncontrolling interests | 0.1 |
| | — |
| — |
| | — |
| | 0.1 |
| | — |
|
| Net earnings attributable to Herman Miller, Inc. | $ | 35.8 |
| | $ | 33.1 |
| $ | 39.3 |
| | $ | 33.5 |
| | $ | 75.1 |
| | $ | 66.5 |
|
| | | | | | | | | | | |
| Earnings per share — basic | $ | 0.60 |
| | $ | 0.55 |
| $ | 0.66 |
| | $ | 0.56 |
| | $ | 1.27 |
| | $ | 1.11 |
|
| Earnings per share — diluted | $ | 0.60 |
| | $ | 0.55 |
| $ | 0.66 |
| | $ | 0.55 |
| | $ | 1.26 |
| | $ | 1.10 |
|
| Dividends declared, per share | $ | 0.1975 |
| | $ | 0.1800 |
| |
| | | | | | | | | | | |
| Other comprehensive income (loss), net of tax | | | | | | | | | | |
| Foreign currency translation adjustments | $ | (7.9 | ) | | $ | 4.4 |
| $ | (4.5 | ) | | $ | 0.1 |
| | $ | (12.4 | ) | | $ | 4.5 |
|
| Pension and other post-retirement plans | 0.7 |
| | 0.8 |
| 0.4 |
| | 0.8 |
| | 1.1 |
| | 1.6 |
|
| Interest rate swaps | (0.5 | ) | | (1.6 | ) | 1.0 |
| | 2.6 |
| | 0.5 |
| | 1.0 |
|
| Unrealized holding loss | (0.1 | ) | | — |
| — |
| | — |
| | (0.1 | ) | | — |
|
| Other comprehensive (loss) income | (7.8 | ) | | 3.6 |
| (3.1 | ) | | 3.5 |
| | (10.9 | ) | | 7.1 |
|
| Comprehensive income | 28.1 |
| | 36.7 |
| 36.2 |
| | 37.0 |
| | 64.3 |
| | 73.6 |
|
| Comprehensive income attributable to noncontrolling interests | 0.1 |
| | — |
| — |
| | — |
| | 0.1 |
| | — |
|
| Comprehensive income attributable to Herman Miller, Inc. | $ | 28.0 |
| | $ | 36.7 |
| $ | 36.2 |
| | $ | 37.0 |
| | $ | 64.2 |
| | $ | 73.6 |
|
See accompanying notes to condensed consolidated financial statements.
Herman Miller, Inc.
Condensed Consolidated Balance Sheets
(Dollars in millions, except per share data)
(Unaudited)
| | | | September 1, 2018 | | June 2, 2018 | December 1, 2018 | | June 2, 2018 |
| ASSETS | | | | | | |
| Current Assets: | | | | | | |
| Cash and cash equivalents | $ | 101.7 |
| | $ | 203.9 |
| $ | 113.6 |
| | $ | 203.9 |
|
| Short-term investments | 8.5 |
| | 8.6 |
| 8.2 |
| | 8.6 |
|
| Accounts and notes receivable, net | 205.4 |
| | 217.4 |
| 223.0 |
| | 217.4 |
|
| Unbilled accounts receivable | 25.4 |
| | 1.9 |
| 32.4 |
| | 1.9 |
|
| Inventories, net | 163.8 |
| | 162.4 |
| 178.5 |
| | 162.4 |
|
| Prepaid expenses and other | 51.2 |
| | 51.2 |
| 45.3 |
| | 51.2 |
|
| Total current assets | 556.0 |
| | 645.4 |
| 601.0 |
| | 645.4 |
|
| Property and equipment, at cost | 1,031.0 |
| | 1,020.8 |
| 1,047.3 |
| | 1,020.8 |
|
| Less — accumulated depreciation | (701.2 | ) | | (689.4 | ) | (714.3 | ) | | (689.4 | ) |
| Net property and equipment | 329.8 |
| | 331.4 |
| 333.0 |
| | 331.4 |
|
| Goodwill | 303.9 |
| | 304.1 |
| 303.9 |
| | 304.1 |
|
| Indefinite-lived intangibles | 78.1 |
| | 78.1 |
| 78.1 |
| | 78.1 |
|
| Other amortizable intangibles, net | 45.1 |
| | 41.3 |
| 43.9 |
| | 41.3 |
|
| Other noncurrent assets | 150.8 |
| | 79.2 |
| 149.8 |
| | 79.2 |
|
| Total Assets | $ | 1,463.7 |
| | $ | 1,479.5 |
| $ | 1,509.7 |
| | $ | 1,479.5 |
|
| | | | | | | |
| LIABILITIES, REDEEMABLE NONCONTROLLING INTERESTS & STOCKHOLDERS' EQUITY | | | | | | |
| Current Liabilities: | | | | | | |
| Accounts payable | $ | 170.2 |
| | $ | 171.4 |
| $ | 184.6 |
| | $ | 171.4 |
|
| Accrued compensation and benefits | 68.8 |
| | 86.3 |
| 82.0 |
| | 86.3 |
|
| Accrued warranty | 52.1 |
| | 51.5 |
| 52.4 |
| | 51.5 |
|
| Customer deposits | 27.3 |
| | 27.6 |
| 27.0 |
| | 27.6 |
|
| Other accrued liabilities | 73.0 |
| | 77.0 |
| 79.3 |
| | 77.0 |
|
| Total current liabilities | 391.4 |
| | 413.8 |
| 425.3 |
| | 413.8 |
|
| Long-term debt | 281.9 |
| | 275.0 |
| 281.9 |
| | 275.0 |
|
| Pension and post-retirement benefits | 14.6 |
| | 15.6 |
| 13.8 |
| | 15.6 |
|
| Other liabilities | 81.9 |
| | 79.8 |
| 82.5 |
| | 79.8 |
|
| Total Liabilities | 769.8 |
| | 784.2 |
| 803.5 |
| | 784.2 |
|
| Redeemable noncontrolling interests | 20.7 |
| | 30.5 |
| 20.7 |
| | 30.5 |
|
| Stockholders' Equity: | | | | | | |
| Preferred stock, no par value (10,000,000 shares authorized, none issued) | — |
| | — |
| — |
| | — |
|
| Common stock, $0.20 par value (240,000,000 shares authorized, 59,302,918 and 59,774,490 shares issued and outstanding in 2019 and 2018, respectively) | 11.9 |
| | 11.7 |
| |
| Common stock, $0.20 par value (240,000,000 shares authorized, 58,902,002 and 59,230,974 shares issued and outstanding in 2019 and 2018, respectively) | | 11.8 |
| | 11.7 |
|
| Additional paid-in capital | 106.5 |
| | 116.6 |
| 94.3 |
| | 116.6 |
|
| Retained earnings | 624.5 |
| | 598.3 |
| 650.6 |
| | 598.3 |
|
| Accumulated other comprehensive loss | (69.2 | ) | | (61.3 | ) | (70.8 | ) | | (61.3 | ) |
| Key executive deferred compensation plans | (0.7 | ) | | (0.7 | ) | (0.7 | ) | | (0.7 | ) |
| Herman Miller, Inc. Stockholders' Equity | 673.0 |
| | 664.6 |
| 685.2 |
| | 664.6 |
|
| Noncontrolling Interests | 0.2 |
| | 0.2 |
| 0.3 |
| | 0.2 |
|
| Total Stockholders' Equity | 673.2 |
| | 664.8 |
| 685.5 |
| | 664.8 |
|
| Total Liabilities, Redeemable Noncontrolling Interests, and Stockholders' Equity | $ | 1,463.7 |
| | $ | 1,479.5 |
| $ | 1,509.7 |
| | $ | 1,479.5 |
|
See accompanying notes to condensed consolidated financial statements.
Herman Miller, Inc.
Condensed Consolidated Statements of Cash Flows
(Dollars in millions)
(Unaudited)
| |
| Three Months Ended | Six Months Ended |
| September 1, 2018 |
| September 2, 2017 | December 1, 2018 |
| December 2, 2017 |
| Cash Flows from Operating Activities: |
|
|
|
|
|
|
| Net earnings | $ | 35.9 |
| | $ | 33.1 |
| $ | 75.2 |
| | $ | 66.5 |
|
| Adjustments to reconcile net earnings to net cash provided by operating activities: | | | | | | |
| Depreciation and amortization | 19.0 |
| | 15.5 |
| 37.6 |
| | 31.8 |
|
| Stock-based compensation | 2.5 |
| | 1.3 |
| 5.0 |
| | 3.0 |
|
| Pension and post-retirement expenses | 0.3 |
| | 0.4 |
| 0.6 |
| | 0.7 |
|
| Pension contributions | — |
| | (12.0 | ) | — |
| | (12.0 | ) |
| Earnings from nonconsolidated affiliates net of dividends received | (0.7 | ) | | (0.1 | ) | (0.7 | ) | | (0.3 | ) |
| Deferred taxes | — |
| | (0.2 | ) | 1.1 |
| | (1.0 | ) |
| Gain on sales of property and dealers | — |
| | (1.1 | ) | — |
| | (0.8 | ) |
| Restructuring and impairment expenses | 1.1 |
| | 1.4 |
| 1.4 |
| | 1.9 |
|
| Increase in current assets | (7.6 | ) | | (13.9 | ) | (44.2 | ) | | (15.7 | ) |
| Decrease in current liabilities | (18.3 | ) | | (7.6 | ) | |
| Increase in non-current liabilities | 0.6 |
| | 1.6 |
| |
| Increase in current liabilities | | 15.1 |
| | 4.4 |
|
| (Decrease) increase in non-current liabilities | | (0.4 | ) | | 3.0 |
|
| Other, net | 0.1 |
| | 0.5 |
| 0.8 |
| | — |
|
| Net Cash Provided by Operating Activities | 32.9 |
| | 18.9 |
| 91.5 |
| | 81.5 |
|
| | | | | | | |
| Cash Flows from Investing Activities: | | | | | | |
| Proceeds from sale of property and dealers | — |
| | 2.0 |
| — |
| | 2.0 |
|
| Marketable securities purchases | | (0.3 | ) | | (0.4 | ) |
| Marketable securities sales | 0.1 |
| | — |
| 0.7 |
| | 0.4 |
|
| Equity investment in non-controlled entities | (71.6 | ) | | — |
| (71.6 | ) | | — |
|
| Capital expenditures | (22.0 | ) | | (24.9 | ) | (41.1 | ) | | (39.8 | ) |
| Proceeds from life insurance policy | | — |
| | 8.1 |
|
| Purchase of HAY licensing agreement | (4.8 | ) | | — |
| (4.8 | ) | | — |
|
| Net advances on notes receivable | — |
| | (1.0 | ) | (0.1 | ) | | (0.5 | ) |
| Other, net | (1.4 | ) | | (0.3 | ) | (1.5 | ) | | (0.4 | ) |
| Net Cash Used in Investing Activities | (99.7 | ) | | (24.2 | ) | (118.7 | ) | | (30.6 | ) |
| | | | | | | |
| Cash Flows from Financing Activities: | | | | | | |
| Dividends paid | (10.7 | ) | | (10.2 | ) | (22.4 | ) | | (20.9 | ) |
| Proceeds from issuance of long-term debt | — |
| | 89.4 |
| — |
| | 115.4 |
|
| Payments of long-term debt | — |
| | (85.4 | ) | — |
| | (115.4 | ) |
| Common stock issued | 8.5 |
| | 4.4 |
| 10.4 |
| | 5.9 |
|
| Common stock repurchased and retired | (20.8 | ) | | (11.1 | ) | (37.4 | ) | | (17.3 | ) |
| Purchase of redeemable noncontrolling interests | (10.0 | ) | | (1.0 | ) | (10.1 | ) | | (1.0 | ) |
| Net proceeds from supplier financing program | — |
| | 0.8 |
| |
| Net (payments) proceeds from supplier financing program | | (0.4 | ) | | 0.4 |
|
| Payment of contingent consideration | (0.1 | ) | | — |
| (0.2 | ) | | (0.1 | ) |
| Other, net | 0.1 |
| | 0.1 |
| 0.3 |
| | (0.2 | ) |
| Net Cash Used in by Financing Activities | (33.0 | ) | | (13.0 | ) | (59.8 | ) | | (33.2 | ) |
| | | | | | | |
| Effect of Exchange Rate Changes on Cash and Cash Equivalents | (2.4 | ) | | 2.1 |
| (3.3 | ) | | 0.7 |
|
| Net Decrease in Cash and Cash Equivalents | (102.2 | ) | | (16.2 | ) | (90.3 | ) | | 18.4 |
|
| | | | | | | |
| Cash and Cash Equivalents, Beginning of Period | 203.9 |
| | 96.2 |
| 203.9 |
| | 96.2 |
|
| Cash and Cash Equivalents, End of Period | $ | 101.7 |
| | $ | 80.0 |
| $ | 113.6 |
| | $ | 114.6 |
|
See accompanying notes to condensed consolidated financial statements.
Herman Miller, Inc.
Condensed Consolidated Statements of Stockholders' Equity
(Dollars in millions)millions, except share data)
(Unaudited)
|
| | | | | | | |
| | Three Months Ended |
| September 1, 2018 | | September 2, 2017 |
| Preferred Stock | | | |
| Balance at beginning of year and end of period | $ | — |
| | $ | — |
|
| Common Stock | | | |
| Balance at beginning of year | $ | 11.7 |
| | $ | 11.9 |
|
| Exercise of stock options | 0.2 |
| | 0.1 |
|
| Restricted stock units released | 0.1 |
| | — |
|
| Repurchase and retirement of common stock | (0.1 | ) | | — |
|
| Balance at end of period | $ | 11.9 |
| | $ | 12.0 |
|
| Additional Paid-in Capital | | | |
| Balance at beginning of year | $ | 116.6 |
| | $ | 139.3 |
|
| Cumulative effect of accounting change | — |
| | (0.3 | ) |
| Repurchase and retirement of common stock | (20.7 | ) | | (11.1 | ) |
| Exercise of stock options | 7.9 |
| | 3.8 |
|
| Stock-based compensation expense | 2.2 |
| | 1.6 |
|
| Restricted stock units released | — |
| | 0.1 |
|
| Employee stock purchase plan issuances | 0.5 |
| | 0.5 |
|
| Balance at end of period | $ | 106.5 |
| | $ | 133.9 |
|
| Retained Earnings | | | |
| Balance at beginning of year | $ | 598.3 |
| | $ | 519.5 |
|
| Cumulative effect of accounting changes | 2.0 |
| | 0.2 |
|
| Net income attributable to Herman Miller, Inc. | 35.8 |
| | 33.1 |
|
| Dividends declared on common stock (per share - 2019: $0.1975; 2018; $0.1800) | (11.6 | ) | | (10.8 | ) |
| Redeemable noncontrolling interests valuation adjustment | — |
| | 0.2 |
|
| Balance at end of period | $ | 624.5 |
| | $ | 542.2 |
|
| Accumulated Other Comprehensive Loss | | | |
| Balance at beginning of year | $ | (61.3 | ) | | $ | (82.2 | ) |
| Cumulative effect of accounting change | (0.1 | ) | | — |
|
| Other comprehensive income (loss) | (7.8 | ) | | 3.6 |
|
| Balance at end of period | $ | (69.2 | ) | | $ | (78.6 | ) |
| Key Executive Deferred Compensation | | | |
| Balance at beginning of year and end of period | $ | (0.7 | ) | | $ | (1.0 | ) |
| Herman Miller, Inc. Stockholders' Equity | $ | 673.0 |
| | $ | 608.5 |
|
| Noncontrolling Interests | | | |
| Balance at beginning of year and end of period | $ | 0.2 |
| | $ | 0.2 |
|
| Total Stockholders' Equity | $ | 673.2 |
| | $ | 608.7 |
|
|
| | | | | | | | | | | | | | | | | | | | | | | | | | | | | | | | | | | | | | |
| | Six Months Ended December 1, 2018 |
| | Preferred Stock | | Common Stock | | Additional Paid-in Capital | | Retained Earnings | | Accumulated Other Comprehensive Income (Loss) | | Key Executive Deferred Compensation | | Herman Miller, Inc. Stockholders' Equity | | Noncontrolling Interests | | Total Stockholders' Equity |
| | | Shares | | Amount | | | | | | | |
| June 2, 2018 | $ | — |
| | 59,230,974 |
| | $ | 11.7 |
| | $ | 116.6 |
| | $ | 598.3 |
| | $ | (61.3 | ) | | $ | (0.7 | ) | | $ | 664.6 |
| | $ | 0.2 |
| | $ | 664.8 |
|
| Net earnings | — |
| | — |
| | — |
| | — |
| | 35.8 |
| | — |
| | — |
| | 35.8 |
| | 0.1 |
| | 35.9 |
|
| Other comprehensive loss | — |
| | — |
| | — |
| | — |
| | — |
| | (7.8 | ) | | — |
| | (7.8 | ) | | — |
| | (7.8 | ) |
| Stock-based compensation expense | — |
| | — |
| | — |
| | 2.2 |
| | — |
| | — |
| | — |
| | 2.2 |
| | — |
| | 2.2 |
|
| Exercise of stock options | — |
| | 265,739 |
| | 0.2 |
| | 7.9 |
| | — |
| | — |
| | — |
| | 8.1 |
| | — |
| | 8.1 |
|
| Restricted and performance stock units released | — |
| | 335,266 |
| | 0.1 |
| | — |
| | — |
| | — |
| | — |
| | 0.1 |
| | — |
| | 0.1 |
|
| Employee stock purchase plan issuances | — |
| | 16,805 |
| | — |
| | 0.5 |
| | — |
| | — |
| | — |
| | 0.5 |
| | — |
| | 0.5 |
|
| Repurchase and retirement of common stock | — |
| | (545,866 | ) | | (0.1 | ) | | (20.7 | ) | | — |
| | — |
| | — |
| | (20.8 | ) | | — |
| | (20.8 | ) |
| Dividends declared ($0.1975 per share) | — |
| | — |
| | — |
| | — |
| | (11.6 | ) | | — |
| | — |
| | (11.6 | ) | | — |
| | (11.6 | ) |
| Cumulative effect of accounting changes | — |
| | — |
| | — |
| | — |
| | 2.0 |
| | (0.1 | ) | | — |
| | 1.9 |
| | — |
| | 1.9 |
|
| September 1, 2018 | $ | — |
| | 59,302,918 |
| | $ | 11.9 |
| | $ | 106.5 |
| | $ | 624.5 |
| | $ | (69.2 | ) | | $ | (0.7 | ) | | $ | 673.0 |
| | $ | 0.3 |
| | $ | 673.3 |
|
| Net earnings | — |
| | — |
| | — |
| | — |
| | 39.3 |
| | — |
| | — |
| | 39.3 |
| | — |
| | 39.3 |
|
| Other comprehensive loss | — |
| | — |
| | — |
| | — |
| | — |
| | (3.1 | ) | | — |
| | (3.1 | ) | | — |
| | (3.1 | ) |
| Stock-based compensation expense | — |
| | — |
| | — |
| | 2.5 |
| | — |
| | — |
| | — |
| | 2.5 |
| | — |
| | 2.5 |
|
| Exercise of stock options | — |
| | 53,614 |
| | — |
| | 1.3 |
| | — |
| | — |
| | — |
| | 1.3 |
| | — |
| | 1.3 |
|
| Restricted and performance stock units released | — |
| | 7,511 |
| | — |
| | — |
| | — |
| | — |
| | — |
| | — |
| | — |
| | — |
|
| Employee stock purchase plan issuances | — |
| | 14,813 |
| | — |
| | 0.5 |
| | — |
| | — |
| | — |
| | 0.5 |
| | — |
| | 0.5 |
|
| Repurchase and retirement of common stock | — |
| | (476,854 | ) | | (0.1 | ) | | (16.5 | ) | | — |
| | — |
| | — |
| | (16.6 | ) | | — |
| | (16.6 | ) |
| Dividends declared ($0.1975 per share) | — |
| | — |
| | — |
| | — |
| | (11.7 | ) | | — |
| | — |
| | (11.7 | ) | | — |
| | (11.7 | ) |
| Cumulative effect of accounting changes | — |
| | — |
| | — |
| | — |
| | (1.5 | ) | | 1.5 |
| | — |
| | — |
| | — |
| | — |
|
| December 1, 2018 | $ | — |
| | 58,902,002 |
| | $ | 11.8 |
| | $ | 94.3 |
| | $ | 650.6 |
| | $ | (70.8 | ) | | $ | (0.7 | ) | | $ | 685.2 |
| | $ | 0.3 |
| | $ | 685.5 |
|
|
| | | | | | | | | | | | | | | | | | | | | | | | | | | | | | | | | | | | | | |
| | Six Months Ended December 2, 2017 |
| | Preferred Stock | | Common Stock | | Additional Paid-in Capital | | Retained Earnings | | Accumulated Other Comprehensive Income (Loss) | | Key Executive Deferred Compensation | | Herman Miller, Inc. Stockholders' Equity | | Noncontrolling Interests | | Total Stockholders' Equity |
| | | Shares | | Amount | | | | | | | |
| June 3, 2017 | $ | — |
| | 59,715,824 |
| | $ | 11.9 |
| | $ | 139.3 |
| | $ | 519.5 |
| | $ | (82.2 | ) | | $ | (1.0 | ) | | $ | 587.5 |
| | $ | 0.2 |
| | $ | 587.7 |
|
| Net earnings | — |
| | — |
| | — |
| | — |
| | 33.0 |
| | — |
| | — |
| | 33.0 |
| | — |
| | 33.0 |
|
| Other comprehensive income | — |
| | — |
| | — |
| | — |
| | — |
| | 3.6 |
| | — |
| | 3.6 |
| | — |
| | 3.6 |
|
| Stock-based compensation expense | — |
| | — |
| | — |
| | 1.7 |
| | — |
| | — |
| | — |
| | 1.7 |
| | — |
| | 1.7 |
|
| Exercise of stock options | — |
| | 150,556 |
| | 0.1 |
| | 3.8 |
| | — |
| | — |
| | — |
| | 3.9 |
| | — |
| | 3.9 |
|
| Restricted and performance stock units released | — |
| | 220,850 |
| | — |
| | — |
| | — |
| | — |
| | — |
| | — |
| | — |
| | — |
|
| Employee stock purchase plan issuances | — |
| | 18,223 |
| | — |
| | 0.5 |
| | — |
| | — |
| | — |
| | 0.5 |
| | — |
| | 0.5 |
|
| Repurchase and retirement of common stock | — |
| | (330,963 | ) | | — |
| | (11.1 | ) | | — |
| | — |
| | — |
| | (11.1 | ) | | — |
| | (11.1 | ) |
| Dividends declared ($0.1800 per share) | — |
| | — |
| | — |
| | — |
| | (10.8 | ) | | — |
| | — |
| | (10.8 | ) | | — |
| | (10.8 | ) |
| Redemption value adjustment | — |
| | — |
| | — |
| | — |
| | 0.2 |
| | — |
| | — |
| | 0.2 |
| | — |
| | 0.2 |
|
| Cumulative effect of accounting changes | — |
| | — |
| | — |
| | (0.3 | ) | | 0.2 |
| | — |
| | — |
| | (0.1 | ) | | — |
| | (0.1 | ) |
| September 2, 2017 | $ | — |
| | 59,774,490 |
| | $ | 12.0 |
| | $ | 133.9 |
| | $ | 542.1 |
| | $ | (78.6 | ) | | $ | (1.0 | ) | | $ | 608.4 |
| | $ | 0.2 |
| | $ | 608.6 |
|
| Net earnings | — |
| | — |
| | — |
| | — |
| | 33.5 |
| | — |
| | — |
| | 33.5 |
| | — |
| | 33.5 |
|
| Other comprehensive income | — |
| | — |
| | — |
| | — |
| | — |
| | 3.5 |
| | — |
| | 3.5 |
| | — |
| | 3.5 |
|
| Stock-based compensation expense | — |
| | — |
| | — |
| | 1.1 |
| | — |
| | — |
| | — |
| | 1.1 |
| | — |
| | 1.1 |
|
| Exercise of stock options | — |
| | 37,469 |
| | — |
| | 0.9 |
| | — |
| | — |
| | — |
| | 0.9 |
| | — |
| | 0.9 |
|
| Restricted and performance stock units released | — |
| | 14,424 |
| | — |
| | — |
| | — |
| | — |
| | — |
| | — |
| | — |
| | — |
|
| Employee stock purchase plan issuances | — |
| | 15,192 |
| | — |
| | 0.6 |
| | — |
| | — |
| | — |
| | 0.6 |
| | — |
| | 0.6 |
|
| Repurchase and retirement of common stock | — |
| | (177,511 | ) | | (0.1 | ) | | (6.1 | ) | | — |
| | — |
| | — |
| | (6.2 | ) | | — |
| | (6.2 | ) |
| Dividends declared ($0.1800 per share) | — |
| | — |
| | — |
| | — |
| | (10.8 | ) | | — |
| | — |
| | (10.8 | ) | | — |
| | (10.8 | ) |
| Redemption value adjustment | — |
| | — |
| | — |
| | — |
| | (0.3 | ) | | — |
| | — |
| | (0.3 | ) | | — |
| | (0.3 | ) |
| Cumulative effect of accounting changes | — |
| | — |
| | — |
| | — |
| | (0.1 | ) | | — |
| | — |
| | (0.1 | ) | | — |
| | (0.1 | ) |
| December 2, 2017 | $ | — |
| | 59,664,064 |
| | $ | 11.9 |
| | $ | 130.4 |
| | $ | 564.4 |
| | $ | (75.1 | ) | | $ | (1.0 | ) | | $ | 630.6 |
| | $ | 0.2 |
| | $ | 630.8 |
|
See accompanying notes to condensed consolidated financial statements.
Notes to Condensed Consolidated Financial Statements
Three and Six Months Ended SeptemberDecember 1, 2018
(in millions)
1. Basis of Presentation
The condensed consolidated financial statements have been prepared by Herman Miller, Inc. (“the company”Company”) in accordance with accounting principles generally accepted in the United States of America ("U.S. GAAP") for interim financial information and with the instructions to Form 10-Q and Article 10 of Regulation S-X. Accordingly, they do not include all of the information and footnotes required by U.S. GAAP for complete financial statements. Management believes the disclosures made in this document are adequate with respect to interim reporting requirements.
The accompanying unaudited condensed consolidated financial statements, taken as a whole, contain all adjustments that are of a normal recurring nature necessary to present fairly the financial position of the companyCompany as of SeptemberDecember 1, 2018. Operating results for the three and six months ended months ended SeptemberDecember 1, 2018, are not necessarily indicative of the results that may be expected for the year ending June 1, 2019. It is suggested that these condensed consolidated financial statements be read in conjunction with the financial statements and notes thereto included in the company'sCompany's annual report on Form 10-K for the year ended June 2, 2018.
2. Recently Issued Accounting Standards
Recently Adopted Accounting Standards |
| | | | | | |
| Standard | | Description | | Effective Date | | Effect on the Financial Statements or Other Significant Matters |
| | | | | | | |
| Revenue from Contracts with Customers | | The standard outlines a single comprehensive model for entities to use in accounting for revenue arising from contracts with customers and supersedes most current revenue recognition guidance, including industry-specific guidance. The core principle of the revenue model is that an entity should recognize revenue to depict the transfer of promised goods or services to customers in an amount that reflects the consideration to which the entity expects to be entitled in exchange for those goods or services. The standard is designed to create greater comparability for financial statement users across industries and jurisdictions and also requires enhanced disclosures. The standard allows for two adoption methods, a full retrospective or modified retrospective approach. | | June 3, 2018 | | The companyCompany adopted the standard effective June 3, 2018 using the modified retrospective method. Refer to Note 3 to the financial statements for further information regarding the adoption of the standard. |
| | | | | | | |
| Financial Instruments - Overall: Recognition and Measurement of Financial Assets and Financial Liabilities | | The standard provides guidance for the measurement, presentation and disclosure of financial assets and liabilities. The standard requires entities to measure equity investments that do not result in consolidation and are not accounted for under the equity method at fair value and recognize any change in fair value in net income. The standard does not permit early adoption and at adoption a cumulative-effect adjustment to beginning retained earnings should be recorded. | | June 3, 2018 | | The companyCompany adopted the standard effective June 3, 2018 using the modified retrospective method. As a result, the companyCompany reclassified $0.1 million of net gains on mutual fund equity securities, that were formerly classified as available for sale securities before the adoption of the new standard, from Accumulated Other Comprehensive Lossother comprehensive loss to Retained earnings. The impact of adoption also resulted in certain disclosure changes. Refer to Note 11 of the financial statements for further information. |
| | | | | | |
| Customer’s Accounting for Implementation Costs Incurred in a Cloud Computing Arrangement That Is a Service Contract | | This update aligns the requirements for capitalizing implementation costs incurred in a hosting arrangement that is a service contract with the requirements for capitalizing implementation costs incurred to develop or obtain internal-use software. Early adoption is permitted. | | September 2, 2018 | | The Company early adopted the standard prospectively effective September 2, 2018. The impacts resulting from adoption did not have an impact on the Company’s Financial Statements. |
Recently Adopted Accounting Standards (Continued)
|
| | | | | | |
| Standard | | Description | | Effective Date | | Effect on the Financial Statements or Other Significant Matters |
| | | | | | |
| Reclassification of Certain Tax Effects from Accumulated Other Comprehensive Income | | This update allows for the reclassification to retained earnings of the tax effects stranded in Accumulated Other Comprehensive Income resulting from The Tax Cuts and Jobs Act. Early adoption is permitted. | | September 2, 2018 | | The Company early adopted the standard effective September 2, 2018 and reclassified $1.5 million from Accumulated other comprehensive loss to Retained earnings related to the Company’s interest rate swap agreements. |
| | | | | | | |
| Compensation - Retirement Benefits: Improving the Presentation of Net Periodic Pension Cost and Net Periodic Postretirement Benefit Cost | | This standard changes the rules related to the income statement presentation of the components of net periodic benefit cost for defined benefit pension and other postretirement benefit plans. Under the new guidance, entities must present the service cost component of net periodic benefit cost in the same income statement line items as other employee compensation costs related to services rendered during the period. Other components of net periodic benefit cost will be presented separately from the line items that include the service cost. Early adoption is permitted. | | June 3, 2018 | | The companyCompany retrospectively adopted the standard effective June 3, 2018. Prior to adoption, the companyCompany recorded net periodic benefit costs related to its defined benefit pension and post-retirement medical plans within Selling, general and administrative expenses. As a result of adoption, these costs are recorded within Other, net. The companyCompany retrospectively reclassified these costs in the Condensed Consolidated Statements of Comprehensive Income for the period ending September 2, 2017 from Selling, general and administrative to Other, net. Refer to Note 7 of the financial statements for further information. |
Recently Issued Accounting Standards Not Yet Adopted
|
| | | | | | |
| Standard | | Description | | Effective Date | | Effect on the Financial Statements or Other Significant Matters |
| | | | | | |
Reclassification of Certain Tax Effects from Accumulated Other Comprehensive Income | | This update allows for the reclassification to retained earnings of the tax effects stranded in Accumulated Other Comprehensive Income resulting from The Tax Cuts and Jobs Act. Early adoption is permitted. | | June 2, 2019 | | The company is still evaluating these amendments and has not determined its accounting policy and whether or not an election will be made to reclassify the stranded effects. |
| | | | | | | |
| Derivatives and Hedging: Targeted Improvements to Accounting for Hedging Activities | | This update amends the hedge accounting recognition and presentation with the objectives of improving the financial reporting of hedging relationships to better portray the economic results of an entity's risk management activities and simplifying the application of hedge accounting. The update expands the strategies eligible for hedge accounting, relaxes the timing requirements of hedge documentation and effectiveness assessments and permits the use of qualitative assessments on an ongoing basis to assess hedge effectiveness. The new guidance also requires new disclosures and presentation. | | June 2, 2019 | | The companyCompany is currently evaluating the impact of adopting this guidance. |
| | | | | | | |
| Leases | | Under the updated standard a lessee's rights and obligations under most leases, including existing and new arrangements, would be recognized as assets and liabilities, respectively, on the balance sheet. The standard must be adopted under a modified retrospective approach and early adoption is permitted. | | June 2, 2019 | | The standard is expected to have a significant impact on our Consolidated Financial Statements. The companyCompany does not expect the Statement of Comprehensive Income to be significantly impacted. However, the impact to the balance sheet of recording right of use assets and lease liabilities for the company’sCompany’s operating leases, as well as the necessary financial statement disclosures, is expected to be significant. The companyCompany has assembled a project team and is working towards implementation of the lease accounting standard. |
| | | | | | | |
| Measurement of Credit Losses on Financial Instruments | | This guidance replaces the existing incurred loss impairment model with an expected loss model and requires consideration of a broader range of reasonable and supportable information to inform credit loss estimates. | | May 30,31, 2020 | | The companyCompany is currently evaluating the impact of adopting this guidance. |
Recently Issued Accounting Standards Not Yet Adopted (Continued)
|
| | | | | | |
| Standard | | Description | | Effective Date | | Effect on the Financial Statements or Other Significant Matters |
| | | | | | |
| Disclosure Framework-Changes to the Disclosure Requirements for Fair Value Measurement | | This update eliminates, adds and modifies certain disclosure requirements for fair value measurements. Early adoption is permitted, and an entity is also permitted to early adopt any removed or modified disclosures and delay adoption of the additional disclosures until their effective date.
| | May 31, 2020 | | The Company is currently evaluating the impact of adopting this guidance. |
| | | | | | |
| Disclosure Framework—Changes to the Disclosure Requirements for Defined Benefit Plans | | This update eliminates, adds and clarifies certain disclosure requirements for employers that sponsor defined benefit pension or other postretirement plans. Early adoption is permitted.
| | May 30, 2021 | | The Company is currently evaluating the impact of adopting this guidance. |
3. Revenue from Contracts with Customers
Impact of Adoption
The companyCompany adopted ASC 606 - Revenue from Contracts with Customers at the beginning of fiscal 2019. The companyCompany completed its review of the impact of the new standard and identified certain key accounting policy changes that resulted from adopting the new standard. These included changes to the identification of performance obligations for commercial contracts in which the companyCompany sells directly to end customers. Under previous accounting rules, which were codified under ASC 605, the companyCompany generally delayed revenue recognition until the products were shipped and installed as the companyCompany had concluded that contracts that contained both products and services represented a single, combined deliverable. However, under ASC 606, the companyCompany has determined that products and services are distinct and as such, represent separate performance obligations. The companyCompany also determined that under ASC 606, certain product pricing elements related to its direct customer sales should be recorded within Cost of sales rather than net within Net sales as had been historical practice under ASC 605.
The companyCompany adopted ASC 606 using the modified retrospective approach.approach and applied the guidance therein to all applicable contracts that were not complete as of the date of adoption. As a result of these changes in accounting, the companyCompany recorded a cumulative adjustment to retained earnings of $1.9 million on the date of adoption. With the change in performance obligations under ASC 606, product revenue recognition is accelerated on certain direct commercial customer sales. As a result, the cumulative adjustment recorded upon the adoption of ASC 606 had the impact of reducing inventory for sales transactions that would have been recognized in a prior period under ASC 606 and recording unbilled receivables for the amounts owed prior to invoicing. Additionally, the cumulative adjustment reflects the change in accrued expenses, including income taxes payable, related to these sales transactions. The cumulative impact to our Condensed Consolidated Balance Sheet as of June 3, 2018 was as follows:
|
| | | | | | | | | | | |
| | Balance at | | Adjustments due | | Balance at |
| (In millions) | June 2, 2018 | | to ASC 606 | | June 3, 2018 |
| Balance Sheet | | | | | |
| Assets: | | | | | |
| Unbilled accounts receivable | $ | 1.9 |
| | $ | 11.1 |
| | $ | 13.0 |
|
| Inventories, net | 162.4 |
| | (7.1 | ) | | 155.3 |
|
| | | | | | |
| Liabilities: | | | | | |
| Accrued compensation and benefits | 86.3 |
| | 0.2 |
| | 86.5 |
|
| Other accrued liabilities | 77.0 |
| | 1.9 |
| | 78.9 |
|
| | | | | | |
| Equity: | | | | | |
| Retained earnings | 598.3 |
| | 1.9 |
| | 600.2 |
|
In accordance with the modified retrospective adoption rules per ASC 606, the companyCompany has disclosed in the tables below the differences in our financial statements due to the adoption of the standard. The “As reported” column represents the financial statement values recorded in
accordance with ASC 606, while the “Legacy GAAP” column represents what the financial statement values would have been under ASC 605, had the new standard not been adopted.
| | | | For the period ended September 1, 2018 | Three Months Ended December 1, 2018 |
| (In millions) | As reported | | Performance Obligation Change | | Gross vs. Net Change | | Legacy GAAP | As reported | | Performance Obligation Change | | Gross vs. Net Change | | Legacy GAAP |
| Statement of Comprehensive Income | | | | | | | | | | | | | | |
| Net sales | $ | 624.6 |
| | $ | (10.7 | ) | | $ | (8.5 | ) | | $ | 605.4 |
| $ | 652.6 |
| | $ | (7.5 | ) | | $ | (10.1 | ) | | $ | 635.0 |
|
| Cost of sales | 399.5 |
| | (5.8 | ) | | (8.5 | ) | | 385.2 |
| 417.0 |
| | (4.1 | ) | | (10.1 | ) | | 402.8 |
|
| Gross margin | 225.1 |
| | (4.9 | ) | |
| | 220.2 |
| 235.6 |
| | (3.4 | ) | |
| | 232.2 |
|
| Total operating expenses | 179.1 |
| | (0.1 | ) | | | | 179.0 |
| 182.5 |
| | (0.1 | ) | | | | 182.4 |
|
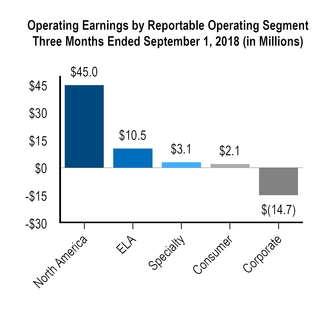
| Operating earnings | 46.0 |
| | (4.8 | ) | | | | 41.2 |
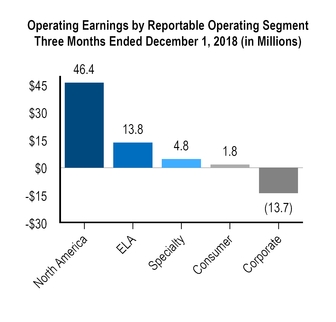
| 53.1 |
| | (3.3 | ) | | | | 49.8 |
|
| Income tax expense | 8.9 |
| | (1.1 | ) | | | | 7.8 |
| 11.2 |
| | (0.6 | ) | | | | 10.6 |
|
| Net earnings | 35.9 |
| | (3.7 | ) | | | | 32.2 |
| 39.3 |
| | (2.7 | ) | | | | 36.6 |
|
|
| | | | | | | | | | | | |
| | For the period ended September 1, 2018 |
| (In millions) | As reported | | Performance Obligation Change | | Gross vs. Net Change | | Legacy GAAP |
| Balance Sheet | | | | | | | |
| Assets: | | | | | | | |
| Unbilled accounts receivable | $ | 25.4 |
| | (21.8 | ) | | | | $ | 3.6 |
|
| Inventories, net | 163.8 |
| | 12.5 |
| | | | 176.3 |
|
| | | | | | | | |
| Liabilities: | | | | | | | |
| Accrued compensation and benefits | 68.8 |
| | (0.3 | ) | | | | 68.5 |
|
| Other accrued liabilities | 73.0 |
| | (3.4 | ) | | | | 69.6 |
|
| | | | | | | | |
| Equity: | | | | | | | |
| Retained earnings | 624.5 |
| | (5.6 | ) | | | | 618.9 |
|
|
| | | | | | | | | | | | | | | |
| | Six Months Ended December 1, 2018 |
| (In millions) | As reported | | Performance Obligation Change | | Gross vs. Net Change | | Legacy GAAP |
| Statement of Comprehensive Income | | | | | | | |
| Net sales | $ | 1,277.3 |
| | $ | (18.2 | ) | | $ | (18.6 | ) | | $ | 1,240.5 |
|
| Cost of sales | 816.6 |
| | (9.9 | ) | | (18.6 | ) | | 788.1 |
|
| Gross margin | 460.7 |
| | (8.3 | ) | | | | 452.4 |
|
| Total operating expenses | 361.6 |
| | (0.2 | ) | | | | 361.4 |
|
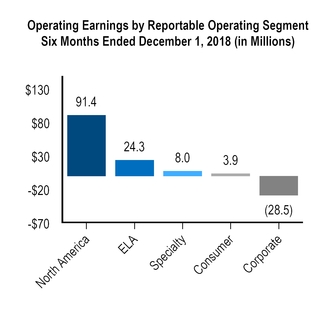
| Operating earnings | 99.1 |
| | (8.1 | ) | | | | 91.0 |
|
| Income tax expense | 20.0 |
| | (1.7 | ) | | | | 18.3 |
|
| Net earnings | 75.2 |
| | (6.4 | ) | | | | 68.8 |
|
|
| | | | | | | | | | | | | |
| | As of December 1, 2018 |
| (In millions) | As reported | | Performance Obligation Change | | Gross vs. Net Change | | Legacy GAAP |
| Balance Sheet | | | | | | | |
| Assets: | | | | | | | |
| Unbilled accounts receivable | $ | 32.4 |
| | $ | (29.3 | ) | | | | $ | 3.1 |
|
| Inventories, net | 178.5 |
| | 16.5 |
| | | | 195.0 |
|
| | | | | | | | |
| Liabilities: | | | | | | | |
| Accrued compensation and benefits | 82.0 |
| | (0.3 | ) | | | | 81.7 |
|
| Other accrued liabilities | 79.3 |
| | (4.2 | ) | | | | 75.1 |
|
| | | | | | | | |
| Equity: | | | | | | | |
| Retained earnings | 650.6 |
| | (8.3 | ) | | | | 642.3 |
|
There was no impact on Net Cash Provided by Operating Activities within the company'sCompany's Condensed Consolidated Statement of Cash Flows as a result of adopting ASC 606.
Accounting Policies
The companyCompany recognizes revenue as performance obligations based on the terms of contracts with customers are satisfied. This happens when control of goods and services based on the contract have been conveyed to the customer. Revenue for the sale of products is typically recognized at the point in time when control transfers, generally upon transfer of title and risk of loss to the customer. Revenue for services, including the
installation of products by the company'sCompany's owned dealers, is recognized over time as the services are provided. The method of revenue recognition may vary, depending on the type of contract with the customer, as noted in the section Disaggregated Revenue further below.
The company'sCompany's contracts with customers include master agreements and certain other forms of contracts, which do not reach the level of a performance obligation until a purchase order is received from a customer. At the point in time that a purchase order under a contract is received by the company,Company, the collective group of documents represent an enforceable contract between the companyCompany and the customer. While certain customer contracts may have a duration of greater than a year, all purchase orders are less than a year in duration. As of SeptemberDecember 1, 2018, all unfulfilled performance obligations are expected to be fulfilled in the next twelve months.
Variable consideration exists within certain contracts that the companyCompany has with customers. When variable consideration is present in a contract with a customer, the companyCompany estimates the amount that should be included in the transaction price utilizing either the expected value method or the most likely amount method, depending on the nature of the variable consideration. Variable consideration is included in the transaction price if, in the company’sCompany’s judgment, it is probable that a significant future reversal of cumulative revenue under the contract will not occur. Adjustments to Net sales from changes in variable consideration related to performance obligations completed in previous periods are not material to the company'sCompany's financial statements. Also, the companyCompany has no contracts with significant financing components.
The companyCompany adopted the following accounting policies as a result of adopting the new standard on revenue recognition:
| |
| – | Shipping and Handling Activities - the companyCompany accounts for shipping and handling activities as fulfillment activities and these costs are accrued within Cost of sales at the same time revenue is recognized. |
| |
| – | Sales Taxes - the companyCompany does not record revenue for sales tax, value added tax or other taxes that are collected on behalf of government entities. The company’sCompany’s revenue is recorded net of these taxes as they are passed through to the relevant government entities. |
| |
| – | Incremental Costs of Obtaining a Contract - the companyCompany has recognized incremental costs to obtain a contract as an expense when incurred as the amortization period is less than one year. |
| |
| – | Significant Financing Component - the companyCompany has not adjusted the amount of consideration to be received for any significant financing components as the company’sCompany’s contracts have a duration of one year or less. |
Disaggregated Revenue
The company’sCompany’s revenue is comprised primarily of sales of products and installation services. Depending on the type of contract, the method of accounting and timing of revenue recognition may differ. Below, descriptions have been provided that summarize the company’sCompany’s different types of contracts and how revenue is recognized for each.
| |
| – | Single Performance Obligation - these contracts are transacted with customers and include only the product performance obligation. Most commonly, these contracts represent master agreements with independent third-party dealers in which a purchase order represents the customer contract, point of sale transactions through the Consumer reportable segment, as well as customer purchase orders for the Maharam subsidiary within the Specialty reportable segment. For contracts that include a single performance obligation, the companyCompany records revenue at the point in time when title and risk of loss has transferred to the customer. |
| |
| – | Multiple Performance Obligations - these contracts are transacted with customers and include more than one performance obligation; products, which are shipped to the customer by the companyCompany and installation and other services, which are primarily fulfilled by independent third-party dealers. For contracts that include multiple performance obligations, the companyCompany records revenue for the product performance obligation at the point in time when control transfers, generally upon transfer of title and risk of loss to the customer. In most cases, the companyCompany has concluded that it is the agent for the installation services performance obligation and as such, the revenue and costs of these services are recorded net within “Net sales” in the company’sCompany’s Condensed Consolidated Statements of Comprehensive Income. |
In certain instances, entities owned by the company,Company, rather than independent third-party dealers, perform installation and other services. In these cases, Service revenue is generated by the company’sCompany’s entities that provide installation services, which include owned dealers, and is recognized by the companyCompany over time as the services are provided. For contracts with multiple performance obligations, the companyCompany allocates the transaction price to each performance obligation based on relative standalone selling prices.
| |
| – | Other - these contracts are comprised mainly of alliance fee arrangements, whereby the companyCompany earns revenue for allowing other furniture sellers access to its dealer distribution channel, as well as other miscellaneous selling arrangements. Revenue from alliance contracts are recorded at the point in time in which the sale is made by other furniture sellers through the company’sCompany’s sales channel. |
Revenue disaggregated by contract type has been provided in the table below:
|
| | | |
| | Three Months Ended |
| (In millions) | September 1, 2018 |
| Net Sales: | |
| Single performance obligation | |
| Product revenue | $ | 535.2 |
|
| Multiple performance obligations | |
| Product revenue | 84.8 |
|
| Service revenue | 2.7 |
|
| Other | 1.9 |
|
| Total | $ | 624.6 |
|
|
| | | | | | | |
| | Three Months Ended | | Six Months Ended |
| (In millions) | December 1, 2018 | | December 1, 2018 |
| Net Sales: | | | |
| Single performance obligation | | | |
| Product revenue | $ | 539.4 |
| | $ | 1,074.6 |
|
| Multiple performance obligations | | | |
| Product revenue | 107.9 |
| | 192.7 |
|
| Service revenue | 3.2 |
| | 5.9 |
|
| Other | 2.1 |
| | 4.1 |
|
| Total | $ | 652.6 |
| | $ | 1,277.3 |
|
Revenue disaggregated by product type and reportable segment has been provided in the table below:
| | | | Three Months Ended | Three Months Ended | | Six Months Ended |
| (In millions) | September 1, 2018 | December 1, 2018 | | December 1, 2018 |
| North American Furniture Solutions: | | | | |
| Systems | $ | 144.5 |
| $ | 143.5 |
| | $ | 288.1 |
|
| Seating | 96.6 |
| 100.0 |
| | 196.6 |
|
| Freestanding and storage | 74.7 |
| 78.5 |
| | 153.2 |
|
| Other | 27.9 |
| 31.2 |
| | 59.0 |
|
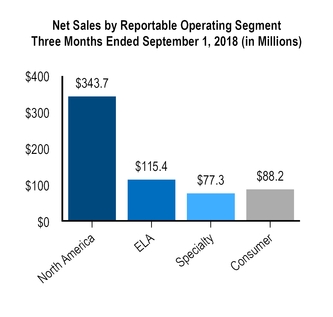
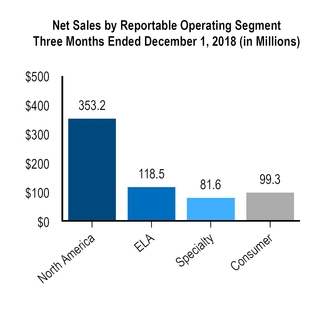
| Total North American Furniture Solutions | $ | 343.7 |
| $ | 353.2 |
| | $ | 696.9 |
|
| | | | | |
| ELA Furniture Solutions: | | | | |
| Systems | $ | 22.8 |
| $ | 28.4 |
| | $ | 51.1 |
|
| Seating | 68.7 |
| 62.1 |
| | 130.8 |
|
| Freestanding and storage | 10.4 |
| 13.9 |
| | 24.3 |
|
| Other | 13.5 |
| 14.1 |
| | 27.8 |
|
| Total ELA Furniture Solutions | $ | 115.4 |
| $ | 118.5 |
| | $ | 234.0 |
|
| | | | | |
| Specialty: | | | | |
| Systems | $ | 1.6 |
| $ | 1.8 |
| | $ | 3.3 |
|
| Seating | 29.0 |
| 26.9 |
| | 55.9 |
|
| Freestanding and storage | 12.9 |
| 19.5 |
| | 32.3 |
|
| Textiles | 28.8 |
| 4.0 |
| | 9.0 |
|
| Other | 5.0 |
| 29.4 |
| | 58.4 |
|
| Total Specialty | $ | 77.3 |
| $ | 81.6 |
| | $ | 158.9 |
|
| | | | | |
| Consumer: | | | | |
| Systems | | $ | 0.1 |
| | $ | 0.1 |
|
| Seating | 53.7 |
| 58.1 |
| | 111.8 |
|
| Freestanding and storage | 17.2 |
| 16.8 |
| | 34.0 |
|
| Other | 17.3 |
| 24.3 |
| | 41.6 |
|
| Total Consumer | $ | 88.2 |
| $ | 99.3 |
| | $ | 187.5 |
|
| | | | | |
| Total | $ | 624.6 |
| $ | 652.6 |
| | $ | 1,277.3 |
|
Refer to Note 16 of the Condensed Consolidated Financial Statements for further information related to our reportable segments.
Contract Assets and Contract Liabilities
The companyCompany records contract assets and contract liabilities related to its revenue generating activities. Contract assets include certain receivables from customers that are unconditional as all performance obligations with respect to the contract with the customer have been completed. These amounts represent trade receivables and they are recorded within the caption “Accounts and notes receivable, net” in the Condensed Consolidated Balance Sheets. The payment terms for the company'sCompany's customers differs depending on the type of customer. For third party dealers and commercial contract customers, standard credit terms apply. Sales transacted through the company'sCompany's direct to consumer channels are generally paid for by the customer at point of sale.
Contract assets also include amounts that are conditional because certain performance obligations in the contract with the customer are incomplete as of the balance sheet date. These contract assets generally arise due to contracts with the customer that include multiple performance obligations, both the product that is shipped to the customer by the company,Company, as well as installation services provided by independent third-party dealers. For these contracts, the companyCompany recognizes revenue upon satisfaction of the product performance obligation. However, the asset is conditional and the customer is not invoiced by the companyCompany until the installation performance obligation is completed. These contract assets are included in the caption "Unbilled accounts receivable" in the Condensed Consolidated Balance Sheets until all performance obligations in the contract with the customer have been satisfied.
Contract liabilities represent deposits made by customers before the satisfaction of performance obligation(s) are complete and revenue is recognized. Upon completion of the performance obligation(s) that the companyCompany has with the customer based on the terms of the contract, the liability for the customer deposit is relieved and revenue is recognized. These customer deposits are included within the caption “Customer deposits” in the Condensed Consolidated Balance Sheets. During the three and six month period periods ended SeptemberDecember 1, 2018, the companyCompany recognized Net sales of $27.6$17.8 million and $23.1 million, respectively, related to customer deposits there were included in the balance sheet as of September 1, 2018 and June 2, 2018.
4. Acquisitions and Divestitures
Maars Holding B.V.
On August 31, 2018, Herman Miller Holdings Limited, a wholly owned subsidiary of the company,Company, acquired 48 percent48% of the outstanding equity of Maars Holding B.V. ("Maars”), a Harderwijk, Netherlands-based worldwide leader in the design and manufacturing of interior wall solutions. The companyCompany acquired its 48 percent48% ownership interest in Maars for approximately $6.1 million in cash. The entity is accounted for using the equity method of accounting as the companyCompany has significant influence, but not control, over the entity.
For the Maars equity method investment, the fair values assigned to the assets acquired were based on best estimates and assumptions as of the reporting date and are considered preliminary pending completion of the valuation analysis.
Nine United Denmark A/S
On June 7, 2018, Herman Miller Holdings Limited, a wholly owned subsidiary of the companyCompany acquired 33 percent33% of the outstanding equity of Nine United Denmark A/S, d/b/a HAY ("HAY”), a Copenhagen, Denmark-based, design leader in furniture and ancillary furnishings for residential and contract markets in Europe and Asia. The companyCompany acquired its 33 percent33% ownership interest in HAY for approximately $65.5 million in cash. The entity is accounted for using the equity method of accounting as the companyCompany has significant influence, but not control, over the entity.
The companyCompany also acquired the rights to the HAY brand in North America under a long-term license agreement for approximately $4.8 million in cash. This licensing agreement is recorded as an amortizing intangible asset and is being amortized over its 15 year useful life. This asset is recodedrecorded within Other amortizable intangibles, net within the Condensed Consolidated Balance Sheets.
For the Hay equity method investment, the fair values assigned to the assets acquired were based on best estimates and assumptions as of the reporting date and are considered preliminary pending completion of the valuation analysis.
Contract Furniture Dealerships
On July 31, 2017, the companyCompany completed the sale of a wholly-owned contract furniture dealership in Vancouver, Canada for initial cash consideration of $2.0 million. A pre-tax gain of $1.1 million was recognized as a result of the sale within the caption Selling, general and administrative within the Condensed Consolidated Statements of Comprehensive Income.
On January 1, 2017, the companyCompany completed the sale of a wholly-owned contract furniture dealership in Philadelphia, Pennsylvania in exchange for $3.0 million, that was comprised of both a term note receivable and a line of credit. A pre-tax gain of $0.7 million was recognized as a result of the sale within the caption Selling, general and administrative within the Condensed Consolidated Statements of Comprehensive Income. These long-term receivables were deemed to be variable interests in a variable interest entity. The carrying value of the long-term receivables was $2.6 million and $2.5 million as of SeptemberDecember 1, 2018 and June 2, 2018, and represents the company'sCompany's maximum exposure to loss. The companyCompany is not deemed to be the primary beneficiary of the variable interest entity as the buyers of the dealership control the activities that most significantly impact the entity's economic performance, including sales, marketing and operations.
5. Inventories, net
| | | (In millions) | September 1, 2018 | | June 2, 2018 | December 1, 2018 | | June 2, 2018 |
| Finished goods | $ | 125.2 |
| | $ | 124.2 |
| $ | 138.2 |
| | $ | 124.2 |
|
| Raw materials | 38.6 |
| | 38.2 |
| 40.3 |
| | 38.2 |
|
| Total | $ | 163.8 |
| | $ | 162.4 |
| $ | 178.5 |
| | $ | 162.4 |
|
Inventories are valued at the lower of cost or market and include material, labor, and overhead. The inventories at our West Michigan manufacturing operations are valued using the last-in, first-out (LIFO) method, whereas inventories of certain other operations are valued using the first-in, first-out (FIFO) method.
6. Goodwill and Indefinite-lived Intangibles
Goodwill and other indefinite-lived intangible assets included in the Condensed Consolidated Balance Sheets consisted of the following as of SeptemberDecember 1, 2018 and June 2, 2018:
| | | (In millions) | Goodwill | | Indefinite-lived Intangible Assets | | Total Goodwill and Indefinite-lived Intangible Assets | Goodwill | | Indefinite-lived Intangible Assets | | Total Goodwill and Indefinite-lived Intangible Assets |
| June 2, 2018 | $ | 304.1 |
| | $ | 78.1 |
| | $ | 382.2 |
| $ | 304.1 |
| | $ | 78.1 |
| | $ | 382.2 |
|
| Foreign currency translation adjustments | (0.2 | ) | | — |
| | (0.2 | ) | (0.2 | ) | | — |
| | (0.2 | ) |
| September 1, 2018 | $ | 303.9 |
| | $ | 78.1 |
| | $ | 382.0 |
| |
| December 1, 2018 | | $ | 303.9 |
| | $ | 78.1 |
| | $ | 382.0 |
|
7. Employee Benefit Plans
The following table summarizes the components of net periodic benefit costs for the company'sCompany's International defined benefit pension plan for the three and six months ended:
|
| | | | | | | | | | | | | | | |
| | Three Months Ended | | Six Months Ended |
| (In millions) | December 1, 2018 | | December 2, 2017 | | December 1, 2018 | | December 2, 2017 |
| Interest cost | $ | 0.7 |
| | $ | 0.8 |
| | $ | 1.4 |
| | $ | 1.6 |
|
| Expected return on plan assets | (1.1 | ) | | (1.8 | ) | | (2.1 | ) | | (3.5 | ) |
| Net amortization loss | 0.7 |
| | 1.3 |
| | 1.3 |
| | 2.6 |
|
| Net periodic benefit cost | $ | 0.3 |
| | $ | 0.3 |
| | $ | 0.6 |
| | $ | 0.7 |
|
|
| | | | | | | |
| (In millions) | September 1, 2018 | | September 2, 2017 |
| Interest cost | $ | 0.7 |
| | $ | 0.8 |
|
| Expected return on plan assets | (1.2 | ) | | (1.7 | ) |
| Net amortization loss | 0.8 |
| | 1.3 |
|
| Net periodic benefit cost | $ | 0.3 |
| | $ | 0.4 |
|
The companyCompany retrospectively adopted ASU 2017-07 - Improving the Presentation of Net Periodic Pension Cost and Net Periodic Postretirement Benefit Cost on June 3, 2018. As the company'sCompany's pension and post retirement medical plans are frozen and not open to new plan participants, these plans no longer have a service component to thein net periodic benefit cost. Prior to adoption, the companyCompany recorded net periodic benefit costs related to its defined benefit pension and post-retirement medical plans within Selling, general and administrative expenses. As a result of adoption, these costs are recorded within Other, net. The companyCompany retrospectively reclassified $0.4 million and $0.8 million of net periodic benefit cost in the Condensed Consolidated Statements of Comprehensive Income for the period ending Septemberthree and six month periods ended December 2, 2017, respectively, from Selling, general and administrative to Other, net.
The Company made a voluntary contribution of $12.0 million to its International defined benefit pension plan in the six month period ended December 2, 2017.
8. Earnings Per Share
The following table reconciles the numerators and denominators used in the calculations of basic and diluted earnings per share (EPS) for the
three and six months ended: | | | | | | | | Three Months Ended | | Six Months Ended |
| | September 1, 2018 | | September 2, 2017 | December 1, 2018 | | December 2, 2017 | | December 1, 2018 | | December 2, 2017 |
Numerators: | | | | | | | | | | |
| Numerator for both basic and diluted EPS, Net earnings attributable to Herman Miller, Inc. - in millions | $ | 35.8 |
| | $ | 33.1 |
| $ | 39.3 |
| | $ | 33.5 |
| | $ | 75.1 |
| | $ | 66.5 |
|
| | | | | | | | | | | |
Denominators: | | | | | | | | | | |
| Denominator for basic EPS, weighted-average common shares outstanding | 59,370,160 |
| | 59,758,610 |
| 59,133,700 |
| | 59,747,932 |
| | 59,212,370 |
| | 59,753,271 |
|
| Potentially dilutive shares resulting from stock plans | 498,954 |
| | 570,659 |
| 308,519 |
| | 524,275 |
| | 399,743 |
| | 543,457 |
|
| Denominator for diluted EPS | 59,869,114 |
| | 60,329,269 |
| 59,442,219 |
| | 60,272,207 |
| | 59,612,113 |
| | 60,296,728 |
|
| Antidilutive equity awards not included in weighted-average common shares - diluted | 161,457 |
| | 536,418 |
| 292,699 |
| | 423,670 |
| | 207,868 |
| | 356,135 |
|
9. Stock-Based Compensation
The following table summarizes the stock-based compensation expense and related income tax effect for the three and six months ended: |
| | | | | | | |
| (In millions) | September 1, 2018 | | September 2, 2017 |
| Stock-based compensation expense | $ | 2.5 |
| | $ | 1.3 |
|
| Related income tax effect | 0.6 |
| | 0.5 |
|
The following table includes common stock issued by the company related to the exercise of stock options, vesting of restricted stock units and vesting of performance share units.
|
| | | | | |
| (Shares) | Three Months Ended |
| | September 1, 2018 | | September 2, 2017 |
| Stock Options | 265,739 |
| | 150,556 |
|
| Restricted Stock Units | 95,587 |
| | 90,671 |
|
| Performance Share Units | 239,679 |
| | 130,179 |
|
|
| | | | | | | | | | | | | | | |
| | Three Months Ended | | Six Months Ended |
| (In millions) | December 1, 2018 | | December 2, 2017 | | December 1, 2018 | | December 2, 2017 |
| Stock-based compensation expense | $ | 2.6 |
| | $ | 1.4 |
| | $ | 5.0 |
| | $ | 3.0 |
|
| Related income tax effect | 0.6 |
| | 0.5 |
| | 1.1 |
| | 1.0 |
|
10. Income Taxes
The companyCompany recognizes interest and penalties related to uncertain tax benefits through income tax expense in its Condensed Consolidated Statement of Comprehensive Income. Interest and penalties recognized in the company'sCompany's Condensed Consolidated Statement of Comprehensive Income were negligible for the three and six months ended SeptemberDecember 1, 2018 and SeptemberDecember 2, 2017.
The company'sCompany's recorded liability for potential interest and penalties related to uncertain tax benefits was:
| | | (In millions) | September 1, 2018 | | June 2, 2018 | December 1, 2018 | | June 2, 2018 |
| Liability for interest and penalties | $ | 0.8 |
| | $ | 1.0 |
| $ | 0.9 |
| | $ | 1.0 |
|
| Liability for uncertain tax positions, current | 3.0 |
| | 3.2 |
| |
The components of the Company's unrecognized tax benefits are as follows:
|
| | | | |
| (In millions) | | |
| Balance at June 2, 2018 | | $ | 3.2 |
|
| Increases related to current year income tax positions | | 0.2 |
|
| Decreases related to settlements | | (1.1 | ) |
| Balance at December 1, 2018 | | $ | 2.3 |
|
The balance of unrecognized tax benefits would impact the effective tax rate if recognized.
On December 22, 2017, the Tax Cuts and Jobs Act (the “Act”) was signed into law in the United States. The effects of the Act included the reduction of the federal corporate income tax rate from 35 percent35% to 21 percent21% and a new participation exemption system of taxation on foreign earnings, among other provisions.
In accordance with SAB 118, for the three-monththree month period ended SeptemberDecember 1, 2018, the companyCompany has not completed its accounting for all the effects of the Act, as the U.S. Treasury Department and the Internal Revenue Service continue to provide additional guidance. Provisional amounts remainAs a result of analyzing additional guidance, the Company has updated its provisional estimate related to foreign tax credits and recorded a discrete increase
to income tax expense of $0.9 million. Additionally, the Company updated its provisional estimate for the one-time U.S. tax liability on certain undistributed foreign earnings and remeasurementrecorded a discrete decrease to income tax expense of net deferred tax liabilities.$0.1 million. The Company will continue to refine its estimates as additional analysis is completed and further guidance is issued.
Besides the one-time U.S. tax liability on undistributed foreign earnings as required by the Act, no other provision was made for income taxes that may result from future remittances of undistributed earnings of foreign subsidiaries that are determined to be indefinitely reinvested. Determination of the total amount of unrecognized deferred income tax on undistributed earnings of foreign subsidiaries is not practicable.
For tax years beginning after December 31, 2017, the Act subjects a U.S. shareholder to tax on global intangible low-taxed income (“GILTI”) earned by certain foreign subsidiaries. The FASB Staff Q&A, Topic 740, No. 5, Accounting for Global Intangible Low-Taxed Income, states that an entity can make an accounting policy election to either recognize deferred taxes for temporary basis differences expected to reverse as GILTI in future years or provide for the tax expense related to GILTI in the year the tax is incurred. The companyCompany has not yet made its accounting policy election regarding GILTI deferred taxes.
In determining the provision for income taxes for the three-month periodthree and six month periods ended SeptemberDecember 1, 2018, the companyCompany used an estimated annual effective tax rate which was based on expected annual income and statutory tax rates across the various jurisdictions in which it operates, which included effects of the Act. The effective tax rates were 20.0 percent22.6% and 30.5 percent,30.5%, respectively, for the three-month periodsthree month periods ended SeptemberDecember 1, 2018 and SeptemberDecember 2, 2017. The effective tax rates were 21.4% and 30.5%, respectively, for the six month periods ended December 1, 2018 and December 2, 2017. The year over year decrease in the effective tax rate for the three-month periodthree and six months ended September December 1, 2018 was the result of the Act. The effective tax ratesrate for the three-month periodsthree and six months ended September December 1, 2018 is higher than the United States federal statutory rate due to the mix of earnings in taxing jurisdictions that had rates that were higher than the United States federal statutory rate. The effective tax rate for the three and Septembersix months ended December 2, 2017 areis lower than the United States federal statutory rate due to the mix of earnings in taxing jurisdictions that had rates that were lower than the United States federal statutory rate, along with the research and development tax credit under the Protecting Americans from Tax Hikes ("PATH") Act of 2015. The effective tax rate for the three-month period ended September 1, 2018 was also lower than United States federal statutory rate due to excess tax benefits from share-based compensation that were recorded during the period.
The companyCompany is subject to periodic audits by domestic and foreign tax authorities. Currently, the companyCompany is undergoing routine periodic audits in both domestic and foreign tax jurisdictions. It is reasonably possible that the amounts of unrecognized tax benefits could change in the next twelve months because of the audits. Tax payments related to these audits, if any, are not expected to be material to the company'sCompany's Condensed Consolidated Statements of Comprehensive Income.
For the majority of tax jurisdictions, the companyCompany is no longer subject to state, local, or non-United States income tax examinations by tax authorities for fiscal years before 2012.
11. Fair Value Measurements
The company'sCompany's financial instruments consist of cash equivalents, marketable securities, accounts and notes receivable, deferred compensation plan, accounts payable, debt, redeemable noncontrolling interests, interest rate swaps and foreign currency exchange contracts. The company'sCompany's financial instruments, other than long-term debt, are recorded at fair value. The carrying value and fair value of the company'sCompany's long-term debt, including current maturities, is as follows for the periods indicated:
| | | (In millions) | September 1, 2018 | | June 2, 2018 | December 1, 2018 | | June 2, 2018 |
| Carrying value | $ | 285.6 |
| | $ | 285.8 |
| $ | 285.3 |
| | $ | 285.8 |
|
| Fair value | $ | 288.9 |
| | $ | 288.6 |
| $ | 288.0 |
| | $ | 288.6 |
|
The following describes the methods the companyCompany uses to estimate the fair value of financial assets and liabilities, which have not significantly changed in the current period:
Cash and cash equivalents — The companyCompany invests excess cash in short term investments in the form of commercial paper and money market funds. Commercial paper is valued at amortized costs while money market funds are valued using net asset value.
Equity securities — The company'sCompany's equity securities primarily include equity mutual funds. The equity mutual fund investments are recorded at fair value using quoted prices for similar securities.
Available-for-sale securities — The company'sCompany's available-for-sale marketable securities primarily include fixed income mutual funds and government obligations. These investments are recorded at fair value using quoted prices for similar securities.
Foreign currency exchange contracts — The company'sCompany's foreign currency exchange contracts are valued using an approach based on foreign currency exchange rates obtained from active markets. The estimated fair value of forward currency exchange contracts is based on month-end spot rates as adjusted by market-based current activity. These forward contracts are not designated as hedging instruments.
Interest rate swap agreements — The value of the company'sCompany's interest rate swap agreements is determined using a market approach based on rates obtained from active markets. The interest rate swap agreements are designated as cash flow hedging instruments.
Deferred compensation plan — The company'sCompany's deferred compensation plan primarily includes various domestic and international mutual funds that are recorded at fair value using quoted prices for similar securities.
Other — The company'sCompany's contingent consideration liabilities and redeemable noncontrolling interests are deemed to be nonrecurring level 3 fair value measurement. Refer to Note 14 for further information regarding redeemable noncontrolling interests.
The following table sets forth financial assets and liabilities measured at fair value through net income and the respective pricing levels to which the fair value measurements are classified within the fair value hierarchy as of SeptemberDecember 1, 2018 and June 2, 2018.
| | | (In millions) | September 1, 2018 | | June 2, 2018 | December 1, 2018 | | June 2, 2018 |
Financial Assets | Quoted Prices with Other Observable Inputs (Level 2) | | Management Estimate (Level 3) | | Quoted Prices with
Other Observable Inputs (Level 2) | | Management Estimate (Level 3) | Quoted Prices with Other Observable Inputs (Level 2) | | Management Estimate (Level 3) | | Quoted Prices with
Other Observable Inputs (Level 2) | | Management Estimate (Level 3) |
| Cash equivalents: | | | | | | | | | | | | | | |
| Money market funds | $ | 25.8 |
| | $ | — |
| | $ | 121.0 |
| | $ | — |
| $ | 38.0 |
| | $ | — |
| | $ | 121.0 |
| | $ | — |
|
| Mutual funds - equity | 0.9 |
| | — |
| | 0.9 |
| | — |
| 0.8 |
| | — |
| | 0.9 |
| | — |
|
| Foreign currency forward contracts | 0.3 |
| | — |
| | 0.4 |
| | — |
| 0.4 |
| | — |
| | 0.4 |
| | — |
|
| Deferred compensation plan | 16.1 |
| | — |
| | 15.1 |
| | — |
| 15.6 |
| | — |
| | 15.1 |
| | — |
|
| Total | $ | 43.1 |
| | $ | — |
| | $ | 137.4 |
| | $ | — |
| $ | 54.8 |
| | $ | — |
| | $ | 137.4 |
| | $ | — |
|
| | | | | | | | | | | | | | | |
| Financial Liabilities | | | | | | | | | | | | | | |
| Foreign currency forward contracts | $ | 0.4 |
| | $ | — |
| | $ | 0.3 |
| | $ | — |
| $ | 0.4 |
| | $ | — |
| | $ | 0.3 |
| | $ | — |
|
| Contingent consideration | — |
| | 0.4 |
| | — |
| | 0.5 |
| — |
| | 0.4 |
| | — |
| | 0.5 |
|
| Total | $ | 0.4 |
| | $ | 0.4 |
| | $ | 0.3 |
| | $ | 0.5 |
| $ | 0.4 |
| | $ | 0.4 |
| | $ | 0.3 |
| | $ | 0.5 |
|
The following table sets forth financial assets measured at fair value through other comprehensive income and the respective pricing levels to which the fair value measurements are classified within the fair value hierarchy as of SeptemberDecember 1, 2018 and June 2, 2018.
| | | (In millions) | September 1, 2018 | | June 2, 2018 | December 1, 2018 | | June 2, 2018 |
Financial Assets | Quoted Prices with Other Observable Inputs (Level 2) | | Management Estimate (Level 3) | | Quoted Prices with
Other Observable Inputs (Level 2) | | Management Estimate (Level 3) | Quoted Prices with Other Observable Inputs (Level 2) | | Management Estimate (Level 3) | | Quoted Prices with
Other Observable Inputs (Level 2) | | Management Estimate (Level 3) |
| Mutual funds - fixed income | 7.6 |
| | — |
| | 7.7 |
| | — |
| 7.4 |
| | — |
| | 7.7 |
| | — |
|
| Interest rate swap agreement | 14.4 |
| | — |
| | 15.0 |
| | — |
| 11.9 |
| | — |
| | 15.0 |
| | — |
|
| Total | $ | 22.0 |
| | $ | — |
| | $ | 22.7 |
| | $ | — |
| $ | 19.3 |
| | $ | — |
| | $ | 22.7 |
| | $ | — |
|
The table below presents a reconciliation for liabilities measured at fair value using significant unobservable inputs (Level 3) for the threesix months ended ended (in millions).
| | | Contingent Consideration | September 1, 2018 | | September 2, 2017 | December 1, 2018 | | December 2, 2017 |
| Beginning balance | $ | 0.5 |
| | $ | 0.5 |
| $ | 0.5 |
| | $ | 0.5 |
|
| Net realized losses (gains) | | — |
| | 0.1 |
|
| Payments | (0.1 | ) | | — |
| (0.1 | ) | | (0.1 | ) |
| Ending balance | $ | 0.4 |
| | $ | 0.5 |
| $ | 0.4 |
| | $ | 0.5 |
|
The contingent consideration liabilities represent future payment obligations that relate to business and product line acquisitions. These payments are based on the future performance of the acquired businesses or product line. The contingent consideration liabilities are valued using estimates based on discount rates that reflect the risk involved and the projected sales and earnings of the acquired businesses. The estimates are updated and the liabilities are adjusted to fair value on a quarterly basis.
The following is a summary of the carrying and market values of the company'sCompany's fixed income mutual funds and equity mutual funds as of the respective dates:
| | | | September 1, 2018 | | June 2, 2018 | December 1, 2018 | | June 2, 2018 |
| (In millions) | Cost | | Unrealized Gain/(loss) | | Market Value | | Cost | | Unrealized
Gain/(Loss) | | Market
Value | Cost | | Unrealized Gain/(loss) | | Market Value | | Cost | | Unrealized
Gain/(Loss) | | Market
Value |
| Mutual funds - fixed income | $ | 7.7 |
| | $ | (0.1 | ) | | $ | 7.6 |
| | $ | 7.8 |
| | $ | (0.1 | ) | | $ | 7.7 |
| $ | 7.5 |
| | $ | (0.1 | ) | | $ | 7.4 |
| | $ | 7.8 |
| | $ | (0.1 | ) | | $ | 7.7 |
|
| Mutual funds - equity | 0.7 |
| | 0.2 |
| | 0.9 |
| | 0.7 |
| | 0.2 |
| | 0.9 |
| 0.7 |
| | 0.1 |
| | 0.8 |
| | 0.7 |
| | 0.2 |
| | 0.9 |
|
| Total | $ | 8.4 |
| | $ | 0.1 |
| | $ | 8.5 |
| | $ | 8.5 |
| | $ | 0.1 |
| | $ | 8.6 |
| $ | 8.2 |
| | $ | — |
| | $ | 8.2 |
| | $ | 8.5 |
| | $ | 0.1 |
| | $ | 8.6 |
|
Adjustments to the fair value of fixed income mutual funds are recorded as increases or decreases, net of income taxes, within Accumulated Other Comprehensive Lossother comprehensive loss in stockholders’ equity. These adjustments are also included within the caption Unrealized holding gain within the Condensed Consolidated Statements of Comprehensive Income. Unrealized losses recognized in the company'sCompany's Condensed Consolidated Statement of Comprehensive Income related to fixed income mutual funds were zero and $0.1 million for the three and six month periods ended SeptemberDecember 1, 2018, respectively. Unrealized losses recognized in the Company's Condensed Consolidated Statement of Comprehensive Income related to fixed income mutual funds were zero for the three and Septembersix month periods ended December 2, 2017.
Adjustments to the fair value of equity mutual funds are recorded as increases or decreases, net of income taxes, in the Condensed Consolidated Statements of Comprehensive Income within "Other, net".Other, net. Unrealized gains recognized in the company'sCompany's Condensed Consolidated Statement of Comprehensive Income related to equity mutual funds were $0.1 millionzero for the three and six month periods ended SeptemberDecember 1, 2018 and SeptemberDecember 2, 2017.
The cost of securities sold is based on the specific identification method; realized gains and losses resulting from such sales are included in the Condensed Consolidated Statements of Comprehensive Income within "Other, net".
The companyCompany reviews its investment portfolio for any unrealized losses that would be deemed other-than-temporary and require the recognition of an impairment loss in earnings. If the cost of an investment exceeds its fair value, the companyCompany evaluates, among other factors, general market conditions, the duration and extent to which the fair value is less than its cost, the company'sCompany's intent to hold the investment, and whether it is more likely than not that the companyCompany will be required to sell the investment before recovery of the cost basis. The companyCompany also considers the type of security, related industry and sector performance, and published investment ratings. Once a decline in fair value is determined to be other-than-temporary, an impairment charge is recorded and a new cost basis in the investment is established. If conditions within individual markets, industry segments, or macro-economic environments deteriorate, the companyCompany could incur future impairments.
The companyCompany views its equity and fixed income mutual funds as available for use in its current operations. Accordingly, the investments are recorded within Current Assets within the Condensed Consolidated Balance Sheets.
On June 3, 2018, as a result of the adoption of ASU 2016-01 - Financial Instruments, the companyCompany reclassified net gains on mutual fund equity securities, that were formerly classified as available for sale securities before the adoption of the new standard, from Accumulated Other Comprehensive Lossother comprehensive loss to Retained earnings. The impact of adoption was not material to the company'sCompany's financial statements.
Derivative Instruments and Hedging Activities
Foreign Currency Forward Contracts
The companyCompany transacts business in various foreign currencies and has established a program that primarily utilizes foreign currency forward contracts to reduce the risks associated with the effects of certain foreign currency exposures. Under this program, the company'sCompany's strategy is to have increases or decreases in our foreign currency exposures offset by gains or losses on the foreign currency forward contracts to mitigate the risks and volatility associated with foreign currency transaction gains or losses. Foreign currency exposures typically arise from net liability or asset exposures in non-functional currencies on the balance sheets of our foreign subsidiaries. Foreign currency forward contracts generally settle within 30 days and are not used for trading purposes. These forward contracts are not designated as hedging instruments. Accordingly, we record the fair value of these contracts as of the end of the reporting period in the Consolidated Balance Sheets with changes in fair value recorded within the Consolidated Statements of Comprehensive Income. The balance sheet classification for the fair values of these forward contracts is to Other current assets for unrealized gains and to Other accrued liabilities for unrealized losses. The Consolidated Statements of Comprehensive Income classification for the fair values of these forward contracts is to Other expenses (income): Other, net, for both realized and unrealized gains and losses. The realized gainloss on foreign currency forward contracts was $0.2 million for the three months ended SeptemberDecember 1, 2018 and SeptemberDecember 2, 2017, respectively. The realized gain on foreign currency forward contracts was $0.4$0.2 million for the six months ended December 1, 2018 and zero,December 2, 2017, respectively.
Interest Rate Swaps
The companyCompany enters into interest rate swap agreements to manage its exposure to interest rate changes and its overall cost of borrowing. The company'sCompany's interest rate swap agreements were entered into to exchange variable rate interest payments for fixed rate payments over the life
of the agreement without the exchange of the underlying notional amounts. The notional amount of the interest rate swap agreements is used to measure interest to be paid or received and does not represent the amount of exposure to credit loss. The differential paid or received on the interest rate swap agreements is recognized as an adjustment to interest expense.
The interest rate swaps were designated cash flow hedges at inception and remain an effective accounting hedge as of SeptemberDecember 1, 2018. Since a designated derivative meets hedge accounting criteria, the fair value of the hedge is recorded in the Consolidated Statement of Stockholders’ Equity as a component of Accumulated other comprehensive loss, net of tax. The ineffective portion of the change in fair value of the derivatives is immediately recognized in earnings. The interest rate swap agreements are assessed for hedge effectiveness on a quarterly basis.
In September 2016, the companyCompany entered into an interest rate swap agreement. The interest rate swap is for an aggregate notional amount of $150.0 million with a forward start date of January 3, 2018 and a termination date of January 3, 2028. As a result of the transaction, the companyCompany effectively converted indebtedness anticipated to be borrowed on the company’sCompany’s revolving line of credit up to the notional amount from a LIBOR-based floating interest rate plus applicable margin to a 1.949 percent1.949% fixed interest rate plus applicable margin under the agreement as of the forward start date.
On June 12, 2017, the companyCompany entered into an interest rate swap agreement. The interest rate swap is for an aggregate notional amount of $75.0 million with a forward start date of January 3, 2018 and a termination date of January 3, 2028. As a result of the transaction, the companyCompany effectively converted the company’sCompany’s revolving line of credit up to the notional amount from a LIBOR-based floating interest rate plus applicable margin to a 2.387 percent2.387% fixed interest rate plus applicable margin under the agreement as of the forward start date.
As of SeptemberDecember 1, 2018, the fair value of the company’sCompany’s two outstanding interest rate swap agreements, which are designated cash flow hedges, was an asset of $14.4$11.9 million. The asset fair value was recorded within Other noncurrent assets within the Condensed Consolidated Balance Sheets. The net unrealized gain recorded within Other comprehensive loss, net of tax, for the effective portion of the company'sCompany's designated cash flow hedges was $1.0 million and $2.6 million for the three months ended December 1, 2018 and December 2, 2017, respectively. The net unrealized gain recorded within Other comprehensive loss, net of tax, for the effective portion of the Company's designated cash flow hedges was $0.5 million and $1.6$1.0 million for the threesix months ended SeptemberDecember 1, 2018 and SeptemberDecember 2, 2017, respectively.
There were no gains or losses recognized against earnings for hedge ineffectiveness for the three and theresix month periods ended December 1, 2018 and December 2, 2017, respectively. The losses reclassified from Accumulated other comprehensive loss into earnings were $0.1 million and zero for three month periods ended December 1, 2018 and December 2, 2017, respectively. There were no gains or losses reclassified from Accumulated other comprehensive loss into earnings for threethe six month periods ended SeptemberDecember 1, 2018 and SeptemberDecember 2, 2017, respectively.2017. The net of tax amount expected to be reclassified out of Accumulated other comprehensive loss into earnings during the next twelve months is a $0.9 million gain.
12. Commitments and Contingencies
Product Warranties
The companyCompany provides coverage to the end-user for parts and labor on products sold under its warranty policy and for other product-related matters. The standard length of warranty is 12 years for the majority of products sold; however, this varies depending on the product classification. The companyCompany does not sell or otherwise issue warranties or warranty extensions as stand-alone products. Reserves have been established for the various costs associated with the company'sCompany's warranty program and are included in the Condensed Consolidated Balance Sheets under “Accrued warranty.” General warranty reserves are based on historical claims experience and other currently available information. These reserves are adjusted once an issue is identified and the actual cost of correction becomes known or can be estimated. The companyCompany provides an assurance-type warranty that ensures that products will function as intended. As such, the company'sCompany's estimated warranty obligation is accounted for as a liability.
| | | | | | | | Three Months Ended | | Six Months Ended |
| (In millions) | September 1, 2018 | | September 2, 2017 | December 1, 2018 | | December 2, 2017 | | December 1, 2018 | | December 2, 2017 |
| Accrual Balance — beginning | $ | 51.5 |
| | $ | 47.7 |
| $ | 52.1 |
| | $ | 52.6 |
| | $ | 51.5 |
| | $ | 47.7 |
|
| Accrual for product-related matters | 5.6 |
| | 9.4 |
| 5.1 |
| | 5.6 |
| | 10.7 |
| | 15.0 |
|
| Settlements and adjustments | (5.0 | ) | | (4.5 | ) | (4.8 | ) | | (4.9 | ) | | (9.8 | ) | | (9.4 | ) |
| Accrual Balance — ending | $ | 52.1 |
| | $ | 52.6 |
| $ | 52.4 |
| | $ | 53.3 |
| | $ | 52.4 |
| | $ | 53.3 |
|
Guarantees
The companyCompany is periodically required to provide performance bonds to do business with certain customers. These arrangements are common in the industry and generally have terms ranging between one and three years. The bonds are required to provide assurance to customers that the products and services they have purchased will be installed and/or provided properly and without damage to their facilities. The bonds are provided by various bonding agencies. However, the companyCompany is ultimately liable for claims that may occur against them. As of SeptemberDecember 1, 2018, the companyCompany had a maximum financial exposure related to performance bonds totaling approximately $6.1$5.1 million. The companyCompany has no history of claims, nor is it aware of circumstances that would require it to pay, under any of these arrangements. The companyCompany also believes that the resolution of any claims that might arise in the future, either individually or in the aggregate, would not materially affect the company'sCompany's financial statements. Accordingly, no liability has been recorded in respect to these bonds as of either SeptemberDecember 1, 2018 or June 2, 2018.
The companyCompany has entered into standby letter of credit arrangements for purposes of protecting various insurance companies and lessors against default on insurance premium and lease payments. As of SeptemberDecember 1, 2018, the companyCompany had a maximum financial exposure from these standby letters of credit totaling approximately $9.8$11.3 million, all of which is considered usage against the company'sCompany's revolving line of credit. The companyCompany has no history of claims, nor is it aware of circumstances that would require it to perform under any of these arrangements, and believes that the resolution of any claims that might arise in the future, either individually or in the aggregate, would not materially affect the company'sCompany's financial statements. Accordingly, no liability has been recorded in respect of these arrangements as of SeptemberDecember 1, 2018 and June 2, 2018.
Contingencies
The companyCompany is also involved in legal proceedings and litigation arising in the ordinary course of business. In the opinion of management, the outcome of such proceedings and litigation currently pending will not materially affect the company'sCompany's consolidated financial statements.
One shareholder has put options that would require the Company to purchase an additional 33% of the equity in HAY at fair market value. These put options have multiple periods for exercise, with fiscal 2020 through fiscal 2024 representing the earliest possible period of exercise.
13. Debt
Long-term debt as of SeptemberDecember 1, 2018 and June 2, 2018 consisted of the following obligations:
| | | (In millions) | September 1, 2018 | | June 2, 2018 | December 1, 2018 | | June 2, 2018 |
| Debt securities, due March 1, 2021 | 50.0 |
| | 50.0 |
| $ | 50.0 |
| | $ | 50.0 |
|
| Syndicated revolving line of credit, due September 2021 | 225.0 |
| | 225.0 |
| 225.0 |
| | 225.0 |
|
| Construction-Type Lease | 6.9 |
| | 7.0 |
| 6.9 |
| | 7.0 |
|
| Supplier financing program | 3.7 |
| | $ | 3.8 |
| 3.4 |
| | 3.8 |
|
| Total debt | $ | 285.6 |
| | $ | 285.8 |
| $ | 285.3 |
| | $ | 285.8 |
|
| Less: Current debt | (3.7 | ) | | (10.8 | ) | (3.4 | ) | | (10.8 | ) |
| Long-term debt | $ | 281.9 |
| | $ | 275.0 |
| $ | 281.9 |
| | $ | 275.0 |
|
The company'sCompany's syndicated revolving line of credit provides the companyCompany with up to $400 million in revolving variable interest borrowing capacity and includes an "accordion feature" allowing the companyCompany to increase, at its option and subject to the approval of the participating banks, the aggregate borrowing capacity of the facility by up to $200 million. The facility will expire in September 2021 and outstanding borrowings bear interest at rates based on the prime rate, federal funds rate, LIBOR or negotiated rates as outlined in the agreement. Interest is payable periodically throughout the period if borrowings are outstanding.
As of SeptemberDecember 1, 2018, the total debt outstanding related to borrowings under the syndicated revolving line of credit was $225.0 million. Available borrowings against this facility were $165.2$163.7 million due to $9.8$11.3 million related to outstanding letters of credit. As of June 2, 2018, total debt outstanding related to borrowings under the syndicated revolving line of credit was $225.0 million and available borrowings were $166.8 million due to $8.2 million outstanding letters of credit.
Supplier Financing Program
The companyCompany has an agreement with a third party financial institution to provide a platform that allows certain participating suppliers the ability to finance payment obligations from the company.Company. Under this program, participating suppliers may finance payment obligations of the company,Company, prior to their scheduled due dates, at a discounted price to the third party financial institution.
The companyCompany has lengthened the payment terms for certain suppliers that have chosen to participate in the program. As a result, certain amounts due to suppliers have payment terms that are longer than standard industry practice and as such, these amounts have been excluded from the caption “Accounts payable” in the Condensed Consolidated Balance Sheets as the amounts have been accounted for by the companyCompany as a current debt obligation. Accordingly, $3.7$3.4 million and $3.8 million have been recorded within the caption “Other accrued liabilities” for the periods ended SeptemberDecember 1, 2018 and June 2, 2018, respectively.
Construction-Type Lease
During fiscal 2015, the companyCompany entered into a lease agreement for the occupancy of a new studio facility in Palo Alto, California which runs through fiscal 2026. In fiscal 2017, the companyCompany became the deemed owner of the leased building for accounting purposes as a result of the company'sCompany's involvement during the construction phase of the project. The lease is therefore accounted for as a financing transaction and the building and related financing liability were initially recorded at fair value in the Consolidated Balance Sheets within both Construction in progress and Other accrued liabilities. The fair value of the building and financing liability was determined through a blend of an income approach, comparable property sales approach and a replacement cost approach.
During the first quarter of fiscal 2018, the construction was substantially completed, and the property was placed in service. As a result, the companyCompany began depreciating the assets over their estimated useful lives. The companyCompany also reclassified the related financing liability to Long-term debt. Additionally, the companyCompany began allocating its monthly lease payments between land rent, which is recorded as an operating lease expense, interest expense and the reduction of the related lease obligation. The imputed interest rate on the financing liability is 2.9 percent,
2.9%, our incremental borrowing rate. The carrying value of the building and the related financing liability at September 1, 2018 was $7.0 million andwere both $6.9 million respectively.at December 1, 2018. The carrying value of the building and the related financing liability were both $7.0 million at June 2, 2018.
14. Accumulated Other Comprehensive Loss
The following table provides an analysis of the changes in accumulated other comprehensive loss for the threesix months ended SeptemberDecember 1, 2018 and SeptemberDecember 2, 2017:
| | | (In millions) | Cumulative Translation Adjustments | | Pension and Other Post-retirement Benefit Plans | | Unrealized Gains on Available-for-sale Securities | | Interest Rate Swap Agreement | | Accumulated Other Comprehensive Loss | Cumulative Translation Adjustments | | Pension and Other Post-retirement Benefit Plans | | Unrealized Gains on Available-for-sale Securities | | Interest Rate Swap Agreement | | Accumulated Other Comprehensive Loss |
| Balance at June 3, 2017 | $ | (36.8 | ) | | $ | (47.6 | ) | | $ | 0.1 |
| | $ | 2.1 |
| | $ | (82.2 | ) | $ | (36.8 | ) | | $ | (47.6 | ) | | $ | 0.1 |
| | $ | 2.1 |
| | $ | (82.2 | ) |
| Other comprehensive income (loss) before reclassifications | 4.4 |
| | — |
| | — |
| | (1.6 | ) | | 2.8 |
| 4.5 |
| | — |
| | — |
| | 1.0 |
| | 5.5 |
|
| Reclassification from accumulated other comprehensive loss - Selling, general and administrative | — |
| | 1.0 |
| | — |
| | — |
| | 1.0 |
| |
| Reclassification from accumulated other comprehensive loss - Other, net | | — |
| | 2.1 |
| | — |
| | — |
| | 2.1 |
|
| Tax benefit | — |
| | (0.2 | ) | | — |
| | — |
| | (0.2 | ) | — |
| | (0.5 | ) | | — |
| | — |
| | (0.5 | ) |
| Net reclassifications | — |
| | 0.8 |
| | — |
| | — |
| | 0.8 |
| — |
| | 1.6 |
| | — |
| | — |
| | 1.6 |
|
| Net current period other comprehensive income | 4.4 |
| | 0.8 |
| | — |
| | (1.6 | ) | | 3.6 |
| 4.5 |
| | 1.6 |
| | — |
| | 1.0 |
| | 7.1 |
|
| Balance at September 2, 2017 | $ | (32.4 | ) | | (46.8 | ) | | $ | 0.1 |
| | $ | 0.5 |
| | $ | (78.6 | ) | |
| Balance at December 2, 2017 | | $ | (32.3 | ) | | (46.0 | ) | | $ | 0.1 |
| | $ | 3.1 |
| | $ | (75.1 | ) |
| | | | | | | | | | | | | | | | | | | |
| Balance at June 2, 2018 | $ | (34.1 | ) | | $ | (37.2 | ) | | $ | 0.1 |
| | $ | 9.9 |
| | $ | (61.3 | ) | $ | (34.1 | ) | | $ | (37.2 | ) | | $ | 0.1 |
| | $ | 9.9 |
| | $ | (61.3 | ) |
| Cumulative effect of accounting change | — |
| | — |
| | (0.1 | ) | | — |
| | (0.1 | ) | — |
| | — |
| | (0.1 | ) | | 1.5 |
| | 1.4 |
|
| Other comprehensive income before reclassifications | (7.9 | ) | | — |
| | (0.1 | ) | | (0.5 | ) | | (8.5 | ) | (12.4 | ) | | — |
| | (0.1 | ) | | 0.5 |
| | (12.0 | ) |
| Reclassification from accumulated other comprehensive loss - Selling, general and administrative | — |
| | 0.8 |
| | — |
| | — |
| | 0.8 |
| |
| Reclassification from accumulated other comprehensive loss - Other, net | | — |
| | 1.3 |
| | — |
| | — |
| | 1.3 |
|
| Tax benefit | — |
| | (0.1 | ) | | — |
| | — |
| | (0.1 | ) | — |
| | (0.2 | ) | | — |
| | — |
| | (0.2 | ) |
| Net reclassifications | — |
| | 0.7 |
| | — |
| | — |
| | 0.7 |
| — |
| | 1.1 |
| | — |
| | — |
| | 1.1 |
|
| Net current period other comprehensive income | (7.9 | ) | | 0.7 |
| | (0.1 | ) | | (0.5 | ) | | (7.8 | ) | (12.4 | ) | | 1.1 |
| | (0.1 | ) | | 0.5 |
| | (10.9 | ) |
| Balance at September 1, 2018 | $ | (42.0 | ) | | $ | (36.5 | ) | | $ | (0.1 | ) | | $ | 9.4 |
| | $ | (69.2 | ) | |
| Balance at December 1, 2018 | | $ | (46.5 | ) | | $ | (36.1 | ) | | $ | (0.1 | ) | | $ | 11.9 |
| | $ | (70.8 | ) |
15. Redeemable Noncontrolling Interests
Redeemable noncontrolling interests are reported on the Consolidated Balance Sheets in mezzanine equity in “Redeemable noncontrolling interests.” The companyCompany recognizes changes to the redemption value of redeemable noncontrolling interests as they occur and adjusts the carrying value to equal the redemption value at the end of each reporting period. The redemption amounts have been estimated based on the fair value of the subsidiary, determined based on a weighting of the discounted cash flow and market methods. This represents a level 3 fair value measurement.
Changes in the company’sCompany’s redeemable noncontrolling interests for the threesix months ended SeptemberDecember 1, 2018 and SeptemberDecember 2, 2017 are as follows:
| | | (In millions) | September 1, 2018 | | September 2, 2017 | December 1, 2018 | | December 2, 2017 |
| Beginning Balance | $ | 30.5 |
| | $ | 24.6 |
| $ | 30.5 |
| | $ | 24.6 |
|
| Purchase of redeemable noncontrolling interests | (10.0 | ) | | (1.0 | ) | (10.1 | ) | | (1.0 | ) |
| Net income attributable to redeemable noncontrolling interests | 0.1 |
| | — |
| 0.1 |
| | — |
|
| Exercised options | 0.2 |
| | — |
| 0.2 |
| | — |
|
| Redemption value adjustment | — |
| | (0.2 | ) | — |
| | 0.2 |
|
| Other adjustments | (0.1 | ) | | — |
| — |
| | 0.1 |
|
| Ending Balance | $ | 20.7 |
| | $ | 23.4 |
| $ | 20.7 |
| | $ | 23.9 |
|
16. Operating Segments
The company'sCompany's reportable segments consist of North American Furniture Solutions, ELA ("EMEA, Latin America, and Asia Pacific") Furniture Solutions, Specialty and Consumer. The North American Furniture Solutions segment includes the operations associated with the design, manufacture and sale of furniture products for work-related settings, including office, education and healthcare environments, throughout the United States and Canada. The business associated with the company'sCompany's owned contract furniture dealers is also included in the North American Furniture Solutions segment. The ELA Furniture Solutions segment includes EMEA, Latin America and Asia-Pacific. ELA includes the operations associated with the design, manufacture, and sale of furniture products, primarily for work-related settings, in these geographic regions. The Specialty segment includes the operations associated with the design, manufacture, and sale of high-craft furniture products and textiles including Geiger wood products, Maharam textiles, Nemschoff and Herman Miller Collection products. The Consumer segment includes operations associated with the sale of modern design furnishings and accessories to third party retail distributors, through contract channels, as well as direct to consumer sales through eCommerce and Design Within Reach and HAY retail studios.studios and outlets.
The companyCompany also reports a “Corporate” category consisting primarily of unallocated expenses related to general corporate functions, including, but not limited to, certain legal, executive, corporate finance, information technology, administrative and acquisition-related costs. Management regularly reviews corporate costs and believes disclosing such information provides more visibility and transparency regarding how the chief operating decision maker reviews results of the Company. The accounting policies of the reportable operating segments are the same as those of the company.Company.
The following is a summary of certain key financial measures for the respective fiscal periods indicated.
| | | | Three Months Ended | Three Months Ended | | Six Months Ended |
| (In millions) | September 1, 2018 | | September 2, 2017 | December 1, 2018 | | December 2, 2017 | | December 1, 2018 | | December 2, 2017 |
| Net Sales: | | | | | | | | | | |
| North American Furniture Solutions | $ | 343.7 |
| | $ | 328.6 |
| $ | 353.2 |
| | $ | 330.5 |
| | $ | 696.9 |
| | $ | 659.0 |
|
| ELA Furniture Solutions | 115.4 |
| | 93.4 |
| 118.5 |
| | 113.0 |
| | 234.0 |
| | 206.4 |
|
| Specialty | 77.3 |
| | 75.1 |
| 81.6 |
| | 74.4 |
| | 158.9 |
| | 149.5 |
|
| Consumer | 88.2 |
| | 83.2 |
| 99.3 |
| | 86.7 |
| | 187.5 |
| | 169.9 |
|
| Total | $ | 624.6 |
| | $ | 580.3 |
| $ | 652.6 |
| | $ | 604.6 |
| | $ | 1,277.3 |
| | $ | 1,184.8 |
|
| | | | | | | | | | | |
| Operating Earnings (Loss): | | | | | | | | | | |
| North American Furniture Solutions | $ | 45.0 |
| | $ | 48.7 |
| $ | 46.4 |
| | $ | 45.1 |
| | $ | 91.4 |
| | $ | 93.9 |
|
| ELA Furniture Solutions | 10.5 |
| | 7.0 |
| 13.8 |
| | 12.7 |
| | 24.3 |
| | 19.6 |
|
| Specialty | 3.1 |
| | 1.6 |
| 4.8 |
| | 2.1 |
| | 8.0 |
| | 3.7 |
|
| Consumer | 2.1 |
| | 0.3 |
| 1.8 |
| | 1.0 |
| | 3.9 |
| | 1.3 |
|
| Corporate | (14.7 | ) | | (8.1 | ) | (13.7 | ) | | (10.5 | ) | | (28.5 | ) | | (18.6 | ) |
| Total | $ | 46.0 |
| | $ | 49.5 |
| $ | 53.1 |
| | $ | 50.4 |
| | $ | 99.1 |
| | $ | 99.9 |
|
|
| | | | | | | |
| (In millions) | September 1, 2018 | | June 2, 2018 |
| Total Assets: | | | |
| North American Furniture Solutions | $ | 506.1 |
| | $ | 488.7 |
|
| ELA Furniture Solutions | 347.4 |
| | 283.4 |
|
| Specialty | 190.8 |
| | 188.7 |
|
| Consumer | 294.8 |
| | 291.2 |
|
| Corporate | 124.6 |
| | 227.5 |
|
| Total | $ | 1,463.7 |
| | $ | 1,479.5 |
|
|
| | | | | | | |
| (In millions) | December 1, 2018 | | June 2, 2018 |
| Total Assets: | | | |
| North American Furniture Solutions | $ | 515.1 |
| | $ | 488.7 |
|
| ELA Furniture Solutions | 355.0 |
| | 283.4 |
|
| Specialty | 197.2 |
| | 188.7 |
|
| Consumer | 305.0 |
| | 291.2 |
|
| Corporate | 137.4 |
| | 227.5 |
|
| Total | $ | 1,509.7 |
| | $ | 1,479.5 |
|
17. Restructuring and Impairment Expenses
Fiscal 2019 Restructuring Expenses
ELA segment
During the fourth quarter of fiscal 2018, the companyCompany announced a facilities consolidation plan related to its ELA segment. This impacted certain office and manufacturing facilities in the United Kingdom and China. It is currently contemplated that this plan will generate approximately $3 million in annual cost reductions as part of the company'sCompany's three-year cost savings initiatives.
In the firstsecond quarter of fiscal 2019, the companyCompany recognized restructuring expenses of $0.3 million related to the consolidation of certain facilities in China and the United Kingdom that were announced in the fourth quarter of fiscal 2018. In the first half of fiscal 2019, the Company recognized restructuring and impairment expenses of $1.1$1.4 million related to the facilities consolidation plan, of which $0.7$0.8 million related to an asset impairment recorded against the office building in the United Kingdom that is being
vacated and $0.4$0.6 million from the consolidation of China manufacturing facilities, comprised primarily of moving related costs. As the United Kingdom office building and related assets meet the criteria to be designated as assets held for sale, the carrying value of these assets have been classified as current assets and included within "Prepaid expenses and other" in the Condensed Consolidated Balance Sheets for the period ended SeptemberDecember 1, 2018. The carrying amount of the assets held for sale was approximately $5.0 million as of SeptemberDecember 1, 2018.
To date, the companyCompany has recognized $5.0$5.3 million of restructuring costs related to the ELA facilities consolidation plan. The companyCompany expects the ELA facilities consolidations to be completed by the first quarter of fiscal 2020. It is currently contemplated that this plan will incur an additional estimated $2 million of future restructuring and related special charges.
The following table provides an analysis of the changes in ELA segment restructuring costs reserve:reserve for the six months ended December 1, 2018:
|
| | | | | | | | | | | | |
| (In millions) | Severance and Employee-Related | Impairment of Property and Equipment | Exit or Disposal Activities | Total |
| Beginning Balance | $ | — |
| $ | — |
| $ | — |
| $ | — |
|
| Restructuring Costs | 0.1 |
| 0.8 |
| 0.5 |
| 1.4 |
|
| Amounts Paid | (0.1 | ) | — |
| (0.5 | ) | (0.6 | ) |
| Charges Against Assets | — |
| (0.8 | ) | — |
| (0.8 | ) |
| Ending Balance | $ | — |
| $ | — |
| $ | — |
| $ | — |
|
|
| | | |
(In millions) | September 1, 2018 |
Beginning Balance | $ | — |
|
Restructuring and impairment expenses | 1.1 |
|
Payments | (1.1 | ) |
Ending Balance | $ | — |
|
Fiscal 2018 Restructuring Expenses
North America Contract segment
During the first quarter of fiscal 2018, the company announced restructuring actions involving targeted workforce reductions primarily within the North American segment. These actions related to the company's cost savings initiatives and resulted in the recognition of restructuring expenses of $1.4 million in the first quarter of fiscal 2018. The restructuring actions were completeddeemed to be complete at SeptemberDecember 2, 2017 and final payments were made over the next quarter.two quarters.
During the second quarter of fiscal 2018, the company announced further restructuring actions involving targeted workforce reductions primarily within the North American segment. These actions related to the company's previously announced cost savings initiatives and resulted in the recognition of restructuring expenses of $0.5 million in the second quarter of fiscal 2018. The restructuring actions were deemed to be complete at December 2, 2017 and final payments were made over the next two quarters.
The following table provides an analysis of the changes in North America Contract segment restructuring costs reserve:reserve for the six months ended December 2, 2017:
| | | (In millions) | September 2, 2017 | |
| Beginning Balance | $ | 2.4 |
| $ | 2.4 |
|
| Restructuring expenses | 1.4 |
| 1.9 |
|
| Payments | (1.8 | ) | (2.8 | ) |
| Ending Balance | $ | 2.0 |
| $ | 1.5 |
|
Item 2: Management's Discussion and Analysis of Financial Condition and Results of Operations
Three and Six Months Ended SeptemberDecember 1, 2018
(in millions)
The following is management's discussion and analysis of certain significant factors that affected the company'sCompany's financial condition, earnings and cash flows during the periods included in the accompanying condensed consolidated financial statements and should be read in conjunction with the company'sCompany's Annual Report on Form 10-K for the fiscal year ended June 2, 2018. References to “Notes” are to the footnotes included in the accompanying condensed consolidated financial statements.
Discussion of Current Business Conditions
ForIn the firstsecond quarter of fiscal 2019, the companyCompany set records for reported net sales and orders. Net sales of $624.6$652.6 million represented an increase of 7.6 percent7.9% from the same quarter of the prior year period reflecting broad-based growth across all reportable segments. Ordersand orders of $630.6$702.6 million represented an increase of 6.0 percent11.6% relative to the prior year period. Diluted earnings per share were $0.60,$0.66, which was an increase of $0.05$0.11 per share as compared to the prior year. After adjusting for specialExcluding the impact of restructuring expenses and other charges, and restructuring and impairment expenses, Adjustedadjusted diluted earnings per share were $0.69$0.75(*), a 21 percent31.6% increase as compared to the prior year.
The North American segment reported net sales of $343.7$353.2 million in the current period, an increase of 4.6 percent6.9% as compared to the prior year period. On an organic basis, net sales were $344.2$354.2 million(*), which represented growth of 3.5 percent5.5%(*) over the firstsecond quarter of fiscal 2018. Orders during the firstsecond quarter of fiscal 2019 of $345.0$370.6 million were 3.0 percent8.6% higher than the same quarter of last fiscal year. On an organic basis, orders were $345.6$371.5 million,(*), which represented growth of 2.4 percent(*)6.7% over the firstsame quarter of fiscal 2018.Operatingthe prior year period. Operating earnings for North America in the firstsecond quarter of fiscal 2019 were $45.0$46.4 million or 13.1 percent13.1% of sales as compared to $48.7$45.1 million or 14.8 percent13.6% of sales in the firstsecond quarter of fiscal 2018.
The ELA segment recorded net sales of $115.4$118.5 million during the current period representing growth of 23.6 percent4.9% compared to last year, while organic net sales increased by 22.1 percent4.3%(*). Growth in net sales compared to last year was driven broad-based growth across all regions. Orders in the firstsecond quarter of fiscal 2019 of $125.0$137.3 million represented an increase of 15.2 percent16.4% from the prior year. Organic order growth was 14.4 percent15.1% relative to the prior year period. This growth in sales and orders was driven primarily by increases in the Asia Pacific, Europe, and EMEAthe Middle East regions. Operating earnings within the ELA segment for the firstsecond quarter of fiscal 2019 were $10.5$13.8 million or 9.1 percent11.6% of sales as compared to $7.0$12.7 million or 7.5 percent11.2% of sales in the firstsecond quarter of fiscal 2018.
The Specialty segment reported growth in both net sales and orders compared to the same three month period of the prior year. Net sales of $77.3$81.6 million and orders of $80.1$87.1 million represented growth compared to the prior year of 2.9 percent9.7% and 6.2 percent,13.0%, respectively. Organic net sales growth was 2.1 percent8.8%(*) as compared to the prior year period while organic order growth was 5.5 percent12.2% as compared to the prior year period. The increase in Netnet sales was broad-based and driven mainly by all components in the company's Maharam subsidiary,Specialty segment, while the increase in orders was broad-baseddriven mainly by the Company's Maharam and driven by allNemschoff subsidiaries, inas well as the Specialty segment.Herman Miller Collection family of products. Operating earnings for Specialty increased from $1.6$2.1 million in the firstsecond quarter of fiscal 2018 to $3.1$4.8 million in the firstsecond quarter of fiscal 2019. The increase in operating earnings as compared to the prior year was mainly by driven increasedimproved profitability at the company'sCompany's Maharam subsidiary.and Nemschoff subsidiaries.
The Consumer segment reported net sales of $88.2$99.3 million, which represented andan improvement of 6.0 percent14.5% compared to the same quarter of last fiscal year. After adjusting forOrders of $107.6 million represented growth in the prior year benefit to Net sales due to a change in shipping terms,comparative period of 15.5%. Organic net sales growth was 12.8 percent14.6%(*) as compared to the prior year period. Orders of $80.5 million representedperiod while organic order growth inwas 15.6% as compared to the comparative period of 5.8 percent, both on an as reported and an organic basis.prior year period. Operating earnings for the Consumer segment in the firstsecond quarter of fiscal 2019 were $2.1$1.8 million or 2.4 percent1.8% of sales as compared to $0.3$1.0 million or 0.4 percent1.2% of sales in the firstsecond quarter of fiscal 2018. The year-over-year increase in profitability was driven mainly by increased sales volumes.
The companyCompany believes that the economic environment in North America remains generally conducive to continue suchcontinued growth due to arecent positive industry forecast fromorder trends as reported by BIFMA - The Business and Institutional Furniture Manufacturer's Association, GDP growth, service sector employment and architectural billings and CEO confidence. Thebillings. Further, the potential benefits of the Tax Cuts and Jobs Act continue to support a positive outlook in North America as well.companies increase business investment and spending. However, the companyCompany acknowledges certain areas of risk within the foreign geographies in which it operates and it is monitoring the resolution of Brexittrade trade policy negotiations between the U.S. and NAFTA negotiations. key trading partners as well as the ongoing negotiations concerning the U.K. referendum to exit the European Union.
The companyCompany is also closely monitoring the potential impact of global tariffs. However, due to the recent deferral of the potential 25% tariff rate on goods imported by the Company and its suppliers from China, near-term tariff pressures have lessened. While uncertainty remains with respect to trade relations with China, the Company continues to believe that its profit optimization work and January 2019 price increase will fully offset the incurred impact of imposed tariffs which has created near-term uncertainty on input costs.
|
|
(*) Non-GAAP measurements; see accompanying reconciliations and explanations. |
and will continue to evaluate additional contingency plans to help navigate this situation in the longer term. The remaining sections within Item 2 include additional analysis of our threesix months ended SeptemberDecember 1, 2018, including discussion of significant variances compared to the prior year periods.
(*) Non-GAAP measurements; see accompanying reconciliations and explanations.
Reconciliation of Non-GAAP Financial Measures
This report contains references to Organic net sales and Adjusted earnings per share - diluted, which are non-GAAP financial measures. Organic Growth (Decline) represents the change in Net sales, excluding currency translation effects, the impact of the reclassification of certain pricing elements from Net sales to Cost of sales related to the new revenue recognition standard (ASC 606) and the impact of acquisitions, divestitures and changes in shipping terms. Adjusted Earningsearnings per Shareshare - diluted represents reported diluted earnings per share excluding the impactan income tax adjustment for provisional estimates related to adoption of U.S. Tax Reform, inventory step up on HAY equity method investment, restructuring and impairment expenses, and other special charges, or gains, including related taxes. Special charges include incremental costs related to the CEO transition and third party consulting costs related to the company's profit enhancement initiatives.
The companyCompany believes presenting Organic net sales and Adjusted earnings per share - diluted is useful for investors as it provides financial information on a more comparative basis for the periods presented by excluding items that are not representative of the ongoing operations of the company.Company.
Organic net sales and Adjusted earnings per share - diluted are not measurements of our financial performance under GAAP and should not be considered as alternatives to the related GAAP measurement. These non-GAAP measurements have limitations as analytical tools and should not be considered in isolation or as a substitute for analysis of our results as reported under GAAP. Our presentation of non-GAAP measures should not be construed as an indication that our future results will be unaffected by unusual or infrequent items. We compensate for these limitations by providing prominence of our GAAP results and using the non-GAAP financial measures only as a supplement. The following table reconciles Net sales to Organic net sales for the periods ended as indicated below:
| | | | Three Months Ended | Three Months Ended | Three Months Ended | Three Months Ended |
| | 9/1/18 | 9/2/17 | 12/1/18 | 12/2/17 |
| | North America | ELA | Specialty | Consumer | Total | North America | ELA | Specialty | Consumer | Total | North America | ELA | Specialty | Consumer | Total | North America | ELA | Specialty | Consumer | Total |
| Net Sales, as reported | $ | 343.7 |
| $ | 115.4 |
| $ | 77.3 |
| $ | 88.2 |
| $ | 624.6 |
| $ | 328.6 |
| $ | 93.4 |
| $ | 75.1 |
| $ | 83.2 |
| $ | 580.3 |
| $ | 353.2 |
| $ | 118.5 |
| $ | 81.6 |
| $ | 99.3 |
| $ | 652.6 |
| $ | 330.5 |
| $ | 113.0 |
| $ | 74.4 |
| $ | 86.7 |
| $ | 604.6 |
|
| % change from PY | 4.6 | % | 23.6 | % | 2.9 | % | 6.0 | % | 7.6 | % | | | 6.9 | % | 4.9 | % | 9.7 | % | 14.5 | % | 7.9 | % | | |
| | | | | | | | | |
| Proforma Adjustments | | | | | | | | |
| Dealer Divestitures | — |
| — |
| — |
| — |
| — |
| (0.8 | ) | — |
| — |
| — |
| (0.8 | ) | |
Currency Translation Effects (1) | 0.5 |
| 1.2 |
| — |
| — |
| 1.7 |
| — |
| — |
| — |
| — |
| — |
| 1.0 |
| 2.9 |
| — |
| 0.1 |
| 4.0 |
| — |
| — |
| — |
| — |
| — |
|
| Impact of Reclassification Related to New Revenue Recognition Standard | — |
| — |
| — |
| — |
| — |
| 4.6 |
| 2.1 |
| 0.6 |
| — |
| 7.3 |
| — |
| — |
| — |
| — |
| — |
| 5.3 |
| 3.4 |
| 0.6 |
| — |
| 9.3 |
|
| Impact of change in DWR shipping terms | — |
| — |
| — |
| — |
| — |
| — |
| — |
| — |
| (5.0 | ) | (5.0 | ) | |
| Organic net sales | $ | 344.2 |
| $ | 116.6 |
| $ | 77.3 |
| $ | 88.2 |
| $ | 626.3 |
| $ | 332.4 |
| $ | 95.5 |
| $ | 75.7 |
| $ | 78.2 |
| $ | 581.8 |
| $ | 354.2 |
| $ | 121.4 |
| $ | 81.6 |
| $ | 99.4 |
| $ | 656.6 |
| $ | 335.8 |
| $ | 116.4 |
| $ | 75.0 |
| $ | 86.7 |
| $ | 613.9 |
|
| % change from PY | 3.5 | % | 22.1 | % | 2.1 | % | 12.8 | % | 7.6 | % | | | 5.5 | % | 4.3 | % | 8.8 | % | 14.6 | % | 7.0 | % | | |
(1) Currency translation effects represent the estimated net impact of translating current period sales and orders using the average exchange rates applicable to the comparable prior year period | |
|
| | | | | | | | | | | | | | | | | | | | | | | | | | | | | |
| | Six Months Ended | Six Months Ended |
| | 12/1/18 | 12/2/17 |
| | North America | ELA | Specialty | Consumer | Total | North America | ELA | Specialty | Consumer | Total |
| Net Sales, as reported | $ | 696.9 |
| $ | 234.0 |
| $ | 158.9 |
| $ | 187.5 |
| $1,277.3 | $ | 659.0 |
| $ | 206.4 |
| $ | 149.5 |
| $ | 169.9 |
| $ | 1,184.8 |
|
| % change from PY | 5.8 | % | 13.4 | % | 6.3 | % | 10.4 | % | 7.8 | % | | | | | |
| | | | | | | | | | | |
| Proforma Adjustments | | | | | | | | | | |
| Dealer Divestitures | — |
| — |
| — |
| — |
| — |
| (0.8 | ) | — |
| — |
| — |
| (0.8 | ) |
Currency Translation Effects (1) | 1.5 |
| 4.0 |
| 0.1 |
| 0.1 |
| 5.7 |
| — |
| — |
| — |
| — |
| — |
|
| Impact of Reclassification Related to New Revenue Recognition Standard | — |
| — |
| — |
| — |
| — |
| 9.9 |
| 5.5 |
| 1.2 |
| — |
| 16.6 |
|
| Impact of change in DWR shipping terms | — |
| — |
| — |
| — |
| — |
| — |
| — |
| — |
| (5.0 | ) | (5.0 | ) |
| Organic net sales | $ | 698.4 |
| $ | 238.0 |
| $ | 159.0 |
| $ | 187.6 |
| $1,283.0 | $ | 668.1 |
| $ | 211.9 |
| $ | 150.7 |
| $ | 164.9 |
| $ | 1,195.6 |
|
| % change from PY | 4.5 | % | 12.3 | % | 5.5 | % | 13.8 | % | 7.3 | % | | | | | |
(1) Currency translation effects represent the estimated net impact of translating current period sales and orders using the average exchange rates applicable to the comparable prior year period |
The following table reconciles Earnings per share - diluted to Adjusted earnings per share - diluted for the three and six months ended:
| | | | | | | | Three Months Ended | Six Months Ended |
| | 9/1/2018 | 9/2/2017 | 12/1/18 | 12/2/17 | 12/1/18 | 12/2/17 |
| Earnings per Share - Diluted | $ | 0.60 |
| $ | 0.55 |
| $ | 0.66 |
| $ | 0.55 |
| $ | 1.26 |
| $ | 1.10 |
|
| | | | | | | |
| Add: Adjustments Related to Adoption of U.S. Tax Cuts and Jobs Act | | 0.01 |
| — |
| 0.01 |
| — |
|
| Add: Inventory step up on HAY equity method investment, after tax | 0.01 |
| — |
| — |
| — |
| 0.01 |
| — |
|
| Add: Special charges, after tax | 0.06 |
| — |
| 0.08 |
| 0.01 |
| 0.14 |
| 0.02 |
|
| Add: Restructuring and impairment expenses, after tax | 0.02 |
| 0.02 |
| — |
| 0.01 |
| 0.02 |
| 0.02 |
|
| Adjusted Earnings per Share - Diluted | $ | 0.69 |
| $ | 0.57 |
| $ | 0.75 |
| $ | 0.57 |
| $ | 1.44 |
| $ | 1.14 |
|
| | | | | | |
| Weighted Average Shares Outstanding (used for Calculating Adjusted Earnings per Share) – Diluted | | 59,442,219 |
| 60,272,207 |
| 59,612,113 |
| 60,296,728 |
|
Analysis of Results for Three and Six Months
The following table presents certain key highlights from the results of operations for the three months ended.periods indicated.
| | | (In millions, except per share data) | September 1, 2018 | | September 2, 2017 | | Percent Change | Three Months Ended | | Six Months Ended |
| | | December 1, 2018 | | December 2, 2017 | | Percent Change | | December 1, 2018 | | December 2, 2017 | | Percent
Change |
| Net sales | $ | 624.6 |
| | $ | 580.3 |
| | 7.6 | % | $ | 652.6 |
| | $ | 604.6 |
| | 7.9 | % | | $ | 1,277.3 |
| | $ | 1,184.8 |
| | 7.8 | % |
| Cost of sales | 399.5 |
| | 363.4 |
| | 9.9 | % | 417.0 |
| | 382.5 |
| | 9.0 | % | | 816.6 |
| | 745.8 |
| | 9.5 | % |
| Gross margin | 225.1 |
| | 216.9 |
| | 3.8 | % | 235.6 |
| | 222.1 |
| | 6.1 | % | | 460.7 |
| | 439.0 |
| | 4.9 | % |
| Operating expenses | 178.0 |
| | 166.0 |
| | 7.2 | % | 182.2 |
| | 171.2 |
| | 6.4 | % | | 360.2 |
| | 337.2 |
| | 6.8 | % |
| Restructuring expenses | 1.1 |
| | 1.4 |
| | n/a |
| 0.3 |
| | 0.5 |
| | (40.0 | )% | | 1.4 |
| | 1.9 |
| | (26.3 | )% |
| Total operating expenses | 179.1 |
| | 167.4 |
| | 7.0 | % | 182.5 |
| | 171.7 |
| | 6.3 | % | | 361.6 |
| | 339.1 |
| | 6.6 | % |
| Operating earnings | 46.0 |
| | 49.5 |
| | (7.1 | )% | 53.1 |
| | 50.4 |
| | 5.4 | % | | 99.1 |
| | 99.9 |
| | (0.8 | )% |
| Other expenses, net | 1.9 |
| | 3.0 |
| | (36.7 | )% | 3.8 |
| | 3.4 |
| | 11.8 | % | | 5.7 |
| | 6.4 |
| | (10.9 | )% |
| Earnings before income taxes and equity income | 44.1 |
| | 46.5 |
| | (5.2 | )% | 49.3 |
| | 47.0 |
| | 4.9 | % | | 93.4 |
| | 93.5 |
| | (0.1 | )% |
| Income tax expense | 8.9 |
| | 14.2 |
| | (37.3 | )% | 11.2 |
| | 14.3 |
| | (21.7 | )% | | 20.0 |
| | 28.5 |
| | (29.8 | )% |
| Equity income from nonconsolidated affiliates, net of tax | 0.7 |
| | 0.8 |
| | n/a |
| 1.2 |
| | 0.8 |
| | 50.0 | % | | 1.8 |
| | 1.5 |
| | 20.0 | % |
| Net earnings | 35.9 |
| | 33.1 |
| | 8.5 | % | 39.3 |
| | 33.5 |
| | 17.3 | % | | 75.2 |
| | 66.5 |
| | 13.1 | % |
| Net earnings attributable to noncontrolling interests | 0.1 |
| | — |
| | n/a |
| — |
| | — |
| | n/a |
| | 0.1 |
| | — |
| | n/a |
|
| Net earnings attributable to Herman Miller, Inc. | $ | 35.8 |
| | $ | 33.1 |
| | 8.2 | % | $ | 39.3 |
| | $ | 33.5 |
| | 17.3 | % | | 75.1 |
| | 66.5 |
| | 12.9 | % |
| | | | | | | | | | | | | | | | | |
| Earnings per share — diluted | 0.60 |
| | 0.55 |
| | 9.1 | % | 0.66 |
| | 0.55 |
| | 20.0 | % | | 1.26 |
| | 1.10 |
| | 14.5 | % |
| Orders | 630.6 |
| | 594.8 |
| | 6.0 | % | 702.6 |
| | 629.4 |
| | 11.6 | % | | 1,333.2 |
| | 1,224.2 |
| | 8.9 | % |
| Backlog | 346.4 |
| | 332.1 |
| | 4.3 | % | 396.1 |
| | 356.9 |
| | 11.0 | % | | | | | | |
The following table presents, for the periods indicated, select components of the company'sCompany's Condensed Consolidated Statements of Comprehensive Income as a percentage of net sales, for the three months ended:sales:
| | | | | | | Three Months Ended | | Six Months Ended |
| | September 1, 2018 | | September 2, 2017 | December 1, 2018 | | December 2, 2017 | | December 1, 2018 | | December 2, 2017 |
| Net sales | 100.0 | % | | 100.0 | % | 100.0 | % | | 100.0 | % | | 100.0 | % | | 100.0 | % |
| Cost of sales | 64.0 |
| | 62.6 |
| 63.9 |
| | 63.3 |
| | 63.9 |
| | 62.9 |
|
| Gross margin | 36.0 |
| | 37.4 |
| 36.1 |
| | 36.7 |
| | 36.1 |
| | 37.1 |
|
| Operating expenses | 28.5 |
| | 28.6 |
| 27.9 |
| | 28.3 |
| | 28.2 |
| | 28.5 |
|
| Restructuring expenses | 0.2 |
| | 0.2 |
| — |
| | 0.1 |
| | 0.1 |
| | 0.2 |
|
| Total operating expenses | 28.7 |
| | 28.8 |
| 28.0 |
| | 28.4 |
| | 28.3 |
| | 28.6 |
|
| Operating earnings | 7.4 |
| | 8.5 |
| 8.1 |
| | 8.3 |
| | 7.8 |
| | 8.4 |
|
| Other expenses, net | 0.3 |
| | 0.5 |
| 0.6 |
| | 0.6 |
| | 0.4 |
| | 0.5 |
|
| Earnings before income taxes and equity income | 7.1 |
| | 8.0 |
| 7.6 |
| | 7.8 |
| | 7.3 |
| | 7.9 |
|
| Income tax expense | 1.4 |
| | 2.4 |
| 1.7 |
| | 2.4 |
| | 1.6 |
| | 2.4 |
|
| Equity income from nonconsolidated affiliates, net of tax | 0.1 |
| | 0.1 |
| 0.2 |
| | 0.1 |
| | 0.1 |
| | 0.1 |
|
| Net earnings | 5.7 |
| | 5.7 |
| 6.0 |
| | 5.5 |
| | 5.9 |
| | 5.6 |
|
| Net earnings attributable to noncontrolling interests | — |
| | — |
| — |
| | — |
| | — |
| | — |
|
| Net earnings attributable to Herman Miller, Inc. | 5.7 |
| | 5.7 |
| 6.0 |
| | 5.5 |
| | 5.9 |
| | 5.6 |
|
Performance versus the Domestic Contract Furniture Industry
BIFMA is the trade association for the North American contract furniture industry. The companyCompany monitors the trade statistics reported by BIFMA and considers them an indicator of industry-wide sales and order performance. BIFMA publishes statistical data for the contract segment and the office supply segment within the North American market. The contract segment of the industry relates primarily to products sold to large to mid-size corporations and installed via a network of dealers. The office supply segment relates primarily to products sold to smaller customers via wholesalers and retailers. The companyCompany participates, and is a leader in, the contract segment. The company'sCompany's diversification strategy lessens its dependence on the North American contract office furniture market.
The companyCompany analyzes BIFMA statistical information as a benchmark comparison against the performance of its contract business in North America and also to that of its competitors. The timing of large project-based business may affect comparisons to this data in any one period. Finally, BIFMA regularly provides its members with industry forecast information, which the companyCompany uses internally as one of several considerations in its planning process.
While the sales and order data for our North American reportable segment provide a relative comparison to BIFMA, it is not intended to be an exact comparison. The data we report to BIFMA is consistent with the BIFMA definition of office furniture “consumption.” This definition differs slightly from the categorization we have presented in this report. Notwithstanding this difference, we believe our presentation provides the reader with a relevant comparison.
For the three months ended ended SeptemberDecember 1, 2018, the company'sCompany's North American shipments and orders, as defined by BIFMA, increased by 2.6 percent6.7% and 0.5 percent10.2% year-over-year, respectively. BIFMA reported an estimated year-over-year increase in shipments and orders of 6.6 percent5.1% and 7.1 percent,8.7%, respectively for the comparable period.
Performance versus the Consumer Furnishings Sector
We also monitor trade statistics reported by the U.S. Census Bureau, which reports monthly retail sales growth data across a number of retail categories, including Furniture and Home Furnishing Stores. This information provides a relative comparison to our Consumer segment, but is not intended to be an exact comparison. The average monthly year-over-year growth rate in sales for the Furniture and Home Furnishing Stores category for the calendar three month period through ended AugustNovember 2018, was approximately 4.4 percent.2.2%. By comparison, netNet sales in our Consumer segment increased by approximately 6.0 percent14.5% as reported and 12.8 percent14.6%(*) on an organic basis for the three months ended SeptemberDecember 1, 2018. Incremental Net sales in the Consumer Segment was attributable to the Company's DWR studios, e-commerce and HAY products.
|
|
| (*) Non-GAAP measurements; see accompanying reconciliations and explanations. |
Consolidated Sales
The following charts present graphically the primary drivers of the year-over-year change in net sales for the three and six months ended SeptemberDecember 1, 2018. The amounts presented in the bar graphs are expressed in millions and have been rounded to eliminate decimals.
Consolidated netNet sales increased $44.3$48.0 million or 7.6 percent7.9% in the firstsecond quarter of fiscal 2019 compared to the firstsecond quarter of fiscal 2018. The following items contributed to the change:
Increased sales volumes within the ELA segment of approximately $21 million were driven primarily by broad-based growth across all regions.
Sales volumes within the North American segment increased by approximately $12$20 million, resulting from increased demand within the company'sCompany's North America office furniture businesses.
| |
| • | Adoption of ASC 606 - Revenue from Contracts with Customers at the beginning of fiscal 2019 led to the reclassification of certain pricing elements from Net sales to Cost of sales, which resulted in an increase in Net sales of $8.5$10.7 million compared to the same period of the prior year in which revenue was recorded under previous accounting rules. |
Incremental sales volumes within the Consumer segment of approximately $4$10 million were driven by growth across the DWR studio,studios, e-commerce and contract channels. In the prior year period, Consumer sales benefited from a change in shipping terms at DWR that increased sales volumes by $5 million.introduction of HAY products.
Increased sales volumes within the Specialty segment of approximately $1$7 million waswere driven mainly by broad-based growth across all four businesses that comprise the company's Maharam subsidiary.Specialty segment.
Increased sales volumes within the ELA segment of approximately $4 million were driven primarily by growth in the Asia Pacific, Europe, and the Middle East regions.
Foreign currency translation had a negative impact on net sales of approximately $1$4 million.
|
|
| (*) Non-GAAP measurements; see accompanying reconciliations and explanations. |
Consolidated net sales increased $92.5 million or 7.8% in the first half of fiscal 2019 compared to the first half of fiscal 2018. The following items led to the change:
Sales volumes within the North American segment increased by approximately $32 million, resulting from increased demand within the Company's North America office furniture business.
Increased sales volumes within the ELA segment of approximately $25 million were driven by broad-based growth across all regions.
| |
| • | The impactAdoption of ASC 606 - Revenue from Contracts with Customers at the divestiturebeginning of fiscal 2019 led to the company's dealershipsreclassification of certain pricing elements from Net sales to Cost of sales, which resulted in Vancouver, Canadaan increase in fiscal 2018 had the effectNet sales of reducing sales by $0.8$19.2 million in the current three month period as compared to the same period of the prior fiscal year.year in which revenue was recorded under previous accounting rules.
|
Incremental sales volumes within the Consumer segment of approximately $14 million were driven by the introduction of HAY products and growth across the DWR studio, e-commerce and contract channels.
Increased sales volumes within the Specialty segment of approximately $8 million were driven mainly by the Company's Maharam and Nemschoff subsidiaries, as well as the Herman Miller Collection portfolio of products.
Foreign currency translation had a negative impact on net sales of approximately $6 million.
Consolidated Gross Margin
Consolidated gross margin was 36.0 percent36.1% for the three month period ended SeptemberDecember 1, 2018 as compared to 37.4 percent36.7% for the same quarter of the prior fiscal year. The following factors summarize the major drivers of the year-over-year change in gross margin percentage:
Approximately 60 basis points of the year-over-year decrease in gross margin related to the adoption of the new revenue recognition standard (ASC 606) at the beginning of fiscal 2019. This adoption requires recording certain product pricing elements as expenses within Cost of sales that were previously classified on a net basis within Net sales. This reclassification lowers gross margin percentage but has no impact on gross margin dollars.
A favorable change in product mix that was driven by a shift out of lower margin product categories and into seating drove an increase of approximately 50 basis points as compared to last fiscal year.
Higher overhead costs at the company's West Michigan manufacturing facilities related to higher medical costs, job correction costs and depreciation decreased gross margin by approximately 30 basis points as compared to the same period of the prior fiscal year.
Higher commodity costs and the initial impact of tariffs on Chinese imports drove an unfavorable impact of approximately 20 basis points relative to the prior year period.
Consolidated gross margin was 36.1% for the six month period ended December 1, 2018 as compared to 37.1% for the same period of the prior fiscal year. The following factors summarize the major drivers of the year-over-year change in gross margin percentage:
Approximately 60 basis points of the year-over-year decrease in gross margin related to the adoption of the new revenue recognition standard (ASC 606) at the beginning of fiscal 2019. This adoption requires recording certain product pricing elements as expenses within cost of goods sold that were previously classified on a net basis within sales. This reclassification lowers gross margin percentage but has no impact on gross margin dollars.
Higher manufacturingoverhead costs at the company's West Michigan manufacturing facilities related to higher medical costs, depreciationjob correction costs and overtime costsdepreciation decreased gross margin by approximately 3040 basis points as compared to the same period of the prior fiscal year.
ShippingA favorable change in product mix that was driven by a shift out of lower margin product categories and freight costs were unfavorable compared to the same period of the prior year period, whichinto seating drove a decreasean increase of approximately 20 basis points. This impact was recognized primarily within the company's Consumer reportable segment.points as compared to last fiscal year.
Higher commodity costs within the North American operating segment drove an unfavorable impact of approximately 20 basis points relative to the first half of prior year period.
The rest of the decrease in gross margin was driven by several factors, including lower alliance revenues during the current year period and product mix changes.year.
Operating Expenses and Operating Earnings
The following chart presents graphically the primary drivers of the year-over-year change in operating expenses for the three and six months ended SeptemberDecember 1, 2018. The amounts presented in the bar graphs are expressed in millions and have been rounded to eliminate decimals.
Consolidated operating expenses increased by $11.7$10.8 million or 7.0 percent6.3% in the firstsecond quarter of fiscal 2019 compared to the prior year period. The following factors contributed to the change:
Restructuring and specialSpecial charges, primarily associated with the planned CEO transition and consulting fees related to the company'sCompany's profit optimization initiatives and costs related to the International facilities consolidation plan increased operating expenses by $4.0$4.3 million in the current three month period compared to the same period last fiscal year.
Compensation and benefit costs increased by approximately $2 million due mainly to employee headcount and wage increases in the current quarter compared to the same period last fiscal year.
Marketing expenses increased by approximately $2 million in the second quarter of fiscal 2019 as compared to the same period in fiscal 2018. The increase was due primarily to the Consumer segment and included initiatives related to the launch of the HAY brand in North America.
Sales volume-based costs, such as sales commissions, increased by approximately $1 million in the current three month period compared to the same period last fiscal year.
Depreciation expense increased by approximately $4$1 million and was driven primarily by capital investment in facilities and IT systems.
Compensation and benefit costs increased $2.2 million due mainly to employee headcount increases and wage inflation.
HigherLower employee incentive costs increaseddecreased operating expenses by $1.9$1.8 million. The increasedecrease reflects higherlower incentive compensation costs that are variable based on the achievement of earnings levels for the fiscal year relative to plan.plan in the current three month period compared to the same period last fiscal year.
The rest of the increase in operating expenses was driven mainly by incremental DWR studio costs and higher IT expenses.
Consolidated operating expenses increased by $22.5 million or 6.6% in the first six months of fiscal 2019 compared to the prior year period. The following factors contributed to the change:
Special charges, primarily associated with the planned CEO transition and consulting fees related to the Company's profit optimization initiatives increased operating expenses by $8.5 million in the first half of fiscal 2019 compared to the same period last fiscal year.
Compensation and benefit costs increased by approximately $5 million due mainly to employee headcount and wage increases in the first half of fiscal 2019 as compared to the same period of fiscal 2018.
Marketing expenses increased by approximately $4 million in the first half of fiscal 2019 as compared to the same period in fiscal 2018. The increase was due primarily to the Consumer segment and included initiatives related to the launch of the HAY brand in North America.
Depreciation expense increased by approximately $3 million and was driven primarily by investment in facilities and IT systems.
Warranty costs were $3.7$4.1 million lower due to specific reserves incurred in the same period of the prior year that did not recur in the current threesix month period.
The rest of the increase in operating expenses was driven mainly by incremental legalDWR studio costs, higher IT expenses and marketing expenditures.higher sales volume-related costs, such as sales commissions.
Operating earnings for the three and six month periodperiods ended September December��1, 2018 were $46.0$53.1 million or 7.4 percent8.1% of sales.sales and $99.1 million or 7.8% of sales, respectively. This compares to $49.5$50.4 million or 8.5 percent8.3% of sales and $99.9 million or 8.4% of sales for the first quarter ofrespective periods during last fiscal 2018.year.
Other Income/Expense
During the three months ended SeptemberDecember 1, 2018, net other expense was $1.9$3.8 million, an increase of $0.4 million compared to the same period in the prior year. This increase resulted mainly from investment losses associated with the Company's deferred compensation plan in the current quarter relative to investment gains recorded in the prior fiscal year, which was partially offset by lower interest expense on outstanding debt.
During the six months ended December 1, 2018, net other expense was $5.7 million, a decrease of $1.1$0.7 million compared to the same period in the prior year. This decrease resulted mainly from lower interest expense on outstanding debt and higherlower investment incomelosses associated with the Company's deferred compensation plan in the current year relative to those recorded in the same period of lastprior fiscal year.
Income Taxes
On December 22, 2017, the Tax Cuts and Jobs Act (the “Act”) was signed into law in the United States. The effects of the Act included the reduction of the federal corporate income tax rate from 35 percent35% to 21 percent21% and a new participation exemption system of taxation on foreign earnings, among other provisions.
The companyCompany has not completed its accounting for all the effects of the Act, as the U.S. Treasury Department and the Internal Revenue Service continuehas continued to provide additional clarifying guidance. Provisional amounts remain for the one-time U.S. tax liability on certain undistributed foreign earnings and remeasurement of net deferred tax liabilities. See Note 10 of the Consolidated Financial Statements for additional information.
The effective tax rates were 22.6% and 30.5%, respectively, for the three-month periodsthree month periods ended SeptemberDecember 1, 2018 and SeptemberDecember 2, 20172017. The effective tax rates were 20.0 percent21.4% and 30.5 percent, respectively.30.5%, respectively, for the six month periods ended December 1, 2018 and December 2, 2017. The year over year decrease in the effective tax rate for the three-month periodthree and six months ended September December 1, 2018 was the result of the Act. The effective tax ratesrate for the three-month periodsthree and six months ended September December 1, 2018 is higher than the United States federal statutory rate due to the mix of earnings in taxing jurisdictions that had rates that were higher than the United States federal statutory rate. The effective tax rate for the three and Septembersix months ended December 2, 2017 areis lower than the United States federal statutory rate due to the mix of earnings in taxing jurisdictions that had rates that were lower than the United States federal statutory rate, along with the research and development tax credit under the Protecting Americans from Tax Hikes ("PATH") Act of 2015. The effective tax rate for the three-month period ended September 1, 2018 was also lower than United United States federal statutory rate due to excess tax benefits from share-based compensation recorded during the current year period.
Reportable Operating Segment Results
The business is comprised of various operating segments as defined by generally accepted accounting principles in the United States. These operating segments are determined on the basis of how the companyCompany internally reports and evaluates financial information used to make operating decisions. For external reporting purposes, the companyCompany has identified the following reportable segments:
| |
| • | North American Furniture Solutions — Includes the operations associated with the design, manufacture and sale of furniture products for work-related settings, including office, education, and Herman Miller healthcare environments, throughout the United States and Canada. |
| |
| • | ELA Furniture Solutions — Includes EMEA, Latin America and Asia-Pacific operations associated with the design, manufacture and sale of furniture products, primarily for work-related settings. |
| |
| • | Specialty — Includes operations associated with the design, manufacture, and sale of high-craft furniture products and textiles including Geiger wood products, Maharam textiles, Nemschoff and Herman Miller Collection products. |
| |
| • | Consumer — Includes operations associated with the sale of modern design furnishings and accessories to third party retail distributors, through contract channels, as well as direct-to-consumer sales through eCommerce and DWR and HAY retail studios and outlets. |
| |
| • | Corporate — Consists primarily of unallocated expenses related to general corporate functions, including, but not limited to, certain legal, executive, corporate finance, information technology, administrative and acquisition-related costs. |
The charts below present the relative mix of net sales and operating earnings across the company'sCompany's reportable segments during the three and six month periods ended SeptemberDecember 1, 2018. This is followed by a discussion of the company'sCompany's results, by reportable segment.
North American Furniture Solutions ("North America")
Three Months Ended SeptemberDecember 1, 2018
Net sales totaled $343.7$353.2 million for the firstsecond quarter of fiscal 2019, an increase of 4.6 percent6.9% from the firstsecond quarter of fiscal 2018. Orders totaled $345.0$370.6 million, an increase of 3.0 percent8.6% from the same period in the prior year. Organic net sales totaled $344.2$354.2 million(*) for the firstsecond quarter of fiscal 2019, an increase of 3.5 percent5.5% from the firstsecond quarter of fiscal 2018. Organic orders totaled $345.6$371.5 million, a decreasean increase of 2.4 percent6.7% from the same period in the prior year. Operating earnings for the firstsecond quarter of fiscal 2019 were $45.0$46.4 million or 13.1 percent13.1% of sales as compared to $48.7$45.1 million or 14.8 percent13.6% of sales in the firstsecond quarter of fiscal 2018. The following is a summary of the major factors impacting our comparative sales and earnings results:
Sales volumes within the North American segment increased by approximately $12$20 million in the second quarter of fiscal 2019, resulting from increased demand within the company'sCompany's North America office furniture businesses.business.
| |
| • | Adoption of ASC 606 - Revenue from Contracts with Customers at the beginning of fiscal 2019 led to the reclassification of certain pricing elements from Netnet sales to Costcost of sales, which resulted in an increase in Netnet sales forof $6.8 million in the North American segment by $5.3 millioncurrent three months compared to the same period of the prior year in which revenue was recorded under previous accounting rules. |
| |
• | Deeper contract price discounting, net of incremental list price increases, reduced net sales and operating earnings in the first quarter of fiscal 2019 by roughly $1Deeper contract price discounting, net of incremental list price increases, reduced net sales and operating earnings in the second quarter of fiscal 2019 by roughly $3 million as compared to the prior year. |
Operating earnings increased an estimated $7 million from incremental sales volumes in the current three month period as compared to the same period of the prior year.
Higher commodity costs and the initial impact of tariffs on Chinese imports decreased dueoperating earnings by approximately $2 million relative to higher coststhe same period of the prior fiscal year.
A favorable change in product mix that was driven by a shift out of lower margin product categories and into seating drove an increase in operating earnings of approximately $3 million as compared to last fiscal year.
Higher overhead costs at the company's West Michigan manufacturing facilities duerelated to higher commodity costs, medical costs, depreciation expensejob correction costs and overtime costs.
Increased depreciation expenses of approximately $2 million, which related to investments in facilities and systems, and workforce related costs, including compensation and benefits and incentive compensation costs decreased operating earnings by roughlyapproximately $2 million as compared to the same period of the prior year period.fiscal year.
These decreases inOperating earnings decreased due to increased depreciation expense, recorded within operating earnings were partially offset by increased operating earningsexpenses, of an estimated $4 million from incremental sales volumes.approximately $1 million.
ELA Furniture Solutions ("ELA")
ThreeSix Months Ended SeptemberDecember 1, 2018
Net sales totaled $115.4$696.9 million for the first firstsix quartermonths of fiscal 2019, an increase of 23.6 percent5.8% from the first quartersame period of fiscal 2018. Orders totaled $125.0$715.6 million, an increase of 15.2 percent5.9% from the same period in the prior year. Organic net sales totaled $116.6$698.4 million(*) for the first firstsix quartermonths of fiscal 2019, an increase of 22.1 percent4.5% from the first quartersame period of fiscal 2018. Organic orders totaled $126.5$717.1 million, an increase of 14.4 percent4.6% from the same period in the prior year. Operating earnings for the first firstsix quartermonths of fiscal 2019 were $10.5$91.4 million or 9.1 percent13.1% of sales as compared to $7.0$93.9 million or 7.5 percent14.2% of sales in the first quartersame period of fiscal 2018.the prior year. The following is a summary of the major factors impacting our comparative sales and earnings results:
Increased salesSales volumes within the ELANorth American segment ofincreased by approximately $21$32 million, were driven by broad-based growth, with Asia Pacific and EMEA generatingresulting from increased demand within the most significant year-over-year growth.Company's North America office furniture business.
| |
| • | Adoption of ASC 606 - Revenue from Contracts with Customers at the beginning of fiscal 2019 led to the reclassification of certain pricing elements from Netnet sales to Costcost of sales, which resulted in an increase in Net sales for the ELANorth American segment by $2.8approximately $12.1 million compared to the same period of the prior year, in which revenue was recorded under previous accounting rules. |
Deeper contract price discounting, net of incremental list price increases, reduced net sales and operating earnings in the first half of fiscal 2019 by roughly $4 million as compared to the prior year.
Operating earnings increased by approximately $7an estimated $12 million from incremental sales volumes in the current threesix month period as compared to the same period of the prior year.
Higher commodity costs and the initial impact of tariffs on Chinese imports decreased operating earnings by approximately $4 million relative to the same period of the prior fiscal 2018year.
Higher overhead costs at the company's West Michigan manufacturing facilities related to higher medical costs, job correction costs and depreciation decreased operating earnings by approximately $5 million as compared to the same period of the prior fiscal year.
Operating earnings decreased due to increased sales volumes. This increase was partially offset by the impact of unfavorable product mixdepreciation expense, recorded within operating expenses, of approximately $2 million and higher restructuring and impairment costs of $1.1 million.
Specialty
ELA Furniture Solutions ("ELA")
Three Months Ended SeptemberDecember 1, 2018
Net sales totaled $77.3$118.5 million for the firstsecond quarter of fiscal 2019, an increase of 2.9 percent4.9% from the firstsecond quarter of fiscal 2018. Orders totaled $80.1$137.3 million, an increase of 6.2 percent16.4% from the same period in the prior year. Organic net sales totaled $121.4 million(*) for the second quarter of fiscal 2019, an increase of 4.3% from the second quarter of fiscal 2018. Organic orders totaled $139.7 million, an increase of 15.1% from the same period in the prior year. Operating earnings for the firstsecond quarter of fiscal 2019 were $3.1$13.8 million or 4.0 percent11.6% of sales as compared to $1.6$12.7 million or 2.1 percent11.2% of sales in the firstsecond quarter of fiscal 2018. The following is a summary of the major factors impacting our comparative sales and earnings results:
Net sales increased in the first quarter of fiscal 2018 as compared to the same period of the prior year due primarily to increasedIncreased sales volumes within the ELA segment of approximately $1$4 million which waswere driven primarily by growth in the company's Maharam subsidiary businesses.Asia Pacific, Europe, and the Middle East regions.
| |
| • | Adoption of ASC 606 - Revenue from Contracts with Customers at the beginning of fiscal 2019 led to the reclassification of certain pricing elements from Netnet sales to Costcost of sales, which resulted in an increase in net sales for the ELA segment by approximately $3.2 million compared to the same period of the prior year, in which revenue was recorded under previous accounting rules. |
Operating earnings increased by $1.1 million in the current three month period of fiscal 2019 due to incremental price increases, net of deeper contract discounting and increased sales volumes. These items increased operating earnings by approximately $2 million and $1 million, respectively. These increases were partially offset by the negative impact on operating earnings of changes in foreign currency exchange rates of approximately $1 million and incremental operating expenses of $0.5 million related to the facilities consolidation plan.
Six Months Ended December 1, 2018
Net sales totaled $234.0 million for the first six months of fiscal 2019, an increase of 13.4% from the same period of fiscal 2018. Orders totaled $262.3 million, an increase of 15.8% from the same period in the prior year. Organic net sales totaled $238.0 million(*) for the first six months of fiscal 2019, an increase of 12.3% from the same period of fiscal 2018. Organic orders totaled $266.1 million, an increase of 14.7% from the same period in the prior year. Operating earnings for the first six months of fiscal 2019 were $24.3 million or 10.4% of sales as compared to $19.6 million or 9.5% of sales in the same period of the prior year. The following is a summary of the major factors impacting our comparative sales and earnings results:
Increased sales volumes within the ELA segment of approximately $25 million were driven by broad-based growth across all regions.
| |
| • | Adoption of ASC 606 - Revenue from Contracts with Customers at the beginning of fiscal 2019 led to the reclassification of certain pricing elements from net sales to cost of sales, which resulted in an increase in net sales for the ELA segment by approximately $6.1 million compared to the same period of the prior year, in which revenue was recorded under previous accounting rules. |
The impact of foreign currency translation decreased net sales and operating earnings by roughly $4 million and $1 million, respectively.
Operating earnings increased by $4.7 million in the first half of fiscal 2019 due to increased sales volumes and incremental price increases, net of deeper contract discounting. These items increased operating earnings by approximately $8 million and $1 million, respectively. These increases were partially offset by the negative impact on operating earnings of changes in foreign currency exchange rates of approximately $1 million and incremental operating expenses of $1.8 million related to the facilities consolidation plan.
Specialty
Three Months Ended December 1, 2018
Net sales totaled $81.6 million for the second quarter of fiscal 2019, an increase of 9.7% from the second quarter of fiscal 2018. Orders totaled $87.1 million, an increase of 13.0% from the same period in the prior year. Organic net sales totaled $81.6 million(*) for the second quarter of fiscal 2019, an increase of 8.8% from the second quarter of fiscal 2018. Organic orders totaled $87.1 million, an increase of 12.2% from the same period in the prior year. Operating earnings for the second quarter of fiscal 2019 were $4.8 million or 5.9% of sales as compared to $2.1 million or 2.8% of sales in the second quarter of fiscal 2018. The following is a summary of the major factors impacting our comparative sales and earnings results:
Increased sales volumes within the Specialty segment of approximately $7 million were driven by broad-based growth across all four businesses that comprise the Specialty segment.
| |
| • | Adoption of ASC 606 - Revenue from Contracts with Customers at the beginning of fiscal 2019 led to the reclassification of certain pricing elements from net sales to cost of sales, which resulted in an increase in net sales for the Specialty segment by $0.4approximately $0.7 million compared to the same period of the prior year, in which revenue was recorded under previous accounting rules. |
Operating earnings increased by approximately $1.5$2.7 million in the current three month period of fiscal 20182019 due primarily due to the increased sales volumes favorable channel mix and a decrease in warrantydecreased operating expenses. Warranty, marketing and compensation expenses each decreased by approximately $0.7 million, $0.5 million and $0.2 million, respectively, as compared to the same period of $0.6 million.the prior fiscal year.
Six Months Ended December 1, 2018
Net sales totaled $158.9 million for the first six months of fiscal 2019, an increase of 6.3% from the same period of fiscal 2018. Orders totaled $167.2 million, an increase of 9.6% from the same period in the prior year. Organic net sales totaled $159.0 million(*) for the first six months of fiscal 2019, an increase of 5.5% from the same period of fiscal 2018. Organic orders totaled $167.3 million, an increase of 9.0% from the same period in the prior year. Operating earnings for the first six months of fiscal 2019 were $8.0 million or 5.0% of sales as compared to $3.7 million or 2.5% of sales in the same period of the prior year. The following is a summary of the major factors impacting our comparative sales and earnings results:
Increased sales volumes within the Specialty segment of approximately $8 million were driven mainly by the Company's Maharam and Nemschoff subsidiaries, as well as the Herman Miller Collection family of products.
| |
| • | Adoption of ASC 606 - Revenue from Contracts with Customers at the beginning of fiscal 2019 led to the reclassification of certain pricing elements from net sales to cost of sales, which resulted in an increase in net sales for the Specialty segment by approximately $1.1 million compared to the same period of the prior year, in which revenue was recorded under previous accounting rules. |
Operating earnings increased by approximately $4.3 million in the first half of fiscal 2019 due primarily due to increased sales volumes and decreased operating expenses. Warranty, marketing and compensation expenses each decreased by approximately $1.3 million, $0.6 million and $0.2 million, respectively, as compared to the same period of the prior fiscal year.
Consumer
Three Months Ended SeptemberDecember 1, 2018
Net sales totaled $88.2$99.3 million for the firstsecond quarter of fiscal 2019, an increase of 6.0 percent14.5% from the firstsecond quarter of fiscal 2018. Orders of $80.5$107.6 million increased 5.8 percent15.5% from the same period last year. Organic net sales totaled $88.2$99.4 million(*) for the firstsecond quarter of fiscal 2019, an increase of 12.8 percent14.6% from the firstsecond quarter of fiscal 2018. Organic orders totaled $107.7 million, an increase of 15.6% from the same period in the prior year. Operating earnings for the firstsecond quarter of fiscal 2019 were $2.1$1.8 million or 2.4 percent1.8% of sales as compared to operating earnings of $0.3$1.0 million or 0.4 percent1.2% of sales in the firstsecond quarter of fiscal 2018. The following is a summary of the major factors impacting our comparative sales and earnings results:
Incremental sales volumes within the Consumer segment of approximately $4$10 million were driven by growth attributable to the Company's DWR studios, e-commerce and HAY products.
Operating earnings increased by $0.8 million in the current three month period of fiscal 2019 due to increased sales volumes and incremental price increases, net of deeper contract discounting, which was partially offset by increased operating expenses. Increased sales volumes and incremental price increases, net of deeper discounting each increased operating earnings by approximately $4 million and approximately $2 million, respectively, while increased operating expenses decreased operating earnings by approximately $5 million. Operating expenses increased due to incremental marketing, compensation, and depreciation expenses that were driven mainly by new studios and the launch of the HAY brand in North America.
Six Months Ended December 1, 2018
Net sales totaled $187.5 million for the first six months of fiscal 2019, an increase of 10.4% from the same period of fiscal 2018. Orders of $188.1 million increased 11.0% from the same period in the prior year. Organic net sales totaled $187.6 million(*) for the first six months of fiscal 2019, an increase of 13.8% from the same period of fiscal 2018. Organic orders totaled $188.2 million, an increase of 11.1% from the same period in the prior year. Operating earnings for the first six months of fiscal 2019 were $3.9 million or 2.1% of sales as compared to operating earnings of $1.3 million or 0.8% of sales in the same period of the prior year. The following is a summary of the major factors impacting our comparative sales and earnings results:
Incremental sales volumes within the Consumer segment of approximately $14 million were driven by the introduction of HAY products and growth across the DWR studio, e-commerce and contract channels. In the prior year period, Consumer sales benefited from a change in shipping terms at DWR that increased sales volumes by $5 million.
Operating earnings increased by approximately $3$2.6 million in the current three month periodfirst half of fiscal 20182019 due to increased sales volumes and incremental price increases, net pricing benefits. Decreased freight revenueof deeper contract discounting, which was partially offset by increased operating expenses. Increased sales volumes and incremental price increases, net of deeper discounting each increased operating earnings by approximately $6 million and approximately $3 million, respectively, while increased operating expenses decreased operating earnings by approximately $6 million. Operating expenses increased due to changesincremental marketing, compensation, and depreciation expenses that were driven mainly by new studios and the launch of the HAY brand in shipping policies and an increase in freight costs partially offset these increases in operating earnings.North America.
Corporate
Corporate unallocated expenses totaled $14.7$13.7 million for the firstsecond quarter of fiscal 2019, an increase of $6.6$3.2 million from the firstsecond quarter of fiscal 2018. The increase was driven mainly by an increase inincremental special charges of $4.3 million from third party consulting costs related to the company'sCompany's profit improvement initiatives, as well as transition costs related to the retirement of the company'sCompany's CEO. These increases were partially offset by lower compensation and benefits and employee incentive costs of $1.1 million from the comparative period.
Corporate unallocated expenses totaled $28.5 million for the first six months of fiscal 2019, an increase of $9.9 million from the same period of fiscal 2018. The increase was driven mainly by incremental special charges of $8.6 million from third party consulting costs related to the Company's profit improvement initiatives, as well as transition costs related to the retirement of the Company's CEO. Increased legal and depreciation expenses also contributed to the increase in corporate unallocated expenses from the comparative period.
Financial Condition, Liquidity and Capital Resources
The table below presents certain key cash flow and capital highlights for threesix months ended as indicated.
| | | (In millions) | September 1, 2018 | | September 2, 2017 | December 1, 2018 | | December 2, 2017 |
| Cash and cash equivalents, end of period | $ | 101.7 |
| | $ | 80.0 |
| $ | 113.6 |
| | $ | 114.6 |
|
| Marketable securities, end of period | 8.5 |
| | 8.7 |
| 8.2 |
| | 8.5 |
|
| Cash provided by operating activities | 32.9 |
| | 18.9 |
| 91.5 |
| | 81.5 |
|
| Cash used in investing activities | (99.7 | ) | | (24.2 | ) | (118.7 | ) | | (30.6 | ) |
| Cash used in financing activities | (33.0 | ) | | (13.0 | ) | (59.8 | ) | | (33.2 | ) |
| Capital expenditures | (22.0 | ) | | (24.9 | ) | (41.1 | ) | | (39.8 | ) |
| Stock repurchased and retired | (20.8 | ) | | (11.1 | ) | (37.4 | ) | | (17.3 | ) |
| Common stock issued | 8.5 |
| | 4.4 |
| 10.4 |
| | 5.9 |
|
| Dividends paid | (10.7 | ) | | (10.2 | ) | (22.4 | ) | | (20.9 | ) |
| Interest-bearing debt, end of period | 281.9 |
| | 203.9 |
| 281.9 |
| | 200.0 |
|
Available unsecured credit facility, end of period (1) | $ | 165.2 |
| | $ | 387.8 |
| $ | 163.7 |
| | $ | 391.8 |
|
(1) Amounts shown are net of outstanding letters of credit of $9.8$11.3 million and $8.2 million as of SeptemberDecember 1, 2018 and SeptemberDecember 2, 2017, respectively, which are applied against availability under the company'sCompany's unsecured credit facility.
Cash Flows - Operating Activities
ThreeSix Month Period Ended SeptemberDecember 1, 2018
Cash generated from operating activities was $32.9$91.5 million for the threesix months ended SeptemberDecember 1, 2018, as compared to $18.9$81.5 million in the same period of the prior year. In the cash flow statement, the company reconciles from Net earnings to Net Cash Provided by Operating Activities. Changes in working capital balances drove a use of cash totaling $25.9$29.1 million during the first threesix months of fiscal 2019. The main factors driving this use of cash were an increaseincreases in inventory of $10.7$26.5 million and accounts, notes and unbilled accounts receivable of $27.7 million, exclusive of the cumulative adjustment upon adoption of ASC 606,606. These were offset by an increase in prepaid expenses and a decreaseother current assets of $10.0 million, an increase in accounts payable of $11.3 million, and an increase in accrued compensation and benefits of $12.2 million. Accrued compensation and benefits decreased due to the annual payout of the prior year accrued incentive bonus. These factors more than offset drivers within working capital that increased cash, including a decrease in other accrued liabilities of $5.1$6.8 million. Additionally, the companyCompany made a voluntary contribution of $12.0 million to its international defined benefit pension plan in the first quarterhalf of fiscal 2018, which also drove a portion of the increase in cash generated from operating activities when compared to the prior year.
ThreeSix Month Period Ended SeptemberDecember 2, 2017
Cash generated from operating activities was $18.9$81.5 million for the three month periodsix months ended SeptemberDecember 2, 2017, as compared to $30.2$94.4 million in the same period of the prior year. In the first quarterhalf of fiscal 2018, the companyCompany made a voluntary contribution of $12.0 million to its international defined benefit pension plan. Additionally, changes in working capital balances drove a use of cash totaling $21.5$13.2 million induring the first quartersix months of fiscal 2018. The main factors driving this use of cash were an increase in inventory of $14.5$19.8 million and a decrease in accrued compensation and benefits of $19.0$4.5 million. Inventory increased due mainly to DWR inventory stocking related to new DWR studios and upcoming promotions, as well as thea build of inventory in the ELA segment to fulfill demand in the second quarter.demand. Accrued compensation and benefits decreased due to the annual payout of the prior year accrued bonus and profit sharing. These factors more than offset drivers within working capital that increased cash, primarily an increase in accounts payable of $17.8$18.3 million.
Cash Flows - Investing Activities
Investing activities in the first threesix months of fiscal 2019 resulted in a net cash outflow of $99.7$118.7 million as compared to a net cash outflow of $24.2$30.6 million in the same period of the prior year. Equity investments in the noncontrolled entities of HAY and Maars and the HAY license agreement resulted in a cash outlay of $71.6 million and $4.8 million, respectively in the first quarterhalf of fiscal 2019.
The companyCompany had cash outflows for the purchase of $22.0$41.1 million of capital assets in the first threesix months of fiscal 2019 as compared to $24.9$39.8 million during the first threesix months of the prior year. The decrease in capital expenditures as compared to the prior year was driven mainly by a reduction in expenditures related to manufacturing assets in West Michigan and reduced expenditures in connection with Design Within Reach studio build outs. These decreases were partly offset by increased expenditure related to the United Kingdom facility consolidation.
At the end of the firstsecond quarter of fiscal 2019, there were outstanding commitments for capital purchases of $26.6$25.1 million compared to $16.5$29.5 million at the corresponding date in the prior year. The companyCompany expects full-year capital purchases to be between $90 million and $100 million,
which will be primarily related to investments in the company'sCompany's facilities and equipment. This compares to full-year capital spending of $70.6 million in fiscal 2018.
Cash Flows - Financing Activities
Cash outflows from financing activities were $33.0$59.8 million for the first threesix months of fiscal 2019 compared to cash outflows of $13.0$33.2 million during the same period of the prior year. Cash inflows from net borrowings were zero and $4.0 million during the first quarter of fiscal 2019 and fiscal 2018, respectively. Cash outflows for dividend payments were $10.7$22.4 million and $10.2$20.9 million for the first threesix month periodsmonths of fiscal 2019 and fiscal 2018, respectively. Cash paid for the repurchase of common stock was $20.8$37.4 million and $11.1$17.3 million in the first threesix months of fiscal 2019 and 2018, respectively. Cash inflows for stock issuances related to employee benefit programs were $8.5$10.4 million and $4.4$5.9 million during the first threesix month periodsmonths of fiscal 2019 and fiscal 2018, respectively.
Certain minority shareholders in a subsidiary have the right, at certain times, to require the companyCompany to acquire a portion of their ownership interest in those entities at fair value. During the threesix months ended SeptemberDecember 1, 2018, the companyCompany purchased $10.0$10.1 million of minority ownership shares as compared to $1.0 million in the same period last year. It is possible that within the next two fiscal years the companyCompany could be required to acquire the majority of the balance of their ownership interest. The fair value of this redeemable noncontrolling interest as of SeptemberDecember 1, 2018 was $20.7 million and is included within "Redeemable noncontrolling interests" on the Consolidated Balance Sheets.
One shareholder has put options that would require the Company to purchase an additional 33% of the equity in HAY at fair market value. These put options have multiple periods for exercise, with fiscal 2020 through fiscal 2024 representing the earliest possible period of exercise.
Sources of Liquidity
In addition to cash flows from operating activities, the companyCompany has access to liquidity through credit facilities, cash and cash equivalents, and short-term investments. These sources have been summarized below. For additional information, refer to Note 13 to the condensed consolidated financial statements.
| | | (In millions) | September 1, 2018 | September 2, 2017 | December 1, 2018 | December 2, 2017 |
| Cash and cash equivalents | $ | 101.7 |
| $ | 80.0 |
| $ | 113.6 |
| $ | 114.6 |
|
| Marketable securities | 8.5 |
| 8.7 |
| 8.2 |
| 8.5 |
|
| Availability under syndicated revolving line of credit | $ | 165.2 |
| $ | 387.8 |
| $ | 163.7 |
| $ | 391.8 |
|
At the end of the firstsecond quarter of fiscal 2019, the companyCompany had cash and cash equivalents of $101.7$113.6 million, including $71.1$72.3 million of cash and cash equivalents held outside the United States. In addition, the companyCompany had marketable securities of $8.5$8.2 million held by one of its international subsidiaries.
The subsidiary holding the company'sCompany's marketable securities is taxed as a United States taxpayer at the company'sCompany's election. Consequently, for tax purposes, all United States tax impacts for this subsidiary have been recorded. The companyCompany maintains it's intent to permanently reinvest
the remainder of the cash outside the United States. The Tax Cuts and Jobs Act (the “Act”), enacted on December 22, 2017, assesses a one-time tax on deferred foreign income upon transition to a participation exemption system of taxation. The new system of taxation allows for future distribution of foreign earnings to the U.S. without incremental federal income taxes. The companyCompany is considering the impact of the Act and the one-time transition tax on its foreign earnings which are invested in liquidable assets.
The companyCompany believes cash on hand, cash generated from operations, and borrowing capacity will provide adequate liquidity to fund near term and foreseeable future business operations, capital needs, future dividends and share repurchases, subject to financing availability in the marketplace.
Contractual Obligations
Contractual obligations associated with ongoing business and financing activities will require cash payments in future periods. A table summarizing the amounts and estimated timing of these future cash payments as of June 2, 2018 was provided in the company'sCompany's annual report on Form 10-K for the year ended June 2, 2018. There has been no material change in such obligations since that date.
Guarantees
The companyCompany provides certain guarantees to third parties under various arrangements in the form of product warranties, loan guarantees, standby letters of credit, lease guarantees, performance bonds and indemnification provisions. These arrangements are accounted for and disclosed in accordance with FASB ASC Topic 460, Guarantees, as described in Note 12 to the condensed consolidated financial statements.
Variable Interest Entities
On occasion, the companyCompany provides financial support to certain independent dealers in the form of term loans, lines of credit, and/or loan guarantees that may represent variable interests in such entities. As of SeptemberDecember 1, 2018, the companyCompany was not considered to be the primary beneficiary of any such dealer relationships under FASB ASC Topic 810, Consolidation. Accordingly, the companyCompany is not required to consolidate the financial statements of any of these entities as of SeptemberDecember 1, 2018.
Contingencies
See Note 12 to the condensed consolidated financial statements.
Critical Accounting Policies
The companyCompany strives to report financial results clearly and understandably. The companyCompany follows accounting principles generally accepted in the United States in preparing its consolidated financial statements, which require certain estimates and judgments that affect the financial position and results of operations for the company.Company. The companyCompany continually reviews the accounting policies and financial information disclosures. A summary of the more significant accounting policies that require the use of estimates and judgments in preparing the financial statements is provided in the company'sCompany's annual report on Form 10-K for the year ended June 2, 2018. During the first threesix months of fiscal 2019, the companyCompany changed certain accounting policies in connection with the adoption of ASC 606 - Revenue from Contracts with Customers. Refer to Note 3 to the Condensed Consolidated Financial Statements for further information.
New Accounting Standards
See Note 2 to the Condensed Consolidated Financial Statements.
Safe Harbor Provisions
Certain statements in this filing are not historical facts but are “forward-looking statements” as defined under Section 27A of the Securities Act of 1933, as amended, and Section 21E of the Securities Exchange Act, as amended, that are based on management’s beliefs, assumptions, current expectations, estimates, and projections about the office furniture industry, the economy, and the companyCompany itself. Words like “anticipates,” “believes,” “confident,” “estimates,” “expects,” “forecasts,” likely,” “plans,” “projects,” and “should,” variations of such words, and similar expressions identify such forward-looking statements. These statements do not guarantee future performance and involve certain risks, uncertainties, and assumptions that are difficult to predict with regard to timing, extent, likelihood, and degree of occurrence. These risks include, without limitation, the success of our growth strategy, employment and general economic conditions, the pace of economic growth in the U.S., and in our International markets, the potential impact of changes in U.S. tax law, the increase in white collar employment, the willingness of customers to undertake capital expenditures, the types of products purchased by customers, competitive-pricing pressures, the availability and pricing of raw materials, our reliance on a limited number of suppliers, our ability to expand globally given the risks associated with regulatory and legal compliance challenges and accompanying currency fluctuations, the ability to increase prices to absorb the additional costs of raw
materials, the financial strength of our dealers and the financial strength of our customers, our ability to locate new DWR and HAY studios, negotiate favorable lease terms for new and existing locations and the implementation of our studio portfolio transformation, our ability to attract and retain key executives and other qualified employees, our ability to continue to make product innovations, the success of newly-introduced products, our ability to serve all of our markets, possible acquisitions, divestitures or alliances, the pace and level of government procurement, the outcome of pending litigation or governmental audits or investigations, political risk in the markets we serve, and other risks identified in our filings with the Securities and Exchange Commission. Therefore, actual results and outcomes may materially differ from what we express or forecast. Furthermore, Herman Miller, Inc., undertakes no obligation to update, amend or clarify forward-looking statements.
Item 3: Quantitative and Qualitative Disclosures About Market Risk
The information concerning quantitative and qualitative disclosures about market risk contained in the company’sCompany’s Annual Report on Form 10-K for its fiscal year ended June 2, 2018 has not changed significantly. The nature of market risks from interest rates and commodity prices has not changed materially during the first threesix months of fiscal 2019.
Foreign Exchange Risk
The companyCompany primarily manufactures its products in the United States, United Kingdom, China and India. It also sources completed products and product components from outside the United States. The company'sCompany's completed products are sold in numerous countries around the world. Sales in foreign countries as well as certain expenses related to those sales are transacted in currencies other than the company'sCompany's reporting currency, the U.S. dollar. Accordingly, production costs and profit margins related to these sales are affected by the currency exchange relationship between the countries where the sales take place and the countries where the products are sourced or manufactured. These currency exchange relationships can also impact the company'sCompany's competitive positions within these markets.
The principal foreign currencies in which the companyCompany conducts its business are the British pound sterling, European euro, Canadian dollar, Australian dollar, Japanese yen, Mexican peso, Brazilian real, Indian rupee, South African rand, Hong Kong dollar and Chinese renminbi. In the normal course of business, the companyCompany enters into forward foreign currency exchange swap contracts. Changes in the fair value of such contracts are reported in earnings in the period the value of the contract changes. The net gain or loss upon settlement and the change in fair value of outstanding contracts is recorded as a component of otherOther expense (income), net.
Item 4: Controls and Procedures
Evaluation of Disclosure Controls and Procedures
Under the supervision and with the participation of management, including the company'sCompany's Chief Executive Officer and Chief Financial Officer, management has evaluated the effectiveness of the company'sCompany's disclosure controls and procedures (as defined in Exchange Act Rules 13a-15(e) and 15d-15(e)) as of SeptemberDecember 1, 2018, and the company'sCompany's Chief Executive Officer and Chief Financial officer have concluded that, as of that date, the company'sCompany's disclosure controls and procedures are effective.
Changes in Internal Control Over Financial Reporting
Beginning June 3,There were no changes in the company's internal control over financial reporting (as defined in Exchange Act Rules 13a-15(f) and 15d-15(f)) during the quarterly period ended December 1, 2018, we implemented ASC 606 - Revenue from Contracts with Customers. As a result,that have materially affected, or are reasonably likely to materially affect, the company implemented certain changes to ERP systems and processes related to revenue recognition and thecompany's internal control activities pertaining to them. These changes included the development of new accounting policies that comport with the new revenue standard, contract reviews, revenue recognition cut-off reviews, system control changes and gathering of information needed for disclosures. over financial reporting.
Part II - Other Information
Item 1: Legal Proceedings
Referred to in Note 12 of the condensed consolidated financial statements.
Item 1A: Risk Factors
There have been no material changes in the company'sCompany's risk factors from those set forth in the company'sCompany's Annual Report on Form 10-K for the year ended June 2, 2018.
Item 2: Unregistered Sales of Equity Securities and Use of Proceeds
Issuer Purchases of Equity Securities
The following is a summary of share repurchase activity during the quarter ended SeptemberDecember 1, 2018.
|
| | | | | | | | | | | | | |
| Period | (a) Total Number of Shares (or Units) Purchased | | (b) Average price Paid per Share or Unit | | (c) Total Number of Shares (or Units) Purchased as Part of Publicly Announced Plans or Programs | | (d) Maximum Number (or Approximate Dollar Value) of Shares (or Units) that may yet be Purchased Under the Plans or Programs (in millions) |
| 6/3/18 - 6/30/18 | 5,871 |
| | $ | 34.19 |
| | 5,871 |
| | $ | 61,888,262 |
|
| 7/1/18 - 7/28/18 | 328,037 |
| | $ | 38.47 |
| | 328,037 |
| | $ | 49,268,550 |
|
| 7/29/18 - 9/1/18 | 211,958 |
| | $ | 37.80 |
| | 211,958 |
| | $ | 41,256,763 |
|
| Total | 545,866 |
| | | | 545,866 |
| | |
|
| | | | | | | | | | | | | |
| Period | (a) Total Number of Shares (or Units) Purchased | | (b) Average price Paid per Share or Unit | | (c) Total Number of Shares (or Units) Purchased as Part of Publicly Announced Plans or Programs | | (d) Maximum Number (or Approximate Dollar Value) of Shares (or Units) that may yet be Purchased Under the Plans or Programs (in millions) |
| 9/2/18 - 9/29/18 | 23,979 |
| | $ | 38.74 |
| | 23,979 |
| | $ | 40,327,829 |
|
| 9/30/18 - 10/27/18 | 227,752 |
| | $ | 35.51 |
| | 227,752 |
| | $ | 32,329,346 |
|
| 10/28/18 - 12/1/18 | 225,123 |
| | $ | 33.41 |
| | 225,123 |
| | $ | 24,717,035 |
|
| Total | 476,854 |
| | | | 476,854 |
| | |
No repurchase plans expired or were terminated during the firstsecond quarter of fiscal 2019, nor do any plans exist under which the companyCompany does not intend to make further purchases. The Board has the authority to terminate any further repurchases.
During the period covered by this report, the companyCompany did not sell any of its equity securities that were not registered under the Securities Act of 1933.
Item 3: Defaults upon Senior Securities
None
Item 4: Mine Safety Disclosures
Not applicable
Item 5: Other Information
None
Item 6: Exhibits
The following exhibits (listed by number corresponding to the Exhibit table as Item 601 in Regulation S-K) are filed with this Report:
| |
| 101.INS | The instance document does not appear in the interactive data file because its XBRL tags are embedded within the inline XBRL document. |
| |
| 101.SCH | XBRL Taxonomy Extension Schema Document |
| |
| 101.CAL | XBRL Taxonomy Extension Calculation Linkbase Document |
| |
| 101.LAB | XBRL Taxonomy Extension Label Linkbase Document |
| |
| 101.PRE | XBRL Taxonomy Extension Presentation Linkbase Document |
| |
| 101.DEF | XBRL Taxonomy Extension Definition Linkbase Document |
SIGNATURES
Pursuant to the requirements of the Securities Exchange Act of 1934, the registrant has duly caused this report to be signed on its behalf by the undersigned hereto duly authorized.
HERMAN MILLER, INC.
|
| | | | |
October 10, 2018January 9, 2019 | | /s/ Andrea R. Owen | |
| | | | Andrea R. Owen | |
| | | | Chief Executive Officer | |
| | | | (Duly Authorized Signatory for Registrant) |
| | | | | |
October 10, 2018January 9, 2019 | | /s/ Jeffrey M. Stutz | |
| | | | Jeffrey M. Stutz | |
| | | | Chief Financial Officer | |
| | | | (Duly Authorized Signatory for Registrant) |