UNITED STATES
SECURITIES AND EXCHANGE COMMISSION
Washington, D.C. 20549
FORM 10-Q
| | | | | |
| ☒ | QUARTERLY REPORT PURSUANT TO SECTION 13 OR 15(d) OF THE SECURITIES EXCHANGE ACT OF 1934 |
For the quarterly period ended August 31,November 30, 2023
or
| | | | | |
| ¨ | TRANSITION REPORT PURSUANT TO SECTION 13 OR 15(d) OF THE SECURITIES EXCHANGE ACT OF 1934 |
For the transition period from to
Commission File Number: 1-7102
NATIONAL RURAL UTILITIES
COOPERATIVE FINANCE CORPORATION
(Exact name of registrant as specified in its charter)
| | | | | | | | |
| District of Columbia | | 52-0891669 |
| (State or other jurisdiction of incorporation or organization) | | (I.R.S. Employer Identification No.) |
| | | | | | | | | | | |
| 20701 Cooperative Way, | Dulles, | Virginia, | 20166 |
| (Address of principal executive offices) (Zip Code) |
Registrant’s telephone number, including area code: (703) 467-1800
Securities registered pursuant to Section 12(b) of the Act:
| | | | | | | | |
| Title of Each Class | Trading Symbol(s) | Name of Each Exchange on Which Registered |
| 7.35% Collateral Trust Bonds, due 2026 | NRUC 26 | New York Stock Exchange |
| 5.50% Subordinated Notes, due 2064 | NRUC | New York Stock Exchange |
Indicate by check mark whether the registrant (1) has filed all reports required to be filed by Section 13 or 15(d) of the Securities Exchange Act of 1934 during the preceding 12 months (or for such shorter period that the registrant was required to file such reports), and (2) has been subject to such filing requirements for the past 90 days. Yes x No ¨
Indicate by check mark whether the registrant has submitted electronically every Interactive Data File required to be submitted pursuant to Rule 405 of Regulation S-T (§232.405 of this chapter) during the preceding 12 months (or for such shorter period that the registrant was required to submit such files). Yes x No ¨
Indicate by check mark whether the registrant is a large accelerated filer, an accelerated filer, a non-accelerated filer, a smaller reporting company, or an emerging growth company. See the definitions of “large accelerated filer,” “accelerated filer,” “smaller reporting company,” and “emerging growth company” in Rule 12b-2 of the Exchange Act.
Large accelerated filer ¨ Accelerated filer ¨ Non-accelerated filer x Smaller reporting company ¨ Emerging growth company ¨
If an emerging growth company, indicate by check mark if the registrant has elected not to use the extended transaction period for complying with any new or revised financial accounting standards provided pursuant to Section13(a) of the Exchange Act. ¨
Indicate by check mark whether the registrant is a shell company (as defined in Rule 12b-2 of the Exchange Act). Yes ☐ No x
The Registrant is a tax-exempt cooperative and therefore does not issue capital stock.
TABLE OF CONTENTS
CROSS REFERENCE INDEX OF MD&A TABLES
| | Table | Table | | Description | | Page | Table | | Description | | Page |
| 1 | 1 | | Summary of Selected Financial Data | | 3 | | 1 | | Summary of Selected Financial Data | | 4 | |
| 2 | 2 | | Average Balances, Interest Income/Interest Expense and Average Yield/Cost | | 12 | | 2 | | Net Income and TIER | | 6 | |
| 3 | 3 | | Rate/Volume Analysis of Changes in Interest Income/Interest Expense | | 14 | | 3 | | Adjusted Net Income and Adjusted TIER | | 7 | |
| 4 | 4 | | Non-Interest Income | | 16 | | 4 | | Average Balances, Interest Income/Interest Expense and Average Yield/Cost | | 12 | |
| 5 | 5 | | Derivative Gains (Losses) | | 17 | | 5 | | Rate/Volume Analysis of Changes in Interest Income/Interest Expense | | 15 | |
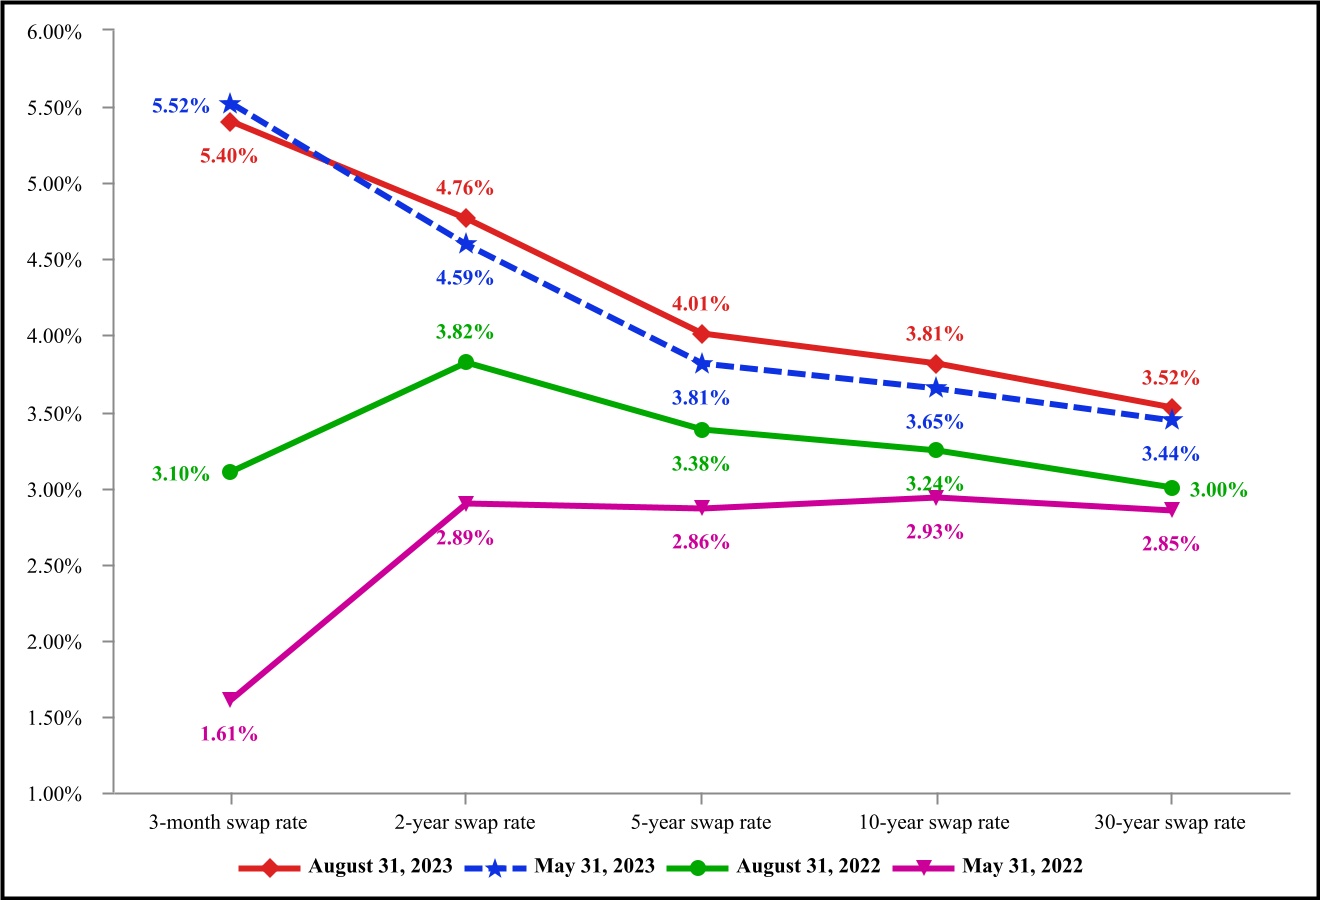
| 6 | 6 | | Comparative Swap Curves | | 18 | | 6 | | Non-Interest Income | | 18 | |
| 7 | 7 | | Non-Interest Expense | | 19 | | 7 | | Derivative Gains (Losses) | | 19 | |
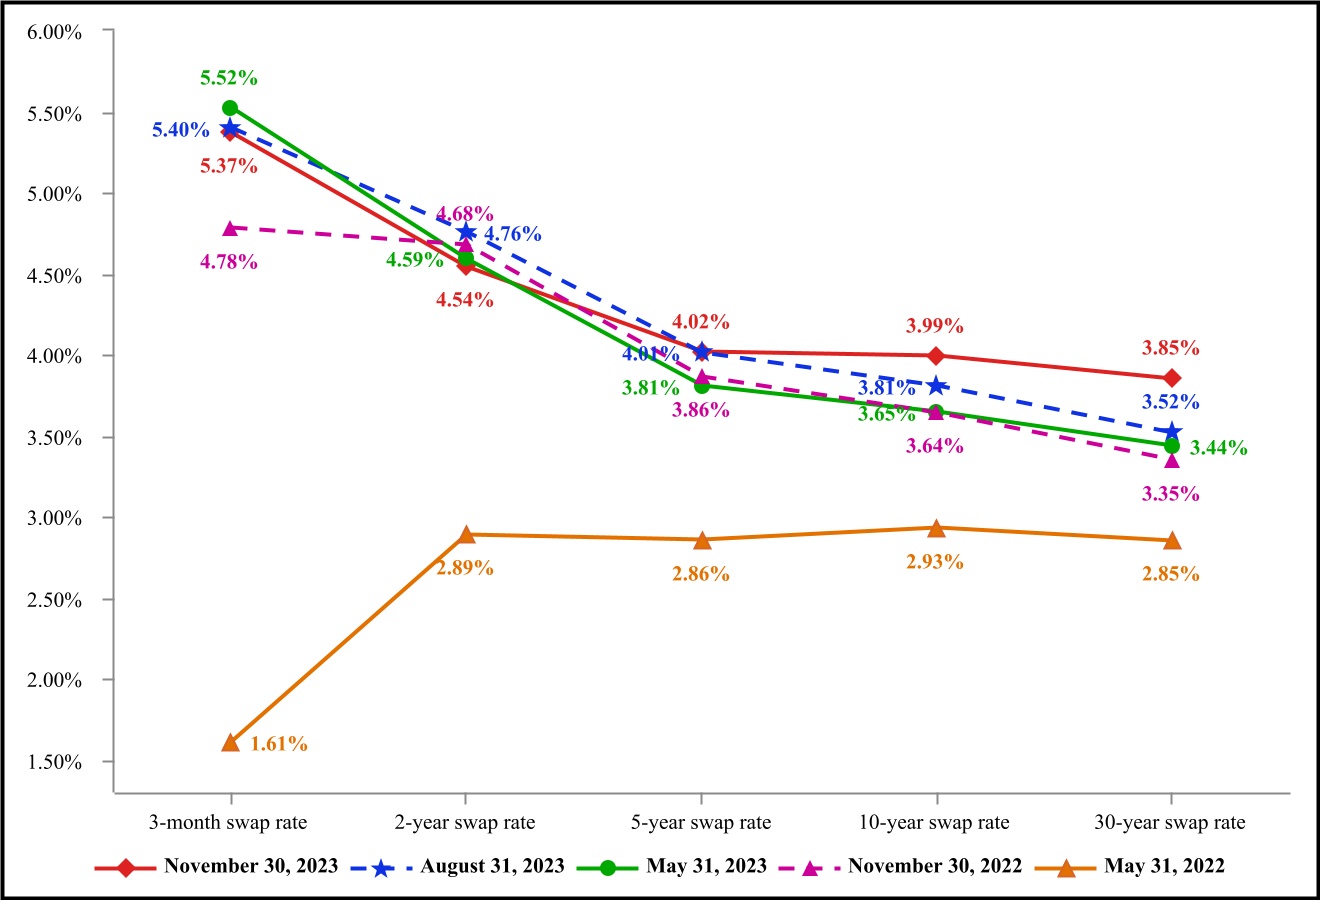
| 8 | 8 | | Debt—Total Debt Outstanding | | 21 | | 8 | | Comparative Swap Curves | | 20 | |
| 9 | 9 | | Debt—Member Investments | | 22 | | 9 | | Non-Interest Expense | | 21 | |
| 10 | 10 | | Equity | | 23 | | 10 | | Debt—Total Debt Outstanding | | 23 | |
| 11 | 11 | | Loans—Loan Portfolio Security Profile | | 26 | | 11 | | Debt—Member Investments | | 24 | |
| 12 | 12 | | Loans—Loan Exposure to 20 Largest Borrowers | | 27 | | 12 | | Equity | | 25 | |
| 13 | 13 | | Allowance for Credit Losses by Borrower Member Class and Evaluation Methodology | | 30 | | 13 | | Loans—Loan Portfolio Security Profile | | 28 | |
| 14 | 14 | | Available Liquidity | | 32 | | 14 | | Loans—Loan Exposure to 20 Largest Borrowers | | 29 | |
| 15 | 15 | | Liquidity Coverage Ratios | | 33 | | 15 | | Allowance for Credit Losses by Borrower Member Class and Evaluation Methodology | | 32 | |
| 16 | 16 | | Committed Bank Revolving Line of Credit Agreements | | 34 | | 16 | | Available Liquidity | | 34 | |
| 17 | 17 | | Short-Term Borrowings—Funding Sources | | 36 | | 17 | | Liquidity Coverage Ratios | | 35 | |
| 18 | 18 | | Long-Term and Subordinated Debt—Issuances and Repayments | | 37 | | 18 | | Committed Bank Revolving Line of Credit Agreements | | 37 | |
| 19 | 19 | | Long-Term and Subordinated Debt—Scheduled Principal Maturities and Amortization | | 37 | | 19 | | Short-Term Borrowings—Funding Sources | | 39 | |
| 20 | 20 | | Collateral Pledged | | 38 | | 20 | | Long-Term and Subordinated Debt—Issuances and Repayments | | 40 | |
| 21 | 21 | | Loans—Unencumbered Loans | | 38 | | 21 | | Long-Term and Subordinated Debt—Scheduled Principal Maturities and Amortization | | 40 | |
| 22 | 22 | | Liquidity—Projected Long-Term Sources and Uses of Funds | | 39 | | 22 | | Collateral Pledged | | 41 | |
| 23 | 23 | | Credit Ratings | | 40 | | 23 | | Loans—Unencumbered Loans | | 41 | |
| 24 | 24 | | Interest Rate Sensitivity Analysis | | 42 | | 24 | | Liquidity—Projected Long-Term Sources and Uses of Funds | | 42 | |
| 25 | 25 | | Adjusted Net Income | | 43 | | 25 | | Credit Ratings | | 43 | |
| 26 | 26 | | TIER and Adjusted TIER | | 44 | | 26 | | Interest Rate Sensitivity Analysis | | 45 | |
| 27 | 27 | | Adjusted Liabilities and Equity | | 45 | | 27 | | Adjusted Net Income | | 46 | |
| 28 | 28 | | Debt-to-Equity Ratio and Adjusted Debt-to-Equity Ratio | | 45 | | 28 | | TIER and Adjusted TIER | | 47 | |
| 29 | 29 | | Members’ Equity | | 46 | | 29 | | Adjusted Liabilities and Equity | | 48 | |
| 30 | | 30 | | Debt-to-Equity Ratio and Adjusted Debt-to-Equity Ratio | | 48 | |
| 31 | | 31 | | Members’ Equity | | 49 | |
|
PART I—FINANCIAL INFORMATION
Item 2. Management’s Discussion and Analysis of Financial Condition and Results of Operations (“MD&A”)
| | |
| FORWARD-LOOKING STATEMENTS |
This Quarterly Report on Form 10-Q for the quarterly period ended August 31,November 30, 2023 (“this Report”) contains certain statements that are considered “forward-looking statements” as defined in and within the meaning of the safe-harbor provisions of the Private Securities Litigation Reform Act of 1995. Forward-looking statements do not represent historical facts or statements of current conditions. Instead, forward-looking statements represent management’s current beliefs and expectations, based on certain assumptions and estimates made by, and information available to, management at the time the statements are made, regarding our future plans, strategies, operations, financial results or other events and developments, many of which, by their nature, are inherently uncertain and outside our control. Forward-looking statements are generally identified by the use of words such as “intend,” “plan,” “may,” “should,” “will,” “project,” “estimate,” “anticipate,” “believe,” “expect,” “continue,” “potential,” “opportunity” and similar expressions, whether in the negative or affirmative. All statements about future expectations or projections, including statements about loan volume, the adequacy of the allowance for credit losses, operating income and expenses, leverage and debt-to-equity ratios, borrower financial performance, impaired loans, and sources and uses of liquidity, are forward-looking statements. Although we believe the expectations reflected in our forward-looking statements are based on reasonable assumptions, actual results and performance may differ materially from our forward-looking statements. Therefore, you should not place undue reliance on any forward-looking statement and should consider the risks and uncertainties that could cause our current expectations to vary from our forward-looking statements, including, but not limited to, legislative changes that could affect our tax status and other matters, demand for our loan products, lending competition, changes in the quality or composition of our loan portfolio, changes in our ability to access external financing, changes in the credit ratings on our debt, valuation of collateral supporting impaired loans, charges associated with our operation or disposition of foreclosed assets, nonperformance of counterparties to our derivative agreements, economic conditions and regulatory or technological changes within the rural electric industry, the costs and impact of legal or governmental proceedings involving us or our members, general economic conditions, governmental monetary and fiscal policies, the occurrence and effect of natural disasters, including severe weather events or public health emergencies, and the factors listed and described under “Item 1A. Risk Factors” in our Annual Report on Form 10-K for the fiscal year ended May 31, 2023 (“2023 Form 10-K”), as well as any risk factors identified under “Part II—Item 1A. Risk Factors” in this Report. Forward-looking statements speak only as of the date they are made, and, except as required by law, we undertake no obligation to update any forward-looking statement to reflect the impact of events, circumstances or changes in expectations that arise after the date any forward-looking statement is made.
Our financial statements include the consolidated accounts of National Rural Utilities Cooperative Finance Corporation (“CFC”), National Cooperative Services Corporation (“NCSC”) and Rural Telephone Finance Cooperative (“RTFC.”) Our principal operations are currently organized for management reporting purposes into three business segments, which are based on the accounts of each of the legal entities included in our consolidated financial statements: CFC, NCSC and RTFC.
CFC is a member-owned, nonprofit finance cooperative association with a principal purpose of providing financing to its members to supplement the loan programs of the Rural Utilities Service (“RUS”) of the United States Department of Agriculture (“USDA”). CFC extends loans to its rural electric members for construction, acquisitions, system and facility repairs and maintenance, enhancements and ongoing operations to support the goal of electric distribution and generation and transmission (“power supply”) systems of providing reliable, affordable power to the customers they service. CFC also provides its members and associates with credit enhancements in the form of letters of credit and guarantees of debt obligations. As a Section 501(c)(4) tax-exempt, member-owned cooperative, CFC’s objective is not to maximize profit, but rather to offer members cost-based financial products and services. The interest rates on lending products offered to our member borrowers reflect our funding costs plus a spread to cover operating expenses and estimated credit losses, while also generating sufficient earnings to cover interest owed on our debt obligations and achieve certain financial target goals. Because CFC is a tax-exempt cooperative, we cannot issue equity securities as a source of funding. CFC’s primary funding sources consist of a combination of public and private issuances of debt securities, member investments and retained equity. NCSC is a member-owned taxable cooperative that is permitted to provide financing to members of CFC, government or
quasi-government entities which own electric utility systems that meet the Rural Electrification Act definition of “rural,” and for-profit and nonprofit entities that are owned,
operated or controlled by, or provide significant benefits to certain members of CFC. RTFC is a taxable Subchapter T member-owned cooperative association. RTFC’s principal purpose is to provide financing to its rural telecommunications members and their affiliates. See “Item 1. Business” in our 2023 Form 10-K for additional information on the business structure, principal purpose, members and core business activities of each of these entities. Unless stated otherwise, references to “we,” “our” or “us” relate to CFC and its consolidated entities. All references to members within this document include members, associates and affiliates of CFC and its consolidated entities, except where indicated otherwise.
The following MD&A is intended to enhance the understanding of our consolidated financial statements by providing material information that we believe is relevant in evaluating our results of operations, financial condition and liquidity and the potential impact of material known events or uncertainties that, based on management’s assessment, are reasonably likely to cause the financial information included in this Report not to be necessarily indicative of our future financial performance. Management monitors a variety of key indicators and metrics to evaluate our business performance. We discuss these key measures and factors influencing changes from period to period. Our MD&A is provided as a supplement to, and should be read in conjunction with, the unaudited consolidated financial statements included in this Report, our audited consolidated financial statements and related notes for the fiscal year ended May 31, 2023 (“fiscal year 2023”) included in our 2023 Form 10-K and additional information, including the risk factors discussed under “Item 1A. Risk Factors,” contained in our 2023 Form 10-K, as well as additional information contained elsewhere in this Report.
Our fiscal year begins on June 1 and ends on May 31. Reference to “Q2 FY2024” and “YTD FY2024” refer to three and six months ended November 30, 2023, respectively. Reference to “Q2 FY2023” and “YTD FY2023” refer to three and six months ended November 30, 2022, respectively.
| | |
| SUMMARY OF SELECTED FINANCIAL DATA |
In addition toOur reported financial measuresresults are determined in conformity with generally accepted accounting principles in the United States (“U.S. GAAP”), and are subject to period-to-period volatility due to changes in market conditions and differences in the way our financial assets and liabilities are accounted for under U.S. GAAP. Our financial assets and liabilities expose us to interest-rate risk, therefore we use derivatives, primarily interest rate swaps, to economically hedge and manage the interest-rate sensitivity mismatch between our financial assets and liabilities. We are required under U.S. GAAP to carry derivatives at fair value on our consolidated balance sheets; however, the financial assets and liabilities for which we use derivatives to economically hedge are carried at amortized cost. Changes in interest rates and the shape of the swap curve result in periodic fluctuations in the fair value of our derivatives, which may cause volatility in our earnings because we do not apply hedge accounting for our interest rate swaps. As a result, the mark-to-market changes in our interest rate swaps are recorded in earnings. The majority of our derivative portfolio consists of pay-fixed swaps with longer maturities, leading to derivative losses when interest rates decline and derivative gains when interest rates rise. This earnings volatility generally is not indicative of the underlying economics of our business, as the derivative forward fair value gains or losses recorded each period may or may not be realized over time, depending on the terms of our derivative instruments and future changes in market conditions that impact the periodic cash settlement amounts of our interest rate swaps.
Therefore, management also evaluates performance based on certainuses non-GAAP financial measures, and metrics, which we refer to as “adjusted” measures.measures, to evaluate financial performance. Our key non-GAAP financial measures are adjusted net income, adjusted net interest income, adjusted interest expense, adjusted net interest yield, adjusted times interest earned ratio (“TIER”) and adjusted debt-to-equity ratio. The most comparable U.S. GAAP financial measures are net income, net interest income, interest expense, net interest yield, TIER and debt-to-equity ratio, respectively. The primary adjustments we make to calculate these non-GAAP financial measures consist of (i) adjusting interest expense and net interest income to include the impact of net periodic derivative cash settlements income (expense) amounts; (ii) adjusting net income, total liabilities and total equity to exclude the non-cash impact of the accounting for derivative financial instruments; (iii) adjusting total liabilities to exclude the amount that funds CFC member loans guaranteed by RUS, subordinated deferrable debt and members’ subordinated certificates; and (iv) adjusting total equity to include subordinated deferrable debt and members’ subordinated certificates and exclude cumulative derivative forward value gains and losses and accumulated other comprehensive income (“AOCI”).
We believe our non-GAAP financial measures, which should not be considered in isolation or as a substitute for measures determined in conformity with U.S. GAAP, provide meaningful information and are useful to investors because management evaluates performance based on these metrics for purposes of (i) establishing short- and long-term performance goals; (ii) budgeting and forecasting; (iii) comparing period-to-period operating results, analyzing changes in results and identifying potential trends; and (iv) making compensation decisions. In addition, certain of the financial covenants in our committed bank revolving line of credit agreements and debt indentures are based on non-GAAP financial measures, as the forward fair value gains and losses related to our interest rate swaps that are excluded from our non-GAAP financial measures do not affect our cash flows, liquidity or ability to service our debt. Our non-GAAP financial measures may not be comparable to similarly titled measures reported by other companies due to differences in the way that these measures are calculated. We provide a reconciliation of our non-GAAP adjusted measures to the most directly comparable U.S. GAAP measures in the section “Non-GAAP Financial Measures.”
Table 1 provides a summary of selected financial data and key metrics used by management in evaluating performance for the three months ended August 31, 2023 and 2022, and as of August 31, 2023 and May 31, 2023.
Table 1: Summary of Selected Financial Data(1)
| | | | | | | | | | | | | | | | | | | | | | | | | | | | | |
| | | | | | Three Months Ended | | | |
| | | | | | August 31, | | | |
| (Dollars in thousands) | | | | | | | | 2023 | | 2022 | | Change | |
| Statements of operations | | | | | | | | | | | | | |
| Net interest income: | | | | | | | | | | | | | |
| Interest income | | | | | | | | $ | 380,956 | | | $ | 306,978 | | | 24 | | % |
| Interest expense | | | | | | | | (316,281) | | | (209,468) | | | 51 | | |
| Net interest income | | | | | | | | | 64,675 | | | | 97,510 | | | (34) | | |
| Fee and other income | | | | | | | | 4,537 | | | 4,056 | | | 12 | | |
| Total revenue | | | | | | | | | 69,212 | | | | 101,566 | | | (32) | | |
| Provision for credit losses | | | | | | | | (800) | | | (3,496) | | | (77) | | |
| Derivative gains: | | | | | | | | | | | | | |
Derivative cash settlements interest income (expense)(2) | | | | | | | | 27,869 | | | (10,785) | | | ** | |
Derivative forward value gains(3) | | | | | | | | 162,018 | | | 104,372 | | | 55 | | |
| Derivative gains | | | | | | | | | 189,887 | | | 93,587 | | | 103 | | |
| Investment security gains (losses) | | | | | | | | 2,933 | | | (3,679) | | | ** | |
Operating expenses(4) | | | | | | | | (31,503) | | | (25,519) | | | 23 | | |
| Other non-interest expense | | | | | | | | (1,117) | | | (322) | | | 247 | | |
| Income before income taxes | | | | | | | | 228,612 | | | 162,137 | | | 41 | | |
| Income tax provision | | | | | | | | (328) | | | (263) | | | 25 | | |
| Net income | | | | | | | | $ | 228,284 | | | $ | 161,874 | | | 41 | | |
| | | | | | | | | | | | | |
| Adjusted statements of operations measures | | | | | | | | | | | | | |
| Interest income | | | | | | | | $ | 380,956 | | | $ | 306,978 | | | 24 | | % |
| Interest expense | | | | | | | | (316,281) | | | (209,468) | | | 51 | | |
Include: Derivative cash settlements interest income (expense)(2) | | | | | | | | 27,869 | | | (10,785) | | | ** | |
Adjusted interest expense(5) | | | | | | | | (288,412) | | | (220,253) | | | 31 | | |
Adjusted net interest income(5) | | | | | | | | $ | 92,544 | | | $ | 86,725 | | | 7 | | |
| | | | | | | | | | | | | |
| Net income | | | | | | | | $ | 228,284 | | | $ | 161,874 | | | 41 | | |
Exclude: Derivative forward value gains(3) | | | | | | | | 162,018 | | | 104,372 | | | 55 | | |
Adjusted net income(5) | | | | | | | | $ | 66,266 | | | $ | 57,502 | | | 15 | | |
| | | | | | | | | | | | | | | | | | | | | | | | | | | | | |
| Profitability ratios | | | | | | | | | | | | | |
Times interest earned ratio (“TIER”)(6) | | | | | | | | 1.72 | | 1.77 | | (3) | | % |
Adjusted TIER(5) | | | | | | | | 1.23 | | 1.26 | | (2) | | |
Net interest yield(7) | | | | | | | | 0.77 | % | | 1.24 | % | | (47) | | bps |
Adjusted net interest yield(5)(8) | | | | | | | | 1.10 | | | 1.10 | | | — | | |
| | | | | | | | | | | | | |
| Credit quality ratios | | | | | | | | | | | | | |
Net (recovery) charge-off rate(9) | | | | | | | | (0.01) | % | | — | | | (1) | | bps |
| | | | | | | | | | | | | | | | | | | | | | | | | | | | | | | | | | | | | | | | | |
| | | | | | | | | |
| | | | | | | | | |
| (Dollars in thousands) | | Q2 FY2024 | | Q2 FY2023 | | Change | | YTD FY2024 | | YTD FY2023 | | Change | |
| Statements of operations | | | | | | | | | | | | | |
| Net interest income: | | | | | | | | | | | | | |
| Interest income | | $ | 388,987 | | | $ | 324,194 | | | 20 | | % | $ | 769,943 | | | $ | 631,172 | | | 22 | | % |
| Interest expense | | (323,845) | | | (245,444) | | | 32 | | | (640,126) | | | (454,912) | | | 41 | | |
| Net interest income | | 65,142 | | | 78,750 | | | (17) | | | | 129,817 | | | | 176,260 | | | (26) | | |
| Fee and other income | | 6,611 | | | 4,166 | | | 59 | | | 11,148 | | | 8,222 | | | 36 | | |
| Total revenue | | 71,753 | | | 82,916 | | | (13) | | | | 140,965 | | | | 184,482 | | | (24) | | |
| Provision for credit losses | | (628) | | | (11,628) | | | (95) | | | (1,428) | | | (15,124) | | | (91) | | |
| Derivative gains: | | | | | | | | | | | | | |
Derivative cash settlements interest income (expense)(2) | | 28,767 | | | 4,801 | | | 499 | | | 56,636 | | | (5,984) | | | ** | |
Derivative forward value gains(3) | | 78,171 | | | 141,989 | | | (45) | | | 240,189 | | | 246,361 | | | (3) | | |
| Derivative gains | | 106,938 | | | 146,790 | | | (27) | | | | 296,825 | | | 240,377 | | | 23 | | |
| Investment security gains (losses) | | 1,843 | | | (493) | | | ** | | 4,776 | | | (4,172) | | | ** | |
Operating expenses(4) | | (31,512) | | | (27,247) | | | 16 | | | (63,015) | | | (52,766) | | | 19 | | |
| Other non-interest expense | | (276) | | | (355) | | | (22) | | | (1,393) | | | (677) | | | 106 | | |
| Income before income taxes | | 148,118 | | | 189,983 | | | (22) | | | 376,730 | | | 352,120 | | | 7 | | |
| Income tax provision | | (83) | | | (219) | | | (62) | | | (411) | | | (482) | | | (15) | | |
| Net income | | $ | 148,035 | | | $ | 189,764 | | | (22) | | | $ | 376,319 | | | $ | 351,638 | | | 7 | | |
| | | | | | | | | | | | | |
| Adjusted statements of operations measures | | | | | | | | | | | | | |
| Interest income | | $ | 388,987 | | | $ | 324,194 | | | 20 | | % | $ | 769,943 | | | $ | 631,172 | | | 22 | | % |
| Interest expense | | (323,845) | | | (245,444) | | | 32 | | | (640,126) | | | (454,912) | | | 41 | | |
Include: Derivative cash settlements interest income (expense)(2) | | 28,767 | | | 4,801 | | | 499 | | | 56,636 | | | (5,984) | | | ** | |
Adjusted interest expense(5) | | (295,078) | | | (240,643) | | | 23 | | | (583,490) | | | (460,896) | | | 27 | | |
Adjusted net interest income(5) | | $ | 93,909 | | | $ | 83,551 | | | 12 | | | $ | 186,453 | | | $ | 170,276 | | | 10 | | |
| | | | | | | | | | | | | |
| Net income | | $ | 148,035 | | | $ | 189,764 | | | (22) | | | $ | 376,319 | | | $ | 351,638 | | | 7 | | |
Exclude: Derivative forward value gains(3) | | 78,171 | | | 141,989 | | | (45) | | | 240,189 | | | 246,361 | | | (3) | | |
Adjusted net income(5) | | $ | 69,864 | | | $ | 47,775 | | | 46 | | | $ | 136,130 | | | $ | 105,277 | | | 29 | | |
| | | | | | | | | | | | | | | | | | | | | | | | | | | | | | | | | | | | | | | | | |
| Profitability ratios | | | | | | | | | | | | | |
Times interest earned ratio (“TIER”)(6) | | 1.46 | | 1.77 | | (18) | | % | 1.59 | | 1.77 | | (10) | | % |
Adjusted TIER(5) | | 1.24 | | 1.20 | | 3 | | | 1.23 | | 1.23 | | — | | |
Net interest yield(7) | | 0.77 | % | | 0.99 | % | | (22) | | bps | 0.77 | % | | 1.12 | % | | (35) | | bps |
Adjusted net interest yield(5)(8) | | 1.12 | | | 1.05 | | | 7 | | | 1.11 | | | 1.08 | | | 3 | | |
| | | | | | | | | | | | | |
| Credit quality ratios | | | | | | | | | | | | | |
Net (recovery) charge-off rate(9) | | — | | | 0.19 | | | (19) | | bps | (0.01) | % | | 0.10 | | | (11) | | bps |
| | | | | | | | | | | | | | | | | | | | | | | | | | | | | |
| (Dollars in thousands) | | | | | | | | August 31, 2023 | | May 31, 2023 | | Change | |
| Balance sheets | | | | | | | | | | | | | |
| Assets: | | | | | | | | | | | | | |
| Cash, cash equivalents and restricted cash | | | | | | | | $ | 208,842 | | | $ | 207,237 | | | 1 | | % |
| Investment securities | | | | | | | | 462,111 | | | 510,369 | | | (9) | | |
Loans to members(10) | | | | | | | | 33,096,646 | | | 32,532,086 | | | 2 | | |
| Allowance for credit losses | | | | | | | | (54,926) | | | (53,094) | | | 3 | | |
| Loans to members, net | | | | | | | | 33,041,720 | | | 32,478,992 | | | 2 | | |
| Total assets | | | | | | | | 34,694,163 | | | 34,012,060 | | | 2 | | |
| Liabilities and equity: | | | | | | | | | | | | | |
| Short-term borrowings | | | | | | | | 5,124,335 | | | 4,546,275 | | | 13 | | |
| Long-term debt | | | | | | | | 23,874,274 | | | 23,946,548 | | | — | | |
| Subordinated deferrable debt | | | | | | | | 1,184,197 | | | 1,283,436 | | | (8) | | |
| Members’ subordinated certificates | | | | | | | | 1,222,026 | | | 1,223,126 | | | — | | |
| Total debt outstanding | | | | | | | | 31,404,832 | | | 30,999,385 | | | 1 | | |
| Total liabilities | | | | | | | | 31,946,236 | | | 31,422,811 | | | 2 | | |
| Total equity | | | | | | | | 2,747,927 | | | 2,589,249 | | | 6 | | |
| | | | | | | | | | | | | |
| Adjusted balance sheets measures | | | | | | | | | | | | | |
Adjusted total liabilities(5) | | | | | | | | $ | 29,311,221 | | | $ | 28,678,302 | | | 2 | | % |
Adjusted total equity(5) | | | | | | | | 4,648,111 | | | 4,751,712 | | | (2) | | |
Members’ equity(5) | | | | | | | | 2,205,266 | | | 2,211,092 | | | — | | |
| | | | | | | | | | | | | |
| Debt ratios | | | | | | | | | | | | | |
Debt-to-equity ratio(11) | | | | | | | | 11.63 | | 12.14 | | (4) | | % |
Adjusted debt-to-equity ratio(5) | | | | | | | | 6.31 | | 6.04 | | 4 | | |
Liquidity coverage ratio(12) | | | | | | | | 0.94 | | 1.03 | | (9) | | |
| | | | | | | | | | | | | |
| | | | | | | | | | | | | | | | | | | | | | | | | | | | | |
| Credit quality ratios | | | | | | | | | | | | | |
Nonperforming loans ratio(13) | | | | | | | | 0.26 | % | | 0.27 | % | | (1) | | bps |
Criticized loans ratio(14) | | | | | | | | 0.87 | | | 0.99 | | | (12) | | |
Allowance coverage ratio(15) | | | | | | | | 0.17 | | | 0.16 | | | 1 | | |
| | | | | | | | | | | | | | | | | | | | | | | | | | | | | |
| (Dollars in thousands) | | | | | | | | November 30, 2023 | | May 31, 2023 | | Change | |
| Balance sheets | | | | | | | | | | | | | |
| Assets: | | | | | | | | | | | | | |
| Cash, cash equivalents and restricted cash | | | | | | | | $ | 139,872 | | | $ | 207,237 | | | (33) | | % |
| Time deposits | | | | | | | | 400,000 | | | — | | | ** | |
| Investment securities | | | | | | | | 416,868 | | | 510,369 | | | (18) | | |
Loans to members(10) | | | | | | | | 33,553,589 | | | 32,532,086 | | | 3 | | |
| Allowance for credit losses | | | | | | | | (55,554) | | | (53,094) | | | 5 | | |
| Loans to members, net | | | | | | | | 33,498,035 | | | 32,478,992 | | | 3 | | |
| Total assets | | | | | | | | 35,510,203 | | | 34,012,060 | | | 4 | | |
| Liabilities and equity: | | | | | | | | | | | | | |
| Short-term borrowings | | | | | | | | 5,161,583 | | | 4,546,275 | | | 14 | | |
| Long-term debt | | | | | | | | 24,640,201 | | | 23,946,548 | | | 3 | | |
| Subordinated deferrable debt | | | | | | | | 1,184,247 | | | 1,283,436 | | | (8) | | |
| Members’ subordinated certificates | | | | | | | | 1,208,819 | | | 1,223,126 | | | (1) | | |
| Total debt outstanding | | | | | | | | 32,194,850 | | | 30,999,385 | | | 4 | | |
| Total liabilities | | | | | | | | 32,614,063 | | | 31,422,811 | | | 4 | | |
| Total equity | | | | | | | | 2,896,140 | | | 2,589,249 | | | 12 | | |
| | | | | | | | | | | | | |
| Adjusted balance sheets measures | | | | | | | | | | | | | |
Adjusted total liabilities(5) | | | | | | | | $ | 30,009,747 | | | $ | 28,678,302 | | | 5 | | % |
Adjusted total equity(5) | | | | | | | | 4,705,075 | | | 4,751,712 | | | (1) | | |
Members’ equity(5) | | | | | | | | 2,275,457 | | | 2,211,092 | | | 3 | | |
| | | | | | | | | | | | | |
| Debt ratios | | | | | | | | | | | | | |
Debt-to-equity ratio(11) | | | | | | | | 11.26 | | 12.14 | | (7) | | % |
Adjusted debt-to-equity ratio(5) | | | | | | | | 6.38 | | 6.04 | | 6 | | |
Liquidity coverage ratio(12) | | | | | | | | 0.89 | | 1.03 | | (14) | | |
| | | | | | | | | | | | | |
| | | | | | | | | | | | | | | | | | | | | | | | | | | | | |
| Credit quality ratios | | | | | | | | | | | | | |
Nonperforming loans ratio(13) | | | | | | | | 0.25 | % | | 0.27 | % | | (2) | | bps |
Criticized loans ratio(14) | | | | | | | | 0.89 | | | 0.99 | | | (10) | | |
Allowance coverage ratio(15) | | | | | | | | 0.17 | | | 0.16 | | | 1 | | |
____________________________
**Calculation of percentage change is not meaningful.
(1)Certain reclassifications may have been made for prior periods to conform to the current-period presentation.
(2)Consists of net periodic contractual interest amounts on our interest rate swaps, which we refer to as derivatives cash settlements interest income (expense).
(3)Consists of derivative forward value gains (losses), which represent changes in fair value during the period, excluding net periodic contractual interest settlement amounts, attributable to derivatives not designated for hedge accounting.
(4)Consists of the total non-interest expense components (i) salaries and employee benefits and (ii) other general and administrative expenses, each of which is presented separately on the consolidated statements of operations.
(5)See “Item 7. MD&A—Non-GAAP Financial Measures” in our 2023 Form 10-K for a description of each of our non-GAAP financial measures. See the section “Non-GAAP Financial Measures” for a reconciliation of the non-GAAP financial measures presented in this Report to the most comparable U.S. GAAP financial measures.
(6)Calculated based on net income (loss) plus interest expense for the period divided by interest expense for the period.
(7)Calculated based on annualized net interest income for the period divided by average interest-earning assets for the period.
(8)Calculated based on annualized adjusted net interest income for the period divided by average interest-earning assets for the period.
(9)Calculated based on annualized net charge-offs or recoveries for the period divided by average total loans outstanding for the period.
(10)Consists of the unpaid principal balance of member loans plus unamortized deferred loan origination costs of $13 million as of both August 31,November 30, 2023 and May 31, 2023.
(11)Calculated based on total liabilities at period end divided by total equity at period end.
(12)Calculated based on available liquidity at period end, divided by the amount of maturing debt obligations over the next 12 months at period end, as of each respective date.
(13)Calculated based on total nonperforming loans at period end divided by total loans outstanding at period end.
(14)Calculated based on loans outstanding at period end to borrowers with a risk rating that falls within the criticized risk rating category, which consists of special mention, substandard and doubtful, divided by total loans outstanding at period end.
(15)Calculated based on the allowance for credit losses at period end divided by total loans outstanding at period end.
As a member-owned, nonprofit finance cooperative, our primary objective is to provide our rural electric utility members with access to affordable, flexible financing products while also maintaining a sound, stable financial position and adequate liquidity to meet our financial obligations and maintain ongoing investment-grade credit ratings. Because maximizing profit is not our primary objective, the interest rates on lending products offered to our member borrowers reflect our funding costs plus a spread to cover operating expenses and estimated credit losses, while also generating sufficient earnings to cover interest owed on our debt obligations and achieve certain financial target goals. Our financial goals focus on earning an annual minimum adjusted TIER of 1.10 and maintaining an adjusted debt-to-equity ratio at approximately 6-to-1 or below.
We are subject to period-to-period volatility in our reported U.S. GAAP results due to changes in market conditions and differences in the way our financial assets and liabilities are accounted for under U.S. GAAP. Our financial assets and liabilities expose us to interest-rate risk. We use derivatives, primarily interest rate swaps, as part of our strategy in managing this risk. Our derivatives are intended to economically hedge and manage the interest-rate sensitivity mismatch between our financial assets and liabilities. We are required under U.S. GAAP to carry derivatives at fair value on our consolidated balance sheets; however, the financial assets and liabilities for which we use derivatives to economically hedge are carried at amortized cost. Changes in interest rates and the shape of the swap curve result in periodic fluctuations in the fair value of our derivatives, which may cause volatility in our earnings because we do not apply hedge accounting for our interest rate swaps. As a result, the mark-to-market changes in our interest rate swaps are recorded in earnings. Because our derivative portfolio consists of a higher proportion of pay-fixed swaps, the majority of which are longer dated, than receive-fixed swaps, the majority of which are shorter dated, we generally record derivative losses when interest rates decline and derivative gains when interest rates rise. This earnings volatility generally is not indicative of the underlying economics of our business, as the derivative forward fair value gains or losses recorded each period may or may not be realized over time, depending on the terms of our derivative instruments and future changes in market conditions that impact the periodic cash settlement amounts of our interest rate swaps. Therefore, as discussed above under “Summary of Selected Financial Data,” management uses our non-GAAP financial measures to evaluate financial performance. Our adjusted financial results include the realized net periodic contractual interest expense amounts on our interest rate swaps but exclude the unrealized forward fair value gains and losses.
Financial Performance
Reported Results
Net Income and TIER
We reported
The table below shows our net income of $228 million and TIER of 1.72 for the three months ended August 31, 2023 (“current quarter”), compared with net incomeperiods presented and the variance between these periods. We provide a more detailed discussion of $162 million and TIER of 1.77 for the three months ended August 31, 2022 (“same prior-year quarter”). The variances between our reported results forunder the current quartersection “Consolidated Results of Operations.”
Table 2: Net Income and the same prior-year quarter areTIER
| | | | | | | | | | | | | | | | | | | | | | | | | | | | | | | | | | | | | | |
| (Dollars in thousands) | | Q2 FY2024 | | Q2 FY2023 | | Change | | YTD FY2024 | | YTD FY2023 | | Change |
| Net income | | $ | 148,035 | | | $ | 189,764 | | | $ | (41,729) | | | $ | 376,319 | | | $ | 351,638 | | | $ | 24,681 | |
| | | | | | | | | | | | |
| | | | | | | | | | | | |
| | | | | | | | | | | | |
| | | | | | | | | | | | |
| | | | | | | | | | | | |
| | | | | | | | | | | | |
| TIER | | 1.46 | | 1.77 | | (0.31) | | 1.59 | | 1.77 | | (0.18) |
Q2 FY2024 versus Q2 FY2023
The decrease in net income was primarily driven by:
•A decrease in derivative gains of $40 million, attributable to mark-to-market changesless pronounced increases in interest rates across the swap curve during Q2 FY2024 compared to Q2 FY2023;
•A decrease in net interest income of $14 million, attributable to a decrease in the net interest yield of 22 basis points, or 22%, to 0.77%, partially offset by an increase in average interest-earning assets of $2,105 million, or 7%; and
•An increase in operating and other non-interest expenses of $4 million;
Partially offset by:
•A reduction in the provision for credit losses of $11 million. We recorded a provision for credit losses of $1 million for Q2 FY2024, resulted primarily from an increase in the collective allowance due to loan portfolio growth. In comparison, we recorded a provision for credit losses of $12 million for Q2 FY2023, primarily driven by an increase in the asset-specific allowance for a nonperforming CFC power supply loan;
•A favorable shift from losses to gains recorded on our investment securities of $2 million, primarily due to period-to-period market fluctuations in fair valuevalue; and an increase in fee and other income of $3 million.
YTD FY2024 versus YTD FY2023
The increase in net income was primarily driven by:
•An increase in derivative gains of $56 million, primarily from an increase in the net interest rate received on our pay-fixed swaps, which drove the higher derivative cash settlements income for YTD FY2024;
•A reduction in the provision for credit losses of $14 million. We recorded a provision for credit losses of $1 million for YTD FY2024, resulted primarily from an increase in the collective allowance due to loan portfolio growth and a slight decline in the overall credit quality and risk profile of our derivative instruments. loan portfolio. In comparison, we recorded a provision for credit losses of $15 million for YTD FY2023, driven primarily by an increase in the asset-specific allowance for a nonperforming CFC power supply loan as discussed above;
•A favorable shift from losses to gains recorded on our investment securities of $9 million, primarily due to period-to-period market fluctuations in fair value; and an increase in fee and other income of $3 million;
Partially offset by:
•A decrease in net interest income of $46 million, attributable to a decrease in the net interest yield of 35 basis points, or 31%, to 0.77%, partially offset by an increase in average interest-earning assets of $2,226 million, or 7%; and
•An increase in operating and other non-interest expenses of $11 million.
The decrease in TIER for Q2 FY2024 and YTD FY2024, compared to Q2 FY2023 and YTD FY2023, was primarily driven by increased interest expense during Q2 FY2024 and YTD FY2024.
Debt-to-Equity Ratio
Our debt-to-equity ratio decreased to 11.6311.26 as of August 31,November 30, 2023, from 12.14 as of May 31, 2023, primarily due to an increase in equity resulting from our reported net income of $228$376 million for the current quarter,YTD FY2024, which was partially offset by a decrease in equity attributable to the CFC Board of Directors’ authorized patronage capital retirement in July 2023 of $72 million.
Non-GAAP Adjusted Results
Adjusted Net Income and Adjusted TIER
The table below shows our adjusted net income and adjusted TIER for the periods presented and the variance between these periods. Our financial goals focus on earning an annual minimum adjusted TIER of 1.10. We provide a more detailed discussion of our non-GAAP adjusted results under the section “Consolidated Results of Operations.”
Table 3: Adjusted Net Income and Adjusted TIER
| | | | | | | | | | | | | | | | | | | | | | | | | | | | | | | | | | | | | | |
| (Dollars in thousands) | | Q2 FY2024 | | Q2 FY2023 | | Change | | YTD FY2024 | | YTD FY2023 | | Change |
| Adjusted Net income | | $ | 69,864 | | | $ | 47,775 | | | $ | 22,089 | | | $ | 136,130 | | | $ | 105,277 | | | $ | 30,853 | |
| Adjusted TIER | | 1.24 | | 1.20 | | 0.04 | | 1.23 | | 1.23 | | 0.00 |
Q2 FY2024 versus Q2 FY2023
The increase in our reportedadjusted net income of $66 million to $228 million for the was primarily driven by:
•current quarter from $162 million for the same prior-year quarter was driven primarily by anAn increase in derivative gains of $96 million, partially offset by a decrease inadjusted net interest income of $33 million. We recorded derivative gains$10 million, driven by the combined impact of $190 million for the current quarter attributable to increases in the medium- and longer-term swap interest rates. In comparison, we recorded derivative gains of $94 million for the same prior-year quarter, attributable to increases in interest rates across the entire swap curve. As noted above, the substantial majority of our swap portfolio consists of longer-dated, pay-fixed swaps. Therefore, increases and decreases in medium- and longer-term swap rates generally have a more pronounced corresponding impact on the change in the net fair value of our swap portfolio.
The decrease in net interest income of $33 million, or 34%, to $65 million for the current quarter was attributable to a decrease in the net interest yield of 47 basis points, or 38%, to 0.77%, partially offset by an increase in average interest-earning assets of $2,345$2,105 million, or 8%. The decrease in the net interest yield reflected the combined impact of an increase in our average cost of borrowings of 117 basis points to 4.02%7%, partially offset by an increase in the average yield on our interest-earning assets of 62 basis points to 4.52% and an increase in the benefit from non-interest bearing fundingadjusted net interest yield of 87 basis points, or 7%, to 0.27%. The increase in average interest-earning assets was primarily driven by growth in average total loans.
The increases•A reduction in the average costprovision for credit losses of borrowings and average yield on interest-earning assets were driven by the continued increase in the federal funds rate, which resulted in increases in the average cost of our short-term and variable-rate borrowings and the average yield earned on our line of credit and variable-rate loans. During the current quarter, the Federal Open Market Committee (“FOMC”) of the Federal Reserve continued to raise the target range for the federal funds rate at its July meeting, resulting in a federal funds rate of 5.25% to 5.50% as of August 31, 2023.$11 million;
Other factors affecting the variance between our reported results for the •current quarter and the same prior-year quarter include the impact of aA favorable shift from losses to gains recorded on our investment securities of $7$2 million; and an increase in fee and other income of $3 million;
Partially offset by:
•An increase in operating and other non-interest expenses of $4 million.
YTD FY2024 versus YTD FY2023
The increase in adjusted net income was primarily driven by:
•An increase in adjusted net interest income of $16 million, primarily duedriven by the combined impact of an increase in average interest-earning assets of $2,226 million, or 7%, and an increase in the adjusted net interest yield of 3 basis points, or 3%, to period-to-period market fluctuations1.11%;
• in fair value, and aA reduction in the provision for credit losses of $2 million$14 million;
•, partiallyA favorable shift from losses to gains recorded on our investment securities of $9 million; and an increase in fee and other income of $3 million;
Partially offset by an by:
•An increase in operating and other non-interest expenses of $6 million, attributable to higher expenses recorded for salaries, information technology, depreciation and amortization expenses, and member relations expenses. We provide additional information on our provision for credit losses under the section “Consolidated Results of Operations—Provision for Credit Losses” of this Report.$11 million.
Non-GAAP Adjusted ResultsDebt-to-Equity Ratio
Adjusted net income totaled $66 million and adjusted TIER was 1.23 for the current quarter, compared with adjusted net income of $58 million and adjusted TIER of 1.26 for the same prior-year quarter. The adjusted TIER for the current quarter and the same prior-year quarter was well above our target of 1.10. While our goal is to maintainOur financial goals focus on maintaining an adjusted debt-to-equity ratio ofat approximately 6-to-1 theor below. The adjusted debt-to-equity ratio increased to 6.316.38 as of August 31,November 30, 2023 from 6.04 as of May 31, 2023, and was above our targeted goal, due to the combined impact
of an increase in adjusted liabilities resulting from additional borrowings to fund growth in our loan portfolio and a decrease in adjusted equity. The decrease in adjusted equity was primarily due to the early redemption during the current quarterYTD FY2024 of $100 million in principal amount of our $400 million subordinated deferrable debt due 2043 and the CFC Board of Directors’ authorized patronage capital retirement in July 2023, partially offset by our current-quarter adjusted net income.
The increase in adjusted net income of $8 million to $66 million for the current quarter, from $58 million for the same prior-year quarter was due primarily to an increase in adjusted net interest income of $6 million, a favorable shift from losses to gains recorded on our investment securities of $7 million, and a reduction in the provision for credit losses of $2 million, partially offset by an increase in operating expenses of $6 million, as discussed above under “Reported Results.”
The increase in adjusted net interest income of $6 million, or 7%, to $93 million, was attributable primarily to an increase in average interest-earning assets of $2,345 million, or 8%, primarily due to growth in average total loans. The adjusted net interest yield remained unchanged at 1.10%, reflecting the combined impact of an increase in the average yield on interest-earning assets of 62 basis points to 4.52% and an increase in the benefit from non-interest bearing funding of 4 basis points to 0.24%, offset by an increase in our adjusted average cost of borrowings of 66 basis points to 3.66%.
See “Non-GAAP Financial Measures” for additional information on our non-GAAP financial measures, including a reconciliation of these measures to the most directly comparable U.S. GAAP financial measures.YTD FY2024.
Lending Activityand Credit Quality
Loans to members totaled $33,097$33,554 million as of August 31,November 30, 2023, an increase of $565$1,022 million, or 2%3%, from May 31, 2023, reflecting net increases in long-term and line of credit loans of $326$853 million and $239$169 million, respectively. The $239 million increase in lineOur loan portfolio composition remained largely unchanged from May 31, 2023 with 77% of credit loans was largely attributable to funding provided for higher member operating costs, working capital and RUS bridge loan financing.
Long-term loan advances totaled $711 million during the current quarter, of which approximately 87% was provided to members for capital expenditures and approximately 13% was provided for other purposes, primarily asset acquisitions. Of the $711 million total long-term loans advanced during the current quarter, $659 million were fixed-rate loan advances with a weighted average fixed-rate term of 14 years.
Our aggregate loans outstanding to CFC electric distribution cooperative members relatingborrowers, 17% to broadband projects, which we started tracking in October 2017, increasedCFC power supply borrowers, and 2% to an estimated $2,558 millionRTFC borrowers as of August 31, 2023, from approximately $2,355 million as of May 31,November 30, 2023.
We provide additional information on our lending activity and loan portfolio under the section “Consolidated Balance Sheet Analysis—Loan Portfolio” and “Note 4—Loans” in this Report.
Credit Quality
We believe the overall credit quality of our loan portfolio remained strong as of August 31,November 30, 2023. Historically, we have had limited defaults and losses on loans in our electric utility loan portfolio largely because of the essential nature of the service provided by electric utility cooperatives as well as other factors, such as limited rate regulation and competition, which we discuss further in the section “Credit Risk—Loan Portfolio Credit Risk.” In addition, we generally lend to members on a senior secured basis, which reduces the risk of loss in the event of a borrower default. Loans outstanding to electric utility organizations of $32,545 million and $32,032 million as of August 31, 2023 and May 31, 2023, respectively, represented approximately 98% and 99% of total loans outstanding as of each respective date. Of our total loans outstanding, 92% were secured as of both August 31, 2023 and May 31, 2023.
We had no loan charge-offs during the current quarterQ2 FY2024 and the same prior-year quarter.YTD FY2024. During the current quarter, we receivedWe recorded a total amount of $28 million in loan payments from Brazos Electric Power Cooperative, Inc. (“Brazos”) and its wholly-owned subsidiary Brazos Sandy Creek Electric Cooperative Inc. (“Brazos Sandy Creek”) to repay their $27 million of total loans outstanding in full. The additional payment of $1 million was recorded as a loan recovery on the Brazos and Brazos Sandy Creekto previously charged-off loan amounts during the three months ended August 31, 2023 (“Q1 FY2024”), which resulted in an annualized net recovery rate of 0.01% for YTD FY2024. In comparison, we experienced charge-offs totaling $15 million during Q2 FY2023 and YTD FY2023, which resulted in an annualized net charge-off rate of 0.19% and 0.10% for Q2 FY2023 and YTD FY2023, respectively.
We had aone loan to one CFC electric power supply borrower totaling $85 million classified as nonperforming as of August 31,November 30, 2023. In comparison, we had loans to two CFC electric power supply borrowersloans totaling $89 million classified as nonperforming as of May 31, 2023. The reduction in nonperforming loans was due to the receipt of $4 million in loan payments fromfor a Brazos Sandy Creek to pay off its nonperforming loan outstanding, as discussed above.loan.
Our allowance for credit losses and allowance coverage ratio increased to $55$56 million and 0.17%, respectively, as of August 31,November 30, 2023, from $53 million and 0.16%, respectively, as of May 31, 2023. The $2$3 million increase in the allowance for credit losses reflected an increase in the collective allowance of $3$4 million, partially offset by a reduction in the asset-specific allowance of $1 million.
We provide additional information on the credit quality of our loan portfolioFinancing and the allowance for credit losses in the sections “Critical Accounting Estimates,” “Credit Risk—Credit Quality Indicators” and “Credit Risk—Allowance for Credit Losses,” and in “Note 4—Loans” and “Note 5—Allowance for Credit Losses” of this Report.Liquidity
Financing Activity
We issue debt primarily to fund growth in our loan portfolio. As such, our debt outstanding generally increases and decreases in response to member loan demand. Total debt outstanding increased $405$1,195 million, or 1%4%, to $31,405$32,195 million as of August 31,November 30, 2023, primarily due to borrowings to fund the increase in loans to members. Outstanding dealer commercial paper of $1,088$1,039 million as of August 31,November 30, 2023 was within our quarter-end target range. We provide additional information on our financing activities in the below section “Liquidity Risk”range of this Report.$1,000 million to $1,500 million.
In September 2023 and December 2023, Fitch Ratings (“Fitch”) and S&P Global Inc.(“S&P”), respectively, affirmed CFC’s credit ratings and stable outlook. We present our credit ratings for each CFC debt product type as of August 31, 2023, which remain unchanged as of the date of this Report, in Table 23 in the below section “Liquidity Risk—Credit Ratings” of this Report.
Liquidity
In addition to cash on hand, our primary sources of funds include member loan principal repayments,and cash equivalents, time deposits, investments in debt securities held in our investment portfolio,and availability under committed bank revolving linesline of credit agreements, committed loan facilities under the USDA Guaranteed Underwriter Program (“Guaranteed Underwriter Program”), and a revolving note purchase agreement with the Federal Agricultural Mortgage Corporation (“Farmer Mac”) and proceeds from debt issuances to our members and in the public capital markets. Although as a nonbank financial institution we are not subject to regulatory liquidity requirements, we monitor our liquidity and funding positions on an ongoing basis and assess our ability to meet our scheduled debt obligations and other cash flow requirements based on point-in-time metrics as well as forward-looking projections. Our liquidity and funding assessment takes into consideration amounts available under existing liquidity sources, the expected rollover of member short-term investments and scheduled loan principal repayment amounts, as well as our continued ability to access the public capital markets and other non-capital market related funding sources.
. As of August 31,November 30, 2023, our available liquidity totaled $6,622 million, consisting of: (i) cash and cash equivalents of $200 million; (ii) investments in debt securities with an aggregate fair value of $425 million, which is subject to changes based on market fluctuations; (iii) up to $2,598 million available under committed bank revolving line of credit agreements; (iv) up to $1,025 million available under committed loan facilities under the Guaranteed Underwriter Program; and (v) up to $2,374 million available under a Farmer Mac revolving note purchase agreement, subject to market conditions. In addition to our existing available liquidity of $6,622 million as of August 31, 2023, we expect to receive $1,487 million from scheduled long-term loan principal payments over the next 12 months.
Debt scheduled to mature over the next 12 months totaled $7,011 million as of August 31, 2023, consisting of short-term borrowings of $5,124$6,556 million and long-term and subordinated debt of $1,887 million. The short-term borrowings scheduled maturity amount of $5,124 million consists of member investments of $3,536 million, dealer commercial paper of $1,088 million and Farmer Mac notes payable of $500 million. The long-term and subordinated scheduled debt obligations over the next 12 months of $1,887 million consist of debt maturities and scheduled debt payment amounts, of which, $202 million was from member investments.
Our available liquidity of $6,622 million as of August 31, 2023 was $389$824 million below our total scheduled debt obligations over the next 12 months of $7,011$7,380 million. In addition to our existing available liquidity, we expect to receive $1,516 million from scheduled long-term loan principal payments over the next 12 months. Subsequent to November 30, 2023, we closed on a $450 million Series U committed loan facility from the U.S. Treasury Department’s Federal Financing Bank under the Guaranteed Underwriter Program, resulting in an increase of the total availability under the Guaranteed Underwriter Program from $750 million as of November 30, 2023 to $1,200 million as of the date of this Report.
We believe we can continue to roll over our member short-term investments of $3,536$3,623 million as of August 31, 2023, based on our expectation that our members will continue to reinvest their excess cash primarily in short-term investment products offered by CFC. Our members historically have maintained a relatively stable level of short-term investments in CFC in the form of commercial paper, select notes, daily liquidity fund notes and medium-term notes.CFC. Member short-term investments in CFC have averaged $3,607$3,589 million over the last 12 fiscal quarter-end reporting periods. Our available liquidity of $6,622 million as of August 31,November 30, 2023 was $3,147$2,799 million in excess of, or 1.91.7 times over, our total scheduled debt obligations, excluding member short-term investments, over the next 12 months of $3,475$3,757 million.
We expect to continue accessing the dealer commercial paper market as a cost-effective means of satisfying our incremental short-term liquidity needs. Although the intra-quarter amount of dealer commercial paper outstanding may fluctuate based on our liquidity requirements, our intent is to manage our short-term wholesale funding risk by maintaining the dealer commercial paper outstanding at each quarter-end within a range of $1,000 million to $1,500 million. To mitigate commercial paper rollover risk, we expect to continue to maintain our committed bank revolving line of credit agreements and be in compliance with the covenants of these agreements so we can draw on these facilities, if necessary, to repay dealer or member commercial paper that cannot be refinanced with similar debt. In addition, under master repurchase agreements we have with our bank counterparties, we can obtain short-term funding in secured borrowing transactions by selling investment-grade corporate debt securities from our investment securities portfolio subject to an obligation to repurchase the same or similar securities at an agreed-upon price and date.
The issuance of long-term debt, which represents the most significant component of our funding, allows us to reduce our reliance on short-term borrowings, as well as effectively manage our refinancing and interest rate risk. We expect to continue to issue long-term debt in the public capital markets and under our other non-capital market debt arrangements to meet our funding needs and believe that we have sufficient sources of liquidity to meet our debt obligations and support our operations over the next 12 months.
We provide additional information on our liquidity profile and our primary sources and uses of funds, including projected amounts, by quarter, over each of the next six fiscal quarters through the quarter ending February 28, 2025, in the “Liquidity Risk” section of this Report.
RTFC and NCSC Consolidation
In April 2023 and June 2023, RTFC’s and NCSC’s members, respectively, approved the sale of RTFC’s business to NCSC. We intend to complete the consolidation of RTFC and NCSC within the fiscal year ended May 31, 2024, subject to meeting certain closing conditions. In October 2023, in connection withas part of the consolidation transaction,process between RTFC and NCSC, the Board of Directors approved the early retirement of allocated but unretired patronage capital at a discounted amount of $52$51 million, which may be subjectwas returned in cash to adjustment at the closing of the consolidation transaction.RTFC’s members in January 2024. In addition, CFC’s and RTFC’s Board of Directors approved theon October 26, 2023, we early redemption ofredeemed at par $12 million of members’ subordinated certificates, which is expectedas approved by CFC’s and RTFC’s Board of Directors. The consolidation of RTFC and NCSC was finalized on December 1, 2023. We accounted for the transaction pursuant to occur prior to the closing of the consolidation transaction.
Electric Cooperative Industry Trends and Developments
Emerging developments and trends in the electric cooperative sector continue to present opportunities as well as challenges for our electric cooperative members. These trends include: (i) expanded investments by many electric cooperatives to deploy broadband services to their members; (ii) inflation, supply chain challenges and labor shortages; (iii) increased federal government programs and policies for electric utilities; (iv) an increased focus on enhancing electric system resiliency and reliability; (v) continued interest in renewable energy investments; and (vi) growing support of beneficial electrification strategies to reduce overall carbon emissions, while also providing benefits to cooperative members. We provide additional information on these emerging developments and trends in the electric cooperative sector in “Item 7. MD&A—Executive Summary” in our 2023 Form 10-K.
Outlook
As further described below in thethe “Liquidity Risk—Projected Near-Term Sources and Uses of Funds” section, we currently anticipate net long-term loan growth of $1,955$1,763 million over the next 12 months. We also expect that our variable-rate line of credit loans outstanding will remain at an elevated level over the same period.
In SeptemberDecember 2023, the FOMCFederal Open Market Committee (“FOMC”) of the Federal Reserve signaled the expectation of oneno additional increaseincreases in the federal funds rate and pointed to a consensus target rate of 5.60%5.4% by December 31, 2023, stating its continued objective of returning2023. The FOMC expects a slowdown in the inflationU.S. economy in 2024, with the median projected Gross Domestic Product (“GDP”) growth rate to 2% over the longer run.at 1.4% in 2024. In addition, the Federal Reserve expects that inflation will continue to remain above the 2% long-term target in 2024. As such, the FOMC projections include a decrease in theprojects federal funds rate to acuts in 2024, bringing the target rate of 5.10%to 4.6% by December 31, 2024. As a result, the September 2023 consensusConsensus market outlook for interest rates indicated risingindicates declining interest rates across the yield curve duringin 2024. Although the remainder of 2023, followed by a decrease in short-term interest rates during 2024. The yield curve is expected to remain inverted for the remainder of 2023 and,throughout 2024, given the expected drop in short-term interest rates, in the following year, the yield curve inversion is expected to narrow in 2024, and remain inverted beyond that period.2024.
Projected Reported Results
Based on thisour current forecast assumptions, including the yield curve forecast noted above, we anticipate aproject:
•A decrease in our reported net interest income and reported net interest yield over the next 12 months compared to the 12-month period ended August 31,November 30, 2023. However,See “Market Risk—Interest Rate Risk Assessment” for an additional discussion.
Projected Non-GAAP Adjusted Results
Based on our current forecast assumptions, including the yield curve forecast noted above, we project an increaseproject:
•A decrease in our adjusted net interest income and adjusted net interest yield over the next 12 months relative to the 12-month period ended August 31, 2023. This is November 30, 2023, primarily attributable to the expected significant increase in our derivative net periodic cash settlements income, which will contribute to reducing our adjusted cost of borrowings. Additionally, we anticipate a sustained expansion of our loan portfolio, with variable-rate line of credit loans outstanding remaining at an elevated level. The anticipated improvement in our adjusted net interest yield over the next 12 months relative to the 12-month period ended August 31, 2023 is due to the current yield curve assumptions and our balance sheet position.See “Market Risk—Interest Rate Risk Assessment” for an additional discussion.
We expect thatA decrease in our adjusted net income will increaseand adjusted TIER over the next 12 months, primarily attributable to ourincreased operating expenses and a projected increasedecrease in adjusted net interest income. However, we believe that our adjusted TIER will decrease slightly over the next 12 months, primarily attributable to our projected increase in adjusted interest expense. We believe that our
•Our adjusted debt-to-equity ratio will remain elevated above our target of 6-to-1, primarily due to the projected increase in total debt outstanding to fund anticipated growth in our loan portfolio and the expectedearly retirement of discounted patronage capital as part of RTFC’s consolidation with NCSC, which we intend to complete during the fiscal year ended May 31, 2024, as discussed above.
As stated above, we are subject to earnings volatility, often significant, because we do not apply hedge accounting to our interest rate swaps. Therefore, the periodic unrealized fluctuations in the fair value of our interest rate swaps are recorded in our earnings. The variances in our earnings between periods are generally attributable to significant shifts in recorded unrealized derivative forward value gain and loss amounts. We exclude the impact of unrealized derivative forward fair value gains and losses from our non-GAAP financial measures.
We are unable to provide a reconciliation of our projected adjusted net income, adjusted TIER and adjusted debt-to-equity ratio to As the most directly comparable GAAP financial measures or directional guidance for the most directly comparable GAAP financial measures on a forward-looking basis without unreasonable effort due to the significant shifts in the unrealized derivative forward value gains and losses recorded each period. The majority of our swaps are long-term with an average remaining life of approximately 1514 years as of August 31, 2023. We can reasonably estimate the realized net periodic derivative cash settlement amounts over the next 12 months for our interest rate swaps, which are typically based on daily November 30, 2023compoundedSecured Overnight Financing Rate (“SOFR”),and the fixed rate of the swap. In contrast, the unrealized periodic derivative forward value gains and losses are largely based on future expected changes in longer-termlonger-term interest rates, which we are unable to accurately predict for each reporting period over the next 12 months. BecauseDue to the difficulty in predicting these unrealized periodic derivative forward value gain and loss amounts, we are unable to provide without unreasonable effort a key driverreconciliation of changes in our earnings between periods, this unavailable information is likelyforward-looking adjusted financial measures to have a significant impact on our reported net income, TIER and debt-to-equity ratio, which represent the most directly comparable GAAP financial measures. We provide reconciliations of our non-GAAP adjusted net income, adjusted TIER and adjusted debt-to-equity ratio to the most directly comparable GAAP financial measures for each reporting period included in this Report in the section “Non-GAAP Financial Measures.” These reconciliations illustrate the potential significant impact that unrealized derivative forward value gains and losses could have on our future reported net income, reported TIER and reported debt-to-equity ratio.
| | |
| CRITICAL ACCOUNTING ESTIMATES |
The preparation of financial statements in conformity with U.S. GAAP requires management to make a number of judgments, estimates and assumptions that affect the reported amount of assets, liabilities, income and expenses in our consolidated financial statements. Understanding our accounting policies and the extent to which we use management’s judgment and estimates in applying these policies is integral to understanding our financial statements. We provide a discussion of our significant accounting policies in “Note 1—Summary of Significant Accounting Policies” in our 2023 Form 10-K.
Certain accounting estimates are considered critical because they involve significant judgments and assumptions about highly complex and inherently uncertain matters, and the use of reasonably different estimates and assumptions could have a material impact on our results of operations or financial condition. The determination of the allowance for expected credit losses over the remaining expected life of the loans in our loan portfolio involves a significant degree of management judgment and level of estimation uncertainty. As such, we have identified our accounting policy governing the estimation of the allowance for credit losses as a critical accounting estimate. We describe our allowance methodology and process for estimating the allowance for credit losses under “Note 1—Summary of Significant Accounting Policies—Allowance for Credit Losses–Loan Portfolio—Current Methodology” in our 2023 Form 10-K.
We identify the key inputs used in determining the allowance for credit losses, discuss the assumptions that require the most significant management judgment and contribute to the estimation uncertainty and disclose the sensitivity of our allowance to hypothetical changes in the assumptions underlying the calculation of our reported allowance for credit losses under “Item 7. MD&A—Critical Accounting Estimates” in our 2023 Form 10-K. Management established policies and control procedures intended to ensure that the methodology used for determining our allowance for credit losses, including any judgments and assumptions made as part of such method, are well-controlled and applied consistently from period to period. We regularly evaluate the key inputs and assumptions used in determining the allowance for credit losses and update them, as necessary, to better reflect present conditions, including current trends in credit performance and borrower risk profile, portfolio concentration risk, changes in risk-management practices, changes in the regulatory environment and other factors relevant to our loan portfolio segments. We did not change our allowance methodology or the nature of the underlying key inputs and assumptions used in measuring our allowance for credit losses during the current quarter.
Our allowance for credit losses and allowance coverage ratio increased to $55 million and 0.17%, respectively, as of August 31, 2023, from $53 million and 0.16%, respectively, as of May 31, 2023. The $2 million increase in the allowance for credit losses reflected an increase in the collective allowance of $3 million, partially offset by a reduction in the asset-specific allowance of $1 million.
We discuss the risks and uncertainties related to management’s judgments and estimates in applying accounting policies that have been identified as critical accounting estimates under “Item 1A. Risk Factors—Regulatory and Compliance Risks” in our 2023 Form 10-K. We provide additional information on the allowance for credit losses under the section “Credit Risk—Allowance for Credit Losses” and “Note 5—Allowance for Credit Losses” in this Report.
| | |
| RECENT ACCOUNTING CHANGES AND OTHER DEVELOPMENTS |
Recent Accounting Changes
We provide information on recently adopted accounting standards and the adoption impact on CFC’s consolidated financial statements and recently issued accounting standards not yet required to be adopted and the expected adoption impact in “Note 1—Summary of Significant Accounting Policies.” To the extent we believe the adoption of new accounting standards has had or will have a material impact on our consolidated results of operations, financial condition or liquidity, we discuss the impact in the applicable section(s) of this MD&A.
| | |
| CONSOLIDATED RESULTS OF OPERATIONS |
This section provides a comparative discussion of our consolidated results of operations between the three months ended August 31, 2023Q2 FY2024 and 2022.Q2 FY2023, and between YTD FY2024 and YTD FY2023. Following this section, we provide a discussion and analysis of material changes between amounts reported on our consolidated balance sheets as of August 31,November 30, 2023 and May 31, 2023. You should read these sections together with our “Executive Summary—Outlook” where we discuss trends and other factors that we expect will affect our future results of operations.
Net Interest Income
Net interest income, which is our largest source of revenue, represents the difference between the interest income earned on our interest-earning assets and the interest expense on our interest-bearing liabilities. Our net interest yield represents the difference between the yield on our interest-earning assets and the cost of our interest-bearing liabilities plus the impact of non-interest bearing funding. We expect net interest income and our net interest yield to fluctuate based on changes in interest rates and changes in the amount and composition of our interest-earning assets and interest-bearing liabilities. We do not fund each individual loan with specific debt. Rather, we attempt to minimize costs and maximize efficiency by proportionately funding large aggregated amounts of loans.
Table 24 presents average balances for the three months ended August 31, 2023 and 2022, and for each major category of our interest-earning assets and interest-bearing liabilities, the interest income earned or interest expense incurred, and the average yield or cost. Table 24 also presents non-GAAP adjusted interest expense, adjusted net interest income and adjusted net interest yield, which reflect the inclusion of net accrued periodic derivative cash settlements expense in interest expense. We provide reconciliations of our non-GAAP financial measures to the most comparable U.S. GAAP financial measures under “Non-GAAP Financial Measures.”
Table 2:4: Average Balances, Interest Income/Interest Expense and Average Yield/Cost
| | | | | | | | | | | | | | | | | | | | | | | | | | | | | | | | | | | | | | |
| | Three Months Ended August 31, |
| | 2023 | | 2022 |
| (Dollars in thousands) | | Average Balance | | Interest Income/Expense | | Average Yield/Cost | | Average Balance | | Interest Income/Expense | | Average Yield/Cost |
| Assets: | | | | | | | | | | | | |
Long-term fixed-rate loans(1) | | $ | 28,610,870 | | | $ | 301,703 | | | 4.20 | % | | $ | 27,255,164 | | | $ | 276,303 | | | 4.02 | % |
| Long-term variable-rate loans | | 1,012,846 | | | 17,752 | | | 6.97 | | | 760,386 | | | 6,871 | | | 3.59 | |
| Line of credit loans | | 3,270,350 | | | 56,514 | | | 6.87 | | | 2,395,365 | | | 19,879 | | | 3.29 | |
| | | | | | | | | | | | |
| | | | | | | | | | | | |
Other, net(2) | | — | | | (401) | | | — | | | — | | | (373) | | | — | |
| Total loans | | 32,894,066 | | | 375,568 | | | 4.54 | | | 30,410,915 | | | 302,680 | | | 3.95 | |
| Cash and investment securities | | 644,358 | | | 5,388 | | | 3.33 | | | 782,101 | | | 4,298 | | | 2.18 | |
| Total interest-earning assets | | $ | 33,538,424 | | | $ | 380,956 | | | 4.52 | % | | $ | 31,193,016 | | | $ | 306,978 | | | 3.90 | % |
Other assets, less allowance for credit losses(3) | | 971,320 | | | | | | | 696,468 | | | | | |
Total assets(3) | | $ | 34,509,744 | | | | | | | $ | 31,889,484 | | | | | |
| | | | | | | | | | | | |
| Liabilities: | | | | | | | | | | | | |
| Commercial paper | | $ | 2,328,557 | | | $ | 31,530 | | | 5.39 | % | | $ | 2,855,770 | | | $ | 14,613 | | | 2.03 | % |
| Other short-term borrowings | | 1,885,279 | | | 23,919 | | | 5.05 | | | 2,171,205 | | | 9,596 | | | 1.75 | |
Short-term borrowings(4) | | 4,213,836 | | | 55,449 | | | 5.23 | | | 5,026,975 | | | $ | 24,209 | | | 1.91 | |
| Medium-term notes | | 7,043,395 | | | 68,142 | | | 3.85 | | | 5,868,605 | | | 35,915 | | | 2.43 | |
| Collateral trust bonds | | 7,579,428 | | | 71,949 | | | 3.78 | | | 6,914,496 | | | 61,567 | | | 3.53 | |
| Guaranteed Underwriter Program notes payable | | 6,695,394 | | | 52,530 | | | 3.12 | | | 6,085,954 | | | 41,996 | | | 2.74 | |
| Farmer Mac notes payable | | 3,345,219 | | | 34,283 | | | 4.08 | | | 3,007,523 | | | 19,375 | | | 2.56 | |
| Other notes payable | | 1,821 | | | 18 | | | 3.93 | | | 4,716 | | | 28 | | | 2.36 | |
| Subordinated deferrable debt | | 1,211,112 | | | 20,448 | | | 6.72 | | | 986,536 | | | 12,888 | | | 5.18 | |
| Subordinated certificates | | 1,222,235 | | | 13,462 | | | 4.38 | | | 1,233,856 | | | 13,490 | | | 4.34 | |
| Total interest-bearing liabilities | | $ | 31,312,440 | | | $ | 316,281 | | | 4.02 | % | | $ | 29,128,661 | | | $ | 209,468 | | | 2.85 | % |
Other liabilities(3) | | 557,475 | | | | | | | 582,764 | | | | | |
Total liabilities(3) | | 31,869,915 | | | | | | | 29,711,425 | | | | | |
Total equity(3) | | 2,639,829 | | | | | | | 2,178,059 | | | | | |
Total liabilities and equity(3) | | $ | 34,509,744 | | | | | | | $ | 31,889,484 | | | | | |
Net interest spread(5) | | | | | | 0.50 | % | | | | | | 1.05 | % |
Impact of non-interest bearing funding(6) | | | | | | 0.27 | | | | | | | 0.19 | |
Net interest income/net interest yield(7) | | | | $ | 64,675 | | | 0.77 | % | | | | $ | 97,510 | | | 1.24 | % |
| | | | | | | | | | | | |
| Adjusted net interest income/adjusted net interest yield: | | | | | | | | | | | | |
| Interest income | | | | $ | 380,956 | | | 4.52 | % | | | | $ | 306,978 | | | 3.90 | % |
| Interest expense | | | | 316,281 | | | 4.02 | | | | | 209,468 | | | 2.85 | |
Add: Net periodic derivative cash settlements interest (income) expense(8) | | | | (27,869) | | | (1.44) | | | | | 10,785 | | | 0.54 | |
Adjusted interest expense/adjusted average cost(9) | | | | $ | 288,412 | | | 3.66 | % | | | | $ | 220,253 | | | 3.00 | % |
Adjusted net interest spread(7) | | | | | | 0.86 | | | | | | | 0.90 | |
Impact of non-interest bearing funding(6) | | | | | | 0.24 | | | | | | | 0.20 | |
Adjusted net interest income/adjusted net interest yield(10) | | | | $ | 92,544 | | | 1.10 | % | | | | $ | 86,725 | | | 1.10 | % |
| | | | | | | | | | | | | | | | | | | | | | | | | | | | | | | | | | | | | | |
| | | | | | | | | | | | |
| | |
| | Q2 FY2024 | | Q2 FY2023 |
| (Dollars in thousands) | | Average Balance | | Interest Income/Expense | | Average Yield/Cost | | Average Balance | | Interest Income/Expense | | Average Yield/Cost |
| Assets: | | | | | | | | | | | | |
Long-term fixed-rate loans(1) | | $ | 29,073,023 | | | $ | 311,085 | | | 4.30 | % | | $ | 27,545,890 | | | $ | 280,767 | | | 4.09 | % |
| Long-term variable-rate loans | | 900,860 | | | 16,069 | | | 7.17 | | | 823,877 | | | 9,446 | | | 4.60 | |
| Line of credit loans | | 3,159,822 | | | 55,277 | | | 7.04 | | | 2,601,805 | | | 29,001 | | | 4.47 | |
| | | | | | | | | | | | |
| | | | | | | | | | | | |
Other, net(2) | | — | | | (421) | | | — | | | — | | | (377) | | | — | |
| Total loans | | 33,133,705 | | | 382,010 | | | 4.64 | | | 30,971,572 | | | 318,837 | | | 4.13 | |
| Cash, time deposits and investment securities | | 737,768 | | | 6,977 | | | 3.80 | | | 794,794 | | | 5,357 | | | 2.70 | |
| Total interest-earning assets | | $ | 33,871,473 | | | $ | 388,987 | | | 4.62 | % | | $ | 31,766,366 | | | $ | 324,194 | | | 4.09 | % |
Other assets, less allowance for credit losses(3) | | 1,183,985 | | | | | | | 1,080,049 | | | | | |
Total assets(3) | | $ | 35,055,458 | | | | | | | $ | 32,846,415 | | | | | |
| | | | | | | | | | | | |
| Liabilities: | | | | | | | | | | | | |
| Commercial paper | | $ | 2,195,063 | | | $ | 30,045 | | | 5.51 | % | | $ | 2,901,962 | | | $ | 24,179 | | | 3.34 | % |
| Other short-term borrowings | | 1,938,120 | | | 25,455 | | | 5.28 | | | 2,262,768 | | | 17,007 | | | 3.01 | |
Short-term borrowings(4) | | 4,133,183 | | | 55,500 | | | 5.40 | | | 5,164,730 | | | 41,186 | | | 3.20 | |
| Medium-term notes | | 7,107,642 | | | 69,729 | | | 3.95 | | | 5,689,824 | | | 41,506 | | | 2.93 | |
| Collateral trust bonds | | 7,511,666 | | | 71,401 | | | 3.82 | | | 7,366,514 | | | 66,995 | | | 3.65 | |
| Guaranteed Underwriter Program notes payable | | 6,841,030 | | | 54,370 | | | 3.20 | | | 6,247,517 | | | 44,634 | | | 2.87 | |
| Farmer Mac notes payable | | 3,667,605 | | | 39,479 | | | 4.33 | | | 3,028,920 | | | 24,757 | | | 3.28 | |
| Other notes payable | | 2,460 | | | 26 | | | 4.25 | | | 4,748 | | | 29 | | | 2.45 | |
| Subordinated deferrable debt | | 1,184,215 | | | 19,972 | | | 6.78 | | | 986,590 | | | 12,887 | | | 5.24 | |
| Subordinated certificates | | 1,216,459 | | | 13,368 | | | 4.42 | | | 1,237,156 | | | 13,450 | | | 4.36 | |
| Total interest-bearing liabilities | | $ | 31,664,260 | | | $ | 323,845 | | | 4.11 | % | | $ | 29,725,999 | | | $ | 245,444 | | | 3.31 | % |
Other liabilities(3) | | 569,541 | | | | | | | 794,873 | | | | | |
Total liabilities(3) | | 32,233,801 | | | | | | | 30,520,872 | | | | | |
Total equity(3) | | 2,821,657 | | | | | | | 2,325,543 | | | | | |
Total liabilities and equity(3) | | $ | 35,055,458 | | | | | | | $ | 32,846,415 | | | | | |
Net interest spread(5) | | | | | | 0.51 | % | | | | | | 0.78 | % |
Impact of non-interest bearing funding(6) | | | | | | 0.26 | | | | | | | 0.21 | |
Net interest income/net interest yield(7) | | | | $ | 65,142 | | | 0.77 | % | | | | $ | 78,750 | | | 0.99 | % |
| | | | | | | | | | | | |
| Adjusted net interest income/adjusted net interest yield: | | | | | | | | | | | | |
| Interest income | | | | $ | 388,987 | | | 4.62 | % | | | | $ | 324,194 | | | 4.09 | % |
| Interest expense | | | | 323,845 | | | 4.11 | | | | | 245,444 | | | 3.31 | |
Add: Net periodic derivative cash settlements interest income(8) | | | | (28,767) | | | (1.49) | | | | | (4,801) | | | (0.25) | |
Adjusted interest expense/adjusted average cost(9) | | | | $ | 295,078 | | | 3.75 | % | | | | $ | 240,643 | | | 3.25 | % |
Adjusted net interest spread(7) | | | | | | 0.87 | | | | | | | 0.84 | |
Impact of non-interest bearing funding(6) | | | | | | 0.25 | | | | | | | 0.21 | |
Adjusted net interest income/adjusted net interest yield(10) | | | | $ | 93,909 | | | 1.12 | % | | | | $ | 83,551 | | | 1.05 | % |
| | | | | | | | | | | | |
| | | | | | | | | | | | | | | | | | | | | | | | | | | | | | | | | | | | | | |
| | |
| | YTD FY2024 | | YTD FY2023 |
| (Dollars in thousands) | | Average Balance | | Interest Income/Expense | | Average Yield/Cost | | Average Balance | | Interest Income/Expense | | Average Yield/Cost |
| Assets: | | | | | | | | | | | | |
Long-term fixed-rate loans(1) | | $ | 28,840,684 | | | $ | 612,788 | | | 4.25 | % | | $ | 27,399,733 | | | $ | 557,070 | | | 4.06 | % |
| Long-term variable-rate loans | | 957,159 | | | 33,821 | | | 7.07 | | | 791,958 | | | 16,317 | | | 4.11 | |
| Line of credit loans | | 3,215,388 | | | 111,791 | | | 6.95 | | | 2,498,021 | | | 48,880 | | | 3.90 | |
| | | | | | | | | | | | |
| | | | | | | | | | | | |
Other, net(2) | | — | | | (822) | | | — | | | — | | | (750) | | | — | |
| Total loans | | 33,013,231 | | | 757,578 | | | 4.59 | | | 30,689,712 | | | 621,517 | | | 4.04 | |
| Cash, time deposits and investment securities | | 690,808 | | | 12,365 | | | 3.58 | | | 788,413 | | | 9,655 | | | 2.44 | |
| Total interest-earning assets | | $ | 33,704,039 | | | $ | 769,943 | | | 4.57 | % | | $ | 31,478,125 | | | $ | 631,172 | | | 4.00 | % |
Other assets, less allowance for credit losses(3) | | 1,077,071 | | | | | | | 887,210 | | | | | |
Total assets(3) | | $ | 34,781,110 | | | | | | | $ | 32,365,335 | | | | | |
| | | | | | | | | | | | |
| Liabilities: | | | | | | | | | | | | |
| Commercial paper | | $ | 2,262,175 | | | $ | 61,575 | | | 5.44 | % | | $ | 2,878,740 | | | $ | 38,792 | | | 2.69 | % |
| Other short-term borrowings | | 1,911,555 | | | 49,374 | | | 5.17 | | | 2,216,736 | | | 26,603 | | | 2.39 | |
Short-term borrowings(4) | | 4,173,730 | | | 110,949 | | | 5.32 | | | 5,095,476 | | | $ | 65,395 | | | 2.56 | |
| Medium-term notes | | 7,075,343 | | | 137,871 | | | 3.90 | | | 5,779,703 | | | 77,421 | | | 2.67 | |
| Collateral trust bonds | | 7,545,732 | | | 143,350 | | | 3.80 | | | 7,139,270 | | | 128,562 | | | 3.59 | |
| Guaranteed Underwriter Program notes payable | | 6,767,814 | | | 106,900 | | | 3.16 | | | 6,166,294 | | | 86,630 | | | 2.80 | |
| Farmer Mac notes payable | | 3,505,531 | | | 73,762 | | | 4.21 | | | 3,018,163 | | | 44,132 | | | 2.92 | |
| Other notes payable | | 2,139 | | | 44 | | | 4.11 | | | 4,732 | | | 57 | | | 2.40 | |
| Subordinated deferrable debt | | 1,197,737 | | | 40,420 | | | 6.75 | | | 986,563 | | | 25,775 | | | 5.21 | |
| Subordinated certificates | | 1,219,363 | | | 26,830 | | | 4.40 | | | 1,235,497 | | | 26,940 | | | 4.35 | |
| Total interest-bearing liabilities | | $ | 31,487,389 | | | $ | 640,126 | | | 4.07 | % | | $ | 29,425,698 | | | $ | 454,912 | | | 3.08 | % |
Other liabilities(3) | | 563,475 | | | | | | | 688,239 | | | | | |
Total liabilities(3) | | 32,050,864 | | | | | | | 30,113,937 | | | | | |
Total equity(3) | | 2,730,246 | | | | | | | 2,251,398 | | | | | |
Total liabilities and equity(3) | | $ | 34,781,110 | | | | | | | $ | 32,365,335 | | | | | |
Net interest spread(5) | | | | | | 0.50 | % | | | | | | 0.92 | % |
Impact of non-interest bearing funding(6) | | | | | | 0.27 | | | | | | | 0.20 | |
Net interest income/net interest yield(7) | | | | $ | 129,817 | | | 0.77 | % | | | | $ | 176,260 | | | 1.12 | % |
| | | | | | | | | | | | |
| Adjusted net interest income/adjusted net interest yield: | | | | | | | | | | | | |
| Interest income | | | | $ | 769,943 | | | 4.57 | % | | | | $ | 631,172 | | | 4.00 | % |
| Interest expense | | | | 640,126 | | | 4.07 | | | | | 454,912 | | | 3.08 | |
Add: Net periodic derivative cash settlements interest (income) expense(8) | | | | (56,636) | | | (1.47) | | | | | 5,984 | | | 0.15 | |
Adjusted interest expense/adjusted average cost(9) | | | | $ | 583,490 | | | 3.71 | % | | | | $ | 460,896 | | | 3.12 | % |
Adjusted net interest spread(7) | | | | | | 0.86 | | | | | | | 0.88 | |
Impact of non-interest bearing funding(6) | | | | | | 0.25 | | | | | | | 0.20 | |
Adjusted net interest income/adjusted net interest yield(10) | | | | $ | 186,453 | | | 1.11 | % | | | | $ | 170,276 | | | 1.08 | % |
___________________________
(1)Interest income on long-term, fixed-rate loans includes loan conversion fees, which are generally deferred and recognized as interest income using the effective interest method.
(2)Consists of late payment fees and net amortization of deferred loan fees and loan origination costs.
(3)The average balance represents average monthly balances, which is calculated based on the month-end balance as of the beginning of the reporting period and the balances as of the end of each month included in the specified reporting period.
(4)Short-term borrowings reported on our consolidated balance sheets consist of borrowings with an original contractual maturity of one year or less. However, short-term borrowings presented in Table 2 consist of commercial paper, select notes, daily liquidity fund notes and secured borrowings under repurchase agreements. Short-term borrowings presented on our consolidated balance sheets related to medium-term notes, Farmer Mac notes payable and other notes payable are reported in the respective category for presentation purposes in Table 2.4. The period-end amounts reported as short-term borrowings on our consolidated balances sheets, which are excluded from the calculation of average short-term borrowings presented in Table 2,4, totaled $910$907 million and $410$398 million as of August 31,November 30, 2023 and 2022, respectively.
(5)Net interest spread represents the difference between the average yield on total average interest-earning assets and the average cost of total average interest-bearing liabilities. Adjusted net interest spread represents the difference between the average yield on total average interest-earning assets and the adjusted average cost of total average interest-bearing liabilities.
(6)Includes other liabilities and equity.
(7)Net interest yield is calculated based on annualized net interest income for the period divided by total average interest-earning assets for the period.
(8)Represents the impact of net periodic contractual interest amounts on our interest rate swaps during the period. This amount is added to interest expense to derive non-GAAP adjusted interest expense. The average (benefit)/cost associated with derivatives is calculated based on the annualized net periodic swap settlement interest amount during the period divided by the average outstanding notional amount of derivatives during the period. The average outstanding notional amount of interest rate swaps was $7,714$7,743 million and $7,973$7,753 million for Q2 FY2024 and Q2 FY2023, respectively. The average outstanding notional amount of interest rate swaps was $7,729 million and $7,864 million for the three months ended August 31, 2023YTD FY2024 and 2022,YTD FY2023, respectively.
(9)Adjusted interest expense consists of interest expense plus net periodic derivative cash settlements interest income (expense) during the period. Net periodic derivative cash settlements interest income (expense) is reported on our consolidated statements of operations as a component of derivative gains (losses). Adjusted average cost is calculated based on annualized adjusted interest expense for the period divided by total average interest-bearing liabilities during the period.
(10)Adjusted net interest yield is calculated based on annualized adjusted net interest income for the period divided by total average interest-earning assets for the period.
Table 35 displays the change in net interest income between periods and the extent to which the variance for each category of interest-earning assets and interest-bearing liabilities is attributable to: (i) changes in volume, which represents the change in the average balances of our interest-earning assets and interest-bearing liabilities or volume and (ii) changes in the rate, which represents the change in the average interest rates of these assets and liabilities. The table also presents the change in adjusted net interest income between periods.
Table 3:5: Rate/Volume Analysis of Changes in Interest Income/Interest Expense
| | | | | | | | | | | | | | | | | | | | | | | | | | |
| | | | Three Months Ended August 31, |
| | | | 2023 versus 2022 |
| | | | | | | Total | | Variance Due To:(1) |
| (Dollars in thousands) | | | | | | | | Variance | | Volume | | Rate |
| Interest income: | | | | | | | | | | | | |
| Long-term fixed-rate loans | | | | | | | | $ | 25,400 | | | $ | 12,951 | | | $ | 12,449 | |
| Long-term variable-rate loans | | | | | | | | 10,881 | | | 2,256 | | | 8,625 | |
| Line of credit loans | | | | | | | | 36,635 | | | 7,187 | | | 29,448 | |
| | | | | | | | | | | | |
| | | | | | | | | | | | |
| Other, net | | | | | | | | (28) | | | — | | | (28) | |
| Total loans | | | | | | | | 72,888 | | | 22,394 | | | 50,494 | |
| Cash and investment securities | | | | | | | | 1,090 | | | (767) | | | 1,857 | |
| Total interest income | | | | | | | | 73,978 | | | 21,627 | | | 52,351 | |
| | | | | | | | | | | | |
| Interest expense: | | | | | | | | | | | | |
| Commercial paper | | | | | | | | 16,917 | | | (2,730) | | | 19,647 | |
| Other short-term borrowings | | | | | | | | 14,323 | | | (1,286) | | | 15,609 | |
| Short-term borrowings | | | | | | | | 31,240 | | | (4,016) | | | 35,256 | |
| Medium-term notes | | | | | | | | 32,227 | | | 7,072 | | | 25,155 | |
| Collateral trust bonds | | | | | | | | 10,382 | | | 5,736 | | | 4,646 | |
| Guaranteed Underwriter Program notes payable | | | | | | | | 10,534 | | | 4,079 | | | 6,455 | |
| Farmer Mac notes payable | | | | | | | | 14,908 | | | 2,117 | | | 12,791 | |
| Other notes payable | | | | | | | | (10) | | | (17) | | | 7 | |
| Subordinated deferrable debt | | | | | | | | 7,560 | | | 2,891 | | | 4,669 | |
| Subordinated certificates | | | | | | | | (28) | | | (164) | | | 136 | |
| Total interest expense | | | | | | | | 106,813 | | | 17,698 | | | 89,115 | |
| Net interest income | | | | | | | | $ | (32,835) | | | $ | 3,929 | | | $ | (36,764) | |
| | | | | | | | | | | | |
| Adjusted net interest income: | | | | | | | | | | | | |
| Interest income | | | | | | | | $ | 73,978 | | | $ | 21,627 | | | $ | 52,351 | |
| Interest expense | | | | | | | | 106,813 | | | 17,698 | | | 89,115 | |
Net periodic derivative cash settlements interest expense(2) | | | | | | | | (38,654) | | | (378) | | | (38,276) | |
Adjusted interest expense(3) | | | | | | | | 68,159 | | | 17,320 | | | 50,839 | |
| Adjusted net interest income | | | | | | | | $ | 5,819 | | | $ | 4,307 | | | $ | 1,512 | |
| | | | | | | | | | | | | | | | | | | | | | | | | | | | | | | | | | | | | | |
| | | | |
| | Q2 FY2024 | | versus | | Q2 FY2023 | | YTD FY2024 | | versus | | YTD FY2023 |
| | | Total | | Variance Due To:(1) | | Total | | Variance Due To:(1) |
| (Dollars in thousands) | | Variance | | Volume | | Rate | | Variance | | Volume | | Rate |
| Interest income: | | | | | | | | | | | | |
| Long-term fixed-rate loans | | $ | 30,318 | | | $ | 14,756 | | | $ | 15,562 | | | $ | 55,718 | | | $ | 27,694 | | | $ | 28,024 | |
| Long-term variable-rate loans | | 6,623 | | | 854 | | | 5,769 | | | 17,504 | | | 3,350 | | | 14,154 | |
| Line of credit loans | | 26,276 | | | 6,124 | | | 20,152 | | | 62,911 | | | 13,865 | | | 49,046 | |
| | | | | | | | | | | | |
| | | | | | | | | | | | |
| Other, net | | (44) | | | — | | | (44) | | | (72) | | | — | | | (72) | |
| Total loans | | 63,173 | | | 21,734 | | | 41,439 | | | 136,061 | | | 44,909 | | | 91,152 | |
| Cash, time deposits and investment securities | | 1,620 | | | (398) | | | 2,018 | | | 2,710 | | | (1,218) | | | 3,928 | |
| Total interest income | | 64,793 | | | 21,336 | | | 43,457 | | | 138,771 | | | 43,691 | | | 95,080 | |
| | | | | | | | | | | | |
| Interest expense: | | | | | | | | | | | | |
| Commercial paper | | 5,866 | | | (5,940) | | | 11,806 | | | 22,783 | | | (8,392) | | | 31,175 | |
| Other short-term borrowings | | 8,448 | | | (2,480) | | | 10,928 | | | 22,771 | | | (3,725) | | | 26,496 | |
| Short-term borrowings | | 14,314 | | | (8,420) | | | 22,734 | | | 45,554 | | | (12,117) | | | 57,671 | |
| Medium-term notes | | 28,223 | | | 10,201 | | | 18,022 | | | 60,450 | | | 17,097 | | | 43,353 | |
| Collateral trust bonds | | 4,406 | | | 1,133 | | | 3,273 | | | 14,788 | | | 6,948 | | | 7,840 | |
| Guaranteed Underwriter Program notes payable | | 9,736 | | | 4,107 | | | 5,629 | | | 20,270 | | | 8,191 | | | 12,079 | |
| Farmer Mac notes payable | | 14,722 | | | 5,138 | | | 9,584 | | | 29,630 | | | 6,986 | | | 22,644 | |
| Other notes payable | | (3) | | | (14) | | | 11 | | | (13) | | | (31) | | | 18 | |
| Subordinated deferrable debt | | 7,085 | | | 2,539 | | | 4,546 | | | 14,645 | | | 5,432 | | | 9,213 | |
| Subordinated certificates | | (82) | | | (261) | | | 179 | | | (110) | | | (424) | | | 314 | |
| Total interest expense | | 78,401 | | | 14,423 | | | 63,978 | | | 185,214 | | | 32,082 | | | 153,132 | |
| Net interest income (expense) | | $ | (13,608) | | | $ | 6,913 | | | $ | (20,521) | | | $ | (46,443) | | | $ | 11,609 | | | $ | (58,052) | |
| | | | | | | | | | | | |
| Adjusted net interest income: | | | | | | | | | | | | |
| Interest income | | $ | 64,793 | | | $ | 21,336 | | | $ | 43,457 | | | $ | 138,771 | | | $ | 43,691 | | | $ | 95,080 | |
| Interest expense | | 78,401 | | | 14,423 | | | 63,978 | | | 185,214 | | | 32,082 | | | 153,132 | |
Net periodic derivative cash settlements interest expense (income)(2) | | (23,966) | | | 20 | | | (23,986) | | | (62,620) | | | (119) | | | (62,501) | |
Adjusted interest expense(3) | | 54,435 | | | 14,443 | | | 39,992 | | | 122,594 | | | 31,963 | | | 90,631 | |
| Adjusted net interest income | | $ | 10,358 | | | $ | 6,893 | | | $ | 3,465 | | | $ | 16,177 | | | $ | 11,728 | | | $ | 4,449 | |
____________________________
(1)The changes for each category of interest income and interest expense represent changes in either average balances (volume) or average rates for both interest-earning assets and interest-bearing liabilities. We allocate the amount attributable to the combined impact of volume and rate to the rate variance.
(2)For the net periodic derivative cash settlements interest amount, the variance due to average volume represents the change in the net periodic derivative cash settlements interest expense amount resulting from the change in the average notional amount of derivative contracts outstanding. The variance due to average rate represents the change in the net periodic derivative cash settlements amount resulting from the net difference between the average rate paid and the average rate received for interest rate swaps during the period.
(3)See “Non-GAAP Financial Measures” for additional information on our adjusted non-GAAP financial measures.
Reported Net Interest Income
Reported net interest income of $65 million for the current quarterQ2 FY2024 decreased $33$14 million, or 34%17%, from the same prior-year quarter,Q2 FY2023, driven by a decrease in the net interest yield of 4722 basis points, or 38%22%, to 0.77%, partially offset by an increase in average interest-earning assets of $2,345$2,105 million, or 8%7%.
•Average Interest-Earning Assets: The increase in average interest-earning assets of 8%7% was attributable to growth in average total loans of $2,483$2,162 million, or 8%7%, driven primarily by an increase in average long-term fixed-rate loans of
$1,356 $1,527 million and an increase in average line of credit loans of $875$558 million, as members continued to advance loans to fund capital expenditures and for working capital purposes.
•Net Interest Yield: The decrease in the net interest yield of 4722 basis points, or 38%22%, was primarily attributable to the combined impact of an increase in our average cost of borrowings of 11780 basis points to 4.02%4.11%, which was partially offset by an increase in the average yield on interest-earning assets of 6253 basis points to 4.52%4.62% and an increase in the benefit from non-interest bearing funding of 85 basis points to 0.27%0.26%. Our average yield on interest-earning assets and average cost of borrowings rose mainly due to the sustained increase in the federal funds rate, which increased 300150 basis points since August 31,November 30, 2022. The increase in average yields on line of credit and variable-rate loans was the primary driver for the increase in the average yield on interest-earning assets. Meanwhile, our average cost of borrowings increased due to higher interest rates on our short-term and variable-rate borrowings.
Reported net interest income of $130 million for YTD FY2024 decreased $46 million, or 26%, from YTD FY2023, driven by a decrease in the net interest yield of 35 basis points, or 31%, to 0.77%, partially offset by an increase in average interest-earning assets of $2,226 million, or 7%.
• Average Interest-Earning Assets: The increase in average interest-earning assets of 7% was attributable to growth in average total loans of $2,324 million, or 8%, driven primarily by an increase in average long-term fixed-rate loans of $1,441 million and an increase in average line of credit loans of $717 million, as members continued to advance loans to fund capital expenditures and for working capital purposes.
• Net Interest Yield: The decrease in the net interest yield of 35 basis points, or 31%, was primarily attributable to the combined impact of an increase in our average cost of borrowings of 99 basis points to 4.07%, which was partially offset by an increase in the average yield on interest-earning assets of 57 basis points to 4.57% and an increase in the benefit from non-interest bearing funding of 7 basis points to 0.27%. As mentioned above, the increases in the average cost of borrowings and average yield on interest-earning assets were driven by the continued increase in the federal funds rate.
Adjusted Net Interest Income
Adjusted net interest income of $93$94 million for the current quarterQ2 FY2024 increased $6$10 million, or 7%12%, from the same prior-year quarterQ2 FY2023, driven by the combined impact of an increase in average interest-earning assets of $2,345$2,105 million, or 8%7%, and an increase in the adjusted net interest yield of 7 basis points, or 7%, to 1.12%.
•Average Interest-Earning Assets: The increase in average interest-earning assets of 8%7% during the current quarterQ2 FY2024 was driven by the growth in average total loans of $2,483$2,162 million, or 8%7%, attributable primarily to the increases in average long-term fixed-rate and line of credit loans as discussed above.
•Adjusted Net Interest Yield: The adjusted net interest yield remained unchanged at 1.10%increased to 1.12%, reflecting the combined impact of an increase in the average yield on interest-earning assets of 6253 basis points to 4.52%4.62% and an increase in the benefit from non-interest bearing funding of 4 basis points to 0.24%0.25%, partially offset by an increase in our adjusted average cost of borrowings of 6650 basis points to 3.66%3.75%, The increaseincreases in both average yield on interest-earning assets and adjusted average cost of borrowings waswere attributable to the continued high interest-rate environment since August 31,November 30, 2022, as discussed above.
Adjusted net interest income of $186 million for YTD FY2024 increased $16 million, or 10%, from YTD FY2023, driven by the combined impact of an increase in average interest-earning assets of $2,226 million, or 7%, and an increase in the adjusted net interest yield of 3 basis points, or 3%, to 1.11%.
•Average Interest-Earning Assets: The increase in average interest-earning assets of 7% during YTD FY2024 was driven by the growth in average total loans of $2,324 million, or 8%, attributable primarily to increases in average long-term fixed-rate and line of credit loans as discussed above.
•Adjusted Net Interest Yield: The increase in the adjusted net interest yield of 3 basis points, or 3%, reflected the combined impact of an increase in the average yield on interest-earning assets of 57 basis points to 4.57% and an increase in the benefit from non-interest bearing funding of 5 basis points to 0.25%, partially offset by an increase in our adjusted average cost of borrowings of 59 basis points to 3.71%. We discuss above the primary drivers for the increases in the
average yield on interest-earning assets and adjusted average cost of borrowings.
Derivative Cash Settlements
We include the net periodic derivative cash settlements interest income (expense) amounts on our interest rate swaps in the calculation of our adjusted average cost of borrowings, which, as a result, also impacts the calculation of adjusted net interest income and adjusted net interest yield. We recorded net periodic derivative cash settlements interest income of $28$29 million for the current quarter,Q2 FY2024, compared with $5 million for Q2 FY2023. We recorded net periodic derivative cash settlements interest income of $57 million for YTD FY2024, compared with derivative cash settlements interest expense of $11$6 million for the same prior-year quarter.YTD FY2023.
Following the cessation of LIBOR on June 30, 2023, daily compounded SOFR replaced LIBOR as the floating-rate index for our interest rate swaps. Because our derivative portfolio consists of a higher proportion of pay-fixed swaps than receive-fixed swaps, the net periodic derivative cash settlements interest income (expense) amounts generally change based on changes in the floating interest amount received each period. When floating rates increase during the period, the floating interest amounts received on our pay-fixed swaps increase and, conversely, when floating rates decrease, the floating interest amounts received on our pay-fixed swaps decrease. The higher floating rates during the current quarterQ2 FY2024 and YTD FY2024 contributed to the derivative cash settlements interest income for the period.periods. In comparison, the lower floating rates during the same prior-year quarterQ2 FY2023 and YTD FY2023 contributed to the lower derivative cash settlements income for Q2 FY2023 and derivative cash settlements interest expense for the period.YTD FY2023.
See “Non-GAAP Financial Measures” for additional information on our non-GAAP financial measures, including a reconciliation of these measures to the most comparable U.S. GAAP financial measures.
Provision for Credit Losses
Our provision for credit losses each period is driven by changes in our measurement of lifetime expected credit losses for our loan portfolio recorded in the allowance for credit losses. Our allowance for credit losses and allowance coverage ratio was $55$56 million and 0.17%, respectively, as of August 31,November 30, 2023. In comparison, our allowance for credit losses and allowance coverage ratio was $53 million and 0.16%, respectively, as of May 31, 2023.
We recorded a provision for credit losses of $1 million for Q2 FY2024, resulted primarily from an increase in the current quarter.collective allowance due to loan portfolio growth. In contrast,comparison, we recorded a provision for credit losses of $3$12 million for Q2 FY2023, primarily driven by an increase in the same prior-year quarter. The asset-specific allowance for a nonperforming CFC power supply loan, attributable to a decrease in the expected payments on this loan.
current quarter
We recorded a provision for credit losses of $1 million for YTD FY2024, compared to a provision for credit losses of $15 million for YTD FY2023. The provision for credit losses for YTD FY2024 resulted from an increase of $34 million in the collective allowance, partially offset by a decrease of $1 million in the asset-specific allowance for a nonperforming CFC power supply loan and a recovery of $1$1 million attributable to additional loan payments received from Brazos Electric Power Cooperative, Inc. (“Brazos”) and its wholly-owned subsidiary Brazos Sandy Creek during the current quarter.Electric Cooperative Inc. (“Brazos Sandy Creek”). The increase of $3$4 millionin the collective allowance was primarily due to loan portfolio growth and a slight decline in the overall credit quality and risk profile of our loan portfolio.
The provision for credit losses of $3 million for the same prior-year quarterYTD FY2023 was driven primarily attributable to an increase in the collective allowance due to loan portfolio growth andby an increase in the asset-specific allowance for the Brazos Sandy Creek nonperforming loan as a result of the terms of a settlement of Brazos Sandy Creek’s rejection damages claim against Brazos approved by the bankruptcy court.discussed above.
We discuss our methodology for estimating the allowance for credit losses in “Note 1—Summary of Significant Accounting Policies—Allowance for Credit Losses—Current Methodology” in our 2023 Form 10-K. We also provide additional
information on our allowance for credit losses below under section “Credit Risk—Allowance for Credit Losses” and “Note 5—Allowance for Credit Losses” in this Report.
Non-Interest Income
Non-interest income consists of fee and other income, gains and losses on derivatives not accounted for in hedge accounting relationships and gains and losses on equity and debt investment securities, which consists of both unrealized and realized gains and losses.
Table 46 presents the components of non-interest income (loss) recorded in our consolidated statements of operations for the three months ended August 31, 2023 and 2022.operations.
Table 4:6: Non-Interest Income
| | | | | | | | | | | | | | | | | | |
| | | | | Three Months Ended August 31, |
| (Dollars in thousands) | | | | | | 2023 | | 2022 |
| Non-interest income components: | | | | | | | | |
| Fee and other income | | | | | | $ | 4,537 | | | $ | 4,056 | |
| Derivative gains | | | | | | 189,887 | | | 93,587 | |
| Investment securities gains (losses) | | | | | | 2,933 | | | (3,679) | |
| Total non-interest income | | | | | | $ | 197,357 | | | $ | 93,964 | |
| | | | | | | | | | | | | | | | | | | | | | | | | | |
| | | | |
| (Dollars in thousands) | | Q2 FY2024 | | Q2 FY2023 | | YTD FY2024 | | YTD FY2023 |
| Non-interest income components: | | | | | | | | |
| Fee and other income | | $ | 6,611 | | | $ | 4,166 | | | $ | 11,148 | | | $ | 8,222 | |
| Derivative gains | | 106,938 | | | 146,790 | | | 296,825 | | | 240,377 | |
| Investment securities gains (losses) | | 1,843 | | | (493) | | | 4,776 | | | (4,172) | |
| Total non-interest income | | $ | 115,392 | | | $ | 150,463 | | | $ | 312,749 | | | $ | 244,427 | |
The variance in non-interest income between the current quarter and the same prior-year quarter was primarily attributable to changes in the derivative gains recognized in our consolidated statements of operations. In addition, we experienced a favorable shift from losses to gains recorded on our debt and equity investment securities of $2 million and $79 million for the current quarterQ2 FY2024 and YTD FY2024, respectively, compared with the same prior-year quarter.Q2 FY2023 and YTD FY2023. We expect period-to-period market fluctuations in the fair value of our equity and debt investment securities, which we report together with realized gains and losses from the sale of investment securities on our consolidated statements of operations.
Derivative Gains (Losses)
Our derivative instruments are an integral part of our interest rate risk management strategy. Our principal purpose in using derivatives is to manage our aggregate interest rate risk profile within prescribed risk parameters. The derivative instruments we use primarily include interest rate swaps, which we typically hold to maturity. In addition, we may use Treasury locks to manage the interest rate risk associated with future debt issuance or debt that is scheduled to reprice in the future. The primary factors affecting the fair value of our derivatives and derivative gains (losses) recorded in our results of operations include changes in interest rates, the shape of the swap curve and the composition of our derivative portfolio. We generally do not designate our interest rate swaps, which currently account for all our derivatives, for hedge accounting. Accordingly, changes in the fair value of interest rate swaps are reported in our consolidated statements of operations under derivative gains (losses). However, if we execute a Treasury lock, we typically designate the Treasury lock as a cash flow hedge.
We currently use two types of interest rate swap agreements: (i) we pay a fixed rate of interest and receive a variable rate of interest (“pay-fixed swaps”), and (ii) we pay a variable rate of interest and receive a fixed rate of interest (“receive-fixed swaps”). The interest amounts are based on a specified notional balance, which is used for calculation purposes only. The benchmark variable rate for the substantial majority of the floating-rate payments under our swap agreements is daily compounded SOFR as of August 31, 2023. AsNovember 30, 2023. As interest rates decline, pay-fixed swaps generally decrease in value and result in the recognition of derivative losses, as the amount of interest we pay remains fixed, while the amount of interest we receive declines. In contrast, as interest rates rise, pay-fixed swaps generally increase in value and result in the recognition of derivative gains, as the amount of interest we pay remains fixed, but the amount we receive increases. With a receive-fixed swap, the opposite results occur as interest rates decline or rise. Our derivative portfolio consists of a higher proportion of pay-fixed swaps than receive-fixed swaps; therefore, we generally record derivative losses when interest rates decline and derivative gains when interest rates rise. Because our pay-fixed and receive-fixed swaps are referenced to different maturity terms along the swap curve, different changes in the swap curve—parallel, flattening, inversion or steepening—will also impact the fair value of our derivatives.
On November 3, 2023, we executed two Treasury lock agreements with an aggregate notional amount of $300 million to hedge interest rate risk by locking in the underlying U.S. Treasury interest rate component of interest rate payments on anticipated debt issuances. The Treasury locks were designated and qualified as cash flow hedges. On November 7, 2023, we terminated the Treasury locks upon the pricing of the $300 million of notes payable under our Farmer Mac revolving note purchase agreement and recorded a net settlement gain of less than $1 million in AOCI, which will be reclassified into interest expense over the term of the related Farmer Mac borrowings. We did not have any derivatives designated as accounting hedges as of November 30, 2023 and May 31, 2023.
Table 57 presents the components of net derivative gains (losses) recorded in our consolidated statements of operations for the three months ended August 31, 2023 and 2022.operations. Derivative cash settlements interest income (expense) represents the net periodic contractual interest amount for our interest-rate swaps during the reporting period. Derivative forward value gains (losses) represent the change in fair value of our interest rate swaps during the applicable reporting period due to changes in expected future interest rates over the remaining life of our derivative contracts.
Table 5:7: Derivative Gains (Losses)
| | | | | | | | | | | | | | | | | | |
| | | | Three Months Ended August 31, |
| (Dollars in thousands) | | | | | | 2023 | | 2022 |
| Derivative gains attributable to: | | | | | | | | |
| Derivative cash settlements interest income (expense) | | | | | | $ | 27,869 | | | $ | (10,785) | |
| Derivative forward value gains | | | | | | 162,018 | | | 104,372 | |
| Derivative gains | | | | | | $ | 189,887 | | | $ | 93,587 | |
| | | | | | | | | | | | | | | | | | | | | | | | | | |
| | | | |
| (Dollars in thousands) | | Q2 FY2024 | | Q2 FY2023 | | YTD FY2024 | | YTD FY2023 |
| Derivative gains attributable to: | | | | | | | | |
| Derivative cash settlements interest income (expense) | | $ | 28,767 | | | $ | 4,801 | | | $ | 56,636 | | | $ | (5,984) | |
| Derivative forward value gains | | 78,171 | | | 141,989 | | | 240,189 | | | 246,361 | |
| Derivative gains | | $ | 106,938 | | | $ | 146,790 | | | $ | 296,825 | | | $ | 240,377 | |
We recorded derivative gains of $190$107 million for Q2 FY2024, attributable to increases in the longer-term swap interest rates. In comparison, we recorded derivative gains of $147 million for current quarter,Q2 FY2023, attributable to more pronounced increases in interest rates across the entire swap curve during the period.
We recorded derivative gains of $297 million for YTD FY2024, attributable to increases in the medium- and longer-term swap interest rates. In comparison, we recorded derivative gains of $94$240 million for the same prior-year quarter,YTD FY2023, attributable to increases in interest rates across the entire swap curve during the period.
Our derivatives portfolio consisted of interest rate swaps with a total notional amount of $7,622$7,621 million and $7,816 million as of August 31,November 30, 2023 and May 31, 2023, respectively. As discussed above, our derivative portfolio consists of a higher proportion of longer-dated pay-fixed swaps than receive-fixed swaps, with pay-fixed swaps accounting for approximately 79% and 78% of the outstanding notional amount of our derivative portfolio as of August 31,both November 30, 2023 and May 31, 2023, respectively.2023. Therefore, increases and decreases in medium- and longer-term swap rates generally have a more pronounced corresponding impact on the change in the net fair value of our swap portfolio. The average remaining maturity of our pay-fixed and receive-fixed swaps was 18 years and two years, respectively, as of August 31,November 30, 2023 and 19 years and three years, respectively, as of August 31,November 30, 2022.
We present comparative swap curves, which depict the relationship between swap rates at varying maturities, for our reported periods in Table 68 below.
Comparative Swap Curves
Table 68 below provides comparative swap curves as of November 30, 2023, August 31, 2023, May 31, 2023, August 31,November 30, 2022 and May 31, 2022.
Table 6:8: Comparative Swap Curves
____________________________
Benchmark rates obtained from Bloomberg.
See “Note 9—Derivative Instruments and Hedging Activities” for additional information on our derivative instruments. Also refer to “Note 14—Fair Value Measurement” to the Consolidated Financial Statements in our 2023 Form 10-K for information on how we measure the fair value of our derivative instruments.
Non-Interest Expense
Non-interest expense consists of salaries and employee benefit expense, general and administrative expenses, gains and losses on the early extinguishment of debt and other miscellaneous expenses. Table 79 presents the components of non-interest expense recorded in our consolidated statements of operations for the three months ended August 31, 2023 and 2022.operations.
Table 7:9: Non-Interest Expense
| | | | | | | | | | | | | | | | | | |
| | | | | Three Months Ended August 31, |
| (Dollars in thousands) | | | | | | 2023 | | 2022 |
| Non-interest expense components: | | | | | | | | |
| Salaries and employee benefits | | | | | | $ | (15,874) | | | $ | (13,778) | |
| Other general and administrative expenses | | | | | | (15,629) | | | (11,741) | |
| Operating expenses | | | | | | (31,503) | | | (25,519) | |
| Losses on early extinguishment of debt | | | | | | (939) | | | — | |
| Other non-interest expense | | | | | | (178) | | | (322) | |
| Total non-interest expense | | | | | | $ | (32,620) | | | $ | (25,841) | |
| | | | | | | | | | | | | | | | | | | | | | | | | | |
| | | | |
| (Dollars in thousands) | | Q2 FY2024 | | Q2 FY2023 | | YTD FY2024 | | YTD FY2023 |
| Non-interest expense components: | | | | | | | | |
| Salaries and employee benefits | | $ | (16,546) | | | $ | (14,206) | | | $ | (32,420) | | | $ | (27,984) | |
| Other general and administrative expenses | | (14,966) | | | (13,041) | | | (30,595) | | | (24,782) | |
| Operating expenses | | (31,512) | | | (27,247) | | | (63,015) | | | (52,766) | |
| Losses on early extinguishment of debt | | (26) | | | — | | | (965) | | | — | |
| Other non-interest expense | | (250) | | | (355) | | | (428) | | | (677) | |
| Total non-interest expense | | $ | (31,788) | | | $ | (27,602) | | | $ | (64,408) | | | $ | (53,443) | |
Non-interest expense of $33$32 million and $64 million for current quarter,Q2 FY2024 and YTD FY2024, respectively, increased $7$4 million, or 26%15% and $11 million, or 21%, respectively, from the same prior-year quarter,Q2 FY2023 and YTD FY2023, primarily attributable to an increase in operating expenses, driven by higher expenses recorded for salaries, information technology, and depreciation and amortization expenses, and member relations expenses. During the current quarter,Q1 FY2024, we redeemed $100$100 million in principal amount of our $400$400 million subordinated deferrabledeferrable debt due 2043, at par plus accrued interest. As a result, we recognized $1 million of losses on early extinguishment of debt related to the unamortized debt issuance costs.
Net Income (Loss) Attributable to Noncontrolling Interests
Net income (loss) attributable to noncontrolling interests represents 100% of the results of operations of NCSC and RTFC, as the members of NCSC and RTFC own or control 100% of the interest in their respective companies. The fluctuations in net income (loss) attributable to noncontrolling interests are primarily due to changes in the fair value of NCSC’s derivative instruments recognized in NCSC’s earnings.
We recorded net loss attributable to noncontrolling interests of less than $1 million for Q2 FY2024 and net income of less than $1 million for YTD FY2024. In comparison, we recorded a net income attributable to noncontrolling interests of less than $1 million for both the current quarterQ2 FY2023 and the same prior-year quarter.YTD FY2023.
| | |
| CONSOLIDATED BALANCE SHEET ANALYSIS |
Total assets increased $682$1,498 million, or 2%4%, to $34,694$35,510 million as of August 31,November 30, 2023, primarily due to growth in our loan portfolio. We experienced an increase in total liabilities of $523$1,191 million, or 2%4%, to $31,946$32,614 million as of August 31,November 30, 2023, largely due to the issuances of debt to fund the growth in our loan portfolio. Total equity increased $159$307 million to $2,748$2,896 million as of August 31,November 30, 2023, attributable to our reported net income of $228$376 million for the current quarter,YTD FY2024, which was partially offset by the CFC Board of Directors’ authorized patronage capital retirement in July 2023 of $72 million.
Below is a discussion of changes in the major components of our assets and liabilities during the current quarter. Period-end balance sheet amounts may vary from average balance sheet amounts due to liquidity and balance sheet management activities that are intended to manage our liquidity requirements and market risk exposure in accordance with our risk appetite framework.
Loan Portfolio
We segregate our loan portfolio into segments, by legal entity, based on the borrower member class, which consists of CFC distribution, CFC power supply, CFC statewide and associate, NCSC and RTFC. We offer both long-term and line of credit loans to our borrowers. Under our long-term loan facilities, a borrower may select a fixed interest rate or a variable interest rate at the time of each loan advance. Line of credit loans are revolving loan facilities and generally have a variable interest rate. We describe and provide additional information on our member classes under “Item 1. Business—Members” and information about our loan programs and loan product types under “Item 1. Business—Loan and Guarantee Programs” in our 2023 Form 10-K.
Loans Outstanding
Loans to members totaled $33,097$33,554 million and $32,532 million as of August 31,November 30, 2023 and May 31, 2023, respectively. Loans to CFC distribution, and power supply, and statewide and associate borrowers accounted for 95% and 96% of total loans to members as of both August 31,November 30, 2023 and May 31, 2023.2023, respectively. The increase in loans to members of $565$1,022 million, or 2%3%, from May 31, 2023, was primarily attributable to net increases in long-term and line of credit loans of $326$853 million and $239$169 million, respectively. The $239$169 million increase in line of credit loans was primarily attributable to funding provided for higher member operating costs, working capital requirements from our members and RUS bridge loan financing. We experienced increases in CFC distribution loans, CFC power supply loans, CFC statewide and associate loans and RTFC loans of $381$605 million, $134$301 million, $32$68 million and $51$58 million, respectively, partially offset by a decrease in NCSC loans of $33$10 million.
Long-term loan advances totaled $711$1,608 million during the current quarter,YTD FY2024, of which approximately 87%94% was provided to members for capital expenditures and approximately 13%6% was provided for other purposes, primarily assetbusiness acquisitions. In comparison, long-term loan advances totaled $815$1,651 million during the same prior-year quarter,YTD FY2023, of which approximately 95% was provided to members for capital expenditures and approximately 2% was provided for the refinancing of loans made by other lenders. Of the $711$1,608 million total long-term loans advanced during the current quarter, $659YTD FY2024, $1,532 million were fixed-rate loan advances with a weighted average fixed-rate term of 1412 years. In comparison, of the $815$1,651 million total long-term loans advanced during the same prior-year quarter, $747YTD FY2023, $1,478 million were fixed-rate loan advances with a weighted average fixed-rate term of 2118 years.
Our aggregate loans outstanding to CFC electric distribution cooperative members relating to broadband projects, which we started tracking in October 2017, increased to an estimated $2,558$2,724 million as of August 31,November 30, 2023, from approximately $2,355 million as of May 31, 2023.
We provide information on the credit performance and risk profile of our loan portfolio below under the section “Credit Risk—Loan Portfolio Credit Risk.” Also refer to “Note 4—Loans” for addition information on our loans to members.
Debt
We utilize both short-term borrowings and long-term debt as part of our funding strategy and asset/liability interest rate risk management. We seek to maintain diversified funding sources, including our members, affiliates, the capital markets and other funding sources, across products, programs and markets to manage funding concentrations and reduce our liquidity or debt rollover risk. Our funding sources include a variety of secured and unsecured debt securities, in a wide range of maturities, to our members, affiliates, the capital markets and other funding sources.
Debt Outstanding
Table 810 displays the composition, by product type, of our outstanding debt as of August 31,November 30, 2023 and May 31, 2023. Table 810 also displays the composition of our debt based on several additional selected attributes.
Table 8:10: Debt—Total Debt Outstanding
| | (Dollars in thousands) | (Dollars in thousands) | | August 31, 2023 | | May 31, 2023 | | Change | (Dollars in thousands) | | November 30, 2023 | | May 31, 2023 | | Change |
| Debt product type: | Debt product type: | | | | | | | Debt product type: | | | | | | |
| Commercial paper: | Commercial paper: | | Commercial paper: | |
| Members, at par | Members, at par | | $ | 1,309,508 | | | $ | 1,017,431 | | | $ | 292,077 | | Members, at par | | $ | 1,312,659 | | | $ | 1,017,431 | | | $ | 295,228 | |
| Dealer, net of discounts | Dealer, net of discounts | | 1,088,343 | | | 1,293,167 | | | (204,824) | | Dealer, net of discounts | | 1,038,638 | | | 1,293,167 | | | (254,529) | |
| Total commercial paper | Total commercial paper | | 2,397,851 | | | 2,310,598 | | | 87,253 | | Total commercial paper | | 2,351,297 | | | 2,310,598 | | | 40,699 | |
| Select notes to members | Select notes to members | | 1,550,697 | | | 1,630,799 | | | (80,102) | | Select notes to members | | 1,550,423 | | | 1,630,799 | | | (80,376) | |
| Daily liquidity fund notes to members | Daily liquidity fund notes to members | | 265,832 | | | 238,329 | | | 27,503 | | Daily liquidity fund notes to members | | 352,961 | | | 238,329 | | | 114,632 | |
| | Medium-term notes: | Medium-term notes: | | Medium-term notes: | |
| Members, at par | Members, at par | | 782,310 | | | 731,809 | | | 50,501 | | Members, at par | | 736,568 | | | 731,809 | | | 4,759 | |
| Dealer, net of discounts | Dealer, net of discounts | | 6,122,478 | | | 6,131,608 | | | (9,130) | | Dealer, net of discounts | | 6,831,391 | | | 6,131,608 | | | 699,783 | |
| Total medium-term notes | Total medium-term notes | | 6,904,788 | | | 6,863,417 | | | 41,371 | | Total medium-term notes | | 7,567,959 | | | 6,863,417 | | | 704,542 | |
| Collateral trust bonds | Collateral trust bonds | | 7,582,174 | | | 7,577,973 | | | 4,201 | | Collateral trust bonds | | 7,181,456 | | | 7,577,973 | | | (396,517) | |
| Guaranteed Underwriter Program notes payable | Guaranteed Underwriter Program notes payable | | 6,670,146 | | | 6,720,643 | | | (50,497) | | Guaranteed Underwriter Program notes payable | | 6,894,611 | | | 6,720,643 | | | 173,968 | |
| Farmer Mac notes payable | Farmer Mac notes payable | | 3,625,953 | | | 3,149,898 | | | 476,055 | | Farmer Mac notes payable | | 3,901,908 | | | 3,149,898 | | | 752,010 | |
| Other notes payable | Other notes payable | | 1,168 | | | 1,166 | | | 2 | | Other notes payable | | 1,169 | | | 1,166 | | | 3 | |
| Subordinated deferrable debt | Subordinated deferrable debt | | 1,184,197 | | | 1,283,436 | | | (99,239) | | Subordinated deferrable debt | | 1,184,247 | | | 1,283,436 | | | (99,189) | |
| Members’ subordinated certificates: | Members’ subordinated certificates: | | Members’ subordinated certificates: | |
| Membership subordinated certificates | Membership subordinated certificates | | 628,614 | | | 628,614 | | | — | | Membership subordinated certificates | | 628,619 | | | 628,614 | | | 5 | |
| Loan and guarantee subordinated certificates | Loan and guarantee subordinated certificates | | 347,249 | | | 348,349 | | | (1,100) | | Loan and guarantee subordinated certificates | | 334,037 | | | 348,349 | | | (14,312) | |
| Member capital securities | Member capital securities | | 246,163 | | | 246,163 | | | — | | Member capital securities | | 246,163 | | | 246,163 | | | — | |
| Total members’ subordinated certificates | Total members’ subordinated certificates | | 1,222,026 | | | 1,223,126 | | | (1,100) | | Total members’ subordinated certificates | | 1,208,819 | | | 1,223,126 | | | (14,307) | |
| Total debt outstanding | Total debt outstanding | | $ | 31,404,832 | | | $ | 30,999,385 | | | $ | 405,447 | | Total debt outstanding | | $ | 32,194,850 | | | $ | 30,999,385 | | | $ | 1,195,465 | |
| | Security type: | Security type: | | Security type: | |
| Secured debt | Secured debt | | 57 | % | | 56 | % | | Secured debt | | 56 | % | | 56 | % | |
| Unsecured debt | Unsecured debt | | 43 | | | 44 | | | Unsecured debt | | 44 | | | 44 | | |
| Total | Total | | 100 | % | | 100 | % | | Total | | 100 | % | | 100 | % | |
| | Funding source: | Funding source: | | Funding source: | |
| Members | Members | | 16 | % | | 16 | % | | Members | | 16 | % | | 16 | % | |
| Other non-capital market: | Other non-capital market: | | Other non-capital market: | |
| Guaranteed Underwriter Program notes payable | Guaranteed Underwriter Program notes payable | | 21 | | | 22 | | | Guaranteed Underwriter Program notes payable | | 21 | | | 22 | | |
| Farmer Mac notes payable | Farmer Mac notes payable | | 12 | | | 10 | | | Farmer Mac notes payable | | 12 | | | 10 | | |
| | Total other non-capital market | Total other non-capital market | | 33 | | | 32 | | | Total other non-capital market | | 33 | | | 32 | | |
| Capital markets | Capital markets | | 51 | | | 52 | | | Capital markets | | 51 | | | 52 | | |
| Total | Total | | 100 | % | | 100 | % | | Total | | 100 | % | | 100 | % | |
| | Interest rate type: | Interest rate type: | | Interest rate type: | |
| Fixed-rate debt | Fixed-rate debt | | 80 | % | | 80 | % | | Fixed-rate debt | | 80 | % | | 80 | % | |
| Variable-rate debt | Variable-rate debt | | 20 | | | 20 | | | Variable-rate debt | | 20 | | | 20 | | |
| Total | Total | | 100 | % | | 100 | % | | Total | | 100 | % | | 100 | % | |
| | Interest rate type, including the impact of swaps: | Interest rate type, including the impact of swaps: | | Interest rate type, including the impact of swaps: | |
Fixed-rate debt(1) | Fixed-rate debt(1) | | 94 | % | | 94 | % | | Fixed-rate debt(1) | | 93 | % | | 94 | % | |
Variable-rate debt(2) | Variable-rate debt(2) | | 6 | | | 6 | | | Variable-rate debt(2) | | 7 | | | 6 | | |
| Total | Total | | 100 | % | | 100 | % | | Total | | 100 | % | | 100 | % | |
| Maturity classification:(3) | Maturity classification:(3) | | Maturity classification:(3) | |
| Short-term borrowings | Short-term borrowings | | 16 | % | | 15 | % | | Short-term borrowings | | 16 | % | | 15 | % | |
Long-term and subordinated debt(4) | Long-term and subordinated debt(4) | | 84 | | | 85 | | | Long-term and subordinated debt(4) | | 84 | | | 85 | | |
| Total | Total | | 100 | % | | 100 | % | | Total | | 100 | % | | 100 | % | |
____________________________
(1) Includes variable-rate debt that has been swapped to a fixed rate, net of any fixed-rate debt that has been swapped to a variable rate.
(2) Includes fixed-rate debt that has been swapped to a variable rate, net of any variable-rate debt that has been swapped to a fixed rate. Also includes commercial paper notes, which generally have maturities of less than 90 days. The interest rate on commercial paper notes does not change once the note has been issued; however, the interest rate for new commercial paper issuances changes daily.
(3) Borrowings with an original contractual maturity of one year or less are classified as short-term borrowings. Borrowings with an original contractual maturity of greater than one year are classified as long-term debt.
(4) Consists of long-term debt, subordinated deferrable debt and total members’ subordinated debt reported on our consolidated balance sheets. Maturity classification is based on the original contractual maturity as of the date of issuance of the debt.
We issue debt primarily to fund growth in our loan portfolio. As such, our debt outstanding generally increases and decreases in response to member loan demand. Total debt outstanding increased $405$1,195 million, or 1%4%, to $31,405$32,195 million as of August 31,November 30, 2023, due to borrowings to fund the increase in loans to members. Outstanding dealer commercial paper of $1,088$1,039 million as of August 31,November 30, 2023 was within our quarter-end target range of $1,000 million to $1,500 million. We provide additional information on our financing activities for the three months ended August 31, 2023YTD FY2024 in the below section “Liquidity Risk” of this Report.
Member Investments
Debt securities issued to our members represent an important, stable source of funding. Table 911 displays member debt outstanding, by product type, as of August 31,November 30, 2023 and May 31, 2023.
Table 9:11: Debt—Member Investments | | | | | August 31, 2023 | | May 31, 2023 | | Change | | | November 30, 2023 | | May 31, 2023 | | Change |
| (Dollars in thousands) | (Dollars in thousands) | | Amount | | % of Total (1) | | Amount | | % of Total (1) | | (Dollars in thousands) | | Amount | | % of Total (1) | | Amount | | % of Total (1) | |
| Member investment product type: | Member investment product type: | | | | | | | | | | | Member investment product type: | | | | | | | | | | |
| Commercial paper | Commercial paper | | $ | 1,309,508 | | 55 | % | | $ | 1,017,431 | | 44 | % | | $ | 292,077 | | Commercial paper | | $ | 1,312,659 | | 56 | % | | $ | 1,017,431 | | 44 | % | | $ | 295,228 | |
| Select notes | Select notes | | 1,550,697 | | 100 | | | 1,630,799 | | 100 | | | (80,102) | | Select notes | | 1,550,423 | | 100 | | | 1,630,799 | | 100 | | | (80,376) | |
| Daily liquidity fund notes | Daily liquidity fund notes | | 265,832 | | 100 | | | 238,329 | | 100 | | | 27,503 | | Daily liquidity fund notes | | 352,961 | | 100 | | | 238,329 | | 100 | | | 114,632 | |
| Medium-term notes | Medium-term notes | | 782,310 | | 11 | | | 731,809 | | 11 | | | 50,501 | | Medium-term notes | | 736,568 | | 10 | | | 731,809 | | 11 | | | 4,759 | |
| Members’ subordinated certificates | Members’ subordinated certificates | | 1,222,026 | | 100 | | | 1,223,126 | | 100 | | | (1,100) | | Members’ subordinated certificates | | 1,208,819 | | 100 | | | 1,223,126 | | 100 | | | (14,307) | |
| Total member investments | Total member investments | | $ | 5,130,373 | | | | $ | 4,841,494 | | | | $ | 288,879 | | Total member investments | | $ | 5,161,430 | | | | $ | 4,841,494 | | | | $ | 319,936 | |
| | Percentage of total debt outstanding | Percentage of total debt outstanding | | 16 | % | | | | 16 | % | | | | | Percentage of total debt outstanding | | 16 | % | | | | 16 | % | | | | |
____________________________
(1) Represents outstanding debt attributable to members for each debt product type as a percentage of the total outstanding debt for each debt product type.
Member investments accounted for 16% of total debt outstanding as of both August 31,November 30, 2023 and May 31, 2023. Member investments totaled $5,130$5,161 million as of August 31,November 30, 2023, an increase of $289$320 million from May 31, 2023, primarily attributable to the increase in short-term member investments as our members had moretend to invest their excess cash on handwith CFC. Over the last twelve fiscal quarters, our member investments have averaged $5,122$5,101 million, calculated based on outstanding member investments as of the end of each fiscal quarter during the period.
Short-Term Borrowings
Short-term borrowings consist of borrowings with an original contractual maturity of one year or less and do not include the current portion of long-term debt. Short-term borrowings increased to $5,124$5,162 million as of August 31,November 30, 2023, from $4,546 million as of May 31, 2023, primarily driven by increase in short-term notes payable advanced under the Farmer Mac revolving purchase agreement and short-term member investments, partially offset by a decrease in outstanding dealer commercial paper. Short-term borrowings accounted for 16% and 15% of total debt outstanding as of August 31,November 30, 2023 and May 31, 2023, respectively.
See “Liquidity Risk” below and “Note 6—Short-Term Borrowings” for information on the composition of our short-term borrowings.
Long-Term and Subordinated Debt
Long-term debt, defined as debt with an original contractual maturity term of greater than one year, primarily consists of medium-term notes, collateral trust bonds, notes payable under the Guaranteed Underwriter Program and notes payable under the Farmer Mac revolving note purchase agreement. Subordinated debt consists of subordinated deferrable debt and members’ subordinated certificates. Our subordinated deferrable debt and members’ subordinated certificates have original contractual maturity terms of greater than one year.
Long-term and subordinated debt decreasedincreased to $26,280$27,033 million as of August 31,November 30, 2023, from $26,453 million as of May 31, 2023, primarily due to net increase of $665 million in medium term notes, $252 million in notes payable under the Farmer Mac revolving purchase agreement, and $174 million in notes payable under the Guaranteed Underwriter Program, partially offset by repayments of $405 million of collateral trust bonds and the early redemption of $100 million of our subordinated deferrable debt and the repayments of $50 million in notes payable under the Guaranteed Underwriter Program and $24 million in notes payable under the Farmer Mac revolving purchase agreement. Long-term and subordinated debt accounted for 84% and 85% of total debt outstanding as of August 31,November 30, 2023 and May 31, 2023, respectively.
We provide additional information on our long-term debt below under the “Liquidity Risk” section and in “Note 7—Long-Term Debt” and “Note 8—Subordinated Deferrable Debt” of this Report.
Equity
Table 1012 presents the components of total CFC equity and total equity as of August 31,November 30, 2023 and May 31, 2023.
Table 10:12: Equity
| | (Dollars in thousands) | (Dollars in thousands) | | August 31, 2023 | | May 31, 2023 | (Dollars in thousands) | | November 30, 2023 | | May 31, 2023 |
| Equity components: | Equity components: | | | | | Equity components: | | | | |
| Membership fees and educational fund: | Membership fees and educational fund: | | Membership fees and educational fund: | |
| Membership fees | Membership fees | | $ | 969 | | | $ | 969 | | Membership fees | | $ | 970 | | | $ | 969 | |
| Educational fund | Educational fund | | 2,116 | | | 2,565 | | Educational fund | | 1,916 | | | 2,565 | |
| Total membership fees and educational fund | Total membership fees and educational fund | | 3,085 | | | 3,534 | | Total membership fees and educational fund | | 2,886 | | | 3,534 | |
| Patronage capital allocated | Patronage capital allocated | | 934,135 | | | 1,006,115 | | Patronage capital allocated | | 934,135 | | | 1,006,115 | |
| Members’ capital reserve | Members’ capital reserve | | 1,202,152 | | | 1,202,152 | | Members’ capital reserve | | 1,202,152 | | | 1,202,152 | |
| Total allocated equity | Total allocated equity | | 2,139,372 | | | 2,211,801 | | Total allocated equity | | 2,139,173 | | | 2,211,801 | |
| Unallocated net income (loss): | Unallocated net income (loss): | | Unallocated net income (loss): | |
Prior fiscal year-end cumulative derivative forward value gains(1) | Prior fiscal year-end cumulative derivative forward value gains(1) | | 342,624 | | | 92,363 | | Prior fiscal year-end cumulative derivative forward value gains(1) | | 342,624 | | | 92,363 | |
Year-to-date derivative forward value gains (1) | Year-to-date derivative forward value gains (1) | | 161,254 | | | 250,261 | | Year-to-date derivative forward value gains (1) | | 239,307 | | | 250,261 | |
Period-end cumulative derivative forward value gains(1) | Period-end cumulative derivative forward value gains(1) | | 503,878 | | | 342,624 | | Period-end cumulative derivative forward value gains(1) | | 581,931 | | | 342,624 | |
| Other unallocated net income (loss) | Other unallocated net income (loss) | | 65,894 | | | (709) | | Other unallocated net income (loss) | | 136,284 | | | (709) | |
| Unallocated net income | Unallocated net income | | 569,772 | | | 341,915 | | Unallocated net income | | 718,215 | | | 341,915 | |
| CFC retained equity | CFC retained equity | | 2,709,144 | | | 2,553,716 | | CFC retained equity | | 2,857,388 | | | 2,553,716 | |
| Accumulated other comprehensive income | Accumulated other comprehensive income | | 8,241 | | | 8,343 | | Accumulated other comprehensive income | | 8,618 | | | 8,343 | |
| Total CFC equity | Total CFC equity | | 2,717,385 | | | 2,562,059 | | Total CFC equity | | 2,866,006 | | | 2,562,059 | |
| Noncontrolling interests | Noncontrolling interests | | 30,542 | | | 27,190 | | Noncontrolling interests | | 30,134 | | | 27,190 | |
| Total equity | Total equity | | $ | 2,747,927 | | | $ | 2,589,249 | | Total equity | | $ | 2,896,140 | | | $ | 2,589,249 | |
|
(1)Represents derivative forward value gains (losses) for CFC only, as total CFC equity does not include the noncontrolling interests of the variable interest entities NCSC and RTFC, which we are required to consolidate. We present the consolidated total derivative forward value gains (losses) in Table 2830 in the “Non-GAAP Financial Measures” section below. Also, see “Note 14—Business Segments” for the statements of operations for CFC.
The increase in total equity of $159$307 million to $2,748$2,896 million as of August 31,November 30, 2023 was attributable to our reported net income of $228$376 million for the current quarter,YTD FY2024, partially offset by the CFC Board of Directors’ authorized patronage capital retirement in July 2023 of $72 million.
Allocation and Retirement of Patronage Capital
We are subject to District of Columbia law governing cooperatives, under which CFC is required to make annual allocations of net earnings, if any, in accordance with the provisions of the District of Columbia statutes. We describe the allocation requirements under “Item 7. MD&A—Consolidated Balance Sheet Analysis—Equity—Allocation and Retirement of Patronage Capital” in our 2023 Form 10-K. The amount of patronage capital allocated each year by CFC’s Board of Directors is based on non-GAAP adjusted net income, which excludes the impact of derivative forward value gains (losses). We provide a reconciliation of our adjusted net income to our reported net income and an explanation of the adjustments below in “Non-GAAP Financial Measures.”
In May 2023, the CFC Board of Directors authorized the allocation of $1 million of net earnings for fiscal year 2023 to the cooperative educational fund. In July 2023, the CFC Board of Directors authorized the allocation of fiscal year 2023 adjusted net income as follows: $110 million to members in the form of patronage capital and $140 million to the members’ capital reserve.
In July 2023, the CFC Board of Directors also authorized the retirement of patronage capital totaling $72 million, of which $55 million represented 50% of the patronage capital allocation for fiscal year 2023, and $17 million represented the portion of the allocation from fiscal year 1998 net earnings that has been held for 25 years pursuant to the CFC Board of Directors’ policy. This amount was returned to members in cash in September 2023. The remaining portion of the patronage capital allocation for fiscal year 2023 will be retained by CFC for 25 years pursuant to the guidelines adopted by the CFC Board of Directors in June 2009.
| | |
| ENTERPRISE RISK MANAGEMENT |
Overview
CFC has an Enterprise Risk Management (“ERM”) framework that is designed to identify, assess, monitor and manage the risks we assume in conducting our activities to serve the financial needs of our members. We face a variety of risks that can significantly affect our financial performance, liquidity, reputation and ability to meet the expectations of our members, investors and other stakeholders. As a financial services company, the major categories of risk exposures inherent in our business activities include credit risk, liquidity risk, market risk and operational risk. These risk categories are summarized below.
•Credit risk is the risk that a borrower or other counterparty will be unable to meet its obligations in accordance with agreed-upon terms.
•Liquidity risk is the risk that we will be unable to fund our operations and meet our contractual obligations or that we will be unable to fund new loans to borrowers at a reasonable cost and tenor in a timely manner.
•Market risk is the risk that changes in market variables, such as movements in interest rates, may adversely affect the match between the timing of the contractual maturities, repricing and prepayments of our financial assets and the related financial liabilities funding those assets.
•Operational risk is the risk of loss resulting from inadequate or failed internal controls, processes, systems, human error or external events, including natural disasters or public health emergencies, such as the COVID-19 pandemic. Operational risk also includes cybersecurity risk, compliance risk, fiduciary risk, reputational risk and litigation risk.
Effective risk management is critical to our overall operations and to achieving our primary objective of providing cost-based financial products to our rural electric members while maintaining the sound financial results required for investment-grade credit ratings on our rated debt instruments. Accordingly, we have a risk-management framework that is intended to govern the principal risks we face in conducting our business and the aggregate amount of risk we are willing to accept, referred to as risk tolerance as well as risk limits and related guidelines, in the context of CFC’s mission and strategic objectives and initiatives. We provide a discussion of our risk management framework in our 2023 Form 10-K under “Item 7. MD&A—Enterprise Risk Management” and describe how we manage these risks under each respective MD&A section in our 2023 Form 10-K.
Our loan portfolio, which represents the largest component of assets on our balance sheet, accounts for the substantial majority of our credit risk exposure. We also engage in certain nonlending activities that may give rise to counterparty credit risk, such as entering into derivative transactions to manage interest rate risk and purchasing investment securities. We provide additional information on our credit risk-management framework under “Item 7. MD&A—Credit Risk—Credit Risk Management” in our 2023 Form 10-K.
Loan Portfolio Credit Risk
Our primary credit exposure is loans to rural electric cooperatives, which provide essential electric services to end-users, the majority of which are residential customers. We also have a limited portfolio of loans to not-for-profit and for-profit telecommunication companies. Loans outstanding to electric utility organizations totaled $32,545$32,994 million and $32,032 million as of August 31,November 30, 2023 and May 31, 2023, respectively, representing 98% and 99% of our total loans outstanding as of each respective date. The remaining loans outstanding in our loan portfolio were to RTFC members, affiliates and associates in the telecommunications industry sector. The substantial majority of loans to our borrowers are long-term fixed-rate loans with terms of up to 35 years. Long-term fixed-rate loans accounted for 88% and 87% of total loans outstanding as of both August 31,November 30, 2023 and May 31, 2023.2023, respectively.
Because we lend primarily to our rural electric utility cooperative members, we have had a loan portfolio inherently subject to single-industry and single-obligor credit concentration risk since our inception in 1969. We historically, however, have experienced limited defaults and losses in our electric utility loan portfolio due to several factors. First, the majority of our electric cooperative borrowers operate in states where electric cooperatives are not subject to rate regulation. Thus, they are able to make rate adjustments to pass along increased costs to the end customer without first obtaining state regulatory approval, allowing them to cover operating costs and generate sufficient earnings and cash flows to service their debt obligations. Second, electric cooperatives face limited competition, as they tend to operate in exclusive territories not serviced by public investor-owned utilities. Third, electric cooperatives typically are consumer-owned, not-for-profit entities that provide an essential service to end-users, the majority of which are residential customers. As not-for-profit entities, rural electric cooperatives, unlike investor-owned utilities, generally are eligible to apply for assistance from the Federal Emergency Management Agency (“FEMA”) and states to help recover from major disasters or emergencies. Fourth, electric cooperatives tend to adhere to a conservative core business strategy model that has historically resulted in a relatively stable, resilient operating environment and overall strong financial performance and credit strength for the electric cooperative network. Finally, we generally lend to our members on a senior secured basis, which reduces the risk of loss in the event of a borrower default.
Below we provide information on the credit risk profile of our loan portfolio, including security provisions, credit concentration, credit quality indicators and our allowance for credit losses.
Security Provisions
Except when providing line of credit loans, we generally lend to our members on a senior secured basis. Table 1113 presents, by legal entity and member class and by loan type, secured and unsecured loans in our loan portfolio as of August 31,November 30, 2023 and May 31, 2023. Of our total loans outstanding, 92% were secured as of both August 31,November 30, 2023 and May 31, 2023.
Table 11:13: Loans—Loan Portfolio Security Profile | | | August 31, 2023 | | November 30, 2023 |
| (Dollars in thousands) | (Dollars in thousands) | | Secured | | % of Total | | Unsecured | | % of Total | | Total | (Dollars in thousands) | | Secured | | % of Total | | Unsecured | | % of Total | | Total |
| Member class: | Member class: | | | | | | | | | | | Member class: | | | | | | | | | | |
| CFC: | CFC: | | CFC: | |
| Distribution | Distribution | | $ | 24,012,128 | | | 93 | % | | $ | 1,806,096 | | | 7 | % | | $ | 25,818,224 | | Distribution | | $ | 24,313,913 | | | 93 | % | | $ | 1,727,759 | | | 7 | % | | $ | 26,041,672 | |
| Power supply | Power supply | | 4,709,602 | | | 85 | | | 860,952 | | 15 | | | 5,570,554 | | Power supply | | 4,930,834 | | | 86 | | | 806,763 | | 14 | | | 5,737,597 | |
| Statewide and associate | Statewide and associate | | 182,305 | | | 78 | | | 49,987 | | 22 | | | 232,292 | | Statewide and associate | | 214,338 | | | 80 | | | 53,948 | | 20 | | | 268,286 | |
| Total CFC | Total CFC | | 28,904,035 | | | 91 | | | 2,717,035 | | | 9 | | | $ | 31,621,070 | | Total CFC | | 29,459,085 | | | 92 | | | 2,588,470 | | | 8 | | | $ | 32,047,555 | |
| NCSC | NCSC | | 910,605 | | | 99 | | | 12,842 | | | 1 | | | 923,447 | | NCSC | | 930,516 | | | 98 | | | 16,127 | | | 2 | | | 946,643 | |
| RTFC | RTFC | | 509,464 | | | 95 | | | 29,512 | | | 5 | | | 538,976 | | RTFC | | 512,643 | | | 94 | | | 33,397 | | | 6 | | | 546,040 | |
Total loans outstanding(1) | Total loans outstanding(1) | | $ | 30,324,104 | | | 92 | | | $ | 2,759,389 | | | 8 | | | $ | 33,083,493 | | Total loans outstanding(1) | | $ | 30,902,244 | | | 92 | | | $ | 2,637,994 | | | 8 | | | $ | 33,540,238 | |
| | Loan type: | Loan type: | | Loan type: | |
| Long-term loans: | Long-term loans: | | Long-term loans: | |
| Fixed rate | Fixed rate | | $ | 28,547,292 | | | 99 | % | | $ | 161,556 | | | 1 | % | | $ | 28,708,848 | | Fixed rate | | $ | 29,231,901 | | | 99 | % | | $ | 156,721 | | | 1 | % | | $ | 29,388,622 | |
| Variable rate | Variable rate | | 1,010,501 | | | 100 | | | 1,680 | | | — | | | 1,012,181 | | Variable rate | | 857,535 | | | 100 | | | 1,547 | | | — | | | 859,082 | |
| Total long-term loans | Total long-term loans | | 29,557,793 | | | 99 | | | 163,236 | | | 1 | | | 29,721,029 | | Total long-term loans | | 30,089,436 | | | 99 | | | 158,268 | | | 1 | | | 30,247,704 | |
| Line of credit loans | Line of credit loans | | 766,311 | | | 23 | | | 2,596,153 | | | 77 | | | 3,362,464 | | Line of credit loans | | 812,808 | | | 25 | | | 2,479,726 | | | 75 | | | 3,292,534 | |
Total loans outstanding(1) | Total loans outstanding(1) | | $ | 30,324,104 | | | 92 | | | $ | 2,759,389 | | | 8 | | | $ | 33,083,493 | | Total loans outstanding(1) | | $ | 30,902,244 | | | 92 | | | $ | 2,637,994 | | | 8 | | | $ | 33,540,238 | |
| | | | | | | | | | | | | | | | | | | | | | | | | | | | | | | | |
| | | | | | | | | | |
| | May 31, 2023 |
| (Dollars in thousands) | | Secured | | % of Total | | Unsecured | | % of Total | | Total |
| Member class: | | | | | | | | | | |
| CFC: | | | | | | | | | | |
| Distribution | | $ | 23,736,624 | | | 93 | % | | $ | 1,700,453 | | | 7 | % | | $ | 25,437,077 | |
| Power supply | | 4,633,558 | | | 85 | | | 803,684 | | 15 | | | 5,437,242 | |
| Statewide and associate | | 157,342 | | | 79 | | | 43,026 | | | 21 | | | 200,368 | |
| Total CFC | | $ | 28,527,524 | | | 92 | | | 2,547,163 | | | 8 | | | 31,074,687 | |
| NCSC | | 925,925 | | | 97 | | | 30,949 | | | 3 | | | 956,874 | |
| RTFC | | 462,209 | | | 95 | | | 25,579 | | | 5 | | | 487,788 | |
Total loans outstanding(1) | | $ | 29,915,658 | | | 92 | | | $ | 2,603,691 | | | 8 | | | $ | 32,519,349 | |
| | | | | | | | | | |
| Loan type: | | | | | | | | | | |
| Long-term loans: | | | | | | | | | | |
| Fixed rate | | $ | 28,203,752 | | | 99 | % | | $ | 167,606 | | | 1 | % | | $ | 28,371,358 | |
| Variable rate | | 1,022,841 | | | 100 | | | 1,812 | | | — | | | 1,024,653 | |
| | | | | | | | | | |
| Total long-term loans | | 29,226,593 | | | 99 | | | 169,418 | | | 1 | | | 29,396,011 | |
| Line of credit loans | | 689,065 | | | 22 | | | 2,434,273 | | | 78 | | | 3,123,338 | |
Total loans outstanding(1) | | $ | 29,915,658 | | | 92 | | | $ | 2,603,691 | | | 8 | | | $ | 32,519,349 | |
____________________________
(1) Represents the unpaid principal balance, net of discounts, charge-offs and recoveries, of loans as of the end of each period. Excludes unamortized deferred loan origination costs of $13 million as of both August 31,November 30, 2023 and May 31, 2023.
Credit Concentration
Concentrations of credit may exist when a lender has large credit exposures to single borrowers, large credit exposures to borrowers in the same industry sector or engaged in similar activities or large credit exposures to borrowers in a geographic region that would cause the borrowers to be similarly impacted by economic or other conditions in the region. As discussed
above under “Credit Risk—Loan Portfolio Credit Risk,” because we lend primarily to our rural electric utility cooperative members, our loan portfolio is inherently subject to single-industry and single-obligor credit concentration risk. Loans outstanding to electric utility organizations totaled $32,545$32,994 million and $32,032 million as of August 31,November 30, 2023 and May 31, 2023, respectively, and represented approximately 98% and 99% of our total loans outstanding as of each respective date. Our credit exposure is partially mitigated by long-term loans guaranteed by RUS, which totaled $121$118 million and $123 million as of August 31,November 30, 2023 and May 31, 2023, respectively.
Single-Obligor Concentration
Table 1214 displays the outstanding loan exposure for our 20 largest borrowers, by legal entity and member class, as of August 31,November 30, 2023 and May 31, 2023.Our 20 largest borrowers consisted of 12 distribution systems and eight power supply systems as of November 30, 2023 compared to 10 distribution systems and 10 power supply systems as of both August 31, 2023 and May 31, 2023. The largest total exposure to a single borrower or controlled group represented approximately 1% of total loans outstanding as of both August 31,November 30, 2023 and May 31, 2023.
Table 12:14: Loans—Loan Exposure to 20 Largest Borrowers
| | | | | | | | | | | | | | | | | | | | | | | | | | | |
| | | August 31, 2023 | | May 31, 2023 | |
| (Dollars in thousands) | | Amount | | % of Total | | Amount | | % of Total | |
| Member class: | | | | | | | | | |
| CFC: | | | | | | | | | |
| Distribution | | $ | 3,644,193 | | | 11 | % | | $ | 3,600,193 | | | 11 | % | |
| Power supply | | 2,929,766 | | | 9 | | | 2,782,098 | | | 9 | | |
| Total CFC | | 6,573,959 | | | 20 | | | 6,382,291 | | | 20 | | |
| NCSC | | 202,849 | | | — | | | 205,321 | | | — | | |
| Total loan exposure to 20 largest borrowers | | 6,776,808 | | | 20 | | | 6,587,612 | | | 20 | | |
| Less: Loans covered under Farmer Mac standby purchase commitment | | (224,023) | | | — | | | (266,754) | | | (1) | | |
| Net loan exposure to 20 largest borrowers | | $ | 6,552,785 | | | 20 | % | | $ | 6,320,858 | | | 19 | % | |
| | | | | | | | | | | | | | | | | | | | | | | | | | | |
| | | November 30, 2023 | | May 31, 2023 | |
| (Dollars in thousands) | | Amount | | % of Total | | Amount | | % of Total | |
| Member class: | | | | | | | | | |
| CFC: | | | | | | | | | |
| Distribution | | $ | 4,148,154 | | | 13 | % | | $ | 3,600,193 | | | 11 | % | |
| Power supply | | 2,422,605 | | | 7 | | | 2,782,098 | | | 9 | | |
| Total CFC | | 6,570,759 | | | 20 | | | 6,382,291 | | | 20 | | |
| NCSC | | 181,750 | | | — | | | 205,321 | | | — | | |
| Total loan exposure to 20 largest borrowers | | 6,752,509 | | | 20 | | | 6,587,612 | | | 20 | | |
| Less: Loans covered under Farmer Mac standby purchase commitment | | (226,225) | | | (1) | | | (266,754) | | | (1) | | |
| Net loan exposure to 20 largest borrowers | | $ | 6,526,284 | | | 19 | % | | $ | 6,320,858 | | | 19 | % | |
We entered into a long-term standby purchase commitment agreement with Farmer Mac during fiscal year 2016. Under this agreement, we may designate certain long-term loans to be covered under the commitment, subject to approval by Farmer Mac, and in the event any such loan later goes into payment default for at least 90 days, upon request by us, Farmer Mac must purchase such loan at par value. The aggregate unpaid principal balance of designated and Farmer Mac approved loans was $428$421 million and $436 million as of August 31,November 30, 2023 and May 31, 2023, respectively. Loan exposure to our 20 largest borrowers covered under the Farmer Mac agreement totaled $224$226 million and $267 million as of August 31,November 30, 2023 and May 31, 2023, respectively, which reduced our exposure to the 20 largest borrowers to $6,553 million and $6,321 million19% as of each respective date. No loans have been put to Farmer Mac for purchase pursuant to this agreement.
Geographic Concentration
Although our organizational structure and mission result in single-industry concentration, we serve a geographically diverse group of electric and telecommunications borrowers throughout the U.S. The consolidated number of borrowers with loans outstanding totaled 883891 and 884 as of August 31,November 30, 2023 and May 31, 2023, respectively, located in 49 states and the District of Columbia. Of the 883891 and 884 borrowers with loans outstanding as of August 31,November 30, 2023 and May 31, 2023, respectively, 50 and 52 were electric power supply borrowers as of each respective date. Electric power supply borrowers generally require significantly more capital than electric distribution and telecommunications borrowers.
Texas, which had 6667 and 69 borrowers with loans outstanding as of August 31,November 30, 2023 and May 31, 2023, respectively, accounted for the largest number of borrowers with loans outstanding in any one state as of each respective date, as well as the largest concentration of loan exposure in any one state. Loans outstanding to Texas-based borrowers totaled $5,637$5,653 million and $5,529 million as of August 31,November 30, 2023 and May 31, 2023, respectively, and accounted for approximately 17% of total loans outstanding as of each respective date. Of the loans outstanding to Texas-based borrowers, $153$151 million and $155
$155 million as of August 31,November 30, 2023 and May 31, 2023, respectively, were covered by the Farmer Mac standby repurchase agreement, which reduced our credit risk exposure to Texas-based borrowers to $5,484$5,502 million and $5,373 million as of
each respective date. See “Note 4—Loans” for information on the Texas-based number of borrowers and loans outstanding by legal entity and member class.
Credit Quality Indicators
Assessing the overall credit quality of our loan portfolio and measuring our credit risk is an ongoing process that involves tracking payment status, modifications to borrowers experiencing financial difficulty, nonperforming loans, charge-offs, the internal risk ratings of our borrowers and other indicators of credit risk. We monitor and subject each borrower and loan facility in our loan portfolio to an individual risk assessment based on quantitative and qualitative factors. Payment status trends and internal risk ratings are indicators, among others, of the probability of borrower default and overall credit quality of our loan portfolio. We believe the overall credit quality of our loan portfolio remained strong as of August 31,November 30, 2023.
Loan Modifications to Borrowers Experiencing Financial Difficulty
We actively monitor problem loans and, from time to time, attempt to work with borrowers to manage such exposures through loan workouts or modifications that better align with the borrower’s current ability to pay. Therefore, as part of our loss mitigation efforts, we may provide modifications to a borrower experiencing financial difficulty to improve long-term collectability of the loan and to avoid the need for exercising remedies. We consider the impact of all loan modifications when estimating the credit quality of our loan portfolio and establishing the allowance for credit losses.
On June 1, 2023, we adopted ASU 2022-02, Financial Instruments – Credit Losses (Topic 326) – Troubled Debt Restructurings and Vintage Disclosures, using the prospective adoption method. The ASU eliminated the accounting guidance for TDRs and enhanced the disclosure requirements for loan refinancings and restructurings made with borrowers experiencing financial difficulty, which are to be applied prospectively. For additional information on the adoption of ASU 2022-02 see “Note 1—Summary of Significant Accounting Policies.”
We had noone loan modificationsmodification to a RTFC borrower experiencing financial difficulty during Q2 FY2024 and YTD FY2024. This loan received a term extension and had an amortized cost of $3 million as of November 30, 2023, representing 1% of the RTFC loan portfolio. Loans modified to borrowers experiencing financial difficulty duringtotaled $3 million as of November 30, 2023, consisting of one RTFC loan as discussed above, which wasperforming in accordance with the three months ended August 31, 2023.terms of the loan agreement. There were no unadvanced loan commitments related to this loan.
Troubled Debt Restructurings—Prior to Adoption of ASU 2022-02
As discussed above, ASU 2022-02 eliminated the accounting guidance for TDRs. Prior to the adoption of ASU 2022-02, a loan restructuring or modification of terms is accounted for as TDR if, for economic or legal reasons related to the borrower’s financial difficulties, a concession is granted to the borrower that we would not otherwise consider.
We had loans outstanding to two borrowers totaling $8 million which have been performing in accordance with the terms of their respective restructured loan agreement for an extended period of time and were classified as performing TDR loans and on accrual status as of May 31, 2023. We had loans outstanding to Brazos totaling $23 million classified as nonperforming TDR loans during the three months ended February 28, 2023 (“Q3 FY2023”), which were on non-accrual status as of May 31, 2023. During the current quarter,Q1 FY2024, we received the remaining payment of Brazos’ loans outstanding of $23 million in accordance with the provisions of Brazos’ plan of reorganization to repay its loans in full. Prior to the Brazos loan restructuring, we have not had any loan modifications that were required to be accounted for as TDRs since fiscal year 2016.
Nonperforming Loans
We classify loans as nonperforming at the earlier of the date when we determine: (i) interest or principal payments on the loan is past due 90 days or more; (ii) as a result of court proceedings, the collection of interest or principal payments based on the original contractual terms is not expected; or (iii) the full and timely collection of interest or principal is otherwise uncertain. Once a loan is classified as nonperforming, we generally place the loan on nonaccrual status. Interest accrued but not collected at the date a loan is placed on nonaccrual status is reversed against earnings.
We had a loan to one CFC electric power supply borrower totaling $85 million classified as nonperforming as of August 31,November 30, 2023. In comparison, we had loans to two CFC electric power supply borrowers totaling $89 million classified as nonperforming as of May 31, 2023. Nonperforming loans represented 0.26%0.25% and 0.27% of total loans outstanding as of August 31,November 30, 2023 and May 31, 2023, respectively. The reduction in nonperforming loans of $4 million was due to the receipt
of $4 million in loan payments from Brazos Sandy Creek to pay off its nonperforming loan outstanding during the current quarter.
Net Charge-OffsYTD FY2024.
We provide additional information on nonperforming loans in “Note 4—Loans—Credit Quality Indicators—Nonperforming Loans.”
Net Charge-Offs
We had no charge-offs during the current quarterQ2 FY2024 and the same prior-year quarter.YTD FY2024. We received a total of $28 million in loan payments from Brazos and Brazos Sandy Creek to repay their $27 million of total loans outstanding in full during the current quarter.Q1 FY2024. The additional payment received of $1 million was recorded as a loan recovery on the Brazos and Brazos Sandy Creek previously charged-off loan amounts, which resulted in an annualized net recovery rate of 0.01% for YTD FY2024. In comparison, we had charge-offs totaling $15 million for the current quarter.CFC electric power supply loan portfolio related to Brazos and Brazos Sandy Creek nonperforming loans during Q2 FY2023 and YTD FY2023, which resulted in an annualized net charge-off rate of 0.19% and 0.10% for Q2 FY2023 and YTD FY2023, respectively. Prior to Brazos’ and Brazos Sandy Creek’s bankruptcy filings, we had not experienced any defaults or charge-offs in our electric utility and telecommunications loan portfolios since fiscal year 2013 and 2017, respectively.
Borrower Risk Ratings
As part of our management of credit risk, we maintain a credit risk rating framework under which we employ a consistent process for assessing the credit quality of our loan portfolio. We evaluate each borrower and loan facility in our loan portfolio and assign internal borrower and loan facility risk ratings based on consideration of a number of quantitative and qualitative factors. We categorize loans in our portfolio based on our internally assigned borrower risk ratings, which are intended to assess the general creditworthiness of the borrower and probability of default. Our borrower risk ratings align with the U.S. federal banking regulatory agencies’ credit risk definitions of pass and criticized categories, with the criticized category further segmented among special mention, substandard and doubtful. Pass ratings reflect relatively low probability of default, while criticized ratings have a higher probability of default. Our internally assigned borrower risk ratings serve as the primary credit quality indicator for our loan portfolio. Because our internal borrower risk ratings provide important information on the probability of default, they are a key input in determining our allowance for credit losses.
Criticized loans totaled $288$300 million and $323 million as of August 31,November 30, 2023 and May 31, 2023, respectively, and represented approximately 1% of total loans outstanding as of each respective date. The decrease of $35$23 million in criticized loans was primarily due to loan payments received from aBrazos and Brazos Sandy Creek in the doubtful category, partially offset by an increase in loans outstanding for one CFC electric distribution borrower in the special mention category and Brazos and Brazos Sandy Creek in the doubtful category during the current quarter, as discussed above.YTD FY2024. Each of the borrowers with loans outstanding in the criticized category was current with regard to all principal and interest amounts due to us as of August 31,November 30, 2023. In contrast, each of the borrowers with loans outstanding in the criticized category, with the exception of Brazos Sandy Creek, was current with regard to all principal and interest amounts due to us as of May 31, 2023.
We provide additional information on our borrower risk rating framework in our 2023 Form 10-K under “Item 7. MD&A Credit Risk—Loan Portfolio Credit Risk—Credit Quality Indicators.” See “Note 4—Loans” of this Report for detail, by member class, on loans outstanding in each borrower risk rating category.
Allowance for Credit Losses
We are required to maintain an allowance based on a current estimate of credit losses that are expected to occur over the remaining contractual term of the loans in our portfolio. Our allowance for credit losses consists of a collective allowance and an asset-specific allowance. The collective allowance is established for loans in our portfolio that share similar risk characteristics and are therefore evaluated on a collective, or pool, basis in measuring expected credit losses. The asset-specificasset-
specific allowance is established for loans in our portfolio that do not share similar risk characteristics with other loans in our portfolio and are therefore evaluated on an individual basis in measuring expected credit losses.
Table 1315 presents, by legal entity and member class, loans outstanding and the related allowance for credit losses and allowance coverage ratio as of August 31,November 30, 2023 and May 31, 2023 and the allowance components as of each date.
Table 13:15: Allowance for Credit Losses by Borrower Member Class and Evaluation Methodology
| | | August 31, 2023 | | May 31, 2023 | | | November 30, 2023 | | May 31, 2023 | |
| (Dollars in thousands) | (Dollars in thousands) | | Loans Outstanding(1) | | Allowance for Credit Losses | | Allowance Coverage Ratio (2) | | Loans Outstanding (1) | | Allowance for Credit Losses | | Allowance Coverage Ratio(2) | | (Dollars in thousands) | | Loans Outstanding(1) | | Allowance for Credit Losses | | Allowance Coverage Ratio (2) | | Loans Outstanding (1) | | Allowance for Credit Losses | | Allowance Coverage Ratio(2) | |
| Member class: | Member class: | | | | | | | | | | | | | | Member class: | | | | | | | | | | | | | |
| CFC: | CFC: | | | CFC: | | |
| Distribution | Distribution | | $ | 25,818,224 | | | $ | 15,722 | | | 0.06 | % | | $ | 25,437,077 | | | $ | 14,924 | | | 0.06 | % | | Distribution | | $ | 26,041,672 | | | $ | 16,037 | | | 0.06 | % | | $ | 25,437,077 | | | $ | 14,924 | | | 0.06 | % | |
| Power supply | Power supply | | 5,570,554 | | | 33,434 | | | 0.60 | | | 5,437,242 | | | 33,306 | | | 0.61 | | | Power supply | | 5,737,597 | | | 33,312 | | | 0.58 | | | 5,437,242 | | | 33,306 | | | 0.61 | | |
| Statewide and associate | Statewide and associate | | 232,292 | | | 1,198 | | | 0.52 | | | 200,368 | | | 1,194 | | | 0.60 | | | Statewide and associate | | 268,286 | | | 1,271 | | | 0.47 | | | 200,368 | | | 1,194 | | | 0.60 | | |
| Total CFC | Total CFC | | 31,621,070 | | | 50,354 | | | 0.16 | | | 31,074,687 | | | 49,424 | | | 0.16 | | | Total CFC | | 32,047,555 | | | 50,620 | | | 0.16 | | | 31,074,687 | | | 49,424 | | | 0.16 | | |
| NCSC | NCSC | | 923,447 | | | 2,612 | | | 0.28 | | | 956,874 | | | 2,464 | | | 0.26 | | | NCSC | | 946,643 | | | 2,941 | | | 0.31 | | | 956,874 | | | 2,464 | | | 0.26 | | |
| RTFC | RTFC | | 538,976 | | | 1,960 | | | 0.36 | | | 487,788 | | | 1,206 | | | 0.25 | | | RTFC | | 546,040 | | | 1,993 | | | 0.36 | | | 487,788 | | | 1,206 | | | 0.25 | | |
| Total | Total | | $ | 33,083,493 | | | $ | 54,926 | | | 0.17 | | | $ | 32,519,349 | | | $ | 53,094 | | | 0.16 | | | Total | | $ | 33,540,238 | | | $ | 55,554 | | | 0.17 | | | $ | 32,519,349 | | | $ | 53,094 | | | 0.16 | | |
| | Allowance components: | Allowance components: | | | Allowance components: | | |
| Collective allowance | Collective allowance | | $ | 32,990,830 | | | $ | 29,792 | | | 0.09 | % | | $ | 32,398,910 | | | $ | 27,335 | | | 0.08 | % | | Collective allowance | | $ | 33,447,714 | | | $ | 30,762 | | | 0.09 | % | | $ | 32,398,910 | | | $ | 27,335 | | | 0.08 | % | |
| Asset-specific allowance | Asset-specific allowance | | 92,663 | | | 25,134 | | | 27.12 | | | 120,439 | | | 25,759 | | | 21.39 | | | Asset-specific allowance | | 92,524 | | | 24,792 | | | 26.80 | | | 120,439 | | | 25,759 | | | 21.39 | | |
| Total allowance for credit losses | Total allowance for credit losses | | $ | 33,083,493 | | | $ | 54,926 | | | 0.17 | | | $ | 32,519,349 | | | $ | 53,094 | | | 0.16 | | | Total allowance for credit losses | | $ | 33,540,238 | | | $ | 55,554 | | | 0.17 | | | $ | 32,519,349 | | | $ | 53,094 | | | 0.16 | | |
| | Allowance coverage ratios: | Allowance coverage ratios: | | | Allowance coverage ratios: | | |
Nonaccrual loans (3) | Nonaccrual loans (3) | | $ | 84,987 | | | 64.63 | % | | $ | 112,209 | | | 47.32 | % | | Nonaccrual loans (3) | | $ | 84,987 | | | 65.37 | % | | $ | 112,209 | | | 47.32 | % | |
___________________________
(1) Represents the unpaid principal balance, net of discounts, charge-offs and recoveries, of loans as of each period end. Excludes unamortized deferred loan origination costs of $13 million as of both August 31,November 30, 2023 and May 31, 2023.
(2)Calculated based on the allowance for credit losses attributable to each member class and allowance components at period end divided by the related loans outstanding at period end.
(3)Calculated based on the total allowance for credit losses at period end divided by loans outstanding on nonaccrual status at period end. Nonaccrual loans represented 0.26%0.25% and 0.35% of total loans outstanding as of August 31,November 30, 2023 and May 31, 2023, respectively. We provide additional information on our nonaccrual loans in “Note 4—Loans” in this Report.
The allowance for credit losses and allowance coverage ratio increased to $55$56 million and 0.17%, respectively, as of August 31,November 30, 2023, from $53 million and 0.16%, respectively, as of May 31, 2023. The $2$3 million increase in the allowance for credit losses reflected an increase in the collective allowance of $3$4 million, partially offset by a reduction in the asset-specific allowance of $1 million. The increase in the collective allowance was primarily due to loan portfolio growth and a slight decline in the overall credit quality and risk profile of our loan portfolio. The decrease in the asset-specific allowance was attributable to a timing change in the expected payments on a nonperforming CFC power supply loan.
We discuss our methodology for estimating the allowance for credit losses under the CECL model in “Note 1—Summary of Significant Accounting Policies—Allowance for Credit Losses” and provide information on management’s judgment and the uncertainties involved in our determination of the allowance for credit losses in “MD&A—Critical Accounting Estimates—Allowance for Credit Losses” in our 2023 Form 10-K. We provide additional information on our loans and allowance for credit losses under “Note 4—Loans” and “Note 5—Allowance for Credit Losses” of this Report.
Counterparty Credit Risk
In addition to credit exposure from our borrowers, we enter into other types of financial transactions in the ordinary course of business that expose us to counterparty credit risk, primarily related to transactions involving our cash and cash equivalents, time deposits, securities held in our investment securities portfolio and derivatives. We mitigate our risk by only entering into these transactions with counterparties with investment-grade ratings, establishing operational guidelines and counterparty exposure limits and monitoring our counterparty credit risk position. We evaluate our counterparties based on certain quantitative and qualitative factors and periodically assign internal risk rating grades to our counterparties.
Cash, Time Deposits and Investments Securities Counterparty Credit Exposure
Our cash and cash equivalents, time deposits and investment securities totaled $200$129 million, $400 million and $462$417 million, respectively, as of August 31,November 30, 2023. The primary credit exposure associated with investments held in our other investments portfolio is that issuers will not repay principal and interest in accordance with the contractual terms. Our cash and cash equivalents and time deposits with financial institutions generally have an original maturity of less than one year and pursuant to our investment policy guidelines, all fixed-income debt securities, at the time of purchase, must be rated at least investment grade based on external credit ratings from at least two of the leading global credit rating agencies, when available, or the corresponding equivalent, when not available. We therefore believe that the risk of default by these counterparties is low. As of August 31,November 30, 2023, our overall counterparty credit risk was deemed to be satisfactory and not materially changed compared with May 31, 2023.
We provide additional information on the holdings in our investment securities portfolio below under “Liquidity Risk—Investment Securities Portfolio” and in “Note 3—Investment Securities.”
Derivative Counterparty Credit Exposure
Our derivative counterparty credit exposure relates principally to interest-rate swap contracts. We generally engage in over-the-counter (“OTC”) derivative transactions, which expose us to individual counterparty credit risk because these transactions are executed and settled directly between us and each counterparty. We are exposed to the risk that an individual derivative counterparty defaults on payments due to us, which we may not be able to collect or which may require us to seek a replacement derivative from a different counterparty. This replacement may be at a higher cost, or we may be unable to find a suitable replacement.
We manage our derivative counterparty credit exposure by executing derivative transactions with financial institutions that have investment-grade credit ratings and maintaining enforceable master netting arrangements with these counterparties, which allow us to net derivative assets and liabilities with the same counterparty. We had 12 active derivative counterparties with credit ratings ranging from Aa1 to Baa1 by Moody’s Investors Service (“Moody’s”) as of both August 31,November 30, 2023 and May 31, 2023, respectively, and from AA- to BBB+ and AA- to A- by S&P as of August 31,November 30, 2023 and May 31, 2023, respectively. The total outstanding notional amount of derivatives with these counterparties was $7,622$7,621 million and $7,816 million as of August 31,November 30, 2023 and May 31, 2023, respectively. The highest single derivative counterparty concentration, by outstanding notional amount, accounted for approximately 24% and 23% of the total outstanding notional amount of our derivatives as of August 31,both November 30, 2023 and May 31, 2023, respectively.2023.
While our derivative agreements include netting provisions that allow for offsetting of all contracts with a given counterparty in the event of default by one of the two parties, we report the fair value of our derivatives on a gross basis by individual contract as either a derivative asset or derivative liability on our consolidated balance sheets. However, we estimate our exposure to credit loss on our derivatives by calculating the replacement cost to settle at current market prices, as defined in our derivative agreements, all outstanding derivatives in a net gain position at the counterparty level where a right of legal offset exists. We provide information on the impact of netting provisions under our master swap agreements and collateral pledged, if any, in “Note 9—Derivative Instruments and Hedging Activities—Impact of Derivatives on Consolidated Balance Sheets.” We believe our exposure to derivative counterparty risk, at any point in time, is equal to the amount of our outstanding derivatives in a net gain position, at the individual counterparty level, which totaled $509$587 million and $349 million as of August 31,November 30, 2023 and May 31, 2023, respectively.
We provide additional detail on our derivative agreements, including a discussion of derivative contracts with credit rating triggers and settlement amounts that would be required in the event of a ratings trigger, in “Note 9—Derivative Instruments and Hedging Activities.”
See “Item 1A. Risk Factors” in our 2023 Form 10-K and “Item 1A. Risk Factors” of this Report for additional information about credit risks related to our business.
We define liquidity as the ability to convert assets into cash quickly and efficiently, maintain access to available funding and roll-over or issue new debt under normal operating conditions and periods of CFC-specific and/or market stress, to ensure that we can meet borrower loan requests, pay current and future obligations and fund our operations in a cost-effective manner. We provide additional information on our liquidity risk-management framework under “Item 7. MD&A—Liquidity Risk—Liquidity Risk Management” in our 2023 Form 10-K.
In addition to cash on hand and time deposits, our primary sources of funds include member loan principal repayments, securities held in our investment portfolio, committed bank revolving lines of credit, committed loan facilities under the Guaranteed Underwriter Program, a revolving note purchase agreement with Farmer Mac and proceeds from debt issuances to members and in the public capital markets. Our primary uses of funds include loan advances to members, principal and interest payments on borrowings, periodic interest settlement payments related to our derivative contracts and operating expenses.
Available Liquidity
As part of our strategy in managing liquidity risk and meeting our liquidity objectives, we seek to maintain various committed sources of funding that are available to meet our near-term liquidity needs. Table 1416 presents a comparison between our available liquidity, which consists of cash and cash equivalents, time deposits, our debt securities investment portfolio and amounts under committed credit facilities, as of August 31,November 30, 2023 and May 31, 2023.
Table 14:16: Available Liquidity
| | | August 31, 2023 | | May 31, 2023 | | November 30, 2023 | | May 31, 2023 |
| (Dollars in millions) | (Dollars in millions) | | Total | | Accessed | | Available | | Total | | Accessed | | Available | (Dollars in millions) | | Total | | Accessed | | Available | | Total | | Accessed | | Available |
| Liquidity sources: | Liquidity sources: | | | | | | | | | | | | | Liquidity sources: | | | | | | | | | | | | |
| Cash and investment debt securities: | | |
| Cash, time deposits and investment debt securities: | | Cash, time deposits and investment debt securities: | |
| Cash and cash equivalents | Cash and cash equivalents | | $ | 200 | | | $ | — | | | $ | 200 | | | $ | 199 | | | $ | — | | | $ | 199 | | Cash and cash equivalents | | $ | 129 | | | $ | — | | | $ | 129 | | | $ | 199 | | | $ | — | | | $ | 199 | |
| Time deposits | | Time deposits | | 400 | | | — | | | 400 | | | — | | | — | | | — | |
Debt securities investment portfolio(1) | Debt securities investment portfolio(1) | | 425 | | | — | | | 425 | | | 475 | | | — | | | 475 | | Debt securities investment portfolio(1) | | 381 | | | — | | | 381 | | | 475 | | | — | | | 475 | |
| Total cash and investment debt securities | | 625 | | | — | | | 625 | | | 674 | | | — | | | 674 | | |
| Total cash, time deposits and investment debt securities | | Total cash, time deposits and investment debt securities | | 910 | | | — | | | 910 | | | 674 | | | — | | | 674 | |
| Committed credit facilities: | Committed credit facilities: | | | | | | | | | | | | | Committed credit facilities: | | | | | | | | | | | | |
Committed bank revolving line of credit agreements—unsecured(2) | Committed bank revolving line of credit agreements—unsecured(2) | | 2,600 | | | 2 | | | 2,598 | | | 2,600 | | | 2 | | | 2,598 | | Committed bank revolving line of credit agreements—unsecured(2) | | 2,800 | | | 2 | | | 2,798 | | | 2,600 | | | 2 | | | 2,598 | |
Guaranteed Underwriter Program committed facilities—secured(3) | Guaranteed Underwriter Program committed facilities—secured(3) | | 9,473 | | | 8,448 | | | 1,025 | | | 9,473 | | | 8,448 | | | 1,025 | | Guaranteed Underwriter Program committed facilities—secured(3) | | 9,473 | | | 8,723 | | | 750 | | | 9,473 | | | 8,448 | | | 1,025 | |
Farmer Mac revolving note purchase agreement—secured(4) | Farmer Mac revolving note purchase agreement—secured(4) | | 6,000 | | | 3,626 | | | 2,374 | | | 6,000 | | | 3,150 | | | 2,850 | | Farmer Mac revolving note purchase agreement—secured(4) | | 6,000 | | | 3,902 | | | 2,098 | | | 6,000 | | | 3,150 | | | 2,850 | |
| Total committed credit facilities | Total committed credit facilities | | 18,073 | | | 12,076 | | | 5,997 | | | 18,073 | | | 11,600 | | | 6,473 | | Total committed credit facilities | | 18,273 | | | 12,627 | | | 5,646 | | | 18,073 | | | 11,600 | | | 6,473 | |
| Total available liquidity | Total available liquidity | | $ | 18,698 | | | $ | 12,076 | | | $ | 6,622 | | | $ | 18,747 | | | $ | 11,600 | | | $ | 7,147 | | Total available liquidity | | $ | 19,183 | | | $ | 12,627 | | | $ | 6,556 | | | $ | 18,747 | | | $ | 11,600 | | | $ | 7,147 | |
(1)Represents the aggregate fair value of our portfolio of debt securities as of period end. Our portfolio of equity securities consists primarily of preferred stock securities that are not as readily redeemable; therefore, we exclude our portfolio of equity securities from our available liquidity.
(2)The committed bank revolving line of credit agreements consist of a three-year and a four-year revolving line of credit agreement. The accessed amount of $2 million as of both August 31,November 30, 2023 and May 31, 2023, relates to letters of credit issued pursuant to the four-year revolving line of credit agreement.
(3)The committed facilities under the Guaranteed Underwriter Program are not revolving.
(4)Availability subject to market conditions.
Although as a nonbank financial institution we are not subject to regulatory liquidity requirements, our liquidity management framework includes monitoring our liquidity and funding positions on an ongoing basis and assessing our ability to meet our scheduled debt obligations and other cash flow requirements based on point-in-time metrics as well as forward-looking projections. Our liquidity and funding assessment takes into consideration amounts available under existing liquidity sources, the expected rollover of member short-term investments and scheduled loan principal payment amounts, as well as our continued ability to access the capital markets and other non-capital market related funding sources.
Liquidity Risk Assessment
We utilize several measures to assess our liquidity risk and ensure we have adequate coverage to meet our liquidity needs. Our primary liquidity measures indicate the extent to which we have sufficient liquidity to cover the payment of scheduled debt obligations over the next 12 months. We calculate our liquidity coverage ratios under several scenarios that take into consideration various assumptions about our near-term sources and uses of liquidity, including the assumption that maturities of member short-term investments will not have a significant impact on our anticipated cash outflows. Our members have historically maintained a relatively stable level of short-term investments in CFC in the form of daily liquidity fund notes, commercial paper, select notes and medium-term notes. As such, we expect that our members will continue to reinvest their excess cash in short-term investment products offered by CFC.
Table 1517 presents our primary liquidity coverage ratios as of August 31,November 30, 2023 and May 31, 2023 and displays the calculation of each ratio as of these respective dates based on the assumptions discussed above.
Table 15:17: Liquidity Coverage Ratios
| | (Dollars in millions) | (Dollars in millions) | | August 31, 2023 | | May 31, 2023 | (Dollars in millions) | | November 30, 2023 | | May 31, 2023 |
Liquidity coverage ratio:(1) | Liquidity coverage ratio:(1) | | | | | Liquidity coverage ratio:(1) | | | | |
Total available liquidity(2) | Total available liquidity(2) | | $ | 6,622 | | | $ | 7,147 | | Total available liquidity(2) | | $ | 6,556 | | | $ | 7,147 | |
| Debt scheduled to mature over next 12 months: | Debt scheduled to mature over next 12 months: | | | | | Debt scheduled to mature over next 12 months: | | | | |
| Short-term borrowings | Short-term borrowings | | 5,124 | | | 4,546 | | Short-term borrowings | | 5,162 | | | 4,546 | |
| Long-term and subordinated debt scheduled to mature over next 12 months | Long-term and subordinated debt scheduled to mature over next 12 months | | 1,887 | | | 2,383 | | Long-term and subordinated debt scheduled to mature over next 12 months | | 2,218 | | | 2,383 | |
| Total debt scheduled to mature over next 12 months | Total debt scheduled to mature over next 12 months | | 7,011 | | | 6,929 | | Total debt scheduled to mature over next 12 months | | 7,380 | | | 6,929 | |
| Excess (deficit) in available liquidity over debt scheduled to mature over next 12 months | Excess (deficit) in available liquidity over debt scheduled to mature over next 12 months | | $ | (389) | | | $ | 218 | | Excess (deficit) in available liquidity over debt scheduled to mature over next 12 months | | $ | (824) | | | $ | 218 | |
| | Liquidity coverage ratio | Liquidity coverage ratio | | 0.94 | | 1.03 | Liquidity coverage ratio | | 0.89 | | 1.03 |
| Liquidity coverage ratio, excluding expected maturities of member short-term investments(3) | Liquidity coverage ratio, excluding expected maturities of member short-term investments(3) | | | Liquidity coverage ratio, excluding expected maturities of member short-term investments(3) | |
Total available liquidity(2) | Total available liquidity(2) | | $ | 6,622 | | | $ | 7,147 | | Total available liquidity(2) | | $ | 6,556 | | | $ | 7,147 | |
| Total debt scheduled to mature over next 12 months | Total debt scheduled to mature over next 12 months | | 7,011 | | | 6,929 | | Total debt scheduled to mature over next 12 months | | 7,380 | | | 6,929 | |
| Exclude: Member short-term investments | Exclude: Member short-term investments | | (3,536) | | | (3,253) | | Exclude: Member short-term investments | | (3,623) | | | (3,253) | |
| Total debt, excluding member short-term investments, scheduled to mature over next 12 months | Total debt, excluding member short-term investments, scheduled to mature over next 12 months | | 3,475 | | | 3,676 | | Total debt, excluding member short-term investments, scheduled to mature over next 12 months | | 3,757 | | | 3,676 | |
| Excess in available liquidity over total debt, excluding member short-term investments, scheduled to mature over next 12 months | Excess in available liquidity over total debt, excluding member short-term investments, scheduled to mature over next 12 months | | $ | 3,147 | | | $ | 3,471 | | Excess in available liquidity over total debt, excluding member short-term investments, scheduled to mature over next 12 months | | $ | 2,799 | | | $ | 3,471 | |
| | Liquidity coverage ratio, excluding expected maturities of member short-term investments | Liquidity coverage ratio, excluding expected maturities of member short-term investments | | 1.91 | | 1.94 | Liquidity coverage ratio, excluding expected maturities of member short-term investments | | 1.75 | | 1.94 |
___________________________
(1)Calculated based on available liquidity at period end divided by total debt scheduled to mature over the next 12 months at period end.
(2)Total available liquidity is presented above in Table 14.16.
(3)Calculated based on available liquidity at period end divided by debt, excluding member short-term investments, scheduled to mature over the next 12 months.
As presented in Table 17 above, our available liquidity of $6,556 million as of November 30, 2023 was $824 million below our total scheduled debt obligations over the next 12 months of $7,380 million, consisting of short-term borrowings and long-term and subordinated debt. The short-term borrowings scheduled maturity amount consists of member investments of $3,623 million, dealer commercial paper of $1,039 million and Farmer Mac notes payable of $500 million. The long-term and subordinated scheduled debt obligations over the next 12 months of $2,218 million consist of debt maturities and scheduled debt payment amounts, of which, $165 million was from member investments.
We believe we can continue to roll over our member short-term investments of $3,623 million as of November 30, 2023, based on our expectation that our members will continue to reinvest their excess cash in short-term investment products offered by CFC. As mentioned above, our members historically have maintained a relatively stable level of short-term investments in CFC. Member short-term investments in CFC have averaged $3,589 million over the last 12 fiscal quarter-end reporting periods. Our available liquidity as of November 30, 2023 was $2,799 million in excess of, or 1.7 times over, our total scheduled debt obligations, excluding member short-term investments, over the next 12 months of $3,757 million. In addition, we expect to receive $1,516 million from scheduled long-term loan principal payments over the next 12 months.
We expect to continue accessing the dealer commercial paper market as a cost-effective means of satisfying our incremental short-term liquidity needs. Although the intra-quarter amount of dealer commercial paper outstanding may fluctuate based on our liquidity requirements, our intent is to manage our short-term wholesale funding risk by maintaining the dealer commercial paper outstanding at each quarter-end within a range of $1,000 million to $1,500 million. To mitigate commercial paper rollover risk, we expect to continue to maintain our committed bank revolving line of credit agreements and be in compliance with the covenants of these agreements so we can draw on these facilities, if necessary, to repay dealer or member commercial paper that cannot be refinanced with similar debt. In addition, under master repurchase agreements we have with our bank counter parties, we can obtain short-term funding in secured borrowing transactions by selling investment-grade corporate debt securities from our investment securities portfolio subject to an obligation to repurchase the same or similar securities at an agreed-upon price and date.
The issuance of long-term debt, which represents the most significant component of our funding, allows us to reduce our reliance on short-term borrowings, as well as effectively manage our refinancing and interest rate risk. We expect to continue to issue long-term debt in the public capital markets and under our other non-capital market debt arrangements to meet our funding needs and believe that we have sufficient sources of liquidity to meet our debt obligations and support our operations over the next 12 months.
Investment Securities Portfolio
We have an investment portfolio, composed of time deposits, debt securities classified as trading and equity securities, bothsecurities. Our time deposits have maturities of less than one year and are valued at carrying value, which approximates fair value. Total time deposits were $400 million as of November 30, 2023. We did not have any time deposits outstanding as of May 31, 2023. The debt securities are reported on our consolidated balance sheets at fair value. The aggregate fair value of the securities in our investment portfolio was $462$417 million as of August 31,November 30, 2023, consisting of debt securities with a fair value of $425$381 million and equity securities with a fair value of $37$36 million. In comparison, the aggregate fair value of the securities in our investment portfolio was $510 million as of May 31, 2023, consisting of debt securities with a fair value of $475 million and equity securities with a fair value of $35 million.
Our debt securities investment portfolio is intended to serve as an additional source of liquidity. Under master repurchase agreements that we have with counterparties, we can obtain short-term funding by selling investment-grade corporate debt securities from our investment portfolio subject to an obligation to repurchase the same or similar securities at an agreed-upon price and date. Because we retain effective control over the transferred securities, transactions under these repurchase agreements are accounted for as collateralized financing agreements (i.e., secured borrowings) and not as a sale and subsequent repurchase of securities. The obligation to repurchase the securities is reflected as a component of our short-term borrowings on our consolidated balance sheets. The aggregate fair value of debt securities underlying repurchase transactions is parenthetically disclosed on our consolidated balance sheets. We had no borrowings under repurchase
agreements outstanding as of both August 31,November 30, 2023 and May 31, 2023; therefore, we had no debt securities in our investment portfolio pledged as collateral as of each respective date.
We provide additional information on our investment securities portfolio in “Note 3—Investment Securities” of this Report.
Borrowing Capacity Under Various Credit FacilitiesShort-Term Borrowings
Short-term borrowings consist of borrowings with an original contractual maturity of one year or less and do not include the current portion of long-term debt. Short-term borrowings increased to $5,162 million as of November 30, 2023, from $4,546 million as of May 31, 2023, primarily driven by increase in short-term notes payable advanced under the Farmer Mac revolving purchase agreement and short-term member investments, partially offset by a decrease in outstanding dealer commercial paper. Short-term borrowings accounted for 16% and 15% of total debt outstanding as of November 30, 2023 and May 31, 2023, respectively.
See “Liquidity Risk” below and “Note 6—Short-Term Borrowings” for information on the composition of our short-term borrowings.
Long-Term and Subordinated Debt
Long-term debt, defined as debt with an original contractual maturity term of greater than one year, primarily consists of medium-term notes, collateral trust bonds, notes payable under the Guaranteed Underwriter Program and notes payable under the Farmer Mac revolving note purchase agreement. Subordinated debt consists of subordinated deferrable debt and members’ subordinated certificates. Our subordinated deferrable debt and members’ subordinated certificates have original contractual maturity terms of greater than one year.
Long-term and subordinated debt increased to $27,033 million as of November 30, 2023, from $26,453 million as of May 31, 2023, primarily due to net increase of $665 million in medium term notes, $252 million in notes payable under the Farmer Mac revolving purchase agreement, and $174 million in notes payable under the Guaranteed Underwriter Program, partially offset by repayments of $405 million of collateral trust bonds and the early redemption of $100 million of our subordinated deferrable debt. Long-term and subordinated debt accounted for 84% and 85% of total debt outstanding as of November 30, 2023 and May 31, 2023, respectively.
We provide additional information on our long-term debt below under the “Liquidity Risk” section and in “Note 7—Long-Term Debt” and “Note 8—Subordinated Deferrable Debt” of this Report.
Equity
Table 12 presents the components of total CFC equity and total equity as of November 30, 2023 and May 31, 2023.
Table 12: Equity
| | | | | | | | | | | | | | |
| (Dollars in thousands) | | November 30, 2023 | | May 31, 2023 |
| Equity components: | | | | |
| Membership fees and educational fund: | | | | |
| Membership fees | | $ | 970 | | | $ | 969 | |
| Educational fund | | 1,916 | | | 2,565 | |
| Total membership fees and educational fund | | 2,886 | | | 3,534 | |
| Patronage capital allocated | | 934,135 | | | 1,006,115 | |
| Members’ capital reserve | | 1,202,152 | | | 1,202,152 | |
| Total allocated equity | | 2,139,173 | | | 2,211,801 | |
| Unallocated net income (loss): | | | | |
Prior fiscal year-end cumulative derivative forward value gains(1) | | 342,624 | | | 92,363 | |
Year-to-date derivative forward value gains (1) | | 239,307 | | | 250,261 | |
Period-end cumulative derivative forward value gains(1) | | 581,931 | | | 342,624 | |
| Other unallocated net income (loss) | | 136,284 | | | (709) | |
| Unallocated net income | | 718,215 | | | 341,915 | |
| CFC retained equity | | 2,857,388 | | | 2,553,716 | |
| Accumulated other comprehensive income | | 8,618 | | | 8,343 | |
| Total CFC equity | | 2,866,006 | | | 2,562,059 | |
| Noncontrolling interests | | 30,134 | | | 27,190 | |
| Total equity | | $ | 2,896,140 | | | $ | 2,589,249 | |
| | | | |
____________________________(1)Represents derivative forward value gains (losses) for CFC only, as total CFC equity does not include the noncontrolling interests of the variable interest entities NCSC and RTFC, which we are required to consolidate. We present the consolidated total derivative forward value gains (losses) in Table 30 in the “Non-GAAP Financial Measures” section below. Also, see “Note 14—Business Segments” for the statements of operations for CFC.
The increase in total equity of $307 million to $2,896 million as of November 30, 2023 was attributable to our reported net income of $376 million for YTD FY2024, partially offset by the CFC Board of Directors’ authorized patronage capital retirement in July 2023 of $72 million.
Allocation and Retirement of Patronage Capital
We are subject to District of Columbia law governing cooperatives, under which CFC is required to make annual allocations of net earnings, if any, in accordance with the provisions of the District of Columbia statutes. We describe the allocation requirements under “Item 7. MD&A—Consolidated Balance Sheet Analysis—Equity—Allocation and Retirement of Patronage Capital” in our 2023 Form 10-K. The amount of patronage capital allocated each year by CFC’s Board of Directors is based on non-GAAP adjusted net income, which excludes the impact of derivative forward value gains (losses). We provide a reconciliation of our adjusted net income to our reported net income and an explanation of the adjustments below in “Non-GAAP Financial Measures.”
In May 2023, the CFC Board of Directors authorized the allocation of $1 million of net earnings for fiscal year 2023 to the cooperative educational fund. In July 2023, the CFC Board of Directors authorized the allocation of fiscal year 2023 adjusted net income as follows: $110 million to members in the form of patronage capital and $140 million to the members’ capital reserve.
In July 2023, the CFC Board of Directors also authorized the retirement of patronage capital totaling $72 million, of which $55 million represented 50% of the patronage capital allocation for fiscal year 2023, and $17 million represented the portion of the allocation from fiscal year 1998 net earnings that has been held for 25 years pursuant to the CFC Board of Directors’ policy. This amount was returned to members in cash in September 2023. The remaining portion of the patronage capital allocation for fiscal year 2023 will be retained by CFC for 25 years pursuant to the guidelines adopted by the CFC Board of Directors in June 2009.
| | |
| ENTERPRISE RISK MANAGEMENT |
Overview
CFC has an Enterprise Risk Management (“ERM”) framework that is designed to identify, assess, monitor and manage the risks we assume in conducting our activities to serve the financial needs of our members. We face a variety of risks that can significantly affect our financial performance, liquidity, reputation and ability to meet the expectations of our members, investors and other stakeholders. As a financial services company, the major categories of risk exposures inherent in our business activities include credit risk, liquidity risk, market risk and operational risk. These risk categories are summarized below.
•Credit risk is the risk that a borrower or other counterparty will be unable to meet its obligations in accordance with agreed-upon terms.
•Liquidity risk is the risk that we will be unable to fund our operations and meet our contractual obligations or that we will be unable to fund new loans to borrowers at a reasonable cost and tenor in a timely manner.
•Market risk is the risk that changes in market variables, such as movements in interest rates, may adversely affect the match between the timing of the contractual maturities, repricing and prepayments of our financial assets and the related financial liabilities funding those assets.
•Operational risk is the risk of loss resulting from inadequate or failed internal controls, processes, systems, human error or external events, including natural disasters or public health emergencies, such as the COVID-19 pandemic. Operational risk also includes cybersecurity risk, compliance risk, fiduciary risk, reputational risk and litigation risk.
Effective risk management is critical to our overall operations and to achieving our primary objective of providing cost-based financial products to our rural electric members while maintaining the sound financial results required for investment-grade credit ratings on our rated debt instruments. Accordingly, we have a risk-management framework that is intended to govern the principal risks we face in conducting our business and the aggregate borrowing capacityamount of risk we are willing to accept, referred to as risk tolerance as well as risk limits and related guidelines, in the context of CFC’s mission and strategic objectives and initiatives. We provide a discussion of our risk management framework in our 2023 Form 10-K under “Item 7. MD&A—Enterprise Risk Management” and describe how we manage these risks under each respective MD&A section in our 2023 Form 10-K.
Our loan portfolio, which represents the largest component of assets on our balance sheet, accounts for the substantial majority of our credit risk exposure. We also engage in certain nonlending activities that may give rise to counterparty credit risk, such as entering into derivative transactions to manage interest rate risk and purchasing investment securities. We provide additional information on our credit risk-management framework under “Item 7. MD&A—Credit Risk—Credit Risk Management” in our 2023 Form 10-K.
Loan Portfolio Credit Risk
Our primary credit exposure is loans to rural electric cooperatives, which provide essential electric services to end-users, the majority of which are residential customers. We also have a limited portfolio of loans to not-for-profit and for-profit telecommunication companies. Loans outstanding to electric utility organizations totaled $32,994 million and $32,032 million as of November 30, 2023 and May 31, 2023, respectively, representing 98% and 99% of our total loans outstanding as of each respective date. The remaining loans outstanding in our loan portfolio were to RTFC members, affiliates and associates in the telecommunications industry sector. The substantial majority of loans to our borrowers are long-term fixed-rate loans with terms of up to 35 years. Long-term fixed-rate loans accounted for 88% and 87% of total loans outstanding as of November 30, 2023 and May 31, 2023, respectively.
Because we lend primarily to our rural electric utility cooperative members, we have had a loan portfolio inherently subject to single-industry and single-obligor credit concentration risk since our inception in 1969. We historically, however, have experienced limited defaults and losses in our electric utility loan portfolio due to several factors. First, the majority of our electric cooperative borrowers operate in states where electric cooperatives are not subject to rate regulation. Thus, they are able to make rate adjustments to pass along increased costs to the end customer without first obtaining state regulatory approval, allowing them to cover operating costs and generate sufficient earnings and cash flows to service their debt obligations. Second, electric cooperatives face limited competition, as they tend to operate in exclusive territories not serviced by public investor-owned utilities. Third, electric cooperatives typically are consumer-owned, not-for-profit entities that provide an essential service to end-users, the majority of which are residential customers. As not-for-profit entities, rural electric cooperatives, unlike investor-owned utilities, generally are eligible to apply for assistance from the Federal Emergency Management Agency (“FEMA”) and states to help recover from major disasters or emergencies. Fourth, electric cooperatives tend to adhere to a conservative core business strategy model that has historically resulted in a relatively stable, resilient operating environment and overall strong financial performance and credit strength for the electric cooperative network. Finally, we generally lend to our members on a senior secured basis, which reduces the risk of loss in the event of a borrower default.
Below we provide information on the credit risk profile of our loan portfolio, including security provisions, credit concentration, credit quality indicators and our allowance for credit losses.
Security Provisions
Except when providing line of credit loans, we generally lend to our members on a senior secured basis. Table 13 presents, by legal entity and member class and by loan type, secured and unsecured loans in our loan portfolio as of November 30, 2023 and May 31, 2023. Of our total loans outstanding, 92% were secured as of both November 30, 2023 and May 31, 2023.
Table 13: Loans—Loan Portfolio Security Profile | | | | | | | | | | | | | | | | | | | | | | | | | | | | | | | | |
| | November 30, 2023 |
| (Dollars in thousands) | | Secured | | % of Total | | Unsecured | | % of Total | | Total |
| Member class: | | | | | | | | | | |
| CFC: | | | | | | | | | | |
| Distribution | | $ | 24,313,913 | | | 93 | % | | $ | 1,727,759 | | | 7 | % | | $ | 26,041,672 | |
| Power supply | | 4,930,834 | | | 86 | | | 806,763 | | 14 | | | 5,737,597 | |
| Statewide and associate | | 214,338 | | | 80 | | | 53,948 | | 20 | | | 268,286 | |
| Total CFC | | 29,459,085 | | | 92 | | | 2,588,470 | | | 8 | | | $ | 32,047,555 | |
| NCSC | | 930,516 | | | 98 | | | 16,127 | | | 2 | | | 946,643 | |
| RTFC | | 512,643 | | | 94 | | | 33,397 | | | 6 | | | 546,040 | |
Total loans outstanding(1) | | $ | 30,902,244 | | | 92 | | | $ | 2,637,994 | | | 8 | | | $ | 33,540,238 | |
| | | | | | | | | | |
| Loan type: | | | | | | | | | | |
| Long-term loans: | | | | | | | | | | |
| Fixed rate | | $ | 29,231,901 | | | 99 | % | | $ | 156,721 | | | 1 | % | | $ | 29,388,622 | |
| Variable rate | | 857,535 | | | 100 | | | 1,547 | | | — | | | 859,082 | |
| Total long-term loans | | 30,089,436 | | | 99 | | | 158,268 | | | 1 | | | 30,247,704 | |
| Line of credit loans | | 812,808 | | | 25 | | | 2,479,726 | | | 75 | | | 3,292,534 | |
Total loans outstanding(1) | | $ | 30,902,244 | | | 92 | | | $ | 2,637,994 | | | 8 | | | $ | 33,540,238 | |
| | | | | | | | | | | | | | | | | | | | | | | | | | | | | | | | |
| | | | | | | | | | |
| | May 31, 2023 |
| (Dollars in thousands) | | Secured | | % of Total | | Unsecured | | % of Total | | Total |
| Member class: | | | | | | | | | | |
| CFC: | | | | | | | | | | |
| Distribution | | $ | 23,736,624 | | | 93 | % | | $ | 1,700,453 | | | 7 | % | | $ | 25,437,077 | |
| Power supply | | 4,633,558 | | | 85 | | | 803,684 | | 15 | | | 5,437,242 | |
| Statewide and associate | | 157,342 | | | 79 | | | 43,026 | | | 21 | | | 200,368 | |
| Total CFC | | $ | 28,527,524 | | | 92 | | | 2,547,163 | | | 8 | | | 31,074,687 | |
| NCSC | | 925,925 | | | 97 | | | 30,949 | | | 3 | | | 956,874 | |
| RTFC | | 462,209 | | | 95 | | | 25,579 | | | 5 | | | 487,788 | |
Total loans outstanding(1) | | $ | 29,915,658 | | | 92 | | | $ | 2,603,691 | | | 8 | | | $ | 32,519,349 | |
| | | | | | | | | | |
| Loan type: | | | | | | | | | | |
| Long-term loans: | | | | | | | | | | |
| Fixed rate | | $ | 28,203,752 | | | 99 | % | | $ | 167,606 | | | 1 | % | | $ | 28,371,358 | |
| Variable rate | | 1,022,841 | | | 100 | | | 1,812 | | | — | | | 1,024,653 | |
| | | | | | | | | | |
| Total long-term loans | | 29,226,593 | | | 99 | | | 169,418 | | | 1 | | | 29,396,011 | |
| Line of credit loans | | 689,065 | | | 22 | | | 2,434,273 | | | 78 | | | 3,123,338 | |
Total loans outstanding(1) | | $ | 29,915,658 | | | 92 | | | $ | 2,603,691 | | | 8 | | | $ | 32,519,349 | |
____________________________
(1) Represents the unpaid principal balance, net of discounts, charge-offs and recoveries, of loans as of the end of each period. Excludes unamortized deferred loan origination costs of $13 million as of both November 30, 2023 and May 31, 2023.
Credit Concentration
Concentrations of credit may exist when a lender has large credit exposures to single borrowers, large credit exposures to borrowers in the same industry sector or engaged in similar activities or large credit exposures to borrowers in a geographic region that would cause the borrowers to be similarly impacted by economic or other conditions in the region. As discussed
above under “Credit Risk—Loan Portfolio Credit Risk,” because we lend primarily to our rural electric utility cooperative members, our loan portfolio is inherently subject to single-industry and single-obligor credit concentration risk. Loans outstanding to electric utility organizations totaled $32,994 million and $32,032 million as of November 30, 2023 and May 31, 2023, respectively, and represented approximately 98% and 99% of our total loans outstanding as of each respective date. Our credit exposure is partially mitigated by long-term loans guaranteed by RUS, which totaled $118 million and $123 million as of November 30, 2023 and May 31, 2023, respectively.
Single-Obligor Concentration
Table 14 displays the outstanding loan exposure for our 20 largest borrowers, by legal entity and member class, as of November 30, 2023 and May 31, 2023. Our 20 largest borrowers consisted of 12 distribution systems and eight power supply systems as of November 30, 2023 compared to 10 distribution systems and 10 power supply systems as of May 31, 2023. The largest total exposure to a single borrower or controlled group represented approximately 1% of total loans outstanding as of both November 30, 2023 and May 31, 2023.
Table 14: Loans—Loan Exposure to 20 Largest Borrowers
| | | | | | | | | | | | | | | | | | | | | | | | | | | |
| | | November 30, 2023 | | May 31, 2023 | |
| (Dollars in thousands) | | Amount | | % of Total | | Amount | | % of Total | |
| Member class: | | | | | | | | | |
| CFC: | | | | | | | | | |
| Distribution | | $ | 4,148,154 | | | 13 | % | | $ | 3,600,193 | | | 11 | % | |
| Power supply | | 2,422,605 | | | 7 | | | 2,782,098 | | | 9 | | |
| Total CFC | | 6,570,759 | | | 20 | | | 6,382,291 | | | 20 | | |
| NCSC | | 181,750 | | | — | | | 205,321 | | | — | | |
| Total loan exposure to 20 largest borrowers | | 6,752,509 | | | 20 | | | 6,587,612 | | | 20 | | |
| Less: Loans covered under Farmer Mac standby purchase commitment | | (226,225) | | | (1) | | | (266,754) | | | (1) | | |
| Net loan exposure to 20 largest borrowers | | $ | 6,526,284 | | | 19 | % | | $ | 6,320,858 | | | 19 | % | |
We entered into a long-term standby purchase commitment agreement with Farmer Mac during fiscal year 2016. Under this agreement, we may designate certain long-term loans to be covered under the commitment, subject to approval by Farmer Mac, and in the event any such loan later goes into payment default for at least 90 days, upon request by us, Farmer Mac must purchase such loan at par value. The aggregate unpaid principal balance of designated and Farmer Mac approved loans was $421 million and $436 million as of November 30, 2023 and May 31, 2023, respectively. Loan exposure to our 20 largest borrowers covered under the Farmer Mac agreement totaled $226 million and $267 million as of November 30, 2023 and May 31, 2023, respectively, which reduced our exposure to the 20 largest borrowers to 19% as of each respective date. No loans have been put to Farmer Mac for purchase pursuant to this agreement.
Geographic Concentration
Although our organizational structure and mission result in single-industry concentration, we serve a geographically diverse group of electric and telecommunications borrowers throughout the U.S. The consolidated number of borrowers with loans outstanding totaled 891 and 884 as of November 30, 2023 and May 31, 2023, respectively, located in 49 states and the District of Columbia. Of the 891 and 884 borrowers with loans outstanding as of November 30, 2023 and May 31, 2023, respectively, 50 and 52 were electric power supply borrowers as of each respective date. Electric power supply borrowers generally require significantly more capital than electric distribution and telecommunications borrowers.
Texas, which had 67 and 69 borrowers with loans outstanding as of November 30, 2023 and May 31, 2023, respectively, accounted for the largest number of borrowers with loans outstanding in any one state as of each respective date, as well as the largest concentration of loan exposure in any one state. Loans outstanding to Texas-based borrowers totaled $5,653 million and $5,529 million as of November 30, 2023 and May 31, 2023, respectively, and accounted for approximately 17% of total loans outstanding as of each respective date. Of the loans outstanding to Texas-based borrowers, $151 million and
$155 million as of November 30, 2023 and May 31, 2023, respectively, were covered by the Farmer Mac standby repurchase agreement, which reduced our credit risk exposure to Texas-based borrowers to $5,502 million and $5,373 million as of each respective date. See “Note 4—Loans” for information on the Texas-based number of borrowers and loans outstanding by legal entity and member class.
Credit Quality Indicators
Assessing the overall credit quality of our loan portfolio and measuring our credit risk is an ongoing process that involves tracking payment status, modifications to borrowers experiencing financial difficulty, nonperforming loans, charge-offs, the internal risk ratings of our borrowers and other indicators of credit risk. We monitor and subject each borrower and loan facility in our loan portfolio to an individual risk assessment based on quantitative and qualitative factors. Payment status trends and internal risk ratings are indicators, among others, of the probability of borrower default and overall credit quality of our loan portfolio. We believe the overall credit quality of our loan portfolio remained strong as of November 30, 2023.
Loan Modifications to Borrowers Experiencing Financial Difficulty
We actively monitor problem loans and, from time to time, attempt to work with borrowers to manage such exposures through loan workouts or modifications that better align with the borrower’s current ability to pay. Therefore, as part of our loss mitigation efforts, we may provide modifications to a borrower experiencing financial difficulty to improve long-term collectability of the loan and to avoid the need for exercising remedies. We consider the impact of all loan modifications when estimating the credit quality of our loan portfolio and establishing the allowance for credit losses.
On June 1, 2023, we adopted ASU 2022-02, Financial Instruments – Credit Losses (Topic 326) – Troubled Debt Restructurings and Vintage Disclosures, using the prospective adoption method. The ASU eliminated the accounting guidance for TDRs and enhanced the disclosure requirements for loan refinancings and restructurings made with borrowers experiencing financial difficulty, which are to be applied prospectively. For additional information on the adoption of ASU 2022-02 see “Note 1—Summary of Significant Accounting Policies.”
We had one loan modification to a RTFC borrower experiencing financial difficulty during Q2 FY2024 and YTD FY2024. This loan received a term extension and had an amortized cost of $3 million as of November 30, 2023, representing 1% of the RTFC loan portfolio. Loans modified to borrowers experiencing financial difficulty totaled $3 million as of November 30, 2023, consisting of one RTFC loan as discussed above, which wasperforming in accordance with the terms of the loan agreement. There were no unadvanced loan commitments related to this loan.
Troubled Debt Restructurings—Prior to Adoption of ASU 2022-02
As discussed above, ASU 2022-02 eliminated the accounting guidance for TDRs. Prior to the adoption of ASU 2022-02, a loan restructuring or modification of terms is accounted for as TDR if, for economic or legal reasons related to the borrower’s financial difficulties, a concession is granted to the borrower that we would not otherwise consider.
We had loans outstanding to two borrowers totaling $8 million which have been performing in accordance with the terms of their respective restructured loan agreement for an extended period of time and were classified as performing TDR loans and on accrual status as of May 31, 2023. We had loans outstanding to Brazos totaling $23 million classified as nonperforming TDR loans during the three months ended February 28, 2023 (“Q3 FY2023”), which were on non-accrual status as of May 31, 2023. During Q1 FY2024, we received the remaining payment of Brazos’ loans outstanding of $23 million in accordance with the provisions of Brazos’ plan of reorganization to repay its loans in full. Prior to the Brazos loan restructuring, we have not had any loan modifications that were required to be accounted for as TDRs since fiscal year 2016.
Nonperforming Loans
We classify loans as nonperforming at the earlier of the date when we determine: (i) interest or principal payments on the loan is past due 90 days or more; (ii) as a result of court proceedings, the collection of interest or principal payments based on the original contractual terms is not expected; or (iii) the full and timely collection of interest or principal is otherwise uncertain. Once a loan is classified as nonperforming, we generally place the loan on nonaccrual status. Interest accrued but not collected at the date a loan is placed on nonaccrual status is reversed against earnings.
We had a loan to one CFC electric power supply borrower totaling $85 million classified as nonperforming as of November 30, 2023. In comparison, we had loans to two CFC electric power supply borrowers totaling $89 million classified as nonperforming as of May 31, 2023. Nonperforming loans represented 0.25% and 0.27% of total loans outstanding as of November 30, 2023 and May 31, 2023, respectively. The reduction in nonperforming loans of $4 million was due to the receipt of $4 million in loan payments from Brazos Sandy Creek to pay off its nonperforming loan outstanding during the YTD FY2024.
We provide additional information on nonperforming loans in “Note 4—Loans—Credit Quality Indicators—Nonperforming Loans.”
Net Charge-Offs
We had no charge-offs during Q2 FY2024 and YTD FY2024. We received a total of $28 million in loan payments from Brazos and Brazos Sandy Creek to repay their $27 million of total loans outstanding in full during Q1 FY2024. The additional payment received of $1 million was recorded as a loan recovery on the Brazos and Brazos Sandy Creek previously charged-off loan amounts, which resulted in an annualized net recovery rate of 0.01% for YTD FY2024. In comparison, we had charge-offs totaling $15 million for the CFC electric power supply loan portfolio related to Brazos and Brazos Sandy Creek nonperforming loans during Q2 FY2023 and YTD FY2023, which resulted in an annualized net charge-off rate of 0.19% and 0.10% for Q2 FY2023 and YTD FY2023, respectively. Prior to Brazos’ and Brazos Sandy Creek’s bankruptcy filings, we had not experienced any defaults or charge-offs in our electric utility and telecommunications loan portfolios since fiscal year 2013 and 2017, respectively.
Borrower Risk Ratings
As part of our management of credit risk, we maintain a credit risk rating framework under which we employ a consistent process for assessing the credit quality of our loan portfolio. We evaluate each borrower and loan facility in our loan portfolio and assign internal borrower and loan facility risk ratings based on consideration of a number of quantitative and qualitative factors. We categorize loans in our portfolio based on our internally assigned borrower risk ratings, which are intended to assess the general creditworthiness of the borrower and probability of default. Our borrower risk ratings align with the U.S. federal banking regulatory agencies’ credit risk definitions of pass and criticized categories, with the criticized category further segmented among special mention, substandard and doubtful. Pass ratings reflect relatively low probability of default, while criticized ratings have a higher probability of default. Our internally assigned borrower risk ratings serve as the primary credit quality indicator for our loan portfolio. Because our internal borrower risk ratings provide important information on the probability of default, they are a key input in determining our allowance for credit losses.
Criticized loans totaled $300 million and $323 million as of November 30, 2023 and May 31, 2023, respectively, and represented approximately 1% of total loans outstanding as of each respective date. The decrease of $23 million in criticized loans was primarily due to loan payments received from Brazos and Brazos Sandy Creek in the doubtful category, partially offset by an increase in loans outstanding for one CFC electric distribution borrower in the special mention category during YTD FY2024. Each of the borrowers with loans outstanding in the criticized category was current with regard to all principal and interest amounts due to us as of November 30, 2023. In contrast, each of the borrowers with loans outstanding in the criticized category, with the exception of Brazos Sandy Creek, was current with regard to all principal and interest amounts due to us as of May 31, 2023.
We provide additional information on our borrower risk rating framework in our 2023 Form 10-K under “Item 7. MD&A Credit Risk—Loan Portfolio Credit Risk—Credit Quality Indicators.” See “Note 4—Loans” of this Report for detail, by member class, on loans outstanding in each borrower risk rating category.
Allowance for Credit Losses
We are required to maintain an allowance based on a current estimate of credit losses that are expected to occur over the remaining contractual term of the loans in our portfolio. Our allowance for credit losses consists of a collective allowance and an asset-specific allowance. The collective allowance is established for loans in our portfolio that share similar risk characteristics and are therefore evaluated on a collective, or pool, basis in measuring expected credit losses. The asset-
specific allowance is established for loans in our portfolio that do not share similar risk characteristics with other loans in our portfolio and are therefore evaluated on an individual basis in measuring expected credit losses.
Table 15 presents, by legal entity and member class, loans outstanding and the related allowance for credit losses and allowance coverage ratio as of November 30, 2023 and May 31, 2023 and the allowance components as of each date.
Table 15: Allowance for Credit Losses by Borrower Member Class and Evaluation Methodology
| | | | | | | | | | | | | | | | | | | | | | | | | | | | | | | | | | | | | | | | | | | |
| | November 30, 2023 | | May 31, 2023 | | | |
| (Dollars in thousands) | | Loans Outstanding(1) | | Allowance for Credit Losses | | Allowance Coverage Ratio (2) | | Loans Outstanding (1) | | Allowance for Credit Losses | | Allowance Coverage Ratio(2) | | | | | |
| Member class: | | | | | | | | | | | | | | | | | |
| CFC: | | | | | | | | | | | | | | | | | |
| Distribution | | $ | 26,041,672 | | | $ | 16,037 | | | 0.06 | % | | $ | 25,437,077 | | | $ | 14,924 | | | 0.06 | % | | | | | |
| Power supply | | 5,737,597 | | | 33,312 | | | 0.58 | | | 5,437,242 | | | 33,306 | | | 0.61 | | | | | | |
| Statewide and associate | | 268,286 | | | 1,271 | | | 0.47 | | | 200,368 | | | 1,194 | | | 0.60 | | | | | | |
| Total CFC | | 32,047,555 | | | 50,620 | | | 0.16 | | | 31,074,687 | | | 49,424 | | | 0.16 | | | | | | |
| NCSC | | 946,643 | | | 2,941 | | | 0.31 | | | 956,874 | | | 2,464 | | | 0.26 | | | | | | |
| RTFC | | 546,040 | | | 1,993 | | | 0.36 | | | 487,788 | | | 1,206 | | | 0.25 | | | | | | |
| Total | | $ | 33,540,238 | | | $ | 55,554 | | | 0.17 | | | $ | 32,519,349 | | | $ | 53,094 | | | 0.16 | | | | | | |
| | | | | | | | | | | | | | | | | |
| Allowance components: | | | | | | | | | | | | | | | | | |
| Collective allowance | | $ | 33,447,714 | | | $ | 30,762 | | | 0.09 | % | | $ | 32,398,910 | | | $ | 27,335 | | | 0.08 | % | | | | | |
| Asset-specific allowance | | 92,524 | | | 24,792 | | | 26.80 | | | 120,439 | | | 25,759 | | | 21.39 | | | | | | |
| Total allowance for credit losses | | $ | 33,540,238 | | | $ | 55,554 | | | 0.17 | | | $ | 32,519,349 | | | $ | 53,094 | | | 0.16 | | | | | | |
| | | | | | | | | | | | | | | | | |
| Allowance coverage ratios: | | | | | | | | | | | | | | | | | |
Nonaccrual loans (3) | | $ | 84,987 | | | | | 65.37 | % | | $ | 112,209 | | | | | 47.32 | % | | | | | |
___________________________
(1) Represents the unpaid principal balance, net of discounts, charge-offs and recoveries, of loans as of each period end. Excludes unamortized deferred loan origination costs of $13 million as of both November 30, 2023 and May 31, 2023.
(2)Calculated based on the allowance for credit losses attributable to each member class and allowance components at period end divided by the related loans outstanding at period end.
(3)Calculated based on the total allowance for credit losses at period end divided by loans outstanding on nonaccrual status at period end. Nonaccrual loans represented 0.25% and 0.35% of total loans outstanding as of November 30, 2023 and May 31, 2023, respectively. We provide additional information on our nonaccrual loans in “Note 4—Loans” in this Report.
The allowance for credit losses and allowance coverage ratio increased to $56 million and 0.17%, respectively, as of November 30, 2023, from $53 million and 0.16%, respectively, as of May 31, 2023. The $3 million increase in the allowance for credit losses reflected an increase in the collective allowance of $4 million, partially offset by a reduction in the asset-specific allowance of $1 million. The increase in the collective allowance was primarily due to loan portfolio growth and a slight decline in the overall credit quality and risk profile of our loan portfolio. The decrease in the asset-specific allowance was attributable to a timing change in the expected payments on a nonperforming CFC power supply loan.
We discuss our methodology for estimating the allowance for credit losses under the CECL model in “Note 1—Summary of Significant Accounting Policies—Allowance for Credit Losses” and provide information on management’s judgment and the uncertainties involved in our determination of the allowance for credit losses in “MD&A—Critical Accounting Estimates—Allowance for Credit Losses” in our 2023 Form 10-K. We provide additional information on our loans and allowance for credit losses under “Note 4—Loans” and “Note 5—Allowance for Credit Losses” of this Report.
Counterparty Credit Risk
In addition to credit exposure from our borrowers, we enter into other types of financial transactions in the ordinary course of business that expose us to counterparty credit risk, primarily related to transactions involving our cash and cash equivalents, time deposits, securities held in our investment securities portfolio and derivatives. We mitigate our risk by only entering into these transactions with counterparties with investment-grade ratings, establishing operational guidelines and counterparty exposure limits and monitoring our counterparty credit risk position. We evaluate our counterparties based on certain quantitative and qualitative factors and periodically assign internal risk rating grades to our counterparties.
Cash, Time Deposits and Investments Securities Counterparty Credit Exposure
Our cash and cash equivalents, time deposits and investment securities totaled $129 million, $400 million and $417 million, respectively, as of November 30, 2023. The primary credit exposure associated with investments held in our investments portfolio is that issuers will not repay principal and interest in accordance with the contractual terms. Our cash and cash equivalents and time deposits with financial institutions generally have an original maturity of less than one year and pursuant to our investment policy guidelines, all fixed-income debt securities, at the time of purchase, must be rated at least investment grade based on external credit ratings from at least two of the leading global credit rating agencies, when available, or the corresponding equivalent, when not available. We therefore believe that the risk of default by these counterparties is low. As of November 30, 2023, our overall counterparty credit risk was deemed to be satisfactory and not materially changed compared with May 31, 2023.
We provide additional information on the holdings in our investment portfolio below under “Liquidity Risk—Investment Portfolio” and in “Note 3—Investment Securities.”
Derivative Counterparty Credit Exposure
Our derivative counterparty credit exposure relates principally to interest-rate swap contracts. We generally engage in over-the-counter (“OTC”) derivative transactions, which expose us to individual counterparty credit risk because these transactions are executed and settled directly between us and each counterparty. We are exposed to the risk that an individual derivative counterparty defaults on payments due to us, which we may not be able to collect or which may require us to seek a replacement derivative from a different counterparty. This replacement may be at a higher cost, or we may be unable to find a suitable replacement.
We manage our derivative counterparty credit exposure by executing derivative transactions with financial institutions that have investment-grade credit ratings and maintaining enforceable master netting arrangements with these counterparties, which allow us to net derivative assets and liabilities with the same counterparty. We had 12 active derivative counterparties with credit ratings ranging from Aa1 to Baa1 by Moody’s Investors Service (“Moody’s”) as of both November 30, 2023 and May 31, 2023, and from AA- to BBB+ and AA- to A- by S&P as of November 30, 2023 and May 31, 2023, respectively. The total outstanding notional amount of derivatives with these counterparties was $7,621 million and $7,816 million as of November 30, 2023 and May 31, 2023, respectively. The highest single derivative counterparty concentration, by outstanding notional amount, accounted for approximately 23% of the total outstanding notional amount of our derivatives as of both November 30, 2023 and May 31, 2023.
While our derivative agreements include netting provisions that allow for offsetting of all contracts with a given counterparty in the event of default by one of the two parties, we report the fair value of our derivatives on a gross basis by individual contract as either a derivative asset or derivative liability on our consolidated balance sheets. However, we estimate our exposure to credit loss on our derivatives by calculating the replacement cost to settle at current market prices, as defined in our derivative agreements, all outstanding derivatives in a net gain position at the counterparty level where a right of legal offset exists. We provide information on the impact of netting provisions under our master swap agreements and collateral pledged, if any, in “Note 9—Derivative Instruments and Hedging Activities—Impact of Derivatives on Consolidated Balance Sheets.” We believe our exposure to derivative counterparty risk, at any point in time, is equal to the amount of our outstanding derivatives in a net gain position, at the individual counterparty level, which totaled $587 million and $349 million as of November 30, 2023 and May 31, 2023, respectively.
We provide additional detail on our derivative agreements, including a discussion of derivative contracts with credit rating triggers and settlement amounts that would be required in the event of a ratings trigger, in “Note 9—Derivative Instruments and Hedging Activities.”
See “Item 1A. Risk Factors” in our 2023 Form 10-K and “Item 1A. Risk Factors” of this Report for additional information about credit risks related to our business.
We define liquidity as the ability to convert assets into cash quickly and efficiently, maintain access to available funding and roll-over or issue new debt under normal operating conditions and periods of CFC-specific and/or market stress, to ensure that we can meet borrower loan requests, pay current and future obligations and fund our operations in a cost-effective manner. We provide additional information on our liquidity risk-management framework under “Item 7. MD&A—Liquidity Risk—Liquidity Risk Management” in our 2023 Form 10-K.
In addition to cash on hand and time deposits, our primary sources of funds include member loan principal repayments, securities held in our investment portfolio, committed bank revolving lines of credit, committed loan facilities under the Guaranteed Underwriter Program, a revolving note purchase agreement with Farmer Mac and proceeds from debt issuances to members and in the public capital markets. Our primary uses of funds include loan advances to members, principal and interest payments on borrowings, periodic interest settlement payments related to our derivative contracts and operating expenses.
Available Liquidity
As part of our strategy in managing liquidity risk and meeting our liquidity objectives, we seek to maintain various committed sources of funding that are available to meet our near-term liquidity needs. Table 16 presents a comparison between our available liquidity, which consists of cash and cash equivalents, time deposits, our debt securities investment portfolio and amounts under committed credit facilities, as of November 30, 2023 and May 31, 2023.
Table 16: Available Liquidity
| | | | | | | | | | | | | | | | | | | | | | | | | | | | | | | | | | | | | | |
| | November 30, 2023 | | May 31, 2023 |
| (Dollars in millions) | | Total | | Accessed | | Available | | Total | | Accessed | | Available |
| Liquidity sources: | | | | | | | | | | | | |
| Cash, time deposits and investment debt securities: | | | | | | | | | | | | |
| Cash and cash equivalents | | $ | 129 | | | $ | — | | | $ | 129 | | | $ | 199 | | | $ | — | | | $ | 199 | |
| Time deposits | | 400 | | | — | | | 400 | | | — | | | — | | | — | |
Debt securities investment portfolio(1) | | 381 | | | — | | | 381 | | | 475 | | | — | | | 475 | |
| Total cash, time deposits and investment debt securities | | 910 | | | — | | | 910 | | | 674 | | | — | | | 674 | |
| Committed credit facilities: | | | | | | | | | | | | |
Committed bank revolving line of credit agreements—unsecured(2) | | 2,800 | | | 2 | | | 2,798 | | | 2,600 | | | 2 | | | 2,598 | |
Guaranteed Underwriter Program committed facilities—secured(3) | | 9,473 | | | 8,723 | | | 750 | | | 9,473 | | | 8,448 | | | 1,025 | |
Farmer Mac revolving note purchase agreement—secured(4) | | 6,000 | | | 3,902 | | | 2,098 | | | 6,000 | | | 3,150 | | | 2,850 | |
| Total committed credit facilities | | 18,273 | | | 12,627 | | | 5,646 | | | 18,073 | | | 11,600 | | | 6,473 | |
| Total available liquidity | | $ | 19,183 | | | $ | 12,627 | | | $ | 6,556 | | | $ | 18,747 | | | $ | 11,600 | | | $ | 7,147 | |
____________________________(1)Represents the aggregate fair value of our portfolio of debt securities as of period end. Our portfolio of equity securities consists primarily of preferred stock securities that are not as readily redeemable; therefore, we exclude our portfolio of equity securities from our available liquidity.
(2)The committed bank revolving line of credit agreements consist of a three-year and a four-year revolving line of credit agreement. The accessed amount of $2 million as of both November 30, 2023 and May 31, 2023, relates to letters of credit issued pursuant to the four-year revolving line of credit agreement.
(3)The committed facilities under the Guaranteed Underwriter Program are not revolving.
(4)Availability subject to market conditions.
Although as a nonbank financial institution we are not subject to regulatory liquidity requirements, our liquidity management framework includes monitoring our liquidity and funding positions on an ongoing basis and assessing our ability to meet our scheduled debt obligations and other cash flow requirements based on point-in-time metrics as well as forward-looking projections. Our liquidity and funding assessment takes into consideration amounts available under existing liquidity sources, the expected rollover of member short-term investments and scheduled loan principal payment amounts, as well as our continued ability to access the capital markets and other non-capital market related funding sources.
Liquidity Risk Assessment
We utilize several measures to assess our liquidity risk and ensure we have adequate coverage to meet our liquidity needs. Our primary liquidity measures indicate the extent to which we have sufficient liquidity to cover the payment of scheduled debt obligations over the next 12 months. We calculate our liquidity coverage ratios under several scenarios that take into consideration various assumptions about our near-term sources and uses of liquidity, including the assumption that maturities of member short-term investments will not have a significant impact on our anticipated cash outflows. Our members have historically maintained a relatively stable level of short-term investments in CFC in the form of daily liquidity fund notes, commercial paper, select notes and medium-term notes. As such, we expect that our members will continue to reinvest their excess cash in short-term investment products offered by CFC.
Table 17 presents our primary liquidity coverage ratios as of November 30, 2023 and May 31, 2023 and displays the calculation of each ratio as of these respective dates based on the assumptions discussed above.
Table 17: Liquidity Coverage Ratios
| | | | | | | | | | | | | | |
| (Dollars in millions) | | November 30, 2023 | | May 31, 2023 |
Liquidity coverage ratio:(1) | | | | |
Total available liquidity(2) | | $ | 6,556 | | | $ | 7,147 | |
| Debt scheduled to mature over next 12 months: | | | | |
| Short-term borrowings | | 5,162 | | | 4,546 | |
| Long-term and subordinated debt scheduled to mature over next 12 months | | 2,218 | | | 2,383 | |
| Total debt scheduled to mature over next 12 months | | 7,380 | | | 6,929 | |
| Excess (deficit) in available liquidity over debt scheduled to mature over next 12 months | | $ | (824) | | | $ | 218 | |
| | | | |
| Liquidity coverage ratio | | 0.89 | | 1.03 |
| | | | |
Liquidity coverage ratio, excluding expected maturities of member short-term investments(3) | | | | |
Total available liquidity(2) | | $ | 6,556 | | | $ | 7,147 | |
| Total debt scheduled to mature over next 12 months | | 7,380 | | | 6,929 | |
| Exclude: Member short-term investments | | (3,623) | | | (3,253) | |
| Total debt, excluding member short-term investments, scheduled to mature over next 12 months | | 3,757 | | | 3,676 | |
| Excess in available liquidity over total debt, excluding member short-term investments, scheduled to mature over next 12 months | | $ | 2,799 | | | $ | 3,471 | |
| | | | |
| Liquidity coverage ratio, excluding expected maturities of member short-term investments | | 1.75 | | 1.94 |
___________________________
(1)Calculated based on available liquidity at period end divided by total debt scheduled to mature over the next 12 months at period end.
(2)Total available liquidity is presented above in Table 16.
(3)Calculated based on available liquidity at period end divided by debt, excluding member short-term investments, scheduled to mature over the next 12 months.
As presented in Table 17 above, our available liquidity of $6,556 million as of November 30, 2023 was $824 million below our total scheduled debt obligations over the next 12 months of $7,380 million, consisting of short-term borrowings and long-term and subordinated debt. The short-term borrowings scheduled maturity amount consists of member investments of $3,623 million, dealer commercial paper of $1,039 million and Farmer Mac notes payable of $500 million. The long-term and subordinated scheduled debt obligations over the next 12 months of $2,218 million consist of debt maturities and scheduled debt payment amounts, of which, $165 million was from member investments.
We believe we can continue to roll over our member short-term investments of $3,623 million as of November 30, 2023, based on our expectation that our members will continue to reinvest their excess cash in short-term investment products offered by CFC. As mentioned above, our members historically have maintained a relatively stable level of short-term investments in CFC. Member short-term investments in CFC have averaged $3,589 million over the last 12 fiscal quarter-end reporting periods. Our available liquidity as of November 30, 2023 was $2,799 million in excess of, or 1.7 times over, our total scheduled debt obligations, excluding member short-term investments, over the next 12 months of $3,757 million. In addition, we expect to receive $1,516 million from scheduled long-term loan principal payments over the next 12 months.
We expect to continue accessing the dealer commercial paper market as a cost-effective means of satisfying our incremental short-term liquidity needs. Although the intra-quarter amount of dealer commercial paper outstanding may fluctuate based on our liquidity requirements, our intent is to manage our short-term wholesale funding risk by maintaining the dealer commercial paper outstanding at each quarter-end within a range of $1,000 million to $1,500 million. To mitigate commercial paper rollover risk, we expect to continue to maintain our committed bank revolving line of credit agreements committed loan facilities under the Guaranteed Underwriter Program and revolving note purchase agreement with Farmer Mac totaled $18,073 million as of both August 31, 2023 and May 31, 2023, and the aggregate amount available for access totaled $5,997 million and $6,473 million as of each respective date. The following is a discussion of our borrowing capacity and key terms and conditions under each of these credit facilities.
Committed Bank Revolving Line of Credit Agreements—Unsecured
Our committed bank revolving lines of credit may be used for general corporate purposes; however, we generally rely on them as a backup source of liquidity for our member and dealer commercial paper. The total commitment amount under the three-year facility and the four-year facility was $1,245 million and $1,355 million, respectively, resulting in a combined total commitment amount under the two facilities of $2,600 million. Under our current committed bank revolving line of credit agreements, we have the ability to request up to $300 million of letters of credit, which would result in a reduction in the remaining available amount under the facilities.
Table 16 presents the total commitment amount under our committed bank revolving line of credit agreements, outstanding letters of credit and the amount available for access as of August 31, 2023.
Table 16: Committed Bank Revolving Line of Credit Agreements
| | | | | | | | | | | | | | | | | | | | | | | | | | | | | | | | |
| | August 31, 2023 | | | | |
| (Dollars in millions) | | Total Commitment | | Letters of Credit Outstanding | | Amount Available for Access | | Maturity | | Annual Facility Fee (1) |
| Bank revolving line of credit term: | | | | | | | | | | |
| 3-year agreement | | $ | 1,245 | | | $ | — | | | $ | 1,245 | | | November 28, 2025 | | 7.5 bps |
| 4-year agreement | | 1,355 | | | 2 | | | 1,353 | | | November 28, 2026 | | 10.0 bps |
| Total | | $ | 2,600 | | | $ | 2 | | | $ | 2,598 | | | | | |
____________________________
(1)Facility fee based on CFC’s senior unsecured credit ratings in accordance with the established pricing schedules at the inception of the related agreement.
We did not have any outstanding borrowings under our committed bank revolving line of credit agreements as of August 31, 2023; however, we had letters of credit outstanding of $2 million under the four-year committed bank revolving agreement as of this date.
Although our committed bank revolving line of credit agreements do not contain a material adverse change clause or rating triggers that would limit the banks’ obligations to provide funding under the terms of the agreements, we must be in compliance with the covenants to draw on the facilities. We have been and expect to continue to be in compliance with the covenants under our committed bank revolving line of credit agreements. As such,these agreements so we couldcan draw on these facilities, if necessary, to repay dealer or member commercial paper that cannot be rolled over.refinanced with similar debt. In addition, under master repurchase agreements we have with our bank counter parties, we can obtain short-term funding in secured borrowing transactions by selling investment-grade corporate debt securities from our investment securities portfolio subject to an obligation to repurchase the same or similar securities at an agreed-upon price and date.
The issuance of long-term debt, which represents the most significant component of our funding, allows us to reduce our reliance on short-term borrowings, as well as effectively manage our refinancing and interest rate risk. We expect to continue to issue long-term debt in the public capital markets and under our other non-capital market debt arrangements to meet our funding needs and believe that we have sufficient sources of liquidity to meet our debt obligations and support our operations over the next 12 months.
Investment Portfolio
We have an investment portfolio, composed of time deposits, debt securities classified as trading and equity securities. Our time deposits have maturities of less than one year and are valued at carrying value, which approximates fair value. Total time deposits were $400 million as of November 30, 2023. We did not have any time deposits outstanding as of May 31, 2023. The debt securities are reported on our consolidated balance sheets at fair value. The aggregate fair value of the securities in our investment portfolio was $417 million as of November 30, 2023, consisting of debt securities with a fair value of $381 million and equity securities with a fair value of $36 million. In comparison, the aggregate fair value of the securities in our investment portfolio was $510 million as of May 31, 2023, consisting of debt securities with a fair value of $475 million and equity securities with a fair value of $35 million.
Our debt securities investment portfolio is intended to serve as an additional source of liquidity. Under master repurchase agreements that we have with counterparties, we can obtain short-term funding by selling investment-grade corporate debt securities from our investment portfolio subject to an obligation to repurchase the same or similar securities at an agreed-upon price and date. Because we retain effective control over the transferred securities, transactions under these repurchase agreements are accounted for as collateralized financing agreements (i.e., secured borrowings) and not as a sale and subsequent repurchase of securities. The obligation to repurchase the securities is reflected as a component of our short-term borrowings on our consolidated balance sheets. The aggregate fair value of debt securities underlying repurchase transactions is parenthetically disclosed on our consolidated balance sheets. We had no borrowings under repurchase
Guaranteed Underwriter Program Committed Facilities—Secured
Under the Guaranteed Underwriter Program, we can borrow from the Federal Financing Bank and use the proceeds to extend new loans to our members and refinance existing member debt. As part of the program, we pay fees, based on ouragreements outstanding borrowings, that are intended to help fund the USDA Rural Economic Development Loan and Grant program and thereby support additional investment in rural economic development projects. The borrowings under this program are guaranteed by RUS. Each advance is subject to quarterly amortization and a final maturity not longer than 30 years from the date of the advance.
As displayed in Table 14, we had accessed $8,448 million under the Guaranteed Underwriter Program and up to $1,025 million was available for borrowing as of August 31, 2023. Of the $1,025 million available borrowing amount, $275 million is available for advance through July 15, 2026 and $750 million is available for advance through July 15, 2027. We are required to pledge eligible distribution system loans or power supply system loans as collateral in an amount at least equal to our total outstanding borrowings under the Guaranteed Underwriter Program committed loan facilities, which totaled $6,670 million as of August 31, 2023. On September 11, 2023, we executed a commitment letter for the guarantee by RUS of a $450 million loan facility from the Federal Financing Bank under the Guaranteed Underwriter Program. On September 27, 2023, we borrowed $275 million under the Guaranteed Underwriter Program.
Farmer Mac Revolving Note Purchase Agreement—Secured
We have a revolving note purchase agreement with Farmer Mac under which we can borrow up to $6,000 million from Farmer Mac at any time, subject to market conditions, through Juneboth November 30, 2027. The agreement has successive automatic one-year renewals beginning June 30, 2026, unless Farmer Mac provides 425 days’ written notice of non-renewal.
Under this agreement, we had outstanding secured notes payable totaling $3,626 million and $3,150 million as of August 31, 2023 and May 31, 2023, respectively. We borrowed $500 million2023; therefore, we had no debt securities in short-term notes payable under this note purchase agreement with Farmer Mac during the current quarter. As displayed in Table 14, the amount available for borrowing under this agreement was $2,374 millionour investment portfolio pledged as collateral as of August 31, 2023. We are required to pledge eligible electric distribution system or electric power supply system loans as collateral in an amount at least equal to the total principal amount of notes outstanding under this agreement.each respective date.
We provide additional information on pledged collateral below under “Pledged Collateral” in this section andour investment securities portfolio in “Note 3—Investment Securities” and “Note 4—Loans.”of this Report.
Short-Term Borrowings
Short-term borrowings consist of borrowings with an original contractual maturity of one year or less and do not include the current portion of long-term debt. Short-term borrowings increased to $5,162 million as of November 30, 2023, from $4,546 million as of May 31, 2023, primarily driven by increase in short-term notes payable advanced under the Farmer Mac revolving purchase agreement and short-term member investments, partially offset by a decrease in outstanding dealer commercial paper. Short-term borrowings accounted for 16% and 15% of total debt outstanding as of November 30, 2023 and May 31, 2023, respectively.
See “Liquidity Risk” below and “Note 6—Short-Term Borrowings” for information on the composition of our short-term borrowings.
Long-Term and Subordinated Debt
Long-term debt, defined as debt with an original contractual maturity term of greater than one year, primarily consists of medium-term notes, collateral trust bonds, notes payable under the Guaranteed Underwriter Program and notes payable under the Farmer Mac revolving note purchase agreement. Subordinated debt consists of subordinated deferrable debt and members’ subordinated certificates. Our subordinated deferrable debt and members’ subordinated certificates have original contractual maturity terms of greater than one year.
Long-term and subordinated debt increased to $27,033 million as of November 30, 2023, from $26,453 million as of May 31, 2023, primarily due to net increase of $665 million in medium term notes, $252 million in notes payable under the Farmer Mac revolving purchase agreement, and $174 million in notes payable under the Guaranteed Underwriter Program, partially offset by repayments of $405 million of collateral trust bonds and the early redemption of $100 million of our subordinated deferrable debt. Long-term and subordinated debt accounted for 84% and 85% of total debt outstanding as of November 30, 2023 and May 31, 2023, respectively.
We provide additional information on our long-term debt below under the “Liquidity Risk” section and in “Note 7—Long-Term Debt” and “Note 8—Subordinated Deferrable Debt” of this Report.
Equity
Table 12 presents the components of total CFC equity and total equity as of November 30, 2023 and May 31, 2023.
Table 12: Equity
| | | | | | | | | | | | | | |
| (Dollars in thousands) | | November 30, 2023 | | May 31, 2023 |
| Equity components: | | | | |
| Membership fees and educational fund: | | | | |
| Membership fees | | $ | 970 | | | $ | 969 | |
| Educational fund | | 1,916 | | | 2,565 | |
| Total membership fees and educational fund | | 2,886 | | | 3,534 | |
| Patronage capital allocated | | 934,135 | | | 1,006,115 | |
| Members’ capital reserve | | 1,202,152 | | | 1,202,152 | |
| Total allocated equity | | 2,139,173 | | | 2,211,801 | |
| Unallocated net income (loss): | | | | |
Prior fiscal year-end cumulative derivative forward value gains(1) | | 342,624 | | | 92,363 | |
Year-to-date derivative forward value gains (1) | | 239,307 | | | 250,261 | |
Period-end cumulative derivative forward value gains(1) | | 581,931 | | | 342,624 | |
| Other unallocated net income (loss) | | 136,284 | | | (709) | |
| Unallocated net income | | 718,215 | | | 341,915 | |
| CFC retained equity | | 2,857,388 | | | 2,553,716 | |
| Accumulated other comprehensive income | | 8,618 | | | 8,343 | |
| Total CFC equity | | 2,866,006 | | | 2,562,059 | |
| Noncontrolling interests | | 30,134 | | | 27,190 | |
| Total equity | | $ | 2,896,140 | | | $ | 2,589,249 | |
| | | | |
____________________________(1)Represents derivative forward value gains (losses) for CFC only, as total CFC equity does not include the noncontrolling interests of the variable interest entities NCSC and RTFC, which we are required to consolidate. We present the consolidated total derivative forward value gains (losses) in Table 30 in the “Non-GAAP Financial Measures” section below. Also, see “Note 14—Business Segments” for the statements of operations for CFC.
The increase in total equity of $307 million to $2,896 million as of November 30, 2023 was attributable to our reported net income of $376 million for YTD FY2024, partially offset by the CFC Board of Directors’ authorized patronage capital retirement in July 2023 of $72 million.
Allocation and Retirement of Patronage Capital
We are subject to District of Columbia law governing cooperatives, under which CFC is required to make annual allocations of net earnings, if any, in accordance with the provisions of the District of Columbia statutes. We describe the allocation requirements under “Item 7. MD&A—Consolidated Balance Sheet Analysis—Equity—Allocation and Retirement of Patronage Capital” in our 2023 Form 10-K. The amount of patronage capital allocated each year by CFC’s Board of Directors is based on non-GAAP adjusted net income, which excludes the impact of derivative forward value gains (losses). We provide a reconciliation of our adjusted net income to our reported net income and an explanation of the adjustments below in “Non-GAAP Financial Measures.”
In May 2023, the CFC Board of Directors authorized the allocation of $1 million of net earnings for fiscal year 2023 to the cooperative educational fund. In July 2023, the CFC Board of Directors authorized the allocation of fiscal year 2023 adjusted net income as follows: $110 million to members in the form of patronage capital and $140 million to the members’ capital reserve.
In July 2023, the CFC Board of Directors also authorized the retirement of patronage capital totaling $72 million, of which $55 million represented 50% of the patronage capital allocation for fiscal year 2023, and $17 million represented the portion of the allocation from fiscal year 1998 net earnings that has been held for 25 years pursuant to the CFC Board of Directors’ policy. This amount was returned to members in cash in September 2023. The remaining portion of the patronage capital allocation for fiscal year 2023 will be retained by CFC for 25 years pursuant to the guidelines adopted by the CFC Board of Directors in June 2009.
| | |
| ENTERPRISE RISK MANAGEMENT |
Overview
CFC has an Enterprise Risk Management (“ERM”) framework that is designed to identify, assess, monitor and manage the risks we assume in conducting our activities to serve the financial needs of our members. We face a variety of risks that can significantly affect our financial performance, liquidity, reputation and ability to meet the expectations of our members, investors and other stakeholders. As a financial services company, the major categories of risk exposures inherent in our business activities include credit risk, liquidity risk, market risk and operational risk. These risk categories are summarized below.
•Credit risk is the risk that a borrower or other counterparty will be unable to meet its obligations in accordance with agreed-upon terms.
•Liquidity risk is the risk that we will be unable to fund our operations and meet our contractual obligations or that we will be unable to fund new loans to borrowers at a reasonable cost and tenor in a timely manner.
•Market risk is the risk that changes in market variables, such as movements in interest rates, may adversely affect the match between the timing of the contractual maturities, repricing and prepayments of our financial assets and the related financial liabilities funding those assets.
•Operational risk is the risk of loss resulting from inadequate or failed internal controls, processes, systems, human error or external events, including natural disasters or public health emergencies, such as the COVID-19 pandemic. Operational risk also includes cybersecurity risk, compliance risk, fiduciary risk, reputational risk and litigation risk.
Effective risk management is critical to our overall operations and to achieving our primary objective of providing cost-based financial products to our rural electric members while maintaining the sound financial results required for investment-grade credit ratings on our rated debt instruments. Accordingly, we have a risk-management framework that is intended to govern the principal risks we face in conducting our business and the aggregate amount of risk we are willing to accept, referred to as risk tolerance as well as risk limits and related guidelines, in the context of CFC’s mission and strategic objectives and initiatives. We provide a discussion of our risk management framework in our 2023 Form 10-K under “Item 7. MD&A—Enterprise Risk Management” and describe how we manage these risks under each respective MD&A section in our 2023 Form 10-K.
Our loan portfolio, which represents the largest component of assets on our balance sheet, accounts for the substantial majority of our credit risk exposure. We also engage in certain nonlending activities that may give rise to counterparty credit risk, such as entering into derivative transactions to manage interest rate risk and purchasing investment securities. We provide additional information on our credit risk-management framework under “Item 7. MD&A—Credit Risk—Credit Risk Management” in our 2023 Form 10-K.
Loan Portfolio Credit Risk
Our primary credit exposure is loans to rural electric cooperatives, which provide essential electric services to end-users, the majority of which are residential customers. We also have a limited portfolio of loans to not-for-profit and for-profit telecommunication companies. Loans outstanding to electric utility organizations totaled $32,994 million and $32,032 million as of November 30, 2023 and May 31, 2023, respectively, representing 98% and 99% of our total loans outstanding as of each respective date. The remaining loans outstanding in our loan portfolio were to RTFC members, affiliates and associates in the telecommunications industry sector. The substantial majority of loans to our borrowers are long-term fixed-rate loans with terms of up to 35 years. Long-term fixed-rate loans accounted for 88% and 87% of total loans outstanding as of November 30, 2023 and May 31, 2023, respectively.
Because we lend primarily to our rural electric utility cooperative members, we have had a loan portfolio inherently subject to single-industry and single-obligor credit concentration risk since our inception in 1969. We historically, however, have experienced limited defaults and losses in our electric utility loan portfolio due to several factors. First, the majority of our electric cooperative borrowers operate in states where electric cooperatives are not subject to rate regulation. Thus, they are able to make rate adjustments to pass along increased costs to the end customer without first obtaining state regulatory approval, allowing them to cover operating costs and generate sufficient earnings and cash flows to service their debt obligations. Second, electric cooperatives face limited competition, as they tend to operate in exclusive territories not serviced by public investor-owned utilities. Third, electric cooperatives typically are consumer-owned, not-for-profit entities that provide an essential service to end-users, the majority of which are residential customers. As not-for-profit entities, rural electric cooperatives, unlike investor-owned utilities, generally are eligible to apply for assistance from the Federal Emergency Management Agency (“FEMA”) and states to help recover from major disasters or emergencies. Fourth, electric cooperatives tend to adhere to a conservative core business strategy model that has historically resulted in a relatively stable, resilient operating environment and overall strong financial performance and credit strength for the electric cooperative network. Finally, we generally lend to our members on a senior secured basis, which reduces the risk of loss in the event of a borrower default.
Below we provide information on the credit risk profile of our loan portfolio, including security provisions, credit concentration, credit quality indicators and our allowance for credit losses.
Security Provisions
Except when providing line of credit loans, we generally lend to our members on a senior secured basis. Table 13 presents, by legal entity and member class and by loan type, secured and unsecured loans in our loan portfolio as of November 30, 2023 and May 31, 2023. Of our total loans outstanding, 92% were secured as of both November 30, 2023 and May 31, 2023.
Table 13: Loans—Loan Portfolio Security Profile | | | | | | | | | | | | | | | | | | | | | | | | | | | | | | | | |
| | November 30, 2023 |
| (Dollars in thousands) | | Secured | | % of Total | | Unsecured | | % of Total | | Total |
| Member class: | | | | | | | | | | |
| CFC: | | | | | | | | | | |
| Distribution | | $ | 24,313,913 | | | 93 | % | | $ | 1,727,759 | | | 7 | % | | $ | 26,041,672 | |
| Power supply | | 4,930,834 | | | 86 | | | 806,763 | | 14 | | | 5,737,597 | |
| Statewide and associate | | 214,338 | | | 80 | | | 53,948 | | 20 | | | 268,286 | |
| Total CFC | | 29,459,085 | | | 92 | | | 2,588,470 | | | 8 | | | $ | 32,047,555 | |
| NCSC | | 930,516 | | | 98 | | | 16,127 | | | 2 | | | 946,643 | |
| RTFC | | 512,643 | | | 94 | | | 33,397 | | | 6 | | | 546,040 | |
Total loans outstanding(1) | | $ | 30,902,244 | | | 92 | | | $ | 2,637,994 | | | 8 | | | $ | 33,540,238 | |
| | | | | | | | | | |
| Loan type: | | | | | | | | | | |
| Long-term loans: | | | | | | | | | | |
| Fixed rate | | $ | 29,231,901 | | | 99 | % | | $ | 156,721 | | | 1 | % | | $ | 29,388,622 | |
| Variable rate | | 857,535 | | | 100 | | | 1,547 | | | — | | | 859,082 | |
| Total long-term loans | | 30,089,436 | | | 99 | | | 158,268 | | | 1 | | | 30,247,704 | |
| Line of credit loans | | 812,808 | | | 25 | | | 2,479,726 | | | 75 | | | 3,292,534 | |
Total loans outstanding(1) | | $ | 30,902,244 | | | 92 | | | $ | 2,637,994 | | | 8 | | | $ | 33,540,238 | |
| | | | | | | | | | | | | | | | | | | | | | | | | | | | | | | | |
| | | | | | | | | | |
| | May 31, 2023 |
| (Dollars in thousands) | | Secured | | % of Total | | Unsecured | | % of Total | | Total |
| Member class: | | | | | | | | | | |
| CFC: | | | | | | | | | | |
| Distribution | | $ | 23,736,624 | | | 93 | % | | $ | 1,700,453 | | | 7 | % | | $ | 25,437,077 | |
| Power supply | | 4,633,558 | | | 85 | | | 803,684 | | 15 | | | 5,437,242 | |
| Statewide and associate | | 157,342 | | | 79 | | | 43,026 | | | 21 | | | 200,368 | |
| Total CFC | | $ | 28,527,524 | | | 92 | | | 2,547,163 | | | 8 | | | 31,074,687 | |
| NCSC | | 925,925 | | | 97 | | | 30,949 | | | 3 | | | 956,874 | |
| RTFC | | 462,209 | | | 95 | | | 25,579 | | | 5 | | | 487,788 | |
Total loans outstanding(1) | | $ | 29,915,658 | | | 92 | | | $ | 2,603,691 | | | 8 | | | $ | 32,519,349 | |
| | | | | | | | | | |
| Loan type: | | | | | | | | | | |
| Long-term loans: | | | | | | | | | | |
| Fixed rate | | $ | 28,203,752 | | | 99 | % | | $ | 167,606 | | | 1 | % | | $ | 28,371,358 | |
| Variable rate | | 1,022,841 | | | 100 | | | 1,812 | | | — | | | 1,024,653 | |
| | | | | | | | | | |
| Total long-term loans | | 29,226,593 | | | 99 | | | 169,418 | | | 1 | | | 29,396,011 | |
| Line of credit loans | | 689,065 | | | 22 | | | 2,434,273 | | | 78 | | | 3,123,338 | |
Total loans outstanding(1) | | $ | 29,915,658 | | | 92 | | | $ | 2,603,691 | | | 8 | | | $ | 32,519,349 | |
____________________________
(1) Represents the unpaid principal balance, net of discounts, charge-offs and recoveries, of loans as of the end of each period. Excludes unamortized deferred loan origination costs of $13 million as of both November 30, 2023 and May 31, 2023.
Credit Concentration
Concentrations of credit may exist when a lender has large credit exposures to single borrowers, large credit exposures to borrowers in the same industry sector or engaged in similar activities or large credit exposures to borrowers in a geographic region that would cause the borrowers to be similarly impacted by economic or other conditions in the region. As discussed
above under “Credit Risk—Loan Portfolio Credit Risk,” because we lend primarily to our rural electric utility cooperative members, our loan portfolio is inherently subject to single-industry and single-obligor credit concentration risk. Loans outstanding to electric utility organizations totaled $32,994 million and $32,032 million as of November 30, 2023 and May 31, 2023, respectively, and represented approximately 98% and 99% of our total loans outstanding as of each respective date. Our credit exposure is partially mitigated by long-term loans guaranteed by RUS, which totaled $118 million and $123 million as of November 30, 2023 and May 31, 2023, respectively.
Single-Obligor Concentration
Table 14 displays the outstanding loan exposure for our 20 largest borrowers, by legal entity and member class, as of November 30, 2023 and May 31, 2023. Our 20 largest borrowers consisted of 12 distribution systems and eight power supply systems as of November 30, 2023 compared to 10 distribution systems and 10 power supply systems as of May 31, 2023. The largest total exposure to a single borrower or controlled group represented approximately 1% of total loans outstanding as of both November 30, 2023 and May 31, 2023.
Table 14: Loans—Loan Exposure to 20 Largest Borrowers
| | | | | | | | | | | | | | | | | | | | | | | | | | | |
| | | November 30, 2023 | | May 31, 2023 | |
| (Dollars in thousands) | | Amount | | % of Total | | Amount | | % of Total | |
| Member class: | | | | | | | | | |
| CFC: | | | | | | | | | |
| Distribution | | $ | 4,148,154 | | | 13 | % | | $ | 3,600,193 | | | 11 | % | |
| Power supply | | 2,422,605 | | | 7 | | | 2,782,098 | | | 9 | | |
| Total CFC | | 6,570,759 | | | 20 | | | 6,382,291 | | | 20 | | |
| NCSC | | 181,750 | | | — | | | 205,321 | | | — | | |
| Total loan exposure to 20 largest borrowers | | 6,752,509 | | | 20 | | | 6,587,612 | | | 20 | | |
| Less: Loans covered under Farmer Mac standby purchase commitment | | (226,225) | | | (1) | | | (266,754) | | | (1) | | |
| Net loan exposure to 20 largest borrowers | | $ | 6,526,284 | | | 19 | % | | $ | 6,320,858 | | | 19 | % | |
We entered into a long-term standby purchase commitment agreement with Farmer Mac during fiscal year 2016. Under this agreement, we may designate certain long-term loans to be covered under the commitment, subject to approval by Farmer Mac, and in the event any such loan later goes into payment default for at least 90 days, upon request by us, Farmer Mac must purchase such loan at par value. The aggregate unpaid principal balance of designated and Farmer Mac approved loans was $421 million and $436 million as of November 30, 2023 and May 31, 2023, respectively. Loan exposure to our 20 largest borrowers covered under the Farmer Mac agreement totaled $226 million and $267 million as of November 30, 2023 and May 31, 2023, respectively, which reduced our exposure to the 20 largest borrowers to 19% as of each respective date. No loans have been put to Farmer Mac for purchase pursuant to this agreement.
Geographic Concentration
Although our organizational structure and mission result in single-industry concentration, we serve a geographically diverse group of electric and telecommunications borrowers throughout the U.S. The consolidated number of borrowers with loans outstanding totaled 891 and 884 as of November 30, 2023 and May 31, 2023, respectively, located in 49 states and the District of Columbia. Of the 891 and 884 borrowers with loans outstanding as of November 30, 2023 and May 31, 2023, respectively, 50 and 52 were electric power supply borrowers as of each respective date. Electric power supply borrowers generally require significantly more capital than electric distribution and telecommunications borrowers.
Texas, which had 67 and 69 borrowers with loans outstanding as of November 30, 2023 and May 31, 2023, respectively, accounted for the largest number of borrowers with loans outstanding in any one state as of each respective date, as well as the largest concentration of loan exposure in any one state. Loans outstanding to Texas-based borrowers totaled $5,653 million and $5,529 million as of November 30, 2023 and May 31, 2023, respectively, and accounted for approximately 17% of total loans outstanding as of each respective date. Of the loans outstanding to Texas-based borrowers, $151 million and
$155 million as of November 30, 2023 and May 31, 2023, respectively, were covered by the Farmer Mac standby repurchase agreement, which reduced our credit risk exposure to Texas-based borrowers to $5,502 million and $5,373 million as of each respective date. See “Note 4—Loans” for information on the Texas-based number of borrowers and loans outstanding by legal entity and member class.
Credit Quality Indicators
Assessing the overall credit quality of our loan portfolio and measuring our credit risk is an ongoing process that involves tracking payment status, modifications to borrowers experiencing financial difficulty, nonperforming loans, charge-offs, the internal risk ratings of our borrowers and other indicators of credit risk. We monitor and subject each borrower and loan facility in our loan portfolio to an individual risk assessment based on quantitative and qualitative factors. Payment status trends and internal risk ratings are indicators, among others, of the probability of borrower default and overall credit quality of our loan portfolio. We believe the overall credit quality of our loan portfolio remained strong as of November 30, 2023.
Loan Modifications to Borrowers Experiencing Financial Difficulty
We actively monitor problem loans and, from time to time, attempt to work with borrowers to manage such exposures through loan workouts or modifications that better align with the borrower’s current ability to pay. Therefore, as part of our loss mitigation efforts, we may provide modifications to a borrower experiencing financial difficulty to improve long-term collectability of the loan and to avoid the need for exercising remedies. We consider the impact of all loan modifications when estimating the credit quality of our loan portfolio and establishing the allowance for credit losses.
On June 1, 2023, we adopted ASU 2022-02, Financial Instruments – Credit Losses (Topic 326) – Troubled Debt Restructurings and Vintage Disclosures, using the prospective adoption method. The ASU eliminated the accounting guidance for TDRs and enhanced the disclosure requirements for loan refinancings and restructurings made with borrowers experiencing financial difficulty, which are to be applied prospectively. For additional information on the adoption of ASU 2022-02 see “Note 1—Summary of Significant Accounting Policies.”
We had one loan modification to a RTFC borrower experiencing financial difficulty during Q2 FY2024 and YTD FY2024. This loan received a term extension and had an amortized cost of $3 million as of November 30, 2023, representing 1% of the RTFC loan portfolio. Loans modified to borrowers experiencing financial difficulty totaled $3 million as of November 30, 2023, consisting of one RTFC loan as discussed above, which wasperforming in accordance with the terms of the loan agreement. There were no unadvanced loan commitments related to this loan.
Troubled Debt Restructurings—Prior to Adoption of ASU 2022-02
As discussed above, ASU 2022-02 eliminated the accounting guidance for TDRs. Prior to the adoption of ASU 2022-02, a loan restructuring or modification of terms is accounted for as TDR if, for economic or legal reasons related to the borrower’s financial difficulties, a concession is granted to the borrower that we would not otherwise consider.
We had loans outstanding to two borrowers totaling $8 million which have been performing in accordance with the terms of their respective restructured loan agreement for an extended period of time and were classified as performing TDR loans and on accrual status as of May 31, 2023. We had loans outstanding to Brazos totaling $23 million classified as nonperforming TDR loans during the three months ended February 28, 2023 (“Q3 FY2023”), which were on non-accrual status as of May 31, 2023. During Q1 FY2024, we received the remaining payment of Brazos’ loans outstanding of $23 million in accordance with the provisions of Brazos’ plan of reorganization to repay its loans in full. Prior to the Brazos loan restructuring, we have not had any loan modifications that were required to be accounted for as TDRs since fiscal year 2016.
Nonperforming Loans
We classify loans as nonperforming at the earlier of the date when we determine: (i) interest or principal payments on the loan is past due 90 days or more; (ii) as a result of court proceedings, the collection of interest or principal payments based on the original contractual terms is not expected; or (iii) the full and timely collection of interest or principal is otherwise uncertain. Once a loan is classified as nonperforming, we generally place the loan on nonaccrual status. Interest accrued but not collected at the date a loan is placed on nonaccrual status is reversed against earnings.
We had a loan to one CFC electric power supply borrower totaling $85 million classified as nonperforming as of November 30, 2023. In comparison, we had loans to two CFC electric power supply borrowers totaling $89 million classified as nonperforming as of May 31, 2023. Nonperforming loans represented 0.25% and 0.27% of total loans outstanding as of November 30, 2023 and May 31, 2023, respectively. The reduction in nonperforming loans of $4 million was due to the receipt of $4 million in loan payments from Brazos Sandy Creek to pay off its nonperforming loan outstanding during the YTD FY2024.
We provide additional information on nonperforming loans in “Note 4—Loans—Credit Quality Indicators—Nonperforming Loans.”
Net Charge-Offs
We had no charge-offs during Q2 FY2024 and YTD FY2024. We received a total of $28 million in loan payments from Brazos and Brazos Sandy Creek to repay their $27 million of total loans outstanding in full during Q1 FY2024. The additional payment received of $1 million was recorded as a loan recovery on the Brazos and Brazos Sandy Creek previously charged-off loan amounts, which resulted in an annualized net recovery rate of 0.01% for YTD FY2024. In comparison, we had charge-offs totaling $15 million for the CFC electric power supply loan portfolio related to Brazos and Brazos Sandy Creek nonperforming loans during Q2 FY2023 and YTD FY2023, which resulted in an annualized net charge-off rate of 0.19% and 0.10% for Q2 FY2023 and YTD FY2023, respectively. Prior to Brazos’ and Brazos Sandy Creek’s bankruptcy filings, we had not experienced any defaults or charge-offs in our electric utility and telecommunications loan portfolios since fiscal year 2013 and 2017, respectively.
Borrower Risk Ratings
As part of our management of credit risk, we maintain a credit risk rating framework under which we employ a consistent process for assessing the credit quality of our loan portfolio. We evaluate each borrower and loan facility in our loan portfolio and assign internal borrower and loan facility risk ratings based on consideration of a number of quantitative and qualitative factors. We categorize loans in our portfolio based on our internally assigned borrower risk ratings, which are intended to assess the general creditworthiness of the borrower and probability of default. Our borrower risk ratings align with the U.S. federal banking regulatory agencies’ credit risk definitions of pass and criticized categories, with the criticized category further segmented among special mention, substandard and doubtful. Pass ratings reflect relatively low probability of default, while criticized ratings have a higher probability of default. Our internally assigned borrower risk ratings serve as the primary credit quality indicator for our loan portfolio. Because our internal borrower risk ratings provide important information on the probability of default, they are a key input in determining our allowance for credit losses.
Criticized loans totaled $300 million and $323 million as of November 30, 2023 and May 31, 2023, respectively, and represented approximately 1% of total loans outstanding as of each respective date. The decrease of $23 million in criticized loans was primarily due to loan payments received from Brazos and Brazos Sandy Creek in the doubtful category, partially offset by an increase in loans outstanding for one CFC electric distribution borrower in the special mention category during YTD FY2024. Each of the borrowers with loans outstanding in the criticized category was current with regard to all principal and interest amounts due to us as of November 30, 2023. In contrast, each of the borrowers with loans outstanding in the criticized category, with the exception of Brazos Sandy Creek, was current with regard to all principal and interest amounts due to us as of May 31, 2023.
We provide additional information on our borrower risk rating framework in our 2023 Form 10-K under “Item 7. MD&A Credit Risk—Loan Portfolio Credit Risk—Credit Quality Indicators.” See “Note 4—Loans” of this Report for detail, by member class, on loans outstanding in each borrower risk rating category.
Allowance for Credit Losses
We are required to maintain an allowance based on a current estimate of credit losses that are expected to occur over the remaining contractual term of the loans in our portfolio. Our allowance for credit losses consists of a collective allowance and an asset-specific allowance. The collective allowance is established for loans in our portfolio that share similar risk characteristics and are therefore evaluated on a collective, or pool, basis in measuring expected credit losses. The asset-
specific allowance is established for loans in our portfolio that do not share similar risk characteristics with other loans in our portfolio and are therefore evaluated on an individual basis in measuring expected credit losses.
Table 15 presents, by legal entity and member class, loans outstanding and the related allowance for credit losses and allowance coverage ratio as of November 30, 2023 and May 31, 2023 and the allowance components as of each date.
Table 15: Allowance for Credit Losses by Borrower Member Class and Evaluation Methodology
| | | | | | | | | | | | | | | | | | | | | | | | | | | | | | | | | | | | | | | | | | | |
| | November 30, 2023 | | May 31, 2023 | | | |
| (Dollars in thousands) | | Loans Outstanding(1) | | Allowance for Credit Losses | | Allowance Coverage Ratio (2) | | Loans Outstanding (1) | | Allowance for Credit Losses | | Allowance Coverage Ratio(2) | | | | | |
| Member class: | | | | | | | | | | | | | | | | | |
| CFC: | | | | | | | | | | | | | | | | | |
| Distribution | | $ | 26,041,672 | | | $ | 16,037 | | | 0.06 | % | | $ | 25,437,077 | | | $ | 14,924 | | | 0.06 | % | | | | | |
| Power supply | | 5,737,597 | | | 33,312 | | | 0.58 | | | 5,437,242 | | | 33,306 | | | 0.61 | | | | | | |
| Statewide and associate | | 268,286 | | | 1,271 | | | 0.47 | | | 200,368 | | | 1,194 | | | 0.60 | | | | | | |
| Total CFC | | 32,047,555 | | | 50,620 | | | 0.16 | | | 31,074,687 | | | 49,424 | | | 0.16 | | | | | | |
| NCSC | | 946,643 | | | 2,941 | | | 0.31 | | | 956,874 | | | 2,464 | | | 0.26 | | | | | | |
| RTFC | | 546,040 | | | 1,993 | | | 0.36 | | | 487,788 | | | 1,206 | | | 0.25 | | | | | | |
| Total | | $ | 33,540,238 | | | $ | 55,554 | | | 0.17 | | | $ | 32,519,349 | | | $ | 53,094 | | | 0.16 | | | | | | |
| | | | | | | | | | | | | | | | | |
| Allowance components: | | | | | | | | | | | | | | | | | |
| Collective allowance | | $ | 33,447,714 | | | $ | 30,762 | | | 0.09 | % | | $ | 32,398,910 | | | $ | 27,335 | | | 0.08 | % | | | | | |
| Asset-specific allowance | | 92,524 | | | 24,792 | | | 26.80 | | | 120,439 | | | 25,759 | | | 21.39 | | | | | | |
| Total allowance for credit losses | | $ | 33,540,238 | | | $ | 55,554 | | | 0.17 | | | $ | 32,519,349 | | | $ | 53,094 | | | 0.16 | | | | | | |
| | | | | | | | | | | | | | | | | |
| Allowance coverage ratios: | | | | | | | | | | | | | | | | | |
Nonaccrual loans (3) | | $ | 84,987 | | | | | 65.37 | % | | $ | 112,209 | | | | | 47.32 | % | | | | | |
___________________________
(1) Represents the unpaid principal balance, net of discounts, charge-offs and recoveries, of loans as of each period end. Excludes unamortized deferred loan origination costs of $13 million as of both November 30, 2023 and May 31, 2023.
(2)Calculated based on the allowance for credit losses attributable to each member class and allowance components at period end divided by the related loans outstanding at period end.
(3)Calculated based on the total allowance for credit losses at period end divided by loans outstanding on nonaccrual status at period end. Nonaccrual loans represented 0.25% and 0.35% of total loans outstanding as of November 30, 2023 and May 31, 2023, respectively. We provide additional information on our nonaccrual loans in “Note 4—Loans” in this Report.
The allowance for credit losses and allowance coverage ratio increased to $56 million and 0.17%, respectively, as of November 30, 2023, from $53 million and 0.16%, respectively, as of May 31, 2023. The $3 million increase in the allowance for credit losses reflected an increase in the collective allowance of $4 million, partially offset by a reduction in the asset-specific allowance of $1 million. The increase in the collective allowance was primarily due to loan portfolio growth and a slight decline in the overall credit quality and risk profile of our loan portfolio. The decrease in the asset-specific allowance was attributable to a timing change in the expected payments on a nonperforming CFC power supply loan.
We discuss our methodology for estimating the allowance for credit losses under the CECL model in “Note 1—Summary of Significant Accounting Policies—Allowance for Credit Losses” and provide information on management’s judgment and the uncertainties involved in our determination of the allowance for credit losses in “MD&A—Critical Accounting Estimates—Allowance for Credit Losses” in our 2023 Form 10-K. We provide additional information on our loans and allowance for credit losses under “Note 4—Loans” and “Note 5—Allowance for Credit Losses” of this Report.
Counterparty Credit Risk
In addition to credit exposure from our borrowers, we enter into other types of financial transactions in the ordinary course of business that expose us to counterparty credit risk, primarily related to transactions involving our cash and cash equivalents, time deposits, securities held in our investment securities portfolio and derivatives. We mitigate our risk by only entering into these transactions with counterparties with investment-grade ratings, establishing operational guidelines and counterparty exposure limits and monitoring our counterparty credit risk position. We evaluate our counterparties based on certain quantitative and qualitative factors and periodically assign internal risk rating grades to our counterparties.
Cash, Time Deposits and Investments Securities Counterparty Credit Exposure
Our cash and cash equivalents, time deposits and investment securities totaled $129 million, $400 million and $417 million, respectively, as of November 30, 2023. The primary credit exposure associated with investments held in our investments portfolio is that issuers will not repay principal and interest in accordance with the contractual terms. Our cash and cash equivalents and time deposits with financial institutions generally have an original maturity of less than one year and pursuant to our investment policy guidelines, all fixed-income debt securities, at the time of purchase, must be rated at least investment grade based on external credit ratings from at least two of the leading global credit rating agencies, when available, or the corresponding equivalent, when not available. We therefore believe that the risk of default by these counterparties is low. As of November 30, 2023, our overall counterparty credit risk was deemed to be satisfactory and not materially changed compared with May 31, 2023.
We provide additional information on the holdings in our investment portfolio below under “Liquidity Risk—Investment Portfolio” and in “Note 3—Investment Securities.”
Derivative Counterparty Credit Exposure
Our derivative counterparty credit exposure relates principally to interest-rate swap contracts. We generally engage in over-the-counter (“OTC”) derivative transactions, which expose us to individual counterparty credit risk because these transactions are executed and settled directly between us and each counterparty. We are exposed to the risk that an individual derivative counterparty defaults on payments due to us, which we may not be able to collect or which may require us to seek a replacement derivative from a different counterparty. This replacement may be at a higher cost, or we may be unable to find a suitable replacement.
We manage our derivative counterparty credit exposure by executing derivative transactions with financial institutions that have investment-grade credit ratings and maintaining enforceable master netting arrangements with these counterparties, which allow us to net derivative assets and liabilities with the same counterparty. We had 12 active derivative counterparties with credit ratings ranging from Aa1 to Baa1 by Moody’s Investors Service (“Moody’s”) as of both November 30, 2023 and May 31, 2023, and from AA- to BBB+ and AA- to A- by S&P as of November 30, 2023 and May 31, 2023, respectively. The total outstanding notional amount of derivatives with these counterparties was $7,621 million and $7,816 million as of November 30, 2023 and May 31, 2023, respectively. The highest single derivative counterparty concentration, by outstanding notional amount, accounted for approximately 23% of the total outstanding notional amount of our derivatives as of both November 30, 2023 and May 31, 2023.
While our derivative agreements include netting provisions that allow for offsetting of all contracts with a given counterparty in the event of default by one of the two parties, we report the fair value of our derivatives on a gross basis by individual contract as either a derivative asset or derivative liability on our consolidated balance sheets. However, we estimate our exposure to credit loss on our derivatives by calculating the replacement cost to settle at current market prices, as defined in our derivative agreements, all outstanding derivatives in a net gain position at the counterparty level where a right of legal offset exists. We provide information on the impact of netting provisions under our master swap agreements and collateral pledged, if any, in “Note 9—Derivative Instruments and Hedging Activities—Impact of Derivatives on Consolidated Balance Sheets.” We believe our exposure to derivative counterparty risk, at any point in time, is equal to the amount of our outstanding derivatives in a net gain position, at the individual counterparty level, which totaled $587 million and $349 million as of November 30, 2023 and May 31, 2023, respectively.
We provide additional detail on our derivative agreements, including a discussion of derivative contracts with credit rating triggers and settlement amounts that would be required in the event of a ratings trigger, in “Note 9—Derivative Instruments and Hedging Activities.”
See “Item 1A. Risk Factors” in our 2023 Form 10-K and “Item 1A. Risk Factors” of this Report for additional information about credit risks related to our business.
We define liquidity as the ability to convert assets into cash quickly and efficiently, maintain access to available funding and roll-over or issue new debt under normal operating conditions and periods of CFC-specific and/or market stress, to ensure that we can meet borrower loan requests, pay current and future obligations and fund our operations in a cost-effective manner. We provide additional information on our liquidity risk-management framework under “Item 7. MD&A—Liquidity Risk—Liquidity Risk Management” in our 2023 Form 10-K.
In addition to cash on hand and time deposits, our primary sources of funds include member loan principal repayments, securities held in our investment portfolio, committed bank revolving lines of credit, committed loan facilities under the Guaranteed Underwriter Program, a revolving note purchase agreement with Farmer Mac and proceeds from debt issuances to members and in the public capital markets. Our primary uses of funds include loan advances to members, principal and interest payments on borrowings, periodic interest settlement payments related to our derivative contracts and operating expenses.
Available Liquidity
As part of our strategy in managing liquidity risk and meeting our liquidity objectives, we seek to maintain various committed sources of funding that are available to meet our near-term liquidity needs. Table 16 presents a comparison between our available liquidity, which consists of cash and cash equivalents, time deposits, our debt securities investment portfolio and amounts under committed credit facilities, as of November 30, 2023 and May 31, 2023.
Table 16: Available Liquidity
| | | | | | | | | | | | | | | | | | | | | | | | | | | | | | | | | | | | | | |
| | November 30, 2023 | | May 31, 2023 |
| (Dollars in millions) | | Total | | Accessed | | Available | | Total | | Accessed | | Available |
| Liquidity sources: | | | | | | | | | | | | |
| Cash, time deposits and investment debt securities: | | | | | | | | | | | | |
| Cash and cash equivalents | | $ | 129 | | | $ | — | | | $ | 129 | | | $ | 199 | | | $ | — | | | $ | 199 | |
| Time deposits | | 400 | | | — | | | 400 | | | — | | | — | | | — | |
Debt securities investment portfolio(1) | | 381 | | | — | | | 381 | | | 475 | | | — | | | 475 | |
| Total cash, time deposits and investment debt securities | | 910 | | | — | | | 910 | | | 674 | | | — | | | 674 | |
| Committed credit facilities: | | | | | | | | | | | | |
Committed bank revolving line of credit agreements—unsecured(2) | | 2,800 | | | 2 | | | 2,798 | | | 2,600 | | | 2 | | | 2,598 | |
Guaranteed Underwriter Program committed facilities—secured(3) | | 9,473 | | | 8,723 | | | 750 | | | 9,473 | | | 8,448 | | | 1,025 | |
Farmer Mac revolving note purchase agreement—secured(4) | | 6,000 | | | 3,902 | | | 2,098 | | | 6,000 | | | 3,150 | | | 2,850 | |
| Total committed credit facilities | | 18,273 | | | 12,627 | | | 5,646 | | | 18,073 | | | 11,600 | | | 6,473 | |
| Total available liquidity | | $ | 19,183 | | | $ | 12,627 | | | $ | 6,556 | | | $ | 18,747 | | | $ | 11,600 | | | $ | 7,147 | |
____________________________(1)Represents the aggregate fair value of our portfolio of debt securities as of period end. Our portfolio of equity securities consists primarily of preferred stock securities that are not as readily redeemable; therefore, we exclude our portfolio of equity securities from our available liquidity.
(2)The committed bank revolving line of credit agreements consist of a three-year and a four-year revolving line of credit agreement. The accessed amount of $2 million as of both November 30, 2023 and May 31, 2023, relates to letters of credit issued pursuant to the four-year revolving line of credit agreement.
(3)The committed facilities under the Guaranteed Underwriter Program are not revolving.
(4)Availability subject to market conditions.
Although as a nonbank financial institution we are not subject to regulatory liquidity requirements, our liquidity management framework includes monitoring our liquidity and funding positions on an ongoing basis and assessing our ability to meet our scheduled debt obligations and other cash flow requirements based on point-in-time metrics as well as forward-looking projections. Our liquidity and funding assessment takes into consideration amounts available under existing liquidity sources, the expected rollover of member short-term investments and scheduled loan principal payment amounts, as well as our continued ability to access the capital markets and other non-capital market related funding sources.
Liquidity Risk Assessment
We utilize several measures to assess our liquidity risk and ensure we have adequate coverage to meet our liquidity needs. Our primary liquidity measures indicate the extent to which we have sufficient liquidity to cover the payment of scheduled debt obligations over the next 12 months. We calculate our liquidity coverage ratios under several scenarios that take into consideration various assumptions about our near-term sources and uses of liquidity, including the assumption that maturities of member short-term investments will not have a significant impact on our anticipated cash outflows. Our members have historically maintained a relatively stable level of short-term investments in CFC in the form of daily liquidity fund notes, commercial paper, select notes and medium-term notes. As such, we expect that our members will continue to reinvest their excess cash in short-term investment products offered by CFC.
Table 17 presents our primary liquidity coverage ratios as of November 30, 2023 and May 31, 2023 and displays the calculation of each ratio as of these respective dates based on the assumptions discussed above.
Table 17: Liquidity Coverage Ratios
| | | | | | | | | | | | | | |
| (Dollars in millions) | | November 30, 2023 | | May 31, 2023 |
Liquidity coverage ratio:(1) | | | | |
Total available liquidity(2) | | $ | 6,556 | | | $ | 7,147 | |
| Debt scheduled to mature over next 12 months: | | | | |
| Short-term borrowings | | 5,162 | | | 4,546 | |
| Long-term and subordinated debt scheduled to mature over next 12 months | | 2,218 | | | 2,383 | |
| Total debt scheduled to mature over next 12 months | | 7,380 | | | 6,929 | |
| Excess (deficit) in available liquidity over debt scheduled to mature over next 12 months | | $ | (824) | | | $ | 218 | |
| | | | |
| Liquidity coverage ratio | | 0.89 | | 1.03 |
| | | | |
Liquidity coverage ratio, excluding expected maturities of member short-term investments(3) | | | | |
Total available liquidity(2) | | $ | 6,556 | | | $ | 7,147 | |
| Total debt scheduled to mature over next 12 months | | 7,380 | | | 6,929 | |
| Exclude: Member short-term investments | | (3,623) | | | (3,253) | |
| Total debt, excluding member short-term investments, scheduled to mature over next 12 months | | 3,757 | | | 3,676 | |
| Excess in available liquidity over total debt, excluding member short-term investments, scheduled to mature over next 12 months | | $ | 2,799 | | | $ | 3,471 | |
| | | | |
| Liquidity coverage ratio, excluding expected maturities of member short-term investments | | 1.75 | | 1.94 |
___________________________
(1)Calculated based on available liquidity at period end divided by total debt scheduled to mature over the next 12 months at period end.
(2)Total available liquidity is presented above in Table 16.
(3)Calculated based on available liquidity at period end divided by debt, excluding member short-term investments, scheduled to mature over the next 12 months.
As presented in Table 17 above, our available liquidity of $6,556 million as of November 30, 2023 was $824 million below our total scheduled debt obligations over the next 12 months of $7,380 million, consisting of short-term borrowings and long-term and subordinated debt. The short-term borrowings scheduled maturity amount consists of member investments of $3,623 million, dealer commercial paper of $1,039 million and Farmer Mac notes payable of $500 million. The long-term and subordinated scheduled debt obligations over the next 12 months of $2,218 million consist of debt maturities and scheduled debt payment amounts, of which, $165 million was from member investments.
We believe we can continue to roll over our member short-term investments of $3,623 million as of November 30, 2023, based on our expectation that our members will continue to reinvest their excess cash in short-term investment products offered by CFC. As mentioned above, our members historically have maintained a relatively stable level of short-term investments in CFC. Member short-term investments in CFC have averaged $3,589 million over the last 12 fiscal quarter-end reporting periods. Our available liquidity as of November 30, 2023 was $2,799 million in excess of, or 1.7 times over, our total scheduled debt obligations, excluding member short-term investments, over the next 12 months of $3,757 million. In addition, we expect to receive $1,516 million from scheduled long-term loan principal payments over the next 12 months.
We expect to continue accessing the dealer commercial paper market as a cost-effective means of satisfying our incremental short-term liquidity needs. Although the intra-quarter amount of dealer commercial paper outstanding may fluctuate based on our liquidity requirements, our intent is to manage our short-term wholesale funding risk by maintaining the dealer commercial paper outstanding at each quarter-end within a range of $1,000 million to $1,500 million. To mitigate commercial paper rollover risk, we expect to continue to maintain our committed bank revolving line of credit agreements and be in compliance with the covenants of these agreements so we can draw on these facilities, if necessary, to repay dealer or member commercial paper that cannot be refinanced with similar debt. In addition, under master repurchase agreements we have with our bank counter parties, we can obtain short-term funding in secured borrowing transactions by selling investment-grade corporate debt securities from our investment securities portfolio subject to an obligation to repurchase the same or similar securities at an agreed-upon price and date.
The issuance of long-term debt, which represents the most significant component of our funding, allows us to reduce our reliance on short-term borrowings, as well as effectively manage our refinancing and interest rate risk. We expect to continue to issue long-term debt in the public capital markets and under our other non-capital market debt arrangements to meet our funding needs and believe that we have sufficient sources of liquidity to meet our debt obligations and support our operations over the next 12 months.
Investment Portfolio
We have an investment portfolio, composed of time deposits, debt securities classified as trading and equity securities. Our time deposits have maturities of less than one year and are valued at carrying value, which approximates fair value. Total time deposits were $400 million as of November 30, 2023. We did not have any time deposits outstanding as of May 31, 2023. The debt securities are reported on our consolidated balance sheets at fair value. The aggregate fair value of the securities in our investment portfolio was $417 million as of November 30, 2023, consisting of debt securities with a fair value of $381 million and equity securities with a fair value of $36 million. In comparison, the aggregate fair value of the securities in our investment portfolio was $510 million as of May 31, 2023, consisting of debt securities with a fair value of $475 million and equity securities with a fair value of $35 million.
Our debt securities investment portfolio is intended to serve as an additional source of liquidity. Under master repurchase agreements that we have with counterparties, we can obtain short-term funding by selling investment-grade corporate debt securities from our investment portfolio subject to an obligation to repurchase the same or similar securities at an agreed-upon price and date. Because we retain effective control over the transferred securities, transactions under these repurchase agreements are accounted for as collateralized financing agreements (i.e., secured borrowings) and not as a sale and subsequent repurchase of securities. The obligation to repurchase the securities is reflected as a component of our short-term borrowings on our consolidated balance sheets. The aggregate fair value of debt securities underlying repurchase transactions is parenthetically disclosed on our consolidated balance sheets. We had no borrowings under repurchase
agreements outstanding as of both November 30, 2023 and May 31, 2023; therefore, we had no debt securities in our investment portfolio pledged as collateral as of each respective date.
We provide additional information on our investment securities portfolio in “Note 3—Investment Securities” of this Report.
Borrowing Capacity Under Various Credit Facilities
The aggregate borrowing capacity under our committed bank revolving line of credit agreements, committed loan facilities under the Guaranteed Underwriter Program and revolving note purchase agreement with Farmer Mac totaled $18,273 million and $18,073 million as of November 30, 2023 and May 31, 2023, respectively, and the aggregate amount available for access totaled $5,646 million and $6,473 million as of each respective date. The following is a discussion of our borrowing capacity and key terms and conditions under each of these credit facilities.
Committed Bank Revolving Line of Credit Agreements—Unsecured
Our committed bank revolving lines of credit may be used for general corporate purposes; however, we generally rely on them as a backup source of liquidity for our member and dealer commercial paper. On November 20, 2023, we amended the three-year and four-year committed bank revolving line of credit agreements to extend the maturity dates to November 28, 2026 and November 28, 2027, respectively, and to include a $100 million swingline facility under each agreement. In connection with the amendments to the revolving line of credit agreements, commitments from the existing banks increased by $100 million under each of the three-year and four-year revolving credit agreements. Commitments of $150 million under each agreement will expire at the prior maturity dates of November 28, 2025 and November 28, 2026. The total commitment amount under the three-year facility and the four-year facility was $1,345 million and $1,455 million, respectively, resulting in a combined total commitment amount under the two facilities of $2,800 million. Under our current committed bank revolving line of credit agreements, we have the ability to request up to $300 million of letters of credit, which would result in a reduction in the remaining available amount under the facilities.
Table 18 presents the total commitment amount under our committed bank revolving line of credit agreements, outstanding letters of credit and the amount available for access as of November 30, 2023.
Table 18: Committed Bank Revolving Line of Credit Agreements
| | | | | | | | | | | | | | | | | | | | | | | | | | | | | | | | |
| | November 30, 2023 | | | | |
| (Dollars in millions) | | Total Commitment | | Letters of Credit Outstanding | | Amount Available for Access | | Maturity | | Annual Facility Fee (1) |
| Bank revolving line of credit term: | | | | | | | | | | |
| 3-year agreement | | $ | 150 | | | $ | — | | | $ | 150 | | | November 28, 2025 | | 7.5 bps |
| 3-year agreement | | 1,195 | | | — | | | 1,195 | | | November 28, 2026 | | 7.5 bps |
| Total 3-year agreement | | 1,345 | | | — | | | 1,345 | | | | | |
| 4-year agreement | | 150 | | | — | | | 150 | | | November 28, 2026 | | 10.0 bps |
| 4-year agreement | | 1,305 | | | 2 | | | 1,303 | | | November 28, 2027 | | 10.0 bps |
| Total 4-year agreement | | 1,455 | | | 2 | | | 1,453 | | | | | |
| Total | | $ | 2,800 | | | $ | 2 | | | $ | 2,798 | | | | | |
____________________________
(1)Facility fee based on CFC’s senior unsecured credit ratings in accordance with the established pricing schedules at the inception of the related agreement.
We did not have any outstanding borrowings under our committed bank revolving line of credit agreements as of November 30, 2023; however, we had letters of credit outstanding of $2 million under the four-year committed bank revolving agreement as of this date.
Although our committed bank revolving line of credit agreements do not contain a material adverse change clause or rating triggers that would limit the banks’ obligations to provide funding under the terms of the agreements, we must be in compliance with the covenants to draw on the facilities. We have been and expect to continue to be in compliance with the
covenants under our committed bank revolving line of credit agreements. As such, we could draw on these facilities to repay dealer or member commercial paper that cannot be rolled over.
Guaranteed Underwriter Program Committed Facilities—Secured
Under the Guaranteed Underwriter Program, we can borrow from the Federal Financing Bank and use the proceeds to extend new loans to our members and refinance existing member debt. As part of the program, we pay fees, based on our outstanding borrowings, that are intended to help fund the USDA Rural Economic Development Loan and Grant program and thereby support additional investment in rural economic development projects. The borrowings under this program are guaranteed by the RUS. Each advance is subject to quarterly amortization and a final maturity not longer than 30 years from the date of the advance.
As displayed in Table 16, we had accessed $8,723 million under the Guaranteed Underwriter Program and up to $750 million was available for borrowing as of November 30, 2023. The $750 million available borrowing amount is available for advance through July 15, 2027. We are required to pledge eligible distribution system loans or power supply system loans as collateral in an amount at least equal to our total outstanding borrowings under the Guaranteed Underwriter Program committed loan facilities, which totaled $6,895 million as of November 30, 2023.
On December 19, 2023, we closed on a $450 million Series U committed loan facility from the U.S. Treasury Department’s Federal Financing Bank under the Guaranteed Underwriter Program. Pursuant to this facility, we may borrow any time before July 15, 2028. Each advance is subject to quarterly amortization and a final maturity not longer than 30 years from the date of the advance.
Farmer Mac Revolving Note Purchase Agreement—Secured
We have a revolving note purchase agreement with Farmer Mac under which we can borrow up to $6,000 million from Farmer Mac at any time, subject to market conditions, through June 30, 2027. The agreement has successive automatic one-year renewals beginning June 30, 2026, unless Farmer Mac provides 425 days’ written notice of non-renewal.
Under this agreement, we had outstanding secured notes payable totaling $3,902 million and $3,150 million as of November 30, 2023 and May 31, 2023, respectively. We borrowed $500 million in short-term notes payable and $300 million in long-term notes payable under this note purchase agreement with Farmer Mac during YTD FY2024. As displayed in Table 16, the amount available for borrowing under this agreement was $2,098 million as of November 30, 2023. We are required to pledge eligible electric distribution system or electric power supply system loans as collateral in an amount at least equal to the total principal amount of notes outstanding under this agreement.
We provide additional information on pledged collateral below under “Pledged Collateral” in this section and in “Note 3—Investment Securities” and “Note 4—Loans.”
Short-Term Borrowings
Our short-term borrowings, which we rely on to meet our daily, near-term funding needs, consist of commercial paper, which we offer to members and dealers, select notes and daily liquidity fund notes offered to members, medium-term notes offered to members and dealers and funds from repurchase secured borrowing transactions.
Short-term borrowings increased $578$616 million to $5,124$5,162 million as of August 31,November 30, 2023, from $4,546 million as of May 31, 2023, and accounted for 16% and 15% of total debt outstanding as of each respective period. The increase in short-term borrowings was primarily driven by the increase in short-term notes payable advanced under the Farmer Mac revolving note purchase agreement and short-term member investments, partially offset by the decrease in outstanding dealer commercial paper.
Member investments have historically been our primary source of short-term borrowings. Table 1719 displays the composition, by funding source, of our short-term borrowings as of August 31,November 30, 2023 and May 31, 2023. As indicated in Table 17,19, members’ investments represented 69%70% and 72% of our outstanding short-term borrowings as of August 31,November 30, 2023 and May 31, 2023, respectively.
Table 17:19: Short-Term Borrowings—Funding Sources
| | | August 31, 2023 | | May 31, 2023 | | November 30, 2023 | | May 31, 2023 |
| (Dollars in thousands) | (Dollars in thousands) | | Amount
Outstanding | | % of Total Short-Term Borrowings | | Amount
Outstanding | | % of Total Short-Term Borrowings | (Dollars in thousands) | | Amount
Outstanding | | % of Total Short-Term Borrowings | | Amount
Outstanding | | % of Total Short-Term Borrowings |
| Funding source: | Funding source: | | | | | | | | | Funding source: | | | | | | | | |
| Members | Members | | $ | 3,535,992 | | | 69 | % | | $ | 3,253,108 | | | 72 | % | Members | | $ | 3,622,945 | | | 70 | % | | $ | 3,253,108 | | | 72 | % |
| Farmer Mac notes payable | Farmer Mac notes payable | | 500,000 | | | 10 | | | — | | | — | | Farmer Mac notes payable | | 500,000 | | | 10 | | | — | | | — | |
| Capital markets | Capital markets | | 1,088,343 | | | 21 | | | 1,293,167 | | | 28 | | Capital markets | | 1,038,638 | | | 20 | | | 1,293,167 | | | 28 | |
| Total | Total | | $ | 5,124,335 | | | 100 | % | | $ | 4,546,275 | | | 100 | % | Total | | $ | 5,161,583 | | | 100 | % | | $ | 4,546,275 | | | 100 | % |
Our intent is to manage our short-term wholesale funding risk by maintaining the dealer commercial paper outstanding at each quarter-end within a range of $1,000 million to $1,500 million, although the intra-quarter amount of dealer commercial paper outstanding may fluctuate based on our liquidity requirements. Dealer commercial paper outstanding of $1,088$1,039 million and $1,293 million as of August 31,November 30, 2023 and May 31, 2023, respectively, was within our quarter-end target range of $1,000 million to $1,500 million.target.
See “Note 6—Short-Term Borrowing” for additional information on our short-term borrowings.
Long-Term and Subordinated Debt
Long-term and subordinated debt, which represents the most significant source of our funding, totaled $26,280$27,033 million and $26,453 million as of August 31,November 30, 2023 and May 31, 2023, respectively, and accounted for 84% and 85% of total debt outstanding as of each respective date. The decreaseincrease in long-term and subordinated debt was primarily due to debt repaymentsissuances totaling $612$1,752 million, during the current quarter, partially offset by debt issuancesrepayments totaling $435$1,180 million during the current fiscal year,YTD FY2024, as presented below in Table 18.20.
The issuance of long-term debt allows us to reduce our reliance on short-term borrowings and effectively manage our refinancing and interest rate risk, due in part to the multi-year contractual maturity structure of long-term debt. In addition to access to private debt facilities, we also issue debt in the public capital markets. Pursuant to Rule 405 of the Securities Act, we are classified as a “well-known seasoned issuer.” Under our effective shelf registration statements filed with the U.S. Securities and Exchange Commission (“SEC”), we may offer and issue the following debt securities:
•an unlimited amount of collateral trust bonds and senior and subordinated debt securities, including medium-term notes, member capital securities and subordinated deferrable debt, until October 2023;2026; and
•daily liquidity fund notes up to $20,000 million in the aggregate—with a $3,000 million limit on the aggregate principal amount outstanding at any time—until March 2025.
We intend to file a new registration statement registering an unlimited amount of collateral trust bonds and senior and subordinated debt securities, including medium-term notes, member capital securities and subordinated deferrable debt prior to the expiration of the existing shelf registration statement in October 2023.
Although we register member capital securities and the daily liquidity fund notes with the SEC, these securities are not available for sale to the general public. Medium-term notes are available for sale to both the general public and members. Notwithstanding the foregoing, we have contractual limitations with respect to the amount of senior indebtedness we may incur.
Long-Term Debt and Subordinated Debt—Issuances and Repayments
Table 1820 summarizes long-term and subordinated debt issuances and repayments during the three months ended August 31, 2023.YTD FY2024.
Table 18:20: Long-Term and Subordinated Debt— Issuances and Repayments
| | | Three Months Ended August 31, 2023 | | YTD FY2024 |
| (Dollars in thousands) | (Dollars in thousands) | | Issuances | | Repayments(1) | (Dollars in thousands) | | Issuances | | Repayments(1) |
| Debt product type: | Debt product type: | | | | | Debt product type: | | | | |
| | Collateral trust bonds | | Collateral trust bonds | | $ | — | | | $ | 405,000 | |
| Guaranteed Underwriter Program notes payable | Guaranteed Underwriter Program notes payable | | $ | — | | | $ | 50,496 | | Guaranteed Underwriter Program notes payable | | 275,000 | | | 101,031 | |
| Farmer Mac notes payable | Farmer Mac notes payable | | — | | | 23,945 | | Farmer Mac notes payable | | 300,000 | | | 47,990 | |
| Medium-term notes sold to members | Medium-term notes sold to members | | 23,645 | | | 16,550 | | Medium-term notes sold to members | | 50,255 | | | 85,849 | |
| Medium-term notes sold to dealers | Medium-term notes sold to dealers | | 411,651 | | | 419,752 | | Medium-term notes sold to dealers | | 1,126,290 | | | 425,478 | |
| | Subordinated deferrable debt | Subordinated deferrable debt | | — | | | 100,000 | | Subordinated deferrable debt | | — | | | 100,000 | |
| Members’ subordinated certificates | Members’ subordinated certificates | | — | | | 1,100 | | Members’ subordinated certificates | | 98 | | | 14,405 | |
| Total | Total | | $ | 435,296 | | | $ | 611,843 | | Total | | $ | 1,751,643 | | | $ | 1,179,753 | |
____________________________
(1) Repayments include principal maturities, scheduled amortization payments, repurchases and redemptions.
Long-Term and Subordinated Debt—Principal Maturity and Amortization
Table 1921 summarizes scheduled principal maturity and amortization of our long-term debt, subordinated deferrable debt and members’ subordinated certificates outstanding of as of August 31,November 30, 2023, in each fiscal year during the five-year period ending May 31, 2028, and thereafter.
Table 19:21: Long-Term and Subordinated Debt—Scheduled Principal Maturities and Amortization(1)
| | (Dollars in thousands) | (Dollars in thousands) | | Scheduled Amortization(2) | | % of Total | (Dollars in thousands) | | Scheduled Amortization(2) | | % of Total |
| Fiscal year ending May 31: | Fiscal year ending May 31: | | | | | Fiscal year ending May 31: | | | | |
| 2024 | 2024 | | $ | 1,770,551 | | | 7 | % | 2024 | | $ | 1,223,418 | | | 4 | % |
| 2025 | 2025 | | 2,300,339 | | | 9 | | 2025 | | 2,627,776 | | | 10 | |
| 2026 | 2026 | | 3,546,046 | | | 13 | | 2026 | | 3,621,396 | | | 13 | |
| 2027 | 2027 | | 1,704,161 | | | 6 | | 2027 | | 2,054,733 | | | 8 | |
| 2028 | 2028 | | 2,164,450 | | | 8 | | 2028 | | 2,166,810 | | | 8 | |
| Thereafter | Thereafter | | 15,043,379 | | | 57 | | Thereafter | | 15,583,278 | | | 57 | |
| Total | Total | | $ | 26,528,926 | | | 100 | % | Total | | $ | 27,277,411 | | | 100 | % |
____________________________
(1) Amounts presented are based on the face amount of debt outstanding as of August 31,November 30, 2023, and therefore does not include related debt issuance costs and discounts.
(2) Member loan subordinated certificates totaling $158$145 million amortize annually based on the unpaid principal balance of the related loan.
We provide additional information on our financing activities under the above “Consolidated Balance Sheet Analysis—Debt” and in “Note 7—Long-Term Debt” and “Note 8—Subordinated Deferrable Debt.”
Pledged Collateral
Under our secured borrowing agreements we are required to pledge loans, investment debt securities or other collateral and maintain certain pledged collateral ratios. Of our total debt outstanding of $31,405$32,195 million as of August 31,November 30, 2023, $17,879$17,979 million, or 57%56%, was secured by pledged loans totaling $20,798$21,438 million. In comparison, of our total debt outstanding of $30,999 million as of May 31, 2023, $17,450 million, or 56%, was secured by pledged loans totaling $21,038 million. Following is additional information on the collateral pledging requirements for our secured borrowing agreements.
Secured Borrowing Agreements—Pledged Loan Requirements
We are required to pledge loans or other collateral in transactions under our collateral trust bond indentures, bond agreements under the Guaranteed Underwriter Program and note purchase agreement with Farmer Mac. Total debt
outstanding is presented on our consolidated balance sheets net of unamortized discounts and issuance costs. Our collateral pledging requirements are based, however, on the face amount of secured outstanding debt, which excludes net unamortized discounts and issuance costs. However, as discussed below, we typically maintain pledged collateral in excess of the required percentage. Under the provisions of our committed bank revolving line of credit agreements, the excess collateral that we are allowed to pledge cannot exceed 150% of the outstanding borrowings under our collateral trust bond indentures, the Guaranteed Underwriter Program or the Farmer Mac note purchase agreements.
Table 2022 displays the collateral coverage ratios pursuant to these secured borrowing agreements as of August 31,November 30, 2023 and May 31, 2023.
Table 20:22: Collateral Pledged
| | | | | Requirement Coverage Ratios | | | | | Requirement Coverage Ratios | | |
| | | Maximum Committed Bank Revolving Line of Credit Agreements | | Actual Coverage Ratios(1) | | | Maximum Committed Bank Revolving Line of Credit Agreements | | Actual Coverage Ratios(1) |
| | Minimum Debt Indentures | | August 31, 2023 | | May 31, 2023 | | Minimum Debt Indentures | | November 30, 2023 | | May 31, 2023 |
| Secured borrowing agreement type: | Secured borrowing agreement type: | | | | | | | | | Secured borrowing agreement type: | | | | | | | | |
| Collateral trust bonds 1994 indenture | Collateral trust bonds 1994 indenture | | 100 | % | | 150 | % | | 111 | % | | 115 | % | Collateral trust bonds 1994 indenture | | 100 | % | | 150 | % | | 144 | % | | 115 | % |
| Collateral trust bonds 2007 indenture | Collateral trust bonds 2007 indenture | | 100 | | | 150 | | | 112 | | | 114 | | Collateral trust bonds 2007 indenture | | 100 | | | 150 | | | 124 | | | 114 | |
| Guaranteed Underwriter Program notes payable | Guaranteed Underwriter Program notes payable | | 100 | | | 150 | | | 117 | | | 117 | | Guaranteed Underwriter Program notes payable | | 100 | | | 150 | | | 112 | | | 117 | |
| Farmer Mac notes payable | Farmer Mac notes payable | | 100 | | | 150 | | | 117 | | | 136 | | Farmer Mac notes payable | | 100 | | | 150 | | | 117 | | | 136 | |
Clean Renewable Energy Bonds Series 2009A(2) | Clean Renewable Energy Bonds Series 2009A(2) | | 100 | | | 150 | | | 126 | | | 129 | | Clean Renewable Energy Bonds Series 2009A(2) | | 100 | | | 150 | | | 115 | | | 129 | |
___________________________
(1) Calculated based on the amount of collateral pledged divided by the face amount of outstanding secured debt.
(2) Collateral includes cash pledged.
Table 2123 displays the unpaid principal balance of loans pledged for secured debt, the excess collateral pledged and unencumbered loans as of August 31,November 30, 2023 and May 31, 2023.
Table 21:23: Loans—Unencumbered Loans
| | (Dollars in thousands) | (Dollars in thousands) | | August 31, 2023 | | May 31, 2023 | (Dollars in thousands) | | November 30, 2023 | | May 31, 2023 |
Total loans outstanding(1) | Total loans outstanding(1) | | $ | 33,083,493 | | | $ | 32,519,349 | | Total loans outstanding(1) | | $ | 33,540,238 | | | $ | 32,519,349 | |
Less: Loans required pledged under secured debt agreements(2) | Less: Loans required pledged under secured debt agreements(2) | | (18,089,908) | | | (17,664,350) | | Less: Loans required pledged under secured debt agreements(2) | | (18,185,328) | | | (17,664,350) | |
Loans pledged in excess of required amount(2)(3) | Loans pledged in excess of required amount(2)(3) | | (2,708,499) | | | (3,373,580) | | Loans pledged in excess of required amount(2)(3) | | (3,252,257) | | | (3,373,580) | |
| Total pledged loans | Total pledged loans | | (20,798,407) | | | (21,037,930) | | Total pledged loans | | (21,437,585) | | | (21,037,930) | |
| Unencumbered loans | Unencumbered loans | | $ | 12,285,086 | | | $ | 11,481,419 | | Unencumbered loans | | $ | 12,102,653 | | | $ | 11,481,419 | |
| | | | | | | | | | | | | | |
| Unencumbered loans as a percentage of total loans outstanding | | 37% | | 35% |
| | | | | | | | | | | | | | |
| Unencumbered loans as a percentage of total loans outstanding | | 36% | | 35% |
____________________________
(1) Represents the unpaid principal balance of loans as of the end of each period. Excludes unamortized deferred loan origination costs of $13 million as of both August 31,November 30, 2023 and May 31, 2023.
(2) Reflects unpaid principal balance of pledged loans.
(3) Excludes cash collateral pledged to secure debt. If there is an event of default under most of our indentures, we can only withdraw the excess collateral if we substitute cash or permitted investments of equal value.
As displayed above in Table 21,23, we had excess loans pledged as collateral totaling $2,708$3,252 million and $3,374 million as of August 31,November 30, 2023 and May 31, 2023, respectively. We typically pledge loans in excess of the required amount for the following reasons: (i) our distribution and power supply loans are typically amortizing loans that require scheduled principal payments over the life of the loan, whereas the debt securities issued under secured indentures and agreements typically
have bullet maturities; (ii) distribution and power supply borrowers have the option to prepay their loans; and (iii) individual loans may become ineligible for various reasons, some of which may be temporary.
We provide additional information on our borrowings, including the maturity profile, below in the “Liquidity Risk” section and additional information on pledged loans in “Note 4—Loans” of this Report. For additional detail on each of our debt product types, refer to “Note 5—Short-Term Borrowings,” “Note 7—Long-Term Debt,” “Note 8—Subordinated Deferrable Debt” and “Note 9—Members’ Subordinated Certificates” in our 2023 Form 10-K.
Off-Balance Sheet Arrangements
In the ordinary course of business, we engage in financial transactions that are not presented on our consolidated balance sheets, or may be recorded on our consolidated balance sheets in amounts that are different from the full contract or notional amount of the transaction. Our off-balance sheet arrangements consist primarily of unadvanced loan commitments intended to meet the financial needs of our members and guarantees of member obligations, which may affect our liquidity and funding requirements based on the likelihood that borrowers will advance funds under the loan commitments or we will be required to perform under the guarantee obligations. We provide information on our unadvanced loan commitments in “Note 4—Loans” and information on our guarantee obligations in “Note 11—Guarantees.”
Projected Near-Term Sources and Uses of Funds
Table 2224 below displays a projection of our primary long-term sources and uses of funds, by quarter, over each of the next six fiscal quarters through the quarter ending February 28,May 31, 2025. Our projection is based on the following, which includes several assumptions: (i) the estimated issuance of long-term debt, including capital market and other non-capital market term debt, is based on our market-risk management goal of minimizing the mismatch between the cash flows from our financial assets and our financial liabilities; (ii) long-term loan scheduled amortization repayment amounts represent scheduled loan principal payments for long-term loans outstanding as of August 31,November 30, 2023 and estimated loan principal payments for long-term loan advances, plus estimated prepayment amounts on long-term loans; (iii) long-term and subordinated debt maturities consist of both scheduled principal maturity and amortization amounts and projected principal maturity and amortization amounts on term debt outstanding in each period presented; and (iv) long-term loan advances are based on our current projection of member demand for loans. In addition, amounts available under our committed bank revolving lines of credit, net increases in dealer commercial paper and short-term member investments are intended to serve as a backup source of liquidity.
Table 22:24: Liquidity—Projected Long-Term Sources and Uses of Funds(1)
| | | | | | | | | | | | | | | | | | | | | | | | | | | | | | | | | | | | | | | | | | | | | | | | |
| | | | | Projected Long-Term Sources of Funds | | Projected Long-Term Uses of Funds | | | | |
| (Dollars in millions) | | | | Long-Term Debt Issuance | | Anticipated Long-Term
Loan Repayments(2) | | | | Total Projected Long-Term
Sources of
Funds | | Long-Term and Subordinated Debt Maturities(3) | | Long-Term
Loan Advances | | | | Total Projected
Long-Term Uses of
Funds | | | | |
| | | | | | | | | | | | | | | | | | | | | | |
| 2Q FY2024 | | | | $ | 705 | | | $ | 361 | | | | | $ | 1,066 | | | $ | 698 | | | $ | 1,062 | | | | | $ | 1,760 | | | | | |
| 3Q FY2024 | | | | 1,691 | | | 365 | | | | | 2,056 | | | 1,169 | | | 940 | | | | | 2,109 | | | | | |
| 4Q FY2024 | | | | 225 | | | 374 | | | | | 599 | | | 251 | | | 703 | | | | | 954 | | | | | |
| 1Q FY2025 | | | | 594 | | | 387 | | | | | 981 | | | 208 | | | 737 | | | | | 945 | | | | | |
| 2Q FY2025 | | | | 1,111 | | | 377 | | | | | 1,488 | | | 865 | | | 727 | | | | | 1,592 | | | | | |
| 3Q FY2025 | | | | 1,658 | | | 381 | | | | | 2,039 | | | 1,227 | | | 731 | | | | | 1,958 | | | | | |
| Total | | | | $ | 5,984 | | | $ | 2,245 | | | | | $ | 8,229 | | | $ | 4,418 | | | $ | 4,900 | | | | | $ | 9,318 | | | | | |
| | | | | | | | | | | | | | | | | | | | | | | | | | | | | | | | | | | | | | | | | | | | | | | | |
| | | | | Projected Long-Term Sources of Funds | | Projected Long-Term Uses of Funds | | | | |
| (Dollars in millions) | | | | Long-Term Debt Issuance | | Anticipated Long-Term
Loan Repayments(2) | | | | Total Projected Long-Term
Sources of
Funds | | Long-Term and Subordinated Debt Maturities(3) | | Long-Term
Loan Advances | | | | Total Projected
Long-Term Uses of
Funds | | | | |
| | | | | | | | | | | | | | | | | | | | | | |
| Q3 FY2024 | | | | $ | 1,002 | | | $ | 374 | | | | | $ | 1,376 | | | $ | 1,169 | | | $ | 957 | | | | | $ | 2,126 | | | | | |
| Q4 FY2024 | | | | 669 | | | 370 | | | | | 1,039 | | | 552 | | | 850 | | | | | 1,402 | | | | | |
| Q1 FY2025 | | | | 305 | | | 391 | | | | | 696 | | | 385 | | | 741 | | | | | 1,126 | | | | | |
| Q2 FY2025 | | | | 1,129 | | | 381 | | | | | 1,510 | | | 959 | | | 731 | | | | | 1,690 | | | | | |
| Q3 FY2025 | | | | 1,673 | | | 382 | | | | | 2,055 | | | 1,229 | | | 732 | | | | | 1,961 | | | | | |
| Q4 FY2025 | | | | 598 | | | 390 | | | | | 988 | | | 420 | | | 740 | | | | | 1,160 | | | | | |
| Total | | | | $ | 5,376 | | | $ | 2,288 | | | | | $ | 7,664 | | | $ | 4,714 | | | $ | 4,751 | | | | | $ | 9,465 | | | | | |
____________________________
(1) The dates presented represent the end of each quarterly period through the quarter ended February 28,May 31, 2025.
(2) Anticipated long-term loan repayments include scheduled long-term loan amortizations and anticipated cash repayments at repricing date.
(3) Long-term debt maturities also include medium-term notes with an original maturity of one year or less and expected early redemptions of debt.
As displayed in Table 22,24, we currently project long-term advances of $3,442$3,279 million over the next 12 months, which we project will exceed anticipated long-term loan repayments over the same period of $1,487$1,516 million, resulting in net long-term loan growth of approximately $1,955$1,763 million over the next 12 months.
The estimates presented above are developed at a particular point in time based on our expected future business growth and funding. Our actual results and future estimates may vary, perhaps significantly, from the current projections, as a result of changes in market conditions, management actions or other factors.
Credit Ratings
Our funding and liquidity, borrowing capacity, ability to access capital markets and other sources of funds and the cost of these funds are partially dependent on our credit ratings.
Table 2325 displays our credit ratings as of August 31,November 30, 2023, which remain unchanged as of the date of this Report. In September 2023, FitchSubsequent to Q2 FY2024, S&P affirmed CFC’s creditCFC’s ratings and stable outlook.outlook in December 2023.
Table 23:25: Credit Ratings
| | | | | | | | | | | | | | | | | | | | |
| | August 31,November 30, 2023 |
| | Moody’s | | S&P | | Fitch |
| CFC credit ratings and outlook: | | | | | | |
Long-term issuer credit rating(1) | | A2 | | A- | | A |
Senior secured debt(2) | | A1 | | A- | | A+ |
Senior unsecured debt(3) | | A2 | | A- | | A |
| Subordinated debt | | A3 | | BBB | | BBB+ |
| Commercial paper | | P-1 | | A-2 | | F1 |
| Outlook | | Stable | | Stable | | Stable |
Ratings and outlook confirmationRating agency credit opinion date | | February 16, 2023 | | December 7, 2022 | | February 6,September 22, 2023 |
___________________________
(1) Based on our senior unsecured debt rating.
(2)Applies to our collateral trust bonds.
(3)Applies to our medium-term notes.
See “Credit Risk—Counterparty Credit Risk—Derivative Counterparty Credit Exposure” above for information on credit rating provisions related to our derivative contracts.
Financial Ratios
Our debt-to-equity ratio decreased to 11.6311.26 as of August 31,November 30, 2023, from 12.14 as of May 31, 2023, primarily due to an increase in equity from our reported net income of $228$376 million for the current quarter,YTD FY2024, which was partially offset by a decrease in equity attributable to the CFC Board of Directors’ authorized patronage capital retirement in July 2023 of $72 million.
While our goal is to maintain an adjusted debt-to-equity ratio of approximately 6-to-1, the adjusted debt-to-equity ratio increased to 6.316.38 as of August 31,November 30, 2023 from 6.04 as of May 31, 2023, and was above our targeted goal, largely due to the combined impact of an increase in adjusted liabilities resulting from additional borrowings to fund growth in our loan portfolio and a decrease in adjusted equity. The decrease in adjusted equity was primarily due to the early redemption during the current quarterYTD FY2024 of $100 million in principal amount of our $400 million subordinated deferrable debt due 2043 and the CFC Board of Directors’ authorized patronage capital retirement in July 2023, partially offset by our current-quarter adjusted net income.income for YTD FY2024.
Debt Covenants
As part of our short-term and long-term borrowing arrangements, we are subject to various financial and operational covenants. If we fail to maintain specified financial ratios, such failure could constitute a default by CFC of certain covenants under our committed bank revolving line of credit agreements and senior debt indentures. We were in compliance
with all covenants and conditions under our committed bank revolving line of credit agreements and senior debt indentures as of August 31,November 30, 2023.
As discussed above in “Summary of Selected Financial Data,” the financial covenants set forth in our committed bank revolving line of credit agreements and senior debt indentures are based on adjusted financial measures, including adjusted TIER. We provide a reconciliation of adjusted TIER and other non-GAAP financial measures disclosed in this Report to the most comparable U.S. GAAP financial measures below in “Non-GAAP Financial Measures.” See “Item 7. MD&A—Non-GAAP Financial Measures” in our 2023 Form 10-K for a discussion of each of our non-GAAP measures and an explanation of the adjustments to derive these measures.
Interest rate risk represents our primary source of market risk, as interest rate-volatility can have a significant impact on the earnings and overall financial condition of a financial institution. We are exposed to interest rate risk primarily from the differences in the timing between the maturity or repricing of our loans and the liabilities funding our loans. We seek to generate stable adjusted net interest income on a sustained and long-term basis by minimizing the mismatch between the cash flows from our financial assets and our financial liabilities. We use derivatives as a tool in matching the duration and repricing characteristics of our interest-rate sensitive assets and liabilities. We provide additional information on our management of interest rate risk in our 2023 Form 10-K under “Item 7. MD&A—Market Risk—Interest Rate Risk Management.” Below we discuss how we manage and measure interest rate risk.
Interest Rate Risk Assessment
Our Asset Liability Management (“ALM”) framework includes the use of analytic tools and capabilities, enabling CFC to generate a comprehensive profile of our interest rate risk exposure. We routinely measure and assess our interest rate risk exposure using various methodologies through the use of ALM models that enable us to accurately measure and monitor our interest rate risk exposure under multiple interest rate scenarios using several different techniques. Below we present two measures used to assess our interest rate risk exposure: (i) the interest rate sensitivity of projected net interest income and adjusted net interest income; and (ii) duration gap.
Interest Rate Sensitivity Analysis
We regularly evaluate the sensitivity of our interest-earning assets and the interest-bearing liabilities funding those assets and our net interest income and adjusted net interest income projections under multiple interest rate scenarios. Each month we update our ALM models to reflect our existing balance sheet position and incorporate different assumptions about forecasted changes in our balance sheet position over the next 12 months. Based on the forecasted balance sheet changes, we generate various projections of net interest income and adjusted net interest income over the next 12 months. Management reviews and assesses these projections and underlying assumptions to identify a baseline scenario of projected net interest income and adjusted net interest income over the next 12 months, which reflects what management considers, at the time, as the most likely scenario. As discussed under “Summary of Selected Financial Data,” we derive adjusted net interest income by adjusting our reported interest expense and net interest income to include the impact of net derivative cash settlements amounts.
Our interest rate sensitivity analyses take into consideration existing interest rate-sensitive assets and liabilities as of the reported balance sheet date and forecasted changes to the balance sheet over the next 12 months under management’s baseline projection. As discussed in the “Executive Summary—Outlook” section, we currently anticipate net long-term loan growth of $1,955of $1,763 million over the next 12 months. We also expect that our variable-rate line of credit loans outstanding will remain at an elevated level over the same period. Although tThe September 2023 consensus market outlook for interest rates indicated rising interest rates across the yield curve during the remainder of 2023, followed by a decrease in short-term interest rates during 2024. Thehe yield curve is expected to remain inverted for the remainder of 2023 and,throughout 2024, given the expected drop in short-term interest rates, in the following year, the yield curve inversion is expected to narrow in 2024, and remain inverted beyond that period. 2024.
Based on thisour current forecast assumptions, including the yield curve forecast noted above, we anticipateproject a decrease in our reported net interest income and reported net interest yield over the next 12 months relativecompared to the 12-month period ended August 31,November 30, 2023. However, weWe also project an increasea decrease in our adjusted net interest income and adjusted net interest yield over the next 12 months compared with the 12-month period ended August 31, 2023. This is primarily attributable to the expected significant increase in our derivative net periodic cash settlements income, which will contribute to reducing our adjusted cost of borrowings. Additionally, we anticipate a sustained expansion of our loan portfolio, with the variable-rate line of credit loans outstanding remaining at an elevated level. The anticipated improvement in our adjusted net interest yield over the next 12 months
next 12 months relative to the 12-month period ended August 31,November 30, 2023, isprimarily due to the current yield curve assumptions and our balance sheet position.
Table 2426 presents the estimated percentage impact that a hypothetical instantaneous parallel shift of plus or minus 100 basis points in the interest rate yield curve, relative to our base case forecast yield curve, would have on our projected baseline 12-month net interest income and adjusted net interest income as of August 31,November 30, 2023 and May 31, 2023. In instances where the hypothetical instantaneous interest rate shift of minus 100 basis points results in a negative interest rate, we assume an interest rate floor rate of 0% in a negative interest rate. We also present the estimated percentage impact on our projected baseline 12-month net interest income and adjusted net interest income assuming a hypothetical inverted yield curve under which shorter-term interest rates increase by an instantaneous 75 basis points and longer-term interest rates decrease by an instantaneous 75 basis points.
Table 24:26: Interest Rate Sensitivity Analysis
| | | August 31, 2023 | | May 31, 2023 | | November 30, 2023 | | May 31, 2023 |
Estimated Impact(1) | Estimated Impact(1) | | + 100 Basis Points | | – 100 Basis Points | | Inverted | | + 100 Basis Points | | – 100 Basis Points | | Inverted | Estimated Impact(1) | | + 100 Basis Points | | – 100 Basis Points | | Inverted | | + 100 Basis Points | | – 100 Basis Points | | Inverted |
| Net interest income | Net interest income | | (5.29) | % | | 5.38 | % | | (6.84) | % | | (4.41) | % | | 4.70 | % | | (5.88) | % | Net interest income | | (6.55) | % | | 6.64 | % | | (8.41) | % | | (4.41) | % | | 4.70 | % | | (5.88) | % |
| Derivative cash settlements | Derivative cash settlements | | 13.04 | % | | (14.11) | % | | 8.39 | % | | 11.50 | % | | (11.58) | % | | 9.38 | % | Derivative cash settlements | | 13.08 | % | | (13.08) | % | | 10.73 | % | | 11.50 | % | | (11.58) | % | | 9.38 | % |
Adjusted net interest income(2) | Adjusted net interest income(2) | | 7.75 | % | | (8.73) | % | | 1.55 | % | | 7.09 | % | | (6.88) | % | | 3.50 | % | Adjusted net interest income(2) | | 6.54 | % | | (6.44) | % | | 2.31 | % | | 7.09 | % | | (6.88) | % | | 3.50 | % |
|
____________________________
(1)The actual impact on our reported and adjusted net interest income may differ significantly from the sensitivity analysis presented.
(2)We include net periodic derivative cash settlement interest expense amounts as a component of interest expense in deriving adjusted net interest income. See the section “Non-GAAP Financial Measures” for a reconciliation of the non-GAAP financial measures presented in this Report to the most comparable U.S. GAAP financial measures.
The changes in the sensitivity measures between August 31,November 30, 2023 and May 31, 2023 are primarily attributable to a slight increasedecrease in the amount of variable rate assets being funded with fixed rate debt, changes in the size and composition of our forecasted balance sheet, as well as changes in current interest rates and forecasted interest rates. As the interest rate sensitivity simulations displayed in Table 2426 indicate, we would expect an unfavorable impact on our projected net interest income over a 12-month horizon as of August 31,November 30, 2023, under the hypothetical scenario of an instantaneous parallel shift of plus 100 basis points in the interest rate yield curve and a further inverted yield curve. However, we would expect an unfavorable impact on our adjusted net interest income over a 12-month horizon as of August 31,November 30, 2023, under the hypothetical scenario of an instantaneous parallel shift of minus 100 basis points in the interest rate yield curve.
Duration Gap
The duration gap, which represents the difference between the estimated duration of our interest-earning assets and the estimated duration of our interest-bearing liabilities, summarizes the extent to which the cash flows for assets and liabilities are matched over time. We use derivatives in managing the differences in timing between the maturities or repricing of our interest earning assets and the debt funding those assets. A positive duration gap indicates that the duration of our interest-earning assets is greater than the duration of our debt and derivatives, and therefore denotes an increased exposure to rising interest rates over the long term. Conversely, a negative duration gap indicates that the duration of our interest-earning assets is less than the duration of our debt and derivatives, and therefore denotes an increased exposure to declining interest rates over the long term. While the duration gap provides a relatively concise and simple measure of the interest rate risk inherent in our consolidated balance sheet as of the reported date, it does not incorporate projected changes in our consolidated balance sheet.
The duration gap widened slightly to negative 1.981.48 months as of August 31,November 30, 2023, from negative 1.34 months as of May 31, 2023 and was within the risk limits and guidelines established by CFC’s Asset Liability Committee as of each respective date. The slight widening of the duration gap is primarily due to an increase in line of credit loans outstanding of $239$169 million, which reduced the duration of interest-earning assets.
Limitations of Interest Rate Risk Measures
While we believe that the interest income sensitivities and duration gap measures provided are useful tools in assessing our interest rate risk exposure, there are inherent limitations in any methodology used to estimate the exposure to changes in market interest rates. These measures should be understood as estimates rather than as precise measurements. The interest rate sensitivity analyses only contemplate certain hypothetical movements in interest rates and are performed at a particular point in time based on the existing balance sheet and, in some cases, expected future business growth and funding mix assumptions. The strategic actions that management may take to manage our balance sheet may differ significantly from our projections, which could cause our actual interest income to differ substantially from the above sensitivity analysis. Moreover, as discussed above, we use various other methodologies to measure and monitor our interest rate risk under multiple interest rate scenarios, which, together, provide a comprehensive profile of our interest rate risk.
| | |
| NON-GAAP FINANCIAL MEASURES |
As discussed above in the section “Summary of Selected Financial Data,” in addition to financial measures determined in accordance with U.S. GAAP, management evaluates performance based on certain non-GAAP financial measures, which we refer to as “adjusted” financial measures. Below we provide a reconciliation of our adjusted financial measures presented in this Report to the most comparable U.S. GAAP financial measures. See “Item 7. MD&A—Non-GAAP Financial Measures” in our 2023 Form 10-K for a discussion of each of our non-GAAP financial measures and an explanation of the adjustments to derive these measures.
Net Income and Adjusted Net Income
Table 2527 provides a reconciliation of adjusted interest expense, adjusted net interest income, adjusted total revenue and adjusted net income to the comparable U.S. GAAP financial measures for the three months ended August 31, 2023 and 2022.measures. These adjusted financial measures are used in the calculation of our adjusted net interest yield and adjusted TIER.
Table 25:27: Adjusted Net Income
| | | | Three Months Ended August 31, | |
| (Dollars in thousands) | (Dollars in thousands) | | | 2023 | | 2022 | (Dollars in thousands) | | Q2 FY2024 | | Q2 FY2023 | | YTD FY2024 | | YTD FY2023 |
| Adjusted net interest income: | Adjusted net interest income: | | | | | | Adjusted net interest income: | | | | | | | | |
| Interest income | Interest income | | | $ | 380,956 | | | $ | 306,978 | | Interest income | | $ | 388,987 | | | $ | 324,194 | | | $ | 769,943 | | | $ | 631,172 | |
| Interest expense | Interest expense | | | (316,281) | | | (209,468) | | Interest expense | | (323,845) | | | (245,444) | | | (640,126) | | | (454,912) | |
Include: Derivative cash settlements interest income (expense)(1) | Include: Derivative cash settlements interest income (expense)(1) | | | 27,869 | | | (10,785) | | Include: Derivative cash settlements interest income (expense)(1) | | 28,767 | | | 4,801 | | | 56,636 | | | (5,984) | |
| Adjusted interest expense | Adjusted interest expense | | | (288,412) | | | (220,253) | | Adjusted interest expense | | (295,078) | | | (240,643) | | | (583,490) | | | (460,896) | |
| Adjusted net interest income | Adjusted net interest income | | | $ | 92,544 | | | $ | 86,725 | | Adjusted net interest income | | $ | 93,909 | | | $ | 83,551 | | | $ | 186,453 | | | $ | 170,276 | |
| | Adjusted total revenue: | Adjusted total revenue: | | | | Adjusted total revenue: | |
| Net interest income | Net interest income | | | $ | 64,675 | | | $ | 97,510 | | Net interest income | | $ | 65,142 | | | $ | 78,750 | | | $ | 129,817 | | | $ | 176,260 | |
| Fee and other income | Fee and other income | | | 4,537 | | | 4,056 | | Fee and other income | | 6,611 | | | 4,166 | | | 11,148 | | | 8,222 | |
| Total revenue | Total revenue | | | 69,212 | | | 101,566 | | Total revenue | | 71,753 | | | 82,916 | | | 140,965 | | | 184,482 | |
Include: Derivative cash settlements interest income (expense)(1) | Include: Derivative cash settlements interest income (expense)(1) | | | 27,869 | | | (10,785) | | Include: Derivative cash settlements interest income (expense)(1) | | 28,767 | | | 4,801 | | | 56,636 | | | (5,984) | |
| Adjusted total revenue | Adjusted total revenue | | | $ | 97,081 | | | $ | 90,781 | | Adjusted total revenue | | $ | 100,520 | | | $ | 87,717 | | | $ | 197,601 | | | $ | 178,498 | |
| | Adjusted net income: | Adjusted net income: | | | | Adjusted net income: | |
| Net income | Net income | | | $ | 228,284 | | | $ | 161,874 | | Net income | | $ | 148,035 | | | $ | 189,764 | | | $ | 376,319 | | | $ | 351,638 | |
Exclude: Derivative forward value gains(2) | Exclude: Derivative forward value gains(2) | | | 162,018 | | | 104,372 | | Exclude: Derivative forward value gains(2) | | 78,171 | | | 141,989 | | | 240,189 | | | 246,361 | |
| Adjusted net income | Adjusted net income | | | $ | 66,266 | | | $ | 57,502 | | Adjusted net income | | $ | 69,864 | | | $ | 47,775 | | | $ | 136,130 | | | $ | 105,277 | |
|
____________________________
(1)Represents the net periodic contractual interest expense amount on our interest-rate swaps during the reporting period.
(2)Represents the change in fair value of our interest rate swaps during the reporting period due to changes in expected future interest rates over the remaining life of our derivative contracts.
We primarily fund our loan portfolio through the issuance of debt. However, we use derivatives as economic hedges as part of our strategy to manage the interest rate risk associated with funding our loan portfolio. We therefore consider the interest expense incurred on our derivatives to be part of our funding cost in addition to the interest expense on our debt. As such, we add net periodic derivative cash settlements interest expense amounts to our reported interest expense to derive our adjusted interest expense and adjusted net interest income. We exclude unrealized derivative forward value gains and losses from our adjusted total revenue and adjusted net income.
TIER and Adjusted TIER
Table 2628 displays the calculation of our TIER and adjusted TIER for the three months ended August 31, 2023 and 2022.TIER.
Table 26:28: TIER and Adjusted TIER
| | | | Three Months Ended August 31, | |
| | | | | 2023 | | 2022 | | Q2 FY2024 | | Q2 FY2023 | | YTD FY2024 | | YTD FY2023 |
TIER (1) | TIER (1) | | | 1.72 | | | 1.77 | | TIER (1) | 1.46 | | | 1.77 | | | 1.59 | | | 1.77 | |
| Adjusted TIER (2) | Adjusted TIER (2) | | | 1.23 | | | 1.26 | | Adjusted TIER (2) | 1.24 | | | 1.20 | | | 1.23 | | | 1.23 | |
____________________________
(1) TIER is calculated based on our net income (loss) plus interest expense for the period divided by interest expense for the period.
(2) Adjusted TIER is calculated based on adjusted net income (loss) plus adjusted interest expense for the period divided by adjusted interest expense for the period.
Liabilities and Equity and Adjusted Liabilities and Equity
Table 2729 provides a reconciliation between our total liabilities and total equity and the adjusted amounts used in the calculation of our adjusted debt-to-equity ratio as of August 31,November 30, 2023 and May 31, 2023. As indicated in Table 27,29, subordinated debt is treated in the same manner as equity in calculating our adjusted-debt-to-equity ratio.
Table 27:29: Adjusted Liabilities and Equity
| | (Dollars in thousands) | (Dollars in thousands) | | August 31, 2023 | | May 31, 2023 | (Dollars in thousands) | | November 30, 2023 | | May 31, 2023 |
| Adjusted total liabilities: | Adjusted total liabilities: | | | | | Adjusted total liabilities: | | | | |
| Total liabilities | Total liabilities | | $ | 31,946,236 | | | $ | 31,422,811 | | Total liabilities | | $ | 32,614,063 | | | $ | 31,422,811 | |
| Exclude: | Exclude: | | | | | Exclude: | | | | |
| Derivative liabilities | Derivative liabilities | | 108,239 | | | 115,074 | | Derivative liabilities | | 92,890 | | | 115,074 | |
| Debt used to fund loans guaranteed by RUS | Debt used to fund loans guaranteed by RUS | | 120,553 | | | 122,873 | | Debt used to fund loans guaranteed by RUS | | 118,360 | | | 122,873 | |
| Subordinated deferrable debt | Subordinated deferrable debt | | 1,184,197 | | | 1,283,436 | | Subordinated deferrable debt | | 1,184,247 | | | 1,283,436 | |
| Subordinated certificates | Subordinated certificates | | 1,222,026 | | | 1,223,126 | | Subordinated certificates | | 1,208,819 | | | 1,223,126 | |
| Adjusted total liabilities | Adjusted total liabilities | | $ | 29,311,221 | | | $ | 28,678,302 | | Adjusted total liabilities | | $ | 30,009,747 | | | $ | 28,678,302 | |
| | Adjusted total equity: | Adjusted total equity: | | Adjusted total equity: | |
| Total equity | Total equity | | $ | 2,747,927 | | | $ | 2,589,249 | | Total equity | | $ | 2,896,140 | | | $ | 2,589,249 | |
| Exclude: | Exclude: | | Exclude: | |
Prior fiscal year-end cumulative derivative forward value gains(1) | Prior fiscal year-end cumulative derivative forward value gains(1) | | 343,098 | | | 90,831 | | Prior fiscal year-end cumulative derivative forward value gains(1) | | 343,098 | | | 90,831 | |
Year-to-date derivative forward value gains(1) | Year-to-date derivative forward value gains(1) | | 162,018 | | | 252,267 | | Year-to-date derivative forward value gains(1) | | 240,189 | | | 252,267 | |
Period-end cumulative derivative forward value gains(1) | Period-end cumulative derivative forward value gains(1) | | 505,116 | | | 343,098 | | Period-end cumulative derivative forward value gains(1) | | 583,287 | | | 343,098 | |
AOCI attributable to derivatives(2) | AOCI attributable to derivatives(2) | | 923 | | | 1,001 | | AOCI attributable to derivatives(2) | | 844 | | | 1,001 | |
| Subtotal | Subtotal | | 506,039 | | | 344,099 | | Subtotal | | 584,131 | | | 344,099 | |
| Include: | Include: | | | | | Include: | | | | |
| Subordinated deferrable debt | Subordinated deferrable debt | | 1,184,197 | | | 1,283,436 | | Subordinated deferrable debt | | 1,184,247 | | | 1,283,436 | |
| Subordinated certificates | Subordinated certificates | | 1,222,026 | | | 1,223,126 | | Subordinated certificates | | 1,208,819 | | | 1,223,126 | |
| Subtotal | Subtotal | | 2,406,223 | | | 2,506,562 | | Subtotal | | 2,393,066 | | | 2,506,562 | |
| Adjusted total equity | Adjusted total equity | | $ | 4,648,111 | | | $ | 4,751,712 | | Adjusted total equity | | $ | 4,705,075 | | | $ | 4,751,712 | |
|
____________________________
(1) Represents consolidated total derivative forward value gains.
(2) Represents the AOCI amount related to derivatives. See “Note 10—Equity” for the additional components of AOCI.
Debt-to-Equity and Adjusted Debt-to-Equity Ratios
Table 2830 displays the calculations of our debt-to-equity and adjusted debt-to-equity ratios as of August 31,November 30, 2023 and May 31, 2023.
Table 28:30: Debt-to-Equity Ratio and Adjusted Debt-to-Equity Ratio
| | (Dollars in thousands) | (Dollars in thousands) | | August 31, 2023 | | May 31, 2023 | (Dollars in thousands) | | November 30, 2023 | | May 31, 2023 |
| Debt-to equity ratio: | Debt-to equity ratio: | | | | | Debt-to equity ratio: | | | | |
| Total liabilities | Total liabilities | | $ | 31,946,236 | | | $ | 31,422,811 | | Total liabilities | | $ | 32,614,063 | | | $ | 31,422,811 | |
| Total equity | Total equity | | 2,747,927 | | | 2,589,249 | | Total equity | | 2,896,140 | | | 2,589,249 | |
Debt-to-equity ratio (1) | Debt-to-equity ratio (1) | | 11.63 | | | 12.14 | | Debt-to-equity ratio (1) | | 11.26 | | | 12.14 | |
| | Adjusted debt-to-equity ratio: | Adjusted debt-to-equity ratio: | | Adjusted debt-to-equity ratio: | |
Adjusted total liabilities(2) | Adjusted total liabilities(2) | | $ | 29,311,221 | | | $ | 28,678,302 | | Adjusted total liabilities(2) | | $ | 30,009,747 | | | $ | 28,678,302 | |
Adjusted total equity(2) | Adjusted total equity(2) | | 4,648,111 | | | 4,751,712 | | Adjusted total equity(2) | | 4,705,075 | | | 4,751,712 | |
Adjusted debt-to-equity ratio(3) | Adjusted debt-to-equity ratio(3) | | 6.31 | | | 6.04 | | Adjusted debt-to-equity ratio(3) | | 6.38 | | | 6.04 | |
____________________________
(1) Calculated based on total liabilities at period end divided by total equity at period end.
(2) See Table 2729 above for details on the calculation of these non-GAAP financial measures and the reconciliation to the most comparable U.S. GAAP financial measures.
(3) Calculated based on adjusted total liabilities at period end divided by adjusted total equity at period end.
Total CFC Equity and Members’ Equity
Members’ equity excludes the noncash impact of derivative forward value gains (losses) and foreign currency adjustments recorded in net income and amounts recorded in accumulated other comprehensive income. Because these amounts generally have not been realized, they are not available to members and are excluded by the CFC Board of Directors in determining the annual allocation of adjusted net income to patronage capital, to the members’ capital reserve and to other member funds. Table 2931 provides a reconciliation of members’ equity to total CFC equity as of August 31,November 30, 2023 and May 31, 2023. We present the components of accumulated other comprehensive income in “Note 10—Equity.”
Table 29:31: Members’ Equity
| | (Dollars in thousands) | (Dollars in thousands) | | August 31, 2023 | | May 31, 2023 | (Dollars in thousands) | | November 30, 2023 | | May 31, 2023 |
| Members’ equity: | Members’ equity: | | | | | Members’ equity: | | | | |
| Total CFC equity | Total CFC equity | | $ | 2,717,385 | | | $ | 2,562,059 | | Total CFC equity | | $ | 2,866,006 | | | $ | 2,562,059 | |
| Exclude: | Exclude: | | Exclude: | |
| Accumulated other comprehensive income | Accumulated other comprehensive income | | 8,241 | | | 8,343 | | Accumulated other comprehensive income | | 8,618 | | | 8,343 | |
Period-end cumulative derivative forward value gains attributable to CFC(1) | Period-end cumulative derivative forward value gains attributable to CFC(1) | | 503,878 | | | 342,624 | | Period-end cumulative derivative forward value gains attributable to CFC(1) | | 581,931 | | | 342,624 | |
| Subtotal | Subtotal | | 512,119 | | | 350,967 | | Subtotal | | 590,549 | | | 350,967 | |
| Members’ equity | Members’ equity | | $ | 2,205,266 | | | $ | 2,211,092 | | Members’ equity | | $ | 2,275,457 | | | $ | 2,211,092 | |
____________________________
(1)Represents period-end cumulative derivative forward value gains for CFC only, as total CFC equity does not include the noncontrolling interests of the variable interest entities NCSC and RTFC, which we are required to consolidate. We report the separate results of operations for CFC in “Note 14—Business Segments.” The period-end cumulative derivative forward value total gain amounts as of August 31,November 30, 2023 and May 31, 2023 are presented above in Table 27.29.
Item 1. Financial Statements
NATIONAL RURAL UTILITIES COOPERATIVE FINANCE CORPORATION
CONSOLIDATED STATEMENTS OF OPERATIONS
(UNAUDITED)
| | | | | Three Months Ended August 31, | | | | | | | | | | | | | | | | | | | | | | |
| (Dollars in thousands) | (Dollars in thousands) | | 2023 | | 2022 | (Dollars in thousands) | | Q2 FY2024 | | Q2 FY2023 | | YTD FY2024 | | YTD FY2023 |
| Interest income | Interest income | | $ | 380,956 | | | $ | 306,978 | | Interest income | | $ | 388,987 | | | $ | 324,194 | | | $ | 769,943 | | | $ | 631,172 | |
| Interest expense | Interest expense | | (316,281) | | | (209,468) | | Interest expense | | (323,845) | | | (245,444) | | | (640,126) | | | (454,912) | |
| Net interest income | Net interest income | | 64,675 | | | 97,510 | | Net interest income | | 65,142 | | | 78,750 | | | 129,817 | | | 176,260 | |
| Provision for credit losses | Provision for credit losses | | (800) | | | (3,496) | | Provision for credit losses | | (628) | | | (11,628) | | | (1,428) | | | (15,124) | |
| Net interest income after provision for credit losses | Net interest income after provision for credit losses | | 63,875 | | | 94,014 | | Net interest income after provision for credit losses | | 64,514 | | | 67,122 | | | 128,389 | | | 161,136 | |
| Non-interest income: | Non-interest income: | | | | | Non-interest income: | | | | | | | | |
| Fee and other income | Fee and other income | | 4,537 | | | 4,056 | | Fee and other income | | 6,611 | | | 4,166 | | | 11,148 | | | 8,222 | |
| Derivative gains | Derivative gains | | 189,887 | | | 93,587 | | Derivative gains | | 106,938 | | | 146,790 | | | 296,825 | | | 240,377 | |
| Investment securities gains (losses) | Investment securities gains (losses) | | 2,933 | | | (3,679) | | Investment securities gains (losses) | | 1,843 | | | (493) | | | 4,776 | | | (4,172) | |
| Total non-interest income | Total non-interest income | | 197,357 | | | 93,964 | | Total non-interest income | | 115,392 | | | 150,463 | | | 312,749 | | | 244,427 | |
| Non-interest expense: | Non-interest expense: | | | | | Non-interest expense: | | | | | | | | |
| Salaries and employee benefits | Salaries and employee benefits | | (15,874) | | | (13,778) | | Salaries and employee benefits | | (16,546) | | | (14,206) | | | (32,420) | | | (27,984) | |
| Other general and administrative expenses | Other general and administrative expenses | | (15,629) | | | (11,741) | | Other general and administrative expenses | | (14,966) | | | (13,041) | | | (30,595) | | | (24,782) | |
| Losses on early extinguishment of debt | Losses on early extinguishment of debt | | (939) | | | — | | Losses on early extinguishment of debt | | (26) | | | — | | | (965) | | | — | |
| Other non-interest expense | Other non-interest expense | | (178) | | | (322) | | Other non-interest expense | | (250) | | | (355) | | | (428) | | | (677) | |
| Total non-interest expense | Total non-interest expense | | (32,620) | | | (25,841) | | Total non-interest expense | | (31,788) | | | (27,602) | | | (64,408) | | | (53,443) | |
| Income before income taxes | Income before income taxes | | 228,612 | | | 162,137 | | Income before income taxes | | 148,118 | | | 189,983 | | | 376,730 | | | 352,120 | |
| Income tax provision | Income tax provision | | (328) | | | (263) | | Income tax provision | | (83) | | | (219) | | | (411) | | | (482) | |
| Net income | Net income | | 228,284 | | | 161,874 | | Net income | | 148,035 | | | 189,764 | | | 376,319 | | | 351,638 | |
| Less: Net income attributable to noncontrolling interests | | (427) | | | (193) | | |
| Less: Net loss (income) attributable to noncontrolling interests | | Less: Net loss (income) attributable to noncontrolling interests | | 408 | | | (27) | | | (19) | | | (220) | |
| Net income attributable to CFC | Net income attributable to CFC | | $ | 227,857 | | | $ | 161,681 | | Net income attributable to CFC | | $ | 148,443 | | | $ | 189,737 | | | $ | 376,300 | | | $ | 351,418 | |
The accompanying Notes to Consolidated Financial Statements (Unaudited) are an integral part of these statements.
48
NATIONAL RURAL UTILITIES COOPERATIVE FINANCE CORPORATION
CONSOLIDATED STATEMENTS OF COMPREHENSIVE INCOME (LOSS)
(UNAUDITED)
| | | | | | | | | | | | | | | | | | |
| | | | | Three Months Ended August 31, |
| (Dollars in thousands) | | | | | | 2023 | | 2022 |
| Net income | | | | | | $ | 228,284 | | | $ | 161,874 | |
| Other comprehensive income (loss): | | | | | | | | |
| | | | | | | | |
| | | | | | | | |
| Reclassification to earnings of realized gains on derivatives | | | | | | (155) | | | (189) | |
| Defined benefit plan adjustments | | | | | | 53 | | | 100 | |
| Other comprehensive loss | | | | | | (102) | | | (89) | |
| Total comprehensive income | | | | | | 228,182 | | | 161,785 | |
| Less: Total comprehensive income attributable to noncontrolling interests | | | | | | (427) | | | (193) | |
| Total comprehensive income attributable to CFC | | | | | | $ | 227,755 | | | $ | 161,592 | |
The accompanying Notes to Consolidated Financial Statements (Unaudited) are an integral part of these statements.
49
NATIONAL RURAL UTILITIES COOPERATIVE FINANCE CORPORATION
CONSOLIDATED BALANCE SHEETS
(UNAUDITED)
| | | | | | | | | | | | | | |
| (Dollars in thousands) | | August 31, 2023 | | May 31, 2023 |
| Assets: | | | | |
| Cash and cash equivalents | | $ | 199,552 | | | $ | 198,936 | |
| Restricted cash | | 9,290 | | | 8,301 | |
| Total cash, cash equivalents and restricted cash | | 208,842 | | | 207,237 | |
| Investment securities: | | | | |
| Debt securities trading, at fair value | | 425,331 | | | 474,875 | |
| Equity securities, at fair value | | 36,780 | | | 35,494 | |
| Total investment securities, at fair value | | 462,111 | | | 510,369 | |
| Loans to members | | 33,096,646 | | | 32,532,086 | |
| Less: Allowance for credit losses | | (54,926) | | | (53,094) | |
| Loans to members, net | | 33,041,720 | | | 32,478,992 | |
| Accrued interest receivable | | 177,351 | | | 172,723 | |
| Other receivables | | 30,613 | | | 31,243 | |
| Fixed assets, net of accumulated depreciation of $78,626 and $77,508 as of August 31, 2023 and May 31, 2023, respectively | | 85,521 | | | 86,011 | |
| | | | |
| Derivative assets | | 615,866 | | | 460,762 | |
| Other assets | | 72,139 | | | 64,723 | |
| Total assets | | $ | 34,694,163 | | | $ | 34,012,060 | |
| | | | |
| Liabilities: | | | | |
| Accrued interest payable | | $ | 274,554 | | | $ | 212,340 | |
| Debt outstanding: | | | | |
| Short-term borrowings | | 5,124,335 | | | 4,546,275 | |
| Long-term debt | | 23,874,274 | | | 23,946,548 | |
| Subordinated deferrable debt | | 1,184,197 | | | 1,283,436 | |
| Members’ subordinated certificates: | | | | |
| Membership subordinated certificates | | 628,614 | | | 628,614 | |
| Loan and guarantee subordinated certificates | | 347,249 | | | 348,349 | |
| Member capital securities | | 246,163 | | | 246,163 | |
| Total members’ subordinated certificates | | 1,222,026 | | | 1,223,126 | |
| Total debt outstanding | | 31,404,832 | | | 30,999,385 | |
| Patronage capital retirement payable | | 69,053 | | | — | |
| Deferred income | | 37,099 | | | 38,601 | |
| Derivative liabilities | | 108,239 | | | 115,074 | |
| Other liabilities | | 52,459 | | | 57,411 | |
| Total liabilities | | 31,946,236 | | | 31,422,811 | |
| | | | |
| Equity: | | | | |
| CFC equity: | | | | |
| Retained equity | | 2,709,144 | | | 2,553,716 | |
| Accumulated other comprehensive income | | 8,241 | | | 8,343 | |
| Total CFC equity | | 2,717,385 | | | 2,562,059 | |
| Noncontrolling interests | | 30,542 | | | 27,190 | |
| Total equity | | 2,747,927 | | | 2,589,249 | |
| Total liabilities and equity | | $ | 34,694,163 | | | $ | 34,012,060 | |
| | | | |
The accompanying Notes to Consolidated Financial Statements (Unaudited) are an integral part of these statements.
50
NATIONAL RURAL UTILITIES COOPERATIVE FINANCE CORPORATION
CONSOLIDATED STATEMENTS OF CHANGES IN EQUITY
(UNAUDITED)
| | | | | | | | | | | | | | | | | | | | | | | | | | | | | | | | | | | | | | | | | | | | | | | | | | | | | | | | |
| | Three Months Ended August 31, 2023 |
| (Dollars in thousands) | | Membership
Fees and
Educational
Fund | | Patronage
Capital
Allocated | | Members’
Capital
Reserve | | Unallocated
Net
Income | | CFC
Retained
Equity | | Accumulated Other Comprehensive Income (Loss) | | Total
CFC
Equity | | Non-controlling
Interests | | Total
Equity |
| | | | | | | | | | | | | | | | | | |
| | | | | | | | | | | | | | | | | | |
| | | | | | | | | | | | | | | | | | |
| | | | | | | | | | | | | | | | | | |
| | | | | | | | | | | | | | | | | | |
| | | | | | | | | | | | | | | | | | |
| | | | | | | | | | | | | | | | | | |
| | | | | | | | | | | | | | | | | | |
| | | | | | | | | | | | | | | | | | |
| | |
| | | | | | | | | | | | | | | | | | |
| Balance as of May 31, 2023 | | $ | 3,534 | | | $ | 1,006,115 | | | $ | 1,202,152 | | | $ | 341,915 | | | $ | 2,553,716 | | | $ | 8,343 | | | $ | 2,562,059 | | | $ | 27,190 | | | $ | 2,589,249 | |
| | | | | | | | | | | | | | | | | | |
| | | | | | | | | | | | | | | | | | |
| Net income | | — | | | — | | | — | | | 227,857 | | | 227,857 | | | — | | | 227,857 | | | 427 | | | 228,284 | |
| Other comprehensive loss | | — | | | — | | | — | | | — | | | — | | | (102) | | | (102) | | | — | | | (102) | |
| Patronage capital retirement | | — | | | (71,980) | | | — | | | — | | | (71,980) | | | — | | | (71,980) | | | — | | | (71,980) | |
| Other | | (449) | | | — | | | — | | | — | | | (449) | | | — | | | (449) | | | 2,925 | | | 2,476 | |
| Balance as of August 31, 2023 | | $ | 3,085 | | | $ | 934,135 | | | $ | 1,202,152 | | | $ | 569,772 | | | $ | 2,709,144 | | | $ | 8,241 | | | $ | 2,717,385 | | | $ | 30,542 | | | $ | 2,747,927 | |
| | | | | | | | | | | | | | | | | | |
| | | | | | | | | | | | | | | | | | |
| | | | | | | | | | | | | | | | | | |
| | Three Months Ended August 31, 2022 |
| (Dollars in thousands) | | Membership
Fees and
Educational
Fund | | Patronage
Capital
Allocated | | Members’
Capital
Reserve | | Unallocated
Net
Income
(Loss) | | CFC
Retained
Equity | | Accumulated
Other
Comprehensive
Income (Loss) | | Total
CFC
Equity | | Non-controlling
Interests | | Total
Equity |
| | | | | | | | | | | | | | | | | | |
| | | | | | | | | | | | | | | | | | |
| | | | | | | | | | | | | | | | | | |
| | | | | | | | | | | | | | | | | | |
| | | | | | | | | | | | | | | | | | |
| | | | | | | | | | | | | | | | | | |
| | | | | | | | | | | | | | | | | | |
| | |
| | | | | | | | | | | | | | | | | | |
| Balance as of May 31, 2022 | | $ | 3,387 | | | $ | 954,988 | | | $ | 1,062,286 | | | $ | 91,654 | | | $ | 2,112,315 | | | $ | 2,258 | | | $ | 2,114,573 | | | $ | 27,396 | | | $ | 2,141,969 | |
| | | | | | | | | | | | | | | | | | |
| | | | | | | | | | | | | | | | | | |
| Net income | | — | | | — | | | — | | | 161,681 | | | 161,681 | | | — | | | 161,681 | | | 193 | | | 161,874 | |
| Other comprehensive loss | | — | | | — | | | — | | | — | | | — | | | (89) | | | (89) | | | — | | | (89) | |
| Patronage capital retirement | | — | | | (58,892) | | | — | | | — | | | (58,892) | | | — | | | (58,892) | | | — | | | (58,892) | |
| Other | | (335) | | | — | | | — | | | — | | | (335) | | | — | | | (335) | | | 2,408 | | | 2,073 | |
| Balance as of August 31, 2022 | | $ | 3,052 | | | $ | 896,096 | | | $ | 1,062,286 | | | $ | 253,335 | | | $ | 2,214,769 | | | $ | 2,169 | | | $ | 2,216,938 | | | $ | 29,997 | | | $ | 2,246,935 | |
The accompanying Notes to Consolidated Financial Statements (Unaudited) are an integral part of these statements.
51
NATIONAL RURAL UTILITIES COOPERATIVE FINANCE CORPORATION
CONSOLIDATED STATEMENTS OF CASH FLOWSCOMPREHENSIVE INCOME (LOSS)
(UNAUDITED)
(UNAUDITED)
| | | | | | | | | | | | | | |
| | | Three Months Ended August 31, |
| (Dollars in thousands) | | 2023 | | 2022 |
| Cash flows from operating activities: | | | | |
| Net income | | $ | 228,284 | | | $ | 161,874 | |
| Adjustments to reconcile net income to net cash provided by operating activities: | | | | |
| Amortization of deferred loan fees | | (1,698) | | | (1,974) | |
| Amortization of debt issuance costs and discounts | | 7,177 | | | 7,123 | |
| Amortization of guarantee fee | | 5,121 | | | 4,653 | |
| Depreciation and amortization | | 2,720 | | | 1,311 | |
| Provision for credit losses | | 800 | | | 3,496 | |
| Loss on early extinguishment of debt | | 939 | | | — | |
| | | | |
| | | | |
| Unrealized (gains) losses on equity and debt securities | | (4,038) | | | 2,446 | |
| Derivative forward value gains | | (162,018) | | | (104,372) | |
| Advances on loans held for sale | | (39,000) | | | (69,000) | |
| Proceeds from sales of loans held for sale | | 39,000 | | | 112,800 | |
| Changes in operating assets and liabilities: | | | | |
| Accrued interest receivable | | (4,628) | | | (20,338) | |
| | | | |
| Accrued interest payable | | 62,214 | | | 66,972 | |
| Deferred income | | 196 | | | 740 | |
| Other | | (18,855) | | | (20,216) | |
| Net cash provided by operating activities | | 116,214 | | | 145,515 | |
| | | | |
| Cash flows from investing activities: | | | | |
| Advances on loans held for investment, net | | (563,112) | | | (667,442) | |
| Investments in fixed assets, net | | (1,085) | | | (4,532) | |
| | | | |
| | | | |
| | | | |
| | | | |
| | | | |
| | | | |
| | | | |
| | | | |
| Purchase of trading securities | | — | | | (48,276) | |
| Proceeds from sales and maturities of trading securities | | 51,191 | | | 46,170 | |
| | | | |
| | | | |
| | | | |
| | | | |
| Net cash used in investing activities | | (513,006) | | | (674,080) | |
| | | | |
| Cash flows from financing activities: | | | | |
| Proceeds from short-term borrowings ≤ 90 days, net | | 182,251 | | | 310,868 | |
| Proceeds from short-term borrowings with original maturity > 90 days | | 1,150,142 | | | 654,762 | |
| Repayments of short-term borrowings with original maturity > 90 days | | (754,333) | | | (675,971) | |
| | | | |
| Proceeds from issuance of long-term debt, net of discount and issuance costs | | 432,366 | | | 724,300 | |
| Payments for retirement of long-term debt | | (510,743) | | | (408,323) | |
| | | | |
| Payments for issuance costs for subordinated deferrable debt | | (185) | | | — | |
| Payments for retirement of subordinated deferrable debt | | (100,000) | | | — | |
| Proceeds from issuance of members’ subordinated certificates | | — | | | 3,330 | |
| Payments for retirement of members’ subordinated certificates | | (1,100) | | | (963) | |
| | | | |
| Repayments for membership fees, net | | (1) | | | — | |
| Net cash provided by financing activities | | 398,397 | | | 608,003 | |
| Net increase in cash, cash equivalents and restricted cash | | 1,605 | | | 79,438 | |
| Beginning cash, cash equivalents and restricted cash | | 207,237 | | | 161,114 | |
| Ending cash, cash equivalents and restricted cash | | $ | 208,842 | | | $ | 240,552 | |
| | | | |
| Supplemental disclosure of cash flow information: | | | | |
| Cash paid for interest | | $ | 248,345 | | | $ | 139,482 | |
| Cash paid for income taxes | | 260 | | | 2 | |
| | | | |
| | | | |
| | | | |
|
| | | | | | | | | | | | | | | | | | | | | | | | | | |
| (Dollars in thousands) | | Q2 FY2024 | | Q2 FY2023 | | YTD FY2024 | | YTD FY2023 |
| Net income | | $ | 148,035 | | | $ | 189,764 | | | $ | 376,319 | | | $ | 351,638 | |
| Other comprehensive income (loss): | | | | | | | | |
| | | | | | | | |
| Changes in unrealized gains on derivative cash flow hedges | | 483 | | | — | | | 483 | | | — | |
| Reclassification to earnings of realized gains on derivatives | | (159) | | | (189) | | | (314) | | | (378) | |
| Defined benefit plan adjustments | | 53 | | | 100 | | | 106 | | | 200 | |
| Other comprehensive income (loss) | | 377 | | | (89) | | | 275 | | | (178) | |
| Total comprehensive income | | 148,412 | | | 189,675 | | | 376,594 | | | 351,460 | |
| Less: Total comprehensive loss (income) attributable to noncontrolling interests | | 408 | | | (27) | | | (19) | | | (220) | |
| Total comprehensive income attributable to CFC | | $ | 148,820 | | | $ | 189,648 | | | $ | 376,575 | | | $ | 351,240 | |
The accompanying Notes to Consolidated Financial Statements (Unaudited) are an integral part of these statements.
52
NATIONAL RURAL UTILITIES COOPERATIVE FINANCE CORPORATION
CONSOLIDATED BALANCE SHEETS
(UNAUDITED)
| | | | | | | | | | | | | | |
| (Dollars in thousands) | | November 30, 2023 | | May 31, 2023 |
| Assets: | | | | |
| Cash and cash equivalents | | $ | 128,794 | | | $ | 198,936 | |
| Restricted cash | | 11,078 | | | 8,301 | |
| Total cash, cash equivalents and restricted cash | | 139,872 | | | 207,237 | |
| Time deposits | | 400,000 | | | — | |
| Investment securities: | | | | |
| Debt securities trading, at fair value | | 381,110 | | | 474,875 | |
| Equity securities, at fair value | | 35,758 | | | 35,494 | |
| Total investment securities, at fair value | | 416,868 | | | 510,369 | |
| Loans to members | | 33,553,589 | | | 32,532,086 | |
| Less: Allowance for credit losses | | (55,554) | | | (53,094) | |
| Loans to members, net | | 33,498,035 | | | 32,478,992 | |
| Accrued interest receivable | | 188,491 | | | 172,723 | |
| Other receivables | | 29,813 | | | 31,243 | |
| Fixed assets, net of accumulated depreciation of $80,301 and $77,508 as of November 30, 2023 and May 31, 2023, respectively | | 85,187 | | | 86,011 | |
| | | | |
| Derivative assets | | 678,609 | | | 460,762 | |
| Other assets | | 73,328 | | | 64,723 | |
| Total assets | | $ | 35,510,203 | | | $ | 34,012,060 | |
| | | | |
| Liabilities: | | | | |
| Accrued interest payable | | $ | 236,441 | | | $ | 212,340 | |
| Debt outstanding: | | | | |
| Short-term borrowings | | 5,161,583 | | | 4,546,275 | |
| Long-term debt | | 24,640,201 | | | 23,946,548 | |
| Subordinated deferrable debt | | 1,184,247 | | | 1,283,436 | |
| Members’ subordinated certificates: | | | | |
| Membership subordinated certificates | | 628,619 | | | 628,614 | |
| Loan and guarantee subordinated certificates | | 334,037 | | | 348,349 | |
| Member capital securities | | 246,163 | | | 246,163 | |
| Total members’ subordinated certificates | | 1,208,819 | | | 1,223,126 | |
| Total debt outstanding | | 32,194,850 | | | 30,999,385 | |
| | | | |
| Deferred income | | 35,450 | | | 38,601 | |
| Derivative liabilities | | 92,890 | | | 115,074 | |
| Other liabilities | | 54,432 | | | 57,411 | |
| Total liabilities | | 32,614,063 | | | 31,422,811 | |
| | | | |
| Equity: | | | | |
| CFC equity: | | | | |
| Retained equity | | 2,857,388 | | | 2,553,716 | |
| Accumulated other comprehensive income | | 8,618 | | | 8,343 | |
| Total CFC equity | | 2,866,006 | | | 2,562,059 | |
| Noncontrolling interests | | 30,134 | | | 27,190 | |
| Total equity | | 2,896,140 | | | 2,589,249 | |
| Total liabilities and equity | | $ | 35,510,203 | | | $ | 34,012,060 | |
| | | | |
The accompanying Notes to Consolidated Financial Statements (Unaudited) are an integral part of these statements.
53
NATIONAL RURAL UTILITIES COOPERATIVE FINANCE CORPORATION
CONSOLIDATED STATEMENTS OF CHANGES IN EQUITY
(UNAUDITED)
| | | | | | | | | | | | | | | | | | | | | | | | | | | | | | | | | | | | | | | | | | | | | | | | | | | | | | | | |
| | Q2 FY2024 |
| (Dollars in thousands) | | Membership
Fees and
Educational
Fund | | Patronage
Capital
Allocated | | Members’
Capital
Reserve | | Unallocated
Net
Income | | CFC
Retained
Equity | | Accumulated Other Comprehensive Income | | Total
CFC
Equity | | Non-controlling
Interests | | Total
Equity |
| | | | | | | | | | | | | | | | | | |
| | | | | | | | | | | | | | | | | | |
| Balance as of August 31, 2023 | | $ | 3,085 | | | $ | 934,135 | | | $ | 1,202,152 | | | $ | 569,772 | | | $ | 2,709,144 | | | $ | 8,241 | | | $ | 2,717,385 | | | $ | 30,542 | | | $ | 2,747,927 | |
| Net income (loss) | | — | | | — | | | — | | | 148,443 | | | 148,443 | | | — | | | 148,443 | | | (408) | | | 148,035 | |
| Other comprehensive income | | — | | | — | | | — | | | — | | | — | | | 377 | | | 377 | | | — | | | 377 | |
| | | | | | | | | | | | | | | | | | |
| Other | | (199) | | | — | | | — | | | — | | | (199) | | | — | | | (199) | | | — | | | (199) | |
| Balance as of November 30, 2023 | | $ | 2,886 | | | $ | 934,135 | | | $ | 1,202,152 | | | $ | 718,215 | | | $ | 2,857,388 | | | $ | 8,618 | | | $ | 2,866,006 | | | $ | 30,134 | | | $ | 2,896,140 | |
| | | | | | | | | | | | | | | | | | |
| | YTD FY2024 |
| | | | | | | | | | | | | | | | | | |
| Balance as of May 31, 2023 | | $ | 3,534 | | | $ | 1,006,115 | | | $ | 1,202,152 | | | $ | 341,915 | | | $ | 2,553,716 | | | $ | 8,343 | | | $ | 2,562,059 | | | $ | 27,190 | | | $ | 2,589,249 | |
| | | | | | | | | | | | | | | | | | |
| | | | | | | | | | | | | | | | | | |
| Net income | | — | | | — | | | — | | | 376,300 | | | 376,300 | | | — | | | 376,300 | | | 19 | | | 376,319 | |
| Other comprehensive income | | — | | | — | | | — | | | — | | | — | | | 275 | | | 275 | | | — | | | 275 | |
| Patronage capital retirement | | — | | | (71,980) | | | — | | | — | | | (71,980) | | | — | | | (71,980) | | | — | | | (71,980) | |
| Other | | (648) | | | — | | | — | | | — | | | (648) | | | — | | | (648) | | | 2,925 | | | 2,277 | |
| Balance as of November 30, 2023 | | $ | 2,886 | | | $ | 934,135 | | | $ | 1,202,152 | | | $ | 718,215 | | | $ | 2,857,388 | | | $ | 8,618 | | | $ | 2,866,006 | | | $ | 30,134 | | | $ | 2,896,140 | |
| | | | | | | | | | | | | | | | | | |
| | | | | | | | | | | | | | | | | | |
| | | | | | | | | | | | | | | | | | |
| | Q2 FY2023 |
| (Dollars in thousands) | | Membership
Fees and
Educational
Fund | | Patronage
Capital
Allocated | | Members’
Capital
Reserve | | Unallocated
Net
Income
(Loss) | | CFC
Retained
Equity | | Accumulated
Other
Comprehensive
Income (Loss) | | Total
CFC
Equity | | Non-controlling
Interests | | Total
Equity |
| Balance as of August 31, 2022 | | $ | 3,052 | | | $ | 896,096 | | | $ | 1,062,286 | | | $ | 253,335 | | | $ | 2,214,769 | | | $ | 2,169 | | | $ | 2,216,938 | | | $ | 29,997 | | | $ | 2,246,935 | |
| Net income | | — | | | — | | | — | | | 189,737 | | | 189,737 | | | — | | | 189,737 | | | 27 | | | 189,764 | |
| Other comprehensive loss | | — | | | — | | | — | | | — | | | — | | | (89) | | | (89) | | | — | | | (89) | |
| Patronage capital retirement | | — | | | — | | | — | | | — | | | — | | | — | | | — | | | (2,704) | | | (2,704) | |
| Other | | (193) | | | — | | | — | | | — | | | (193) | | | — | | | (193) | | | (1) | | | (194) | |
| Balance as of November 30, 2022 | | $ | 2,859 | | | $ | 896,096 | | | $ | 1,062,286 | | | $ | 443,072 | | | $ | 2,404,313 | | | $ | 2,080 | | | $ | 2,406,393 | | | $ | 27,319 | | | $ | 2,433,712 | |
| | | | | | | | | | | | | | | | | | |
| | YTD FY2023 |
| | | | | | | | | | | | | | | | | | |
| Balance as of May 31, 2022 | | $ | 3,387 | | | $ | 954,988 | | | $ | 1,062,286 | | | $ | 91,654 | | | $ | 2,112,315 | | | $ | 2,258 | | | $ | 2,114,573 | | | $ | 27,396 | | | $ | 2,141,969 | |
| | | | | | | | | | | | | | | | | | |
| | | | | | | | | | | | | | | | | | |
| Net income | | — | | | — | | | — | | | 351,418 | | | 351,418 | | | — | | | 351,418 | | | 220 | | | 351,638 | |
| Other comprehensive loss | | — | | | — | | | — | | | — | | | — | | | (178) | | | (178) | | | — | | | (178) | |
| Patronage capital retirement | | — | | | (58,892) | | | — | | | — | | | (58,892) | | | — | | | (58,892) | | | (2,704) | | | (61,596) | |
| Other | | (528) | | | — | | | — | | | — | | | (528) | | | — | | | (528) | | | 2,407 | | | 1,879 | |
| Balance as of November 30, 2022 | | $ | 2,859 | | | $ | 896,096 | | | $ | 1,062,286 | | | $ | 443,072 | | | $ | 2,404,313 | | | $ | 2,080 | | | $ | 2,406,393 | | | $ | 27,319 | | | $ | 2,433,712 | |
The accompanying Notes to Consolidated Financial Statements (Unaudited) are an integral part of these statements.
54
NATIONAL RURAL UTILITIES COOPERATIVE FINANCE CORPORATION
CONSOLIDATED STATEMENTS OF CASH FLOWS (UNAUDITED) | | | | | | | | | | | | | | |
| (Dollars in thousands) | | YTD FY2024 | | YTD FY2023 |
| Cash flows from operating activities: | | | | |
| Net income | | $ | 376,319 | | | $ | 351,638 | |
| Adjustments to reconcile net income to net cash provided by operating activities: | | | | |
| Amortization of deferred loan fees | | (3,313) | | | (3,882) | |
| Amortization of debt issuance costs and discounts | | 14,441 | | | 14,364 | |
| Amortization of guarantee fee | | 10,293 | | | 9,377 | |
| Depreciation and amortization | | 5,339 | | | 2,546 | |
| Provision for credit losses | | 1,428 | | | 15,124 | |
| Loss on early extinguishment of debt | | 965 | | | — | |
| | | | |
| | | | |
| Unrealized (gains) losses on equity and debt securities | | (7,763) | | | 1,828 | |
| Derivative forward value gains | | (240,189) | | | (246,361) | |
| Advances on loans held for sale | | (103,000) | | | (112,142) | |
| Proceeds from sales of loans held for sale | | 103,000 | | | 155,942 | |
| Changes in operating assets and liabilities: | | | | |
| Accrued interest receivable | | (15,768) | | | (35,493) | |
| | | | |
| Accrued interest payable | | 24,101 | | | 37,218 | |
| Deferred income | | 162 | | | 697 | |
| Other | | (19,730) | | | (14,461) | |
| Net cash provided by operating activities | | 146,285 | | | 176,395 | |
| | | | |
| Cash flows from investing activities: | | | | |
| Advances on loans held for investment, net | | (1,019,856) | | | (1,572,339) | |
| Investments in fixed assets, net | | (2,683) | | | (10,232) | |
| | | | |
| | | | |
| | | | |
| | | | |
| Investments in time deposits | | (400,000) | | | — | |
| | | | |
| | | | |
| | | | |
| Purchase of trading securities | | — | | | (107,734) | |
| Proceeds from sales and maturities of trading securities | | 98,276 | | | 95,738 | |
| | | | |
| | | | |
| | | | |
| | | | |
| Net cash used in investing activities | | (1,324,263) | | | (1,594,567) | |
| | | | |
| Cash flows from financing activities: | | | | |
| Proceeds from short-term borrowings ≤ 90 days, net | | 142,262 | | | 612,734 | |
| Proceeds from short-term borrowings with original maturity > 90 days | | 1,907,790 | | | 1,505,587 | |
| Repayments of short-term borrowings with original maturity > 90 days | | (1,434,744) | | | (1,505,276) | |
| Payments for issuance costs for revolving bank lines of credit | | (2,520) | | | (2,008) | |
| Proceeds from issuance of long-term debt, net of discount and issuance costs | | 1,746,718 | | | 2,011,627 | |
| Payments for retirement of long-term debt | | (1,065,348) | | | (1,031,862) | |
| | | | |
| Payments for issuance costs for subordinated deferrable debt | | (185) | | | — | |
| Payments for retirement of subordinated deferrable debt | | (100,000) | | | — | |
| Proceeds from issuance of members’ subordinated certificates | | 98 | | | 6,127 | |
| Payments for retirement of members’ subordinated certificates | | (14,405) | | | (1,736) | |
| Payments for retirement of patronage capital | | (69,053) | | | (56,485) | |
| Repayments for membership fees, net | | — | | | (2) | |
| Net cash provided by financing activities | | 1,110,613 | | | 1,538,706 | |
| Net increase (decrease) in cash, cash equivalents and restricted cash | | (67,365) | | | 120,534 | |
| Beginning cash, cash equivalents and restricted cash | | 207,237 | | | 161,114 | |
| Ending cash, cash equivalents and restricted cash | | $ | 139,872 | | | $ | 281,648 | |
| | | | |
| Supplemental disclosure of cash flow information: | | | | |
| Cash paid for interest | | $ | 605,943 | | | $ | 408,374 | |
| Cash paid for income taxes | | 361 | | | 66 | |
| | | | |
| | | | |
| | | | |
|
The accompanying Notes to Consolidated Financial Statements (Unaudited) are an integral part of these statements.
55
NATIONAL RURAL UTILITIES COOPERATIVE FINANCE CORPORATION
NOTES TO CONSOLIDATED FINANCIAL STATEMENTS
(UNAUDITED)
| | |
| NOTE 1—SUMMARY OF SIGNIFICANT ACCOUNTING POLICIES |
The Company
National Rural Utilities Cooperative Finance Corporation (“CFC”) is a tax-exempt, member-owned cooperative association incorporated under the laws of the District of Columbia in April 1969. CFC’s principal purpose is to provide its members with financing to supplement the loan programs of the Rural Utilities Service (“RUS”) of the United States Department of Agriculture (“USDA”). CFC makes loans to its rural electric members so they can acquire, construct and operate electric distribution systems, electric generation and transmission (“power supply”) systems and related facilities. CFC also provides its members and associates with credit enhancements in the form of letters of credit and guarantees of debt obligations. As a cooperative, CFC is owned by and exclusively serves its membership, which consists of not-for-profit entities or subsidiaries or affiliates of not-for-profit entities.
Basis of Presentation and Use of Estimates
The accompanying unaudited interim consolidated financial statements have been prepared in conformity with accounting principles generally accepted in the United States (“U.S. GAAP”). These consolidated financial statements include the accounts of CFC and variable interest entities (“VIEs”) where CFC is the primary beneficiary. National Cooperative Services Corporation (“NCSC”) and Rural Telephone Finance Cooperative (“RTFC”) are VIEs that are required to be consolidated by CFC. NCSC is a taxable member-owned cooperative that may provide financing to members of CFC, government or quasi-government entities which own electric utility systems that meet the Rural Electrification Act definition of “rural,” and for-profit and nonprofit entities that are owned, operated or controlled by, or provide significant benefits to certain members of CFC. RTFC is a taxable Subchapter T cooperative association that provides financing for its rural telecommunications members and their affiliates. All intercompany balances and transactions have been eliminated. Unless stated otherwise, references to “we,” “our” or “us” relate to CFC and its consolidated entities.
In April 2023 and June 2023, RTFC’s and NCSC’s members, respectively, approved the sale of RTFC’s business to NCSC. We intend to complete the consolidation of RTFC and NCSC within the fiscal year ended May 31, 2024, subject to meeting certain closing conditions. In October 2023, in connection with the consolidation transaction, the Board of Directors approved the early retirement of allocated but unretired patronage capital at a discounted amount of $52 million, which may be subject to adjustment at the closing of the consolidation transaction. In addition, CFC’s and RTFC’s Board of Directors approved the early redemption of $12 million of members’ subordinated certificates, which is expected to occur prior to the closing of the consolidation transaction.
The preparation of financial statements in conformity with U.S. GAAP requires management to make estimates and assumptions that affect the reported amounts and related disclosures during the period. Management’s most significant estimates and assumptions involve determining the allowance for credit losses. These estimates are based on information available as of the date of the consolidated financial statements. While management makes its best judgments, actual amounts or results could differ from these estimates. In the opinion of management, these unaudited interim financial statements reflect all adjustments of a normal, recurring nature that are necessary for the fair statement of results for the periods presented. The results in the interim financial statements included in our Quarterly Report on Form 10-Q for the quarterly period ended August 31,November 30, 2023 (“this Report”) are not necessarily indicative of results that may be expected for the full fiscal year, and the unaudited interim consolidated financial statements should be read in conjunction with our audited consolidated financial statements included in CFC’s Annual Report on Form 10-K for the fiscal year ended May 31, 2023 (“2023 Form 10-K”).
Our fiscal year begins on June 1 and ends on May 31. Reference to “Q2 FY2024” and “YTD FY2024” refer to three and six months ended November 30, 2023, respectively. Reference to “Q2 FY2023” and “YTD FY2023” refer to three and six months ended November 30, 2022, respectively.
RTFC and NCSC Consolidation
In April 2023 and June 2023, RTFC’s and NCSC’s members, respectively, approved the sale of RTFC’s business to NCSC. In October 2023, as part of the consolidation process between RTFC and NCSC, the Board of Directors approved the early retirement of allocated but unretired patronage capital at a discounted amount of $51 million, which was returned in cash to RTFC’s members in January 2024. In addition, on October 26, 2023, we early redeemed at par $12 million of members’
NATIONAL RURAL UTILITIES COOPERATIVE FINANCE CORPORATION
NOTES TO CONSOLIDATED FINANCIAL STATEMENTS
(UNAUDITED)
subordinated certificates, as approved by CFC’s and RTFC’s Board of Directors. The consolidation of RTFC and NCSC was finalized on December 1, 2023. We accounted for the transaction pursuant to ASC 805-50 “Transactions between Entities under Common Control.”
(UNAUDITED)Time Deposits
Time deposits are deposits that we make with financial institutions in interest-bearing accounts. We had time deposits totaling $400 million as of November 30, 2023, which had a remaining maturity of less than 90 days as of the reporting date and were valued at carrying value, which approximates fair value. We had no time deposits outstanding as of May 31, 2023.
New Accounting Standards Adopted in Fiscal Year 2024
Financial Instruments-Credit Losses, Troubled Debt Restructurings (“TDRs”) and Vintage Disclosures
In March 2022, the Financial Accounting Standards Board (“FASB”) issued Accounting Standards Update (“ASU”) 2022-02, Financial Instruments—Credit Losses (Topic 326): Troubled Debt Restructurings and Vintage Disclosures, which addresses and amends areas identified by the FASB as part of its post-implementation review of the accounting standard that introduced the current expected credit losses (“CECL”) model. The amendments eliminate the accounting guidance for troubled debt restructurings (“TDR”) by creditors that have adopted the CECL model and enhance the disclosure requirements for loan refinancings and restructurings made with borrowers experiencing financial difficulty. In addition, the amendments require disclosure of current-period gross write-offs for financing receivables and net investment in leases by year of origination in the vintage disclosures. ASU 2022-02 is effective for fiscal years beginning after December 15, 2022, including interim periods within those fiscal years for entities, such as CFC, that have adopted the CECL accounting standard. We adopted the guidance on June 1, 2023 using the prospective adoption method. Accordingly, we will continue to account for existing TDR loans pursuant to the prior TDR accounting guidance until the loans are subsequently modified or settled, and to provide the disclosure required for TDR loans for the comparative periods prior to the adoption. While the guidance resulted in expanded disclosures, it did not have an impact on our consolidated results of operation, financial condition or liquidity from adoption of this accounting standard.
New Accounting Standards Issued But Not Yet Adopted
Segment Reporting-Improvements to Reportable Segment Disclosures.
In November 2023, the FASB issued ASU 2023-07, Segment Reporting (Topic 280): Improvements to Reportable Segment Disclosures, which introduce key amendments to enhance disclosures for public entities’ reportable segments. The amendments require disclosure of significant segment expenses that are regularly provided to the chief operating decision maker (“CODM”) and included within each reported measure of segment profit or loss, an amount and description of its composition for other segment items to reconcile to segment profit or loss, and the title and position of the entity’s CODM. The amendments also expand the interim segment disclosure requirements. ASU 2023-07 is effective for fiscal years beginning after December 15, 2023, and interim periods within fiscal years beginning after December 15, 2024, with early adoption permitted and requires retrospective application to all prior periods presented in the financial statements. We expect to adopt the guidance in fiscal year 2025, and the interim disclosure requirements in the first quarter of fiscal year 2026. We are currently in the process of reviewing the guidance and evaluating its impact on our consolidated financial statements and related disclosures.
Disclosure Improvements-Codification Amendment in Response to the SEC’s Disclosure Update and Simplification Initiative
In October 2023, the FASB issued ASU 2023-06, Disclosure Improvements - Codification Amendment in Response to the SEC’s Disclosure Update and Simplification Initiative. The amendments in this update modify the disclosure or presentation
NATIONAL RURAL UTILITIES COOPERATIVE FINANCE CORPORATION
NOTES TO CONSOLIDATED FINANCIAL STATEMENTS
(UNAUDITED)
requirements of a variety of Topics in the Accounting Standards Codification (“ASC”) in response to the SEC’s Release No. 33-10532, Disclosure Update and Simplification Initiative, and align the ASC’s requirements with the SEC’s regulations. For entities subject to the SEC’s existing disclosure requirements, the effective date for each amendment will be the date on which the SEC’s removal of that related disclosure from Regulation S-X or Regulation S-K becomes effective. However, if by June 30, 2027, the SEC has not removed the related disclosure from its regulations, the amendments will be removed from the Codification and not become effective. Early adoption is prohibited. We are currently in the process of evaluating the impact of the amendment on our consolidated financial statements and related disclosures.
| | |
| NOTE 2—INTEREST INCOME AND INTEREST EXPENSE |
The following table displays the components of interest income, by interest-earning asset type, and interest expense, by debt product type, presented on our consolidated statements of operations for the three months ended August 31, 2023 and 2022.operations.
Table 2.1: Interest Income and Interest Expense
| | | | | | | | | | | | | | | |
| | | Three Months Ended August 31, |
| (Dollars in thousands) | | | | | 2023 | | 2022 |
| Interest income: | | | | | | | |
| | | | | | | |
| | | | | | | |
| | | | | | | |
| | | | | | | |
| | | | | | | |
| | | | | | | |
Loans(1) | | | | | $ | 375,568 | | | $ | 302,680 | |
| Investment securities | | | | | 5,388 | | | 4,298 | |
| Total interest income | | | | | 380,956 | | | 306,978 | |
| | | | | | | |
Interest expense:(2)(3) | | | | | | | |
| Short-term borrowings | | | | | 58,394 | | | 24,209 | |
| | | | | | | |
| | | | | | | |
| | | | | | | |
| | | | | | | |
| | | | | | | |
| Long-term debt | | | | | 223,976 | | | 158,881 | |
| | | | | | | |
| | | | | | | |
| Subordinated debt | | | | | 33,911 | | | 26,378 | |
| Total interest expense | | | | | 316,281 | | | 209,468 | |
| | | | | | | |
| Net interest income | | | | | $ | 64,675 | | | $ | 97,510 | |
| | | | | | | | | | | | | | | | | | | | | | | | | | |
| | | | |
| (Dollars in thousands) | | Q2 FY2024 | | Q2 FY2023 | | YTD FY2024 | | YTD FY2023 |
| Interest income: | | | | | | | | |
| | | | | | | | |
| | | | | | | | |
| | | | | | | | |
| | | | | | | | |
| | | | | | | | |
| | | | | | | | |
Loans(1) | | $ | 382,010 | | | $ | 318,837 | | | $ | 757,578 | | | $ | 621,517 | |
| Cash, time deposits and investment securities | | 6,977 | | | 5,357 | | | 12,365 | | | 9,655 | |
| Total interest income | | 388,987 | | | 324,194 | | | 769,943 | | | 631,172 | |
| | | | | | | | |
Interest expense:(2)(3) | | | | | | | | |
| Short-term borrowings | | 63,030 | | | 41,186 | | | 121,424 | | | 65,395 | |
| | | | | | | | |
| | | | | | | | |
| | | | | | | | |
| | | | | | | | |
| | | | | | | | |
| Long-term debt | | 227,476 | | | 177,921 | | | 451,452 | | | 336,802 | |
| | | | | | | | |
| | | | | | | | |
| Subordinated debt | | 33,339 | | | 26,337 | | | 67,250 | | | 52,715 | |
| Total interest expense | | 323,845 | | | 245,444 | | | 640,126 | | | 454,912 | |
| | | | | | | | |
| Net interest income | | $ | 65,142 | | | $ | 78,750 | | | $ | 129,817 | | | $ | 176,260 | |
____________________________
(1) Includes loan conversion fees, which are generally deferred and recognized in interest income over the period to maturity using the effective interest method, late payment fees, commitment fees and net amortization of deferred loan fees and loan origination costs.
(2) Includes amortization of debt discounts and debt issuance costs, which are generally deferred and recognized as interest expense over the period to maturity using the effective interest method. Issuance costs related to dealer commercial paper, however, are recognized in interest expense immediately as incurred.
(3) Includes fees related to funding arrangements, such as up-front fees paid to banks participating in our committed bank revolving line of credit agreements. Based on the nature of the fees, the amount is either recognized immediately as incurred or deferred and recognized in interest expense ratably over the term of the arrangement.
NATIONAL RURAL UTILITIES COOPERATIVE FINANCE CORPORATION
NOTES TO CONSOLIDATED FINANCIAL STATEMENTS
(UNAUDITED)
Deferred income reported on our consolidated balance sheets of $37$35 million and $39 million as of August 31,November 30, 2023 and May 31, 2023, respectively, consists primarily of deferred loan conversion fees that totaled $29$27 million and $30 million as of each respective date.
| | |
| NOTE 3—INVESTMENT SECURITIES |
Our investment securities portfolio consists of debt securities classified as trading and equity securities with readily determinable fair values. We therefore record changes in the fair value of our debt and equity securities in earnings and report these unrealized changes together with realized gains and losses from the sale of securities as a component of non-interest income in our consolidated statements of operations.
NATIONAL RURAL UTILITIES COOPERATIVE FINANCE CORPORATION
NOTES TO CONSOLIDATED FINANCIAL STATEMENTS
(UNAUDITED)
Debt Securities
The following table presents the composition of our investment debt securities portfolio and the fair value as of August 31,November 30, 2023 and May 31, 2023.
Table 3.1: Investments in Debt Securities, at Fair Value
| | (Dollars in thousands) | (Dollars in thousands) | | August 31, 2023 | | May 31, 2023 | (Dollars in thousands) | | November 30, 2023 | | May 31, 2023 |
| Debt securities, at fair value: | Debt securities, at fair value: | | | | | Debt securities, at fair value: | | | | |
| | Corporate debt securities | Corporate debt securities | | $ | 366,885 | | | $ | 401,367 | | Corporate debt securities | | $ | 330,717 | | | $ | 401,367 | |
| Commercial agency mortgage-backed securities (“MBS”)(1) | Commercial agency mortgage-backed securities (“MBS”)(1) | | 7,181 | | | 7,237 | | Commercial agency mortgage-backed securities (“MBS”)(1) | | 7,037 | | | 7,237 | |
| | U.S. state and municipality debt securities | U.S. state and municipality debt securities | | 18,408 | | | 27,300 | | U.S. state and municipality debt securities | | 13,743 | | | 27,300 | |
| Foreign government debt securities | Foreign government debt securities | | 986 | | | 974 | | Foreign government debt securities | | 493 | | | 974 | |
Other asset-backed securities(2) | Other asset-backed securities(2) | | 31,871 | | | 37,997 | | Other asset-backed securities(2) | | 29,120 | | | 37,997 | |
| Total debt securities trading, at fair value | Total debt securities trading, at fair value | | $ | 425,331 | | | $ | 474,875 | | Total debt securities trading, at fair value | | $ | 381,110 | | | $ | 474,875 | |
____________________________
(1)Consists of securities backed by the Federal National Mortgage Association (“Fannie Mae”) and the Federal Home Loan Mortgage Corporation (“Freddie Mac”).
(2)Consists primarily of securities backed by auto lease loans, equipment-backed loans, auto loans and credit card loans.
We recognized net unrealized gains on our debt securities of $3$5 million and $7 million for Q2 FY2024 and YTD FY2024, respectively. We recognized net unrealized losses of $5$3 million and $9 million for the three months ended August 31, 2023Q2 FY2023 and 2022,YTD FY2023, respectively.
We did not sell any debt securities during the three months ended August 31, 2023YTD FY2024 and 2022;YTD FY2023; therefore, no realized gains or losses were recorded during these periods for sale of securities.
Equity Securities
The following table presents the composition of our equity security holdings and the fair value as of August 31,November 30, 2023 and May 31, 2023.
Table 3.2: Investments in Equity Securities, at Fair Value
| | | | | | | | | | | | | | |
| (Dollars in thousands) | | November 30, 2023 | | May 31, 2023 |
| Equity securities, at fair value: | | | | |
| Farmer Mac—Series C non-cumulative preferred stock | | $ | 25,300 | | | $ | 25,750 | |
| Farmer Mac—Class A common stock | | 10,458 | | | 9,744 | |
| Total equity securities, at fair value | | $ | 35,758 | | | $ | 35,494 | |
We recognized net unrealized losses on our equity securities of $1 million and net unrealized gains of less than $1 million for Q2 FY2024 and YTD FY2024, respectively. We recognized net unrealized gains on our equity securities of $4 million and $7 million for Q2 FY2023 and YTD FY2023, respectively.
NATIONAL RURAL UTILITIES COOPERATIVE FINANCE CORPORATION
NOTES TO CONSOLIDATED FINANCIAL STATEMENTS
(UNAUDITED)
Table 3.2: Investments in Equity Securities, at Fair Value
| | | | | | | | | | | | | | |
| (Dollars in thousands) | | August 31, 2023 | | May 31, 2023 |
| Equity securities, at fair value: | | | | |
| Farmer Mac—Series C non-cumulative preferred stock | | $ | 25,200 | | | $ | 25,750 | |
| Farmer Mac—Class A common stock | | 11,580 | | | 9,744 | |
| Total equity securities, at fair value | | $ | 36,780 | | | $ | 35,494 | |
We recognized net unrealized gains on our equity securities of $1 million and $3 million for the three months ended August 31, 2023 and 2022, respectively.
We segregate our loan portfolio into segments, by legal entity, based on the borrower member class, which consists of CFC distribution, CFC power supply, CFC statewide and associate, NCSC and RTFC. We offer both long-term and line of credit loans to our borrowers. Under our long-term loan facilities, a borrower may select a fixed interest rate or a variable interest rate at the time of each loan advance. Line of credit loans are revolving loan facilities and generally have a variable interest rate.
Loans to Members
Loans to members consist of loans held for investment and loans held for sale. The outstanding amount of loans held for investment is recorded based on the unpaid principal balance, net of discounts, charge-offs and recoveries, of loans and deferred loan origination costs. The outstanding amount of loans held for sale is recorded based on the lower of cost or fair value. The following table presents loans to members by legal entity, member class and loan type, as of August 31,November 30, 2023 and May 31, 2023.
NATIONAL RURAL UTILITIES COOPERATIVE FINANCE CORPORATION
NOTES TO CONSOLIDATED FINANCIAL STATEMENTS
(UNAUDITED)
Table 4.1: Loans to Members by Member Class and Loan Type
| | | | | August 31, 2023 | | May 31, 2023 | | | November 30, 2023 | | May 31, 2023 |
| (Dollars in thousands) | (Dollars in thousands) | | Amount | | % of Total | | Amount | | % of Total | (Dollars in thousands) | | Amount | | % of Total | | Amount | | % of Total |
| Member class: | Member class: | | | | | | | | | Member class: | | | | | | | | |
| CFC: | CFC: | | CFC: | |
| Distribution | Distribution | | $ | 25,818,224 | | | 78 | % | | $ | 25,437,077 | | | 78 | % | Distribution | | $ | 26,041,672 | | | 77 | % | | $ | 25,437,077 | | | 78 | % |
| Power supply | Power supply | | 5,570,554 | | | 17 | | | 5,437,242 | | | 17 | | Power supply | | 5,737,597 | | | 17 | | | 5,437,242 | | | 17 | |
| Statewide and associate | Statewide and associate | | 232,292 | | | 1 | | | 200,368 | | | 1 | | Statewide and associate | | 268,286 | | | 1 | | | 200,368 | | | 1 | |
| Total CFC | Total CFC | | 31,621,070 | | | 96 | | | 31,074,687 | | | 96 | | Total CFC | | 32,047,555 | | | 95 | | | 31,074,687 | | | 96 | |
| NCSC | NCSC | | 923,447 | | | 2 | | | 956,874 | | | 3 | | NCSC | | 946,643 | | | 3 | | | 956,874 | | | 3 | |
| RTFC | RTFC | | 538,976 | | | 2 | | | 487,788 | | | 1 | | RTFC | | 546,040 | | | 2 | | | 487,788 | | | 1 | |
Total loans outstanding(1) | Total loans outstanding(1) | | 33,083,493 | | | 100 | | | 32,519,349 | | | 100 | | Total loans outstanding(1) | | 33,540,238 | | | 100 | | | 32,519,349 | | | 100 | |
Deferred loan origination costs—CFC(2) | Deferred loan origination costs—CFC(2) | | 13,153 | | | — | | | 12,737 | | | — | | Deferred loan origination costs—CFC(2) | | 13,351 | | | — | | | 12,737 | | | — | |
| Loans to members | Loans to members | | $ | 33,096,646 | | | 100 | % | | $ | 32,532,086 | | | 100 | % | Loans to members | | $ | 33,553,589 | | | 100 | % | | $ | 32,532,086 | | | 100 | % |
| | Loan type: | Loan type: | | | | | | | | | Loan type: | | | | | | | | |
| Long-term loans: | Long-term loans: | | Long-term loans: | |
| Fixed rate | Fixed rate | | $ | 28,708,848 | | | 87 | % | | $ | 28,371,358 | | | 87 | % | Fixed rate | | $ | 29,388,622 | | | 88 | % | | $ | 28,371,358 | | | 87 | % |
| Variable rate | Variable rate | | 1,012,181 | | | 3 | | | 1,024,653 | | | 3 | | Variable rate | | 859,082 | | | 2 | | | 1,024,653 | | | 3 | |
| | Total long-term loans | Total long-term loans | | 29,721,029 | | | 90 | | | 29,396,011 | | | 90 | | Total long-term loans | | 30,247,704 | | | 90 | | | 29,396,011 | | | 90 | |
| Lines of credit | Lines of credit | | 3,362,464 | | | 10 | | | 3,123,338 | | | 10 | | Lines of credit | | 3,292,534 | | | 10 | | | 3,123,338 | | | 10 | |
Total loans outstanding(1) | Total loans outstanding(1) | | 33,083,493 | | | 100 | | | 32,519,349 | | | 100 | | Total loans outstanding(1) | | 33,540,238 | | | 100 | | | 32,519,349 | | | 100 | |
Deferred loan origination costs—CFC(2) | Deferred loan origination costs—CFC(2) | | 13,153 | | | — | | | 12,737 | | | — | | Deferred loan origination costs—CFC(2) | | 13,351 | | | — | | | 12,737 | | | — | |
| Loans to members | Loans to members | | $ | 33,096,646 | | | 100 | % | | $ | 32,532,086 | | | 100 | % | Loans to members | | $ | 33,553,589 | | | 100 | % | | $ | 32,532,086 | | | 100 | % |
|
____________________________
(1) Represents the unpaid principal balance, net of discounts, charge-offs and recoveries, of loans as of the end of each period.
(2) Deferred loan origination costs are recorded on the books of CFC.
NATIONAL RURAL UTILITIES COOPERATIVE FINANCE CORPORATION
NOTES TO CONSOLIDATED FINANCIAL STATEMENTS
(UNAUDITED)
Loan Sales
We may transfer whole loans and participating interests to third parties. These transfers are typically made concurrently or within a short period of time with the closing of the loan sale or participation agreement at par value and meet the accounting criteria required for sale accounting.
We sold CFC and NCSC loans, at par for cash, totaling $39$103 million and $113$156 million during the three months ended August 31, 2023YTD FY2024 and 2022YTD FY2023, respectively. We recorded immaterial losses on the sale of these loans attributable to the unamortized deferred loan origination costs associated with the transferred loans. We had no loans held for sale as of August 31,November 30, 2023 or May 31, 2023.
Accrued Interest Receivable
We report accrued interest on loans separately on our consolidated balance sheets as a component of the line item accrued interest receivable rather than as a component of loans to members. Accrued interest on loans totaled $134totaled $141 million and $133 million as of August 31,November 30, 2023 and May 31, 2023, respectively. Accrued interest receivable amounts generally represent three months or less of accrued interest on loans outstanding. Because our policy is to write off past-due accrued interest receivable in a timely manner, we elected not to measure an allowance for credit losses for accrued interest receivable on
NATIONAL RURAL UTILITIES COOPERATIVE FINANCE CORPORATION
NOTES TO CONSOLIDATED FINANCIAL STATEMENTS
(UNAUDITED)
loans outstanding. We also elected to exclude accrued interest receivable from the credit quality disclosures required under CECL.
Credit Concentration
Concentrations of credit may exist when a lender has large credit exposures to single borrowers, large credit exposures to borrowers in the same industry sector or engaged in similar activities or large credit exposures to borrowers in a geographic region that would cause the borrowers to be similarly impacted by economic or other conditions in the region. As a tax-exempt, member-owned finance cooperative, CFC’s principal focus is to provide funding to its rural electric utility cooperative members to assist them in acquiring, constructing and operating electric distribution systems, power supply systems and related facilities.
Because we lend primarily to our rural electric utility cooperative members, we have had a loan portfolio subject to single-industry and single-obligor concentration risks since our inception in 1969. Loans outstanding to electric utility organizations of $32,545$32,994 million and $32,032 million as of August 31,November 30, 2023 and May 31, 2023, respectively, accounted for 98% and 99% of total loans outstanding as of each respective date. The remaining loans outstanding in our portfolio were to RTFC members, affiliates and associates in the telecommunications industry. Our credit exposure is partially mitigated by long-term loans guaranteed by RUS, which totaled $121$118 million and $123 million as of August 31,November 30, 2023 and May 31, 2023, respectively.
Single-Obligor Concentration
The outstanding loan exposure for our 20 largest borrowers totaled $6,777$6,753 million and $6,588 million as of August 31,November 30, 2023 and May 31, 2023, respectively, representing 20% of total loans outstanding as of each respective date. Our 20 largest borrowers consisted of 12 distribution systems and eight power supply systems as of November 30, 2023 compared to 10 distribution systems and 10 power supply systems as of both August 31, 2023 and May 31, 2023. The largest total outstanding exposure to a single borrower or controlled group represented approximately 1% of total loans outstanding as of both August 31,November 30, 2023 and May 31, 2023.
We entered into a long-term standby purchase commitment agreement with Farmer Mac during fiscal year 2016. Under this agreement, we may designate certain long-term loans to be covered under the commitment, subject to approval by Farmer Mac, and in the event any such loan later goes into payment default for at least 90 days, upon request by us, Farmer Mac must purchase such loan at par value. We are required to pay Farmer Mac a monthly fee based on the unpaid principal
NATIONAL RURAL UTILITIES COOPERATIVE FINANCE CORPORATION
NOTES TO CONSOLIDATED FINANCIAL STATEMENTS
(UNAUDITED)
balance of loans covered under the purchase commitment. The aggregate unpaid principal balance of designated and Farmer Mac approved loans was $428$421 million and $436 million as of August 31,November 30, 2023 and May 31, 2023, respectively. Loan exposure to our 20 largest borrowers covered under the Farmer Mac agreement totaled $224$226 million and $267 million as of August 31,November 30, 2023 and May 31, 2023, respectively, which reduced our exposure to the 20 largest borrowers to $6,553 million and $6,321 million19% as of each respective date. We have had no loan defaults for loans covered under this agreement; therefore, no loans have been put to Farmer Mac for purchase pursuant to the standby purchase agreement as of August 31,November 30, 2023. Our credit exposure is also mitigated by long-term loans guaranteed by RUS.
Geographic Concentration
Although our organizational structure and mission result in single-industry concentration, we serve a geographically diverse group of electric and telecommunications borrowers throughout the U.S. The consolidated number of borrowers with loans outstanding totaled 883891 and 884 as of August 31,November 30, 2023 and May 31, 2023, respectively, located in 49 states and the District of Columbia. Of the 883891 and 884 borrowers with loans outstanding, 50 and 52 were electric power supply borrowers as of
NATIONAL RURAL UTILITIES COOPERATIVE FINANCE CORPORATION
NOTES TO CONSOLIDATED FINANCIAL STATEMENTS
(UNAUDITED)
August 31, November 30, 2023 and May 31, 2023, respectively. Electric power supply borrowers generally require significantly more capital than electric distribution and telecommunications borrowers.
Texas accounted for the largest number of borrowers with loans outstanding in any one state as of both August 31,November 30, 2023 and May 31, 2023, as well as the largest concentration of loan exposure. The following table presents the Texas-based number of borrowers and loans outstanding by legal entity and member class, as of August 31,November 30, 2023 and May 31, 2023.
Table 4.2: Loan Exposure to Texas-Based Borrowers
| | | | | August 31, 2023 | | May 31, 2023 | | | November 30, 2023 | | May 31, 2023 |
| (Dollars in thousands) | (Dollars in thousands) | | Number of Borrowers | | Amount | | % of Total | | Number of Borrowers | | Amount | | % of Total | (Dollars in thousands) | | Number of Borrowers | | Amount | | % of Total | | Number of Borrowers | | Amount | | % of Total |
| Member class: | Member class: | | | | | | | | | | | | | Member class: | | | | | | | | | | | | |
| CFC: | CFC: | | CFC: | |
| Distribution | Distribution | | 57 | | | $ | 4,368,220 | | | 13 | % | | 57 | | | $ | 4,319,937 | | | 13 | % | Distribution | | 57 | | | $ | 4,360,741 | | | 13 | % | | 57 | | | $ | 4,319,937 | | | 13 | % |
| Power supply | Power supply | | 6 | | | 1,181,919 | | | 4 | | | 8 | | | 1,128,941 | | | 4 | | Power supply | | 6 | | | 1,199,573 | | | 4 | | | 8 | | | 1,128,941 | | | 4 | |
| Statewide and associate | Statewide and associate | | 1 | | | 75,754 | | | — | | | 1 | | | 51,504 | | | — | | Statewide and associate | | 1 | | | 77,029 | | | — | | | 1 | | | 51,504 | | | — | |
| Total CFC | Total CFC | | 64 | | | 5,625,893 | | | 17 | | | 66 | | | 5,500,382 | | | 17 | | Total CFC | | 64 | | | 5,637,343 | | | 17 | | | 66 | | | 5,500,382 | | | 17 | |
| NCSC | NCSC | | — | | | — | | | — | | | 1 | | | 16,667 | | | — | | NCSC | | 1 | | | 4,667 | | | — | | | 1 | | | 16,667 | | | — | |
| | RTFC | RTFC | | 2 | | | 11,429 | | | — | | | 2 | | | 11,755 | | | — | | RTFC | | 2 | | | 11,098 | | | — | | | 2 | | | 11,755 | | | — | |
| Total loan exposure to Texas-based borrowers | Total loan exposure to Texas-based borrowers | | 66 | | | 5,637,322 | | | 17 | | | 69 | | | 5,528,804 | | | 17 | | Total loan exposure to Texas-based borrowers | | 67 | | | 5,653,108 | | | 17 | | | 69 | | | 5,528,804 | | | 17 | |
| Less: Loans covered under Farmer Mac standby purchase commitment | Less: Loans covered under Farmer Mac standby purchase commitment | | | | (153,132) | | | — | | | | | (155,409) | | | — | | Less: Loans covered under Farmer Mac standby purchase commitment | | | | (151,279) | | | (1) | | | | | (155,409) | | | — | |
| Net loan exposure to Texas-based borrowers | Net loan exposure to Texas-based borrowers | | $ | 5,484,190 | | | 17 | % | | $ | 5,373,395 | | | 17 | % | Net loan exposure to Texas-based borrowers | | $ | 5,501,829 | | | 16 | % | | $ | 5,373,395 | | | 17 | % |
|
Credit Quality Indicators
Assessing the overall credit quality of our loan portfolio and measuring our credit risk is an ongoing process that involves tracking payment status, modifications to borrowers experiencing financial difficulty, nonperforming loans, charge-offs, the internal risk ratings of our borrowers and other indicators of credit risk. We monitor and subject each borrower and loan facility in our loan portfolio to an individual risk assessment based on quantitative and qualitative factors. Payment status trends and internal risk ratings are indicators, among others, of the probability of borrower default and overall credit quality of our loan portfolio.
NATIONAL RURAL UTILITIES COOPERATIVE FINANCE CORPORATION
NOTES TO CONSOLIDATED FINANCIAL STATEMENTS
(UNAUDITED)
Payment Status of Loans
Loans are considered delinquent when contractual principal or interest amounts become past due 30 days or more following the scheduled payment due date. Loans are placed on nonaccrual status when payment of principal or interest is 90 days or more past due or management determines that the full collection of principal and interest is doubtful. The following table presents the payment status, by legal entity and member class, of loans outstanding as of August 31,November 30, 2023 and May 31, 2023.
NATIONAL RURAL UTILITIES COOPERATIVE FINANCE CORPORATION
NOTES TO CONSOLIDATED FINANCIAL STATEMENTS
(UNAUDITED)
Table 4.3: Payment Status of Loans Outstanding
| | | | | August 31, 2023 | | | November 30, 2023 |
| (Dollars in thousands) | (Dollars in thousands) | | Current | | 30-89 Days Past Due | | > 90 Days
Past Due | | Total
Past Due | | Total Loans Outstanding | | Nonaccrual Loans | (Dollars in thousands) | | Current | | 30-89 Days Past Due | | > 90 Days
Past Due | | Total
Past Due | | Total Loans Outstanding | | Nonaccrual Loans |
| Member class: | Member class: | | | | | | | | | | | | | Member class: | | | | | | | | | | | | |
| CFC: | CFC: | | | | | | | | | | | | | CFC: | | | | | | | | | | | | |
| Distribution | Distribution | | $ | 25,818,224 | | $ | — | | | $ | — | | | $ | — | | | $ | 25,818,224 | | $ | — | Distribution | | $ | 26,041,672 | | $ | — | | | $ | — | | | $ | — | | | $ | 26,041,672 | | $ | — |
| Power supply | Power supply | | 5,570,554 | | — | | | — | | | — | | | 5,570,554 | | 84,987 | Power supply | | 5,737,597 | | — | | | — | | | — | | | 5,737,597 | | 84,987 |
| Statewide and associate | Statewide and associate | | 232,292 | | — | | | — | | | — | | | 232,292 | | — | | Statewide and associate | | 268,286 | | — | | | — | | | — | | | 268,286 | | — | |
| CFC total | CFC total | | 31,621,070 | | — | | | — | | | — | | | 31,621,070 | | 84,987 | CFC total | | 32,047,555 | | — | | | — | | | — | | | 32,047,555 | | 84,987 |
| NCSC | NCSC | | 923,447 | | — | | | — | | | — | | | 923,447 | | — | NCSC | | 946,643 | | — | | | — | | | — | | | 946,643 | | — |
| RTFC | RTFC | | 538,976 | | — | | | — | | | — | | | 538,976 | | — | RTFC | | 546,040 | | — | | | — | | | — | | | 546,040 | | — |
| Total loans outstanding | Total loans outstanding | | $ | 33,083,493 | | $ | — | | | $ | — | | | $ | — | | | $ | 33,083,493 | | $ | 84,987 | Total loans outstanding | | $ | 33,540,238 | | $ | — | | | $ | — | | | $ | — | | | $ | 33,540,238 | | $ | 84,987 |
| | Percentage of total loans | Percentage of total loans | | 100.00 | % | | — | % | | — | % | | — | % | | 100.00 | % | | 0.26 | % | Percentage of total loans | | 100.00 | % | | — | % | | — | % | | — | % | | 100.00 | % | | 0.25 | % |
| | | | | | | | | | | | | | | | | | | | | | | | | | | | | | | | | | | | | | |
| | | May 31, 2023 |
| (Dollars in thousands) | | Current | | 30-89 Days Past Due | | > 90 Days
Past Due | | Total
Past Due | | Total Loans Outstanding | | Nonaccrual Loans |
| Member class: | | | | | | | | | | | | |
| CFC: | | | | | | | | | | | | |
| Distribution | | $ | 25,437,077 | | $ | — | | | $ | — | | | $ | — | | | $ | 25,437,077 | | $ | — |
| Power supply | | 5,432,895 | | — | | | 4,347 | | | 4,347 | | | 5,437,242 | | 112,209 |
| Statewide and associate | | 200,368 | | — | | | — | | | — | | | 200,368 | | — |
| CFC total | | 31,070,340 | | — | | | 4,347 | | | 4,347 | | | 31,074,687 | | 112,209 |
| NCSC | | 920,159 | | 36,715 | | | — | | | 36,715 | | | 956,874 | | — |
| RTFC | | 487,788 | | — | | | — | | | — | | | 487,788 | | — |
| Total loans outstanding | | $ | 32,478,287 | | $ | 36,715 | | | $ | 4,347 | | | $ | 41,062 | | | $ | 32,519,349 | | $ | 112,209 |
| | | | | | | | | | | | |
| Percentage of total loans | | 99.87 | % | | 0.11% | | 0.02% | | 0.13% | | 100.00 | % | | 0.35 | % |
We had no delinquent loans as of August 31,November 30, 2023. In comparison, we had one CFC electric power supply borrower, Brazos Sandy Creek Electric Cooperative Inc. (“Brazos Sandy Creek”), with a delinquent loan totaling $4 million and one NCSC borrower with a delinquent loan of $37 million as of May 31, 2023. The decrease in loans on nonaccrual status of $27 million to $85 million as of August 31,November 30, 2023, from $112 million as of May 31, 2023 was due to the receipt of loan principal payments for Brazos Electric Power Cooperative, Inc. (“Brazos”) and Brazos Sandy Creek during the three months ended August 31, 2023.2023 (“Q1 FY2024”). We received a total of $28 million in loan payments from Brazos and Brazos Sandy Creek to repay their $27 million of total loans outstanding in full during the three months ended August 31, 2023.Q1 FY2024. The additional payment received of $1 million was recorded as a loan recovery on the Brazos and Brazos Sandy Creek previously charged-off loan amounts.
NATIONAL RURAL UTILITIES COOPERATIVE FINANCE CORPORATION
NOTES TO CONSOLIDATED FINANCIAL STATEMENTS
(UNAUDITED)
Loan Modifications to Borrowers Experiencing Financial Difficulty
We actively monitor problem loans and, from time to time, attempt to work with borrowers to manage such exposures through loan workouts or modifications that better align with the borrower’s current ability to pay. Therefore, as part of our loss mitigation efforts, we may provide modifications to a borrower experiencing financial difficulty to improve long-term
NATIONAL RURAL UTILITIES COOPERATIVE FINANCE CORPORATION
NOTES TO CONSOLIDATED FINANCIAL STATEMENTS
(UNAUDITED)
collectability of the loan and to avoid the need for exercising remedies. We consider the impact of all loan modifications when estimating the credit quality of our loan portfolio and establishing the allowance for credit losses.
On June 1, 2023, we adopted ASU 2022-02, Financial Instruments – Credit Losses (Topic 326) – Troubled Debt Restructurings and Vintage Disclosures, using the prospective adoption method. The ASU eliminated the accounting guidance for TDRs and enhanced the disclosure requirements for loan refinancings and restructurings made with borrowers experiencing financial difficulty, which are to be applied prospectively. For additional information on the adoption of ASU 2022-02 see “Note 1—Summary of Significant Accounting Policies.”
We had noone loan modificationsmodification to a RTFC borrower experiencing financial difficulty during Q2 FY2024 and YTD FY2024. This loan received a term extension and had an amortized cost of $3 million as of November 30, 2023, representing 1% of the RTFC loan portfolio. Loans modified to borrowers experiencing financial difficulty duringtotaled $3 million as of November 30, 2023, consisting of one RTFC loan as discussed above, which wasperforming in accordance with the three months ended August 31, 2023.terms of the loan agreement. There were no unadvanced loan commitments related to this loan.
Troubled Debt Restructurings—Prior to the Adoption of ASU 2022-02
As discussed above, ASU 2022-02 eliminated the accounting guidance for TDRs. Prior to the adoption of ASU 2022-02, a loan restructuring or modification of terms was accounted for as a TDR if, for economic or legal reasons related to the borrower’s financial difficulties, a concession was granted to the borrower that we would not otherwise consider. The following table presents the outstanding balance of modified loans accounted for as TDRs and the performance status, by legal entity and member class, of these loans as of May 31, 2023.
Table 4.4: Troubled Debt Restructurings—Prior to the Adoption of ASU 2022-02
| | | | | | | | | | | | | | | | | | | | | | | | | |
| | | | May 31, 2023 |
| (Dollars in thousands) | | | | | | | Number of Borrowers | | Outstanding Amount (1) | | % of Total Loans Outstanding |
| TDR loans: | | | | | | | | | | | |
| | | | | | | | | | | |
| | | | | | | | | | | |
| Member class: | | | | | | | | | | | |
| CFC—Distribution | | | | | | | 1 | | $ | 4,638 | | | 0.02 | % |
| CFC—Power Supply | | | | | | | 1 | | 22,875 | | | 0.07 | |
| RTFC | | | | | | | 1 | | 3,592 | | | 0.01 | |
| Total TDR loans | | | | | | | 3 | | $ | 31,105 | | | 0.10 | % |
| | | | | | | | | | | |
| Performance status of TDR loans: | | | | | | | | | | | |
| Performing TDR loans | | | | | | | 2 | | $ | 8,230 | | | 0.03 | % |
| Nonperforming TDR loans | | | | | | | 1 | | 22,875 | | | 0.07 | |
| Total TDR loans | | | | | | | 3 | | $ | 31,105 | | | 0.10 | % |
____________________________
(1) Represents the unpaid principal balance net of charge-offs and recoveries as of the end of each period.
NATIONAL RURAL UTILITIES COOPERATIVE FINANCE CORPORATION
NOTES TO CONSOLIDATED FINANCIAL STATEMENTS
(UNAUDITED)
There were no unadvanced commitments related to these loans as of May 31, 2023. We had loans outstanding to two borrowers totaling $8 million which have been performing in accordance with the terms of their respective restructured loan agreement for an extended period of time and were classified as performing TDR loans and on accrual status as of May 31, 2023. We had loans outstanding to Brazos totaling $23 million classified as nonperforming TDR loans during the three months ended February 28, 2023 (“Q3 FY2023”), which were on non-accrual status as of May 31, 2023. During the three months ended August 31, 2023,Q1 FY2024, we received the remaining payment of Brazos’ loans outstanding of $23 million in accordance with the provisions of Brazos’ plan of reorganization to repay its loans in full. Prior to the Brazos loan restructuring, we have not had any loan modifications that were required to be accounted for as TDRs since fiscal year 2016.
NATIONAL RURAL UTILITIES COOPERATIVE FINANCE CORPORATION
NOTES TO CONSOLIDATED FINANCIAL STATEMENTS
(UNAUDITED)
Nonperforming Loans
The following table presents the outstanding balance of nonperforming loans, by legal entity and member class, as of August 31,November 30, 2023 and May 31, 2023. Loans classified as nonperforming are placed on nonaccrual status.
Table 4.5: Nonperforming Loans
| | | | | August 31, 2023 | | | May 31, 2023 | | | November 30, 2023 | | | May 31, 2023 |
| (Dollars in thousands) | (Dollars in thousands) | | Number of Borrowers | | Outstanding Amount (1) | | % of Total Loans Outstanding | | | Number of Borrowers | | Outstanding Amount (1) | | % of Total Loans Outstanding | | (Dollars in thousands) | | Number of Borrowers | | Outstanding Amount (1) | | % of Total Loans Outstanding | | | Number of Borrowers | | Outstanding Amount (1) | | % of Total Loans Outstanding | |
| Nonperforming loans: | Nonperforming loans: | | | | | | | | | | | | | | | Nonperforming loans: | | | | | | | | | | | | | | |
| Member class: | Member class: | | | | | Member class: | | | | |
| CFC—Power supply | CFC—Power supply | | 1 | | $ | 84,987 | | | 0.26 | % | | | 2 | | $ | 89,334 | | | 0.27 | % | | CFC—Power supply | | 1 | | $ | 84,987 | | | 0.25 | % | | | 2 | | $ | 89,334 | | | 0.27 | % | |
| | Total nonperforming loans | Total nonperforming loans | | 1 | | $ | 84,987 | | | 0.26 | % | | | 2 | | $ | 89,334 | | | 0.27 | % | | Total nonperforming loans | | 1 | | $ | 84,987 | | | 0.25 | % | | | 2 | | $ | 89,334 | | | 0.27 | % | |
(1) Represents the unpaid principal balance net of charge-offs and recoveries as of the end of each period.
Nonperforming loans totaled $85 million as of August 31,November 30, 2023, a decrease of $4 million from May 31, 2023, due to the receipt of $4 million in loan payments from Brazos Sandy Creek to pay off its nonperforming loan outstanding during the three months ended August 31, 2023,Q1 FY2024, as discussed above.
Net Charge-Offs
We had no charge-offs during the three months ended August 31, 2023Q2 FY2024 and 2022.YTD FY2024. As mentioned above, during the three months ended August 31, 2023Q1 FY2024, we recorded a $1 million loan recovery on the Brazos and Brazos Sandy Creek previously charged-off loan amounts, which resulted in an annualized net recovery rate of 0.01%. for YTD FY2024. In comparison, we had charge-offs totaling $15 million for the CFC electric power supply loan portfolio related to Brazos and Brazos Sandy Creek nonperforming loans during Q2 FY2023 and YTD FY2023, which resulted in an annualized net charge of rate of 0.19% and 0.10% for Q2 FY2023 and YTD FY2023, respectively. Prior to Brazos’ and Brazos Sandy Creek’s bankruptcy filings, we had not experienced any defaults or charge-offs in our electric utility and telecommunications loan portfolios since fiscal year 2013 and 2017, respectively.
Borrower Risk Ratings
As part of our management of credit risk, we maintain a credit risk rating framework under which we employ a consistent process for assessing the credit quality of our loan portfolio. We evaluate each borrower and loan facility in our loan portfolio and assign internal borrower and loan facility risk ratings based on the consideration of a number of quantitative and qualitative factors. Each risk rating is reassessed annually following the receipt of the borrower’s audited financial statements; however, interim risk-rating adjustments may occur as a result of updated information affecting a borrower’s ability to fulfill its obligations or other significant developments and trends. We categorize loans in our portfolio based on
NATIONAL RURAL UTILITIES COOPERATIVE FINANCE CORPORATION
NOTES TO CONSOLIDATED FINANCIAL STATEMENTS
(UNAUDITED)
our internally assigned borrower risk ratings, which are intended to assess the general creditworthiness of the borrower and probability of default. Our borrower risk ratings align with the U.S. federal banking regulatory agencies’ credit risk definitions of pass and criticized categories, with the criticized category further segmented among special mention, substandard and doubtful. Pass ratings reflect relatively low probability of default, while criticized ratings have a higher probability of default.
The following is a description of the borrower risk rating categories.
•Pass: Borrowers that are not included in the categories of special mention, substandard or doubtful.
•Special Mention: Borrowers that may be characterized by a potential credit weakness or deteriorating financial condition that is not sufficiently serious to warrant a classification of substandard or doubtful.
NATIONAL RURAL UTILITIES COOPERATIVE FINANCE CORPORATION
NOTES TO CONSOLIDATED FINANCIAL STATEMENTS
(UNAUDITED)
•Substandard: Borrowers that display a well-defined credit weakness that may jeopardize the full collection of principal and interest.
•Doubtful: Borrowers that have a well-defined credit weakness or weaknesses that make full collection of principal and interest, on the basis of currently known facts, conditions and collateral values, highly questionable and improbable.
Our internally assigned borrower risk ratings serve as the primary credit quality indicator for our loan portfolio. Because our internal borrower risk ratings provide important information on the probability of default, they are a key input in determining our allowance for credit losses.
Table 4.6 displays total loans outstanding, by borrower risk rating category and by legal entity and member class, as of August 31,November 30, 2023 and May 31, 2023. The borrower risk rating categories presented below correspond to the borrower risk rating categories used in calculating our collective allowance for credit losses. If a parent company provides a guarantee of full repayment of loans of a subsidiary borrower, we include the loans outstanding in the borrower risk-rating category of the guarantor parent company rather than the risk rating category of the subsidiary borrower for purposes of calculating the collective allowance.
We present term loans outstanding as of August 31,November 30, 2023, by fiscal year of origination for each year during the five-year annual reporting period beginning in fiscal year 2020, and in the aggregate for periods prior to fiscal year 2020. The origination period represents the date CFC advances funds to a borrower, rather than the execution date of a loan facility for a borrower. Revolving loans are presented separately due to the nature of revolving loans. The substantial majority of loans in our portfolio represent fixed-rate advances under secured long-term facilities with terms up to 35 years, and as indicated in Table 4.6 below, term loan advances made to borrowers prior to fiscal year 2020 totaled $18,381$18,106 million, representing 56%54% of our total loans outstanding of $33,083$33,540 million as of August 31,November 30, 2023. The average remaining maturity of our long-term loans, which accounted for 90% of total loans outstanding as of August 31,November 30, 2023, was 19 years.
NATIONAL RURAL UTILITIES COOPERATIVE FINANCE CORPORATION
NOTES TO CONSOLIDATED FINANCIAL STATEMENTS
(UNAUDITED)
Table 4.6: Loans Outstanding by Borrower Risk Ratings and Origination Year
| | | August 31, 2023 | | | November 30, 2023 | |
| | Term Loans by Fiscal Year of Origination | | | | Term Loans by Fiscal Year of Origination | | |
| (Dollars in thousands) | (Dollars in thousands) | | YTD Q1 2024 | | 2023 | | 2022 | | 2021 | | 2020 | | Prior | | Revolving Loans | | Total | | May 31, 2023 | (Dollars in thousands) | | YTD Q2 2024 | | 2023 | | 2022 | | 2021 | | 2020 | | Prior | | Revolving Loans | | Total | | May 31, 2023 |
| Pass | Pass | | | | | | | | | | | | | | | | | | | Pass | | | | | | | | | | | | | | | | | | |
| CFC: | CFC: | | CFC: | |
| Distribution | Distribution | | $ | 552,343 | | | $ | 2,442,462 | | | $ | 2,383,521 | | | $ | 1,631,443 | | | $ | 1,808,667 | | | $ | 14,771,702 | | | $ | 2,041,214 | | | $ | 25,631,352 | | | $ | 25,242,708 | | Distribution | | $ | 1,117,547 | | | $ | 2,430,105 | | | $ | 2,364,522 | | | $ | 1,618,393 | | | $ | 1,794,622 | | | $ | 14,552,558 | | | $ | 1,964,844 | | | $ | 25,842,591 | | | $ | 25,242,708 | |
| Power supply | Power supply | | 99,394 | | | 462,843 | | | 342,465 | | | 545,372 | | | 176,313 | | | 3,003,208 | | | 855,972 | | | 5,485,567 | | | 5,325,033 | | Power supply | | 379,142 | | | 459,721 | | | 335,085 | | | 541,990 | | | 173,777 | | | 2,957,831 | | | 805,064 | | | 5,652,610 | | | 5,325,033 | |
Statewide and
associate | Statewide and
associate | | 1,000 | | | 61,104 | | | 23,489 | | | 1,875 | | | 13,840 | | | 18,812 | | | 99,400 | | | 219,520 | | | 187,310 | | Statewide and
associate | | 37,000 | | | 60,561 | | | 23,440 | | | 1,812 | | | 12,940 | | | 18,051 | | | 102,000 | | | 255,804 | | | 187,310 | |
| CFC total | CFC total | | 652,737 | | | 2,966,409 | | | 2,749,475 | | | 2,178,690 | | | 1,998,820 | | | 17,793,722 | | | 2,996,586 | | | 31,336,439 | | | 30,755,051 | | CFC total | | 1,533,689 | | | 2,950,387 | | | 2,723,047 | | | 2,162,195 | | | 1,981,339 | | | 17,528,440 | | | 2,871,908 | | | 31,751,005 | | | 30,755,051 | |
| NCSC | NCSC | | 3,000 | | | 264,868 | | | 23,838 | | | 5,489 | | | 190,849 | | | 271,951 | | | 163,452 | | | 923,447 | | | 956,874 | | NCSC | | 9,771 | | | 264,322 | | | 17,962 | | | 5,298 | | | 188,417 | | | 266,545 | | | 194,328 | | | 946,643 | | | 956,874 | |
| RTFC | RTFC | | 55,204 | | | 50,703 | | | 81,879 | | | 72,164 | | | 37,300 | | | 196,746 | | | 41,513 | | | 535,509 | | | 484,196 | | RTFC | | 62,082 | | | 49,403 | | | 79,353 | | | 69,294 | | | 35,824 | | | 193,838 | | | 52,918 | | | 542,712 | | | 484,196 | |
| Total pass | Total pass | | $ | 710,941 | | | $ | 3,281,980 | | | $ | 2,855,192 | | | $ | 2,256,343 | | | $ | 2,226,969 | | | $ | 18,262,419 | | | $ | 3,201,551 | | | $ | 32,795,395 | | | $ | 32,196,121 | | Total pass | | $ | 1,605,542 | | | $ | 3,264,112 | | | $ | 2,820,362 | | | $ | 2,236,787 | | | $ | 2,205,580 | | | $ | 17,988,823 | | | $ | 3,119,154 | | | $ | 33,240,360 | | | $ | 32,196,121 | |
| | Special mention | Special mention | | Special mention | |
| CFC: | CFC: | | CFC: | |
| Distribution | Distribution | | $ | — | | | $ | 4,213 | | | $ | — | | | $ | 4,746 | | | $ | — | | | $ | 17,000 | | | $ | 160,913 | | | $ | 186,872 | | | $ | 194,369 | | Distribution | | $ | — | | | $ | 4,199 | | | $ | — | | | $ | 4,717 | | | $ | — | | | $ | 16,785 | | | $ | 173,380 | | | $ | 199,081 | | | $ | 194,369 | |
| Statewide and
associate | Statewide and
associate | | — | | | — | | | — | | | — | | | — | | | 12,772 | | | — | | | 12,772 | | | 13,058 | | Statewide and
associate | | — | | | — | | | — | | | — | | | — | | | 12,482 | | | — | | | 12,482 | | | 13,058 | |
| CFC total | CFC total | | — | | | 4,213 | | | — | | | 4,746 | | | — | | | 29,772 | | | 160,913 | | | 199,644 | | | 207,427 | | CFC total | | — | | | 4,199 | | | — | | | 4,717 | | | — | | | 29,267 | | | 173,380 | | | 211,563 | | | 207,427 | |
| RTFC | RTFC | | — | | | — | | | — | | | — | | | — | | | 3,467 | | | — | | | 3,467 | | | 3,592 | | RTFC | | — | | | — | | | — | | | — | | | — | | | 3,328 | | | — | | | 3,328 | | | 3,592 | |
| Total special mention | Total special mention | | $ | — | | | $ | 4,213 | | | $ | — | | | $ | 4,746 | | | $ | — | | | $ | 33,239 | | | $ | 160,913 | | | $ | 203,111 | | | $ | 211,019 | | Total special mention | | $ | — | | | $ | 4,199 | | | $ | — | | | $ | 4,717 | | | $ | — | | | $ | 32,595 | | | $ | 173,380 | | | $ | 214,891 | | | $ | 211,019 | |
| | Substandard | Substandard | | Substandard | |
| | Total substandard | Total substandard | | $ | — | | | $ | — | | | $ | — | | | $ | — | | | $ | — | | | $ | — | | | $ | — | | | $ | — | | | $ | — | | Total substandard | | $ | — | | | $ | — | | | $ | — | | | $ | — | | | $ | — | | | $ | — | | | $ | — | | | $ | — | | | $ | — | |
| | Doubtful | Doubtful | | Doubtful | |
| CFC: | CFC: | | CFC: | |
| Power supply | Power supply | | $ | — | | | $ | — | | | $ | — | | | $ | — | | | $ | — | | | $ | 84,987 | | | $ | — | | | $ | 84,987 | | | $ | 112,209 | | Power supply | | $ | — | | | $ | — | | | $ | — | | | $ | — | | | $ | — | | | $ | 84,987 | | | $ | — | | | $ | 84,987 | | | $ | 112,209 | |
| | Total doubtful | Total doubtful | | $ | — | | | $ | — | | | $ | — | | | $ | — | | | $ | — | | | $ | 84,987 | | | $ | — | | | $ | 84,987 | | | $ | 112,209 | | Total doubtful | | $ | — | | | $ | — | | | $ | — | | | $ | — | | | $ | — | | | $ | 84,987 | | | $ | — | | | $ | 84,987 | | | $ | 112,209 | |
| | Total criticized loans | Total criticized loans | | $ | — | | | $ | 4,213 | | | $ | — | | | $ | 4,746 | | | $ | — | | | $ | 118,226 | | | $ | 160,913 | | | $ | 288,098 | | | $ | 323,228 | | Total criticized loans | | $ | — | | | $ | 4,199 | | | $ | — | | | $ | 4,717 | | | $ | — | | | $ | 117,582 | | | $ | 173,380 | | | $ | 299,878 | | | $ | 323,228 | |
| Total loans outstanding | Total loans outstanding | | $ | 710,941 | | | $ | 3,286,193 | | | $ | 2,855,192 | | | $ | 2,261,089 | | | $ | 2,226,969 | | | $ | 18,380,645 | | | $ | 3,362,464 | | | $ | 33,083,493 | | | $ | 32,519,349 | | Total loans outstanding | | $ | 1,605,542 | | | $ | 3,268,311 | | | $ | 2,820,362 | | | $ | 2,241,504 | | | $ | 2,205,580 | | | $ | 18,106,405 | | | $ | 3,292,534 | | | $ | 33,540,238 | | | $ | 32,519,349 | |
|
Criticized loans totaled $288$300 million and $323 million as of August 31,November 30, 2023 and May 31, 2023, respectively, and represented approximately 1% of total loans outstanding as of each respective date. The decrease of $35$23 million in criticized loans was primarily due to loan payments received from aBrazos and Brazos Sandy Creek in the doubtful category, partially offset by an increase in loans outstanding for one CFC electric distribution borrower in the special mention category and from Brazos and Brazos Sandy Creek in the doubtful category during the three months ended August 31, 2023YTD FY2024. Each of the borrowers with loans outstanding in the criticized category was current with regard to all principal and interest amounts due to us as of August 31,November 30, 2023. In contrast, each of the borrowers with loans outstanding in the criticized category, with the exception of Brazos Sandy Creek, was current with regard to all principal and interest amounts due to us as of May 31, 2023.
Special Mention
One CFC electric distribution borrower with loans outstanding of $187$199 million and $194 million as of August 31,November 30, 2023 and May 31, 2023, respectively, accounted for the substantial majority of loans in the special mention loan category amount of
NATIONAL RURAL UTILITIES COOPERATIVE FINANCE CORPORATION
NOTES TO CONSOLIDATED FINANCIAL STATEMENTS
(UNAUDITED)
$203of $215 million and $211 million as of each respective date. This borrower experienced an adverse financial impact from restoration costs incurred to repair damage caused by two successive hurricanes. We expect that the borrower will continue to receive grant funds from the Federal Emergency Management Agency and the state where it is located for the full reimbursement of the hurricane damage-related restoration costs.
Substandard
We did not have any loans classified as substandard as of August 31,November 30, 2023 or May 31, 2023.
Doubtful
We had loansone loan outstanding classified as doubtful totaling $85 million as of August 31,November 30, 2023 to a CFC electric power supply borrower. We had loans outstanding classified as doubtful totaling $112 million as of May 31, 2023, consisting of an $85 million loansloan outstanding to a CFC electric power supply borrower and $27 million of loans outstanding to Brazos and Brazos Sandy Creek. See “Troubled Debt Restructurings—Prior to the Adoption of ASU 2022-02” and “Nonperforming Loans” above for additional information on these loans.
Unadvanced Loan Commitments
Unadvanced loan commitments represent approved and executed loan contracts for which funds have not been advanced to borrowers. The following table presents unadvanced loan commitments, by member class and by loan type, as of August 31,November 30, 2023 and May 31, 2023.
Table 4.7: Unadvanced Commitments by Member Class and Loan Type(1)
| | (Dollars in thousands) | (Dollars in thousands) | | August 31, 2023 | | May 31, 2023 | (Dollars in thousands) | | November 30, 2023 | | May 31, 2023 |
| Member class: | Member class: | | | | | Member class: | | | | |
| CFC: | CFC: | | CFC: | |
| Distribution | Distribution | | $ | 9,803,363 | | | $ | 9,673,712 | | Distribution | | $ | 10,446,109 | | | $ | 9,673,712 | |
| Power supply | Power supply | | 3,995,643 | | | 3,995,128 | | Power supply | | 4,136,648 | | | 3,995,128 | |
| Statewide and associate | Statewide and associate | | 157,100 | | | 175,150 | | Statewide and associate | | 186,100 | | | 175,150 | |
| Total CFC | Total CFC | | 13,956,106 | | | 13,843,990 | | Total CFC | | 14,768,857 | | | 13,843,990 | |
| NCSC | NCSC | | 633,895 | | | 604,436 | | NCSC | | 640,971 | | | 604,436 | |
| RTFC | RTFC | | 374,920 | | | 340,135 | | RTFC | | 354,946 | | | 340,135 | |
| Total unadvanced commitments | Total unadvanced commitments | | $ | 14,964,921 | | | $ | 14,788,561 | | Total unadvanced commitments | | $ | 15,764,774 | | | $ | 14,788,561 | |
| | Loan type:(2) | Loan type:(2) | | | | | Loan type:(2) | | | | |
| Long-term loans: | Long-term loans: | | Long-term loans: | |
| Fixed rate | Fixed rate | | $ | — | | | $ | — | | Fixed rate | | $ | — | | | $ | — | |
| Variable rate | Variable rate | | 5,796,421 | | | 5,669,634 | | Variable rate | | 6,272,525 | | | 5,669,634 | |
| | Total long-term loans | Total long-term loans | | 5,796,421 | | | 5,669,634 | | Total long-term loans | | 6,272,525 | | | 5,669,634 | |
| Lines of credit | Lines of credit | | 9,168,500 | | | 9,118,927 | | Lines of credit | | 9,492,249 | | | 9,118,927 | |
| Total unadvanced commitments | Total unadvanced commitments | | $ | 14,964,921 | | | $ | 14,788,561 | | Total unadvanced commitments | | $ | 15,764,774 | | | $ | 14,788,561 | |
|
____________________________
(1)Excludes the portion of any commitment to advance funds under swingline loan facilities in excess of CFC’s total commitment amount in a syndicated credit facility. Other syndicate lenders have an absolute obligation to acquire participations in such swingline loans upon CFC’s election, including during a default by the borrower.
(2)The interest rate on unadvanced loan commitments is not set until an advance is made; therefore, all unadvanced long-term loan commitments are reported as variable rate. However, the borrower may select either a fixed or a variable rate when an advance is drawn under a loan commitment.
NATIONAL RURAL UTILITIES COOPERATIVE FINANCE CORPORATION
NOTES TO CONSOLIDATED FINANCIAL STATEMENTS
(UNAUDITED)
The following table displays, by loan type, the available balance under unadvanced loan commitments as of August 31,November 30, 2023, and the related maturities in each fiscal year during the five-year period ended May 31, 2028, and thereafter.
Table 4.8: Unadvanced Loan Commitments
| | | | | Available
Balance | | Notional Maturities of Unadvanced Loan Commitments | | | Available
Balance | | Notional Maturities of Unadvanced Loan Commitments |
| (Dollars in thousands) | (Dollars in thousands) | | 2024 | | 2025 | | 2026 | | 2027 | | 2028 | | Thereafter | (Dollars in thousands) | | 2024 | | 2025 | | 2026 | | 2027 | | 2028 | | Thereafter |
| Line of credit loans | Line of credit loans | | $ | 9,168,500 | | | $ | 758,854 | | | $ | 5,172,684 | | | $ | 837,114 | | | $ | 1,199,718 | | | $ | 636,387 | | | $ | 563,743 | | Line of credit loans | | $ | 9,492,249 | | | $ | 617,272 | | | $ | 4,661,131 | | | $ | 1,262,133 | | | $ | 1,376,869 | | | $ | 803,646 | | | $ | 771,198 | |
| Long-term loans | Long-term loans | | 5,796,421 | | | 877,539 | | | 694,623 | | | 706,646 | | | 1,301,246 | | | 1,684,716 | | | 531,651 | | Long-term loans | | 6,272,525 | | | 572,527 | | | 834,572 | | | 759,597 | | | 1,278,472 | | | 1,634,216 | | | 1,193,141 | |
| Total | Total | | $ | 14,964,921 | | | $ | 1,636,393 | | | $ | 5,867,307 | | | $ | 1,543,760 | | | $ | 2,500,964 | | | $ | 2,321,103 | | | $ | 1,095,394 | | Total | | $ | 15,764,774 | | | $ | 1,189,799 | | | $ | 5,495,703 | | | $ | 2,021,730 | | | $ | 2,655,341 | | | $ | 2,437,862 | | | $ | 1,964,339 | |
Unadvanced line of credit commitments accounted for 61%60% of total unadvanced loan commitments as of August 31,November 30, 2023, while unadvanced long-term loan commitments accounted for 39%40% of total unadvanced loan commitments. Unadvanced line of credit commitments are typically revolving facilities for periods not to exceed five years and generally serve as supplemental back-up liquidity to our borrowers. Historically, borrowers have not drawn the full commitment amount for line of credit facilities, and we have experienced a very low utilization rate on line of credit loan facilities regardless of whether or not we are obligated to fund the facility when a material adverse change has occurred.
Our unadvanced long-term loan commitments typically have a five-year draw period under which a borrower may draw funds prior to the expiration of the commitment. We expect that the majority of the long-term unadvanced loan commitments of $5,796$6,273 million will be advanced prior to the expiration of the commitment.
Because we historically have experienced a very low utilization rate on line of credit loan facilities, which account for the majority of our total unadvanced loan commitments, we believe the unadvanced loan commitment total of $14,965$15,765 million as of August 31,November 30, 2023 is not necessarily representative of our future funding requirements.
Unadvanced Loan Commitments—Conditional
The substantial majority of our line of credit commitments and all of our unadvanced long-term loan commitments include material adverse change clauses. Unadvanced loan commitments subject to material adverse change clauses totaled $11,817$12,496 million and $11,617 million as of August 31,November 30, 2023 and May 31, 2023, respectively. Prior to making an advance on these facilities, we confirm that there has been no material adverse change in the business or condition, financial or otherwise, of the borrower since the time the loan was approved and confirm that the borrower is currently in compliance with loan terms and conditions. In some cases, the borrower’s access to the full amount of the facility is further constrained by the designated purpose, imposition of borrower-specific restrictions or by additional conditions that must be met prior to advancing funds.
Unadvanced Loan Commitments—Unconditional
Unadvanced loan commitments not subject to material adverse change clauses at the time of each advance consisted of unadvanced committed lines of credit totaling $3,148$3,269 million and $3,172 million as of August 31,November 30, 2023 and May 31, 2023, respectively. We are required to advance amounts on these committed facilities as long as the borrower is in compliance with the terms and conditions of the facility. The following table summarizes the available balance under unconditional committed lines of credit as of August 31,November 30, 2023, and the related maturity amounts in each fiscal year during the five-year period ending May 31, 2028, and thereafter.
NATIONAL RURAL UTILITIES COOPERATIVE FINANCE CORPORATION
NOTES TO CONSOLIDATED FINANCIAL STATEMENTS
(UNAUDITED)
Table 4.9: Unconditional Committed Lines of Credit—Available Balance
| | | | | Available
Balance | | Notional Maturities of Unconditional Committed Lines of Credit | | | Available
Balance | | Notional Maturities of Unconditional Committed Lines of Credit |
| (Dollars in thousands) | (Dollars in thousands) | | 2024 | | 2025 | | 2026 | | 2027 | | 2028 | | Thereafter | (Dollars in thousands) | | 2024 | | 2025 | | 2026 | | 2027 | | 2028 | | Thereafter |
| Committed lines of credit | Committed lines of credit | | $ | 3,148,266 | | | $ | 160,500 | | | $ | 486,002 | | | $ | 539,800 | | | $ | 864,900 | | | $ | 688,665 | | | $ | 408,399 | | Committed lines of credit | | $ | 3,268,639 | | | $ | 133,389 | | | $ | 408,630 | | | $ | 534,700 | | | $ | 929,846 | | | $ | 719,656 | | | $ | 542,418 | |
Pledged Collateral—Loans
We are required to pledge eligible mortgage notes or other collateral in an amount at least equal to the outstanding balance of our secured debt. Table 4.10 displays the borrowing amount under each of our secured borrowing agreements and the corresponding loans outstanding pledged as collateral as of August 31,November 30, 2023 and May 31, 2023. See “Note 6—Short-Term Borrowings” and “Note 7—Long-Term Debt” for information on our secured borrowings and other borrowings.
Table 4.10: Pledged Loans
| | (Dollars in thousands) | (Dollars in thousands) | | August 31, 2023 | | May 31, 2023 | (Dollars in thousands) | | November 30, 2023 | | May 31, 2023 |
| Collateral trust bonds: | Collateral trust bonds: | | | | | Collateral trust bonds: | | | | |
| 2007 indenture: | 2007 indenture: | | | | | 2007 indenture: | | | | |
| Collateral trust bonds outstanding | Collateral trust bonds outstanding | | $ | 7,772,711 | | | $ | 7,772,711 | | Collateral trust bonds outstanding | | $ | 7,372,711 | | | $ | 7,772,711 | |
| Pledged collateral: | Pledged collateral: | | Pledged collateral: | |
| Distribution system mortgage notes pledged | Distribution system mortgage notes pledged | | 8,623,311 | | | 8,719,287 | | Distribution system mortgage notes pledged | | 9,017,741 | | | 8,719,287 | |
| RUS-guaranteed loans qualifying as permitted investments pledged | RUS-guaranteed loans qualifying as permitted investments pledged | | 120,554 | | | 122,874 | | RUS-guaranteed loans qualifying as permitted investments pledged | | 118,360 | | | 122,874 | |
| Total pledged collateral | Total pledged collateral | | 8,743,865 | | | 8,842,161 | | Total pledged collateral | | 9,136,101 | | | 8,842,161 | |
| | 1994 indenture: | 1994 indenture: | | | | | 1994 indenture: | | | | |
| Collateral trust bonds outstanding | Collateral trust bonds outstanding | | $ | 20,000 | | | $ | 20,000 | | Collateral trust bonds outstanding | | $ | 15,000 | | | $ | 20,000 | |
| Pledged collateral: | Pledged collateral: | | Pledged collateral: | |
| Distribution system mortgage notes pledged | Distribution system mortgage notes pledged | | 22,278 | | | 22,900 | | Distribution system mortgage notes pledged | | 21,650 | | | 22,900 | |
| | Guaranteed Underwriter Program: | Guaranteed Underwriter Program: | | Guaranteed Underwriter Program: | |
| Notes payable outstanding | Notes payable outstanding | | $ | 6,670,146 | | | $ | 6,720,643 | | Notes payable outstanding | | $ | 6,894,611 | | | $ | 6,720,643 | |
| Pledged collateral: | Pledged collateral: | | Pledged collateral: | |
| Distribution and power supply system mortgage notes pledged | Distribution and power supply system mortgage notes pledged | | 7,804,512 | | | 7,877,558 | | Distribution and power supply system mortgage notes pledged | | 7,719,308 | | | 7,877,558 | |
| | Farmer Mac: | Farmer Mac: | | | | | Farmer Mac: | | | | |
| Notes payable outstanding | Notes payable outstanding | | $ | 3,625,953 | | | $ | 3,149,898 | | Notes payable outstanding | | $ | 3,901,908 | | | $ | 3,149,898 | |
| Pledged collateral: | Pledged collateral: | | Pledged collateral: | |
| Distribution and power supply system mortgage notes pledged | Distribution and power supply system mortgage notes pledged | | 4,227,149 | | | 4,294,282 | | Distribution and power supply system mortgage notes pledged | | 4,560,436 | | | 4,294,282 | |
| | Clean Renewable Energy Bonds Series 2009A: | Clean Renewable Energy Bonds Series 2009A: | | | | | Clean Renewable Energy Bonds Series 2009A: | | | | |
| Notes payable outstanding | Notes payable outstanding | | $ | 1,098 | | | $ | 1,098 | | Notes payable outstanding | | $ | 1,098 | | | $ | 1,098 | |
| Pledged collateral: | Pledged collateral: | | Pledged collateral: | |
| Distribution and power supply system mortgage notes pledged | Distribution and power supply system mortgage notes pledged | | 603 | | | 1,029 | | Distribution and power supply system mortgage notes pledged | | 90 | | | 1,029 | |
| Cash | Cash | | 780 | | | 391 | | Cash | | 1,171 | | | 391 | |
| Total pledged collateral | Total pledged collateral | | 1,383 | | | 1,420 | | Total pledged collateral | | 1,261 | | | 1,420 | |
NATIONAL RURAL UTILITIES COOPERATIVE FINANCE CORPORATION
NOTES TO CONSOLIDATED FINANCIAL STATEMENTS
(UNAUDITED)
| | |
| NOTE 5—ALLOWANCE FOR CREDIT LOSSES |
We are required to maintain an allowance based on a current estimate of credit losses that are expected to occur over the remaining term of the loans in our portfolio. Our allowance for credit losses consists of a collective allowance and an asset-specific allowance. The collective allowance is established for loans in our portfolio that share similar risk characteristics and are therefore evaluated on a collective, or pool, basis in measuring expected credit losses. The asset-specific allowance is established for loans in our portfolio that do not share similar risk characteristics with other loans in our portfolio and are therefore evaluated on an individual basis in measuring expected credit losses.
Allowance for Credit Losses—Loan Portfolio
The following tables summarize, by legal entity and member class, changes in the allowance for credit losses for our loan portfolio for the three months ended August 31, 2023 and 2022.portfolio.
Table 5.1: Changes in Allowance for Credit Losses
| | | | | | | | | | | | | | | | | | | | | | | | | | | | | | | | | | | | | | | | | | | | | | |
| | | Three Months Ended August 31, 2023 | | |
| (Dollars in thousands) | | CFC Distribution | | CFC Power Supply | | CFC Statewide & Associate | | CFC Total | | NCSC | | RTFC | | Total | | |
| Balance as of May 31, 2023 | | $ | 14,924 | | | $ | 33,306 | | | $ | 1,194 | | | $ | 49,424 | | | $ | 2,464 | | | $ | 1,206 | | | $ | 53,094 | | | |
| | | | | | | | | | | | | | | | |
| | | | | | | | | | | | | | | | |
| Provision for credit losses | | 798 | | | (904) | | | 4 | | | (102) | | | 148 | | | 754 | | | 800 | | | |
| | | | | | | | | | | | | | | | |
| Recoveries | | — | | | 1,032 | | | — | | | 1,032 | | | — | | | — | | | 1,032 | | | |
| Balance as of August 31, 2023 | | $ | 15,722 | | | $ | 33,434 | | | $ | 1,198 | | | $ | 50,354 | | | $ | 2,612 | | | $ | 1,960 | | | $ | 54,926 | | | |
| | | | | | | | | | | | | | | | | | | | | | | | | | | | | | | | | | | | | | | | | | | | | | |
| | | Q2 FY2024 | | |
| (Dollars in thousands) | | CFC Distribution | | CFC Power Supply | | CFC Statewide & Associate | | CFC Total | | NCSC | | RTFC | | Total | | |
| Balance as of August 31, 2023 | | $ | 15,722 | | | $ | 33,434 | | | $ | 1,198 | | | $ | 50,354 | | | $ | 2,612 | | | $ | 1,960 | | | $ | 54,926 | | | |
| | | | | | | | | | | | | | | | |
| | | | | | | | | | | | | | | | |
| Provision (benefit) for credit losses | | 315 | | | (122) | | | 73 | | | 266 | | | 329 | | | 33 | | | 628 | | | |
| | | | | | | | | | | | | | | | |
| | | | | | | | | | | | | | | | |
| Balance as of November 30, 2023 | | $ | 16,037 | | | $ | 33,312 | | | $ | 1,271 | | | $ | 50,620 | | | $ | 2,941 | | | $ | 1,993 | | | $ | 55,554 | | | |
| | | | | Three Months Ended August 31, 2022 | | | Q2 FY2023 | |
| (Dollars in thousands) | (Dollars in thousands) | | CFC Distribution | | CFC Power Supply | | CFC Statewide & Associate | | CFC Total | | NCSC | | RTFC | | Total | (Dollars in thousands) | | CFC Distribution | | CFC Power Supply | | CFC Statewide & Associate | | CFC Total | | NCSC | | RTFC | | Total | |
| Balance as of May 31, 2022 | | $ | 15,781 | | | $ | 47,793 | | | $ | 1,251 | | | $ | 64,825 | | | $ | 1,449 | | | $ | 1,286 | | | $ | 67,560 | | |
| Balance as of August 31, 2022 | | Balance as of August 31, 2022 | | $ | 16,412 | | | $ | 50,343 | | | $ | 1,319 | | | $ | 68,074 | | | $ | 1,565 | | | $ | 1,417 | | | $ | 71,056 | | |
| | Provision for credit losses | | 631 | | | 2,550 | | | 68 | | | 3,249 | | | 116 | | | 131 | | | 3,496 | | |
| Provision (benefit) for credit losses | | Provision (benefit) for credit losses | | 609 | | | 10,015 | | | (30) | | | 10,594 | | | 946 | | | 88 | | | 11,628 | | |
| Charge-offs | | Charge-offs | | — | | | (15,069) | | | — | | | (15,069) | | | — | | | — | | | (15,069) | | |
| | Balance as of August 31, 2022 | | $ | 16,412 | | | $ | 50,343 | | | $ | 1,319 | | | $ | 68,074 | | | $ | 1,565 | | | $ | 1,417 | | | $ | 71,056 | | |
| Balance as of November 30, 2022 | | Balance as of November 30, 2022 | | $ | 17,021 | | | $ | 45,289 | | | $ | 1,289 | | | $ | 63,599 | | | $ | 2,511 | | | $ | 1,505 | | | $ | 67,615 | | |
The following tables present, by legal entity and member class, the components of our allowance for credit losses as of August 31, 2023 and May 31, 2023. | | | | | | | | | | | | | | | | | | | | | | | | | | | | | | | | | | | | | | | | | | | | | | |
| | | YTD FY2024 | | |
| (Dollars in thousands) | | CFC Distribution | | CFC Power Supply | | CFC Statewide & Associate | | CFC Total | | NCSC | | RTFC | | Total | | |
| Balance as of May 31, 2023 | | $ | 14,924 | | | $ | 33,306 | | | $ | 1,194 | | | $ | 49,424 | | | $ | 2,464 | | | $ | 1,206 | | | $ | 53,094 | | | |
| | | | | | | | | | | | | | | | |
| | | | | | | | | | | | | | | | |
| Provision (benefit) for credit losses | | 1,113 | | | (1,026) | | | 77 | | | 164 | | | 477 | | | 787 | | | 1,428 | | | |
| | | | | | | | | | | | | | | | |
| Recoveries | | — | | | 1,032 | | | — | | | 1,032 | | | — | | | — | | | 1,032 | | | |
| Balance as of November 30, 2023 | | $ | 16,037 | | | $ | 33,312 | | | $ | 1,271 | | | $ | 50,620 | | | $ | 2,941 | | | $ | 1,993 | | | $ | 55,554 | | | |
NATIONAL RURAL UTILITIES COOPERATIVE FINANCE CORPORATION
NOTES TO CONSOLIDATED FINANCIAL STATEMENTS
(UNAUDITED)
| | | | | | | | | | | | | | | | | | | | | | | | | | | | | | | | | | | | | | | | | | | | |
| | | YTD FY2023 |
| (Dollars in thousands) | | CFC Distribution | | CFC Power Supply | | CFC Statewide & Associate | | CFC Total | | NCSC | | RTFC | | Total |
| Balance as of May 31, 2022 | | $ | 15,781 | | | $ | 47,793 | | | $ | 1,251 | | | $ | 64,825 | | | $ | 1,449 | | | $ | 1,286 | | | $ | 67,560 | |
| | | | | | | | | | | | | | |
| | | | | | | | | | | | | | |
| Provision for credit losses | | 1,240 | | | 12,565 | | | 38 | | | 13,843 | | | 1,062 | | | 219 | | | 15,124 | |
| Charge-offs | | — | | | (15,069) | | | — | | | (15,069) | | | — | | | — | | | (15,069) | |
| | | | | | | | | | | | | | |
| Balance as of November 30, 2022 | | $ | 17,021 | | | $ | 45,289 | | | $ | 1,289 | | | $ | 63,599 | | | $ | 2,511 | | | $ | 1,505 | | | $ | 67,615 | |
(UNAUDITED)The following tables present, by legal entity and member class, the components of our allowance for credit losses as of November 30, 2023 and May 31, 2023.
Table 5.2: Allowance for Credit Losses Components
| | | | | August 31, 2023 | | | November 30, 2023 |
| (Dollars in thousands) | (Dollars in thousands) | | CFC Distribution | | CFC Power Supply | | CFC Statewide & Associate | | CFC Total | | NCSC | | RTFC | | Total | (Dollars in thousands) | | CFC Distribution | | CFC Power Supply | | CFC Statewide & Associate | | CFC Total | | NCSC | | RTFC | | Total |
| Allowance components: | Allowance components: | | | | | | | | | | | | | | | Allowance components: | | | | | | | | | | | | | | |
| Collective allowance | Collective allowance | | $ | 15,722 | | $ | 8,585 | | $ | 1,198 | | $ | 25,505 | | $ | 2,612 | | $ | 1,675 | | $ | 29,792 | Collective allowance | | $ | 16,037 | | $ | 8,820 | | $ | 1,271 | | $ | 26,128 | | $ | 2,941 | | $ | 1,693 | | $ | 30,762 |
| Asset-specific allowance | Asset-specific allowance | | — | | 24,849 | | — | | 24,849 | | — | | 285 | | 25,134 | Asset-specific allowance | | — | | 24,492 | | — | | 24,492 | | — | | 300 | | 24,792 |
| Total allowance for credit losses | Total allowance for credit losses | | $ | 15,722 | | $ | 33,434 | | $ | 1,198 | | $ | 50,354 | | $ | 2,612 | | $ | 1,960 | | $ | 54,926 | Total allowance for credit losses | | $ | 16,037 | | $ | 33,312 | | $ | 1,271 | | $ | 50,620 | | $ | 2,941 | | $ | 1,993 | | $ | 55,554 |
| Loans outstanding:(1) | Loans outstanding:(1) | | | | | | | | | Loans outstanding:(1) | | | | | | | | |
| Collectively evaluated loans | Collectively evaluated loans | | $ | 25,814,015 | | $ | 5,485,567 | | $ | 232,292 | | $ | 31,531,874 | | $ | 923,447 | | $ | 535,509 | | $ | 32,990,830 | Collectively evaluated loans | | $ | 26,037,463 | | $ | 5,652,610 | | $ | 268,286 | | $ | 31,958,359 | | $ | 946,643 | | $ | 542,712 | | $ | 33,447,714 |
| Individually evaluated loans | Individually evaluated loans | | 4,209 | | 84,987 | | — | | 89,196 | | — | | 3,467 | | 92,663 | Individually evaluated loans | | 4,209 | | 84,987 | | — | | 89,196 | | — | | 3,328 | | 92,524 |
| Total loans outstanding | Total loans outstanding | | $ | 25,818,224 | | $ | 5,570,554 | | $ | 232,292 | | $ | 31,621,070 | | $ | 923,447 | | $ | 538,976 | | $ | 33,083,493 | Total loans outstanding | | $ | 26,041,672 | | $ | 5,737,597 | | $ | 268,286 | | $ | 32,047,555 | | $ | 946,643 | | $ | 546,040 | | $ | 33,540,238 |
|
| | Allowance coverage ratios: | Allowance coverage ratios: | | Allowance coverage ratios: | |
Collective allowance coverage ratio(2) | Collective allowance coverage ratio(2) | | 0.06 | % | | 0.16 | % | | 0.52 | % | | 0.08 | % | | 0.28 | % | | 0.31 | % | | 0.09 | % | Collective allowance coverage ratio(2) | | 0.06 | % | | 0.16 | % | | 0.47 | % | | 0.08 | % | | 0.31 | % | | 0.31 | % | | 0.09 | % |
Asset-specific allowance coverage ratio(3) | Asset-specific allowance coverage ratio(3) | | — | | | 29.24 | | | — | | | 27.86 | | | — | | | 8.22 | | | 27.12 | | Asset-specific allowance coverage ratio(3) | | — | | | 28.82 | | | — | | | 27.46 | | | — | | | 9.01 | | | 26.80 | |
Total allowance coverage ratio(4) | Total allowance coverage ratio(4) | | 0.06 | | | 0.60 | | | 0.52 | | | 0.16 | | | 0.28 | | | 0.36 | | | 0.17 | | Total allowance coverage ratio(4) | | 0.06 | | | 0.58 | | | 0.47 | | | 0.16 | | | 0.31 | | | 0.36 | | | 0.17 | |
NATIONAL RURAL UTILITIES COOPERATIVE FINANCE CORPORATION
NOTES TO CONSOLIDATED FINANCIAL STATEMENTS
(UNAUDITED)
| | | | | | | | | | | | | | | | | | | | | | | | | | | | | | | | | | | | | | | | | | | | |
| | | May 31, 2023 |
| (Dollars in thousands) | | CFC Distribution | | CFC Power Supply | | CFC Statewide & Associate | | CFC Total | | NCSC | | RTFC | | Total |
| Allowance components: | | | | | | | | | | | | | | |
| Collective allowance | | $ | 14,924 | | $ | 7,837 | | $ | 1,194 | | $ | 23,955 | | $ | 2,464 | | $ | 916 | | $ | 27,335 |
| Asset-specific allowance | | — | | 25,469 | | — | | 25,469 | | — | | 290 | | 25,759 |
| Total allowance for credit losses | | $ | 14,924 | | $ | 33,306 | | $ | 1,194 | | $ | 49,424 | | $ | 2,464 | | $ | 1,206 | | $ | 53,094 |
| | | | | | | | | | | | | | |
Loans outstanding:(1) | | | | | | | | | | | | | | |
| Collectively evaluated loans | | $ | 25,432,439 | | $ | 5,325,033 | | $ | 200,368 | | $ | 30,957,840 | | | $ | 956,874 | | | $ | 484,196 | | | $ | 32,398,910 | |
| Individually evaluated loans | | 4,638 | | 112,209 | | — | | 116,847 | | — | | 3,592 | | 120,439 |
| Total loans outstanding | | $ | 25,437,077 | | $ | 5,437,242 | | $ | 200,368 | | $ | 31,074,687 | | $ | 956,874 | | | $ | 487,788 | | | $ | 32,519,349 |
| | | | | | | | | | | | | | |
| | | | | | | | | | | | | | |
| | | | | | | | | | | | | | |
| | | | | | | | | | | | | | |
| | | | | | | | | | | | | | |
| | | | | | | | | | | | | | |
| | | | | | | | | | | | | | | | | | | | | | | | | | | | | | | | | | | | | | | | | | | | |
| Allowance coverage ratios: | | | | | | | | | | | | | | |
Collective allowance coverage ratio(2) | | 0.06 | % | | 0.15 | % | | 0.60 | % | | 0.08 | % | | 0.26 | % | | 0.19 | % | | 0.08 | % |
Asset-specific allowance coverage ratio(3) | | — | | | 22.70 | | | — | | | 21.80 | | | — | | | 8.07 | | | 21.39 | |
Total allowance coverage ratio(4) | | 0.06 | | | 0.61 | | | 0.60 | | | 0.16 | | | 0.26 | | | 0.25 | | | 0.16 | |
____________________________
(1)Represents the unpaid principal amount of loans as of the end of each period. Excludes unamortized deferred loan origination costs of $13 million as of both August 31,November 30, 2023 and May 31, 2023.
(2)Calculated based on the collective allowance component at period end divided by collectively evaluated loans outstanding at period end.
(3)Calculated based on the asset-specific allowance component at period end divided by individually evaluated loans outstanding at period end.
(4)Calculated based on the total allowance for credit losses at period end divided by total loans outstanding at period end.
NATIONAL RURAL UTILITIES COOPERATIVE FINANCE CORPORATION
NOTES TO CONSOLIDATED FINANCIAL STATEMENTS
(UNAUDITED)
Our allowance for credit losses and allowance coverage ratio increased to $55$56 million and 0.17%, respectively, as of August 31,November 30, 2023, from $53 million and 0.16%, respectively, as of May 31, 2023. The $2$3 million increase in the allowance for credit losses reflected an increase in the collective allowance of $3$4 million, partially offset by a reduction in the asset-specific allowance of $1 million. The increase in the collective allowance was primarily due to loan portfolio growth and a slight decline in the overall credit quality and risk profile of our loan portfolio. The decrease in the asset-specific allowance was attributable to a timing change in the expected payments on a nonperforming CFC power supply loan.
Reserve for Credit Losses—Unadvanced Loan Commitments
In addition to the allowance for credit losses for our loan portfolio, we maintain an allowance for credit losses for unadvanced loan commitments, which we refer to as our reserve for credit losses because this amount is reported as a component of other liabilities on our consolidated balance sheets. We measure the reserve for credit losses for unadvanced loan commitments based on expected credit losses over the contractual period of our exposure to credit risk arising from our obligation to extend credit, unless that obligation is unconditionally cancellable by us. The reserve for credit losses related to our off-balance sheet exposure for unadvanced loan commitments was less than $1 million as of both August 31,November 30, 2023 and May 31, 2023.
NATIONAL RURAL UTILITIES COOPERATIVE FINANCE CORPORATION
NOTES TO CONSOLIDATED FINANCIAL STATEMENTS
(UNAUDITED)
| | |
| NOTE 6—SHORT-TERM BORROWINGS |
Short-term borrowings consist of borrowings with an original contractual maturity of one year or less and do not include the current portion of long-term debt. Our short-term borrowings totaled $5,124$5,162 million and accounted for 16% of total debt outstanding as of August 31,November 30, 2023, compared with $4,546 million and 15% of total debt outstanding as of May 31, 2023. The following table provides information on our short-term borrowings as of August 31,November 30, 2023 and May 31, 2023.
Table 6.1: Short-Term Borrowings Sources
| | | | | | | | | | | | | | | | | | | | | | | | | | |
| | | | | | | | |
| | August 31, 2023 | | May 31, 2023 |
| (Dollars in thousands) | | Amount | | % of Total Debt Outstanding | | Amount | | % of Total Debt Outstanding |
| Short-term borrowings: | | | | | | | | |
| Commercial paper: | | | | | | | | |
| Commercial paper dealers, net of discounts | | $ | 1,088,343 | | | 3 | % | | $ | 1,293,167 | | | 4 | % |
| Commercial paper members, at par | | 1,309,508 | | | 4 | | | 1,017,431 | | | 4 | |
| Total commercial paper | | 2,397,851 | | | 7 | | | 2,310,598 | | | 8 | |
| Select notes to members | | 1,550,697 | | | 5 | | | 1,630,799 | | | 5 | |
| Daily liquidity fund notes to members | | 265,832 | | | 1 | | | 238,329 | | | 1 | |
| Medium-term notes to members | | 409,955 | | | 1 | | | 366,549 | | | 1 | |
Farmer Mac notes payable (1) | | 500,000 | | | 2 | | | — | | | — | |
| | | | | | | | |
| Total short-term borrowings | | $ | 5,124,335 | | | 16 | % | | $ | 4,546,275 | | | 15 | % |
| | | | | | | | | | | | | | | | | | | | | | | | | | |
| | | | | | | | |
| | November 30, 2023 | | May 31, 2023 |
| (Dollars in thousands) | | Amount | | % of Total Debt Outstanding | | Amount | | % of Total Debt Outstanding |
| Short-term borrowings: | | | | | | | | |
| Commercial paper: | | | | | | | | |
| Commercial paper dealers, net of discounts | | $ | 1,038,638 | | | 3 | % | | $ | 1,293,167 | | | 4 | % |
| Commercial paper members, at par | | 1,312,659 | | | 4 | | | 1,017,431 | | | 4 | |
| Total commercial paper | | 2,351,297 | | | 7 | | | 2,310,598 | | | 8 | |
| Select notes to members | | 1,550,423 | | | 5 | | | 1,630,799 | | | 5 | |
| Daily liquidity fund notes to members | | 352,961 | | | 1 | | | 238,329 | | | 1 | |
| Medium-term notes to members | | 406,902 | | | 1 | | | 366,549 | | | 1 | |
Farmer Mac notes payable (1) | | 500,000 | | | 2 | | | — | | | — | |
| | | | | | | | |
| Total short-term borrowings | | $ | 5,161,583 | | | 16 | % | | $ | 4,546,275 | | | 15 | % |
____________________________
(1) Advanced under the revolving purchase agreement with Farmer Mac dated March 24, 2011. See “Note 7—Long-Term Debt” for additional information on this revolving note purchase agreement with Farmer Mac.
Committed Bank Revolving Line of Credit Agreements
The following table presents the amount available for access under our bank revolving line of credit agreements as of August 31,November 30, 2023.
Table 6.2: Committed Bank Revolving Line of Credit Agreements Available Amounts
| | | | | | | | | | | | | | | | | | | | | | | | | | | | | | | | |
| | November 30, 2023 | | | | |
| (Dollars in millions) | | Total Commitment | | Letters of Credit Outstanding | | Available Amount | | Maturity | | Annual Facility Fee (1) |
| Bank revolving agreements: | | | | | | | | | | |
| 3-year agreement | | $ | 150 | | | $ | — | | | $ | 150 | | | November 28, 2025 | | 7.5 bps |
| 3-year agreement | | 1,195 | | | — | | | 1,195 | | | November 28, 2026 | | 7.5 bps |
| Total 3-year agreement | | 1,345 | | | — | | | 1,345 | | | | | |
| 4-year agreement | | 150 | | | — | | | 150 | | | November 28, 2026 | | 10.0 bps |
| 4-year agreement | | 1,305 | | | 2 | | | 1,303 | | | November 28, 2027 | | 10.0 bps |
| Total 4-year agreement | | 1,455 | | | 2 | | | 1,453 | | | | | |
| Total | | $ | 2,800 | | | $ | 2 | | | $ | 2,798 | | | | | |
____________________________
(1) Facility fee determined by CFC’s senior unsecured credit ratings based on the pricing schedules put in place at the inception of the related agreement.
NATIONAL RURAL UTILITIES COOPERATIVE FINANCE CORPORATION
NOTES TO CONSOLIDATED FINANCIAL STATEMENTS
(UNAUDITED)
Table 6.2: Committed Bank Revolving LineOn November 20, 2023, we amended the three-year and four-year committed bank revolving line of Credit Agreements Available Amounts
| | | | | | | | | | | | | | | | | | | | | | | | | | | | | | | | |
| | August 31, 2023 | | | | |
| (Dollars in millions) | | Total Commitment | | Letters of Credit Outstanding | | Available Amount | | Maturity | | Annual Facility Fee (1) |
| Bank revolving agreements: | | | | | | | | | | |
| 3-year agreement | | $ | 1,245 | | | $ | — | | | $ | 1,245 | | | November 28, 2025 | | 7.5 bps |
| | | | | | | | | | |
| 4-year agreement | | 1,355 | | | 2 | | | 1,353 | | | November 28, 2026 | | 10.0 bps |
| | | | | | | | | | |
| Total | | $ | 2,600 | | | $ | 2 | | | $ | 2,598 | | | | | |
____________________________
(1) Facility fee determinedcredit agreements to extend the maturity dates to November 28, 2026 and November 28, 2027, respectively, and to include a $100 million swingline facility under each agreement. In connection with the amendments to the revolving line of credit agreements, commitments from the existing banks increased by CFC’s senior unsecured$100 million under each of the three-year and four-year revolving credit ratings based on the pricing schedules put in placeagreements. Commitments of $150 million under each agreement will expire at the inceptionprior maturity dates of the related agreement.
November 28, 2025 and November 28, 2026. The total commitment amount under the three-year facility and the four-year facility was $1,245$1,345 million and $1,355$1,455 million, respectively, resulting in a combined total commitment amount under the two facilities of $2,600$2,800 million. These agreements allow us to request up to $300 million of letters of credit, which, if requested, results in a reduction in the total amount available for our use. We were in compliance with all covenants and conditions under the agreements as of August 31,November 30, 2023.
The following table displays, by debt product type, long-term debt outstanding as of August 31,November 30, 2023 and May 31, 2023. Long-term debt outstanding totaled $23,874$24,640 million and accounted for 76%77% of total debt outstanding as of August 31,November 30, 2023, compared with $23,947 million and 77% of total debt outstanding as of May 31, 2023.
NATIONAL RURAL UTILITIES COOPERATIVE FINANCE CORPORATION
NOTES TO CONSOLIDATED FINANCIAL STATEMENTS
(UNAUDITED)
Table 7.1: Long-Term Debt by Debt Product Type
| | (Dollars in thousands) | (Dollars in thousands) | | August 31, 2023 | | May 31, 2023 | (Dollars in thousands) | | November 30, 2023 | | May 31, 2023 |
| Secured long-term debt: | Secured long-term debt: | | | | | Secured long-term debt: | | | | |
| Collateral trust bonds | Collateral trust bonds | | $ | 7,792,711 | | | $ | 7,792,711 | | Collateral trust bonds | | $ | 7,387,711 | | | $ | 7,792,711 | |
| Unamortized discount, net | Unamortized discount, net | | (175,836) | | | (178,832) | | Unamortized discount, net | | (172,767) | | | (178,832) | |
| Debt issuance costs | Debt issuance costs | | (34,701) | | | (35,906) | | Debt issuance costs | | (33,488) | | | (35,906) | |
| Total collateral trust bonds | Total collateral trust bonds | | 7,582,174 | | | 7,577,973 | | Total collateral trust bonds | | 7,181,456 | | | 7,577,973 | |
| Guaranteed Underwriter Program notes payable | Guaranteed Underwriter Program notes payable | | 6,670,146 | | | 6,720,643 | | Guaranteed Underwriter Program notes payable | | 6,894,611 | | | 6,720,643 | |
| Farmer Mac notes payable | Farmer Mac notes payable | | 3,125,953 | | | 3,149,898 | | Farmer Mac notes payable | | 3,401,908 | | | 3,149,898 | |
| Other secured notes payable | Other secured notes payable | | 1,098 | | | 1,098 | | Other secured notes payable | | 1,098 | | | 1,098 | |
| Debt issuance costs | Debt issuance costs | | (1) | | | (2) | | Debt issuance costs | | — | | | (2) | |
| Total other secured notes payable | Total other secured notes payable | | 1,097 | | | 1,096 | | Total other secured notes payable | | 1,098 | | | 1,096 | |
| Total secured notes payable | Total secured notes payable | | 9,797,196 | | | 9,871,637 | | Total secured notes payable | | 10,297,617 | | | 9,871,637 | |
| Total secured long-term debt | Total secured long-term debt | | 17,379,370 | | | 17,449,610 | | Total secured long-term debt | | 17,479,073 | | | 17,449,610 | |
| Unsecured long-term debt: | Unsecured long-term debt: | | | | | Unsecured long-term debt: | | | | |
| Medium-term notes sold through dealers | Medium-term notes sold through dealers | | 6,144,625 | | | 6,152,726 | | Medium-term notes sold through dealers | | 6,853,538 | | | 6,152,726 | |
| Medium-term notes sold to members | Medium-term notes sold to members | | 372,355 | | | 365,260 | | Medium-term notes sold to members | | 329,666 | | | 365,260 | |
| Medium term notes sold through dealers and to members | Medium term notes sold through dealers and to members | | 6,516,980 | | | 6,517,986 | | Medium term notes sold through dealers and to members | | 7,183,204 | | | 6,517,986 | |
| Unamortized premium, net | Unamortized premium, net | | 79 | | | 4 | | Unamortized premium, net | | 61 | | | 4 | |
| Debt issuance costs | Debt issuance costs | | (22,226) | | | (21,122) | | Debt issuance costs | | (22,208) | | | (21,122) | |
| Total unsecured medium-term notes | Total unsecured medium-term notes | | 6,494,833 | | | 6,496,868 | | Total unsecured medium-term notes | | 7,161,057 | | | 6,496,868 | |
| Unsecured notes payable | Unsecured notes payable | | 71 | | | 71 | | Unsecured notes payable | | 71 | | | 71 | |
| Unamortized discount | Unamortized discount | | — | | | (1) | | Unamortized discount | | — | | | (1) | |
| | Total unsecured notes payable | Total unsecured notes payable | | 71 | | | 70 | | Total unsecured notes payable | | 71 | | | 70 | |
| Total unsecured long-term debt | Total unsecured long-term debt | | 6,494,904 | | | 6,496,938 | | Total unsecured long-term debt | | 7,161,128 | | | 6,496,938 | |
| Total long-term debt | Total long-term debt | | $ | 23,874,274 | | | $ | 23,946,548 | | Total long-term debt | | $ | 24,640,201 | | | $ | 23,946,548 | |
Secured Debt
Long-term secured debt of $17,379$17,479 million and $17,450 million as of August 31,November 30, 2023 and May 31, 2023, respectively, represented 71% and 73% of total long-term debt outstanding as of each respective date. We were in compliance with all covenants and conditions under our debt indentures as of August 31,November 30, 2023 and May 31, 2023. We are required to pledge eligible mortgage notes in an amount at least equal to the outstanding balance of our secured debt. See “Note 4—Loans” for information on pledged collateral under our secured debt agreements.
Collateral Trust Bonds
Collateral trust bonds represent secured obligations sold to investors in the capital markets. Collateral trust bonds are secured by the pledge of mortgage notes or eligible securities in an amount at least equal to the principal balance of the bonds outstanding.
NATIONAL RURAL UTILITIES COOPERATIVE FINANCE CORPORATION
NOTES TO CONSOLIDATED FINANCIAL STATEMENTS
(UNAUDITED)
Guaranteed Underwriter Program Notes Payable
We borrowed $275 million and repaid $50$101 million of notes payable outstanding under the Guaranteed Underwriter Program during the three months ended August 31, 2023.YTD FY2024. We had up to $1,025$750 million available for access under the Guaranteed Underwriter Program as of August 31,November 30, 2023.
On September 11,December 19, 2023, we executed a commitment letter for the guarantee by RUS ofclosed on a $450 million Series U committed loan facility from the U.S. Treasury Department’s Federal Financing Bank under the Guaranteed Underwriter Program. On September 27, 2023,Pursuant to this facility, we borrowed $275 million undermay borrow any time before July 15, 2028. Each advance is subject to quarterly amortization and a final maturity not longer than 30 years from the Guaranteed Underwriter Program.date of the advance.
The notes outstanding under the Guaranteed Underwriter Program contain a provision that if during any portion of the fiscal year, our senior secured credit ratings do not have at least two of the following ratings: (i) A3 or higher from Moody’s Investors Service (“Moody’s”), (ii) A- or higher from S&P Global Inc. (“S&P”), (iii) A- or higher from Fitch Ratings (“Fitch”) or (iv) an equivalent rating from a successor rating agency to any of the above rating agencies, we may not make cash patronage capital distributions in excess of 5% of total patronage capital. We are required to pledge eligible distribution system or power supply system loans as collateral in an amount at least equal to the total principal amount of notes outstanding under the Guaranteed Underwriter Program.
Farmer Mac Notes Payable
We have a revolving note purchase agreement with Farmer Mac under which we can borrow up to $6,000 million from Farmer Mac at any time, subject to market conditions, through June 30, 2027. The agreement has successive automatic one-year renewals beginning June 30, 2026, unless Farmer Mac provides 425 days’ written notice of non-renewal. Pursuant to this revolving note purchase agreement, we can borrow, repay and re-borrow funds at any time through maturity, as market conditions permit, provided that the outstanding principal amount at any time does not exceed the total available under the agreement. Each borrowing under the revolving note purchase agreement is evidenced by a pricing agreement setting forth the interest rate, maturity date and other related terms as we may negotiate with Farmer Mac at the time of each such borrowing. We may select a fixed rate or variable rate at the time of each advance with a maturity as determined in the applicable pricing agreement. We borrowed a total of $300 million in principal amount of long-term notes payable under the Farmer Mac note purchase agreement during YTD FY2024.The amount outstanding under this agreement included $500 million of short-term borrowings and $3,126$3,402 million of long-term debt as of August 31,November 30, 2023. The amount available for borrowing totaled $2,374$2,098 million as of August 31,November 30, 2023. We are required to pledge eligible electric distribution system or electric power supply system loans as collateral in an amount at least equal to the total principal amount of notes outstanding under this agreement.
Unsecured Debt
Long-term unsecured debt of $6,495$7,161 million and $6,497 million as of August 31,November 30, 2023 and May 31, 2023, respectively, represented 29% and 27% of long-term debt outstanding as of each respective date.
Medium-Term Notes
Medium-term notes present unsecured obligations that may be issued through dealers in the capital markets or directly to our members. On June 29, 2023, During YTD FY2024, we issued $400$300 million in principal amount of dealer medium-term notes with a floating rate and a term of 18 months, and an aggregate principal amount of dealer medium-term notes at atotaling $800 million with an average fixed interest rate of 5.05% due on September 15, 2028. On August 7, 2023, we5.33% and an average term of four years. We repaid $400 million in principal amount of dealer medium-term notes that matured during YTD FY2024.
See “Note 7—Long-Term Debt” in our 2023 Form 10-K for additional information on our various long-term debt product types.
NATIONAL RURAL UTILITIES COOPERATIVE FINANCE CORPORATION
NOTES TO CONSOLIDATED FINANCIAL STATEMENTS
(UNAUDITED)
| | |
| NOTE 8—SUBORDINATED DEFERRABLE DEBT |
Subordinated deferrable debt represents long-term debt that is subordinated to all debt other than subordinated certificates held by our members. We had subordinated deferrable debt outstanding of $1,184 million and $1,283 million as of August 31,November 30, 2023 and May 31, 2023, respectively. On June 26, 2023, we redeemed $100 million in principal amount of our $400 million subordinated deferrable debt due 2043, at par plus accrued interest. As a result, we recognized $1 million of losses on early extinguishment of debt related to unamortized debt issuance costs in our consolidated statements of operations for the three months ended August 31, 2023.YTD FY2024. See “Note 8—Subordinated Deferrable Debt” in our 2023 Form 10-K for additional information on the terms and conditions, including maturity and call dates, of our subordinated deferrable debt outstanding. | | |
| NOTE 9—DERIVATIVE INSTRUMENTS AND HEDGING ACTIVITIES |
We are an end user of derivative financial instruments and do not engage in derivative trading. Derivatives may be privately negotiated contracts, which are often referred to as over-the-counter (“OTC”) derivatives, or they may be listed and traded on an exchange. We generally engage in OTC derivative transactions. Our derivative instruments are an integral part of our interest rate risk-management strategy. Our principal purpose in using derivatives is to manage our aggregate interest rate risk profile within prescribed risk parameters. The derivative instruments we use primarily consist of interest rate swaps, which we typically hold to maturity. In addition, we may use Treasury locks to manage the interest rate risk associated with future debt issuance or debt that is scheduled to reprice in the future. We provide a discussion of our accounting for derivatives policy in “Note 1—Summary of Significant Accounting Policies” in our 2023 Form 10-K.
Notional Amount of Derivatives Not Designated as Accounting Hedges
The notional amount is used only as the basis on which interest payments are determined and is not the amount exchanged, nor recorded on our consolidated balance sheets. The following table shows, by derivative instrument type, the notional amount, the weighted-average rate paid and the weighted-average interest rate received for our interest rate swaps as of August 31,November 30, 2023 and May 31, 2023. For the substantial majority of interest rate swap agreements, the daily compounded Secured Overnight Financing Rate (“SOFR”) is currently used as the basis for determining variable interest payment amounts each period.
Table 9.1: Derivative Notional Amount and Weighted Average Rates
| | | | | August 31, 2023 | | May 31, 2023 | | | November 30, 2023 | | May 31, 2023 |
| (Dollars in thousands) | (Dollars in thousands) | | Notional
Amount | | Weighted-
Average
Rate Paid | | Weighted-
Average
Rate Received | | Notional
Amount | | Weighted-
Average
Rate Paid | | Weighted-
Average
Rate Received | (Dollars in thousands) | | Notional
Amount | | Weighted-
Average
Rate Paid | | Weighted-
Average
Rate Received | | Notional
Amount | | Weighted-
Average
Rate Paid | | Weighted-
Average
Rate Received |
| Pay-fixed swaps | Pay-fixed swaps | | $ | 6,021,557 | | | 2.77 | % | | 5.53 | % | | $ | 5,920,269 | | | 2.75 | % | | 5.26 | % | Pay-fixed swaps | | $ | 5,945,786 | | | 2.77 | % | | 5.57 | % | | $ | 5,920,269 | | | 2.75 | % | | 5.26 | % |
| Receive-fixed swaps | Receive-fixed swaps | | 1,600,000 | | | 6.32 | | | 2.96 | | | 1,700,000 | | | 6.05 | | | 2.97 | | Receive-fixed swaps | | 1,675,000 | | | 6.14 | | | 3.18 | | | 1,700,000 | | | 6.05 | | | 2.97 | |
| Total interest rate swaps | Total interest rate swaps | | 7,621,557 | | 3.52 | | | 4.99 | | | 7,620,269 | | 3.49 | | | 4.75 | | Total interest rate swaps | | 7,620,786 | | 3.51 | | | 5.04 | | | 7,620,269 | | 3.49 | | | 4.75 | |
| Forward pay-fixed swaps | Forward pay-fixed swaps | | — | | 195,845 | | Forward pay-fixed swaps | | — | | 195,845 | |
| Total interest rate swaps | Total interest rate swaps | | $ | 7,621,557 | | | $ | 7,816,114 | | | Total interest rate swaps | | $ | 7,620,786 | | | $ | 7,816,114 | | |
|
Cash Flow Hedges
On November 3, 2023, we executed two Treasury lock agreements with an aggregate notional amount of $300 million to hedge interest rate risk by locking in the underlying U.S. Treasury interest rate component of interest rate payments on anticipated debt issuances. The Treasury locks were designated and qualified as cash flow hedges. On November 7, 2023, we terminated the Treasury locks upon the pricing of the $300 million of notes payable under our Farmer Mac revolving
NATIONAL RURAL UTILITIES COOPERATIVE FINANCE CORPORATION
NOTES TO CONSOLIDATED FINANCIAL STATEMENTS
(UNAUDITED)
note purchase agreement and recorded a net settlement gain of less than $1 million in accumulated other comprehensive income (“AOCI”), which will be reclassified into interest expense over the term of the related Farmer Mac borrowings. We did not have any derivatives designated as accounting hedges as of November 30, 2023 and May 31, 2023.
Impact of Derivatives on Consolidated Balance Sheets
The following table displays the fair value of the derivative assets and derivative liabilities, by derivatives type, recorded on our consolidated balance sheets and the related outstanding notional amount as of August 31,November 30, 2023 and May 31, 2023.
NATIONAL RURAL UTILITIES COOPERATIVE FINANCE CORPORATION
NOTES TO CONSOLIDATED FINANCIAL STATEMENTS
(UNAUDITED)
Table 9.2: Derivative Assets and Liabilities at Fair Value
| | | | | August 31, 2023 | | May 31, 2023 | | | November 30, 2023 | | May 31, 2023 |
| (Dollars in thousands) | (Dollars in thousands) | | Fair Value | | Notional Amount | | Fair Value | | Notional Amount (1) | (Dollars in thousands) | | Fair Value | | Notional Amount | | Fair Value | | Notional Amount (1) |
| Derivative assets: | Derivative assets: | | | | | | | | | Derivative assets: | | | | | | | | |
| | Interest rate swaps | Interest rate swaps | | $ | 615,866 | | | $ | 5,525,253 | | | $ | 460,762 | | | $ | 5,405,274 | | Interest rate swaps | | $ | 678,609 | | | $ | 5,736,256 | | | $ | 460,762 | | | $ | 5,405,274 | |
| Total derivative assets | Total derivative assets | | $ | 615,866 | | | $ | 5,525,253 | | | $ | 460,762 | | | $ | 5,405,274 | | Total derivative assets | | $ | 678,609 | | | $ | 5,736,256 | | | $ | 460,762 | | | $ | 5,405,274 | |
| | Derivative liabilities: | Derivative liabilities: | | Derivative liabilities: | |
| | Interest rate swaps | Interest rate swaps | | $ | 108,239 | | | $ | 2,096,304 | | | $ | 115,074 | | | $ | 2,410,840 | | Interest rate swaps | | $ | 92,890 | | | $ | 1,884,530 | | | $ | 115,074 | | | $ | 2,410,840 | |
| Total derivative liabilities | Total derivative liabilities | | $ | 108,239 | | | $ | 2,096,304 | | | $ | 115,074 | | | $ | 2,410,840 | | Total derivative liabilities | | $ | 92,890 | | | $ | 1,884,530 | | | $ | 115,074 | | | $ | 2,410,840 | |
____________________________
(1) The notional amount as of May 31, 2023 includes $196 million notional amount of forward starting swaps, as shown above in Table 9.1: Derivative Notional Amount and Weighted-Average Rates, with an effective start date during the three months ended August 31, 2023.in YTD FY2024. The fair value of these swaps as of May 31, 2023 is included in the above table and in our consolidated financial statements.
All of our master swap agreements include netting provisions that allow for offsetting of all contracts with a given counterparty in the event of default by one of the two parties. However, we report derivative asset and liability amounts on a gross basis by individual contract. The following table presents the gross fair value of derivative assets and liabilities reported on our consolidated balance sheets as of August 31,November 30, 2023 and May 31, 2023, and provides information on the impact of netting provisions under our master swap agreements and collateral pledged, if any.
Table 9.3: Derivative Gross and Net Amounts | | | | | | | | | | | | | | | | | | | | | | | | | | | | | | | | | | | | | | |
| | August 31, 2023 |
| | Gross Amount
of Recognized
Assets/ Liabilities | | Gross Amount
Offset in the
Balance Sheet | | Net Amount of Assets/ Liabilities
Presented
in the
Balance Sheet | | Gross Amount
Not Offset in the
Balance Sheet | | |
| (Dollars in thousands) | | | | | Financial
Instruments | | Cash
Collateral
Pledged | | Net
Amount |
| Derivative assets: | | | | | | | | | | | | |
| | | | | | | | | | | | |
| Interest rate swaps | | $ | 615,866 | | | $ | — | | | $ | 615,866 | | | $ | 106,557 | | | $ | — | | | $ | 509,309 | |
| | | | | | | | | | | | |
| Derivative liabilities: | | | | | | | | | | | | |
| | | | | | | | | | | | |
| Interest rate swaps | | 108,239 | | | — | | | 108,239 | | | 106,557 | | | — | | | 1,682 | |
| | | May 31, 2023 | | November 30, 2023 |
| | Gross Amount
of Recognized
Assets/ Liabilities | | Gross Amount
Offset in the
Balance Sheet | | Net Amount of Assets/ Liabilities
Presented
in the
Balance Sheet | | Gross Amount
Not Offset in the
Balance Sheet | | | Gross Amount
of Recognized
Assets/ Liabilities | | Gross Amount
Offset in the
Balance Sheet | | Net Amount of Assets/ Liabilities
Presented
in the
Balance Sheet | | Gross Amount
Not Offset in the
Balance Sheet | |
| (Dollars in thousands) | (Dollars in thousands) | | Financial
Instruments | | Cash
Collateral
Pledged | | Net
Amount | (Dollars in thousands) | | Financial
Instruments | | Cash
Collateral
Pledged | | Net
Amount |
| Derivative assets: | Derivative assets: | | | | | | | | | | | | | Derivative assets: | | | | | | | | | | | | |
| | Interest rate swaps | Interest rate swaps | | $ | 460,762 | | | $ | — | | | $ | 460,762 | | | $ | 112,047 | | | $ | — | | | $ | 348,715 | | Interest rate swaps | | $ | 678,609 | | | $ | — | | | $ | 678,609 | | | $ | 91,306 | | | $ | — | | | $ | 587,303 | |
| | Derivative liabilities: | Derivative liabilities: | | Derivative liabilities: | |
| | Interest rate swaps | Interest rate swaps | | 115,074 | | | — | | | 115,074 | | | 112,047 | | | — | | | 3,027 | | Interest rate swaps | | 92,890 | | | — | | | 92,890 | | | 91,306 | | | — | | | 1,584 | |
NATIONAL RURAL UTILITIES COOPERATIVE FINANCE CORPORATION
NOTES TO CONSOLIDATED FINANCIAL STATEMENTS
(UNAUDITED)
| | | | | | | | | | | | | | | | | | | | | | | | | | | | | | | | | | | | | | |
| | May 31, 2023 |
| | Gross Amount
of Recognized
Assets/ Liabilities | | Gross Amount
Offset in the
Balance Sheet | | Net Amount of Assets/ Liabilities
Presented
in the
Balance Sheet | | Gross Amount
Not Offset in the
Balance Sheet | | |
| (Dollars in thousands) | | | | | Financial
Instruments | | Cash
Collateral
Pledged | | Net
Amount |
| Derivative assets: | | | | | | | | | | | | |
| Interest rate swaps | | $ | 460,762 | | | $ | — | | | $ | 460,762 | | | $ | 112,047 | | | $ | — | | | $ | 348,715 | |
| | | | | | | | | | | | |
| Derivative liabilities: | | | | | | | | | | | | |
| | | | | | | | | | | | |
| Interest rate swaps | | 115,074 | | | — | | | 115,074 | | | 112,047 | | | — | | | 3,027 | |
(UNAUDITED)
Impact of Derivatives on Consolidated Statements of Operations
The primary factors affecting the fair value of our derivatives and the derivative gains (losses) recorded in our consolidated statements of operations include changes in interest rates, the shape of the swap curve and the composition of our derivative portfolio. We generally record derivative losses when interest rates decline and derivative gains when interest rates rise, as our derivative portfolio consists of a higher proportion of pay-fixed swaps than receive-fixed swaps.
The following table presents the components of the derivative gains (losses) reported in our consolidated statements of operations for the three months ended August 31, 2023 and 2022.operations. Derivative cash settlements interest expense represents the net periodic contractual interest amount for our interest-rate swaps during the reporting period. Derivative forward value gains (losses) represent the change in fair value of our interest rate swaps during the reporting period due to changes in expected future interest rates over the remaining life of our derivative contracts. We classify the derivative cash settlement amounts for the net periodic contractual interest expense on our interest rate swaps as an operating activity in our consolidated statements of cash flows.
Table 9.4: Derivative Gains (Losses)
| | | | | | | | | | | | | | | | | | |
| | | | Three Months Ended August 31, |
| (Dollars in thousands) | | | | | | 2023 | | 2022 |
| Derivative gains (losses) attributable to: | | | | | | | | |
| Derivative cash settlements interest income (expense) | | | | | | $ | 27,869 | | | $ | (10,785) | |
| Derivative forward value gains | | | | | | 162,018 | | | 104,372 | |
| Derivative gains | | | | | | $ | 189,887 | | | $ | 93,587 | |
| | | | | | | | | | | | | | | | | | | | | | | | | | |
| | | | |
| (Dollars in thousands) | | Q2 FY2024 | | Q2 FY2023 | | YTD FY2024 | | YTD FY2023 |
| Derivative gains (losses) attributable to: | | | | | | | | |
| Derivative cash settlements interest income (expense) | | $ | 28,767 | | | $ | 4,801 | | | $ | 56,636 | | | $ | (5,984) | |
| Derivative forward value gains | | 78,171 | | | 141,989 | | | 240,189 | | | 246,361 | |
| Derivative gains | | $ | 106,938 | | | $ | 146,790 | | | $ | 296,825 | | | $ | 240,377 | |
Credit Risk-Related Contingent Features
Our derivative contracts typically contain mutual early-termination provisions, generally in the form of a credit rating trigger. Under the mutual credit rating trigger provisions, either counterparty may, but is not obligated to, terminate and settle the agreement if the credit rating of the other counterparty falls below a level specified in the agreement. If a derivative contract is terminated, the amount to be received or paid by us would be equal to the prevailing fair value, as defined in the agreement, as of the termination date.
In September 2023 and December 2023, Fitch and S&P, respectively, affirmed CFC’s credit ratings and stable outlook. Our senior unsecured credit ratings from Moody’s, S&P and Fitch were A2, A- and A, respectively, as of August 31,November 30, 2023. Moody’s, S&P and Fitch had our ratings on stable outlook as of August 31,November 30, 2023. In September 2023, Fitch affirmed CFC’s credit ratings and stable outlook. Our credit ratings and outlook remain unchanged as of the date of this Report.
The following table displays the notional amounts of our derivative contracts with rating triggers as of August 31,November 30, 2023, and the payments that would be required if the contracts were terminated as of that date because of a downgrade of our
NATIONAL RURAL UTILITIES COOPERATIVE FINANCE CORPORATION
NOTES TO CONSOLIDATED FINANCIAL STATEMENTS
(UNAUDITED)
unsecured credit ratings or the counterparty’s unsecured credit ratings below A3/A-, below Baa1/BBB+, to or below Baa2/BBB, or to or below Ba2/BB+ by Moody’s or S&P, respectively. In calculating the payment amounts that would be required upon termination of the derivative contracts, we assume that amounts for each counterparty would be netted in accordance with the provisions of the master netting agreements with the counterparty. The net payment amounts are based on the fair value of the underlying derivative instrument, excluding the credit risk valuation adjustment, plus any unpaid accrued interest amounts.
NATIONAL RURAL UTILITIES COOPERATIVE FINANCE CORPORATION
NOTES TO CONSOLIDATED FINANCIAL STATEMENTS
(UNAUDITED)
Table 9.5: Derivative Credit Rating Trigger Exposure
| | (Dollars in thousands) | (Dollars in thousands) | | Notional
Amount | | Payable Due from CFC | | Receivable
Due to CFC | | Net Receivable (Payable) | (Dollars in thousands) | | Notional
Amount | | Payable Due from CFC | | Receivable
Due to CFC | | Net Receivable (Payable) |
| Impact of rating downgrade trigger: | Impact of rating downgrade trigger: | | | | | | | | | Impact of rating downgrade trigger: | | | | | | | | |
Falls below A3/A-(1) | Falls below A3/A-(1) | | $ | 30,930 | | | $ | (951) | | | $ | — | | | $ | (951) | | Falls below A3/A-(1) | | $ | 27,625 | | | $ | (876) | | | $ | — | | | $ | (876) | |
| Falls below Baa1/BBB+ | Falls below Baa1/BBB+ | | 5,177,232 | | | (765) | | | 340,918 | | | 340,153 | | Falls below Baa1/BBB+ | | 5,208,518 | | | (702) | | | 396,631 | | | 395,929 | |
Falls to or below Baa2/BBB (2) | Falls to or below Baa2/BBB (2) | | 315,461 | | | — | | | 24,183 | | | 24,183 | | Falls to or below Baa2/BBB (2) | | 316,514 | | | — | | | 26,496 | | | 26,496 | |
| | Total | Total | | $ | 5,523,623 | | | $ | (1,716) | | | $ | 365,101 | | | $ | 363,385 | | Total | | $ | 5,552,657 | | | $ | (1,578) | | | $ | 423,127 | | | $ | 421,549 | |
____________________________
(1) Rating trigger for CFC falls below A3/A-, while rating trigger for counterparty falls below Baa1/BBB+ by Moody’s or S&P, respectively.
(2) Rating trigger for CFC falls to or below Baa2/BBB, while rating trigger for counterparty falls to or below Ba2/BB+ by Moody’s or S&P, respectively.
We have interest rate swaps with one counterparty that are subject to a ratings trigger and early termination provision in the event of a downgrade of CFC’s senior unsecured credit ratings below Baa3, BBB- or BBB- by Moody’s, S&P or Fitch, respectively. The outstanding notional amount of these swaps, which is not included in the above table, totaled $223$222 million as of August 31,November 30, 2023. These swaps were in an unrealized gain position of $34$39 million as of August 31,November 30, 2023.
Our largest counterparty exposure, based on the outstanding notional amount, accounted for approximately 24% and 23% of the total outstanding notional amount of derivatives as of August 31,both November 30, 2023 and May 31, 2023 respectively. The aggregate fair value amount, including the credit valuation adjustment, of all interest rate swaps with rating triggers that were in a net liability position was $2 million as of August 31,November 30, 2023.
Total equity increased $159$307 million to $2,748$2,896 million as of August 31,November 30, 2023, attributable primarily to our reported net income of $228$376 million for the three months ended August 31, 2023,YTD FY2024, partially offset by the patronage capital retirement of $72 million authorized by the CFC Board of Directors in July 2023.
Allocation of Net Earnings and Retirement of Patronage Capital
The amount of patronage capital allocated each year by CFC’s Board of Directors is based on adjusted net income, which excludes the impact of derivative forward value gains (losses). See “MD&A—Non-GAAP Financial Measures” for information on adjusted net income. In May 2023, the CFC Board of Directors authorized the allocation of $1 million of net earnings for fiscal year 2023 to the cooperative educational fund. In July 2023, the CFC Board of Directors authorized the allocation of net earnings for fiscal year 2023 as follows: $110 million to members in the form of patronage capital and $140 million to the members’ capital reserve.
In July 2023, the CFC Board of Directors also authorized the retirement of allocated net earnings totaling $72 million, of which $55 million represented 50% of the patronage capital allocation for fiscal year 2023 and $17 million represented the portion of the allocation from net earnings for fiscal year 1998 that had been held for 25 years pursuant to the CFC Board of
NATIONAL RURAL UTILITIES COOPERATIVE FINANCE CORPORATION
NOTES TO CONSOLIDATED FINANCIAL STATEMENTS
(UNAUDITED)
Directors’ policy. The authorized patronage capital retirement amount of $72 million was returned to members in cash in September 2023. The remaining portion of the patronage capital allocation for fiscal year 2023 will be retained by CFC for 25 years pursuant to the guidelines adopted by the CFC Board of Directors in June 2009.
See “Note 11—Equity” in our 2023 Form 10-K for additional information on our policy for allocation and retirement of patronage capital.
NATIONAL RURAL UTILITIES COOPERATIVE FINANCE CORPORATION
NOTES TO CONSOLIDATED FINANCIAL STATEMENTS
(UNAUDITED)
Accumulated Other Comprehensive Income (Loss)
The following table presents, by component, changes in AOCI for the three months ended August 31, 2023 and 2022periods presented and the balance of each component as of the end of each respective period.
Table 10.1: Changes in Accumulated Other Comprehensive Income (Loss)
| | | | | | Three Months Ended August 31, | |
| | 2023 | | 2022 | | | Q2 FY2024 | | Q2 FY2023 |
| (Dollars in thousands) | (Dollars in thousands) | | Unrealized Gains on Derivative Hedges(1) | | Unrealized Losses on Defined Benefit Plans(2) | | Total | | Unrealized Gains on Derivative Hedges(1) | | Unrealized Losses on Defined Benefit Plans(2) | | Total | (Dollars in thousands) | | Unrealized Gains on Derivative Hedges(1) | | Unrealized Losses on Defined Benefit Plans(2) | | Total | | Unrealized Gains on Derivative Hedges(1) | | Unrealized Losses on Defined Benefit Plans(2) | | Total |
| Beginning balance | Beginning balance | | $ | 11,102 | | | $ | (2,759) | | | $ | 8,343 | | | $ | 5,123 | | | $ | (2,865) | | | $ | 2,258 | | Beginning balance | | $ | 10,947 | | | $ | (2,706) | | | $ | 8,241 | | | $ | 4,934 | | | $ | (2,765) | | | $ | 2,169 | |
| | Changes in unrealized gains | | Changes in unrealized gains | | 483 | | | — | | | 483 | | | — | | | — | | | — | |
| Realized (gains) losses reclassified to earnings | Realized (gains) losses reclassified to earnings | | (155) | | | 53 | | | (102) | | | (189) | | | 100 | | | (89) | | Realized (gains) losses reclassified to earnings | | (159) | | | 53 | | | (106) | | | (189) | | | 100 | | | (89) | |
| Ending balance | Ending balance | | $ | 10,947 | | | $ | (2,706) | | | $ | 8,241 | | | $ | 4,934 | | | $ | (2,765) | | | $ | 2,169 | | Ending balance | | $ | 11,271 | | | $ | (2,653) | | | $ | 8,618 | | | $ | 4,745 | | | $ | (2,665) | | | $ | 2,080 | |
| | | | YTD FY2024 | | YTD FY2023 |
| (Dollars in thousands) | | (Dollars in thousands) | | Unrealized Gains on Derivative Hedges(1) | | Unrealized Losses on Defined Benefit Plans(2) | | Total | | Unrealized Gains on Derivative Hedges(1) | | Unrealized Losses on Defined Benefit Plans(2) | | Total |
| Beginning balance | | Beginning balance | | $ | 11,102 | | | $ | (2,759) | | | $ | 8,343 | | | $ | 5,123 | | | $ | (2,865) | | | $ | 2,258 | |
| Changes in unrealized gains | | Changes in unrealized gains | | 483 | | | — | | | 483 | | | — | | | — | | | — | |
| Realized (gains) losses reclassified to earnings | | Realized (gains) losses reclassified to earnings | | (314) | | | 106 | | | (208) | | | (378) | | | 200 | | | (178) | |
| Ending balance | | Ending balance | | $ | 11,271 | | | $ | (2,653) | | | $ | 8,618 | | | $ | 4,745 | | | $ | (2,665) | | | $ | 2,080 | |
____________________________
(1) Of the derivative gains reclassified to earnings, a portion is reclassified as a component of the derivative gains (losses) line item and the remainder is reclassified as a component of the interest expense line item on our consolidated statements of operations.
(2) Reclassified to earnings as a component of the other non-interest expense line item presented on our consolidated statements of operations.
See “Note 9—Derivative Instruments and Hedging Activities” for discussion on our derivatives designated as accounting hedges. We expect to reclassify realized net gains of $1 million attributable to derivative cash flow hedges from AOCI into earnings over the next 12 months.
NATIONAL RURAL UTILITIES COOPERATIVE FINANCE CORPORATION
NOTES TO CONSOLIDATED FINANCIAL STATEMENTS
(UNAUDITED)
We guarantee certain contractual obligations of our members so they may obtain various forms of financing. We use the same credit policies and monitoring procedures in providing guarantees as we do for loans and commitments. If a member system defaults on its obligation to pay debt service, then we are obligated to pay any required amounts under our guarantees. Meeting our guarantee obligations satisfies the underlying obligation of our member systems and prevents the exercise of remedies by the guarantee beneficiary based upon a payment default by a member system. In general, the member system is required to repay any amount advanced by us with interest, pursuant to the documents evidencing the member system’s reimbursement obligation.
The following table displays the notional amount of our outstanding guarantee obligations, by guarantee type and by member class, as of August 31,November 30, 2023 and May 31, 2023.
Table 11.1: Guarantees Outstanding by Type and Member Class
| | | | | | | | | | | | | | |
| (Dollars in thousands) | | November 30, 2023 | | May 31, 2023 |
| Guarantee type: | | | | |
Long-term tax-exempt bonds(1) | | $ | 75,005 | | | $ | 98,405 | |
Letters of credit(2)(3) | | 637,236 | | | 538,393 | |
| Other guarantees | | 185,295 | | | 160,023 | |
| Total | | $ | 897,536 | | | $ | 796,821 | |
| | | | |
| Member class: | | | | |
| CFC: | | | | |
| Distribution | | $ | 420,380 | | | $ | 383,644 | |
| Power supply | | 435,251 | | | 380,382 | |
Statewide and associate(4) | | 19,039 | | | 17,532 | |
| CFC total | | 874,670 | | | 781,558 | |
| NCSC | | 22,866 | | | 15,263 | |
| | | | |
| Total | | $ | 897,536 | | | $ | 796,821 | |
____________________________
(1)Represents the outstanding principal amount of long-term variable-rate guaranteed bonds.
(2)Reflects our maximum potential exposure for letters of credit, which also includes interest due, if any.
(3)Under a hybrid letter of credit facility, we had $30 million of commitments that may be used for the issuance of letters of credit as of November 30, 2023.
(4)Includes CFC guarantees to RTFC members totaling $17 million and $16 million as of November 30, 2023 and May 31, 2023, respectively.
We had guarantees outstanding totaling $898 million and $797 million as of November 30, 2023 and May 31, 2023, respectively. Guarantees under which our right of recovery from our members was not secured totaled $657 million and $535 million and represented 73% and 67% of total guarantees as of November 30, 2023 and May 31, 2023, respectively.
NATIONAL RURAL UTILITIES COOPERATIVE FINANCE CORPORATION
NOTES TO CONSOLIDATED FINANCIAL STATEMENTS
(UNAUDITED)
Table 11.1: Guarantees Outstanding by Type and Member Class
| | | | | | | | | | | | | | |
| (Dollars in thousands) | | August 31, 2023 | | May 31, 2023 |
| Guarantee type: | | | | |
Long-term tax-exempt bonds(1) | | $ | 97,705 | | | $ | 98,405 | |
Letters of credit(2)(3) | | 618,172 | | | 538,393 | |
| Other guarantees | | 184,564 | | | 160,023 | |
| Total | | $ | 900,441 | | | $ | 796,821 | |
| | | | |
| Member class: | | | | |
| CFC: | | | | |
| Distribution | | $ | 405,271 | | | $ | 383,644 | |
| Power supply | | 460,652 | | | 380,382 | |
Statewide and associate(4) | | 17,839 | | | 17,532 | |
| CFC total | | 883,762 | | | 781,558 | |
| NCSC | | 16,679 | | | 15,263 | |
| | | | |
| Total | | $ | 900,441 | | | $ | 796,821 | |
____________________________
(1)Represents the outstanding principal amountLong-term tax-exempt bonds of long-term variable-rate guaranteed bonds.
(2)Reflects our maximum potential exposure for letters of credit.
(3)Under a hybrid letter of credit facility, we had $30 million of commitments that may be used for the issuance of letters of credit as of August 31, 2023.
(4)Includes CFC guarantees to RTFC members totaling $16 million as of both August 31, 2023 and May 31, 2023.
We had guarantees outstanding totaling $900$75 million and $797$98 million as of August 31,November 30, 2023 and May 31, 2023, respectively. Guarantees under which our right of recovery from our members was not secured totaled $629 million and $535 million and represented 70% and 67% of total guarantees as of August 31, 2023 and May 31, 2023, respectively.
Long-term tax-exempt bonds of $98 million as of both August 31, 2023 and May 31, 2023,respectively, consist of adjustable or variable-rate bonds that may be converted to a fixed rate as specified in the applicable indenture for each bond offering. We are unable to determine the maximum amount of interest that we may be required to pay related to the remaining adjustable and variable-rate bonds. Many of these bonds have a call provision that allows us to call the bond in the event of a default, which would limit our exposure to future interest payments on these bonds. Our maximum potential exposure generally is secured by mortgage liens on the members’ assets and future revenue. If a member’s debt is accelerated because of a determination that the interest thereon is not tax-exempt, the member’s obligation to reimburse us for any guarantee payments will be treated as a long-term loan. The maturities for long-term tax-exempt bonds and the related guarantees extend through calendar year 2037.
Of the outstanding letters of credit of $618$637 million and $538 million as of August 31,November 30, 2023 and May 31, 2023, respectively, $149$140 million and $138 million were secured at each respective date. The maturities for the outstanding letters of credit as of August 31,November 30, 2023 extend through calendar year 2043.
In addition to the letters of credit listed in the table above, under master letter of credit facilities in place as of August 31,November 30, 2023, we may be required to issue up to an additional $129$154 million in letters of credit to third parties for the benefit of our members. All of our master letter of credit facilities were subject to material adverse change clauses at the time of issuance as of August 31,November 30, 2023. Prior to issuing a letter of credit, we would confirm that there has been no material adverse change in the business or condition, financial or otherwise, of the borrower since the master letter of credit facility was approved and confirm that the borrower is currently in compliance with the terms and conditions of the agreement governing the facility.
NATIONAL RURAL UTILITIES COOPERATIVE FINANCE CORPORATION
NOTES TO CONSOLIDATED FINANCIAL STATEMENTS
(UNAUDITED)
The maximum potential exposure for other guarantees was $185 million and $160 million as of August 31,November 30, 2023 and May 31, 2023, respectively, of which $25 million was secured as of both August 31,November 30, 2023 and May 31, 2023. The maturities for these other guarantees listed in the table above extend through calendar year 2025.
In addition to the guarantees described above, we were also the liquidity provider for $98$75 million of variable-rate tax-exempt bonds as of August 31,November 30, 2023, issued for our member cooperatives. While the bonds are in variable-rate mode, in return for a fee, we have unconditionally agreed to purchase bonds tendered or put for redemption if the remarketing agents are unable to sell such bonds to other investors. We were not required to perform as liquidity provider pursuant to these obligations during the three months ended August 31, 2023YTD FY2024 or the prior fiscal year.YTD FY2023.
Guarantee Liability
We recorded a total guarantee liability for noncontingent and contingent exposures related to guarantees and liquidity obligations of $14 million and $13 million as of August 31,both November 30, 2023 and May 31, 2023, respectively.2023. The noncontingent guarantee liability, which pertains to our obligation to stand ready to perform over the term of our guarantees and liquidity obligations we have entered into or modified since January 1, 2003 and accounts for the substantial majority of our guarantee liability, totaled $13 million and $12 million as of August 31,November 30, 2023 and May 31, 2023, respectively. The remaining amount pertains to our contingent guarantee exposures.
| | |
| NOTE 12—FAIR VALUE MEASUREMENT |
Fair value, also referred to as an exit price, is defined as the price that would be received for an asset or paid to transfer a liability in an orderly transaction between market participants on the measurement date. The fair value accounting guidance provides a three-level fair value hierarchy for classifying financial instruments. This hierarchy is based on the markets in which the assets or liabilities trade and whether the inputs to the valuation techniques used to measure fair value are observable or unobservable. The fair value measurement of a financial asset or liability is assigned a level based on the lowest level of any input that is significant to the fair value measurement in its entirety. The levels, in priority order based on
NATIONAL RURAL UTILITIES COOPERATIVE FINANCE CORPORATION
NOTES TO CONSOLIDATED FINANCIAL STATEMENTS
(UNAUDITED)
the extent to which observable inputs are available to measure fair value, are Level 1, Level 2 and Level 3. The accounting guidance for fair value measurements requires that we maximize the use of observable inputs and minimize the use of unobservable inputs in determining fair value.
The following table presents the carrying value and estimated fair value of all of our financial instruments, including those carried at amortized cost, as of August 31,November 30, 2023 and May 31, 2023. The table also displays the classification level within the fair value hierarchy based on the degree of observability of the inputs used in the valuation technique for estimating fair value.
Table 12.1: Fair Value of Financial Instruments | | | | | | | | | | | | | | | | | | | | | | | | | | | | | | | | |
| | | November 30, 2023 | | Fair Value Measurement Level |
| (Dollars in thousands) | | Carrying Value | | Fair Value | | Level 1 | | Level 2 | | Level 3 |
| Assets: | | | | | | | | | | |
| Cash and cash equivalents | | $ | 128,794 | | | $ | 128,794 | | | $ | 128,794 | | | $ | — | | | $ | — | |
| Restricted cash | | 11,078 | | | 11,078 | | | 11,078 | | | — | | | — | |
| Time deposits | | 400,000 | | | 400,000 | | | — | | | 400,000 | | | — | |
| Equity securities, at fair value | | 35,758 | | | 35,758 | | | 35,758 | | | — | | | — | |
| Debt securities trading, at fair value | | 381,110 | | | 381,110 | | | — | | | 381,110 | | | — | |
| | | | | | | | | | |
| Deferred compensation investments | | 7,185 | | | 7,185 | | | 7,185 | | | — | | | — | |
| Loans to members, net | | 33,498,035 | | | 29,567,059 | | | — | | | — | | | 29,567,059 | |
| Accrued interest receivable | | 188,491 | | | 188,491 | | | — | | | 188,491 | | | — | |
| Derivative assets | | 678,609 | | | 678,609 | | | — | | | 678,609 | | | — | |
| Total financial assets | | $ | 35,329,060 | | | $ | 31,398,084 | | | $ | 182,815 | | | $ | 1,648,210 | | | $ | 29,567,059 | |
| | | | | | | | | | |
| Liabilities: | | | | | | | | | | |
| Short-term borrowings | | $ | 5,161,583 | | | $ | 5,163,238 | | | $ | — | | | $ | 4,663,238 | | | $ | 500,000 | |
| Long-term debt | | 24,640,201 | | | 23,121,887 | | | — | | | 13,738,311 | | | 9,383,576 | |
| Accrued interest payable | | 236,441 | | | 236,441 | | | — | | | 236,441 | | | — | |
| Guarantee liability | | 13,429 | | | 13,000 | | | — | | | — | | | 13,000 | |
| Derivative liabilities | | 92,890 | | | 92,890 | | | — | | | 92,890 | | | — | |
| Subordinated deferrable debt | | 1,184,247 | | | 1,170,117 | | | 235,675 | | | 934,442 | | | — | |
| Members’ subordinated certificates | | 1,208,819 | | | 1,208,819 | | | — | | | — | | | 1,208,819 | |
| Total financial liabilities | | $ | 32,537,610 | | | $ | 31,006,392 | | | $ | 235,675 | | | $ | 19,665,322 | | | $ | 11,105,395 | |
NATIONAL RURAL UTILITIES COOPERATIVE FINANCE CORPORATION
NOTES TO CONSOLIDATED FINANCIAL STATEMENTS
(UNAUDITED)
Table 12.1: Fair Value of Financial Instruments | | | | | | | | | | | | | | | | | | | | | | | | | | | | | | | | |
| | | August 31, 2023 | | Fair Value Measurement Level |
| (Dollars in thousands) | | Carrying Value | | Fair Value | | Level 1 | | Level 2 | | Level 3 |
| Assets: | | | | | | | | | | |
| Cash and cash equivalents | | $ | 199,552 | | | $ | 199,552 | | | $ | 199,552 | | | $ | — | | | $ | — | |
| Restricted cash | | 9,290 | | | 9,290 | | | 9,290 | | | — | | | — | |
| | | | | | | | | | |
| Equity securities, at fair value | | 36,780 | | | 36,780 | | | 36,780 | | | — | | | — | |
| Debt securities trading, at fair value | | 425,331 | | | 425,331 | | | — | | | 425,331 | | | — | |
| | | | | | | | | | |
| Deferred compensation investments | | 7,162 | | | 7,162 | | | 7,162 | | | — | | | — | |
| Loans to members, net | | 33,041,720 | | | 29,309,889 | | | — | | | — | | | 29,309,889 | |
| Accrued interest receivable | | 177,351 | | | 177,351 | | | — | | | 177,351 | | | — | |
| Derivative assets | | 615,866 | | | 615,866 | | | — | | | 615,866 | | | — | |
| Total financial assets | | $ | 34,513,052 | | | $ | 30,781,221 | | | $ | 252,784 | | | $ | 1,218,548 | | | $ | 29,309,889 | |
| | | | | | | | | | |
| Liabilities: | | | | | | | | | | |
| Short-term borrowings | | $ | 5,124,335 | | | $ | 5,125,706 | | | $ | — | | | $ | 4,625,706 | | | $ | 500,000 | |
| Long-term debt | | 23,874,274 | | | 22,148,726 | | | — | | | 13,395,526 | | | 8,753,200 | |
| Accrued interest payable | | 274,554 | | | 274,554 | | | — | | | 274,554 | | | — | |
| Guarantee liability | | 13,552 | | | 13,088 | | | — | | | — | | | 13,088 | |
| Derivative liabilities | | 108,239 | | | 108,239 | | | — | | | 108,239 | | | — | |
| Subordinated deferrable debt | | 1,184,197 | | | 1,172,990 | | | 241,771 | | | 931,219 | | | — | |
| Members’ subordinated certificates | | 1,222,026 | | | 1,222,026 | | | — | | | — | | | 1,222,026 | |
| Total financial liabilities | | $ | 31,801,177 | | | $ | 30,065,329 | | | $ | 241,771 | | | $ | 19,335,244 | | | $ | 10,488,314 | |
| | | | | | | | | | | | | | | | | | | | | | | | | | | | | | | | |
| | | May 31, 2023 | | Fair Value Measurement Level |
| (Dollars in thousands) | | Carrying Value | | Fair Value | | Level 1 | | Level 2 | | Level 3 |
| Assets: | | | | | | | | | | |
| Cash and cash equivalents | | $ | 198,936 | | | $ | 198,936 | | | $ | 198,936 | | | $ | — | | | $ | — | |
| Restricted cash | | 8,301 | | | 8,301 | | | 8,301 | | | — | | | — | |
| | | | | | | | | | |
| Equity securities, at fair value | | 35,494 | | | 35,494 | | | 35,494 | | | — | | | — | |
| Debt securities trading, at fair value | | 474,875 | | | 474,875 | | | — | | | 474,875 | | | — | |
| | | | | | | | | | |
| Deferred compensation investments | | 6,660 | | | 6,660 | | | 6,660 | | | — | | | — | |
| Loans to members, net | | 32,478,992 | | | 29,308,647 | | | — | | | — | | | 29,308,647 | |
| Accrued interest receivable | | 172,723 | | | 172,723 | | | — | | | 172,723 | | | — | |
| Derivative assets | | 460,762 | | | 460,762 | | | — | | | 460,762 | | | — | |
| Total financial assets | | $ | 33,836,743 | | | $ | 30,666,398 | | | $ | 249,391 | | | $ | 1,108,360 | | | $ | 29,308,647 | |
| | | | | | | | | | |
| Liabilities: | | | | | | | | | | |
| Short-term borrowings | | $ | 4,546,275 | | | $ | 4,547,333 | | | $ | — | | | $ | 4,547,333 | | | $ | — | |
| Long-term debt | | 23,946,548 | | | 22,665,551 | | | — | | | 13,527,393 | | | 9,138,158 | |
| Accrued interest payable | | 212,340 | | | 212,340 | | | — | | | 212,340 | | | — | |
| Guarantee liability | | 12,973 | | | 12,475 | | | — | | | — | | | 12,475 | |
| Derivative liabilities | | 115,074 | | | 115,074 | | | — | | | 115,074 | | | — | |
| Subordinated deferrable debt | | 1,283,436 | | | 1,261,141 | | | 240,831 | | | 1,020,310 | | | — | |
| Members’ subordinated certificates | | 1,223,126 | | | 1,223,126 | | | — | | | — | | | 1,223,126 | |
| Total financial liabilities | | $ | 31,339,772 | | | $ | 30,037,040 | | | $ | 240,831 | | | $ | 19,422,450 | | | $ | 10,373,759 | |
NATIONAL RURAL UTILITIES COOPERATIVE FINANCE CORPORATION
NOTES TO CONSOLIDATED FINANCIAL STATEMENTS
(UNAUDITED)
For additional information regarding fair value measurements, the fair value hierarchy and a description of the methodologies we use to estimate fair value, see “Note 14—Fair Value Measurement” to the Consolidated Financial Statements in our 2023 Form 10-K.
Transfers Between Levels
We monitor the availability of observable market data to assess the appropriate classification of financial instruments within the fair value hierarchy and transfer between Level 1, Level 2, and Level 3 accordingly. Observable market data includes but is not limited to quoted prices and market transactions. Changes in economic conditions or market liquidity generally will drive changes in availability of observable market data. Changes in availability of observable market data, which also may result in changes in the valuation technique used, are generally the cause of transfers between levels. We did not have any transfers into or out of Level 3 of the fair value hierarchy during the three months ended August 31, 2023 and 2022.YTD FY2024 or YTD FY2023.
Assets and Liabilities Measured at Fair Value on a Recurring Basis
The following table presents the carrying value and fair value of financial instruments reported in our consolidated financial statements at fair value on a recurring basis as of August 31,November 30, 2023 and May 31, 2023, and the classification of the valuation technique within the fair value hierarchy. We did not have any assets and liabilities measured at fair value on a recurring basis using significant unobservable inputs during the three months ended August 31, 2023 and 2022.YTD FY2024 or YTD FY2023.
NATIONAL RURAL UTILITIES COOPERATIVE FINANCE CORPORATION
NOTES TO CONSOLIDATED FINANCIAL STATEMENTS
(UNAUDITED)
Table 12.2: Assets and Liabilities Measured at Fair Value on a Recurring Basis
| | | | | August 31, 2023 | | May 31, 2023 | | | November 30, 2023 | | May 31, 2023 |
| (Dollars in thousands) | (Dollars in thousands) | | Level 1 | | Level 2 | | Total | | Level 1 | | Level 2 | | Total | (Dollars in thousands) | | Level 1 | | Level 2 | | Total | | Level 1 | | Level 2 | | Total |
| Assets: | Assets: | | | | | | | | | | | | | Assets: | | | | | | | | | | | | |
| Equity securities, at fair value | Equity securities, at fair value | | $ | 36,780 | | | $ | — | | | $ | 36,780 | | | $ | 35,494 | | | $ | — | | | $ | 35,494 | | Equity securities, at fair value | | $ | 35,758 | | | $ | — | | | $ | 35,758 | | | $ | 35,494 | | | $ | — | | | $ | 35,494 | |
| Debt securities trading, at fair value | Debt securities trading, at fair value | | — | | | 425,331 | | | 425,331 | | | — | | | 474,875 | | | 474,875 | | Debt securities trading, at fair value | | — | | | 381,110 | | | 381,110 | | | — | | | 474,875 | | | 474,875 | |
| Deferred compensation investments | Deferred compensation investments | | 7,162 | | | — | | | 7,162 | | | 6,660 | | | — | | | 6,660 | | Deferred compensation investments | | 7,185 | | | — | | | 7,185 | | | 6,660 | | | — | | | 6,660 | |
| Derivative assets | Derivative assets | | — | | | 615,866 | | | 615,866 | | | — | | | 460,762 | | | 460,762 | | Derivative assets | | — | | | 678,609 | | | 678,609 | | | — | | | 460,762 | | | 460,762 | |
| | Liabilities: | Liabilities: | | Liabilities: | |
| Derivative liabilities | Derivative liabilities | | $ | — | | | $ | 108,239 | | | $ | 108,239 | | | $ | — | | | $ | 115,074 | | | $ | 115,074 | | Derivative liabilities | | $ | — | | | $ | 92,890 | | | $ | 92,890 | | | $ | — | | | $ | 115,074 | | | $ | 115,074 | |
Assets and Liabilities Measured at Fair Value on a Nonrecurring Basis
We may be required, from time to time, to measure certain assets and liabilities at fair value on a nonrecurring basis on our consolidated balance sheets. These assets and liabilities are not measured at fair value on an ongoing basis but are subject to fair value adjustments in certain circumstances, such as in the application of the lower of cost or fair value accounting or when we evaluate assets for impairment. We did not have any assets or liabilities measured at fair value on a nonrecurring basis during as of August 31, 2023 and May 31, 2023.YTD FY2024 or YTD FY2023.
| | |
| NOTE 13—VARIABLE INTEREST ENTITIES |
NCSC and RTFC meet the definition of a VIE because they do not have sufficient equity investment at risk to finance their activities without financial support. CFC is the primary source of funding for NCSC and the sole source of funding for RTFC. Under the terms of management agreements with each company, CFC manages the business operations of NCSC and RTFC. CFC also unconditionally guarantees full indemnification for any loan losses of NCSC and RTFC pursuant to guarantee agreements with each company. CFC earns management and guarantee fees from its agreements with NCSC and RTFC.
NATIONAL RURAL UTILITIES COOPERATIVE FINANCE CORPORATION
NOTES TO CONSOLIDATED FINANCIAL STATEMENTS
(UNAUDITED)
All loans that require NCSC board approval also require CFC board approval. CFC is not a member of NCSC and does not elect directors to the NCSC board. If CFC becomes a member of NCSC, it would control the nomination process for one NCSC director. NCSC members elect directors to the NCSC board based on one vote for each member. NCSC is a Class C member of CFC. All loans that require RTFC board approval also require approval by CFC for funding under RTFC’s credit facilities with CFC. CFC is not a member of RTFC and does not elect directors to the RTFC board. RTFC is a nonvoting associate of CFC. RTFC members elect directors to the RTFC board based on one vote for each member.
NCSC and RTFC creditors have no recourse against CFC in the event of a default by NCSC and RTFC, unless there is a guarantee agreement under which CFC has guaranteed NCSC or RTFC debt obligations to a third party. The following table provides information on incremental consolidated assets and liabilities of VIEs included in CFC’s consolidated financial statements, after intercompany eliminations, as of August 31,November 30, 2023 and May 31, 2023.
NATIONAL RURAL UTILITIES COOPERATIVE FINANCE CORPORATION
NOTES TO CONSOLIDATED FINANCIAL STATEMENTS
(UNAUDITED)
Table 13.1: Consolidated Assets and Liabilities of Variable Interest Entities
| | (Dollars in thousands) | (Dollars in thousands) | | August 31, 2023 | | May 31, 2023 | (Dollars in thousands) | | November 30, 2023 | | May 31, 2023 |
| Assets: | Assets: | | | | | Assets: | | | | |
| Loans outstanding | Loans outstanding | | $ | 1,462,423 | | | $ | 1,444,662 | | Loans outstanding | | $ | 1,492,683 | | | $ | 1,444,662 | |
| Other assets | Other assets | | 8,017 | | | 12,612 | | Other assets | | 20,438 | | | 12,612 | |
| Total assets | Total assets | | $ | 1,470,440 | | | $ | 1,457,274 | | Total assets | | $ | 1,513,121 | | | $ | 1,457,274 | |
| | Liabilities: | Liabilities: | | Liabilities: | |
| Total liabilities | Total liabilities | | $ | 19,118 | | | $ | 19,704 | | Total liabilities | | $ | 7,287 | | | $ | 19,704 | |
____________________________
(1) Total liabilities decreased $12 million as of November 30, 2023, compared to May 31, 2023, primarily due to the early redemption of $12 million members’ subordinated certificates in connection with the consolidation of RTFC and NCSC. See “Note 1—Summary of Significant Accounting Policies” in this Report for additional information on the consolidation of RTFC and NCSC.
The following table provides information on CFC’s credit commitments to NCSC and RTFC and potential exposure to loss under these commitments as of August 31,November 30, 2023 and May 31, 2023.
Table 13.2: CFC Exposure Under Credit Commitments to NCSC and RTFC
| | (Dollars in thousands) | (Dollars in thousands) | | August 31, 2023 | | May 31, 2023 | (Dollars in thousands) | | November 30, 2023 | | May 31, 2023 |
| CFC credit commitments to NCSC and RTFC: | CFC credit commitments to NCSC and RTFC: | | | | | CFC credit commitments to NCSC and RTFC: | | | | |
| Total CFC credit commitments | Total CFC credit commitments | | $ | 5,500,000 | | | $ | 5,500,000 | | Total CFC credit commitments | | $ | 5,500,000 | | | $ | 5,500,000 | |
| | Outstanding commitments: | Outstanding commitments: | | Outstanding commitments: | |
Borrowings payable to CFC(1) | Borrowings payable to CFC(1) | | 1,442,215 | | | 1,428,886 | | Borrowings payable to CFC(1) | | 1,481,837 | | | 1,428,886 | |
| Credit enhancements: | Credit enhancements: | | Credit enhancements: | |
| CFC third-party guarantees | CFC third-party guarantees | | 16,679 | | | 15,263 | | CFC third-party guarantees | | 22,866 | | | 15,263 | |
| Other credit enhancements | Other credit enhancements | | 1,274 | | | 2,038 | | Other credit enhancements | | 1,156 | | | 2,038 | |
Total credit enhancements(2) | Total credit enhancements(2) | | 17,953 | | | 17,301 | | Total credit enhancements(2) | | 24,022 | | | 17,301 | |
| Total outstanding commitments | Total outstanding commitments | | 1,460,168 | | | 1,446,187 | | Total outstanding commitments | | 1,505,859 | | | 1,446,187 | |
CFC credit commitments available(3) | CFC credit commitments available(3) | | $ | 4,039,832 | | | $ | 4,053,813 | | CFC credit commitments available(3) | | $ | 3,994,141 | | | $ | 4,053,813 | |
____________________________
(1) Intercompany borrowings payable by NCSC and RTFC to CFC are eliminated in consolidation.
(2) Excludes interest due on these instruments.
(3) Represents total CFC credit commitments less outstanding commitments as of each period end.
NATIONAL RURAL UTILITIES COOPERATIVE FINANCE CORPORATION
NOTES TO CONSOLIDATED FINANCIAL STATEMENTS
(UNAUDITED)
Under a loan and security agreement with CFC, NCSC has access to a $1,500 million revolving line of credit and a $1,500 million revolving term loan from CFC, which will mature in 2067. Under a loan and security agreement with CFC, RTFC has access to a $1,000 million revolving line of credit and a $1,500 million revolving term loan from CFC, which mature in 2067. CFC loans to NCSC and RTFC are secured by all assets and revenue of NCSC and RTFC. CFC’s maximum potential exposure, including interest due, for the credit enhancements totaled $18$24 million as of August 31,November 30, 2023. The maturities for obligations guaranteed by CFC extend through 2031.2030.
In connection with the consolidation of RTFC and NCSC, as discussed above under “Note 1—Summary of Significant Accounting Policies”, on December 1, 2023, the NCSC loan and security agreement with CFC was amended to assume the RTFC loan and security agreement with CFC and revise the amount available thereunder. As a result, NCSC has access to $2,000 million revolving line of credit and a $3,000 million revolving term loan from CFC which will mature in 2067.
NATIONAL RURAL UTILITIES COOPERATIVE FINANCE CORPORATION
NOTES TO CONSOLIDATED FINANCIAL STATEMENTS
(UNAUDITED)
| | |
| NOTE 14—BUSINESS SEGMENTS |
Our activities are conducted through three operating segments, which are based on each of the legal entities included in our consolidated financial statements: CFC, NCSC and RTFC. We report segment information for CFC separately; however, we aggregate segment information for NCSC and RTFC into one reportable segment because neither entity meets the quantitative materiality threshold for separate reporting under the accounting guidance governing segment reporting. We present the results of our business segments on the basis in which management internally evaluates operating performance to establish short- and long-term performance goals, develop budgets and forecasts, identify potential trends, allocate resources and make compensation decisions. We describe the business segment reporting methodology in “Note 16—Business Segments” to the Consolidated Financial Statements in our 2023 Form 10-K.
Segment Results and Reconciliation
The following tables display segment results of operations for the three months ended August 31, 2023Q2 FY2024 and 2022,YTD FY2024, and Q2 FY2023 and YTD FY2023, assets attributable to each segment as of August 31,November 30, 2023 and August 31,November 30, 2022 and a reconciliation of total segment amounts to our consolidated total amounts.
NATIONAL RURAL UTILITIES COOPERATIVE FINANCE CORPORATION
NOTES TO CONSOLIDATED FINANCIAL STATEMENTS
(UNAUDITED)
Table 14.1: Business Segment Information
| | | | | | | | | | | | | | | | | | | | | | | | | | | | | | | | | | | | | | |
| | | Three Months Ended August 31, 2023 |
| (Dollars in thousands) | | CFC | | NCSC and RTFC | | Segments Total | | Reclasses and Adjustments(1) | | Intersegment Eliminations(2) | | Consolidated Total |
| Results of operations: | | | | | | | | | | | | |
| Interest income | | $ | 378,630 | | | $ | 19,032 | | | $ | 397,662 | | | $ | — | | | $ | (16,706) | | | $ | 380,956 | |
| Interest expense | | (316,273) | | | (16,714) | | | (332,987) | | | — | | | 16,706 | | | (316,281) | |
| Derivative cash settlements interest income | | 27,837 | | | 32 | | | 27,869 | | | (27,869) | | | — | | | — | |
| Interest expense | | (288,436) | | | (16,682) | | | (305,118) | | | (27,869) | | | 16,706 | | | (316,281) | |
| Net interest income | | 90,194 | | | 2,350 | | | 92,544 | | | (27,869) | | | — | | | 64,675 | |
| Provision for credit losses | | (800) | | | (902) | | | (1,702) | | | — | | | 902 | | | (800) | |
| Net interest income after provision for credit losses | | 89,394 | | | 1,448 | | | 90,842 | | | (27,869) | | | 902 | | | 63,875 | |
| Non-interest income: | |
| | | | | | | | | | |
| Fee and other income | | 6,327 | | | 1,666 | | | 7,993 | | | — | | | (3,456) | | | 4,537 | |
| Derivative gains: | | | | | | | | | | | | |
| Derivative cash settlements interest income | | — | | | — | | | — | | | 27,869 | | | — | | | 27,869 | |
| Derivative forward value gains | | — | | | — | | | — | | | 162,018 | | | — | | | 162,018 | |
| Derivative gains | | — | | | — | | | — | | | 189,887 | | | — | | | 189,887 | |
| Investment securities gains | | 2,933 | | | — | | | 2,933 | | | — | | | — | | | 2,933 | |
| Total non-interest income | | 9,260 | | | 1,666 | | | 10,926 | | | 189,887 | | | (3,456) | | | 197,357 | |
| Non-interest expense: | | | | | | | | | | | | |
| General and administrative expenses | | (30,936) | | | (2,763) | | | (33,699) | | | — | | | 2,196 | | | (31,503) | |
| Losses on early extinguishment of debt | | (939) | | | — | | | (939) | | | — | | | — | | | (939) | |
| Other non-interest expense | | (177) | | | (359) | | | (536) | | | — | | | 358 | | | (178) | |
| Total non-interest expense | | (32,052) | | | (3,122) | | | (35,174) | | | — | | | 2,554 | | | (32,620) | |
| Income (loss) before income taxes | | 66,602 | | | (8) | | | 66,594 | | | 162,018 | | | — | | | 228,612 | |
| Income tax provision | | — | | | (328) | | | (328) | | | — | | | — | | | (328) | |
| Net income (loss) | | $ | 66,602 | | | $ | (336) | | | $ | 66,266 | | | $ | 162,018 | | | $ | — | | | $ | 228,284 | |
| | | | | | | | | | | | |
| | August 31, 2023 |
| | CFC | | NCSC and RTFC | | Segments Total | | Reclasses and Adjustments(1) | | Intersegment Eliminations(2) | | Consolidated Total |
| Assets: | | | | | | | | | | | | |
| Total loans outstanding | | $ | 33,063,285 | | | $ | 1,462,423 | | | $ | 34,525,708 | | | $ | — | | | $ | (1,442,215) | | | $ | 33,083,493 | |
| Deferred loan origination costs | | 13,153 | | | — | | | 13,153 | | | — | | | — | | | 13,153 | |
| Loans to members | | 33,076,438 | | | 1,462,423 | | | 34,538,861 | | | — | | | (1,442,215) | | | 33,096,646 | |
| Less: Allowance for credit losses | | (54,926) | | | (4,572) | | | (59,498) | | | — | | | 4,572 | | | (54,926) | |
| Loans to members, net | | 33,021,512 | | | 1,457,851 | | | 34,479,363 | | | — | | | (1,437,643) | | | 33,041,720 | |
| Other assets | | 1,644,426 | | | 76,321 | | | 1,720,747 | | | — | | | (68,304) | | | 1,652,443 | |
| Total assets | | $ | 34,665,938 | | | $ | 1,534,172 | | | $ | 36,200,110 | | | $ | — | | | $ | (1,505,947) | | | $ | 34,694,163 | |
| | | | | | | | | | | | | | | | | | | | | | | | | | | | | | | | | | | | | | |
| | | Q2 FY2024 |
| (Dollars in thousands) | | CFC | | NCSC and RTFC | | Segments Total | | Reclasses and Adjustments(1) | | Intersegment Eliminations(2) | | Consolidated Total |
| Results of operations: | | | | | | | | | | | | |
| Interest income | | $ | 386,659 | | | $ | 20,016 | | | $ | 406,675 | | | $ | — | | | $ | (17,688) | | | $ | 388,987 | |
| Interest expense | | (323,828) | | | (17,705) | | | (341,533) | | | — | | | 17,688 | | | (323,845) | |
| Derivative cash settlements interest income | | 28,728 | | | 39 | | | 28,767 | | | (28,767) | | | — | | | — | |
| Interest expense | | (295,100) | | | (17,666) | | | (312,766) | | | (28,767) | | | 17,688 | | | (323,845) | |
| Net interest income | | 91,559 | | | 2,350 | | | 93,909 | | | (28,767) | | | — | | | 65,142 | |
| Provision for credit losses | | (628) | | | (362) | | | (990) | | | — | | | 362 | | | (628) | |
| Net interest income after provision for credit losses | | 90,931 | | | 1,988 | | | 92,919 | | | (28,767) | | | 362 | | | 64,514 | |
| Non-interest income: | | | | | | | | | | | | |
| Fee and other income | | 8,358 | | | 1,296 | | | 9,654 | | | — | | | (3,043) | | | 6,611 | |
| Derivative gains: | | | | | | | | | | | | |
| Derivative cash settlements interest income | | — | | | — | | | — | | | 28,767 | | | — | | | 28,767 | |
| Derivative forward value gains | | — | | | — | | | — | | | 78,171 | | | — | | | 78,171 | |
| Derivative gains | | — | | | — | | | — | | | 106,938 | | | — | | | 106,938 | |
| Investment securities gains | | 1,843 | | | — | | | 1,843 | | | — | | | — | | | 1,843 | |
| Total non-interest income | | 10,201 | | | 1,296 | | | 11,497 | | | 106,938 | | | (3,043) | | | 115,392 | |
| Non-interest expense: | | | | | | | | | | | | |
| General and administrative expenses | | (30,467) | | | (3,284) | | | (33,751) | | | — | | | 2,239 | | | (31,512) | |
| Losses on early extinguishment of debt | | (26) | | | — | | | (26) | | | — | | | — | | | (26) | |
| Other non-interest expense | | (248) | | | (444) | | | (692) | | | — | | | 442 | | | (250) | |
| Total non-interest expense | | (30,741) | | | (3,728) | | | (34,469) | | | — | | | 2,681 | | | (31,788) | |
| Income (loss) before income taxes | | 70,391 | | | (444) | | | 69,947 | | | 78,171 | | | — | | | 148,118 | |
| Income tax provision | | — | | | (83) | | | (83) | | | — | | | — | | | (83) | |
| Net income (loss) | | $ | 70,391 | | | $ | (527) | | | $ | 69,864 | | | $ | 78,171 | | | $ | — | | | $ | 148,035 | |
| | | | | | | | | | | | |
| | |
| | | | | | | | | | | | |
| | | | | | | | | | | | |
| | | | | | | | | | | | |
| | | | | | | | | | | | |
| | | | | | | | | | | | |
| | | | | | | | | | | | |
| | | | | | | | | | | | |
| | | | | | | | | | | | |
| | | | | | | | | | | | |
NATIONAL RURAL UTILITIES COOPERATIVE FINANCE CORPORATION
NOTES TO CONSOLIDATED FINANCIAL STATEMENTS
(UNAUDITED)
| | | | | | | | | | | | | | | | | | | | | | | | | | | | | | | | | | | | | | |
| | | Q2 FY2023 |
| (Dollars in thousands) | | CFC | | NCSC and RTFC | | Segments Total | | Reclasses and Adjustments(1) | | Intersegment Eliminations(2) | | Consolidated Total |
| Results of operations: | | | | | | | | | | | | |
| Interest income | | $ | 322,252 | | | $ | 13,063 | | | $ | 335,315 | | | $ | — | | | $ | (11,121) | | | $ | 324,194 | |
| Interest expense | | (245,444) | | | (11,121) | | | (256,565) | | | — | | | 11,121 | | | (245,444) | |
| Derivative cash settlements interest income (expense) | | 4,938 | | | (137) | | | 4,801 | | | (4,801) | | | — | | | — | |
| Interest expense | | (240,506) | | | (11,258) | | | (251,764) | | | (4,801) | | | 11,121 | | | (245,444) | |
| Net interest income | | 81,746 | | | 1,805 | | | 83,551 | | | (4,801) | | | — | | | 78,750 | |
| Provision for credit losses | | (11,628) | | | (1,034) | | | (12,662) | | | — | | | 1,034 | | | (11,628) | |
| Net interest income after provision for credit losses | | 70,118 | | | 771 | | | 70,889 | | | (4,801) | | | 1,034 | | | 67,122 | |
| Non-interest income: | | | | | | | | | | | | |
| Fee and other income | | 5,899 | | | 1,695 | | | 7,594 | | | — | | | (3,428) | | | 4,166 | |
| Derivative gains: | | | | | | | | | | | | |
| Derivative cash settlements interest income | | — | | | — | | | — | | | 4,801 | | | — | | | 4,801 | |
| Derivative forward value gains | | — | | | — | | | — | | | 141,989 | | | — | | | 141,989 | |
| Derivative gains | | — | | | — | | | — | | | 146,790 | | | — | | | 146,790 | |
| Investment securities losses | | (493) | | | — | | | (493) | | | — | | | — | | | (493) | |
| Total non-interest income | | 5,406 | | | 1,695 | | | 7,101 | | | 146,790 | | | (3,428) | | | 150,463 | |
| Non-interest expense: | | | | | | | | | | | | |
| General and administrative expenses | | (26,601) | | | (2,675) | | | (29,276) | | | — | | | 2,029 | | | (27,247) | |
| | | | | | | | | | | | |
| Other non-interest expense | | (354) | | | (366) | | | (720) | | | — | | | 365 | | | (355) | |
| Total non-interest expense | | (26,955) | | | (3,041) | | | (29,996) | | | — | | | 2,394 | | | (27,602) | |
| Income (loss) before income taxes | | 48,569 | | | (575) | | | 47,994 | | | 141,989 | | | — | | | 189,983 | |
| Income tax provision | | — | | | (219) | | | (219) | | | — | | | — | | | (219) | |
| Net income (loss) | | $ | 48,569 | | | $ | (794) | | | $ | 47,775 | | | $ | 141,989 | | | $ | — | | | $ | 189,764 | |
| | | | | | | | | | | | |
NATIONAL RURAL UTILITIES COOPERATIVE FINANCE CORPORATION
NOTES TO CONSOLIDATED FINANCIAL STATEMENTS
(UNAUDITED)
| | | | | Three Months Ended August 31, 2022 | | | YTD FY2024 |
| (Dollars in thousands) | (Dollars in thousands) | | CFC | | NCSC and RTFC | | Segments Total | | Reclasses and Adjustments(1) | | Intersegment Eliminations(2) | | Consolidated Total | (Dollars in thousands) | | CFC | | NCSC and RTFC | | Segments Total | | Reclasses and Adjustments(1) | | Intersegment Eliminations(2) | | Consolidated Total |
| Results of operations: | Results of operations: | | | | | | | | | | | | | Results of operations: | | | | | | | | | | | | |
| Interest income | Interest income | | $ | 304,984 | | | $ | 11,936 | | | $ | 316,920 | | | $ | — | | | $ | (9,942) | | | $ | 306,978 | | Interest income | | $ | 765,289 | | | $ | 39,048 | | | $ | 804,337 | | | $ | — | | | $ | (34,394) | | | $ | 769,943 | |
| Interest expense | Interest expense | | (209,468) | | | (9,942) | | | (219,410) | | | — | | | 9,942 | | | (209,468) | | Interest expense | | (640,101) | | | (34,419) | | | (674,520) | | | — | | | 34,394 | | | (640,126) | |
| Derivative cash settlements interest expense | | (10,528) | | | (257) | | | (10,785) | | | 10,785 | | | — | | | — | | |
| Derivative cash settlements interest income | | Derivative cash settlements interest income | | 56,565 | | | 71 | | | 56,636 | | | (56,636) | | | — | | | — | |
| Interest expense | Interest expense | | (219,996) | | | (10,199) | | | (230,195) | | | 10,785 | | | 9,942 | | | (209,468) | | Interest expense | | (583,536) | | | (34,348) | | | (617,884) | | | (56,636) | | | 34,394 | | | (640,126) | |
| Net interest income | Net interest income | | 84,988 | | | 1,737 | | | 86,725 | | | 10,785 | | | — | | | 97,510 | | Net interest income | | 181,753 | | | 4,700 | | | 186,453 | | | (56,636) | | | — | | | 129,817 | |
| Provision for credit losses | Provision for credit losses | | (3,496) | | | (247) | | | (3,743) | | | — | | | 247 | | | (3,496) | | Provision for credit losses | | (1,428) | | | (1,264) | | | (2,692) | | | — | | | 1,264 | | | (1,428) | |
| Net interest income after provision for credit losses | Net interest income after provision for credit losses | | 81,492 | | | 1,490 | | | 82,982 | | | 10,785 | | | 247 | | | 94,014 | | Net interest income after provision for credit losses | | 180,325 | | | 3,436 | | | 183,761 | | | (56,636) | | | 1,264 | | | 128,389 | |
| Non-interest income: | Non-interest income: | | | | | | | | | | | | | Non-interest income: | |
| | | | | | | | | | |
| Fee and other income | Fee and other income | | 5,793 | | | 919 | | | 6,712 | | | — | | | (2,656) | | | 4,056 | | Fee and other income | | 14,685 | | | 2,962 | | | 17,647 | | | — | | | (6,499) | | | 11,148 | |
| Derivative gains: | Derivative gains: | | Derivative gains: | |
| Derivative cash settlements interest expense | | — | | | — | | | — | | | (10,785) | | | — | | | (10,785) | | |
| Derivative cash settlements interest income | | Derivative cash settlements interest income | | — | | | — | | | — | | | 56,636 | | | — | | | 56,636 | |
| Derivative forward value gains | Derivative forward value gains | | — | | | — | | | — | | | 104,372 | | | — | | | 104,372 | | Derivative forward value gains | | — | | | — | | | — | | | 240,189 | | | — | | | 240,189 | |
| Derivative gains | Derivative gains | | — | | | — | | | — | | | 93,587 | | | — | | | 93,587 | | Derivative gains | | — | | | — | | | — | | | 296,825 | | | — | | | 296,825 | |
| Investment securities losses | | (3,679) | | | — | | | (3,679) | | | — | | | — | | | (3,679) | | |
| Investment securities gains | | Investment securities gains | | 4,776 | | | — | | | 4,776 | | | — | | | — | | | 4,776 | |
| Total non-interest income | Total non-interest income | | 2,114 | | | 919 | | | 3,033 | | | 93,587 | | | (2,656) | | | 93,964 | | Total non-interest income | | 19,461 | | | 2,962 | | | 22,423 | | | 296,825 | | | (6,499) | | | 312,749 | |
| Non-interest expense: | Non-interest expense: | | | | | | | | | | | | | Non-interest expense: | | | | | | | | | | | | |
| General and administrative expenses | General and administrative expenses | | (25,012) | | | (2,535) | | | (27,547) | | | — | | | 2,028 | | | (25,519) | | General and administrative expenses | | (61,403) | | | (6,047) | | | (67,450) | | | — | | | 4,435 | | | (63,015) | |
| | Losses on early extinguishment of debt | | Losses on early extinguishment of debt | | (965) | | | — | | | (965) | | | — | | | — | | | (965) | |
| Other non-interest expense | Other non-interest expense | | (322) | | | (381) | | | (703) | | | — | | | 381 | | | (322) | | Other non-interest expense | | (425) | | | (803) | | | (1,228) | | | — | | | 800 | | | (428) | |
| Total non-interest expense | Total non-interest expense | | (25,334) | | | (2,916) | | | (28,250) | | | — | | | 2,409 | | | (25,841) | | Total non-interest expense | | (62,793) | | | (6,850) | | | (69,643) | | | — | | | 5,235 | | | (64,408) | |
| Income (loss) before income taxes | Income (loss) before income taxes | | 58,272 | | | (507) | | | 57,765 | | | 104,372 | | | — | | | 162,137 | | Income (loss) before income taxes | | 136,993 | | | (452) | | | 136,541 | | | 240,189 | | | — | | | 376,730 | |
| Income tax provision | Income tax provision | | — | | | (263) | | | (263) | | | — | | | — | | | (263) | | Income tax provision | | — | | | (411) | | | (411) | | | — | | | — | | | (411) | |
| Net income (loss) | Net income (loss) | | $ | 58,272 | | | $ | (770) | | | $ | 57,502 | | | $ | 104,372 | | | $ | — | | | $ | 161,874 | | Net income (loss) | | $ | 136,993 | | | $ | (863) | | | $ | 136,130 | | | $ | 240,189 | | | $ | — | | | $ | 376,319 | |
| | | August 31, 2022 | | November 30, 2023 |
| | CFC | | NCSC and RTFC | | Segment Total | | Reclasses and Adjustments(1) | | Intersegment Eliminations(2) | | Consolidated Total | | CFC | | NCSC and RTFC | | Segments Total | | Reclasses and Adjustments(1) | | Intersegment Eliminations(2) | | Consolidated Total |
| Assets: | Assets: | | | | | | | | | | | | | Assets: | | | | | | | | | | | | |
| Total loans outstanding | Total loans outstanding | | $ | 30,656,301 | | | $ | 1,197,504 | | | $ | 31,853,805 | | | $ | — | | | $ | (1,178,809) | | | $ | 30,674,996 | | Total loans outstanding | | $ | 33,529,392 | | | $ | 1,492,683 | | | $ | 35,022,075 | | | $ | — | | | $ | (1,481,837) | | | $ | 33,540,238 | |
| Deferred loan origination costs | Deferred loan origination costs | | 12,335 | | | — | | | 12,335 | | | — | | | — | | | 12,335 | | Deferred loan origination costs | | 13,351 | | | — | | | 13,351 | | | — | | | — | | | 13,351 | |
| Loans to members | Loans to members | | 30,668,636 | | | 1,197,504 | | | 31,866,140 | | | — | | | (1,178,809) | | | 30,687,331 | | Loans to members | | 33,542,743 | | | 1,492,683 | | | 35,035,426 | | | — | | | (1,481,837) | | | 33,553,589 | |
| Less: Allowance for credit losses | Less: Allowance for credit losses | | (71,056) | | | (2,982) | | | (74,038) | | | — | | | 2,982 | | | (71,056) | | Less: Allowance for credit losses | | (55,554) | | | (4,934) | | | (60,488) | | | — | | | 4,934 | | | (55,554) | |
| Loans to members, net | Loans to members, net | | 30,597,580 | | | 1,194,522 | | | 31,792,102 | | | — | | | (1,175,827) | | | 30,616,275 | | Loans to members, net | | 33,487,189 | | | 1,487,749 | | | 34,974,938 | | | — | | | (1,476,903) | | | 33,498,035 | |
| Other assets | Other assets | | 1,456,295 | | | 97,694 | | | 1,553,989 | | | — | | | (87,970) | | | 1,466,019 | | Other assets | | 1,991,729 | | | 75,449 | | | 2,067,178 | | | — | | | (55,010) | | | 2,012,168 | |
| Total assets | Total assets | | $ | 32,053,875 | | | $ | 1,292,216 | | | $ | 33,346,091 | | | $ | — | | | $ | (1,263,797) | | | $ | 32,082,294 | | Total assets | | $ | 35,478,918 | | | $ | 1,563,198 | | | $ | 37,042,116 | | | $ | — | | | $ | (1,531,913) | | | $ | 35,510,203 | |
NATIONAL RURAL UTILITIES COOPERATIVE FINANCE CORPORATION
NOTES TO CONSOLIDATED FINANCIAL STATEMENTS
(UNAUDITED)
| | | | | | | | | | | | | | | | | | | | | | | | | | | | | | | | | | | | | | |
| | | YTD FY2023 |
| (Dollars in thousands) | | CFC | | NCSC and RTFC | | Segments Total | | Reclasses and Adjustments(1) | | Intersegment Eliminations(2) | | Consolidated Total |
| Results of operations: | | | | | | | | | | | | |
| Interest income | | $ | 627,236 | | | $ | 24,999 | | | $ | 652,235 | | | $ | — | | | $ | (21,063) | | | $ | 631,172 | |
| Interest expense | | (454,912) | | | (21,063) | | | (475,975) | | | — | | | 21,063 | | | (454,912) | |
| Derivative cash settlements interest expense | | (5,590) | | | (394) | | | (5,984) | | | 5,984 | | | — | | | — | |
| Interest expense | | (460,502) | | | (21,457) | | | (481,959) | | | 5,984 | | | 21,063 | | | (454,912) | |
| Net interest income | | 166,734 | | | 3,542 | | | 170,276 | | | 5,984 | | | — | | | 176,260 | |
| Provision for credit losses | | (15,124) | | | (1,281) | | | (16,405) | | | — | | | 1,281 | | | (15,124) | |
| Net interest income after provision for credit losses | | 151,610 | | | 2,261 | | | 153,871 | | | 5,984 | | | 1,281 | | | 161,136 | |
| Non-interest income: | | | | | | | | | | | | |
| Fee and other income | | 11,692 | | | 2,614 | | | 14,306 | | | — | | | (6,084) | | | 8,222 | |
| Derivative gains: | | | | | | | | | | | | |
| Derivative cash settlements interest expense | | — | | | — | | | — | | | (5,984) | | | — | | | (5,984) | |
| Derivative forward value gains | | — | | | — | | | — | | | 246,361 | | | — | | | 246,361 | |
| Derivative gains | | — | | | — | | | — | | | 240,377 | | | — | | | 240,377 | |
| Investment securities losses | | (4,172) | | | — | | | (4,172) | | | — | | | — | | | (4,172) | |
| Total non-interest income | | 7,520 | | | 2,614 | | | 10,134 | | | 240,377 | | | (6,084) | | | 244,427 | |
| Non-interest expense: | | | | | | | | | | | | |
| General and administrative expenses | | (51,613) | | | (5,210) | | | (56,823) | | | — | | | 4,057 | | | (52,766) | |
| | | | | | | | | | | | |
| Other non-interest expense | | (676) | | | (747) | | | (1,423) | | | — | | | 746 | | | (677) | |
| Total non-interest expense | | (52,289) | | | (5,957) | | | (58,246) | | | — | | | 4,803 | | | (53,443) | |
| Income (loss) before income taxes | | 106,841 | | | (1,082) | | | 105,759 | | | 246,361 | | | — | | | 352,120 | |
| Income tax provision | | — | | | (482) | | | (482) | | | — | | | — | | | (482) | |
| Net income (loss) | | $ | 106,841 | | | $ | (1,564) | | | $ | 105,277 | | | $ | 246,361 | | | $ | — | | | $ | 351,638 | |
| | | | | | | | | | | | |
| | November 30, 2022 |
| | CFC | | NCSC and RTFC | | Segment Total | | Reclasses and Adjustments(1) | | Intersegment Eliminations(2) | | Consolidated Total |
| Assets: | | | | | | | | | | | | |
| Total loans outstanding | | $ | 31,545,440 | | | $ | 1,387,933 | | | $ | 32,933,373 | | | $ | — | | | $ | (1,368,549) | | | $ | 31,564,824 | |
| Deferred loan origination costs | | 12,527 | | | — | | | 12,527 | | | — | | | — | | | 12,527 | |
| Loans to members | | 31,557,967 | | | 1,387,933 | | | 32,945,900 | | | — | | | (1,368,549) | | | 31,577,351 | |
| Less: Allowance for credit losses | | (67,615) | | | (4,016) | | | (71,631) | | | — | | | 4,016 | | | (67,615) | |
| Loans to members, net | | 31,490,352 | | | 1,383,917 | | | 32,874,269 | | | — | | | (1,364,533) | | | 31,509,736 | |
| Other assets | | 1,667,517 | | | 97,712 | | | 1,765,229 | | | — | | | (86,595) | | | 1,678,634 | |
| Total assets | | $ | 33,157,869 | | | $ | 1,481,629 | | | $ | 34,639,498 | | | $ | — | | | $ | (1,451,128) | | | $ | 33,188,370 | |
____________________________
(1)Consists of (i) the reclassification of net periodic derivative settlement interest expense amounts, which we report as a component of interest expense for business segment reporting purposes but is included in derivatives gains (losses) in our consolidated total results and (ii) derivative forward value gains and losses, which we exclude from our business segment results but is included in derivatives gains (losses) in our consolidated total results.
(2)Consists of intercompany borrowings payable by NCSC and RTFC to CFC and the interest related to those borrowings, management fees paid by NCSC and RTFC to CFC and other intercompany amounts, all of which are eliminated in consolidation.
Item 3. Quantitative and Qualitative Disclosures About Market Risk
For quantitative and qualitative disclosures about market risk, see “Part I—Item 2. MD&A—Market Risk” and “Note 9—Derivative Instruments and Hedging Activities.”
Item 4. Controls and Procedures
As of the end of the period covered by this report, senior management, including the Chief Executive Officer and Chief Financial Officer, evaluated the effectiveness of our disclosure controls and procedures as defined in Rules 13a-15(e) and 15d-15(e) of the Securities Exchange Act of 1934. Based on this evaluation process, the Chief Executive Officer and Chief Financial Officer concluded that our disclosure controls and procedures are effective. There were no changes in our internal control over financial reporting that occurred during the three months ended August 31,November 30, 2023 that have materially affected, or are reasonably likely to materially affect, our internal control over financial reporting.
PART II—OTHER INFORMATION
Item 1. Legal Proceedings
From time to time, CFC is subject to certain legal proceedings and claims in the ordinary course of business, including litigation with borrowers related to enforcement or collection actions. Management presently believes that the ultimate outcome of these proceedings, individually and in the aggregate, will not materially harm our financial position, liquidity or results of operations. CFC establishes reserves for specific legal matters when it determines that the likelihood of an unfavorable outcome is probable and the loss is reasonably estimable. Accordingly, no reserve has been recorded with respect to any legal proceedings at this time.
Item 1A. Risk Factors
Our financial condition, results of operations and liquidity are subject to various risks and uncertainties, some of which are inherent in the financial services industry and others of which are more specific to our own business. We identify and discuss the most significant risk factors of which we are currently aware that could have a material adverse impact on our business, results of operations, financial condition or liquidity in the section “Part I—Item 1A. Risk Factors” in our 2023 Form 10-K, as filed with the SEC on August 2, 2023. We are not aware of any material changes in the risk factors identified in our 2023 Form 10-K. However, other risks and uncertainties, including those not currently known to us, could also negatively impact our business, results of operations, financial condition and liquidity. Therefore, the risk factors identified and discussed in our 2023 Form 10-K should not be considered a complete discussion of all the risks and uncertainties we may face. For information on how we manage our key risks, see “Item 7. MD&A—Enterprise Risk Management” in our 2023 Form 10-K.
Item 2. Unregistered Sales of Equity Securities and Use of Proceeds and Issuer Purchases of Equity Securities
Not applicable.
Item 3. Defaults Upon Senior Securities
Not applicable.
Item 4. Mine Safety Disclosures
Not applicable.
Item 5. Other Information
None.
Item 6. Exhibits
The following exhibits are incorporated by reference or filed as part of this Report.
EXHIBIT INDEX
| | | | | | | | |
| Exhibit No. | | Description |
| 10.1* | — | |
| 10.2* | — | |
| 10.3* | — | |
| 10.4* | — | |
| 10.5* | — | |
| 10.6* | — | |
| 31.1* | — | |
| 31.2* | — | |
| 32.1† | — | |
| 32.2† | — | |
| 101.INS | — | Inline XBRL Instance Document - the instance document does not appear in the Interactive Data File because its XBRL tags are embedded within the Inline XBRL document. |
| 101.SCH* | — | Inline XBRL Taxonomy Extension Schema Document |
| 101.CAL* | — | Inline XBRL Taxonomy Calculation Linkbase Document |
| 101.LAB* | — | Inline XBRL Taxonomy Label Linkbase Document |
| 101.PRE* | — | Inline XBRL Taxonomy Presentation Linkbase Document |
| 101.DEF* | — | Inline XBRL Taxonomy Definition Linkbase Document |
| 104 | — | Cover Page Interactive Data File (formatted as Inline XBRL and contained in Exhibit 101) |
____________________________
* Filed herewith this Report.
† Furnished with this Report, which shall not be deemed “filed” for purposes of Section 18 of the Securities Exchange Act of 1934, or otherwise subject to the liability of that Section.
SIGNATURES
Pursuant to the requirements of the Securities Exchange Act of 1934, the registrant has duly caused this report to be signed on its behalf by the undersigned thereunto duly authorized.
| | |
| NATIONAL RURAL UTILITIES |
| COOPERATIVE FINANCE CORPORATION |
Date: OctoberJanuary 12, 20232024
| | | | | |
| By: | /s/ YU LING WANG |
| Yu Ling Wang |
| Senior Vice President and Chief Financial Officer |
| | | | | | | | |
| | | By: | /s/ PANKAJ SHAH |
| | | | Pankaj Shah |
| | | | Vice President and Controller
(Principal Accounting Officer) |