0000070858us-gaap:ResidentialPortfolioSegmentMemberbac:ChapterSevenBankruptcyMember2020-07-012020-09-300000070858bac:MeasurementInputLongDatedEquityVolatilitiesMemberus-gaap:FairValueMeasurementsRecurringMemberbac:ValuationTechniqueIndustryStandardDerivativePricingMemberus-gaap:EquityContractMemberus-gaap:FairValueInputsLevel3Membersrt:MinimumMember2019-12-31 UNITED STATES
SECURITIES AND EXCHANGE COMMISSION
Washington, D.C. 20549
FORM 10-Q
(Mark One)
[ü] ☑QUARTERLY REPORT PURSUANT TO SECTION 13 OR 15(d) OF THE SECURITIES
EXCHANGE ACT OF 1934
For the Quarterly Period Ended September 30, 20172020
or
[ ] ☐TRANSITION REPORT PURSUANT TO SECTION 13 OR 15(d) OF THE SECURITIES
EXCHANGE ACT OF 1934
For the transition period from to
Commission file number:
1-6523
Exact name of registrant as specified in its charter:
Bank of America Corporation
State or other jurisdiction of incorporation or organization:
Delaware
IRS Employer Identification No.:
56-0906609
Address of principal executive offices:
Bank of America Corporate Center
100 N. Tryon Street
Charlotte, North Carolina 28255
Registrant'sRegistrant’s telephone number, including area code:
(704) 386-5681
Former name, former address and former fiscal year, if changed since last report:
Securities registered pursuant to Section 12(b) of the Act:
| | | | | | | | |
| Title of each class | Trading Symbol(s) | Name of each exchange on which registered |
| Common Stock, par value $0.01 per share | BAC | New York Stock Exchange |
| Depositary Shares, each representing a 1/1,000th interest in a share | BAC PrE | New York Stock Exchange |
| of Floating Rate Non-Cumulative Preferred Stock, Series E |
| Depositary Shares, each representing a 1/1,000th interest in a share | BAC PrC | New York Stock Exchange |
| of 6.200% Non-Cumulative Preferred Stock, Series CC |
| Depositary Shares, each representing a 1/1,000th interest in a share | BAC PrA | New York Stock Exchange |
| of 6.000% Non-Cumulative Preferred Stock, Series EE |
| Depositary Shares, each representing a 1/1,000th interest in a share | BAC PrB | New York Stock Exchange |
| of 6.000% Non-Cumulative Preferred Stock, Series GG |
| Depositary Shares, each representing a 1/1,000th interest in a share | BAC PrK | New York Stock Exchange |
| of 5.875% Non-Cumulative Preferred Stock, Series HH |
| 7.25% Non-Cumulative Perpetual Convertible Preferred Stock, Series L | BAC PrL | New York Stock Exchange |
| Depositary Shares, each representing a 1/1,200th interest in a share | BML PrG | New York Stock Exchange |
| of Bank of America Corporation Floating Rate |
| Non-Cumulative Preferred Stock, Series 1 |
| | | | | | | | |
| Title of each class | Trading Symbol(s) | Name of each exchange on which registered |
| Depositary Shares, each representing a 1/1,200th interest in a share | BML PrH | New York Stock Exchange |
| of Bank of America Corporation Floating Rate |
| Non-Cumulative Preferred Stock, Series 2 |
| Depositary Shares, each representing a 1/1,200th interest in a share | BML PrJ | New York Stock Exchange |
| of Bank of America Corporation Floating Rate |
| Non-Cumulative Preferred Stock, Series 4 |
| Depositary Shares, each representing a 1/1,200th interest in a share | BML PrL | New York Stock Exchange |
| of Bank of America Corporation Floating Rate |
| Non-Cumulative Preferred Stock, Series 5 |
| Floating Rate Preferred Hybrid Income Term Securities of BAC Capital | BAC/PF | New York Stock Exchange |
| Trust XIII (and the guarantee related thereto) |
| 5.63% Fixed to Floating Rate Preferred Hybrid Income Term Securities | BAC/PG | New York Stock Exchange |
| of BAC Capital Trust XIV (and the guarantee related thereto) |
| Income Capital Obligation Notes initially due December 15, 2066 of | MER PrK | New York Stock Exchange |
| Bank of America Corporation |
| Senior Medium-Term Notes, Series A, Step Up Callable Notes, due | BAC/31B | New York Stock Exchange |
| November 28, 2031 of BofA Finance LLC (and the guarantee |
| of the Registrant with respect thereto) |
Depositary Shares, each representing a 1/1,000th interest in a share of
| BAC PrM | New York Stock Exchange |
| 5.375% Non-Cumulative Preferred Stock, Series KK |
| Depositary Shares, each representing a 1/1,000th interest in a share | BAC PrN | New York Stock Exchange |
| of 5.000% Non-Cumulative Preferred Stock, Series LL |
| Depositary Shares, each representing a 1/1,000th interest in a share of | BAC PrO | New York Stock Exchange |
| 4.375% Non-Cumulative Preferred Stock, Series NN |
Indicate by check mark whether the registrant (1) has filed all reports required to be filed by Section 13 or 15(d) of the Securities Exchange Act of 1934 during the preceding 12 months (or for such shorter period that the registrant was required to file such reports), and (2) has been subject to such filing requirements for the past 90 days.
Yes ü ☑No☐
Indicate by check mark whether the registrant has submitted electronically and posted on its corporate Web site, if any, every Interactive Data File required to be submitted and posted pursuant to Rule 405 of Regulation S-T (§ 232.405 of this chapter) during the preceding 12 months (or for such shorter period that the registrant was required to submit and post such files).
Yes ü ☑No☐
Indicate by check mark whether the registrant is a large accelerated filer, an accelerated filer, a non-accelerated filer, a smaller reporting company, or an emerging growth company. See the definitions of "large“large accelerated filer," "accelerated” “accelerated filer," "smaller” “smaller reporting company,"” and "emerging“emerging growth company"company” in Rule 12b-2 of the Exchange Act (check one).
|
| | | | | | | | | | | | | | | | | | | | | | | | | | | | | | | |
Large accelerated filerü | ☑ | | Accelerated filer | ☐ | | Non-accelerated filer (do not check if a smaller
reporting company)
| ☐ | | Smaller reporting company | ☐ |
Emerging growth company☐
YesNo ü
If an emerging growth company, indicate by check mark if the registrant has elected not to use the extended transition period for complying with any new or revised financial accounting standards provided pursuant to Section 13(a) of the Exchange Act.☐
YesNo
Indicate by check mark whether the registrant is a shell company (as defined in Exchange Act Rule 12b-2).
Yes☐No ü☑
On October 27, 2017,29, 2020, there were 10,430,613,6758,650,789,694 shares of Bank of America Corporation Common Stock outstanding.
Bank of America Corporation and Subsidiaries
September 30, 20172020
Form 10-Q
INDEX
Part I. Financial Information
|
| | | | | | | |
| Item 1. Financial Statements | | Page |
| | |
| | |
| | |
| | |
| | |
| | |
| | |
| | |
| | |
| | |
| | |
| | |
| | |
| | |
| | |
| | |
| | |
| | |
| | |
| | |
| | |
| | |
| | |
| | |
| | |
| | |
| | |
| | |
| | |
| | | | | | | | |
| | |
Item 2. Management'sManagement’s Discussion and Analysis of Financial Condition and Results of Operations | | |
| | |
| | |
| | |
| | |
| | 8 | |
| | |
| | |
| | |
| | |
| | |
| | |
| | |
| | |
| | |
| | |
| | |
| | |
| | |
| | |
| | |
| | |
| | |
| | |
| | |
| | |
| | |
| | |
| | |
| | |
| | |
| | |
| | |
| | |
| | |
| | |
| | |
| | |
Part II. Other Information
Part II. Other Information
Item 2. Management’s Discussion and Analysis of Financial Condition and Results of Operations
Bank of America Corporation (the "Corporation"“Corporation”) and its management may make certain statements that constitute "forward-looking statements"“forward-looking statements” within the meaning of the Private Securities Litigation Reform Act of 1995. These statements can be identified by the fact that they do not relate strictly to historical or current facts. Forward-looking statements often use words such as “anticipates,” “targets,” “expects,” “hopes,” “estimates,” “intends,” “plans,” “goals,” “believes,” “continue"“continue” and other similar expressions or future or conditional verbs such as “will,” “may,” “might,” “should,” “would” and “could.” Forward-looking statements represent the Corporation'sCorporation’s current expectations, plans or forecasts of its future results, revenues, provision for credit losses, expenses, efficiency ratio, capital measures, strategy, and future business and economic conditions more generally, and other future matters. These statements are not guarantees of future results or performance and involve certain known and unknown risks, uncertainties and assumptions that are difficult to predict and are often beyond the Corporation'sCorporation’s control. Actual outcomes and results may differ materially from those expressed in, or implied by, any of these forward-looking statements.
You should not place undue reliance on any forward-looking statement and should consider the following uncertainties and risks, as well as the risks and uncertainties more fully discussed under Item 1A. Risk Factors of our 20162019 Annual Report on Form 10-K and in any of the Corporation’s subsequent Securities and Exchange Commission filings: the Corporation’s potential judgments, claims, damages, penalties, fines and reputational damage resulting from pending or future litigation and regulatory proceedings and enforcementgovernment actions, including inquiries intoas a result of our retail sales practices,participation in and execution of government programs related to the Coronavirus Disease 2019 (COVID-19) pandemic; the possibility that amountsthe Corporation’s future liabilities may be in excess of the Corporation’sits recorded liability and estimated range of possible loss for litigation, regulatory, and representations and warranties exposures; the possibility that the Corporation could face increased servicing, securities, fraud, indemnity, contribution or other claims from one or more counterparties, including trustees, purchasers of loans, underwriters, issuers, monolines, private-label and other investors, or other parties involved in securitizations, monolines or private-label and other investors; the possibility that future representations and warranties losses may occur in excess of the Corporation’s recorded liability and estimated range of possible loss for its representations and warranties exposures;securitizations; the Corporation’s ability to resolve representations and warranties repurchase and related claims, including claims brought by investors or trustees seeking to avoid the statute of limitations for repurchase claims; the risks related to the discontinuation of the London Interbank Offered Rate and other reference rates, including increased expenses and litigation and the effectiveness of hedging strategies; uncertainties about the financial stability and growth rates of non-U.S. jurisdictions, the risk that those jurisdictions may face difficulties servicing their sovereign debt, and related stresses on financial markets, currencies and trade, and the Corporation’sCorporation’s exposures to such risks, including direct, indirect and operational; the impact of U.S. and global interest rates, inflation, currency exchange rates,
economic conditions, trade policies and economic conditions;tensions, including tariffs, and potential geopolitical instability; the impact of the interest rate environment
on the Corporation'sCorporation’s business, financial condition and results of operations of a potential higher interest rate environment;operations; the possibility that future credit losses may be higher than currently expected due to changes in economic assumptions, customer behavior, adverse developments with respect to U.S. or global economic conditions and other uncertainties; the impact on the Corporation’s business, financial condition and results of operations from a protracted period of lower oil prices or ongoing volatility with respect to oil prices; the Corporation'sCorporation’s ability to achieve its expense targets orand expectations regarding revenue, net interest income, expectationsprovision for credit losses, net charge-offs, effective tax rate, loan growth or other projections or expectations;projections; adverse changes to the Corporation’sCorporation’s credit ratings from the major credit rating agencies; an inability to access capital markets or maintain deposits or borrowing costs; estimates of the fair value and other accounting values, subject to impairment assessments, of certain of the Corporation’sCorporation’s assets and liabilities; the estimated or actual impact of changes in accounting standards or assumptions in applying those standards; uncertainty regarding the content, timing and impact of regulatory capital and liquidity requirements; the impact of adverse changes to total loss-absorbing capacity requirements, including the approval of our internal models methodology for calculating counterparty credit risk for derivatives;stress capital buffer requirements and/or global systemically important bank surcharges; the potential impact of total loss-absorbing capacity requirements; potential adverse changes to our global systemically important bank surcharge;actions of the potential impactBoard of Governors of the Federal Reserve actionsSystem on the Corporation’s capital plans; the possibleeffect of regulations, other guidance or additional information on the impact offrom the Corporation's failure to remediate shortcomings identified by banking regulators in the Corporation's Resolution Plan or failure to take actions identified therein;Tax Cuts and Jobs Act; the impact of implementation and compliance with U.S. and international laws, regulations and regulatory interpretations, including, but not limited to, recovery and resolution planning requirements, Federal Deposit Insurance Corporation assessments, the Volcker Rule, fiduciary standards, derivatives regulations and derivativesthe Coronavirus Aid, Relief, and Economic Security Act and any similar or related rules and regulations; a failure or disruption in or breach of the Corporation’s operational or security systems or infrastructure, or those of third parties, including as a result of cyber attacks;attacks or campaigns; the impact on the Corporation'sCorporation’s business, financial condition and results of operations from the plannedUnited Kingdom's exit of the United Kingdom from the European Union; the impact of any future federal government shutdown and uncertainty regarding the federal government’s debt limit or changes to the U.S. presidential administration and Congress; the emergence of widespread health emergencies or pandemics, including the magnitude and duration of the COVID-19 pandemic and its impact on the U.S. and/or global economy, financial market conditions and our business, results of operations and financial condition; the impact of natural disasters, military conflict, terrorism or other geopolitical events; and other similar matters.
Forward-looking statements speak only as of the date they are made, and the Corporation undertakes no obligation to update any forward-looking statement to reflect the impact of circumstances or events that arise after the date the forward-looking statement was made.
Notes to the Consolidated Financial Statements referred to in the Management’s Discussion and Analysis of Financial Condition and Results of Operations (MD&A) are incorporated by reference into the MD&A. Certain prior-period amounts have been reclassified to conform to current-period presentation.
Throughout the MD&A, the Corporation uses certain acronyms and abbreviations which are defined in the Glossary.
Executive Summary
Business Overview
The Corporation is a Delaware corporation, a bank holding company (BHC) and a financial holding company. When used in this report, “the Corporation”Corporation,” “we,” “us” and “our” may refer to Bank of America Corporation individually, Bank of America Corporation and its subsidiaries, or certain of Bank of America Corporation’s subsidiaries or affiliates. Our principal executive offices are located in Charlotte, North Carolina. Through our banking and various nonbank subsidiaries throughout the U.S. and in international markets, we provide a diversified range of banking and nonbank financial services and products through four business segments: Consumer Banking, Global Wealth & Investment Management (GWIM), Global Banking and Global Markets, with the remaining operations recorded in All Other. We operate our banking activities primarily under the Bank of America, National Association (Bank of America, N.A. or BANA) charter. At September 30, 2017,2020, the Corporation had approximately $2.3$2.7 trillion in assets and a headcount of approximately 210,000211,000 employees. Headcount remained relatively unchanged since December 31, 2016.
As of September 30, 2017,2020, we operated in all 50 states,served clients through operations across the District of Columbia, the U.S. Virgin Islands, Puerto Rico, its territories and more thanapproximately 35 countries. Our retail banking footprint covers approximately 83 percent ofall major markets in the U.S. population,, and we serve approximately 4766 million consumer and small business relationshipsclients with approximately 4,5004,300 retail financial centers, approximately 16,00017,000 ATMs, and leading digital banking platforms (www.bankofamerica.com) with approximately 34more than 39 million active users, including approximately 2431 million active mobile active users. We offer industry-leading support to approximately three million small business owners.households. Our wealth management businesses, with client balances of approximately $2.7$3.1 trillion, provide tailored solutions to meet client needs through a full set of investment management, brokerage, banking, trust and retirement products. We are a global leader in corporate and investment banking and trading across a broad range of asset classes serving corporations, governments, institutions and individuals around the world.
Third Quarter 2017 Economic and Business Environment
U.S. macroeconomic trends in the third quarter were characterized by a softening in economic growth and low inflation. GDP advanced at a slower pace than the previous quarter. At the same time, inflation remained subdued overall despite some energy-related pressure stemming from the hurricanes that impacted the southern U.S.
Despite sustained growth in the third quarter, the hurricanes added uncertainty to economic forecasts and distorted economic data releases. As a result of the hurricanes, there was an estimated 0.1 to 0.5 percent reduction from annualized GDP growth. Consumer spending slowed in August but recovered, especially vehicle sales, the following month. Business investment in equipment remained buoyant. While nonfarm payroll growth decelerated, the unemployment rate remained low. Despite tight labor market conditions, wage gains were modest.
The Federal Reserve, as expected, kept its target federal funds rate corridor at 1 to 1.25 percent, while announcing that balance
sheet normalization would begin in October. U.S. equities rose in the quarter, in part due to improvement in corporate earnings and despite the realization that domestic fiscal policy changes will likely take longer than previously expected. Despite a late rally, the U.S. dollar index fell primarily on the strength of the euro. Amid a weaker dollar, gold and oil prices both rose. The U.S. yield curve flattened modestly while interest rates increased.
Abroad, eurozone recovery remained robust in the third quarter, maintaining momentum following its best quarter in two years. The more robust economic momentum has failed to translate into stronger inflationary pressures, which remained depressed over the quarter. As a result, the European Central Bank remained cautious about the outlook for monetary policy and it has been carefully evaluating how to extend the ongoing quantitative easing program into next year.
Many survey indicators suggest that the subdued momentum from the first half of the year in the United Kingdom (U.K.) economy has extended into the third quarter. At the same time, inflation continued in an upward trend and reached the highest level since 2012, well above the Bank of England target, driven by the pass-through from the sterling depreciation that followed the Brexit referendum.
In Japan, business surveys suggest that moderate economic momentum remained intact in the third quarter. In China, the service sector remained a key driver of economic growth. The yuan had a volatile third quarter, reaching a one-year high in September with Chinese foreign exchange reserves rising steadily over the quarter.
Recent EventsDevelopments
Capital Management
DuringIn June 2020, the Board of Governors of the Federal Reserve System (Federal Reserve) notified BHCs of their 2020 Comprehensive Capital Analysis and Review (CCAR) supervisory stress test results, which included a preliminary stress capital buffer (SCB) that was finalized in August 2020. Based on our results, we are subject to a 2.5 percent SCB for the period beginning October 1, 2020 and ending on September 30, 2021.
Due to economic uncertainty resulting from the Coronavirus Disease 2019 (COVID-19) pandemic, the Federal Reserve required all large banks to suspend share repurchase programs in the third quarter of 2017, we repurchased approximately $3.0 billion2020, except for repurchases to offset shares awarded under equity-based compensation plans, and to limit dividends to existing rates that do not exceed the average of common stock pursuantthe last four quarters’ net income. In September 2020, the Federal Reserve announced that these measures would remain in place for the fourth quarter of 2020. Large banks will also be required to resubmit and update their capital plans in November
2020 based on the Board's 2017 repurchase authorizationFederal Reserve’s updated supervisory stress test scenarios. The Federal Reserve announced that they will publish the results of $12.9 billion announced on June 28, 2017. Forthe additional information, see Capital Management on page 28. supervisory stress tests by December 31, 2020.
On July 26, 2017,October 21, 2020, the Board of Directors (the Board) declared a quarterly common stock dividend at the current rate of $0.12$0.18 per share, payableshare. We intend to maintain the quarterly common stock dividend at this rate until further notice, subject to approval by the Board. For more information on September 29, 2017our capital resources, see Capital Management on page 23.
COVID-19 Pandemic
As previously disclosed, in the first quarter of 2020, the World Health Organization declared the outbreak of COVID-19 a pandemic. In an attempt to shareholderscontain the spread and impact of recordthe COVID-19 pandemic, travel bans and restrictions, quarantines, shelter-in-place orders and limitations on business activity have been implemented. Additionally, there has been a decline in global economic activity, reduced U.S. and global economic output and a deterioration in macroeconomic conditions in the U.S. and globally. This has resulted in, among other things, high rates of unemployment and underemployment and caused volatility and disruptions in the global financial markets, including the energy and commodity markets. Although some restrictive measures have been eased in certain areas, businesses, market participants, our counterparties and clients, and the U.S. and global economies have been negatively impacted and are likely to be so for an extended period of time, as there remains significant uncertainty about the timing and strength of September 1, 2017.
Series T Preferred Stockan economic recovery.
In connection with an investment inresponse to the Corporation’s Series T 6% Non-cumulative preferred stock (Series T) in 2011,pandemic, the Series T holders also received warrantsCorporation has implemented protocols and processes to purchase 700 million sharesexecute its business continuity plans and help protect its employees and support its clients. The Corporation is managing its response to the COVID-19 pandemic according to its Enterprise Response Framework, which invokes centralized management of the crisis event and the integration of its response. The CEO and key members of the Corporation’s common stock at an exercise pricemanagement team meet regularly with co-leaders of $7.142857 per share. On August 24, 2017, the Series T holders exercisedExecutive Response Team, which is composed of senior executives across the warrantsCorporation, to help drive decisions, communications and acquiredconsistency of response across all businesses and functions. We are also coordinating with global, regional and local authorities and health experts, including the 700 million sharesU.S. Centers for Disease Control and Prevention (CDC) and the World Health Organization.
Additionally, we have implemented a number of measures to assist our employees, clients and the communities we serve as discussed below.
Employees
We are providing support to our teammates to help promote the health and safety of our common stock usingemployees by monitoring guidance from the Series T preferred stock as consideration for the exercise price,CDC, medical boards and health authorities and sharing such guidance with our employees. We are also operating our businesses from remote locations and leveraging our business continuity plans and capabilities.
The Corporation has globally implemented a work-from-home posture, which increased the number of common shares outstanding, but had no effect on diluted earnings per share as this conversion had been includedhas resulted in the Corporation’s diluted earnings per share calculationsubstantial majority of our employees working from home, and pre-planned contingency strategies for site-based operations for our remaining employees. We continue to evaluate our continuity plans and work-from-home strategy in an effort to best protect the health and safety of our employees.
Clients
We continue to leverage our business continuity plans and capabilities to service our clients and meet our clients’ financial needs by offering assistance to clients affected by the COVID-19 pandemic and providing access to credit and the important financial services on which our clients rely. We are also participating in the programs created by the Coronavirus Aid, Relief and Economic Security (CARES Act) and Federal Reserve lending programs for businesses, such as the Paycheck Protection Program (PPP) and Main Street Lending Program, as well as other measures. While most of our deferral programs expired in the third quarter of 2020, we continue to offer assistance on a case-by-case basis when requested by clients affected by the COVID-19 pandemic.
As of September 30 2020, we had approximately 343,000 PPP loans outstanding with balances totaling $24.7 billion, which were recorded in the Consumer, GWIM and Global Banking segments. In addition, we have begun to process applications for forgiveness. For more information on PPP loans, see Credit Risk Management on page 31, and for more information on accounting for PPP loans and loan modifications under the applicableCARES Act, see Note 1 – Summary of Significant Accounting Principles to the Consolidated Financial Statements.
Community Partners
We continue to support the communities where we live and work by engaging in various initiatives to help those affected by COVID-19. These initiatives include committing resources to provide medical supplies, food and other necessities for those in need. We are also supporting racial equality, economic opportunity and environmental sustainability through direct equity investments in minority-owned depository institutions, equity investments in minority entrepreneurs, businesses and funds, as well as other initiatives.
Risk Management
We continue to manage the increased operational risk related to the execution of our business continuity plans in accordance with our Enterprise Response Framework, Risk Framework and Operational Risk Management Program. For more information, see Managing Risk on page 23.
Loan Modifications
The Corporation has implemented various consumer and commercial loan modification programs to provide its borrowers relief from the economic impacts of COVID-19. Based on guidance in the CARES Act that the Corporation adopted, COVID-19 related modifications to consumer and commercial loans that were current as of December 31, 2019 are exempt from troubled debt restructuring (TDR) classification under accounting guidance. The carrying amountprinciples generally accepted in the United States of America (GAAP). In addition, the bank regulatory agencies issued interagency guidance stating that COVID-19 related short-term modifications (i.e., six months or less) granted to consumer or commercial loans that were current as of the Series T was $2.9loan modification program implementation date are not TDRs. For more information, see Note 1 – Summary of Significant Accounting Principles and Note 5 – Outstanding Loans and Leases and Allowance for Credit Lossesto the Consolidated Financial Statements.
We have provided borrowers with relief from the economic impacts of COVID-19 through payment deferral and forbearance programs. A significant portion of deferrals expired in the third quarter of 2020, reflecting a decline in customer requests for assistance.
As of October 21, 2020, deferred consumer and small business loans recorded on the Consolidated Balance Sheet totaled $9.8 billion, consisting of $9.0 billion of residential mortgage and upon conversion, was recorded as additional paid-in capital, increasinghome equity loans, including loans serviced by others, that are well-collateralized, $298 million of consumer credit card loans and $582 million of small business and consumer vehicle loans. For deferred residential mortgage and home equity loans, the Common equity tier 1 capital ratio by 20 basis points.
As of October 21, 2020, excluding small business, deferred commercial balances totaled $1.4 billion, or 0.29 percent of total commercial loans.
3Bank of AmericaOther Related Matters
Selected Financial Data
Table 1 provides selected consolidated financial data forAlthough the macroeconomic outlook improved modestly in the three and nine months ended September 30, 20172020, the future direct and 2016,indirect impact of COVID-19 on our businesses, results of operations and at September 30, 2017financial condition of the Corporation remain highly uncertain. Should current economic conditions persist or deteriorate, this macroeconomic environment will have a continued adverse effect on our businesses and December 31, 2016.results of operations and could have an adverse effect on our financial condition. For more information on how the risks related to the COVID-19 pandemic may adversely affect our businesses, results of operations and financial condition, see Part II, Item 1A. Risk Factors on page 105.
LIBOR and Other Benchmark Rates
As previously disclosed, to facilitate an orderly transition from Interbank Offered Rates (IBORs) and other benchmark rates to alternative reference rates (ARRs), the Corporation has established an enterprise-wide program to identify, assess and monitor risks associated with the expected discontinuation or unavailability of benchmarks, including the London Interbank Offered Rate (LIBOR). As part of this program, the Corporation continues to identify, assess and monitor risks associated with the expected discontinuation or unavailability of LIBOR and other benchmarks. Additionally, the Corporation continues to evaluate and address documentation and contractual mechanics of outstanding IBOR-based products and contracts that may mature after LIBOR is no longer deemed a representative benchmark, as well as new and potential future ARR-based products and contracts to achieve operational readiness.
This program, which is led by the Corporation's Chief Operating Officer, includes active involvement of senior management and regular reports to the Enterprise Risk Committee. The program is structured to address the Corporation's industry and regulatory engagement, client and financial contract changes, internal and external communications, technology and operations modifications, introduction of new products, migration of existing clients, and program strategy and governance.
As the markets for ARRs continue to grow, the Corporation continues to monitor and participate in the development and usage of ARRs, including the Secured Overnight Financing Rate (SOFR) and the Sterling Overnight Index Average (SONIA). The Corporation issued debt and deposits linked to SOFR and SONIA, facilitated debt issuances by clients linked to SOFR and SONIA, and executed SOFR- and SONIA-based derivative contracts to make markets and facilitate client activities.
|
| | | | | | | | | | | | | | | | |
| | | | | | | | | |
| Table 1 | Selected Financial Data | | | | | | | |
| | | Three Months Ended
September 30 | | Nine Months Ended
September 30 |
| (Dollars in millions, except per share information) | 2017 | | 2016 | | 2017 | | 2016 |
| Income statement | |
| | |
| | | | |
| Revenue, net of interest expense | $ | 21,839 |
| | $ | 21,635 |
| | $ | 66,916 |
| | $ | 63,711 |
|
| Net income | 5,587 |
| | 4,955 |
| | 15,712 |
| | 13,210 |
|
| Diluted earnings per common share | 0.48 |
| | 0.41 |
| | 1.35 |
| | 1.10 |
|
| Dividends paid per common share | 0.12 |
| | 0.075 |
| | 0.27 |
| | 0.175 |
|
| Performance ratios | |
| | |
| | | | |
| Return on average assets | 0.98 | % | | 0.90 | % | | 0.93 | % | | 0.81 | % |
| Return on average common shareholders' equity | 8.14 |
| | 7.27 |
| | 7.81 |
| | 6.61 |
|
Return on average tangible common shareholders’ equity (1) | 11.32 |
| | 10.28 |
| | 10.95 |
| | 9.40 |
|
| Efficiency ratio | 60.16 |
| | 62.31 |
| | 62.34 |
| | 65.59 |
|
| | | | | | | | |
| | | | | | September 30
2017 | | December 31
2016 |
| Balance sheet | |
| | |
| | |
| | |
|
| Total loans and leases | | | | | $ | 927,117 |
| | $ | 906,683 |
|
| Total assets | | | | | 2,283,896 |
| | 2,187,702 |
|
| Total deposits | | | | | 1,284,417 |
| | 1,260,934 |
|
| Total common shareholders’ equity | | | | | 250,136 |
| | 241,620 |
|
| Total shareholders’ equity | | | | | 272,459 |
| | 266,840 |
|
| | | | | | | | |
(1)
| | Return on average tangible common shareholders' equity is a non-GAAP financial measure. For additional information and a corresponding reconciliation to accounting principles generally accepted in the United StatesBank of America (GAAP) financial measures, see Non-GAAP Reconciliations on page 67.4
|
In accordance with the industry-wide transition from IBORs to ARRs, central clearing counterparties (CCPs) in Europe and the U.S., which act as intermediaries and require collateral deposits for the clearing and settlement of interest rate swap products and other derivatives, changed the interest rate used to calculate amounts due to counterparties for collateral deposits posted with them from the European Overnight Index Average (EONIA) to the Euro Short-Term Rate (ESTR) and the Effective Fed Funds Rate (EFFR) to SOFR in July and October 2020, respectively. In connection with this transition, the Corporation updated its operational models, systems, procedures and internal infrastructure. The earnings impact from the changes in net valuations of these derivatives was not significant at the point of conversion, as the Corporation either provided or received compensation to/from the CCPs. Additionally, in October 2020, the Corporation and certain of its subsidiaries adhered to the International Swaps and Derivatives Association, Inc. 2020 IBOR Fallbacks Protocol, effective January 25, 2021, which provides a mechanism to enable market participants to incorporate fallbacks for certain legacy non-cleared derivatives linked to certain IBORs. The Corporation continues to monitor the impact of COVID-19 on the market and industry transition to ARRs, including the readiness of impacted clients and their operational readiness to transition to ARRs. For more information on the expected replacement of LIBOR and other benchmark rates, see
Executive Summary - Recent Developments - LIBOR and Other Benchmark Rates in the MD&A and Item 1A. Risk Factors - Other of the Corporation’s 2019 Annual Report on Form 10-K. For more information about the Corporation's risks related to the COVID-19 pandemic, see Part II, Item 1A. Risk Factors on page 105.
Merchant Services Joint Venture
Prior to July 1, 2020, a significant portion of our merchant processing activity was performed by a joint venture in which we held a 49 percent ownership interest. Effective July 1, 2020, the Corporation received its share of the joint venture's merchant contracts and began performing merchant processing services for these merchants. The Corporation records merchant revenue in card income with the related costs in noninterest expense in the Consolidated Statement of Income. For more information, see Note 10 – Commitments and Contingencies to the Consolidated Financial Statements.
Financial Highlights
Effective January 1, 2020, we adopted the new accounting standard on current expected credit losses (CECL), under which the allowance is measured based on management’s best estimate of lifetime expected credit losses (ECL). Prior-year periods presented reflect measurement of the allowance based on management’s estimate of probable incurred credit losses. For more information, see Note 1 – Summary of Significant Accounting Principles to the Consolidated Financial Statements.
| | | | | | | | | | | | | | | | | | | | | | | | | | |
| | | | | | | | |
| Table 1 | Summary Income Statement and Selected Financial Data |
| | | | | | | | |
| | Three Months Ended
September 30 | | Nine Months Ended
September 30 |
| (Dollars in millions, except per share information) | 2020 | | 2019 | | 2020 | | 2019 |
| Income statement | | | | | | | |
| Net interest income | $ | 10,129 | | | $ | 12,187 | | | $ | 33,107 | | | $ | 36,751 | |
| Noninterest income | 10,207 | | | 10,620 | | | 32,322 | | | 32,144 | |
| Total revenue, net of interest expense | 20,336 | | | 22,807 | | | 65,429 | | | 68,895 | |
| Provision for credit losses | 1,389 | | | 779 | | | 11,267 | | | 2,649 | |
| Noninterest expense | 14,401 | | | 15,169 | | | 41,286 | | | 41,661 | |
| Income before income taxes | 4,546 | | | 6,859 | | | 12,876 | | | 24,585 | |
| Income tax expense | (335) | | | 1,082 | | | 452 | | | 4,149 | |
| Net income | 4,881 | | | 5,777 | | | 12,424 | | | 20,436 | |
| Preferred stock dividends | 441 | | | 505 | | | 1,159 | | | 1,186 | |
| Net income applicable to common shareholders | $ | 4,440 | | | $ | 5,272 | | | $ | 11,265 | | | $ | 19,250 | |
| | | | | | | | |
| Per common share information | | | | | | | |
| Earnings | $ | 0.51 | | | $ | 0.57 | | | $ | 1.29 | | | $ | 2.02 | |
| Diluted earnings | 0.51 | | | 0.56 | | | 1.28 | | | 2.01 | |
| Dividends paid | 0.18 | | | 0.18 | | | 0.54 | | | 0.48 | |
| Performance ratios | | | | | | | |
Return on average assets (1) | 0.71 | % | | 0.95 | % | | 0.63 | % | | 1.14 | % |
Return on average common shareholders’ equity (1) | 7.24 | | | 8.48 | | | 6.20 | | | 10.49 | |
Return on average tangible common shareholders’ equity (2) | 10.16 | | | 11.84 | | | 8.71 | | | 14.67 | |
Efficiency ratio (1) | 70.81 | | | 66.51 | | | 63.10 | | | 60.47 | |
| | | | | September 30
2020 | | December 31
2019 |
| | | | | |
| Balance sheet | | | | | | | |
| Total loans and leases | | | | | $ | 955,172 | | | $ | 983,426 | |
| Total assets | | | | | 2,738,452 | | | 2,434,079 | |
| Total deposits | | | | | 1,702,880 | | | 1,434,803 | |
| Total liabilities | | | | | 2,469,602 | | | 2,169,269 | |
| Total common shareholders’ equity | | | | | 245,423 | | | 241,409 | |
| Total shareholders’ equity | | | | | 268,850 | | | 264,810 | |
| | | | | | | |
| | | | | | | |
| | | | | | | |
| | | | | | | |
| | | | | | | |
| | | | | | | |
(1)For definitions, see Key Metrics on page 104.
(2)Return on average tangible common shareholders’ equity is a non-GAAP financial measure. For more information and a corresponding reconciliation to the most closely related financial measures defined by accounting principles generally accepted in the United States of America, see Non-GAAP Reconciliations on page 51.
Net income was $5.6$4.9 billion and $15.7$12.4 billion, or $0.48$0.51 and $1.35$1.28 per diluted share, for the three and nine months ended September 30, 20172020 compared to $5.0$5.8 billion and $13.2$20.4 billion, or $0.41$0.56 and $1.10$2.01 per diluted share, for the same periods in 2016.2019. The results for the three- and nine-month periods compareddecline in net income was primarily due to the same periods in 2016 were primarily driven by higher revenue, lower provision for credit losses driven by the weaker economic outlook related to COVID-19 and noninterest expense.lower net interest income, partially offset by a $2.1 billion pretax impairment charge related to the notice of the termination of the merchant services joint venture in the prior year.
Total assets increased $96.2$304.4 billion from December 31, 20162019 to $2.3$2.7 trillion at September 30, 2017 due to higher trading account assets primarily driven by additional inventory in fixed-income, currencies and commodities (FICC) to meet expected client demand, and increased client financing activities in equities, growthan increase in cash and cash equivalents, primarily due to an increase in deposits, as well as higher loansdebt securities and leasesfederal funds sold and securities
borrowed or purchased under agreements to resell. These increases wereresell primarily due to cash deployed from higher deposit balances. The increase in assets was partially offset by the impact of the sale of the non-U.S. consumerlower loans and leases primarily driven by a decline in credit card business to a third party in the second quarter of 2017. originations and promotional balances, mortgage paydowns and lower origination volumes.
Total liabilities increased $90.6$300.3 billion from December 31, 20162019 to $2.0$2.5 trillion at September 30, 2017 primarily driven by higher depositsdeposit inflows resulting from government stimulus actions and client responses to market volatility as clients improved their liquidity positions. The increase in liabilities was also due to strong organic growth, an increase in trading account liabilities, higher federal funds purchased and securities loaned or sold under agreements to repurchase primarily due to higher inventory in Fixed Income, Currencies and Commodities (FICC) within Global Markets. Long-term debt also increased matched-book activity,primarily driven by
valuations due to lower interest rates, as well as increases in long-term debt and accrued expenses and other liabilities. Shareholders'issuances.
Shareholders’ equity increased $5.6$4.0 billion from December 31, 20162019 primarily due to net income and market value increases on debt securities, partially offset by returns of capital to shareholders of $12.0 billion through common stock repurchases and common and preferred stock dividends.dividends as well as the impact of the adoption of the new credit loss accounting standard.
|
| | | | | | | | | | | | | | | | |
| | | | | | | | | |
| Table 2 | Summary Income Statement | | | | | | | |
| | | Three Months Ended September 30 | | Nine Months Ended September 30 |
| (Dollars in millions) | 2017 | | 2016 | | 2017 | | 2016 |
| Net interest income | $ | 11,161 |
| | $ | 10,201 |
| | $ | 33,205 |
| | $ | 30,804 |
|
| Noninterest income | 10,678 |
| | 11,434 |
| | 33,711 |
| | 32,907 |
|
| Total revenue, net of interest expense | 21,839 |
| | 21,635 |
| | 66,916 |
| | 63,711 |
|
| Provision for credit losses | 834 |
| | 850 |
| | 2,395 |
| | 2,823 |
|
| Noninterest expense | 13,139 |
| | 13,481 |
| | 41,713 |
| | 41,790 |
|
| Income before income taxes | 7,866 |
| | 7,304 |
| | 22,808 |
| | 19,098 |
|
| Income tax expense | 2,279 |
| | 2,349 |
| | 7,096 |
| | 5,888 |
|
| Net income | 5,587 |
| | 4,955 |
| | 15,712 |
| | 13,210 |
|
| Preferred stock dividends | 465 |
| | 503 |
| | 1,328 |
| | 1,321 |
|
| Net income applicable to common shareholders | $ | 5,122 |
| | $ | 4,452 |
| | $ | 14,384 |
| | $ | 11,889 |
|
| | | | | | | | | |
| Per common share information | | | | | | | |
| Earnings | $ | 0.50 |
| | $ | 0.43 |
| | $ | 1.42 |
| | $ | 1.15 |
|
| Diluted earnings | 0.48 |
| | 0.41 |
| | 1.35 |
| | 1.10 |
|
Net interest income increased $960 milliondecreased $2.1 billion to $11.2$10.1 billion, and $2.4$3.6 billion to $33.2$33.1 billion for the three and nine months ended September 30, 20172020 compared to the same periods in 2016. The net2019. Net interest yield increased 13on a fully taxable-equivalent (FTE) basis decreased 69 basis points (bps) to 2.311.72 percent, and 1149 bps to 2.32 percent. These increases were1.96 percent for the same periods. The decrease in net interest income was primarily driven by the benefits from higherlower interest rates, and loan and deposit growth, partially offset by reduced deposit and funding costs, the decline resulting from the saledeployment of the non-U.S. consumer credit card businessexcess deposits into securities and an additional day of interest accrual. We expect net interest income to remain relatively flat or to modestly increase in the secondfourth quarter of 2017.2020 as compared to the third quarter of 2020 assuming economic conditions do not deteriorate and interest rates remain stable as compared to September 30, 2020. For more information regardingon net interest yield and the FTE basis, see Supplemental Financial Data on page 8, and for more information on interest rate risk management, see Interest Rate Risk Management for the Banking Book on page 63.48.
| | | Table 2 | | Table 2 | Noninterest Income | |
| | | | | | | | | | | | | Three Months Ended September 30 | | Nine Months Ended
September 30 |
| | | | | | | | | | |
| Table 3 | Noninterest Income | | | | | | | | |
| | | Three Months Ended September 30 | | Nine Months Ended September 30 | |
| (Dollars in millions) | (Dollars in millions) | 2017 | | 2016 | | 2017 | | 2016 | (Dollars in millions) | 2020 | | 2019 | | 2020 | | 2019 |
| Fees and commissions: | | Fees and commissions: | | |
| Card income | Card income | $ | 1,429 |
| | $ | 1,455 |
| | $ | 4,347 |
| | $ | 4,349 |
| Card income | $ | 1,568 | | | $ | 1,465 | | | $ | 4,089 | | | $ | 4,286 | |
| Service charges | Service charges | 1,968 |
| | 1,952 |
| | 5,863 |
| | 5,660 |
| Service charges | 1,817 | | | 1,975 | | | 5,282 | | | 5,717 | |
| Investment and brokerage services | Investment and brokerage services | 3,303 |
| | 3,160 |
| | 9,882 |
| | 9,543 |
| Investment and brokerage services | 3,623 | | | 3,494 | | | 10,803 | | | 10,324 | |
| Investment banking income | 1,477 |
| | 1,458 |
| | 4,593 |
| | 4,019 |
| |
| Trading account profits | 1,837 |
| | 2,141 |
| | 6,124 |
| | 5,821 |
| |
| Mortgage banking income | (20 | ) | | 589 |
| | 332 |
| | 1,334 |
| |
| Gains on sales of debt securities | 125 |
| | 51 |
| | 278 |
| | 490 |
| |
| Investment banking fees | | Investment banking fees | 1,769 | | | 1,533 | | | 5,316 | | | 4,168 | |
| Total fees and commissions | | Total fees and commissions | 8,777 | | | 8,467 | | | 25,490 | | | 24,495 | |
| Market making and similar activities | | Market making and similar activities | 1,689 | | | 2,118 | | | 6,983 | | | 7,267 | |
| | Other income | Other income | 559 |
| | 628 |
| | 2,292 |
| | 1,691 |
| Other income | (259) | | | 35 | | | (151) | | | 382 | |
| | Total noninterest income | Total noninterest income | $ | 10,678 |
| | $ | 11,434 |
| | $ | 33,711 |
| | $ | 32,907 |
| Total noninterest income | $ | 10,207 | | | $ | 10,620 | | | $ | 32,322 | | | $ | 32,144 | |
Noninterest income decreased $756$413 million to $10.7$10.2 billionandincreased$804178 million to $33.7$32.3 billion for the three and nine months ended September 30, 20172020 compared to the same periods in 2016.2019. The following highlights the more significant changes.
| |
● | Service charges remained relatively unchanged for the three-month period and increased $203 million for the nine-month period with the increase primarily driven by the impact of pricing strategies and higher treasury services-related revenue. |
| |
● | Investment and brokerage services income increased $143 million and $339 million primarily driven by the impact of assets under management (AUM) flows and higher market valuations, partially offset by the impact of changing market dynamics on transactional revenue and AUM pricing. |
●Card income increased $103 million for the three-month period and decreased $197 million for the nine-month period. The increase in the three-month period was primarily driven by higher income related to the processing of unemployment insurance and higher merchant processing, partially offset by lower client activity related to the impact of COVID-19. The decrease in the nine-month period was primarily due to lower levels of consumer spending driven by the impact of COVID-19.
● Service charges decreased $158 million and $435 million primarily due to higher deposit balances and lower client activity due to the impact of COVID-19.
● Investment and brokerage services income increased $129 million and $479 million primarily due to higher client transactional activity, higher market valuations and assets
under management (AUM) flows, partially offset by declines in AUM pricing.
●Investment banking fees increased $236 million and $1.1 billion primarily due to higher equity underwriting fees and for the nine-month period, higher debt underwriting fees, as well.
● Market making and similar activities decreased $429 million and $284 million. The decrease in both periods was primarily due to the impact of lower U.S. interest rates on certain risk management derivatives. The decrease in the nine-month period was also partially offset by increased client activity and strong trading performance in FICC.
●Other income decreased $294 million and $533 million. The decrease in the three-month period was primarily due to higher partnership losses on tax credit investments, primarily affordable housing and renewable energy, as well as loan sales in the prior period. The decrease in the nine-month period was primarily due to lower equity investment income and higher partnership losses on tax credit investments.
| |
● | Investment banking income remained relatively unchanged for the three-month period and increased $574 million for the nine-month period primarily due to higher debt and equity issuance fees and higher advisory fees. |
| | | | |
● | Trading account profits decreased $304 million for the three-month period primarily due to weaker performance in fixed-income products, and increased $303 million for the nine-month period primarily due to increased client financing activity in equities. |
| |
● | Mortgage banking income decreased $609 millionand$1.0 billion primarily driven by lower net servicing income due to lower mortgage servicing rights (MSR) results, netBank of the related hedge performance, and lower production income primarily due to lower volume.America 6
|
| |
● | Gains on sales of debt securities increased $74 million for the three-month period and decreased $212 million for the nine-month period primarily driven by sales volume. |
| |
● | Other income decreased $69 million for the three-month period due to lower fair value adjustments from economic hedging activities in the fair value option portfolio, partially offset by higher gains on asset sales, and increased $601 million for the nine-month period primarily due to the $793 million pre-tax gain recognized in connection with the sale of the non-U.S. consumer credit card business in the second quarter of 2017. |
Provision for Credit Losses
The provision for credit losses decreased $16increased $610 million to $834 million,$1.4 billion, and $428 million$8.6 billion to $2.4$11.3 billion for the three and nine months ended September 30, 20172020 compared to the same periods in 20162019 primarily driven by higher ECL due to credit quality improvements in the consumer real estate portfolio and reductions in energy exposures in the commercial portfolio, partially offset by portfolio seasoning and loan growth in the U.S. credit card portfolio.a weaker economic outlook related to COVID-19. For more information on the provision for credit losses, see ProvisionAllowance for Credit Losses on page 57.44.
Noninterest Expense
|
| | | | | | | | | | | | | | | | |
| | | | | | | | | |
| Table 4 | Noninterest Expense | | | | | | | |
| | | Three Months Ended September 30 | | Nine Months Ended September 30 |
| (Dollars in millions) | 2017 | | 2016 | | 2017 | | 2016 |
| Personnel | $ | 7,483 |
| | $ | 7,704 |
| | $ | 24,353 |
| | $ | 24,278 |
|
| Occupancy | 999 |
| | 1,005 |
| | 3,000 |
| | 3,069 |
|
| Equipment | 416 |
| | 443 |
| | 1,281 |
| | 1,357 |
|
| Marketing | 461 |
| | 410 |
| | 1,235 |
| | 1,243 |
|
| Professional fees | 476 |
| | 536 |
| | 1,417 |
| | 1,433 |
|
| Amortization of intangibles | 151 |
| | 181 |
| | 473 |
| | 554 |
|
| Data processing | 777 |
| | 685 |
| | 2,344 |
| | 2,240 |
|
| Telecommunications | 170 |
| | 189 |
| | 538 |
| | 551 |
|
| Other general operating | 2,206 |
| | 2,328 |
| | 7,072 |
| | 7,065 |
|
| Total noninterest expense | $ | 13,139 |
| | $ | 13,481 |
| | $ | 41,713 |
| | $ | 41,790 |
|
| | | | | | | | | | | | | | | | | | | | | | | | | | |
| | | | | | | | |
| Table 3 | Noninterest Expense | | | | | | | |
| | | | | | | | |
| | Three Months Ended September 30 | | Nine Months Ended
September 30 |
| | |
| (Dollars in millions) | 2020 | | 2019 | | 2020 | | 2019 |
| Compensation and benefits | $ | 8,200 | | | $ | 7,779 | | | $ | 24,535 | | | $ | 24,000 | |
| Occupancy and equipment | 1,798 | | | 1,663 | | | 5,302 | | | 4,908 | |
| Information processing and communications | 1,333 | | | 1,163 | | | 3,807 | | | 3,484 | |
| Product delivery and transaction related | 930 | | | 696 | | | 2,518 | | | 2,067 | |
| Marketing | 308 | | | 440 | | | 1,238 | | | 1,410 | |
| Professional fees | 450 | | | 386 | | | 1,206 | | | 1,155 | |
| Other general operating | 1,382 | | | 3,042 | | | 2,680 | | | 4,637 | |
| Total noninterest expense | $ | 14,401 | | | $ | 15,169 | | | $ | 41,286 | | | $ | 41,661 | |
Noninterest expense declined $342decreased $768 million to $13.1$14.4 billion, for the three months ended September 30, 2017 comparedand $375 million to the same period in 2016. The decrease was primarily due to lower personnel and other general operating expense, including the reduction related to the sale of the non-U.S. credit card business.
Noninterest expense$41.3 billion for the nine-month period remained relatively unchanged as a $295 million impairment charge related to certain data centers in the process of being sold and higher Federal Deposit Insurance Corporation (FDIC) expense were largely offset by lower litigation expense.
Income Tax Expense
|
| | | | | | | | | | | | | | | | |
| | | | | | | | | |
| Table 5 | Income Tax Expense | | | | | | | |
| | | Three Months Ended September 30 | | Nine Months Ended September 30 |
| (Dollars in millions) | 2017 | | 2016 | | 2017 | | 2016 |
| Income before income taxes | $ | 7,866 |
| | $ | 7,304 |
| | $ | 22,808 |
| | $ | 19,098 |
|
| Income tax expense | 2,279 |
| | 2,349 |
| | 7,096 |
| | 5,888 |
|
| Effective tax rate | 29.0 | % | | 32.2 | % | | 31.1 | % | | 30.8 | % |
The effective tax rates for both the three and nine months ended September 30, 2017 were driven2020 compared to the same periods in 2019. The decrease was primarily due to a $2.1 billion pretax impairment charge related to the notice of termination of the merchant services joint venture recorded in the prior-year
periods, partially offset by the impact of our recurring tax preference benefits. The nine-month 2017 effective tax rate also included taxCOVID-19 related expense, of $690 million recognized in connection with the sale of the non-U.S. consumer credit card businessas well as higher litigation expense. Absent unexpected changes, we expect noninterest expense will be approximately $13.7 billion in the secondfourth quarter of 2017.2020 assuming both lower COVID-19 related costs and litigation expense.
Income Tax Expense
| | | | | | | | | | | | | | | | | | | | | | | | | | |
| | | | | | | | |
| Table 4 | Income Tax Expense | | | | | | | |
| | | | | | | | |
| | Three Months Ended September 30 | | Nine Months Ended
September 30 |
| | |
| (Dollars in millions) | 2020 | | 2019 | | 2020 | | 2019 |
| Income before income taxes | $ | 4,546 | | | $ | 6,859 | | | $ | 12,876 | | | $ | 24,585 | |
| Income tax expense | (335) | | | 1,082 | | | 452 | | | 4,149 | |
| Effective tax rate | (7.4) | % | | 15.8 | % | | 3.5 | % | | 16.9 | % |
The changes in the effective tax rates for the three and nine months ended September 30, 20162020 compared to the same periods a year ago were driven by the impact of our recurring tax preference benefits andon the third quarterlower levels of 2016 included a $350 million charge forpretax income and the impact of the U.K. tax law changeschange discussed below. Our recurring tax preference benefits primarily consist of tax credits from investments in affordable housing and renewable energy, aligning with our responsible growth strategy to address global sustainability challenges. We expect the effective tax rate for the fourth quarter of 2020 to be approximately 10 percent, excluding unusual items. Absent these tax credits, the effective tax rate would be approximately 26 percent.
On July 22, 2020, the U.K. enacted a reversal of the final two percent of scheduled decreases in September 2016.the U.K. corporation tax rate, which had been previously enacted. This change will unfavorably affect income tax expense on future U.K. earnings, and requires a reversal of the adjustment to the U.K. net deferred tax assets recognized at the time the related tax rate decrease was originally enacted. Accordingly, during the third quarter of 2020, the Corporation recorded a positive income tax adjustment of approximately $700 million along with a corresponding increase to the U.K. net deferred tax assets.
|
| | | | | | | | | | | | | | | | | | | | |
| | | | | | | | | | | |
| Table 6 | Selected Quarterly Financial Data | | | | | | | | | |
| | | 2017 Quarters | | 2016 Quarters |
| (Dollars in millions, except per share information) | Third | | Second | | First | | Fourth | | Third |
| Income statement | |
| | |
| | |
| | |
| | |
|
| Net interest income | $ | 11,161 |
| | $ | 10,986 |
| | $ | 11,058 |
| | $ | 10,292 |
| | $ | 10,201 |
|
| Noninterest income | 10,678 |
| | 11,843 |
| | 11,190 |
| | 9,698 |
| | 11,434 |
|
| Total revenue, net of interest expense | 21,839 |
| | 22,829 |
| | 22,248 |
| | 19,990 |
| | 21,635 |
|
| Provision for credit losses | 834 |
| | 726 |
| | 835 |
| | 774 |
| | 850 |
|
| Noninterest expense | 13,139 |
| | 13,726 |
| | 14,848 |
| | 13,161 |
| | 13,481 |
|
| Income before income taxes | 7,866 |
| | 8,377 |
| | 6,565 |
| | 6,055 |
| | 7,304 |
|
| Income tax expense | 2,279 |
| | 3,108 |
| | 1,709 |
| | 1,359 |
| | 2,349 |
|
| Net income | 5,587 |
| | 5,269 |
| | 4,856 |
| | 4,696 |
| | 4,955 |
|
| Net income applicable to common shareholders | 5,122 |
| | 4,908 |
| | 4,354 |
| | 4,335 |
| | 4,452 |
|
| Average common shares issued and outstanding | 10,198 |
| | 10,014 |
| | 10,100 |
| | 10,170 |
| | 10,250 |
|
| Average diluted common shares issued and outstanding | 10,725 |
| | 10,822 |
| | 10,915 |
| | 10,959 |
| | 11,000 |
|
| Performance ratios | |
| | |
| | |
| | |
| | |
|
| Return on average assets | 0.98 | % | | 0.93 | % | | 0.88 | % | | 0.85 | % | | 0.90 | % |
Four quarter trailing return on average assets (1) | 0.91 |
| | 0.89 |
| | 0.88 |
| | 0.82 |
| | 0.76 |
|
| Return on average common shareholders’ equity | 8.14 |
| | 8.00 |
| | 7.27 |
| | 7.04 |
| | 7.27 |
|
Return on average tangible common shareholders’ equity (2) | 11.32 |
| | 11.23 |
| | 10.28 |
| | 9.92 |
| | 10.28 |
|
| Return on average shareholders' equity | 8.10 |
| | 7.79 |
| | 7.35 |
| | 6.91 |
| | 7.33 |
|
Return on average tangible shareholders’ equity (2) | 10.89 |
| | 10.54 |
| | 10.00 |
| | 9.38 |
| | 9.98 |
|
| Total ending equity to total ending assets | 11.93 |
| | 12.02 |
| | 11.93 |
| | 12.20 |
| | 12.30 |
|
| Total average equity to total average assets | 12.05 |
| | 11.95 |
| | 12.01 |
| | 12.24 |
| | 12.28 |
|
| Dividend payout | 24.78 |
| | 15.25 |
| | 17.37 |
| | 17.68 |
| | 17.32 |
|
| Per common share data | |
| | |
| | |
| | |
| | |
|
| Earnings | $ | 0.50 |
| | $ | 0.49 |
| | $ | 0.43 |
| | $ | 0.43 |
| | $ | 0.43 |
|
| Diluted earnings | 0.48 |
| | 0.46 |
| | 0.41 |
| | 0.40 |
| | 0.41 |
|
| Dividends paid | 0.12 |
| | 0.075 |
| | 0.075 |
| | 0.075 |
| | 0.075 |
|
| Book value | 23.92 |
| | 24.88 |
| | 24.36 |
| | 24.04 |
| | 24.19 |
|
Tangible book value (2) | 17.23 |
| | 17.78 |
| | 17.23 |
| | 16.95 |
| | 17.14 |
|
| Market price per share of common stock | |
| | |
| | |
| | |
| | |
|
| Closing | $ | 25.34 |
| | $ | 24.26 |
| | $ | 23.59 |
| | $ | 22.10 |
| | $ | 15.65 |
|
| High closing | 25.45 |
| | 24.32 |
| | 25.50 |
| | 23.16 |
| | 16.19 |
|
| Low closing | 22.89 |
| | 22.23 |
| | 22.05 |
| | 15.63 |
| | 12.74 |
|
| Market capitalization | $ | 264,992 |
| | $ | 239,643 |
| | $ | 235,291 |
| | $ | 222,163 |
| | $ | 158,438 |
|
| |
(1)
| Calculated as total net income for four consecutive quarters divided by annualized average assets for four consecutive quarters. |
| |
(2)
| Tangible equity ratios and tangible book value per share of common stock are non-GAAP financial measures. For more information on these ratios and for corresponding reconciliations to GAAP financial measures, see Non-GAAP Reconciliations on page 67.
|
| |
(3)
| For more information on the impact of the purchased credit-impaired (PCI) loan portfolio on asset quality, see Consumer Portfolio Credit Risk Management on page 39.
|
| |
(4)
| Includes the allowance for loan and lease losses and the reserve for unfunded lending commitments. |
| |
(5)
| Balances and ratios do not include loans accounted for under the fair value option. For additional exclusions from nonperforming loans, leases and foreclosed properties, see Consumer Portfolio Credit Risk Management – Nonperforming Consumer Loans, Leases and Foreclosed Properties Activity on page 48 and corresponding Table 33, and Commercial Portfolio Credit Risk Management – Nonperforming Commercial Loans, Leases and Foreclosed Properties Activity on page 52 and corresponding Table 40.
|
| |
(6)
| Asset quality metrics include $242 million and $243 million of non-U.S. credit card allowance for loan and lease losses and $9.5 billion and $9.2 billion of non-U.S. credit card loans in the first quarter of 2017 and in the fourth quarter of 2016, which were previously included in assets of business held for sale. During the second quarter of 2017, the Corporation sold its non-U.S. consumer credit card business.
|
| |
(7)
| Primarily includes amounts allocated to the U.S. credit card and unsecured consumer lending portfolios in Consumer Banking, PCI loans and the non-U.S. credit card portfolio in All Other.
|
| |
(8)
| Net charge-offs exclude $73 million, $55 million, $33 million, $70 million, and $83 million of write-offs in the PCI loan portfolio in the third, second and first quarters of 2017, and in the fourth and third quarters of 2016, respectively. For more information on PCI write-offs, see Consumer Portfolio Credit Risk Management – Purchased Credit-impaired Loan Portfolio on page 45.
|
| |
(9)
| Includes net charge-offs of $31 million, $44 million and $41 million on non-U.S. credit card loans in the second and first quarters of 2017, and in the fourth quarter of 2016, which were previously included in assets of business held for sale on the Consolidated Balance Sheet at March 31, 2017 and December 31, 2016. |
| |
(10)
| Risk-based capital ratios are reported under Basel 3 Advanced - Transition. For additional information, see Capital Management on page 28.
|
|
| | | | | | | | | | | | | | | | | | | | |
| | | | | | | | | | | |
| Table 6 | Selected Quarterly Financial Data (continued) | | | | | | | | | |
| | | 2017 Quarters | | 2016 Quarters |
| (Dollars in millions) | Third | | Second | | First | | Fourth | | Third |
| Average balance sheet | |
| | |
| | |
| | |
| | |
|
| Total loans and leases | $ | 918,129 |
| | $ | 914,717 |
| | $ | 914,144 |
| | $ | 908,396 |
| | $ | 900,594 |
|
| Total assets | 2,270,872 |
| | 2,269,153 |
| | 2,231,420 |
| | 2,208,039 |
| | 2,189,490 |
|
| Total deposits | 1,271,711 |
| | 1,256,838 |
| | 1,256,632 |
| | 1,250,948 |
| | 1,227,186 |
|
| Long-term debt | 227,309 |
| | 224,019 |
| | 221,468 |
| | 220,587 |
| | 227,269 |
|
| Common shareholders’ equity | 249,624 |
| | 246,003 |
| | 242,883 |
| | 245,139 |
| | 243,679 |
|
| Total shareholders’ equity | 273,648 |
| | 271,223 |
| | 268,103 |
| | 270,360 |
| | 268,899 |
|
Asset quality (3) | |
| | |
| | |
| | |
| | |
|
Allowance for credit losses (4) | $ | 11,455 |
| | $ | 11,632 |
| | $ | 11,869 |
| | $ | 11,999 |
| | $ | 12,459 |
|
Nonperforming loans, leases and foreclosed properties (5) | 6,869 |
| | 7,127 |
| | 7,637 |
| | 8,084 |
| | 8,737 |
|
Allowance for loan and lease losses as a percentage of total loans and leases outstanding (5, 6) | 1.16 | % | | 1.20 | % | | 1.25 | % | | 1.26 | % | | 1.30 | % |
Allowance for loan and lease losses as a percentage of total nonperforming loans and leases (5, 6) | 163 |
| | 160 |
| | 156 |
| | 149 |
| | 140 |
|
Allowance for loan and lease losses as a percentage of total nonperforming loans and leases, excluding the PCI loan portfolio (5, 6) | 158 |
| | 154 |
| | 150 |
| | 144 |
| | 135 |
|
Amounts included in allowance for loan and lease losses for loans and leases that are excluded from nonperforming loans and leases (7) | $ | 3,880 |
| | $ | 3,782 |
| | $ | 4,047 |
| | $ | 3,951 |
| | $ | 4,068 |
|
Allowance for loan and lease losses as a percentage of total nonperforming loans and leases, excluding the allowance for loan and lease losses for loans and leases that are excluded from nonperforming loans and leases (5, 7) | 104 | % | | 104 | % | | 100 | % | | 98 | % | | 91 | % |
Net charge-offs (8, 9) | $ | 900 |
| | $ | 908 |
| | $ | 934 |
| | $ | 880 |
| | $ | 888 |
|
Annualized net charge-offs as a percentage of average loans and leases outstanding (5, 8) | 0.39 | % | | 0.40 | % | | 0.42 | % | | 0.39 | % | | 0.40 | % |
Annualized net charge-offs as a percentage of average loans and leases outstanding, excluding the PCI loan portfolio (5) | 0.40 |
| | 0.41 |
| | 0.42 |
| | 0.39 |
| | 0.40 |
|
Annualized net charge-offs and PCI write-offs as a percentage of average loans and leases outstanding (5) | 0.42 |
| | 0.43 |
| | 0.43 |
| | 0.42 |
| | 0.43 |
|
Nonperforming loans and leases as a percentage of total loans and leases outstanding (5, 6) | 0.71 |
| | 0.75 |
| | 0.80 |
| | 0.85 |
| | 0.93 |
|
Nonperforming loans, leases and foreclosed properties as a percentage of total loans, leases and foreclosed properties (5, 6) | 0.75 |
| | 0.78 |
| | 0.84 |
| | 0.89 |
| | 0.97 |
|
Ratio of the allowance for loan and lease losses at period end to annualized net charge-offs (6, 8) | 3.00 |
| | 2.99 |
| | 3.00 |
| | 3.28 |
| | 3.31 |
|
Ratio of the allowance for loan and lease losses at period end to annualized net charge-offs, excluding the PCI loan portfolio (6) | 2.91 |
| | 2.88 |
| | 2.88 |
| | 3.16 |
| | 3.18 |
|
Ratio of the allowance for loan and lease losses at period end to annualized net charge-offs and PCI write-offs (6) | 2.77 |
| | 2.82 |
| | 2.90 |
| | 3.04 |
| | 3.03 |
|
Capital ratios at period end (10) | |
| | |
| | |
| | |
| | |
|
| Risk-based capital: | |
| | |
| | |
| | |
| | |
|
| Common equity tier 1 capital | 11.9 | % | | 11.6 | % | | 11.0 | % | | 11.0 | % | | 11.0 | % |
| Tier 1 capital | 13.3 |
| | 13.2 |
| | 12.5 |
| | 12.4 |
| | 12.4 |
|
| Total capital | 15.1 |
| | 15.1 |
| | 14.4 |
| | 14.3 |
| | 14.2 |
|
| Tier 1 leverage | 9.0 |
| | 8.9 |
| | 8.8 |
| | 8.9 |
| | 9.1 |
|
Tangible equity (2) | 9.1 |
| | 9.2 |
| | 9.1 |
| | 9.2 |
| | 9.4 |
|
Tangible common equity (2) | 8.1 |
| | 8.0 |
| | 7.9 |
| | 8.1 |
| | 8.2 |
|
For footnotes see page 7.
|
| | | | | | | | |
| | | | | |
| Table 7 | Selected Year-to-Date Financial Data | | | |
| | | Nine Months Ended September 30 |
| (In millions, except per share information) | 2017 | | 2016 |
| Income statement | | | |
| Net interest income | $ | 33,205 |
| | $ | 30,804 |
|
| Noninterest income | 33,711 |
| | 32,907 |
|
| Total revenue, net of interest expense | 66,916 |
| | 63,711 |
|
| Provision for credit losses | 2,395 |
| | 2,823 |
|
| Noninterest expense | 41,713 |
| | 41,790 |
|
| Income before income taxes | 22,808 |
| | 19,098 |
|
| Income tax expense | 7,096 |
| | 5,888 |
|
| Net income | 15,712 |
| | 13,210 |
|
| Net income applicable to common shareholders | 14,384 |
| | 11,889 |
|
| Average common shares issued and outstanding | 10,103 |
| | 10,313 |
|
| Average diluted common shares issued and outstanding | 10,820 |
| | 11,047 |
|
| Performance ratios | |
| | |
|
| Return on average assets | 0.93 | % | | 0.81 | % |
| Return on average common shareholders’ equity | 7.81 |
| | 6.61 |
|
Return on average tangible common shareholders’ equity (1) | 10.95 |
| | 9.40 |
|
| Return on average shareholder's equity | 7.75 |
| | 6.66 |
|
Return on average tangible shareholders’ equity (1) | 10.48 |
| | 9.13 |
|
| Total ending equity to total ending assets | 11.93 |
| | 12.30 |
|
| Total average equity to total average assets | 12.01 |
| | 12.13 |
|
| Dividend payout | 19.28 |
| | 15.19 |
|
| Per common share data | |
| | |
|
| Earnings | $ | 1.42 |
| | $ | 1.15 |
|
| Diluted earnings | 1.35 |
| | 1.10 |
|
| Dividends paid | 0.27 |
| | 0.175 |
|
| Book value | 23.92 |
| | 24.19 |
|
Tangible book value (1) | 17.23 |
| | 17.14 |
|
| Market price per share of common stock | |
| | |
|
| Closing | $ | 25.34 |
| | $ | 15.65 |
|
| High closing | 25.50 |
| | 16.43 |
|
| Low closing | 22.05 |
| | 11.16 |
|
| Market capitalization | $ | 264,992 |
| | $ | 158,438 |
|
| |
(1)
| Tangible equity ratios and tangible book value per share of common stock are non-GAAP financial measures. For more information on these ratios and for corresponding reconciliations to GAAP financial measures, see Non-GAAP Reconciliations on page 67.
|
| |
(2)
| For more information on the impact of the PCI loan portfolio on asset quality, see Consumer Portfolio Credit Risk Management on page 39.
|
| |
(3)
| Includes the allowance for loan and lease losses and the reserve for unfunded lending commitments. |
| |
(4)
| Balances and ratios do not include loans accounted for under the fair value option. For additional exclusions from nonperforming loans, leases and foreclosed properties, see Consumer Portfolio Credit Risk Management – Nonperforming Consumer Loans, Leases and Foreclosed Properties Activity on page 48 and corresponding Table 33, and Commercial Portfolio Credit Risk Management – Nonperforming Commercial Loans, Leases and Foreclosed Properties Activity on page 52 and corresponding Table 40.
|
| |
(5)
| Primarily includes amounts allocated to the U.S. credit card and unsecured consumer lending portfolios in Consumer Banking, PCI loans and the non-U.S. credit card portfolio in All Other. During the second quarter of 2017, the Corporation sold its non-U.S. consumer credit card business.
|
| |
(6)
| Net charge-offs exclude $161 million and $270 million of write-offs in the PCI loan portfolio for the nine months ended September 30, 2017 and 2016. For more information on PCI write-offs, see Consumer Portfolio Credit Risk Management – Purchased Credit-impaired Loan Portfolio on page 45.
|
|
| | | | | | | | |
| | | | | |
| Table 7 | Selected Year-to-Date Financial Data (continued) |
| | | Nine Months Ended September 30 |
| (Dollars in millions) | 2017 | | 2016 |
| Average balance sheet | |
| | |
|
| Total loans and leases | $ | 915,678 |
| | $ | 897,760 |
|
| Total assets | 2,257,293 |
| | 2,183,905 |
|
| Total deposits | 1,261,782 |
| | 1,213,029 |
|
| Long-term debt | 224,287 |
| | 231,313 |
|
| Common shareholders’ equity | 246,195 |
| | 240,440 |
|
| Total shareholders’ equity | 271,012 |
| | 264,907 |
|
Asset quality (2) | |
| | |
|
Allowance for credit losses (3) | $ | 11,455 |
| | $ | 12,459 |
|
Nonperforming loans, leases and foreclosed properties (4) | 6,869 |
| | 8,737 |
|
Allowance for loan and lease losses as a percentage of total loans and leases outstanding (4) | 1.16 | % | | 1.30 | % |
Allowance for loan and lease losses as a percentage of total nonperforming loans and leases (4) | 163 |
| | 140 |
|
Allowance for loan and lease losses as a percentage of total nonperforming loans and leases, excluding the PCI loan portfolio (4) | 158 |
| | 135 |
|
Amounts included in allowance for loan and lease losses for loans and leases that are excluded from nonperforming loans and leases (5) | $ | 3,880 |
| | $ | 4,068 |
|
Allowance for loan and lease losses as a percentage of total nonperforming loans and leases, excluding the allowance for loan and lease losses for loans and leases that are excluded from nonperforming loans and leases (4, 5) | 104 | % | | 91 | % |
Net charge-offs (6) | $ | 2,742 |
| | $ | 2,941 |
|
Annualized net charge-offs as a percentage of average loans and leases outstanding (4, 6) | 0.40 | % | | 0.44 | % |
Annualized net charge-offs as a percentage of average loans and leases outstanding, excluding the PCI loan portfolio (4) | 0.41 |
| | 0.45 |
|
Annualized net charge-offs and PCI write-offs as a percentage of average loans and leases outstanding (4) | 0.43 |
| | 0.48 |
|
Nonperforming loans and leases as a percentage of total loans and leases outstanding (4) | 0.71 |
| | 0.93 |
|
Nonperforming loans, leases and foreclosed properties as a percentage of total loans, leases and foreclosed properties (4) | 0.75 |
| | 0.97 |
|
Ratio of the allowance for loan and lease losses at period end to annualized net charge-offs (6) | 2.92 |
| | 2.98 |
|
| Ratio of the allowance for loan and lease losses at period end to annualized net charge-offs, excluding the PCI loan portfolio | 2.83 |
| | 2.86 |
|
| Ratio of the allowance for loan and lease losses at period end to annualized net charge-offs and PCI write-offs | 2.76 |
| | 2.73 |
|
For footnotes see page 9.
Supplemental Financial Data
Non-GAAP Financial Measures
In this Form 10-Q, we present certain non-GAAP financial measures. Non-GAAP financial measures exclude certain items or otherwise include components that differ from the most directly comparable measures calculated in accordance with GAAP. Non-GAAP financial measures are provided as additional useful information to assess our financial condition, results of operations (including period-to-period operating performance) or compliance with prospective regulatory requirements. These non-GAAP financial measures are not intended as a substitute for GAAP financial measures and may not be defined or calculated the same way as non-GAAP financial measures used by other companies.
We view net interest income and related ratios and analyses on a fully taxable-equivalent (FTE)an FTE basis, which when presented on a consolidated basis are non-GAAP financial measures. To derive the FTE basis, net interest income is adjusted to reflect tax-exempt income on an equivalent before-tax basis with a corresponding increase in income tax expense. For purposes of this calculation, we use the federal statutory tax rate of 3521 percent and a representative state tax rate. In addition, certain performance measures including the efficiency ratio and netNet interest yield, utilize net interest income (and thus total revenue) on an FTE basis. The efficiency ratiowhich measures the costs expended to generate a dollar of revenue, and net interest yield measures the bpsbasis points we earn over the cost of funds.funds, utilizes net interest income on an FTE basis. We believe that presentation of these items on an FTE basis allows for comparison of amounts from both taxable and tax-exempt sources and is consistent with industry practices.
We may present certain key performance indicators and ratios excluding certain items (e.g., debit valuation adjustment (DVA) gains (losses)) which result in non-GAAP financial measures. We believe that the presentation of measures that exclude these items areis useful because theysuch measures provide additional information to assess the underlying operational performance and trends of our businesses and to allow better comparison of period-to-period operating performance.
We also evaluate our business based on certain ratios that utilize tangible equity, a non-GAAP financial measure. Tangible equity represents an adjusted shareholders’ equity or common shareholders’ equity amount which has been reduced by goodwill and certain acquired intangible assets (excluding MSRs)mortgage servicing rights (MSRs)), net of related deferred tax liabilities.liabilities ("adjusted" shareholders' equity or common shareholders' equity). These measures are used to evaluate our use of equity. In addition, profitability, relationship and investment models use both return on average tangible
common shareholders’ equity and return on average tangible shareholders’ equity as key measures to support our overall growth goals.objectives. These ratios are as follows:
| |
● | Return on average tangible common shareholders’ equity measures our earnings contribution as a percentage of adjusted common shareholders’ equity. The tangible common equity ratio represents adjusted ending common shareholders’ equity divided by total assets less goodwill and certain acquired intangible assets (excluding MSRs), net of related deferred tax liabilities. |
| |
● | Return on average tangible shareholders’ equity measures our earnings contribution as a percentage of adjusted average total shareholders’ equity. The tangible equity ratio represents adjusted ending shareholders’ equity divided by total assets less goodwill and certain acquired intangible assets (excluding MSRs), net of related deferred tax liabilities. |
| |
● | Tangible book value per common share represents adjusted ending common shareholders’ equity divided by ending common shares outstanding. |
● Return on average tangible common shareholders’ equity measures our net income applicable to common shareholders as a percentage of adjusted average common shareholders’ equity. The tangible common equity ratio represents adjusted ending common shareholders’ equity divided by total tangible assets.
● Return on average tangible shareholders' equity measures our net income as a percentage of adjusted average total shareholders’ equity. The tangible equity ratio represents adjusted ending shareholders’ equity divided by total tangible assets.
● Tangible book value per common share represents adjusted ending common shareholders’ equity divided by ending common shares outstanding.
We believe that the use of ratios that utilizeutilizing tangible equity providesprovide additional useful information because they present measures of those assets that can generate income. Tangible book value per common share provides additional useful information about the level of tangible assets in relation to outstanding shares of common stock.
The aforementioned supplemental data and performance measures are presented in Tables 65 and 7. Table 8 presents certain6.
For more information on the reconciliation of these non-GAAP financial measures to the corresponding GAAP financial measures, see Non-GAAP Reconciliations on page 51.
Key Performance Indicators
We present certain key financial and nonfinancial performance measurementsindicators (key performance indicators) that management uses when assessing our consolidated and/or segment results. We believe they are useful to investors because they provide additional information about our underlying operational performance and trends. These key performance indicators (KPIs) may not be defined or calculated in the same way as similar KPIs used by other companies. For information on an FTE basis.how these metrics are defined, see Key Metrics on page 104.
Our consolidated key performance indicators, which include various equity and credit metrics, are presented in Table 1 on page 5 and/or Table 5 on page 9.
For information on key segment performance metrics, see Business Segment Operations on page 12.
|
| | | | | | | | | | | | | | | | |
| | | | | | | | | |
| Table 8 | Supplemental Financial Data | | | | | | | |
| | | | | | | | | |
| | | Three Months Ended September 30 | | Nine Months Ended September 30 |
| (Dollars in millions) | 2017 | | 2016 | | 2017 | | 2016 |
| Fully taxable-equivalent basis data | |
| | |
| | | | |
| Net interest income | $ | 11,401 |
| | $ | 10,429 |
| | $ | 33,879 |
| | $ | 31,470 |
|
| Total revenue, net of interest expense | 22,079 |
| | 21,863 |
| | 67,590 |
| | 64,377 |
|
| Net interest yield | 2.36 | % | | 2.23 | % | | 2.36 | % | | 2.26 | % |
| Efficiency ratio | 59.51 |
| | 61.66 |
| | 61.71 |
| | 64.91 |
|
|
| | | | | | | | | | | | | | | | | | | | | | |
| | | | | | | | | | | | | |
| Table 9 | Quarterly Average Balances and Interest Rates – FTE Basis |
| | | | | | | | | | | | | |
| | | Third Quarter 2017 | | Third Quarter 2016 |
| (Dollars in millions) | Average Balance | | Interest
Income/ Expense | | Yield/ Rate | | Average
Balance | | Interest
Income/
Expense | | Yield/
Rate |
| Earning assets | |
| | |
| | |
| | |
| | |
| | |
|
| Interest-bearing deposits with the Federal Reserve, non-U.S. central banks and other banks | $ | 127,835 |
| | $ | 323 |
| | 1.00 | % | | $ | 133,866 |
| | $ | 148 |
| | 0.44 | % |
| Time deposits placed and other short-term investments | 12,503 |
| | 68 |
| | 2.17 |
| | 9,336 |
| | 34 |
| | 1.45 |
|
| Federal funds sold and securities borrowed or purchased under agreements to resell | 223,585 |
| | 659 |
| | 1.17 |
| | 214,254 |
| | 267 |
| | 0.50 |
|
| Trading account assets | 124,068 |
| | 1,125 |
| | 3.60 |
| | 128,879 |
| | 1,111 |
| | 3.43 |
|
Debt securities (1) | 436,886 |
| | 2,670 |
| | 2.44 |
| | 423,182 |
| | 2,169 |
| | 2.07 |
|
Loans and leases (2): | | | | | | | | | | | |
| Residential mortgage | 199,240 |
| | 1,724 |
| | 3.46 |
| | 188,234 |
| | 1,612 |
| | 3.42 |
|
| Home equity | 61,225 |
| | 664 |
| | 4.31 |
| | 70,603 |
| | 681 |
| | 3.84 |
|
| U.S. credit card | 91,602 |
| | 2,253 |
| | 9.76 |
| | 88,210 |
| | 2,061 |
| | 9.30 |
|
Non-U.S. credit card (1) | — |
| | — |
| | — |
| | 9,256 |
| | 231 |
| | 9.94 |
|
Direct/Indirect consumer (3) | 93,510 |
| | 678 |
| | 2.88 |
| | 92,870 |
| | 585 |
| | 2.51 |
|
Other consumer (4) | 2,762 |
| | 28 |
| | 4.07 |
| | 2,358 |
| | 18 |
| | 2.94 |
|
| Total consumer | 448,339 |
| | 5,347 |
| | 4.74 |
| | 451,531 |
| | 5,188 |
| | 4.58 |
|
| U.S. commercial | 293,203 |
| | 2,542 |
| | 3.44 |
| | 276,833 |
| | 2,040 |
| | 2.93 |
|
Commercial real estate (5) | 59,044 |
| | 552 |
| | 3.71 |
| | 57,606 |
| | 452 |
| | 3.12 |
|
| Commercial lease financing | 21,818 |
| | 160 |
| | 2.92 |
| | 21,194 |
| | 153 |
| | 2.88 |
|
| Non-U.S. commercial | 95,725 |
| | 676 |
| | 2.80 |
| | 93,430 |
| | 599 |
| | 2.55 |
|
| Total commercial | 469,790 |
| | 3,930 |
| | 3.32 |
| | 449,063 |
| | 3,244 |
| | 2.87 |
|
| Total loans and leases | 918,129 |
| | 9,277 |
| | 4.02 |
| | 900,594 |
| | 8,432 |
| | 3.73 |
|
| Other earning assets | 76,496 |
| | 775 |
| | 4.02 |
| | 59,951 |
| | 677 |
| | 4.50 |
|
Total earning assets (6) | 1,919,502 |
| | 14,897 |
| | 3.09 |
| | 1,870,062 |
| | 12,838 |
| | 2.74 |
|
Cash and due from banks (1) | 28,990 |
| | | | | | 27,361 |
| | | | |
Other assets, less allowance for loan and lease losses (1) | 322,380 |
| | | | | | 292,067 |
| | | | |
| Total assets | $ | 2,270,872 |
| | | | | | $ | 2,189,490 |
| | | | |
| Interest-bearing liabilities | |
| | |
| | |
| | |
| | |
| | |
|
| U.S. interest-bearing deposits: | |
| | |
| | |
| | |
| | |
| | |
|
| Savings | $ | 54,328 |
| | $ | 1 |
| | 0.01 | % | | $ | 49,885 |
| | $ | 2 |
| | 0.01 | % |
| NOW and money market deposit accounts | 631,270 |
| | 333 |
| | 0.21 |
| | 592,907 |
| | 73 |
| | 0.05 |
|
| Consumer CDs and IRAs | 44,239 |
| | 31 |
| | 0.27 |
| | 48,695 |
| | 33 |
| | 0.27 |
|
| Negotiable CDs, public funds and other deposits | 38,119 |
| | 101 |
| | 1.05 |
| | 32,023 |
| | 43 |
| | 0.54 |
|
| Total U.S. interest-bearing deposits | 767,956 |
| | 466 |
| | 0.24 |
| | 723,510 |
| | 151 |
| | 0.08 |
|
| Non-U.S. interest-bearing deposits: | | | | | | | | | | | |
| Banks located in non-U.S. countries | 2,259 |
| | 5 |
| | 0.97 |
| | 4,294 |
| | 9 |
| | 0.87 |
|
| Governments and official institutions | 1,012 |
| | 3 |
| | 1.04 |
| | 1,391 |
| | 3 |
| | 0.61 |
|
| Time, savings and other | 63,716 |
| | 150 |
| | 0.93 |
| | 59,340 |
| | 103 |
| | 0.70 |
|
| Total non-U.S. interest-bearing deposits | 66,987 |
| | 158 |
| | 0.93 |
| | 65,025 |
| | 115 |
| | 0.71 |
|
| Total interest-bearing deposits | 834,943 |
| | 624 |
| | 0.30 |
| | 788,535 |
| | 266 |
| | 0.13 |
|
| Federal funds purchased, securities loaned or sold under agreements to repurchase, short-term borrowings and other interest-bearing liabilities | 230,230 |
| | 944 |
| | 1.63 |
| | 207,634 |
| | 569 |
| | 1.09 |
|
| Trading account liabilities | 48,390 |
| | 319 |
| | 2.62 |
| | 37,229 |
| | 244 |
| | 2.61 |
|
| Long-term debt | 227,309 |
| | 1,609 |
| | 2.82 |
| | 227,269 |
| | 1,330 |
| | 2.33 |
|
Total interest-bearing liabilities (6) | 1,340,872 |
| | 3,496 |
| | 1.04 |
| | 1,260,667 |
| | 2,409 |
| | 0.76 |
|
| Noninterest-bearing sources: | | | | | | | | | | | |
| Noninterest-bearing deposits | 436,768 |
| | | | | | 438,651 |
| | | | |
| Other liabilities | 219,584 |
| | | | | | 221,273 |
| | | | |
| Shareholders’ equity | 273,648 |
| | | | | | 268,899 |
| | | | |
| Total liabilities and shareholders’ equity | $ | 2,270,872 |
| | | | | | $ | 2,189,490 |
| | | | |
| Net interest spread | | | | | 2.05 | % | | | | | | 1.98 | % |
| Impact of noninterest-bearing sources | | | | | 0.31 |
| | | | | | 0.25 |
|
| Net interest income/yield on earning assets | | | $ | 11,401 |
| | 2.36 | % | | | | $ | 10,429 |
| | 2.23 | % |
| |
(1)
| Includes assets of the Corporation's non-U.S. consumer credit card business, which was sold during the second quarter of 2017. |
| |
(2)
| Nonperforming loans are included in the respective average loan balances. Income on these nonperforming loans is generally recognized on a cost recovery basis. PCI loans were recorded at fair value upon acquisition and accrete interest income over the estimated life of the loan. |
| |
(3)
| Includes non-U.S. consumer loans of $2.9 billion and $3.2 billion in the third quarter of 2017 and 2016.
|
| |
(4)
| Includes consumer finance loans of $406 million and $501 million; consumer leases of $2.2 billion and $1.7 billion, and consumer overdrafts of $193 million and $187 million in the third quarter of 2017 and 2016, respectively.
|
| |
(5)
| Includes U.S. commercial real estate loans of $55.2 billion and $54.3 billion, and non-U.S. commercial real estate loans of $3.8 billion and $3.3 billion in the third quarter of 2017 and 2016, respectively.
|
| |
(6)
| Interest income includes the impact of interest rate risk management contracts, which decreased interest income on the underlying assets by $7 million and $64 million in the third quarter of 2017 and 2016. Interest expense includes the impact of interest rate risk management contracts, which decreased interest expense on the underlying liabilities by $346 million and $560 million in the third quarter of 2017 and 2016. For additional information, see Interest Rate Risk Management for the Banking Book on page 63.
|
| | | | | | | | | | | | | | | | | | | | | | | | | | | | | | | | | | | | | | | | | | | | | | |
| | | | | | | | | | | | | | | | |
| | | | | | | | | | | | | | | | |
| Table 5 | Selected Financial Data | | | | | | | | | | | | |
| | | | | | | | | | | | | | | | |
| | 2020 Quarters | | 2019 Quarters | | Nine Months Ended
September 30 | | |
| (In millions, except per share information) | Third | | Second | | First | | Fourth | | Third | | 2020 | | 2019 | | |
| Income statement | | | | | | | | | | | | | | | |
| Net interest income | $ | 10,129 | | | $ | 10,848 | | | $ | 12,130 | | | $ | 12,140 | | | $ | 12,187 | | | $ | 33,107 | | | $ | 36,751 | | | |
| Noninterest income | 10,207 | | | 11,478 | | | 10,637 | | | 10,209 | | | 10,620 | | | 32,322 | | | 32,144 | | | |
| Total revenue, net of interest expense | 20,336 | | | 22,326 | | | 22,767 | | | 22,349 | | | 22,807 | | | 65,429 | | | 68,895 | | | |
| Provision for credit losses | 1,389 | | | 5,117 | | | 4,761 | | | 941 | | | 779 | | | 11,267 | | | 2,649 | | | |
| Noninterest expense | 14,401 | | | 13,410 | | | 13,475 | | | 13,239 | | | 15,169 | | | 41,286 | | | 41,661 | | | |
| Income before income taxes | 4,546 | | | 3,799 | | | 4,531 | | | 8,169 | | | 6,859 | | | 12,876 | | | 24,585 | | | |
| Income tax expense | (335) | | | 266 | | | 521 | | | 1,175 | | | 1,082 | | | 452 | | | 4,149 | | | |
| Net income | 4,881 | | | 3,533 | | | 4,010 | | | 6,994 | | | 5,777 | | | 12,424 | | | 20,436 | | | |
| Net income applicable to common shareholders | 4,440 | | | 3,284 | | | 3,541 | | | 6,748 | | | 5,272 | | | 11,265 | | | 19,250 | | | |
| Average common shares issued and outstanding | 8,732.9 | | | 8,739.9 | | | 8,815.6 | | | 9,017.1 | | | 9,303.6 | | | 8,762.6 | | | 9,516.2 | | | |
| Average diluted common shares issued and outstanding | 8,777.5 | | | 8,768.1 | | | 8,862.7 | | | 9,079.5 | | | 9,353.0 | | | 8,800.5 | | | 9,565.7 | | | |
| Performance ratios | | | | | | | | | | | | | | | |
Return on average assets (1) | 0.71 | % | | 0.53 | % | | 0.65 | % | | 1.13 | % | | 0.95 | % | | 0.63 | % | | 1.14 | % | | |
Four-quarter trailing return on average assets (2) | 0.75 | | | 0.81 | | | 0.99 | | | 1.14 | | | 1.17 | | | n/a | | n/a | | |
Return on average common shareholders’ equity (1) | 7.24 | | | 5.44 | | | 5.91 | | | 11.00 | | | 8.48 | | | 6.20 | | | 10.49 | | | |
Return on average tangible common shareholders’ equity (1) | 10.16 | | | 7.63 | | | 8.32 | | | 15.43 | | | 11.84 | | | 8.71 | | | 14.67 | | | |
Return on average shareholders’ equity (1) | 7.26 | | | 5.34 | | | 6.10 | | | 10.40 | | | 8.48 | | | 6.24 | | | 10.19 | | | |
Return on average tangible shareholders’ equity (3) | 9.84 | | | 7.23 | | | 8.29 | | | 14.09 | | | 11.43 | | | 8.46 | | | 13.78 | | | |
| Total ending equity to total ending assets | 9.82 | | | 9.69 | | | 10.11 | | | 10.88 | | | 11.06 | | | 9.82 | | | 11.06 | | | |
| Total average equity to total average assets | 9.76 | | | 9.85 | | | 10.60 | | | 10.89 | | | 11.21 | | | 10.05 | | | 11.22 | | | |
| Dividend payout | 35.36 | | | 47.87 | | | 44.57 | | | 23.90 | | | 31.48 | | | 41.90 | | | 23.56 | | | |
| Per common share data | | | | | | | | | | | | | | | |
| Earnings | $ | 0.51 | | | $ | 0.38 | | | $ | 0.40 | | | $ | 0.75 | | | $ | 0.57 | | | $ | 1.29 | | | $ | 2.02 | | | |
| Diluted earnings | 0.51 | | | 0.37 | | | 0.40 | | | 0.74 | | | 0.56 | | | 1.28 | | | 2.01 | | | |
| Dividends paid | 0.18 | | | 0.18 | | | 0.18 | | | 0.18 | | | 0.18 | | | 0.54 | | | 0.48 | | | |
Book value (1) | 28.33 | | | 27.96 | | | 27.84 | | | 27.32 | | | 26.96 | | | 28.33 | | | 26.96 | | | |
Tangible book value (3) | 20.23 | | | 19.90 | | | 19.79 | | | 19.41 | | | 19.26 | | | 20.23 | | | 19.26 | | | |
| | | | | | | | | | | | | | | |
| | | | | | | | | | | | | | | |
| | | | | | | | | | | | | | | |
| | | | | | | | | | | | | | | |
| Market capitalization | $ | 208,656 | | | $ | 205,772 | | | $ | 184,181 | | | $ | 311,209 | | | $ | 264,842 | | | $ | 208,656 | | | $ | 264,842 | | | |
| Average balance sheet | | | | | | | | | | | | | | | |
| Total loans and leases | $ | 974,018 | | | $ | 1,031,387 | | | $ | 990,283 | | | $ | 973,986 | | | $ | 964,733 | | | | | | | |
| Total assets | 2,739,684 | | | 2,704,186 | | | 2,494,928 | | | 2,450,005 | | | 2,412,223 | | | | | | | |
| Total deposits | 1,695,488 | | | 1,658,197 | | | 1,439,336 | | | 1,410,439 | | | 1,375,052 | | | | | | | |
| Long-term debt | 224,254 | | | 221,167 | | | 210,816 | | | 206,026 | | | 202,620 | | | | | | | |
| Common shareholders’ equity | 243,896 | | | 242,889 | | | 241,078 | | | 243,439 | | | 246,630 | | | | | | | |
| Total shareholders’ equity | 267,323 | | | 266,316 | | | 264,534 | | | 266,900 | | | 270,430 | | | | | | | |
| Asset quality | | | | | | | | | | | | | | | |
Allowance for credit losses (4) | $ | 21,506 | | | $ | 21,091 | | | $ | 17,126 | | | $ | 10,229 | | | $ | 10,242 | | | | | | | |
Nonperforming loans, leases and foreclosed properties (5) | 4,730 | | | 4,611 | | | 4,331 | | | 3,837 | | | 3,723 | | | | | | | |
Allowance for loan and lease losses as a percentage of total loans and leases outstanding (5) | 2.07 | % | | 1.96 | % | | 1.51 | % | | 0.97 | % | | 0.98 | % | | | | | | |
Allowance for loan and lease losses as a percentage of total nonperforming loans and leases (5) | 431 | | | 441 | | | 389 | | | 265 | | | 271 | | | | | | | |
| Net charge-offs | $ | 972 | | | $ | 1,146 | | | $ | 1,122 | | | $ | 959 | | | $ | 811 | | | | | | | |
Annualized net charge-offs as a percentage of average loans and leases outstanding (5) | 0.40 | % | | 0.45 | % | | 0.46 | % | | 0.39 | % | | 0.34 | % | | | | | | |
| | | | | | | | | | | | | | | |
| | | | | | | | | | | | | | | |
| | | | | | | | | | | | | | | |
| | | | | | | | | | | | | | | |
| | | | | | | | | | | | | | | |
| | | | | | | | | | | | | | | |
| | | | | | | | | | | | | | | |
Capital ratios at period end (6) | | | | | | | | | | | | | | | |
| | | | | | | | | | | | | | | |
| Common equity tier 1 capital | 11.9 | % | | 11.4 | % | | 10.8 | % | | 11.2 | % | | 11.4 | % | | | | | | |
| | | | | | | | | | | | | | | |
| Tier 1 capital | 13.5 | | | 12.9 | | | 12.3 | | | 12.6 | | | 12.9 | | | | | | | |
| Total capital | 16.1 | | | 14.8 | | | 14.6 | | | 14.7 | | | 15.1 | | | | | | | |
| Tier 1 leverage | 7.4 | | | 7.4 | | | 7.9 | | | 7.9 | | | 8.2 | | | | | | | |
| Supplementary leverage ratio | 6.9 | | | 7.1 | | | 6.4 | | | 6.4 | | | 6.6 | | | | | | | |
Tangible equity (3) | 7.4 | | | 7.3 | | | 7.7 | | | 8.2 | | | 8.4 | | | | | | | |
Tangible common equity (3) | 6.6 | | | 6.5 | | | 6.7 | | | 7.3 | | | 7.4 | | | | | | | |
| Total loss-absorbing capacity and long-term debt metrics | | | | | | | | | | | | | | | |
| Total loss-absorbing capacity to risk-weighted assets | 26.9 | % | | 26.0 | % | | 24.6 | % | | 24.6 | % | | 24.8 | % | | | | | | |
| Total loss-absorbing capacity to supplementary leverage exposure | 13.7 | | | 14.2 | | | 12.8 | | | 12.5 | | | 12.7 | | | | | | | |
| Eligible long-term debt to risk-weighted assets | 12.9 | | | 12.4 | | | 11.6 | | | 11.5 | | | 11.4 | | | | | | | |
| Eligible long-term debt to supplementary leverage exposure | 6.6 | | | 6.7 | | | 6.1 | | | 5.8 | | | 5.8 | | | | | | | |
(1)For definitions, see Key Metrics on page 104.
(2)Calculated as total net income for four consecutive quarters divided by annualized average assets for four consecutive quarters.
(3)Tangible equity ratios and tangible book value per share of common stock are non-GAAP financial measures. For more information on these ratios and corresponding reconciliations to GAAP financial measures, see Supplemental Financial Data on page 8 and Non-GAAP Reconciliations on page 51.
(4)Includes the allowance for loan and lease losses and the reserve for unfunded lending commitments.
(5)Balances and ratios do not include loans accounted for under the fair value option. For additional exclusions from nonperforming loans, leases and foreclosed properties, see Consumer Portfolio Credit Risk Management – Nonperforming Consumer Loans, Leases and Foreclosed Properties Activity on page 36 and corresponding Table 26 and Commercial Portfolio Credit Risk Management – Nonperforming Commercial Loans, Leases and Foreclosed Properties Activity on page 41 and corresponding Table 33.
(6)For more information, including which approach is used to assess capital adequacy, see Capital Management on page 23.
n/a = not applicable
| | | | | | | | | | | | | | | | | | | | | | | | | | | | | | | | | | | | | | |
| | | | | | | | | | | | |
| Table 6 | Quarterly Average Balances and Interest Rates - FTE Basis | | | | | | | | |
| | | | | | | | | | | | |
| Average
Balance | | Interest
Income/ Expense (1) | | Yield/
Rate | | Average
Balance | | Interest Income/ Expense (1) | | Yield/
Rate |
| (Dollars in millions) | Third Quarter 2020 | | Third Quarter 2019 |
| Earning assets | | | | | | | | | | | |
Interest-bearing deposits with the Federal Reserve, non-U.S. central banks and other banks | $ | 245,682 | | | $ | 10 | | | 0.02 | % | | $ | 122,033 | | | $ | 453 | | | 1.47 | % |
| Time deposits placed and other short-term investments | 7,686 | | | (4) | | | (0.25) | | | 9,863 | | | 47 | | | 1.87 | |
Federal funds sold and securities borrowed or purchased under agreements to resell | 384,221 | | | 55 | | | 0.06 | | | 269,129 | | | 1,242 | | | 1.83 | |
| Trading account assets | 146,972 | | | 960 | | | 2.60 | | | 157,818 | | | 1,338 | | | 3.37 | |
| Debt securities | 533,261 | | | 2,147 | | | 1.63 | | | 447,126 | | | 2,856 | | | 2.56 | |
Loans and leases (2): | | | | | | | | | | | |
| Residential mortgage | 237,414 | | | 1,811 | | | 3.05 | | | 224,084 | | | 1,937 | | | 3.46 | |
| Home equity | 37,897 | | | 284 | | | 2.99 | | | 43,616 | | | 552 | | | 5.03 | |
| Credit card | 81,309 | | | 2,086 | | | 10.20 | | | 94,370 | | | 2,581 | | | 10.85 | |
| | | | | | | | | | | |
Direct/Indirect and other consumer (3) | 89,559 | | | 593 | | | 2.63 | | | 90,813 | | | 824 | | | 3.59 | |
| | | | | | | | | | | |
| Total consumer | 446,179 | | | 4,774 | | | 4.26 | | | 452,883 | | | 5,894 | | | 5.18 | |
| U.S. commercial | 343,533 | | | 2,099 | | | 2.43 | | | 324,436 | | | 3,279 | | | 4.01 | |
| Non-U.S. commercial | 102,938 | | | 531 | | | 2.05 | | | 105,003 | | | 905 | | | 3.42 | |
Commercial real estate (4) | 63,262 | | | 393 | | | 2.47 | | | 62,185 | | | 687 | | | 4.38 | |
| Commercial lease financing | 18,106 | | | 138 | | | 3.04 | | | 20,226 | | | 182 | | | 3.58 | |
| Total commercial | 527,839 | | | 3,161 | | | 2.38 | | | 511,850 | | | 5,053 | | | 3.92 | |
| Total loans and leases | 974,018 | | | 7,935 | | | 3.25 | | | 964,733 | | | 10,947 | | | 4.51 | |
| Other earning assets | 83,086 | | | 497 | | | 2.39 | | | 68,018 | | | 1,181 | | | 6.90 | |
| Total earning assets | 2,374,926 | | | 11,600 | | | 1.95 | | | 2,038,720 | | | 18,064 | | | 3.52 | |
| Cash and due from banks | 32,714 | | | | | | | 25,588 | | | | | |
| Other assets, less allowance for loan and lease losses | 332,044 | | | | | | | 347,915 | | | | | |
| Total assets | $ | 2,739,684 | | | | | | | $ | 2,412,223 | | | | | |
| Interest-bearing liabilities | | | | | | | | | | | |
| U.S. interest-bearing deposits: | | | | | | | | | | | |
| Savings | $ | 61,228 | | | $ | 1 | | | 0.01 | % | | $ | 51,277 | | | $ | 1 | | | 0.01 | % |
| Demand and money market deposit accounts | 842,987 | | | 93 | | | 0.04 | | | 741,602 | | | 1,172 | | | 0.63 | |
| Consumer CDs and IRAs | 45,921 | | | 84 | | | 0.73 | | | 49,811 | | | 136 | | | 1.08 | |
| Negotiable CDs, public funds and other deposits | 57,499 | | | 31 | | | 0.21 | | | 63,936 | | | 354 | | | 2.19 | |
| Total U.S. interest-bearing deposits | 1,007,635 | | | 209 | | | 0.08 | | | 906,626 | | | 1,663 | | | 0.73 | |
| Non-U.S. interest-bearing deposits: | | | | | | | | | | | |
| Banks located in non-U.S. countries | 1,108 | | | — | | | 0.08 | | | 1,721 | | | 5 | | | 1.13 | |
| Governments and official institutions | 177 | | | — | | | — | | | 188 | | | — | | | 0.02 | |
| Time, savings and other | 74,200 | | | 18 | | | 0.10 | | | 70,234 | | | 212 | | | 1.20 | |
| Total non-U.S. interest-bearing deposits | 75,485 | | | 18 | | | 0.09 | | | 72,143 | | | 217 | | | 1.19 | |
| Total interest-bearing deposits | 1,083,120 | | | 227 | | | 0.08 | | | 978,769 | | | 1,880 | | | 0.76 | |
| Federal funds purchased, securities loaned or sold under agreements to repurchase, short-term borrowings and other interest-bearing liabilities | 286,582 | | | (24) | | | (0.03) | | | 280,123 | | | 1,876 | | | 2.66 | |
| Trading account liabilities | 39,689 | | | 212 | | | 2.13 | | | 45,750 | | | 303 | | | 2.63 | |
| Long-term debt | 224,254 | | | 942 | | | 1.67 | | | 202,620 | | | 1,670 | | | 3.28 | |
| Total interest-bearing liabilities | 1,633,645 | | | 1,357 | | | 0.33 | | | 1,507,262 | | | 5,729 | | | 1.51 | |
| Noninterest-bearing sources: | | | | | | | | | | | |
| Noninterest-bearing deposits | 612,368 | | | | | | | 396,283 | | | | | |
Other liabilities (5) | 226,348 | | | | | | | 238,248 | | | | | |
| Shareholders’ equity | 267,323 | | | | | | | 270,430 | | | | | |
| Total liabilities and shareholders’ equity | $ | 2,739,684 | | | | | | | $ | 2,412,223 | | | | | |
| Net interest spread | | | | | 1.62 | % | | | | | | 2.01 | % |
| Impact of noninterest-bearing sources | | | | | 0.10 | | | | | | | 0.40 | |
Net interest income/yield on earning assets (6) | | | $ | 10,243 | | | 1.72 | % | | | | $ | 12,335 | | | 2.41 | % |
(1)Includes the impact of interest rate risk management contracts. For more information, see Interest Rate Risk Management for the Banking Book on page 48.
(2)Nonperforming loans are included in the respective average loan balances. Income on these nonperforming loans is generally recognized on a cost recovery basis.
(3)Includes non-U.S. consumer loans of $2.9 billion for both the third quarter of 2020 and 2019.
(4)Includes U.S. commercial real estate loans of $59.6 billion and $57.6 billion, and non-U.S. commercial real estate loans of $3.7 billion and $4.5 billion for the third quarter of 2020 and 2019.
(5)Includes $34.2 billion and $38.1 billion of structured notes and liabilities for the third quarter of 2020 and 2019.
(6)Net interest income includes FTE adjustments of $114 million and $148 million for the third quarter of 2020 and 2019.
| | | | | | | | | | | | | | | | | | | | | | | | | | | | | | | | | | | | | | | | | | | | |
| | | | | | | | | | | | | | | | | | |
| Table 7 | Year-to-Date Average Balances and Interest Rates - FTE Basis | | | | | | |
| | | | | | | | | | | | | | | | | | |
| | Average
Balance | | Interest
Income/
Expense (1) | | Yield/
Rate | | Average
Balance | | Interest
Income/
Expense (1) | | Yield/
Rate | | | | | | |
| Nine Months Ended September 30 | | | | | | |
| (Dollars in millions) | 2020 | | 2019 | | |
| Earning assets | | | | | | | | | | | | | | | | | |
Interest-bearing deposits with the Federal Reserve, non-U.S. central banks and other banks | $ | 230,265 | | | $ | 311 | | | 0.18 | % | | $ | 126,416 | | | $ | 1,454 | | | 1.54 | % | | | | | | |
| Time deposits placed and other short-term investments | 9,070 | | | 31 | | | 0.45 | | | 9,377 | | | 167 | | | 2.38 | | | | | | | |
Federal funds sold and securities borrowed or purchased under agreements to resell | 325,356 | | | 900 | | | 0.37 | | | 274,822 | | | 3,746 | | | 1.82 | | | | | | | |
| Trading account assets | 149,002 | | | 3,247 | | | 2.91 | | | 148,368 | | | 4,016 | | | 3.62 | | | | | | | |
| Debt securities | 491,664 | | | 7,477 | | | 2.05 | | | 445,104 | | | 9,051 | | | 2.71 | | | | | | | |
Loans and leases (2): | | | | | | | | | | | | | | | | | |
| Residential mortgage | 239,623 | | | 5,678 | | | 3.16 | | | 216,744 | | | 5,698 | | | 3.51 | | | | | | | |
| Home equity | 39,078 | | | 1,013 | | | 3.46 | | | 45,735 | | | 1,732 | | | 5.06 | | | | | | | |
| Credit card | 87,302 | | | 6,690 | | | 10.24 | | | 94,333 | | | 7,622 | | | 10.80 | | | | | | | |
| | | | | | | | | | | | | | | | | |
Direct/Indirect and other consumer (3) | 89,824 | | | 1,962 | | | 2.92 | | | 90,567 | | | 2,475 | | | 3.65 | | | | | | | |
| | | | | | | | | | | | | | | | | |
| Total consumer | 455,827 | | | 15,343 | | | 4.49 | | | 447,379 | | | 17,527 | | | 5.23 | | | | | | | |
| U.S. commercial | 349,616 | | | 7,407 | | | 2.83 | | | 319,621 | | | 10,010 | | | 4.19 | | | | | | | |
| Non-U.S. commercial | 110,096 | | | 1,975 | | | 2.40 | | | 103,625 | | | 2,685 | | | 3.46 | | | | | | | |
Commercial real estate (4) | 64,062 | | | 1,406 | | | 2.93 | | | 61,612 | | | 2,109 | | | 4.58 | | | | | | | |
| Commercial lease financing | 18,872 | | | 427 | | | 3.02 | | | 20,932 | | | 550 | | | 3.50 | | | | | | | |
| Total commercial | 542,646 | | | 11,215 | | | 2.76 | | | 505,790 | | | 15,354 | | | 4.06 | | | | | | | |
| Total loans and leases | 998,473 | | | 26,558 | | | 3.55 | | | 953,169 | | | 32,881 | | | 4.61 | | | | | | | |
| Other earning assets | 81,079 | | | 1,986 | | | 3.27 | | | 67,431 | | | 3,445 | | | 6.83 | | | | | | | |
| Total earning assets | 2,284,909 | | | 40,510 | | | 2.37 | | | 2,024,687 | | | 54,760 | | | 3.61 | | | | | | | |
| Cash and due from banks | 30,663 | | | | | | | 25,787 | | | | | | | | | | | |
| Other assets, less allowance for loan and lease losses | 331,035 | | | | | | | 340,469 | | | | | | | | | | | |
| Total assets | $ | 2,646,607 | | | | | | | $ | 2,390,943 | | | | | | | | | | | |
| Interest-bearing liabilities | | | | | | | | | | | | | | | | | |
| U.S. interest-bearing deposits: | | | | | | | | | | | | | | | | | |
| Savings | $ | 56,271 | | | $ | 4 | | | 0.01 | % | | $ | 52,604 | | | $ | 4 | | | 0.01 | % | | | | | | |
| Demand and money market deposit accounts | 821,324 | | | 898 | | | 0.15 | | | 736,613 | | | 3,557 | | | 0.65 | | | | | | | |
| Consumer CDs and IRAs | 50,040 | | | 358 | | | 0.96 | | | 45,688 | | | 315 | | | 0.92 | | | | | | | |
| Negotiable CDs, public funds and other deposits | 68,964 | | | 296 | | | 0.57 | | | 66,618 | | | 1,129 | | | 2.27 | | | | | | | |
| Total U.S. interest-bearing deposits | 996,599 | | | 1,556 | | | 0.21 | | | 901,523 | | | 5,005 | | | 0.74 | | | | | | | |
| Non-U.S. interest-bearing deposits: | | | | | | | | | | | | | | | | | |
| Banks located in non-U.S. countries | 1,604 | | | 3 | | | 0.27 | | | 2,044 | | | 16 | | | 1.03 | | | | | | | |
| Governments and official institutions | 174 | | | — | | | 0.02 | | | 182 | | | — | | | 0.06 | | | | | | | |
| Time, savings and other | 74,660 | | | 225 | | | 0.40 | | | 67,740 | | | 619 | | | 1.22 | | | | | | | |
| Total non-U.S. interest-bearing deposits | 76,438 | | | 228 | | | 0.40 | | | 69,966 | | | 635 | | | 1.21 | | | | | | | |
| Total interest-bearing deposits | 1,073,037 | | | 1,784 | | | 0.22 | | | 971,489 | | | 5,640 | | | 0.78 | | | | | | | |
| Federal funds purchased, securities loaned or sold under agreements to repurchase, short-term borrowings and other interest-bearing liabilities | 295,483 | | | 1,024 | | | 0.46 | | | 274,550 | | | 5,725 | | | 2.79 | | | | | | | |
| Trading account liabilities | 42,838 | | | 764 | | | 2.38 | | | 46,122 | | | 967 | | | 2.80 | | | | | | | |
| Long-term debt | 218,766 | | | 3,445 | | | 2.10 | | | 200,139 | | | 5,227 | | | 3.49 | | | | | | | |
| Total interest-bearing liabilities | 1,630,124 | | | 7,017 | | | 0.58 | | | 1,492,300 | | | 17,559 | | | 1.57 | | | | | | | |
| Noninterest-bearing sources: | | | | | | | | | | | | | | | | | |
| Noninterest-bearing deposits | 524,994 | | | | | | | 398,689 | | | | | | | | | | | |
Other liabilities (5) | 225,427 | | | | | | | 231,731 | | | | | | | | | | | |
| Shareholders’ equity | 266,062 | | | | | | | 268,223 | | | | | | | | | | | |
| Total liabilities and shareholders’ equity | $ | 2,646,607 | | | | | | | $ | 2,390,943 | | | | | | | | | | | |
| Net interest spread | | | | | 1.79 | % | | | | | | 2.04 | % | | | | | | |
| Impact of noninterest-bearing sources | | | | | 0.17 | | | | | | | 0.41 | | | | | | | |
Net interest income/yield on earning assets (6) | | | $ | 33,493 | | | 1.96 | % | | | | $ | 37,201 | | | 2.45 | % | | | | | | |
(1)Includes the impact of interest rate risk management contracts. For more information, see Interest Rate Risk Management for the Banking Book on page 48.
(2)Nonperforming loans are included in the respective average loan balances. Income on these nonperforming loans is generally recognized on a cost recovery basis.
(3)Includes non-U.S. consumer loans of $2.9 billion for both the nine months ended September 30, 2020 and 2019.
(4)Includes U.S. commercial real estate loans of $60.4 billion and $57.0 billion, and non-U.S. commercial real estate loans of $3.7 billion and $4.6 billion for the nine months ended September 30, 2020 and 2019.
(5)Includes $35.1 billion and $34.9 billion of structured notes and liabilities for the nine months ended September 30, 2020 and 2019.
(6)Net interest income includes FTE adjustments of $386 million and $450 million for the nine months ended September 30, 2020 and 2019.
|
| | | | | | | | | | | | | | | | | | | | | | |
| | | | | | | | | | | | | |
| Table 10 | Year-to-Date Average Balances and Interest Rates – FTE Basis |
| | | | | | | | | | | | | |
| | | Nine Months Ended September 30 |
| | | 2017 | | 2016 |
| (Dollars in millions) | Average
Balance | | Interest
Income/
Expense | | Yield/
Rate | | Average
Balance | | Interest
Income/
Expense | | Yield/
Rate |
| Earning assets | |
| | |
| | |
| | |
| | |
| | |
|
| Interest-bearing deposits with the Federal Reserve, non-U.S. central banks and other banks | $ | 127,000 |
| | $ | 786 |
| | 0.83 | % | | $ | 135,910 |
| | $ | 460 |
| | 0.45 | % |
| Time deposits placed and other short-term investments | 11,820 |
| | 173 |
| | 1.96 |
| | 8,784 |
| | 101 |
| | 1.54 |
|
| Federal funds sold and securities borrowed or purchased under agreements to resell | 222,255 |
| | 1,658 |
| | 1.00 |
| | 215,476 |
| | 803 |
| | 0.50 |
|
| Trading account assets | 128,547 |
| | 3,435 |
| | 3.57 |
| | 130,785 |
| | 3,432 |
| | 3.50 |
|
Debt securities (1) | 432,775 |
| | 7,875 |
| | 2.42 |
| | 414,115 |
| | 6,990 |
| | 2.27 |
|
Loans and leases (2): | |
| | |
| | |
| | |
| | |
| | |
|
| Residential mortgage | 196,288 |
| | 5,082 |
| | 3.45 |
| | 187,325 |
| | 4,867 |
| | 3.46 |
|
| Home equity | 63,339 |
| | 1,967 |
| | 4.15 |
| | 73,015 |
| | 2,095 |
| | 3.83 |
|
| U.S. credit card | 90,238 |
| | 6,492 |
| | 9.62 |
| | 87,362 |
| | 6,065 |
| | 9.27 |
|
Non-U.S. credit card (1) | 5,253 |
| | 358 |
| | 9.12 |
| | 9,687 |
| | 734 |
| | 10.12 |
|
Direct/Indirect consumer (3) | 93,316 |
| | 1,929 |
| | 2.76 |
| | 91,291 |
| | 1,698 |
| | 2.48 |
|
Other consumer (4) | 2,648 |
| | 81 |
| | 4.07 |
| | 2,240 |
| | 50 |
| | 2.99 |
|
| Total consumer | 451,082 |
| | 15,909 |
| | 4.71 |
| | 450,920 |
| | 15,509 |
| | 4.59 |
|
| U.S. commercial | 290,632 |
| | 7,167 |
| | 3.30 |
| | 274,669 |
| | 5,982 |
| | 2.91 |
|
Commercial real estate (5) | 58,340 |
| | 1,545 |
| | 3.54 |
| | 57,550 |
| | 1,320 |
| | 3.06 |
|
| Commercial lease financing | 21,862 |
| | 547 |
| | 3.33 |
| | 21,049 |
| | 482 |
| | 3.05 |
|
| Non-U.S. commercial | 93,762 |
| | 1,886 |
| | 2.69 |
| | 93,572 |
| | 1,748 |
| | 2.50 |
|
| Total commercial | 464,596 |
| | 11,145 |
| | 3.21 |
| | 446,840 |
| | 9,532 |
| | 2.85 |
|
| Total loans and leases | 915,678 |
| | 27,054 |
| | 3.95 |
| | 897,760 |
| | 25,041 |
| | 3.72 |
|
| Other earning assets | 74,554 |
| | 2,206 |
| | 3.95 |
| | 58,189 |
| | 2,031 |
| | 4.66 |
|
Total earning assets (6) | 1,912,629 |
| | 43,187 |
| | 3.02 |
| | 1,861,019 |
| | 38,858 |
| | 2.79 |
|
Cash and due from banks (1) | 27,955 |
| | | | |
| | 28,041 |
| | | | |
|
Other assets, less allowance for loan and lease losses (1) | 316,709 |
| | |
| | |
| | 294,845 |
| | |
| | |
|
| Total assets | $ | 2,257,293 |
| | |
| | |
| | $ | 2,183,905 |
| | |
| | |
|
| Interest-bearing liabilities | |
| | |
| | |
| | |
| | |
| | |
|
| U.S. interest-bearing deposits: | |
| | |
| | |
| | |
| | |
| | |
|
| Savings | $ | 53,679 |
| | $ | 4 |
| | 0.01 | % | | $ | 49,281 |
| | $ | 4 |
| | 0.01 | % |
| NOW and money market deposit accounts | 622,920 |
| | 512 |
| | 0.11 |
| | 584,896 |
| | 216 |
| | 0.05 |
|
| Consumer CDs and IRAs | 45,535 |
| | 92 |
| | 0.27 |
| | 48,920 |
| | 101 |
| | 0.28 |
|
| Negotiable CDs, public funds and other deposits | 35,968 |
| | 221 |
| | 0.82 |
| | 32,212 |
| | 107 |
| | 0.45 |
|
| Total U.S. interest-bearing deposits | 758,102 |
| | 829 |
| | 0.15 |
| | 715,309 |
| | 428 |
| | 0.08 |
|
| Non-U.S. interest-bearing deposits: | |
| | |
| | |
| | |
| | |
| | |
|
| Banks located in non-U.S. countries | 2,643 |
| | 16 |
| | 0.82 |
| | 4,218 |
| | 28 |
| | 0.90 |
|
| Governments and official institutions | 1,002 |
| | 7 |
| | 0.92 |
| | 1,468 |
| | 7 |
| | 0.60 |
|
| Time, savings and other | 60,747 |
| | 400 |
| | 0.88 |
| | 58,866 |
| | 273 |
| | 0.62 |
|
| Total non-U.S. interest-bearing deposits | 64,392 |
| | 423 |
| | 0.88 |
| | 64,552 |
| | 308 |
| | 0.64 |
|
| Total interest-bearing deposits | 822,494 |
| | 1,252 |
| | 0.20 |
| | 779,861 |
| | 736 |
| | 0.13 |
|
| Federal funds purchased, securities loaned or sold under agreements to repurchase, short-term borrowings and other interest-bearing liabilities | 237,857 |
| | 2,508 |
| | 1.41 |
| | 215,131 |
| | 1,808 |
| | 1.12 |
|
| Trading account liabilities | 44,128 |
| | 890 |
| | 2.70 |
| | 37,760 |
| | 778 |
| | 2.76 |
|
| Long-term debt | 224,287 |
| | 4,658 |
| | 2.77 |
| | 231,313 |
| | 4,066 |
| | 2.35 |
|
Total interest-bearing liabilities (6) | 1,328,766 |
| | 9,308 |
| | 0.94 |
| | 1,264,065 |
| | 7,388 |
| | 0.78 |
|
| Noninterest-bearing sources: | |
| | |
| | |
| | |
| | |
| | |
|
| Noninterest-bearing deposits | 439,288 |
| | |
| | |
| | 433,168 |
| | |
| | |
|
| Other liabilities | 218,227 |
| | |
| | |
| | 221,765 |
| | |
| | |
|
| Shareholders’ equity | 271,012 |
| | |
| | |
| | 264,907 |
| | |
| | |
|
| Total liabilities and shareholders’ equity | $ | 2,257,293 |
| | |
| | |
| | $ | 2,183,905 |
| | |
| | |
|
| Net interest spread | |
| | |
| | 2.08 | % | | |
| | |
| | 2.01 | % |
| Impact of noninterest-bearing sources | |
| | |
| | 0.28 |
| | |
| | |
| | 0.25 |
|
| Net interest income/yield on earning assets | |
| | $ | 33,879 |
| | 2.36 | % | | |
| | $ | 31,470 |
| | 2.26 | % |
| | | | | | | | |
(1)11Bank of America
| Includes assets of the Corporation's non-U.S. consumer credit card business, which was sold during the second quarter of 2017. | |
| | | | | | | | |
(2)
| Nonperforming loans are included in the respective average loan balances. Income on these nonperforming loans is generally recognized on a cost recovery basis. PCI loans were recorded at fair value upon acquisition and accrete interest income over the estimated life of the loan. |
Includes non-U.S. consumer loans of $2.9 billion and $3.5 billion for the nine months ended September 30, 2017 and 2016.
| | |
(4)
| Includes consumer finance loans of $430 million and $526 million; consumer leases of $2.0 billion and $1.5 billion, and consumer overdrafts of $177 million and $171 million for the nine months ended September 30, 2017 and 2016, respectively.
|
| |
(5)
| Includes U.S. commercial real estate loans of $55.0 billion and $54.1 billion, and non-U.S. commercial real estate loans of $3.4 billion and $3.4 billion for the nine months ended September 30, 2017 and 2016, respectively.
|
| |
(6)
| Interest income includes the impact of interest rate risk management contracts, which decreased interest income on the underlying assets by $48 million and $155 million for the nine months ended September 30, 2017 and 2016. Interest expense includes the impact of interest rate risk management contracts, which decreased interest expense on the underlying liabilities by $1.1 billion and $1.7 billion for the nine months ended September 30, 2017 and 2016. For additional information, see Interest Rate Risk Management for the Banking Book on page 63.
|
Business Segment Operations
Segment Description and Basis of Presentation
We report our results of operations through the following four business segments: Consumer Banking,, GWIM,, Global Bankingand Global Markets, with the remaining operations recorded in All Other. We manage our segments and report their results on an FTE basis. For more information, see Business Segment Operations in the MD&A of the Corporation’s 2019 Annual Report on Form 10-K.
We periodically review capital allocated to our businesses and allocate capital annually during the strategic and capital planning processes. We utilize a methodology that considers the effect of regulatory capital requirements in addition to internal risk-
basedrisk-based capital models. Our internal risk-based capital models use a risk-adjusted methodology incorporating each segment’s credit, market, interest rate, business and operational risk components. For more information on the nature of these risks, see Managing Risk on page 28. 23. The
capital allocated to the business segments is referred to as allocated capital. Allocated equity in the reporting units is comprised of allocated capital plus capital for the portion of goodwill and intangibles specifically assigned to the reporting unit. For more information, see Note 7 – Goodwill and Intangible Assets to the Consolidated Financial Statements.
For more information on theour presentation of financial information on an FTE basis, of presentationsee Supplemental Financial Data on page 8, and for business segments and reconciliations to consolidated total revenue, net income and period-end total assets, seeNote 17 – Business Segment Information to the Consolidated Financial Statements.
Key Performance Indicators
We present certain key financial and nonfinancial performance indicators that management uses when evaluating segment results. We believe they are useful to investors because they provide additional information about our segments’ operational performance, customer trends and business growth.
Consumer Banking
| | | | | | | | | | | | | | | | | | | | | | | | | | | | | | | | | | | |
| | | | | | | | | | | |
| | Deposits | | Consumer Lending | | Total Consumer Banking | | |
| Three Months Ended September 30 | | |
| (Dollars in millions) | 2020 | 2019 | | 2020 | 2019 | | 2020 | 2019 | | % Change |
| Net interest income | $ | 3,244 | | $ | 4,196 | | | $ | 2,646 | | $ | 2,835 | | | $ | 5,890 | | $ | 7,031 | | | (16) | % |
| Noninterest income: | | | | | | | | | | |
| Card income | (3) | | (11) | | | 1,224 | | 1,300 | | | 1,221 | | 1,289 | | | (5) | |
| Service charges | 836 | | 1,098 | | | 1 | | — | | | 837 | | 1,098 | | | (24) | |
| All other income | 85 | | 232 | | | 6 | | 74 | | | 91 | | 306 | | | (70) | |
| Total noninterest income | 918 | | 1,319 | | | 1,231 | | 1,374 | | | 2,149 | | 2,693 | | | (20) | |
| Total revenue, net of interest expense | 4,162 | | 5,515 | | | 3,877 | | 4,209 | | | 8,039 | | 9,724 | | | (17) | |
| | | | | | | | | | |
| Provision for credit losses | 59 | | 84 | | | 420 | | 833 | | | 479 | | 917 | | | (48) | |
| Noninterest expense | 2,938 | | 2,664 | | | 1,904 | | 1,735 | | | 4,842 | | 4,399 | | | 10 | |
| Income before income taxes | 1,165 | | 2,767 | | | 1,553 | | 1,641 | | | 2,718 | | 4,408 | | | (38) | |
| Income tax expense | 285 | | 678 | | | 381 | | 402 | | | 666 | | 1,080 | | | (38) | |
| Net income | $ | 880 | | $ | 2,089 | | | $ | 1,172 | | $ | 1,239 | | | $ | 2,052 | | $ | 3,328 | | | (38) | |
| | | | | | | | | | |
Effective tax rate (1) | | | | | | | 24.5 | % | 24.5 | % | | |
| | | | | | | | | | |
| Net interest yield | 1.52 | % | 2.37 | % | | 3.35 | % | 3.76 | % | | 2.61 | | 3.77 | | | |
| Return on average allocated capital | 29 | | 69 | | | 18 | | 20 | | | 21 | | 36 | | | |
| Efficiency ratio | 70.60 | | 48.29 | | | 49.10 | | 41.23 | | | 60.23 | | 45.23 | | | |
| | | | | | | | | | | |
| Balance Sheet | | | | | | | | | | | |
| | Three Months Ended September 30 | | |
| Average | | 2020 | 2019 | | 2020 | 2019 | | 2020 | 2019 | | % Change |
| | | | | | | | | | | |
| | | | | | | | | | | |
| Total loans and leases | $ | 5,046 | | $ | 5,404 | | | $ | 313,705 | | $ | 298,428 | | | $ | 318,751 | | $ | 303,832 | | | 5 | % |
Total earning assets (2) | 849,189 | | 703,926 | | | 314,079 | | 299,041 | | | 896,867 | | 739,802 | | | 21 | |
Total assets (2) | 886,406 | | 735,913 | | | 316,107 | | 308,991 | | | 936,112 | | 781,739 | | | 20 | |
| Total deposits | 853,452 | | 703,628 | | | 7,547 | | 5,711 | | | 860,999 | | 709,339 | | | 21 | |
| Allocated capital | 12,000 | | 12,000 | | | 26,500 | | 25,000 | | | 38,500 | | 37,000 | | | 4 | |
| | | | | | | | | | | |
| | | | | | | | | | | |
| | | | | | | | | | | |
| | | | | | | | | | |
| | | | | | | | | | |
| | | | | | | | | | |
| | | | | | | | | | |
|
| | | | | | | | | | | | | | | | | | | | | | | | |
| | | | | | | | | | | | |
| | | Three Months Ended September 30 | | |
| | Deposits | | Consumer Lending | | Total Consumer Banking | | |
| (Dollars in millions) | 2017 | 2016 | | 2017 | 2016 | | 2017 | 2016 | | % Change |
|
| Net interest income (FTE basis) | $ | 3,439 |
| $ | 2,629 |
| | $ | 2,772 |
| $ | 2,660 |
| | $ | 6,211 |
| $ | 5,289 |
| | 17 | % |
| Noninterest income: | | | | | | | | | | |
| Card income | 3 |
| 2 |
| | 1,241 |
| 1,216 |
| | 1,244 |
| 1,218 |
| | 2 |
|
| Service charges | 1,082 |
| 1,072 |
| | 1 |
| — |
| | 1,083 |
| 1,072 |
| | 1 |
|
Mortgage banking income (1) | — |
| — |
| | 142 |
| 297 |
| | 142 |
| 297 |
| | (52 | ) |
| All other income (loss) | 96 |
| 98 |
| | (2 | ) | (6 | ) | | 94 |
| 92 |
| | 2 |
|
| Total noninterest income | 1,181 |
| 1,172 |
| | 1,382 |
| 1,507 |
| | 2,563 |
| 2,679 |
| | (4 | ) |
| Total revenue, net of interest expense (FTE basis) | 4,620 |
| 3,801 |
| | 4,154 |
| 4,167 |
| | 8,774 |
| 7,968 |
| | 10 |
|
| | | | | | | | | | |
|
|
| Provision for credit losses | 47 |
| 43 |
| | 920 |
| 655 |
| | 967 |
| 698 |
| | 39 |
|
| Noninterest expense | 2,615 |
| 2,397 |
| | 1,844 |
| 1,974 |
| | 4,459 |
| 4,371 |
| | 2 |
|
| Income before income taxes (FTE basis) | 1,958 |
| 1,361 |
| | 1,390 |
| 1,538 |
| | 3,348 |
| 2,899 |
| | 15 |
|
| Income tax expense (FTE basis) | 738 |
| 510 |
| | 523 |
| 576 |
| | 1,261 |
| 1,086 |
| | 16 |
|
| Net income | $ | 1,220 |
| $ | 851 |
| | $ | 867 |
| $ | 962 |
| | $ | 2,087 |
| $ | 1,813 |
| | 15 |
|
| | | | | | | | | | | |
| Net interest yield (FTE basis) | 2.08 | % | 1.73 | % | | 4.16 | % | 4.31 | % | | 3.56 | % | 3.30 | % | | |
| Return on average allocated capital | 40 |
| 28 |
| | 14 |
| 17 |
| | 22 |
| 21 |
| | |
| Efficiency ratio (FTE basis) | 56.61 |
| 63.03 |
| | 44.40 |
| 47.40 |
| | 50.83 |
| 54.86 |
| | |
| | | | | | | | | | | | |
| Balance Sheet | | | | | | | | | | | |
| | | Three Months Ended September 30 | | |
| Average | | 2017 | 2016 | | 2017 | 2016 | | 2017 | 2016 | | % Change |
|
| Total loans and leases | $ | 5,079 |
| $ | 4,837 |
| | $ | 263,731 |
| $ | 243,846 |
| | $ | 268,810 |
| $ | 248,683 |
| | 8 | % |
Total earning assets (2) | 657,036 |
| 604,223 |
| | 264,665 |
| 245,540 |
| | 692,122 |
| 636,832 |
| | 9 |
|
Total assets (2) | 684,642 |
| 630,394 |
| | 276,014 |
| 257,167 |
| | 731,077 |
| 674,630 |
| | 8 |
|
| Total deposits | 652,286 |
| 598,117 |
| | 6,688 |
| 7,588 |
| | 658,974 |
| 605,705 |
| | 9 |
|
| Allocated capital | 12,000 |
| 12,000 |
| | 25,000 |
| 22,000 |
| | 37,000 |
| 34,000 |
| | 9 |
|
| |
(1)
| Total consolidated mortgage banking income (loss) of $(20) million and $332 million for the three and nine months ended September 30, 2017 were recorded primarily in Consumer Lending and All Other, compared to $589 million and $1.3 billion for the same periods in 2016.
|
| |
(2)
| In segments and businesses where the total of liabilities and equity exceeds assets, we allocate assets from All Other to match the segments’ and businesses’ liabilities and allocated shareholders’ equity. As a result, total earning assets and total assets of the businesses may not equal total Consumer Banking.
|
(2)In segments and businesses where the total of liabilities and equity exceeds assets, we allocate assets from All Other to match the segments’ and businesses’ liabilities and allocated shareholders’ equity. As a result, total earning assets and total assets of the businesses may not equal total Consumer Banking.
| | | | | | | | | | | | |
| | | Nine Months Ended September 30 | | | | Deposits | | Consumer Lending | | Total Consumer Banking | |
| | | Deposits | | Consumer Lending | | Total Consumer Banking | | | | Nine Months Ended September 30 | |
| (Dollars in millions) | (Dollars in millions) | 2017 | 2016 | | 2017 | 2016 | | 2017 | 2016 | | % Change |
| (Dollars in millions) | 2020 | 2019 | | 2020 | 2019 | | 2020 | 2019 | | % Change |
| Net interest income (FTE basis) | $ | 9,804 |
| $ | 7,940 |
| | $ | 8,149 |
| $ | 7,885 |
| | $ | 17,953 |
| $ | 15,825 |
| | 13 | % | |
| Net interest income | | Net interest income | $ | 10,491 | | $ | 12,867 | | | $ | 8,252 | | $ | 8,386 | | | $ | 18,743 | | $ | 21,253 | | | (12) | % |
| Noninterest income: | Noninterest income: | | | | | | | | Noninterest income: | |
| Card income | Card income | 6 |
| 7 |
| | 3,710 |
| 3,638 |
| | 3,716 |
| 3,645 |
| | 2 |
| Card income | (15) | | (24) | | | 3,399 | | 3,778 | | | 3,384 | | 3,754 | | | (10) | |
| Service charges | Service charges | 3,193 |
| 3,079 |
| | 1 |
| 1 |
| | 3,194 |
| 3,080 |
| | 4 |
| Service charges | 2,537 | | 3,162 | | | 1 | | 1 | | | 2,538 | | 3,163 | | | (20) | |
Mortgage banking income (1) | — |
| — |
| | 401 |
| 754 |
| | 401 |
| 754 |
| | (47 | ) | |
| All other income | All other income | 294 |
| 312 |
| | 9 |
| 4 |
| | 303 |
| 316 |
| | (4 | ) | All other income | 244 | | 673 | | | 111 | | 230 | | | 355 | | 903 | | | (61) | |
| Total noninterest income | Total noninterest income | 3,493 |
| 3,398 |
| | 4,121 |
| 4,397 |
| | 7,614 |
| 7,795 |
| | (2 | ) | Total noninterest income | 2,766 | | 3,811 | | | 3,511 | | 4,009 | | | 6,277 | | 7,820 | | | (20) | |
| Total revenue, net of interest expense (FTE basis) | 13,297 |
| 11,338 |
| | 12,270 |
| 12,282 |
| | 25,567 |
| 23,620 |
| | 8 |
| |
| Total revenue, net of interest expense | | Total revenue, net of interest expense | 13,257 | | 16,678 | | | 11,763 | | 12,395 | | | 25,020 | | 29,073 | | | (14) | |
| | | | | | | | |
|
| | |
| Provision for credit losses | Provision for credit losses | 148 |
| 132 |
| | 2,491 |
| 1,823 |
| | 2,639 |
| 1,955 |
| | 35 |
| Provision for credit losses | 328 | | 173 | | | 5,433 | | 2,665 | | | 5,761 | | 2,838 | | | 103 | |
| Noninterest expense | Noninterest expense | 7,702 |
| 7,227 |
| | 5,578 |
| 6,097 |
| | 13,280 |
| 13,324 |
| | <(1) |
| Noninterest expense | 8,532 | | 7,993 | | | 5,539 | | 5,185 | | | 14,071 | | 13,178 | | | 7 | |
| Income before income taxes (FTE basis) | 5,447 |
| 3,979 |
| | 4,201 |
| 4,362 |
| | 9,648 |
| 8,341 |
| | 16 |
| |
| Income tax expense (FTE basis) | 2,054 |
| 1,473 |
| | 1,584 |
| 1,615 |
| | 3,638 |
| 3,088 |
| | 18 |
| |
| Income before income taxes | | Income before income taxes | 4,397 | | 8,512 | | | 791 | | 4,545 | | | 5,188 | | 13,057 | | | (60) | |
| Income tax expense | | Income tax expense | 1,077 | | 2,086 | | | 194 | | 1,113 | | | 1,271 | | 3,199 | | | (60) | |
| Net income | Net income | $ | 3,393 |
| $ | 2,506 |
| | $ | 2,617 |
| $ | 2,747 |
| | $ | 6,010 |
| $ | 5,253 |
| | 14 |
| Net income | $ | 3,320 | | $ | 6,426 | | | $ | 597 | | $ | 3,432 | | | $ | 3,917 | | $ | 9,858 | | | (60) | |
| | | | | | | | | | | | |
| Net interest yield (FTE basis) | 2.02 | % | 1.79 | % | | 4.21 | % | 4.39 | % | | 3.52 | % | 3.39 | % | | | |
Effective tax rate (1) | | Effective tax rate (1) | | 24.5 | % | 24.5 | % | |
| | Net interest yield | | Net interest yield | 1.76 | % | 2.46 | % | | 3.51 | % | 3.83 | % | | 2.98 | | 3.87 | | |
| Return on average allocated capital | Return on average allocated capital | 38 |
| 28 |
| | 14 |
| 17 |
| | 22 |
| 21 |
| | | Return on average allocated capital | 37 | | 72 | | | 3 | | 18 | | | 14 | | 36 | | |
| Efficiency ratio (FTE basis) | 57.93 |
| 63.74 |
| | 45.46 |
| 49.64 |
| | 51.94 |
| 56.41 |
| | | |
| Efficiency ratio | | Efficiency ratio | 64.36 | | 47.92 | | | 47.09 | | 41.84 | | | 56.24 | | 45.33 | | |
| | | | | | | | | | |
| Balance Sheet | | | | | | | | | Balance Sheet | | | |
| | | Nine Months Ended September 30 | | | | | Nine Months Ended September 30 | |
| Average | | 2017 | 2016 | | 2017 | 2016 | | 2017 | 2016 | | % Change |
| Average | | 2020 | 2019 | | 2020 | 2019 | | 2020 | 2019 | | % Change |
| | Total loans and leases | Total loans and leases | $ | 5,025 |
| $ | 4,787 |
| | $ | 257,779 |
| $ | 238,404 |
| | $ | 262,804 |
| $ | 243,191 |
| | 8 | % | Total loans and leases | $ | 5,264 | | $ | 5,350 | | | $ | 313,820 | | $ | 292,188 | | | $ | 319,084 | | $ | 297,538 | | | 7 | % |
Total earning assets (2) | Total earning assets (2) | 647,887 |
| 591,913 |
| | 258,659 |
| 239,870 |
| | 682,436 |
| 623,834 |
| | 9 |
| Total earning assets (2) | 794,370 | | 699,944 | | | 314,275 | | 292,641 | | | 838,792 | | 735,014 | | | 14 | |
Total assets (2) | Total assets (2) | 675,159 |
| 618,466 |
| | 270,196 |
| 251,609 |
| | 721,245 |
| 662,126 |
| | 9 |
| Total assets (2) | 829,505 | | 731,593 | | | 318,214 | | 302,862 | | | 877,866 | | 776,884 | | | 13 | |
| Total deposits | Total deposits | 642,783 |
| 586,334 |
| | 6,421 |
| 7,167 |
| | 649,204 |
| 593,501 |
| | 9 |
| Total deposits | 796,591 | | 699,280 | | | 6,411 | | 5,242 | | | 803,002 | | 704,522 | | | 14 | |
| Allocated capital | Allocated capital | 12,000 |
| 12,000 |
| | 25,000 |
| 22,000 |
| | 37,000 |
| 34,000 |
| | 9 |
| Allocated capital | 12,000 | | 12,000 | | | 26,500 | | 25,000 | | | 38,500 | | 37,000 | | | 4 | |
| | | | | | | | | | |
| | Period end | | September 30
2017 | December 31
2016 | | September 30
2017 | December 31
2016 | | September 30
2017 | December 31
2016 | | % Change |
| Period end | | September 30
2020 | December 31
2019 | | September 30
2020 | December 31
2019 | | September 30
2020 | December 31
2019 | | % Change |
| Total loans and leases | Total loans and leases | $ | 5,060 |
| $ | 4,938 |
| | $ | 267,300 |
| $ | 254,053 |
| | $ | 272,360 |
| $ | 258,991 |
| | 5 | % | Total loans and leases | $ | 4,909 | | $ | 5,467 | | | $ | 307,538 | | $ | 311,942 | | | $ | 312,447 | | $ | 317,409 | | | (2) | % |
Total earning assets (2) | Total earning assets (2) | 667,733 |
| 631,172 |
| | 268,354 |
| 255,511 |
| | 703,277 |
| 662,698 |
| | 6 |
| Total earning assets (2) | 859,659 | | 724,573 | | | 307,985 | | 312,684 | | | 906,994 | | 760,174 | | | 19 | |
Total assets (2) | Total assets (2) | 695,403 |
| 658,316 |
| | 279,920 |
| 268,002 |
| | 742,513 |
| 702,333 |
| | 6 |
| Total assets (2) | 897,182 | | 758,459 | | | 310,981 | | 322,717 | | | 947,513 | | 804,093 | | | 18 | |
| Total deposits | Total deposits | 662,781 |
| 625,727 |
| | 6,866 |
| 7,059 |
| | 669,647 |
| 632,786 |
| | 6 |
| Total deposits | 864,100 | | 725,665 | | | 7,922 | | 5,080 | | | 872,022 | | 730,745 | | | 19 | |
See page 1412 for footnotes.
Consumer Banking, which is comprised of Deposits and Consumer Lending, offers a diversified range of credit, banking and investment products and services to consumers and small businesses. Our customersFor more information about Consumer Banking, including our Deposits and clients have access to a coast to coast network including financial centersConsumer Lending businesses, see Business Segment Operations in 33 states and the DistrictMD&A of Columbia. Our network includes approximately 4,500 financial centers, 16,000 ATMs, nationwide call centers, and leading digital banking platforms with approximately 34 million active users, including approximately 24 million mobile active users.the Corporation’s 2019 Annual Report on Form 10-K.
Consumer Banking Results
Three Months Ended September 30, 2017 Compared to Three Months Ended September 30, 2016Three-Month Comparison
Net income for Consumer Banking increased $274 decreased $1.3 billion to $2.1 billion primarily due to lower revenue and higher noninterest expense, partially offset by lower provision for credit losses.
Net interest income decreased $1.1 billion to $5.9 billion primarily due to lower interest rates, partially offset by the benefit of higher deposit and loan balances. Noninterest income decreased $544 million to $2.1 billion primarily driven by higher net interest income, partially offset by higher provision for credit losses and noninterest expense. Net interest income increased $922 million to $6.2 billiona decline in service charges primarily due to the beneficial impact of an increase in investable assets as a result of higher deposits,deposit balances and loan growth. Noninterest income decreased $116 million to $2.6 billion primarily driven by lower mortgage banking income, partially offset by higher card income due to decreased client activity, as well as lower other income due to the allocation of asset and service charges.liability management (ALM) results.
The provision for credit losses increased $269decreased $438 million to $967
$479 million primarily driven by a release in reserves due to portfolio seasoningan improved macroeconomic outlook and loan growth in the U.S.lower credit card balances.
card portfolio. The three months ended September 30, 2017 included a net reserve increase of $167 million compared to a release of $12 million for the three months ended September 30, 2016.
Noninterest expense increased $88$443 million to $4.5$4.8 billion primarily driven by incremental expense to support customers and employees during COVID-19, as well as the cost of increased client activity and continued investments in digital capabilities andfor business growth, including increased primary sales professionals combined with investments in new financial centers and renovations, as well as higher litigation expense.the merchant services platform.
The return on average allocated capital was 22 percent, up from 21 percent, as higherdown from 36 percent, driven by lower net income, was partially offset byand to a lesser extent, an increased capital allocation.increase in allocated capital. For more information on capital allocations,allocated to the business segments, see Business Segment Operations on page 14.12.
Nine Months Ended September 30, 2017 Compared to Nine Months Ended September 30, 2016Nine-Month Comparison
Net income for Consumer Banking increased $757 million decreased $5.9 billion to $6.0$3.9 billion primarily driven by higher net interest income, partially offset bydue to lower revenue and a higher provision for credit losses.
Net interest income increased $2.1decreased $2.5 billion to $18.0 billion primarily due to the beneficial impact of an increase in investable assets as a result of higher deposits, as well as pricing discipline and loan growth. Noninterest income decreased $181 million to $7.6 billion driven by lower mortgage banking income, partially offset by higher service charges and card income.
The provision for credit losses increased $684 million to $2.6 billion due to portfolio seasoning and loan growth in the U.S. credit card portfolio. Noninterest expense decreased $44 million to $13.3 billion driven by improved operating efficiencies, largely offset by higher FDIC, personnel and litigation expenses.
The return on average allocated capital was 22 percent, up from 21 percent, as higher net income was partially offset by an increased capital allocation. For more information on capital allocations, see Business Segment Operations on page 14.
Deposits
Deposits includes the results of consumer deposit activities which consist of a comprehensive range of products provided to consumers and small businesses. Our deposit products include traditional savings accounts, money market savings accounts, CDs and IRAs, noninterest- and interest-bearing checking accounts, as well as investment accounts and products. Net interest income is allocated to the deposit products using our funds transfer pricing process that matches assets and liabilities with similar interest rate sensitivity and maturity characteristics. Deposits generates fees such as account service fees, non-sufficient funds fees, overdraft charges and ATM fees, as well as investment and brokerage fees from Merrill Edge accounts. Merrill Edge is an integrated investing and banking service targeted at customers with less than $250,000 in investable assets. Merrill Edge provides investment advice and guidance, client brokerage asset services, a self-directed online investing platform and key banking capabilities including access to the Corporation’s network of financial centers and ATMs.
Deposits includes the net impact of migrating customers and their related deposit and brokerage asset balances between Deposits and GWIM as well as other client-managed businesses. For more information on the migration of customer balances to or from GWIM, see GWIM – Net Migration Summary on page 20.
Three Months Ended September 30, 2017 Compared to Three Months Ended September 30, 2016
Net income for Deposits increased $369 million to $1.2 billion driven by higher revenue, partially offset by higher noninterest expense. Net interest income increased $810 million to $3.4 billion primarily due to the beneficial impact of an increase in investable assets as a result of higher deposits, and pricing discipline.
Noninterest expense increased $218 million to $2.6 billion primarily driven by investments in digital capabilities and business growth, including increased primary sales professionals, combined with investments in new financial centers and renovations, and higher litigation and FDIC expenses.
Average deposits increased $54.2 billion to $652.3 billion driven by strong organic growth. Growth in checking, money market savings and traditional savings of $57.4 billion was partially offset by a decline in time deposits of $3.4 billion.
Nine Months Ended September 30, 2017 Compared to Nine Months Ended September 30, 2016
Net income for Deposits increased $887 million to $3.4 billion. Net interest income increased $1.9 billion to $9.8$18.7 billion and noninterest income increased $95 milliondecreased $1.5 billion to $3.5 billion, both of which$6.3 billion. The declines were primarily driven by the same factors as described in the three-month discussion. The prior-year period included gains on certain divestitures.
The provision for credit losses increased $16 million$2.9 billion to $148 million.$5.8 billion primarily due to the weaker economic outlook related to COVID-19. Noninterest expense increased $475$893 million to $7.7$14.1 billion primarily driven by the same factors as described in the three-month discussion.
The return on average allocated capital was 14 percent, down from 36 percent, driven by lower net income and, to a lesser extent, an increase in allocated capital.
Deposits
Three-Month Comparison
Net income for Deposits decreased $1.2 billion to $880 million primarily driven by lower revenue. Net interest income declined $952 million to $3.2 billion primarily due to lower interest rates, partially offset by the benefit of growth in deposits. Noninterest income decreased $401 million to $918 million. The decline in noninterest income was primarily driven by lower service charges due to higher deposit balances and lower client activity related to the impact of COVID-19, as well as lower other income due to the allocation of ALM results.
The provision for credit losses decreased $25 million to $59 million. Noninterest expense increased $274 million to $2.9 billion driven by continued investments in the business and incremental expense to support customers and employees during the COVID-19 pandemic.
Average deposits increased $56.4$149.8 billion to $642.8$853.5 billion. The increase was driven by strong organic growth of $101.7 billion in checking and time deposits and $47.7 billion in traditional savings and money market savings.
Nine-Month Comparison
Net income for Deposits decreased $3.1 billion to $3.3 billion primarily driven by lower revenue. Net interest income declined $2.4 billion to $10.5 billion primarily due to the same factorfactors as described in the three-month discussion. Noninterest income decreased $1.0 billion to $2.8 billion primarily due to the same factors as described in the three-month discussion.
The provision for credit losses increased $155 million to $328 million due to the weaker economic outlook related to COVID-19. Noninterest expense increased $539 million to $8.5 billion due to the same factors as described in the three-month discussion.
Average deposits increased $97.3 billion to $796.6 billion. The increase was driven by strong organic growth of $71.5 billion in checking and time deposits and $25.7 billion in traditional savings and money market savings.
The following table provides key performance indicators for Deposits. Management uses these metrics, and we believe they are useful to investors because they provide additional information to evaluate our deposit profitability and digital/mobile trends.
| | | | | | | | | | | | | | | | | | | | | | | |
| | | | | | | |
| Key Statistics – Deposits | | | | | | | |
| | | | | | | |
| Three Months Ended September 30 | | Nine Months Ended September 30 |
| 2020 | | 2019 | | 2020 | | 2019 |
Total deposit spreads (excludes noninterest costs) (1) | 1.87 | % | | 2.35 | % | | 1.98 | % | | 2.38 | % |
| | | | | | | |
| Period End | | | | | | | |
Consumer investment assets (in millions) (2) | | | | | $ | 266,733 | | | $ | 223,199 | |
Active digital banking users (units in thousands) (3) | | | | | 39,267 | | | 37,981 | |
Active mobile banking users (units in thousands) (4) | | | | | 30,601 | | | 28,703 | |
| Financial centers | | | | | 4,309 | | | 4,302 | |
| ATMs | | | | | 16,962 | | | 16,626 | |
|
| | | | | | | | | | | | | |
| | | | | | | | |
Key Statistics – Deposits | | | | | | | |
| | Three Months Ended September 30 | | Nine Months Ended September 30 |
| | 2017 | | 2016 | | 2017 | | 2016 |
Total deposit spreads (excludes noninterest costs) (1) | 1.88 | % | | 1.64 | % | | 1.82 | % | | 1.65 | % |
| | | | | | | | |
| Period end | | | | | | | |
| Client brokerage assets (in millions) | | | | | $ | 167,274 |
| | $ | 137,985 |
|
Digital banking active users (units in thousands) (2) | | | | | 34,472 |
| | 32,814 |
|
| Mobile banking active users (units in thousands) | | | | | 23,572 |
| | 21,305 |
|
| Financial centers | | | | | 4,511 |
| | 4,629 |
|
| ATMs | | | | | 15,973 |
| | 15,959 |
|
| |
(1)
| Includes deposits held in Consumer Lending. |
| |
(2)
| Digital users represents mobile and/or online users across consumer businesses; historical information has been reclassified primarily due to the sale of the Corporation's non-U.S. consumer credit card business during the second quarter of 2017. |
Client(2)Includes client brokerage assets, deposit sweep balances and AUM in Consumer Banking.
(3)Active digital banking users represents mobile and/or online users over the last three months.
(4)Active mobile banking users represents mobile users over the last three months.
Consumer investment assets increased $29.3$43.5 billion driven by strong client flows and market performance. MobileActive mobile banking active users increased 2.31.9 million reflecting continuing changes in our customers’ banking preferences. The numberWe had a net increase of seven financial centers
declined 118 driven by changes in customer preferences to self-service options as we continuecontinued to optimize our consumer banking network and improve our cost-to-serve.network.
Consumer Lending
Three-Month Comparison
Net income for Consumer Lending offers productswas $1.2 billion, a decrease of $67 million primarily due to consumerslower revenue and small businesses across the U.S. The products offered include credit and debit cards, residential mortgages and home equity loans, and direct and indirect loans such as automotive, recreational
vehicle and consumer personal loans. In addition to earning net interest spread revenue on its lending activities, Consumer Lending generates interchange revenue from credit and debit card transactions, late fees, cash advance fees, annual credit card fees, mortgage banking fee income and other miscellaneous fees. Consumer Lending products are available to our customers through our retail network, direct telephone, and online and mobile channels. Consumer Lending results also include the impact of servicing residential mortgages and home equity loans in the core portfolio, including loans held on the balance sheet of Consumer Lending and loans serviced for others.
We classify consumer real estate loans as core or non-core based on loan and customer characteristics such as origination date, product type, loan-to-value (LTV), Fair Isaac Corporation (FICO) score and delinquency status. For more information on the core and non-core portfolios, see Consumer Portfolio Credit Risk Management on page 39. At September 30, 2017, total owned loans in the core portfolio held in Consumer Lending were $111.6 billion, an increase of $13.8 billion from September 30, 2016, primarily driven by higher residential mortgage balances,noninterest expense, partially offset by a decline in home equity balances.provision for credit losses. Net interest income decreased $189 million to $2.6 billion primarily due to lower interest rates, partially offset by loan growth. Noninterest income decreased $143 million to $1.2 billion primarily driven by lower card income due to lower client activity as well as lower other income due to the allocation of ALM results.
Consumer Lending includesThe provision for credit losses decreased $413 million to $420 million primarily driven by a release in reserves due to an improved macroeconomic outlook and lower credit card
balances. Noninterest expense increased $169 million to $1.9 billion primarily driven by investments in the net impact of migratingbusiness and incremental expense to support customers and their related loan balances between Consumer Lendingemployees during the COVID-19 pandemic.
Average loans increased $15.3 billion to $313.7 billion primarily driven by an increase in residential mortgages and GWIM. For more information on the migration of customer balances to or from GWIM, see GWIM – Net Migration Summary on page 20.PPP loans, partially offset by a decline in credit cards.
Three Months Ended September 30, 2017 Compared to Three Months Ended September 30, 2016Nine-Month Comparison
Net income for Consumer Lending decreased $95was $597 million, a decrease of $2.8 billion primarily due to $867 million driven by higher provision for credit losses and lower noninterest income, partially offset by lower noninterest expense and higher net interest income.losses. Net interest income increased $112declined $134 million to $2.8$8.3 billion primarily driven by the impact of an increase in loan balances. Noninterestand noninterest income decreased $125$498 million to $1.4$3.5 billion driven by lower mortgage banking income, partially offset by higher card income.
The provision for credit losses increased $265 million to $920 million due to portfolio seasoning and loan growth in the U.S. credit card portfolio. Noninterest expense decreased $130 million to $1.8 billion primarily driven by improved operating efficiencies.
Average loans increased $19.9 billion to $263.7 billion primarily driven by increases in residential mortgages, as well as U.S. credit card and consumer vehicle loans, partially offset by lower home equity loan balances.
Nine Months Ended September 30, 2017 Compared to Nine Months Ended September 30, 2016
Net income for Consumer Lending decreased $130 million to $2.6 billion driven by the same factors as described in the three-month discussion. Net interest income increased $264 million to $8.1 billion. Noninterest income decreased $276 million to $4.1 billion. Fluctuations were driven by the same factors as described in the three-month discussion.
The provision for credit losses increased $668$2.8 billion to $5.4 billion primarily due to the weaker economic outlook related to COVID-19. Noninterest expense increased $354 million to $2.5$5.5 billion due to portfolio seasoning and loan growth in the U.S. credit card portfolio. Noninterest expense decreased $519 million to $5.6 billion primarily driven by the same factor as described in the three-month discussion.
Average loans increased $19.4 billion to $257.8 billion driven by increases in residential mortgages as well as consumer vehicle and U.S credit card loans, partially offset by lower home equity loan balances.
|
| | | | | | | | | | | | | | | |
| | | | | | | | |
Key Statistics – Consumer Lending |
| | Three Months Ended September 30 | | Nine Months Ended September 30 |
| (Dollars in millions) | 2017 | | 2016 | | 2017 | | 2016 |
Total U.S. credit card (1) | | | | | | | |
| Gross interest yield | 9.76 | % | | 9.30 | % | | 9.62 | % | | 9.27 | % |
| Risk-adjusted margin | 8.63 |
| | 9.11 |
| | 8.64 |
| | 8.99 |
|
| New accounts (in thousands) | 1,315 |
| | 1,324 |
| | 3,801 |
| | 3,845 |
|
| Purchase volumes | $ | 62,244 |
| | $ | 57,591 |
| | $ | 179,230 |
| | $ | 165,412 |
|
| Debit card purchase volumes | $ | 74,769 |
| | $ | 71,049 |
| | $ | 220,729 |
| | $ | 212,316 |
|
| |
(1)
| In addition to the U.S. credit card portfolio in Consumer Banking, the remaining U.S. credit card portfolio is in GWIM.
|
During the three and nine months ended September 30, 2017, the total U.S. credit card risk-adjusted margin decreased 48 bps and 35 bps compared to the same periods in 2016, primarily driven by increased net charge-offs and higher credit card rewards costs.
Total U.S. credit card purchase volumes increased $4.7 billion to $62.2 billion, and $13.8 billion to $179.2 billion, and debit card purchase volumes increased $3.7 billion to $74.8 billion, and $8.4 billion to $220.7 billion, reflecting higher levels of consumer spending.
Mortgage Banking Income
Mortgage banking income in Consumer Banking includes production income and net servicing income. Production income is comprised primarily of revenue from the fair value gains and losses recognized on our interest rate lock commitments (IRLCs) and loans held-for-sale (LHFS), the related secondary market execution, and costs related to representations and warranties made in the sales transactions along with other obligations incurred in the sales of mortgage loans. Production income for the three and nine months ended September 30, 2017 decreased $148 million to $64 million, and $347 million to $185 million compared to the same periods in 2016 due to a decision to retain
a higher percentage of residential mortgage production in Consumer Banking, as well as the impact of a higher interest rate environment driving lower refinances.
Net servicing income within Consumer Banking includes income earned in connection with servicing activities and MSR valuation adjustments for the core portfolio, net of results from risk management activities used to hedge certain market risks of the MSRs. Net servicing income for the three and nine months ended September 30, 2017 decreased $7 million to $78 million, and $6 million to $216 million compared to the same periods in 2016.
Mortgage Servicing Rights
At September 30, 2017, the core MSR portfolio, held within Consumer Lending, was $1.7 billion compared to $1.8 billion at September 30, 2016. The decrease was primarily driven by the amortization of expected cash flows, which exceeded additions to the MSR portfolio, partially offset by changes in fair value from rising interest rates. For more information on MSRs, see Note 14 – Fair Value Measurements to the Consolidated Financial Statements.
|
| | | | | | | | | | | | | | | |
| | | | | | | | |
| Key Statistics | | | | | | | |
| | Three Months Ended September 30 | | Nine Months Ended September 30 |
| (Dollars in millions) | 2017 | | 2016 | | 2017 | | 2016 |
Loan production (1): | |
| | |
| | |
| | |
|
Total (2): | | | | | | | |
| First mortgage | $ | 13,183 |
| | $ | 16,865 |
| | $ | 37,876 |
| | $ | 45,802 |
|
| Home equity | 4,133 |
| | 3,541 |
| | 12,871 |
| | 11,649 |
|
| Consumer Banking: | | | | | | | |
| First mortgage | $ | 9,044 |
| | $ | 11,588 |
| | $ | 25,679 |
| | $ | 32,207 |
|
| Home equity | 3,722 |
| | 3,139 |
| | 11,604 |
| | 10,535 |
|
| |
(1)
| The loan production amounts represent the unpaid principal balance of loans and in the case of home equity, the principal amount of the total line of credit. |
| |
(2)
| In addition to loan production in Consumer Banking, there is also first mortgage and home equity loan production in GWIM.
|
First mortgage loan originations in Consumer Banking and for the total Corporation decreased $2.5 billion and $3.7 billion in the three months ended September 30, 2017 compared to the same period in 2016 primarily driven by a higher interest rate environment driving lower first-lien mortgage refinances. First mortgage loan originations in Consumer Banking and for the total Corporation decreased $6.5 billion and $7.9 billion in the nine months ended September 30, 2017 primarily driven by the same factor as described in the three-month discussion.
Home equity production in Consumer Banking and for the total Corporation increased $583 million and $592 million for the three months ended September 30, 2017 compared to the same period in 2016 due to a higher demand based on improving housing trends, and improved engagement with customers. Home equity production in Consumer Banking and for the total Corporation increased $1.1 billion and $1.2 billion for the nine months ended September 30, 2017 primarily driven by the same factors as described in the three-month discussion.
Average loans increased $21.6 billion to $313.8 billion primarily driven by the same factors as described in the three-month discussion.
Global Wealth & Investment Management |
| | | | | | | | | | | | | | | | | | | | | | |
| | | | | | | | | | | | | |
| | | Three Months Ended September 30 | | | | Nine Months Ended September 30 | | |
| (Dollars in millions) | 2017 | | 2016 | | % Change | | 2017 | | 2016 | | % Change |
|
| Net interest income (FTE basis) | $ | 1,496 |
| | $ | 1,394 |
| | 7 | % | | $ | 4,653 |
| | $ | 4,310 |
| | 8 | % |
| Noninterest income: | | | | | | | | | | | |
| Investment and brokerage services | 2,728 |
| | 2,585 |
| | 6 |
| | 8,073 |
| | 7,718 |
| | 5 |
|
| All other income | 396 |
| | 400 |
| | (1 | ) | | 1,181 |
| | 1,245 |
| | (5 | ) |
| Total noninterest income | 3,124 |
| | 2,985 |
| | 5 |
| | 9,254 |
| | 8,963 |
| | 3 |
|
| Total revenue, net of interest expense (FTE basis) | 4,620 |
| | 4,379 |
| | 6 |
| | 13,907 |
| | 13,273 |
| | 5 |
|
| | | | | | | | | | | | |
| Provision for credit losses | 16 |
| | 7 |
| | 129 |
| | 50 |
| | 46 |
| | 9 |
|
| Noninterest expense | 3,370 |
| | 3,255 |
| | 4 |
| | 10,091 |
| | 9,816 |
| | 3 |
|
| Income before income taxes (FTE basis) | 1,234 |
| | 1,117 |
| | 10 |
| | 3,766 |
| | 3,411 |
| | 10 |
|
| Income tax expense (FTE basis) | 465 |
| | 419 |
| | 11 |
| | 1,420 |
| | 1,270 |
| | 12 |
|
| Net income | $ | 769 |
| | $ | 698 |
| | 10 |
| | $ | 2,346 |
| | $ | 2,141 |
| | 10 |
|
| | | | | | | | | | | | |
| Net interest yield (FTE basis) | 2.29 | % | | 2.03 | % | | | | 2.32 | % | | 2.09 | % | | |
| Return on average allocated capital | 22 |
| | 21 |
| | | | 22 |
| | 22 |
| | |
| Efficiency ratio (FTE basis) | 72.95 |
| | 74.32 |
| | | | 72.56 |
| | 73.96 |
| | |
| | | | | | | | | | | | |
| Balance Sheet | | | | | | | | | | | | |
| | Three Months Ended September 30 | | | | Nine Months Ended September 30 | | |
| Average | 2017 | | 2016 | | % Change | | 2017 | | 2016 | | % Change |
|
| Total loans and leases | $ | 154,333 |
| | $ | 143,207 |
| | 8 | % | | $ | 151,205 |
| | $ | 141,169 |
| | 7 | % |
| Total earning assets | 259,564 |
| | 273,567 |
| | (5 | ) | | 267,732 |
| | 275,674 |
| | (3 | ) |
| Total assets | 275,570 |
| | 288,820 |
| | (5 | ) | | 283,324 |
| | 291,382 |
| | (3 | ) |
| Total deposits | 239,647 |
| | 253,812 |
| | (6 | ) | | 247,389 |
| | 256,356 |
| | (3 | ) |
| Allocated capital | 14,000 |
| | 13,000 |
| | 8 |
| | 14,000 |
| | 13,000 |
| | 8 |
|
| | | | | | | | | | | | |
| Period end | | | | | | | September 30
2017 | | December 31
2016 | | % Change |
|
| Total loans and leases | | | | | | | $ | 155,871 |
| | $ | 148,179 |
| | 5 | % |
| Total earning assets | | | | | | | 259,548 |
| | 283,151 |
| | (8 | ) |
| Total assets | | | | | | | 276,187 |
| | 298,931 |
| | (8 | ) |
| Total deposits | | | | | | | 237,771 |
| | 262,530 |
| | (9 | ) |
The following table provides key performance indicators for Consumer Lending. Management uses these metrics, and we believe they are useful to investors because they provide additional information about loan growth and profitability.
| | | | | | | | | | | | | | | | | | | | | | | |
| | | | | | | |
| Key Statistics – Consumer Lending | | | | | | | |
| | | | | | | |
| Three Months Ended September 30 | | Nine Months Ended September 30 |
| (Dollars in millions) | 2020 | | 2019 | | 2020 | | 2019 |
Total credit card (1) | | | | | | | |
Gross interest yield (2) | 10.16 | % | | 10.85 | % | | 10.21 | % | | 10.80 | % |
Risk-adjusted margin (3) | 9.66 | | | 8.45 | | | 8.66 | | | 8.14 | |
| New accounts (in thousands) | 487 | | | 1,172 | | | 1,991 | | | 3,274 | |
| Purchase volumes | $ | 64,060 | | | $ | 71,096 | | | $ | 182,133 | | | $ | 204,135 | |
| Debit card purchase volumes | $ | 102,004 | | | $ | 90,942 | | | $ | 280,222 | | | $ | 267,204 | |
(1)Includes GWIM's credit card portfolio.
(2)Calculated as the effective annual percentage rate divided by average loans.
(3)Calculated as the difference between total revenue, net of interest expense, and net credit losses divided by average loans.
During the three and nine months ended September 30, 2020, total risk-adjusted margin increased 121 bps and 52 bps compared to the same periods in 2019 primarily due to a decrease in the proportion of customers who pay their balances in full each month. During the three and nine months ended September 30, 2020, total credit card purchase volumes declined $7.0 billion to $64.1 billion, and $22.0 billion to $182.1 billion compared to the same periods in 2019. The declines in credit card purchase volumes were driven by the
impact of COVID-19. While overall spending improved during the third quarter of 2020, spending for travel and entertainment remained lower compared to the same periods a year ago. During the three and nine months ended September 30, 2020, debit card purchase volumes increased $11.1 billion to $102.0 billion and $13.0 billion to $280.2 billion compared to the same periods in 2019. Debit card purchase volumes improved late in the second quarter of 2020 and continued throughout the third quarter of 2020 as businesses reopened.
| | | | | | | | | | | | | | | | | | | | | | | |
| | | | | | | |
Key Statistics – Residential Mortgage Loan Production (1) |
| | | | | | | |
| Three Months Ended September 30 | | Nine Months Ended September 30 |
| (Dollars in millions) | 2020 | | 2019 | | 2020 | | 2019 |
| Consumer Banking: | | | | | | | |
| First mortgage | $ | 7,298 | | | $ | 13,622 | | | $ | 35,228 | | | $ | 34,534 | |
| Home equity | 738 | | | 2,219 | | | 6,555 | | | 7,109 | |
Total (2): | | | | | | | |
| First mortgage | $ | 13,360 | | | $ | 20,664 | | | $ | 55,422 | | | $ | 50,353 | |
| Home equity | 984 | | | 2,539 | | | 7,691 | | | 8,132 | |
(1)The loan production amounts represent the unpaid principal balance of loans and, in the case of home equity, the principal amount of the total line of credit.
(2)In addition to loan production in Consumer Banking, there is also first mortgage and home equity loan production in GWIM.
First mortgage loan originations in Consumer Banking and for the total Corporation decreased $6.3 billion and $7.3 billion for the three months ended September 30, 2020 compared to the same period in 2019 due to a decline in applications. First mortgage loan originations in Consumer Banking and for the total Corporation increased $694 million and $5.1 billion for the nine months ended September 30, 2020 compared to the same period in 2019 primarily driven by an increase in applications
during the first quarter of 2020 due to a lower interest rate environment.
Home equity production in Consumer Banking and for the total Corporation decreased $1.5 billion and $1.6 billion for the three months ended September 30, 2020 and $554 million and $441 million for the nine months ended September 30, 2020 primarily driven by a decline in applications.
Bank of America18
Global Wealth & Investment Management
| | | | | | | | | | | | | | | | | | | | | | | | | | | | | | | | | | | | | | |
| | | | | | | | | | | | |
| | Three Months Ended September 30 | | | | Nine Months Ended September 30 | | |
| (Dollars in millions) | 2020 | | 2019 | | % Change | | 2020 | | 2019 | | % Change |
| Net interest income | $ | 1,237 | | | $ | 1,609 | | | (23 | %) | | $ | 4,186 | | | $ | 4,917 | | | (15) | % |
| Noninterest income: | | | | | | | | | | | |
| Investment and brokerage services | 3,105 | | | 3,001 | | | 3 | | | 9,081 | | | 8,805 | | | 3 | |
| All other income | 204 | | | 294 | | | (31) | | | 640 | | | 903 | | | (29) | |
| Total noninterest income | 3,309 | | | 3,295 | | | — | | | 9,721 | | | 9,708 | | | — | |
| Total revenue, net of interest expense | 4,546 | | | 4,904 | | | (7) | | | 13,907 | | | 14,625 | | | (5) | |
| | | | | | | | | | | |
| Provision for credit losses | 24 | | | 37 | | | (35) | | | 349 | | | 63 | | | n/m |
| Noninterest expense | 3,530 | | | 3,414 | | | 3 | | | 10,593 | | | 10,302 | | | 3 | |
| Income before income taxes | 992 | | | 1,453 | | | (32) | | | 2,965 | | | 4,260 | | | (30) | |
| Income tax expense | 243 | | | 356 | | | (32) | | | 726 | | | 1,044 | | | (30) | |
| Net income | $ | 749 | | | $ | 1,097 | | | (32) | | | $ | 2,239 | | | $ | 3,216 | | | (30) | |
| | | | | | | | | | | |
| Effective tax rate | 24.5 | % | | 24.5 | % | | | | 24.5 | % | | 24.5 | % | | |
| | | | | | | | | | | |
| Net interest yield | 1.53 | | | 2.30 | | | | | 1.81 | | | 2.35 | | | |
| Return on average allocated capital | 20 | | | 30 | | | | | 20 | | | 30 | | | |
| | | | | | | | | | | |
| Efficiency ratio | 77.63 | | | 69.61 | | | | | 76.17 | | | 70.44 | | | |
| | | | | | | | | | | |
| Balance Sheet | | | | | | | | | | | | |
| | | | | | | |
| | Three Months Ended September 30 | | | | Nine Months Ended September 30 | | |
| Average | 2020 | | 2019 | | % Change | | 2020 | | 2019 | | % Change |
| Total loans and leases | $ | 185,587 | | | $ | 170,414 | | | 9 | % | | $ | 182,138 | | | $ | 167,069 | | | 9 | % |
| Total earning assets | 321,410 | | | 277,343 | | | 16 | | | 309,240 | | | 279,784 | | | 11 | |
| Total assets | 333,794 | | | 289,460 | | | 15 | | | 321,565 | | | 292,114 | | | 10 | |
| Total deposits | 291,845 | | | 254,460 | | | 15 | | | 280,828 | | | 256,720 | | | 9 | |
| Allocated capital | 15,000 | | | 14,500 | | | 3 | | | 15,000 | | | 14,500 | | | 3 | |
| | | | | | | | | | | |
| Period end | | | | | | | September 30
2020 | | December 31
2019 | | % Change |
| Total loans and leases | | | | | | | $ | 187,211 | | | $ | 176,600 | | | 6 | % |
| Total earning assets | | | | | | | 324,889 | | | 287,201 | | | 13 | |
| Total assets | | | | | | | 337,576 | | | 299,770 | | | 13 | |
| Total deposits | | | | | | | 295,893 | | | 263,113 | | | 12 | |
n/m = not meaningful
GWIM consists of two primary businesses: Merrill Lynch Global Wealth Management (MLGWM) andU.S. Trust, Bank of America Private Wealth Management (U.S. Trust).Bank. For more information about GWIM, see Business Segment Operations in the MD&A of the Corporation’s 2019 Annual Report on Form 10-K.
MLGWM’s advisory business provides a high-touch client experience through a network of financial advisors focused on clients with over $250,000 in total investable assets. MLGWM provides tailored solutions to meet our clients’ needs through a full set of investment management, brokerage, banking and retirement products.Three-Month Comparison
U.S. Trust, together with MLGWM’s Private Banking & Investments Group, provides comprehensive wealth management solutions targeted to high net worth and ultra high net worth clients, as well as customized solutions to meet clients’ wealth structuring, investment management, trust and banking needs, including specialty asset management services.
Three Months Ended September 30, 2017 Compared to Three Months Ended September 30, 2016
Net income for GWIM increased $71 decreased $348 million to $769$749 million primarily due to lower revenue and higher revenue, partially offset by an increase in revenue-relatednoninterest expense. The operating margin was 2722 percent compared to 2630 percent a year ago.
Net interest income increased $102decreased $372 million to $1.5$1.2 billion drivendue to the impact of lower interest rates, partially offset by higher short-term interest rates. the benefit of strong deposit and loan growth.
Noninterest income, which primarily includes investment and brokerage services income, increased $139 million to $3.1 billion. This increase was driven byremained relatively unchanged at $3.3 billion, as the impactbenefits of AUM flows and higher market valuations partiallyand positive AUM flows were offset by declines in AUM pricing as well as lower other income due to the impactallocation of changing market dynamics on transactional revenue and AUM pricing.ALM results.
The provision for credit losses decreased $13 million to $24 million. Noninterest expense increased $115$116 million to $3.4$3.5 billion primarily driven by higher revenue-related expense.
The return on average allocated capital was 22 percent, up from 21 percent, as higher net income was partially offset by an increased capital allocation.
MLGWM revenue of $3.8 billion increased five percent due to higher net interest incomeincentives and asset management fees driven by higher market valuations and AUM flows, partially offset by lower transactional revenue. U.S. Trust revenue of $822 million increased eight percent reflecting higher net interest income and asset management fees driven by higher market valuations and AUM flows.
Nine Months Ended September 30, 2017 Compared to Nine Months Ended September 30, 2016
Net income for GWIM increased$205 million to $2.3 billion due to higher revenue, partially offset by an increaseinvestments in noninterest expense. The operating margin was 27 percent compared to 26 percent a year ago.
Net interest income increased $343 million to $4.7 billion. Noninterest income, which primarily includes investment and brokerage services income, increased $291 million to $9.3 billion. Noninterest expense increased $275 million to $10.1 billion. Theseincreases were driven by the same factors as described in the three-month discussion.primary sales professionals.
The return on average allocated capital was 2220 percent, for both periods.down from 30 percent, due to lower net income and, to a lesser extent, a small increase in allocated capital.
Revenue
Average loans increased $15.2 billion to $185.6 billion primarily driven by residential mortgage and custom lending. Average deposits increased $37.4 billion to $291.8 billion primarily driven by inflows resulting from MLGWM of $11.5 billion increased five percent,client responses to market volatility and U.S. Trustlower spending.
MLGWM revenue of $2.5$3.7 billion increased seven percent. These increases weredecreased eight percent primarily driven by the impact of lower interest rates, partially offset by the benefits of higher market valuations and positive AUM flows.
Bank of America Private Bank revenue of $798 million decreased six percent primarily driven by the impact of lower interest rates.
Nine-Month Comparison
Net income for GWIM decreased $977 million to $2.2 billion primarily due to lower revenue, higher noninterest expense and higher provision for credit losses. The operating margin was 21 percent compared to 29 percent a year ago.
Net interest income decreased $731 million to $4.2 billion due to the same factors as described in the three-month discussion.
Noninterest income, which primarily includes investment and brokerage services income, remained relatively unchanged at $9.7 billion due to the same factors as described in the three-month discussion.
|
| | | | | | | | | | | | | | | | |
| | | | | | | | | |
| Key Indicators and Metrics | | | | | | | | |
| | | Three Months Ended September 30 | | Nine Months Ended September 30 |
| (Dollars in millions, except as noted) | | 2017 | | 2016 | | 2017 | | 2016 |
| Revenue by Business | | | | | | | | |
| Merrill Lynch Global Wealth Management | | $ | 3,796 |
| | $ | 3,617 |
| | $ | 11,452 |
| | $ | 10,886 |
|
| U.S. Trust | | 822 |
| | 761 |
| | 2,450 |
| | 2,300 |
|
Other (1) | | 2 |
| | 1 |
| | 5 |
| | 87 |
|
| Total revenue, net of interest expense (FTE basis) | | $ | 4,620 |
| | $ | 4,379 |
| | $ | 13,907 |
| | $ | 13,273 |
|
| | | | | | | | | |
| Client Balances by Business, at period end | | | | | | | | |
| Merrill Lynch Global Wealth Management | | | | | | $ | 2,245,499 |
| | $ | 2,089,683 |
|
| U.S. Trust | | | | | | 430,684 |
| | 400,538 |
|
| Total client balances | | | | | | $ | 2,676,183 |
| | $ | 2,490,221 |
|
| | | | | | | | | |
| Client Balances by Type, at period end | | | | | | | | |
| Assets under management | | | | | | $ | 1,036,048 |
| | $ | 871,026 |
|
| Brokerage assets | | | | | | 1,112,178 |
| | 1,095,635 |
|
| Assets in custody | | | | | | 131,680 |
| | 122,804 |
|
| Deposits | | | | | | 237,771 |
| | 252,962 |
|
Loans and leases (2) | | | | | | 158,506 |
| | 147,794 |
|
| Total client balances | | | | | | $ | 2,676,183 |
| | $ | 2,490,221 |
|
| | | | | | | | | |
| Assets Under Management Rollforward | | | | | | | | |
| Assets under management, beginning of period | | $ | 990,709 |
| | $ | 832,394 |
| | $ | 886,148 |
| | $ | 900,863 |
|
Net client flows (3) | | 20,749 |
| | 10,182 |
| | 77,479 |
| | 11,648 |
|
Market valuation/other (1) | | 24,590 |
| | 28,450 |
| | 72,421 |
| | (41,485 | ) |
| Total assets under management, end of period | | $ | 1,036,048 |
| | $ | 871,026 |
| | $ | 1,036,048 |
| | $ | 871,026 |
|
| | | | | | | | | |
Associates, at period end (4, 5) | | | | | | | | |
| Number of financial advisors | | | | | | 17,221 |
| | 16,834 |
|
| Total wealth advisors, including financial advisors | | | | | | 19,108 |
| | 18,714 |
|
| Total primary sales professionals, including financial advisors and wealth advisors | | | | | | 20,115 |
| | 19,594 |
|
| | | | | | | | | |
Merrill Lynch Global Wealth Management Metric (5) | | | | | | | | |
Financial advisor productivity (6) (in thousands) | | $ | 994 |
| | $ | 979 |
| | $ | 1,009 |
| | $ | 978 |
|
| | | | | | | | | |
U.S. Trust Metric, at period end (5) | | | | | | | | |
| Primary sales professionals | | | | | | 1,696 |
| | 1,684 |
|
| | | | | | | | |
(1)
| Includes the results of BofA Global Capital Management, the cash management division of | Bank of America and certain administrative items. Also reflects the sale to a third party of approximately $80 billion of BofA Global Capital Management's AUM in the second quarter of 2016. |
| |
(2)
| Includes margin receivables which are classified in customer and other receivables on the Consolidated Balance Sheet. |
| |
(3)
| For the nine months ended September 30, 2016, net client flows included $8.0 billion of net outflows related to BofA Global Capital Management's AUM that were sold during the second quarter of 2016. |
| |
(4)
| Includes financial advisors in the Consumer Banking segment of 2,267 and 2,171 at September 30, 2017 and 2016.16
|
| |
(5)
| Associate computation is based on headcount. |
| |
(6)
| Financial advisor productivity is defined as annualized MLGWM total revenue, excluding the allocation of certain asset and liability management (ALM) activities, divided by the total average number of financial advisors (excluding financial advisors in the Consumer Banking segment).
|
Client BalancesThe provision for credit losses increased $286 million to $349 million primarily due to the weaker economic outlook related to COVID-19. Noninterest expense increased $291 million to $10.6 billion, primarily due to investments for business growth along with higher revenue-related incentives.
Client balances managed under advisory and/or discretionThe return on average allocated capital was 20 percent, down from 30 percent, due to lower net income and, to a lesser extent, a small increase in allocated capital.
Average loans increased $15.1 billion to $182.1 billion, and
average deposits increased $24.1 billion to $280.8 billion due to the same factors as described in the three-month discussion.
MLGWM revenue of GWIM are AUM and are typically held in diversified portfolios. Fees earned on AUM are calculated as a percentage of clients' AUM balances. The asset management fees charged to clients per year depend on various factors, but are commonly$11.4 billion decreased five percent primarily driven by the breadthimpact of lower interest rates and AUM pricing, partially offset by higher market valuations and positive AUM flows.
Bank of America Private Bank revenue of $2.5 billion decreased four percent primarily driven by the client’s relationship and generally range from 50 to 150 bps on their total AUM. The net client AUM flows represent the net changeimpact of lower interest rates.
| | | | | | | | | | | | | | | | | | | | | | | |
| | | | | | | |
| Key Indicators and Metrics | | | | | | | |
| | | | | | | |
| Three Months Ended September 30 | | Nine Months Ended September 30 |
| (Dollars in millions, except as noted) | 2020 | | 2019 | | 2020 | | 2019 |
| Revenue by Business | | | | | | | |
| Merrill Lynch Global Wealth Management | $ | 3,748 | | | $ | 4,053 | | | $ | 11,446 | | | $ | 12,065 | |
| Bank of America Private Bank | 798 | | | 851 | | | 2,461 | | | 2,559 | |
| | | | | | | |
| Total revenue, net of interest expense | $ | 4,546 | | | $ | 4,904 | | | $ | 13,907 | | | $ | 14,624 | |
| | | | | | | |
| Client Balances by Business, at period end | | | | | | | |
| Merrill Lynch Global Wealth Management | | | | | $ | 2,570,252 | | | $ | 2,443,614 | |
| Bank of America Private Bank | | | | | 496,369 | | | 462,347 | |
| | | | | | | |
| Total client balances | | | | | $ | 3,066,621 | | | $ | 2,905,961 | |
| | | | | | | |
| Client Balances by Type, at period end | | | | | | | |
| | | | | | | |
| | | | | | | |
| Assets under management | | | | | $ | 1,286,145 | | | $ | 1,212,120 | |
| Brokerage and other assets | | | | | 1,344,538 | | | 1,305,926 | |
| | | | | | | |
| Deposits | | | | | 295,893 | | | 252,466 | |
Loans and leases (1) | | | | | 189,952 | | | 175,579 | |
| Less: Managed deposits in assets under management | | | | | (49,907) | | | (40,130) | |
| Total client balances | | | | | $ | 3,066,621 | | | $ | 2,905,961 | |
| | | | | | | |
| Assets Under Management Rollforward | | | | | | | |
| Assets under management, beginning of period | $ | 1,219,748 | | | $ | 1,203,783 | | | $ | 1,275,555 | | | $ | 1,072,234 | |
| | | | | | | |
| | | | | | | |
| Net client flows | 1,385 | | | 5,529 | | | 11,993 | | | 16,721 | |
Market valuation/other | 65,012 | | | 2,808 | | | (1,403) | | | 123,165 | |
| Total assets under management, end of period | $ | 1,286,145 | | | $ | 1,212,120 | | | $ | 1,286,145 | | | $ | 1,212,120 | |
| | | | | | | |
| Associates, at period end | | | | | | | |
| Number of financial advisors | | | | | 17,760 | | | 17,657 | |
| Total wealth advisors, including financial advisors | | | | | 19,673 | | | 19,672 | |
| Total primary sales professionals, including financial advisors and wealth advisors | | | | | 21,271 | | | 20,775 | |
| | | | | | | |
| Merrill Lynch Global Wealth Management Metric | | | | | | | |
Financial advisor productivity (2) (in thousands) | $ | 1,125 | | | $ | 1,096 | | | $ | 1,111 | | | $ | 1,073 | |
| | | | | | | |
| Bank of America Private Bank Metric, at period end | | | | | | | |
| Primary sales professionals | | | | | 1,770 | | | 1,811 | |
(1)Includes margin receivables which are classified in clients’ AUM balances over a specified period of time, excluding market appreciation/depreciationcustomer and other adjustments.
receivables on the Consolidated Balance Sheet.(2)For a definition, see Key Metrics on page 104.
Client Balances
Client balances increased $186.0$160.7 billion, or sevensix percent, to nearly $2.7$3.1 trillion at September 30, 20172020 compared to September 30, 2016.2019. The increase in client balances was primarily due to AUM which increased $165.0 billion, or 19 percent, due to positive net flows and higher market valuations.
Net Migration Summary
GWIM results are impacted by the net migration of clientsvaluations and their corresponding deposit, loan and brokerage balances primarily to or from Consumer Banking, as presented in the table below. Migrations result from the movement of clients between business segments to better align withpositive client needs.
|
| | | | | | | | | | | | | | | |
| | | | | | | | |
Net Migration Summary (1) | | | | | | | |
| | Three Months Ended September 30 | | Nine Months Ended September 30 |
| (Dollars in millions) | 2017 | | 2016 | | 2017 | | 2016 |
Total deposits, net – to (from) GWIM | $ | 34 |
| | $ | 17 |
| | $ | (250 | ) | | $ | (1,040 | ) |
Total loans, net – (from) GWIM | (15 | ) | | (15 | ) | | (145 | ) | | — |
|
Total brokerage, net – (from) GWIM | (199 | ) | | (264 | ) | | (175 | ) | | (830 | ) |
| | | | | | | | |
(1)17Bank of America
| Migration occurs primarily between GWIM and Consumer Banking.
| |
Bank of America20
Global Banking
| | | | | | | | | | | | | | | | | | | | | | | | | | | | | | | | | | | | | | |
| | | | | | | | | | | | |
| Three Months Ended September 30 | | | | Nine Months Ended September 30 | | |
| (Dollars in millions) | 2020 | | 2019 | | % Change | | 2020 | | 2019 | | % Change |
| Net interest income | $ | 2,028 | | | $ | 2,617 | | | (23 | %) | | $ | 7,003 | | | $ | 8,116 | | | (14) | % |
| Noninterest income: | | | | | | | | | | | |
| Service charges | 845 | | | 763 | | | 11 | | | 2,379 | | | 2,225 | | | 7 | |
| Investment banking fees | 970 | | | 902 | | | 8 | | | 2,912 | | | 2,328 | | | 25 | |
| All other income | 674 | | | 930 | | | (28) | | | 1,914 | | | 2,673 | | | (28) | |
| Total noninterest income | 2,489 | | | 2,595 | | | (4) | | | 7,205 | | | 7,226 | | | — |
| Total revenue, net of interest expense | 4,517 | | | 5,212 | | | (13) | | | 14,208 | | | 15,342 | | | (7) | |
| | | | | | | | | | | |
| Provision for credit losses | 883 | | | 120 | | | n/m | | 4,849 | | | 356 | | | n/m |
| Noninterest expense | 2,365 | | | 2,219 | | | 7 | | | 6,910 | | | 6,697 | | | 3 | |
| Income before income taxes | 1,269 | | | 2,873 | | | (56) | | | 2,449 | | | 8,289 | | | (70) | |
| Income tax expense | 343 | | | 776 | | | (56) | | | 661 | | | 2,238 | | | (70) | |
| Net income | $ | 926 | | | $ | 2,097 | | | (56) | | | $ | 1,788 | | | $ | 6,051 | | | (70) | |
| | | | | | | | | | | |
| Effective tax rate | 27.0 | % | | 27.0 | % | | | | 27.0 | % | | 27.0 | % | | |
| | | | | | | | | | | |
| Net interest yield | 1.61 | | | 2.69 | | | | | 1.96 | | | 2.84 | | | |
| Return on average allocated capital | 9 | | | 20 | | | | | 6 | | | 20 | | | |
| Efficiency ratio | 52.36 | | | 42.58 | | | | | 48.63 | | | 43.65 | | | |
| | | | | | | | | | | |
| Balance Sheet | | | | | | | | | | | | |
| Three Months Ended September 30 | | | | Nine Months Ended September 30 | | |
| Average | 2020 | | 2019 | | % Change | | 2020 | | 2019 | | % Change |
| | | | | | | | | | | |
| | | | | | | | | | | |
Total loans and leases | $ | 373,118 | | | $ | 377,109 | | | (1 | %) | | $ | 394,331 | | | $ | 373,275 | | | 6 | % |
| Total earning assets | 501,572 | | | 385,999 | | | 30 | | | 477,606 | | | 382,711 | | | 25 | |
| Total assets | 557,889 | | | 441,186 | | | 26 | | | 534,061 | | | 437,570 | | | 22 | |
| Total deposits | 471,288 | | | 360,457 | | | 31 | | | 449,273 | | | 357,413 | | | 26 | |
| Allocated capital | 42,500 | | | 41,000 | | | 4 | | | 42,500 | | | 41,000 | | | 4 | |
| | | | | | | | | | | |
| Period end | | | | | | | September 30
2020 | | December 31
2019 | | % Change |
| | | | | | | | | | | |
| | | | | | | | | | | |
| Total loans and leases | | | | | | | $ | 356,919 | | | $ | 379,268 | | | (6) | % |
| Total earning assets | | | | | | | 496,825 | | | 407,180 | | | 22 | |
| Total assets | | | | | | | 553,776 | | | 464,032 | | | 19 | |
| Total deposits | | | | | | | 465,399 | | | 383,180 | | | 21 | |
|
| | | | | | | | | | | | | | | | | | | | | | |
| | | | | | | | | | | | | |
| | | Three Months Ended September 30 | | | | Nine Months Ended September 30 | | |
| (Dollars in millions) | 2017 | | 2016 | | % Change | | 2017 | | 2016 | | % Change |
| Net interest income (FTE basis) | $ | 2,743 |
| | $ | 2,470 |
| | 11 | % | | $ | 8,229 |
| | $ | 7,440 |
| | 11 | % |
| Noninterest income: | | | | | | | | | | | |
| Service charges | 777 |
| | 780 |
| | <(1) |
| | 2,351 |
| | 2,284 |
| | 3 |
|
| Investment banking fees | 807 |
| | 796 |
| | 1 |
| | 2,661 |
| | 2,230 |
| | 19 |
|
| All other income | 659 |
| | 700 |
| | (6 | ) | | 1,739 |
| | 1,942 |
| | (10 | ) |
| Total noninterest income | 2,243 |
| | 2,276 |
| | (1 | ) | | 6,751 |
| | 6,456 |
| | 5 |
|
| Total revenue, net of interest expense (FTE basis) | 4,986 |
| | 4,746 |
| | 5 |
| | 14,980 |
| | 13,896 |
| | 8 |
|
| | | | | | | | | | | | |
| Provision for credit losses | 48 |
| | 118 |
| | (59 | ) | | 80 |
| | 870 |
| | (91 | ) |
| Noninterest expense | 2,118 |
| | 2,152 |
| | (2 | ) | | 6,435 |
| | 6,450 |
| | <(1) |
|
| Income before income taxes (FTE basis) | 2,820 |
| | 2,476 |
| | 14 |
| | 8,465 |
| | 6,576 |
| | 29 |
|
| Income tax expense (FTE basis) | 1,062 |
| | 925 |
| | 15 |
| | 3,192 |
| | 2,435 |
| | 31 |
|
| Net income | $ | 1,758 |
| | $ | 1,551 |
| | 13 |
| | $ | 5,273 |
| | $ | 4,141 |
| | 27 |
|
| | | | | | | | | | | | |
| Net interest yield (FTE basis) | 2.99 | % | | 2.83 | % | | | | 3.02 | % | | 2.88 | % | | |
| Return on average allocated capital | 17 |
| | 17 |
| | | | 18 |
| | 15 |
| | |
| Efficiency ratio (FTE basis) | 42.52 |
| | 45.34 |
| | | | 42.97 |
| | 46.42 |
| | |
| | | | | | | | | | | | |
| Balance Sheet | | | | | | | | | | | | |
| | Three Months Ended September 30 | | | | Nine Months Ended September 30 | | |
| Average | 2017 | | 2016 | | % Change | | 2017 | | 2016 | | % Change |
| Total loans and leases | $ | 346,093 |
| | $ | 334,363 |
| | 4 | % | | $ | 344,683 |
| | $ | 332,474 |
| | 4 | % |
| Total earning assets | 363,560 |
| | 347,462 |
| | 5 |
| | 364,385 |
| | 345,406 |
| | 5 |
|
| Total assets | 414,755 |
| | 395,479 |
| | 5 |
| | 414,867 |
| | 394,425 |
| | 5 |
|
| Total deposits | 315,692 |
| | 307,288 |
| | 3 |
| | 307,163 |
| | 301,175 |
| | 2 |
|
| Allocated capital | 40,000 |
| | 37,000 |
| | 8 |
| | 40,000 |
| | 37,000 |
| | 8 |
|
| | | | | | | | | | | | |
| Period end | | | | | | | September 30
2017 | | December 31
2016 | | % Change |
| Total loans and leases | | | | | | | $ | 349,838 |
| | $ | 339,271 |
| | 3 | % |
| Total earning assets | | | | | | | 371,159 |
| | 356,241 |
| | 4 |
|
| Total assets | | | | | | | 423,185 |
| | 408,330 |
| | 4 |
|
| Total deposits | | | | | | | 319,545 |
| | 307,630 |
| | 4 |
|
Global Banking, which includes Global Corporate Banking, Global Commercial Banking, Business Banking and Global Investment Banking, provides a wide range of lending-related products and services, integrated working capital management and treasury solutions, and underwriting and advisory services through our network of offices and client relationship teams. Our lending products and services include commercial loans, leases, commitment facilities, trade finance, commercial real estate lending and asset-based lending. Our treasury solutions business includes treasury management, foreign exchange and short-term investing options. We also provide investment banking products to our clients such as debt and equity underwriting and distribution, and merger-related and other advisory services. Underwriting debt and equity issuances, fixed-income and equity research, and certain market-based activities are executed through our global broker-dealer affiliates, which are our primary dealers in several countries. Within For more information about Global Banking, Global Commercial Banking clients generally include middle-market companies, commercial real estate firms and not-for-profit companies. Global Corporate Banking clients generally include large global corporations, financial institutions and leasing clients.see Business Banking clients include mid-sized U.S.-based businesses requiring customized and integrated financial advice and solutions.
Segment Operations in the MD&A of the Corporation’s 2019 Annual Report on Form 10-K.Three-Month Comparison
Three Months Ended September 30, 2017 Compared to Three Months Ended September 30, 2016
Net income for Global Banking increased $207 decreased $1.2 billion to $926 million primarily driven by higher provision for credit losses and lower revenue.
Revenue decreased $695 million to $1.8$4.5 billion driven by higher revenuelower net interest income and lower provision for credit losses.
Revenue increased $240 million to $5.0 billion driven by higher net interestnoninterest income. Net interest income increased $273decreased $589 million to $2.7$2.0 billion primarily driven by the impact of higher short-termdue to lower interest rates, as well as loan and deposit growth, partially offset by modest loan spread compression. deposit growth and higher credit spreads.
Noninterest income decreased $33$106 million to $2.2$2.5 billion largelyprimarily due to lower leasing-related revenue and the impactallocation of loans and loan-related hedging activity in the fair value option portfolio,ALM results, partially offset by higher leasing-related revenue.investment banking fees and service charges.
The provision for credit losses decreased $70increased $763 million to $48$883 million drivenprimarily due to a reserve build for industries that are more heavily impacted by reductions in energy exposures.COVID-19, such as travel and entertainment. Noninterest expense decreased $34increased $146 million to $2.1$2.4 billion driven by lower revenue-related incentives, partially offset bydue to continued investments in technology and relationship bankers.the business, including the merchant services platform.
The return on average allocated capital remained relatively unchanged at 17was nine percent as higherin 2020 compared to 20 percent in 2019, due to lower net income, offset the impact of $3.0 billionand to a lesser extent, an increase in additional allocated capital. For more information on capital allocated to the business segments, see Business Segment Operations on page 14.
Nine-Month Comparison
Nine Months Ended September 30, 2017 Compared to Nine Months Ended September 30, 2016
Net income for Global Banking increased decreased $4.3 billion to $1.8 billion primarily driven by higher provision for credit losses as well as lower revenue.
Revenue decreased $1.1 billion to $5.3$14.2 billion driven by higher revenue and lower provision for credit losses.
Revenue increased $1.1 billion to $15.0 billion driven by higher net interest income and noninterest income. Net interest income increased $789 milliondecreased $1.1 billion to $8.2$7.0 billion primarily driven by loan-related growth, an increased deposit base drivenlower interest rates, partially offset by higher short-term ratesloan and deposit balances.
Noninterest income of $7.2 billion remained relatively unchanged as lower valuation adjustments on the impact offair value option loan portfolio and the allocation of ALM activities, partiallyresults were largely offset by margin compression. Noninterest income increased $295 million to $6.8 billion largely due to higher investment banking fees.
The provision for credit losses decreased$790 millionincreased $4.5 billion to $80$4.8 billion primarily due to the weaker economic outlook related to COVID-19. Noninterest expense increased $213 million primarily driven by reductionsdue to continued investments in energy exposures. Noninterest expense decreased $15 million to $6.4 billion primarily driven by lower personnel and operating expense,the business, partially offset by higher FDIC expenselower revenue-related incentives and investments in technology.COVID-19 related costs.
The return on average allocated capital was 18six percent up from 15in 2020 compared to 20 percent as higherin 2019, due to lower net income was partially offset byand, to a lesser extent, an increase in allocated capital. For
increased capital allocation. For more information on capital allocated to the business segments, see Business Segment Operations on page 14.12.
Global Corporate, Global Commercial and Business Banking
Global Corporate, Global Commercial and Business Banking each include Business Lending and Global Transaction Services activities. Business Lending includes various lending-related products and services, and related hedging activities, including commercial loans, leases, commitment facilities, trade finance, real estate lending and asset-based lending. Global Transaction Services includes deposits, treasury management, credit card, foreign exchange and short-term investment products.
The table below and following discussion present a summary of the results, which exclude certain investment banking, merchant services and PPP activities in Global Banking.
|
| | | | | | | | | | | | | | | | | | | | | | | | | | | | | | | | |
| | | | | | | | | | | | | | | | | |
| Global Corporate, Global Commercial and Business Banking | | | | | | | | | | | | |
| | | Three Months Ended September 30 |
| | | Global Corporate Banking | | Global Commercial Banking | | Business Banking | | Total |
| (Dollars in millions) | 2017 | | 2016 | | 2017 |
| 2016 | | 2017 | | 2016 | | 2017 | | 2016 |
| Revenue | | | | | | | | | | | | | | | |
| Business Lending | $ | 1,127 |
| | $ | 1,113 |
| | $ | 1,090 |
| | $ | 1,069 |
| | $ | 101 |
| | $ | 91 |
| | $ | 2,318 |
| | $ | 2,273 |
|
| Global Transaction Services | 840 |
| | 738 |
| | 758 |
| | 671 |
| | 217 |
| | 182 |
| | 1,815 |
| | 1,591 |
|
| Total revenue, net of interest expense | $ | 1,967 |
| | $ | 1,851 |
| | $ | 1,848 |
| | $ | 1,740 |
| | $ | 318 |
| | $ | 273 |
| | $ | 4,133 |
| | $ | 3,864 |
|
| | | | | | | | | | | | | | | | |
| Balance Sheet | | | | | | | | | | | | | | | | |
| Average | | | | | | | | | | | | | | | |
| Total loans and leases | $ | 159,417 |
| | $ | 153,249 |
| | $ | 168,945 |
| | $ | 163,446 |
| | $ | 17,659 |
| | $ | 17,658 |
| | $ | 346,021 |
| | $ | 334,353 |
|
| Total deposits | 149,564 |
| | 144,694 |
| | 129,440 |
| | 127,161 |
| | 36,687 |
| | 35,433 |
| | 315,691 |
| | 307,288 |
|
| | | | | | | | | | | | | | | | |
| | | Nine Months Ended September 30 |
| | | Global Corporate Banking | | Global Commercial Banking | | Business Banking | | Total |
| | 2017 | | 2016 | | 2017 | | 2016 | | 2017 | | 2016 | | 2017 | | 2016 |
| Revenue | | | | | | | | | | | | | | | |
| Business Lending | $ | 3,322 |
| | $ | 3,269 |
| | $ | 3,186 |
| | $ | 3,129 |
| | $ | 301 |
| | $ | 280 |
| | $ | 6,809 |
| | $ | 6,678 |
|
| Global Transaction Services | 2,470 |
| | 2,171 |
| | 2,217 |
| | 2,036 |
| | 625 |
| | 549 |
| | 5,312 |
| | 4,756 |
|
| Total revenue, net of interest expense | $ | 5,792 |
| | $ | 5,440 |
| | $ | 5,403 |
| | $ | 5,165 |
| | $ | 926 |
| | $ | 829 |
| | $ | 12,121 |
| | $ | 11,434 |
|
| | | | | | | | | | | | | | | | |
| Balance Sheet | | | | | | | | | | | | | | | | |
| Average | | | | | | | | | | | | | | | |
| Total loans and leases | $ | 157,144 |
| | $ | 152,772 |
| | $ | 169,751 |
| | $ | 162,207 |
| | $ | 17,762 |
| | $ | 17,467 |
| | $ | 344,657 |
| | $ | 332,446 |
|
| Total deposits | 146,627 |
| | 140,817 |
| | 124,446 |
| | 125,676 |
| | 36,092 |
| | 34,685 |
| | 307,165 |
| | 301,178 |
|
| | | | | | | | | | | | | | | | |
| Period end | | | | | | | | | | | | | | | |
| Total loans and leases | $ | 161,441 |
| | $ | 151,825 |
| | $ | 170,825 |
| | $ | 164,518 |
| | $ | 17,579 |
| | $ | 17,760 |
| | $ | 349,845 |
| | $ | 334,103 |
|
| Total deposits | 147,893 |
| | 141,754 |
| | 135,249 |
| | 124,995 |
| | 36,402 |
| | 35,656 |
| | 319,544 |
| | 302,405 |
|
| | | | | | | | | | | | | | | | | | | | | | | | | | | | | | | | | | | | | | | | | | | | | | | | | | |
| | | | | | | | | | | | | | | | |
| Global Corporate, Global Commercial and Business Banking | | | | | | | | | | |
| | | | | | | | | | | | | | |
| | | Global Corporate Banking | | Global Commercial Banking | | Business Banking | | Total |
| | Three Months Ended September 30 |
| (Dollars in millions) | 2020 | | 2019 | | 2020 | | 2019 | | 2020 | | 2019 | | 2020 | | 2019 |
| Revenue | | | | | | | | | | | | | | | |
| Business Lending | $ | 791 | | | $ | 1,024 | | | $ | 953 | | | $ | 1,020 | | | $ | 59 | | | $ | 91 | | | $ | 1,803 | | | $ | 2,135 | |
| Global Transaction Services | 658 | | | 967 | | | 745 | | | 862 | | | 209 | | | 267 | | | 1,612 | | | 2,096 | |
| Total revenue, net of interest expense | $ | 1,449 | | | $ | 1,991 | | | $ | 1,698 | | | $ | 1,882 | | | $ | 268 | | | $ | 358 | | | $ | 3,415 | | | $ | 4,231 | |
| | | | | | | | | | | | | | | |
| Balance Sheet | | | | | | | | | | | | | | | | |
| Average | | | | | | | | | | | | | | | |
| Total loans and leases | $ | 174,235 | | | $ | 179,191 | | | $ | 175,536 | | | $ | 183,031 | | | $ | 13,972 | | | $ | 14,868 | | | $ | 363,743 | | | $ | 377,090 | |
| Total deposits | 218,593 | | | 175,914 | | | 201,523 | | | 143,835 | | | 50,946 | | | 40,707 | | | 471,062 | | | 360,456 | |
| | | | | | | | | | | | | | | |
| | Global Corporate Banking | | Global Commercial Banking | | Business Banking | | Total |
| | Nine Months Ended September 30 |
| (Dollars in millions) | 2020 | | 2019 | | 2020 | | 2019 | | 2020 | | 2019 | | 2020 | | 2019 |
| Revenue | | | | | | | | | | | | | | | |
| Business Lending | $ | 2,658 | | | $ | 2,992 | | | $ | 2,815 | | | $ | 3,100 | | | $ | 207 | | | $ | 275 | | | $ | 5,680 | | | $ | 6,367 | |
| Global Transaction Services | 2,314 | | | 2,979 | | | 2,432 | | | 2,642 | | | 682 | | | 800 | | | 5,428 | | | 6,421 | |
| Total revenue, net of interest expense | $ | 4,972 | | | $ | 5,971 | | | $ | 5,247 | | | $ | 5,742 | | | $ | 889 | | | $ | 1,075 | | | $ | 11,108 | | | $ | 12,788 | |
| | | | | | | | | | | | | | | |
| Balance Sheet | | | | | | | | | | | | | | | | |
| | | | | | | | | | | | | | | | |
| Average | | | | | | | | | | | | | | | |
Total loans and leases | $ | 186,220 | | | $ | 177,071 | | | $ | 188,147 | | | $ | 181,091 | | | $ | 14,721 | | | $ | 15,108 | | | $ | 389,088 | | | $ | 373,270 | |
| Total deposits | 214,327 | | | 175,239 | | | 188,271 | | | 142,665 | | | 46,599 | | | 39,522 | | | 449,197 | | | 357,426 | |
| | | | | | | | | | | | | | | |
| Period end | | | | | | | | | | | | | | | |
| Total loans and leases | $ | 165,498 | | | $ | 179,291 | | | $ | 168,385 | | | $ | 183,314 | | | $ | 13,665 | | | $ | 14,919 | | | $ | 347,548 | | | $ | 377,524 | |
| Total deposits | 212,564 | | | 183,678 | | | 200,591 | | | 147,119 | | | 51,889 | | | 41,089 | | | 465,044 | | | 371,886 | |
Business Lending revenue increased $45decreased $332 million and $131$687 million for the three and nine months ended September 30, 20172020 compared to the same periods in 2016.2019. The increase in the three-month perioddecrease was primarily driven by the impact of loan growth and lease-related activities and the allocation of ALM activities, partially offset by credit spread compression. The increase in the nine-month period was driven by the impact of the allocation of ALM activities and loans and loan-related hedging activity, partially offset by lower revenues from commercial real estate activity.interest rates.
Global Transaction Services revenue increased $224decreased $484 million and $556$993 million for the three and nine months ended September 30, 20172020 driven by the allocation of ALM results, partially offset by the impact of higher deposit balances.
Average loans and leases decreased four percent for the three months ended September 30, 2020 compared to the same periodsperiod in 20162019 driven by the impact of an increase in deposit balances and higher short-term rates, the allocation of ALM activities as well as higher treasury-related revenue.
client paydowns. Average loans and leases increased threefour percent for the nine months ended September 30, 2020 driven by growth in the commercial and industrial loan portfolio. Average deposits increased 31 percent and four26 percent for the three and nine months ended September 30, 2017
compared to the same periods in 2016 driven by growth in the commercial and industrial, and leasing portfolios. Average deposits increased three percent and two percent for the three and nine months ended September 30, 2017 compared to the same periods in 20162020 primarily due to growth with newclient responses to market volatility, government stimulus and existing clients.placement of credit draws.
Global Investment Banking
Client teams and product specialists underwrite and distribute debt, equity and loan products, and provide advisory services and tailored risk management solutions. The economics of certain investment banking and underwriting activities are shared primarily between Global Banking and Global Markets under an internal revenue-sharing arrangement. Global Banking originates certain deal-related transactions with our corporate and commercial clients that are executed and distributed by Global Markets. To provide a complete discussion of our consolidated investment banking fees, the following table presents total Corporation investment banking fees and the portion attributable to Global Banking.
| | | Investment Banking Fees | | Investment Banking Fees | |
| | | | | | | | | | | | | | | | | | | | Global Banking | | Total Corporation | | Global Banking | | Total Corporation |
| Investment Banking Fees | | | | | | | | | | | | | |
| | Three Months Ended September 30 | | Nine Months Ended September 30 | | Three Months Ended September 30 | | Nine Months Ended September 30 |
| | Global Banking | | Total Corporation | | Global Banking | | Total Corporation | |
| (Dollars in millions) | 2017 |
| 2016 | | 2017 | | 2016 | | 2017 | | 2016 | | 2017 | | 2016 | (Dollars in millions) | 2020 | | 2019 | | 2020 | | 2019 | | 2020 | | 2019 | | 2020 | | 2019 |
| Products | | | | | | | | | | | | | | | | Products | | | | |
| Advisory | $ | 322 |
| | $ | 295 |
| | $ | 374 |
| | $ | 328 |
| | $ | 1,177 |
| | $ | 913 |
| | $ | 1,262 |
| | $ | 1,007 |
| Advisory | $ | 356 | | | $ | 427 | | | $ | 397 | | | $ | 452 | | | $ | 948 | | | $ | 984 | | | $ | 1,072 | | | $ | 1,083 | |
| Debt issuance | 397 |
| | 405 |
| | 962 |
| | 908 |
| | 1,170 |
| | 1,060 |
| | 2,789 |
| | 2,466 |
| Debt issuance | 320 | | | 356 | | | 740 | | | 816 | | | 1,247 | | | 1,007 | | | 2,725 | | | 2,310 | |
| Equity issuance | 88 |
| | 96 |
| | 193 |
| | 261 |
| | 314 |
| | 257 |
| | 736 |
| | 681 |
| Equity issuance | 294 | | | 119 | | | 664 | | | 308 | | | 717 | | | 337 | | | 1,687 | | | 937 | |
| Gross investment banking fees | 807 |
| | 796 |
| | 1,529 |
| | 1,497 |
| | 2,661 |
| | 2,230 |
| | 4,787 |
| | 4,154 |
| Gross investment banking fees | 970 | | | 902 | | | 1,801 | | | 1,576 | | | 2,912 | | | 2,328 | | | 5,484 | | | 4,330 | |
| Self-led deals | (18 | ) | | (10 | ) | | (52 | ) | | (39 | ) | | (89 | ) | | (36 | ) | | (194 | ) | | (135 | ) | Self-led deals | (13) | | | (11) | | | (32) | | | (43) | | | (73) | | | (54) | | | (168) | | | (162) | |
| Total investment banking fees | $ | 789 |
| | $ | 786 |
| | $ | 1,477 |
| | $ | 1,458 |
| | $ | 2,572 |
| | $ | 2,194 |
| | $ | 4,593 |
| | $ | 4,019 |
| Total investment banking fees | $ | 957 | | | $ | 891 | | | $ | 1,769 | | | $ | 1,533 | | | $ | 2,839 | | | $ | 2,274 | | | $ | 5,316 | | | $ | 4,168 | |
Total Corporation investment banking fees, excluding self-led deals, of $1.5$1.8 billion and $4.6$5.3 billion, which are primarily included within Global Banking and Global Markets, increased one15 percent and 1428 percent for the three and nine months ended September
30, 20172020 compared to the same periods in 2016. The increase for both periods was2019 primarily driven by higher advisory fees and higher debtequity issuance fees due to an increase in overall client activity and market fee pools.
Global Markets
| | | | | | | | | | | | | | | | | | | | | | | | | | | | | | | | | | | | | | |
| | | | | | | | | | | | |
| | Three Months Ended September 30 | | | | Nine Months Ended September 30 | | |
| (Dollars in millions) | 2020 | | 2019 | | % Change | | 2020 | | 2019 | | % Change |
| Net interest income | $ | 1,108 | | | $ | 1,016 | | | 9 | % | | $ | 3,558 | | | $ | 2,780 | | | 28 | % |
| Noninterest income: | | | | | | | | | | | |
| Investment and brokerage services | 440 | | | 419 | | | 5 | | | 1,487 | | | 1,296 | | | 15 | |
| Investment banking fees | 739 | | | 585 | | | 26 | | | 2,280 | | | 1,707 | | | 34 | |
| Market making and similar activities | 1,726 | | | 1,580 | | | 9 | | | 7,059 | | | 5,623 | | | 26 | |
| All other income | 270 | | | 263 | | | 3 | | | 475 | | | 783 | | | (39) | |
| Total noninterest income | 3,175 | | | 2,847 | | | 12 | | | 11,301 | | | 9,409 | | | 20 | |
| Total revenue, net of interest expense | 4,283 | | | 3,863 | | | 11 | | | 14,859 | | | 12,189 | | | 22 | |
| | | | | | | | | | | |
| Provision for credit losses | 21 | | | — | | | n/m | | 233 | | | (18) | | | n/m |
| Noninterest expense | 3,104 | | | 2,677 | | | 16 | | | 8,598 | | | 8,109 | | | 6 | |
| Income before income taxes | 1,158 | | | 1,186 | | | (2) | | | 6,028 | | | 4,098 | | | 47 | |
| Income tax expense | 301 | | | 338 | | | (11) | | | 1,567 | | | 1,168 | | | 34 | |
| Net income | $ | 857 | | | $ | 848 | | | 1 | | | $ | 4,461 | | | $ | 2,930 | | | 52 | |
| | | | | | | | | | | |
| Effective tax rate | 26.0 | % | | 28.5 | % | | | | 26.0 | % | | 28.5 | % | | |
| | | | | | | | | | | |
| Return on average allocated capital | 9 | | | 10 | | | | | 17 | | | 11 | | | |
| Efficiency ratio | 72.42 | | | 69.31 | | | | | 57.86 | | | 66.53 | | | |
| | | | | | | | | | | |
| Balance Sheet | | | | | | | | | | | | |
| Three Months Ended September 30 | | | | Nine Months Ended September 30 | | |
| Average | 2020 | | 2019 | | % Change | | 2020 | | 2019 | | % Change |
| | | | | | | | | | | |
| | | | | | | | | | | |
| Trading-related assets: | | | | | | | | | | | |
| Trading account securities | $ | 251,735 | | | $ | 261,182 | | | (4) | % | | $ | 241,753 | | | $ | 246,077 | | | (2) | % |
| Reverse repurchases | 100,395 | | | 110,907 | | | (9) | | | 106,968 | | | 117,087 | | | (9) | |
| Securities borrowed | 86,508 | | | 80,641 | | | 7 | | | 88,734 | | | 82,772 | | | 7 | |
| Derivative assets | 46,676 | | | 46,066 | | | 1 | | | 47,687 | | | 43,922 | | | 9 | |
| Total trading-related assets | 485,314 | | | 498,796 | | | (3) | | | 485,142 | | | 489,858 | | | (1) | |
| Total loans and leases | 72,319 | | | 71,589 | | | 1 | | | 72,702 | | | 70,757 | | | 3 | |
| Total earning assets | 476,182 | | | 476,919 | | | — | | | 485,448 | | | 474,481 | | | 2 | |
| Total assets | 680,983 | | | 687,398 | | | (1) | | | 685,685 | | | 679,040 | | | 1 | |
| Total deposits | 56,475 | | | 30,155 | | | 87 | | | 45,002 | | | 30,878 | | | 46 | |
| Allocated capital | 36,000 | | | 35,000 | | | 3 | | | 36,000 | | | 35,000 | | | 3 | |
| | | | | | | | | | | |
| Period end | | | | | | | September 30
2020 | | December 31
2019 | | % Change |
| | | | | | | | | | | |
| | | | | | | | | | | |
| Total trading-related assets | | | | | | | $ | 477,552 | | | $ | 452,499 | | | 6 | % |
| Total loans and leases | | | | | | | 75,475 | | | 72,993 | | | 3 | |
| Total earning assets | | | | | | | 461,855 | | | 471,701 | | | (2) | |
| Total assets | | | | | | | 676,242 | | | 641,809 | | | 5 | |
| Total deposits | | | | | | | 56,727 | | | 34,676 | | | 64 | |
n/m = not meaningful
|
| | | | | | | | | | | | | | | | | | | | | | |
| | | | | | | | | | | | | |
| | | Three Months Ended September 30 | | | | Nine Months Ended September 30 | | |
| (Dollars in millions) | 2017 | | 2016 | | % Change | | 2017 | | 2016 | | % Change |
| Net interest income (FTE basis) | $ | 899 |
| | $ | 1,119 |
| | (20 | )% | | $ | 2,812 |
| | $ | 3,391 |
| | (17 | )% |
| Noninterest income: | | | | | | | | | | | |
| Investment and brokerage services | 496 |
| | 490 |
| | 1 |
| | 1,548 |
| | 1,583 |
| | (2 | ) |
| Investment banking fees | 623 |
| | 645 |
| | (3 | ) | | 1,879 |
| | 1,742 |
| | 8 |
|
| Trading account profits | 1,714 |
| | 1,934 |
| | (11 | ) | | 5,634 |
| | 5,401 |
| | 4 |
|
| All other income | 168 |
| | 170 |
| | (1 | ) | | 682 |
| | 501 |
| | 36 |
|
| Total noninterest income | 3,001 |
| | 3,239 |
| | (7 | ) | | 9,743 |
| | 9,227 |
| | 6 |
|
| Total revenue, net of interest expense (FTE basis) | 3,900 |
| | 4,358 |
| | (11 | ) | | 12,555 |
| | 12,618 |
| | <(1) |
|
| | | | | | | | | | | | |
| Provision for credit losses | (6 | ) | | 19 |
| | (132 | ) | | 2 |
| | 23 |
| | (91 | ) |
| Noninterest expense | 2,710 |
| | 2,656 |
| | 2 |
| | 8,117 |
| | 7,690 |
| | 6 |
|
| Income before income taxes (FTE basis) | 1,196 |
| | 1,683 |
| | (29 | ) | | 4,436 |
| | 4,905 |
| | (10 | ) |
| Income tax expense (FTE basis) | 440 |
| | 609 |
| | (28 | ) | | 1,553 |
| | 1,746 |
| | (11 | ) |
| Net income | $ | 756 |
| | $ | 1,074 |
| | (30 | ) | | $ | 2,883 |
| | $ | 3,159 |
| | (9 | ) |
| | | | | | | | | | | | |
| Return on average allocated capital | 9 | % | | 12 | % | | | | 11 | % | | 11 | % | | |
| Efficiency ratio (FTE basis) | 69.48 |
| | 60.94 |
| | | | 64.64 |
| | 60.94 |
| | |
| | | | | | | | | | | | |
| Balance Sheet | | | | | | | | | | | | |
| | Three Months Ended September 30 | | | | Nine Months Ended September 30 | | |
| Average | 2017 | | 2016 | | % Change | | 2017 | | 2016 | | % Change |
| Trading-related assets: | | | | | | | | | | | |
| Trading account securities | $ | 216,988 |
| | $ | 185,785 |
| | 17 | % | | $ | 214,190 |
| | $ | 183,928 |
| | 16 | % |
| Reverse repurchases | 101,556 |
| | 89,435 |
| | 14 |
| | 99,998 |
| | 89,218 |
| | 12 |
|
| Securities borrowed | 81,950 |
| | 87,872 |
| | (7 | ) | | 83,770 |
| | 86,159 |
| | (3 | ) |
| Derivative assets | 41,789 |
| | 52,325 |
| | (20 | ) | | 41,184 |
| | 52,164 |
| | (21 | ) |
Total trading-related assets (1) | 442,283 |
| | 415,417 |
| | 6 |
| | 439,142 |
| | 411,469 |
| | 7 |
|
| Total loans and leases | 72,347 |
| | 69,043 |
| | 5 |
| | 70,692 |
| | 69,315 |
| | 2 |
|
Total earning assets (1) | 446,754 |
| | 422,636 |
| | 6 |
| | 444,478 |
| | 421,221 |
| | 6 |
|
| Total assets | 642,430 |
| | 584,069 |
| | 10 |
| | 631,686 |
| | 582,006 |
| | 9 |
|
| Total deposits | 32,125 |
| | 32,840 |
| | (2 | ) | | 32,397 |
| | 34,409 |
| | (6 | ) |
| Allocated capital | 35,000 |
| | 37,000 |
| | (5 | ) | | 35,000 |
| | 37,000 |
| | (5 | ) |
| | | | | | | | | | | | |
| Period end | | | | | | | September 30
2017 | | December 31
2016 | | % Change |
Total trading-related assets (1) | | | | | | | $ | 426,371 |
| | $ | 380,562 |
| | 12 | % |
| Total loans and leases | | | | | | | 76,225 |
| | 72,743 |
| | 5 |
|
Total earning assets (1) | | | | | | | 441,656 |
| | 397,023 |
| | 11 |
|
| Total assets | | | | | | | 629,270 |
| | 566,060 |
| | 11 |
|
| Total deposits | | | | | | | 33,382 |
| | 34,927 |
| | (4 | ) |
| |
(1)
| Trading-related assets include derivative assets, which are considered non-earning assets. |
Global Markets offers sales and trading services includingand research services to institutional clients across fixed-income, credit, currency, commodity and equity businesses. Global Markets product coverage includes securities and derivative products in both the primary and secondary markets. Global Markets provides market-making, financing, securities clearing, settlement and custody services globally to our institutional investor clients in support of their investing and trading activities. We also work with our commercial and corporate clients to provide risk management products using interest rate, equity, credit, currency and commodity derivatives, foreign exchange, fixed-income and mortgage-related products. As a result of our market-making activities in these products, we may be required to manage risk in a broad range of financial products including government securities, equity and equity-linked securities, high-grade and high-yield corporate debt securities, syndicated loans, mortgage-backed securities (MBS), commodities and asset-backed securities. The economics of certain investment banking and underwriting activities are shared primarily between Global Markets and Global Banking under an
internal revenue-sharing arrangement. Global Banking originates certain deal-related transactions with our corporate and commercial clients that are executed and distributed by Global Markets. For more information
about Global Markets, see Business Segment Operations in the MD&A of the Corporation’s 2019 Annual Report on investment banking fees on a consolidated basis, see page 23.Form 10-K.
Three Months Ended September 30, 2017 Compared to Three Months Ended September 30, 2016
Net incomeThe following explanations for current period-over-period changes for Global Markets decreased $318 million to $756 million driven by lower sales and trading revenue, as well as a decline in investment banking fees and increased noninterest expense. Net DVA losses were $21 million compared to losses of $127 million., including those disclosed under Sales and trading revenue, excluding net DVA, decreased $577 million primarily due to less favorable FICC market conditions across credit products and lower volatility in rates products compared toTrading Revenue, are the prior-year period. Noninterest expense increased $54 million to $2.7 billion as continued investments in technology were partially offset by lower operating costs.same for amounts including
Average trading-related assetsand excluding net DVA. Amounts excluding net DVA are a non-GAAP financial measure. For more information on net DVA, see Supplemental Financial Data on page 8.
Three-Month Comparison
Net income for Global Markets remained relatively unchanged at $857 million. Net DVA losses were $116 million compared to losses of $15 million in the prior-year period. Excluding net DVA, net income increased $26.9 billion$86 million to $442.3$945 million. These increases were primarily driven by higher revenue, partially offset by higher noninterest expense.
Revenue increased $420 million to $4.3 billion primarily driven by targeted growthhigher sales and trading revenue, investment banking fees and card income. Sales and trading revenue increased $16 million, and excluding net DVA, increased $117 million driven by increased client activity in Asian equities and stronger performance in mortgage and foreign exchange products.
Noninterest expense increased $427 million to $3.1 billion driven by higher activity-based expenses for both card and trading.
Average total assets decreased $6.4 billion to $681.0 billion driven by increased balance sheet efficiency in securities financing matched-book activity and lower levels of inventory in FICC, partially offset by higher client financing activitiesbalances in the global equities business.Global Equities.
The return on average allocated capital was nine percent, down from 1210 percent, as lower net income was partially offset by a decreasedprimarily due to an increase in allocated capital. For more information on capital allocation.allocated to the business segments, see Business Segment Operations on page 12.
Nine Months Ended September 30, 2017 Compared to Nine Months Ended September 30, 2016Nine-Month Comparison
Net income for Global Markets decreased $276 millionincreased $1.5 billion to $2.9$4.5 billion. Net DVA losses were $310$77 million compared to losses of $137 million.$136 million in the prior-year period. Excluding net DVA, net income decreased $169 millionincreased $1.5 billion to $3.1$4.5 billion. These increases
were primarily driven by an increase in revenue, partially offset by higher noninterest expense and provision for credit losses.
Revenue increased $2.7 billion to $14.9 billion primarily driven by higher noninterest expense and lower sales and trading revenue partially offset by higherand investment banking fees. Sales and trading revenue increased $2.1 billion, and excluding net DVA, decreased $168increased $2.0 billion. These increases were driven by higher revenue across FICC and Equities.
The provision for credit losses increased $251 million primarily due to the weaker performance in rates products and emerging markets.economic outlook related to COVID-19. Noninterest expense increased $427$489 million to $8.1$8.6 billion due to the same factors as described in the three-month discussion.
Average total assets increased $6.6 billion to $685.7 billion primarily due to litigation expenseincreased levels of inventory in the nine months ended September 30, 2017 comparedFICC to a litigation recovery in the same period in 2016 and continued investments in technology.
Average trading-relatedfacilitate expected client demand. Period-end total assets increased $27.7$34.4 billion since December 31, 2019 to $439.1$676.2 billion primarily driven by targeted growth inEquities due to increased hedging of client financing activities in the global equities business. Period-end trading-related assets increased $45.8 billionactivity with stock positions relative to $426.4 billion driven by additional inventory in FICC to meet expected client demand as
well as targeted growth in client financing activities in the global equities business.derivative transactions at year end.
The return on average allocated capital remained atwas 17 percent, up from 11 percent, reflecting lowerhigher net income, partially offset by a decreasean increase in average allocated capital.
Sales and Trading Revenue
SalesFor a description of sales and trading revenue, includes unrealized and realized gains and lossessee Business Segment Operations in the MD&A of the Corporation’s 2019 Annual Report on trading and other assets, net interest income, and fees primarily from commissions on equity securities. Sales and trading revenue is segregated into fixed-income (government debt obligations, investment and non-investment grade corporate debt obligations, commercial MBS, residential mortgage-backed securities, collateralized loan obligations (CLOs), interest rate and credit derivative contracts), currencies (interest rate and foreign exchange contracts), commodities (primarily futures, forwards, swaps and options) and equities (equity-linked derivatives and cash equity activity).Form 10-K. The following table and related discussion present sales and trading revenue, substantially all of which is in Global Markets, with the remainder in Global Banking. In addition, the following table and related discussion present sales and trading revenue, excluding the impact of net DVA, which is a non-GAAP financial measure. We believeFor more information on net DVA, see Supplemental Financial Data on page 8.
| | | | | | | | | | | | | | | | | | | | | | | |
| | | | | | | |
Sales and Trading Revenue (1, 2, 3) |
| | | | | |
| Three Months Ended September 30 | | Nine Months Ended September 30 |
| (Dollars in millions) | 2020 | | 2019 | | 2020 | | 2019 |
Sales and trading revenue (2) | | | | | | | |
| Fixed income, currencies and commodities | $ | 2,019 | | | $ | 2,056 | | | $ | 7,905 | | | $ | 6,435 | |
| Equities | 1,205 | | | 1,152 | | | 4,105 | | | 3,478 | |
| Total sales and trading revenue | $ | 3,224 | | | $ | 3,208 | | | $ | 12,010 | | | $ | 9,913 | |
| | | | | | | |
Sales and trading revenue, excluding net DVA (4) | | | | | | | |
| Fixed income, currencies and commodities | $ | 2,126 | | | $ | 2,074 | | | $ | 7,983 | | | $ | 6,562 | |
| Equities | 1,214 | | | 1,149 | | | 4,104 | | | 3,487 | |
| Total sales and trading revenue, excluding net DVA | $ | 3,340 | | | $ | 3,223 | | | $ | 12,087 | | | $ | 10,049 | |
(1)For more information on sales and trading revenue, see Note 3 – Derivatives to the useConsolidated Financial Statements.
(2)Includes FTE adjustments of this$38 million and $138 million for the three and nine months ended September 30, 2020 compared to $52 million and $131 million for the same periods in 2019.
(3) Includes Global Banking sales and trading revenue of $86 million and $378 million for the three and nine months ended September 30, 2020 compared to $152 million and $399 million for the same periods in 2019.
(4) FICC and Equities sales and trading revenue, excluding net DVA, is a non-GAAP financial measure provides additional useful informationmeasure. FICC net DVA losses were $107 million and $78 million for the three and nine months ended September 30, 2020 compared to assesslosses of $18 million and $127 million for the underlyingsame periods in 2019. Equities net DVA losses were $9 million and gains of $1 million for the three and nine months ended September 30, 2020 compared to gains of $3 million and losses of $9 million for the same periods in 2019.
Three-Month Comparison
FICC revenue increased $52 million due to stronger performance of these businessesin mortgages and to allow better comparison of period-over-period operating performance.foreign exchange products. Equities revenue increased $65 million driven by increased client activity in Asia.
Nine-Month Comparison
FICC revenue increased $1.4 billion driven by increased client activity and improved market-making conditions across macro products, partially offset by weaker performances in credit-sensitive businesses. Equities revenue increased $617 million driven by increased client activity and a strong trading performance in a more volatile market environment.
|
| | | | | | | | | | | | | | | |
| | | | | | | | |
Sales and Trading Revenue (1, 2) | | | | |
| | Three Months Ended September 30 | | Nine Months Ended September 30 |
| (Dollars in millions) | 2017 | | 2016 | | 2017 | | 2016 |
| Sales and trading revenue | | | | | | | |
| Fixed-income, currencies and commodities | $ | 2,152 |
| | $ | 2,646 |
| | $ | 7,068 |
| | $ | 7,507 |
|
| Equities | 977 |
| | 954 |
| | 3,170 |
| | 3,072 |
|
| Total sales and trading revenue | $ | 3,129 |
| | $ | 3,600 |
| | $ | 10,238 |
| | $ | 10,579 |
|
| | | | | | | | |
Sales and trading revenue, excluding net DVA (3) | | | | | | | |
| Fixed-income, currencies and commodities | $ | 2,166 |
| | $ | 2,767 |
| | $ | 7,350 |
| | $ | 7,647 |
|
| Equities | 984 |
| | 960 |
| | 3,198 |
| | 3,069 |
|
| Total sales and trading revenue, excluding net DVA | $ | 3,150 |
| | $ | 3,727 |
| | $ | 10,548 |
| | $ | 10,716 |
|
| | | | | | | | |
(1)21Bank of America
| Includes FTE adjustments of $63 million and $162 million for the three and nine months ended September 30, 2017 compared to $49 million and $136 million for the same periods in 2016. For more information on sales and trading revenue, see Note 2 – Derivatives to the Consolidated Financial Statements.
| |
| | | | | | | | |
(2)
| Includes Global Banking sales and trading revenue of $61 million and $175 million for the three and nine months ended September 30, 2017 compared to $57 million and $336 million for the same periods in 2016.
|
| |
(3)
| FICC and Equities sales and trading revenue, excluding net DVA, is a non-GAAP financial measure. FICC net DVA losses were $14 million and $282 million for the three and nine months ended September 30, 2017 compared to net DVA losses of $121 million and $140 million for the same periods in 2016. Equities net DVA losses were $7 million and $28 million for the three and nine months ended September 30, 2017 compared to net DVA losses of $6 million and gains of $3 million for the same periods in 2016.
|
The explanations for period-over-period changes in sales and trading, FICC and Equities revenue, as set forth below, would be the same if net DVA was included.
Three Months Ended September 30, 2017 Compared to Three Months Ended September 30, 2016
FICC revenue, excluding net DVA, decreased $601 million due to less favorable market conditions across credit-related products and lower volatility in rates products in the current-year quarter. Equities revenue, excluding net DVA, increased $24 million
primarily due to growth in client financing activities, partially offset by slower secondary markets.
Nine Months Ended September 30, 2017 Compared to Nine Months Ended September 30, 2016
FICC revenue, excluding net DVA, decreased $297 million as weaker performance in rates products and emerging markets were partially offset by strength in credit and G10 currencies. Equities revenue, excluding net DVA, increased $129 million primarily due to growth in client financing activities.
All Other
| | | | | | | | | | | | | | | | | | | | | | | | | | | | | | | | | | | | | | |
| | | | | | | | | | | | |
| | Three Months Ended September 30 | | | | Nine Months Ended September 30 | | |
| (Dollars in millions) | 2020 | | 2019 | | % Change | | 2020 | | 2019 | | % Change |
| Net interest income | $ | (20) | | | $ | 62 | | | (132) | % | | $ | 3 | | | $ | 135 | | | (98) | % |
| | | | | | | | | | | |
| | | | | | | | | | | |
| | | | | | | | | | | |
| | | | | | | | | | | |
| | | | | | | | | | | |
| Noninterest income (loss) | (915) | | | (810) | | | 13 | | | (2,182) | | | (2,019) | | | 8 | |
| Total revenue, net of interest expense | (935) | | | (748) | | | 25 | | | (2,179) | | | (1,884) | | | 16 | |
| | | | | | | | | | | |
| Provision for credit losses | (18) | | | (295) | | | (94) | | | 75 | | | (590) | | | (113) | |
| | | | | | | | | | | |
| | | | | | | | | | | |
| Noninterest expense | 560 | | | 2,460 | | | (77) | | | 1,114 | | | 3,375 | | | (67) | |
| Loss before income taxes | (1,477) | | | (2,913) | | | (49) | | | (3,368) | | | (4,669) | | | (28) | |
| Income tax benefit | (1,774) | | | (1,320) | | | 34 | | | (3,387) | | | (3,050) | | | 11 | |
| Net income (loss) | $ | 297 | | | $ | (1,593) | | | (119) | | | $ | 19 | | | $ | (1,619) | | | (101) | |
| | | | | | | | | | | | |
| Balance Sheet | | | | | | | | | | | | |
| | | | | | | | |
| | Three Months Ended September 30 | | | | Nine Months Ended September 30 | | |
| Average | | 2020 | | 2019 | | % Change | | 2020 | | 2019 | | % Change |
| | | | | | | | | | | |
| | | | | | | | | | | |
| | | | | | | | | | | |
| | | | | | | | | | | |
| | | | | | | | | | | |
| Total loans and leases | $ | 24,243 | | | $ | 41,789 | | | (42) | % | | $ | 30,218 | | | $ | 44,530 | | | (32) | % |
Total assets (1) | 230,906 | | | 212,440 | | | 9 | | | 227,430 | | | 205,335 | | | 11 | |
| Total deposits | 14,881 | | | 20,641 | | | (28) | | | 19,926 | | | 20,645 | | | (3) | |
| | | | | | | | | | | | |
| Period end | | | | | | | | September 30
2020 | | December 31
2019 | | % Change |
| | | | | | | | | | | |
| | | | | | | | | | | |
| | | | | | | | | | | |
| | | | | | | | | | | |
| | | | | | | | | | | |
| Total loans and leases | | | | | | | $ | 23,120 | | | $ | 37,156 | | | (38) | % |
| | | | | | | | | | | |
Total assets (1) | | | | | | | 223,345 | | | 224,375 | | | — | |
| Total deposits | | | | | | | 12,839 | | | 23,089 | | | (44) | |
|
| | | | | | | | | | | | | | | | | | | | | | |
| | | | | | | | | | | | | |
| | | Three Months Ended September 30 | | | | Nine Months Ended September 30 | | |
| (Dollars in millions) | 2017 | | 2016 | | % Change | | 2017 | | 2016 | | % Change |
| Net interest income (FTE basis) | $ | 52 |
| | $ | 157 |
| | (67 | )% | | $ | 232 |
| | $ | 504 |
| | (54 | )% |
| Noninterest income: | | | | | | | | | | | |
| Card income | — |
| | 46 |
| | (100 | ) | | 71 |
| | 145 |
| | (51 | ) |
| Mortgage banking income (loss) | (163 | ) | | 292 |
| | n/m |
| | (72 | ) | | 577 |
| | (112 | ) |
| Gains on sales of debt securities | 125 |
| | 51 |
| | 145 |
| | 278 |
| | 490 |
| | (43 | ) |
| All other income (loss) | (215 | ) | | (134 | ) | | 60 |
| | 72 |
| | (746 | ) | | (110 | ) |
| Total noninterest income (loss) | (253 | ) | | 255 |
| | n/m |
| | 349 |
| | 466 |
| | (25 | ) |
| Total revenue, net of interest expense (FTE basis) | (201 | ) | | 412 |
| | (149 | ) | | 581 |
| | 970 |
| | (40 | ) |
| | | | | | | | | | | | |
| Provision for credit losses | (191 | ) | | 8 |
| | n/m |
| | (376 | ) | | (71 | ) | | n/m |
|
| Noninterest expense | 482 |
| | 1,047 |
| | (54 | ) | | 3,790 |
| | 4,510 |
| | (16 | ) |
| Loss before income taxes (FTE basis) | (492 | ) | | (643 | ) | | (23 | ) | | (2,833 | ) | | (3,469 | ) | | (18 | ) |
| Income tax expense (benefit) (FTE basis) | (709 | ) | | (462 | ) | | 53 |
| | (2,033 | ) | | (1,985 | ) | | 2 |
|
| Net income (loss) | $ | 217 |
| | $ | (181 | ) | | n/m |
| | $ | (800 | ) | | $ | (1,484 | ) | | (46 | ) |
| | | | | | | | | | | | | |
Balance Sheet (1) | | | | | | | | | | | | |
| | | Three Months Ended September 30 | | | | Nine Months Ended September 30 | | |
| Average | 2017 | | 2016 | | % Change | | 2017 | | 2016 | | % Change |
| Total loans and leases | $ | 76,546 |
| | $ | 105,298 |
| | (27 | )% | | $ | 86,294 |
| | $ | 111,611 |
| | (23 | )% |
| Total deposits | 25,273 |
| | 27,541 |
| | (8 | ) | | 25,629 |
| | 27,588 |
| | (7 | ) |
| | | | | | | | | | | | | |
| Period end | | | | | | | September 30
2017 | | December 31
2016 | | % Change |
Total loans and leases (2) | | | | | | | $ | 72,823 |
| | $ | 96,713 |
| | (25 | )% |
| Total deposits | | | | | | | 24,072 |
| | 23,061 |
| | 4 |
|
| |
(1)
| In segments where the total of liabilities and equity exceeds assets, which are generally deposit-taking segments, we allocate assets from All Other to those segments to match liabilities (i.e., deposits) and allocated shareholders’ equity. Such allocated assets were $510.1 billion and $517.9 billion for the three and nine months ended September 30, 2017 compared to $500.4 billion and $497.8 billion for the same periods in 2016, and $515.0 billion and $518.7 billion at September 30, 2017 and December 31, 2016.
|
| |
(2)
| Included $9.2 billion of non-U.S. credit card loans, which were included in assets of business held for sale on the Consolidated Balance Sheet at December 31, 2016. During the second quarter of 2017, the Corporation sold its non-U.S. consumer credit card business.
|
n/m = not meaningful(1)In segments where the total of liabilities and equity exceeds assets, which are generally deposit-taking segments, we allocate assets from All Other to those segments to match liabilities (i.e., deposits) and allocated shareholders’ equity. Average allocated assets were $828.3 billion and $714.2 billion for the three and nine months ended September 30, 2020 compared to $536.8 billion and $540.9 billion for the same periods in 2019, and period-end allocated assets were $857.8 billion and $565.4 billion at September 30, 2020 and December 31, 2019.
All Other consists of ALM activities, equity investments, non-core mortgage loans and servicing activities, the net impact of periodic revisions to the MSR valuation model for both core and non-core MSRs and the related economic hedge results and ineffectiveness, other liquidating businesses residual expense allocations and other.certain expenses not otherwise allocated to a business segment. ALM activities encompass certain residential mortgages, debt securities, and interest rate and foreign currency risk management activities,activities. Substantially all of the impact of certain allocation methodologies and accounting hedge ineffectiveness. The results of certain ALM activities are allocated to our business segments. For more information on our ALM activities, see Note 17 – Business Segment Informationto the Consolidated Financial Statements. Equity investments include our merchant services joint venture as well as Global Principal Investments (GPI) which is comprised of a portfolio of equity, real estate and other alternative investments. For more information on our merchant services joint venture, see Note 10 – Commitments and Contingenciesto the Consolidated Financial Statements.
During the second quarter of 2017, the Corporation sold its non-U.S. consumer credit card business. For more information about All Other, see Business Segment Operations in the MD&A of the Corporation’s 2019 Annual Report on the sale, see Note 1 – Summary of Significant Accounting Principles to the Consolidated Financial Statements.Form 10-K.
The Corporation classifies consumer real estate loans as core or non-core based on loan and customer characteristics such as origination date, product type, LTV, FICO score and delinquency status. For more information on the core and non-core portfolios, see Consumer Portfolio Credit Risk Management on page 39. Residential mortgage loans that are held for ALM purposes, including interest rate or liquidity risk management, are classified as core and are presented on the balance sheet of All Other. For more information on our interest rate and liquidity risk management activities, see Liquidity Risk on page 35 and Interest Rate Risk Management for the Banking Book on page 63. During
the nine months ended September 30, 2017,2020, residential mortgage loans held for ALM activities decreased $4.9$11.7 billion to $29.8$10.0 billion at September 30, 2017due primarily as a result of payoffs and paydowns outpacing new originations.to loan sales. Non-core residential mortgage and home equity loans, which are principally run-offrunoff portfolios, including certain loans accounted for under the fair value option and MSRs pertaining to non-core loans serviced for others, are also held in All Other. During the nine months ended September 30, 2017,2020, total non-core loans decreased $9.3$2.4 billion to $43.8$13.3 billion at September 30, 2017 due primarily to payoffs and paydowns, as well as Federal Housing Administration (FHA) loan sales.conveyances and sales, partially offset by repurchases. For more information on the composition of the core and non-core portfolios, see Consumer Portfolio Credit Risk Management on page 30.
Three Months Ended September 30, 2017 Compared to Three Months Ended September 30, 2016Three-Month Comparison
Results for All Other improved $398 million$1.9 billion to net income of $217$297 million from a net loss of $181 million$1.6 billion in the prior-year period reflectingprimarily due to a $2.1 billion pretax impairment charge related to the notice of termination of the merchant services joint venture in the prior year, partially offset by lower revenue and a decrease in the benefit in provision for credit losses.
Revenue decreased $187 million due to lower noninterest income driven by the results of certain treasury activities and lower net interest income.
Noninterest expense and adecreased $1.9 billion to $560 million due to the $2.1 billion pretax impairment charge in the prior-year period, partially offset by higher litigation expense.
The benefit in the provision for credit losses partially offset by a decline in revenue. Revenue declined $613decreased $277 million to a loss$18 million primarily due to recoveries from sales of $201 million reflecting lower mortgage banking income and the impact of the sale of the non-U.S.previously charged-off non-core consumer credit card business. Mortgage banking income was negatively impacted by less favorable valuations on mortgage servicing rights, net of related hedges, and an increasereal estate loans in the provision for representations and warranties.prior-year period.
The provision for credit losses improved $199 million to a benefit of $191 million primarily driven by loan sale recoveries, continued runoff of the non-core portfolio and the sale of the non-U.S. consumer credit card business. Noninterest expense decreased $565 million to $482 million driven by lower personnel and operational costs due to the sale of the non-U.S. consumer credit card business and lower litigation expense in the non-core mortgage business.
The income tax benefit increased to $709$454 million from a benefit of $462 million as the prior-year quarter included a $350 million charge forreflecting the impact of the U.K. tax law changes enacted in September 2016.change, partially offset by the impact of decreased pretax losses and lower discrete tax benefits. For more information on the U.K. tax law change, see Financial Highlights on page 7. Both periods included income tax benefit adjustments to eliminate the FTE treatment in noninterest income of certain tax credits recorded in Global Banking.Banking.
Nine Months Ended September 30, 2017 Compared to Nine Months Ended September 30, 2016Nine-Month Comparison
The net lossResults for All Other decreased $684 improved $1.6 billion to net income of $19 million tofrom a net loss of $800 million, reflecting lower noninterest expense, the net gain on sale of the non-U.S. consumer credit card business$1.6 billion in the second quarter and a larger benefit in the provision for credit losses, offset by a decline in revenue. Revenue declined $389 millionprior-year period primarily due to lower mortgage banking income. Mortgage banking income decreased $649 million driven by the same factors as described in the three-month discussion. Gains
Revenue decreased $295 million primarily due to the results of certain treasury activities, valuation adjustments on securities and derivatives and extinguishment losses on certain structured liabilities, partially offset by a gain on sales of loans included in all other income, including nonperforming and other delinquent loans, were $108 million compared to gains of $214 million in the same period in 2016.mortgage loans.
The benefit in the provision for credit losses increased $305$665 millionto$75 million due to a benefit of $376 million driven bythe same factor as described in the three-month discussion as well as the weaker economic outlook related to COVID-19.
Noninterest expense decreased $2.3 billion to $1.1 billion due to the same factors as described in the three-month discussion. Noninterest expense decreased $720 million to $3.8 billion driven by lower litigation expense, lower personnel expense and a decline in non-core mortgage servicing costs, partially offset by a $295 million impairment charge related to certain data centers in the process of being sold.
The income tax benefit increased $48$337 million due to a benefit of $2.0 billion, reflecting tax expense of $690 million recognizedthe same factors as described in connection with the sale of the non-U.S. consumer credit card business and tax benefits related to a new accounting standard on share-based compensation. The prior-year period included a $350 million charge for the impact of the U.K. tax law changes.three-month discussion. Both periods included income tax benefit adjustments to eliminate the FTE treatment in noninterest income of certain tax credits recorded in Global Banking.Banking.
Off-Balance Sheet Arrangements and Contractual Obligations
We have contractual obligations to make future payments on debt and lease agreements. Additionally, in the normal course of business, we enter into contractual arrangements whereby we commit to future purchases of products or services from unaffiliated parties. For more information on obligations and commitments, see Note 10 – Commitments and Contingencies to the Consolidated Financial Statements herein, as well as Off-Balance Sheet Arrangements and Contractual Obligations in the MD&A of the Corporation's 2016Corporation’s 2019 Annual Report on Form 10-K, as well as and Note 1112 – Long-term Debt and Note 1213 – Commitments and Contingencies to the Consolidated Financial Statements of the Corporation's 2016Corporation’s 2019 Annual Report on Form 10-K.
Representations and Warranties Obligations
For more information on representations and warranties obligations in connection with the reserve for representationssale of mortgage loans, see Note 13 – Commitments and warranties exposures and the corresponding estimated range of possible loss, see Note 7 – Representations and Warranties Obligations and Corporate
Guarantees Contingenciesto the Consolidated Financial Statements of the Corporation's 2016Corporation’s 2019 Annual Report on Form 10-K and, for more information related to the sensitivity of the assumptions used to estimate our reserve for representations and warranties, see Complex Accounting Estimates – Representations and Warranties Liability in the MD&A of the Corporation's 2016 Annual Report on Form 10-K.
At September 30, 2017 and December 31, 2016, we had $17.6 billion and $18.3 billion of unresolved repurchase claims, predominately related to subprime and pay option first-lien loans and home equity loans. Outstanding repurchase claims remain unresolved primarily due to (1) the level of detail, support and analysis accompanying such claims, which impact overall claim quality and, therefore, claim resolution and (2) the lack of an established process to resolve disputes related to these claims.
In addition to unresolved repurchase claims, we have received notifications from a sponsor of third-party securitizations with whom we engaged in whole-loan transactions indicating that we may have indemnity obligations with respect to specific loans for which we have not received a repurchase request. These notifications were received prior to 2015, and totaled $1.3 billion at both September 30, 2017 and December 31, 2016. During the three months ended September 30, 2017, we reached an agreement with the party requesting indemnity, subject to acceptance of a settlement agreement by a securitization trustee; the impact of this agreement is included in the reserve for representations and warranties.
The reserve for representations and warranties and corporate guarantees is included in accrued expenses and other liabilities on the Consolidated Balance Sheet and the related provision is included in mortgage banking income. At September 30, 2017 and December 31, 2016, the reserve for representations and warranties was $2.2 billion and $2.3 billion. For the three and nine months ended September 30, 2017, the representations and warranties provision was $198 million and $193 million compared to $99 million and $158 million for the same periods in 2016. The increase in the provision was the result of advanced negotiations with certain counterparties where we believe we will reach settlements on several outstanding legacy matters.
In addition, we currently estimate that the range of possible loss for representations and warranties exposures could be up to $2 billion over existing accruals at September 30, 2017. The estimated range of possible loss represents a reasonably possible loss, but does not represent a probable loss, and is based on currently available information, significant judgment and a number of assumptions that are subject to change.
Future provisions and/or ranges of possible loss associated with obligations under representations and warranties may be significantly impacted if future experiences are different from historical experience or our understandings, interpretations or assumptions. Adverse developments, with respect to one or more of the assumptions underlying the reserve for representations and warranties and the corresponding estimated range of possible loss, such as counterparties successfully challenging or avoiding the application of the relevant statute of limitations, could result in significant increases to future provisions and/or the estimated range of possible loss.
Other Mortgage-related Matters
We continue to be subject to additional mortgage-related litigation and disputes, as well as governmental and regulatory scrutiny and investigations, related to our past and current origination, servicing, transfer of servicing and servicing rights, servicing compliance obligations, foreclosure activities, indemnification obligations, and mortgage insurance and captive reinsurance practices with mortgage insurers. The ongoing environment of additional regulation, increased regulatory compliance obligations, and enhanced regulatory enforcement, combined with ongoing uncertainty related to the continuing evolution of the regulatory environment, has resulted in increased operational and compliance costs and may limit our ability to continue providing certain products and services. For more information on management’s estimate of the aggregate range of possible loss for certain litigation matters and on regulatory investigations, see Note 10 – Commitments and Contingencies to the Consolidated Financial Statements.
Managing Risk
Risk is inherent in all our business activities. The seven key types of risk faced by the Corporation are strategic, credit, market, liquidity, compliance, operational and reputational risks.reputational. Sound risk management enables us to serve our customers and deliver for our shareholders. If not managed well, risks can result in financial loss, regulatory sanctions and penalties, and damage to our reputation, each of which may adversely impact our ability to execute our business strategies. The Corporation takesWe take a comprehensive approach to risk management with a defined Risk Framework and an articulated Risk Appetite Statement which are approved annually by the Enterprise Risk Committee (ERC) and the Board.
Our Risk Framework isserves as the foundation for comprehensivethe consistent and effective management of the risks facing the Corporation. The Risk Framework sets forth clear roles, responsibilities and accountability for the management of risk and provides a blueprint for how the Board, through delegation of authority to committees and executive officers, establishes risk appetite and associated limits for our activities.
Our Risk Appetite Statement is intended to ensure that the Corporation maintains an acceptable risk profile by providing a common framework and a comparable set of measures for senior management and the Board to clearly indicate the level of risk the Corporation is willing to accept. Risk appetite is set at least annually and is aligned with the Corporation'sCorporation’s strategic, capital and financial operating plans. Our line of businessline-of-business strategies and risk appetite are also similarly aligned.
For more information about the Corporation's risks related to the COVID-19 pandemic, see Part II, Item 1A. Risk Factors on page 105. These COVID-19 related risks are being managed within our Risk Framework and supporting risk management programs.
For more information on our Risk Framework, our risk management activities including our Risk Framework, and the key types of risk faced by the Corporation, see the Managing Risk through Reputational Risk sections in the MD&Aof the Corporation's 2016Corporation’s 2019 Annual Report on Form 10-K.10-K.
Capital Management
The Corporation manages its capital position so that its capital is more than adequate to support its business activities and to maintain capital,aligns with risk, and risk appetite commensurate with one another. Additionally, we seek to maintain safety and soundness at all times, even under adverse scenarios, take advantage of organic growth opportunities, meet obligations to creditors and counterparties, maintain ready access to financial markets, continue to serve as a credit intermediary, remain a source of strength for our subsidiaries, and satisfy current and future regulatory capital requirements. Capital management is integrated into our risk and governance processes, as capital is a key consideration in the development of our strategic plan, risk appetite and risk limits.strategic planning. For more information on capital management, including related regulatory requirements, see Capital Management in the MD&A of the Corporation’s 2019 Annual Report on Form 10-K.
We periodically review capital allocated to our businesses and allocate capital annually during the strategic and capital planning processes. For additional information, see Business Segment Operations on page 14.
Comprehensive Capital Analysis and ReviewCCAR and Capital Planning
The Federal Reserve requires BHCs to submit a capital plan and requests forplanned capital actions on an annual basis, consistent with the rules governing the Comprehensive Capital Analysis and Review (CCAR)CCAR capital plan.
On In June 28, 2017, following2020, the Federal Reserve's non-objectionReserve notified BHCs of their 2020 CCAR supervisory stress test results, which included a preliminary stress capital buffer (SCB) that was finalized in August 2020. Based on our results, we are subject to a 2.5 percent SCB for the period beginning October 1, 2020 and ending on September 30, 2021. Our Common equity tier 1 (CET1) capital ratio under the Standardized approach must remain above 9.5 percent during this period (the sum of our 2017 CCARCET1 capital plan,ratio minimum of 4.5 percent, global systemically important bank (G-SIB) surcharge of 2.5 percent and our SCB of 2.5 percent) in order to avoid restrictions on capital distributions and discretionary bonus payments.
Due to economic uncertainty resulting from the Board authorizedCOVID-19 pandemic, the Federal Reserve required all large banks to suspend share repurchase programs in the third quarter of $12.9 billion in common stock from July 1, 2017 through June 30, 2018, including approximately $900 million2020, except for repurchases to offset the effect ofshares awarded under equity-based compensation plans, duringand to limit dividends to existing rates that do not exceed the same period.average of the last four quarters’ net income. In September 2020, the Federal Reserve announced that these measures would remain in place for the fourth quarter of 2020. Large banks will also be required to update and resubmit their capital plans in November 2020 based on the Federal Reserve’s updated supervisory stress test scenarios. The Federal Reserve announced that it will publish the results of the additional supervisory stress tests by December 31, 2020.
As previously disclosed, the Federal Reserve’s directives regarding share repurchases aligned with our decision to voluntarily suspend our general common stock repurchase authorization includes bothprogram during the first half of 2020. The suspension of our repurchases did not include repurchases to offset shares awarded under our equity-based compensation plans, for which we repurchased $114 million of common stock and warrants.
Duringduring the three months ended September 30, 2017,third quarter of 2020 pursuant to the Board's authorization, we repurchased $3.0 billionBoard’s repurchase authorization.
We intend to maintain the quarterly common stock dividend at the current rate of $0.18 per share until further notice, subject to approval by the Board. We will also continue our current suspension of common stock repurchases in the fourth quarter of 2020, except for repurchases to offset shares awarded under our equity-based compensation plans, which includeshave previously been authorized by the Board.
Our general common stock repurchase program is subject to offset equity-based compensation awards. The timingthe Board’s approval, and amount of commonat such time that we reinstate our stock repurchase program, our stock repurchases will be subject to various factors, including the Corporation’s capital position, liquidity, financial performance and alternative uses of capital, stock trading price and general market conditions, and may be suspended at any time. The common stockSuch repurchases may be effected through open market purchases or privately negotiated transactions, including repurchase plans that satisfy the conditions of Rule 10b5-1 of the Securities Exchange Act of 1934. As a “well-capitalized” BHC, we may notify the Federal Reserve of our intention to make additional capital distributions not to exceed 0.25 percent of Tier 1 capital, and which were not contemplated in our capital plan, subject to the Federal Reserve's non-objection.1934, as amended (Exchange Act).
Regulatory Capital
As a financial services holding company, we are subject to regulatory capital rules, including Basel 3, issued by U.S. banking regulators including Basel 3, which includes certain transition provisions through January 1, 2019.regulators. The Corporation's depository institution subsidiaries are also subject to the Prompt Corrective Action (PCA) framework. The Corporation and its primary affiliated banking entity, BANA, are Advanced approaches institutions under Basel 3 Advanced approaches institutions.
Basel 3 Overview
Basel 3 updated the composition of capital and established a Common equity tier 1 capital ratio. Common equity tier 1 capital primarily includes common stock, retained earnings and accumulated other comprehensive income (OCI), net of deductions and adjustments primarily related to goodwill, deferred tax assets, intangibles and defined benefit pension assets. Under the Basel 3 regulatory capital transition provisions, certain deductions and adjustments to Common equity tier 1 capital are phased in through January 1, 2018. As of January 1, 2017, under the transition provisions, 80 percent of these deductions and adjustments was recognized. Basel 3 also revised minimum capital ratios and buffer requirements, added a supplementary leverage ratio (SLR), and addressed the adequately capitalized minimum requirements under the Prompt Corrective Action (PCA) framework. Finally, Basel 3 established two methods of calculating risk-weighted assets, the Standardized approach and the Advanced approaches. The Standardized approach relies primarily on supervisory risk weights based on exposure type, and the Advanced approaches determine risk weights based on internal models.
As an Advanced approaches institution, we are required to report regulatory risk-based capital ratios and risk-weighted assets (RWA) under both the Standardized and Advanced approaches. The approach that yields the lower ratio is used to assess capital adequacy including under the PCA framework. As of September 30, 2020, the CET1, Tier 1 capital and Total capital ratios for the Corporation were lower under the Standardized approach.
Minimum Capital Requirements
MinimumIn order to avoid restrictions on capital requirementsdistributions and related buffers are being phased in from January 1, 2014 through January 1, 2019. The PCA framework establishes categories of capitalization including “well capitalized,” based ondiscretionary bonus payments, the Basel 3 regulatory ratio requirements. U.S. banking regulators are required to take certain mandatory actions depending on the category of capitalization, with no mandatory actions required for “well-capitalized” banking organizations, which included BANA at September 30, 2017.
We are subject to a capital conservation buffer, a countercyclical capital buffer and a global systemically important
bank (G-SIB) surcharge that are being phased in over a three-year period ending January 1, 2019. Once fully phased in, the Corporation’sCorporation must meet risk-based capital ratio requirements willthat include a capital conservation buffer greater than 2.5 percent, plus any
applicable countercyclical capital buffer and a G-SIB surcharge in order to avoid restrictions onsurcharge. On October 1, 2020, the capital distributions and discretionary bonus payments.conservation buffer was replaced by the SCB for the Corporation’s Standardized approach ratio requirements. The buffers and surcharge must be comprised solely of Common equity tier 1CET1 capital. Under the phase-in provisions, we were required to maintain a capital conservation buffer greater than 1.25 percent plus a G-SIB surcharge of 1.5 percent at September 30, 2017.
The countercyclical capital bufferCorporation is currently set at zero. We estimate that our fully phased-in G-SIB surcharge will be 2.5 percent. The G-SIB surcharge may differ from this estimate over time. For more information on the Corporation's transition and fully phased-in capital ratios and regulatory requirements, see Table 11.
Supplementary Leverage Ratio
Basel 3 requires Advanced approaches institutions to disclose an SLR. The numerator of the SLR is quarter-end Basel 3 Tier 1 capital. The denominator is total leverage exposure based on the daily average of the sum of on-balance sheet exposures less permitted Tier 1 deductions, as well as the simple average of certain off-balance sheet exposures, as of the end of each month in a quarter. Effective January 1, 2018, the Corporation will bealso required to maintain a minimum SLRsupplementary leverage ratio (SLR) of 3.0 percent plus a leverage buffer of 2.0 percent in order to avoid certain restrictions on capital distributions and discretionary bonus payments. InsuredOur insured depository institution subsidiaries of BHCs will beare required to maintain a minimum 6.0 percent SLR to be considered "well capitalized"well capitalized under the PCA framework.
Capital Composition and Ratios
Table 118 presents Bank of America Corporation’s transition and fully phased-in capital ratios and related information in accordance with Basel 3 Standardized and Advanced approaches as measured at September 30, 20172020 and December 31, 2016. Fully phased-in estimates are non-GAAP financial measures that2019. For the Corporation considers to be useful measures in evaluating compliance with new regulatory capital requirements that are not yet effective. For reconciliations to GAAP financial measures, see Table 14. As of September 30, 2017 and December 31, 2016,periods presented herein, the Corporation met the definition of “well capitalized”well capitalized under current regulatory requirements.
| | | | | | | | | | | | | | | | | | | | | | | | | | | | | | |
| | | | | | | | | | | | | | | | |
| Table 8 | Bank of America Corporation Regulatory Capital under Basel 3 | | | | | | |
| | | | | | | | |
| | | | | | | | | | |
| | | | | | | Standardized
Approach (1, 2) | | Advanced
Approaches (1) | | Regulatory
Minimum (3) | | | | |
| (Dollars in millions, except as noted) | | | | | | | September 30, 2020 | | |
| Risk-based capital metrics: | | | | | | | | | | | | | | | |
| Common equity tier 1 capital | | | | | | | $ | 173,213 | | | $ | 173,213 | | | | | | | |
| Tier 1 capital | | | | | | | 196,637 | | | 196,637 | | | | | | | |
Total capital (4) | | | | | | | 235,446 | | | 224,541 | | | | | | | |
| Risk-weighted assets (in billions) | | | | | | | 1,460 | | | 1,364 | | | | | | | |
| Common equity tier 1 capital ratio | | | | | | | 11.9 | % | | 12.7 | % | | 9.5 | % | | | | |
| Tier 1 capital ratio | | | | | | | 13.5 | | | 14.4 | | | 11.0 | | | | | |
| Total capital ratio | | | | | | | 16.1 | | | 16.5 | | | 13.0 | | | | | |
| | | | | | | | | | | | | | | | |
| Leverage-based metrics: | | | | | | | | | | | | | | | |
Adjusted quarterly average assets (in billions) (5) | | | | | | | $ | 2,667 | | | $ | 2,667 | | | | | | | |
| Tier 1 leverage ratio | | | | | | | 7.4 | % | | 7.4 | % | | 4.0 | | | | | |
| | | | | | | | | | | | | | | |
Supplementary leverage exposure (in billions) (6) | | | | | | | | | $ | 2,867 | | | | | | | |
| Supplementary leverage ratio | | | | | | | | | 6.9 | % | | 5.0 | | | | | |
| | | | | | | | | | | | | | | | |
| | | | | | | | December 31, 2019 | | |
| Risk-based capital metrics: | | | | | | | | | | | | | | | |
| Common equity tier 1 capital | | | | | | | $ | 166,760 | | | $ | 166,760 | | | | | | | |
| Tier 1 capital | | | | | | | 188,492 | | | 188,492 | | | | | | | |
Total capital (4) | | | | | | | 221,230 | | | 213,098 | | | | | | | |
| Risk-weighted assets (in billions) | | | | | | | 1,493 | | | 1,447 | | | | | | | |
| Common equity tier 1 capital ratio | | | | | | | 11.2 | % | | 11.5 | % | | 9.5 | % | | | | |
| Tier 1 capital ratio | | | | | | | 12.6 | | | 13.0 | | | 11.0 | | | | | |
| Total capital ratio | | | | | | | 14.8 | | | 14.7 | | | 13.0 | | | | | |
| | | | | | | | | | | | | | | | |
| Leverage-based metrics: | | | | | | | | | | | | | | | |
Adjusted quarterly average assets (in billions) (5) | | | | | | | $ | 2,374 | | | $ | 2,374 | | | | | | | |
| Tier 1 leverage ratio | | | | | | | 7.9 | % | | 7.9 | % | | 4.0 | | | | | |
| | | | | | | | | | | | | | | | |
| Supplementary leverage exposure (in billions) | | | | | | | | | $ | 2,946 | | | | | | | |
| Supplementary leverage ratio | | | | | | | | | 6.4 | % | | 5.0 | | | | | |
| | | | | | | | | | | | | | | | |
| | | | | | | | | | | | | | | |
| | | | | | | | | | | | | | | |
| | | | | | | | | | | | | | | | |
| | | | | | | | | | | | | | | |
| | | | | | | | | | | | | | | |
| | | | | | | | | | | | | | | |
29Bank(1)As of AmericaSeptember 30, 2020, capital ratios are calculated using the regulatory capital rule that allows a five-year transition period related to the adoption of CECL.
|
| | | | | | | | | | | | | | | | | | | | | | |
| | | | | | | | | | | | | |
| Table 11 | Bank of America Corporation Regulatory Capital under Basel 3 (1) | | | | |
| | | |
| | | September 30, 2017 |
| | | Transition | | Fully Phased-in |
| (Dollars in millions) | Standardized Approach | | Advanced Approaches | | Regulatory Minimum (2) | | Standardized Approach | | Advanced Approaches (3) | | Regulatory Minimum (4) |
| Risk-based capital metrics: | | | | | | | | | | | |
| Common equity tier 1 capital | $ | 176,094 |
| | $ | 176,094 |
| | | | $ | 173,568 |
| | $ | 173,568 |
| | |
| Tier 1 capital | 196,438 |
| | 196,438 |
| | | | 195,291 |
| | 195,291 |
| | |
Total capital (5) | 232,849 |
| | 223,814 |
| | | | 229,779 |
| | 220,745 |
| | |
| Risk-weighted assets (in billions) | 1,407 |
| | 1,482 |
| | | | 1,420 |
| | 1,460 |
| | |
| Common equity tier 1 capital ratio | 12.5 | % | | 11.9 | % | | 7.25 | % | | 12.2 | % | | 11.9 | % | | 9.5 | % |
| Tier 1 capital ratio | 14.0 |
| | 13.3 |
| | 8.75 |
| | 13.8 |
| | 13.4 |
| | 11.0 |
|
| Total capital ratio | 16.5 |
| | 15.1 |
| | 10.75 |
| | 16.2 |
| | 15.1 |
| | 13.0 |
|
| | | | | | | | | | | | | |
| Leverage-based metrics: | | | | | | | | | | | |
Adjusted quarterly average assets (in billions) (6) | $ | 2,194 |
| | $ | 2,194 |
| | | | $ | 2,193 |
| | $ | 2,193 |
| | |
| Tier 1 leverage ratio | 9.0 | % | | 9.0 | % | | 4.0 |
| | 8.9 | % | | 8.9 | % | | 4.0 |
|
| | | | | | | | | | | | |
| SLR leverage exposure (in billions) | | | | | | | | | $ | 2,742 |
| | |
| SLR | | | | | | | | | 7.1 | % | | 5.0 |
|
| | | | | | | | | | | | | |
| | | December 31, 2016 |
| Risk-based capital metrics: | | | | | | | | | | | |
| Common equity tier 1 capital | $ | 168,866 |
| | $ | 168,866 |
| | | | $ | 162,729 |
| | $ | 162,729 |
| | |
| Tier 1 capital | 190,315 |
| | 190,315 |
| | | | 187,559 |
| | 187,559 |
| | |
Total capital (5) | 228,187 |
| | 218,981 |
| | | | 223,130 |
| | 213,924 |
| | |
| Risk-weighted assets (in billions) | 1,399 |
| | 1,530 |
| | | | 1,417 |
| | 1,512 |
| | |
| Common equity tier 1 capital ratio | 12.1 | % | | 11.0 | % | | 5.875 | % | | 11.5 | % | | 10.8 | % | | 9.5 | % |
| Tier 1 capital ratio | 13.6 |
| | 12.4 |
| | 7.375 |
| | 13.2 |
| | 12.4 |
| | 11.0 |
|
| Total capital ratio | 16.3 |
| | 14.3 |
| | 9.375 |
| | 15.8 |
| | 14.2 |
| | 13.0 |
|
| | | | | | | | | | | | | |
| Leverage-based metrics: | | | | | | | | | | | |
Adjusted quarterly average assets (in billions) (6) | $ | 2,131 |
| | $ | 2,131 |
| | | | $ | 2,131 |
| | $ | 2,131 |
| | |
| Tier 1 leverage ratio | 8.9 | % | | 8.9 | % | | 4.0 |
| | 8.8 | % | | 8.8 | % | | 4.0 |
|
| | | | | | | | | | | | | |
| SLR leverage exposure (in billions) | | | | | | | | | $ | 2,702 |
| | |
| SLR | | | | | | | | | 6.9 | % | | 5.0 |
|
| |
(1)
| As an Advanced approaches institution, we are required to report regulatory capital risk-weighted assets and ratios under both the Standardized and Advanced approaches. The approach that yields the lower ratio is to be used to assess capital adequacy and was the Advanced approaches method at September 30, 2017 and December 31, 2016.
|
| |
(2)
| The September 30, 2017 and December 31, 2016 amounts include a transition capital conservation buffer of 1.25 percent and 0.625 percent, and a transition G-SIB surcharge of 1.5 percent and 0.75 percent. The countercyclical capital buffer for both periods is zero.
|
| |
(3)
| Basel 3 fully phased-in Advanced approaches estimates assume approval by U.S. banking regulators of our internal models methodology (IMM) for calculating(2)Derivative exposure amounts are calculated using the standardized approach for measuring counterparty credit risk regulatory capital for derivatives. As of September 30, 2017, we did not have regulatory approval of the IMM model. Basel 3 fully phased-in Common equity tier 1 capital ratio would be reduced by approximately 25 bps if IMM is not used. |
| |
(4)
| Fully phased-in regulatory minimums assume a capital conservation buffer of 2.5 percent and estimated G-SIB surcharge of 2.5 percent. The estimated fully phased-in countercyclical capital buffer is currently set at zero. We will be subject to fully phased-in regulatory minimums on January 1, 2019. The fully phased-in SLR minimum assumes a leverage buffer of 2.0 percent and is applicable on January 1, 2018.
|
| |
(5)
| Total capital under the Advanced approaches differs from the Standardized approach due to differences in the amount permitted in Tier 2 capital related to the qualifying allowance for credit losses. |
| |
(6)
| Reflects adjusted average total assets for the three months ended September 30, 2017 and December 31, 2016.
|
Common equity tier 1 capital under Basel 3 Advanced – Transition was $176.1 billion at September 30, 2017,2020 and the current exposure method at December 31, 2019.
(3)The capital conservation buffer and G-SIB surcharge were 2.5 percent at both September 30, 2020 and December 31, 2019. The countercyclical capital buffer for both periods was zero. The SLR minimum includes a leverage buffer of 2.0 percent.
(4)Total capital under the Advanced approaches differs from the Standardized approach due to differences in the amount permitted in Tier 2 capital related to the qualifying allowance for credit losses.
(5)Reflects total average assets adjusted for certain Tier 1 capital deductions.
(6)Supplementary leverage exposure at September 30, 2020 reflects the temporary exclusion of U.S. Treasury Securities and deposits at Federal Reserve Banks.
At September 30, 2020, CET1 capital was $173.2 billion, an increase of $7.2$6.5 billion compared tofrom December 31, 20162019, driven by earnings and the exercise of warrants associated with the Series T preferred stock,net unrealized gains on available-for-sale (AFS) debt securities included in accumulated other comprehensive income (OCI), partially offset by common stock repurchases dividends and
dividends. Total capital under the phase-in under Basel 3 transition provisions of deductions, primarily related to deferred tax assets. During the nine months ended September 30, 2017, total capitalStandardized approach increased $4.8$14.2 billion
primarily driven by earnings, partially offset by common stock repurchases, dividendsthe same factors as CET1 capital, an increase in the adjusted allowance for credit losses included in Tier 2 capital and the phase-inissuance of preferred stock. RWA under Basel 3 transition provisions.the Standardized approach, which yielded the
lower CET1 capital ratio at September 30, 2020, decreased $48$33.5 billion during the nine months ended September 30, 20172020 to $1,482$1,460 billion primarily due to model improvements, the sale of the non-U.S. consumerlower exposures in Global Banking and Consumer Banking, partially offset by
increases in counterparty credit card business, improved credit qualityrisk and lower market risk.
risk RWA. Table 129 shows the capital composition at September 30, 2020 and December 31, 2019.
| | | | | | | | | | | | | | |
| | | | |
| Table 9 | Capital Composition under Basel 3 | | | |
| | | | |
| | |
| (Dollars in millions) | September 30
2020 | | December 31
2019 |
| | | |
| Total common shareholders’ equity | $ | 245,423 | | | $ | 241,409 | |
CECL transitional amount (1) | 4,411 | | | — | |
| Goodwill, net of related deferred tax liabilities | (68,569) | | | (68,570) | |
| Deferred tax assets arising from net operating loss and tax credit carryforwards | (5,853) | | | (5,193) | |
| Intangibles, other than mortgage servicing rights and goodwill, net of related deferred tax liabilities | (1,656) | | | (1,328) | |
| Defined benefit pension plan net assets | (1,056) | | | (1,003) | |
Cumulative unrealized net (gain) loss related to changes in fair value of financial liabilities attributable to own creditworthiness,
net-of-tax | 1,245 | | | 1,278 | |
| Other | (732) | | | 167 | |
| Common equity tier 1 capital | 173,213 | | | 166,760 | |
| Qualifying preferred stock, net of issuance cost | 23,426 | | | 22,329 | |
| Other | (2) | | | (597) | |
| Tier 1 capital | 196,637 | | | 188,492 | |
| Tier 2 capital instruments | 22,571 | | | 22,538 | |
Qualifying allowance for credit losses (2) | 16,243 | | | 10,229 | |
| Other | (5) | | | (29) | |
| Total capital under the Standardized approach | 235,446 | | | 221,230 | |
Adjustment in qualifying allowance for credit losses under the Advanced approaches (2) | (10,905) | | | (8,132) | |
| Total capital under the Advanced approaches | $ | 224,541 | | | $ | 213,098 | |
(1)The CECL transitional amount includes the impact of the Corporation's adoption of the new CECL accounting standard on January 1, 2020 plus 25 percent of the increase in the adjusted allowance for credit losses from January 1, 2020 through September 30, 2020.
(2)The balance at September 30, 2020 includes the impact of transition provisions related to the new CECL accounting standard.
Table 10 shows the components of RWA as measured under Basel 3 – Transition at September 30, 20172020 and December 31, 2016.2019.
| | | | | | | | | | | | | | | | | | | | | | | | | | |
| | | | | | | | |
| Table 10 | Risk-weighted Assets under Basel 3 | | | | | | | |
| | | | | | | | |
| Standardized Approach (1) | | Advanced Approaches | | Standardized Approach (1) | | Advanced Approaches |
| |
| |
| (Dollars in billions) | September 30, 2020 | | December 31, 2019 |
| | | |
| Credit risk | $ | 1,396 | | | $ | 884 | | | $ | 1,437 | | | $ | 858 | |
| Market risk | 64 | | | 63 | | | 56 | | | 55 | |
Operational risk (2) | n/a | | 372 | | | n/a | | 500 | |
| Risks related to credit valuation adjustments | n/a | | 45 | | | n/a | | 34 | |
| Total risk-weighted assets | $ | 1,460 | | | $ | 1,364 | | | $ | 1,493 | | | $ | 1,447 | |
|
| | | | | | | | |
| | | | | |
| Table 12 | Capital Composition under Basel 3 – Transition (1, 2) | | | |
| | | | | |
| (Dollars in millions) | September 30
2017 | | December 31
2016 |
| Total common shareholders’ equity | $ | 250,136 |
| | $ | 241,620 |
|
| Goodwill | (68,413 | ) | | (69,191 | ) |
| Deferred tax assets arising from net operating loss and tax credit carryforwards | (5,428 | ) | | (4,976 | ) |
| Adjustments for amounts recorded in accumulated OCI attributed to AFS Securities and defined benefit postretirement plans | 747 |
| | 1,899 |
|
| Adjustments for amounts recorded in accumulated OCI attributed to certain cash flow hedges | 739 |
| | 895 |
|
| Intangibles, other than mortgage servicing rights and goodwill | (1,263 | ) | | (1,198 | ) |
| Defined benefit pension fund assets | (749 | ) | | (512 | ) |
| DVA related to liabilities and derivatives | 632 |
| | 413 |
|
| Other | (307 | ) | | (84 | ) |
| Common equity tier 1 capital | 176,094 |
| | 168,866 |
|
| Qualifying preferred stock, net of issuance cost | 22,323 |
| | 25,220 |
|
| Deferred tax assets arising from net operating loss and tax credit carryforwards | (1,357 | ) | | (3,318 | ) |
| Defined benefit pension fund assets | (187 | ) | | (341 | ) |
| DVA related to liabilities and derivatives under transition | 158 |
| | 276 |
|
| Other | (593 | ) | | (388 | ) |
| Total Tier 1 capital | 196,438 |
| | 190,315 |
|
| Long-term debt qualifying as Tier 2 capital | 23,129 |
| | 23,365 |
|
| Eligible credit reserves included in Tier 2 capital | 2,420 |
| | 3,035 |
|
| Nonqualifying capital instruments subject to phase out from Tier 2 capital | 1,893 |
| | 2,271 |
|
| Other | (66 | ) | | (5 | ) |
| Total Basel 3 Capital | $ | 223,814 |
| | $ | 218,981 |
|
| |
(1)
| See Table 11, footnote 1.
|
| |
(2)
| Deductions from and adjustments to regulatory capital subject to transition provisions under Basel 3 are generally recognized in 20 percent annual increments, and will be fully recognized as of January 1, 2018. Any assets that are a direct deduction from the computation of capital are excluded from risk-weighted assets and adjusted average total assets. |
Table 13 presents(1) Derivative exposure amounts are calculated using the components of our risk-weighted assets as measured under Basel 3 – Transitionstandardized approach for measuring counterparty credit risk at September 30, 20172020 and the current exposure method at December 31, 2016.2019.
|
| | | | | | | | | | | | | | | | |
| | | | | | | | | |
| Table 13 | Risk-weighted Assets under Basel 3 – Transition | | | | | | | |
| | | | | | | | | |
| | September 30, 2017 | | December 31, 2016 |
| (Dollars in billions) | Standardized Approach | | Advanced Approaches | | Standardized Approach | | Advanced Approaches |
| Credit risk | $ | 1,348 |
| | $ | 868 |
| | $ | 1,334 |
| | $ | 903 |
|
| Market risk | 59 |
| | 58 |
| | 65 |
| | 63 |
|
| Operational risk | n/a |
| | 500 |
| | n/a |
| | 500 |
|
| Risks related to CVA | n/a |
| | 56 |
| | n/a |
| | 64 |
|
| Total risk-weighted assets | $ | 1,407 |
| | $ | 1,482 |
| | $ | 1,399 |
| | $ | 1,530 |
|
n/a = not applicable
Table 14 presents a reconciliation of regulatory capital in accordance with Basel 3 Standardized – Transition to the Basel 3 Standardized approach fully phased-in estimates and Basel 3 Advanced approaches fully phased-in estimates at September 30, 2017 and December 31, 2016.
|
| | | | | | | | |
| | | | | |
| Table 14 | Regulatory Capital Reconciliations between Basel 3 Transition to Fully Phased-in (1) |
| | | | |
| (Dollars in millions) | September 30
2017 | | December 31
2016 |
| Common equity tier 1 capital (transition) | $ | 176,094 |
| | $ | 168,866 |
|
| Deferred tax assets arising from net operating loss and tax credit carryforwards phased in during transition | (1,357 | ) | | (3,318 | ) |
| Accumulated OCI phased in during transition | (747 | ) | | (1,899 | ) |
| Intangibles phased in during transition | (316 | ) | | (798 | ) |
| Defined benefit pension fund assets phased in during transition | (187 | ) | | (341 | ) |
| DVA related to liabilities and derivatives phased in during transition | 158 |
| | 276 |
|
| Other adjustments and deductions phased in during transition | (77 | ) | | (57 | ) |
| Common equity tier 1 capital (fully phased-in) | 173,568 |
| | 162,729 |
|
| Additional Tier 1 capital (transition) | 20,344 |
| | 21,449 |
|
| Deferred tax assets arising from net operating loss and tax credit carryforwards phased out during transition | 1,357 |
| | 3,318 |
|
| Defined benefit pension fund assets phased out during transition | 187 |
| | 341 |
|
| DVA related to liabilities and derivatives phased out during transition | (158 | ) | | (276 | ) |
| Other transition adjustments to additional Tier 1 capital | (7 | ) | | (2 | ) |
| Additional Tier 1 capital (fully phased-in) | 21,723 |
| | 24,830 |
|
| Tier 1 capital (fully phased-in) | 195,291 |
| | 187,559 |
|
| Tier 2 capital (transition) | 27,376 |
| | 28,666 |
|
| Nonqualifying capital instruments phased out during transition | (1,893 | ) | | (2,271 | ) |
| Other adjustments to Tier 2 capital | 9,005 |
| | 9,176 |
|
| Tier 2 capital (fully phased-in) | 34,488 |
| | 35,571 |
|
| Basel 3 Standardized approach Total capital (fully phased-in) | 229,779 |
| | 223,130 |
|
| Change in Tier 2 qualifying allowance for credit losses | (9,034 | ) | | (9,206 | ) |
| Basel 3 Advanced approaches Total capital (fully phased-in) | $ | 220,745 |
| | $ | 213,924 |
|
| | | | |
| Risk-weighted assets – As reported to Basel 3 (fully phased-in) | | | |
| Basel 3 Standardized approach risk-weighted assets as reported | $ | 1,407,093 |
| | $ | 1,399,477 |
|
| Changes in risk-weighted assets from reported to fully phased-in | 12,710 |
| | 17,638 |
|
| Basel 3 Standardized approach risk-weighted assets (fully phased-in) | $ | 1,419,803 |
| | $ | 1,417,115 |
|
| | | | |
| Basel 3 Advanced approaches risk-weighted assets as reported | $ | 1,481,919 |
| | $ | 1,529,903 |
|
| Changes in risk-weighted assets from reported to fully phased-in | (21,768 | ) | | (18,113 | ) |
Basel 3 Advanced approaches risk-weighted assets (fully phased-in) (2) | $ | 1,460,151 |
| | $ | 1,511,790 |
|
| | | | | | | | |
(1)25Bank of America
| See Table 11, footnote 1.
| |
| | | | | | | | |
(2)
| Basel 3 fully phased-in Advanced approaches estimates assume approval by U.S. banking regulators of our IMM for calculating counterparty credit risk regulatory capital for derivatives. As of September 30, 2017, we did not have regulatory approval of the IMM model. Basel 3 fully phased-in Common equity tier 1 capital ratio would be reduced by approximately 25 bps if IMM is not used. | |
Bank of America, N.A. Regulatory Capital
Table 1511 presents transition regulatory capital information for BANA in accordance with Basel 3 Standardized and Advanced approaches as measured at September 30, 20172020 and December 31, 2016. As of September 30, 2017,2019. BANA met the definition of “well capitalized”well capitalized under the PCA framework for both periods.
| | | | | | | | | | | | | | | | | | | | | | |
| | | | | | | | |
| Table 11 | Bank of America, N.A. Regulatory Capital under Basel 3 | | |
| | | | | | | | |
| | Standardized
Approach (1, 2) | | | | Advanced
Approaches (1) | | Regulatory
Minimum (3) |
| (Dollars in millions, except as noted) | September 30, 2020 |
| Risk-based capital metrics: | | | | | | | |
| Common equity tier 1 capital | $ | 160,013 | | | | | $ | 160,013 | | | |
| Tier 1 capital | 160,013 | | | | | 160,013 | | | |
Total capital (4) | 176,754 | | | | | 166,426 | | | |
| Risk-weighted assets (in billions) | 1,212 | | | | | 1,019 | | | |
| Common equity tier 1 capital ratio | 13.2 | % | | | | 15.7 | % | | 7.0 | % |
| Tier 1 capital ratio | 13.2 | | | | | 15.7 | | | 8.5 | |
| Total capital ratio | 14.6 | | | | | 16.3 | | | 10.5 | |
| | | | | | | |
| Leverage-based metrics: | | | | | | | |
Adjusted quarterly average assets (in billions) (5) | $ | 2,091 | | | | | $ | 2,091 | | | |
| Tier 1 leverage ratio | 7.7 | % | | | | 7.7 | % | | 5.0 | |
| | | | | | | |
| Supplementary leverage exposure (in billions) | | | | | $ | 2,465 | | | |
| Supplementary leverage ratio | | | | | 6.5 | % | | 6.0 | |
|
| | | | | | | |
|
| December 31, 2019 |
| Risk-based capital metrics: | | | | | | | |
| Common equity tier 1 capital | $ | 154,626 | | | | | $ | 154,626 | | | |
| Tier 1 capital | 154,626 | | | | | 154,626 | | | |
Total capital (4) | 166,567 | | | | | 158,665 | | | |
| Risk-weighted assets (in billions) | 1,241 | | | | | 991 | | | |
| Common equity tier 1 capital ratio | 12.5 | % | | | | 15.6 | % | | 7.0 | % |
| Tier 1 capital ratio | 12.5 | | | | | 15.6 | | | 8.5 | |
| Total capital ratio | 13.4 | | | | | 16.0 | | | 10.5 | |
| | | | | | | |
| Leverage-based metrics: | | | | | | | |
Adjusted quarterly average assets (in billions) (5) | $ | 1,780 | | | | | $ | 1,780 | | | |
| Tier 1 leverage ratio | 8.7 | % | | | | 8.7 | % | | 5.0 | |
| | | | | | | |
| Supplementary leverage exposure (in billions) | | | | | $ | 2,177 | | | |
| Supplementary leverage ratio | | | | | 7.1 | % | | 6.0 | |
(1)As of September 30, 2020, capital ratios are calculated using the regulatory capital rule that allows a five-year transition period related to the adoption of CECL.
(2)Derivative exposure amounts are calculated using the standardized approach for measuring counterparty credit risk at September 30, 2020 and the current exposure method at December 31, 2019.
(3)Risk-based capital regulatory minimums at September 30, 2020 and December 31, 2019 are the minimum ratios under Basel 3 including a capital conservation buffer of 2.5 percent. The regulatory minimums for the leverage ratios as of both period ends are the percent required to be considered well capitalized under the PCA framework.
(4)Total capital under the Advanced approaches differs from the Standardized approach due to differences in the amount permitted in Tier 2 capital related to the qualifying allowance for credit losses.
(5)Reflects total average assets adjusted for certain Tier 1 capital deductions.
Total Loss-Absorbing Capacity Requirements
Total loss-absorbing capacity (TLAC) consists of the Corporation’s Tier 1 capital and eligible long-term debt issued directly by the Corporation. Eligible long-term debt for TLAC ratios is comprised of unsecured debt that has a remaining maturity of at least one year and satisfies additional requirements as prescribed in the TLAC final rule. As with the
|
| | | | | | | | | | | | | | | | | | | | |
| | | | | | | | | | | | | |
| Table 15 | Bank of America, N.A. Regulatory Capital under Basel 3 | | |
| | | | | | | | | | | | | |
| | | September 30, 2017 |
| | | Standardized Approach | | Advanced Approaches |
| (Dollars in millions) | Ratio | | Amount | | Minimum
Required (1) | | Ratio | | Amount | | Minimum
Required (1) |
| Common equity tier 1 capital | 12.8 | % | | $ | 151,761 |
| | 6.5 | % | | 14.8 | % | | $ | 151,761 |
| | 6.5 | % |
| Tier 1 capital | 12.8 |
| | 151,761 |
| | 8.0 |
| | 14.8 |
| | 151,761 |
| | 8.0 |
|
| Total capital | 13.9 |
| | 164,735 |
| | 10.0 |
| | 15.2 |
| | 156,071 |
| | 10.0 |
|
| Tier 1 leverage | 9.2 |
| | 151,761 |
| | 5.0 |
| | 9.2 |
| | 151,761 |
| | 5.0 |
|
| | | | | | | | | | | | | |
| | | December 31, 2016 |
| Common equity tier 1 capital | 12.7 | % | | $ | 149,755 |
| | 6.5 | % | | 14.3 | % | | $ | 149,755 |
| | 6.5 | % |
| Tier 1 capital | 12.7 |
| | 149,755 |
| | 8.0 |
| | 14.3 |
| | 149,755 |
| | 8.0 |
|
| Total capital | 13.9 |
| | 163,471 |
| | 10.0 |
| | 14.8 |
| | 154,697 |
| | 10.0 |
|
| Tier 1 leverage | 9.3 |
| | 149,755 |
| | 5.0 |
| | 9.3 |
| | 149,755 |
| | 5.0 |
|
| |
(1)risk-based capital ratios and SLR, the Corporation is required to maintain TLAC ratios in excess of minimum requirements plus applicable buffers to avoid restrictions on capital distributions and discretionary bonus payments. Table 12 presents the Corporation's TLAC and long-term debt ratios and related information as of September 30, 2020 and December 31, 2019. | Percent required to meet guidelines to be considered “well capitalized” under the PCA framework. |
| | | | | | | | | | | | | | | | | | | | | | | | | | | | |
| | | | | | | | | | |
| Table 12 | Bank of America Corporation Total Loss-Absorbing Capacity and Long-Term Debt |
| | | | | | | | | | |
|
TLAC (1) | | Regulatory Minimum (2) | | | | Long-term
Debt | | Regulatory Minimum (3) |
| (Dollars in millions) | September 30, 2020 |
| Total eligible balance | $ | 392,767 | | | | | | | $ | 188,022 | | | |
Percentage of risk-weighted assets (4) | 26.9 | % | | 22.0 | % | | | | 12.9 | % | | 8.5 | % |
Percentage of supplementary leverage exposure (5, 6) | 13.7 | | | 9.5 | | | | | 6.6 | | | 4.5 | |
| | | | | | | | | |
| December 31, 2019 |
| Total eligible balance | $ | 367,449 | | | | | | | $ | 171,349 | | | |
Percentage of risk-weighted assets (4) | 24.6 | % | | 22.0 | % | | | | 11.5 | % | | 8.5 | % |
Percentage of supplementary leverage exposure (6) | 12.5 | | | 9.5 | | | | | 5.8 | | | 4.5 | |
(1)As of September 30, 2020, TLAC ratios are calculated using the regulatory capital rule that allows a five-year transition period related to the adoption of CECL.
(2)The TLAC RWA regulatory minimum consists of 18.0 percent plus a TLAC RWA buffer comprised of 2.5 percent plus the method 1 G-SIB surcharge of 1.5 percent. The countercyclical buffer is zero for both periods. The TLAC supplementary leverage exposure regulatory minimum consists of 7.5 percent plus a 2.0 percent TLAC leverage buffer. The TLAC RWA and leverage buffers must be comprised solely of CET1 capital and Tier 1 capital, respectively.
(3)The long-term debt RWA regulatory minimum is comprised of 6.0 percent plus an additional 2.5 percent requirement based on the Corporation’s method 2 G-SIB surcharge. The long-term debt leverage exposure regulatory minimum is 4.5 percent.
(4)The approach that yields the higher RWA is used to calculate TLAC and long-term debt ratios, which was the Standardized approach as of September 30, 2020 and December 31, 2019.
(5)Supplementary leverage exposure at September 30, 2020 reflects the temporary exclusion of U.S. Treasury Securities and deposits at Federal Reserve Banks.
(6)Derivative exposure amounts are calculated using the standardized approach for measuring counterparty credit risk at September 30, 2020 and the current exposure method at December 31, 2019.
Regulatory Developments
Minimum Total Loss-Absorbing Capacity
The Federal Reserve has established a final rule effective January 1, 2019, which includes minimum external total loss-absorbing capacity (TLAC) requirements to improvefollowing supplements the resolvability and resiliency of large, interconnected BHCs. We estimate our minimum required external TLAC would be the greater of 22.5 percent of risk-weighted assets or 9.5 percent of SLR leverage exposure. In addition, U.S. G-SIBs must meet a minimum long-term debt requirement. Our minimum required long-term debt is estimated to be the greater of 8.5 percent of risk-weighted assets or 4.5 percent of SLR leverage exposure. As of September 30, 2017, the Corporation's TLAC and long-term debt exceeded our estimated 2019 minimum requirements.
Revisions to Approaches for Measuring Risk-weighted Assets
The Basel Committee has several open proposals to revise key methodologies for measuring risk-weighted assets. The proposals include a standardized approach for credit risk, standardized approach for operational risk, revisions to the credit valuation adjustment (CVA) risk framework and constraints on the use of internal models. The Basel Committee has also finalized a revised standardized model for counterparty credit risk, revisions to the securitization framework and its fundamental review of the trading book, which updates both modeled and standardized approaches for market risk measurement. These revisions are to be coupled with a proposed capital floor framework to limit the extent to which banks can reduce risk-weighted asset levels through the use of internal models, both at the input parameter and aggregate risk-weighted asset level. After the outstanding proposals are finalized by the Basel Committee, U.S. banking regulators may update the U.S. Basel 3 rules to incorporate the Basel Committee revisions.
Revisions to the G-SIB Assessment Framework
On March 30, 2017, the Basel Committee issued a consultative document with proposed revisions to the G-SIB surcharge assessment framework. The proposed revisions would include removing the cap on the substitutability category, expanding the scope of consolidation to include insurance subsidiariesdisclosure in three categories (size, interconnectedness and complexity) and modifying the substitutability category weights with the
introduction of a new trading volume indicator. The Basel Committee has also requested feedback on a new short-term wholesale funding indicator, which would be included in the interconnectedness category. The U.S. banking regulators may update the U.S. G-SIB surcharge rule to incorporate the Basel Committee revisions.
For more information on our Regulatory Developments, see Capital Management – Regulatory Developments in the MD&A of the Corporation's 2016Corporation’s 2019 Annual Report on Form 10-K.10-K and in the Corporation's Quarterly Report on Form 10-Q for the quarter ended June 30, 2020.
Broker-dealer Deduction of Unsecured Debt of G-SIBs
On October 20, 2020, the Federal Reserve, Federal Deposit Insurance Corporation and the Office of the Comptroller of the Currency (U.S. Agencies) finalized a rule requiring Advanced approaches institutions to deduct from regulatory capital certain investments in TLAC-eligible long-term debt and other pari passu or subordinated debt instruments issued by G-SIBs above a specified threshold. The final rule is intended to limit the interconnectedness between G-SIBs and is complementary to existing regulatory capital requirements that generally require banks to deduct investments in the regulatory capital of financial institutions. The final rule is effective April 1, 2021. The impact to the Corporation is not expected to be significant.
Regulatory Capital and Securities Regulation
The Corporation’s principal U.S. broker-dealer subsidiaries are BofA Securities, Inc. (BofAS), Merrill Lynch Professional Clearing Corp. (MLPCC) and Merrill Lynch, Pierce, Fenner & Smith Incorporated (MLPF&S) and. The Corporation's principal European broker-dealer subsidiaries are Merrill Lynch Professional Clearing Corp (MLPCC). MLPCC is a fully-guaranteed subsidiary of MLPF&SInternational (MLI) and provides clearing and settlement services. Both entitiesBofA Securities Europe SA (BofASE).
The U.S. broker-dealer subsidiaries are subject to the net capital requirements of SecuritiesRule 15c3-1 under the Exchange Act. BofAS computes its minimum capital requirements as an alternative net capital broker-dealer under Rule 15c3-1e, and Exchange Commission (SEC)MLPCC and MLPF&S compute their minimum capital requirements in accordance with the alternative standard under Rule 15c3-1. Both entitiesBofAS and MLPCC are also registered as futures commission merchants and are subject to the Commodity Futures Trading Commission (CFTC) Regulation 1.17. The U.S. broker-dealer subsidiaries are also registered with the Financial Industry Regulatory Authority, Inc. (FINRA). Pursuant to FINRA Rule 4110, FINRA may impose higher net capital requirements than Rule 15c3-1 under the Exchange Act with respect to each of the broker-dealers.
MLPF&S has elected to compute the minimum capital requirementBofAS provides institutional services, and in accordance with the Alternative Net Capital Requirement as permitted by SEC Rule 15c3-1. At September 30, 2017, MLPF&S’s regulatoryalternative net capital as defined by Rule 15c3-1 was $12.9 billion and exceeded the minimum requirement of $1.7 billion by $11.2 billion. MLPCC’s net capital of $3.4 billion exceeded the minimum requirement of $600 million by $2.8 billion.
In accordance with the Alternative Net Capital Requirements, MLPF&Srequirements, is required to maintain tentative net capital in excess of $1.0 billion and net capital in excess of the greater of $500 million andor a certain percentage of
its reserve requirement. BofAS must also notify the SECSecurities and Exchange Commission (SEC) in the event its tentative net capital is less than $5.0 billion. BofAS is also required to hold a certain percentage of its customers' and affiliates' risk-based margin in order to meet its CFTC minimum net capital requirement. At September 30, 2017, MLPF&S2020, BofAS had tentative net capital andof $20.3 billion. BofAS also had regulatory net capital in excess of $17.9 billion, which exceeded the minimum requirement of $3.0 billion.
MLPCC is a fully-guaranteed subsidiary of BofAS and notification requirements.provides clearing and settlement services as well as prime brokerage and arranged financing services for institutional clients. At September 30, 2020, MLPCC’s regulatory net capital of $7.2 billion exceeded the minimum requirement of $1.2 billion.
Merrill Lynch International (MLI),MLPF&S provides retail services. At September 30, 2020, MLPF&S' regulatory net capital was $3.4 billion, which exceeded the minimum requirement of $147 million.
Our European broker-dealers are regulated by non-U.S. regulators. MLI, a U.K. investment firm, is regulated by the Prudential Regulation Authority and the Financial Conduct Authority and is subject to certain regulatory capital requirements. At September 30, 2017,2020, MLI’s capital resources were $35.3$35.1 billion, which exceeded the minimum Pillar 1 requirement of $15.9$13.8 billion.
Common and Preferred Stock Dividends
Table 16 is a summary of our cash dividend declarations on preferred stock during the third quarter of 2017 and through October 30, 2017. During the third quarter of 2017, we recognized $465 million of cash dividends on preferred stock. For more information on preferred stock and a summary of our declared quarterly cash dividends on common stock, see Note 11 – Shareholders’ Equity to the Consolidated Financial Statements.
|
| | | | | | | | | | | | | | | | | | | |
| | | | | | | | | | | | | | | |
| Table 16 | Preferred Stock Cash Dividend Summary |
| | | | | | | | | | | | | | |
| | September 30, 2017 | | | | | | | | | | |
| Preferred Stock | | Outstanding
Notional
Amount (in millions) | | | Declaration Date | | Record Date | | Payment Date | | Per Annum Dividend Rate | | Dividend Per Share |
Series B (1) | | $ | 1 |
| | | October 25, 2017 | | January 11, 2018 | | January 25, 2018 | | 7.00 | % | | $ | 1.75 |
|
| | | | | | July 26, 2017 | | October 11, 2017 | | October 25, 2017 | | 7.00 |
| | 1.75 |
|
Series D (2) | | $ | 654 |
| | | October 9, 2017 | | November 30, 2017 | | December 14, 2017 | | 6.204 | % | | $ | 0.38775 |
|
| | | | | | July 5, 2017 | | August 31, 2017 | | September 14, 2017 | | 6.204 |
| | 0.38775 |
|
Series E (2) | | $ | 317 |
| | | October 9, 2017 | | October 31, 2017 | | November 15, 2017 | | Floating |
| | $ | 0.25556 |
|
| | | | | | July 5, 2017 | | July 31, 2017 | | August 15, 2017 | | Floating |
| | 0.25556 |
|
| Series F | | $ | 141 |
| | | October 9, 2017 | | November 30, 2017 | | December 15, 2017 | | Floating |
| | $ | 1,011.11111 |
|
| | | | | | July 5, 2017 | | August 31, 2017 | | September 15, 2017 | | Floating |
| | 1,022.22222 |
|
| Series G | | $ | 493 |
| | | October 9, 2017 | | November 30, 2017 | | December 15, 2017 | | Adjustable |
| | $ | 1,011.11111 |
|
| | | | | | July 5, 2017 | | August 31, 2017 | | September 15, 2017 | | Adjustable |
| | 1,022.22222 |
|
Series I (2) | | $ | 365 |
| | | October 9, 2017 | | December 15, 2017 | | January 2, 2018 | | 6.625 | % | | $ | 0.4140625 |
|
| | | | | | July 5, 2017 | | September 15, 2017 | | October 2, 2017 | | 6.625 |
| | 0.4140625 |
|
Series K (3, 4) | | $ | 1,544 |
| | | July 5, 2017 | | July 15, 2017 | | July 31, 2017 | | Fixed-to-floating |
| | $ | 40.00 |
|
| Series L | | $ | 3,080 |
| | | September 18, 2017 | | October 1, 2017 | | October 30, 2017 | | 7.25 | % | | $ | 18.125 |
|
Series M (3, 4) | | $ | 1,310 |
| | | October 9, 2017 | | October 31, 2017 | | November 15, 2017 | | Fixed-to-floating |
| | $ | 40.625 |
|
Series T (5) | | $ | 35 |
| | | July 26, 2017 | | September 25, 2017 | | October 10, 2017 | | 6.00 | % | | $ | 1,500.00 |
|
| | | | | | October 25, 2017 | | December 26, 2017 | | January 10, 2018 | | 6.00 |
| | 1,500.00 |
|
Series U (3, 4) | | $ | 1,000 |
| | | October 9, 2017 | | November 15, 2017 | | December 1, 2017 | | Fixed-to-floating |
| | $ | 26.00 |
|
Series V (3, 4) | | $ | 1,500 |
| | | October 9, 2017 | | December 1, 2017 | | December 18, 2017 | | Fixed-to-floating |
| | $ | 25.625 |
|
Series W (2) | | $ | 1,100 |
| | | October 9, 2017 | | November 15, 2017 | | December 11, 2017 | | 6.625 | % | | $ | 0.4140625 |
|
| | | | | | July 5, 2017 | | August 15, 2017 | | September 11, 2017 | | 6.625 |
| | 0.4140625 |
|
Series X (3, 4) | | $ | 2,000 |
| | | July 5, 2017 | | August 15, 2017 | | September 5, 2017 | | Fixed-to-floating |
| | $ | 31.25 |
|
Series Y (2) | | $ | 1,100 |
| | | September 18, 2017 | | October 1, 2017 | | October 27, 2017 | | 6.50 | % | | $ | 0.40625 |
|
Series Z (3,4) | | $ | 1,400 |
| | | September 18, 2017 | | October 1, 2017 | | October 23, 2017 | | FIxed-to-floating |
| | $ | 32.50 |
|
Series AA (3, 4) | | $ | 1,900 |
| | | July 5, 2017 | | September 1, 2017 | | September 18, 2017 | | Fixed-to-floating |
| | $ | 30.50 |
|
Series CC (2) | | $ | 1,100 |
| | | September 18, 2017 | | October 1, 2017 | | October 30, 2017 | | 6.20 | % | | $ | 0.3875 |
|
Series DD (3,4) | | $ | 1,000 |
| | | July 5, 2017 | | August 15, 2017 | | September 11, 2017 | | Fixed-to-floating |
| | $ | 31.50 |
|
Series EE (2) | | $ | 900 |
| | | September 18, 2017 | | October 1, 2017 | | October 25, 2017 | | 6.00 | % | | $ | 0.375 |
|
Series 1 (6) | | $ | 98 |
| | | October 9, 2017 | | November 15, 2017 | | November 28, 2017 | | Floating |
| | $ | 0.18750 |
|
| | | | | | July 5, 2017 | | August 15, 2017 | | August 29, 2017 | | Floating |
| | 0.18750 |
|
Series 2 (6) | | $ | 299 |
| | | October 9, 2017 | | November 15, 2017 | | November 28, 2017 | | Floating |
| | $ | 0.19167 |
|
| | | | | | July 5, 2017 | | August 15, 2017 | | August 29, 2017 | | Floating |
| | 0.19167 |
|
Series 3 (6) | | $ | 653 |
| | | October 9, 2017 | | November 15, 2017 | | November 28, 2017 | | 6.375 | % | | $ | 0.3984375 |
|
| | | | | | July 5, 2017 | | August 15, 2017 | | August 28, 2017 | | 6.375 |
| | 0.3984375 |
|
Series 4 (6) | | $ | 210 |
| | | October 9, 2017 | | November 15, 2017 | | November 28, 2017 | | Floating |
| | $ | 0.25556 |
|
| | | | | | July 5, 2017 | | August 15, 2017 | | August 29, 2017 | | Floating |
| | 0.25556 |
|
Series 5 (6) | | $ | 422 |
| | | October 9, 2017 | | November 1, 2017 | | November 21, 2017 | | Floating |
| | $ | 0.25556 |
|
| | | | | | July 5, 2017 | | August 1, 2017 | | August 21, 2017 | | Floating |
| | 0.25556 |
|
| |
(1)
| Dividends are cumulative. |
| |
(2)
| Dividends per depositary share, each representing a 1/1,000th interest in a share of preferred stock.
|
| |
(3)
| Initially pays dividends semi-annually. |
| |
(4)
| Dividends per depositary share, each representing a 1/25th interest in a share of preferred stock.
|
| |
(5)
| The Series T outstanding notional amount represents Series T shares that were not surrendered in the exercise of the warrants. For additional information, see Recent Events on page 3. |
| |
(6)
| Dividends per depositary share, each representing a 1/1,200th interest in a share of preferred stock.
|
Liquidity Risk
Funding and Liquidity Risk Management
Our primary liquidity risk management objective is to meet expected or unexpected cash flow and collateral needs while continuing to support our businesses and customers under a range of economic conditions. To achieve that objective, we analyze and monitor our liquidity risk under expected and stressed conditions, maintain liquidity and access to diverse funding sources, including our stable deposit base, and seek to align liquidity-related incentives and risks. These liquidity risk management practices have allowed us to effectively manage the market stress that began in the first quarter of 2020 from the COVID-19 pandemic. For more information on the effects of
the pandemic, see Executive Summary - Recent Developments – COVID-19 Pandemic on page 3.
We define liquidity as readily available assets, limited to cash and high-quality, liquid, unencumbered securities that we can use to meet our contractual and contingent financial obligations as those obligations arise. We manage our liquidity position through line of businessline-of-business and ALM activities, as well as through our legal entity funding strategy, on both a forward and current (including intraday) basis under both expected and stressed conditions. We believe that a centralized approach to funding and liquidity management enhances our ability to monitor liquidity requirements, maximizes access to funding sources, minimizes borrowing costs and facilitates timely responses to liquidity events. For more information regarding global funding and liquidity risk management, as well as liquidity sources, liquidity arrangements, contingency planning and credit ratings discussed below, see Liquidity Risk – Time-to-required Funding and Liquidity Stress Analysis in the MD&A of the Corporation's 2016Corporation’s 2019 Annual Report on Form 10-K.
NB Holdings Corporation
In 2016, we entered intoWe have intercompany arrangements with certain key subsidiaries under which we transferred certain assets of ourBank of America Corporation, as the parent company, assets,which is a separate and distinct legal entity from our banking and nonbank subsidiaries, and agreed to transfer certain additional parent company assets not needed to satisfy anticipated near-termnear term expenditures, to NB Holdings Corporation, a wholly-owned holding company subsidiary (NB Holdings). The parent company is expected to continue to have access to the same flow of dividends, interest and other amounts of cash necessary to service its debt, pay dividends and perform other obligations as it would have had if it had not entered into these arrangements and transferred any assets.
In consideration for the transfer of assets, NB Holdings issued a subordinated note to the parent company in a principal amount equal to the value of the transferred assets. The aggregate principal amount of the note will increase by the amount of any future asset transfers. NB Holdings also provided the parent company with a committed line of credit that allows the parent company to draw funds necessary to service near-term cash needs. These arrangements support our preferred single point of entry resolution strategy, under which only the parent company would be resolved under the U.S. Bankruptcy Code. These arrangements include provisions to terminate the line of credit, forgive the subordinated note and require the parent company to transfer its remaining financial assets to NB Holdings if our projected liquidity resources deteriorate so severely that resolution of the parent company becomes imminent.
Global Liquidity Sources and Other Unencumbered Assets
Table 13 presents average Global Liquidity Sources (GLS) for the three months ended September 30, 2020 and December 31, 2019.
| | | | | | | | | | | | | | |
| | | | |
| Table 13 | Average Global Liquidity Sources |
| | | | |
| | Three Months Ended |
| (Dollars in billions) | September 30
2020 | | December 31
2019 |
| Bank entities | $ | 690 | | | $ | 454 | |
Nonbank and other entities (1) | 169 | | | 122 | |
| Total Average Global Liquidity Sources | $ | 859 | | | $ | 576 | |
(1) Nonbank includes Parent, NB Holdings and other regulated entities.
We maintain liquidity available to the Corporation, including the parent company and selected subsidiaries, in the form of cash and high-quality, liquid, unencumbered securities. Our liquidity buffer, referred to as Global Liquidity Sources (GLS), is comprised of assets that are readily available to the parent company and selected subsidiaries, including holding company, bank and broker-
dealer subsidiaries, even during stressed market conditions. Our cash is primarily on deposit with the Federal Reserve and, to a lesser extent, central banks outside of the U.S. We limit the composition of high-quality, liquid, unencumbered securities to U.S. government securities, U.S. agency securities, U.S. agency MBS and a select group of non-U.S. government securities. We can quickly obtain cash for these securities, even in stressed conditions, through repurchase agreements or outright sales. We hold our GLS in legal entities that allow us to meet the liquidity requirements of our global businesses, and we consider the impact of potential regulatory, tax, legal and other restrictions that could limit the transferability of funds among entities.
For the three months ended September 30, 2017 and December 31, 2016, our average GLS were $517 billion and $515 billion, and were as shown in Table 17.
|
| | | | | | | | |
| | | | | |
| Table 17 | Average Global Liquidity Sources |
| | | | | |
| | | Three Months Ended |
| (Dollars in billions) | September 30
2017 | | December 31
2016 |
| Parent company and NB Holdings | $ | 85 |
| | $ | 77 |
|
| Bank subsidiaries | 381 |
| | 389 |
|
| Other regulated entities | 51 |
| | 49 |
|
| Total Average Global Liquidity Sources | $ | 517 |
| | $ | 515 |
|
Parent company and NB Holdings average liquidity was $85 billion and $77 billion for the three months ended September 30, 2017 and December 31, 2016. The increase in parent company and NB Holdings liquidity was primarily due to debt issuances outpacing maturities. Typically, parent company and NB Holdings liquidity is in the form of cash deposited with BANA.
Average liquidity held at our bank subsidiaries was $381 billion and $389 billion for the three months ended September 30, 2017 and December 31, 2016. Our bank subsidiaries'subsidiaries’ liquidity is primarily driven by deposit and lending activity, as well as securities valuation and net debt activity. Liquidity at bank subsidiaries excludes the cash deposited by the parent company and NB Holdings. Our bank subsidiaries can also generate incremental liquidity by pledging a range of unencumbered loans and securities to certain Federal Home Loan Banks (FHLBs) and the Federal Reserve
Discount Window. The cash we could have obtained by borrowing against this pool of specifically-identified eligible assets was $304$320 billion and $310$372 billion at September 30, 20172020 and December 31, 2016, with the decrease due to FHLB borrowings, which reduced available borrowing capacity, and adjustments to our valuation model.2019. We have established operational procedures to enable us to borrow against these assets, including regularly monitoring our total pool of eligible loans and securities collateral. Eligibility is defined in guidelines from the FHLBs and the Federal Reserve and is subject to change at their discretion. Due to regulatory restrictions, liquidity generated by the bank subsidiaries can generally be used only to fund obligations within the bank subsidiaries, and transfers to the parent company or nonbank subsidiaries may be subject to prior regulatory approval.
Average liquidityLiquidity held at ourin other regulated entities, comprised primarily of broker-dealer subsidiaries, was $51 billion and $49 billion for the three months ended September 30, 2017 and December 31, 2016. Our other regulated entities also held unencumbered investment-grade securities and equities that we believe could be used to generate additional liquidity. Liquidity held in an other regulated entity is primarily available to meet the
obligations of that entity, and transfers to the parent company or to any other subsidiary may be subject to prior regulatory approval due to regulatory restrictions and minimum requirements. Our other regulated entities also hold unencumbered investment-grade securities and equities that we believe could be used to generate additional liquidity.
Table 1814 presents the composition of average GLS atfor the three months ended September 30, 20172020 and December 31, 2016.2019.
| | | | | | | | |
| Table 18 | Average Global Liquidity Sources Composition | |
| Table 14 | | Table 14 | Average Global Liquidity Sources Composition |
| | | | | |
| | | Three Months Ended | | Three Months Ended |
| (Dollars in billions) | (Dollars in billions) | September 30
2017 | | December 31
2016 | (Dollars in billions) | September 30
2020 | | December 31
2019 |
| Cash on deposit | Cash on deposit | $ | 117 |
| | $ | 118 |
| Cash on deposit | $ | 244 | | | $ | 103 | |
| U.S. Treasury securities | U.S. Treasury securities | 62 |
| | 58 |
| U.S. Treasury securities | 166 | | | 98 | |
| U.S. agency securities and mortgage-backed securities | 324 |
| | 322 |
| |
| U.S. agency securities, mortgage-backed securities, and other investment-grade securities | | U.S. agency securities, mortgage-backed securities, and other investment-grade securities | 426 | | | 358 | |
| Non-U.S. government securities | Non-U.S. government securities | 14 |
| | 17 |
| Non-U.S. government securities | 23 | | | 17 | |
| Total Average Global Liquidity Sources | Total Average Global Liquidity Sources | $ | 517 |
| | $ | 515 |
| Total Average Global Liquidity Sources | $ | 859 | | | $ | 576 | |
Our GLS are substantially the same in composition to what qualifies as High Quality Liquid Assets (HQLA) under the final U.S. Liquidity Coverage Ratio (LCR) rules. However, HQLA for purposes of calculating LCR is not reported at market value, but at a lower value that incorporates regulatory deductions and the exclusion of excess liquidity held at certain subsidiaries. The LCR is calculated as the amount of a financial institution’s unencumbered HQLA relative to the estimated net cash outflows the institution could encounter over a 30-day period of significant liquidity stress, expressed as a percentage. For the three months ended September 30, 2017, ourOur average consolidated HQLA, on a net basis, was $439$562 billion and $464 billion for the three months ended September 30, 2020 and December 31, 2019. For the same periods, the average consolidated Corporation's average LCR was 126122 percent and 116 percent. Our LCR will fluctuatefluctuates due to normal business flows from customer activity.
Time-to-required Funding and Liquidity Stress Analysis
We use a variety of metrics to determine the appropriate amounts of liquidity to maintain at the parent company and our subsidiaries. One metric we use to evaluate the appropriate level of liquidity at the parent company and NB Holdings is “time-to-required funding (TTF).” This debt coverage measure indicates the number of months the parent company can continue to meet its unsecured contractual obligations as they come due using only the parent company and NB Holdings' liquidity sources without issuing any new debt or accessing any additional liquidity sources. We define unsecured contractual obligations for purposes of this metric as maturities of senior or subordinated debt issued or guaranteed by Bank of America Corporation. These include certain unsecured debt instruments, primarily structured liabilities, which we may be required to settle for cash prior to maturity. TTF was 52 months at September 30, 2017 compared to 35 months at December 31, 2016. The increase in TTF was driven by debt issuances outpacing maturities.
We also utilize liquidity stress analysis to assist us in determining the appropriate amounts of liquidity to maintain at the parent company and our subsidiaries. The liquidity stress testing process is an integral part of analyzing our potential contractual and contingent cash outflows. We evaluate the liquidity requirements under a range of scenarios with varying levels of severity and time horizons. The scenarios we consider and utilize incorporate market-wide and Corporation-specific events, including potential credit rating downgrades for the parent company and our subsidiaries and more severe events including potential resolution scenarios. The scenarios are based on our historical experience, experience of distressed and failed financial
institutions, regulatory guidance, and both expected and unexpected future events.
The types of potentialto meet contractual and contingent cash outflows we considerunder a range of scenarios. For more information on our liquidity stress analysis, see Liquidity Risk – Liquidity Stress Analysis in our scenarios may include, but are not limited to, upcoming contractual maturitiesthe MD&A of unsecured debt and reductions in new debt issuance; diminished access to secured financing markets; potential deposit withdrawals; increased drawsthe Corporation’s 2019 Annual Report on loan commitments, liquidity facilities and letters of credit; additional collateral that counterparties could call if our credit ratings were downgraded; collateral and margin requirements arising from market value changes; and potential liquidity required to maintain businesses and finance customer activities. Changes in certain market factors, including, but not limited to, credit rating downgrades, could negatively impact potential contractual and contingent outflows and the related financial instruments, and in some cases these impacts could be material to our financial results.Form 10-K.
We consider all sources of funds that we could access during each stress scenario and focus particularly on matching available sources with corresponding liquidity requirements by legal entity. We also use the stress modeling results to manage our asset and liability profile and establish limits and guidelines on certain funding sources and businesses.
Net Stable Funding Ratio Final Rule
On October 20, 2020, the U.S. banking regulators have issued a proposal for aAgencies finalized the Net Stable Funding Ratio, (NSFR) requirement applicablea rule requiring large banks to U.S. financial institutions followingmaintain a minimum level of stable funding over a one-year period. The final rule is intended to support the Basel Committee'sability of banks to lend to households and businesses in both normal and adverse economic conditions and is complementary to the LCR rule, which focuses on short-term liquidity risks. The final standard.rule is effective July 1, 2021. The U.S. NSFR would applyimpact to the Corporation on a consolidated basis andis not expected to our insured depository institutions beginning on January 1, 2018, if finalized as proposed. We expect to meet the NSFR requirement within the regulatory timeline. The standard is intended to reduce funding risk over a longer time horizon. The NSFR is designed to ensure an appropriate amount of stable funding, generally capital and liabilities maturing beyond one year, given the mix of assets and off-balance sheet items.be significant.
Diversified Funding Sources
We fund our assets primarily with a mix of deposits, and secured and unsecured liabilities through a centralized, globally coordinated funding approach diversified across products, programs, markets, currencies and investor groups.
The primary benefits of our centralized funding approach include greater control, reduced funding costs, wider name recognition by investors and greater flexibility to meet the variable funding requirements of subsidiaries. Where regulations, time zone differences or other business considerations make parent company funding impractical, certain other subsidiaries may issue their own debt.
We fund a substantial portion of our lending activities through our deposits, which were $1.28$1.70 trillion and $1.26$1.43 trillion at September 30, 20172020 and December 31, 2016. Deposits are primarily generated by our Consumer Banking, GWIM and Global Banking segments. These deposits are diversified by clients, product type and geography, and the majority of our U.S. deposits are insured by the FDIC. We consider a substantial portion of our deposits to be a stable, low-cost and consistent source of funding. We believe this deposit funding is generally less sensitive to interest rate changes, market volatility or changes in our credit ratings than wholesale funding sources. Our lending activities may also be financed through secured borrowings, including credit card securitizations and securitizations with government-sponsored
2019.
enterprises, the Federal Housing Administration (FHA) and private-label investors, as well as FHLB loans.
Our trading activities in other regulated entities are primarily funded on a secured basis through securities lending and repurchase agreements, and these amounts will vary based on customer activity and market conditions. We believe funding these activities in the secured financing markets is more cost-efficient and less sensitive to changes in our credit ratings than unsecured financing. Repurchase agreements are generally short-term and often overnight. Disruptions in secured financing markets for financial institutions have occurred in prior market cycles which resulted in adverse changes in terms or significant reductions in the availability of such financing. We manage the liquidity risks arising from secured funding by sourcing funding globally from a diverse group of counterparties, providing a range of securities collateral and pursuing longer durations, when appropriate. For more information on secured financing agreements, see Note 9 – Federal Funds Sold or Purchased, Securities Financing Agreements and Short-term Borrowingsto the Consolidated Financial Statements.
We issue long-term unsecured debt in a variety of maturities and currencies to achieve cost-efficient funding and to maintain an appropriate maturity profile. While the cost and availability of unsecured funding may be negatively impacted by general market conditions or by matters specific to the financial services industry or the Corporation, we seek to mitigate refinancing risk by actively managing the amount of our borrowings that we anticipate will mature within any month or quarter.Long-term Debt
During the three and nine months ended September 30, 2017,2020, we issued $17.1 billion and $50.5$40.7 billion of long-term debt consisting of $14.0$32.9 billion and $37.5 billion forof notes issued by Bank of America Corporation, substantially all of which was TLAC compliant, $2.1$1.9 billion of notes issued by Bank of America, N.A. and $7.2$5.9 billion of other debt.
During the nine months ended September 30, 2020, we had total long-term debt maturities and redemptions in the aggregate of $36.4 billion consisting of $16.4 billion for Bank of America Corporation, $10.1 billion for Bank of America, N.A. and $974 million and $5.8$9.9 billion of other debt.
Table 1915 presents the carrying value of aggregate annual contractual maturities of long-term debt as ofat September 30, 2017. During2020.
| | | | | | | | | | | | | | | | | | | | | | | | | | | | | | | | | | | | | | | | | | | | |
| | | | | | | | | | | | | | |
| Table 15 | Long-term Debt by Maturity |
| | | | | | | | | | | | | | |
| (Dollars in millions) | Remainder of 2020 | | 2021 | | 2022 | | 2023 | | 2024 | | Thereafter | | Total |
| Bank of America Corporation | | | | | | | | | | | | | |
Senior notes (1) | $ | 2,352 | | | $ | 11,457 | | | $ | 15,109 | | | $ | 23,752 | | | $ | 18,777 | | | $ | 114,846 | | | $ | 186,293 | |
| Senior structured notes | 191 | | | 457 | | | 1,956 | | | 264 | | | 269 | | | 13,636 | | | 16,773 | |
| Subordinated notes | — | | | 352 | | | 375 | | | — | | | 3,368 | | | 20,191 | | | 24,286 | |
| Junior subordinated notes | — | | | — | | | — | | | — | | | — | | | 739 | | | 739 | |
| Total Bank of America Corporation | 2,543 | | | 12,266 | | | 17,440 | | | 24,016 | | | 22,414 | | | 149,412 | | | 228,091 | |
| Bank of America, N.A. | | | | | | | | | | | | | |
| Senior notes | 1,342 | | | 1,340 | | | — | | | 516 | | | — | | | 8 | | | 3,206 | |
| Subordinated notes | — | | | — | | | — | | | — | | | — | | | 1,937 | | | 1,937 | |
| Advances from Federal Home Loan Banks | 7 | | | 2 | | | 3 | | | 1 | | | — | | | 94 | | | 107 | |
Securitizations and other Bank VIEs (2) | — | | | 4,024 | | | 1,249 | | | — | | | — | | | 18 | | | 5,291 | |
| Other | 5 | | | 95 | | | — | | | 152 | | | 1 | | | 110 | | | 363 | |
| Total Bank of America, N.A. | 1,354 | | | 5,461 | | | 1,252 | | | 669 | | | 1 | | | 2,167 | | | 10,904 | |
| Other debt | | | | | | | | | | | | | |
| | | | | | | | | | | | | |
| Structured liabilities | 1,565 | | | 3,937 | | | 2,093 | | | 1,841 | | | 624 | | | 6,215 | | | 16,275 | |
| | | | | | | | | | | | | |
Nonbank VIEs (2) | — | | | 1 | | | — | | | — | | | — | | | 452 | | | 453 | |
| | | | | | | | | | | | | |
| Total other debt | 1,565 | | | 3,938 | | | 2,093 | | | 1,841 | | | 624 | | | 6,667 | | | 16,728 | |
| Total long-term debt | $ | 5,462 | | | $ | 21,665 | | | $ | 20,785 | | | $ | 26,526 | | | $ | 23,039 | | | $ | 158,246 | | | $ | 255,723 | |
(1) Total includes $139.8 billion of outstanding notes that are both TLAC eligible and callable one year before their stated maturities, including $2.8 billion during the remainder of 2020, and $11.8 billion, $15.2 billion, $12.0 billion and $11.6 billion during each year of 2021 through 2024, respectively, and $86.4 billion thereafter. The call features provide the flexibility to retire long-term notes before their final year outstanding, when they are no longer eligible to count toward TLAC requirements, and replace them with new TLAC-eligible debt, should we choose to do so.
(2) Represents liabilities of consolidated VIEs included in total long-term debt on the Consolidated Balance Sheet.
Total long-term debt increased $14.9 billion during the nine months ended September 30, 2017, we had total long-term debt maturities and purchases of $44.1 billion consisting of $24.7 billion for Bank of America Corporation, $13.3 billion for Bank of America, N.A. and $6.1 billion of other debt.
|
| | | | | | | | | | | | | | | | | | | | | | | | | | | | |
| | | | | | | | | | | | | | | |
| Table 19 | Long-term Debt by Maturity | | | | | | | | | | | | | |
| | | | | | | | | | | | | | | |
| (Dollars in millions) | Remainder of 2017 | | 2018 | | 2019 | | 2020 | | 2021 | | Thereafter | | Total |
| Bank of America Corporation | | | | | | | | | | | | | |
| Senior notes | $ | 3,576 |
| | $ | 19,634 |
| | $ | 18,257 |
| | $ | 12,389 |
| | $ | 17,975 |
| | $ | 72,582 |
| | $ | 144,413 |
|
| Senior structured notes | 518 |
| | 2,909 |
| | 1,470 |
| | 1,001 |
| | 426 |
| | 9,368 |
| | 15,692 |
|
| Subordinated notes | — |
| | 2,922 |
| | 1,537 |
| | — |
| | 372 |
| | 21,311 |
| | 26,142 |
|
| Junior subordinated notes | — |
| | — |
| | — |
| | — |
| | — |
| | 3,835 |
| | 3,835 |
|
| Total Bank of America Corporation | 4,094 |
| | 25,465 |
| | 21,264 |
| | 13,390 |
| | 18,773 |
| | 107,096 |
| | 190,082 |
|
| Bank of America, N.A. |
|
| | | | | | | | | | | | |
| Senior notes | — |
| | 5,784 |
| | — |
| | — |
| | — |
| | 21 |
| | 5,805 |
|
| Subordinated notes | — |
| | — |
| | 1 |
| | — |
| | — |
| | 1,691 |
| | 1,692 |
|
| Advances from Federal Home Loan Banks | 5 |
| | 2,009 |
| | 2,013 |
| | 11 |
| | 2 |
| | 113 |
| | 4,153 |
|
Securitizations and other Bank VIEs (1) | — |
| | 2,300 |
| | 3,201 |
| | 3,097 |
| | — |
| | 42 |
| | 8,640 |
|
| Other | 25 |
| | 82 |
| | 201 |
| | 19 |
| | — |
| | 194 |
| | 521 |
|
| Total Bank of America, N.A. | 30 |
| | 10,175 |
| | 5,416 |
| | 3,127 |
| | 2 |
| | 2,061 |
| | 20,811 |
|
| Other debt | | | | | | | | | | | | | |
| Structured liabilities | 129 |
| | 4,667 |
| | 2,001 |
| | 1,378 |
| | 790 |
| | 7,960 |
| | 16,925 |
|
Nonbank VIEs (1) | 12 |
| | 22 |
| | 50 |
| | — |
| | — |
| | 733 |
| | 817 |
|
| Other | — |
| | — |
| | — |
| | — |
| | — |
| | 31 |
| | 31 |
|
| Total other debt | 141 |
| | 4,689 |
| | 2,051 |
| | 1,378 |
| | 790 |
| | 8,724 |
| | 17,773 |
|
| Total long-term debt | $ | 4,265 |
| | $ | 40,329 |
| | $ | 28,731 |
| | $ | 17,895 |
| | $ | 19,565 |
| | $ | 117,881 |
| | $ | 228,666 |
|
| |
(1)
| Represents the total long-term debt included in the liabilities of consolidated variable interest entities (VIEs) on the Consolidated Balance Sheet. |
Table 20 presents our long-term debt by major currency at September 30, 2017 and December 31, 2016.
|
| | | | | | | | |
| | | | | |
| Table 20 | Long-term Debt by Major Currency |
| | | |
| | | September 30
2017 | | December 31
2016 |
| (Dollars in millions) | |
| U.S. dollar | $ | 177,505 |
| | $ | 172,082 |
|
| Euro | 34,813 |
| | 28,236 |
|
| British pound | 6,951 |
| | 6,588 |
|
| Australian dollar | 3,050 |
| | 2,900 |
|
| Japanese yen | 2,938 |
| | 3,919 |
|
| Canadian dollar | 1,958 |
| | 1,049 |
|
| Other | 1,451 |
| | 2,049 |
|
| Total long-term debt | $ | 228,666 |
| | $ | 216,823 |
|
Total long-term debt increased $11.8 billion, or five percent, in the nine months ended September 30, 2017,2020 primarily due to debt issuances outpacing maturities.and valuation adjustments, partially offset by maturities and redemptions. We may, from time to time, purchase outstanding debt instruments in various transactions, depending on prevailing market conditions, liquidity and other factors. In addition, ourOur other regulated entities may also make markets in our debt instruments to provide liquidity for investors. For information on funding and liquidity risk management, see Liquidity Risk – Time-to-required Funding and Liquidity Stress Analysisin the MD&A of the Corporation's 2016 Annual Report on Form 10-K and for information regarding long-term debt funding, see Note 11 – Long-term Debtto the Consolidated Financial Statementsof the Corporation's 2016 Annual Report on Form 10-K.
We use derivative transactions to manage the duration, interest rate and currency risks of our borrowings, considering the characteristics of the assets they are funding. For more information on our ALM activities, see Interest Rate Risk Management for the Banking Book on page 63.48.
We may also issue unsecured debt in the form of structured notes for client purposes, certain of which qualify as TLAC eligibleTLAC-eligible debt. During the three and nine months ended September 30, 2017,2020, we issued $1.6 billion and $3.9$6.1 billion of structured notes, which are unsecured debt obligations that pay investors returns linked to other debt or equity securities, indices, currencies or commodities. We typically hedge the returns we are obligated to
pay on these liabilities with derivatives and/or investments in the underlying instruments, so that from a funding perspective, the cost is similar to our other unsecured long-term debt. We could be required to settle certain structured note obligations for cash or other securities prior to maturity under certain circumstances, which we consider for liquidity planning purposes. We believe, however, that a portion of such borrowings will remain outstanding beyond the earliest put or redemption date.
Substantially all of our senior and subordinated debt obligations contain no provisions that could trigger a requirement for an early repayment, require additional collateral support, result in changes to terms, accelerate maturity or create additional financial obligations upon an adverse change in our credit ratings, financial ratios, earnings, cash flows or stock price. For more information on long-term debt funding, including issuances and maturities and redemptions, see Note 12 – Long-term Debt to the Consolidated Financial Statementsof the Corporation’s 2019 Annual Report on Form 10-K.
Contingency Planning
We maintain contingency funding plans that outline our potential responses to liquidity stress events at various levels of severity. These policies and plans are based on stress scenarios and include potential funding strategies and communication and notification procedures that we would implement in the event we experienced stressed liquidity conditions. We periodically review and test the contingency funding plans to validate efficacy and assess readiness.
Our U.S. bank subsidiaries can access contingency funding through the Federal Reserve Discount Window. Certain non-U.S. subsidiaries have access to central bank facilities in the jurisdictions in which they operate. While we do not rely on these sources in our liquidity modeling, we maintain the policies, procedures and governance processes that would enable us to access these sources if necessary.
Credit Ratings
Credit ratings and outlooks are opinions expressed by rating agencies on our creditworthiness and that of our obligations or securities, including long-term debt, short-term borrowings, preferred stock and other securities, including asset securitizations. Table 2116 presents the Corporation'sCorporation’s current long-term/short-term senior debt ratings and outlooks expressed by the rating agencies.
On September 28, 2017,The ratings and outlooks from Fitch Ratings (Fitch) completed its latest review of 12 large, complex securities trading and universal banks, including Bank of America. The agency affirmed the long-term and short-term senior debt ratings offor the Corporation and its rated subsidiaries including BANA, and maintained its stable outlook on those ratings.
On September 12, 2017, Moody’s Investor Service (Moody’s) placed the long-term ratings of the Corporation and its rated subsidiaries, including BANA, on review for upgrade, citing our improved profitability and commitment to a conservative risk profile as drivers of the review. A rating review indicates that those ratings are under consideration for a change in the near term, which typically concludes within 90 days. Moody’s concurrently affirmed the short-term ratings of the Corporation and its rated subsidiaries.
The ratings from Standard & Poor's Global Ratings (S&P) have not changed from those disclosed in the Corporation’s Quarterly Report on Form 10-Q for the quarter ended June 30, 2020. The ratings and outlooks
from Moody’s Investors Service (Moody’s) and Standard & Poor’s Global Ratings for the Corporation and its subsidiaries did not change from those disclosed in the Corporation's 20162019 Annual Report on Form 10-K.
For more information on credit ratings, see Liquidity Risk – Credit Ratings in the MD&A of the Corporation's 2016 Annual Report on Form 10-K. For more information on the additional collateral and termination payments that could be required in connection with certain over-the-counter (OTC) derivative contracts and other trading agreements as a resultin the event of such a credit rating downgrade, see Note 23 – Derivatives to the Consolidated Financial Statements herein and Item 1A. Risk Factors of the Corporation's 2016Corporation’s 2019 Annual Report on Form 10-K.
| | | | | | | | | | | | | | | | | | | | | | | | | | | | | | | | | | | | | | | | | | | | | | | | | | | | | | | | |
| | | | | | | | | | | | | | | | | | |
| Table 16 | | | | | | | | | | | | | | | | | | |
Table 21 | Senior Debt Ratings | | | | | | | | | | | | | | |
| | |
| | Moody’sMoody’s Investors Service
| | Standard & Poor’sPoor’s Global Ratings | | Fitch Ratings |
| Long-term | | Short-term | | Outlook | | Long-term | | Short-term | | Outlook | | Long-term | | Short-term | | Outlook |
| Bank of America Corporation | A2 | | P-1 | | Stable | | A- | | A-2 | | Stable | | A+ | | F1 | | Stable |
| Bank of America, N.A. | Aa2 | | P-1 | | Stable | | A+ | | A-1 | | Stable | | AA- | | F1+ | | Stable |
Bank of America CorporationMerrill Lynch International Designated Activity Company | Baa1 NR | | P-2 NR | | Review for upgrade NR | | BBB+ A+ | | A-2 A-1 | | Stable | | A AA- | | F1 F1+ | | Stable |
Bank of America, N.A. | A1 | | P-1 | | Review for upgrade | | A+ | | A-1 | | Stable | | A+ | | F1 | | Stable |
| Merrill Lynch, Pierce, Fenner & Smith Incorporated | NR | | NR | | NR | | A+ | | A-1 | | Stable | | A+ AA- | | F1 F1+ | | Stable |
| BofA Securities, Inc. | NR | | NR | | NR | | A+ | | A-1 | | Stable | | AA- | | F1+ | | Stable |
| Merrill Lynch International | NR | | NR | | NR | | A+ | | A-1 | | Stable | | A AA- | | F1 F1+ | | Stable |
| BofA Securities Europe SA | NR | | NR | | NR | | A+ | | A-1 | | Stable | | AA- | | F1+ | | Stable |
NR = not rated
Credit Risk Management
For more information on our credit risk management activities, see Consumer Portfolio Credit Risk Management below, Commercial Portfolio Credit Risk Management on page 48, 37, Non-U.S. Portfolio on page 56, Provision for Credit Losses on page 57, 43, Allowance for Credit Losses on page 57,44, and Note 45 – Outstanding Loans and Leases andNote 5 – Allowance for Credit Lossesto the Consolidated Financial Statements.Statements.
During the thirdnine months ended September 30, 2020, the COVID-19 pandemic negatively impacted economic activity in the U.S. and around the world. However, there were also positive signs during this period as parts of the economy began to reopen, and unemployment dropped from double-digit highs in the second quarter of 2017, hurricanes impacted2020. To provide relief to individuals and businesses in the southern United StatesU.S., the President signed into law four economic stimulus packages in March and April 2020, including the Caribbean, bringing widespread
CARES Act, and also signed an executive order in August 2020 to establish the Lost Wage Assistance Program. In addition, U.S. bank regulatory agencies also issued interagency guidance to financial institutions that are working with borrowers affected by COVID-19.floodingConsumer charge-offs remained low during the nine months ended September 30, 2020 due to payment deferrals and wind damage to communities acrossgovernment stimulus benefits. However, we experienced increases in nonperforming loans and commercial reservable criticized utilized exposures as a result of weaker economic conditions arising from COVID-19, particularly in certain sectors of the region. In the weeks after these storms, weeconomy that have been supportingmore significantly impacted during the pandemic (e.g., travel and entertainment).
To support our customers, and clients in these communities by providing mobile financial centers and ATMs to supplement local financial centers in affected areas. In addition, we are providing support for the recovery efforts including proactive fee refunds in affected areas, as well as homeimplemented various loan modification programs and other credit assistance,forms of support beginning in March 2020, including offering loan payment deferrals, refunding certain fees, and pausing foreclosure sales, evictions and repossessions. During the three months ended September 30, 2020, we experienced a decline in the need for impacted individualscustomer assistance as the number of customer accounts and businesses. While we are continuing our assessment, we do not believe that these storms will have a material financial impactbalances on deferral decreased significantly. For information on the Corporation.
accounting for loan modifications related to the COVID-19
pandemic, see Note 1 – Summary of Significant Accounting Principles to the Consolidated Financial Statements.
Consumer Portfolio Credit Risk Management
Credit risk management for the consumer portfolio begins with initial underwriting and continues throughout a borrower’s credit cycle. Statistical techniques in conjunction with experiential judgment are used in all aspects of portfolio management including underwriting, product pricing, risk appetite, setting credit limits, and establishing operating processes and metrics to quantify and balance risks and returns. Statistical models are built using detailed behavioral information from external sources such as credit bureaus and/or internal historical experience and are a component of our consumer credit risk management process. These models are used in part to assist in making both new and ongoing credit decisions, as well as portfolio management strategies, including authorizations and line management, collection practices and strategies, and determination of the allowance for loan and lease losses and allocated capital for credit risk.
Consumer Credit Portfolio
Improvement in the U.S. unemployment rateWhile COVID-19 is severely impacting economic activity, and home prices continued inis contributing to increasing delinquencies and nonperforming loans within certain consumer portfolios, it did not have a significant impact on consumer portfolio charge-offs during the three and nine months ended September 30, 2017 resulting in improved2020 due to payment deferrals and government stimulus benefits. However, COVID-19 could lead to adverse impacts to credit quality andmetrics in future periods if negative economic conditions continue or worsen. Net charge-offs decreased $58 million to $564 million for the three months ended September 30, 2020 due to lower credit card losses inand remained relatively flat at $2.2 billion for the consumer real estate portfolio, partially offset by seasoning and loan growth in the credit card portfolio compared to the same periods in 2016.
nine months ended September 30, 2020.Improved credit quality, the sale of the non-U.S. consumer credit card business in the second quarter of 2017, continued loan balance run-off and sales in the consumer real estate portfolio drove a $640 million decrease in theThe consumer allowance for loan and lease losses increased $6.1 billion during the nine months ended September 30, 20172020 to $5.6$10.7 billion at September 30, 2017.due to the adoption of the new CECL accounting standard and deterioration in the economic outlook resulting
from the impact of COVID-19. For additionalmore information, see Allowance for Credit Losses on page 57.44.
For more information on our accounting policies regarding delinquencies, nonperforming status, charge-offs and troubled debt restructurings (TDRs)TDRs for the consumer portfolio, see Note 1 – Summary of Significant Accounting Principles and Note 5 – Outstanding Loans and Leases to the Consolidated Financial Statements of the Corporation's 2016Corporation’s 2019 Annual Report on Form 10-K. For
information on our interest accrual policies and delinquency status for loan modifications related to the COVID-19 pandemic, see Note 1 – Summary of Significant Accounting Principles to the Consolidated Financial Statements.
Table 2217 presents our outstanding consumer loans and leases, and the PCI loan portfolio. In addition to being included in the “Outstandings” columns in Table 22, PCI loans are also shown separately in the “Purchased Credit-impaired Loan Portfolio” columns. The impact of the PCI loan portfolio on certain credit statistics is reported where appropriate. For more information on PCI loans, see Consumer Portfolio Credit Risk Management – Purchased Credit-impaired Loan Portfolio on page 45 and Note 4 – Outstanding Loans and Leases to the Consolidated Financial Statements.
|
| | | | | | | | | | | | | | | | |
| | | | | | | | | |
| Table 22 | Consumer Loans and Leases | | | | | | | |
| | | | | | | | | |
| | | Outstandings | | Purchased Credit-impaired Loan Portfolio |
| (Dollars in millions) | September 30
2017 | | December 31
2016 | | September 30
2017 | | December 31
2016 |
| Residential mortgage | $ | 199,446 |
| | $ | 191,797 |
| | $ | 8,399 |
| | $ | 10,127 |
|
| Home equity | 59,752 |
| | 66,443 |
| | 2,913 |
| | 3,611 |
|
| U.S. credit card | 92,602 |
| | 92,278 |
| | n/a |
| | n/a |
|
| Non-U.S. credit card | — |
| | 9,214 |
| | n/a |
| | n/a |
|
Direct/Indirect consumer (1) | 93,391 |
| | 94,089 |
| | n/a |
| | n/a |
|
Other consumer (2) | 2,424 |
| | 2,499 |
| | n/a |
| | n/a |
|
| Consumer loans excluding loans accounted for under the fair value option | 447,615 |
| | 456,320 |
| | 11,312 |
| | 13,738 |
|
Loans accounted for under the fair value option (3) | 978 |
| | 1,051 |
| | n/a |
| | n/a |
|
Total consumer loans and leases (4) | $ | 448,593 |
| | $ | 457,371 |
| | $ | 11,312 |
| | $ | 13,738 |
|
| |
(1)
| Outstandings include auto and specialty lending loans of $50.0 billion and $48.9 billion, unsecured consumer lending loans of $484 million and $585 million, U.S. securities-based lending loans of $39.3 billion and $40.1 billion, non-U.S. consumer loans of $2.9 billion and $3.0 billion, student loans of $0 and $497 million and other consumer loans of $682 million and $1.1 billion at September 30, 2017 and December 31, 2016.
|
| |
(2)
| Outstandings include consumer leases of $2.3 billion and $1.9 billion, consumer overdrafts of $160 million and $157 million and consumer finance loans of $0 and $465 million at September 30, 2017 and December 31, 2016.
|
| |
(3)
| Consumer loans accounted for under the fair value option include residential mortgage loans of $615 million and $710 million and home equity loans of $363 million and $341 million at September 30, 2017 and December 31, 2016. For more information on the fair value option, see Note 15 – Fair Value Option to the Consolidated Financial Statements.
|
| |
(4)
| Includes $9.2 billion of non-U.S. credit card loans, which were included in assets of business held for sale on the Consolidated Balance Sheet at December 31, 2016. During the second quarter of 2017, the Corporation sold its non-U.S. consumer credit card business. |
n/a = not applicable
Table 23 presents consumer nonperforming loans and accruing consumer loans past due 90 days or more. Nonperforming loans do not include past due consumer credit card loans, other unsecured loans and in general, consumer loans not secured by real estate (loans discharged in Chapter 7 bankruptcy are included) as these loans are typically charged off no later than the end of the month in which the loan becomes 180 days past due. Real estate-secured past due consumer loans that are insured by the FHA or individually insured under long-term standby agreements with Fannie Mae (FNMA) and Freddie Mac (FHLMC) (collectively,
| | | | | | | | | | | | | | | | | | | | | | | | | | | | | | | | | | | | | | |
| | | | | | | | | | | | |
| Table 17 | Consumer Credit Quality | | | | | | | | | | | |
| | | | | | | | | | | | |
| | Outstandings | | Nonperforming | | Accruing Past Due
90 Days or More |
| | | | | | | | | | | |
| (Dollars in millions) | September 30
2020 | | December 31
2019 | | September 30
2020 | | December 31
2019 | | September 30
2020 | | December 31
2019 |
Residential mortgage (1) | $ | 232,718 | | | $ | 236,169 | | | $ | 1,675 | | | $ | 1,470 | | | $ | 837 | | | $ | 1,088 | |
| Home equity | 36,530 | | | 40,208 | | | 640 | | | 536 | | | — | | | — | |
| Credit card | 79,834 | | | 97,608 | | | n/a | | n/a | | 546 | | | 1,042 | |
Direct/Indirect consumer (2) | 89,914 | | | 90,998 | | | 42 | | | 47 | | | 27 | | | 33 | |
| Other consumer | 140 | | | 192 | | | — | | | — | | | — | | | — | |
| Consumer loans excluding loans accounted for under the fair value option | $ | 439,136 | | | $ | 465,175 | | | $ | 2,357 | | | $ | 2,053 | | | $ | 1,410 | | | $ | 2,163 | |
Loans accounted for under the fair value option (3) | 657 | | | 594 | | | | | | | | | |
| Total consumer loans and leases | $ | 439,793 | | | $ | 465,769 | | | | | | | | | |
Percentage of outstanding consumer loans and leases (4) | | | | | 0.54 | % | | 0.44 | % | | 0.32 | % | | 0.47 | % |
Percentage of outstanding consumer loans and leases, excluding fully-insured loan portfolios (4) | | | | | 0.55 | | | 0.46 | | | 0.13 | | | 0.24 | |
the fully-insured loan portfolio) are reported as accruing as opposed to nonperforming since the principal repayment is insured. Fully-insured(1)Residential mortgage loans included in accruing past due 90 days or more are fully-insured loans. At September 30, 2020 and December 31, 2019, residential mortgage includes $561 million and $740 million of loans on which interest had been curtailed by the FHA, and therefore were no longer accruing interest, although principal was still insured, and $276 million and $348 million of loans on which interest was still accruing.
(2)Outstandings primarily from our repurchases of delinquent FHA loans pursuant to our servicing agreements with the Government National Mortgage Association (GNMA). Additionally, nonperforminginclude auto and specialty lending loans and accruing balances past due 90 days or more do not include the PCI loan portfolio orleases of $47.1 billion and $50.4 billion, U.S. securities-based lending loans of $39.0 billion and $36.7 billion and non-U.S. consumer loans of $2.9 billion and $2.8 billion at September 30, 2020 and December 31, 2019.
(3)Consumer loans accounted for under the fair value option even thoughinclude residential mortgage loans of $314 million and $257 million and home equity loans of $343 million and $337 million at September 30, 2020 and December 31, 2019. For more information on the customer may be contractuallyfair value option, see Note 15 – Fair Value Option to the Consolidated Financial Statements.
(4)Excludes consumer loans accounted for under the fair value option. At September 30, 2020 and December 31, 2019, $9 million and $6 million of loans accounted for under the fair value option were past due.due 90 days or more and not accruing interest.
|
| | | | | | | | | | | | | | | | |
| | | | | | | | | |
| Table 23 | Consumer Credit Quality | | | | | | | |
| | | | | | | | | |
| | Nonperforming | | Accruing Past Due 90 Days or More |
| (Dollars in millions) | September 30
2017 | | December 31
2016 | | September 30
2017 | | December 31
2016 |
Residential mortgage (1) | $ | 2,518 |
| | $ | 3,056 |
| | $ | 3,372 |
| | $ | 4,793 |
|
| Home equity | 2,691 |
| | 2,918 |
| | — |
| | — |
|
| U.S. credit card | n/a |
| | n/a |
| | 810 |
| | 782 |
|
| Non-U.S. credit card | n/a |
| | n/a |
| | — |
| | 66 |
|
| Direct/Indirect consumer | 43 |
| | 28 |
| | 31 |
| | 34 |
|
| Other consumer | — |
| | 2 |
| | 1 |
| | 4 |
|
Total (2) | $ | 5,252 |
| | $ | 6,004 |
| | $ | 4,214 |
| | $ | 5,679 |
|
Consumer loans and leases as a percentage of outstanding consumer loans and leases (2) | 1.17 | % | | 1.32 | % | | 0.94 | % | | 1.24 | % |
Consumer loans and leases as a percentage of outstanding loans and leases, excluding PCI and fully-insured loan portfolios (2) | 1.28 |
| | 1.45 |
| | 0.20 |
| | 0.21 |
|
| |
(1)
| Residential mortgage loans accruing past due 90 days or more are fully-insured loans. At September 30, 2017 and December 31, 2016, residential mortgage included $2.3 billion and $3.0 billion of loans on which interest has been curtailed by the FHA, and therefore are no longer accruing interest, although principal is still insured, and $1.1 billion and $1.8 billion of loans on which interest was still accruing.
|
| |
(2)
| Balances exclude consumer loans accounted for under the fair value option. At September 30, 2017 and December 31, 2016, $27 million and $48 million of loans accounted for under the fair value option were past due 90 days or more and not accruing interest.
|
n/a = not applicable
Table 2418 presents net charge-offs and related ratios for consumer loans and leases.
| | | | | | | | | | | | | | | | | | | | | | | | | | | | | | | | | | | | | | | | | | | | | | | | | | |
| | | | | | | | | | | | | | | | |
| Table 18 | Consumer Net Charge-offs and Related Ratios | | | | | | | | | | |
| | | | | | | | | | | | | | | | |
| | Net Charge-offs | | Net Charge-off Ratios (1) |
| | Three Months Ended
September 30 | | Nine Months Ended
September 30 | | Three Months Ended
September 30 | | Nine Months Ended
September 30 |
| (Dollars in millions) | 2020 | | 2019 | | 2020 | | 2019 | | 2020 | | 2019 | | 2020 | | 2019 |
| Residential mortgage | $ | (6) | | | $ | (38) | | | $ | (27) | | | $ | (51) | | | (0.01) | % | | (0.07) | % | | (0.02) | % | | (0.03) | % |
| Home equity | (20) | | | (202) | | | (45) | | | (346) | | | (0.21) | | | (1.85) | | | (0.16) | | | (1.02) | |
| Credit card | 509 | | | 717 | | | 1,944 | | | 2,224 | | | 2.49 | | | 3.01 | | | 2.97 | | | 3.15 | |
| | | | | | | | | | | | | | | |
| Direct/Indirect consumer | 18 | | | 76 | | | 84 | | | 170 | | | 0.08 | | | 0.33 | | | 0.13 | | | 0.25 | |
| Other consumer | 63 | | | 69 | | | 214 | | | 151 | | | n/m | | n/m | | n/m | | n/m |
| Total | $ | 564 | | | $ | 622 | | | $ | 2,170 | | | $ | 2,148 | | | 0.50 | | | 0.55 | | | 0.64 | | | 0.64 | |
| | | | | | | | | | | | | | | | |
|
| | | | | | | | | | | | | | | | | | | | | | | | | | | | |
| | | | | | | | | | | | | | | | | |
| Table 24 | Consumer Net Charge-offs and Related Ratios | | | | | | | | | | |
| | | | | | | | | | | | | | | | | |
| | | Net Charge-offs (1) | | Net Charge-off Ratios (1, 2) |
| | | Three Months Ended
September 30 | | Nine Months Ended
September 30 | | Three Months Ended
September 30 | | Nine Months Ended
September 30 |
| (Dollars in millions) | 2017 | | 2016 | | 2017 | | 2016 | | 2017 | | 2016 | | 2017 | | 2016 |
| Residential mortgage | $ | (82 | ) | | $ | 4 |
| | $ | (84 | ) | | $ | 129 |
| | (0.16 | )% | | 0.01 | % | | (0.06 | )% | | 0.09 | % |
| Home equity | 83 |
| | 97 |
| | 197 |
| | 335 |
| | 0.54 |
| | 0.55 |
| | 0.42 |
| | 0.61 |
|
| U.S. credit card | 612 |
| | 543 |
| | 1,858 |
| | 1,703 |
| | 2.65 |
| | 2.45 |
| | 2.75 |
| | 2.60 |
|
| Non-U.S. credit card | — |
| | 43 |
| | 75 |
| | 134 |
| | — |
| | 1.83 |
| | 1.91 |
| | 1.84 |
|
| Direct/Indirect consumer | 67 |
| | 34 |
| | 147 |
| | 91 |
| | 0.28 |
| | 0.14 |
| | 0.21 |
| | 0.13 |
|
| Other consumer | 51 |
| | 57 |
| | 116 |
| | 152 |
| | 7.23 |
| | 9.74 |
| | 5.83 |
| | 9.09 |
|
| Total | $ | 731 |
| | $ | 778 |
| | $ | 2,309 |
| | $ | 2,544 |
| | 0.65 |
| | 0.69 |
| | 0.69 |
| | 0.76 |
|
| |
(1)
| Net charge-offs exclude write-offs in the PCI loan portfolio. For more information on PCI write-offs, see Consumer Portfolio Credit Risk Management – Purchased Credit-impaired Loan Portfolio on page 45.
|
| |
(2)
| Net charge-off ratios are calculated as annualized net charge-offs divided by average outstanding loans and leases excluding loans accounted for under the fair value option. |
Net charge-offs, as shown in Tables 24 and 25, exclude write-offs in the PCI loan portfolio of $62 million and $112 million in residential mortgage for the three and nine months ended September 30, 2017 compared to $33 million and $109 million for the same periods in 2016. Net charge-offs, as shown in Tables 24 and 25, exclude write-offs in the PCI loan portfolio of $11 million and $49 million in home equity for the three and nine months ended September 30, 2017 compared to $50 million and $161 million for the same periods in 2016. Net charge-off (recovery) ratios including the PCI write-offs were (0.04) percent and 0.02 percent for residential mortgage for the three and nine months ended September 30, 2017 compared to 0.08 percent and 0.17 percent for the same periods in 2016. (1)Net charge-off ratios includingare calculated as annualized net charge-offs divided by average outstanding loans and leases excluding loans accounted for under the PCI write-offs were 0.61 percent and 0.52 percent for home equity for the three and nine months ended September 30, 2017 compared to 0.83 percent and 0.91 percent for the same periods in 2016. For more information on PCI write-offs, see Consumer Portfolio Credit Risk Management – Purchased Credit-impaired Loan Portfolio on page 45.fair value option.
n/m = not meaningful
Table 2519 presents outstandings, nonperforming balances, net charge-offs, allowance for loan and leasecredit losses and provision for
loan and lease credit losses for the core and non-core portfolios within the consumer real estate portfolio. We categorize consumer real estate loans as core and non-core based on loan and customer characteristics such as origination date, product type, LTV, FICOFair Isaac Corporation (FICO) score and delinquency status consistent with our current consumer and mortgage servicing strategy. Generally, loans that were originated after January 1, 2010, qualified under government-sponsored enterprise underwriting guidelines, or otherwise met our underwriting
guidelines in place in 2015 are characterized as core loans. Loans held in legacy private-label securitizations, government-insuredAll other loans originated prior to 2010, loan products no longer originated, and loans originated prior to 2010 and classified as nonperforming or modified in a TDR prior to 2016 are generally characterized as non-core loans and are principally run-offrepresent runoff portfolios. Core loans as reported in Table 2519 include loans held in the Consumer Banking and GWIM segments, as well as loans held for ALM activities in All Other. For more information on core and non-core loans, see Note 4 – Outstanding Loans and Leases to the Consolidated Financial Statements.
As shown in Table 25,19, outstanding core consumer real estate loans increased $10.2decreased $4.8 billion during the nine months ended September 30, 20172020 driven by an increasea decrease of $14.2$1.9 billion in residential mortgage partially offset byand a $4.0$2.9 billion decrease in home equity.
|
| | | | | | | | | | | | | | | | | | | | | | | | | | | | | | | | |
| | | | | | | | | | | | | | | | | |
| Table 25 | Consumer Real Estate Portfolio (1) | | | | | | | | |
| | | | | | | | | | | |
| | | Outstandings | | Nonperforming | | Net Charge-offs (2) |
| | | September 30
2017 | | December 31
2016 | | September 30
2017 | | December 31
2016 | | Three Months Ended
September 30 | | Nine Months Ended
September 30 |
| (Dollars in millions) | | | | | 2017 | | 2016 | | 2017 | | 2016 |
| Core portfolio | |
| | |
| | |
| | |
| | |
| | | | | | |
| Residential mortgage | $ | 170,657 |
| | $ | 156,497 |
| | $ | 1,076 |
| | $ | 1,274 |
| | $ | (42 | ) | | $ | (12 | ) | | $ | (40 | ) | | $ | (23 | ) |
| Home equity | 45,377 |
| | 49,373 |
| | 1,046 |
| | 969 |
| | 26 |
| | 35 |
| | 85 |
| | 81 |
|
| Total core portfolio | 216,034 |
| | 205,870 |
| | 2,122 |
| | 2,243 |
| | (16 | ) | | 23 |
| | 45 |
| | 58 |
|
| Non-core portfolio | | | |
| | |
| | |
| | | | | | | | |
| Residential mortgage | 28,789 |
| | 35,300 |
| | 1,442 |
| | 1,782 |
| | (40 | ) | | 16 |
| | (44 | ) | | 152 |
|
| Home equity | 14,375 |
| | 17,070 |
| | 1,645 |
| | 1,949 |
| | 57 |
| | 62 |
| | 112 |
| | 254 |
|
| Total non-core portfolio | 43,164 |
| | 52,370 |
| | 3,087 |
| | 3,731 |
| | 17 |
| | 78 |
| | 68 |
| | 406 |
|
| Consumer real estate portfolio | |
| | |
| | |
| | |
| | |
| | |
| | | | |
| Residential mortgage | 199,446 |
| | 191,797 |
| | 2,518 |
| | 3,056 |
| | (82 | ) | | 4 |
| | (84 | ) | | 129 |
|
| Home equity | 59,752 |
| | 66,443 |
| | 2,691 |
| | 2,918 |
| | 83 |
| | 97 |
| | 197 |
| | 335 |
|
| Total consumer real estate portfolio | $ | 259,198 |
| | $ | 258,240 |
| | $ | 5,209 |
| | $ | 5,974 |
| | $ | 1 |
| | $ | 101 |
| | $ | 113 |
| | $ | 464 |
|
| | | | | | | | | | | | | | | | | |
| | | | | | | Allowance for Loan and Lease Losses | | Provision for Loan and Lease Losses |
| | | | | | | September 30
2017 | | December 31
2016 | | Three Months Ended
September 30 | | Nine Months Ended
September 30 |
| | | | | | | | | 2017 | | 2016 | | 2017 | | 2016 |
| Core portfolio | | | | | | | | | | | | | | | |
| Residential mortgage | | | | | $ | 231 |
| | $ | 252 |
| | $ | (49 | ) | | $ | (33 | ) | | $ | (60 | ) | | $ | (86 | ) |
| Home equity | | | | | 456 |
| | 560 |
| | (10 | ) | | 2 |
| | (19 | ) | | 10 |
|
| Total core portfolio | | | | | 687 |
| | 812 |
| | (59 | ) | | (31 | ) | | (79 | ) | | (76 | ) |
| Non-core portfolio | | | | | |
| | |
| | | | | | | | |
| Residential mortgage | | | | | 582 |
| | 760 |
| | (59 | ) | | (34 | ) | | (111 | ) | | (88 | ) |
| Home equity | | | | | 763 |
| | 1,178 |
| | (86 | ) | | 29 |
| | (255 | ) | | (27 | ) |
| Total non-core portfolio | | | | | 1,345 |
| | 1,938 |
| | (145 | ) | | (5 | ) | | (366 | ) | | (115 | ) |
| Consumer real estate portfolio | | | | | |
| | |
| | |
| | |
| | | | |
| Residential mortgage | | | | | 813 |
| | 1,012 |
| | (108 | ) | | (67 | ) | | (171 | ) | | (174 | ) |
| Home equity | | | | | 1,219 |
| | 1,738 |
| | (96 | ) | | 31 |
| | (274 | ) | | (17 | ) |
| Total consumer real estate portfolio | | | | | $ | 2,032 |
| | $ | 2,750 |
| | $ | (204 | ) | | $ | (36 | ) | | $ | (445 | ) | | $ | (191 | ) |
| | | | | | | | |
(1)31Bank of America
| Outstandings and nonperforming loans exclude loans accounted for under the fair value option. Consumer loans accounted for under the fair value option include residential mortgage loans of $615 million and $710 million and home equity loans of $363 million and $341 million at September 30, 2017 and December 31, 2016. For more information on the fair value option, see Note 15 – Fair Value Option to the Consolidated Financial Statements.
| |
| | | | | | | | |
(2)
| Net charge-offs exclude write-offs in the PCI loan portfolio. For more information on PCI write-offs, see Consumer Portfolio Credit Risk Management – Purchased Credit-impaired Loan Portfolio on page 45.
| |
| | | | | | | | | | | | | | | | | | | | | | | | | | | | | | | | | | | | | | | | | | | | | | | | | | |
| | | | | | | | | | | | | | | | |
| Table 19 | Consumer Real Estate Portfolio (1) | | | | | | | | |
| | | | | | | | | | |
| | Outstandings | | Nonperforming | | Net Charge-offs |
| September 30
2020 | | December 31
2019 | | September 30
2020 | | December 31
2019 | | Three Months Ended
September 30 | | Nine Months Ended
September 30 |
| | | | | | | | | |
| (Dollars in millions) | | | | | 2020 | | 2019 | | 2020 | | 2019 |
| Core portfolio | | | | | | | | | | | | | | | |
| Residential mortgage | $ | 223,895 | | | $ | 225,770 | | | $ | 1,057 | | | $ | 883 | | | $ | (3) | | | $ | (6) | | | $ | (23) | | | $ | (2) | |
| Home equity | 32,338 | | | 35,226 | | | 451 | | | 363 | | | (4) | | | 8 | | | (1) | | | 39 | |
| Total core portfolio | 256,233 | | | 260,996 | | | 1,508 | | | 1,246 | | | (7) | | | 2 | | | (24) | | | 37 | |
| Non-core portfolio | | | | | | | | | | | | | | | |
| Residential mortgage | 8,823 | | | 10,399 | | | 618 | | | 587 | | | (3) | | | (32) | | | (4) | | | (49) | |
| Home equity | 4,192 | | | 4,982 | | | 189 | | | 173 | | | (16) | | | (210) | | | (44) | | | (385) | |
| Total non-core portfolio | 13,015 | | | 15,381 | | | 807 | | | 760 | | | (19) | | | (242) | | | (48) | | | (434) | |
| Consumer real estate portfolio | | | | | | | | | | | | | | | |
| Residential mortgage | 232,718 | | | 236,169 | | | 1,675 | | | 1,470 | | | (6) | | | (38) | | | (27) | | | (51) | |
| Home equity | 36,530 | | | 40,208 | | | 640 | | | 536 | | | (20) | | | (202) | | | (45) | | | (346) | |
| Total consumer real estate portfolio | $ | 269,248 | | | $ | 276,377 | | | $ | 2,315 | | | $ | 2,006 | | | $ | (26) | | | $ | (240) | | | $ | (72) | | | $ | (397) | |
| | | | | | | | | | | | | | | | |
| | | | | | Allowance for Credit Losses | | Provision for Credit Losses |
| | | | | | September 30
2020 | | December 31
2019 | | Three Months Ended
September 30 | | Nine Months Ended
September 30 |
| | | | | | | | | | | | | | |
| | | | | | | | 2020 | | 2019 | | 2020 | | 2019 |
| Core portfolio | | | | | | | | | | | | | | | |
| Residential mortgage | | | | | $ | 371 | | | $ | 229 | | | $ | 8 | | | $ | (4) | | | $ | 135 | | | $ | 3 | |
| Home equity | | | | | 603 | | | 120 | | | (4) | | | (19) | | | 144 | | | (52) | |
| Total core portfolio | | | | | 974 | | | 349 | | | 4 | | | (23) | | | 279 | | | (49) | |
| Non-core portfolio | | | | | | | | | | | | | | | |
| Residential mortgage | | | | | 86 | | | 96 | | | 2 | | | (39) | | | 78 | | | (91) | |
Home equity (2) | | | | | (67) | | | 101 | | | (15) | | | (250) | | | (2) | | | (481) | |
| Total non-core portfolio | | | | | 19 | | | 197 | | | (13) | | | (289) | | | 76 | | | (572) | |
| Consumer real estate portfolio | | | | | | | | | | | | | | | |
| Residential mortgage | | | | | 457 | | | 325 | | | 10 | | | (43) | | | 213 | | | (88) | |
Home equity (3) | | | | | 536 | | | 221 | | | (19) | | | (269) | | | 142 | | | (533) | |
| Total consumer real estate portfolio | | | | | $ | 993 | | | $ | 546 | | | $ | (9) | | | $ | (312) | | | $ | 355 | | | $ | (621) | |
(1)Outstandings and nonperforming loans exclude loans accounted for under the fair value option. Consumer loans accounted for under the fair value option include residential mortgage loans of $314 million and $257 million and home equity loans of $343 million and $337 million at September 30, 2020 and December 31, 2019. For more information, see Note 15 – Fair Value Option to the Consolidated Financial Statements.
(2)The home equity non-core allowance is in a negative position at September 30, 2020 as it includes expected recoveries of amounts previously charged off.
(3)Home equity allowance includes a reserve for unfunded lending commitments of $138 million at September 30, 2020.
We believe that the presentation of information adjusted to exclude the impact of the PCI loan portfolio, the fully-insured loan portfolio and loans accounted for under the fair value option is more representative of the ongoing operations and credit quality of the business. As a result, in the following tables and discussions of the residential mortgage and home equity portfolios, we exclude loans accounted for under the fair value option and provide information that excludes the impact of the PCI loan portfolio, the fully-insured loan portfolio and loans accounted for under the fair value option in certain credit quality statistics. We separately disclose information on the PCI loan portfolio on page 45.
Residential Mortgage
The residential mortgage portfolio makesmade up the largest percentage of our consumer loan portfolio at 4553 percent of consumer loans and leases at September 30, 2017.2020. Approximately 3553 percent of the residential mortgage portfolio iswas in Consumer Banking and approximately 3539 percent iswas in GWIM. The remaining portion iswas in All Other and iswas comprised of originated
loans, purchased loans used in our overall ALM activities, delinquent FHA loans repurchased pursuant to our servicing agreements with GNMAthe
Government National Mortgage Association as well as loans repurchased related to our representations and warranties.
Outstanding balances in the residential mortgage portfolio excluding loans accounted for under the fair value option, increased $7.6decreased $3.5 billion during the nine months ended September 30, 20172020 as retention of new originations wasboth loan sales and runoff were partially offset by loan sales of $3.2 billion, and run-off.originations.
At September 30, 20172020 and December 31, 2016,2019, the residential mortgage portfolio included $24.8$11.7 billion and $28.7$18.7 billion of outstanding fully-insured loans. On this portionloans, of the residential mortgage portfolio, we are protected against principal loss as a result of either FHA insurance or long-term standby agreements that provide for the transfer of credit risk to FNMA and FHLMC. At September 30, 2017 and December 31, 2016, $18.3which $3.0 billion and $22.3$11.2 billion had FHA insurance with the remainder protected by Fannie Mae long-term standby agreements. AtThe decline was primarily driven by sales of loans with FHA insurance during the nine months ended September 30,
2017 and December 31, 2016, $5.5 billion and $7.4 billion of the FHA-insured loan population were repurchases of delinquent FHA loans pursuant to our servicing agreements with GNMA. 2020.
Table 2620 presents certain residential mortgage key credit statistics on both a reported basis excluding loans accounted for under the fair value option, and excluding the PCI loan portfolio, the fully-insured loan portfolio and loans accounted for under the fair value option. Additionally, in the “Reported Basis” columns in
the table below, accruing balances past due and nonperforming loans do not include the PCI loan portfolio, in accordance with our accounting policies, even though the customer may be contractually past due. As such, theportfolio. The following discussion presents the residential mortgage portfolio excluding the PCI loan portfolio, the fully-insured loan portfolio.
| | | | | | | | | | | | | | | | | | | | | | | | | | | | | | | | | | | | | | | | | | | | | | |
| | | | | | | | | | | | | | | | |
| Table 20 | Residential Mortgage – Key Credit Statistics | | | | | | | | |
| | | | | | | | | | | | | | | | |
| | | | | | | | | | Reported Basis (1) | | Excluding Fully-insured Loans (1) |
| | | | | | | | | | |
| (Dollars in millions) | | | | | | | | | September 30
2020 | | December 31
2019 | | September 30
2020 | | December 31
2019 |
| Outstandings | | | | | | | | $ | 232,718 | | | $ | 236,169 | | | $ | 220,996 | | | $ | 217,479 | |
| Accruing past due 30 days or more | | | | | | | | 2,607 | | | 3,108 | | | 1,394 | | | 1,296 | |
| Accruing past due 90 days or more | | | | | | | | 837 | | | 1,088 | | | — | | | — | |
Nonperforming loans (2) | | | | | | | | 1,675 | | | 1,470 | | | 1,675 | | | 1,470 | |
| Percent of portfolio | | | | | | | | | | | | | | |
| Refreshed LTV greater than 90 but less than or equal to 100 | | | | 2 | % | | 2 | % | | 2 | % | | 2 | % |
| Refreshed LTV greater than 100 | | | | | | | | 1 | | | 1 | | | 1 | | | 1 | |
| Refreshed FICO below 620 | | | | | | | | 2 | | | 3 | | | 1 | | | 2 | |
2006 and 2007 vintages (3) | | | | | | | | 3 | | | 4 | | | 3 | | | 4 | |
| | | | | | | | | | | | | | | | |
| | | | | | | | | | | | | | | | |
| | | | | | | | | | | | | | | | |
| | | | | | | | | | |
| | | | | | | | |
| | | | |
| | | | | | | | |
| | | | | | | | | | | | | | | | |
| | | | | | | | | | | | | | | |
| | | | | | | | | | | | | | | | |
(1)Outstandings, accruing past due, nonperforming loans and percentages of portfolio andexclude loans accounted for under the fair value option. For more information on our interest accrual policies and delinquency status for loan modifications related to the PCI loan portfolio,COVID-19 pandemic, see page 45.
(2)Includes loans that are contractually current which primarily consist of collateral-dependent TDRs, including those that have been discharged in Chapter 7 bankruptcy and loans that have not yet demonstrated a sustained period of payment performance following a TDR. |
| | | | | | | | | | | | | | | | | | | | | | | | | | | | |
| | | | | | | | | | | | | | | | | |
| Table 26 | Residential Mortgage – Key Credit Statistics | | | | | | | | |
| | | | | | | | | | | | | | | | | |
| | | | | | | | | | | Reported Basis (1) | | Excluding Purchased
Credit-impaired and
Fully-insured Loans |
| (Dollars in millions) | | | | | | | | | September 30
2017 | | December 31
2016 | | September 30
2017 | | December 31
2016 |
| Outstandings | | | | | | | | $ | 199,446 |
| | $ | 191,797 |
| | $ | 166,262 |
| | $ | 152,941 |
|
| Accruing past due 30 days or more | | | | | | | | 6,613 |
| | 8,232 |
| | 1,893 |
| | 1,835 |
|
| Accruing past due 90 days or more | | | | | | | | 3,372 |
| | 4,793 |
| | — |
| | — |
|
| Nonperforming loans | | | | | | | | 2,518 |
| | 3,056 |
| | 2,518 |
| | 3,056 |
|
| Percent of portfolio | | | | | | | | |
| | |
| | |
| | |
|
| Refreshed LTV greater than 90 but less than or equal to 100 | | | | 3 | % | | 5 | % | | 3 | % | | 3 | % |
| Refreshed LTV greater than 100 | | | | | | | | 3 |
| | 4 |
| | 2 |
| | 3 |
|
| Refreshed FICO below 620 | | | | | | | | 7 |
| | 9 |
| | 3 |
| | 4 |
|
2006 and 2007 vintages (2) | | | | | | | | 10 |
| | 13 |
| | 9 |
| | 12 |
|
| | | | | | | | | | | | | | | | | |
| | | Reported Basis | | Excluding Purchased Credit-impaired and Fully-Insured Loans |
| | | Three Months Ended
September 30 | | Nine Months Ended
September 30 | | Three Months Ended
September 30 | | Nine Months Ended
September 30 |
| | | 2017 | | 2016 | | 2017 | | 2016 | | 2017 | | 2016 | | 2017 | | 2016 |
Net charge-off ratio (3) | (0.16 | )% | | 0.01 | % | | (0.06 | )% | | 0.09 | % | | (0.20 | )% | | 0.01 | % | | (0.07 | )% | | 0.12 | % |
| |
(1)
| Outstandings, accruing past due, nonperforming loans and percentages of portfolio exclude loans accounted for under the fair value option. |
| |
(2)
| These vintages of loans account for $825 million, or 33(3)These vintages of loans accounted for $481 million, or 29 percent, and $365 million, or 25 percent,, and $931 million, or 31 percent of nonperforming residential mortgage loans at September 30, 2017 and December 31, 2016.
|
| |
(3)
| Net charge-off ratios are calculated as annualized net charge-offs divided by average outstanding loans excluding loans accounted for under the fair value option. |
Nonperforming residential mortgage loans decreased $538at September 30, 2020 and December 31, 2019.
Nonperforming outstanding balances in the residential mortgage portfolio increased $205 million during the nine months ended September 30, 2017 as outflows, including sales2020 primarily driven by loans with deferrals that expired and have subsequently become nonperforming, and the inclusion of $386 million, outpacedcertain loans that, upon adoption of the new inflowscredit loss standard, became accounted for on an individual basis, which included the addition of $140 million of nonperforming loans aspreviously had been accounted for under a result of clarifying regulatory guidance related to bankruptcy loans.pool basis. Of the nonperforming residential mortgage loans at September 30, 2017, $8802020, $531 million, or 3532 percent, were current on contractual payments. Loans accruing past due 30 days or more increased $58$98 million due in part todriven primarily by borrowers whose deferrals expired throughout the timing impact of a consumer real estate servicer conversion that occurred during the third quarter of 2017.year and have subsequently become delinquent.
Net charge-offs decreased $86increased $32 million and $24 million to an $82 milliona net recovery of $6 million and decreased $213$27 million to an $84 million net recovery for the three and nine months ended September 30, 2017,2020 compared to the same periods in 2016. These decreases in net charge-offs were primarily driven by net2019. This increase is due largely to lower recoveries from the sales of $88 million and $102 million related to loan sales during the three and nine months ended September 30, 2017, compared to loan sale-related net recoveries of $7 million and net charge-offs of $35 million for the same periods in 2016. Additionally, net charge-offs declined due to favorable portfolio trends and decreased write-downs on loans greater than 180 days past due driven by improvement in home prices and the U.S. economy.
Loans with a refreshed LTV greater than 100 percent represented two percent and three percent of the residential mortgage loan portfolio at September 30, 2017 and December 31, 2016. Of the loans with a refreshed LTV greater than 100 percent, 99 percent and 98 percent were performing at September 30, 2017 and December 31, 2016. Loans with a refreshed LTV
greater than 100 percent reflect loans where the outstanding carrying value of the loan is greater than the most recent valuation of the property securing the loan. The majority of these loans have a refreshed LTV greater than 100 percent primarily due to home price deterioration since 2006, partially offset by subsequent appreciation.previously charged-off loans.
Of the $166.3$221.0 billion in total residential mortgage loans outstanding at September 30, 2017,2020, as shown in Table 20, 27 34 percent were originated as interest-only loans. The outstanding balance of interest-only residential mortgage loans that have entered the amortization period was $10.5$6.3 billion, or 1811 percent, at September 30, 2017.2020. Residential mortgage loans that have entered the amortization period generally have experienced a higher rate of early stage delinquencies and nonperforming status compared to the residential mortgage portfolio as a
whole. At September 30, 2017, $3002020, $101 million, or threetwo percent of outstanding interest-only residential mortgages that had entered the amortization period were accruing past due 30 days or more compared to $1.9$1.4 billion, or less than one percent, for the entire residential mortgage portfolio. In addition, at September 30, 2017, $4752020, $329 million, or five percent, of outstanding interest-only residential mortgage loans that had entered the amortization period were nonperforming, of which $255$71 million were contractually current, compared to $2.5$1.7 billion, or twoone percent, for the entire residential mortgage portfolio, of which $880 million were contractually current.portfolio. Loans that have yet to enter the amortization period in our interest-only residential mortgage portfolio are primarily well-collateralized loans to our wealth management clients and have an interest-only period of three to ten years. More than 80Approximately 97 percent
of these loans that have yet to enter the amortization period will not be required to make a fully-amortizing payment until 20202022 or later.
Table 2721 presents outstandings, nonperforming loans and net charge-offs by certain state concentrations for the residential mortgage portfolio. The Los Angeles-Long Beach-Santa Ana
Metropolitan Statistical Area (MSA) within California represented 16 percent and 15 percent of outstandings at both September 30, 20172020 and December 31, 2016.2019. In the New York area, the New York-Northern New Jersey-Long Island MSA made up 1314 percent and 1213 percent of outstandings at September 30, 20172020 and December 31, 2016.2019.
| | | | | | | | | | | | | | | | | | | | | | | | | | | | | | | | | | | | | | | | | | | | | | | | | | |
| | | | | | | | | | | | | | | | |
| Table 21 | Residential Mortgage State Concentrations | | | | |
| | | | | | | | | | | | | | | | |
| Outstandings (1) | | Nonperforming (1) | | Net Charge-offs |
| September 30
2020 | | December 31
2019 | | September 30
2020 | | December 31
2019 | | Three Months Ended
September 30 | | Nine Months Ended
September 30 |
| (Dollars in millions) | | | | | 2020 | | 2019 | | 2020 | | 2019 |
| California | $ | 89,467 | | | $ | 88,998 | | | $ | 390 | | | $ | 274 | | | $ | (5) | | | $ | (12) | | | $ | (16) | | | $ | (22) | |
| New York | 23,935 | | | 22,385 | | | 238 | | | 196 | | | 1 | | | 1 | | | 2 | | | 2 | |
| Florida | 13,155 | | | 12,833 | | | 161 | | | 143 | | | (1) | | | (8) | | | (4) | | | (12) | |
| Texas | 9,121 | | | 8,943 | | | 73 | | | 65 | | | — | | | — | | | — | | | (1) | |
| New Jersey | 9,081 | | | 8,734 | | | 84 | | | 77 | | | (1) | | | (2) | | | (1) | | | (4) | |
| Other | 76,237 | | | 75,586 | | | 729 | | | 715 | | | — | | | (17) | | | (8) | | | (14) | |
| Residential mortgage loans | $ | 220,996 | | | $ | 217,479 | | | $ | 1,675 | | | $ | 1,470 | | | $ | (6) | | | $ | (38) | | | $ | (27) | | | $ | (51) | |
| Fully-insured loan portfolio | 11,722 | | | 18,690 | | | | | | | | | | | | | |
| | | | | | | | | | | | | | | |
| Total residential mortgage loan portfolio | $ | 232,718 | | | $ | 236,169 | | | | | | | | | | | | | |
(1)Outstandings and nonperforming loans exclude loans accounted for under the fair value option.
|
| | | | | | | | | | | | | | | | | | | | | | | | | | | | | | | | |
| | | | | | | | | | | | | | | | | |
| Table 27 | Residential Mortgage State Concentrations | | | | |
| | | | | | | | | | | | | | | | | |
| | | Outstandings (1) | | Nonperforming (1) | | Net Charge-offs (2) |
| | September 30
2017 | | December 31
2016 | | September 30
2017 | | December 31
2016 | | Three Months Ended
September 30 | | Nine Months Ended
September 30 |
| (Dollars in millions) | | | | 2017 | | 2016 | | 2017 | | 2016 |
| California | $ | 65,407 |
| | $ | 58,295 |
| | $ | 453 |
| | $ | 554 |
| | $ | (59 | ) | | $ | (21 | ) | | $ | (84 | ) | | $ | (51 | ) |
New York (3) | 16,705 |
| | 14,476 |
| | 238 |
| | 290 |
| | (1 | ) | | (1 | ) | | (2 | ) | | 17 |
|
Florida (3) | 10,613 |
| | 10,213 |
| | 264 |
| | 322 |
| | (9 | ) | | 2 |
| | (11 | ) | | 19 |
|
| Texas | 7,046 |
| | 6,607 |
| | 120 |
| | 132 |
| | 1 |
| | — |
| | 2 |
| | 8 |
|
| Massachusetts | 5,691 |
| | 5,344 |
| | 63 |
| | 77 |
| | (1 | ) | | — |
| | (1 | ) | | 4 |
|
| Other U.S./Non-U.S. | 60,800 |
| | 58,006 |
| | 1,380 |
| | 1,681 |
| | (13 | ) | | 24 |
| | 12 |
| | 132 |
|
Residential mortgage loans (4) | $ | 166,262 |
| | $ | 152,941 |
| | $ | 2,518 |
| | $ | 3,056 |
| | $ | (82 | ) | | $ | 4 |
| | $ | (84 | ) | | $ | 129 |
|
| Fully-insured loan portfolio | 24,785 |
| | 28,729 |
| | |
| | |
| | |
| | |
| | | | |
Purchased credit-impaired residential mortgage loan portfolio (5) | 8,399 |
| | 10,127 |
| | |
| | |
| | |
| | |
| | | | |
| Total residential mortgage loan portfolio | $ | 199,446 |
| | $ | 191,797 |
| | |
| | |
| | |
| | |
| | | | |
| | | | | | | | |
(1)33Bank of America
| Outstandings and nonperforming loans exclude loans accounted for under the fair value option. | |
| | | | | | | | |
(2)
| Net charge-offs exclude $62 million and $112 million of write-offs in the residential mortgage PCI loan portfolio for the three and nine months ended September 30, 2017 compared to $33 million and $109 million for the same periods in 2016. For more information on PCI write-offs, see Consumer Portfolio Credit Risk Management – Purchased Credit-impaired Loan Portfolio on page 45.
|
| |
(3)
| In these states, foreclosure requires a court order following a legal proceeding (judicial states). |
| |
(4)
| Amounts exclude the PCI residential mortgage and fully-insured loan portfolios. |
| |
(5)
| At September 30, 2017 and December 31, 2016, 47 percent and 48 percent of PCI residential mortgage loans were in California. There were no other significant single state concentrations.
|
Home Equity
At September 30, 2017,2020, the home equity portfolio made up 13eight percent of the consumer portfolio and iswas comprised of home equity lines of credit (HELOCs), home equity loans and reverse mortgages. We no longer originate home equity loans or reverse mortgages.
At September 30, 2017,2020, our HELOC portfolio had an outstanding balance of $52.8$34.2 billion, or 8894 percent of the total home equity portfolio, compared to $58.6$37.5 billion, also 88or 93 percent, at December 31, 2016.2019. HELOCs generally have an initial draw period of 10 years, and the borrowers typically are only required to pay the interest due on the loans on a monthly basis. Afterafter the initial draw period ends, the loans generally convert to 15-year15- or 20-year amortizing loans.
At September 30, 2017,2020 and December 31, 2019, our home equity loan portfolio had an outstanding balance of $4.7$974 million and $1.2 billion, or eightthree percent, of the total home equity portfolio. At September 30, 2020, our reverse mortgage portfolio had an outstanding balance of $1.3 billion, or three percent of the total home equity portfolio, compared to $5.9$1.5 billion, or ninefour percent, at December 31, 2016. Home equity loans are almost all fixed-rate loans with amortizing payment terms of 10 to 30 years and of the $4.7 billion at September 30, 2017, 57 percent have 25- to 30-year terms. 2019.
At September 30, 2017, our reverse mortgage portfolio had an outstanding balance, excluding loans accounted for under the fair value option, of $2.2 billion, or four percent of the total home equity portfolio compared to $1.9 billion, or three percent, at December 31, 2016. We no longer originate reverse mortgages.
At September 30, 2017, approximately 692020, 80 percent of the home equity portfolio was in Consumer Banking, 2412 percent was in All Other and the remainder of the portfolio was primarily in GWIM. Outstanding balances in the home equity portfolio excluding loans accounted for under the fair value option, decreased $6.7$3.7 billion during the nine months ended September 30, 20172020 primarily due to paydowns and charge-offs outpacing new originations and draws on existing lines. Of the total home equity portfolio at September 30, 20172020 and December 31, 2016, $19.0 billion and $19.62019, $14.3 billion, or 3239 percent, and 29$15.0 billion, or 37 percent, were in first-lien positions (33 percent and 31 percent excluding the PCI home equity portfolio).positions. At September 30, 2017,2020, outstanding balances in the home equity portfolio that were in a second-lien or more junior-lien position and where we also held the first-lien loan totaled $9.8$6.3 billion, or 17 percent, of our total home equity portfolio excluding the PCI loan portfolio.
Unused HELOCs totaled $45.4$43.5 billion and $43.6 billion at September 30, 2017 compared to $47.2 billion at2020 and December 31, 2016. The decrease was primarily due to accounts reaching the end of their draw period, which automatically eliminates open line exposure, and customers choosing to close accounts. Both of these more than offset the impact of new production.2019. The HELOC utilization rate was 5444 percent and 46 percent at September 30, 2017 compared to 55 percent at2020 and December 31, 2016.2019.
Table 2822 presents certain home equity portfolio key credit statistics on both a reported basis excluding loans accounted for under the fair value option, and excluding the PCI loan portfolio and loans accounted for under the fair value option. Additionally, in the “Reported Basis” columns in the table below,statistics.
| | | | | | | | | | | | | | | | | | | | | | | | | | | | |
| | | | | | | | | | | | | | | | |
| Table 22 | Home Equity – Key Credit Statistics (1) |
| | | | | | | | | | | | | | | | |
| | | | | | | | | | | | |
| | | | | | | | | | | | | | |
| (Dollars in millions) | | | | | | | | | September 30
2020 | | December 31
2019 | | | | |
| Outstandings | | | | | | | | | $ | 36,530 | | | $ | 40,208 | | | | | |
Accruing past due 30 days or more (2) | | | | | | 215 | | | 218 | | | | | |
Nonperforming loans (2, 3) | | | | | | | | | 640 | | | 536 | | | | | |
| Percent of portfolio | | | | | | | | | | | | | | | |
| Refreshed CLTV greater than 90 but less than or equal to 100 | | | | 1 | % | | 1 | % | | | | |
| Refreshed CLTV greater than 100 | | | | | | 2 | | | 2 | | | | | |
| Refreshed FICO below 620 | | | | | | | | | 3 | | | 3 | | | | | |
2006 and 2007 vintages (4) | | | | | | | | 16 | | | 18 | | | | | |
| | | | | | | | | | | | | | | |
| | | | | | | | | | | | | | | |
| | | | | | | | | |
| | | |
| | | | | | | |
| | | | | | | | | | | | | | | |
| | | | | | | | | | | | | | | |
(1)Outstandings, accruing balances past due, 30 days or more and nonperforming loans do
not includeand percentages of the PCI loan portfolio in accordance with our accounting policies, even though the customer may be contractually past due. As such, the following discussion presents the home equity portfolio excluding the PCI loan portfolio andexclude loans accounted for under the fair value option. For more information on our interest accrual policies and delinquency status for loan modifications related to the PCI loan portfolio,COVID-19 pandemic, see page 45.
|
| | | | | | | | | | | | | | | | | | | | | | | | | | | | |
| | | | | | | | | | | | | | | | | |
| Table 28 | Home Equity – Key Credit Statistics |
| | | | | | | | | | | | | | | | | |
| | | | | | | | | | | Reported Basis (1) | | Excluding Purchased
Credit-impaired Loans |
| (Dollars in millions) | | | | | | | | | September 30
2017 | | December 31
2016 | | September 30
2017 | | December 31
2016 |
| Outstandings | | | | | | | | | $ | 59,752 |
| | $ | 66,443 |
| | $ | 56,839 |
| | $ | 62,832 |
|
Accruing past due 30 days or more (2) | | | | | | 581 |
| | 566 |
| | 581 |
| | 566 |
|
Nonperforming loans (2) | | | | | | | | | 2,691 |
| | 2,918 |
| | 2,691 |
| | 2,918 |
|
| Percent of portfolio | | | | | | | | | | | | | | | |
| Refreshed CLTV greater than 90 but less than or equal to 100 | | | | 4 | % | | 5 | % | | 3 | % | | 4 | % |
| Refreshed CLTV greater than 100 | | | | | | 6 |
| | 8 |
| | 5 |
| | 7 |
|
| Refreshed FICO below 620 | | | | | | | | | 7 |
| | 7 |
| | 6 |
| | 6 |
|
2006 and 2007 vintages (3) | | | | | | | | | 31 |
| | 37 |
| | 28 |
| | 34 |
|
| | | | | | | | | | | | | | | | |
| | Reported Basis | | Excluding Purchased Credit-impaired |
| | Three Months Ended
September 30 | | Nine Months Ended
September 30 | | Three Months Ended
September 30 | | Nine Months Ended
September 30 |
| | 2017 | | 2016 | | 2017 | | 2016 | | 2017 | | 2016 | | 2017 | | 2016 |
Net charge-off ratio (4) | 0.54 | % | | 0.55 | % | | 0.42 | % | | 0.61 | % | | 0.56 | % | | 0.58 | % | | 0.44 | % | | 0.65 | % |
| |
(1)
| Outstandings, accruing past due, nonperforming loans and percentages of the portfolio exclude loans accounted for under the fair value option. |
| |
(2)
| Accruing past due 30 days or more includes $74 million and $81 million and nonperforming loans include $329 million and $340 million of loans where we serviced the underlying first-lien at September 30, 2017 and December 31, 2016.
|
| |
(3)
| These vintages of loans have higher refreshed combined loan-to-value (CLTV) ratios and accounted for 52 percent and 50 percent of nonperforming home equity loans at September 30, 2017 and December 31, 2016, and 81 percent and 86 percent of net charge-offs for the three and nine months ended September 30, 2017 and 57 percent and 47 percent for the same periods in 2016.
|
| |
(4)
| Net charge-off ratios are calculated as annualized net charge-offs divided by average outstanding loans excluding loans accounted for under the fair value option. |
Nonperforming outstanding balances in the home equity portfolio decreased $227(2)Accruing past due 30 days or more include $30 million during the nine months endedat both September 30, 2017 as outflows, including $662020 and December 31, 2019, and nonperforming loans include $84 million and $57 million of net transfers to held-for-sale and $38 million of sales, outpaced new inflows, which includedloans where we serviced the addition of $135 million of nonperforming loans as a result of clarifying regulatory guidance related to bankruptcy loans. Of the nonperforming home equity portfoliounderlying first lien at September 30, 2017, $1.5 billion, or 55 percent, were current on contractual payments. Nonperforming2020 and December 31, 2019.
(3)Includes loans that are contractually current which primarily consist of collateral-dependent TDRs, including those that have been discharged in Chapter 7 bankruptcy, junior-lien loans where the underlying first-lienfirst lien is 90 days or more past due, as well as loans that have not yet demonstrated a sustained period of payment performance following a TDR.
(4)These vintages of loans accounted for 36 percent and 34 percent of nonperforming home equity loans at September 30, 2020 and December 31, 2019.
Nonperforming outstanding balances in the home equity portfolio increased $104 million during the nine months ended September 30, 2020 primarily driven by loans with deferrals that expired and have subsequently become nonperforming. Of the nonperforming home equity loans at September 30, 2020, $262 million, or 41 percent, were current on contractual payments. In addition, $713$223 million, or 2635 percent, of nonperforming home equity loans were 180 days or more past due and had been written down to the estimated fair value of the collateral, less costs to sell. Accruing loans that were 30 days or more past due increased $15decreased $3 million during the nine months ended September 30, 2017.
In some cases, the junior-lien home equity outstanding balance that we hold is performing, but the underlying first-lien is not. For outstanding balances in the home equity portfolio on which we service the first-lien loan, we are able to track whether the first-lien loan is in default. For loans where the first-lien is serviced by a third party, we utilize credit bureau data to estimate the delinquency status of the first-lien. Given that the credit bureau database we use does not include a property address for the mortgages, we are unable to identify with certainty whether a reported delinquent first-lien mortgage pertains to the same property for which we hold a junior-lien loan. For certain loans, we
utilize a third-party vendor to combine credit bureau and public record data to better link a junior-lien loan with the underlying first-lien mortgage. At September 30, 2017, we estimate that $856 million of current and $151 million of 30 to 89 days past due junior-lien loans were behind a delinquent first-lien loan. We service the first-lien loans on $191 million of these combined amounts, with the remaining $816 million serviced by third parties. Of the $1.0 billion of current to 89 days past due junior-lien loans, based on available credit bureau data and our own internal servicing data, we estimate that approximately $336 million had first-lien loans that were 90 days or more past due.2020.
Net charge-offs decreased $14increased $182 million to $83a net recovery of $20 million, and decreased $138$301 million to $197a net recovery of $45 million for the three and nine months ended September 30, 20172020 compared to the same periods in 2016. These decreases in net charge-offs were driven by favorable portfolio trends due in part to improvement in home prices and2019 as the U.S. economy, partially offset by $32 million of charge-offs as a result of clarifying regulatory guidance related to bankruptcy loans.
Outstanding balances with a refreshed CLTV greater than 100 percent comprised five percent and seven percent of the home equity portfolio at September 30, 2017 and December 31, 2016. Outstanding balances in the home equity portfolio with a refreshed CLTV greater than 100 percent reflect loans where our loan and available line of credit combined with any outstanding senior liens against the property are equal to or greater than the most recent valuation of the property securing the loan. Depending on the value of the property, there may be collateral in excess of the first-lien that is available to reduce the severity of loss on the second-lien. Of those outstanding balances with a refreshed CLTV greater than 100 percent, 95 percent of the customers were current on their
prior-year period included recoveries from non-core home equity loan and 91 percent of second-lien loans with a refreshed CLTV greater than 100 percent were current on both their second-lien and underlying first-lien loans at September 30, 2017.sales.
Of the $56.8$36.5 billion in total home equity portfolio outstandings at September 30, 2017,2020, as shown in Table 29, 3522, 15 percent require interest-only payments. The outstanding balance of HELOCs that have reached the end of their draw period and have entered the amortization period was $17.8$9.9 billion at September 30, 2017.2020. The HELOCs that have entered the
amortization period have experienced a higher percentage of early stage delinquencies and nonperforming status when compared to the HELOC portfolio as a whole. At September 30, 2017, $3792020, $145 million, or twoone percent of outstanding HELOCs that had entered the amortization period were accruing past due 30 days or more. In addition, at September 30, 2017, $2.0 billion,2020, $473 million, or 11five percent, of outstanding HELOCswere nonperforming. Loans that have yet to enter the amortization period in our interest-only portfolio are primarily post-2008 vintages and generally have better credit quality than the previous vintages that had entered the amortization period were nonperforming, of which $1.1 billion were contractually current. Loans in our HELOC portfolio generally have an initial draw period of 10 years and 16 percent of these loans will enter the amortization period through 2018 and will be required to make fully-amortizing payments.period. We communicate to contractually current customers more than a year prior to the end of their draw period to inform them of the potential change to the payment structure before entering the amortization period, and provide payment options to customers prior to the end of the draw period.
Although we do not actively track how many of our home equity customers pay only the minimum amount due on their home equity loans and lines, we can infer some of this information through a review of our HELOC portfolio that we service and that is still in its revolving period (i.e., customers may draw on and repay their line of credit, but are generally only required to pay interest on a monthly basis).period. During the three months ended September 30, 2017, approximately 352020, 17 percent of these customers with an outstanding balance did not pay any principal on their HELOCs.
Table 2923 presents outstandings, nonperforming balances and net charge-offs by certain state concentrations for the home equity portfolio. In the New York area, the New York-Northern New Jersey-Long Island MSA made up 13 percent of the outstanding home equity portfolio at both September 30, 2017 2020
and December 31, 2016. For the three and nine months ended September 30, 2017, loans within this MSA contributed 29 percent and 26 percent of net charge-offs within the home equity portfolio compared to 15 percent and 16 percent of net charge-offs for the same periods in 2016.2019. The Los Angeles-Long Beach-Santa Ana MSA within California made up 11 percent of the outstanding home equity portfolio at both September 30, 20172020 and December 31, 2016. For2019.
| | | | | | | | | | | | | | | | | | | | | | | | | | | | | | | | | | | | | | | | | | | | | | | | | | | | | | |
| | | | | | | | | | | | | | | | | | | | |
| Table 23 | Home Equity State Concentrations | | | | | | | | |
| | | | | | | | | | | | | | | | | | | | |
| | Outstandings (1) | | Nonperforming (1) | | Net Charge-offs | | | | |
| | | | | | | | | | | | | | |
| | September 30
2020 | | December 31
2019 | | September 30
2020 | | December 31
2019 | | Three Months Ended
September 30 | | Nine Months Ended
September 30 | | | | |
| (Dollars in millions) | | | | | 2020 | | 2019 | | 2020 | | 2019 | | | | |
| California | $ | 10,171 | | | $ | 11,232 | | | $ | 136 | | | $ | 101 | | | $ | (8) | | | $ | (54) | | | $ | (17) | | | $ | (109) | | | | | |
| Florida | 3,916 | | | 4,327 | | | 82 | | | 71 | | | (2) | | | (30) | | | (7) | | | (72) | | | | | |
| New Jersey | 2,925 | | | 3,216 | | | 67 | | | 56 | | | — | | | (13) | | | (1) | | | (11) | | | | | |
| New York | 2,636 | | | 2,899 | | | 100 | | | 85 | | | (1) | | | (10) | | | — | | | (4) | | | | | |
| Massachusetts | 1,826 | | | 2,023 | | | 34 | | | 29 | | | — | | | (6) | | | 1 | | | (6) | | | | | |
| Other | 15,056 | | | 16,511 | | | 221 | | | 194 | | | (9) | | | (89) | | | (21) | | | (144) | | | | | |
Total home equity loan portfolio | $ | 36,530 | | | $ | 40,208 | | | $ | 640 | | | $ | 536 | | | $ | (20) | | | $ | (202) | | | $ | (45) | | | $ | (346) | | | | | |
| | | | | | | | | | | | | | | | | | | |
| | | | | | | | | | | | | | | | | | | |
(1)Outstandings and nonperforming loans exclude loans accounted for under the fair value option.
Credit Card
At September 30, 2020, 97 percent of the credit card portfolio was managed in Consumer Banking with the remainder in GWIM. Outstandings in the credit card portfolio decreased $17.8 billion during the nine months ended September 30, 2020 to $79.8 billion due to lower retail spending. Net charge-offs decreased $208 million to $509 million and $280 million to $1.9 billion during the three and nine months ended September 30, 2017, loans within this MSA contributed net recoveries of $7 million and $16 million within the home equity portfolio compared to net charge-offs of $0 and $2 million for the same periods in 2016.
|
| | | | | | | | | | | | | | | | | | | | | | | | | | | | | | | | |
| | | | | | | | | | | | | | | | | |
| Table 29 | Home Equity State Concentrations | | | | |
| | | | | | | | | | | | | | | | | |
| | | Outstandings (1) | | Nonperforming (1) | | Net Charge-offs (2) |
| | | September 30
2017 | | December 31
2016 | | September 30
2017 | | December 31
2016 | | Three Months Ended
September 30 | | Nine Months Ended
September 30 |
| (Dollars in millions) | | | | | 2017 | | 2016 | | 2017 | | 2016 |
| California | $ | 15,699 |
| | $ | 17,563 |
| | $ | 782 |
| | $ | 829 |
| | $ | (9 | ) | | $ | 3 |
| | $ | (24 | ) | | $ | 12 |
|
Florida (3) | 6,508 |
| | 7,319 |
| | 405 |
| | 442 |
| | 13 |
| | 18 |
| | 34 |
| | 59 |
|
New Jersey (3) | 4,683 |
| | 5,102 |
| | 195 |
| | 201 |
| | 16 |
| | 12 |
| | 37 |
| | 37 |
|
New York (3) | 4,330 |
| | 4,720 |
| | 254 |
| | 271 |
| | 14 |
| | 11 |
| | 31 |
| | 37 |
|
| Massachusetts | 2,846 |
| | 3,078 |
| | 94 |
| | 100 |
| | 5 |
| | 2 |
| | 7 |
| | 10 |
|
| Other U.S./Non-U.S. | 22,773 |
| | 25,050 |
| | 961 |
| | 1,075 |
| | 44 |
| | 51 |
| | 112 |
| | 180 |
|
Home equity loans (4) | $ | 56,839 |
| | $ | 62,832 |
| | $ | 2,691 |
| | $ | 2,918 |
| | $ | 83 |
| | $ | 97 |
| | $ | 197 |
| | $ | 335 |
|
Purchased credit-impaired home equity portfolio (5) | 2,913 |
| | 3,611 |
| | |
| | |
| | |
| | |
| | | | |
| Total home equity loan portfolio | $ | 59,752 |
| | $ | 66,443 |
| | |
| | |
| | |
| | |
| | | | |
| |
(1)
| Outstandings and nonperforming loans exclude loans accounted for under the fair value option. |
| |
(2)
| Net charge-offs exclude $11 million and $49 million of write-offs in the home equity PCI loan portfolio for the three and nine months ended September 30, 2017 compared to $50 million and $161 million for the same periods in 2016. For more information on PCI write-offs, see Consumer Portfolio Credit Risk Management – Purchased Credit-impaired Loan Portfolio on page 45.
|
| |
(3)
| In these states, foreclosure requires a court order following a legal proceeding (judicial states). |
| |
(4)
| Amount excludes the PCI home equity portfolio. |
| |
(5)
| At September 30, 2017 and December 31, 2016, 28 percent and 29 percent of PCI home equity loans were in California. There were no other significant single state concentrations.
|
Purchased Credit-impaired Loan Portfolio
Loans acquired with evidence of credit quality deterioration since origination and for which it is probable at purchase that we will be unable to collect all contractually required payments are accounted for under the accounting standards for PCI loans. For more information on PCI loans, see Note 1 – Summary of Significant Accounting Principles to the Consolidated Financial Statements of
the Corporation's 2016 Annual Report on Form 10-K and Note 4 – Outstanding Loans and Leases to the Consolidated Financial Statements.
Table 30 presents the unpaid principal balance, carrying value, related valuation allowance and the net carrying value as a percentage of the unpaid principal balance for the PCI loan portfolio.
|
| | | | | | | | | | | | | | | | | | | |
| | | | | | | | | | | |
| Table 30 | Purchased Credit-impaired Loan Portfolio |
| | | | | | | | | | | |
| | | September 30, 2017 |
| (Dollars in millions) | Unpaid
Principal
Balance | | Gross Carrying
Value | | Related
Valuation
Allowance | | Carrying
Value Net of
Valuation
Allowance | | Percent of Unpaid
Principal
Balance |
Residential mortgage (1) | $ | 8,515 |
| | $ | 8,399 |
| | $ | 134 |
| | $ | 8,265 |
| | 97.06 | % |
| Home equity | 2,988 |
| | 2,913 |
| | 181 |
| | 2,732 |
| | 91.43 |
|
| Total purchased credit-impaired loan portfolio | $ | 11,503 |
| | $ | 11,312 |
| | $ | 315 |
| | $ | 10,997 |
| | 95.60 |
|
| | | | | | | | | | | |
| | | December 31, 2016 |
Residential mortgage (1) | $ | 10,330 |
| | $ | 10,127 |
| | $ | 169 |
| | $ | 9,958 |
| | 96.40 | % |
| Home equity | 3,689 |
| | 3,611 |
| | 250 |
| | 3,361 |
| | 91.11 |
|
| Total purchased credit-impaired loan portfolio | $ | 14,019 |
| | $ | 13,738 |
| | $ | 419 |
| | $ | 13,319 |
| | 95.01 |
|
| |
(1)
| At September 30, 2017 and December 31, 2016, pay option loans had an unpaid principal balance of $1.5 billion and $1.9 billion and a carrying value of $1.5 billion and $1.8 billion. This includes $1.3 billion and $1.6 billion of loans that were credit-impaired upon acquisition and $152 million and $226 million of loans that are 90 days or more past due at September 30, 2017 and December 31, 2016. The total unpaid principal balance of pay option loans with accumulated negative amortization was $177 million and $303 million, including $10 million and $16 million of negative amortization at September 30, 2017 and December 31, 2016.
|
The total PCI unpaid principal balance decreased $2.5 billion, or 18 percent, during the nine months ended September 30, 2017 primarily driven by payoffs, paydowns and write-offs. During the nine months ended September 30, 2017, we sold PCI loans with a carrying value of $742 million compared to sales of $435 million for the same period in 2016.
Of the unpaid principal balance of $11.5 billion at September 30, 2017, $10.1 billion, or 88 percent, was current based on the contractual terms, $811 million, or seven percent, was in early stage delinquency, and $394 million was 180 days or more past due, including $331 million of first-lien mortgages and $63 million of home equity loans.
The PCI residential mortgage loan portfolio represented 74 percent of the total PCI loan portfolio at September 30, 2017. Those loans to borrowers with a refreshed FICO score below 620 represented 25 percent of the PCI residential mortgage loan portfolio at September 30, 2017. Loans with a refreshed LTV greater than 90 percent, after consideration of purchase accounting adjustments and the related valuation allowance, represented 16 percent of the PCI residential mortgage loan portfolio and 17 percent based on the unpaid principal balance at September 30, 2017.
The PCI home equity portfolio represented 26 percent of the total PCI loan portfolio at September 30, 2017. Those loans with a refreshed FICO score below 620 represented 16 percent of the PCI home equity portfolio at September 30, 2017. Loans with a
refreshed CLTV greater than 90 percent, after consideration of purchase accounting adjustments and the related valuation allowance, represented 35 percent of the PCI home equity portfolio and 38 percent based on the unpaid principal balance at September 30, 2017.
U.S. Credit Card
At September 30, 2017, 97 percent of the U.S. credit card portfolio was managed in Consumer Banking with the remainder in GWIM.
Outstandings in the U.S. credit card portfolio remained relatively unchanged at $92.6 billion at September 30, 2017. Net charge-offs increased $69 million to $612 million, and $155 million to $1.9 billion for the three and nine months ended September 30, 20172020 compared to the same periods in 20162019 due to portfolio seasoninggovernment stimulus benefits and loan growth. U.S. creditpayment deferrals associated with COVID-19. Credit card loans 30 days or more past due and still
accruing interest increased $62decreased $765 million and loans 90 days or more past due and still accruing interest increased $28decreased $496 million during the nine months ended September 30, 2017, driven by portfolio seasoningprimarily due to government stimulus benefits and payment deferrals along with declines in loan growth.balances associated with COVID-19.
Unused lines of credit for U.S. credit card totaled $332.0 billion and $321.6increased to $344.6 billion at September 30, 2017 and2020 from $336.9 billion at December 31, 2016. The increase was2019 driven by a seasonal decrease in line utilization due to a decrease in transaction volume as well as account growth and lines of credit increases.decreased consumer spending.
Table 3124 presents certain state concentrations for the U.S. credit card portfolio.
| | | | | | | | | | | | | | | | | | | | | | | | | | | | | | | | | | | | | | | | | | | | | | | | | | | | | | |
| | | | | | | | | | | | | | | | | | | | |
| Table 24 | Credit Card State Concentrations | | | | | | | | |
| | | | | | | | | | | | | | | | | | | | |
| | Outstandings | | Accruing Past Due 90 Days or More (1) | | Net Charge-offs | | | | |
| | | | | | | | | | |
| | September 30
2020 | | December 31
2019 | | September 30
2020 | | December 31
2019 | | Three Months Ended
September 30 | | Nine Months Ended
September 30 | | | | |
| (Dollars in millions) | | | | | 2020 | | 2019 | | 2020 | | 2019 | | | | |
| California | $ | 12,820 | | | $ | 16,135 | | | $ | 96 | | | $ | 178 | | | $ | 92 | | | $ | 132 | | | $ | 347 | | | $ | 398 | | | | | |
| Florida | 7,634 | | | 9,075 | | | 73 | | | 135 | | | 66 | | | 90 | | | 252 | | | 272 | | | | | |
| Texas | 6,578 | | | 7,815 | | | 51 | | | 93 | | | 45 | | | 58 | | | 166 | | | 180 | | | | | |
| New York | 4,799 | | | 5,975 | | | 44 | | | 80 | | | 43 | | | 63 | | | 154 | | | 183 | | | | | |
| Washington | 3,696 | | | 4,639 | | | 13 | | | 26 | | | 12 | | | 17 | | | 47 | | | 53 | | | | | |
| Other | 44,307 | | | 53,969 | | | 269 | | | 530 | | | 251 | | | 357 | | | 978 | | | 1,138 | | | | | |
| Total credit card portfolio | $ | 79,834 | | | $ | 97,608 | | | $ | 546 | | | $ | 1,042 | | | $ | 509 | | | $ | 717 | | | $ | 1,944 | | | $ | 2,224 | | | | | |
|
| | | | | | | | | | | | | | | | | | | | | | | | | | | | | | | | |
| | | | | | | | | | | | | | | | | |
| Table 31 | U.S. Credit Card State Concentrations | | | | |
| | | | | | | | | | | | | | | | | |
| | | Outstandings | | Accruing Past Due
90 Days or More | | Net Charge-offs |
| | | September 30
2017 | | December 31
2016 | | September 30
2017 | | December 31
2016 | | Three Months Ended
September 30 | | Nine Months Ended
September 30 |
| (Dollars in millions) | | | | | 2017 | | 2016 | | 2017 | | 2016 |
| California | $ | 14,533 |
| | $ | 14,251 |
| | $ | 125 |
| | $ | 115 |
| | $ | 104 |
| | $ | 86 |
| | $ | 303 |
| | $ | 269 |
|
| Florida | 8,030 |
| | 7,864 |
| | 74 |
| | 85 |
| | 58 |
| | 60 |
| | 195 |
| | 184 |
|
| Texas | 7,211 |
| | 7,037 |
| | 67 |
| | 65 |
| | 46 |
| | 40 |
| | 143 |
| | 122 |
|
| New York | 5,762 |
| | 5,683 |
| | 78 |
| | 60 |
| | 59 |
| | 39 |
| | 155 |
| | 120 |
|
| Washington | 4,177 |
| | 4,128 |
| | 20 |
| | 18 |
| | 13 |
| | 13 |
| | 41 |
| | 42 |
|
| Other U.S. | 52,889 |
| | 53,315 |
| | 446 |
| | 439 |
| | 332 |
| | 305 |
| | 1,021 |
| | 966 |
|
| Total U.S. credit card portfolio | $ | 92,602 |
| | $ | 92,278 |
| | $ | 810 |
| | $ | 782 |
| | $ | 612 |
| | $ | 543 |
| | $ | 1,858 |
| | $ | 1,703 |
|
(1)For information on our interest accrual policies and delinquency status for loan modifications related to the COVID-19 pandemic, see Note 1 – Summary of Significant Accounting Principles to the Consolidated Financial Statements.
Direct/Indirect Consumer
At September 30, 2017, approximately 542020, 53 percent of the direct/indirect portfolio was included in Consumer Banking (consumer auto and specialty lending – automotive, marine, aircraft, recreational vehicle, loansmarine, aircraft and consumer personal loans) and 4647 percent was
included in GWIM (principally securities-based lending loans).
Outstandings in the direct/indirect portfolio decreased $698 million$1.1 billion during the nine months ended September 30, 20172020 to $89.9 billion primarily due to lower originations in Auto.
primarily driven by lower draws and utilization in the securities-based lending portfolio.
Net charge-offs increased $33 million to $67 million, and $56 million to $147 million for the three and nine months ended September 30, 2017 compared to the same periods in 2016 due largely to recent clarifying regulatory guidance related to bankruptcy and repossessed loans.
Table 3225 presents certain state concentrations for the direct/indirect consumer loan portfolio.
| | | | | | | | | | | | | | | | | | | | | | | | | | | | | | | | | | | | | | | | | | | | | | | | | | | | | | |
| | | | | | | | | | | | | | | | | | | | |
| Table 25 | Direct/Indirect State Concentrations | | | | | | | | |
| | | | | | | | | | | | | | | | | | | | |
| | Outstandings | | Accruing Past Due
90 Days or More (1) | | Net Charge-offs | | | | |
| | | | | | | | | | | | | | | | |
| | September 30
2020 | | December 31
2019 | | September 30
2020 | | December 31
2019 | | Three Months Ended
September 30 | | Nine Months Ended
September 30 | | | | |
| | | | | | | | | | | | | | | | |
| (Dollars in millions) | | | | | 2020 | | 2019 | | 2020 | | 2019 | | | | |
| California | $ | 11,950 | | | $ | 11,912 | | | $ | 3 | | | $ | 4 | | | $ | 2 | | | $ | 32 | | | $ | 13 | | | $ | 44 | | | | | |
| Florida | 10,581 | | | 10,154 | | | 4 | | | 4 | | | 3 | | | 5 | | | 14 | | | 21 | | | | | |
| Texas | 8,915 | | | 9,516 | | | 3 | | | 5 | | | 4 | | | 8 | | | 13 | | | 23 | | | | | |
| New York | 6,542 | | | 6,394 | | | 2 | | | 1 | | | 2 | | | 3 | | | 6 | | | 9 | | | | | |
| New Jersey | 3,472 | | | 3,468 | | | — | | | 1 | | | — | | | 1 | | | 1 | | | 3 | | | | | |
| Other | 48,454 | | | 49,554 | | | 15 | | | 18 | | | 7 | | | 27 | | | 37 | | | 70 | | | | | |
Total direct/indirect loan
portfolio | $ | 89,914 | | | $ | 90,998 | | | $ | 27 | | | $ | 33 | | | $ | 18 | | | $ | 76 | | | $ | 84 | | | $ | 170 | | | | | |
(1)For information on our interest accrual policies and delinquency status for loan modifications related to the COVID-19 pandemic, see Note 1 – Summary of Significant Accounting Principles to the Consolidated Financial Statements.
|
| | | | | | | | | | | | | | | | | | | | | | | | | | | | | | | | |
| | | | | | | | | | | | | | | | | |
| Table 32 | Direct/Indirect State Concentrations | | | | |
| | | | | | | | | | | | | | | | | |
| | | Outstandings | | Accruing Past Due
90 Days or More | | Net Charge-offs |
| | | September 30
2017 | | December 31
2016 | | September 30
2017 | | December 31
2016 | | Three Months Ended
September 30 | | Nine Months Ended
September 30 |
| (Dollars in millions) | | | | | 2017 | | 2016 | | 2017 | | 2016 |
| California | $ | 11,039 |
| | $ | 11,300 |
| | $ | 3 |
| | $ | 3 |
| | $ | 7 |
| | $ | 4 |
| | $ | 14 |
| | $ | 9 |
|
| Florida | 10,469 |
| | 9,418 |
| | 4 |
| | 3 |
| | 15 |
| | 7 |
| | 31 |
| | 20 |
|
| Texas | 10,410 |
| | 9,406 |
| | 3 |
| | 5 |
| | 13 |
| | 6 |
| | 29 |
| | 14 |
|
| New York | 6,085 |
| | 5,253 |
| | 2 |
| | 1 |
| | 2 |
| | — |
| | 3 |
| | 1 |
|
| Illinois | 3,436 |
| | 2,996 |
| | 1 |
| | 1 |
| | 3 |
| | 1 |
| | 5 |
| | 3 |
|
| Other U.S./Non-U.S. | 51,952 |
| | 55,716 |
| | 18 |
| | 21 |
| | 27 |
| | 16 |
| | 65 |
| | 44 |
|
| Total direct/indirect loan portfolio | $ | 93,391 |
| | $ | 94,089 |
| | $ | 31 |
| | $ | 34 |
| | $ | 67 |
| | $ | 34 |
| | $ | 147 |
| | $ | 91 |
|
Other Consumer
At September 30, 2017, approximately 93 percent of the $2.4 billion other consumer portfolio was consumer auto leases included in Consumer Banking. The remainder is primarily associated with certain consumer finance businesses that we previously exited.
Nonperforming Consumer Loans, Leases and Foreclosed Properties Activity
Table 3326 presents nonperforming consumer loans, leases and foreclosed properties activity for the three and nine months ended September 30, 20172020 and 2016. For more information on nonperforming loans, see Note 1 – Summary of Significant Accounting Principles to the Consolidated Financial Statements of the Corporation's 2016 Annual Report on Form 10-K and Note 4 – Outstanding Loans and Leases to the Consolidated Financial Statements.2019. During the nine months ended September 30, 2017,2020, nonperforming consumer loans declined $752increased $304 million to $5.3$2.4 billion primarily driven in part by loan salesloans with deferrals that expired and have subsequently become nonperforming, as well as the inclusion of $423$137 million of certain loans that were previously classified as purchased credit-impaired loans and net transfers of loans to held-for-sale of $198 million. Additionally, nonperforming loans declined as outflows outpaced new inflows, which included the addition of $295accounted for under a pool basis.
At September 30, 2020, $791 million, or 34 percent of nonperforming loans as a result of clarifying regulatory guidance related to bankruptcy loans.
The outstanding balance of a real estate-secured loan that is in excess of the estimated property value less costs to sell is charged off no later than the end of the month in which the loan becomeswere 180 days or more past due unless repayment of the loan is fully insured. At September 30, 2017, $1.9 billion, or 35 percent of nonperforming consumer real estate loans and foreclosed properties had been written down to their estimated property value less costs to sell, including $1.7 billion of nonperforming loans 180 days or more past due and $259 million of foreclosed
properties.sell. In addition, at September 30, 2017, $2.3 billion,2020, $831 million, or 4535 percent of nonperforming consumer loans were modified and
are now current after successful trial periods, or are current loans classified as nonperforming loans in accordance with applicable policies.
Foreclosed properties decreased $104$94 million during the nine months ended September 30, 20172020 to $135 million as liquidations outpaced additions. PCI loans are excluded from nonperforming loans as these loans were written down to fair value at the acquisition date; however, once we acquire the underlying real estate upon foreclosure of the delinquent PCI loan, it is included in foreclosed properties. Not included in foreclosed properties at September 30, 2017 was $879 million of real estate that was acquired upon foreclosure of certain delinquent government-guaranteed loans (principally FHA-insured loans). We exclude these amounts from our nonperforming loans and foreclosed properties activity as we expect we will be reimbursed once the property is conveyed to the guarantor for principal and, up to certain limits, costs incurred during the foreclosure process and interest accrued during the holding period.
Nonperforming loans also include certain loans that have been modified in TDRs where economic concessions have been granted to borrowers experiencing financial difficulties. These concessions typically result from our loss mitigation activities and could include reductions in the interest rate, payment extensions, forgiveness of principal, forbearance or other actions. CertainNonperforming TDRs are classified as nonperforming atincluded in Table 26. For more information on our loan modification programs offered in response to the timeCOVID-19 pandemic, which are not TDRs, see Executive Summary - Recent Developments – COVID-19 Pandemic on page 3 and Note 1 – Summary of restructuring andSignificant Accounting Principles to the Consolidated Financial Statements.
| | | | | | | | | | | | | | | | | | | | | | | | | | |
| | | | | | | | |
| Table 26 | Nonperforming Consumer Loans, Leases and Foreclosed Properties Activity | | | | |
| | | | | | | | |
| | Three Months Ended
September 30 | | Nine Months Ended
September 30 |
| (Dollars in millions) | 2020 | | 2019 | | 2020 | | 2019 |
| Nonperforming loans and leases, beginning of period | $ | 2,191 | | | $ | 3,027 | | | $ | 2,053 | | | $ | 3,842 | |
| Additions | 587 | | | 335 | | | 1,418 | | | 1,116 | |
| Reductions: | | | | | | | |
| Paydowns and payoffs | (113) | | | (197) | | | (303) | | | (580) | |
| Sales | — | | | (748) | | | (31) | | | (1,414) | |
Returns to performing status (1) | (291) | | | (185) | | | (689) | | | (623) | |
| Charge-offs | (13) | | | (23) | | | (62) | | | (80) | |
| Transfers to foreclosed properties | (4) | | | (20) | | | (29) | | | (72) | |
| | | | | | | |
| Total net additions/(reductions) to nonperforming loans and leases | 166 | | | (838) | | | 304 | | | (1,653) | |
| Total nonperforming loans and leases, September 30 | 2,357 | | | 2,189 | | | 2,357 | | | 2,189 | |
Foreclosed properties, September 30 (2) | 135 | | | 188 | | | 135 | | | 188 | |
| Nonperforming consumer loans, leases and foreclosed properties, September 30 | $ | 2,492 | | | $ | 2,377 | | | $ | 2,492 | | | $ | 2,377 | |
Nonperforming consumer loans and leases as a percentage of outstanding consumer loans and leases (3) | 0.54 | % | | 0.48 | % | | | | |
Nonperforming consumer loans, leases and foreclosed properties as a percentage of outstanding consumer loans, leases and foreclosed properties (3) | 0.57 | | | 0.52 | | | | | |
(1)Consumer loans may only be returned to performing status after consideringwhen all principal and interest is current and full repayment of the borrower’s sustained repayment performance for a reasonable period, generally six months. Nonperforming TDRs, excluding those modified loansremaining contractual principal and interest is expected, or when the loan otherwise becomes well-secured and is in the PCI loan portfolio, are included in Table 33.process of collection.
(2)Foreclosed property balances do not include properties insured by certain government-guaranteed loans, principally FHA-insured, of $131 million and $275 million at September 30, 2020 and 2019.
(3)Outstanding consumer loans and leases exclude loans accounted for under the fair value option.
|
| | | | | | | | | | | | | | | | |
| | | | | | | | | |
| Table 33 | Nonperforming Consumer Loans, Leases and Foreclosed Properties Activity (1) | | | | |
| | | | | | | | | |
| | | Three Months Ended September 30 | | Nine Months Ended
September 30 |
| (Dollars in millions) | 2017 | | 2016 | | 2017 | | 2016 |
| Nonperforming loans and leases, beginning of period | $ | 5,282 |
| | $ | 6,705 |
| | $ | 6,004 |
| | $ | 8,165 |
|
| Additions | 999 |
| | 831 |
| | 2,499 |
| | 2,581 |
|
| Reductions: | | | | | | | |
| Paydowns and payoffs | (117 | ) | | (220 | ) | | (517 | ) | | (605 | ) |
| Sales | (162 | ) | | (237 | ) | | (423 | ) | | (1,331 | ) |
Returns to performing status (2) | (347 | ) | | (383 | ) | | (1,101 | ) | | (1,220 | ) |
| Charge-offs | (346 | ) | | (279 | ) | | (845 | ) | | (1,008 | ) |
| Transfers to foreclosed properties | (57 | ) | | (67 | ) | | (167 | ) | | (232 | ) |
| Transfers to loans held-for-sale | — |
| | — |
| | (198 | ) | | — |
|
| Total net reductions to nonperforming loans and leases | (30 | ) | | (355 | ) | | (752 | ) | | (1,815 | ) |
Total nonperforming loans and leases, September 30 (3) | 5,252 |
| | 6,350 |
| | 5,252 |
| | 6,350 |
|
Total foreclosed properties, September 30 (4) | 259 |
| | 372 |
| | 259 |
| | 372 |
|
| Nonperforming consumer loans, leases and foreclosed properties, September 30 | $ | 5,511 |
| | $ | 6,722 |
| | $ | 5,511 |
| | $ | 6,722 |
|
Nonperforming consumer loans and leases as a percentage of outstanding consumer loans and leases (5) | 1.17 | % | | 1.41 | % | | | | |
Nonperforming consumer loans, leases and foreclosed properties as a percentage of outstanding consumer loans, leases and foreclosed properties (5) | 1.23 |
| | 1.49 |
| | | | |
| | | | | | | | |
(1)
| | Balances do not include nonperforming LHFSBank of $1 million and $12 million and nonaccruing TDRs removed from the PCI loan portfolio prior to January 1, 2010 of $24 million and $27 million at September 30, 2017 and 2016 as well as loans accruing past due 90 days or more as presented in Table 23 and Note 4 – Outstanding Loans and Leases to the Consolidated Financial Statements.America 36
|
| |
(2)
| Consumer loans may be returned to performing status when all principal and interest is current and full repayment of the remaining contractual principal and interest is expected, or when the loan otherwise becomes well-secured and is in the process of collection. |
| |
(3)
| At September 30, 2017, 32 percent of nonperforming loans were 180 days or more past due. |
| |
(4)
| Foreclosed property balances do not include properties insured by certain government-guaranteed loans, principally FHA-insured loans, of $879 million and $1.3 billion at September 30, 2017 and 2016.
|
| |
(5)
| Outstanding consumer loans and leases exclude loans accounted for under the fair value option. |
We classify junior-lien home equity loans as nonperforming when the first-lien loan becomes 90 days past due even if the junior-lien loan is performing. At September 30, 2017 and December 31, 2016, $336 million and $428 million of such junior-lien home equity loans were included in nonperforming loans and leases.
Table 3427 presents TDRs for the consumer real estate portfolio. Performing TDR balances are excluded from nonperforming loans and leases in Table 33.
| | | | | | | | | | | | | | | | | | | | | | | | | | | | | | | | | | | | | | |
| | | | | | | | | | | | |
| Table 27 | Consumer Real Estate Troubled Debt Restructurings |
| | | | | | | | | | | | |
| | September 30, 2020 | | December 31, 2019 |
| (Dollars in millions) | Nonperforming | | Performing | | Total | | Nonperforming | | Performing | | Total |
Residential mortgage (1, 2) | $ | 852 | | | $ | 3,079 | | | $ | 3,931 | | | $ | 921 | | | $ | 3,832 | | | $ | 4,753 | |
Home equity (3) | 241 | | | 876 | | | 1,117 | | | 252 | | | 977 | | | 1,229 | |
| Total consumer real estate troubled debt restructurings | $ | 1,093 | | | $ | 3,955 | | | $ | 5,048 | | | $ | 1,173 | | | $ | 4,809 | | | $ | 5,982 | |
|
| | | | | | | | | | | | | | | | | | | | | | | | |
| | | | | | | | | | | | | |
| Table 34 | Consumer Real Estate Troubled Debt Restructurings |
| | | | | | | | | | | | | |
| | | September 30, 2017 | | December 31, 2016 |
| (Dollars in millions) | Total | | Nonperforming | | Performing | | Total | | Nonperforming | | Performing |
Residential mortgage (1, 2) | $ | 10,251 |
| | $ | 1,575 |
| | $ | 8,676 |
| | $ | 12,631 |
| | $ | 1,992 |
| | $ | 10,639 |
|
Home equity (3) | 2,871 |
| | 1,480 |
| | 1,391 |
| | 2,777 |
| | 1,566 |
| | 1,211 |
|
| Total consumer real estate troubled debt restructurings | $ | 13,122 |
| | $ | 3,055 |
| | $ | 10,067 |
| | $ | 15,408 |
| | $ | 3,558 |
| | $ | 11,850 |
|
| |
(1)(2)At September 30, 2020 and December 31, 2019, residential mortgage performing TDRs include $1.6 billion and $2.1 billion of loans that were fully-insured. (3)At September 30, 2020 and December 31, 2019, home equity TDRs deemed collateral dependent totaled $408 million and $442 million, and include $206 million and $209 million of loans classified as nonperforming and $202 million and $233 million of loans classified as performing. | At September 30, 2017 and December 31, 2016, residential mortgage TDRs deemed collateral dependent totaled $2.9 billion and $3.5 billion, and included $1.3 billion and $1.6 billion of loans classified as nonperforming and $1.6 billion and $1.9 billion of loans classified as performing.
|
| |
(2)
| Residential mortgage performing TDRs included $4.1 billion and $5.3 billion of loans that were fully-insured at September 30, 2017 and December 31, 2016.
|
| |
(3)
| Home equity TDRs deemed collateral dependent totaled $1.6 billion and included $1.3 billion of loans classified as nonperforming for both periods, and $382 million and $301 million of loans classified as performing at September 30, 2017 and December 31, 2016.
|
In addition to modifying consumer real estate loans, we work with customers who are experiencing financial difficulty by modifying credit card and other consumer loans. Credit card and other consumer loan modifications generally involve a reduction in the customer’s interest rate on the account and placing the customer on a fixed payment plan not exceeding 60 months, all of which are considered TDRs (the renegotiated TDR portfolio).months.
Modifications of credit card and other consumer loans are made through renegotiation programs utilizing direct customer contact, but may also utilize external renegotiation programs. The renegotiated TDR portfolio is excluded in large part from Table 33 as substantially all of the loans remain on accrual status until either charged off or paid in full. At September 30, 20172020 and December 31, 2016,2019, our renegotiatedcredit card and other consumer TDR portfolio was $485$699 million and $610$679 million, of which $428$624 million and $493$570 million were current or less than 30 days past due under the modified terms. The decline in the renegotiated TDR portfolio was primarily
driven by paydowns and charge-offs as well as lower program enrollments. For more information on the renegotiated TDR portfolio, see Note 4 – Outstanding Loans and Leases to the Consolidated Financial Statements.
Commercial Portfolio Credit Risk Management
Commercial credit risk is evaluated and managed with the goal that concentrations of credit exposure do not result in undesirable levels of risk.continue to be aligned with our risk appetite. We review, measure and manage concentrations of credit exposure by industry, product, geography, customer relationship and loan size. We also review, measure and manage commercial real estate loans by geographic location and property type. In addition, within our non-U.S. portfolio, we evaluate exposures by region and by country. Tables 39, 4232, 35 and 4738 summarize our concentrations. We also utilize syndications of exposure to third parties, loan sales, hedging and other risk mitigation techniques to manage the size and risk profile of the
commercial credit portfolio. For more information on our industry concentrations, including our utilized exposure to the energy sector, which was three percent of total commercial utilized exposure at both September 30, 2017 and December 31, 2016, see Commercial Portfolio Credit Risk Management – Industry Concentrations on page 5341 and Table 42.35.
For more information on our accounting policies regarding delinquencies, nonperforming status, and net charge-offs and TDRs for the commercial portfolio, see Note 1 – Summary of Significant Accounting Principles to the Consolidated Financial Statements of the Corporation’s 2019 Annual Report on Form 10-K.
For information on the accounting for loan modifications related to the COVID-19 pandemic, see Note 1 – Summary of Significant Accounting Principles to the Consolidated Financial Statements of the Corporation's 2016 Annual Report on Form 10-K.Statements.
Commercial Credit Portfolio
During the nine months ended September 30, 2017, other than2020, commercial asset quality weakened as a result of the economic impact from COVID-19. However, there were also positive signs during this period. The draws by large corporate and commercial clients contributing to the $67.2 billion loan growth in the higher risk energy sub-sectors, credit quality among large corporate borrowersfirst quarter of 2020 have largely been repaid over the past six months as emergency or contingent funding was strong. We saw further improvementno longer needed or clients were able to access capital markets. Additionally, as part of the CARES Act, we had $24.7 billion of PPP loans outstanding with our small business clients at September 30, 2020, which are included in U.S. small business commercial in the energy sectortables in this section. For more information on PPP loans, see Note 1 – Summary of Significant Accounting Principles to the nine months ended September 30, 2017.Consolidated Financial Statements.
Credit quality of commercial real estate borrowers continuedhas begun to stabilize in many sectors as certain economies have reopened. Certain sectors, including hospitality and retail, continue to be strong with conservative LTV ratios, stable market rentsnegatively impacted as a result of COVID-19. Moreover, many real estate markets, while improving, are still experiencing some disruptions in most sectorsdemand, supply chain challenges and vacancy rates remaining low.tenant difficulties.
OutstandingThe commercial loansallowance for loan and leaseslease losses increased $20.0$4.0 billion during the nine months ended September 30, 2017 primarily in U.S. commercial. Nonperforming commercial loans and leases decreased $433 million2020 to $1.4$8.9 billion and reservable criticized balances decreased $1.5 billiondue to $14.8 billion during the nine months ended September 30, 2017 driven by improvementsdeterioration in the energy sector. The allowance for loan and lease losses foreconomic outlook resulting from the commercial portfolio decreased $147 million to $5.1 billion at September 30, 2017 compared to December 31, 2016.impact of COVID-19. For more information, see Allowance for Credit Losses on page 57.44.
Table 35 presents ourTotal commercial loans and leases portfolio and relatedutilized credit quality information at September 30, 2017 and December 31, 2016.
|
| | | | | | | | | | | | | | | | | | | | | | | | |
| | | | | | | | | | | | | |
| Table 35 | Commercial Loans and Leases |
| | | |
| | | Outstandings | | Nonperforming | | Accruing Past Due 90 Days or More |
| (Dollars in millions) | September 30
2017 | | December 31
2016 | | September 30
2017 | | December 31
2016 | | September 30
2017 | | December 31
2016 |
| U.S. commercial | $ | 282,677 |
| | $ | 270,372 |
| | $ | 863 |
| | $ | 1,256 |
| | $ | 82 |
| | $ | 106 |
|
Commercial real estate (1) | 59,628 |
| | 57,355 |
| | 130 |
| | 72 |
| | — |
| | 7 |
|
| Commercial lease financing | 21,413 |
| | 22,375 |
| | 26 |
| | 36 |
| | 38 |
| | 19 |
|
| Non-U.S. commercial | 95,896 |
| | 89,397 |
| | 244 |
| | 279 |
| | — |
| | 5 |
|
| | | 459,614 |
| | 439,499 |
| | 1,263 |
| | 1,643 |
| | 120 |
| | 137 |
|
U.S. small business commercial (2) | 13,603 |
| | 12,993 |
| | 55 |
| | 60 |
| | 68 |
| | 71 |
|
| Commercial loans excluding loans accounted for under the fair value option | 473,217 |
| | 452,492 |
| | 1,318 |
| | 1,703 |
| | 188 |
| | 208 |
|
Loans accounted for under the fair value option (3) | 5,307 |
| | 6,034 |
| | 36 |
| | 84 |
| | — |
| | — |
|
| Total commercial loans and leases | $ | 478,524 |
| | $ | 458,526 |
| | $ | 1,354 |
| | $ | 1,787 |
| | $ | 188 |
| | $ | 208 |
|
| |
(1)
| Includes U.S. commercial real estate of $55.5 billion and $54.3 billion and non-U.S. commercial real estate of $4.2 billion and $3.1 billion at September 30, 2017 and December 31, 2016.
|
| |
(2)
| Includes card-related products. |
| |
(3)
| Commercial loans accounted for underexposure decreased $4.1 billion during the fair value option include U.S. commercial of $2.8 billion and $2.9 billion and non-U.S. commercial of $2.5 billion and $3.1 billion at September 30, 2017 and December 31, 2016. For more information on the fair value option, see Note 15 – Fair Value Option to the Consolidated Financial Statements.
|
Table 36 presents net charge-offs and related ratios for our commercial loans and leases for the three and nine months ended September 30, 20172020 to $631.2 billion driven by lower loans held-for-sale (LHFS) and 2016.lower loans and leases. The increaseutilization rate for loans and leases, standby letters of credit (SBLCs) and financial guarantees, and commercial letters of credit, in net charge-offs of $59 million and $36 million for the three and nine months endedaggregate, was 58 percent at both September 30, 2017 compared to the same periods in 2016 was driven by higher energy losses, partially offset by lower charge-offs in commercial lease financing. Also, the prior-year period included commercial real estate recoveries.2020 and December 31, 2019.
|
| | | | | | | | | | | | | | | | | | | | | | | | | | | | |
| | | | | | | | | | | | | | | | | |
| Table 36 | Commercial Net Charge-offs and Related Ratios |
| | | | | | | | | | | |
| | | Net Charge-offs | | Net Charge-off Ratios (1) |
| | | Three Months Ended
September 30 | | Nine Months Ended
September 30 | | Three Months Ended
September 30 | | Nine Months Ended
September 30 |
| (Dollars in millions) | 2017 | | 2016 | | 2017 | | 2016 | | 2017 | | 2016 | | 2017 | | 2016 |
| U.S. commercial | $ | 80 |
| | $ | 62 |
| | $ | 176 |
| | $ | 155 |
| | 0.11 | % | | 0.10 | % | | 0.09 | % | | 0.08 | % |
| Commercial real estate | 2 |
| | (23 | ) | | 3 |
| | (31 | ) | | 0.02 |
| | (0.16 | ) | | 0.01 |
| | (0.07 | ) |
| Commercial lease financing | (1 | ) | | 6 |
| | — |
| | 19 |
| | (0.02 | ) | | 0.11 |
| | — |
| | 0.12 |
|
| Non-U.S. commercial | 33 |
| | 10 |
| | 94 |
| | 97 |
| | 0.14 |
| | 0.04 |
| | 0.14 |
| | 0.14 |
|
| | | 114 |
| | 55 |
| | 273 |
| | 240 |
| | 0.10 |
| | 0.05 |
| | 0.08 |
| | 0.08 |
|
| U.S. small business commercial | 55 |
| | 55 |
| | 160 |
| | 157 |
| | 1.61 |
| | 1.67 |
| | 1.60 |
| | 1.62 |
|
| Total commercial | $ | 169 |
| | $ | 110 |
| | $ | 433 |
| | $ | 397 |
| | 0.14 |
| | 0.10 |
| | 0.13 |
| | 0.12 |
|
| | | | | | | | |
(1)37Bank of America
| Net charge-off ratios are calculated as annualized net charge-offs divided by average outstanding loans and leases excluding loans accounted for under the fair value option. | |
Table 3728 presents commercial credit exposure by type for utilized, unfunded and total binding committed credit exposure. Commercial utilized credit exposure includes standby letters of credit (SBLCs)SBLCs and financial guarantees bankers’ acceptances and commercial letters of credit that have been issued and for which we are legally bound to advance
funds under prescribed conditions during a specified time period, and excludes exposure related to trading account assets. Although funds have not yet been advanced, these exposure types are considered utilized for credit risk management purposes.
| | | | | | | | | | | | | | | | | | | | | | | | | | | | | | | | | | | | | | |
| | | | | | | | | | | | |
| Table 28 | Commercial Credit Exposure by Type |
| | | | | | | | | | | | |
| | | Commercial Utilized (1) | | Commercial Unfunded (2, 3, 4) | | Total Commercial Committed |
| | | | | | | | | | | | |
| (Dollars in millions) | September 30
2020 | | December 31
2019 | | September 30
2020 | | December 31
2019 | | September 30
2020 | | December 31
2019 |
| Loans and leases | $ | 515,379 | | | $ | 517,657 | | | $ | 396,920 | | | $ | 405,834 | | | $ | 912,299 | | | $ | 923,491 | |
Derivative assets (5) | 44,297 | | | 40,485 | | | — | | | — | | | 44,297 | | | 40,485 | |
| Standby letters of credit and financial guarantees | 35,406 | | | 36,062 | | | 531 | | | 468 | | | 35,937 | | | 36,530 | |
| Debt securities and other investments | 24,049 | | | 25,546 | | | 5,066 | | | 5,101 | | | 29,115 | | | 30,647 | |
| Loans held-for-sale | 3,732 | | | 7,047 | | | 6,553 | | | 15,135 | | | 10,285 | | | 22,182 | |
| Operating leases | 6,482 | | | 6,660 | | | — | | | — | | | 6,482 | | | 6,660 | |
| Commercial letters of credit | 817 | | | 1,049 | | | 296 | | | 451 | | | 1,113 | | | 1,500 | |
| Other | 1,033 | | | 800 | | | — | | | — | | | 1,033 | | | 800 | |
| Total | $ | 631,195 | | | $ | 635,306 | | | $ | 409,366 | | | $ | 426,989 | | | $ | 1,040,561 | | | $ | 1,062,295 | |
(1)Commercial utilized exposure includes loans of $6.6 billion and $7.7 billion and issued letters of credit with a notional amount of $121 million and $170 million accounted for under the fair value option at September 30, 2020 and December 31, 2019.
(2)Commercial unfunded exposure includes commitments accounted for under the fair value option with a notional amount of $3.2 billion and $4.2 billion at September 30, 2020 and December 31, 2019.
(3)Excludes unused business card lines, which are not legally binding.
(4)Includes the notional amount of unfunded legally binding lending commitments net of amounts distributed (i.e., syndicated or participated) to other financial institutions. The distributed amounts were $10.3 billion and $10.6 billion at September 30, 2020 and December 31, 2019.
(5)Derivative assets are carried at fair value, reflect the effects of legally enforceable master netting agreements and have been reduced by cash collateral of $41.3 billion and $33.9 billion at September 30, 2020 and December 31, 2019. Not reflected in utilized and committed exposure is additional non-cash derivative collateral held of $35.0 billion and $35.2 billion at September 30, 2020 and December 31, 2019, which consists primarily of other marketable securities.
TotalOutstanding commercial utilized credit exposure increased $21.5loans and leases decreased $2.3 billion during the nine months ended September 30, 20172020 primarily drivendue to repayments, partially offset by increases in$24.7 billion of PPP loans outstanding at September 30, 2020. Nonperforming commercial loans increased $694 million across industries, and leases. The utilization rate forcommercial reservable criticized utilized exposure increased
$24.3 billion spread across several industries, including travel and entertainment, as a result of weaker economic conditions arising from COVID-19. Table 29 presents our commercial loans and leases SBLCsportfolio and financial guarantees, commercial letters ofrelated credit and bankers acceptances, in the aggregate, was 59 percent and 58 percentquality information at September 30, 20172020 and December 31, 2016.2019.
| | | | | | | | | | | | | | | | | | | | | | | | | | | | | | | | | | | | | | |
| | | | | | | | | | | | |
| Table 29 | Commercial Credit Quality |
| | |
| | Outstandings | | Nonperforming | | Accruing Past Due 90 Days or More (3) |
| | | | | | | | | | | | |
| (Dollars in millions) | September 30
2020 | | December 31
2019 | | September 30
2020 | | December 31
2019 | | September 30
2020 | | December 31
2019 |
| Commercial and industrial: | | | | | | | | | | | |
| U.S. commercial | $ | 293,934 | | | $ | 307,048 | | | $ | 1,351 | | | $ | 1,094 | | | $ | 199 | | | $ | 106 | |
| Non-U.S. commercial | 96,151 | | | 104,966 | | | 338 | | | 43 | | | 28 | | | 8 | |
| Total commercial and industrial | 390,085 | | | 412,014 | | | 1,689 | | | 1,137 | | | 227 | | | 114 | |
| Commercial real estate | 62,454 | | | 62,689 | | | 414 | | | 280 | | | 2 | | | 19 | |
| Commercial lease financing | 17,413 | | | 19,880 | | | 14 | | | 32 | | | 32 | | | 20 | |
| 469,952 | | | 494,583 | | | 2,117 | | | 1,449 | | | 261 | | | 153 | |
U.S. small business commercial (1) | 38,850 | | | 15,333 | | | 76 | | | 50 | | | 77 | | | 97 | |
| Commercial loans excluding loans accounted for under the fair value option | 508,802 | | | 509,916 | | | 2,193 | | | 1,499 | | | 338 | | | 250 | |
Loans accounted for under the fair value option (2) | 6,577 | | | 7,741 | | | | | | | | | |
| Total commercial loans and leases | $ | 515,379 | | | $ | 517,657 | | | | | | | | | |
(1)Includes card-related products.
(2)Commercial loans accounted for under the fair value option include U.S. commercial of $3.4 billion and $4.7 billion and non-U.S. commercial of $3.2 billion and $3.1 billion at September 30, 2020 and December 31, 2019. For more information on the fair value option, see Note 15 – Fair Value Option to the Consolidated Financial Statements.
(3)For information on our interest accrual policies and delinquency status for loan modifications related to the COVID-19 pandemic, see Note 1 – Summary of Significant Accounting Principles to the Consolidated Financial Statements.
|
| | | | | | | | | | | | | | | | | | | | | | | | |
| | | | | | | | | | | | | |
| Table 37 | Commercial Credit Exposure by Type |
| | | | | | | | | | | | | |
| | | Commercial Utilized (1) | | Commercial Unfunded (2, 3, 4) | | Total Commercial Committed |
| (Dollars in millions) | September 30
2017 | | December 31
2016 | | September 30
2017 | | December 31
2016 | | September 30
2017 | | December 31
2016 |
Loans and leases (5) | $ | 484,565 |
| | $ | 464,260 |
| | $ | 354,927 |
| | $ | 366,106 |
| | $ | 839,492 |
| | $ | 830,366 |
|
Derivative assets (6) | 38,384 |
| | 42,512 |
| | — |
| | — |
| | 38,384 |
| | 42,512 |
|
| Standby letters of credit and financial guarantees | 33,967 |
| | 33,135 |
| | 723 |
| | 660 |
| | 34,690 |
| | 33,795 |
|
| Debt securities and other investments | 26,190 |
| | 26,244 |
| | 5,092 |
| | 5,474 |
| | 31,282 |
| | 31,718 |
|
| Loans held-for-sale | 10,998 |
| | 6,510 |
| | 2,246 |
| | 3,824 |
| | 13,244 |
| | 10,334 |
|
| Commercial letters of credit | 1,414 |
| | 1,464 |
| | 83 |
| | 112 |
| | 1,497 |
| | 1,576 |
|
| Bankers’ acceptances | 389 |
| | 395 |
| | — |
| | 13 |
| | 389 |
| | 408 |
|
| Other | 514 |
| | 372 |
| | — |
| | — |
| | 514 |
| | 372 |
|
| Total | | $ | 596,421 |
| | $ | 574,892 |
| | $ | 363,071 |
| | $ | 376,189 |
| | $ | 959,492 |
| | $ | 951,081 |
|
| | | | | | | | |
(1)
| | Commercial utilized exposure includes loansBank of $5.3 billion and $6.0 billion and issued letters of credit with a notional amount of $234 million and $284 million accounted for under the fair value option at September 30, 2017 and December 31, 2016.America 38
|
| |
(2)
| Commercial unfunded exposure includes commitments accounted for under the fair value option with a notional amount of $4.7 billion and $6.7 billion at September 30, 2017 and December 31, 2016.
|
| |
(3)
| Excludes unused business card lines which are not legally binding. |
| |
(4)
| Includes the notional amount of unfunded legally binding lending commitments net of amounts distributed (e.g., syndicated or participated) to other financial institutions. The distributed amounts were $11.3 billion and $12.1 billion at September 30, 2017 and December 31, 2016.
|
| |
(5)
| Includes credit risk exposure associated with assets under operating lease arrangements of $6.0 billion and $5.7 billion at September 30, 2017 and December 31, 2016.
|
| |
(6)
| Derivative assets are carried at fair value, reflect the effects of legally enforceable master netting agreements and have been reduced by cash collateral of $35.6 billion and $43.3 billion at September 30, 2017 and December 31, 2016. Not reflected in utilized and committed exposure is additional non-cash derivative collateral held of $25.6 billion and $25.3 billion at September 30, 2017 and December 31, 2016, which consists primarily of other marketable securities.
|
Table 3830 presents net charge-offs and related ratios for our commercial loans and leases for the three and nine months ended September 30, 2020 and 2019.
| | | | | | | | | | | | | | | | | | | | | | | | | | | | | | | | | | | | | | | | | | | | | | | | | | |
| | | | | | | | | | | | | | | | |
| Table 30 | Commercial Net Charge-offs and Related Ratios |
| | | | | | | | | | |
| | Net Charge-offs | | Net Charge-off Ratios (1) |
| | Three Months Ended
September 30 | | Nine Months Ended
September 30 | | Three Months Ended
September 30 | | Nine Months Ended
September 30 |
| | | | | | | | |
| (Dollars in millions) | 2020 | | 2019 | | 2020 | | 2019 | | 2020 | | 2019 | | 2020 | | 2019 |
| Commercial and industrial: | | | | | | | | | | | | | | | |
| U.S. commercial | $ | 154 | | | $ | 53 | | | $ | 536 | | | $ | 202 | | | 0.20 | % | | 0.07 | % | | 0.23 | % | | 0.09 | % |
| Non-U.S. commercial | 57 | | | 67 | | | 90 | | | 115 | | | 0.23 | | | 0.26 | | | 0.11 | | | 0.15 | |
| Total commercial and industrial | 211 | | | 120 | | | 626 | | | 317 | | | 0.21 | | | 0.12 | | | 0.20 | | | 0.11 | |
| Commercial real estate | 106 | | | (1) | | | 169 | | | 8 | | | 0.66 | | | — | | | 0.35 | | | 0.02 | |
| Commercial lease financing | 24 | | | 1 | | | 60 | | | 14 | | | 0.53 | | | 0.02 | | | 0.43 | | | 0.09 | |
| | 341 | | | 120 | | | 855 | | | 339 | | | 0.28 | | | 0.10 | | | 0.23 | | | 0.09 | |
| U.S. small business commercial | 67 | | | 69 | | | 215 | | | 202 | | | 0.69 | | | 1.83 | | | 1.01 | | | 1.83 | |
| Total commercial | $ | 408 | | | $ | 189 | | | $ | 1,070 | | | $ | 541 | | | 0.31 | | | 0.15 | | | 0.27 | | | 0.15 | |
(1)Net charge-off ratios are calculated as net charge-offs divided by average outstanding loans and leases excluding loans accounted for under the fair value option.
Table 31 presents commercial utilized reservable criticized utilized exposure by loan type. Criticized exposure corresponds to the Special Mention, Substandard and Doubtful asset categories as defined by regulatory authorities. Total commercial utilized reservable criticized utilized exposure decreased $1.5increased $24.3 billion or nine
percent, during the nine months ended September 30, 2017 primarily driven by paydowns2020, which was spread across several industries, including travel and upgrades in the energy portfolio. Approximately 80entertainment, as a result of weaker economic conditions arising from COVID-19. At September 30, 2020 and December 31, 2019, 84 percent and 7690 percent of commercial utilized reservable criticized utilized exposure was securedsecured.
| | | | | | | | | | | | | | | | | | | | | | | | | | |
| | | | | | | | |
| Table 31 | Commercial Reservable Criticized Utilized Exposure (1, 2) |
| | | | | | | | |
| | |
| | | | | | | | |
| | |
| (Dollars in millions) | September 30, 2020 | | December 31, 2019 |
| Commercial and industrial: |
| U.S. commercial | $ | 22,223 | | | 6.88 | % | | $ | 8,272 | | | 2.46 | % |
| Non-U.S. commercial | 4,381 | | | 4.30 | | | 989 | | | 0.89 | |
| Total commercial and industrial | 26,604 | | | 6.26 | | | 9,261 | | | 2.07 | |
| Commercial real estate | 7,001 | | | 10.89 | | | 1,129 | | | 1.75 | |
| Commercial lease financing | 657 | | | 3.77 | | | 329 | | | 1.66 | |
| | 34,262 | | | 6.76 | | | 10,719 | | | 2.01 | |
| U.S. small business commercial | 1,448 | | | 3.73 | | | 733 | | | 4.78 | |
Total commercial reservable criticized utilized exposure (1) | $ | 35,710 | | | 6.55 | | | $ | 11,452 | | | 2.09 | |
(1)Total commercial reservable criticized utilized exposure includes loans and leases of $33.9 billion and $10.7 billion and commercial letters of credit of $1.8 billion and $715 million at September 30, 20172020 and December 31, 2016.2019.
(2)Percentages are calculated as commercial reservable criticized utilized exposure divided by total commercial reservable utilized exposure for each exposure category.
Commercial and Industrial
|
| | | | | | | | | | | | | | |
| | | | | | | | | |
| Table 38 | Commercial Utilized Reservable Criticized Exposure |
| | | | | | | | | |
| | | September 30, 2017 | | December 31, 2016 |
| (Dollars in millions) | Amount (1) | | Percent (2) | | Amount (1) | | Percent (2) |
| U.S. commercial | $ | 10,098 |
| | 3.24 | % | | $ | 10,311 |
| | 3.46 | % |
| Commercial real estate | 628 |
| | 1.03 |
| | 399 |
| | 0.68 |
|
| Commercial lease financing | 650 |
| | 3.04 |
| | 810 |
| | 3.62 |
|
| Non-U.S. commercial | 2,573 |
| | 2.54 |
| | 3,974 |
| | 4.17 |
|
| | | 13,949 |
| | 2.82 |
| | 15,494 |
| | 3.27 |
|
| U.S. small business commercial | 875 |
| | 6.43 |
| | 826 |
| | 6.36 |
|
| Total commercial utilized reservable criticized exposure | $ | 14,824 |
| | 2.91 |
| | $ | 16,320 |
| | 3.35 |
|
| |
(1)
| Total commercial utilized reservable criticized exposure includes loans and leases of $13.6 billion and $14.9 billion and commercial letters of credit of $1.3 billion and $1.4 billion at September 30, 2017 and December 31, 2016.
|
| |
(2)
| Percentages are calculated as commercial utilized reservable criticized exposure divided by total commercial utilized reservable exposure for each exposure category. |
U.S. Commercial
At September 30, 2017, 702020, 66 percent of the U.S. commercial loan portfolio, excluding small business, was managed in Global Banking,17 percent in Global Markets, 1115 percent in GWIM (generally business-purpose loans for high net worth clients) and the remainder primarily in Consumer Banking. U.S. commercial loans excluding loans accounted for under the fair value option, increased $12.3decreased $13.1 billion or five percent, during the nine months ended September 30, 2017 due to growth across most of the
commercial businesses.2020 primarily in Global Banking. Reservable criticized balancesutilized exposure increased $14.0 billion, which was spread across several industries, including travel and entertainment, as a result of weaker economic conditions arising from COVID-19.
Non-U.S. Commercial
At September 30, 2020, 81 percent of the non-U.S. commercial loan portfolio was managed in Global Banking and 19 percent in Global Markets. Non-U.S. commercial loans decreased $213 million, or two percent, and nonperforming loans and leases decreased $393 million, or 31 percent, in$8.8 billion during the nine months ended September 30, 2017 driven by improvements2020, primarily in Global Banking. For information on the energy sector. Net charge-offs increased $18 million and $21 million for the three and nine months ended September 30, 2017 compared to the same periods in 2016. The increase was driven by higher energy losses.non-U.S. commercial portfolio, see Non-U.S. Portfolio on page 43.
Commercial Real Estate
Commercial real estate primarily includes commercial loans and leases secured by non-owner-occupied real estate and is dependent on the sale or lease of the real estate as the primary source of repayment. Outstanding loans remained relatively flat at $62.5 billion at September 30, 2020 as paydowns were offset by new originations and increased utilizations under existing credit facilities. Reservable criticized utilized exposure increased $5.9 billion due to downgrades driven by the impact of COVID-19 across industries, led by hotels. Although we have observed property-level improvements in a number of the most impacted sectors, the length of time for recovery has been slower than originally anticipated, which has prompted these downgrades. The portfolio remains diversified across property types and geographic regions. California represented the largest state concentration at 2423 percent and 2324 percent of the commercial real estate loans and leases portfolio at September 30, 20172020 and December 31, 2016.2019. The commercial real estate portfolio is predominantly managed in Global Banking and consists of loans made primarily to public and private developers, and commercial real estate firms. Outstanding loans increased $2.3 billion, or four percent, during the nine months ended September 30, 2017 due to new originations outpacing paydowns.
For the three and nine months ended September 30, 2017,2020, we continued to see low default rates and solid credit qualityvarying degrees of improvement in both the residential and non-residential portfolios.portfolio. We use a number of proactive risk mitigation initiatives to reduce adversely
rated exposure in the commercial real estate portfolio, including
transfers of deteriorating exposures to management by independent special asset officers and the pursuit of loan restructurings or asset sales to achieve the best results for our customers and the Corporation.
Nonperforming commercial real estate loans and foreclosed properties increased $83 million, or 95 percent, driven by a small number of clients across property types. Reservable criticized balances increased $229 million, or 57 percent, during the nine months ended September 30, 2017 primarily due to loan downgrades. Net charge-offs were $2 million and $3 million for the three and nine months ended September 30, 2017 compared to net recoveries of $23 million and $31 million for the same periods in 2016.
Table 3932 presents outstanding commercial real estate loans by geographic region, based on the geographic location of the collateral, and by property type.
| | | | | | | | | | | | | | |
| | | | |
| Table 32 | Outstanding Commercial Real Estate Loans |
| | | | |
| | |
| (Dollars in millions) | September 30
2020 | | December 31
2019 |
| By Geographic Region | | | |
| California | $ | 14,364 | | | $ | 14,910 | |
| Northeast | 12,030 | | | 12,408 | |
| Southwest | 9,070 | | | 8,408 | |
| Southeast | 6,637 | | | 5,937 | |
| Florida | 4,262 | | | 3,984 | |
| Midwest | 3,226 | | | 3,203 | |
| Illinois | 3,028 | | | 3,349 | |
| Midsouth | 2,496 | | | 2,468 | |
| Northwest | 1,598 | | | 1,638 | |
| Non-U.S. | 3,707 | | | 3,724 | |
Other (1) | 2,036 | | | 2,660 | |
| Total outstanding commercial real estate loans | $ | 62,454 | | | $ | 62,689 | |
| By Property Type | | | |
| Non-residential | | | |
| Office | $ | 17,650 | | | $ | 17,902 | |
| Industrial / Warehouse | 9,289 | | | 8,677 | |
| Shopping centers / Retail | 7,850 | | | 8,183 | |
| Multi-family rental | 7,524 | | | 7,250 | |
| Hotels / Motels | 7,418 | | | 6,982 | |
| Unsecured | 2,598 | | | 3,438 | |
| Multi-use | 1,709 | | | 1,788 | |
| | | |
| Other | 7,420 | | | 6,958 | |
| Total non-residential | 61,458 | | | 61,178 | |
| Residential | 996 | | | 1,511 | |
| Total outstanding commercial real estate loans | $ | 62,454 | | | $ | 62,689 | |
|
| | | | | | | | |
| | | | | |
| Table 39 | Outstanding Commercial Real Estate Loans |
| | | | | |
| (Dollars in millions) | September 30
2017 | | December 31
2016 |
| By Geographic Region | |
| | |
|
| California | $ | 14,274 |
| | $ | 13,450 |
|
| Northeast | 10,173 |
| | 10,329 |
|
| Southwest | 7,515 |
| | 7,567 |
|
| Southeast | 5,415 |
| | 5,630 |
|
| Midwest | 3,901 |
| | 4,380 |
|
| Florida | 3,253 |
| | 3,213 |
|
| Midsouth | 3,069 |
| | 2,346 |
|
| Northwest | 2,706 |
| | 2,430 |
|
| Illinois | 2,422 |
| | 2,408 |
|
| Non-U.S. | 4,159 |
| | 3,103 |
|
Other (1) | 2,741 |
| | 2,499 |
|
| Total outstanding commercial real estate loans | $ | 59,628 |
| | $ | 57,355 |
|
| By Property Type | |
| | |
|
| Non-residential | | | |
| Office | $ | 17,891 |
| | $ | 16,643 |
|
| Shopping centers / Retail | 9,046 |
| | 8,794 |
|
| Multi-family rental | 8,427 |
| | 8,817 |
|
| Hotels / Motels | 6,388 |
| | 5,550 |
|
| Industrial / Warehouse | 5,429 |
| | 5,357 |
|
| Multi-use | 2,804 |
| | 2,822 |
|
| Unsecured | 2,243 |
| | 1,730 |
|
| Land and land development | 236 |
| | 357 |
|
| Other | 5,785 |
| | 5,595 |
|
| Total non-residential | 58,249 |
| | 55,665 |
|
| Residential | 1,379 |
| | 1,690 |
|
| Total outstanding commercial real estate loans | $ | 59,628 |
| | $ | 57,355 |
|
| |
(1)
| (1)Includes unsecured loans to real estate investment trusts and national home builders whose portfolios of properties span multiple geographic regions and properties in the states of Colorado, Utah, Hawaii, Wyoming and Montana. |
At September 30, 2017, total committed non-residential exposure was $80.1 billion compared to $76.9 billion at December 31, 2016, of which $58.2 billion and $55.7 billion were funded loans. Non-residential nonperforming loans and foreclosed properties increased $84 million, or 104 percent, to $165 million at September 30, 2017 compared to December 31, 2016 driven by a small number of clients across property types. The non-residential nonperforming loans and foreclosed properties represented 0.28 percent and 0.14 percent of total non-residential loans and foreclosed properties at September 30, 2017 and December 31, 2016. Non-residential utilized reservable criticized exposure increased $173 million, or 44 percent, to $570 million
at September 30, 2017 compared to $397 million at December 31, 2016, which represented 0.96 percent and 0.70 percent of non-residential utilized reservable exposure. For the non-residential portfolio, net charge-offs increased $26 million to $3 million and increased $34 million to $4 million for the three and nine months ended September 30, 2017 compared to the same periods in 2016.
At September 30, 2017, total committed residential exposure was $3.1 billion compared to $3.7 billion at December 31, 2016, of which $1.4 billion and $1.7 billion were funded secured loans. The nonperforming loans, leases and foreclosed properties and the utilized reservable criticized ratios for the residential portfolio
were 0.33 percent and 4.08 percent at September 30, 2017 compared to 0.35 percent and 0.16 percent at December 31, 2016.
At September 30, 2017 and December 31, 2016, the commercial real estate loan portfolio included $7.1 billioninvestment trusts and $6.8 billionnational home builders whose portfolios of funded constructionproperties span multiple geographic regions and land development loans that were originated to fundproperties in the construction and/or rehabilitationstates of commercial properties. Reservable criticized constructionColorado, Utah, Hawaii, Wyoming and land development loans totaled $213 million and $107 million, and nonperforming construction and land development loans and foreclosed properties totaled $39 million and $44 million at September 30, 2017 and December 31, 2016. During a property’s construction phase, interest income is typically paid from interest reserves that are established at the inception of the loan. As construction is completed and the property is put into service, these interest reserves are depleted and interest payments from operating cash flows begin. We do not recognize interest income on nonperforming loans regardless of the existence of an interest reserve.Montana.
Non-U.S. Commercial
At September 30, 2017, 80 percent of the non-U.S. commercial loan portfolio was managed in Global Banking and 20 percent in Global Markets. Outstanding loans, excluding loans accounted for under the fair value option, increased $6.5 billion during the nine months ended September 30, 2017. Net charge-offs increased$23 million to $33 million and decreased $3 million to $94 million for the three and nine months ended September 30, 2017 compared to the same periods in 2016. The three-month increase was driven by higher energy losses. For more information on the non-U.S. commercial portfolio, see Non-U.S. Portfolio on page 56.
U.S. Small Business Commercial
The U.S. small business commercial loan portfolio is comprised of small business card loans and small business loans primarily managed in Consumer Banking,. Credit and includes $24.7 billion of PPP loans outstanding at September 30, 2020. Excluding PPP, credit card-related products were 51 percent and 4852 percent of the U.S. small business commercial portfolio at September 30, 20172020 and December 31, 2016. Net charge-offs remained relatively unchanged at $55 million and $160 million for the three and nine months ended September 30, 2017 compared to the same periods in 2016.2019. Of the U.S. small business commercial net charge-offs, 92 percent and 9093 percent were credit card-related products for the three and nine months ended September 30, 20172020 compared to 7992 percent and 8595 percent for the same periods in 2016.2019.
Nonperforming Commercial Loans, Leases and Foreclosed Properties Activity
Table 4033 presents the nonperforming commercial loans, leases and foreclosed properties activity during the three and nine months ended September 30, 20172020 and 2016.2019. Nonperforming loans do not include loans accounted for under the fair value option. During the three and nine months ended September 30, 2017,2020, nonperforming commercial loans and leases decreased $202 million and $385increased $694 million to $1.3 billion. Approximately 81$2.2 billion, primarily driven by the impact of COVID-19. At September 30, 2020, 85 percent of commercial nonperforming loans, leases and foreclosed properties were secured and approximately 63 percent were contractually current. Commercial nonperforming loans were carried at approximately 8478 percent of their unpaid principal balance before consideration of the allowance for loan and lease losses, as the carrying value of these loans has been reduced to the estimated propertycollateral value less costs to sell.
|
| | | | | | | | | | | | | | | | |
| | | | | | | | | |
| Table 40 | Nonperforming Commercial Loans, Leases and Foreclosed Properties Activity (1, 2) | | | | |
| | | | | | | |
| | | Three Months Ended
September 30 | | Nine Months Ended
September 30 |
| (Dollars in millions) | 2017 | | 2016 | | 2017 | | 2016 |
| Nonperforming loans and leases, beginning of period | $ | 1,520 |
| | $ | 1,659 |
| | $ | 1,703 |
| | $ | 1,212 |
|
| Additions | 412 |
| | 892 |
| | 1,172 |
| | 2,089 |
|
| Reductions: | | | |
| | | | |
|
| Paydowns | (270 | ) | | (267 | ) | | (803 | ) | | (598 | ) |
| Sales | (61 | ) | | (73 | ) | | (116 | ) | | (166 | ) |
Returns to performing status (3) | (100 | ) | | (101 | ) | | (240 | ) | | (177 | ) |
| Charge-offs | (145 | ) | | (102 | ) | | (312 | ) | | (350 | ) |
Transfers to foreclosed properties (4) | — |
| | — |
| | (27 | ) | | (2 | ) |
| Transfers to loans held-for-sale | (38 | ) | | (9 | ) | | (59 | ) | | (9 | ) |
| Total net additions/(reductions) to nonperforming loans and leases | (202 | ) | | 340 |
| | (385 | ) | | 787 |
|
| Total nonperforming loans and leases, September 30 | 1,318 |
| | 1,999 |
| | 1,318 |
| | 1,999 |
|
Total foreclosed properties, September 30 (4) | 40 |
| | 16 |
| | 40 |
| | 16 |
|
| Nonperforming commercial loans, leases and foreclosed properties, September 30 | $ | 1,358 |
| | $ | 2,015 |
| | $ | 1,358 |
| | $ | 2,015 |
|
Nonperforming commercial loans and leases as a percentage of outstanding commercial loans and leases (5) | 0.28 | % | | 0.45 | % | | | | |
Nonperforming commercial loans, leases and foreclosed properties as a percentage of outstanding commercial loans, leases and foreclosed properties (5) | 0.29 |
| | 0.45 |
| | | | |
| |
(1)
| Balances do not include nonperforming LHFS of $322 million and $262 million at September 30, 2017 and 2016.
|
| |
(2)
| Includes U.S. small business commercial activity. Small business card loans are excluded as they are not classified as nonperforming. |
| |
(3)
| Commercial loans and leases may be returned to performing status when all principal and interest is current and full repayment of the remaining contractual principal and interest is expected, or when the loan otherwise becomes well-secured and is in the process of collection. TDRs are generally classified as performing after a sustained period of demonstrated payment performance. |
| |
(4)
| New foreclosed properties represents transfers of nonperforming loans to foreclosed properties net of charge-offs recorded during the first 90 days after transfer of a loan to foreclosed properties. |
| |
(5)
| Outstanding commercial loans exclude loans accounted for under the fair value option. |
| | | | | | | | | | | | | | | | | | | | | | | | |
| | | | | | | | |
| Table 33 | Nonperforming Commercial Loans, Leases and Foreclosed Properties Activity (1, 2) |
| | | | | | |
| | Three Months Ended
September 30 | | Nine Months Ended
September 30 |
| (Dollars in millions) | 2020 | | 2019 | | 2020 | | 2019 |
| Nonperforming loans and leases, beginning of period | $ | 2,202 | | | $ | 1,160 | | | $ | 1,499 | | | $ | 1,102 | |
| Additions | 656 | | | 492 | | | 2,326 | | | 1,521 | |
| | | | | | | |
| | | | | | | |
| Reductions: | | | | | | | |
| Paydowns | (216) | | | (161) | | | (605) | | | (479) | |
| Sales | (50) | | | (33) | | | (76) | | | (193) | |
Returns to performing status (3) | (21) | | | (48) | | | (45) | | | (105) | |
| Charge-offs | (367) | | | (123) | | | (895) | | | (371) | |
| Transfers to foreclosed properties | — | | | — | | | — | | | (7) | |
| Transfers to loans held-for-sale | (11) | | | — | | | (11) | | | (181) | |
| Total net additions/(reductions) to nonperforming loans and leases | (9) | | | 127 | | | 694 | | | 185 | |
| Total nonperforming loans and leases, September 30 | 2,193 | | | 1,287 | | | 2,193 | | | 1,287 | |
| | | | | | | |
| | | | | | | |
| | | | | | | |
| | | | | | | |
| | | | | | | |
| | | | | | | |
| Foreclosed properties, September 30 | 45 | | | 59 | | | 45 | | | 59 | |
| Nonperforming commercial loans, leases and foreclosed properties, September 30 | $ | 2,238 | | | $ | 1,346 | | | $ | 2,238 | | | $ | 1,346 | |
Nonperforming commercial loans and leases as a percentage of outstanding commercial loans and leases (4) | 0.43 | % | | 0.25 | % | | | | |
Nonperforming commercial loans, leases and foreclosed properties as a percentage of outstanding commercial loans, leases and foreclosed properties (4) | 0.44 | | | 0.26 | | | | | |
(1)Balances do not include nonperforming loans held-for-sale of $184 million and $237 million at September 30, 2020 and 2019.
(2)Includes U.S. small business commercial activity. Small business card loans are excluded as they are not classified as nonperforming.
(3)Commercial loans and leases may be returned to performing status when all principal and interest is current and full repayment of the remaining contractual principal and interest is expected, or when the loan otherwise becomes well-secured and is in the process of collection. TDRs are generally classified as performing after a sustained period of demonstrated payment performance.
(4)Outstanding commercial loans exclude loans accounted for under the fair value option.
Table 4134 presents our commercial TDRs by product type and performing status. U.S. small business commercial TDRs are comprised of renegotiated small business card loans and small business loans. The renegotiated small business card loans are not classified as nonperforming as they are charged off no later than the end of the month in which the loan becomes 180 days
past due. For more information on our loan modification programs offered in response to the COVID-19 pandemic, which are not TDRs, see Executive Summary - Recent Developments – COVID-19 Pandemic on page 3 and Note 41 – Outstanding Loans and LeasesSummary of Significant Accounting Principles to the Consolidated Financial Statements.
| | | | | | | | | | | | | | | | |
| Table 41 | Commercial Troubled Debt Restructurings | |
| Table 34 | | Table 34 | Commercial Troubled Debt Restructurings |
| | | | | |
| | | September 30, 2017 | | December 31, 2016 | | September 30, 2020 | | December 31, 2019 |
| (Dollars in millions) | (Dollars in millions) | Nonperforming | | Performing | | Total | | Nonperforming | | Performing | | Total | (Dollars in millions) | Nonperforming | | Performing | | Total | | Nonperforming | | Performing | | Total |
| Commercial and industrial: | | Commercial and industrial: |
| U.S. commercial | U.S. commercial | $ | 377 |
| | $ | 944 |
| | $ | 1,321 |
| | $ | 720 |
| | $ | 1,140 |
| | $ | 1,860 |
| U.S. commercial | $ | 743 | | | $ | 996 | | | $ | 1,739 | | | $ | 617 | | | $ | 999 | | | $ | 1,616 | |
| Non-U.S. commercial | | Non-U.S. commercial | 82 | | | 128 | | | 210 | | | 41 | | | 193 | | | 234 | |
| Total commercial and industrial | | Total commercial and industrial | 825 | | | 1,124 | | | 1,949 | | | 658 | | | 1,192 | | | 1,850 | |
| Commercial real estate | Commercial real estate | 40 |
| | 15 |
| | 55 |
| | 45 |
| | 95 |
| | 140 |
| Commercial real estate | 260 | | | 34 | | | 294 | | | 212 | | | 14 | | | 226 | |
| Commercial lease financing | Commercial lease financing | — |
| | 12 |
| | 12 |
| | 2 |
| | 2 |
| | 4 |
| Commercial lease financing | 2 | | | 28 | | | 30 | | | 18 | | | 31 | | | 49 | |
| Non-U.S. commercial | 12 |
| | 220 |
| | 232 |
| | 25 |
| | 283 |
| | 308 |
| |
| | | 429 |
| | 1,191 |
| | 1,620 |
| | 792 |
| | 1,520 |
| | 2,312 |
| | 1,087 | | | 1,186 | | | 2,273 | | | 888 | | | 1,237 | | | 2,125 | |
| U.S. small business commercial | U.S. small business commercial | 4 |
| | 15 |
| | 19 |
| | 2 |
| | 13 |
| | 15 |
| U.S. small business commercial | — | | | 28 | | | 28 | | | — | | | 27 | | | 27 | |
| Total commercial troubled debt restructurings | Total commercial troubled debt restructurings | $ | 433 |
| | $ | 1,206 |
| | $ | 1,639 |
| | $ | 794 |
| | $ | 1,533 |
| | $ | 2,327 |
| Total commercial troubled debt restructurings | $ | 1,087 | | | $ | 1,214 | | | $ | 2,301 | | | $ | 888 | | | $ | 1,264 | | | $ | 2,152 | |
Industry Concentrations
Table 4235 presents commercial committed and utilized credit exposure by industry and the total net credit default protection purchased to cover the funded and unfunded portions of certain credit exposures. Our commercial credit exposure is diversified across a broad range of industries. Total commercial committed exposure decreased $21.7 billion, or two percent, during the nine months ended September 30, 2020 to $1.0 trillion. The decrease in commercial committed exposure was concentrated in the Asset managers and funds, Global commercial banks, Utilities, and Pharmaceuticals and biotechnology industry sectors. Decreases were partially offset by increased $8.4exposure to the Automobiles and components and the Healthcare equipment and services industry sectors.
For information on industry limits, see Commercial Portfolio Credit Risk Management - Industry Concentrations in the MD&A of the Corporation’s 2019 Annual Report on Form 10-K.
Asset managers and funds, our largest industry concentration with committed exposure of $97.5 billion, decreased $12.6
billion, or 11 percent, during the nine months ended September 30, 2020.
Real estate, our second largest industry concentration with committed exposure of $95.3 billion, decreased $1.1 billion, or one percent, during the nine months ended September 30, 2017 to $959.5 billion. The increase in commercial committed exposure was concentrated in the Food, Beverage and Tobacco, Diversified Financials and Materials sectors. Increases were partially offset by reduced exposure to the Healthcare Equipment and Services, Banking and Telecommunications sectors.
Industry limits are used internally to manage industry concentrations and are based on committed exposure that is allocated on an industry-by-industry basis. A risk management framework is in place to set and approve industry limits as well as to provide ongoing monitoring. The Management Risk Committee oversees industry limit governance.
Diversified Financials, our largest industry concentration, with committed exposure of $128.9 billion, increased $4.3 billion, or three percent, during the nine months ended September 30, 2017. The increase primarily reflected an increase in exposure to several counterparties.
Real estate, our second largest industry concentration, with committed exposure of $85.4 billion, increased $1.7 billion, or two percent, during the nine months ended September 30, 2017.2020. For more information on the commercial real estate and related portfolios, see Commercial Portfolio Credit Risk Management – Commercial Real Estate on page 51.39.
Retailing,Capital goods, our third largest industry concentration with committed exposure of $68.7$83.2 billion,, increased $158 million,$2.3 billion, or less than onethree percent, during the nine months ended September 30, 2017. The modest2020 with the increase largely occurring in committed exposure occurred as increases in Diversified Wholesalersthe machinery, aerospace and Vehicle Dealers weredefense, and building products categories, partially offset by decreases Multilinea decrease in trading companies and Specialty retailers.distributors, construction and engineering, and industrial conglomerates.
Given the widespread impact the COVID-19 pandemic is having on the U.S. and global economy, a number of industries have been and continue to be adversely impacted. We continue to monitor all industries, particularly higher risk industries which
are experiencing or could experience a more significant impact to their financial condition. The impact of the COVID-19 pandemic has also placed significant stress on global demand for oil, resulting in a steep decline in prices. Our energy-related committed exposure decreased $2.6$1.8 billion, or sevenfive percent, to $36.6 billion during the nine months ended September 30, 2017. Energy sector2020 to $34.5
billion, driven by declines in exploration and production, energy equipment and services and refining and marketing exposure offset, in part, by an increase in our integrated client exposure. For more information on COVID-19, see Executive Summary - Recent Developments – COVID-19 Pandemic on page 3.
| | | | | | | | | | | | | | | | | | | | | | | | | | |
| | | | | | | | |
| Table 35 | Commercial Credit Exposure by Industry (1) |
| | | | | | | | |
| | Commercial
Utilized | | Total Commercial Committed (2) |
| | |
| (Dollars in millions) | September 30
2020 | | December 31
2019 | | September 30
2020 | | December 31
2019 |
| Asset managers and funds | $ | 63,360 | | | $ | 71,386 | | | $ | 97,518 | | | $ | 110,069 | |
Real estate (3) | 72,105 | | | 70,361 | | | 95,251 | | | 96,370 | |
| Capital goods | 42,899 | | | 41,082 | | | 83,159 | | | 80,892 | |
| Finance companies | 43,396 | | | 40,173 | | | 66,964 | | | 63,942 | |
| Healthcare equipment and services | 36,554 | | | 34,353 | | | 61,094 | | | 55,918 | |
| Government and public education | 43,699 | | | 41,889 | | | 56,785 | | | 53,566 | |
| Materials | 25,478 | | | 26,663 | | | 51,316 | | | 52,129 | |
| Retailing | 27,085 | | | 25,868 | | | 49,602 | | | 48,317 | |
| Consumer services | 32,016 | | | 28,434 | | | 48,631 | | | 49,071 | |
| Food, beverage and tobacco | 22,706 | | | 24,163 | | | 45,019 | | | 45,956 | |
| Commercial services and supplies | 22,274 | | | 23,103 | | | 39,219 | | | 38,944 | |
| Transportation | 25,157 | | | 23,449 | | | 34,668 | | | 33,028 | |
| Energy | 15,432 | | | 16,406 | | | 34,514 | | | 36,326 | |
| Utilities | 12,488 | | | 12,383 | | | 29,501 | | | 36,060 | |
| Individuals and trusts | 21,171 | | | 18,927 | | | 27,954 | | | 27,817 | |
| Media | | 13,616 | | | 12,445 | | | 25,802 | | | 23,645 | |
| Global commercial banks | 21,295 | | | 30,171 | | | 23,444 | | | 32,345 | |
| Technology hardware and equipment | 9,875 | | | 10,646 | | | 22,563 | | | 24,072 | |
| Software and services | 10,767 | | | 10,432 | | | 21,104 | | | 20,556 | |
| Consumer durables and apparel | 10,053 | | | 10,193 | | | 20,972 | | | 21,245 | |
| Automobiles and components | 11,916 | | | 7,345 | | | 19,391 | | | 14,910 | |
| Vehicle dealers | 14,598 | | | 18,013 | | | 18,457 | | | 21,435 | |
| Pharmaceuticals and biotechnology | 5,142 | | | 5,964 | | | 15,634 | | | 20,206 | |
| Insurance | 6,310 | | | 6,673 | | | 13,962 | | | 15,218 | |
| Telecommunication services | 7,063 | | | 9,154 | | | 13,441 | | | 16,113 | |
| Food and staples retailing | 5,166 | | | 6,290 | | | 10,470 | | | 10,392 | |
| Financial markets infrastructure (clearinghouses) | 4,587 | | | 5,496 | | | 7,216 | | | 7,997 | |
| Religious and social organizations | 4,987 | | | 3,844 | | | 6,910 | | | 5,756 | |
| | | | | | | |
| Total commercial credit exposure by industry | $ | 631,195 | | | $ | 635,306 | | | $ | 1,040,561 | | | $ | 1,062,295 | |
Net credit default protection purchased on total commitments (4) | | | | | $ | (5,206) | | | $ | (3,349) | |
(1)Includes U.S. small business commercial exposure.
(2)Includes the notional amount of unfunded legally binding lending commitments net charge-offsof amounts distributed (i.e., syndicated or participated) to other financial institutions. The distributed amounts were $131 million during the nine months ended$10.3 billion and $10.6 billion at September 30, 2017 compared2020 and December 31, 2019.
(3)Industries are viewed from a variety of perspectives to $226 millionbest isolate the perceived risks. For purposes of this table, the real estate industry is defined based on the primary business activity of the borrowers or counterparties using operating cash flows and primary source of repayment as key factors.
(4)Represents net notional credit protection purchased to hedge funded and unfunded exposures for which we elected the same period in 2016. Energy sector reservable criticized exposure decreased $2.4 billion to $3.2 billion during the nine months ended September 30, 2017 due to improvement infair value option, as well as certain other credit quality of some borrowers coupled with exposure reductions and fewer new criticized exposures. The energy allowance for credit losses decreased $265 million to $660 million during the nine months ended September 30, 2017.For more information, see Commercial Portfolio Credit Risk Management – Risk Mitigation.
|
| | | | | | | | | | | | | | | | |
| | | | | | | | | |
| Table 42 | Commercial Credit Exposure by Industry (1) |
| | | | | | | | | |
| | | Commercial Utilized | | Total Commercial Committed (2) |
| (Dollars in millions) | September 30
2017 | | December 31
2016 | | September 30
2017 | | December 31
2016 |
| Diversified financials | $ | 81,120 |
| | $ | 81,156 |
| | $ | 128,879 |
| | $ | 124,535 |
|
Real estate (3) | 64,030 |
| | 61,203 |
| | 85,351 |
| | 83,658 |
|
| Retailing | 43,061 |
| | 41,630 |
| | 68,665 |
| | 68,507 |
|
| Capital goods | 35,919 |
| | 34,278 |
| | 67,385 |
| | 64,202 |
|
| Healthcare equipment and services | 38,201 |
| | 37,656 |
| | 57,425 |
| | 64,663 |
|
| Government and public education | 46,537 |
| | 45,694 |
| | 56,494 |
| | 54,626 |
|
| Materials | 24,463 |
| | 22,578 |
| | 47,546 |
| | 44,357 |
|
| Banking | 38,578 |
| | 39,877 |
| | 43,637 |
| | 47,799 |
|
| Food, beverage and tobacco | 23,471 |
| | 19,669 |
| | 42,650 |
| | 37,145 |
|
| Consumer services | 27,446 |
| | 27,413 |
| | 42,410 |
| | 42,523 |
|
| Energy | 16,251 |
| | 19,686 |
| | 36,629 |
| | 39,231 |
|
| Commercial services and supplies | 22,137 |
| | 21,241 |
| | 35,448 |
| | 35,360 |
|
| Transportation | 21,781 |
| | 19,805 |
| | 30,124 |
| | 27,483 |
|
| Utilities | 12,078 |
| | 11,349 |
| | 27,281 |
| | 27,140 |
|
| Media | 13,400 |
| | 13,419 |
| | 25,998 |
| | 27,116 |
|
| Individuals and trusts | 18,860 |
| | 16,364 |
| | 24,728 |
| | 21,764 |
|
| Pharmaceuticals and biotechnology | 7,568 |
| | 5,539 |
| | 20,231 |
| | 18,910 |
|
| Software and services | 9,256 |
| | 7,991 |
| | 18,440 |
| | 19,790 |
|
| Technology hardware and equipment | 7,972 |
| | 7,793 |
| | 17,519 |
| | 18,429 |
|
| Insurance, including monolines | 6,731 |
| | 7,406 |
| | 13,021 |
| | 13,936 |
|
| Telecommunication services | 5,870 |
| | 6,317 |
| | 12,935 |
| | 16,925 |
|
| Automobiles and components | 5,710 |
| | 5,459 |
| | 12,687 |
| | 12,969 |
|
| Consumer durables and apparel | 6,403 |
| | 6,042 |
| | 12,224 |
| | 11,460 |
|
| Food and staples retailing | 5,006 |
| | 4,795 |
| | 9,367 |
| | 8,869 |
|
| Religious and social organizations | 4,196 |
| | 4,423 |
| | 6,133 |
| | 6,252 |
|
| Other | 10,376 |
| | 6,109 |
| | 16,285 |
| | 13,432 |
|
| Total commercial credit exposure by industry | $ | 596,421 |
| | $ | 574,892 |
| | $ | 959,492 |
| | $ | 951,081 |
|
Net credit default protection purchased on total commitments (4) | |
| | |
| | $ | (2,098 | ) | | $ | (3,477 | ) |
| |
(1)
| Includes U.S. small business commercial exposure. |
| |
(2)
| Includes the notional amount of unfunded legally binding lending commitments net of amounts distributed (e.g., syndicated or participated) to other financial institutions. The distributed amounts were $11.3 billion and $12.1 billion at September 30, 2017 and December 31, 2016.
|
| |
(3)
| Industries are viewed from a variety of perspectives to best isolate the perceived risks. For purposes of this table, the real estate industry is defined based on the borrowers’ or counterparties’ primary business activity using operating cash flows and primary source of repayment as key factors. |
| |
(4)
| Represents net notional credit protection purchased. For additional information, see Commercial Portfolio Credit Risk Management – Risk Mitigation below. |
Risk Mitigation
We purchase credit protection to cover the funded portion as well as the unfunded portion of certain credit exposures. To lower the cost of obtaining our desired credit protection levels, we may add credit exposure within an industry, borrower or counterparty group by selling protection.
At September 30, 20172020 and December 31, 2016,2019, net notional credit default protection purchased in our credit derivatives portfolio to hedge our funded and unfunded exposures for which we elected the fair value option, as well as certain other credit exposures, was $2.1$5.2 billion and $3.5$3.3 billion. We recorded net losses on these positions of $10$104 million and $57$106 million for the three and nine months ended September 30, 20172020 compared to net losses of $80$15 million and $408$93 million for the same periods in 2016 on these positions.2019. The gains and losses on these instruments were offset by gains and losses on the related exposures. The Value-at-Risk (VaR)
exposures are included in the fair value option portfolio information in Table 50.41. For additionalmore information, see Trading Risk Management on page 60.46.
Tables 4336 and 4437 present the maturity profiles and the credit exposure debt ratings of the net credit default protection portfolio at September 30, 20172020 and December 31, 2016.2019.
| | | Table 36 | | Table 36 | Net Credit Default Protection by Maturity |
| | | | | | | | |
| Table 43 | Net Credit Default Protection by Maturity | |
| | | | | | |
| | | September 30
2017 | | December 31
2016 | | September 30
2020 | | December 31
2019 |
| Less than or equal to one year | Less than or equal to one year | 42 | % | | 56 | % | Less than or equal to one year | 50 | % | | 54 | % |
| Greater than one year and less than or equal to five years | Greater than one year and less than or equal to five years | 55 |
| | 41 |
| Greater than one year and less than or equal to five years | 48 | | | 45 | |
| Greater than five years | Greater than five years | 3 |
| | 3 |
| Greater than five years | 2 | | | 1 | |
| Total net credit default protection | Total net credit default protection | 100 | % | | 100 | % | Total net credit default protection | 100 | % | | 100 | % |
| | | | | | | | | | | | | | | | | | | | | | | | | | |
| | | | | | | | |
| Table 37 | Net Credit Default Protection by Credit Exposure Debt Rating |
| | | | | | | | |
| | Net
Notional (1) | | Percent of
Total | | Net
Notional (1) | | Percent of
Total |
| | |
| | | | | | | | |
| (Dollars in millions) | September 30, 2020 | | December 31, 2019 |
Ratings (2, 3) | | | | | | | |
| | | | | | | |
| | | | | | | |
| A | $ | (310) | | | 6.0 | % | | $ | (697) | | | 20.8 | % |
| BBB | (2,699) | | | 51.8 | | | (1,089) | | | 32.5 | |
| BB | (1,388) | | | 26.7 | | | (766) | | | 22.9 | |
| B | (519) | | | 10.0 | | | (373) | | | 11.1 | |
| CCC and below | (237) | | | 4.6 | | | (119) | | | 3.6 | |
NR (4) | (53) | | | 0.9 | | | (305) | | | 9.1 | |
Total net credit default protection | $ | (5,206) | | | 100.0 | % | | $ | (3,349) | | | 100.0 | % |
|
| | | | | | | | | | | | | | |
| | | | | | | | | |
| Table 44 | Net Credit Default Protection by Credit Exposure Debt Rating |
| | | | | | | | | |
| | | September 30, 2017 | | December 31, 2016 |
| (Dollars in millions) | Net Notional (1) | | Percent of Total | | Net Notional (1) | | Percent of Total |
Ratings (2, 3) | |
| | |
| | |
| | |
|
| A | $ | (280 | ) | | 13.3 | % | | $ | (135 | ) | | 3.9 | % |
| BBB | (597 | ) | | 28.5 |
| | (1,884 | ) | | 54.2 |
|
| BB | (570 | ) | | 27.2 |
| | (871 | ) | | 25.1 |
|
| B | (528 | ) | | 25.2 |
| | (477 | ) | | 13.7 |
|
| CCC and below | (101 | ) | | 4.8 |
| | (81 | ) | | 2.3 |
|
NR (4) | (22 | ) | | 1.0 |
| | (29 | ) | | 0.8 |
|
| Total net credit default protection | $ | (2,098 | ) | | 100.0 | % | | $ | (3,477 | ) | | 100.0 | % |
| |
(1)
| (1)Represents net credit default protection purchased. |
| |
(2)
| Ratings are refreshed on a quarterly basis. |
| |
(3)
| Ratings of BBB- or higher are considered to meet the definition of investment grade. |
| |
(4)
| NR is comprised of index positions held and any names that have not been rated. |
In addition to our net notional credit default protection purchased to cover the funded and unfunded portion of certain credit exposures, credit derivativespurchased.
(2)Ratings are used for market-making activities for clients and establishing positions intended to profit from directional or relative value changes. We execute the majority of our credit derivative trades in the OTC market with large, multinational financial institutions, including broker-dealers and, to a lesser degree, with a variety of other investors. Because these
transactions are executed in the OTC market, we are subject to settlement risk. We are also subject to credit risk in the event that these counterparties fail to perform under the terms of these contracts. In most cases, credit derivative transactions are executedrefreshed on a daily marginquarterly basis. Therefore, events such as a credit downgrade, depending on
(3)Ratings of BBB- or higher are considered to meet the ultimate rating level, or a breachdefinition of credit covenants would typically require an increase in the amountinvestment grade.
(4)NR is comprised of collateral required by the counterparty, where applicable, and/or allow us to take additional protective measures such as early termination of all trades.index positions held and any names that have not been rated.
Table 45 presents the total contract/notional amount of credit derivatives outstanding and includes both purchased and written credit derivatives. The credit risk amounts are measured as net asset exposure by counterparty, taking into consideration all contracts with the counterparty. For more information on our written credit derivatives and counterparty credit risk valuation adjustments, see Note 23 – Derivativesto the Consolidated Financial Statements.
The credit risk amounts discussed above and presented in Table 45 take into consideration the effects of legally enforceable master netting agreements while amounts disclosed in Note 2 – Derivatives to the Consolidated Financial Statements are shownof the Corporation’s 2019 Annual Report on a gross basis. Credit risk reflects the potential benefit from offsetting exposure to non-credit derivative products with the same counterparties that may be netted upon the occurrence of certain events, thereby reducing our overall exposure.Form 10-K.
|
| | | | | | | | | | | | | | | | |
| | | | | | | | | |
| Table 45 | Credit Derivatives |
| | | | | | | | | |
| | | |
| | | September 30, 2017 | | December 31, 2016 |
| (Dollars in millions) | Contract/ Notional | | Credit Risk | | Contract/ Notional | | Credit Risk |
| Purchased credit derivatives: | |
| | |
| | |
| | |
|
| Credit default swaps | $ | 522,839 |
| | $ | 2,397 |
| | $ | 603,979 |
| | $ | 2,732 |
|
| Total return swaps/other | 57,591 |
| | 263 |
| | 21,165 |
| | 433 |
|
| Total purchased credit derivatives | $ | 580,430 |
| | $ | 2,660 |
| | $ | 625,144 |
| | $ | 3,165 |
|
| Written credit derivatives: | |
| | |
| | |
| | |
|
| Credit default swaps | $ | 514,479 |
| | n/a |
| | $ | 614,355 |
| | n/a |
|
| Total return swaps/other | 55,313 |
| | n/a |
| | 25,354 |
| | n/a |
|
| Total written credit derivatives | $ | 569,792 |
| | n/a |
| | $ | 639,709 |
| | n/a |
|
n/a = not applicable
Counterparty Credit Risk Valuation Adjustments
We record counterparty credit risk valuation adjustments on certain derivative assets, including our credit default protection purchased, in order to properly reflect the credit risk of the counterparty, as presented in Table 46. We calculate CVA based on a modeled expected exposure that incorporates current market risk factors including changes in market spreads and non-credit related market factors that affect the value of a derivative. The exposure also takes into consideration credit mitigants such as legally enforceable master netting agreements and collateral. For additional information, see Note 2 – Derivatives to the Consolidated Financial Statements.
We enter into risk management activities to offset market driven exposures. We often hedge the counterparty spread risk in CVA with credit default swaps (CDS). We hedge other market risks in CVA primarily with currency and interest rate swaps. In certain instances, the net-of-hedge amounts in the following table move
in the same direction as the gross amount or may move in the opposite direction. This movement is a consequence of the complex interaction of the risks being hedged, resulting in limitations in the ability to perfectly hedge all of the market exposures at all times.
|
| | | | | | | | | | | | | | | | | | | | |
| | | | | | | | | |
| Table 46 | Credit Valuation Gains and Losses |
| | | | | | | | | |
| | | Three Months Ended September 30 |
| (Dollars in millions) | 2017 | | 2016 |
| Gains (Losses) | Gross | Hedge | Net | | Gross | Hedge | Net |
| Credit valuation | $ | 23 |
| $ | (8 | ) | $ | 15 |
| | $ | 280 |
| $ | (214 | ) | $ | 66 |
|
| | | | | | | | | |
| | | Nine Months Ended September 30 |
| | 2017 | | 2016 |
| | Gross | Hedge | Net | | Gross | Hedge | Net |
| Credit valuation | $ | 281 |
| $ | (188 | ) | $ | 93 |
| | $ | 45 |
| $ | 106 |
| $ | 151 |
|
Non-U.S. Portfolio
Our non-U.S. credit and trading portfolios are subject to country risk. We define country risk as the risk of loss from unfavorable economic and political conditions, currency fluctuations, social instability and changes in government policies. A risk management framework is in place to measure, monitor and manage non-U.S. risk and exposures. In addition to the direct risk of doing business in a country, we also are exposed to indirect country risks (e.g., related to the collateral received on secured financing transactions or related to client clearing activities). These indirect exposures are managed in the normal course of business through credit, market and operational risk governance, rather than through country risk governance.
Table 4738 presents our 20 largest non-U.S. country exposures as ofat September 30, 2017.2020. These exposures accounted for 8791 percent and 88 percent of our total non-U.S. exposure at September 30, 20172020 and December 31, 2016.2019. Net country exposure for these 20 countries increased $10.3$37.9 billion in the nine months ended September 30, 20172020. The majority of the increase was due to higher deposits with central banks in Germany and Japan.
| | | | | | | | | | | | | | | | | | | | | | | | | | | | | | | | | | | | | | | | | | | | | | | | | | |
| | | | | | | | | | | | | | | | |
| Table 38 | Top 20 Non-U.S. Countries Exposure |
| | | | | | | | | | | | | | | | |
| (Dollars in millions) | Funded Loans and Loan Equivalents | | Unfunded Loan Commitments | | Net Counterparty Exposure | | Securities/
Other
Investments | | Country Exposure at September 30
2020 | | Hedges and Credit Default Protection | | Net Country Exposure at September 30
2020 | | Increase (Decrease) from December 31
2019 |
| United Kingdom | $ | 31,825 | | | $ | 16,188 | | | $ | 6,197 | | | $ | 2,836 | | | $ | 57,046 | | | $ | (2,015) | | | $ | 55,031 | | | $ | (813) | |
| Germany | 35,523 | | | 9,366 | | | 2,389 | | | 5,353 | | | 52,631 | | | (2,564) | | | 50,067 | | | 19,239 | |
| Japan | 20,481 | | | 1,004 | | | 1,560 | | | 2,558 | | | 25,603 | | | (983) | | | 24,620 | | | 14,088 | |
| France | 11,340 | | | 8,436 | | | 1,308 | | | 4,942 | | | 26,026 | | | (1,740) | | | 24,286 | | | 8,031 | |
| Canada | 8,148 | | | 9,043 | | | 1,323 | | | 2,082 | | | 20,596 | | | (720) | | | 19,876 | | | (246) | |
| Australia | 6,610 | | | 3,660 | | | 454 | | | 2,893 | | | 13,617 | | | (367) | | | 13,250 | | | 2,148 | |
| China | 9,182 | | | 41 | | | 1,126 | | | 2,343 | | | 12,692 | | | (203) | | | 12,489 | | | (3,098) | |
| Brazil | 6,478 | | | 730 | | | 272 | | | 3,907 | | | 11,387 | | | (320) | | | 11,067 | | | (705) | |
| Netherlands | 6,579 | | | 3,081 | | | 590 | | | 1,592 | | | 11,842 | | | (810) | | | 11,032 | | | 705 | |
| India | 5,597 | | | 151 | | | 448 | | | 3,897 | | | 10,093 | | | (224) | | | 9,869 | | | (2,148) | |
| Switzerland | 5,752 | | | 2,921 | | | 156 | | | 230 | | | 9,059 | | | (395) | | | 8,664 | | | 1,279 | |
| South Korea | 5,486 | | | 854 | | | 459 | | | 1,824 | | | 8,623 | | | (127) | | | 8,496 | | | (209) | |
| Singapore | 3,997 | | | 230 | | | 354 | | | 3,809 | | | 8,390 | | | (57) | | | 8,333 | | | 507 | |
| Mexico | 3,920 | | | 1,225 | | | 201 | | | 1,663 | | | 7,009 | | | (139) | | | 6,870 | | | (941) | |
| Belgium | 4,271 | | | 1,310 | | | 534 | | | 901 | | | 7,016 | | | (250) | | | 6,766 | | | 259 | |
| Hong Kong | 4,723 | | | 220 | | | 512 | | | 1,167 | | | 6,622 | | | (26) | | | 6,596 | | | (460) | |
| Spain | 2,926 | | | 1,343 | | | 306 | | | 789 | | | 5,364 | | | (303) | | | 5,061 | | | 339 | |
| Ireland | 3,272 | | | 930 | | | 103 | | | 389 | | | 4,694 | | | (11) | | | 4,683 | | | 1,316 | |
| Italy | 2,610 | | | 1,222 | | | 562 | | | 1,310 | | | 5,704 | | | (1,065) | | | 4,639 | | | (738) | |
| United Arab Emirates | 2,545 | | | 139 | | | 217 | | | 52 | | | 2,953 | | | (41) | | | 2,912 | | | (675) | |
| Total top 20 non-U.S. countries exposure | $ | 181,265 | | | $ | 62,094 | | | $ | 19,071 | | | $ | 44,537 | | | $ | 306,967 | | | $ | (12,360) | | | $ | 294,607 | | | $ | 37,878 | |
Our largest non-U.S. country exposure at September 30, 2020 was the U.K. with net exposure of $55.0 billion, which represents an $813 million decrease from December 31, 2019. Our second largest non-U.S. country exposure was Germany with net exposure of $50.1 billion at September 30, 2020, a $19.2 billion increase from December 31, 2019. The increase in Germany was primarily driven by increasesan increase in China, Mexico, Belgium, South Korea and Japan, partially offset by decreases in Switzerland, Brazil anddeposits with the U.K. On a product basis, the increase was driven by increased funded commitments in China, the Netherlands, Mexico and Belgium, along with increased sovereign securities in Japan, India and Korea. These increases were partially offset by the salecentral bank.
In light of the non-
U.S. consumer credit card business in the second quarter of 2017, and lower unfunded commitments in Switzerland and lower funded commitments in Brazil.
Non-U.S.global COVID-19 pandemic, we are monitoring our non-U.S. exposure is presented on an internal risk management basis and includes sovereign and non-sovereign credit exposure, securities and other investments issued by or domiciledclosely, particularly in countries other thanwhere restrictions on certain activities, in an attempt to contain the U.S.spread and impact of the virus, have affected and will likely
Funded loans
continue to adversely affect economic activity. We are managing the impact to our international business operations as part of our overall response framework and loan equivalents include loans, leases,are taking actions to manage exposure carefully in impacted regions while supporting the needs of our clients. The magnitude and other extensionsduration of creditthe COVID-19 pandemic and funds, including lettersits full impact on the global economy continue to be highly uncertain. The impact of credit and due from placements, whichCOVID-19 could have not been reduced by collateral, hedges or credit default protection. Unfunded commitments arean adverse impact on the undrawn portionglobal economy for a prolonged period of legally binding commitments related to loans and loan equivalents.
Net counterparty exposure includes the fair value of derivatives, including the counterparty risk associated with CDS, and secured financing transactions.
Securities and other investments are carried at fair value and long securities exposures are netted against short exposures with the same underlying issuer to, but not below, zero (i.e., negative issuer exposures are reported as zero).
Net country exposure represents country exposure less hedges and credit default protection purchased, net of credit default protection sold.time. For more information on how the COVID-19 pandemic may affect our non-U.S. creditoperations, see Executive Summary - Recent Developments – COVID-19 Pandemic on page 3 and trading portfolios, see Non-U.S. Portfolio in the MD&A of the Corporation's 2016 Annual ReportPart II, Item 1A. Risk Factors on Form 10-K.page 105.
|
| | | | | | | | | | | | | | | | | | | | | | | | | | | | | | | | |
| | | | | | | | | | | | | | | | | |
| Table 47 | Top 20 Non-U.S. Countries Exposure |
| | | | | | | | | | | | | | | | | |
| (Dollars in millions) | Funded Loans and Loan Equivalents | | Unfunded Loan Commitments | | Net Counterparty Exposure | | Securities/
Other Investments | | Country Exposure at September 30
2017 | | Hedges and Credit Default Protection | | Net Country Exposure at September 30
2017 | | Increase (Decrease) from December 31
2016 |
| United Kingdom | $ | 28,518 |
| | $ | 14,359 |
| | $ | 5,020 |
| | $ | 2,619 |
| | $ | 50,516 |
| | $ | (4,814 | ) | | $ | 45,702 |
| | $ | (2,031 | ) |
| Germany | 12,374 |
| | 9,093 |
| | 1,720 |
| | 3,603 |
| | 26,790 |
| | (3,607 | ) | | 23,183 |
| | 805 |
|
| Canada | 7,942 |
| | 7,725 |
| | 2,012 |
| | 2,460 |
| | 20,139 |
| | (647 | ) | | 19,492 |
| | 718 |
|
| Japan | 11,234 |
| | 549 |
| | 1,720 |
| | 4,823 |
| | 18,326 |
| | (1,690 | ) | | 16,636 |
| | 1,625 |
|
| China | 11,852 |
| | 711 |
| | 509 |
| | 1,345 |
| | 14,417 |
| | (234 | ) | | 14,183 |
| | 3,298 |
|
| Brazil | 7,665 |
| | 379 |
| | 382 |
| | 3,476 |
| | 11,902 |
| | (315 | ) | | 11,587 |
| | (2,079 | ) |
| France | 5,047 |
| | 5,711 |
| | 2,141 |
| | 4,245 |
| | 17,144 |
| | (5,654 | ) | | 11,490 |
| | 796 |
|
| India | 6,792 |
| | 265 |
| | 385 |
| | 3,573 |
| | 11,015 |
| | (953 | ) | | 10,062 |
| | 834 |
|
| Australia | 5,096 |
| | 2,810 |
| | 415 |
| | 1,994 |
| | 10,315 |
| | (515 | ) | | 9,800 |
| | 877 |
|
| Netherlands | 5,137 |
| | 3,488 |
| | 763 |
| | 1,428 |
| | 10,816 |
| | (2,015 | ) | | 8,801 |
| | 1,403 |
|
| Hong Kong | 6,845 |
| | 200 |
| | 580 |
| | 704 |
| | 8,329 |
| | (43 | ) | | 8,286 |
| | 807 |
|
| South Korea | 4,984 |
| | 610 |
| | 757 |
| | 2,048 |
| | 8,399 |
| | (418 | ) | | 7,981 |
| | 1,875 |
|
| Mexico | 3,901 |
| | 1,616 |
| | 228 |
| | 1,650 |
| | 7,395 |
| | (548 | ) | | 6,847 |
| | 2,363 |
|
| Singapore | 2,996 |
| | 315 |
| | 790 |
| | 2,128 |
| | 6,229 |
| | (65 | ) | | 6,164 |
| | 746 |
|
| Switzerland | 3,414 |
| | 3,093 |
| | 300 |
| | 107 |
| | 6,914 |
| | (1,613 | ) | | 5,301 |
| | (4,345 | ) |
| Italy | 2,483 |
| | 1,479 |
| | 587 |
| | 566 |
| | 5,115 |
| | (1,114 | ) | | 4,001 |
| | (86 | ) |
| Belgium | 2,274 |
| | 777 |
| | 114 |
| | 1,051 |
| | 4,216 |
| | (313 | ) | | 3,903 |
| | 1,977 |
|
| Turkey | 2,741 |
| | 60 |
| | 37 |
| | 272 |
| | 3,110 |
| | (1 | ) | | 3,109 |
| | 419 |
|
| Spain | 1,740 |
| | 1,156 |
| | 299 |
| | 1,023 |
| | 4,218 |
| | (1,172 | ) | | 3,046 |
| | 500 |
|
| United Arab Emirates | 2,186 |
| | 111 |
| | 284 |
| | 78 |
| | 2,659 |
| | (91 | ) | | 2,568 |
| | (175 | ) |
| Total top 20 non-U.S. countries exposure | $ | 135,221 |
| | $ | 54,507 |
| | $ | 19,043 |
| | $ | 39,193 |
| | $ | 247,964 |
| | $ | (25,822 | ) | | $ | 222,142 |
| | $ | 10,327 |
|
A number of economic conditions and geopolitical events have given rise to risk aversion in certain emerging markets. Our two largest emerging market country exposures at September 30, 2017 were China and Brazil. At September 30, 2017, net exposure to China was $14.2 billion, concentrated in large state-owned
companies, subsidiaries of multinational corporations and commercial banks. At September 30, 2017, net exposure to Brazil was $11.6 billion, concentrated in sovereign securities, oil and gas companies and commercial banks.
Bank of America56
The outlook for policy direction and therefore economic performance in the European Union (EU) remains uncertain as a consequence of reduced political cohesion among EU countries. Additionally, we believe that the uncertainty on the U.K.'s ability to negotiate a favorable exit from the EU will further weigh on economic performance. Our largest EU country exposure at September 30, 2017 was the U.K. At September 30, 2017, net exposure to the U.K. was $45.7 billion, concentrated in multinational corporations and sovereign clients. For additional information, see Executive Summary – Third Quarter 2017 Economic and Business Environment on page 3.
Provision for Credit Losses
The provision for credit losses decreased $16 million to $834 million, and $428 million to $2.4 billion for the three and nine months ended September 30, 2017 compared to the same periods in 2016. The provision for credit losses was $66 million and $347 million lower than net charge-offs for the three and nine months ended September 30, 2017, resulting in a reduction in the allowance for credit losses. This compared to a reduction of $38 million and $118 million in the allowance for credit losses for the three and nine months ended September 30, 2016.
The provision for credit losses for the consumer portfolio increased $25 million to $730 million, and $268 million to $2.1 billion for the three and nine months ended September 30, 2017 compared to the same periods in 2016. The increase for both periods was primarily driven by a provision increase of $218 million and $554 million in the U.S. credit card portfolio due to portfolio seasoning and loan growth, largely offset by improvement in the home equity portfolio due to increased home prices and lower nonperforming loans. Included in the provision is an expense of $12 million and $56 million related to the PCI loan portfolio for the three and nine months ended September 30, 2017 compared to an expense of $8 million and a benefit of $81 million for the same periods in 2016.
The provision for credit losses for the commercial portfolio, including unfunded lending commitments, decreased $41 million to $104 million, and $696 million to $287 million for the three and nine months ended September 30, 2017 compared to the same periods in 2016 driven by reductions in energy exposures.
Allowance for Credit Losses
Allowance for Loan and Lease Losses
TheOn January 1, 2020, the Corporation adopted the new accounting standard that requires the measurement of the allowance for loan and leasecredit losses isto be based on management’s best estimate of lifetime ECL inherent in the Corporation’s relevant financial assets. Upon adoption of the new accounting standard, the Corporation recorded a net increase of $3.3 billion in the allowance for credit losses which was comprised of two components. The first component covers nonperforming commercial loans and TDRs. The second component covers loans and leases on which there are incurred losses that are not yet individually identifiable, as well as incurred losses that may not be representeda net increase of $2.9 billion in the loss forecast models. We evaluate the adequacy of the allowance for loan and lease losses based onand an increase of $310 million in the total of these two components. reserve for unfunded lending commitments. The net increase was primarily driven by a $3.1 billion increase related to the credit card portfolio.
The allowance for loan and leasecredit losses excludes LHFS and loans accounted for under the fair value option as the fair value reflects a credit risk component. For more information on the allowance for loan and lease losses, see Allowance for Credit Losses in the MD&A of the Corporation's 2016 Annual Report on Form 10-K.
During the three and nine months endedfurther increased by $8.0 billion from January 1, 2020 to $21.5 billion at September 30, 2017, the factors that impacted the allowance for loan and lease losses2020, which included improvements in the credit quality of the consumer real estate portfolios driven by continuing improvements in the U.S. economy and labor markets, proactive credit risk management
initiatives and the impact of high credit quality originations. Evidencing the improvements in the U.S. economy and labor markets are downward unemployment trends and increases in home prices. In addition to these improvements, in the consumer portfolio, nonperforming consumer loans decreased $752 million in the nine months ended September 30, 2017 as returns to performing status, charge-offs, paydowns and loan sales continued to outpace new nonaccrual loans. During the nine months ended September 30, 2017, the allowance for loan and lease lossesa $5.2 billion increase in the commercial portfolio reflected decreased energy reserves primarily driven by reductions in energy exposures.
The allowance for loan and lease losses for the consumer portfolio, as presented in Table 49, was $5.6a $2.8 billion at September 30, 2017, a decrease of $640 million from December 31, 2016. The decrease was primarily in the home equity portfolio and the non-U.S. card portfolio which was sold during the second quarter of 2017, partially offset by an increase in the U.S. credit cardconsumer portfolio. The reductionincreases were driven by deterioration in the home equity portfolio was dueeconomic outlook resulting from the impact of COVID-19. Assuming the macroeconomic outlook does not deteriorate further, we do not expect to improved home prices, lower nonperforming loans and a decrease in loan balances. The increase the level of the allowance for credit losses in the U.S. credit card portfolio was driven by portfolio seasoning and loan growth.
fourth quarter of 2020. The following table presents an allocation of the allowance for loan and leasecredit losses by product type for the commercial portfolio, as presented in Table 49, was $5.1 billion at September 30, 2017, a decrease of $147 million from2020, January 1, 2020 and December 31, 2016 driven by decreased energy reserves due2019 (prior to reductions in the higher risk energy sub-sectors. Commercial utilized reservable criticized exposure decreased to $14.8 billion at September 30, 2017 from $16.3 billion (to 2.91 percent from 3.35 percentadoption of total commercial utilized reservable exposure) at December 31, 2016, largely due to paydowns and net upgrades in the energy portfolio. Nonperforming commercial loans decreased to $1.3 billion at September 30, 2017 from $1.7 billion (to 0.28 percentfrom0.38 percent of outstanding commercial loans excluding loans accounted for under the fair value option) at December 31, 2016. See Tables 35, 36 and 38 for additional details on key commercial credit statistics.CECL accounting standard).
The | | | | | | | | | | | | | | | | | | | | | | | | | | | | | | | | | | | | | | | | | | | | | | | | | | | | | | | | |
| | | | | | | | | | | | | | | | | | |
| Table 39 | Allocation of the Allowance for Credit Losses by Product Type | | | | |
| | | | | | | | | | | | | | |
| | | | | | | | | | |
| Amount | | Percent of
Total | | Percent of
Loans and
Leases Outstanding (1) | | Amount | | Percent of
Total | | Percent of
Loans and
Leases
Outstanding (1) | | Amount | | Percent of
Total | | Percent of
Loans and
Leases Outstanding (1) |
| (Dollars in millions) | September 30, 2020 | | January 1, 2020 | | December 31, 2019 |
| Allowance for loan and lease losses | | | | | | | | | | | | | | | | | |
| Residential mortgage | $ | 457 | | | 2.33 | % | | 0.20 | % | | $ | 212 | | | 1.72 | % | | 0.09 | % | | $ | 325 | | | 3.45 | % | | 0.14 | % |
| Home equity | 398 | | | 2.03 | | | 1.09 | | | 228 | | | 1.84 | | | 0.57 | | | 221 | | | 2.35 | | | 0.55 | |
| Credit card | 8,972 | | | 45.78 | | | 11.24 | | | 6,809 | | | 55.10 | | | 6.98 | | | 3,710 | | | 39.39 | | | 3.80 | |
| | | | | | | | | | | | | | | | | |
| Direct/Indirect consumer | 800 | | | 4.08 | | | 0.89 | | | 566 | | | 4.58 | | | 0.62 | | | 234 | | | 2.49 | | | 0.26 | |
| Other consumer | 64 | | | 0.34 | | | n/m | | 55 | | | 0.45 | | | n/m | | 52 | | | 0.55 | | | n/m |
| Total consumer | 10,691 | | | 54.56 | | | 2.43 | | | 7,870 | | | 63.69 | | | 1.69 | | | 4,542 | | | 48.23 | | | 0.98 | |
U.S. commercial (2) | 5,163 | | | 26.35 | | | 1.55 | | | 2,723 | | | 22.03 | | | 0.84 | | | 3,015 | | | 32.02 | | | 0.94 | |
| Non-U.S. commercial | 1,353 | | | 6.90 | | | 1.41 | | | 668 | | | 5.41 | | | 0.64 | | | 658 | | | 6.99 | | | 0.63 | |
| Commercial real estate | 2,283 | | | 11.65 | | | 3.66 | | | 1,036 | | | 8.38 | | | 1.65 | | | 1,042 | | | 11.07 | | | 1.66 | |
| Commercial lease financing | 106 | | | 0.54 | | | 0.60 | | | 61 | | | 0.49 | | | 0.31 | | | 159 | | | 1.69 | | | 0.80 | |
| Total commercial | 8,905 | | | 45.44 | | | 1.75 | | | 4,488 | | | 36.31 | | | 0.88 | | | 4,874 | | | 51.77 | | | 0.96 | |
| Allowance for loan and lease losses | 19,596 | | | 100.00 | % | | 2.07 | | | 12,358 | | | 100.00 | % | | 1.27 | | | 9,416 | | | 100.00 | % | | 0.97 | |
| | | | | | | | | | | | | | | | | |
| | | | | | | | | | | | | | | | | |
| Reserve for unfunded lending commitments | 1,910 | | | | | | | 1,123 | | | | | | | 813 | | | | | |
| Allowance for credit losses | $ | 21,506 | | | | | | | $ | 13,481 | | | | | | | $ | 10,229 | | | | | |
| | | | | | | | | | | | | | | | | | |
| | | | | | |
| | | | | | | | | | | | | | | | | |
| | | | | |
| | | | | | | | | | | | | | | | | |
| | | | | | | | | | | | | | | | | |
| | | | | | | | | | | | | | | | | |
| | | | | | | | | | | | | | | | | |
| | | | | | | | | | | | | | | | | |
| | | | | | | | | | | | | | | | | |
| | | | | | | | | | | | | | | | | |
| | | | | | | | | | | | | | | | | |
| | | | | | | | | | | | | | | | | |
| | | | | | | | | | | | | | | | | |
| | | | | | | | | | | | | | | | | |
| | | | | | | | | | | | | | | | | |
| | | | | | | | | | | | | | | | | |
| | | | | | | | | | | | | | | | | |
| | | | | | | | | | | | | | | | | |
| | | | | | | | | | | | | | | | | |
| | | | | | | | | | | | | | | | | |
| | | | | | | | | | | | | | | | | |
| | | | | | | | | | | | | | | | | | |
(1)Ratios are calculated as allowance for loan and lease losses as a percentage of total loans and leases outstanding was 1.16 percent at September 30, 2017 compared to 1.26 percent at December 31, 2016. The September 30, 2017 and December 31, 2016 ratios above include the PCI loan portfolio. Excluding the PCI loan portfolio, the allowance for loan and lease losses as a percentage of totalexcluding loans and leases outstanding was 1.14 percent and 1.24 percent at September 30, 2017 and December 31, 2016.
Reserve for Unfunded Lending Commitments
In addition to the allowance for loan and lease losses, we also estimate probable losses related to unfunded lending commitments such as letters of credit, financial guarantees, unfunded bankers’ acceptances and binding loan commitments, excluding commitments accounted for under the fair value option. For more informationConsumer loans accounted for under the fair value option include residential mortgage loans of $314 million at September 30, 2020 and $257 million at January 1, 2020 and December 31, 2019 and home equity loans of $343 million at September 30, 2020 and $337 million at January 1, 2020 and December 31, 2019. Commercial loans accounted for under the fair value option include U.S. commercial loans of $3.4 billion, $5.1 billion and $4.7 billion at September 30, 2020, January 1, 2020 and December 31, 2019, respectively and non-U.S. commercial loans of $3.2 billion, $3.2 billion and $3.1 billion at September 30, 2020, January 1, 2020 and December 31, 2019, respectively.
(2)Includes allowance for loan and lease losses for U.S. small business commercial loans of $1.5 billion, $831 million and $523 million at September 30, 2020, January 1, 2020 and December 31, 2019, respectively.
n/m = not meaningful
Net charge-offs for the three and nine months ended September 30, 2020 were $972 million and $3.2 billion compared to $811 million and $2.7 billion for the same periods in 2019 driven by increases in commercial losses. The provision for credit losses increased $610 million to $1.4 billion, and $8.6 billion to $11.3 billion for the three and nine months ended September 30, 2020 compared to the same periods in 2019. The allowance for credit losses included a reserve build of $417 million for the three months ended September 30, 2020, driven by COVID-19 impacted industries, such as travel and entertainment, and a reserve build of $8.0 billion for the nine months ended September 30, 2020 primarily due to the deterioration in the economic outlook resulting from the impact of COVID-19 on both the reserveconsumer and commercial portfolios. The provision for credit losses for the consumer portfolio, including unfunded lending commitments, see Allowance decreased $269 million to $295 million and increased $3.0 billion to $5.0 billion
for Credit Lossesthe three and nine months ended September 30, 2020 compared to the same periods in 2019. The provision for credit losses for the MD&A of the Corporation's 2016 Annual Report on Form 10-K.
The reserve forcommercial portfolio, including unfunded lending commitments, was $762increased $879 million at bothto $1.1 billion and $5.6 billion to $6.3 billion for the three and nine months ended September 30, 2017 and December 31, 2016.2020 compared to the same periods in 2019.
Table 48The following table presents a rollforward of the allowance for credit losses, which includesincluding certain loan and allowance ratios for the nine months ended September 30, 2020 and 2019, noting that measurement of the allowance for loancredit losses for 2019 was based on management’s estimate of probable incurred losses. For more information on the Corporation’s credit loss accounting policies and leaseactivity related to the allowance for credit losses, see Note 1 – Summary of Significant Accounting Principles and Note 5 – Outstanding Loans and Leases and Allowance for Credit Losses to the reserve for unfunded lending commitments,Consolidated Financial Statements.
| | | | | | | | | | | | | | | | | | | | | | | | | | |
| | | | | | | | |
| Table 40 | Allowance for Credit Losses | | | | | | | |
| | | | | | | | |
| | Three Months Ended September 30 | | Nine Months Ended September 30 |
| (Dollars in millions) | 2020 | | 2019 | | 2020 | | 2019 |
| Allowance for loan and lease losses, beginning of period | $ | 19,389 | | | $ | 9,527 | | | $ | 12,358 | | | $ | 9,601 | |
| Loans and leases charged off | | | | | | | |
| Residential mortgage | (5) | | | (28) | | | (28) | | | (69) | |
| Home equity | (8) | | | (171) | | | (47) | | | (386) | |
| Credit card | (665) | | | (865) | | | (2,407) | | | (2,659) | |
| Direct/Indirect consumer | (75) | | | (157) | | | (277) | | | (403) | |
| Other consumer | (70) | | | (71) | | | (232) | | | (163) | |
| Total consumer charge-offs | (823) | | | (1,292) | | | (2,991) | | | (3,680) | |
U.S. commercial (1) | (279) | | | (151) | | | (870) | | | (486) | |
| Non-U.S. commercial | (57) | | | (66) | | | (91) | | | (115) | |
| Commercial real estate | (106) | | | — | | | (170) | | | (10) | |
| Commercial lease financing | (28) | | | (3) | | | (68) | | | (19) | |
| Total commercial charge-offs | (470) | | | (220) | | | (1,199) | | | (630) | |
| Total loans and leases charged off | (1,293) | | | (1,512) | | | (4,190) | | | (4,310) | |
| Recoveries of loans and leases previously charged off | | | | | | | |
| Residential mortgage | 11 | | | 66 | | | 55 | | | 120 | |
| Home equity | 28 | | | 373 | | | 92 | | | 732 | |
| Credit card | 156 | | | 148 | | | 463 | | | 435 | |
| Direct/Indirect consumer | 57 | | | 81 | | | 193 | | | 233 | |
| Other consumer | 7 | | | 2 | | | 18 | | | 12 | |
| Total consumer recoveries | 259 | | | 670 | | | 821 | | | 1,532 | |
U.S. commercial (2) | 58 | | | 29 | | | 119 | | | 82 | |
| Non-U.S. commercial | — | | | (1) | | | 1 | | | — | |
| Commercial real estate | — | | | 1 | | | 1 | | | 2 | |
| Commercial lease financing | 4 | | | 2 | | | 8 | | | 5 | |
| Total commercial recoveries | 62 | | | 31 | | | 129 | | | 89 | |
| Total recoveries of loans and leases previously charged off | 321 | | | 701 | | | 950 | | | 1,621 | |
| Net charge-offs | (972) | | | (811) | | | (3,240) | | | (2,689) | |
| | | | | | | |
| Provision for loan and lease losses | 1,180 | | | 776 | | | 10,480 | | | 2,637 | |
Other (3) | (1) | | | (59) | | | (2) | | | (116) | |
| | | | | | | |
| | | | | | | |
| Allowance for loan and lease losses, September 30 | 19,596 | | | 9,433 | | | 19,596 | | | 9,433 | |
| Reserve for unfunded lending commitments, beginning of period | 1,702 | | | 806 | | | 1,123 | | | 797 | |
| Provision for unfunded lending commitments | 209 | | | 3 | | | 787 | | | 12 | |
Other (3) | (1) | | | — | | | — | | | — | |
| Reserve for unfunded lending commitments, September 30 | 1,910 | | | 809 | | | 1,910 | | | 809 | |
| Allowance for credit losses, September 30 | $ | 21,506 | | | $ | 10,242 | | | $ | 21,506 | | | $ | 10,242 | |
| | | | | | | | |
| Loan and allowance ratios: | | | | | | | |
Loans and leases outstanding at September 30 (4) | $ | 947,938 | | | $ | 965,236 | | | $ | 947,938 | | | $ | 965,236 | |
Allowance for loan and lease losses as a percentage of total loans and leases outstanding at September 30 (4) | 2.07 | % | | 0.98 | % | | 2.07 | % | | 0.98 | % |
Consumer allowance for loan and lease losses as a percentage of total consumer loans and leases outstanding at September 30 (5) | 2.43 | | | 1.01 | | | 2.43 | | | 1.01 | |
Commercial allowance for loan and lease losses as a percentage of total commercial loans and leases outstanding at September 30 (6) | 1.75 | | | 0.95 | | | 1.75 | | | 0.95 | |
Average loans and leases outstanding (4) | $ | 965,836 | | | $ | 956,850 | | | $ | 989,839 | | | $ | 946,546 | |
Annualized net charge-offs as a percentage of average loans and leases outstanding (4) | 0.40 | % | | 0.34 | % | | 0.44 | % | | 0.38 | % |
| | | | | | | |
| Allowance for loan and lease losses as a percentage of total nonperforming loans and leases at September 30 | 431 | | | 271 | | | 431 | | | 271 | |
| Ratio of the allowance for loan and lease losses at September 30 to net charge-offs | 5.07 | | | 2.93 | | | 4.53 | | | 2.62 | |
| | | | | | | |
Amounts included in allowance for loan and lease losses for loans and leases that are excluded from nonperforming loans and leases at September 30 (7) | $ | 10,331 | | | $ | 4,144 | | | $ | 10,331 | | | $ | 4,144 | |
Allowance for loan and lease losses as a percentage of total nonperforming loans and leases, excluding the allowance for loan and lease losses for loans and leases that are excluded from nonperforming loans and leases at September 30 (7) | 204 | % | | 152 | % | | 204 | % | | 152 | % |
(1)Includes U.S. small business commercial charge-offs of $77 million and $247 million for the three and nine months ended September 30, 20172020 compared to $79 million and 2016.
$239 million for the same periods in 2019.
(2)Includes U.S. small business commercial recoveries of $10 million and $32 million for the three and nine months ended September 30, 2020 compared to $10 million and $37 million for the same periods in 2019.
(3)Primarily represents write-offs of purchased credit-impaired (PCI) loans in 2019, and the net impact of portfolio sales, transfers to held for sale and transfers to foreclosed properties.
(4)Outstanding loan and lease balances and ratios do not include loans accounted for under the fair value option of $7.2 billion and $7.7 billion at September 30, 2020 and 2019. Average loans accounted for under the fair value option were $8.2 billion and $8.6 billion for the three and nine months ended September 30, 2020 compared to $7.9 billion and $6.6 billion for the same periods in 2019.
(5)Excludes consumer loans accounted for under the fair value option of $657 million and $640 million at September 30, 2020 and 2019.
(6)Excludes commercial loans accounted for under the fair value option of $6.6 billion and $7.0 billion at September 30, 2020 and 2019.
(7)Primarily includes amounts allocated to credit card and unsecured consumer lending portfolios in Consumer Banking.
|
| | | | | | | | | | | | | | | | |
| | | | | | | | | |
| Table 48 | Allowance for Credit Losses | | | | | | | |
| | | | | | | | | |
| | | Three Months Ended September 30 | | Nine Months Ended September 30 |
| (Dollars in millions) | 2017 | | 2016 | | 2017 | | 2016 |
| Allowance for loan and lease losses, beginning of period | $ | 10,875 |
| | $ | 11,837 |
| | $ | 11,237 |
| | $ | 12,234 |
|
| Loans and leases charged off | | | | | | | |
| Residential mortgage | (51 | ) | | (66 | ) | | (157 | ) | | (339 | ) |
| Home equity | (180 | ) | | (180 | ) | | (476 | ) | | (589 | ) |
| U.S. credit card | (727 | ) | | (648 | ) | | (2,198 | ) | | (2,021 | ) |
Non-U.S. credit card (1) | — |
| | (59 | ) | | (103 | ) | | (183 | ) |
| Direct/Indirect consumer | (135 | ) | | (98 | ) | | (356 | ) | | (287 | ) |
| Other consumer | (57 | ) | | (63 | ) | | (162 | ) | | (173 | ) |
| Total consumer charge-offs | (1,150 | ) | | (1,114 | ) | | (3,452 | ) | | (3,592 | ) |
U.S. commercial (2) | (171 | ) | | (141 | ) | | (449 | ) | | (423 | ) |
| Commercial real estate | (4 | ) | | (1 | ) | | (12 | ) | | (9 | ) |
| Commercial lease financing | (3 | ) | | (9 | ) | | (9 | ) | | (26 | ) |
| Non-U.S. commercial | (34 | ) | | (12 | ) | | (100 | ) | | (101 | ) |
| Total commercial charge-offs | (212 | ) | | (163 | ) | | (570 | ) | | (559 | ) |
| Total loans and leases charged off | (1,362 | ) | | (1,277 | ) | | (4,022 | ) | | (4,151 | ) |
| Recoveries of loans and leases previously charged off | | | | | | | |
| Residential mortgage | 133 |
| | 62 |
| | 241 |
| | 210 |
|
| Home equity | 97 |
| | 83 |
| | 279 |
| | 254 |
|
| U.S. credit card | 115 |
| | 105 |
| | 340 |
| | 318 |
|
| Non-U.S. credit card | — |
| | 16 |
| | 28 |
| | 49 |
|
| Direct/Indirect consumer | 68 |
| | 64 |
| | 209 |
| | 196 |
|
| Other consumer | 6 |
| | 6 |
| | 46 |
| | 21 |
|
| Total consumer recoveries | 419 |
| | 336 |
| | 1,143 |
| | 1,048 |
|
U.S. commercial (3) | 36 |
| | 24 |
| | 113 |
| | 111 |
|
| Commercial real estate | 2 |
| | 24 |
| | 9 |
| | 40 |
|
| Commercial lease financing | 4 |
| | 3 |
| | 9 |
| | 7 |
|
| Non-U.S. commercial | 1 |
| | 2 |
| | 6 |
| | 4 |
|
| Total commercial recoveries | 43 |
| | 53 |
| | 137 |
| | 162 |
|
| Total recoveries of loans and leases previously charged off | 462 |
| | 389 |
| | 1,280 |
| | 1,210 |
|
| Net charge-offs | (900 | ) | | (888 | ) | | (2,742 | ) | | (2,941 | ) |
| Write-offs of PCI loans | (73 | ) | | (83 | ) | | (161 | ) | | (270 | ) |
| Provision for loan and lease losses | 829 |
| | 834 |
| | 2,395 |
| | 2,802 |
|
Other (4) | (38 | ) | | (8 | ) | | (36 | ) | | (133 | ) |
| Allowance for loan and lease losses, September 30 | 10,693 |
| | 11,692 |
| | 10,693 |
| | 11,692 |
|
| Reserve for unfunded lending commitments, beginning of period | 757 |
| | 750 |
| | 762 |
| | 646 |
|
| Provision for unfunded lending commitments | 5 |
| | 16 |
| | — |
| | 21 |
|
Other (4) | — |
| | 1 |
| | — |
| | 100 |
|
| Reserve for unfunded lending commitments, September 30 | 762 |
| | 767 |
| | 762 |
| | 767 |
|
| Allowance for credit losses, September 30 | $ | 11,455 |
| | $ | 12,459 |
| | $ | 11,455 |
| | $ | 12,459 |
|
| | | | | | | | |
(1)45Bank of America
| Represents net charge-offs of non-U.S. credit card loans, which were previously included in assets of business held for sale. During the second quarter of 2017, the Corporation sold its non-U.S. consumer credit card business. | |
| |
(2)
| Includes U.S. small business commercial charge-offs of $65 million and $193 million for the three and nine months ended September 30, 2017 compared to $66 million and $189 million for the same periods in 2016.
|
| |
(3)
| Includes U.S. small business commercial recoveries of $10 million and $33 million for the three and nine months ended September 30, 2017 compared to $11 million and $32 million for the same periods in 2016.
|
| |
(4)
| Primarily represents the net impact of portfolio sales, consolidations and deconsolidations, foreign currency translation adjustments, transfers to held-for-sale and certain other reclassifications. |
Bank of America58
|
| | | | | | | | | | | | | | | | |
| | | | | | | | | |
| Table 48 | Allowance for Credit Losses (continued) | | | | | | | |
| | | | | | | | | |
| | | Three Months Ended September 30 | | Nine Months Ended September 30 |
| (Dollars in millions) | 2017 | | 2016 | | 2017 | | 2016 |
| Loan and allowance ratios: | | | | | | | |
Loans and leases outstanding at September 30 (5) | $ | 920,832 |
| | $ | 896,900 |
| | $ | 920,832 |
| | $ | 896,900 |
|
Allowance for loan and lease losses as a percentage of total loans and leases outstanding at September 30 (5) | 1.16 | % | | 1.30 | % | | 1.16 | % | | 1.30 | % |
Consumer allowance for loan and lease losses as a percentage of total consumer loans and leases outstanding at September 30 (6) | 1.25 |
| | 1.42 |
| | 1.25 |
| | 1.42 |
|
Commercial allowance for loan and lease losses as a percentage of total commercial loans and leases outstanding at September 30 (7) | 1.08 |
| | 1.19 |
| | 1.08 |
| | 1.19 |
|
Average loans and leases outstanding (5) | $ | 911,945 |
| | $ | 892,207 |
| | $ | 908,670 |
| | $ | 889,498 |
|
Annualized net charge-offs as a percentage of average loans and leases outstanding (5, 8) | 0.39 | % | | 0.40 | % | | 0.40 | % | | 0.44 | % |
Annualized net charge-offs and PCI write-offs as a percentage of average loans and leases outstanding (5) | 0.42 |
| | 0.43 |
| | 0.43 |
| | 0.48 |
|
Allowance for loan and lease losses as a percentage of total nonperforming loans and leases at September 30 (5, 9) | 163 |
| | 140 |
| | 163 |
| | 140 |
|
Ratio of the allowance for loan and lease losses at September 30 to annualized net charge-offs (8) | 3.00 |
| | 3.31 |
| | 2.92 |
| | 2.98 |
|
| Ratio of the allowance for loan and lease losses at September 30 to annualized net charge-offs and PCI write-offs | 2.77 |
| | 3.03 |
| | 2.76 |
| | 2.73 |
|
Amounts included in allowance for loan and lease losses for loans and leases that are excluded from nonperforming loans and leases at September 30 (10) | $ | 3,880 |
| | $ | 4,068 |
| | $ | 3,880 |
| | $ | 4,068 |
|
Allowance for loan and lease losses as a percentage of total nonperforming loans and leases, excluding the allowance for loan and lease losses for loans and leases that are excluded from nonperforming loans and leases at September 30 (5, 10) | 104 | % | | 91 | % | | 104 | % | | 91 | % |
Loan and allowance ratios excluding PCI loans and the related valuation allowance: (11) | |
| | | | | | |
Allowance for loan and lease losses as a percentage of total loans and leases outstanding at September 30 (5) | 1.14 | % | | 1.27 | % | | 1.14 | % | | 1.27 | % |
Consumer allowance for loan and lease losses as a percentage of total consumer loans and leases outstanding at September 30 (6) | 1.21 |
| | 1.36 |
| | 1.21 |
| | 1.36 |
|
Annualized net charge-offs as a percentage of average loans and leases outstanding (5) | 0.40 |
| | 0.40 |
| | 0.41 |
| | 0.45 |
|
Allowance for loan and lease losses as a percentage of total nonperforming loans and leases at September 30 (5, 9) | 158 |
| | 135 |
| | 158 |
| | 135 |
|
| Ratio of the allowance for loan and lease losses at September 30 to annualized net charge-offs | 2.91 |
| | 3.18 |
| | 2.83 |
| | 2.86 |
|
| |
(5)
| Outstanding loan and lease balances and ratios do not include loans accounted for under the fair value option of $6.3 billion and $8.1 billion at September 30, 2017 and 2016. Average loans accounted for under the fair value option were $6.2 billion and $7.0 billion for the three and nine months ended September 30, 2017 compared to $8.4 billion and $8.3 billion for the same periods in 2016.
|
| |
(6)
| Excludes consumer loans accounted for under the fair value option of $978 million and $1.8 billion at September 30, 2017 and 2016.
|
| |
(7)
| Excludes commercial loans accounted for under the fair value option of $5.3 billion and $6.3 billion at September 30, 2017 and 2016.
|
| |
(8)
| Net charge-offs exclude $73 million and $161 million of write-offs in the PCI loan portfolio for the three and nine months ended September 30, 2017 compared to $83 million and $270 million for the same periods in 2016. For more information on PCI write-offs, see Consumer Portfolio Credit Risk Management – Purchased Credit-impaired Loan Portfolio on page 45.
|
| |
(9)
| For more information on our definition of nonperforming loans, see pages 48 and 52.
|
| |
(10)
| Primarily includes amounts allocated to U.S. credit card and unsecured consumer lending portfolios in Consumer Banking, PCI loans and the non-U.S. credit card portfolio in All Other.
|
| |
(11)
| For more information on the PCI loan portfolio and the valuation allowance for PCI loans, see Note 4 – Outstanding Loans and Leases and Note 5 – Allowance for Credit Losses to the Consolidated Financial Statements.
|
For reporting purposes, we allocate the allowance for credit losses across products as presented in Table 49.
|
| | | | | | | | | | | | | | | | | | | | |
| | | | | | | | | | | | | |
| Table 49 | Allocation of the Allowance for Credit Losses by Product Type | | | | |
| | | | | |
| | | September 30, 2017 | | December 31, 2016 |
| (Dollars in millions) | Amount | | Percent of Total | | Percent of
Loans and
Leases Outstanding (1) | | Amount | | Percent of Total | | Percent of
Loans and
Leases Outstanding (1) |
| Allowance for loan and lease losses | |
| | |
| | |
| | |
| | |
| | |
|
| Residential mortgage | $ | 813 |
| | 7.60 | % | | 0.41 | % | | $ | 1,012 |
| | 8.82 | % | | 0.53 | % |
| Home equity | 1,219 |
| | 11.40 |
| | 2.04 |
| | 1,738 |
| | 15.14 |
| | 2.62 |
|
| U.S. credit card | 3,263 |
| | 30.52 |
| | 3.52 |
| | 2,934 |
| | 25.56 |
| | 3.18 |
|
| Non-U.S. credit card | — |
| | — |
| | — |
| | 243 |
| | 2.12 |
| | 2.64 |
|
| Direct/Indirect consumer | 255 |
| | 2.38 |
| | 0.27 |
| | 244 |
| | 2.13 |
| | 0.26 |
|
| Other consumer | 32 |
| | 0.30 |
| | 1.32 |
| | 51 |
| | 0.44 |
| | 2.01 |
|
| Total consumer | 5,582 |
| | 52.20 |
| | 1.25 |
| | 6,222 |
| | 54.21 |
| | 1.36 |
|
U.S. commercial (2) | 3,199 |
| | 29.92 |
| | 1.08 |
| | 3,326 |
| | 28.97 |
| | 1.17 |
|
| Commercial real estate | 956 |
| | 8.94 |
| | 1.60 |
| | 920 |
| | 8.01 |
| | 1.60 |
|
| Commercial lease financing | 144 |
| | 1.35 |
| | 0.67 |
| | 138 |
| | 1.20 |
| | 0.62 |
|
| Non-U.S. commercial | 812 |
| | 7.59 |
| | 0.85 |
| | 874 |
| | 7.61 |
| | 0.98 |
|
| Total commercial | 5,111 |
| | 47.80 |
| | 1.08 |
| | 5,258 |
| | 45.79 |
| | 1.16 |
|
Allowance for loan and lease losses (3) | 10,693 |
| | 100.00 | % | | 1.16 |
| | 11,480 |
| | 100.00 | % | | 1.26 |
|
Less: Allowance included in assets of business held for sale (4) | — |
| | | | | | (243 | ) | | | | |
| Total allowance for loan and lease losses | 10,693 |
| | | | | | 11,237 |
| | | | |
| Reserve for unfunded lending commitments | 762 |
| | | | | | 762 |
| | | | |
|
| Allowance for credit losses | $ | 11,455 |
| | | | | | $ | 11,999 |
| | | | |
|
| |
(1)
| Ratios are calculated as allowance for loan and lease losses as a percentage of loans and leases outstanding excluding loans accounted for under the fair value option. Consumer loans accounted for under the fair value option included residential mortgage loans of $615 million and $710 million and home equity loans of $363 million and $341 million at September 30, 2017 and December 31, 2016. Commercial loans accounted for under the fair value option included U.S. commercial loans of $2.8 billion and $2.9 billion and non-U.S. commercial loans of $2.5 billion and $3.1 billion at September 30, 2017 and December 31, 2016.
|
| |
(2)
| Includes allowance for loan and lease losses for U.S. small business commercial loans of $422 million and $416 million at September 30, 2017 and December 31, 2016.
|
| |
(3)
| Includes $315 million and $419 million of valuation allowance presented with the allowance for loan and lease losses related to PCI loans at September 30, 2017 and December 31, 2016.
|
| |
(4)
| Represents allowance for loan and lease losses related to the non-U.S. credit card loan portfolio, which was included in assets of business held for sale on the Consolidated Balance Sheet at December 31, 2016. During the second quarter of 2017, the Corporation sold its non-U.S. consumer credit card business. |
Market Risk Management
For more information on our market risk management process, see Market Risk Management in the MD&A of the Corporation's 2016Corporation’s 2019 Annual Report on Form 10-K.
Market risk is the risk that changes in market conditions may adversely impact the value of assets or liabilities, or otherwise negatively impact earnings. This risk is inherent in the financial instruments associated with our operations, primarily within our Global Markets segment. We are also exposed to these risks in other areas of the Corporation (e.g., our ALM activities). In the event of market stress, these risks could have a material impact on our results. We have been affected, and expect to continue to be affected, by market stress resulting from the COVID-19 pandemic that began in the first quarter of 2020. For more information on the effects of the pandemic, see Executive Summary - Recent Developments – COVID-19 Pandemic on page 3.
Trading Risk Management
To evaluate risk arising fromrisks in our trading activities, the Corporation focuseswe focus on the actual and potential volatility of revenues generated by individual positions as well as portfolios of positions.
VaR is a common statistic used to measure market risk as it allows the aggregation of market risk factors, including the effects of portfolio diversification. A VaR model simulates the value of a portfolio under a range of scenarios in order to generate a distribution of potential gains and losses. VaR represents the loss a portfolio is not expected to exceed more than a certain number of times per period, based on a specified holding period, confidence level and window of historical data. We use one VaR model consistently across the trading portfolios and it uses a historical simulation approach based on a three-year window of historical data.risk. Our primary VaR statistic is equivalent to a 99 percent confidence level. Thislevel, which means that for a VaR with a one-day holding period, there should not be losses in excess of VaR, on average, 99 out of 100 trading days.
Table 41 presents the total market-based portfolio VaR which is the combination of the total covered positions (and less liquid trading positions) portfolio and the fair value option portfolio. For more information on ourthe market risk VaR for trading risk management process,activities, see Trading Risk Management in the MD&A of the Corporation's 2016Corporation’s 2019 Annual Report on Form 10-K.
Table 50 presents the total market-based trading portfolio VaR which is the combination of the covered positions trading portfolio and the impact from less liquid trading exposures. Covered positions are defined by regulatory standards as trading assets
and liabilities, both on- and off-balance sheet, that meet a defined set of specifications. These specifications identify the most liquid trading positions which are intended to be held for a short-term horizon and where we are able to hedge the material risk elements in a two-way market. Positions in less liquid markets, or where there are restrictions on the ability to trade the positions, typically do not qualify as covered positions. Foreign exchange and commodity positions are always considered covered positions, except for structural foreign currency positions that are excluded with prior regulatory approval. In addition, Table 50 presents our fair value option portfolio, which includes substantially all of the funded and unfunded exposures for which we elect the fair value option, and their corresponding hedges. The fair value option portfolio combined with the total market-based trading portfolio VaR represents our total market-based portfolio VaR. Additionally, market risk VaR for trading activities as presented in Table 50 differs from VaR used for regulatory capital calculations due to the holding period being used. The holding period for VaR used for regulatory capital calculations is 10 days, while for the market risk VaR presented below, it is one day. Both measures utilize the same process and methodology.
The total market-based portfolio VaR results in Table 5041 include market risk to which we are exposed from all business segments, excluding CVAcredit valuation adjustment (CVA), DVA and DVA.related hedges. The majority of this portfolio is inwithin the Global Markets segment.
Table 5041 presents period-end, average, high and low daily trading VaR for the three months ended September 30, 2017,2020, June 30, 20172020 and September 30, 2016,2019 using a 99 percent confidence level, as well as average daily trading VaR for the nine months ended September 30, 20172020 and 2016, using2019. The amounts disclosed in Table 41 and Table 42 align to the view of covered positions used in the Basel 3 capital calculations. Foreign exchange and commodity positions are always considered covered positions, regardless of trading or banking treatment for the trade, except for structural foreign currency positions that are excluded with prior regulatory approval.
The average of total covered positions and less liquid trading positions portfolio VaR increased for the three months ended September 30, 2020 compared to the prior quarter primarily due to a 99 percent confidence level.decrease in portfolio diversification.
| | | | | | | | | | | | | | | | | | | | | | | | | | | | | | | | | | | | | | | | | | | | | | | | | | | | | | | | | | | | | | | | | | | | | | | | | | | | | | | | | | | | | | |
| | | | | | | | | | | | | | | | | | | | | | | | | | | | |
| Table 41 | Market Risk VaR for Trading Activities | | | | | | | | | | | | | | | | |
| | | | | | |
| | Three Months Ended | | Nine Months Ended September 30 |
| | | |
| September 30, 2020 | | June 30, 2020 | | September 30, 2019 | |
| (Dollars in millions) | Period End | | Average | | High (1) | | Low (1) | | Period End | | Average | | High (1) | | Low (1) | | Period End | | Average | | High (1) | | Low (1) | | 2020 Average | | 2019 Average |
| Foreign exchange | $ | 7 | | | $ | 7 | | | $ | 25 | | | $ | 5 | | | $ | 5 | | | $ | 7 | | | $ | 11 | | | $ | 4 | | | $ | 3 | | | $ | 6 | | | $ | 11 | | | $ | 3 | | | $ | 7 | | | $ | 6 | |
| Interest rate | 14 | | | 18 | | | 27 | | | 13 | | | 17 | | | 15 | | | 23 | | | 7 | | | 22 | | | 20 | | | 26 | | | 14 | | | 18 | | | 25 | |
| Credit | 61 | | | 62 | | | 68 | | | 54 | | | 64 | | | 65 | | | 91 | | | 48 | | | 26 | | | 24 | | | 27 | | | 20 | | | 54 | | | 22 | |
| Equity | 16 | | | 17 | | | 22 | | | 12 | | | 16 | | | 24 | | | 43 | | | 15 | | | 24 | | | 23 | | | 29 | | | 17 | | | 26 | | | 21 | |
| Commodities | 4 | | | 6 | | | 10 | | | 4 | | | 7 | | | 7 | | | 12 | | | 5 | | | 4 | | | 6 | | | 31 | | | 4 | | | 6 | | | 6 | |
| Portfolio diversification | (71) | | | (56) | | | — | | | — | | | (39) | | | (60) | | | — | | | — | | | (50) | | | (48) | | | — | | | — | | | (58) | | | (48) | |
| Total covered positions portfolio | 31 | | | 54 | | | 96 | | | 31 | | | 70 | | | 58 | | | 85 | | | 28 | | | 29 | | | 31 | | | 36 | | | 24 | | | 53 | | | 32 | |
| Impact from less liquid exposures | 50 | | | 55 | | | — | | | — | | | 30 | | | 23 | | | — | | | — | | | 2 | | | 3 | | | — | | | — | | | 26 | | | 3 | |
| Total covered positions and less liquid trading positions portfolio | 81 | | | 109 | | | 149 | | | 55 | | | 100 | | | 81 | | | 111 | | | 47 | | | 31 | | | 34 | | | 38 | | | 27 | | | 79 | | | 35 | |
| Fair value option loans | 71 | | | 62 | | | 72 | | | 54 | | | 56 | | | 67 | | | 84 | | | 55 | | | 11 | | | 11 | | | 13 | | | 9 | | | 48 | | | 9 | |
| Fair value option hedges | 11 | | | 13 | | | 15 | | | 11 | | | 15 | | | 15 | | | 17 | | | 12 | | | 10 | | | 11 | | | 13 | | | 9 | | | 13 | | | 9 | |
| Fair value option portfolio diversification | (27) | | | (32) | | | — | | | — | | | (36) | | | (31) | | | — | | | — | | | (6) | | | (10) | | | — | | | — | | | (24) | | | (9) | |
| Total fair value option portfolio | 55 | | | 43 | | | 58 | | | 34 | | | 35 | | | 51 | | | 86 | | | 34 | | | 15 | | | 12 | | | 16 | | | 9 | | | 37 | | | 9 | |
| Portfolio diversification | (10) | | | (18) | | | — | | | — | | | (16) | | | (12) | | | — | | | — | | | (12) | | | (9) | | | — | | | — | | | (14) | | | (6) | |
| Total market-based portfolio | $ | 126 | | | $ | 134 | | | 160 | | | 99 | | | $ | 119 | | | $ | 120 | | | 159 | | | 76 | | | $ | 34 | | | $ | 37 | | | 44 | | | 28 | | | $ | 102 | | | $ | 38 | |
(1)The high and low for each portfolio may have occurred on different trading days than the high and low for the components. Therefore the impact from less liquid exposures and the amount of portfolio diversification, which is the difference between the total portfolio and the sum of the individual components, is not relevant.
|
| | | | | | | | | | | | | | | | | | | | | | | | | | | | | | | | | | | | | | | | | | | | | | | | | | | | | | | | |
| | | | | | | | | | | | | | | | | | | | | | | | | | | | | |
| Table 50 | Market Risk VaR for Trading Activities | | | | | | | | | | | | | | | | |
| | | | | | | | | | | | | | | | | | | | | | | | | | | Nine Months Ended September 30 |
| | | Three Months Ended | |
| | | September 30, 2017 | | June 30, 2017 | | September 30, 2016 | |
| (Dollars in millions) | Period End | | Average | | High (1) | | Low (1) | | Period End | | Average | | High (1) | | Low (1) | | Period End | | Average | | High (1) | | Low (1) | | 2017 Average | | 2016 Average |
| Foreign exchange | $ | 6 |
| | $ | 10 |
| | $ | 15 |
| | $ | 5 |
| | $ | 11 |
| | $ | 13 |
| | $ | 25 |
| | $ | 3 |
| | $ | 7 |
| | $ | 8 |
| | $ | 11 |
| | $ | 6 |
| | $ | 12 |
| | $ | 9 |
|
| Interest rate | 15 |
| | 21 |
| | 41 |
| | 14 |
| | 18 |
| | 23 |
| | 33 |
| | 15 |
| | 15 |
| | 20 |
| | 25 |
| | 15 |
| | 20 |
| | 21 |
|
| Credit | 24 |
| | 25 |
| | 29 |
| | 23 |
| | 26 |
| | 25 |
| | 29 |
| | 22 |
| | 31 |
| | 29 |
| | 37 |
| | 25 |
| | 25 |
| | 30 |
|
| Equity | 17 |
| | 17 |
| | 33 |
| | 12 |
| | 19 |
| | 18 |
| | 26 |
| | 13 |
| | 16 |
| | 17 |
| | 24 |
| | 11 |
| | 18 |
| | 19 |
|
| Commodity | 4 |
| | 5 |
| | 7 |
| | 4 |
| | 6 |
| | 6 |
| | 9 |
| | 4 |
| | 8 |
| | 7 |
| | 10 |
| | 5 |
| | 5 |
| | 6 |
|
| Portfolio diversification | (40 | ) | | (44 | ) | | — |
| | — |
| | (45 | ) | | (47 | ) | | — |
| | — |
| | (45 | ) | | (47 | ) | | — |
| | — |
| | (45 | ) | | (47 | ) |
| Total covered positions trading portfolio | 26 |
| | 34 |
| | 51 |
| | 24 |
| | 35 |
| | 38 |
| | 53 |
| | 26 |
| | 32 |
| | 34 |
| | 46 |
| | 28 |
| | 35 |
| | 38 |
|
| Impact from less liquid exposures | 3 |
| | 7 |
| | — |
| | — |
| | 3 |
| | 5 |
| | — |
| | — |
| | 12 |
| | 6 |
| | — |
| | — |
| | 6 |
| | 5 |
|
| Total market-based trading portfolio | 29 |
| | 41 |
| | 63 |
| | 26 |
| | 38 |
| | 43 |
| | 60 |
| | 32 |
| | 44 |
| | 40 |
| | 50 |
| | 31 |
| | 41 |
| | 43 |
|
| Fair value option loans | 10 |
| | 10 |
| | 12 |
| | 9 |
| | 9 |
| | 10 |
| | 12 |
| | 9 |
| | 16 |
| | 18 |
| | 23 |
| | 16 |
| | 11 |
| | 26 |
|
| Fair value option hedges | 8 |
| | 8 |
| | 9 |
| | 6 |
| | 6 |
| | 5 |
| | 7 |
| | 4 |
| | 7 |
| | 8 |
| | 11 |
| | 6 |
| | 6 |
| | 13 |
|
| Fair value option portfolio diversification | (11 | ) | | (9 | ) | | — |
| | — |
| | (6 | ) | | (6 | ) | | — |
| | — |
| | (12 | ) | | (15 | ) | | — |
| | — |
| | (8 | ) | | (24 | ) |
| Total fair value option portfolio | 7 |
| | 9 |
| | 10 |
| | 7 |
| | 9 |
| | 9 |
| | 11 |
| | 8 |
| | 11 |
| | 11 |
| | 16 |
| | 9 |
| | 9 |
| | 15 |
|
| Portfolio diversification | (4 | ) | | (3 | ) | | — |
| | — |
| | (5 | ) | | (4 | ) | | — |
| | — |
| | (3 | ) | | (4 | ) | | — |
| | — |
| | (4 | ) | | (8 | ) |
| Total market-based portfolio | $ | 32 |
| | $ | 47 |
| | 69 |
| | 29 |
| | $ | 42 |
| | $ | 48 |
| | 66 |
| | 36 |
| | $ | 52 |
| | $ | 47 |
| | 61 |
| | 36 |
| | $ | 46 |
| | $ | 50 |
|
| |
(1)
| The high and low for each portfolio may have occurred on different trading days than the high and low for the components. Therefore the impact from less liquid exposures and the amount of portfolio diversification, which is the difference between the total portfolio and the sum of the individual components, is not relevant. |
The graph below presents the daily total market-basedcovered positions and less liquid trading positions portfolio VaR for the previous five quarters, corresponding to the data in Table 50.41. Peak VaR in mid-March 2020 was driven by increased market realized volatility and higher implied volatilities.
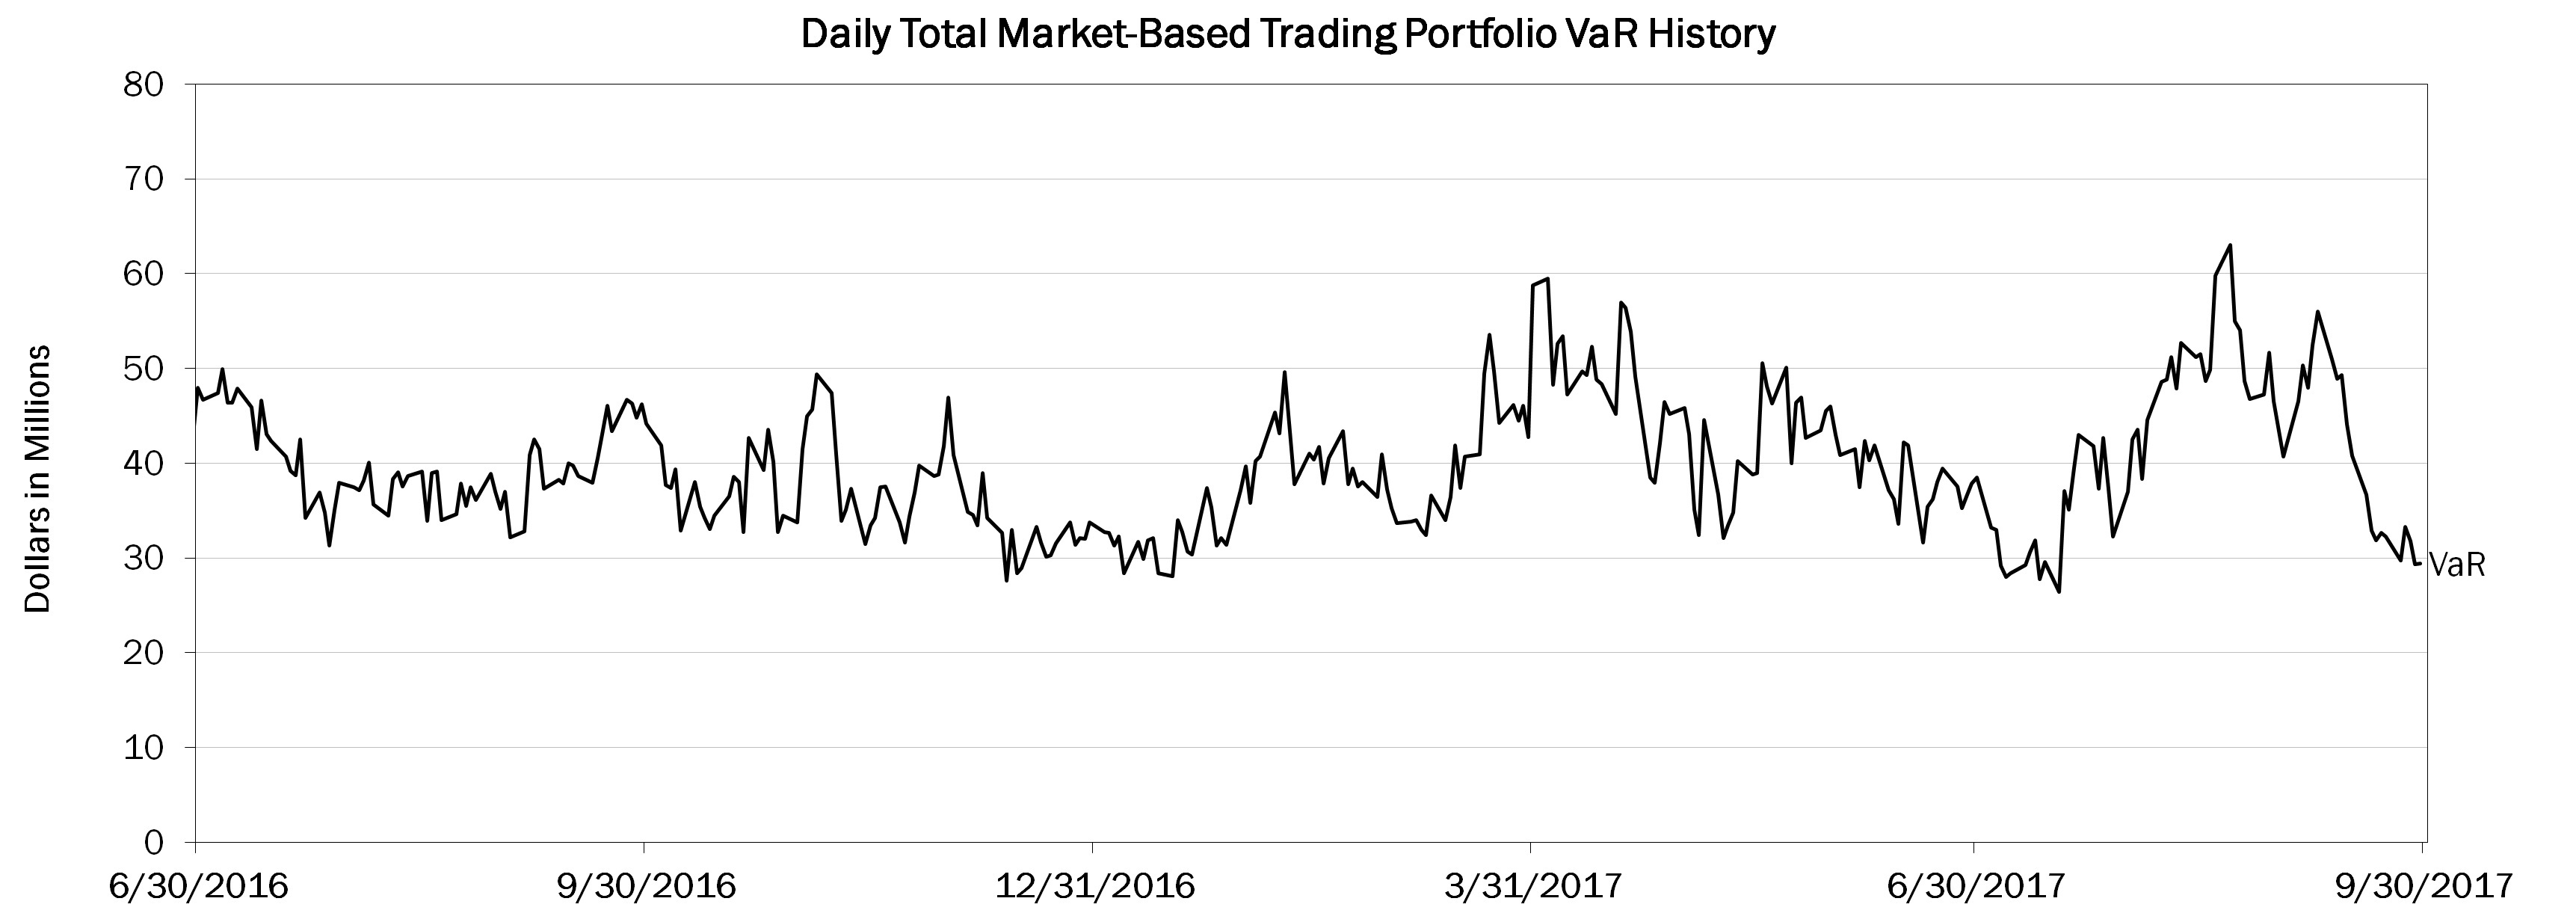
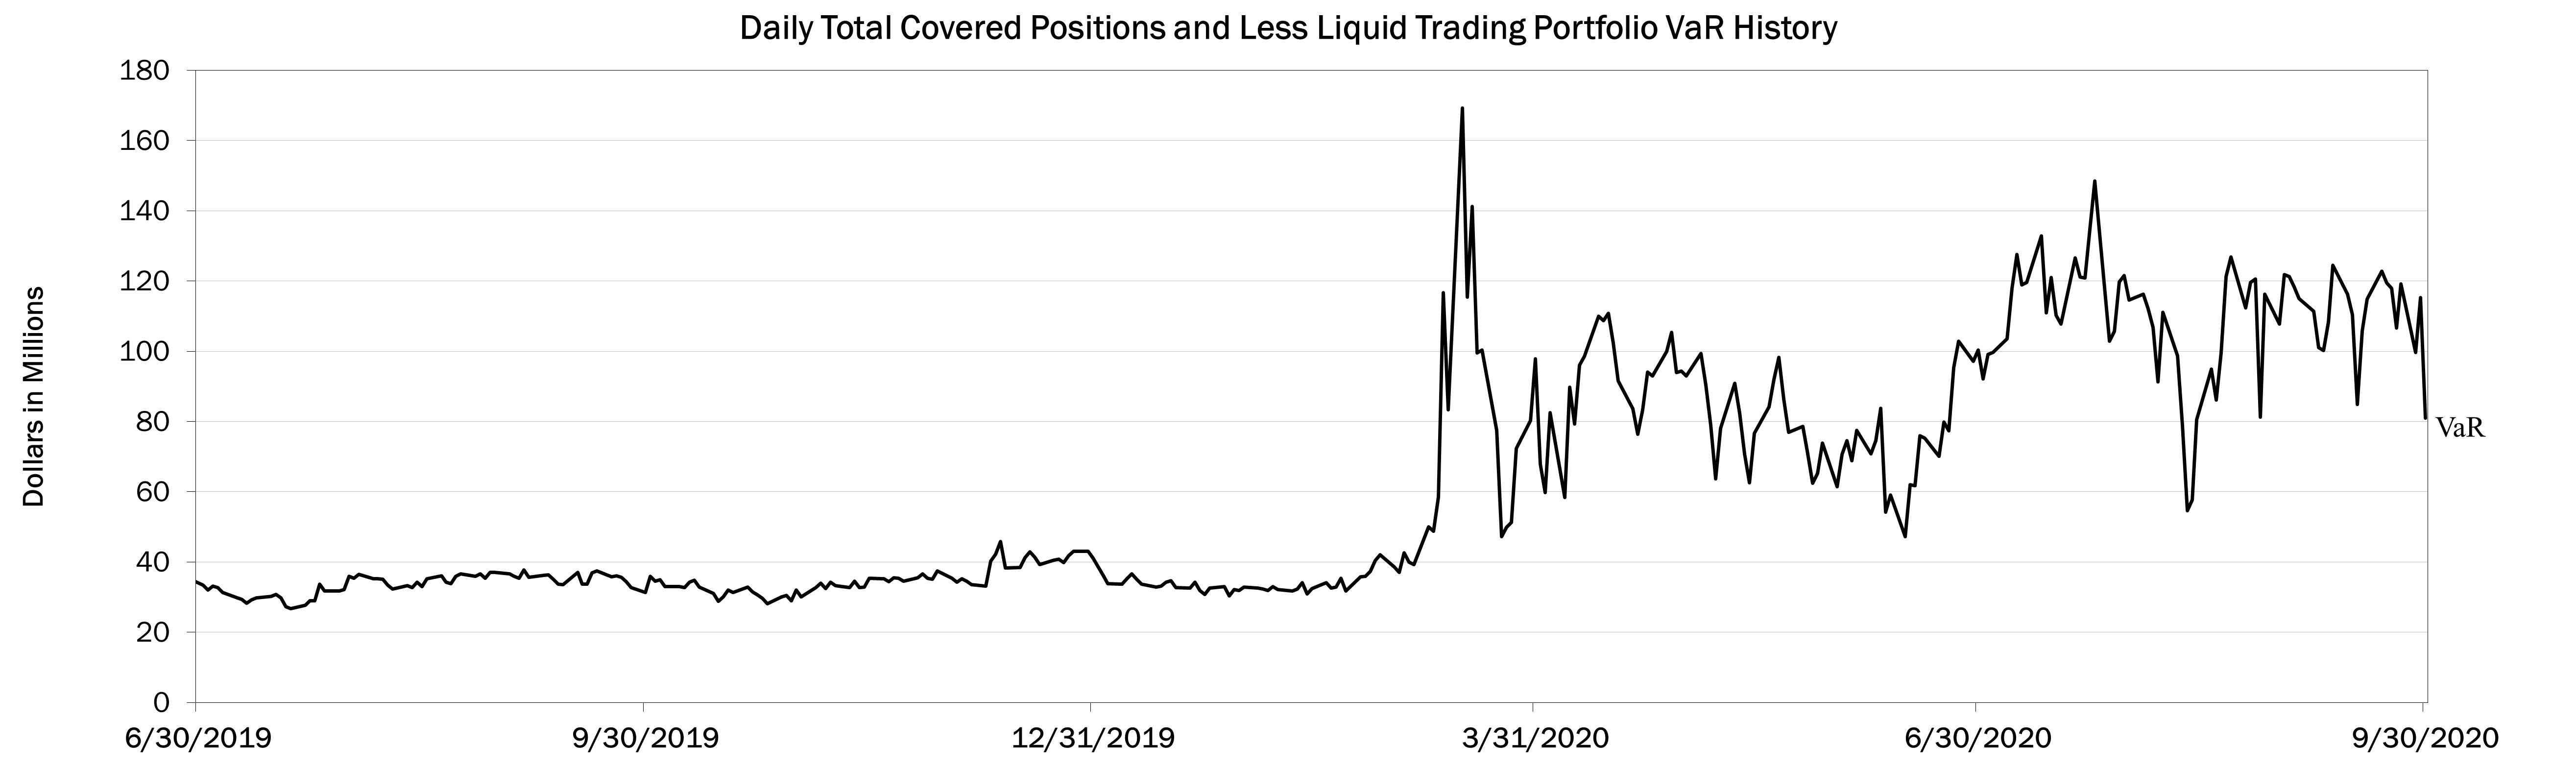
Additional VaR statistics produced within our single VaR model are provided in Table 5142 at the same level of detail as in Table 50.41. Evaluating VaR with additional statistics allows for an increased understanding of the risks in the portfolio as the historical market data used in the VaR calculation does not necessarily follow a predefined statistical distribution. Table 5142 presents average trading VaR statistics at 99 percent and 95
percent confidence levels for the three months ended September 30, 2017,2020, June 30, 20172020 and September 30, 2016.2019. The increase in VaR for the 99 percent confidence level for the three months ended September 30, 2020 was primarily due to COVID-19 related market volatility, which impacted the 99 percent VaR average more severely than the 95 percent VaR average.
| | | Table 42 | | Table 42 | Average Market Risk VaR for Trading Activities – 99 percent and 95 percent VaR Statistics |
| | | | | | | | | | | | | | | | |
| Table 51 | Average Market Risk VaR for Trading Activities – 99 percent and 95 percent VaR Statistics | |
| | | | | | | | | | | | | | |
| | | Three Months Ended | | | Three Months Ended |
| | | September 30, 2017 | | June 30, 2017 | | September 30, 2016 | | | September 30, 2020 | | June 30, 2020 | | September 30, 2019 |
| (Dollars in millions) | (Dollars in millions) | | 99 percent | | 95 percent | | 99 percent | | 95 percent | | 99 percent | | 95 percent | (Dollars in millions) | | 99 percent | | 95 percent | | 99 percent | | 95 percent | | 99 percent | | 95 percent |
| Foreign exchange | Foreign exchange | | $ | 10 |
| | $ | 6 |
| | $ | 13 |
| | $ | 7 |
| | $ | 8 |
| | $ | 4 |
| Foreign exchange | | $ | 7 | | | $ | 4 | | | $ | 7 | | | $ | 4 | | | $ | 6 | | | $ | 4 | |
| Interest rate | Interest rate | | 21 |
| | 14 |
| | 23 |
| | 16 |
| | 20 |
| | 13 |
| Interest rate | | 18 | | | 8 | | | 15 | | | 6 | | | 20 | | | 13 | |
| Credit | Credit | | 25 |
| | 15 |
| | 25 |
| | 15 |
| | 29 |
| | 18 |
| Credit | | 62 | | | 18 | | | 65 | | | 18 | | | 24 | | | 16 | |
| Equity | Equity | | 17 |
| | 9 |
| | 18 |
| | 9 |
| | 17 |
| | 10 |
| Equity | | 17 | | | 9 | | | 24 | | | 12 | | | 23 | | | 12 | |
| Commodity | | 5 |
| | 3 |
| | 6 |
| | 4 |
| | 7 |
| | 4 |
| |
| Commodities | | Commodities | | 6 | | | 3 | | | 7 | | | 4 | | | 6 | | | 3 | |
| Portfolio diversification | Portfolio diversification | | (44 | ) | | (30 | ) | | (47 | ) | | (30 | ) | | (47 | ) | | (30 | ) | Portfolio diversification | | (56) | | | (25) | | | (60) | | | (25) | | | (48) | | | (31) | |
| Total covered positions trading portfolio | | 34 |
| | 17 |
| | 38 |
| | 21 |
| | 34 |
| | 19 |
| |
| Total covered positions portfolio | | Total covered positions portfolio | | 54 | | | 17 | | | 58 | | | 19 | | | 31 | | | 17 | |
| Impact from less liquid exposures | Impact from less liquid exposures | | 7 |
| | 2 |
| | 5 |
| | 2 |
| | 6 |
| | 3 |
| Impact from less liquid exposures | | 55 | | | 5 | | | 23 | | | 2 | | | 3 | | | 2 | |
| Total market-based trading portfolio | | 41 |
| | 19 |
| | 43 |
| | 23 |
| | 40 |
| | 22 |
| |
| Total covered positions and less liquid trading positions portfolio | | Total covered positions and less liquid trading positions portfolio | | 109 | | | 22 | | | 81 | | | 21 | | | 34 | | | 19 | |
| Fair value option loans | Fair value option loans | | 10 |
| | 6 |
| | 10 |
| | 6 |
| | 18 |
| | 10 |
| Fair value option loans | | 62 | | | 14 | | | 67 | | | 15 | | | 11 | | | 6 | |
| Fair value option hedges | Fair value option hedges | | 8 |
| | 6 |
| | 5 |
| | 4 |
| | 8 |
| | 6 |
| Fair value option hedges | | 13 | | | 6 | | | 15 | | | 8 | | | 11 | | | 7 | |
| Fair value option portfolio diversification | Fair value option portfolio diversification | | (9 | ) | | (7 | ) | | (6 | ) | | (5 | ) | | (15 | ) | | (9 | ) | Fair value option portfolio diversification | | (32) | | | (7) | | | (31) | | | (12) | | | (10) | | | (7) | |
| Total fair value option portfolio | Total fair value option portfolio | | 9 |
| | 5 |
| | 9 |
| | 5 |
| | 11 |
| | 7 |
| Total fair value option portfolio | | 43 | | | 13 | | | 51 | | | 11 | | | 12 | | | 6 | |
| Portfolio diversification | Portfolio diversification | | (3 | ) | | (3 | ) | | (4 | ) | | (3 | ) | | (4 | ) | | (3 | ) | Portfolio diversification | | (18) | | | (7) | | | (12) | | | (7) | | | (9) | | | (4) | |
| Total market-based portfolio | Total market-based portfolio | | $ | 47 |
| | $ | 21 |
| | $ | 48 |
| | $ | 25 |
| | $ | 47 |
| | $ | 26 |
| Total market-based portfolio | | $ | 134 | | | $ | 28 | | | $ | 120 | | | $ | 25 | | | $ | 37 | | | $ | 21 | |
Backtesting
The accuracy of the VaR methodology is evaluated by backtesting, which compares the daily VaR results, utilizing a one-day holding period, against a comparable subset of trading revenue. A backtesting excess occurs when a trading loss exceeds the VaR for the corresponding day. These excesses are evaluated to understand the positions and market moves that produced the trading loss and to ensure that the VaR methodology accurately represents those losses. For more information on our backtesting process, see Trading Risk Management – Backtesting in the MD&A of the Corporation's 2016Corporation’s 2019 Annual Report on Form 10-K.
During the three and nine months ended September 30, 2017,2020, there were no days in which there was a backtesting excess forwhere this subset of trading revenue had losses that exceeded our total market-basedcovered portfolio VaR, utilizing a one-day holding period. During the nine months ended September 30, 2020, seven days with losses exceeded total covered portfolio VaR.
Total Trading-related Revenue
Total trading-related revenue, excluding brokerage fees, and CVA, DVA and funding valuation adjustment (FVA) gains (losses), represents the total amount earned from trading positions,
including market-based net interest income, which are taken in a diverse range of financial instruments and markets. Trading account assets and liabilities are reported at fair value. For more
information, see Trading Risk Management – Total Trading-related Revenue in the MD&A of the Corporation’s 2019 Annual Report on fair value, see Note 14 – Fair Value Measurements to the Consolidated Financial Statements. Trading-related revenue can be volatile and is largely driven by general market conditions and customer demand. Also, trading-related revenue is dependent on the volume and type of transactions, the level of risk assumed, and the volatility of price and rate movements at any given time within the ever-changing market environment. Significant daily revenue by business is monitored and the primary drivers of these are reviewed.Form 10-K.
The following histogram is a graphic depiction of trading volatility and illustrates the daily level of trading-related revenue for the three months ended September 30, 20172020 compared to the three months ended June 30, 20172020 and March 31, 2017.2020. During the three months ended September 30, 2017,2020, positive trading-related revenue was recorded for 100 percent of the trading days, of which 7788 percent were daily trading gains of over $25 million. This compares to the three months ended June 30, 2017,2020 where positive trading-related revenue was recorded for all100 percent of the trading days, of which 8095 percent were daily trading gains of over $25 million. During the three months ended March 31, 2017,2020, positive trading-related
revenue was recorded for all94 percent of the trading days, of which 89 percent were daily trading gains of over $25 million.
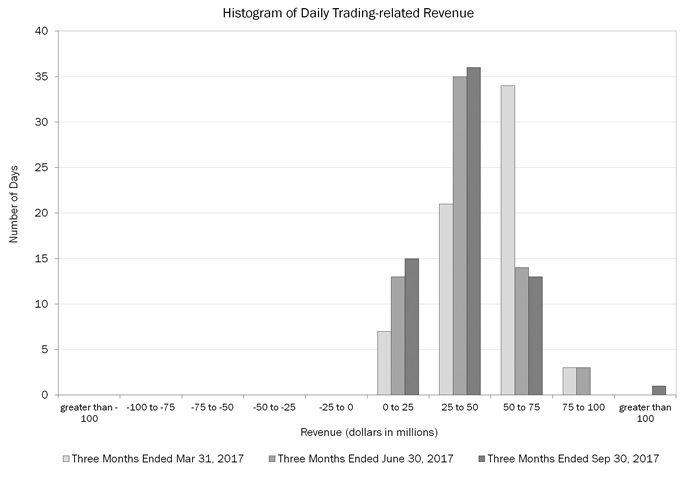
Trading Portfolio Stress Testing
Because the very nature of a VaR model suggests results can exceed our estimates and it is dependent on a limited historical window, we also stress test our portfolio using scenario analysis. This analysis estimates the change in the value of our trading portfolio that may result from abnormal market movements. For additionalmore information, see Trading Risk Management – Trading Portfolio Stress Testing in the MD&A of the Corporation's 2016Corporation’s 2019 Annual Report on Form 10-K.
Interest Rate Risk Management for the Banking Book
The following discussion presents net interest income for banking book activities. For more information, see Interest Rate Risk Management for the Banking Book in the MD&A of the Corporation’s 2019 Annual Report on Form 10-K.
Interest rate risk represents the most significant market risk exposure to our banking book balance sheet. Interest rate risk is measured as the potential change in net interest income caused by movements in market interest rates. Client-facing activities, primarily lending and deposit-taking, create interest rate sensitive positions on our balance sheet.
We prepare forward-looking forecasts of net interest income. The baseline forecast takes into consideration expected future business growth, ALM positioning and the direction of interest rate movements as implied by the market-based forward curve. We then measure and evaluate the impact that alternative interest rate scenarios have on the baseline forecast in order to assess interest rate sensitivity under varied conditions. The net interest income forecast is frequently updated for changing assumptions and differing outlooks based on economic trends, market conditions and business strategies. Thus, we continually monitor
our balance sheet position in order to maintain an acceptable level of exposure to interest rate changes.
The interest rate scenarios that we analyze incorporate balance sheet assumptions such as loan and deposit growth and pricing, changes in funding mix, product repricing, maturity characteristics and investment securities premium amortization. Our overall goal is to manage interest rate risk so that movements in interest rates do not significantly adversely affect earnings and capital.
Table 5243 presents the spot and 12-month forward rates used in our baseline forecasts at September 30, 20172020 and December 31, 2016.2019.
| | | | | | | | | | |
| Table 52 | Forward Rates | | | | | | |
| Table 43 | | Table 43 | Forward Rates |
| | | | | | | | |
| | | September 30, 2017 | | September 30, 2020 |
| | | Federal Funds | | Three-month LIBOR | | 10-Year Swap | | | Federal
Funds | | Three-month
LIBOR | | 10-Year
Swap |
| Spot rates | Spot rates | 1.25 | % | | 1.33 | % | | 2.29 | % | Spot rates | 0.25 | % | | 0.23 | % | | 0.71 | % |
| 12-month forward rates | 12-month forward rates | 1.75 |
| | 1.77 |
| | 2.40 |
| 12-month forward rates | 0.25 | | | 0.19 | | | 0.81 | |
| | | | | | | | |
| | | December 31, 2016 | | December 31, 2019 |
| Spot rates | Spot rates | 0.75 | % | | 1.00 | % | | 2.34 | % | Spot rates | 1.75 | % | | 1.91 | % | | 1.90 | % |
| 12-month forward rates | 12-month forward rates | 1.25 |
| | 1.51 |
| | 2.49 |
| 12-month forward rates | 1.50 | | | 1.62 | | | 1.92 | |
Table 5344 shows the pre-tax dollarpretax impact to forecasted net interest income over the next 12 months from September 30, 20172020 and December 31, 2016,2019 resulting from instantaneous parallel and non-parallel shocks to the market-based forward curve. Periodically we evaluate the scenarios presented so that they are meaningful in the context of the current rate environment. The interest rate scenarios also assume U.S. dollar rates are floored at zero.
In the nine months ended September 30, 2017,2020, the asset sensitivity of our balance sheet increased in both up-rate and down-rate scenarios primarily due to rising rates was largely unchanged.higher deposit balances. We continue to be asset sensitive to a parallel upward move in interest rates with the majority of that benefitimpact coming from the short end of the yield curve. Additionally, higher interest rates impact the fair value of debt securities and, accordingly, for debt
securities classified as available-for-sale (AFS),AFS, may adversely affect accumulated OCI and thus capital levels under the Basel 3 capital rules. Under instantaneous upward parallel shifts, the near-term adverse impact to Basel 3 capital is reduced over time by offsetting positive impacts to net interest income. For more information on the transition provisions of Basel 3, see Capital Management – Regulatory Capital on page 29.24.
| | | Table 44 | | Table 44 | Estimated Banking Book Net Interest Income Sensitivity to Curve Changes |
| | | | | | | | | | | | | | | | | Short
Rate (bps) | | Long
Rate (bps) | |
| | | | | | | | | | | | |
| Table 53 | Estimated Banking Book Net Interest Income Sensitivity | |
| (Dollars in millions) | | (Dollars in millions) | Short
Rate (bps) | | Long
Rate (bps) | | September 30, 2020 | | December 31
2019 |
| | | | | | | | | | |
| | Short Rate (bps) | | Long Rate (bps) | | | | | |
| (Dollars in millions) | | September 30
2017 | | December 31
2016 | |
| Curve Change | | | |
| Parallel Shifts | Parallel Shifts | | | | | | | | Parallel Shifts | |
+100 bps instantaneous shift | +100 bps instantaneous shift | +100 | | +100 | | $ | 3,234 |
| | $ | 3,370 |
| +100 bps instantaneous shift | +100 | | +100 | | $ | 9,600 | | | $ | 4,190 | |
-50 bps instantaneous shift | -50 |
| | -50 |
| | (2,306 | ) | | (2,900 | ) | |
-25 bps instantaneous shift | | -25 bps instantaneous shift | -25 | | | -25 | | | (2,516) | | | (1,500) | |
| Flatteners | Flatteners | |
| | |
| | | | |
| Flatteners | | | | |
Short-end instantaneous change | Short-end instantaneous change | +100 | | — |
| | 2,203 |
| | 2,473 |
| Short-end instantaneous change | +100 | | — | | | 6,357 | | | 2,641 | |
Long-end instantaneous change | Long-end instantaneous change | — |
| | -50 |
| | (1,166 | ) | | (961 | ) | Long-end instantaneous change | — | | | -25 | | | (1,322) | | | (653) | |
| Steepeners | Steepeners | |
| | |
| | | | | Steepeners | | | | |
Short-end instantaneous change | Short-end instantaneous change | -50 |
| | — |
| | (1,125 | ) | | (1,918 | ) | Short-end instantaneous change | -25 | | | — | | | (1,198) | | | (844) | |
Long-end instantaneous change | Long-end instantaneous change | — |
| | +100 | | 1,042 |
| | 928 |
| Long-end instantaneous change | — | | | +100 | | 3,341 | | | 1,561 | |
The sensitivity analysis in Table 5344 assumes that we take no action in response to these rate shocks and does not assume any change in other macroeconomic variables normally correlated with changes in interest rates. As part of our ALM activities, we use securities, certain residential mortgages, and interest rate and foreign exchange derivatives in managing interest rate sensitivity.
The behavior of our depositdeposits portfolio in the baseline forecast and in alternate interest rate scenarios is a key assumption in our projected estimates of net interest income. The sensitivity analysis in Table 5344 assumes no change in deposit portfolio size or mix from the baseline forecast in alternate rate environments. In higher rate scenarios, any customer activity resulting in the replacement of low-cost or noninterest-bearing deposits with higher-yieldinghigher yielding deposits or market-based funding would reduce our benefit in those scenarios.
Interest Rate and Foreign Exchange Derivative Contracts
Interest rate and foreign exchange derivative contracts are utilized in our ALM activities and serve as an efficient tool to manage our interest rate and foreign exchange risk. We use derivatives to hedge the variability in cash flows or changes in fair value on our balance sheet due to interest rate and foreign exchange components. For more information on our hedging activities, see Note 23 – Derivativesto the Consolidated Financial Statements.
OurStatements. For more information on interest rate contracts are generally non-leveraged generic interest rate and foreign exchange basis swaps, options, futures and forwards. In addition, we use foreign exchange contracts, including cross-currency interest rate swaps, foreign currency futures contracts, foreign currency forward contracts and options to mitigaterisk management, see Interest Rate Risk Management for the foreign exchange risk associated with foreign currency-denominated assets and liabilities.Banking Book in the MD&A of the Corporation’s 2019 Annual Report on Form 10-K.
Changes to the composition of our derivatives portfolio during the nine months ended September 30, 2017 reflect actions taken for interest rate and foreign exchange rate risk management. The decisions to reposition our derivatives portfolio are based on the current assessment of economic and financial conditions including the interest rate and foreign currency environments, balance sheet composition and trends, and the relative mix of our cash and derivative positions.
Table 54 presents derivatives utilized in our ALM activities including those designated as accounting and economic hedging instruments and shows the notional amount, fair value, weighted-average receive-fixed and pay-fixed rates, expected maturity and average estimated durations of our open ALM derivatives at September 30, 2017 and December 31, 2016. These amounts do not include derivative hedges on our MSRs.
|
| | | | | | | | | | | | | | | | | | | | | | | | | | | | | | | | | | | |
| | | | | | | | | | | | | | | | | | | |
| Table 54 | Asset and Liability Management Interest Rate and Foreign Exchange Contracts |
| | | | | | | |
| | | | | September 30, 2017 | | |
| | | | | Expected Maturity | | |
| (Dollars in millions, average estimated duration in years) | Fair Value | | Total | | Remainder of 2017 | | 2018 | | 2019 | | 2020 | | 2021 | | Thereafter | | Average
Estimated Duration |
Receive-fixed interest rate swaps (1) | $ | 3,591 |
| | |
| | |
| | |
| | |
| | |
| | |
| | |
| | 5.31 |
|
| Notional amount | |
| | $ | 151,504 |
| | $ | 5,780 |
| | $ | 21,850 |
| | $ | 21,783 |
| | $ | 15,115 |
| | $ | 5,307 |
| | $ | 81,669 |
| | |
|
| Weighted-average fixed-rate | |
| | 2.50 | % | | 3.60 | % | | 3.20 | % | | 1.87 | % | | 1.87 | % | | 3.18 | % | | 2.48 | % | | |
|
Pay-fixed interest rate swaps (1) | (202 | ) | | |
| | |
| | |
| | |
| | |
| | |
| | |
| | 5.63 |
|
| Notional amount | |
| | $ | 25,330 |
| | $ | — |
| | $ | 6,408 |
| | $ | — |
| | $ | — |
| | $ | — |
| | $ | 18,922 |
| | |
|
| Weighted-average fixed-rate | |
| | 2.09 | % | | — | % | | 1.60 | % | | — | % | | — | % | | — | % | | 2.26 | % | | |
|
Same-currency basis swaps (2) | (29 | ) | | |
| | |
| | |
| | |
| | |
| | |
| | |
| | |
|
| Notional amount | |
| | $ | 43,551 |
| | $ | 4,935 |
| | $ | 11,028 |
| | $ | 6,790 |
| | $ | 1,180 |
| | $ | 2,809 |
| | $ | 16,809 |
| | |
|
Foreign exchange basis swaps (1, 3, 4) | (1,830 | ) | | |
| | |
| | |
| | |
| | |
| | |
| | |
| | |
|
| Notional amount | |
| | 113,011 |
| | 5,294 |
| | 24,124 |
| | 11,947 |
| | 13,325 |
| | 9,393 |
| | 48,928 |
| | |
|
Option products (5) | 6 |
| | |
| | |
| | |
| | |
| | |
| | |
| | |
| | |
|
Notional amount (6) | |
| | 1,869 |
| | 671 |
| | 1,182 |
| | — |
| | — |
| | — |
| | 16 |
| | |
|
Foreign exchange contracts (1, 4, 7) | 1,463 |
| | |
| | |
| | |
| | |
| | |
| | |
| | |
| | |
|
Notional amount (6) | | | 3,623 |
| | (6,908 | ) | | (6,169 | ) | | 2,201 |
| | (20 | ) | | 2,438 |
| | 12,081 |
| | |
|
| Net ALM contracts | $ | 2,999 |
| | |
| | |
| | |
| | |
| | |
| | |
| | |
| | |
|
| | | | | | | | | | | | | | | | | | | |
| | | | | December 31, 2016 | | |
| | | | | Expected Maturity | | |
| (Dollars in millions, average estimated duration in years) | Fair Value | | Total | | 2017 | | 2018 | | 2019 | | 2020 | | 2021 | | Thereafter | | Average Estimated Duration |
Receive-fixed interest rate swaps (1) | $ | 4,055 |
| | |
| | |
| | |
| | |
| | |
| | |
| | |
| | 4.81 |
|
| Notional amount | |
| | $ | 118,603 |
| | $ | 21,453 |
| | $ | 25,788 |
| | $ | 10,283 |
| | $ | 7,515 |
| | $ | 5,307 |
| | $ | 48,257 |
| | |
|
| Weighted-average fixed-rate | |
| | 2.83 | % | | 3.64 | % | | 2.81 | % | | 2.31 | % | | 2.07 | % | | 3.18 | % | | 2.67 | % | | |
|
Pay-fixed interest rate swaps (1) | 159 |
| | |
| | |
| | |
| | |
| | |
| | |
| | |
| | 2.77 |
|
| Notional amount | |
| | $ | 22,400 |
| | $ | 1,527 |
| | $ | 9,168 |
| | $ | 2,072 |
| | $ | 7,975 |
| | $ | 213 |
| | $ | 1,445 |
| | |
|
| Weighted-average fixed-rate | |
| | 1.37 | % | | 1.84 | % | | 1.47 | % | | 0.97 | % | | 1.08 | % | | 1.00 | % | | 2.45 | % | | |
|
Same-currency basis swaps (2) | (26 | ) | | |
| | |
| | |
| | |
| | |
| | |
| | |
| | |
|
| Notional amount | |
| | $ | 59,274 |
| | $ | 20,775 |
| | $ | 11,027 |
| | $ | 6,784 |
| | $ | 1,180 |
| | $ | 2,799 |
| | $ | 16,709 |
| | |
|
Foreign exchange basis swaps (1, 3, 4) | (4,233 | ) | | |
| | |
| | |
| | |
| | |
| | |
| | |
| | |
|
| Notional amount | |
| | 125,522 |
| | 26,509 |
| | 22,724 |
| | 12,178 |
| | 12,150 |
| | 8,365 |
| | 43,596 |
| | |
|
Option products (5) | 5 |
| | |
| | |
| | |
| | |
| | |
| | |
| | |
| | |
|
Notional amount (6) | |
| | 1,687 |
| | 1,673 |
| | — |
| | — |
| | — |
| | — |
| | 14 |
| | |
|
Foreign exchange contracts (1, 4, 7) | 3,180 |
| | |
| | |
| | |
| | |
| | |
| | |
| | |
| | |
|
Notional amount (6) | |
| | (20,285 | ) | | (30,199 | ) | | 197 |
| | 1,961 |
| | (8 | ) | | 881 |
| | 6,883 |
| | |
|
| Futures and forward rate contracts | 19 |
| | |
| | |
| | |
| | |
| | |
| | |
| | |
| | |
|
Notional amount (6) | |
| | 37,896 |
| | 37,896 |
| | — |
| | — |
| | — |
| | — |
| | — |
| | |
|
| Net ALM contracts | $ | 3,159 |
| | |
| | |
| | |
| | |
| | |
| | |
| | |
| | |
|
| |
(1)
| Does not include basis adjustments on either fixed-rate debt issued by the Corporation or AFS debt securities, which are hedged using derivatives designated as fair value hedging instruments, that substantially offset the fair values of these derivatives. |
| |
(2)
| At September 30, 2017 and December 31, 2016, the notional amount of same-currency basis swaps included $43.6 billion and $59.3 billion in both foreign currency and U.S. dollar-denominated basis swaps in which both sides of the swap are in the same currency.
|
| |
(3)
| Foreign exchange basis swaps consisted of cross-currency variable interest rate swaps used separately or in conjunction with receive-fixed interest rate swaps. |
| |
(4)
| Does not include foreign currency translation adjustments on certain non-U.S. debt issued by the Corporation that substantially offset the fair values of these derivatives. |
| |
(5)
| The notional amount of option products of $1.9 billion and $1.7 billion at September 30, 2017 and December 31, 2016 was substantially all in foreign exchange options.
|
| |
(6)
| Reflects the net of long and short positions. Amounts shown as negative reflect a net short position. |
| |
(7)
| The notional amount of foreign exchange contracts of $3.6 billion at September 30, 2017 was comprised of $41.7 billion in foreign currency-denominated and cross-currency receive-fixed swaps, $(32.6) billion in net foreign currency forward rate contracts, $(6.5) billion in foreign currency-denominated pay-fixed swaps and $1.0 billion in net foreign currency futures contracts. Foreign exchange contracts of $(20.3) billion at December 31, 2016 were comprised of $21.5 billion in foreign currency-denominated and cross-currency receive-fixed swaps, $(38.5) billion in net foreign currency forward rate contracts, $(4.6) billion in foreign currency-denominated pay-fixed swaps and $1.3 billion in foreign currency futures contracts.
|
We use interest rate derivative instruments to hedge the variability in the cash flows of our assets and liabilities and other forecasted transactions (collectively referred to as cash flow hedges). The net lossesresults on both open and terminated cash flow hedge derivative instruments recorded in accumulated OCI
were $1.2 billiona gain of $557 million and $1.4 billion,a loss of $496 million, on a pre-taxpretax basis, at September 30, 20172020 and December 31, 2016.2019. These netgains and losses are expected to be reclassified into earnings in the same period as the hedged cash flows affect earnings and will decrease income or increase expense on the respective hedged cash flows. Assuming no change in open cash flow derivative hedge positions and no changes in prices or interest rates beyond what is implied in forward yield curves at September 30, 2017,2020, the pre-taxafter-tax net lossesgains are expected to be reclassified into earnings as follows: $164a gain of $191 million or 14 percent within the next year, 51 percenta gain of $352 million in years two through five, and 23 percenta loss of $79 million in years six through 10,ten, with the remaining 12 percentloss of $56 million thereafter. For more information on derivatives designated as cash flow hedges, see Note 23 – Derivativesto the Consolidated Financial Statements.Statements.
We hedge our net investment in non-U.S. operations determined to have functional currencies other than the U.S.
dollar using forward foreign exchange contracts that typically settle in less than 180 days, cross-currency basis swaps and foreign exchange options. We recorded net after-tax losses on derivatives in accumulated OCI associated with net investment hedges which were offset by gains on our net investments in consolidated non-U.S. entities at September 30, 2017.2020.
Table 45 presents derivatives utilized in our ALM activities and shows the notional amount, fair value, weighted-average receive-fixed and pay-fixed rates, expected maturity and average estimated durations of our open ALM derivatives at September 30, 2020 and December 31, 2019. These amounts do not include derivative hedges on our MSRs. During the nine months ended September 30, 2020, the fair value of receive-fixed interest rate swaps increased while pay-fixed interest swaps decreased, primarily driven by lower swap rates on hedges of U.S. dollar long-term debt. | | | | | | | | | | | | | | | | | | | | | | | | | | | | | | | | | | | | | | | | | | | | | | | | | | | | | | | | |
| | | | | | | | | | | | | | | | | | |
| Table 45 | Asset and Liability Management Interest Rate and Foreign Exchange Contracts |
| | | | | | |
| | | | September 30, 2020 | | |
| | | | Expected Maturity | | |
| (Dollars in millions, average estimated duration in years) | Fair
Value | | Total | | Remainder of 2020 | | 2021 | | 2022 | | 2023 | | 2024 | | Thereafter | | Average
Estimated
Duration |
Receive-fixed interest rate swaps (1) | $ | 24,685 | | | | | | | | | | | | | | | | | 7.78 | |
| Notional amount | | | $ | 282,994 | | | $ | 4,650 | | | $ | 14,644 | | | $ | 27,058 | | | $ | 46,960 | | | $ | 31,747 | | | $ | 157,935 | | | |
| Weighted-average fixed-rate | | | 1.90 | % | | 2.79 | % | | 3.17 | % | | 2.01 | % | | 1.82 | % | | 1.42 | % | | 1.85 | % | | |
Pay-fixed interest rate swaps (1) | (11,446) | | | | | | | | | | | | | | | | | 6.66 | |
| Notional amount | | | $ | 271,616 | | | $ | 4,344 | | | $ | 12,269 | | | $ | 15,258 | | | $ | 36,919 | | | $ | 30,411 | | | $ | 172,415 | | | |
| Weighted-average fixed-rate | | | 1.05 | % | | 2.16 | % | | 0.62 | % | | 0.34 | % | | 1.21 | % | | 1.04 | % | | 1.09 | % | | |
Same-currency basis swaps (2) | (199) | | | | | | | | | | | | | | | | | |
| Notional amount | | | $ | 209,569 | | | $ | 3,381 | | | $ | 18,537 | | | $ | 6,796 | | | $ | 3,518 | | | $ | 22,737 | | | $ | 154,600 | | | |
Foreign exchange basis swaps (1, 3, 4) | (1,251) | | | | | | | | | | | | | | | | | |
| Notional amount | | | 108,512 | | | 1,485 | | | 26,538 | | | 15,637 | | | 7,890 | | | 3,555 | | | 53,407 | | | |
Foreign exchange contracts (1, 4, 5) | 1,841 | | | | | | | | | | | | | | | | | |
Notional amount (6) | | | (102,072) | | | (128,059) | | | 1,989 | | | 2,721 | | | 2,402 | | | 4,546 | | | 14,329 | | | |
| Futures and forward rate contracts | 115 | | | | | | | | | | | | | | | | | |
| Notional amount | | | 48,375 | | | 48,375 | | | | | | | | | | | | | |
| Option products | — | | | | | | | | | | | | | | | | | |
| Notional amount | | | 16 | | | — | | | — | | | — | | | 16 | | | — | | | — | | | |
| | | | | | | | | | | | | | | | | |
| | | | | | | | | | | | | | | | | |
| | | | | | | | | | | | | | | | | |
| | | | | | | | | | | | | | | | | |
| Net ALM contracts | $ | 13,745 | | | | | | | | | | | | | | | | | |
| | | | | | | | | | | | | | | | | | | | | | | | | | | | | | | | | | | | | | | | | | | | | | | | | | | | | | | | |
| | | | | | | | | | | | | | | | | | |
| |
| | | | | | |
| | | | | | |
| | | | | | |
| | | | | | | | | | | | | | | | | |
| | | | | | | | | | | | | | | | | |
| | | | | | | | | | | | | | | | | |
| | | | | | | | | | | | | | | | | |
| | | | | | | | | | | | | | | | | |
| | | | | | | | | | | | | | | | | |
| | | | | | | | | | | | | | | | | |
| | | | | | | | | | | | | | | | | |
| | | | | | | | | | | | | | | | | |
| | | | | | | | | | | | | | | | | |
| | | | | | | | | | | | | | | | | |
| | | | | | | | | | | | | | | | | |
| | | | | | | | | | | | | | | | | |
| | | | | | | | | | | | | | | | | |
| | | | | | | | | | | | | | | | | |
| | | | | | | | | | | | | | | | | |
| | | | | | | | | | | | | | | | | |
| | | | | | | | | | | | | | | | | |
| | | | | | |
| | | | | | |
| |
| | | | | | |
| | | | | December 31, 2019 | | |
| | | | | Expected Maturity | | |
| (Dollars in millions, average estimated duration in years) | Fair
Value | | Total | | 2020 | | 2021 | | 2022 | | 2023 | | 2024 | | Thereafter | | Average
Estimated
Duration |
Receive-fixed interest rate swaps (1) | $ | 12,370 | | | | | | | | | | | | | | | | | 6.47 | |
| Notional amount | | | $ | 215,123 | | | $ | 16,347 | | | $ | 14,642 | | | $ | 21,616 | | | $ | 36,356 | | | $ | 21,257 | | | $ | 104,905 | | | |
| Weighted-average fixed-rate | | | 2.68 | % | | 2.68 | % | | 3.17 | % | | 2.48 | % | | 2.36 | % | | 2.55 | % | | 2.79 | % | | |
Pay-fixed interest rate swaps (1) | (2,669) | | | | | | | | | | | | | | | | | 6.99 | |
| Notional amount | | | $ | 69,586 | | | $ | 4,344 | | | $ | 2,117 | | | $ | — | | | $ | 13,993 | | | $ | 8,194 | | | $ | 40,938 | | | |
| Weighted-average fixed-rate | | | 2.36 | % | | 2.16 | % | | 2.15 | % | | — | % | | 2.52 | % | | 2.26 | % | | 2.35 | % | | |
Same-currency basis swaps (2) | (290) | | | | | | | | | | | | | | | | | |
| Notional amount | | | $ | 152,160 | | | $ | 18,857 | | | $ | 18,590 | | | $ | 4,306 | | | $ | 2,017 | | | $ | 14,567 | | | $ | 93,823 | | | |
Foreign exchange basis swaps (1, 3, 4) | (1,258) | | | | | | | | | | | | | | | | | |
| Notional amount | | | 113,529 | | | 23,639 | | | 24,215 | | | 14,611 | | | 7,111 | | | 3,521 | | | 40,432 | | | |
Foreign exchange contracts (1, 4, 5) | 414 | | | | | | | | | | | | | | | | | |
Notional amount (6) | | | (53,106) | | | (79,315) | | | 4,539 | | | 2,674 | | | 2,340 | | | 4,432 | | | 12,224 | | | |
| Option products | — | | | | | | | | | | | | | | | | | |
| Notional amount | | | 15 | | | — | | | — | | | — | | | 15 | | | — | | | — | | | |
| | | | | | | | | | | | | | | | | |
| | | | | | | | | | | | | | | | | |
| | | | | | | | | | | | | | | | | |
| | | | | | | | | | | | | | | | | |
| Net ALM contracts | $ | 8,567 | | | | | | | | | | | | | | | | | |
(1)Does not include basis adjustments on either fixed-rate debt issued by the Corporation or AFS debt securities, which are hedged using derivatives designated as fair value hedging instruments, that substantially offset the fair values of these derivatives.
(2)At September 30, 2020 and December 31, 2019, the notional amount of same-currency basis swaps included $209.6 billion and $152.2 billion in both foreign currency and U.S. dollar-denominated basis swaps in which both sides of the swap are in the same currency.
(3)Foreign exchange basis swaps consisted of cross-currency variable interest rate swaps used separately or in conjunction with receive-fixed interest rate swaps.
(4)Does not include foreign currency translation adjustments on certain non-U.S. debt issued by the Corporation that substantially offset the fair values of these derivatives.
(5)The notional amount of foreign exchange contracts of $(102.1) billion at September 30, 2020 was comprised of $33.7 billion in foreign currency-denominated and cross-currency receive-fixed swaps, $(131.9) billion in net foreign currency forward rate contracts, $(4.3) billion in foreign currency-denominated interest rate swaps and $462 million in net foreign currency futures contracts. Foreign exchange contracts of $(53.1) billion at December 31, 2019 were comprised of $29.0 billion in foreign currency-denominated and cross-currency receive-fixed swaps, $(82.4) billion in net foreign currency forward rate contracts, $(313) million in foreign currency-denominated interest rate swaps and $644 million in foreign currency futures contracts.
(6)Reflects the net of long and short positions. Amounts shown as negative reflect a net short position.
Mortgage Banking Risk Management
We originate, fund and service mortgage loans, which subject us to credit, liquidity and interest rate risks, among others. We determine whether loans will be held-for-investmentheld for investment or held-for-saleheld for sale at the time of commitment and manage credit and liquidity risks by selling or securitizing a portion of the loans we originate.
Interest rate risk and market risk can be substantial in the mortgage business. Changes in interest rates and other market factors impact the volume of mortgage originations. Changes in interest rates also impact the value of IRLCsinterest rate lock commitments (IRLCs) and the related residential first mortgage LHFS, between the date of the IRLC and the date the loans are sold to the secondary market. An increase in mortgage interest rates typically leads to a decrease in the value of these instruments. Conversely,as well as the value of the MSRs will increase driven by lower prepayment expectations when there is an increase in interest rates.MSRs. Because the interest rate risks of these two hedged items offset, we combine them into one overall hedged item with one combined economic hedge portfolio consisting of derivative contracts and securities. For more information on IRLCs and the related residential mortgage LHFS, see Mortgage Banking Risk Management in the MD&A of the Corporation’s 2019 Annual Report on Form 10-K.
ForDuring the three and nine months ended September 30, 2017,2020 and 2019, we recorded gains in mortgage banking income of $34$85 million and $100$313 million related to the change in fair value of the MSRs, IRLCs and LHFS, net of gains and losses on the hedge portfolio, compared to gains of $136$78 million and $318$217 million for the same periods in 2016. For more information on MSRs, see Note 14 – Fair Value Measurements to the Consolidated Financial Statements and for more information on mortgage banking income, see Consumer Banking on page 14.2019.
Complex Accounting Estimates
Our significant accounting principles are essential in understanding the MD&A. Many of our significant accounting principles require complex judgments to estimate the values of assets and liabilities. We have procedures and processes in place to facilitate making these judgments. For additionalmore information, see Complex Accounting Estimates ofin the MD&A of the Corporation's 2016Corporation’s 2019 Annual Report on Form 10-K and Note 1 – Summary of Significant Accounting Principles to the Consolidated Financial Statements of the Corporation's 2016Corporation’s 2019 Annual Report on Form 10-K. Except as noted below under Allowance for Credit Losses, there have not been any material updates to our complex accounting estimates as disclosed in the MD&A of the Corporation's Annual Report on Form 10-K.
Allowance for Credit Losses
On January 1, 2020, the Corporation adopted the new accounting standard that requires the measurement of the allowance for credit losses, which includes the allowance for loan and lease losses and the reserve for unfunded lending commitments, to be based on management’s best estimate of lifetime ECL inherent in the Corporation's relevant financial assets.
The Corporation's estimate of lifetime ECL includes the use of quantitative models that incorporate forward-looking
macroeconomic scenarios that are applied over the contractual life of the loan portfolios, adjusted for expected prepayments and borrower-controlled extension options. These macroeconomic scenarios include variables that have historically been key drivers of increases and decreases in credit losses. These variables include, but are not limited to, unemployment rates, real estate prices, gross domestic product levels, corporate bond spreads and long-term interest rate forecasts. As any one economic outlook is inherently uncertain, the Corporation leverages multiple scenarios. The scenarios that are chosen each quarter and the amount of weighting given to each scenario depend on a variety of factors including recent economic events, leading economic indicators, views of internal and third-party economists and industry trends.
The Corporation also includes qualitative reserves to cover losses that are expected but, in the Corporation's assessment, may not be adequately represented in the economic assumptions described above. For example, factors that the Corporation considers include changes in lending policies and procedures, business conditions, the nature and size of the portfolio, portfolio concentrations, the volume and severity of past due loans and nonaccrual loans, the effect of external factors such as competition and legal and regulatory requirements, among others. Further, the Corporation considers the inherent uncertainty in quantitative models that are built on historical data.
The allowance for credit losses can also be impacted by unanticipated changes in asset quality of the portfolio, such as increases in risk rating downgrades in our commercial portfolio, deterioration in borrower delinquencies or credit scores in our credit card portfolio or increases in LTVs in our consumer real estate portfolio. In addition, while we have incorporated our estimated impact of COVID-19 into our allowance for credit losses, the ultimate impact of the pandemic is still unknown, including how long economic activities will be impacted and what effect the unprecedented levels of government fiscal and monetary actions will have on the economy and our credit losses.
As described above, the process to determine the allowance for credit losses requires numerous estimates and assumptions, some of which require a high degree of judgment and are often interrelated. Changes in the estimates and assumptions can result in significant changes in the allowance for credit losses. Our process for determining the allowance for credit losses is further discussed in Note 1 – Summary of Significant Accounting Principles and Note 5 – Outstanding Loans and Leases and Allowance for Credit Losses to the Consolidated Financial Statements.
Tables 55 and 56 provideTable 46 provides reconciliations of certain non-GAAP financial measures to the most closely related GAAP financial measures.
| | | | | | | | | | | | | | | | | | | | | | | | | | | | | | | | | | | | | | | | | | |
| | | | | | | | | | | | | | | | |
| Table 46 | Period-end and Average Supplemental Financial Data and Reconciliations to GAAP Financial Measures (1) |
| | | | | | | | | | | | | | | | |
| | Period-end | | Average | | | | |
| | | | | | | | | | |
| September 30
2020 | | December 31
2019 | | Three Months Ended September 30 | | Nine Months Ended September 30 | | | | |
| (Dollars in millions) | | | 2020 | | 2019 | | 2020 | | 2019 | | | | |
| | | | | | | | | | | | | | | |
| | | | | | | | | | | | | | | |
| | | | | | | | | | | | | | | |
| | | | | | | | | | | | | | | |
| | | | | | | | | | | | | | | |
| | | | | | | | | | | | | | | |
| | | | | | | | | | | | | | | |
| | | | | | | | | | | | | | | |
| | | | | | | | | | | | | | | | |
| | | | | | | | | | | | | | | | |
| | | | | | | | | | | | | | | | |
| | | | | | | | | | | | | | | | |
| | | | | | | | | | | | | | | |
| | | | | | | | | | | | | | | |
| | | | | | | | | | | | | | | |
| | | | | | | | | | | | | | | |
| | | | | | | | | | | | | | | | |
| | | | | | | | | | | | | | | | |
| | | | | | | | | | | | | | | | |
| | | | | | | | | | | | | | | | |
| | | | | | | | | | | | | | | | |
| | | | | | | | | | | | | | | | |
| | | | | | | | | | | | | | | | |
| | | | | | | | | | | | | | | | |
| | | | | | | | | | | | | | | |
| | | | | | | | | | | | | | | |
| | | | | | | | | | | | | | | |
| | | | | | | | | | | | | | | |
| | | | | | | | | | | | | | | |
| | | | | | | | | | | | | | | |
| | | | | | | | | | | | | | | |
| | | | | | | | | | | | | | | |
| | | | | | | | | | | | | | | |
| | | | | | | | | | | | | | | |
| | | | | | | | | | | | | | | |
| | | | | | | | | | | | | | | |
| | | | | | | | | | | | | | | |
| | | | | | | | | | | | | | | |
| | | | | | | | | | | | | | | |
| | | | | | | | | | | | | | | |
| | | | | | | | | | | | | | | |
| | | | | | | | | | | | | | | |
| | | | | | | | | | | | | | | |
| | | | | | | | | | | | | | | |
| | | | | | | | | | | | | | | |
| Shareholders’ equity | $ | 268,850 | | | $ | 264,810 | | | $ | 267,323 | | | $ | 270,430 | | | $ | 266,062 | | | $ | 268,223 | | | | | |
| Goodwill | (68,951) | | | (68,951) | | | (68,951) | | | (68,951) | | | (68,951) | | | (68,951) | | | | | |
| Intangible assets (excluding MSRs) | (2,185) | | | (1,661) | | | (1,976) | | | (1,707) | | | (1,758) | | | (1,735) | | | | | |
| Related deferred tax liabilities | 910 | | | 713 | | | 855 | | | 752 | | | 791 | | | 787 | | | | | |
| Tangible shareholders’ equity | $ | 198,624 | | | $ | 194,911 | | | $ | 197,251 | | | $ | 200,524 | | | $ | 196,144 | | | $ | 198,324 | | | | | |
| Preferred stock | (23,427) | | | (23,401) | | | (23,427) | | | (23,800) | | | (23,437) | | | (22,894) | | | | | |
| Tangible common shareholders’ equity | $ | 175,197 | | | $ | 171,510 | | | $ | 173,824 | | | $ | 176,724 | | | $ | 172,707 | | | $ | 175,430 | | | | | |
| | | | | | | | | | | | | | | |
| Total assets | $ | 2,738,452 | | | $ | 2,434,079 | | | | | | | | | | | | | |
| Goodwill | (68,951) | | | (68,951) | | | | | | | | | | | | | |
| Intangible assets (excluding MSRs) | (2,185) | | | (1,661) | | | | | | | | | | | | | |
| Related deferred tax liabilities | 910 | | | 713 | | | | | | | | | | | | | |
| Tangible assets | $ | 2,668,226 | | | $ | 2,364,180 | | | | | | | | | | | | | |
|
| | | | | | | | | | | | | | | | | | | | | | | | |
| | | | | | | | | | | | | |
| Table 55 | Quarterly and Year-to-Date Supplemental Financial Data and Reconciliations to GAAP Financial Measures |
| | | | | | | | | | | | | |
| | | Three Months Ended September 30 |
| | 2017 | | 2016 |
| (Dollars in millions) | As Reported | | Fully taxable-equivalent adjustment | | Fully taxable-equivalent basis | | As Reported | | Fully taxable-equivalent adjustment | | Fully taxable-equivalent basis |
| Net interest income | $ | 11,161 |
| | $ | 240 |
| | $ | 11,401 |
| | $ | 10,201 |
| | $ | 228 |
| | $ | 10,429 |
|
| Total revenue, net of interest expense | 21,839 |
| | 240 |
| | 22,079 |
| | 21,635 |
| | 228 |
| | 21,863 |
|
| Income tax expense | 2,279 |
| | 240 |
| | 2,519 |
| | 2,349 |
| | 228 |
| | 2,577 |
|
| | | | | | | | | | | | |
| | Nine Months Ended September 30 |
| | 2017 | | 2016 |
| Net interest income | $ | 33,205 |
| | $ | 674 |
| | $ | 33,879 |
| | $ | 30,804 |
| | $ | 666 |
| | $ | 31,470 |
|
| Total revenue, net of interest expense | 66,916 |
| | 674 |
| | 67,590 |
| | 63,711 |
| | 666 |
| | 64,377 |
|
| Income tax expense | 7,096 |
| | 674 |
| | 7,770 |
| | 5,888 |
| | 666 |
| | 6,554 |
|
|
| | | | | | | | | | | | | | | | | | | | | | | | |
| | | | | | | | | | | | | |
| Table 56 | Period-end and Average Supplemental Financial Data and Reconciliations to GAAP Financial Measures |
| | | | | | | | | | | |
| | | | | | | Average |
| | Period-end | | Three Months Ended September 30 | | Nine Months Ended September 30 |
| (Dollars in millions) | September 30
2017 | | December 31
2016 | | 2017 | | 2016 | | 2017 | | 2016 |
| Common shareholders' equity | $ | 250,136 |
| | $ | 241,620 |
| | $ | 249,624 |
| | $ | 243,679 |
| | $ | 246,195 |
| | $ | 240,440 |
|
| Goodwill | (68,968 | ) | | (69,744 | ) | | (68,969 | ) | | (69,744 | ) | | (69,398 | ) | | (69,752 | ) |
| Intangible assets (excluding MSRs) | (2,459 | ) | | (2,989 | ) | | (2,549 | ) | | (3,276 | ) | | (2,737 | ) | | (3,480 | ) |
| Related deferred tax liabilities | 1,435 |
| | 1,545 |
| | 1,465 |
| | 1,628 |
| | 1,503 |
| | 1,666 |
|
| Tangible common shareholders' equity | $ | 180,144 |
| | $ | 170,432 |
| | $ | 179,571 |
| | $ | 172,287 |
| | $ | 175,563 |
| | $ | 168,874 |
|
| | | | | | | | | | | | |
| Shareholders' equity | $ | 272,459 |
| | $ | 266,840 |
| | $ | 273,648 |
| | $ | 268,899 |
| | $ | 271,012 |
| | $ | 264,907 |
|
| Goodwill | (68,968 | ) | | (69,744 | ) | | (68,969 | ) | | (69,744 | ) | | (69,398 | ) | | (69,752 | ) |
| Intangible assets (excluding MSRs) | (2,459 | ) | | (2,989 | ) | | (2,549 | ) | | (3,276 | ) | | (2,737 | ) | | (3,480 | ) |
| Related deferred tax liabilities | 1,435 |
| | 1,545 |
| | 1,465 |
| | 1,628 |
| | 1,503 |
| | 1,666 |
|
| Tangible shareholders' equity | $ | 202,467 |
| | $ | 195,652 |
| | $ | 203,595 |
| | $ | 197,507 |
| | $ | 200,380 |
| | $ | 193,341 |
|
| | | | | | | | | | | | |
| Total assets | $ | 2,283,896 |
| | $ | 2,187,702 |
| | | | | | | | |
| Goodwill | (68,968 | ) | | (69,744 | ) | | | | | | | | |
| Intangible assets (excluding MSRs) | (2,459 | ) | | (2,989 | ) | | | | | | | | |
| Related deferred tax liabilities | 1,435 |
| | 1,545 |
| | | | | | | | |
| Tangible assets | $ | 2,213,904 |
| | $ | 2,116,514 |
| | | | | | | | |
Item 3. Quantitative and Qualitative Disclosures about Market Risk
See Market Risk Management on page 6046 in the MD&A and the sections referenced therein for Quantitative and Qualitative Disclosures about Market Risk.
Item 4. Controls and Procedures
Disclosure Controls and Procedures
As of the end of the period covered by this report, the Corporation'sCorporation’s management, including the Chief Executive Officer and Chief Financial Officer, conducted an evaluation of the effectiveness and design of the Corporation'sCorporation’s disclosure controls and procedures (as that term is defined in Rule 13a-15(e) of the Exchange Act). Based upon that evaluation, the Corporation'sCorporation’s Chief Executive Officer and Chief Financial Officer concluded that the Corporation'sCorporation’s disclosure controls and procedures were effective, as of the end of the period covered by this report, in recording, processing, summarizing and reporting information required to be disclosed by the Corporation in reports that it files or submits under the Exchange Act, within the time periods specified in the Securities and Exchange Commission’s rules and forms.report.
Changes in Internal Control Over Financial Reporting
There have been no changes in the Corporation'sCorporation’s internal control over financial reporting (as defined in Rule 13a-15(f) of the Exchange Act) during the three months ended September 30, 2017,2020, that have materially affected, or are reasonably likely to materially affect, the Corporation'sCorporation’s internal control over financial reporting.
Bank of America67
Part I. Financial Information
Item 1. Financial Statements
Bank of America Corporation and Subsidiaries
| | | | | | | | | | | | | | | | | | | | | | | | | |
| | | | | | | | | |
| Consolidated Statement of Income |
| | | | | |
| Three Months Ended September 30 | | Nine Months Ended September 30 | | |
| (In millions, except per share information) | 2020 | | 2019 | | 2020 | | 2019 | | |
| Net interest income | | | | | | | | | |
| Interest income | $ | 11,486 | | | $ | 17,916 | | | $ | 40,124 | | | $ | 54,310 | | | |
| Interest expense | 1,357 | | | 5,729 | | | 7,017 | | | 17,559 | | | |
| Net interest income | 10,129 | | | 12,187 | | | 33,107 | | | 36,751 | | | |
| | | | | | | | | |
| Noninterest income | | | | | | | | | |
| Fees and commissions | 8,777 | | | 8,467 | | | 25,490 | | | 24,495 | | | |
| Market making and similar activities | 1,689 | | | 2,118 | | | 6,983 | | | 7,267 | | | |
| Other income | (259) | | | 35 | | | (151) | | | 382 | | | |
| Total noninterest income | 10,207 | | | 10,620 | | | 32,322 | | | 32,144 | | | |
| Total revenue, net of interest expense | 20,336 | | | 22,807 | | | 65,429 | | | 68,895 | | | |
| | | | | | | | | |
| Provision for credit losses | 1,389 | | | 779 | | | 11,267 | | | 2,649 | | | |
| | | | | | | | | |
| Noninterest expense | | | | | | | | | |
| Compensation and benefits | 8,200 | | | 7,779 | | | 24,535 | | | 24,000 | | | |
| Occupancy and equipment | 1,798 | | | 1,663 | | | 5,302 | | | 4,908 | | | |
| Information processing and communications | 1,333 | | | 1,163 | | | 3,807 | | | 3,484 | | | |
| Product delivery and transaction related | 930 | | | 696 | | | 2,518 | | | 2,067 | | | |
| Marketing | 308 | | | 440 | | | 1,238 | | | 1,410 | | | |
| Professional fees | 450 | | | 386 | | | 1,206 | | | 1,155 | | | |
| Other general operating | 1,382 | | | 3,042 | | | 2,680 | | | 4,637 | | | |
| | | | | | | | | |
| | | | | | | | | |
| Total noninterest expense | 14,401 | | | 15,169 | | | 41,286 | | | 41,661 | | | |
| Income before income taxes | 4,546 | | | 6,859 | | | 12,876 | | | 24,585 | | | |
| Income tax expense | (335) | | | 1,082 | | | 452 | | | 4,149 | | | |
| Net income | $ | 4,881 | | | $ | 5,777 | | | $ | 12,424 | | | $ | 20,436 | | | |
| Preferred stock dividends | 441 | | | 505 | | | 1,159 | | | 1,186 | | | |
| Net income applicable to common shareholders | $ | 4,440 | | | $ | 5,272 | | | $ | 11,265 | | | $ | 19,250 | | | |
| | | | | | | | | |
| Per common share information | | | | | | | | | |
| Earnings | $ | 0.51 | | | $ | 0.57 | | | $ | 1.29 | | | $ | 2.02 | | | |
| Diluted earnings | 0.51 | | | 0.56 | | | 1.28 | | | 2.01 | | | |
| | | | | | | | | |
| Average common shares issued and outstanding | 8,732.9 | | | 9,303.6 | | | 8,762.6 | | | 9,516.2 | | | |
| Average diluted common shares issued and outstanding | 8,777.5 | | | 9,353.0 | | | 8,800.5 | | | 9,565.7 | | | |
|
| | | | | | | | | | | | | | | |
| | | | | | | | |
| Consolidated Statement of Income |
| | Three Months Ended September 30 | | Nine Months Ended September 30 |
| (Dollars in millions, except per share information) | 2017 | | 2016 | | 2017 | | 2016 |
| Interest income | |
| | |
| | | | |
| Loans and leases | $ | 9,203 |
| | $ | 8,358 |
| | $ | 26,877 |
| | $ | 24,837 |
|
| Debt securities | 2,629 |
| | 2,144 |
| | 7,764 |
| | 6,922 |
|
| Federal funds sold and securities borrowed or purchased under agreements to resell | 659 |
| | 267 |
| | 1,658 |
| | 803 |
|
| Trading account assets | 1,091 |
| | 1,076 |
| | 3,330 |
| | 3,330 |
|
| Other interest income | 1,075 |
| | 765 |
| | 2,884 |
| | 2,300 |
|
| Total interest income | 14,657 |
| | 12,610 |
| | 42,513 |
| | 38,192 |
|
| | | | | | | | |
| Interest expense | |
| | |
| | | | |
| Deposits | 624 |
| | 266 |
| | 1,252 |
| | 736 |
|
| Short-term borrowings | 944 |
| | 569 |
| | 2,508 |
| | 1,808 |
|
| Trading account liabilities | 319 |
| | 244 |
| | 890 |
| | 778 |
|
| Long-term debt | 1,609 |
| | 1,330 |
| | 4,658 |
| | 4,066 |
|
| Total interest expense | 3,496 |
| | 2,409 |
| | 9,308 |
| | 7,388 |
|
| Net interest income | 11,161 |
| | 10,201 |
| | 33,205 |
| | 30,804 |
|
| | | | | | | | |
| Noninterest income | |
| | |
| | | | |
| Card income | 1,429 |
| | 1,455 |
| | 4,347 |
| | 4,349 |
|
| Service charges | 1,968 |
| | 1,952 |
| | 5,863 |
| | 5,660 |
|
| Investment and brokerage services | 3,303 |
| | 3,160 |
| | 9,882 |
| | 9,543 |
|
| Investment banking income | 1,477 |
| | 1,458 |
| | 4,593 |
| | 4,019 |
|
| Trading account profits | 1,837 |
| | 2,141 |
| | 6,124 |
| | 5,821 |
|
| Mortgage banking income (loss) | (20 | ) | | 589 |
| | 332 |
| | 1,334 |
|
| Gains on sales of debt securities | 125 |
| | 51 |
| | 278 |
| | 490 |
|
| Other income | 559 |
| | 628 |
| | 2,292 |
| | 1,691 |
|
| Total noninterest income | 10,678 |
| | 11,434 |
| | 33,711 |
| | 32,907 |
|
| Total revenue, net of interest expense | 21,839 |
| | 21,635 |
| | 66,916 |
| | 63,711 |
|
| | | | | | | | |
| Provision for credit losses | 834 |
| | 850 |
| | 2,395 |
| | 2,823 |
|
| | | | | | | | |
| Noninterest expense | |
| | |
| | | | |
| Personnel | 7,483 |
| | 7,704 |
| | 24,353 |
| | 24,278 |
|
| Occupancy | 999 |
| | 1,005 |
| | 3,000 |
| | 3,069 |
|
| Equipment | 416 |
| | 443 |
| | 1,281 |
| | 1,357 |
|
| Marketing | 461 |
| | 410 |
| | 1,235 |
| | 1,243 |
|
| Professional fees | 476 |
| | 536 |
| | 1,417 |
| | 1,433 |
|
| Amortization of intangibles | 151 |
| | 181 |
| | 473 |
| | 554 |
|
| Data processing | 777 |
| | 685 |
| | 2,344 |
| | 2,240 |
|
| Telecommunications | 170 |
| | 189 |
| | 538 |
| | 551 |
|
| Other general operating | 2,206 |
| | 2,328 |
| | 7,072 |
| | 7,065 |
|
| Total noninterest expense | 13,139 |
| | 13,481 |
| | 41,713 |
| | 41,790 |
|
| Income before income taxes | 7,866 |
| | 7,304 |
| | 22,808 |
| | 19,098 |
|
| Income tax expense | 2,279 |
| | 2,349 |
| | 7,096 |
| | 5,888 |
|
| Net income | $ | 5,587 |
| | $ | 4,955 |
| | $ | 15,712 |
| | $ | 13,210 |
|
| Preferred stock dividends | 465 |
| | 503 |
| | 1,328 |
| | 1,321 |
|
| Net income applicable to common shareholders | $ | 5,122 |
| | $ | 4,452 |
| | $ | 14,384 |
| | $ | 11,889 |
|
| | | | | | | | |
| Per common share information | |
| | |
| | | | |
| Earnings | $ | 0.50 |
| | $ | 0.43 |
| | $ | 1.42 |
| | $ | 1.15 |
|
| Diluted earnings | 0.48 |
| | 0.41 |
| | 1.35 |
| | 1.10 |
|
| Dividends paid | 0.12 |
| | 0.075 |
| | 0.27 |
| | 0.175 |
|
| Average common shares issued and outstanding (in thousands) | 10,197,891 |
| | 10,250,124 |
| | 10,103,386 |
| | 10,312,878 |
|
| Average diluted common shares issued and outstanding (in thousands) | 10,725,482 |
| | 11,000,473 |
| | 10,820,425 |
| | 11,046,807 |
|
| | | | | | | | | | | | | | | | | | | | | | | | | |
| | | | | | | | | |
| Consolidated Statement of Comprehensive Income | | |
| | | | | | | | | |
| Three Months Ended September 30 | | Nine Months Ended September 30 | | |
| (Dollars in millions) | 2020 | | 2019 | | 2020 | | 2019 | | |
| Net income | $ | 4,881 | | | $ | 5,777 | | | $ | 12,424 | | | $ | 20,436 | | | |
| Other comprehensive income (loss), net-of-tax: | | | | | | | | | |
| Net change in debt securities | 101 | | | 1,538 | | | 4,794 | | | 6,231 | | | |
| Net change in debit valuation adjustments | (58) | | | 229 | | | (5) | | | (272) | | | |
| Net change in derivatives | 76 | | | 118 | | | 808 | | | 651 | | | |
| Employee benefit plan adjustments | 44 | | | 26 | | | 144 | | | 83 | | | |
| Net change in foreign currency translation adjustments | 21 | | | (51) | | | (86) | | | (99) | | | |
| Other comprehensive income (loss) | 184 | | | 1,860 | | | 5,655 | | | 6,594 | | | |
| Comprehensive income | $ | 5,065 | | | $ | 7,637 | | | $ | 18,079 | | | $ | 27,030 | | | |
See accompanying Notes to Consolidated Financial Statements.
Bank of America Corporation and Subsidiaries
|
| | | | | | | | | | | | | | | |
| | | | | | | | |
| Consolidated Statement of Comprehensive Income |
| | | | | | | | |
| | Three Months Ended September 30 | | Nine Months Ended September 30 |
| (Dollars in millions) | 2017 | | 2016 | | 2017 | | 2016 |
| Net income | $ | 5,587 |
| | $ | 4,955 |
| | $ | 15,712 |
| | $ | 13,210 |
|
| Other comprehensive income (loss), net-of-tax: | | | | | | | |
| Net change in debt and marketable equity securities | 462 |
| | 208 |
| | 931 |
| | 3,319 |
|
| Net change in debit valuation adjustments | (80 | ) | | (65 | ) | | (149 | ) | | 49 |
|
| Net change in derivatives | 24 |
| | 127 |
| | 156 |
| | 277 |
|
| Employee benefit plan adjustments | 26 |
| | 6 |
| | 80 |
| | 29 |
|
| Net change in foreign currency translation adjustments | 5 |
| | (8 | ) | | 102 |
| | (17 | ) |
| Other comprehensive income | 437 |
| | 268 |
| | 1,120 |
| | 3,657 |
|
| Comprehensive income | $ | 6,024 |
| | $ | 5,223 |
| | $ | 16,832 |
| | $ | 16,867 |
|
| | | | | | | | | | | | | | |
| | | | |
| Consolidated Balance Sheet |
| | |
| | |
| | September 30 | | December 31 |
| (Dollars in millions) | 2020 | | 2019 |
| Assets | | | |
| Cash and due from banks | $ | 32,922 | | | $ | 30,152 | |
| Interest-bearing deposits with the Federal Reserve, non-U.S. central banks and other banks | 268,084 | | | 131,408 | |
| Cash and cash equivalents | 301,006 | | | 161,560 | |
| Time deposits placed and other short-term investments | 5,088 | | | 7,107 | |
Federal funds sold and securities borrowed or purchased under agreements to resell (includes $103,101 and $50,364 measured at fair value) | 326,745 | | | 274,597 | |
Trading account assets (includes $110,698 and $90,946 pledged as collateral) | 255,500 | | | 229,826 | |
| Derivative assets | 44,297 | | | 40,485 | |
| Debt securities: | | | |
| Carried at fair value | 245,997 | | | 256,467 | |
Held-to-maturity, at cost (fair value – $347,917 and $219,821) | 338,400 | | | 215,730 | |
| Total debt securities | 584,397 | | | 472,197 | |
Loans and leases (includes $7,234 and $8,335 measured at fair value) | 955,172 | | | 983,426 | |
| Allowance for loan and lease losses | (19,596) | | | (9,416) | |
| Loans and leases, net of allowance | 935,576 | | | 974,010 | |
| Premises and equipment, net | 10,902 | | | 10,561 | |
| Goodwill | 68,951 | | | 68,951 | |
Loans held-for-sale (includes $1,905 and $3,709 measured at fair value) | 4,434 | | | 9,158 | |
| Customer and other receivables | 61,684 | | | 55,937 | |
Other assets (includes $12,725 and $15,518 measured at fair value) | 139,872 | | | 129,690 | |
| Total assets | $ | 2,738,452 | | | $ | 2,434,079 | |
| | | | |
| Liabilities | | | |
| Deposits in U.S. offices: | | | |
| Noninterest-bearing | $ | 616,925 | | | $ | 403,305 | |
Interest-bearing (includes $626 and $508 measured at fair value) | 996,804 | | | 940,731 | |
| Deposits in non-U.S. offices: | | | |
| Noninterest-bearing | 15,158 | | | 13,719 | |
| Interest-bearing | 73,993 | | | 77,048 | |
| Total deposits | 1,702,880 | | | 1,434,803 | |
Federal funds purchased and securities loaned or sold under agreements to repurchase (includes $132,322 and $16,008 measured at fair value) | 190,769 | | | 165,109 | |
| Trading account liabilities | 84,681 | | | 83,270 | |
| Derivative liabilities | 41,728 | | | 38,229 | |
Short-term borrowings (includes $4,577 and $3,941 measured at fair value) | 17,861 | | | 24,204 | |
Accrued expenses and other liabilities (includes $12,765 and $15,434 measured at fair value and $1,910 and $813 of reserve for unfunded lending commitments) | 175,960 | | | 182,798 | |
Long-term debt (includes $30,455 and $34,975 measured at fair value) | 255,723 | | | 240,856 | |
| Total liabilities | 2,469,602 | | | 2,169,269 | |
Commitments and contingencies (Note 6 – Securitizations and Other Variable Interest Entities and Note 10 – Commitments and Contingencies) | | | |
| Shareholders’ equity | | | |
Preferred stock, $0.01 par value; authorized – 100,000,000 shares; issued and outstanding – 3,887,440 and 3,887,440 shares | 23,427 | | | 23,401 | |
Common stock and additional paid-in capital, $0.01 par value; authorized – 12,800,000,000 shares; issued and outstanding – 8,661,522,562 and 8,836,148,954 shares | 85,954 | | | 91,723 | |
| Retained earnings | 160,447 | | | 156,319 | |
| Accumulated other comprehensive income (loss) | (978) | | | (6,633) | |
| | | |
| Total shareholders’ equity | 268,850 | | | 264,810 | |
| Total liabilities and shareholders’ equity | $ | 2,738,452 | | | $ | 2,434,079 | |
| | | | |
| Assets of consolidated variable interest entities included in total assets above (isolated to settle the liabilities of the variable interest entities) | | | |
| Trading account assets | $ | 4,492 | | | $ | 5,811 | |
| | | | |
| | | | |
| Loans and leases | 24,094 | | | 38,837 | |
| Allowance for loan and lease losses | (1,812) | | | (807) | |
| Loans and leases, net of allowance | 22,282 | | | 38,030 | |
| | | | |
| All other assets | 191 | | | 540 | |
| Total assets of consolidated variable interest entities | $ | 26,965 | | | $ | 44,381 | |
| Liabilities of consolidated variable interest entities included in total liabilities above | | | |
| Short-term borrowings (includes $25 and $0 of non-recourse short-term borrowings) | $ | 739 | | | $ | 2,175 | |
| Long-term debt (includes $5,742 and $8,717 of non-recourse debt) | 5,742 | | | 8,718 | |
| All other liabilities (includes $19 and $19 of non-recourse liabilities) | 19 | | | 22 | |
| Total liabilities of consolidated variable interest entities | $ | 6,500 | | | $ | 10,915 | |
See accompanying Notes to Consolidated Financial Statements.
Bank of America Corporation and Subsidiaries
|
| | | | | | | |
| | | | |
| Consolidated Balance Sheet |
| | |
| (Dollars in millions) | September 30
2017 | | December 31
2016 |
| Assets | |
| | |
|
| Cash and due from banks | $ | 30,819 |
| | $ | 30,719 |
|
| Interest-bearing deposits with the Federal Reserve, non-U.S. central banks and other banks | 141,562 |
| | 117,019 |
|
| Cash and cash equivalents | 172,381 |
| | 147,738 |
|
| Time deposits placed and other short-term investments | 9,493 |
| | 9,861 |
|
Federal funds sold and securities borrowed or purchased under agreements to resell (includes $56,780 and $49,750 measured at fair value) | 217,214 |
| | 198,224 |
|
Trading account assets (includes $119,458 and $106,057 pledged as collateral) | 210,319 |
| | 180,209 |
|
| Derivative assets | 38,384 |
| | 42,512 |
|
| Debt securities: | |
| | |
Carried at fair value (includes $32,146 and $29,804 pledged as collateral) | 316,864 |
| | 313,660 |
|
Held-to-maturity, at cost (fair value – $121,185 and $115,285; $5,043 and $8,233 pledged as collateral) | 122,345 |
| | 117,071 |
|
| Total debt securities | 439,209 |
| | 430,731 |
|
Loans and leases (includes $6,285 and $7,085 measured at fair value and $36,362 and $31,805 pledged as collateral) | 927,117 |
| | 906,683 |
|
| Allowance for loan and lease losses | (10,693 | ) | | (11,237 | ) |
| Loans and leases, net of allowance | 916,424 |
| | 895,446 |
|
| Premises and equipment, net | 8,971 |
| | 9,139 |
|
| Mortgage servicing rights | 2,407 |
| | 2,747 |
|
| Goodwill | 68,968 |
| | 68,969 |
|
| Intangible assets | 2,459 |
| | 2,922 |
|
Loans held-for-sale (includes $3,128 and $4,026 measured at fair value) | 13,243 |
| | 9,066 |
|
Customer and other receivables (includes $230 measured at fair value at September 30, 2017) | 55,855 |
| | 58,759 |
|
| Assets of business held for sale (includes $619 measured at fair value at December 31, 2016) | — |
| | 10,670 |
|
Other assets (includes $19,341 and $13,802 measured at fair value) | 128,569 |
| | 120,709 |
|
| Total assets | $ | 2,283,896 |
| | $ | 2,187,702 |
|
| | | | |
| Assets of consolidated variable interest entities included in total assets above (isolated to settle the liabilities of the variable interest entities) |
| Trading account assets | $ | 5,142 |
| | $ | 5,773 |
|
| Loans and leases | 50,022 |
| | 56,001 |
|
| Allowance for loan and lease losses | (1,023 | ) | | (1,032 | ) |
| Loans and leases, net of allowance | 48,999 |
| | 54,969 |
|
| Loans held-for-sale | 66 |
| | 188 |
|
| All other assets | 662 |
| | 1,596 |
|
| Total assets of consolidated variable interest entities | $ | 54,869 |
| | $ | 62,526 |
|
| | | | | | | | | | | | | | | | | | | | | | | | | | | | | | | | | | | | | |
| | | | | | | | | | | | | |
| Consolidated Statement of Changes in Shareholders’ Equity |
| | | | | | | | | | | | | |
| Preferred
Stock | | Common Stock and
Additional Paid-in Capital | | Retained
Earnings | | Accumulated
Other
Comprehensive
Income (Loss) | | | | Total
Shareholders’
Equity |
| (In millions) | | Shares | | Amount | | | | |
| | | | | | | | | | | | | |
| | | | | | | | | | | | | |
| | | | | | | | | | | | | |
| | | | | | | | | | | | | |
| | | | | | | | | | | | | |
| | | | | | | | | | | | | |
| | | | | | | | | | | | | |
| | | | | | | | | | | | | |
| | | | | | | | | | | | | |
| | | | | | | | | | | | | |
| | | | | | | | | | | | | |
| | | | | | | | | | | | | |
| | | | | | | | | | | | | |
| | | | | | | | | | | | | |
| | | | | | | | | | | | | |
| | | | | | | | | | | | | |
| | | | | | | | | | | | | |
| | | | | | | | | | | | | |
| | | | | | | | | | | | | |
| | | | | | | | | | | | | |
| | | | | | | | | | | | | |
| | | | | | | | | | | | | |
| | | | | | | | | | | | | |
| | | | | | | | | | | | | |
| | | | | | | | | | | | | |
| | | | | | | | | | | | | |
| | | | | | | | | | | | | |
| | | | | | | | | | | | | |
| | | | | | | | | | | | | |
| | | | | | | | | | | | | |
| | | | | | | | | | | | | |
| Balance, June 30, 2020 | $ | 23,427 | | | 8,664.1 | | | $ | 85,794 | | | $ | 157,578 | | | $ | (1,162) | | | | | $ | 265,637 | |
| | | | | | | | | | | | | |
| Net income | | | | | | | 4,881 | | | | | | | 4,881 | |
| Net change in debt securities | | | | | | | | | 101 | | | | | 101 | |
| Net change in debit valuation adjustments | | | | | | | | | (58) | | | | | (58) | |
| Net change in derivatives | | | | | | | | | 76 | | | | | 76 | |
| Employee benefit plan adjustments | | | | | | | | | 44 | | | | | 44 | |
| Net change in foreign currency translation adjustments | | | | | | | | | 21 | | | | | 21 | |
| Dividends declared: | | | | | | | | | | | | | |
| Common | | | | | | | (1,571) | | | | | | | (1,571) | |
| Preferred | | | | | | | (441) | | | | | | | (441) | |
| | | | | | | | | | | | | |
| | | | | | | | | | | | | |
| Common stock issued under employee plans, net, and other | | | 1.8 | | | 274 | | | | | | | | | 274 | |
| Common stock repurchased | | | (4.4) | | | (114) | | | | | | | | | (114) | |
| Balance, September 30, 2020 | $ | 23,427 | | | 8,661.5 | | | $ | 85,954 | | | $ | 160,447 | | | $ | (978) | | | | | $ | 268,850 | |
| Balance, December 31, 2019 | $ | 23,401 | | | 8,836.1 | | | $ | 91,723 | | | $ | 156,319 | | | $ | (6,633) | | | | | $ | 264,810 | |
| Cumulative adjustment for adoption of credit loss accounting standard | | | | | | | (2,406) | | | | | | | (2,406) | |
| Net income | | | | | | | 12,424 | | | | | | | 12,424 | |
| Net change in debt securities | | | | | | | | | 4,794 | | | | | 4,794 | |
| Net change in debit valuation adjustments | | | | | | | | | (5) | | | | | (5) | |
| Net change in derivatives | | | | | | | | | 808 | | | | | 808 | |
| Employee benefit plan adjustments | | | | | | | | | 144 | | | | | 144 | |
| Net change in foreign currency translation adjustments | | | | | | | | | (86) | | | | | (86) | |
| Dividends declared: | | | | | | | | | | | | | |
| Common | | | | | | | (4,722) | | | | | | | (4,722) | |
| Preferred | | | | | | | (1,159) | | | | | | | (1,159) | |
| Issuance of preferred stock | 1,098 | | | | | | | | | | | | | 1,098 | |
| Redemption of preferred stock | (1,072) | | | | | | | | | | | | | (1,072) | |
| Common stock issued under employee plans, net, and other | | | 41.6 | | | 993 | | | (9) | | | | | | | 984 | |
| Common stock repurchased | | | (216.2) | | | (6,762) | | | | | | | | | (6,762) | |
| Balance, September 30, 2020 | $ | 23,427 | | | 8,661.5 | | | $ | 85,954 | | | $ | 160,447 | | | $ | (978) | | | | | $ | 268,850 | |
| Balance, June 30, 2019 | $ | 24,689 | | | 9,342.6 | | | $ | 106,619 | | | $ | 147,577 | | | $ | (7,477) | | | | | $ | 271,408 | |
| Net income | | | | | | | 5,777 | | | | | | | 5,777 | |
| Net change in debt securities | | | | | | | | | 1,538 | | | | | 1,538 | |
| Net change in debit valuation adjustments | | | | | | | | | 229 | | | | | 229 | |
| Net change in derivatives | | | | | | | | | 118 | | | | | 118 | |
| Employee benefit plan adjustments | | | | | | | | | 26 | | | | | 26 | |
| Net change in foreign currency translation adjustments | | | | | | | | | (51) | | | | | (51) | |
| Dividends declared: | | | | | | | | | | | | | |
| Common | | | | | | | (1,659) | | | | | | | (1,659) | |
| Preferred | | | | | | | (505) | | | | | | | (505) | |
| Issuance of preferred stock | 1,280 | | | | | | | | | | | | | 1,280 | |
| Redemption of preferred stock | (2,363) | | | | | | | | | | | | | (2,363) | |
| Common stock issued under employee plans, net, and other | | | 4.3 | | | 222 | | | (7) | | | | | | | 215 | |
| Common stock repurchased | | | (267.6) | | | (7,626) | | | | | | | | | (7,626) | |
| Balance, September 30, 2019 | $ | 23,606 | | | 9,079.3 | | | $ | 99,215 | | | $ | 151,183 | | | $ | (5,617) | | | | | $ | 268,387 | |
| Balance, December 31, 2018 | $ | 22,326 | | | 9,669.3 | | | $ | 118,896 | | | $ | 136,314 | | | $ | (12,211) | | | | | $ | 265,325 | |
| Cumulative adjustment for adoption of lease accounting standard | | | | | | | 165 | | | | | | | 165 | |
| Net income | | | | | | | 20,436 | | | | | | | 20,436 | |
| Net change in debt securities | | | | | | | | | 6,231 | | | | | 6,231 | |
| Net change in debit valuation adjustments | | | | | | | | | (272) | | | | | (272) | |
| Net change in derivatives | | | | | | | | | 651 | | | | | 651 | |
| Employee benefit plan adjustments | | | | | | | | | 83 | | | | | 83 | |
| Net change in foreign currency translation adjustments | | | | | | | | | (99) | | | | | (99) | |
| Dividends declared: | | | | | | | | | | | | | |
| Common | | | | | | | (4,535) | | | | | | | (4,535) | |
| Preferred | | | | | | | (1,186) | | | | | | | (1,186) | |
| Issuance of preferred stock | 3,643 | | | | | | | | | | | | | 3,643 | |
| Redemption of preferred stock | (2,363) | | | | | | | | | | | | | (2,363) | |
| Common stock issued under employee plans, net, and other | | | 123.4 | | | 715 | | | (11) | | | | | | | 704 | |
| Common stock repurchased | | | (713.4) | | | (20,396) | | | | | | | | | (20,396) | |
| Balance, September 30, 2019 | $ | 23,606 | | | 9,079.3 | | | $ | 99,215 | | | $ | 151,183 | | | $ | (5,617) | | | | | $ | 268,387 | |
See accompanying Notes to Consolidated Financial Statements.
Bank of America Corporation and Subsidiaries
|
| | | | | | | |
| | | | |
| Consolidated Balance Sheet (continued) |
| | |
| (Dollars in millions) | September 30
2017 | | December 31
2016 |
| Liabilities | |
| | |
|
| Deposits in U.S. offices: | |
| | |
|
| Noninterest-bearing | $ | 429,861 |
| | $ | 438,125 |
|
Interest-bearing (includes $468 and $731 measured at fair value) | 776,756 |
| | 750,891 |
|
| Deposits in non-U.S. offices: | | | |
| Noninterest-bearing | 14,126 |
| | 12,039 |
|
| Interest-bearing | 63,674 |
| | 59,879 |
|
| Total deposits | 1,284,417 |
| | 1,260,934 |
|
Federal funds purchased and securities loaned or sold under agreements to repurchase (includes $38,852 and $35,766 measured at fair value) | 189,790 |
| | 170,291 |
|
| Trading account liabilities | 86,434 |
| | 63,031 |
|
| Derivative liabilities | 31,781 |
| | 39,480 |
|
Short-term borrowings (includes $1,904 and $2,024 measured at fair value) | 32,679 |
| | 23,944 |
|
Accrued expenses and other liabilities (includes $22,369 and $14,630 measured at fair value and $762 and $762 of reserve for unfunded lending commitments) | 157,670 |
| | 146,359 |
|
Long-term debt (includes $29,897 and $30,037 measured at fair value) | 228,666 |
| | 216,823 |
|
| Total liabilities | 2,011,437 |
| | 1,920,862 |
|
Commitments and contingencies (Note 6 – Securitizations and Other Variable Interest Entities, Note 7 – Representations and Warranties Obligations and Corporate Guarantees and Note 10 – Commitments and Contingencies) |
|
| |
|
|
| Shareholders’ equity | |
| | |
|
Preferred stock, $0.01 par value; authorized – 100,000,000 shares; issued and outstanding – 3,837,683 and 3,887,329 shares | 22,323 |
| | 25,220 |
|
Common stock and additional paid-in capital, $0.01 par value; authorized – 12,800,000,000 shares; issued and outstanding – 10,457,473,674 and 10,052,625,604 shares | 142,818 |
| | 147,038 |
|
| Retained earnings | 113,486 |
| | 101,870 |
|
| Accumulated other comprehensive income (loss) | (6,168 | ) | | (7,288 | ) |
| Total shareholders’ equity | 272,459 |
| | 266,840 |
|
| Total liabilities and shareholders’ equity | $ | 2,283,896 |
| | $ | 2,187,702 |
|
| | | | |
| Liabilities of consolidated variable interest entities included in total liabilities above | |
| | |
|
| Short-term borrowings | $ | 122 |
| | $ | 348 |
|
Long-term debt (includes $9,398 and $10,417 of non-recourse debt) | 9,457 |
| | 10,646 |
|
All other liabilities (includes $52 and $38 of non-recourse liabilities) | 54 |
| | 41 |
|
| Total liabilities of consolidated variable interest entities | $ | 9,633 |
| | $ | 11,035 |
|
| | | | | | | | | | | | | | | | | |
| | | | | | | | | |
| Consolidated Statement of Cash Flows | | | | |
| | | | | | | | | |
| | | | | | | Nine Months Ended September 30 |
| | | | | | | | | |
| (Dollars in millions) | | | | | | | 2020 | | 2019 |
| Operating activities | | | | | | | | | |
| Net income | | | | | | | $ | 12,424 | | | $ | 20,436 | |
| Adjustments to reconcile net income to net cash provided by operating activities: | | | | | | | | | |
| Provision for credit losses | | | | | | | 11,267 | | | 2,649 | |
| Gains on sales of debt securities | | | | | | | (379) | | | (116) | |
| Depreciation and amortization | | | | | | | 1,356 | | | 1,290 | |
| | | | | | | | | |
| Net amortization of premium/discount on debt securities | | | | | | | 2,636 | | | 1,419 | |
| Deferred income taxes | | | | | | | (1,994) | | | 1,789 | |
| Stock-based compensation | | | | | | | 1,597 | | | 1,495 | |
| Impairment of equity method investment | | | | | | | 0 | | | 2,072 | |
| Loans held-for-sale: | | | | | | | | | |
| Originations and purchases | | | | | | | (11,093) | | | (18,732) | |
Proceeds from sales and paydowns of loans originally classified as held for sale and instruments from related securitization activities | | | | | | | 15,654 | | | 19,350 | |
| Net change in: | | | | | | | | | |
| Trading and derivative assets/liabilities | | | | | | | (25,503) | | | (30,541) | |
| Other assets | | | | | | | (15,078) | | | 613 | |
| Accrued expenses and other liabilities | | | | | | | (9,495) | | | (4,053) | |
| Other operating activities, net | | | | | | | 2,007 | | | 5,003 | |
| Net cash provided by (used in) operating activities | | | | | | | (16,601) | | | 2,674 | |
| Investing activities | | | | | | | | | |
| Net change in: | | | | | | | | | |
| Time deposits placed and other short-term investments | | | | | | | 2,019 | | | (63) | |
| Federal funds sold and securities borrowed or purchased under agreements to resell | | | | | | | (52,148) | | | (10,464) | |
| Debt securities carried at fair value: | | | | | | | | | |
| Proceeds from sales | | | | | | | 61,485 | | | 43,845 | |
| Proceeds from paydowns and maturities | | | | | | | 61,973 | | | 57,868 | |
| Purchases | | | | | | | (148,905) | | | (110,658) | |
| Held-to-maturity debt securities: | | | | | | | | | |
| Proceeds from paydowns and maturities | | | | | | | 63,097 | | | 22,832 | |
| Purchases | | | | | | | (126,710) | | | (9,825) | |
| Loans and leases: | | | | | | | | | |
Proceeds from sales of loans originally classified as held for investment and instruments from related securitization activities | | | | | | | 10,041 | | | 9,757 | |
| Purchases | | | | | | | (3,972) | | | (4,016) | |
| Other changes in loans and leases, net | | | | | | | 11,810 | | | (34,439) | |
| Other investing activities, net | | | | | | | (2,473) | | | (2,188) | |
| Net cash used in investing activities | | | | | | | (123,783) | | | (37,351) | |
| Financing activities | | | | | | | | | |
| Net change in: | | | | | | | | | |
| Deposits | | | | | | | 268,077 | | | 11,360 | |
| Federal funds purchased and securities loaned or sold under agreements to repurchase | | | | | | | 25,660 | | | 15,079 | |
| Short-term borrowings | | | | | | | (6,353) | | | 10,493 | |
| Long-term debt: | | | | | | | | | |
| Proceeds from issuance | | | | | | | 40,858 | | | 45,149 | |
| Retirement | | | | | | | (37,123) | | | (42,842) | |
| Preferred stock: | | | | | | | | | |
| Proceeds from issuance | | | | | | | 1,098 | | | 3,643 | |
| Redemption | | | | | | | (1,072) | | | (2,363) | |
| Common stock repurchased | | | | | | | (6,762) | | | (20,396) | |
| Cash dividends paid | | | | | | | (5,899) | | | (4,086) | |
| Other financing activities, net | | | | | | | (603) | | | (794) | |
| Net cash provided by financing activities | | | | | | | 277,881 | | | 15,243 | |
| Effect of exchange rate changes on cash and cash equivalents | | | | | | | 1,949 | | | (876) | |
| Net increase (decrease) in cash and cash equivalents | | | | | | | 139,446 | | | (20,310) | |
| Cash and cash equivalents at January 1 | | | | | | | 161,560 | | | 177,404 | |
| Cash and cash equivalents at September 30 | | | | | | | $ | 301,006 | | | $ | 157,094 | |
| | | | | | | | | |
| | | | | | | | | |
| | | | | | | | | |
| | | | | | | | | |
See accompanying Notes to Consolidated Financial Statements.
Bank of America Corporation and Subsidiaries
|
| | | | | | | | | | | | | | | | | | | | | | |
| | | | | | | | | | | | |
| Consolidated Statement of Changes in Shareholders’ Equity |
| | | | | | | | | | | | |
| | Preferred Stock | | Common Stock and Additional Paid-in Capital | | Retained Earnings | | Accumulated
Other Comprehensive Income (Loss) | | Total Shareholders’ Equity |
| (Dollars in millions, shares in thousands) | | Shares | | Amount | | | |
| Balance, December 31, 2015 | $ | 22,273 |
| | 10,380,265 |
| | $ | 151,042 |
| | $ | 88,219 |
| | $ | (5,358 | ) | | $ | 256,176 |
|
| Net income | | | | | | | 13,210 |
| | | | 13,210 |
|
| Net change in debt and marketable equity securities | | | | | | | | | 3,319 |
| | 3,319 |
|
| Net change in debit valuation adjustments | | | | | | | | | 49 |
| | 49 |
|
| Net change in derivatives | | | | | | | | | 277 |
| | 277 |
|
| Employee benefit plan adjustments | | | | | | | | | 29 |
| | 29 |
|
| Net change in foreign currency translation adjustments | | | | | | | | | (17 | ) | | (17 | ) |
| Dividends declared: | | | | | | | | | | | |
| Common | | | | | | | (1,805 | ) | | | | (1,805 | ) |
| Preferred | | | | | | | (1,321 | ) | | | | (1,321 | ) |
| Issuance of preferred stock | 2,947 |
| | | | | | | | | | 2,947 |
|
| Common stock issued under employee plans, net, and related tax effects | | | 5,082 |
| | 1,001 |
| | | | | | 1,001 |
|
| Common stock repurchased | | | (261,502 | ) | | (3,782 | ) | | | | | | (3,782 | ) |
| Balance, September 30, 2016 | $ | 25,220 |
| | 10,123,845 |
| | $ | 148,261 |
| | $ | 98,303 |
| | $ | (1,701 | ) | | $ | 270,083 |
|
| | | | | | | | | | | | |
| Balance, December 31, 2016 | $ | 25,220 |
| | 10,052,626 |
| | $ | 147,038 |
| | $ | 101,870 |
| | $ | (7,288 | ) | | $ | 266,840 |
|
| Net income | | | | | | | 15,712 |
| | | | 15,712 |
|
| Net change in debt and marketable equity securities | | | | | | | | | 931 |
| | 931 |
|
| Net change in debit valuation adjustments | | | | | | | | | (149 | ) | | (149 | ) |
| Net change in derivatives | | | | | | | | | 156 |
| | 156 |
|
| Employee benefit plan adjustments | | | | | | | | | 80 |
| | 80 |
|
| Net change in foreign currency translation adjustments | | | | | | | | | 102 |
| | 102 |
|
| Dividends declared: | | | | | | | | | | | |
| Common | | | | | | | (2,768 | ) | | | | (2,768 | ) |
| Preferred | | | | | | | (1,292 | ) | | | | (1,292 | ) |
| Common stock issued in connection with exercise of warrants and exchange of preferred stock | (2,897 | ) | | 700,000 |
| | 2,933 |
| | (36 | ) | | | | — |
|
| Common stock issued under employee plans, net and other | | | 39,496 |
| | 792 |
| | | | | | 792 |
|
| Common stock repurchased | | | (334,648 | ) | | (7,945 | ) | | | | | | (7,945 | ) |
| Balance, September 30, 2017 | $ | 22,323 |
| | 10,457,474 |
| | $ | 142,818 |
| | $ | 113,486 |
| | $ | (6,168 | ) | | $ | 272,459 |
|
See accompanying Notes to Consolidated Financial Statements.
Bank of America72
Bank of America Corporation and Subsidiaries
|
| | | | | | | |
| | | | |
| Consolidated Statement of Cash Flows | | | |
| | | | |
| | Nine Months Ended September 30 |
| (Dollars in millions) | 2017 | | 2016 |
| Operating activities | | | |
| Net income | $ | 15,712 |
| | $ | 13,210 |
|
| Adjustments to reconcile net income to net cash provided by operating activities: | | | |
| Provision for credit losses | 2,395 |
| | 2,823 |
|
| Gains on sales of debt securities | (278 | ) | | (490 | ) |
| Depreciation and premises improvements amortization | 1,115 |
| | 1,138 |
|
| Amortization of intangibles | 473 |
| | 554 |
|
| Net amortization of premium/discount on debt securities | 1,647 |
| | 2,203 |
|
| Deferred income taxes | 5,043 |
| | 5,072 |
|
| Stock-based compensation | 1,465 |
| | 1,087 |
|
| Loans held-for-sale: | | | |
| Originations and purchases | (31,404 | ) | | (24,154 | ) |
| Proceeds from sales and paydowns of loans originally classified as held-for-sale | 27,006 |
| | 21,068 |
|
| Net change in: | | | |
| Trading and derivative instruments | (11,844 | ) | | 9,068 |
|
| Other assets | (9,809 | ) | | (612 | ) |
| Accrued expenses and other liabilities | 11,201 |
| | (4,845 | ) |
| Other operating activities, net | 4,729 |
| | 595 |
|
| Net cash provided by operating activities | 17,451 |
| | 26,717 |
|
| Investing activities | | | |
| Net change in: | | | |
| Time deposits placed and other short-term investments | 368 |
| | (762 | ) |
| Federal funds sold and securities borrowed or purchased under agreements to resell | (18,990 | ) | | (26,328 | ) |
| Debt securities carried at fair value: | | | |
| Proceeds from sales | 64,597 |
| | 67,681 |
|
| Proceeds from paydowns and maturities | 71,628 |
| | 81,404 |
|
| Purchases | (134,915 | ) | | (156,537 | ) |
| Held-to-maturity debt securities: | | | |
| Proceeds from paydowns and maturities | 12,194 |
| | 12,827 |
|
| Purchases | (17,850 | ) | | (29,085 | ) |
| Loans and leases: | | | |
| Proceeds from sales | 8,643 |
| | 14,870 |
|
| Purchases | (4,511 | ) | | (9,347 | ) |
| Other changes in loans and leases, net | (29,654 | ) | | (17,832 | ) |
| Other investing activities, net | 8,451 |
| | 109 |
|
| Net cash used in investing activities | (40,039 | ) | | (63,000 | ) |
| Financing activities | | | |
| Net change in: | | | |
| Deposits | 23,483 |
| | 35,636 |
|
| Federal funds purchased and securities loaned or sold under agreements to repurchase | 19,987 |
| | 3,904 |
|
| Short-term borrowings | 8,583 |
| | (1,069 | ) |
| Long-term debt: | | | |
| Proceeds from issuance | 50,702 |
| | 24,681 |
|
| Retirement of long-term debt | (44,724 | ) | | (41,458 | ) |
| Preferred stock: Proceeds from issuance | — |
| | 2,947 |
|
| Common stock repurchased | (7,945 | ) | | (3,782 | ) |
| Cash dividends paid | (4,124 | ) | | (3,031 | ) |
| Other financing activities, net | (609 | ) | | (58 | ) |
| Net cash provided by financing activities | 45,353 |
| | 17,770 |
|
| Effect of exchange rate changes on cash and cash equivalents | 1,878 |
| | 2,594 |
|
| Net increase (decrease) in cash and cash equivalents | 24,643 |
| | (15,919 | ) |
| Cash and cash equivalents at January 1 | 147,738 |
| | 159,353 |
|
| Cash and cash equivalents at September 30 | $ | 172,381 |
| | $ | 143,434 |
|
See accompanying Notes to Consolidated Financial Statements.
Bank of America Corporation and Subsidiaries
Notes to Consolidated Financial Statements
NOTE 1 Summary of Significant Accounting Principles
Bank of America Corporation, a bank holding company and a financial holding company, provides a diverse range of financial services and products throughout the U.S. and in certain international markets. The term “the Corporation” as used herein may refer to Bank of America Corporation, individually, Bank of America Corporation and its subsidiaries, or certain of Bank of America Corporation’s subsidiaries or affiliates.
Principles of Consolidation and Basis of Presentation
The Consolidated Financial Statements include the accounts of the Corporation and its majority-owned subsidiaries and those variable interest entities (VIEs) where the Corporation is the primary beneficiary. Intercompany accounts and transactions have been eliminated. Results of operations of acquired companies are included from the dates of acquisition, and for VIEs, from the dates that the Corporation became the primary beneficiary. Assets held in an agency or fiduciary capacity are not included in the Consolidated Financial Statements. The Corporation accounts for investments in companies for which it owns a voting interest and for which it has the ability to exercise significant influence over operating and financing decisions using the equity method of accounting. These investments are included in other assets. Equity method investments are subject to impairment testing, and the Corporation’s proportionate share of income or loss is included in other income.
The preparation of the Consolidated Financial Statements in conformity with accounting principles generally accepted in the United States of America (GAAP) requires management to make estimates and assumptions that affect reported amounts and disclosures. RealizedActual results could materially differ from those estimates and assumptions.
These unaudited Consolidated Financial Statements should be read in conjunction with the audited Consolidated Financial Statements of the Corporation's 2016Corporation’s 2019 Annual Report on Form 10-K.
The nature of the Corporation'sCorporation’s business is such that the results of any interim period are not necessarily indicative of results for a full year. In the opinion of management, all adjustments, which consist of normal recurring adjustments necessary for a fair statement of the interim period results, have been made. The Corporation evaluates subsequent events through the date of filing with the Securities and Exchange Commission. Certain prior-period amounts have been reclassified to conform to current period presentation.
On June 1, 2017,New Accounting Standards
Reference Rate Reform
In March 2020, the Corporation completedFASB issued a new accounting standard related to contracts or hedging relationships that reference LIBOR or other reference rates that are expected to be discontinued due to reference rate reform. The new standard provides for optional expedients and other guidance regarding the saleaccounting related to modifications of its non-U.S. consumer credit card business to a third party.contracts, hedging relationships and other transactions affected by reference rate reform. The Corporation has indemnifiedelected to retrospectively adopt the purchaser for substantially all payment protection insurance (PPI) exposure above reserves assumed by the purchaser. Thenew standard as of January 1, 2020 which resulted in 0 immediate impact. While reference rate reform is not expected to have a material accounting impact of the sale was an after-tax gain of $103 million, and is presented in the Consolidated Statement of Income as other income of $793 million and an income tax expense of $690 million. The income tax expense was related to gains on the derivatives used to hedgeCorporation’s
consolidated financial position or results of operations, the currency riskstandard will ease the administrative burden in accounting for the future effects of the net investment. Total cash proceeds from the sale were $10.9 billion. The assets of the business sold primarily included consumer credit card receivables of $9.8 billion and $9.2 billion
at June 1, 2017 and December 31, 2016 and goodwill of $775 million at both of those period ends. This business was includedin All Other.
New Accounting Pronouncementsreference rate reform.
Accounting for Financial Instruments -- Credit Losses
The Financial Accounting Standards Board (FASB) issued aOn January 1, 2020, the Corporation adopted the new accounting standard effective on January 1, 2020, with early adoption permitted on January 1, 2019, that will requirerequires the earlier recognitionmeasurement of credit losses on loans and other financial instruments based on an expected loss model, replacing the incurred loss model that is currently in use. The standard also requires expanded credit quality disclosures, including credit quality indicators disaggregated by vintage. The Corporation is in the process of identifying and implementing required changes to loan loss estimation models and processes and evaluating the impact of this new accounting standard, which at the date of adoption is expected to increase the allowance for credit losses with a resulting negative adjustment to retained earnings.
Hedge Accounting
The FASB issued a new accountingbe based on management’s best estimate of lifetime expected credit losses (ECL) inherent in the Corporation’s relevant financial assets. Upon adoption of the standard effective on January 1, 2019, with early2020, the Corporation recorded a $3.3 billion, or 32 percent, increase to the allowance for credit losses. After adjusting for deferred taxes and other adoption permitted, that makes targeted improvements to simplifyeffects, a $2.4 billion decrease was recorded in retained earnings through a cumulative-effect adjustment.
Accounting Principles for Credit Losses
The following summarizes the applicationCorporation’s accounting policies for certain credit loss activities.
Allowance for Credit Losses
The allowance for credit losses includes both the allowance for loan and lease losses and the reserve for unfunded lending commitments and represents management’s estimate of hedge accounting guidance. The Corporation is evaluating the timing of adoption. The ongoing implementation efforts include identifying current hedge strategies and systems and processes that will need to be modified to comply with the standard, which could impact the timing of adoption. The Corporation does not expect the new accounting standard to have a material impact on its consolidated financial position, results of operations or disclosuresECL in the Notes to the Consolidated Financial Statements.
Lease Accounting
The FASB issued a new accounting standard effective on January 1, 2019 that requires substantially all leases to be recorded as assetsCorporation’s loan and liabilities on the balance sheet. This new accounting standard uses a modified retrospective transition that will be applied to all prior periods presented. The Corporation is in the process of reviewing its existing lease portfolios, as well as other service contracts for embedded leases, to evaluate the impact of the new accounting standard on the financial statements, as well as the impact to regulatory capital and risk-weighted assets. The effect of the adoption will depend on its lease portfolio, at the time of transition; however, the Corporation does not expect the new accounting standard to have a material impact on its consolidated financial position, results of operations or disclosures in the Notes to the Consolidated Financial Statements.
Recognitionexcluding loans and Measurement of Financial Assets and Financial Liabilities
The FASB issued a new accounting standard effective on January 1, 2018, with early adoption permitted for the provisions related to debit valuation adjustments (DVA), on recognition and measurement of financial instruments, including certain equity investments and financial liabilities recorded at fair value under the fair value option. In 2015, the Corporation early adopted, retrospective to January 1, 2015, the provisions of this new accounting standard related to DVA on financial liabilitiesunfunded lending commitments accounted for under the fair value option. The ECL on funded consumer and commercial loans and leases is referred to as the allowance for loan and lease losses and is reported separately as a contra-asset to loans and leases on the Consolidated Balance Sheet. The ECL for unfunded lending commitments, including home equity lines of credit (HELOCs), standby letters of credit (SBLCs) and binding unfunded loan commitments is reported on the Consolidated Balance Sheet in accrued expenses and other liabilities. The provision for credit losses related to the loan and lease portfolio and unfunded lending commitments is reported in the Consolidated Statement of Income.
For loans and leases, the ECL is typically estimated using quantitative methods that consider a variety of factors such as historical loss experience, the current credit quality of the portfolio as well as an economic outlook over the life of the loan. The life of the loan for closed-ended products is based on the contractual maturity of the loan adjusted for any expected prepayments. The contractual maturity includes any extension options that are at the sole discretion of the borrower. For open-ended products (e.g., lines of credit), the ECL is determined based on the maximum repayment term associated with future draws from credit lines unless those lines of credit are unconditionally cancellable (e.g., credit cards) in which case the Corporation does not record any allowance.
In its loss forecasting framework, the Corporation incorporates forward-looking information through the use of macroeconomic scenarios applied over the forecasted life of the assets. These macroeconomic scenarios include variables that have historically been key drivers of increases and decreases in credit losses. These variables include, but are not limited to, unemployment rates, real estate prices, gross domestic product levels, corporate bond spreads and long-term interest rate forecasts. As any one economic outlook is inherently uncertain, the Corporation leverages multiple scenarios. The scenarios that are chosen each quarter and the amount of weighting given to each scenario depend on a variety of factors including recent economic events, leading economic indicators, views of internal as well as third-party economists and industry trends.
The estimate of credit losses includes expected recoveries of amounts previously charged off (i.e., negative allowance). If a loan has been charged off, the expected cash flows on the loan are not limited by the current amortized cost balance. Instead, expected cash flows can be assumed up to the unpaid principal balance immediately prior to the charge-off.
The allowance for loan and lease losses for troubled debt restructurings (TDR) is measured based on the present value of projected future lifetime principal and interest cash flows discounted at the loan’s original effective interest rate, or in cases where foreclosure is probable or the loan is collateral dependent, at the loan’s collateral value or its observable market price, if available. The measurement of ECL for the renegotiated consumer credit card TDR portfolio is based on the present value of projected cash flows discounted using the average TDR portfolio contractual interest rate, excluding promotionally priced loans, in effect prior to restructuring. Projected cash flows for TDRs use the same economic outlook as discussed above. For purposes of computing this specific loss component of the allowance, larger impaired loans are evaluated individually and smaller impaired loans are evaluated as a pool.
Also included in the allowance for loan and lease losses are qualitative reserves to cover losses that are expected but, in the Corporation's assessment, may not be adequately represented in the quantitative methods or the economic assumptions described above. For example, factors that the Corporation considers include changes in lending policies and procedures, business conditions, the nature and size of the portfolio, portfolio concentrations, the volume and severity of past due loans and nonaccrual loans, the effect of external factors such as competition, and legal and regulatory requirements, among others. Further, the Corporation considers the inherent uncertainty in quantitative models that are built on historical data.
With the exception of the Corporation's credit card portfolio, the Corporation does not include reserves for interest receivable in the measurement of the allowance for credit losses as the Corporation generally classifies consumer loans as nonperforming at 90 days past due and reverses interest income for these loans at that time. For credit card loans, the Corporation reserves for interest and fees as part of the allowance for loan and lease losses. Upon charge-off of a credit card loan, the Corporation reverses the interest and fee income against the income statement line item where it was originally recorded.
The Corporation has identified the following 3 portfolio segments and measures the allowance for credit losses using the following methods.
Consumer Real Estate
To estimate ECL for consumer loans secured by residential real estate, the Corporation estimates the number of loans that will default over the life of the existing portfolio, after factoring in estimated prepayments, using quantitative modeling methodologies. The attributes that are most significant in estimating the Corporation’s ECL include refreshed loan-to-value (LTV) or, in the case of a subordinated lien, refreshed combined LTV (CLTV), borrower credit score, months since origination and geography, all of which are further broken down by present collection status (whether the loan is current, delinquent, in default, or in bankruptcy). The estimates are based on the Corporation’s historical experience with the loan portfolio,
adjusted to reflect the economic outlook. The outlook on the unemployment rate and consumer real estate prices are key factors that impact the frequency and severity of loss estimates. The Corporation does not reserve for credit losses on the unpaid principal balance of loans insured by the Federal Housing Administration (FHA) and long-term standby loans, as these loans are fully insured. The Corporation records a reserve for unfunded lending commitments for the ECL associated with the undrawn portion of the Corporation’s HELOCs, which can only be canceled by the Corporation if certain criteria are met. The ECL associated with these unfunded lending commitments is calculated using the same models and methodologies noted above and incorporate utilization assumptions at time of default.
For loans that are more than 180 days past due and collateral-dependent TDRs, the Corporation bases the allowance on the estimated fair value of the underlying collateral as of the reporting date less costs to sell. The fair value of the collateral securing these loans is generally determined using an automated valuation model (AVM) that estimates the value of a property by reference to market data including sales of comparable properties and price trends specific to the Metropolitan Statistical Area in which the property being valued is located. In the event that an AVM value is not available, the Corporation utilizes publicized indices or if these methods provide less reliable valuations, the Corporation uses appraisals or broker price opinions to estimate the fair value of the collateral. While there is inherent imprecision in these valuations, the Corporation believes that they are representative of this portfolio in the aggregate.
For loans that are more than 180 days past due and collateral-dependent TDRs, with the exception of the Corporation’s fully insured portfolio, the outstanding balance of loans that is in excess of the estimated property value after adjusting for costs to sell is charged off. If the estimated property value decreases in periods subsequent to the initial charge-off, the Corporation will record an additional charge-off; however, if the value increases in periods subsequent to the charge-off, the Corporation will adjust the allowance to account for the increase but not to a level above the cumulative charge-off amount.
Credit Cards and Other Consumer
Credit cards are revolving lines of credit without a defined maturity date. The estimated life of a credit card receivable is determined by estimating the amount and timing of expected future payments (e.g., borrowers making full payments, minimum payments or somewhere in between) that it will take for a receivable balance to pay off. The ECL on the future payments incorporates the spending behavior of a borrower through time using key borrower-specific factors and the economic outlook described above. The Corporation applies all expected payments in accordance with the Credit Card Accountability Responsibility and Disclosure Act of 2009 (i.e., paying down the highest interest rate bucket first). Then forecasted future payments are prioritized to pay off the oldest balance until it is brought to zero or an expected charge-off amount. Unemployment rate outlook, borrower credit score, delinquency status and historical payment behavior are all key inputs into the credit card receivable loss forecasting model. Future draws on the credit card lines are excluded from the ECL as they are unconditionally cancellable.
The ECL for the consumer vehicle lending portfolio is also determined using quantitative methods supplemented with qualitative analysis. The quantitative model estimates ECL giving consideration to key borrower and loan characteristics such as delinquency status, borrower credit score, LTV ratio, underlying collateral type and collateral value.
Commercial
The ECL on commercial loans is forecasted using models that estimate credit losses over the loan’s contractual life at an individual loan level. The models use the contractual terms to forecast future principal cash flows while also considering expected prepayments. For open-ended commitments such as revolving lines of credit, changes in funded balance are captured by forecasting a borrower’s draw and payment behavior over the remaining life of the commitment. For loans collateralized with commercial real estate and for which the underlying asset is the primary source of repayment, the loss forecasting models consider key loan and customer attributes such as LTV ratio, net operating income and debt service coverage, and captures variations in behavior according to property type and region. The commercial real estate model also utilizes key economic variables to forecast market indicators such as rent levels and vacancy rates, which impact the ECL estimate. For all other commercial loans and leases, the loss forecasting model determines the probabilities of transition to different credit risk ratings or default at each point over the life of the asset based on the borrower’s current credit risk rating, industry sector, size of the exposure and the geographic market. The severity of loss is determined based on the type of collateral securing the exposure, the size of the exposure, the borrower’s industry sector, any guarantors and the geographic market. Assumptions of expected loss are conditioned to the economic outlook and the model considers key economic variables such as unemployment rate, gross domestic product, credit risk spreads, asset prices and equity market returns.
In addition to the allowance for loan and lease losses, the Corporation also estimates ECL related to unfunded lending commitments such as letters of credit, financial guarantees, unfunded bankers acceptances and binding loan commitments, excluding commitments accounted for under the fair value option. Reserves are estimated for the unfunded exposure using the same models and methodologies as the funded exposure and are reported as reserves for unfunded lending commitments.
Securities
The Corporation evaluates each available-for-sale (AFS) security where the value has declined below amortized cost. If the Corporation intends to sell or believes it is more likely than not that it will be required to sell the debt security, it is written down to fair value through earnings. For AFS debt securities the Corporation intends to hold, the Corporation evaluates the debt securities for ECL except for debt securities that are guaranteed by the U.S. Treasury, U.S. government agencies or sovereign entities of high credit quality where the Corporation applies a zero credit loss assumption. For the remaining AFS debt securities, the Corporation considers qualitative parameters such as internal and external credit ratings and the value of underlying collateral. If an AFS debt security fails any of the qualitative parameters, a discounted cash flow analysis is used by the Corporation to determine if a portion of the unrealized loss is a result of a credit loss. Any credit losses determined are recognized as an increase to the allowance for credit losses through provision expense recorded in other income. Cash flows
expected to be collected are estimated using all relevant information available such as, remaining payment terms, prepayment speeds, the financial condition of the issuer, expected defaults and the value of the underlying collateral. If any of the decline in fair value is related to market factors, that amount is recognized in accumulated other comprehensive income (OCI). In certain instances, the credit loss may exceed the total decline in fair value, in which case, the allowance recorded is limited to the difference between the amortized cost and the fair value of the asset.
The Corporation separately evaluates its held-to-maturity (HTM) debt securities for any credit losses, of which substantially all qualify for the zero loss assumption. For the remaining securities, the Corporation performs a discounted cash flow analysis to estimate any credit losses which are then recognized as part of the allowance for credit losses.
Other Assets
For the Corporation’s financial assets that are measured at amortized cost and are not included in debt securities or loans and leases on the Consolidated Balance Sheet, the Corporation evaluates these assets for ECL using various techniques. For assets that are subject to collateral maintenance provisions, including federal funds sold and securities borrowed or purchased under agreements to resell, where the collateral consists of daily margining of liquid and marketable assets where the margining is expected to be maintained into the foreseeable future, the expected losses are assumed to be 0. For all other assets, the Corporation performs qualitative analyses, including consideration of historical losses and current economic conditions, to estimate any ECL which are then included in a valuation account that is recorded as a contra-asset against the amortized cost basis of the financial asset.
Troubled Debt Restructurings
The Corporation has implemented various consumer and commercial loan modification programs to provide its borrowers relief from the economic impacts of the COVID-19 pandemic. In accordance with the Coronavirus Aid, Relief, and Economic Security Act (CARES Act), the Corporation has elected to not apply TDR classification to any COVID-19 related loan modifications that were performed after March 1, 2020 to borrowers who were current as of December 31, 2019. Accordingly, these restructurings are not classified as TDRs. In addition, for loans modified in response to the COVID-19 pandemic that do not meet the above criteria (e.g., current payment status at December 31, 2019), the Corporation is applying the guidance included in an interagency statement issued by the bank regulatory agencies. This guidance states that loan modifications performed in light of the COVID-19 pandemic, including loan payment deferrals that are up to six months in duration, that were granted to borrowers who were current as of the implementation date of a loan modification program or modifications granted under government mandated modification programs, are not TDRs. For loan modifications that include a payment deferral and are not TDRs, the borrowers' past due and nonaccrual status have not been impacted during the deferral period. The Corporation has continued to accrue interest during the deferral period using a constant effective yield method. For most mortgage, HELOC and commercial loan modifications, the contractual interest that accrued during the deferral period is payable at the maturity of the loan. The Corporation includes these amounts with the unpaid principal balance when computing its allowance for credit losses. Amounts that are subsequently deemed uncollectible
not expectare written off against the remaining provisionsallowance for credit losses. For more information on the Corporation's TDR accounting, see Note 1 – Summary of this new accounting standard to have a material impact on its consolidated financial position, results of operations or disclosures in the NotesSignificant Accounting Principles to the Consolidated Financial Statements.Statements of the Corporation’s 2019 Annual Report on Form 10-K.
Revenue RecognitionPaycheck Protection Program
The FASB issuedCorporation is participating in the Paycheck Protection Program (PPP), which is a new accounting standard effective on January 1, 2018 for recognizing revenueloan program that originated from contractsthe CARES Act and was subsequently expanded by the Paycheck Protection Program and Health Care Enhancement Act. The PPP is designed to provide U.S. small businesses with customers. The customer contracts withincash-flow assistance through loans fully guaranteed by the scopeSmall Business Administration (SBA). If the borrower meets certain criteria and uses the proceeds towards certain eligible expenses, the borrower’s obligation to repay the loan can be forgiven up to the full principal amount of the new standard have been identified,loan and any accrued interest. Upon borrower forgiveness, the Corporation's current evaluation indicates thatSBA pays the new standard will not impact the timing or measurement of its revenue recognition. The Corporation continues to evaluate the presentation of certain costs as either operating expenses or net against noninterest income; consequently, there may be an insignificant change in the Consolidated Statement of Income for the presentationprincipal and accrued interest owed on the loan. If the full principal of these costs. Overall, the loan is not forgiven, the loan will operate according to the original loan terms with the 100 percent SBA guaranty remaining. As of September 30, 2020,
the Corporation does not expecthad approximately 343,000 PPP loans with outstanding balances totaling $24.7 billion. As compensation for originating the new accounting standardloans, the Corporation received lender processing fees from the SBA, which are capitalized, along with the loan origination costs, and will be amortized over the loans’ contractual lives and recognized as interest income. Upon forgiveness of a loan and repayment by the SBA, any unrecognized net capitalized fees and costs related to have a material impact on its consolidated financial position, resultsthe loan will be recognized as interest income in that period.
NOTE 2Net Interest Income and Noninterest Income
The table below presents the Corporation’s net interest income and noninterest income disaggregated by revenue source for the three and nine months ended September 30, 2020 and 2019. For more information, see Note 1 – Summary of operations or disclosures in the NotesSignificant Accounting Principles to the Consolidated Financial Statements.Statements of the Corporation’s 2019 Annual Report on Form 10-K. For a disaggregation of noninterest income by business segment and All Other, see Note 17 – Business Segment Information.
| | | | | | | | | | | | | | | | | | | | | | | | | | | | | | | | |
| | | | | | | | | | | | | | |
| | | | | | Three Months Ended September 30 | | Nine Months Ended September 30 |
| (Dollars in millions) | | | | | | | | | | 2020 | | 2019 | | 2020 | | 2019 |
| Net interest income | | | | | | | | | | | | | | | | |
| Interest income | | | | | | | | | | | | | | | | |
| Loans and leases | | | | | | | | | | $ | 7,894 | | | $ | 10,894 | | | $ | 26,426 | | | $ | 32,721 | |
| Debt securities | | | | | | | | | | 2,130 | | | 2,829 | | | 7,413 | | | 8,965 | |
| Federal funds sold and securities borrowed or purchased under agreements to resell | | | | | | | | | | 55 | | | 1,242 | | | 900 | | | 3,746 | |
| Trading account assets | | | | | | | | | | 948 | | | 1,319 | | | 3,203 | | | 3,962 | |
| Other interest income | | | | | | | | | | 459 | | | 1,632 | | | 2,182 | | | 4,916 | |
| Total interest income | | | | | | | | | | 11,486 | | | 17,916 | | | 40,124 | | | 54,310 | |
| | | | | | | | | | | | | | | | |
| Interest expense | | | | | | | | | | | | | | | | |
| Deposits | | | | | | | | | | 227 | | | 1,880 | | | 1,784 | | | 5,640 | |
| Short-term borrowings | | | | | | | | | | (24) | | | 1,876 | | | 1,024 | | | 5,725 | |
| Trading account liabilities | | | | | | | | | | 212 | | | 303 | | | 764 | | | 967 | |
| Long-term debt | | | | | | | | | | 942 | | | 1,670 | | | 3,445 | | | 5,227 | |
| Total interest expense | | | | | | | | | | 1,357 | | | 5,729 | | | 7,017 | | | 17,559 | |
| Net interest income | | | | | | | | | | $ | 10,129 | | | $ | 12,187 | | | $ | 33,107 | | | $ | 36,751 | |
| | | | | | | | | | | | | | | | |
| Noninterest income | | | | | | | | | | | | | | | | |
| Fees and commissions | | | | | | | | | | | | | | | | |
| Card income | | | | | | | | | | | | | | | | |
Interchange fees (1) | | | | | | | | | | $ | 1,172 | | | $ | 963 | | | $ | 2,794 | | | $ | 2,827 | |
| Other card income | | | | | | | | | | 396 | | | 502 | | | 1,295 | | | 1,459 | |
| Total card income | | | | | | | | | | 1,568 | | | 1,465 | | | 4,089 | | | 4,286 | |
| Service charges | | | | | | | | | | | | | | | | |
| Deposit-related fees | | | | | | | | | | 1,515 | | | 1,690 | | | 4,441 | | | 4,908 | |
| Lending-related fees | | | | | | | | | | 302 | | | 285 | | | 841 | | | 809 | |
| Total service charges | | | | | | | | | | 1,817 | | | 1,975 | | | 5,282 | | | 5,717 | |
| Investment and brokerage services | | | | | | | | | | | | | | | | |
| Asset management fees | | | | | | | | | | 2,740 | | | 2,597 | | | 7,905 | | | 7,591 | |
| Brokerage fees | | | | | | | | | | 883 | | | 897 | | | 2,898 | | | 2,733 | |
| Total investment and brokerage services | | | | | | | | | | 3,623 | | | 3,494 | | | 10,803 | | | 10,324 | |
| Investment banking fees | | | | | | | | | | | | | | | | |
| Underwriting income | | | | | | | | | | 1,239 | | | 740 | | | 3,610 | | | 2,198 | |
| Syndication fees | | | | | | | | | | 133 | | | 341 | | | 634 | | | 887 | |
| Financial advisory services | | | | | | | | | | 397 | | | 452 | | | 1,072 | | | 1,083 | |
| Total investment banking fees | | | | | | | | | | 1,769 | | | 1,533 | | | 5,316 | | | 4,168 | |
| Total fees and commissions | | | | | | | | | | 8,777 | | | 8,467 | | | 25,490 | | | 24,495 | |
| Market making and similar activities | | | | | | | | | | 1,689 | | | 2,118 | | | 6,983 | | | 7,267 | |
| Other income | | | | | | | | | | (259) | | | 35 | | | (151) | | | 382 | |
| Total noninterest income | | | | | | | | | | $ | 10,207 | | | $ | 10,620 | | | $ | 32,322 | | | $ | 32,144 | |
(1)Gross interchange fees were $2.4 billion and $2.6 billion for the three months ended September 30, 2020 and 2019 and are presented net of $1.4 billion and $1.6 billion of expenses for rewards and partner payments as well as certain other card costs. Gross interchange fees were $6.7 billion and $7.4 billion for the nine months ended September 30, 2020 and 2019 and are presented net of $4.1 billion and $4.6 billion of expenses for rewards and partner payments as well as certain other card costs for the same periods.
NOTE 2 3Derivatives
Derivative Balances
Derivatives are entered into on behalf of customers, for trading or to support risk management activities. Derivatives used in risk management activities include derivatives that may or may not be designated in qualifying hedge accounting relationships. Derivatives that are not designated in qualifying hedge accounting relationships are referred to as other risk management derivatives. For more information on the Corporation’s derivatives and hedging activities, see Note 1 –
Summary of Significant Accounting Principlesto the Consolidated Financial Statementsof the Corporation's 2016Corporation’s 2019 Annual Report on Form 10-K. 10-K. The following tables present derivative instruments included on the Consolidated Balance Sheet in derivative assets and liabilities at September 30, 20172020 and December 31, 2016.2019. Balances are presented on a gross basis, prior to the application of counterparty and cash collateral netting. Total derivative assets and liabilities are adjusted on an aggregate basis to take into consideration the effects of legally enforceable master netting agreements and have been reduced by the cash collateral received or paid.
| | | | | | | | | | | | | | | | | | | | | | | | | | | | | | | | | | | | | | | | | |
| | | | | | | | | | | | | |
| | | September 30, 2020 |
| | | Gross Derivative Assets | | Gross Derivative Liabilities |
| (Dollars in billions) | Contract/ Notional (1) | | Trading and Other Risk Management Derivatives | | Qualifying
Accounting
Hedges | | Total | | Trading and Other Risk Management Derivatives | | Qualifying
Accounting
Hedges | | Total |
| Interest rate contracts | | | | | | | | | | | | | |
| Swaps | $ | 16,869.8 | | | $ | 203.8 | | | $ | 13.0 | | | $ | 216.8 | | | $ | 214.9 | | | $ | 0.9 | | | $ | 215.8 | |
| Futures and forwards | 5,599.2 | | | 2.0 | | | 0.1 | | | 2.1 | | | 1.9 | | | 0 | | | 1.9 | |
| Written options | 1,599.1 | | | 0 | | | 0 | | | 0 | | | 44.8 | | | 0 | | | 44.8 | |
| Purchased options | 1,573.0 | | | 51.2 | | | 0 | | | 51.2 | | | 0 | | | 0 | | | 0 | |
| Foreign exchange contracts | | | | | | | | | | | | | |
| Swaps | 1,471.8 | | | 30.9 | | | 0.4 | | | 31.3 | | | 34.8 | | | 0.6 | | | 35.4 | |
| Spot, futures and forwards | 4,278.5 | | | 35.9 | | | 0.2 | | | 36.1 | | | 36.0 | | | 0.1 | | | 36.1 | |
| Written options | 297.6 | | | 0 | | | 0 | | | 0 | | | 4.4 | | | 0 | | | 4.4 | |
| Purchased options | 294.7 | | | 4.6 | | | 0 | | | 4.6 | | | 0 | | | 0 | | | 0 | |
| Equity contracts | | | | | | | | | | | | | |
| Swaps | 291.2 | | | 12.0 | | | 0 | | | 12.0 | | | 12.5 | | | 0 | | | 12.5 | |
| Futures and forwards | 109.3 | | | 0.7 | | | 0 | | | 0.7 | | | 0.7 | | | 0 | | | 0.7 | |
| Written options | 650.3 | | | 0 | | | 0 | | | 0 | | | 44.5 | | | 0 | | | 44.5 | |
| Purchased options | 586.8 | | | 46.6 | | | 0 | | | 46.6 | | | 0 | | | 0 | | | 0 | |
| Commodity contracts | | | | | | | | | | | | | |
| Swaps | 36.7 | | | 2.9 | | | 0 | | | 2.9 | | | 4.1 | | | 0 | | | 4.1 | |
| Futures and forwards | 62.2 | | | 2.2 | | | 0 | | | 2.2 | | | 1.0 | | | 0 | | | 1.0 | |
| Written options | 29.5 | | | 0 | | | 0 | | | 0 | | | 2.3 | | | 0 | | | 2.3 | |
| Purchased options | 29.6 | | | 2.1 | | | 0 | | | 2.1 | | | 0 | | | 0 | | | 0 | |
Credit derivatives (2) | | | | | | | | | | | | | |
| Purchased credit derivatives: | | | | | | | | | | | | | |
| Credit default swaps | 398.7 | | | 4.3 | | | 0 | | | 4.3 | | | 4.3 | | | 0 | | | 4.3 | |
| Total return swaps/options | 92.1 | | | 0.5 | | | 0 | | | 0.5 | | | 1.1 | | | 0 | | | 1.1 | |
| Written credit derivatives: | | | | | | | | | | | | | |
| Credit default swaps | 386.8 | | | 4.2 | | | 0 | | | 4.2 | | | 3.6 | | | 0 | | | 3.6 | |
| Total return swaps/options | 83.2 | | | 0.5 | | | 0 | | | 0.5 | | | 0.6 | | | 0 | | | 0.6 | |
| Gross derivative assets/liabilities | | | $ | 404.4 | | | $ | 13.7 | | | $ | 418.1 | | | $ | 411.5 | | | $ | 1.6 | | | $ | 413.1 | |
| Less: Legally enforceable master netting agreements | | | | | | | (332.5) | | | | | | | (332.5) | |
| Less: Cash collateral received/paid | | | | | | | (41.3) | | | | | | | (38.9) | |
| Total derivative assets/liabilities | | | | | | | $ | 44.3 | | | | | | | $ | 41.7 | |
(1)Represents the total contract/notional amount of derivative assets and liabilities outstanding.
(2)The net derivative asset (liability) and notional amount of written credit derivatives for which the Corporation held purchased credit derivatives with identical underlying referenced names were $217 million and $332.6 billion at September 30, 2020.
|
| | | | | | | | | | | | | | | | | | | | | | | | | | | |
| | | | | | | | | | | | | | |
| | | | September 30, 2017 |
| | | | Gross Derivative Assets | | Gross Derivative Liabilities |
| (Dollars in billions) | Contract/ Notional (1) | | Trading and Other Risk Management Derivatives | | Qualifying
Accounting Hedges | | Total | | Trading and Other Risk Management Derivatives | | Qualifying
Accounting Hedges | | Total |
| Interest rate contracts | |
| | |
| | |
| | |
| | |
| | |
| | |
|
Swaps (2) | $ | 18,602.5 |
| | $ | 179.5 |
| | $ | 5.1 |
| | $ | 184.6 |
| | $ | 176.7 |
| | $ | 1.3 |
| | $ | 178.0 |
|
Futures and forwards (2) | 5,957.2 |
| | 0.9 |
| | — |
| | 0.9 |
| | 0.8 |
| | — |
| | 0.8 |
|
| Written options | 1,467.4 |
| | — |
| | — |
| | — |
| | 36.3 |
| | — |
| | 36.3 |
|
| Purchased options | 1,390.7 |
| | 38.5 |
| | — |
| | 38.5 |
| | — |
| | — |
| | — |
|
| Foreign exchange contracts | | | | | |
| | |
| | |
| | |
| | |
|
| Swaps | 2,011.9 |
| | 36.6 |
| | 2.5 |
| | 39.1 |
| | 37.0 |
| | 3.1 |
| | 40.1 |
|
| Spot, futures and forwards | 4,313.6 |
| | 46.6 |
| | 0.9 |
| | 47.5 |
| | 46.9 |
| | 0.8 |
| | 47.7 |
|
| Written options | 367.3 |
| | — |
| | — |
| | — |
| | 5.7 |
| | — |
| | 5.7 |
|
| Purchased options | 335.7 |
| | 5.2 |
| | — |
| | 5.2 |
| | — |
| | — |
| | — |
|
| Equity contracts | | | |
| | |
| | |
| | |
| | |
| | |
|
| Swaps | 236.2 |
| | 4.6 |
| | — |
| | 4.6 |
| | 4.6 |
| | — |
| | 4.6 |
|
| Futures and forwards | 100.9 |
| | 1.9 |
| | — |
| | 1.9 |
| | 1.2 |
| | — |
| | 1.2 |
|
| Written options | 524.9 |
| | — |
| | — |
| | — |
| | 25.1 |
| | — |
| | 25.1 |
|
| Purchased options | 467.0 |
| | 25.2 |
| | — |
| | 25.2 |
| | — |
| | — |
| | — |
|
| Commodity contracts | |
| | |
| | |
| | |
| | |
| | |
| | |
|
| Swaps | 47.6 |
| | 1.7 |
| | — |
| | 1.7 |
| | 4.2 |
| | — |
| | 4.2 |
|
| Futures and forwards | 51.5 |
| | 3.5 |
| | — |
| | 3.5 |
| | 0.6 |
| | — |
| | 0.6 |
|
| Written options | 25.0 |
| | — |
| | — |
| | — |
| | 1.2 |
| | — |
| | 1.2 |
|
| Purchased options | 26.1 |
| | 1.4 |
| | — |
| | 1.4 |
| | — |
| | — |
| | — |
|
Credit derivatives (3) | |
| | |
| | |
| | |
| | |
| | |
| | |
|
| Purchased credit derivatives: | |
| | |
| | |
| | | | |
| | |
| | |
Credit default swaps (2) | 522.8 |
| | 4.8 |
| | — |
| | 4.8 |
| | 11.2 |
| | — |
| | 11.2 |
|
| Total return swaps/other | 57.6 |
| | 0.1 |
| | — |
| | 0.1 |
| | 1.3 |
| | — |
| | 1.3 |
|
| Written credit derivatives: |
|
| |
|
| | |
| |
|
| |
|
| | |
| |
|
|
Credit default swaps (2) | 514.5 |
| | 10.9 |
| | — |
| | 10.9 |
| | 4.2 |
| | — |
| | 4.2 |
|
| Total return swaps/other | 55.3 |
| | 0.8 |
| | — |
| | 0.8 |
| | 0.2 |
| | — |
| | 0.2 |
|
| Gross derivative assets/liabilities | | | $ | 362.2 |
| | $ | 8.5 |
| | $ | 370.7 |
| | $ | 357.2 |
| | $ | 5.2 |
| | $ | 362.4 |
|
Less: Legally enforceable master netting agreements (2) | |
| | |
| | |
| | (296.7 | ) | | |
| | |
| | (296.7 | ) |
Less: Cash collateral received/paid (2) | |
| | |
| | |
| | (35.6 | ) | | |
| | |
| | (33.9 | ) |
| Total derivative assets/liabilities | |
| | |
| | |
| | $ | 38.4 |
| | |
| | |
| | $ | 31.8 |
|
| | | | | | | | |
(1)
| Represents the total contract/notional amount of derivative assets and liabilities outstanding. |
| |
(2)
| Derivative assets and liabilities reflect the effectsBank of contractual amendments by two central clearing counterparties to legally re-characterize daily cash variation margin from collateral, which secures an outstanding exposure, to settlement, which discharges an outstanding exposure. One of these central clearing counterparties amended its governing documents, which became effective in January 2017. In addition, the Corporation elected to transfer its existing positions to the settlement platform for the other central clearing counterparty in September 2017.America 60
|
| |
(3)
| The net derivative asset and notional amount of written credit derivatives for which the Corporation held purchased credit derivatives with identical underlying referenced names were $6.2 billion and $494.1 billion at September 30, 2017.
|
| | | | | | | | | | | | | | | | | |
| | | | December 31, 2016 | | December 31, 2019 |
| | | | Gross Derivative Assets | | Gross Derivative Liabilities | | Gross Derivative Assets | | Gross Derivative Liabilities |
| (Dollars in billions) | Contract/ Notional (1) | | Trading and Other Risk Management Derivatives | | Qualifying
Accounting Hedges | | Total | | Trading and Other Risk Management Derivatives | | Qualifying
Accounting Hedges | | Total | (Dollars in billions) | Contract/ Notional (1) | | Trading and Other Risk Management Derivatives | | Qualifying
Accounting
Hedges | | Total | | Trading and Other Risk Management Derivatives | | Qualifying
Accounting
Hedges | | Total |
| Interest rate contracts | |
| | |
| | |
| | |
| | |
| | |
| | |
| Interest rate contracts | | | | | | | | | | | | | |
| Swaps | $ | 16,977.7 |
| | $ | 385.0 |
| | $ | 5.9 |
| | $ | 390.9 |
| | $ | 386.9 |
| | $ | 2.0 |
| | $ | 388.9 |
| Swaps | $ | 15,074.4 | | | $ | 162.0 | | | $ | 9.7 | | | $ | 171.7 | | | $ | 168.5 | | | $ | 0.4 | | | $ | 168.9 | |
| Futures and forwards | 5,609.5 |
| | 2.2 |
| | — |
| | 2.2 |
| | 2.1 |
| | — |
| | 2.1 |
| Futures and forwards | 3,279.8 | | | 1.0 | | | 0 | | | 1.0 | | | 1.0 | | | 0 | | | 1.0 | |
| Written options | 1,146.2 |
| | — |
| | — |
| | — |
| | 52.2 |
| | — |
| | 52.2 |
| Written options | 1,767.7 | | | 0 | | | 0 | | | 0 | | | 32.5 | | | 0 | | | 32.5 | |
| Purchased options | 1,178.7 |
| | 53.3 |
| | — |
| | 53.3 |
| | — |
| | — |
| | — |
| Purchased options | 1,673.6 | | | 37.4 | | | 0 | | | 37.4 | | | 0 | | | 0 | | | 0 | |
| Foreign exchange contracts | | | |
| | |
| | |
| | |
| | |
| | |
| Foreign exchange contracts | | | | | | | | | | | | |
| Swaps | 1,828.6 |
| | 54.6 |
| | 4.2 |
| | 58.8 |
| | 58.8 |
| | 6.2 |
| | 65.0 |
| Swaps | 1,657.7 | | | 30.3 | | | 0.7 | | | 31.0 | | | 31.7 | | | 0.9 | | | 32.6 | |
| Spot, futures and forwards | 3,410.7 |
| | 58.8 |
| | 1.7 |
| | 60.5 |
| | 56.6 |
| | 0.8 |
| | 57.4 |
| Spot, futures and forwards | 3,792.7 | | | 35.9 | | | 0.1 | | | 36.0 | | | 38.7 | | | 0.3 | | | 39.0 | |
| Written options | 356.6 |
| | — |
| | — |
| | — |
| | 9.4 |
| | — |
| | 9.4 |
| Written options | 274.3 | | | 0 | | | 0 | | | 0 | | | 3.8 | | | 0 | | | 3.8 | |
| Purchased options | 342.4 |
| | 8.9 |
| | — |
| | 8.9 |
| | — |
| | — |
| | — |
| Purchased options | 261.6 | | | 4.0 | | | 0 | | | 4.0 | | | 0 | | | 0 | | | 0 | |
| Equity contracts | |
| | |
| | |
| | |
| | |
| | |
| | |
| Equity contracts | | | | | | | | | | | | | |
| Swaps | 189.7 |
| | 3.4 |
| | — |
| | 3.4 |
| | 4.0 |
| | — |
| | 4.0 |
| Swaps | 315.0 | | | 6.5 | | | 0 | | | 6.5 | | | 8.1 | | | 0 | | | 8.1 | |
| Futures and forwards | 68.7 |
| | 0.9 |
| | — |
| | 0.9 |
| | 0.9 |
| | — |
| | 0.9 |
| Futures and forwards | 125.1 | | | 0.3 | | | 0 | | | 0.3 | | | 1.1 | | | 0 | | | 1.1 | |
| Written options | 431.5 |
| | — |
| | — |
| | — |
| | 21.4 |
| | — |
| | 21.4 |
| Written options | 731.1 | | | 0 | | | 0 | | | 0 | | | 34.6 | | | 0 | | | 34.6 | |
| Purchased options | 385.5 |
| | 23.9 |
| | — |
| | 23.9 |
| | — |
| | — |
| | — |
| Purchased options | 668.6 | | | 42.4 | | | 0 | | | 42.4 | | | 0 | | | 0 | | | 0 | |
| Commodity contracts | |
| | |
| | |
| | |
| | |
| | |
| | |
| Commodity contracts | | | | | | | | | | | | | |
| Swaps | 48.2 |
| | 2.5 |
| | — |
| | 2.5 |
| | 5.1 |
| | — |
| | 5.1 |
| Swaps | 42.0 | | | 2.1 | | | 0 | | | 2.1 | | | 4.4 | | | 0 | | | 4.4 | |
| Futures and forwards | 49.1 |
| | 3.6 |
| | — |
| | 3.6 |
| | 0.5 |
| | — |
| | 0.5 |
| Futures and forwards | 61.3 | | | 1.7 | | | 0 | | | 1.7 | | | 0.4 | | | 0 | | | 0.4 | |
| Written options | 29.3 |
| | — |
| | — |
| | — |
| | 1.9 |
| | — |
| | 1.9 |
| Written options | 33.2 | | | 0 | | | 0 | | | 0 | | | 1.4 | | | 0 | | | 1.4 | |
| Purchased options | 28.9 |
| | 2.0 |
| | — |
| | 2.0 |
| | — |
| | — |
| | — |
| Purchased options | 37.9 | | | 1.4 | | | 0 | | | 1.4 | | | 0 | | | 0 | | | 0 | |
Credit derivatives (2) | |
| | |
| | |
| | |
| | |
| | |
| | |
| Credit derivatives (2) | | | | | | | | | | | | | |
| Purchased credit derivatives: | |
| | |
| | |
| | |
| | |
| | |
| | |
| Purchased credit derivatives: | | | | | | | | | | | | | |
| Credit default swaps | 604.0 |
| | 8.1 |
| | — |
| | 8.1 |
| | 10.3 |
| | — |
| | 10.3 |
| Credit default swaps | 321.6 | | | 2.7 | | | 0 | | | 2.7 | | | 5.6 | | | 0 | | | 5.6 | |
| Total return swaps/other | 21.2 |
| | 0.4 |
| | — |
| | 0.4 |
| | 1.5 |
| | — |
| | 1.5 |
| |
| Total return swaps/options | | Total return swaps/options | 86.6 | | | 0.4 | | | 0 | | | 0.4 | | | 1.3 | | | 0 | | | 1.3 | |
| Written credit derivatives: | |
| | |
| | |
| | |
| | | | |
| | |
| Written credit derivatives: | | | | | | | | | | | |
| Credit default swaps | 614.4 |
| | 10.7 |
| | — |
| | 10.7 |
| | 7.5 |
| | — |
| | 7.5 |
| Credit default swaps | 300.2 | | | 5.4 | | | 0 | | | 5.4 | | | 2.0 | | | 0 | | | 2.0 | |
| Total return swaps/other | 25.4 |
| | 1.0 |
| | — |
| | 1.0 |
| | 0.2 |
| | — |
| | 0.2 |
| |
| Total return swaps/options | | Total return swaps/options | 86.2 | | | 0.8 | | | 0 | | | 0.8 | | | 0.4 | | | 0 | | | 0.4 | |
| Gross derivative assets/liabilities | |
| | $ | 619.3 |
| | $ | 11.8 |
| | $ | 631.1 |
| | $ | 619.3 |
| | $ | 9.0 |
| | $ | 628.3 |
| Gross derivative assets/liabilities | | | $ | 334.3 | | | $ | 10.5 | | | $ | 344.8 | | | $ | 335.5 | | | $ | 1.6 | | | $ | 337.1 | |
| Less: Legally enforceable master netting agreements | |
| | |
| | |
| | (545.3 | ) | | |
| | |
| | (545.3 | ) | Less: Legally enforceable master netting agreements | | | | | | | (270.4) | | | | | | | (270.4) | |
| Less: Cash collateral received/paid | |
| | |
| | |
| | (43.3 | ) | | |
| | |
| | (43.5 | ) | Less: Cash collateral received/paid | | | | | | | (33.9) | | | | | | | (28.5) | |
| Total derivative assets/liabilities | |
| | |
| | |
| | $ | 42.5 |
| | |
| | |
| | $ | 39.5 |
| Total derivative assets/liabilities | | | | | | | $ | 40.5 | | | | | | | $ | 38.2 | |
| |
(1)(1)Represents the total contract/notional amount of derivative assets and liabilities outstanding. (2)The net derivative asset (liability) and notional amount of written credit derivatives for which the Corporation held purchased credit derivatives with identical underlying referenced names were $2.8 billion and $309.7 billion at December 31, 2019. | Represents the total contract/notional amount of derivative assets and liabilities outstanding. |
| |
(2)
| The net derivative asset and notional amount of written credit derivatives for which the Corporation held purchased credit derivatives with identical underlying referenced names were $2.2 billion and $548.9 billion at December 31, 2016.
|
Offsetting of Derivatives
The Corporation enters into International Swaps and Derivatives Association, Inc. (ISDA) master netting agreements or similar agreements with substantially all of the Corporation’s derivative counterparties. Where legally enforceable, these master netting agreements give the Corporation, in the event of default by the counterparty, the right to liquidate securities held as collateral and to offset receivables and payables with the same counterparty. For additionalmore information, on the offsetting of derivative assets and liabilities, see Note 23 – Derivatives to the Consolidated Financial Statementsof the Corporation's 2016Corporation’s 2019 Annual Report on Form 10-K.10-K.
The following table presents derivative instruments included in derivative assets and liabilities on the Consolidated Balance Sheet at September 30, 20172020 and December 31, 20162019 by primary risk (e.g., interest rate risk) and the platform, where
applicable, on which these derivatives are transacted. Balances are presented on a gross basis, prior to the application of counterparty and cash collateral netting. Total gross derivative assets and liabilities are adjusted on an aggregate basis to take into consideration the effects of legally enforceable master netting agreements which includesinclude reducing the balance for counterparty netting and cash collateral received or paid.
For more information on offsetting of securities financing agreements, see Note 9 – Federal Funds Sold or Purchased, Securities Financing Agreements, and Short-term Borrowings and Restricted Cash.
| | | | | | | | | | | |
Offsetting of Derivatives (1) | | | | | | | | Offsetting of Derivatives (1) | |
| | September 30, 2017 | | December 31, 2016 | |
| | | Derivative
Assets | | Derivative Liabilities | | Derivative
Assets | | Derivative Liabilities |
| (Dollars in billions) | Derivative Assets | | Derivative Liabilities | | Derivative Assets | | Derivative Liabilities | (Dollars in billions) | September 30, 2020 | | December 31, 2019 |
| Interest rate contracts | |
| | |
| | |
| | |
| Interest rate contracts | | | | | | | |
| Over-the-counter | $ | 219.1 |
| | $ | 211.3 |
| | $ | 267.3 |
| | $ | 258.2 |
| Over-the-counter | $ | 260.6 | | | $ | 253.1 | | | $ | 203.1 | | | $ | 196.6 | |
Over-the-counter cleared (2) | 2.3 |
| | 2.3 |
| | 177.2 |
| | 182.8 |
| |
| Exchange-traded | | Exchange-traded | 0.1 | | | 0.1 | | | 0.1 | | | 0.1 | |
| Over-the-counter cleared | | Over-the-counter cleared | 9.5 | | | 8.7 | | | 6.0 | | | 5.3 | |
| Foreign exchange contracts | | | | | | | | Foreign exchange contracts | |
| Over-the-counter | 88.2 |
| | 90.7 |
| | 124.3 |
| | 126.7 |
| Over-the-counter | 69.3 | | | 73.5 | | | 69.2 | | | 73.1 | |
| Over-the-counter cleared | 0.7 |
| | 0.6 |
| | 0.3 |
| | 0.3 |
| Over-the-counter cleared | 1.1 | | | 1.0 | | | 0.5 | | | 0.5 | |
| Equity contracts | | | | | | | | Equity contracts | |
| Over-the-counter | 18.3 |
| | 17.3 |
| | 15.6 |
| | 13.7 |
| Over-the-counter | 26.0 | | | 22.3 | | | 21.3 | | | 17.8 | |
| Exchange-traded | 9.5 |
| | 9.7 |
| | 11.4 |
| | 10.8 |
| Exchange-traded | 31.9 | | | 32.2 | | | 26.4 | | | 22.8 | |
| Commodity contracts | | | | | | | | Commodity contracts | |
| Over-the-counter | 2.7 |
| | 4.0 |
| | 3.7 |
| | 4.9 |
| Over-the-counter | 5.0 | | | 5.3 | | | 2.8 | | | 4.2 | |
| Exchange-traded | 0.7 |
| �� | 0.6 |
| | 1.1 |
| | 1.0 |
| Exchange-traded | 1.0 | | | 1.1 | | | 0.8 | | | 0.8 | |
| Over-the-counter cleared | | Over-the-counter cleared | 0 | | | 0 | | | 0 | | | 0.1 | |
| Credit derivatives | | | | | | | | Credit derivatives | |
| Over-the-counter | 10.1 |
| | 10.5 |
| | 15.3 |
| | 14.7 |
| Over-the-counter | 6.8 | | | 7.1 | | | 6.4 | | | 6.6 | |
Over-the-counter cleared (2) | 6.1 |
| | 6.0 |
| | 4.3 |
| | 4.3 |
| |
| Over-the-counter cleared | | Over-the-counter cleared | 2.6 | | | 2.3 | | | 2.5 | | | 2.2 | |
| Total gross derivative assets/liabilities, before netting | | | | | | | | Total gross derivative assets/liabilities, before netting | |
| Over-the-counter | 338.4 |
| | 333.8 |
| | 426.2 |
| | 418.2 |
| Over-the-counter | 367.7 | | | 361.3 | | | 302.8 | | | 298.3 | |
| Exchange-traded | 10.2 |
| | 10.3 |
| | 12.5 |
| | 11.8 |
| Exchange-traded | 33.0 | | | 33.4 | | | 27.3 | | | 23.7 | |
Over-the-counter cleared (2) | 9.1 |
| | 8.9 |
| | 181.8 |
| | 187.4 |
| |
| Over-the-counter cleared | | Over-the-counter cleared | 13.2 | | | 12.0 | | | 9.0 | | | 8.1 | |
| Less: Legally enforceable master netting agreements and cash collateral received/paid | | | | | | | | Less: Legally enforceable master netting agreements and cash collateral received/paid | |
| Over-the-counter | (314.9 | ) | | (312.8 | ) | | (398.2 | ) | | (392.6 | ) | Over-the-counter | (332.6) | | | (330.8) | | | (274.7) | | | (269.3) | |
| Exchange-traded | (9.2 | ) | | (9.2 | ) | | (8.9 | ) | | (8.9 | ) | Exchange-traded | (28.9) | | | (28.9) | | | (21.5) | | | (21.5) | |
Over-the-counter cleared (2) | (8.2 | ) | | (8.6 | ) | | (181.5 | ) | | (187.3 | ) | |
| Over-the-counter cleared | | Over-the-counter cleared | (12.3) | | | (11.7) | | | (8.1) | | | (8.1) | |
| Derivative assets/liabilities, after netting | 25.4 |
| | 22.4 |
| | 31.9 |
| | 28.6 |
| Derivative assets/liabilities, after netting | 40.1 | | | 35.3 | | | 34.8 | | | 31.2 | |
Other gross derivative assets/liabilities (3) | 13.0 |
| | 9.4 |
| | 10.6 |
| | 10.9 |
| |
Other gross derivative assets/liabilities (2) | | Other gross derivative assets/liabilities (2) | 4.2 | | | 6.4 | | | 5.7 | | | 7.0 | |
| Total derivative assets/liabilities | 38.4 |
| | 31.8 |
| | 42.5 |
| | 39.5 |
| Total derivative assets/liabilities | 44.3 | | | 41.7 | | | 40.5 | | | 38.2 | |
Less: Financial instruments collateral (4) | (11.3 | ) | | (9.6 | ) | | (13.5 | ) | | (10.5 | ) | |
Less: Financial instruments collateral (3) | | Less: Financial instruments collateral (3) | (15.8) | | | (16.4) | | | (14.6) | | | (16.1) | |
| Total net derivative assets/liabilities | $ | 27.1 |
| | $ | 22.2 |
| | $ | 29.0 |
| | $ | 29.0 |
| Total net derivative assets/liabilities | $ | 28.5 | | | $ | 25.3 | | | $ | 25.9 | | | $ | 22.1 | |
| |
(1)(1)Over-the-counter derivatives include bilateral transactions between the Corporation and a particular counterparty. Over-the-counter-cleared derivatives include bilateral transactions between the Corporation and a counterparty where the transaction is cleared through a clearinghouse. Exchange-traded derivatives include listed options transacted on an exchange. (2)Consists of derivatives entered into under master netting agreements where the enforceability of these agreements is uncertain under bankruptcy laws in some countries or industries. (3)Amounts are limited to the derivative asset/liability balance and, accordingly, do not include excess collateral received/pledged. Financial instruments collateral includes securities collateral received or pledged and cash securities held and posted at third-party custodians that are not offset on the Consolidated Balance Sheet but shown as a reduction to derive net derivative assets and liabilities. | Over-the-counter (OTC) derivatives include bilateral transactions between the Corporation and a particular counterparty. OTC-cleared derivatives include bilateral transactions between the Corporation and a counterparty where the transaction is cleared through a clearinghouse, and exchange-traded derivatives include listed options transacted on an exchange. |
| |
(2)
| Derivative assets and liabilities reflect the effects of contractual amendments by two central clearing counterparties to legally re-characterize daily cash variation margin from collateral, which secures an outstanding exposure, to settlement, which discharges an outstanding exposure. One of these central clearing counterparties amended its governing documents, which became effective in January 2017. In addition, the Corporation elected to transfer its existing positions to the settlement platform for the other central clearing counterparty in September 2017.
|
| |
(3)
| Consists of derivatives entered into under master netting agreements where the enforceability of these agreements is uncertain under bankruptcy laws in some countries or industries. |
| |
(4)
| Amounts are limited to the derivative asset/liability balance and, accordingly, do not include excess collateral received/pledged. Financial instruments collateral includes securities collateral received or pledged and cash securities held and posted at third-party custodians that are not offset on the Consolidated Balance Sheet but shown as a reduction to derive net derivative assets and liabilities. |
ALM and Risk Management Derivatives
The Corporation’s asset and liability management (ALM) and risk management activities include the use of derivatives to mitigate risk to the Corporation including derivatives designated in qualifying hedge accounting relationships and derivatives used in other risk management activities. For additionalmore information on ALM and risk management derivatives, see Note 23 – Derivatives to the Consolidated Financial Statements of the Corporation's 2016Corporation’s 2019 Annual Report on Form 10-K.
Derivatives Designated as Accounting Hedges
The Corporation uses various types of interest rate commodity and foreign exchange derivative contracts to protect against changes in the fair value of its assets and liabilities due to fluctuations in
interest rates commodity prices and exchange rates (fair value hedges). The Corporation also uses these types of contracts and equity derivatives to protect against changes in the cash flows of its assets and liabilities, and other forecasted transactions (cash flow hedges). The Corporation hedges its net investment in consolidated non-U.S. operations determined to
have functional currencies other than the U.S. dollar using forward exchange contracts and cross-currency basis swaps, and by issuing foreign currency-denominated debt (net investment hedges).
Fair Value Hedges
The following table summarizes information related to fair value hedges for the three and nine months ended September 30, 20172020 and 2016, including hedges2019.
| | | | | | | | | | | | | | | | | | | | | | | | | | | | | | | | | | | | | |
| | | | | | | | | | | | | | | | | | | | | |
| Gains and Losses on Derivatives Designated as Fair Value Hedges | | | | | | |
| | | | | | | | | | | | | | | | | | | | | |
| Three Months Ended September 30, 2020 | | | | Three Months Ended September 30, 2019 | | | | | | | | | | | | |
| | | | | | | | | | | | | | | | | |
| (Dollars in millions) | Derivative | | Hedged Item | | | | Derivative | | Hedged Item | | | | |
| | | | | | | | | | | | | | | | | |
Interest rate risk on long-term debt (1) | $ | (1,523) | | | $ | 1,473 | | | | | $ | 3,328 | | | $ | (3,342) | | | | | | | | | | | | | |
Interest rate and foreign currency risk on long-term debt (2) | 79 | | | (87) | | | | | (110) | | | 111 | | | | | | | | | | | | | |
Interest rate risk on available-for-sale securities (3) | 139 | | | (139) | | | | | (33) | | | 30 | | | | | | | | | | | | | |
| | | | | | | | | | | | | | | | | | | | | |
| Total | $ | (1,305) | | | $ | 1,247 | | | | | $ | 3,185 | | | $ | (3,201) | | | | | | | | | | | | | |
| | | | | | | | | | | | | | | | | | | | | |
| Nine Months Ended September 30, 2020 | | | | Nine Months Ended September 30, 2019 | | | | | | | | | | | |
| Derivative | | Hedged Item | | | | Derivative | | Hedged Item | | | | | | | | | | | | |
Interest rate risk on long-term debt (1) | $ | 9,286 | | | $ | (9,403) | | | | | $ | 9,373 | | | $ | (9,392) | | | | | | | | | | | | | |
Interest rate and foreign currency risk on long-term debt (2) | 644 | | | (638) | | | | | (12) | | | 31 | | | | | | | | | | | | | |
Interest rate risk on available-for-sale securities (3) | (572) | | | 559 | | | | | (133) | | | 128 | | | | | | | | | | | | | |
| | | | | | | | | | | | | | | | | | | | | |
| Total | $ | 9,358 | | | $ | (9,482) | | | | | $ | 9,228 | | | $ | (9,233) | | | | | | | | | | | | | |
(1)Amounts are recorded in interest expense in the Consolidated Statement of Income.
(2)For the three and nine months ended September 30, 2020, the derivative amount includes gains (losses) of $(13) million and $718 million in interest rate riskexpense, $95 million and $(83) million in market making and similar activities, and $(3) million and $9 million in accumulated OCI. For the same periods in 2019, the derivative amount includes gains (losses) of $(59) million and $108 million in interest expense, $(53) million and $(142) million in market making and similar activities, and $2 million and $22 million in accumulated OCI. Line item totals are in the Consolidated Statement of Income and on the Consolidated Balance Sheet.
(3)Amounts are recorded in interest income in the Consolidated Statement of Income.
The table below summarizes the carrying value of hedged assets and liabilities that are designated and qualifying in fair value hedging relationships along with the cumulative amount of fair value hedging adjustments included in the carrying value that have been recorded in the current hedging relationships. These fair value hedging adjustments are open basis adjustments that are not subject to amortization as long as the hedging relationship remains designated.
| | | | | | | | | | | | | | | | | | | | | | | | | | | | |
| | | | | | | | | | | | |
| Designated Fair Value Hedged Assets (Liabilities) | |
| | | | | | | | | | | | |
| September 30, 2020 | | December 31, 2019 | | | | | |
| (Dollars in millions) | Carrying Value | | Cumulative Fair Value Adjustments (1) | | Carrying Value | | Cumulative Fair Value Adjustments (1) | | | | | |
| | | | | | | | |
Long-term debt (2) | $ | (126,852) | | | $ | (12,071) | | | $ | (162,389) | | | $ | (8,685) | | | | | | |
Available-for-sale debt securities (2, 3, 4) | 102,474 | | | 566 | | | 1,654 | | | 64 | | | | | | |
| | | | | | | | | | | | |
| |
| | | | | | | | | | | | |
| | | | | | |
| | | | | | |
| | | | | | | | | | | | |
| | | | | | | | | | | | |
| | | | | | | | | | | | |
(1)For assets, increase (decrease) to carrying value and for liabilities, (increase) decrease to carrying value.
(2)At September 30, 2020, the cumulative fair value adjustments remaining on long-term debt that were acquired as partand AFS debt securities from discontinued hedging relationships resulted in an increase in the related liability of $1.3 billion and a business combinationdecrease in the related asset of $6 million compared to a decrease in the related liability of $1.3 billion and redesignatedan increase in the related asset of $8 million at that time. At redesignation,December 31, 2019, which are being amortized over the fair valueremaining contractual life of the derivativesde-designated hedged items.
(3)These amounts include the amortized cost basis of the prepayable financial assets used to designate hedging relationships in which the hedged item is the last layer expected to be remaining at the end of the hedging relationship. At September 30, 2020, the amortized cost of the closed portfolios used in these hedging relationships was positive. As the derivatives mature, the fair value will approach zero. As a result, ineffectiveness will occur and the fair value changes$40.2 billion, of which $8.4 billion was designated in the derivatives and the long-term debt being hedged may be directionally the same in certain scenarios. Based on a regression analysis, the derivatives continue to be highly effective at offsetting changes in the fairhedging relationship. The cumulative basis adjustments associated with these hedging relationships totaled $33 million.
(4)Carrying value of the long-term debt attributable to interest rate risk.represents amortized cost.
|
| | | | | | | | | | | | | | | | | | | | | | | |
| | | |
| Derivatives Designated as Fair Value Hedges | | | | | | | | | | | |
| | | | | | | | | | | | |
| Gains (Losses) | Three Months Ended September 30, 2017 | | Nine Months Ended September 30, 2017 |
| (Dollars in millions) | Derivative | | Hedged
Item | | Hedge
Ineffectiveness | | Derivative | | Hedged
Item | | Hedge
Ineffectiveness |
Interest rate risk on long-term debt (1) | $ | (273 | ) | | $ | 169 |
| | $ | (104 | ) | | $ | (751 | ) | | $ | 313 |
| | $ | (438 | ) |
Interest rate and foreign currency risk on long-term debt (1) | 607 |
| | (593 | ) | | 14 |
| | 1,631 |
| | (1,603 | ) | | 28 |
|
Interest rate risk on available-for-sale securities (2) | (8 | ) | | 7 |
| | (1 | ) | | (71 | ) | | 40 |
| | (31 | ) |
Price risk on commodity inventory (3) | — |
| | (1 | ) | | (1 | ) | | 8 |
| | (8 | ) | | — |
|
| Total | $ | 326 |
| | $ | (418 | ) | | $ | (92 | ) | | $ | 817 |
| | $ | (1,258 | ) | | $ | (441 | ) |
| | | | | | | | | | | | |
| | Three Months Ended September 30, 2016 | | Nine Months Ended September 30, 2016 |
Interest rate risk on long-term debt (1) | $ | (758 | ) | | $ | 580 |
| | $ | (178 | ) | | $ | 3,166 |
| | $ | (3,654 | ) | | $ | (488 | ) |
Interest rate and foreign currency risk on long-term debt (1) | 16 |
| | (10 | ) | | 6 |
| | 360 |
| | (369 | ) | | (9 | ) |
Interest rate risk on available-for-sale securities (2) | 235 |
| | (250 | ) | | (15 | ) | | (131 | ) | | 80 |
| | (51 | ) |
Price risk on commodity inventory (3) | 6 |
| | (6 | ) | | — |
| | — |
| | — |
| | — |
|
| Total | $ | (501 | ) | | $ | 314 |
| | $ | (187 | ) | | $ | 3,395 |
| | $ | (3,943 | ) | | $ | (548 | ) |
| |
(1)
| Amounts are recorded in interest expense on long-term debt and in other income. |
| |
(2)
| Amounts are recorded in interest income on debt securities. |
| |
(3)
| Amounts relating to commodity inventory are recorded in trading account profits. |
Cash Flow and Net Investment Hedges
The following table below summarizes certain information related to cash flow hedges and net investment hedges for the three and nine months ended September 30, 20172020 and 2016.2019. Of the $739$408 million after-tax net lossgain ($1.2 billion pre-tax)542 million pretax) on derivatives in accumulated other comprehensive income (OCI)OCI at September 30, 2017, $1022020, gains of $191 million after-tax ($164252 million pre-tax) ispretax) related to open cash flow hedges are expected to be reclassified into earnings
in the next 12 months. These net
losses gains reclassified into earnings are expected to primarily reduceincrease net interest income related to the respective hedged items. Amounts related to price risk on restricted stock awards reclassified from accumulated OCI are recorded in personnel expense. For terminated cash flow hedges, the time period over which the majority of the forecasted transactions are hedged is approximately seven3 years, with a maximum length of time for certain forecasted transactions of 1916 years.
| | | | | | | | | | | | | | | | | | | | | | | | | | | | | | | | | | | | | | | | |
| | | | | | | | | | | | | | | | | | | | | | | | |
| Gains and Losses on Derivatives Designated as Cash Flow and Net Investment Hedges | | | |
| | | | | | | | | | | | | | | | | | | | | | | | |
| | | | | | | | | | |
| | | | | | | | | | | | | | | | | | | | |
| | | | | Gains (Losses) Recognized in
Accumulated OCI
on Derivatives | | Gains (Losses)
in Income
Reclassified from Accumulated OCI | | Gains (Losses) Recognized in
Accumulated OCI
on Derivatives | | Gains (Losses)
in Income
Reclassified from Accumulated OCI | | | | | | | | | | | | | |
| (Dollars in millions, amounts pretax) | | | | | Three Months Ended September 30, 2020 | | Nine Months Ended September 30, 2020 | | | | | | | | | | | | | |
| Cash flow hedges | | | | | | | | | | | | | | | | | | | | | | | | |
Interest rate risk on variable-rate assets (1) | | | | | $ | (101) | | | $ | 5 | | | $ | 810 | | | $ | (44) | | | | | | | | | | | | | | |
Price risk on forecasted MBS purchases (1) | | | | | 184 | | | 3 | | | 184 | | | 3 | | | | | | | | | | | | | | |
Price risk on certain compensation plans (2) | | | | | 32 | | | 5 | | | 23 | | | 5 | | | | | | | | | | | | | | |
| Total | | | | | $ | 115 | | | $ | 13 | | | $ | 1,017 | | | $ | (36) | | | | | | | | | | | | | | |
| Net investment hedges | | | | | | | | | | | | | | | | | | | | | | | | |
Foreign exchange risk (3) | | | | | $ | (703) | | | $ | 0 | | | $ | 265 | | | $ | 1 | | | | | | | | | | | | | | |
| | | | | | | | | | | | | | | | | | | | | | | | |
| | | | | Three Months Ended September 30, 2019 | | Nine Months Ended September 30, 2019 | | | | | | | | | | | | | |
| Cash flow hedges | | | | | | | | | | | | | | | | | | | | | | | | |
Interest rate risk on variable-rate assets (1) | | | | | $ | 125 | | | $ | (27) | | | $ | 743 | | | $ | (78) | | | | | | | | | | | | | | |
| | | | | | | | | | | | | | | | | | | | | | | | |
| | | | | | | | | | | | | | | | | | | | | | | | |
| Net investment hedges | | | | | | | | | | | | | | | | | | | | | | | | |
Foreign exchange risk (3) | | | | | $ | 786 | | | $ | 362 | | | $ | 590 | | | $ | 363 | | | | | | | | | | | | | | |
|
| | | | | | | | | | | | | | | | | | | | | | | |
| | | | | | | | | | | | |
| Derivatives Designated as Cash Flow and Net Investment Hedges | | | | | | |
| | | | | | | | | | | | |
| | Three Months Ended September 30, 2017 | | Nine Months Ended September 30, 2017 |
(Dollars in millions, amounts pre-tax) | Gains (Losses)
Recognized in
Accumulated OCI on Derivatives | | Gains (Losses)
in Income
Reclassified from
Accumulated OCI | | Hedge
Ineffectiveness and Amounts Excluded
from Effectiveness
Testing (1) | | Gains (Losses)
Recognized in
Accumulated OCI on Derivatives | | Gains (Losses)
in Income
Reclassified from
Accumulated OCI | | Hedge
Ineffectiveness and Amounts Excluded
from Effectiveness
Testing (1) |
| Cash flow hedges | | | | | | | | | | | |
| Interest rate risk on variable-rate portfolios | $ | 11 |
| | $ | (54 | ) | | $ | (1 | ) | | $ | 38 |
| | $ | (274 | ) | | $ | 4 |
|
Price risk on restricted stock awards (2) | 7 |
| | 32 |
| | — |
| | 41 |
| | 103 |
| | — |
|
| Total | $ | 18 |
| | $ | (22 | ) | | $ | (1 | ) | | $ | 79 |
| | $ | (171 | ) | | $ | 4 |
|
| Net investment hedges | | | | | | | |
| | |
| | |
|
Foreign exchange risk (3) | $ | (427 | ) | | $ | (3 | ) | | $ | (33 | ) | | $ | (1,541 | ) | | $ | 1,811 |
| | $ | (82 | ) |
| | | | | | | | | | | | |
| | Three Months Ended September 30, 2016 | | Nine Months Ended September 30, 2016 |
| Cash flow hedges | | | | | | | | | | | |
| Interest rate risk on variable-rate portfolios | $ | (8 | ) | | $ | (119 | ) | | $ | (4 | ) | | $ | 50 |
| | $ | (447 | ) | | $ | 2 |
|
Price risk on restricted stock awards (2) | 85 |
| | (8 | ) | | — |
| | (114 | ) | | (61 | ) | | — |
|
| Total | $ | 77 |
| | $ | (127 | ) | | $ | (4 | ) | | $ | (64 | ) | | $ | (508 | ) | | $ | 2 |
|
| Net investment hedges | | | | | | | |
| | |
| | |
|
| Foreign exchange risk | $ | 214 |
| | $ | 2 |
| | $ | (68 | ) | | $ | 173 |
| | $ | 3 |
| | $ | (234 | ) |
(2)Amounts reclassified from accumulated OCI are recorded in compensation and benefits expense in the Consolidated Statement of Income.
(3)Amounts reclassified from accumulated OCI are recorded in other income in the Consolidated Statement of Income. For the three and nine months ended September 30, 2020, amounts excluded from effectiveness testing and recognized in market making and similar activities were gains of $10 million and $115 million. For the same periods in 2019, amounts excluded from effectiveness testing and recognized in market making and similar activities were gains of $32 million and $109 million.
| | | | | | | | |
(1)63Bank of America
| Amounts related to cash flow hedges represent hedge ineffectiveness and amounts related to net investment hedges represent amounts excluded from effectiveness testing. | |
| |
(2)
| Gains (losses) recognized in accumulated OCI are primarily related to the change in the Corporation’s stock price for the period. |
| |
(3)
| For the nine months ended September 30, 2017, substantially all of the gains in income reclassified from accumulated OCI were comprised of the gain recognized on derivatives used to hedge the currency risk of the Corporation's net investment in its non-U.S. consumer credit card business, which was sold during the second quarter of 2017. For additional information, see Note 12 – Accumulated Other Comprehensive Income (Loss).
|
Other Risk Management Derivatives
Other risk management derivatives are used by the Corporation to reduce certain risk exposures. These derivatives are not qualifying accounting hedges because either they did not qualify for or were not designated as accounting hedges.exposures by economically hedging various assets and liabilities. The following table below presents gains (losses) on these derivatives for the three and nine months ended September 30, 20172020 and 2016.2019. These gains (losses) are largely offset by the income or expense that is recorded on the hedged item.
| | | | | | | | | | | | | | | | | | | | | | | | | |
| | | | | | | | | |
| Gains and Losses on Other Risk Management Derivatives |
| | | | | | | | | |
| | | | | | | | | |
| Three Months Ended September 30 | | Nine Months Ended September 30 |
| (Dollars in millions) | 2020 | | 2019 | | 2020 | | 2019 | | |
Interest rate risk on mortgage activities (1, 2) | $ | 32 | | | $ | 110 | | | $ | 473 | | | $ | 361 | | | |
Credit risk on loans (2) | (28) | | | (8) | | | (6) | | | (48) | | | |
Interest rate and foreign currency risk on ALM activities (3) | (2,571) | | | 1,576 | | | (2,060) | | | 2,450 | | | |
Price risk on certain compensation plans (4) | 263 | | | (7) | | | 109 | | | 629 | | | |
|
| | | | | | | | | | | | | | | |
| | | | | | | | |
| Other Risk Management Derivatives | | | | | | | |
| | | | | | | | |
| Gains (Losses) | Three Months Ended September 30 | | Nine Months Ended September 30 |
| (Dollars in millions) | 2017 | | 2016 | | 2017 | | 2016 |
Interest rate risk on mortgage banking income (1) | $ | 1 |
| | $ | 57 |
| | $ | 32 |
| | $ | 882 |
|
Credit risk on loans (2) | — |
| | (7 | ) | | (3 | ) | | (103 | ) |
Interest rate and foreign currency risk on ALM activities (3) | 26 |
| | (262 | ) | | (26 | ) | | (1,970 | ) |
Price risk on restricted stock awards (4) | 33 |
| | 199 |
| | 161 |
| | (569 | ) |
| Other | — |
| | — |
| | 5 |
| | 40 |
|
| |
(1)(2)Gains (losses) on these derivatives are recorded in other income. (3)Gains (losses) on these derivatives are recorded in market making and similar activities. (4)Gains (losses) on these derivatives are recorded in compensation and benefits expense. | Net gains on these derivatives are recorded in mortgage banking income as they are used to mitigate the interest rate risk related to mortgage servicing rights (MSRs), interest rate lock commitments (IRLCs) and mortgage loans held-for-sale, all of which are measured at fair value with changes in fair value recorded in mortgage banking income. The net gains on IRLCs related to the origination of mortgage loans that are held-for-sale, which are not included in the table but are considered derivative instruments, were $76 million and $192 million for the three and nine months ended September 30, 2017 compared to $185 million and $514 million for the same periods in 2016.
|
| |
(2)
| Primarily related to derivatives that are economic hedges of credit risk on loans. Net gains (losses) on these derivatives are recorded in other income. |
| |
(3)
| Primarily related to hedges of debt securities carried at fair value and hedges of foreign currency-denominated debt. Gains (losses) on these derivatives and the related hedged items are recorded in other income. |
| |
(4)
| Gains (losses) on these derivatives are recorded in personnel expense. |
Transfers of Financial Assets with Risk Retained through Derivatives
The Corporation enters into certain transactions involving the transfer of financial assets that are accounted for as sales where substantially all of the economic exposure to the transferred financial assets is retained through derivatives (e.g., interest rate and/or credit), but the Corporation does not retain control over the assets transferred. ThroughAt September 30, 20172020 and December 31, 2016,2019, the Corporation had transferred $6.2$5.1 billion and $6.6$5.2 billion of non-U.S. government-guaranteed mortgage-backed
securities (MBS) to a third-party trust and retained economic exposure to the transferred assets through derivative contracts. In connection with these transfers, the Corporation received gross cash proceeds of $6.2$5.1 billion and $6.6$5.2 billion at the transfer dates. At both September 30, 20172020 and December 31, 2016,2019, the fair value of the transferred securities was $6.3$5.2 billion and $5.3 billion. Derivative assets of $44 million and $43 million and liabilities of $5 million and $10 million were recorded at September 30, 2017 and December 31, 2016, and are included in credit derivatives in the derivative instruments table on page 75.
Sales and Trading Revenue
The Corporation enters into trading derivatives to facilitate client transactions and to manage risk exposures arising from trading
account assets and liabilities. It is the Corporation’s policy to include these derivative instruments in its trading activities, which include derivatives and non-derivative cash instruments. The resulting risk from these derivatives is managed on a portfolio basis as part of the Corporation’s Global Markets business segment. For more information on sales and trading revenue, see Note 23 – Derivatives to the Consolidated Financial Statements of the Corporation's 2016Corporation’s 2019 Annual Report on Form 10-K.
The following table, which includes both derivatives and non-derivative cash instruments, identifies the amounts in the respective income statement line items attributable to the Corporation’s sales and trading revenue in Global Markets, categorized by primary risk, for the three and nine months ended September 30, 20172020 and 2016. The difference between total trading account profits in the following table and in the Consolidated Statement of Income represents trading activities in business segments other than Global Markets.2019. This table includes DVAdebit valuation adjustment (DVA) and funding valuation adjustment (FVA) gains (losses). Global Markets results in Note 17 – Business Segment Information are presented on a fully taxable-equivalent (FTE) basis. The following table below is not presented on an FTE basis.
| | | | | | | | | | | | | | | | | | | | | | | | | | | | | | | | | | | | | | | | | | | | | | | |
| | | | | | | | | | | | | | | |
| Sales and Trading Revenue |
| | | | | | | | | | | | | | | |
| Market making and similar activities | | Net Interest
Income | | Other (1) | | Total | | Market making and similar activities | | Net Interest
Income | | Other (1) | | Total |
| | | |
| (Dollars in millions) | Three Months Ended September 30, 2020 | | Nine Months Ended September 30, 2020 |
| Interest rate risk | $ | 65 | | | $ | 576 | | | $ | 58 | | | $ | 699 | | | $ | 2,253 | | | $ | 1,851 | | | $ | 179 | | | $ | 4,283 | |
| Foreign exchange risk | 340 | | | (10) | | | 4 | | | 334 | | | 1,145 | | | (8) | | | (3) | | | 1,134 | |
| Equity risk | 817 | | | (7) | | | 391 | | | 1,201 | | | 2,820 | | | (99) | | | 1,361 | | | 4,082 | |
| Credit risk | 411 | | | 370 | | | 74 | | | 855 | | | 567 | | | 1,239 | | | 250 | | | 2,056 | |
| Other risk | 92 | | | (7) | | | 12 | | | 97 | | | 272 | | | 21 | | | 24 | | | 317 | |
| Total sales and trading revenue | $ | 1,725 | | | $ | 922 | | | $ | 539 | | | $ | 3,186 | | | $ | 7,057 | | | $ | 3,004 | | | $ | 1,811 | | | $ | 11,872 | |
| | | | | | | | | | | | | | | |
| | | | | | | | | | | | | | | |
| Three Months Ended September 30, 2019 | | Nine Months Ended September 30, 2019 |
| Interest rate risk | $ | 30 | | | $ | 477 | | | $ | 212 | | | $ | 719 | | | $ | 659 | | | $ | 1,273 | | | $ | 357 | | | $ | 2,289 | |
| Foreign exchange risk | 313 | | | 16 | | | 12 | | | 341 | | | 954 | | | 50 | | | 28 | | | 1,032 | |
| Equity risk | 907 | | | (121) | | | 366 | | | 1,152 | | | 2,886 | | | (560) | | | 1,161 | | | 3,487 | |
| Credit risk | 273 | | | 451 | | | 140 | | | 864 | | | 1,039 | | | 1,349 | | | 405 | | | 2,793 | |
| Other risk | 57 | | | 11 | | | 12 | | | 80 | | | 83 | | | 58 | | | 40 | | | 181 | |
| Total sales and trading revenue | $ | 1,580 | | | $ | 834 | | | $ | 742 | | | $ | 3,156 | | | $ | 5,621 | | | $ | 2,170 | | | $ | 1,991 | | | $ | 9,782 | |
| | | | | | | | | | | | | | | |
| | | |
| | | | | | | | | | | | | | | |
| | | | | | | | | | | | | | | |
| | | | | | | | | | | | | | | |
| | | | | | | | | | | | | | | |
| | | | | | | | | | | | | | | |
| | | | | | | | | | | | | | | |
(1)Represents amounts in investment and brokerage services and other income that are recorded in Global Markets and included in the definition of sales and trading revenue. Includes investment and brokerage services revenue of $430 million and $1.5 billion for the three and nine months ended September 30, 2020 compared to $410 million and $1.3 billion for the same periods in 2019.
|
| | | | | | | | | | | | | | | | | | | | | | | | | | | | | | | |
| | | | | | | | | | | | | | | | |
| Sales and Trading Revenue | | | | | | | | | | | | | | | |
| | | | | | | | | | | | | | | | |
| | Three Months Ended September 30, 2017 | | Nine Months Ended September 30, 2017 |
| (Dollars in millions) | Trading Account Profits | | Net Interest Income | | Other (1) | | Total | | Trading Account Profits | | Net Interest Income | | Other (1) | | Total |
| Interest rate risk | $ | 441 |
| | $ | 224 |
| | $ | 91 |
| | $ | 756 |
| | $ | 1,115 |
| | $ | 763 |
| | $ | 325 |
| | $ | 2,203 |
|
| Foreign exchange risk | 348 |
| | 2 |
| | (40 | ) | | 310 |
| | 1,063 |
| | (2 | ) | | (119 | ) | | 942 |
|
| Equity risk | 640 |
| | (142 | ) | | 464 |
| | 962 |
| | 2,088 |
| | (372 | ) | | 1,426 |
| | 3,142 |
|
| Credit risk | 251 |
| | 624 |
| | 104 |
| | 979 |
| | 1,200 |
| | 1,886 |
| | 450 |
| | 3,536 |
|
| Other risk | 34 |
| | 8 |
| | 17 |
| | 59 |
| | 168 |
| | 18 |
| | 67 |
| | 253 |
|
| Total sales and trading revenue | $ | 1,714 |
| | $ | 716 |
| | $ | 636 |
| | $ | 3,066 |
| | $ | 5,634 |
| | $ | 2,293 |
| | $ | 2,149 |
| | $ | 10,076 |
|
| | | | | | | | | | | | | | | | |
| | Three Months Ended September 30, 2016 | | Nine Months Ended September 30, 2016 |
| Interest rate risk | $ | 511 |
| | $ | 307 |
| | $ | 83 |
| | $ | 901 |
| | $ | 1,430 |
| | $ | 1,073 |
| | $ | 210 |
| | $ | 2,713 |
|
| Foreign exchange risk | 319 |
| | (4 | ) | | (39 | ) | | 276 |
| | 1,003 |
| | (7 | ) | | (112 | ) | | 884 |
|
| Equity risk | 463 |
| | 31 |
| | 467 |
| | 961 |
| | 1,481 |
| | 15 |
| | 1,573 |
| | 3,069 |
|
| Credit risk | 598 |
| | 634 |
| | 123 |
| | 1,355 |
| | 1,224 |
| | 1,895 |
| | 380 |
| | 3,499 |
|
| Other risk | 43 |
| | 7 |
| | 8 |
| | 58 |
| | 263 |
| | (19 | ) | | 34 |
| | 278 |
|
| Total sales and trading revenue | $ | 1,934 |
| | $ | 975 |
| | $ | 642 |
| | $ | 3,551 |
| | $ | 5,401 |
| | $ | 2,957 |
| | $ | 2,085 |
| | $ | 10,443 |
|
| | | | | | | | |
(1)
| | Represents amounts in investment and brokerage services and other income that are recorded in Global Markets and included in the definitionBank of sales and trading revenue. Includes investment and brokerage services revenue of $488 million and $1.5 billion for the three and nine months ended September 30, 2017 and $485 million and $1.6 billion for the same periods in 2016.America 64
|
Credit Derivatives
The Corporation enters into credit derivatives primarily to facilitate client transactions and to manage credit risk exposures. Credit derivatives derive value based on an underlying third-party referenced obligation or a portfolio of referenced obligations and generally require the Corporation, as the seller of credit protection, to make payments to a buyer upon the occurrence of a pre-defined credit event. Such credit events generally include bankruptcy of the referenced credit entity and failure to pay under the obligation, as well as acceleration of indebtedness and payment repudiation
or moratorium. For credit derivatives based on a portfolio of referenced credits or credit indices, the Corporation may not be required to make payment until a specified amount of loss has occurred and/or may only be required to make payment up to a specified amount.
Credit derivative instruments where the Corporation is the seller of credit protection and their expiration at September 30, 2017 and December 31, 2016 are summarized in the following table.
|
| | | | | | | | | | | | | | | | | | | |
| | | | | | | | | | |
| Credit Derivative Instruments | |
| | September 30, 2017 |
| | Carrying Value |
| (Dollars in millions) | Less than One Year | | One to Three Years | | Three to Five Years | | Over Five Years | | Total |
| Credit default swaps: | |
| | |
| | |
| | |
| | |
|
| Investment grade | $ | 10 |
| | $ | 27 |
| | $ | 175 |
| | $ | 389 |
| | $ | 601 |
|
| Non-investment grade | 237 |
| | 571 |
| | 462 |
| | 2,343 |
| | 3,613 |
|
| Total | 247 |
| | 598 |
| | 637 |
| | 2,732 |
| | 4,214 |
|
| Total return swaps/other: | |
| | |
| | |
| | |
| | |
|
| Investment grade | 39 |
| | — |
| | — |
| | — |
| | 39 |
|
| Non-investment grade | 153 |
| | — |
| | — |
| | — |
| | 153 |
|
| Total | 192 |
| | — |
| | — |
| | — |
| | 192 |
|
| Total credit derivatives | $ | 439 |
| | $ | 598 |
| | $ | 637 |
| | $ | 2,732 |
| | $ | 4,406 |
|
| Credit-related notes: | |
| | |
| | |
| | |
| | |
|
| Investment grade | $ | — |
| | $ | — |
| | $ | 84 |
| | $ | 702 |
| | $ | 786 |
|
| Non-investment grade | 20 |
| | 12 |
| | 31 |
| | 1,416 |
| | 1,479 |
|
| Total credit-related notes | $ | 20 |
| | $ | 12 |
| | $ | 115 |
| | $ | 2,118 |
| | $ | 2,265 |
|
| | Maximum Payout/Notional |
| Credit default swaps: | |
| | |
| | |
| | |
| | |
|
| Investment grade | $ | 76,594 |
| | $ | 117,714 |
| | $ | 109,875 |
| | $ | 38,025 |
| | $ | 342,208 |
|
| Non-investment grade | 62,935 |
| | 43,775 |
| | 44,094 |
| | 21,466 |
| | 172,270 |
|
| Total | 139,529 |
| | 161,489 |
| | 153,969 |
| | 59,491 |
| | 514,478 |
|
| Total return swaps/other: | |
| | |
| | |
| | |
| | |
|
| Investment grade | 36,743 |
| | — |
| | — |
| | — |
| | 36,743 |
|
| Non-investment grade | 13,232 |
| | 4,792 |
| | 143 |
| | 404 |
| | 18,571 |
|
| Total | 49,975 |
| | 4,792 |
| | 143 |
| | 404 |
| | 55,314 |
|
| Total credit derivatives | $ | 189,504 |
| | $ | 166,281 |
| | $ | 154,112 |
| | $ | 59,895 |
| | $ | 569,792 |
|
| | | | | | | | | | |
| | December 31, 2016 |
| | Carrying Value |
| Credit default swaps: | | | | | | | | | |
| Investment grade | $ | 10 |
| | $ | 64 |
| | $ | 535 |
| | $ | 783 |
| | $ | 1,392 |
|
| Non-investment grade | 771 |
| | 1,053 |
| | 908 |
| | 3,339 |
| | 6,071 |
|
| Total | 781 |
| | 1,117 |
| | 1,443 |
| | 4,122 |
| | 7,463 |
|
| Total return swaps/other: | |
| | |
| | |
| | |
| | |
|
| Investment grade | 16 |
| | — |
| | — |
| | — |
| | 16 |
|
| Non-investment grade | 127 |
| | 10 |
| | 2 |
| | 1 |
| | 140 |
|
| Total | 143 |
| | 10 |
| | 2 |
| | 1 |
| | 156 |
|
| Total credit derivatives | $ | 924 |
| | $ | 1,127 |
| | $ | 1,445 |
| | $ | 4,123 |
| | $ | 7,619 |
|
| Credit-related notes: | |
| | |
| | |
| | |
| | |
|
| Investment grade | $ | — |
| | $ | 12 |
| | $ | 542 |
| | $ | 1,423 |
| | $ | 1,977 |
|
| Non-investment grade | 70 |
| | 22 |
| | 60 |
| | 1,318 |
| | 1,470 |
|
| Total credit-related notes | $ | 70 |
| | $ | 34 |
| | $ | 602 |
| | $ | 2,741 |
| | $ | 3,447 |
|
| | Maximum Payout/Notional |
| Credit default swaps: | | | | | | | | | |
| Investment grade | $ | 121,083 |
| | $ | 143,200 |
| | $ | 116,540 |
| | $ | 21,905 |
| | $ | 402,728 |
|
| Non-investment grade | 84,755 |
| | 67,160 |
| | 41,001 |
| | 18,711 |
| | 211,627 |
|
| Total | 205,838 |
| | 210,360 |
| | 157,541 |
| | 40,616 |
| | 614,355 |
|
| Total return swaps/other: | |
| | |
| | |
| | |
| | |
|
| Investment grade | 12,792 |
| | — |
| | — |
| | — |
| | 12,792 |
|
| Non-investment grade | 6,638 |
| | 5,127 |
| | 589 |
| | 208 |
| | 12,562 |
|
| Total | 19,430 |
| | 5,127 |
| | 589 |
| | 208 |
| | 25,354 |
|
| Total credit derivatives | $ | 225,268 |
| | $ | 215,487 |
| | $ | 158,130 |
| | $ | 40,824 |
| | $ | 639,709 |
|
Credit derivatives are classified as investment and non-investment grade based on the credit quality of the underlying referenced obligation. The Corporation considers ratings of BBB- or higher as investment grade. Non-investment grade includes non-rated credit derivative instruments. The Corporation discloses internal categorizations of investment
grade and non-investment grade consistent with how risk is managed for these instruments. For more information on credit derivatives, see Note 3 – Derivatives to the Consolidated Financial Statements of the Corporation’s 2019 Annual Report on Form 10-K.
Credit derivative instruments where the Corporation is the seller of credit protection and their expiration at September 30, 2020 and December 31, 2019 are summarized in the following table.
| | | | | | | | | | | | | | | | | | | | | | | | | | | | | |
| | | | | | | | | |
| Credit Derivative Instruments | | | | | | | | | |
| | | | | | | | | |
| Less than
One Year | | One to
Three Years | | Three to
Five Years | | Over Five
Years | | Total |
| September 30, 2020 |
| (Dollars in millions) | Carrying Value |
| Credit default swaps: | | | | | | | | | |
| Investment grade | $ | 0 | | | $ | 10 | | | $ | 79 | | | $ | 213 | | | $ | 302 | |
| Non-investment grade | 54 | | | 527 | | | 1,059 | | | 1,698 | | | 3,338 | |
| Total | 54 | | | 537 | | | 1,138 | | | 1,911 | | | 3,640 | |
| Total return swaps/options: | | | | | | | | | |
| Investment grade | 120 | | | 0 | | | 0 | | | 0 | | | 120 | |
| Non-investment grade | 508 | | | 1 | | | 0 | | | 0 | | | 509 | |
| Total | 628 | | | 1 | | | 0 | | | 0 | | | 629 | |
| Total credit derivatives | $ | 682 | | | $ | 538 | | | $ | 1,138 | | | $ | 1,911 | | | $ | 4,269 | |
| Credit-related notes: | | | | | | | | | |
| Investment grade | $ | 0 | | | $ | 2 | | | $ | 0 | | | $ | 579 | | | $ | 581 | |
| Non-investment grade | 6 | | | 2 | | | 4 | | | 1,019 | | | 1,031 | |
| Total credit-related notes | $ | 6 | | | $ | 4 | | | $ | 4 | | | $ | 1,598 | | | $ | 1,612 | |
| | Maximum Payout/Notional |
| Credit default swaps: | | | | | | | | | |
| Investment grade | $ | 45,486 | | | $ | 78,733 | | | $ | 116,365 | | | $ | 34,056 | | | $ | 274,640 | |
| Non-investment grade | 19,008 | | | 31,252 | | | 44,187 | | | 17,721 | | | 112,168 | |
| Total | 64,494 | | | 109,985 | | | 160,552 | | | 51,777 | | | 386,808 | |
| Total return swaps/options: | | | | | | | | | |
| Investment grade | 50,952 | | | 61 | | | 74 | | | 0 | | | 51,087 | |
| Non-investment grade | 31,484 | | | 656 | | | 0 | | | 5 | | | 32,145 | |
| Total | 82,436 | | | 717 | | | 74 | | | 5 | | | 83,232 | |
| Total credit derivatives | $ | 146,930 | | | $ | 110,702 | | | $ | 160,626 | | | $ | 51,782 | | | $ | 470,040 | |
| | | | | | | | | |
| December 31, 2019 |
| Carrying Value |
| Credit default swaps: | | | | | | | | | |
| Investment grade | $ | 0 | | | $ | 5 | | | $ | 60 | | | $ | 164 | | | $ | 229 | |
| Non-investment grade | 70 | | | 292 | | | 561 | | | 808 | | | 1,731 | |
| Total | 70 | | | 297 | | | 621 | | | 972 | | | 1,960 | |
| Total return swaps/options: | | | | | | | | | |
| Investment grade | 35 | | | 0 | | | 0 | | | 0 | | | 35 | |
| Non-investment grade | 344 | | | 0 | | | 0 | | | 0 | | | 344 | |
| Total | 379 | | | 0 | | | 0 | | | 0 | | | 379 | |
| Total credit derivatives | $ | 449 | | | $ | 297 | | | $ | 621 | | | $ | 972 | | | $ | 2,339 | |
| Credit-related notes: | | | | | | | | | |
| Investment grade | $ | 0 | | | $ | 3 | | | $ | 1 | | | $ | 639 | | | $ | 643 | |
| Non-investment grade | 6 | | | 2 | | | 1 | | | 1,125 | | | 1,134 | |
| Total credit-related notes | $ | 6 | | | $ | 5 | | | $ | 2 | | | $ | 1,764 | | | $ | 1,777 | |
| | Maximum Payout/Notional |
| Credit default swaps: | | | | | | | | | |
| Investment grade | $ | 55,827 | | | $ | 67,838 | | | $ | 71,320 | | | $ | 17,708 | | | $ | 212,693 | |
| Non-investment grade | 19,049 | | | 26,521 | | | 29,618 | | | 12,337 | | | 87,525 | |
| Total | 74,876 | | | 94,359 | | | 100,938 | | | 30,045 | | | 300,218 | |
| Total return swaps/options: | | | | | | | | | |
| Investment grade | 56,488 | | | 0 | | | 62 | | | 76 | | | 56,626 | |
| Non-investment grade | 28,707 | | | 657 | | | 104 | | | 60 | | | 29,528 | |
| Total | 85,195 | | | 657 | | | 166 | | | 136 | | | 86,154 | |
| Total credit derivatives | $ | 160,071 | | | $ | 95,016 | | | $ | 101,104 | | | $ | 30,181 | | | $ | 386,372 | |
The notional amount represents the maximum amount payable by the Corporation for most credit derivatives. However, the Corporation does not monitor its exposure to credit derivatives based solely on the notional amount because this measure does not take into consideration the probability of occurrence. As such, the notional amount is not a reliable indicator of the Corporation’s exposure to these contracts.
Instead, a risk framework is used to define risk tolerances and establish limits to help ensureso that certain credit risk-related losses occur within acceptable, predefined limits.
Credit-related notes in the table on page 81above include investments in securities issued by collateralized debt obligation (CDO), collateralized loan obligation and credit-linked note vehicles. These instruments are primarily classified as trading securities.
The carrying value of these instruments equals the Corporation’s maximum exposure to loss. The Corporation is not obligated to make any payments to the entities under the terms of the securities owned.
Credit-related Contingent Features and Collateral
The majorityCertain of the Corporation'sCorporation’s derivative contracts contain credit-risk relatedcredit risk-related contingent features, primarily in the form of ISDA master netting agreements and credit support documentation that enhance the creditworthiness of these instruments. Therefore, events suchinstruments compared to other obligations of the respective counterparty with whom the Corporation has transacted. These contingent features may be for the benefit of the Corporation as a credit rating downgrade or a breach of credit covenants would typically require an increasewell as its counterparties with respect to changes in the amount of collateral required ofCorporation’s creditworthiness and the counterparty, where applicable, and/or allowmark-to-market exposure under the Corporation to take additional protective measures such as early termination of all trades.derivative transactions. At September 30, 20172020 and December 31, 2016,2019, the Corporation held cash and securities collateral of $77.4$91.7 billion and $85.5$84.3 billion and posted cash and securities collateral of $58.4$79.9 billion and $71.1$69.1 billion in the normal course of business under derivative agreements, excluding cross-product margining agreements where clients are permitted to margin on a net basis for both derivative and secured financing arrangements.
In connection with certain OTCover-the-counter derivative contracts and other trading agreements, the Corporation can be required to provide additional collateral or to terminate transactions with certain counterparties in the event of a downgrade of the senior debt ratings of the Corporation or certain subsidiaries. The amount of additional collateral required depends on the contract and is usually a fixed incremental amount and/or the market value of the exposure. For more information on credit-related contingent features and collateral, see Note 3 – Derivatives to the Consolidated Financial Statements of the Corporation’s 2019 Annual Report on Form 10-K.
At September 30, 2017,2020, the amount of collateral, calculated based on the terms of the contracts, that the Corporation and certain subsidiaries could be required to post to counterparties but had not yet posted to counterparties was approximately $2.0$1.9 billion,, including $1.2 billion$945 million for Bank of America, National Association. For more information on credit-related contingent features and collateral, see Note 2 – Derivatives to the Consolidated Financial Statements of the Corporation's 2016 Annual Report on Form 10-K.
Some counterparties are currently able to unilaterally terminate certain contracts, or the Corporation or certain subsidiaries may be required to take other action such as find a suitable replacement or obtain a guarantee. At September 30, 2017,2020 and December 31, 2019, the liability recorded for these derivative contracts was $23 million.not significant.
The following table presents the amount of additional collateral that would have been contractually required by derivative contracts and other trading agreements at September 30, 20172020 if the rating agencies had downgraded their long-term senior debt ratings for the Corporation or certain subsidiaries by one incremental notch and by an additional second incremental notch.
| | | | | | | | | | | |
| | | |
| Additional Collateral Required to be Posted Upon Downgrade at September 30, 2020 |
| | | |
| (Dollars in millions) | One
incremental notch | | Second
incremental notch |
| Bank of America Corporation | $ | 303 | | | $ | 724 | |
Bank of America, N.A. and subsidiaries (1) | 85 | | | 536 | |
|
| | | | | | |
| | | |
| Additional Collateral Required to be Posted Upon Downgrade |
| | September 30, 2017 |
| (Dollars in millions) | One incremental notch | Second incremental notch |
| Bank of America Corporation | $ | 512 |
| $ | 668 |
|
Bank of America, N.A. and subsidiaries (1) | 387 |
| 300 |
|
| |
(1)
| Included in Bank of America Corporation collateral requirements in this table. |
The following table below presents the derivative liabilities that would be subject to unilateral termination by counterparties and the amounts of collateral that would have been contractually required at September 30, 20172020 if the long-term senior debt ratings for the Corporation or certain subsidiaries had been lower by one incremental notch and by an additional second incremental notch.
| | | | | |
| Derivative Liabilities Subject to Unilateral Termination Upon Downgrade | |
| Derivative Liabilities Subject to Unilateral Termination Upon Downgrade at September 30, 2020 | | Derivative Liabilities Subject to Unilateral Termination Upon Downgrade at September 30, 2020 |
| | September 30, 2017 | |
| (Dollars in millions) | One incremental notch | Second incremental notch | (Dollars in millions) | One
incremental notch | | Second
incremental notch |
| Derivative liabilities | $ | 468 |
| $ | 1,122 |
| Derivative liabilities | $ | 14 | | | $ | 935 | |
| Collateral posted | 387 |
| 857 |
| Collateral posted | 1 | | | 611 | |
Valuation Adjustments on Derivatives
The table below presents credit valuation adjustment (CVA), DVA and FVA gains (losses) on derivatives (excluding the effect of any related hedge activities), which are recorded in trading account profits, on a grossmarket making and net of hedge basissimilar activities, for the three and nine months ended September 30, 20172020 and 2016.2019. For more information on the valuation adjustments on derivatives, see Note 23 – Derivatives to the Consolidated Financial Statements of the Corporation's 2016Corporation’s 2019 Annual Report on Form 10-K.
| | | | | | | | | | | | | | |
| | | | | | |
Valuation Adjustments Gains (Losses) on Derivatives (1) |
| | | | | | |
| | | | |
| Three Months Ended September 30 | | | |
| (Dollars in millions) | 2020 | | 2019 | | |
| | | | | | |
| Derivative assets (CVA) | $ | 174 | | | $ | (41) | | | | |
| Derivative assets/liabilities (FVA) | 27 | | | (60) | | | | |
| Derivative liabilities (DVA) | (105) | | | 17 | | | | |
| | | | | | |
| Nine Months Ended September 30 | | | |
| (Dollars in millions) | 2020 | | 2019 | | |
| Derivative assets (CVA) | $ | (334) | | | $ | (39) | | | | |
| Derivative assets/liabilities (FVA) | (60) | | | (27) | | | | |
| Derivative liabilities (DVA) | 53 | | | (56) | | | | |
| | | | | | |
(1)At September 30, 2020 and December 31, 2019, cumulative CVA reduced the derivative assets balance by $862 million and $528 million, cumulative FVA reduced the net derivatives balance by $213 million and $153 million, and cumulative DVA reduced the derivative liabilities balance by $338 million and $285 million, respectively.
|
| | | | | | | | | | | | | |
| | | | | | |
Valuation Adjustments on Derivatives (1) |
| | | | | | |
| Gains (Losses) | Three Months Ended September 30 |
| | 2017 | | 2016 |
| (Dollars in millions) | Gross | Net | | Gross | Net |
| Derivative assets (CVA) | $ | 23 |
| $ | 15 |
| | $ | 280 |
| $ | 66 |
|
| Derivative assets/liabilities (FVA) | 37 |
| 43 |
| | 42 |
| 51 |
|
| Derivative liabilities (DVA) | 29 |
| 17 |
| | (125 | ) | (103 | ) |
| | | | | | |
| | Nine Months Ended September 30 |
| | 2017 | | 2016 |
| | Gross | Net | | Gross | Net |
| Derivative assets (CVA) | $ | 281 |
| $ | 93 |
| | $ | 45 |
| $ | 151 |
|
| Derivative assets/liabilities (FVA) | 113 |
| 140 |
| | 9 |
| 20 |
|
| Derivative liabilities (DVA) | (249 | ) | (201 | ) | | 106 |
| (60 | ) |
| |
(1)
| At September 30, 2017 and December 31, 2016, cumulative CVA reduced the derivative assets balance by $726 million and $1.0 billion, cumulative FVA reduced the net derivatives balance by $182 million and $296 million, and cumulative DVA reduced the derivative liabilities balance by $525 million and $774 million, respectively.
|
The table below presents the amortized cost, gross unrealized gains and losses, and fair value of available-for-sale (AFS)AFS debt securities, other debt securities carried at fair value held-to-maturity (HTM)and HTM debt securities and AFS marketable equity securities at September 30, 20172020 and December 31, 2016.2019.
| | | | | | | | | | | | | | | | | | | | | | | |
| | | | | | | |
| Debt Securities | | | | |
| |
| Amortized
Cost | | Gross
Unrealized
Gains | | Gross
Unrealized
Losses | | Fair
Value |
| (Dollars in millions) | September 30, 2020 |
| Available-for-sale debt securities | | | | | | | |
| Mortgage-backed securities: | | | | | | | |
| Agency | $ | 67,566 | | | $ | 2,349 | | | $ | (51) | | | $ | 69,864 | |
| Agency-collateralized mortgage obligations | 5,663 | | | 189 | | | (15) | | | 5,837 | |
| Commercial | 15,190 | | | 1,017 | | | (1) | | | 16,206 | |
Non-agency residential (1) | 1,167 | | | 146 | | | (30) | | | 1,283 | |
| Total mortgage-backed securities | 89,586 | | | 3,701 | | | (97) | | | 93,190 | |
| U.S. Treasury and agency securities | 100,508 | | | 2,377 | | | (7) | | | 102,878 | |
| Non-U.S. securities | 16,333 | | | 34 | | | (13) | | | 16,354 | |
| | | | | | | |
| Other taxable securities, substantially all asset-backed securities | 3,628 | | | 58 | | | (10) | | | 3,676 | |
| Total taxable securities | 210,055 | | | 6,170 | | | (127) | | | 216,098 | |
| Tax-exempt securities | 17,299 | | | 340 | | | (45) | | | 17,594 | |
| Total available-for-sale debt securities | 227,354 | | | 6,510 | | | (172) | | | 233,692 | |
Other debt securities carried at fair value (2) | 11,982 | | | 399 | | | (76) | | | 12,305 | |
| Total debt securities carried at fair value | 239,336 | | | 6,909 | | | (248) | | | 245,997 | |
| Held-to-maturity debt securities, substantially all U.S. agency mortgage-backed securities | 338,418 | | | 9,727 | | | (228) | | | 347,917 | |
Total debt securities (3,4) | $ | 577,754 | | | $ | 16,636 | | | $ | (476) | | | $ | 593,914 | |
| | | | | | | |
| | | | | | | |
| December 31, 2019 |
| Available-for-sale debt securities | | | | | | | |
| Mortgage-backed securities: | | | | | | | |
| Agency | $ | 121,698 | | | $ | 1,013 | | | $ | (183) | | | $ | 122,528 | |
| Agency-collateralized mortgage obligations | 4,587 | | | 78 | | | (24) | | | 4,641 | |
| Commercial | 14,797 | | | 249 | | | (25) | | | 15,021 | |
Non-agency residential (1) | 948 | | | 138 | | | (9) | | | 1,077 | |
| Total mortgage-backed securities | 142,030 | | | 1,478 | | | (241) | | | 143,267 | |
| U.S. Treasury and agency securities | 67,700 | | | 1,023 | | | (195) | | | 68,528 | |
| Non-U.S. securities | 11,987 | | | 6 | | | (2) | | | 11,991 | |
| | | | | | | |
| Other taxable securities, substantially all asset-backed securities | 3,874 | | | 67 | | | 0 | | | 3,941 | |
| Total taxable securities | 225,591 | | | 2,574 | | | (438) | | | 227,727 | |
| Tax-exempt securities | 17,716 | | | 202 | | | (6) | | | 17,912 | |
| Total available-for-sale debt securities | 243,307 | | | 2,776 | | | (444) | | | 245,639 | |
Other debt securities carried at fair value (2) | 10,596 | | | 255 | | | (23) | | | 10,828 | |
| Total debt securities carried at fair value | 253,903 | | | 3,031 | | | (467) | | | 256,467 | |
| Held-to-maturity debt securities, substantially all U.S. agency mortgage-backed securities | 215,730 | | | 4,433 | | | (342) | | | 219,821 | |
Total debt securities (3, 4) | $ | 469,633 | | | $ | 7,464 | | | $ | (809) | | | $ | 476,288 | |
| | | | | | | |
(1)At September 30, 2020 and December 31, 2019, the underlying collateral type included approximately 35 percent and 49 percent prime, 4 percent and 6 percent Alt-A and 61 percent and 45 percent subprime.
(2)Primarily includes non-U.S. securities used to satisfy certain international regulatory requirements. Any changes in value are reported in market making and similar activities. For detail on the components, see Note 14 – Fair Value Measurements.
(3)Includes securities pledged as collateral of $55.7 billion and $67.0 billion at September 30, 2020 and December 31, 2019.
(4)The Corporation held debt securities from Fannie Mae and Freddie Mac that each exceeded 10 percent of shareholders’ equity, with an amortized cost of $193.8 billion and $76.9 billion, and a fair value of $201.0 billion and $79.3 billion at September 30, 2020, and an amortized cost of $157.2 billion and $54.1 billion, and a fair value of $160.6 billion and $55.1 billion at December 31, 2019.
|
| | | | | | | | | | | | | | | |
| | | | | | | | |
| Debt Securities and Available-for-Sale Marketable Equity Securities | | | | |
| | September 30, 2017 |
| (Dollars in millions) | Amortized Cost | | Gross
Unrealized Gains | | Gross
Unrealized Losses | | Fair Value |
| Available-for-sale debt securities | | | | | | | |
| Mortgage-backed securities: | | | | | | | |
|
| Agency | $ | 196,530 |
| | $ | 850 |
| | $ | (1,186 | ) | | $ | 196,194 |
|
| Agency-collateralized mortgage obligations | 7,021 |
| | 73 |
| | (45 | ) | | 7,049 |
|
| Commercial | 12,584 |
| | 48 |
| | (168 | ) | | 12,464 |
|
Non-agency residential (1) | 2,345 |
| | 333 |
| | (21 | ) | | 2,657 |
|
| Total mortgage-backed securities | 218,480 |
| | 1,304 |
| | (1,420 | ) | | 218,364 |
|
| U.S. Treasury and agency securities | 50,824 |
| | 70 |
| | (626 | ) | | 50,268 |
|
| Non-U.S. securities | 5,432 |
| | 9 |
| | (1 | ) | | 5,440 |
|
| Other taxable securities, substantially all asset-backed securities | 6,964 |
| | 77 |
| | (3 | ) | | 7,038 |
|
| Total taxable securities | 281,700 |
| | 1,460 |
| | (2,050 | ) | | 281,110 |
|
| Tax-exempt securities | 19,117 |
| | 167 |
| | (92 | ) | | 19,192 |
|
| Total available-for-sale debt securities | 300,817 |
| | 1,627 |
| | (2,142 | ) | | 300,302 |
|
| Other debt securities carried at fair value | 16,265 |
| | 345 |
| | (48 | ) | | 16,562 |
|
| Total debt securities carried at fair value | 317,082 |
| | 1,972 |
| | (2,190 | ) | | 316,864 |
|
| Held-to-maturity debt securities, substantially all U.S. agency mortgage-backed securities | 122,345 |
| | 267 |
| | (1,427 | ) | | 121,185 |
|
Total debt securities (2) | $ | 439,427 |
| | $ | 2,239 |
| | $ | (3,617 | ) | | $ | 438,049 |
|
Available-for-sale marketable equity securities (3) | $ | 22 |
| | $ | 28 |
| | $ | — |
| | $ | 50 |
|
| | | | | | | | |
| | December 31, 2016 |
| Available-for-sale debt securities | | | | | | | |
| Mortgage-backed securities: | |
| | |
| | |
| | |
|
| Agency | $ | 190,809 |
| | $ | 640 |
| | $ | (1,963 | ) | | $ | 189,486 |
|
| Agency-collateralized mortgage obligations | 8,296 |
| | 85 |
| | (51 | ) | | 8,330 |
|
| Commercial | 12,594 |
| | 21 |
| | (293 | ) | | 12,322 |
|
Non-agency residential (1) | 1,863 |
| | 181 |
| | (31 | ) | | 2,013 |
|
| Total mortgage-backed securities | 213,562 |
| | 927 |
| | (2,338 | ) | | 212,151 |
|
| U.S. Treasury and agency securities | 48,800 |
| | 204 |
| | (752 | ) | | 48,252 |
|
| Non-U.S. securities | 6,372 |
| | 13 |
| | (3 | ) | | 6,382 |
|
| Other taxable securities, substantially all asset-backed securities | 10,573 |
| | 64 |
| | (23 | ) | | 10,614 |
|
| Total taxable securities | 279,307 |
| | 1,208 |
| | (3,116 | ) | | 277,399 |
|
| Tax-exempt securities | 17,272 |
| | 72 |
| | (184 | ) | | 17,160 |
|
| Total available-for-sale debt securities | 296,579 |
| | 1,280 |
| | (3,300 | ) | | 294,559 |
|
Less: Available-for-sale securities of business held for sale (4) | (619 | ) | | — |
| | — |
| | (619 | ) |
| Other debt securities carried at fair value | 19,748 |
| | 121 |
| | (149 | ) | | 19,720 |
|
| Total debt securities carried at fair value | 315,708 |
| | 1,401 |
| | (3,449 | ) | | 313,660 |
|
| Held-to-maturity debt securities, substantially all U.S. agency mortgage-backed securities | 117,071 |
| | 248 |
| | (2,034 | ) | | 115,285 |
|
Total debt securities (2) | $ | 432,779 |
| | $ | 1,649 |
| | $ | (5,483 | ) | | $ | 428,945 |
|
Available-for-sale marketable equity securities (3) | $ | 325 |
| | $ | 51 |
| | $ | (1 | ) | | $ | 375 |
|
| |
(1)
| At September 30, 2017 and December 31, 2016, the underlying collateral type included approximately 70 percent and 60 percent prime, 13 percent and 19 percent Alt-A, and 17 percent and 21 percent subprime.
|
| |
(2)
| The Corporation had debt securities from Fannie Mae (FNMA) and Freddie Mac (FHLMC) that each exceeded 10 percent of shareholders’ equity, with an amortized cost of $165.1 billion and $48.2 billion, and a fair value of $164.2 billion and $48.1 billion at September 30, 2017, and an amortized cost of $156.4 billion and $48.7 billion, and a fair value of $154.4 billion and $48.3 billion at December 31, 2016.
|
| |
(3)
| Classified in other assets on the Consolidated Balance Sheet. |
| |
(4)
| Represents AFS debt securities of business held for sale. During the second quarter of 2017, the Corporation sold its non-U.S. consumer credit card business. |
At September 30, 2017,2020, the accumulated net unrealized lossgain on AFS debt securities, excluding the amount related to debt securities previously transferred to held to maturity, included in accumulated OCI was $312 million,$4.8 billion, net of the related income tax benefitexpense of $203 million. At both September 30, 2017 and December 31, 2016, the$1.6 billion. The Corporation had nonperforming AFS debt securities of $121 million.$25 million and $9 million at September 30, 2020 and December 31, 2019.
Effective January 1, 2020, the Corporation adopted the new accounting standard for credit losses that requires evaluation of AFS and HTM debt securities for any expected losses with recognition of an allowance for credit losses, when applicable. For more information, see Note 1 – Summary of Significant Accounting Principles. At September 30, 2020, the Corporation had $194.8 billion in AFS debt securities, which were primarily
83BankU.S. agency and U.S. Treasury securities that have a zero credit loss assumption. For the remaining $38.9 billion in AFS debt securities, the amount of AmericaECL was insignificant. Substantially all of the Corporation's HTM debt securities are U.S. agency and U.S. Treasury securities and have a zero credit loss assumption.
At September 30, 2020, the Corporation held equity securities at an aggregate fair value of $809 million and other equity securities, as valued under the measurement alternative, at a carrying value of $261 million, both of which are included in other assets. At September 30, 2020, the Corporation also held money market investments at a fair value of $385 million, which are included in time deposits placed and other short-term investments.
The table below presents the components of other debt securities carried at fair value where the changes in fair value are reported in other income. In the three and nine months ended September 30, 2017,2020, the Corporation recorded unrealized mark-to-market net gains of $124 million and $323 million, and realized
net losses of $11 million and $129 million, compared to unrealized mark-to-market net gains of $47 million and net losses of $25 million, and realized net losses of $28 million and $65 million for the same periods in 2016. These amounts exclude hedge results.
|
| | | | | | | |
| | | | |
| Other Debt Securities Carried at Fair Value |
| (Dollars in millions) | September 30
2017 | | December 31
2016 |
| Mortgage-backed securities: | | | |
| Agency-collateralized mortgage obligations | $ | 5 |
| | $ | 5 |
|
| Non-agency residential | 3,058 |
| | 3,139 |
|
| Total mortgage-backed securities | 3,063 |
| | 3,144 |
|
Non-U.S. securities (1) | 13,260 |
| | 16,336 |
|
| Other taxable securities, substantially all asset-backed securities | 239 |
| | 240 |
|
| Total | $ | 16,562 |
| | $ | 19,720 |
|
| |
(1)
| These securities are primarily used to satisfy certain international regulatory liquidity requirements. |
The gross realized gains and losses on sales of AFS debt securities forof $4 million and $383 million and gross realized losses of $2 million and $4 million, resulting in net gains of $2 million and $379 million, with $1 million and $95 million of income taxes attributable to the realized net gain on sales of these AFS debt securities. Sales of AFS debt securities during the three andmonths ended September 30, 2019 were not significant. In the nine months ended September 30, 20172019, the Corporation recorded gross realized gains on sales of AFS debt
securities of $228 million and 2016 are presentedgross realized losses of $112 million, resulting in net gains of $116 million with $28 million of income taxes attributable to the table below.
|
| | | | | | | | | | | | | | | |
| | | | | | | | |
| Gains and Losses on Sales of AFS Debt Securities |
| | Three Months Ended September 30 | | Nine Months Ended September 30 |
| (Dollars in millions) | 2017 | | 2016 | | 2017 | | 2016 |
| Gross gains | $ | 130 |
| | $ | 57 |
| | $ | 286 |
| | $ | 513 |
|
| Gross losses | (5 | ) | | (6 | ) | | (8 | ) | | (23 | ) |
| Net gains on sales of AFS debt securities | $ | 125 |
| | $ | 51 |
| | $ | 278 |
| | $ | 490 |
|
| Income tax expense attributable to realized net gains on sales of AFS debt securities | $ | 48 |
| | $ | 19 |
| | $ | 106 |
| | $ | 186 |
|
realized net gains on sales of these AFS debt securities.
The table below presents the fair value and the associated gross unrealized losses on AFS debt securities and whether these securities have had gross unrealized losses for less than 12 months or for 12 months or longer at September 30, 20172020 and December 31, 2016.2019.
| | | | | | | | | | | | | | | | | | | | | | | | | | | | | | | | | | | |
| | | | | | | | | | | |
| Total AFS Debt Securities in a Continuous Unrealized Loss Position | | | | | | |
| |
| Less than Twelve Months | | Twelve Months or Longer | | Total |
| Fair
Value | | Gross Unrealized Losses | | Fair
Value | | Gross Unrealized Losses | | Fair
Value | | Gross Unrealized Losses |
| (Dollars in millions) | September 30, 2020 |
| Continuously unrealized loss-positioned AFS debt securities | | | | | | | | | | | |
| Mortgage-backed securities: | | | | | | | | | | | |
| Agency | $ | 5,284 | | | $ | (51) | | | $ | 2 | | | $ | 0 | | | $ | 5,286 | | | $ | (51) | |
| Agency-collateralized mortgage obligations | 242 | | | (3) | | | 447 | | | (12) | | | 689 | | | (15) | |
| Commercial | 244 | | | (1) | | | 190 | | | 0 | | | 434 | | | (1) | |
| Non-agency residential | 326 | | | (19) | | | 75 | | | (11) | | | 401 | | | (30) | |
| Total mortgage-backed securities | 6,096 | | | (74) | | | 714 | | | (23) | | | 6,810 | | | (97) | |
| U.S. Treasury and agency securities | 3,893 | | | (3) | | | 503 | | | (4) | | | 4,396 | | | (7) | |
| Non-U.S. securities | 2,749 | | | (11) | | | 224 | | | (2) | | | 2,973 | | | (13) | |
| | | | | | | | | | | |
| Other taxable securities, substantially all asset-backed securities | 984 | | | (5) | | | 342 | | | (5) | | | 1,326 | | | (10) | |
| Total taxable securities | 13,722 | | | (93) | | | 1,783 | | | (34) | | | 15,505 | | | (127) | |
| Tax-exempt securities | 4,135 | | | (35) | | | 964 | | | (10) | | | 5,099 | | | (45) | |
| | | | | | | | | | | |
| | | | | | | | | | | |
| | | | | | | | | | | |
Total AFS debt securities in a continuous
unrealized loss position | $ | 17,857 | | | $ | (128) | | | $ | 2,747 | | | $ | (44) | | | $ | 20,604 | | | $ | (172) | |
| | | | | | | | | | | |
| December 31, 2019 |
| Continuously unrealized loss-positioned AFS debt securities | | | | | | | | | | | |
| Mortgage-backed securities: | | | | | | | | | | | |
| Agency | $ | 17,641 | | | $ | (41) | | | $ | 17,238 | | | $ | (142) | | | $ | 34,879 | | | $ | (183) | |
| Agency-collateralized mortgage obligations | 255 | | | (1) | | | 925 | | | (23) | | | 1,180 | | | (24) | |
| Commercial | 2,180 | | | (22) | | | 442 | | | (3) | | | 2,622 | | | (25) | |
| Non-agency residential | 122 | | | (6) | | | 22 | | | (3) | | | 144 | | | (9) | |
| Total mortgage-backed securities | 20,198 | | | (70) | | | 18,627 | | | (171) | | | 38,825 | | | (241) | |
| U.S. Treasury and agency securities | 12,836 | | | (71) | | | 18,866 | | | (124) | | | 31,702 | | | (195) | |
| Non-U.S. securities | 851 | | | 0 | | | 837 | | | (2) | | | 1,688 | | | (2) | |
| | | | | | | | | | | |
| Other taxable securities, substantially all asset-backed securities | 938 | | | 0 | | | 222 | | | 0 | | | 1,160 | | | 0 | |
| Total taxable securities | 34,823 | | | (141) | | | 38,552 | | | (297) | | | 73,375 | | | (438) | |
| Tax-exempt securities | 4,286 | | | (5) | | | 190 | | | (1) | | | 4,476 | | | (6) | |
| | | | | | | | | | | |
| | | | | | | | | | | |
| | | | | | | | | | | |
Total AFS debt securities in a continuous
unrealized loss position | $ | 39,109 | | | $ | (146) | | | $ | 38,742 | | | $ | (298) | | | $ | 77,851 | | | $ | (444) | |
|
| | | | | | | | | | | | | | | | | | | | | | | |
| | | | | | | | | | | | |
| Temporarily Impaired and Other-than-temporarily Impaired AFS Debt Securities | | | | | | |
| | |
| | September 30, 2017 |
| | Less than Twelve Months | | Twelve Months or Longer | | Total |
| (Dollars in millions) | Fair Value | | Gross Unrealized Losses | | Fair Value | | Gross Unrealized Losses | | Fair Value | | Gross Unrealized Losses |
| Temporarily impaired AFS debt securities | |
| | |
| | |
| | |
| | |
| | |
|
| Mortgage-backed securities: | | | | | | | | | | | |
| Agency | $ | 96,106 |
| | $ | (681 | ) | | $ | 17,570 |
| | $ | (505 | ) | | $ | 113,676 |
| | $ | (1,186 | ) |
| Agency-collateralized mortgage obligations | 2,137 |
| | (15 | ) | | 1,051 |
| | (30 | ) | | 3,188 |
| | (45 | ) |
| Commercial | 5,068 |
| | (59 | ) | | 2,819 |
| | (109 | ) | | 7,887 |
| | (168 | ) |
| Non-agency residential | 140 |
| | (7 | ) | | 118 |
| | (8 | ) | | 258 |
| | (15 | ) |
| Total mortgage-backed securities | 103,451 |
| | (762 | ) | | 21,558 |
| | (652 | ) | | 125,009 |
| | (1,414 | ) |
| U.S. Treasury and agency securities | 20,685 |
| | (144 | ) | | 17,035 |
| | (482 | ) | | 37,720 |
| | (626 | ) |
| Non-U.S. securities | 774 |
| | (1 | ) | | — |
| | — |
| | 774 |
| | (1 | ) |
| Other taxable securities, substantially all asset-backed securities | — |
| | — |
| | 384 |
| | (3 | ) | | 384 |
| | (3 | ) |
| Total taxable securities | 124,910 |
| | (907 | ) | | 38,977 |
| | (1,137 | ) | | 163,887 |
| | (2,044 | ) |
| Tax-exempt securities | — |
| | — |
| | 2,682 |
| | (92 | ) | | 2,682 |
| | (92 | ) |
| Total temporarily impaired AFS debt securities | 124,910 |
| | (907 | ) | | 41,659 |
| | (1,229 | ) | | 166,569 |
| | (2,136 | ) |
Other-than-temporarily impaired AFS debt securities (1) | | | | | | | | | | | |
| Non-agency residential mortgage-backed securities | 27 |
| | (1 | ) | | 30 |
| | (5 | ) | | 57 |
| | (6 | ) |
Total temporarily impaired and other-than-temporarily impaired AFS debt securities | $ | 124,937 |
| | $ | (908 | ) | | $ | 41,689 |
| | $ | (1,234 | ) | | $ | 166,626 |
| | $ | (2,142 | ) |
| | | | | | | | | | | | |
| | December 31, 2016 |
| Temporarily impaired AFS debt securities | | | | | | | | | | | |
| Mortgage-backed securities: | | | | | | | | | | | |
| Agency | $ | 135,210 |
| | $ | (1,846 | ) | | $ | 3,770 |
| | $ | (117 | ) | | $ | 138,980 |
| | $ | (1,963 | ) |
| Agency-collateralized mortgage obligations | 3,229 |
| | (25 | ) | | 1,028 |
| | (26 | ) | | 4,257 |
| | (51 | ) |
| Commercial | 9,018 |
| | (293 | ) | | — |
| | — |
| | 9,018 |
| | (293 | ) |
| Non-agency residential | 212 |
| | (1 | ) | | 204 |
| | (13 | ) | | 416 |
| | (14 | ) |
| Total mortgage-backed securities | 147,669 |
| | (2,165 | ) | | 5,002 |
| | (156 | ) | | 152,671 |
| | (2,321 | ) |
| U.S. Treasury and agency securities | 28,462 |
| | (752 | ) | | — |
| | — |
| | 28,462 |
| | (752 | ) |
| Non-U.S. securities | 52 |
| | (1 | ) | | 142 |
| | (2 | ) | | 194 |
| | (3 | ) |
| Other taxable securities, substantially all asset-backed securities | 762 |
| | (5 | ) | | 1,438 |
| | (18 | ) | | 2,200 |
| | (23 | ) |
| Total taxable securities | 176,945 |
| | (2,923 | ) | | 6,582 |
| | (176 | ) | | 183,527 |
| | (3,099 | ) |
| Tax-exempt securities | 4,782 |
| | (148 | ) | | 1,873 |
| | (36 | ) | | 6,655 |
| | (184 | ) |
| Total temporarily impaired AFS debt securities | 181,727 |
| | (3,071 | ) | | 8,455 |
| | (212 | ) | | 190,182 |
| | (3,283 | ) |
Other-than-temporarily impaired AFS debt securities (1) | | | | | | | | | | | |
| Non-agency residential mortgage-backed securities | 94 |
| | (1 | ) | | 401 |
| | (16 | ) | | 495 |
| | (17 | ) |
Total temporarily impaired and other-than-temporarily impaired AFS debt securities | $ | 181,821 |
| | $ | (3,072 | ) | | $ | 8,856 |
| | $ | (228 | ) | | $ | 190,677 |
| | $ | (3,300 | ) |
| | | | | | | | |
(1)
| Includes other-than-temporary impaired AFS debt securities on which an other-than-temporary impairment (OTTI) loss, primarily related to changes in interest rates, remains in accumulated OCI. | Bank of America 68 |
The Corporation had $0and $33 million of credit-related OTTI losses on AFS debt securities that were recognized in other income for the three and nine months ended September 30, 2017 and $2 million and $14 million for the three and nine months ended September 30, 2016. The amount of noncredit-related OTTI losses, which are recognized in OCI, was insignificant for all periods presented.
The cumulative credit loss component of OTTI losses that have been recognized in income related to AFS debt securities that the Corporation does not intend to sell was $284 million and $248 million at September 30, 2017 and 2016.
The Corporation estimates the portion of a loss on a security that is attributable to credit using a discounted cash flow model and estimates the expected cash flows of the underlying collateral
using internal credit, interest rate and prepayment risk models that incorporate management’s best estimate of current key assumptions such as default rates, loss severity and prepayment rates. Assumptions used for the underlying loans that support the MBS can vary widely from loan to loan and are influenced by such factors as loan interest rate, geographic location of the borrower, borrower characteristics and collateral type. Based on these assumptions, the Corporation then determines how the underlying collateral cash flows will be distributed to each MBS issued from the applicable special purpose entity. Expected principal and interest cash flows on an impaired AFS debt security are discounted using the effective yield of each individual impaired AFS debt security.
Significant assumptions used in estimating the expected cash flows for measuring credit losses on non-agency RMBS were as follows at September 30, 2017.
|
| | | | | | | | |
| | | | | | |
| Significant Assumptions |
| | | | Range (1) |
| | Weighted-
average | | 10th Percentile (2) | | 90th Percentile (2) |
| Prepayment speed | 12.0 | % | | 3.0 | % | | 20.6 | % |
| Loss severity | 19.8 |
| | 9.1 |
| | 36.5 |
|
| Life default rate | 21.0 |
| | 1.2 |
| | 77.7 |
|
| |
(1)
| Represents the range of inputs/assumptions based upon the underlying collateral. |
| |
(2)
| The value of a variable below which the indicated percentile of observations will fall. |
Annual constant prepayment speed and loss severity rates are projected considering collateral characteristics such as loan-to-value (LTV), creditworthiness of borrowers as measured using Fair
Isaac Corporation (FICO) scores, and geographic concentrations. The weighted-average severity by collateral type was 17.5 percent for prime, 18.4 percent for Alt-A and 29.5 percent for subprime at September 30, 2017. Additionally, default rates are projected by considering collateral characteristics including, but not limited to, LTV, FICO and geographic concentration. Weighted-average life default rates by collateral type were 15.6 percent for prime, 21.7 percent for Alt-A and 22.1 percent for subprime at September 30, 2017.
The remaining contractual maturity distribution and yields of the Corporation’s debt securities carried at fair value and HTM debt securities at September 30, 20172020 are summarized in the table below. Actual duration and yields may differ as prepayments on the loans underlying the mortgages or other asset-backed securities (ABS) are passed through to the Corporation.
| | | | | | | | | | | | | | | | | | | | | | | | | | | | | | | | | | | | | | | | | | | | | | | | | | | | | | | | | | | |
| | | | | | | | | | | | | | | | | | | |
| Maturities of Debt Securities Carried at Fair Value and Held-to-maturity Debt Securities |
| | | | | | | | | | | | | | | | | | | |
| Due in One
Year or Less | | Due after One Year
through Five Years | | Due after Five Years
through Ten Years | | Due after
Ten Years | | Total |
| (Dollars in millions) | Amount | | Yield (1) | | Amount | | Yield (1) | | Amount | | Yield (1) | | Amount | | Yield (1) | | Amount | | Yield (1) |
| Amortized cost of debt securities carried at fair value | | | | | | | | | | | | | | | | | | | |
| Mortgage-backed securities: | | | | | | | | | | | | | | | | | | | |
| Agency | $ | 0 | | | 0 | % | | $ | 7 | | | 5.37 | % | | $ | 59 | | | 4.51 | % | | $ | 67,500 | | | 3.36 | % | | $ | 67,566 | | | 3.36 | % |
| Agency-collateralized mortgage obligations | 0 | | | 0 | | | 0 | | | 0 | | | 24 | | | 2.54 | | | 5,639 | | | 2.95 | | | 5,663 | | | 2.95 | |
| Commercial | 26 | | | 3.08 | | | 6,136 | | | 2.49 | | | 8,014 | | | 2.44 | | | 1,027 | | | 2.75 | | | 15,203 | | | 2.48 | |
| Non-agency residential | 0 | | | 0 | | | 0 | | | 0 | | | 11 | | | 0 | | | 2,313 | | | 7.35 | | | 2,324 | | | 7.32 | |
| Total mortgage-backed securities | 26 | | | 3.08 | | | 6,143 | | | 2.49 | | | 8,108 | | | 2.45 | | | 76,479 | | | 3.44 | | | 90,756 | | | 3.29 | |
| U.S. Treasury and agency securities | 10,398 | | | 1.19 | | | 29,682 | | | 1.81 | | | 60,399 | | | 0.78 | | | 32 | | | 2.62 | | | 100,511 | | | 1.13 | |
| Non-U.S. securities | 25,784 | | | 0.37 | | | 1,275 | | | 1.50 | | | 7 | | | 5.82 | | | 76 | | | 8.89 | | | 27,142 | | | 0.44 | |
| | | | | | | | | | | | | | | | | | | |
| Other taxable securities, substantially all asset-backed securities | 1,107 | | | 1.42 | | | 1,423 | | | 2.32 | | | 628 | | | 2.06 | | | 470 | | | 1.73 | | | 3,628 | | | 1.92 | |
| Total taxable securities | 37,315 | | | 0.63 | | | 38,523 | | | 1.93 | | | 69,142 | | | 0.99 | | | 77,057 | | | 3.44 | | | 222,037 | | | 1.94 | |
| Tax-exempt securities | 905 | | | 0.92 | | | 8,462 | | | 1.23 | | | 5,051 | | | 1.66 | | | 2,881 | | | 1.53 | | | 17,299 | | | 1.39 | |
| Total amortized cost of debt securities carried at fair value | $ | 38,220 | | | 0.64 | | | $ | 46,985 | | | 1.80 | | | $ | 74,193 | | | 1.03 | | | $ | 79,938 | | | 3.37 | | | $ | 239,336 | | | 1.90 | |
Amortized cost of HTM debt securities (2) | $ | 66 | | | 1.87 | | | $ | 81 | | | 3.29 | | | $ | 17,188 | | | 1.86 | | | $ | 321,083 | | | 2.71 | | | $ | 338,418 | | | 2.67 | |
| | | | | | | | | | | | | | | | | | | |
| Debt securities carried at fair value | | | | | | | | | | | | | | | | | | | |
| Mortgage-backed securities: | | | | | | | | | | | | | | | | | | | |
| Agency | $ | 0 | | | | | $ | 8 | | | | | $ | 63 | | | | | $ | 69,793 | | | | | $ | 69,864 | | | |
| Agency-collateralized mortgage obligations | 0 | | | | | 0 | | | | | 25 | | | | | 5,812 | | | | | 5,837 | | | |
| Commercial | 26 | | | | | 6,491 | | | | | 8,586 | | | | | 1,117 | | | | | 16,220 | | | |
| Non-agency residential | 0 | | | | | 0 | | | | | 22 | | | | | 2,469 | | | | | 2,491 | | | |
| Total mortgage-backed securities | 26 | | | | | 6,499 | | | | | 8,696 | | | | | 79,191 | | | | | 94,412 | | | |
| U.S. Treasury and agency securities | 10,452 | | | | | 31,020 | | | | | 61,377 | | | | | 32 | | | | | 102,881 | | | |
| Non-U.S. securities | 26,066 | | | | | 1,278 | | | | | 8 | | | | | 79 | | | | | 27,431 | | | |
| | | | | | | | | | | | | | | | | | | |
| Other taxable securities, substantially all asset-backed securities | 1,112 | | | | | 1,445 | | | | | 640 | | | | | 482 | | | | | 3,679 | | | |
| Total taxable securities | 37,656 | | | | | 40,242 | | | | | 70,721 | | | | | 79,784 | | | | | 228,403 | | | |
| Tax-exempt securities | 907 | | | | | 8,548 | | | | | 5,201 | | | | | 2,938 | | | | | 17,594 | | | |
| Total debt securities carried at fair value | $ | 38,563 | | | | | $ | 48,790 | | | | | $ | 75,922 | | | | | $ | 82,722 | | | | | $ | 245,997 | | | |
Fair value of HTM debt securities (2) | $ | 65 | | | | | $ | 83 | | | | | $ | 17,442 | | | | | $ | 330,327 | | | | | $ | 347,917 | | | |
(1)The weighted-average yield is computed based on a constant effective interest rate over the contractual life of each security. The average yield considers the contractual coupon and the amortization of premiums and accretion of discounts, excluding the effect of related hedging derivatives.
(2)Substantially all U.S. agency MBS.
|
| | | | | | | | | | | | | | | | | | | | | | | | | | | | | | | | | | |
| | | | | | | | | | | | | | | | | | | | |
| Maturities of Debt Securities Carried at Fair Value and Held-to-maturity Debt Securities |
| | | | | | | | | | | | | | | | | | | | |
| | September 30, 2017 |
| | Due in One Year or Less | | Due after One Year through Five Years | | Due after Five Years through Ten Years | | Due after Ten Years | | Total |
| (Dollars in millions) | Amount | | Yield (1) | | Amount | | Yield (1) | | Amount | | Yield (1) | | Amount | | Yield (1) | | Amount | | Yield (1) |
| Amortized cost of debt securities carried at fair value | |
| | |
| | |
| | |
| | |
| | |
| | |
| | |
| | |
| | |
|
| Mortgage-backed securities: | |
| | |
| | |
| | |
| | |
| | |
| | |
| | |
| | |
| | |
|
| Agency | $ | 6 |
| | 4.67 | % | | $ | 25 |
| | 3.38 | % | | $ | 593 |
| | 2.56 | % | | $ | 195,906 |
| | 3.23 | % | | $ | 196,530 |
| | 3.23 | % |
| Agency-collateralized mortgage obligations | — |
| | — |
| | — |
| | — |
| | 34 |
| | 2.50 |
| | 6,991 |
| | 3.18 |
| | 7,025 |
| | 3.18 |
|
| Commercial | 48 |
| | 8.11 |
| | 847 |
| | 2.06 |
| | 11,183 |
| | 2.44 |
| | 506 |
| | 2.70 |
| | 12,584 |
| | 2.45 |
|
| Non-agency residential | — |
| | — |
| | — |
| | — |
| | 26 |
| | 0.01 |
| | 5,106 |
| | 9.05 |
| | 5,132 |
| | 9.00 |
|
| Total mortgage-backed securities | 54 |
| | 7.73 |
| | 872 |
| | 2.10 |
| | 11,836 |
| | 2.44 |
| | 208,509 |
| | 3.37 |
| | 221,271 |
| | 3.32 |
|
| U.S. Treasury and agency securities | 516 |
| | 0.39 |
| | 21,254 |
| | 1.40 |
| | 29,033 |
| | 1.96 |
| | 21 |
| | 2.42 |
| | 50,824 |
| | 1.71 |
|
| Non-U.S. securities | 16,563 |
| | 0.50 |
| | 1,839 |
| | 1.24 |
| | 110 |
| | 1.34 |
| | 177 |
| | 6.52 |
| | 18,689 |
| | 0.63 |
|
| Other taxable securities, substantially all asset-backed securities | 1,747 |
| | 2.28 |
| | 2,865 |
| | 2.59 |
| | 1,418 |
| | 2.95 |
| | 1,151 |
| | 3.28 |
| | 7,181 |
| | 2.70 |
|
| Total taxable securities | 18,880 |
| | 0.68 |
| | 26,830 |
| | 1.54 |
| | 42,397 |
| | 2.13 |
| | 209,858 |
| | 3.37 |
| | 297,965 |
| | 2.86 |
|
| Tax-exempt securities | 1,175 |
| | 1.46 |
| | 6,428 |
| | 1.77 |
| | 9,155 |
| | 1.66 |
| | 2,359 |
| | 2.03 |
| | 19,117 |
| | 1.73 |
|
| Total amortized cost of debt securities carried at fair value | $ | 20,055 |
| | 0.73 |
| | $ | 33,258 |
| | 1.58 |
| | $ | 51,552 |
| | 2.04 |
| | $ | 212,217 |
| | 3.36 |
| | $ | 317,082 |
| | 2.79 |
|
Amortized cost of HTM debt securities (2) | $ | — |
| | — |
| | $ | 35 |
| | 3.66 |
| | $ | 1,074 |
| | 2.56 |
| | $ | 121,236 |
| | 3.03 |
| | $ | 122,345 |
| | 3.03 |
|
| | | | | | | | | | | | | | | | | | | | |
| Debt securities carried at fair value | |
| | |
| | |
| | |
| | |
| | |
| | |
| | |
| | |
| | |
|
| Mortgage-backed securities: | |
| | |
| | |
| | |
| | |
| | |
| | |
| | |
| | |
| | |
|
| Agency | $ | 6 |
| | |
| | $ | 25 |
| | |
| | $ | 598 |
| | |
| | $ | 195,565 |
| | |
| | $ | 196,194 |
| | |
|
| Agency-collateralized mortgage obligations | — |
| | |
| | — |
| | |
| | 33 |
| | |
| | 7,021 |
| | |
| | 7,054 |
| | |
|
| Commercial | 48 |
| | |
| | 848 |
| | |
| | 11,072 |
| | |
| | 496 |
| | |
| | 12,464 |
| | |
|
| Non-agency residential | — |
| | |
| | — |
| | |
| | 35 |
| | |
| | 5,680 |
| | |
| | 5,715 |
| | |
|
| Total mortgage-backed securities | 54 |
| | | | 873 |
| | | | 11,738 |
| | | | 208,762 |
| | | | 221,427 |
| | |
| U.S. Treasury and agency securities | 516 |
| | | | 20,992 |
| | | | 28,739 |
| | | | 21 |
| | | | 50,268 |
| | |
| Non-U.S. securities | 16,563 |
| | |
| | 1,844 |
| | |
| | 111 |
| | |
| | 182 |
| | |
| | 18,700 |
| | |
|
| Other taxable securities, substantially all asset-backed securities | 1,747 |
| | |
| | 2,845 |
| | |
| | 1,450 |
| | |
| | 1,235 |
| | |
| | 7,277 |
| | |
|
| Total taxable securities | 18,880 |
| | |
| | 26,554 |
| | |
| | 42,038 |
| | |
| | 210,200 |
| | |
| | 297,672 |
| | |
|
| Tax-exempt securities | 1,174 |
| | |
| | 6,451 |
| | |
| | 9,202 |
| | |
| | 2,365 |
| | |
| | 19,192 |
| | |
|
| Total debt securities carried at fair value | $ | 20,054 |
| | |
| | $ | 33,005 |
| | |
| | $ | 51,240 |
| | |
| | $ | 212,565 |
| | |
| | $ | 316,864 |
| | |
|
Fair value of HTM debt securities (2) | $ | — |
| | | | $ | 27 |
| | | | $ | 896 |
| | | | $ | 120,262 |
| | | | $ | 121,185 |
| | |
| | | | | | | | |
(1)69Bank of America
| The average yield is computed based on a constant effective interest rate over the contractual life of each security. The average yield considers the contractual coupon and the amortization of premiums and accretion of discounts, excluding the effect of related hedging derivatives. | |
| |
(2)
| Substantially all U.S. agency MBS. |
Bank of America86
NOTE 4 5Outstanding Loans and Leases and Allowance for Credit Losses
The following tables present total outstanding loans and leases and an aging analysis for the Consumer Real Estate, Credit Card and Other Consumer, and Commercial portfolio segments, by class of financing receivables, at September 30, 20172020 and December 31, 2016.2019.
During | | | | | | | | | | | | | | | | | | | | | | | | | | | | | | | | | | | | | | | | | | | |
| | | | | | | | | | | | | | | |
| 30-59 Days Past Due (1) | | 60-89 Days Past Due (1) | | 90 Days or
More Past Due (1) | | Total Past
Due 30 Days
or More | | Total Current or Less Than 30 Days Past Due (1) | | | | Loans Accounted for Under the Fair Value Option | | Total
Outstandings |
| (Dollars in millions) | September 30, 2020 |
| Consumer real estate | | | | | | | | | | | | | | | |
| Core portfolio | | | | | | | | | | | | | | | |
| Residential mortgage | $ | 1,244 | | | $ | 280 | | | $ | 829 | | | $ | 2,353 | | | $ | 221,542 | | | | | | | $ | 223,895 | |
| Home equity | 129 | | | 77 | | | 261 | | | 467 | | | 31,871 | | | | | | | 32,338 | |
| Non-core portfolio | | | | | | | | | | | | | | | |
| Residential mortgage | 308 | | | 126 | | | 964 | | | 1,398 | | | 7,425 | | | | | | | 8,823 | |
| Home equity | 29 | | | 20 | | | 76 | | | 125 | | | 4,067 | | | | | | | 4,192 | |
| Credit card and other consumer | | | | | | | | | | | | | | | |
| Credit card | 486 | | | 238 | | | 546 | | | 1,270 | | | 78,564 | | | | | | | 79,834 | |
| | | | | | | | | | | | | | | |
Direct/Indirect consumer (2) | 209 | | | 58 | | | 31 | | | 298 | | | 89,616 | | | | | | | 89,914 | |
| Other consumer | 0 | | | 0 | | | 0 | | | 0 | | | 140 | | | | | | | 140 | |
| Total consumer | 2,405 | | | 799 | | | 2,707 | | | 5,911 | | | 433,225 | | | | | | | 439,136 | |
Consumer loans accounted for under the fair value option (3) | | | | | | | | | | | | | $ | 657 | | | 657 | |
| Total consumer loans and leases | 2,405 | | | 799 | | | 2,707 | | | 5,911 | | | 433,225 | | | | | 657 | | | 439,793 | |
| Commercial | | | | | | | | | | | | | | | |
| | | | | | | | | | | | | | | |
| U.S. commercial | 500 | | | 213 | | | 558 | | | 1,271 | | | 292,663 | | | | | | | 293,934 | |
| Non-U.S. commercial | 80 | | | 22 | | | 28 | | | 130 | | | 96,021 | | | | | | | 96,151 | |
Commercial real estate (4) | 58 | | | 3 | | | 206 | | | 267 | | | 62,187 | | | | | | | 62,454 | |
| Commercial lease financing | 67 | | | 92 | | | 42 | | | 201 | | | 17,212 | | | | | | | 17,413 | |
U.S. small business commercial (5) | 71 | | | 51 | | | 83 | | | 205 | | | 38,645 | | | | | | | 38,850 | |
| Total commercial | 776 | | | 381 | | | 917 | | | 2,074 | | | 506,728 | | | | | | | 508,802 | |
Commercial loans accounted for under the fair value option (3) | | | | | | | | | | | | | 6,577 | | | 6,577 | |
| Total commercial loans and leases | 776 | | | 381 | | | 917 | | | 2,074 | | | 506,728 | | | | | 6,577 | | | 515,379 | |
Total loans and leases (6) | $ | 3,181 | | | $ | 1,180 | | | $ | 3,624 | | | $ | 7,985 | | | $ | 939,953 | | | | | $ | 7,234 | | | $ | 955,172 | |
| Percentage of outstandings | 0.33 | % | | 0.12 | % | | 0.38 | % | | 0.83 | % | | 98.41 | % | | | | 0.76 | % | | 100.00 | % |
(1)Consumer real estate loans 30-59 days past due includes fully-insured loans of $258 million and nonperforming loans of $132 million. Consumer real estate loans 60-89 days past due includes fully-insured loans of $118 million and nonperforming loans of $96 million. Consumer real estate loans 90 days or more past due includes fully-insured loans of $1.0 billion. Consumer real estate loans current or less than 30 days past due includes $793 million and direct/indirect consumer includes $38 million of nonperforming loans. For information on the second quarter of 2017, the Corporation sold its non-U.S. consumer credit card business. This business, which at
December 31, 2016 included $9.2 billion of non-U.S. credit card loansCorporation's interest accrual policies and the related allowancedelinquency status for loan and lease losses of $243 million, was presented in assets of business held for sale onmodifications related to the Consolidated Balance Sheet. In this Note, all applicable amounts for December 31, 2016 include these balances, unless otherwise noted. For additional information,COVID-19 pandemic, see Note 1 – Summary of Significant Accounting Principles.Principles.
(2)Total outstandings primarily includes auto and specialty lending loans and leases of $47.1 billion, U.S. securities-based lending loans of $39.0 billion and non-U.S. consumer loans of $2.9 billion.
(3)Consumer loans accounted for under the fair value option includes residential mortgage loans of $314 million and home equity loans of $343 million. Commercial loans accounted for under the fair value option includes U.S. commercial loans of $3.4 billion and non-U.S. commercial loans of $3.2 billion. For more information, see Note 14 – Fair Value Measurements and Note 15 – Fair Value Option.
(4)Total outstandings includes U.S. commercial real estate loans of $58.7 billion and non-U.S. commercial real estate loans of $3.7 billion.
(5)Includes PPP loans.
(6)Total outstandings includes loans and leases pledged as collateral of $15.9 billion. The Corporation also pledged $158.4 billion of loans with no related outstanding borrowings to secure potential borrowing capacity with the Federal Reserve Bank and Federal Home Loan Bank.
|
| | | | | | | | | | | | | | | | | | | | | | | | | | | | | | | |
| | | | | | | | | | | | | | | | |
| | September 30, 2017 |
| (Dollars in millions) | 30-59 Days Past Due (1) | | 60-89 Days Past Due (1) | | 90 Days or
More Past Due (2) | | Total Past
Due 30 Days or More | | Total Current or Less Than 30 Days Past Due (3) | | Purchased
Credit-impaired (4) | | Loans Accounted for Under the Fair Value Option | | Total Outstandings |
| Consumer real estate | |
| | | | |
| | |
| | |
| | |
| | |
| | |
|
| Core portfolio | | | | | | | | | | | | | | | |
| Residential mortgage | $ | 1,583 |
| | $ | 306 |
| | $ | 986 |
| | $ | 2,875 |
| | $ | 167,782 |
| | | | | | $ | 170,657 |
|
| Home equity | 246 |
| | 111 |
| | 435 |
| | 792 |
| | 44,585 |
| | | | | | 45,377 |
|
| Non-core portfolio | | | | | | | | | | | | | | | |
Residential mortgage (5) | 1,144 |
| | 540 |
| | 3,728 |
| | 5,412 |
| | 14,978 |
| | $ | 8,399 |
| | | | 28,789 |
|
| Home equity | 269 |
| | 131 |
| | 613 |
| | 1,013 |
| | 10,449 |
| | 2,913 |
| | | | 14,375 |
|
| Credit card and other consumer | | | | | | | | | | | | | | | |
| U.S. credit card | 492 |
| | 355 |
| | 810 |
| | 1,657 |
| | 90,945 |
| | | | | | 92,602 |
|
Direct/Indirect consumer (6) | 273 |
| | 82 |
| | 33 |
| | 388 |
| | 93,003 |
| | | | | | 93,391 |
|
Other consumer (7) | 7 |
| | 1 |
| | 1 |
| | 9 |
| | 2,415 |
| | | | | | 2,424 |
|
| Total consumer | 4,014 |
| | 1,526 |
| | 6,606 |
| | 12,146 |
| | 424,157 |
| | 11,312 |
| | | | 447,615 |
|
Consumer loans accounted for under the fair value option (8) | |
| | |
| | |
| | |
| | |
| | |
| | $ | 978 |
| | 978 |
|
| Total consumer loans and leases | 4,014 |
| | 1,526 |
| | 6,606 |
| | 12,146 |
| | 424,157 |
| | 11,312 |
| | 978 |
| | 448,593 |
|
| Commercial | | | | | | | | | | | | | | | |
| U.S. commercial | 459 |
| | 176 |
| | 349 |
| | 984 |
| | 281,693 |
| | | | | | 282,677 |
|
Commercial real estate (9) | 13 |
| | 2 |
| | 51 |
| | 66 |
| | 59,562 |
| | | | | | 59,628 |
|
| Commercial lease financing | 39 |
| | 56 |
| | 45 |
| | 140 |
| | 21,273 |
| | | | | | 21,413 |
|
| Non-U.S. commercial | 9 |
| | 14 |
| | — |
| | 23 |
| | 95,873 |
| | | | | | 95,896 |
|
| U.S. small business commercial | 63 |
| | 38 |
| | 80 |
| | 181 |
| | 13,422 |
| | | | | | 13,603 |
|
| Total commercial | 583 |
| | 286 |
| | 525 |
| | 1,394 |
| | 471,823 |
| | | | | | 473,217 |
|
Commercial loans accounted for under the fair value option (8) | |
| | |
| | |
| | |
| | |
| | |
| | 5,307 |
| | 5,307 |
|
| Total commercial loans and leases | 583 |
| | 286 |
| | 525 |
| | 1,394 |
| | 471,823 |
| | | | 5,307 |
| | 478,524 |
|
Total loans and leases (10) | $ | 4,597 |
| | $ | 1,812 |
| | $ | 7,131 |
| | $ | 13,540 |
| | $ | 895,980 |
| | $ | 11,312 |
| | $ | 6,285 |
| | $ | 927,117 |
|
| Percentage of outstandings | 0.50 | % | | 0.19 | % | | 0.77 | % | | 1.46 | % | | 96.64 | % | | 1.22 | % | | 0.68 | % | | 100.00 | % |
| | | | | | | | |
(1)
| | Consumer real estate loans 30-59 days past due includes fully-insured loansBank of $905 million and nonperforming loans of $282 million. Consumer real estate loans 60-89 days past due includes fully-insured loans of $443 million and nonperforming loans of $201 million.America 70
|
| |
(2)
| Consumer real estate includes fully-insured loans of $3.4 billion.
|
| |
(3)
| Consumer real estate includes $2.3 billion and direct/indirect consumer includes $39 million of nonperforming loans.
|
| |
(4)
| Purchased credit-impaired (PCI) loan amounts are shown gross of the valuation allowance. |
| |
(5)
| Total outstandings includes pay option loans of $1.5 billion. The Corporation no longer originates this product.
|
| |
(6)
| Total outstandings includes auto and specialty lending loans of $50.0 billion, unsecured consumer lending loans of $484 million, U.S. securities-based lending loans of $39.3 billion, non-U.S. consumer loans of $2.9 billion and other consumer loans of $682 million.
|
| |
(7)
| Total outstandings includes consumer leases of $2.3 billion and consumer overdrafts of $160 million.
|
| |
(8)
| Consumer loans accounted for under the fair value option were residential mortgage loans of $615 million and home equity loans of $363 million. Commercial loans accounted for under the fair value option were U.S. commercial loans of $2.8 billion and non-U.S. commercial loans of $2.5 billion. For additional information, see Note 14 – Fair Value Measurements and Note 15 – Fair Value Option.
|
| |
(9)
| Total outstandings includes U.S. commercial real estate loans of $55.5 billion and non-U.S. commercial real estate loans of $4.2 billion.
|
| |
(10)
| The Corporation pledged $152.9 billion of loans to secure potential borrowing capacity with the Federal Reserve Bank and Federal Home Loan Bank (FHLB). This amount is not included in the parenthetical disclosure of loans and leases pledged as collateral on the Consolidated Balance Sheet as there were no related outstanding borrowings.
|
| | | | | | | | | | | | | | | | | | | | | |
| | December 31, 2016 | | 30-59 Days
Past Due (1) | | 60-89 Days Past Due (1) | | 90 Days or
More
Past Due (1) | | Total Past
Due 30 Days
or More | | Total Current or Less Than 30 Days Past Due (1) | | | Loans
Accounted
for Under
the Fair
Value Option | | Total Outstandings |
| (Dollars in millions) | 30-59 Days
Past Due (1) | | 60-89 Days Past Due (1) | | 90 Days or
More
Past Due (2) | | Total Past
Due 30 Days
or More | | Total Current or Less Than 30 Days Past Due (3) | | Purchased
Credit-impaired (4) | | Loans Accounted for Under the Fair Value Option | | Total Outstandings | (Dollars in millions) | December 31, 2019 |
| Consumer real estate | |
| | | | |
| | |
| | |
| | |
| | |
| | |
| Consumer real estate | | | | | | | | | | | | |
| Core portfolio | | | | | | | | | | | | | | | | Core portfolio | | | |
| Residential mortgage | $ | 1,340 |
| | $ | 425 |
| | $ | 1,213 |
| | $ | 2,978 |
| | $ | 153,519 |
| |
|
| | |
| | $ | 156,497 |
| Residential mortgage | $ | 1,378 | | | $ | 261 | | | $ | 565 | | | $ | 2,204 | | | $ | 223,566 | | | | | | $ | 225,770 | |
| Home equity | 239 |
| | 105 |
| | 451 |
| | 795 |
| | 48,578 |
| |
|
| | |
| | 49,373 |
| Home equity | 135 | | | 70 | | | 198 | | | 403 | | | 34,823 | | | | | | 35,226 | |
| Non-core portfolio | | | |
| | |
| | |
| | |
| | |
| | |
| | |
| Non-core portfolio | | | | | | | | | | | | | | |
Residential mortgage (5) | 1,338 |
| | 674 |
| | 5,343 |
| | 7,355 |
| | 17,818 |
| | $ | 10,127 |
| | |
| | 35,300 |
| |
| Residential mortgage | | Residential mortgage | 458 | | | 209 | | | 1,263 | | | 1,930 | | | 8,469 | | | | | | 10,399 | |
| Home equity | 260 |
| | 136 |
| | 832 |
| | 1,228 |
| | 12,231 |
| | 3,611 |
| | |
| | 17,070 |
| Home equity | 34 | | | 16 | | | 72 | | | 122 | | | 4,860 | | | | | | 4,982 | |
| Credit card and other consumer | | | |
| | |
| | |
| | |
| | |
| | |
| | |
| Credit card and other consumer | | | | | | | | | | | | | | |
| U.S. credit card | 472 |
| | 341 |
| | 782 |
| | 1,595 |
| | 90,683 |
| | | | |
| | 92,278 |
| |
| Non-U.S. credit card | 37 |
| | 27 |
| | 66 |
| | 130 |
| | 9,084 |
| | | | |
| | 9,214 |
| |
Direct/Indirect consumer (6) | 272 |
| | 79 |
| | 34 |
| | 385 |
| | 93,704 |
| | | | |
| | 94,089 |
| |
Other consumer (7) | 26 |
| | 8 |
| | 6 |
| | 40 |
| | 2,459 |
| | | | |
| | 2,499 |
| |
| Credit card | | Credit card | 564 | | | 429 | | | 1,042 | | | 2,035 | | | 95,573 | | | | | | 97,608 | |
| Direct/Indirect consumer (2) | | Direct/Indirect consumer (2) | 297 | | | 85 | | | 35 | | | 417 | | | 90,581 | | | | | | 90,998 | |
| Other consumer | | Other consumer | 0 | | | 0 | | | 0 | | | 0 | | | 192 | | | | | | 192 | |
| Total consumer | 3,984 |
| | 1,795 |
| | 8,727 |
| | 14,506 |
| | 428,076 |
| | 13,738 |
| | |
| 456,320 |
| Total consumer | 2,866 | | | 1,070 | | | 3,175 | | | 7,111 | | | 458,064 | | | | | 465,175 | |
Consumer loans accounted for under the fair value option (8) | | | | | | | | | | | | | $ | 1,051 |
|
| 1,051 |
| |
Consumer loans accounted for under the fair value option (3) | | Consumer loans accounted for under the fair value option (3) | | | $ | 594 | | | 594 | |
| Total consumer loans and leases | 3,984 |
| | 1,795 |
| | 8,727 |
| | 14,506 |
| | 428,076 |
| | 13,738 |
| | 1,051 |
| | 457,371 |
| Total consumer loans and leases | 2,866 | | | 1,070 | | | 3,175 | | | 7,111 | | | 458,064 | | | | 594 | | | 465,769 | |
| Commercial | | | |
| | |
| | |
| | |
| | |
| | |
| | |
| Commercial | | | | | | | | | | | | | | |
| | U.S. commercial | 952 |
| | 263 |
| | 400 |
| | 1,615 |
| | 268,757 |
| | | | |
| | 270,372 |
| U.S. commercial | 788 | | | 279 | | | 371 | | | 1,438 | | | 305,610 | | | | | | 307,048 | |
Commercial real estate (9) | 20 |
| | 10 |
| | 56 |
| | 86 |
| | 57,269 |
| | | | |
| | 57,355 |
| |
| Non-U.S. commercial | | Non-U.S. commercial | 35 | | | 23 | | | 8 | | | 66 | | | 104,900 | | | | | | 104,966 | |
Commercial real estate (4) | | Commercial real estate (4) | 144 | | | 19 | | | 119 | | | 282 | | | 62,407 | | | | | | 62,689 | |
| Commercial lease financing | 167 |
| | 21 |
| | 27 |
| | 215 |
| | 22,160 |
| | | | |
| | 22,375 |
| Commercial lease financing | 100 | | | 56 | | | 39 | | | 195 | | | 19,685 | | | | | | 19,880 | |
| Non-U.S. commercial | 348 |
| | 4 |
| | 5 |
| | 357 |
| | 89,040 |
| | | | |
| | 89,397 |
| |
| U.S. small business commercial | 96 |
| | 49 |
| | 84 |
| | 229 |
| | 12,764 |
| | | | |
| | 12,993 |
| U.S. small business commercial | 119 | | | 56 | | | 107 | | | 282 | | | 15,051 | | | | | | 15,333 | |
| Total commercial | 1,583 |
| | 347 |
| | 572 |
| | 2,502 |
| | 449,990 |
| | | | |
| | 452,492 |
| Total commercial | 1,186 | | | 433 | | | 644 | | | 2,263 | | | 507,653 | | | | | | 509,916 | |
Commercial loans accounted for under the fair value option (8)(3) | | | | | | | | | | | | | 6,034 |
| | 6,034 |
| | | 7,741 | | | 7,741 | |
| Total commercial loans and leases | 1,583 |
| | 347 |
| | 572 |
| | 2,502 |
| | 449,990 |
| | | | 6,034 |
| | 458,526 |
| Total commercial loans and leases | 1,186 | | | 433 | | | 644 | | | 2,263 | | | 507,653 | | | | 7,741 | | | 517,657 | |
Total consumer and commercial loans and leases (10) | $ | 5,567 |
| | $ | 2,142 |
| | $ | 9,299 |
| | $ | 17,008 |
| | $ | 878,066 |
| | $ | 13,738 |
| | $ | 7,085 |
| | $ | 915,897 |
| |
Less: Loans of business held for sale (10) | | | | | | | | | | | | | | | (9,214 | ) | |
Total loans and leases (11) | | | | | | | | | | | | | | | $ | 906,683 |
| |
Percentage of outstandings (10) | 0.61 | % | | 0.23 | % | | 1.02 | % | | 1.86 | % | | 95.87 | % | | 1.50 | % | | 0.77 | % | | 100.00 | % | |
| Total loans and leases (5) | | Total loans and leases (5) | $ | 4,052 | | | $ | 1,503 | | | $ | 3,819 | | | $ | 9,374 | | | $ | 965,717 | | | | $ | 8,335 | | | $ | 983,426 | |
| Percentage of outstandings | | Percentage of outstandings | 0.41 | % | | 0.15 | % | | 0.39 | % | | 0.95 | % | | 98.20 | % | | | 0.85 | % | | 100.00 | % |
| |
(1)(1)Consumer real estate loans 30-59 days past due includes fully-insured loans of $517 million and nonperforming loans of $139 million. Consumer real estate loans 60-89 days past due includes fully-insured loans of $206 million and nonperforming loans of $114 million. Consumer real estate loans 90 days or more past due includes fully-insured loans of $1.1 billion. Consumer real estate loans current or less than 30 days past due includes $856 million and direct/indirect consumer includes $45 million of nonperforming loans. (2)Total outstandings primarily includes auto and specialty lending loans and leases of $50.4 billion, U.S. securities-based lending loans of $36.7 billion and non-U.S. consumer loans of $2.8 billion. (3)Consumer loans accounted for under the fair value option includes residential mortgage loans of $257 million and home equity loans of $337 million. Commercial loans accounted for under the fair value option includes U.S. commercial loans of $4.7 billion and non-U.S. commercial loans of $3.1 billion. For more information, see Note 14 – Fair Value Measurements and Note 15 – Fair Value Option. (4)Total outstandings includes U.S. commercial real estate loans of $59.0 billion and non-U.S. commercial real estate loans of $3.7 billion. (5)Total outstandings includes loans and leases pledged as collateral of $25.9 billion. The Corporation also pledged $168.2 billion of loans with no related outstanding borrowings to secure potential borrowing capacity with the Federal Reserve Bank and Federal Home Loan Bank. | Consumer real estate loans 30-59 days past due includes fully-insured loans of $1.1 billion and nonperforming loans of $266 million. Consumer real estate loans 60-89 days past due includes fully-insured loans of $547 million and nonperforming loans of $216 million.
|
| |
(2)
| Consumer real estate includes fully-insured loans of $4.8 billion.
|
| |
(3)
| Consumer real estate includes $2.5 billion and direct/indirect consumer includes $27 million of nonperforming loans.
|
| |
(4)
| PCI loan amounts are shown gross of the valuation allowance. |
| |
(5)
| Total outstandings includes pay option loans of $1.8 billion. The Corporation no longer originates this product.
|
| |
(6)
| Total outstandings includes auto and specialty lending loans of $48.9 billion, unsecured consumer lending loans of $585 million, U.S. securities-based lending loans of $40.1 billion, non-U.S. consumer loans of $3.0 billion, student loans of $497 million and other consumer loans of $1.1 billion.
|
| |
(7)
| Total outstandings includes consumer finance loans of $465 million, consumer leases of $1.9 billion and consumer overdrafts of $157 million.
|
| |
(8)
| Consumer loans accounted for under the fair value option were residential mortgage loans of $710 million and home equity loans of $341 million. Commercial loans accounted for under the fair value option were U.S. commercial loans of $2.9 billion and non-U.S. commercial loans of $3.1 billion. For more information, see Note 14 – Fair Value Measurements and Note 15 – Fair Value Option.
|
| |
(9)
| Total outstandings includes U.S. commercial real estate loans of $54.3 billion and non-U.S. commercial real estate loans of $3.1 billion.
|
| |
(10)
| Includes non-U.S. credit card loans, which were included in assets of business held for sale on the Consolidated Balance Sheet. |
| |
(11)
| The Corporation pledged $143.1 billion of loans to secure potential borrowing capacity with the Federal Reserve Bank and FHLB. This amount is not included in the parenthetical disclosure of loans and leases pledged as collateral on the Consolidated Balance Sheet as there were no related outstanding borrowings.
|
The Corporation categorizes consumer real estate loans as core and non-core based on loan and customer characteristics such as origination date, product type, LTV, FICOFair Isaac Corporation (FICO) score and delinquency status consistent with its current consumer and mortgage servicing strategy. Generally, loans that were originated after January 1, 2010, qualified under government-sponsored enterprise (GSE) underwriting guidelines, or otherwise met the Corporation'sCorporation’s underwriting guidelines in place in 2015 are characterized as core loans. Loans held in legacy private-label securitizations, government-insuredAll other loans originated prior to 2010, loan products no longer originated, and loans originated prior to 2010 and classified as nonperforming or modified in a troubled debt restructuring (TDR) prior to 2016 are generally characterized as non-core loans and are principally run-offrepresent runoff portfolios.
The Corporation has entered into long-term credit protection agreements with FNMAFannie Mae and FHLMCFreddie Mac on loans totaling $6.5$8.8 billion
and $6.4$7.5 billion at September 30, 20172020 and December 31, 2016,2019, providing full credit protection on residential mortgage loans that become severely delinquent. All of these loans are individually insured, and therefore the Corporation does not record an allowance for credit losses related to these loans.
Nonperforming Loans and Leases
The Corporation classifies junior-lien home equityCommercial nonperforming loans as nonperforming when the first-lien loan becomes 90 days past due even if the junior-lien loan is performing. Atincreased to $2.2 billion at September 30, 2017 and2020 from $1.5 billion at December 31, 2016, $336 million2019 with broad-based increases across multiple industries. Consumer nonperforming loans increased to $2.4 billion at September 30, 2020 from $2.1 billion at December 31, 2019 driven by loans with deferrals that expired and $428have subsequently become nonperforming, as well as the inclusion of $137 million of such junior-lien home equity loans were included in nonperforming loans.
The Corporation classifies consumer real estatecertain loans that have been discharged in Chapter 7 bankruptcywere previously classified as purchased credit-impaired loans and not reaffirmed by the borrower as TDRs, irrespective of payment history or delinquency status, even if the repayment termsaccounted for the loan have
not been otherwise modified. The Corporation continues to have a lien on the underlying collateral. At September 30, 2017, nonperforming loans discharged in Chapter 7 bankruptcy with no change in repayment terms were $379 million of which $224 million were current on their contractual payments, while $127 million were 90 days or more past due. Of the contractually current nonperforming loans, approximately 78 percent were discharged in Chapter 7 bankruptcy over 12 months ago, and approximately 68 percent were discharged 24 months or more ago.
During the three and nine months ended September 30, 2017, the Corporation sold nonperforming and other delinquent consumer real estate loans with a carrying value of $700 million and $1.2 billion, including $538 million and $742 million of PCI loans, compared to $360 million and $1.8 billion, including $111 million and $435 million of PCI loans, for the same periods in 2016. The Corporation recorded net recoveries of $88 million and $102 million related to these sales for the three and nine months ended September 30, 2017 compared to net recoveries of $6 million and net charge-offs of $39 million for the same periods in 2016. Gains related to these sales of $38 million and $50 million
were recorded in other income in the Consolidated Statement of Income for the three and nine months ended September 30, 2017 compared to gains of $19 million and $63 million for the same periods in 2016. During the nine months ended September 30, 2017, the Corporation transferred nonperforming loans with a net carrying value of $198 million to held-for-sale, which have been subsequently sold during the nine-month period. There were no transfers of nonperforming loans to held-for-sale for the same period in 2016.
The table below presents the Corporation’s nonperforming loans and leases including nonperforming TDRs, and loans accruing past due 90 days or more at September 30, 20172020 and December 31, 2016.2019. Nonperforming loans held-for-sale (LHFS) are excluded from nonperforming loans and leases as they are recorded at either fair value or the lower of cost or fair value. For information on the Corporation's interest accrual policies and delinquency status for loan modifications related to the COVID-19 pandemic, see Note 1 – Summary of Significant Accounting Principles. For more information on the criteria for classification as nonperforming, see Note 1 – Summary of Significant Accounting Principles to the Consolidated Financial Statements of the Corporation's 2016Corporation’s 2019 Annual Report on Form 10-K.
|
| | | | | | | | | | | | | | | |
| | | | | | | | |
| Credit Quality | | |
| | | | | | | | |
| | Nonperforming Loans and Leases | | Accruing Past Due 90 Days or More |
| (Dollars in millions) | September 30
2017 | | December 31
2016 | | September 30
2017 | | December 31
2016 |
| Consumer real estate | |
| | |
| | |
| | |
|
| Core portfolio | | | | | | | |
Residential mortgage (1) | $ | 1,076 |
| | $ | 1,274 |
| | $ | 396 |
| | $ | 486 |
|
| Home equity | 1,046 |
| | 969 |
| | — |
| | — |
|
| Non-core portfolio | |
| | |
| | |
| | |
Residential mortgage (1) | 1,442 |
| | 1,782 |
| | 2,976 |
| | 4,307 |
|
| Home equity | 1,645 |
| | 1,949 |
| | — |
| | — |
|
| Credit card and other consumer | |
| | |
| | | | |
| U.S. credit card | n/a |
| | n/a |
| | 810 |
| | 782 |
|
| Non-U.S. credit card | n/a |
| | n/a |
| | — |
| | 66 |
|
| Direct/Indirect consumer | 43 |
| | 28 |
| | 31 |
| | 34 |
|
| Other consumer | — |
| | 2 |
| | 1 |
| | 4 |
|
| Total consumer | 5,252 |
| | 6,004 |
| | 4,214 |
| | 5,679 |
|
| Commercial | |
| | |
| | |
| | |
|
| U.S. commercial | 863 |
| | 1,256 |
| | 82 |
| | 106 |
|
| Commercial real estate | 130 |
| | 72 |
| | — |
| | 7 |
|
| Commercial lease financing | 26 |
| | 36 |
| | 38 |
| | 19 |
|
| Non-U.S. commercial | 244 |
| | 279 |
| | — |
| | 5 |
|
| U.S. small business commercial | 55 |
| | 60 |
| | 68 |
| | 71 |
|
| Total commercial | 1,318 |
| | 1,703 |
| | 188 |
| | 208 |
|
| Total loans and leases | $ | 6,570 |
| | $ | 7,707 |
| | $ | 4,402 |
| | $ | 5,887 |
|
| | | | | | | | |
(1)71Bank of America
| Residential mortgage loans in the core and non-core portfolios accruing past due 90 days or more are fully-insured loans. At September 30, 2017 and December 31, 2016, residential mortgage includes $2.3 billion and $3.0 billion of loans on which interest has been curtailed by the Federal Housing Administration (FHA), and therefore are no longer accruing interest, although principal is still insured, and $1.1 billion and $1.8 billion of loans on which interest is still accruing.
| |
| | | | | | | | | | | | | | | | | | | | | | | |
| | | | | | | |
| Credit Quality | | |
| | | | | | | |
| |
| Nonperforming Loans
and Leases | | Accruing Past Due 90 Days or More (1) |
| (Dollars in millions) | September 30
2020 | | December 31
2019 | | September 30
2020 | | December 31
2019 |
Residential mortgage (2) | $ | 1,675 | | | $ | 1,470 | | | $ | 837 | | | $ | 1,088 | |
With negative allowance (3) | 500 | | | 0 | | | | | |
Home equity (2) | 640 | | | 536 | | | 0 | | | 0 | |
With negative allowance (3) | 119 | | | 0 | | | | | |
| Credit Card | n/a | | n/a | | 546 | | | 1,042 | |
| Direct/indirect consumer | 42 | | | 47 | | | 27 | | | 33 | |
| | | | | | | |
| Total consumer | 2,357 | | | 2,053 | | | 1,410 | | | 2,163 | |
| U.S. commercial | 1,351 | | | 1,094 | | | 199 | | | 106 | |
| Non-U.S. commercial | 338 | | | 43 | | | 28 | | | 8 | |
| Commercial real estate | 414 | | | 280 | | | 2 | | | 19 | |
| Commercial lease financing | 14 | | | 32 | | | 32 | | | 20 | |
| U.S. small business commercial | 76 | | | 50 | | | 77 | | | 97 | |
| Total commercial | 2,193 | | | 1,499 | | | 338 | | | 250 | |
| Total nonperforming loans | $ | 4,550 | | | $ | 3,552 | | | $ | 1,748 | | | $ | 2,413 | |
| Percentage of outstanding loans and leases | 0.48 | % | | 0.36 | % | | 0.18 | % | | 0.25 | % |
(1)For information on the Corporation's interest accrual policies and delinquency status for loan modifications related to the COVID-19 pandemic, see Note 1 – Summary of Significant Accounting Principles.
(2)Residential mortgage loans accruing past due 90 days or more are fully-insured loans. At September 30, 2020 and December 31, 2019 residential mortgage includes $561 million and $740 million of loans on which interest had been curtailed by the FHA, and therefore were no longer accruing interest, although principal was still insured, and $276 million and $348 million of loans on which interest was still accruing.
(3)At September 30, 2020, Residential Mortgage and Home Equity include negative allowance on nonperforming loans of $170 million and $106 million.
n/a = not applicable
Included in the September 30, 2020 nonperforming loans are $120 million and $17 million of residential mortgage and home equity loans that prior to the January 1, 2020 adoption of the new credit loss standard were not included in nonperforming loans, as they were previously classified as purchased credit-impaired loans and accounted for under a pool basis.
Consumer Real Estate
To estimate ECL for consumer loans secured by residential real estate, the Corporation estimates the number of loans that will default over the life of the existing portfolio, after factoring in estimated prepayments, using quantitative modeling methodologies. The attributes that are most significant in estimating the Corporation’s ECL include refreshed loan-to-value (LTV) or, in the case of a subordinated lien, refreshed combined LTV (CLTV), borrower credit score, months since origination and geography, all of which are further broken down by present collection status (whether the loan is current, delinquent, in default, or in bankruptcy). The estimates are based on the Corporation’s historical experience with the loan portfolio,
adjusted to reflect the economic outlook. The outlook on the unemployment rate and consumer real estate prices are key factors that impact the frequency and severity of loss estimates. The Corporation does not reserve for credit losses on the unpaid principal balance of loans insured by the Federal Housing Administration (FHA) and long-term standby loans, as these loans are fully insured. The Corporation records a reserve for unfunded lending commitments for the ECL associated with the undrawn portion of the Corporation’s HELOCs, which can only be canceled by the Corporation if certain criteria are met. The ECL associated with these unfunded lending commitments is calculated using the same models and methodologies noted above and incorporate utilization assumptions at time of default.
For loans that are more than 180 days past due and collateral-dependent TDRs, the Corporation bases the allowance on the estimated fair value of the underlying collateral as of the reporting date less costs to sell. The fair value of the collateral securing these loans is generally determined using an automated valuation model (AVM) that estimates the value of a property by reference to market data including sales of comparable properties and price trends specific to the Metropolitan Statistical Area in which the property being valued is located. In the event that an AVM value is not available, the Corporation utilizes publicized indices or if these methods provide less reliable valuations, the Corporation uses appraisals or broker price opinions to estimate the fair value of the collateral. While there is inherent imprecision in these valuations, the Corporation believes that they are representative of this portfolio in the aggregate.
For loans that are more than 180 days past due and collateral-dependent TDRs, with the exception of the Corporation’s fully insured portfolio, the outstanding balance of loans that is in excess of the estimated property value after adjusting for costs to sell is charged off. If the estimated property value decreases in periods subsequent to the initial charge-off, the Corporation will record an additional charge-off; however, if the value increases in periods subsequent to the charge-off, the Corporation will adjust the allowance to account for the increase but not to a level above the cumulative charge-off amount.
Credit Quality IndicatorsCards and Other Consumer
Credit cards are revolving lines of credit without a defined maturity date. The estimated life of a credit card receivable is determined by estimating the amount and timing of expected future payments (e.g., borrowers making full payments, minimum payments or somewhere in between) that it will take for a receivable balance to pay off. The ECL on the future payments incorporates the spending behavior of a borrower through time using key borrower-specific factors and the economic outlook described above. The Corporation applies all expected payments in accordance with the Credit Card Accountability Responsibility and Disclosure Act of 2009 (i.e., paying down the highest interest rate bucket first). Then forecasted future payments are prioritized to pay off the oldest balance until it is brought to zero or an expected charge-off amount. Unemployment rate outlook, borrower credit score, delinquency status and historical payment behavior are all key inputs into the credit card receivable loss forecasting model. Future draws on the credit card lines are excluded from the ECL as they are unconditionally cancellable.
The ECL for the consumer vehicle lending portfolio is also determined using quantitative methods supplemented with qualitative analysis. The quantitative model estimates ECL giving consideration to key borrower and loan characteristics such as delinquency status, borrower credit score, LTV ratio, underlying collateral type and collateral value.
Commercial
The ECL on commercial loans is forecasted using models that estimate credit losses over the loan’s contractual life at an individual loan level. The models use the contractual terms to forecast future principal cash flows while also considering expected prepayments. For open-ended commitments such as revolving lines of credit, changes in funded balance are captured by forecasting a borrower’s draw and payment behavior over the remaining life of the commitment. For loans collateralized with commercial real estate and for which the underlying asset is the primary source of repayment, the loss forecasting models consider key loan and customer attributes such as LTV ratio, net operating income and debt service coverage, and captures variations in behavior according to property type and region. The commercial real estate model also utilizes key economic variables to forecast market indicators such as rent levels and vacancy rates, which impact the ECL estimate. For all other commercial loans and leases, the loss forecasting model determines the probabilities of transition to different credit risk ratings or default at each point over the life of the asset based on the borrower’s current credit risk rating, industry sector, size of the exposure and the geographic market. The severity of loss is determined based on the type of collateral securing the exposure, the size of the exposure, the borrower’s industry sector, any guarantors and the geographic market. Assumptions of expected loss are conditioned to the economic outlook and the model considers key economic variables such as unemployment rate, gross domestic product, credit risk spreads, asset prices and equity market returns.
In addition to the allowance for loan and lease losses, the Corporation also estimates ECL related to unfunded lending commitments such as letters of credit, financial guarantees, unfunded bankers acceptances and binding loan commitments, excluding commitments accounted for under the fair value option. Reserves are estimated for the unfunded exposure using the same models and methodologies as the funded exposure and are reported as reserves for unfunded lending commitments.
Securities
The Corporation monitorsevaluates each available-for-sale (AFS) security where the value has declined below amortized cost. If the Corporation intends to sell or believes it is more likely than not that it will be required to sell the debt security, it is written down to fair value through earnings. For AFS debt securities the Corporation intends to hold, the Corporation evaluates the debt securities for ECL except for debt securities that are guaranteed by the U.S. Treasury, U.S. government agencies or sovereign entities of high credit quality within its Consumer Real Estate, Credit Cardwhere the Corporation applies a zero credit loss assumption. For the remaining AFS debt securities, the Corporation considers qualitative parameters such as internal and Other Consumer,external credit ratings and Commercial portfolio segments based on primary credit quality indicators. Within the consumer portfolio segments, the primary credit quality indicators are refreshed LTV and refreshed FICO score. Refreshed LTV measures the carrying value of underlying collateral. If an AFS debt security fails any of the loanqualitative parameters, a discounted cash flow analysis is used by the Corporation to determine if a portion of the unrealized loss is a result of a credit loss. Any credit losses determined are recognized as a percentagean increase to the allowance for credit losses through provision expense recorded in other income. Cash flows
expected to be collected are estimated using all relevant information available such as, remaining payment terms, prepayment speeds, the financial condition of the issuer, expected defaults and the value of the property securing the loan, refreshed quarterly. FICO score measures the creditworthinessunderlying collateral. If any of the borrower baseddecline in fair value is related to market factors, that amount is recognized in accumulated other comprehensive income (OCI). In certain instances, the credit loss may exceed the total decline in fair value, in which case, the allowance recorded is limited to the difference between the amortized cost and the fair value of the asset.
The Corporation separately evaluates its held-to-maturity (HTM) debt securities for any credit losses, of which substantially all qualify for the zero loss assumption. For the remaining securities, the Corporation performs a discounted cash flow analysis to estimate any credit losses which are then recognized as part of the allowance for credit losses.
Other Assets
For the Corporation’s financial assets that are measured at amortized cost and are not included in debt securities or loans and leases on the financial obligationsConsolidated Balance Sheet, the Corporation evaluates these assets for ECL using various techniques. For assets that are subject to collateral maintenance provisions, including federal funds sold and securities borrowed or purchased under agreements to resell, where the collateral consists of daily margining of liquid and marketable assets where the margining is expected to be maintained into the foreseeable future, the expected losses are assumed to be 0. For all other assets, the Corporation performs qualitative analyses, including consideration of historical losses and current economic conditions, to estimate any ECL which are then included in a valuation account that is recorded as a contra-asset against the amortized cost basis of the borrowerfinancial asset.
Troubled Debt Restructurings
The Corporation has implemented various consumer and commercial loan modification programs to provide its borrowers relief from the borrower’s credit history. FICO scoreseconomic impacts of the COVID-19 pandemic. In accordance with the Coronavirus Aid, Relief, and Economic Security Act (CARES Act), the Corporation has elected to not apply TDR classification to any COVID-19 related loan modifications that were performed after March 1, 2020 to borrowers who were current as of December 31, 2019. Accordingly, these restructurings are typically refreshed quarterly or more
frequently. Within the Commercial portfolio segment, loans are evaluated using the internal classifications of pass rated or reservable criticizednot classified as the primary credit quality indicators.TDRs. In addition, for loans modified in response to these primary credit quality indicators,the COVID-19 pandemic that do not meet the above criteria (e.g., current payment status at December 31, 2019), the Corporation uses otheris applying the guidance included in an interagency statement issued by the bank regulatory agencies. This guidance states that loan modifications performed in light of the COVID-19 pandemic, including loan payment deferrals that are up to six months in duration, that were granted to borrowers who were current as of the implementation date of a loan modification program or modifications granted under government mandated modification programs, are not TDRs. For loan modifications that include a payment deferral and are not TDRs, the borrowers' past due and nonaccrual status have not been impacted during the deferral period. The Corporation has continued to accrue interest during the deferral period using a constant effective yield method. For most mortgage, HELOC and commercial loan modifications, the contractual interest that accrued during the deferral period is payable at the maturity of the loan. The Corporation includes these amounts with the unpaid principal balance when computing its allowance for credit quality indicatorslosses. Amounts that are subsequently deemed uncollectible
are written off against the allowance for certain types of loans.credit losses. For more information on the portfolio segments and credit quality indicators,Corporation's TDR accounting, see Note 1 – Summary of Significant Accounting Principles and Note 4 – Outstanding Loans and Leases to the Consolidated Financial Statements of the Corporation's 2016Corporation’s 2019 Annual Report on Form 10-K.
Paycheck Protection Program
The Corporation is participating in the Paycheck Protection Program (PPP), which is a loan program that originated from the CARES Act and was subsequently expanded by the Paycheck Protection Program and Health Care Enhancement Act. The PPP is designed to provide U.S. small businesses with cash-flow assistance through loans fully guaranteed by the Small Business Administration (SBA). If the borrower meets certain criteria and uses the proceeds towards certain eligible expenses, the borrower’s obligation to repay the loan can be forgiven up to the full principal amount of the loan and any accrued interest. Upon borrower forgiveness, the SBA pays the Corporation for the principal and accrued interest owed on the loan. If the full principal of the loan is not forgiven, the loan will operate according to the original loan terms with the 100 percent SBA guaranty remaining. As of September 30, 2020,
the Corporation had approximately 343,000 PPP loans with outstanding balances totaling $24.7 billion. As compensation for originating the loans, the Corporation received lender processing fees from the SBA, which are capitalized, along with the loan origination costs, and will be amortized over the loans’ contractual lives and recognized as interest income. Upon forgiveness of a loan and repayment by the SBA, any unrecognized net capitalized fees and costs related to the loan will be recognized as interest income in that period.
NOTE 2Net Interest Income and Noninterest Income
The table below presents the Corporation’s net interest income and noninterest income disaggregated by revenue source for the three and nine months ended September 30, 2020 and 2019. For more information, see Note 1 – Summary of Significant Accounting Principles to the Consolidated Financial Statements of the Corporation’s 2019 Annual Report on Form 10-K. For a disaggregation of noninterest income by business segment and All Other, see Note 17 – Business Segment Information.
| | | | | | | | | | | | | | | | | | | | | | | | | | | | | | | | |
| | | | | | | | | | | | | | |
| | | | | | Three Months Ended September 30 | | Nine Months Ended September 30 |
| (Dollars in millions) | | | | | | | | | | 2020 | | 2019 | | 2020 | | 2019 |
| Net interest income | | | | | | | | | | | | | | | | |
| Interest income | | | | | | | | | | | | | | | | |
| Loans and leases | | | | | | | | | | $ | 7,894 | | | $ | 10,894 | | | $ | 26,426 | | | $ | 32,721 | |
| Debt securities | | | | | | | | | | 2,130 | | | 2,829 | | | 7,413 | | | 8,965 | |
| Federal funds sold and securities borrowed or purchased under agreements to resell | | | | | | | | | | 55 | | | 1,242 | | | 900 | | | 3,746 | |
| Trading account assets | | | | | | | | | | 948 | | | 1,319 | | | 3,203 | | | 3,962 | |
| Other interest income | | | | | | | | | | 459 | | | 1,632 | | | 2,182 | | | 4,916 | |
| Total interest income | | | | | | | | | | 11,486 | | | 17,916 | | | 40,124 | | | 54,310 | |
| | | | | | | | | | | | | | | | |
| Interest expense | | | | | | | | | | | | | | | | |
| Deposits | | | | | | | | | | 227 | | | 1,880 | | | 1,784 | | | 5,640 | |
| Short-term borrowings | | | | | | | | | | (24) | | | 1,876 | | | 1,024 | | | 5,725 | |
| Trading account liabilities | | | | | | | | | | 212 | | | 303 | | | 764 | | | 967 | |
| Long-term debt | | | | | | | | | | 942 | | | 1,670 | | | 3,445 | | | 5,227 | |
| Total interest expense | | | | | | | | | | 1,357 | | | 5,729 | | | 7,017 | | | 17,559 | |
| Net interest income | | | | | | | | | | $ | 10,129 | | | $ | 12,187 | | | $ | 33,107 | | | $ | 36,751 | |
| | | | | | | | | | | | | | | | |
| Noninterest income | | | | | | | | | | | | | | | | |
| Fees and commissions | | | | | | | | | | | | | | | | |
| Card income | | | | | | | | | | | | | | | | |
Interchange fees (1) | | | | | | | | | | $ | 1,172 | | | $ | 963 | | | $ | 2,794 | | | $ | 2,827 | |
| Other card income | | | | | | | | | | 396 | | | 502 | | | 1,295 | | | 1,459 | |
| Total card income | | | | | | | | | | 1,568 | | | 1,465 | | | 4,089 | | | 4,286 | |
| Service charges | | | | | | | | | | | | | | | | |
| Deposit-related fees | | | | | | | | | | 1,515 | | | 1,690 | | | 4,441 | | | 4,908 | |
| Lending-related fees | | | | | | | | | | 302 | | | 285 | | | 841 | | | 809 | |
| Total service charges | | | | | | | | | | 1,817 | | | 1,975 | | | 5,282 | | | 5,717 | |
| Investment and brokerage services | | | | | | | | | | | | | | | | |
| Asset management fees | | | | | | | | | | 2,740 | | | 2,597 | | | 7,905 | | | 7,591 | |
| Brokerage fees | | | | | | | | | | 883 | | | 897 | | | 2,898 | | | 2,733 | |
| Total investment and brokerage services | | | | | | | | | | 3,623 | | | 3,494 | | | 10,803 | | | 10,324 | |
| Investment banking fees | | | | | | | | | | | | | | | | |
| Underwriting income | | | | | | | | | | 1,239 | | | 740 | | | 3,610 | | | 2,198 | |
| Syndication fees | | | | | | | | | | 133 | | | 341 | | | 634 | | | 887 | |
| Financial advisory services | | | | | | | | | | 397 | | | 452 | | | 1,072 | | | 1,083 | |
| Total investment banking fees | | | | | | | | | | 1,769 | | | 1,533 | | | 5,316 | | | 4,168 | |
| Total fees and commissions | | | | | | | | | | 8,777 | | | 8,467 | | | 25,490 | | | 24,495 | |
| Market making and similar activities | | | | | | | | | | 1,689 | | | 2,118 | | | 6,983 | | | 7,267 | |
| Other income | | | | | | | | | | (259) | | | 35 | | | (151) | | | 382 | |
| Total noninterest income | | | | | | | | | | $ | 10,207 | | | $ | 10,620 | | | $ | 32,322 | | | $ | 32,144 | |
(1)Gross interchange fees were $2.4 billion and $2.6 billion for the three months ended September 30, 2020 and 2019 and are presented net of $1.4 billion and $1.6 billion of expenses for rewards and partner payments as well as certain other card costs. Gross interchange fees were $6.7 billion and $7.4 billion for the nine months ended September 30, 2020 and 2019 and are presented net of $4.1 billion and $4.6 billion of expenses for rewards and partner payments as well as certain other card costs for the same periods.
NOTE 3Derivatives
Derivative Balances
Derivatives are entered into on behalf of customers, for trading or to support risk management activities. Derivatives used in risk management activities include derivatives that may or may not be designated in qualifying hedge accounting relationships. Derivatives that are not designated in qualifying hedge accounting relationships are referred to as other risk management derivatives. For more information on the Corporation’s derivatives and hedging activities, see Note 1 –
Summary of Significant Accounting Principlesto the Consolidated Financial Statementsof the Corporation’s 2019 Annual Report on Form 10-K. The following tables present derivative instruments included on the Consolidated Balance Sheet in derivative assets and liabilities at September 30, 2020 and December 31, 2019. Balances are presented on a gross basis, prior to the application of counterparty and cash collateral netting. Total derivative assets and liabilities are adjusted on an aggregate basis to take into consideration the effects of legally enforceable master netting agreements and have been reduced by cash collateral received or paid.
| | | | | | | | | | | | | | | | | | | | | | | | | | | | | | | | | | | | | | | | | |
| | | | | | | | | | | | | |
| | | September 30, 2020 |
| | | Gross Derivative Assets | | Gross Derivative Liabilities |
| (Dollars in billions) | Contract/ Notional (1) | | Trading and Other Risk Management Derivatives | | Qualifying
Accounting
Hedges | | Total | | Trading and Other Risk Management Derivatives | | Qualifying
Accounting
Hedges | | Total |
| Interest rate contracts | | | | | | | | | | | | | |
| Swaps | $ | 16,869.8 | | | $ | 203.8 | | | $ | 13.0 | | | $ | 216.8 | | | $ | 214.9 | | | $ | 0.9 | | | $ | 215.8 | |
| Futures and forwards | 5,599.2 | | | 2.0 | | | 0.1 | | | 2.1 | | | 1.9 | | | 0 | | | 1.9 | |
| Written options | 1,599.1 | | | 0 | | | 0 | | | 0 | | | 44.8 | | | 0 | | | 44.8 | |
| Purchased options | 1,573.0 | | | 51.2 | | | 0 | | | 51.2 | | | 0 | | | 0 | | | 0 | |
| Foreign exchange contracts | | | | | | | | | | | | | |
| Swaps | 1,471.8 | | | 30.9 | | | 0.4 | | | 31.3 | | | 34.8 | | | 0.6 | | | 35.4 | |
| Spot, futures and forwards | 4,278.5 | | | 35.9 | | | 0.2 | | | 36.1 | | | 36.0 | | | 0.1 | | | 36.1 | |
| Written options | 297.6 | | | 0 | | | 0 | | | 0 | | | 4.4 | | | 0 | | | 4.4 | |
| Purchased options | 294.7 | | | 4.6 | | | 0 | | | 4.6 | | | 0 | | | 0 | | | 0 | |
| Equity contracts | | | | | | | | | | | | | |
| Swaps | 291.2 | | | 12.0 | | | 0 | | | 12.0 | | | 12.5 | | | 0 | | | 12.5 | |
| Futures and forwards | 109.3 | | | 0.7 | | | 0 | | | 0.7 | | | 0.7 | | | 0 | | | 0.7 | |
| Written options | 650.3 | | | 0 | | | 0 | | | 0 | | | 44.5 | | | 0 | | | 44.5 | |
| Purchased options | 586.8 | | | 46.6 | | | 0 | | | 46.6 | | | 0 | | | 0 | | | 0 | |
| Commodity contracts | | | | | | | | | | | | | |
| Swaps | 36.7 | | | 2.9 | | | 0 | | | 2.9 | | | 4.1 | | | 0 | | | 4.1 | |
| Futures and forwards | 62.2 | | | 2.2 | | | 0 | | | 2.2 | | | 1.0 | | | 0 | | | 1.0 | |
| Written options | 29.5 | | | 0 | | | 0 | | | 0 | | | 2.3 | | | 0 | | | 2.3 | |
| Purchased options | 29.6 | | | 2.1 | | | 0 | | | 2.1 | | | 0 | | | 0 | | | 0 | |
Credit derivatives (2) | | | | | | | | | | | | | |
| Purchased credit derivatives: | | | | | | | | | | | | | |
| Credit default swaps | 398.7 | | | 4.3 | | | 0 | | | 4.3 | | | 4.3 | | | 0 | | | 4.3 | |
| Total return swaps/options | 92.1 | | | 0.5 | | | 0 | | | 0.5 | | | 1.1 | | | 0 | | | 1.1 | |
| Written credit derivatives: | | | | | | | | | | | | | |
| Credit default swaps | 386.8 | | | 4.2 | | | 0 | | | 4.2 | | | 3.6 | | | 0 | | | 3.6 | |
| Total return swaps/options | 83.2 | | | 0.5 | | | 0 | | | 0.5 | | | 0.6 | | | 0 | | | 0.6 | |
| Gross derivative assets/liabilities | | | $ | 404.4 | | | $ | 13.7 | | | $ | 418.1 | | | $ | 411.5 | | | $ | 1.6 | | | $ | 413.1 | |
| Less: Legally enforceable master netting agreements | | | | | | | (332.5) | | | | | | | (332.5) | |
| Less: Cash collateral received/paid | | | | | | | (41.3) | | | | | | | (38.9) | |
| Total derivative assets/liabilities | | | | | | | $ | 44.3 | | | | | | | $ | 41.7 | |
(1)Represents the total contract/notional amount of derivative assets and liabilities outstanding.
(2)The net derivative asset (liability) and notional amount of written credit derivatives for which the Corporation held purchased credit derivatives with identical underlying referenced names were $217 million and $332.6 billion at September 30, 2020.
| | | | | | | | | | | | | | | | | | | | | | | | | | | | | | | | | | | | | | | | | |
| | | | | | | | | | | | | |
| | | December 31, 2019 |
| | | Gross Derivative Assets | | Gross Derivative Liabilities |
| (Dollars in billions) | Contract/ Notional (1) | | Trading and Other Risk Management Derivatives | | Qualifying
Accounting
Hedges | | Total | | Trading and Other Risk Management Derivatives | | Qualifying
Accounting
Hedges | | Total |
| Interest rate contracts | | | | | | | | | | | | | |
| Swaps | $ | 15,074.4 | | | $ | 162.0 | | | $ | 9.7 | | | $ | 171.7 | | | $ | 168.5 | | | $ | 0.4 | | | $ | 168.9 | |
| Futures and forwards | 3,279.8 | | | 1.0 | | | 0 | | | 1.0 | | | 1.0 | | | 0 | | | 1.0 | |
| Written options | 1,767.7 | | | 0 | | | 0 | | | 0 | | | 32.5 | | | 0 | | | 32.5 | |
| Purchased options | 1,673.6 | | | 37.4 | | | 0 | | | 37.4 | | | 0 | | | 0 | | | 0 | |
| Foreign exchange contracts | | | | | | | | | | | | | |
| Swaps | 1,657.7 | | | 30.3 | | | 0.7 | | | 31.0 | | | 31.7 | | | 0.9 | | | 32.6 | |
| Spot, futures and forwards | 3,792.7 | | | 35.9 | | | 0.1 | | | 36.0 | | | 38.7 | | | 0.3 | | | 39.0 | |
| Written options | 274.3 | | | 0 | | | 0 | | | 0 | | | 3.8 | | | 0 | | | 3.8 | |
| Purchased options | 261.6 | | | 4.0 | | | 0 | | | 4.0 | | | 0 | | | 0 | | | 0 | |
| Equity contracts | | | | | | | | | | | | | |
| Swaps | 315.0 | | | 6.5 | | | 0 | | | 6.5 | | | 8.1 | | | 0 | | | 8.1 | |
| Futures and forwards | 125.1 | | | 0.3 | | | 0 | | | 0.3 | | | 1.1 | | | 0 | | | 1.1 | |
| Written options | 731.1 | | | 0 | | | 0 | | | 0 | | | 34.6 | | | 0 | | | 34.6 | |
| Purchased options | 668.6 | | | 42.4 | | | 0 | | | 42.4 | | | 0 | | | 0 | | | 0 | |
| Commodity contracts | | | | | | | | | | | | | |
| Swaps | 42.0 | | | 2.1 | | | 0 | | | 2.1 | | | 4.4 | | | 0 | | | 4.4 | |
| Futures and forwards | 61.3 | | | 1.7 | | | 0 | | | 1.7 | | | 0.4 | | | 0 | | | 0.4 | |
| Written options | 33.2 | | | 0 | | | 0 | | | 0 | | | 1.4 | | | 0 | | | 1.4 | |
| Purchased options | 37.9 | | | 1.4 | | | 0 | | | 1.4 | | | 0 | | | 0 | | | 0 | |
Credit derivatives (2) | | | | | | | | | | | | | |
| Purchased credit derivatives: | | | | | | | | | | | | | |
| Credit default swaps | 321.6 | | | 2.7 | | | 0 | | | 2.7 | | | 5.6 | | | 0 | | | 5.6 | |
| Total return swaps/options | 86.6 | | | 0.4 | | | 0 | | | 0.4 | | | 1.3 | | | 0 | | | 1.3 | |
| Written credit derivatives: | | | | | | | | | | | | | |
| Credit default swaps | 300.2 | | | 5.4 | | | 0 | | | 5.4 | | | 2.0 | | | 0 | | | 2.0 | |
| Total return swaps/options | 86.2 | | | 0.8 | | | 0 | | | 0.8 | | | 0.4 | | | 0 | | | 0.4 | |
| Gross derivative assets/liabilities | | | $ | 334.3 | | | $ | 10.5 | | | $ | 344.8 | | | $ | 335.5 | | | $ | 1.6 | | | $ | 337.1 | |
| Less: Legally enforceable master netting agreements | | | | | | | (270.4) | | | | | | | (270.4) | |
| Less: Cash collateral received/paid | | | | | | | (33.9) | | | | | | | (28.5) | |
| Total derivative assets/liabilities | | | | | | | $ | 40.5 | | | | | | | $ | 38.2 | |
(1)Represents the total contract/notional amount of derivative assets and liabilities outstanding.
(2)The net derivative asset (liability) and notional amount of written credit derivatives for which the Corporation held purchased credit derivatives with identical underlying referenced names were $2.8 billion and $309.7 billion at December 31, 2019.
Offsetting of Derivatives
The Corporation enters into International Swaps and Derivatives Association, Inc. (ISDA) master netting agreements or similar agreements with substantially all of the Corporation’s derivative counterparties. For more information, see Note 3 – Derivatives to the Consolidated Financial Statementsof the Corporation’s 2019 Annual Report on Form 10-K.
The following table presents derivative instruments included in derivative assets and liabilities on the Consolidated Balance Sheet at September 30, 2020 and December 31, 2019 by primary risk (e.g., interest rate risk) and the platform, where
applicable, on which these derivatives are transacted. Balances are presented on a gross basis, prior to the application of counterparty and cash collateral netting. Total gross derivative assets and liabilities are adjusted on an aggregate basis to take into consideration the effects of legally enforceable master netting agreements which include reducing the balance for counterparty netting and cash collateral received or paid.
For more information on offsetting of securities financing agreements, see Note 9 – Federal Funds Sold or Purchased, Securities Financing Agreements, Short-term Borrowings and Restricted Cash.
| | | | | | | | | | | | | | | | | | | | | | | |
| | | | | | | |
Offsetting of Derivatives (1) | | | | | | | |
| | | | | | | |
| Derivative
Assets | | Derivative Liabilities | | Derivative
Assets | | Derivative Liabilities |
| (Dollars in billions) | September 30, 2020 | | December 31, 2019 |
| Interest rate contracts | | | | | | | |
| Over-the-counter | $ | 260.6 | | | $ | 253.1 | | | $ | 203.1 | | | $ | 196.6 | |
| Exchange-traded | 0.1 | | | 0.1 | | | 0.1 | | | 0.1 | |
| Over-the-counter cleared | 9.5 | | | 8.7 | | | 6.0 | | | 5.3 | |
| Foreign exchange contracts | | | | | | | |
| Over-the-counter | 69.3 | | | 73.5 | | | 69.2 | | | 73.1 | |
| Over-the-counter cleared | 1.1 | | | 1.0 | | | 0.5 | | | 0.5 | |
| Equity contracts | | | | | | | |
| Over-the-counter | 26.0 | | | 22.3 | | | 21.3 | | | 17.8 | |
| Exchange-traded | 31.9 | | | 32.2 | | | 26.4 | | | 22.8 | |
| Commodity contracts | | | | | | | |
| Over-the-counter | 5.0 | | | 5.3 | | | 2.8 | | | 4.2 | |
| Exchange-traded | 1.0 | | | 1.1 | | | 0.8 | | | 0.8 | |
| Over-the-counter cleared | 0 | | | 0 | | | 0 | | | 0.1 | |
| Credit derivatives | | | | | | | |
| Over-the-counter | 6.8 | | | 7.1 | | | 6.4 | | | 6.6 | |
| Over-the-counter cleared | 2.6 | | | 2.3 | | | 2.5 | | | 2.2 | |
| Total gross derivative assets/liabilities, before netting | | | | | | | |
| Over-the-counter | 367.7 | | | 361.3 | | | 302.8 | | | 298.3 | |
| Exchange-traded | 33.0 | | | 33.4 | | | 27.3 | | | 23.7 | |
| Over-the-counter cleared | 13.2 | | | 12.0 | | | 9.0 | | | 8.1 | |
| Less: Legally enforceable master netting agreements and cash collateral received/paid | | | | | | | |
| Over-the-counter | (332.6) | | | (330.8) | | | (274.7) | | | (269.3) | |
| Exchange-traded | (28.9) | | | (28.9) | | | (21.5) | | | (21.5) | |
| Over-the-counter cleared | (12.3) | | | (11.7) | | | (8.1) | | | (8.1) | |
| Derivative assets/liabilities, after netting | 40.1 | | | 35.3 | | | 34.8 | | | 31.2 | |
Other gross derivative assets/liabilities (2) | 4.2 | | | 6.4 | | | 5.7 | | | 7.0 | |
| Total derivative assets/liabilities | 44.3 | | | 41.7 | | | 40.5 | | | 38.2 | |
Less: Financial instruments collateral (3) | (15.8) | | | (16.4) | | | (14.6) | | | (16.1) | |
| Total net derivative assets/liabilities | $ | 28.5 | | | $ | 25.3 | | | $ | 25.9 | | | $ | 22.1 | |
(1)Over-the-counter derivatives include bilateral transactions between the Corporation and a particular counterparty. Over-the-counter-cleared derivatives include bilateral transactions between the Corporation and a counterparty where the transaction is cleared through a clearinghouse. Exchange-traded derivatives include listed options transacted on an exchange.
(2)Consists of derivatives entered into under master netting agreements where the enforceability of these agreements is uncertain under bankruptcy laws in some countries or industries.
(3)Amounts are limited to the derivative asset/liability balance and, accordingly, do not include excess collateral received/pledged. Financial instruments collateral includes securities collateral received or pledged and cash securities held and posted at third-party custodians that are not offset on the Consolidated Balance Sheet but shown as a reduction to derive net derivative assets and liabilities.
ALM and Risk Management Derivatives
The Corporation’s asset and liability management (ALM) and risk management activities include the use of derivatives to mitigate risk to the Corporation including derivatives designated in qualifying hedge accounting relationships and derivatives used in other risk management activities. For more information on ALM and risk management derivatives, see Note 3 – Derivatives to the Consolidated Financial Statements of the Corporation’s 2019 Annual Report on Form 10-K.
Derivatives Designated as Accounting Hedges
The Corporation uses various types of interest rate and foreign exchange derivative contracts to protect against changes in the fair value of its assets and liabilities due to fluctuations in
interest rates and exchange rates (fair value hedges). The Corporation also uses these types of contracts to protect against changes in the cash flows of its assets and liabilities, and other forecasted transactions (cash flow hedges). The Corporation hedges its net investment in consolidated non-U.S. operations determined to have functional currencies other than the U.S. dollar using forward exchange contracts and cross-currency basis swaps, and by issuing foreign currency-denominated debt (net investment hedges).
Fair Value Hedges
The following table summarizes information related to fair value hedges for the three and nine months ended September 30, 2020 and 2019.
| | | | | | | | | | | | | | | | | | | | | | | | | | | | | | | | | | | | | |
| | | | | | | | | | | | | | | | | | | | | |
| Gains and Losses on Derivatives Designated as Fair Value Hedges | | | | | | |
| | | | | | | | | | | | | | | | | | | | | |
| Three Months Ended September 30, 2020 | | | | Three Months Ended September 30, 2019 | | | | | | | | | | | | |
| | | | | | | | | | | | | | | | | |
| (Dollars in millions) | Derivative | | Hedged Item | | | | Derivative | | Hedged Item | | | | |
| | | | | | | | | | | | | | | | | |
Interest rate risk on long-term debt (1) | $ | (1,523) | | | $ | 1,473 | | | | | $ | 3,328 | | | $ | (3,342) | | | | | | | | | | | | | |
Interest rate and foreign currency risk on long-term debt (2) | 79 | | | (87) | | | | | (110) | | | 111 | | | | | | | | | | | | | |
Interest rate risk on available-for-sale securities (3) | 139 | | | (139) | | | | | (33) | | | 30 | | | | | | | | | | | | | |
| | | | | | | | | | | | | | | | | | | | | |
| Total | $ | (1,305) | | | $ | 1,247 | | | | | $ | 3,185 | | | $ | (3,201) | | | | | | | | | | | | | |
| | | | | | | | | | | | | | | | | | | | | |
| Nine Months Ended September 30, 2020 | | | | Nine Months Ended September 30, 2019 | | | | | | | | | | | |
| Derivative | | Hedged Item | | | | Derivative | | Hedged Item | | | | | | | | | | | | |
Interest rate risk on long-term debt (1) | $ | 9,286 | | | $ | (9,403) | | | | | $ | 9,373 | | | $ | (9,392) | | | | | | | | | | | | | |
Interest rate and foreign currency risk on long-term debt (2) | 644 | | | (638) | | | | | (12) | | | 31 | | | | | | | | | | | | | |
Interest rate risk on available-for-sale securities (3) | (572) | | | 559 | | | | | (133) | | | 128 | | | | | | | | | | | | | |
| | | | | | | | | | | | | | | | | | | | | |
| Total | $ | 9,358 | | | $ | (9,482) | | | | | $ | 9,228 | | | $ | (9,233) | | | | | | | | | | | | | |
(1)Amounts are recorded in interest expense in the Consolidated Statement of Income.
(2)For the three and nine months ended September 30, 2020, the derivative amount includes gains (losses) of $(13) million and $718 million in interest expense, $95 million and $(83) million in market making and similar activities, and $(3) million and $9 million in accumulated OCI. For the same periods in 2019, the derivative amount includes gains (losses) of $(59) million and $108 million in interest expense, $(53) million and $(142) million in market making and similar activities, and $2 million and $22 million in accumulated OCI. Line item totals are in the Consolidated Statement of Income and on the Consolidated Balance Sheet.
(3)Amounts are recorded in interest income in the Consolidated Statement of Income.
The table below summarizes the carrying value of hedged assets and liabilities that are designated and qualifying in fair value hedging relationships along with the cumulative amount of fair value hedging adjustments included in the carrying value that have been recorded in the current hedging relationships. These fair value hedging adjustments are open basis adjustments that are not subject to amortization as long as the hedging relationship remains designated.
| | | | | | | | | | | | | | | | | | | | | | | | | | | | |
| | | | | | | | | | | | |
| Designated Fair Value Hedged Assets (Liabilities) | |
| | | | | | | | | | | | |
| September 30, 2020 | | December 31, 2019 | | | | | |
| (Dollars in millions) | Carrying Value | | Cumulative Fair Value Adjustments (1) | | Carrying Value | | Cumulative Fair Value Adjustments (1) | | | | | |
| | | | | | | | |
Long-term debt (2) | $ | (126,852) | | | $ | (12,071) | | | $ | (162,389) | | | $ | (8,685) | | | | | | |
Available-for-sale debt securities (2, 3, 4) | 102,474 | | | 566 | | | 1,654 | | | 64 | | | | | | |
| | | | | | | | | | | | |
| |
| | | | | | | | | | | | |
| | | | | | |
| | | | | | |
| | | | | | | | | | | | |
| | | | | | | | | | | | |
| | | | | | | | | | | | |
(1)For assets, increase (decrease) to carrying value and for liabilities, (increase) decrease to carrying value.
(2)At September 30, 2020, the cumulative fair value adjustments remaining on long-term debt and AFS debt securities from discontinued hedging relationships resulted in an increase in the related liability of $1.3 billion and a decrease in the related asset of $6 million compared to a decrease in the related liability of $1.3 billion and an increase in the related asset of $8 million at December 31, 2019, which are being amortized over the remaining contractual life of the de-designated hedged items.
(3)These amounts include the amortized cost basis of the prepayable financial assets used to designate hedging relationships in which the hedged item is the last layer expected to be remaining at the end of the hedging relationship. At September 30, 2020, the amortized cost of the closed portfolios used in these hedging relationships was $40.2 billion, of which $8.4 billion was designated in the hedging relationship. The cumulative basis adjustments associated with these hedging relationships totaled $33 million.
(4)Carrying value represents amortized cost.
Cash Flow and Net Investment Hedges
The following table summarizes certain information related to cash flow hedges and net investment hedges for the three and nine months ended September 30, 2020 and 2019. Of the $408 million after-tax net gain ($542 million pretax) on derivatives in accumulated OCI at September 30, 2020, gains of $191 million after-tax ($252 million pretax) related to open cash flow hedges are expected to be reclassified into earnings
in the next 12 months. These net gains reclassified into earnings are expected to primarily increase net interest income related to the respective hedged items. For terminated cash flow hedges, the time period over which the majority of the forecasted transactions are hedged is approximately 3 years, with a maximum length of time for certain forecasted transactions of 16 years.
| | | | | | | | | | | | | | | | | | | | | | | | | | | | | | | | | | | | | | | | |
| | | | | | | | | | | | | | | | | | | | | | | | |
| Gains and Losses on Derivatives Designated as Cash Flow and Net Investment Hedges | | | |
| | | | | | | | | | | | | | | | | | | | | | | | |
| | | | | | | | | | |
| | | | | | | | | | | | | | | | | | | | |
| | | | | Gains (Losses) Recognized in
Accumulated OCI
on Derivatives | | Gains (Losses)
in Income
Reclassified from Accumulated OCI | | Gains (Losses) Recognized in
Accumulated OCI
on Derivatives | | Gains (Losses)
in Income
Reclassified from Accumulated OCI | | | | | | | | | | | | | |
| (Dollars in millions, amounts pretax) | | | | | Three Months Ended September 30, 2020 | | Nine Months Ended September 30, 2020 | | | | | | | | | | | | | |
| Cash flow hedges | | | | | | | | | | | | | | | | | | | | | | | | |
Interest rate risk on variable-rate assets (1) | | | | | $ | (101) | | | $ | 5 | | | $ | 810 | | | $ | (44) | | | | | | | | | | | | | | |
Price risk on forecasted MBS purchases (1) | | | | | 184 | | | 3 | | | 184 | | | 3 | | | | | | | | | | | | | | |
Price risk on certain compensation plans (2) | | | | | 32 | | | 5 | | | 23 | | | 5 | | | | | | | | | | | | | | |
| Total | | | | | $ | 115 | | | $ | 13 | | | $ | 1,017 | | | $ | (36) | | | | | | | | | | | | | | |
| Net investment hedges | | | | | | | | | | | | | | | | | | | | | | | | |
Foreign exchange risk (3) | | | | | $ | (703) | | | $ | 0 | | | $ | 265 | | | $ | 1 | | | | | | | | | | | | | | |
| | | | | | | | | | | | | | | | | | | | | | | | |
| | | | | Three Months Ended September 30, 2019 | | Nine Months Ended September 30, 2019 | | | | | | | | | | | | | |
| Cash flow hedges | | | | | | | | | | | | | | | | | | | | | | | | |
Interest rate risk on variable-rate assets (1) | | | | | $ | 125 | | | $ | (27) | | | $ | 743 | | | $ | (78) | | | | | | | | | | | | | | |
| | | | | | | | | | | | | | | | | | | | | | | | |
| | | | | | | | | | | | | | | | | | | | | | | | |
| Net investment hedges | | | | | | | | | | | | | | | | | | | | | | | | |
Foreign exchange risk (3) | | | | | $ | 786 | | | $ | 362 | | | $ | 590 | | | $ | 363 | | | | | | | | | | | | | | |
(1)Amounts reclassified from accumulated OCI are recorded in interest income in the Consolidated Statement of Income.
(2)Amounts reclassified from accumulated OCI are recorded in compensation and benefits expense in the Consolidated Statement of Income.
(3)Amounts reclassified from accumulated OCI are recorded in other income in the Consolidated Statement of Income. For the three and nine months ended September 30, 2020, amounts excluded from effectiveness testing and recognized in market making and similar activities were gains of $10 million and $115 million. For the same periods in 2019, amounts excluded from effectiveness testing and recognized in market making and similar activities were gains of $32 million and $109 million.
Other Risk Management Derivatives
Other risk management derivatives are used by the Corporation to reduce certain risk exposures by economically hedging various assets and liabilities. The following table presents gains (losses) on these derivatives for the three and nine months ended September 30, 2020 and 2019. These gains (losses) are largely offset by the income or expense recorded on the hedged item.
| | | | | | | | | | | | | | | | | | | | | | | | | |
| | | | | | | | | |
| Gains and Losses on Other Risk Management Derivatives |
| | | | | | | | | |
| | | | | | | | | |
| Three Months Ended September 30 | | Nine Months Ended September 30 |
| (Dollars in millions) | 2020 | | 2019 | | 2020 | | 2019 | | |
Interest rate risk on mortgage activities (1, 2) | $ | 32 | | | $ | 110 | | | $ | 473 | | | $ | 361 | | | |
Credit risk on loans (2) | (28) | | | (8) | | | (6) | | | (48) | | | |
Interest rate and foreign currency risk on ALM activities (3) | (2,571) | | | 1,576 | | | (2,060) | | | 2,450 | | | |
Price risk on certain compensation plans (4) | 263 | | | (7) | | | 109 | | | 629 | | | |
(1)Primarily related to hedges of interest rate risk on mortgage servicing rights and interest rate lock commitments to originate mortgage loans that will be held for sale. The net gains on interest rate lock commitments which are not included in the table but are considered derivative instruments, were $41 million and $128 million for the three and nine months ended September 30, 2020 compared to $20 million and $56 million for the same periods in 2019.
(2)Gains (losses) on these derivatives are recorded in other income.
(3)Gains (losses) on these derivatives are recorded in market making and similar activities.
(4)Gains (losses) on these derivatives are recorded in compensation and benefits expense.
Transfers of Financial Assets with Risk Retained through Derivatives
The Corporation enters into certain transactions involving the transfer of financial assets that are accounted for as sales where substantially all of the economic exposure to the transferred financial assets is retained through derivatives (e.g., interest rate and/or credit), but the Corporation does not retain control over the assets transferred. At September 30, 2020 and December 31, 2019, the Corporation had transferred $5.1 billion and $5.2 billion of non-U.S. government-guaranteed mortgage-backed securities (MBS) to a third-party trust and retained economic exposure to the transferred assets through derivative contracts. In connection with these transfers, the Corporation received gross cash proceeds of $5.1 billion and $5.2 billion at the transfer dates. At September 30, 2020 and December 31, 2019, the fair value of the transferred securities was $5.2 billion and $5.3 billion.
Sales and Trading Revenue
The Corporation enters into trading derivatives to facilitate client transactions and to manage risk exposures arising from trading
account assets and liabilities. It is the Corporation’s policy to include these derivative instruments in its trading activities, which include derivatives and non-derivative cash instruments. The resulting risk from these derivatives is managed on a portfolio basis as part of the Corporation’s Global Markets business segment. For more information on sales and trading revenue, see Note 3 – Derivatives to the Consolidated Financial Statements of the Corporation’s 2019 Annual Report on Form 10-K.
The following table, which includes both derivatives and non-derivative cash instruments, identifies the amounts in the respective income statement line items attributable to the Corporation’s sales and trading revenue in Global Markets, categorized by primary risk, for the three and nine months ended September 30, 2020 and 2019. This table includes debit valuation adjustment (DVA) and funding valuation adjustment (FVA) gains (losses). Global Markets results in Note 17 – Business Segment Information are presented on a fully taxable-equivalent (FTE) basis. The table below is not presented on an FTE basis.
| | | | | | | | | | | | | | | | | | | | | | | | | | | | | | | | | | | | | | | | | | | | | | | |
| | | | | | | | | | | | | | | |
| Sales and Trading Revenue |
| | | | | | | | | | | | | | | |
| Market making and similar activities | | Net Interest
Income | | Other (1) | | Total | | Market making and similar activities | | Net Interest
Income | | Other (1) | | Total |
| | | |
| (Dollars in millions) | Three Months Ended September 30, 2020 | | Nine Months Ended September 30, 2020 |
| Interest rate risk | $ | 65 | | | $ | 576 | | | $ | 58 | | | $ | 699 | | | $ | 2,253 | | | $ | 1,851 | | | $ | 179 | | | $ | 4,283 | |
| Foreign exchange risk | 340 | | | (10) | | | 4 | | | 334 | | | 1,145 | | | (8) | | | (3) | | | 1,134 | |
| Equity risk | 817 | | | (7) | | | 391 | | | 1,201 | | | 2,820 | | | (99) | | | 1,361 | | | 4,082 | |
| Credit risk | 411 | | | 370 | | | 74 | | | 855 | | | 567 | | | 1,239 | | | 250 | | | 2,056 | |
| Other risk | 92 | | | (7) | | | 12 | | | 97 | | | 272 | | | 21 | | | 24 | | | 317 | |
| Total sales and trading revenue | $ | 1,725 | | | $ | 922 | | | $ | 539 | | | $ | 3,186 | | | $ | 7,057 | | | $ | 3,004 | | | $ | 1,811 | | | $ | 11,872 | |
| | | | | | | | | | | | | | | |
| | | | | | | | | | | | | | | |
| Three Months Ended September 30, 2019 | | Nine Months Ended September 30, 2019 |
| Interest rate risk | $ | 30 | | | $ | 477 | | | $ | 212 | | | $ | 719 | | | $ | 659 | | | $ | 1,273 | | | $ | 357 | | | $ | 2,289 | |
| Foreign exchange risk | 313 | | | 16 | | | 12 | | | 341 | | | 954 | | | 50 | | | 28 | | | 1,032 | |
| Equity risk | 907 | | | (121) | | | 366 | | | 1,152 | | | 2,886 | | | (560) | | | 1,161 | | | 3,487 | |
| Credit risk | 273 | | | 451 | | | 140 | | | 864 | | | 1,039 | | | 1,349 | | | 405 | | | 2,793 | |
| Other risk | 57 | | | 11 | | | 12 | | | 80 | | | 83 | | | 58 | | | 40 | | | 181 | |
| Total sales and trading revenue | $ | 1,580 | | | $ | 834 | | | $ | 742 | | | $ | 3,156 | | | $ | 5,621 | | | $ | 2,170 | | | $ | 1,991 | | | $ | 9,782 | |
| | | | | | | | | | | | | | | |
| | | |
| | | | | | | | | | | | | | | |
| | | | | | | | | | | | | | | |
| | | | | | | | | | | | | | | |
| | | | | | | | | | | | | | | |
| | | | | | | | | | | | | | | |
| | | | | | | | | | | | | | | |
(1)Represents amounts in investment and brokerage services and other income that are recorded in Global Markets and included in the definition of sales and trading revenue. Includes investment and brokerage services revenue of $430 million and $1.5 billion for the three and nine months ended September 30, 2020 compared to $410 million and $1.3 billion for the same periods in 2019.
Credit Derivatives
The Corporation enters into credit derivatives primarily to facilitate client transactions and to manage credit risk exposures. Credit derivatives are classified as investment and non-investment grade based on the credit quality of the underlying referenced obligation. The Corporation considers ratings of BBB- or higher as investment grade. Non-investment grade includes non-rated credit derivative instruments. The Corporation discloses internal categorizations of investment
grade and non-investment grade consistent with how risk is managed for these instruments. For more information on credit derivatives, see Note 3 – Derivatives to the Consolidated Financial Statements of the Corporation’s 2019 Annual Report on Form 10-K.
Credit derivative instruments where the Corporation is the seller of credit protection and their expiration at September 30, 2020 and December 31, 2019 are summarized in the following table.
| | | | | | | | | | | | | | | | | | | | | | | | | | | | | |
| | | | | | | | | |
| Credit Derivative Instruments | | | | | | | | | |
| | | | | | | | | |
| Less than
One Year | | One to
Three Years | | Three to
Five Years | | Over Five
Years | | Total |
| September 30, 2020 |
| (Dollars in millions) | Carrying Value |
| Credit default swaps: | | | | | | | | | |
| Investment grade | $ | 0 | | | $ | 10 | | | $ | 79 | | | $ | 213 | | | $ | 302 | |
| Non-investment grade | 54 | | | 527 | | | 1,059 | | | 1,698 | | | 3,338 | |
| Total | 54 | | | 537 | | | 1,138 | | | 1,911 | | | 3,640 | |
| Total return swaps/options: | | | | | | | | | |
| Investment grade | 120 | | | 0 | | | 0 | | | 0 | | | 120 | |
| Non-investment grade | 508 | | | 1 | | | 0 | | | 0 | | | 509 | |
| Total | 628 | | | 1 | | | 0 | | | 0 | | | 629 | |
| Total credit derivatives | $ | 682 | | | $ | 538 | | | $ | 1,138 | | | $ | 1,911 | | | $ | 4,269 | |
| Credit-related notes: | | | | | | | | | |
| Investment grade | $ | 0 | | | $ | 2 | | | $ | 0 | | | $ | 579 | | | $ | 581 | |
| Non-investment grade | 6 | | | 2 | | | 4 | | | 1,019 | | | 1,031 | |
| Total credit-related notes | $ | 6 | | | $ | 4 | | | $ | 4 | | | $ | 1,598 | | | $ | 1,612 | |
| | Maximum Payout/Notional |
| Credit default swaps: | | | | | | | | | |
| Investment grade | $ | 45,486 | | | $ | 78,733 | | | $ | 116,365 | | | $ | 34,056 | | | $ | 274,640 | |
| Non-investment grade | 19,008 | | | 31,252 | | | 44,187 | | | 17,721 | | | 112,168 | |
| Total | 64,494 | | | 109,985 | | | 160,552 | | | 51,777 | | | 386,808 | |
| Total return swaps/options: | | | | | | | | | |
| Investment grade | 50,952 | | | 61 | | | 74 | | | 0 | | | 51,087 | |
| Non-investment grade | 31,484 | | | 656 | | | 0 | | | 5 | | | 32,145 | |
| Total | 82,436 | | | 717 | | | 74 | | | 5 | | | 83,232 | |
| Total credit derivatives | $ | 146,930 | | | $ | 110,702 | | | $ | 160,626 | | | $ | 51,782 | | | $ | 470,040 | |
| | | | | | | | | |
| December 31, 2019 |
| Carrying Value |
| Credit default swaps: | | | | | | | | | |
| Investment grade | $ | 0 | | | $ | 5 | | | $ | 60 | | | $ | 164 | | | $ | 229 | |
| Non-investment grade | 70 | | | 292 | | | 561 | | | 808 | | | 1,731 | |
| Total | 70 | | | 297 | | | 621 | | | 972 | | | 1,960 | |
| Total return swaps/options: | | | | | | | | | |
| Investment grade | 35 | | | 0 | | | 0 | | | 0 | | | 35 | |
| Non-investment grade | 344 | | | 0 | | | 0 | | | 0 | | | 344 | |
| Total | 379 | | | 0 | | | 0 | | | 0 | | | 379 | |
| Total credit derivatives | $ | 449 | | | $ | 297 | | | $ | 621 | | | $ | 972 | | | $ | 2,339 | |
| Credit-related notes: | | | | | | | | | |
| Investment grade | $ | 0 | | | $ | 3 | | | $ | 1 | | | $ | 639 | | | $ | 643 | |
| Non-investment grade | 6 | | | 2 | | | 1 | | | 1,125 | | | 1,134 | |
| Total credit-related notes | $ | 6 | | | $ | 5 | | | $ | 2 | | | $ | 1,764 | | | $ | 1,777 | |
| | Maximum Payout/Notional |
| Credit default swaps: | | | | | | | | | |
| Investment grade | $ | 55,827 | | | $ | 67,838 | | | $ | 71,320 | | | $ | 17,708 | | | $ | 212,693 | |
| Non-investment grade | 19,049 | | | 26,521 | | | 29,618 | | | 12,337 | | | 87,525 | |
| Total | 74,876 | | | 94,359 | | | 100,938 | | | 30,045 | | | 300,218 | |
| Total return swaps/options: | | | | | | | | | |
| Investment grade | 56,488 | | | 0 | | | 62 | | | 76 | | | 56,626 | |
| Non-investment grade | 28,707 | | | 657 | | | 104 | | | 60 | | | 29,528 | |
| Total | 85,195 | | | 657 | | | 166 | | | 136 | | | 86,154 | |
| Total credit derivatives | $ | 160,071 | | | $ | 95,016 | | | $ | 101,104 | | | $ | 30,181 | | | $ | 386,372 | |
The notional amount represents the maximum amount payable by the Corporation for most credit derivatives. However, the Corporation does not monitor its exposure to credit derivatives based solely on the notional amount because this measure does not take into consideration the probability of occurrence. As such, the notional amount is not a reliable indicator of the Corporation’s exposure to these contracts.
Instead, a risk framework is used to define risk tolerances and establish limits so that certain credit risk-related losses occur within acceptable, predefined limits.
Credit-related notes in the table above include investments in securities issued by collateralized debt obligation (CDO), collateralized loan obligation and credit-linked note vehicles. These instruments are primarily classified as trading securities.
The carrying value of these instruments equals the Corporation’s maximum exposure to loss. The Corporation is not obligated to make any payments to the entities under the terms of the securities owned.
Credit-related Contingent Features and Collateral
Certain of the Corporation’s derivative contracts contain credit risk-related contingent features, primarily in the form of ISDA master netting agreements and credit support documentation that enhance the creditworthiness of these instruments compared to other obligations of the respective counterparty with whom the Corporation has transacted. These contingent features may be for the benefit of the Corporation as well as its counterparties with respect to changes in the Corporation’s creditworthiness and the mark-to-market exposure under the derivative transactions. At September 30, 2020 and December 31, 2019, the Corporation held cash and securities collateral of $91.7 billion and $84.3 billion and posted cash and securities collateral of $79.9 billion and $69.1 billion in the normal course of business under derivative agreements, excluding cross-product margining agreements where clients are permitted to margin on a net basis for both derivative and secured financing arrangements.
In connection with certain over-the-counter derivative contracts and other trading agreements, the Corporation can be required to provide additional collateral or to terminate transactions with certain counterparties in the event of a downgrade of the senior debt ratings of the Corporation or certain subsidiaries. The amount of additional collateral required depends on the contract and is usually a fixed incremental amount and/or the market value of the exposure. For more information on credit-related contingent features and collateral, see Note 3 – Derivatives to the Consolidated Financial Statements of the Corporation’s 2019 Annual Report on Form 10-K.
At September 30, 2020, the amount of collateral, calculated based on the terms of the contracts, that the Corporation and certain subsidiaries could be required to post to counterparties but had not yet posted to counterparties was $1.9 billion, including $945 million for Bank of America, National Association.
Some counterparties are currently able to unilaterally terminate certain contracts, or the Corporation or certain subsidiaries may be required to take other action such as find a suitable replacement or obtain a guarantee. At September 30, 2020 and December 31, 2019, the liability recorded for these derivative contracts was not significant.
The following table presents the amount of additional collateral that would have been contractually required by derivative contracts and other trading agreements at September 30, 2020 if the rating agencies had downgraded their long-term senior debt ratings for the Corporation or certain subsidiaries by one incremental notch and by an additional second incremental notch.
| | | | | | | | | | | |
| | | |
| Additional Collateral Required to be Posted Upon Downgrade at September 30, 2020 |
| | | |
| (Dollars in millions) | One
incremental notch | | Second
incremental notch |
| Bank of America Corporation | $ | 303 | | | $ | 724 | |
Bank of America, N.A. and subsidiaries (1) | 85 | | | 536 | |
(1)Included in Bank of America Corporation collateral requirements in this table.
The following table presents the derivative liabilities that would be subject to unilateral termination by counterparties and the amounts of collateral that would have been contractually required at September 30, 2020 if the long-term senior debt ratings for the Corporation or certain subsidiaries had been lower by one incremental notch and by an additional second incremental notch.
| | | | | | | | | | | |
| | | |
| Derivative Liabilities Subject to Unilateral Termination Upon Downgrade at September 30, 2020 |
| | | |
| (Dollars in millions) | One
incremental notch | | Second
incremental notch |
| Derivative liabilities | $ | 14 | | | $ | 935 | |
| Collateral posted | 1 | | | 611 | |
Valuation Adjustments on Derivatives
The table below presents credit valuation adjustment (CVA), DVA and FVA gains (losses) on derivatives (excluding the effect of any related hedge activities), which are recorded in market making and similar activities, for the three and nine months ended September 30, 2020 and 2019. For more information on the valuation adjustments on derivatives, see Note 3 – Derivatives to the Consolidated Financial Statements of the Corporation’s 2019 Annual Report on Form 10-K.
| | | | | | | | | | | | | | |
| | | | | | |
Valuation Adjustments Gains (Losses) on Derivatives (1) |
| | | | | | |
| | | | |
| Three Months Ended September 30 | | | |
| (Dollars in millions) | 2020 | | 2019 | | |
| | | | | | |
| Derivative assets (CVA) | $ | 174 | | | $ | (41) | | | | |
| Derivative assets/liabilities (FVA) | 27 | | | (60) | | | | |
| Derivative liabilities (DVA) | (105) | | | 17 | | | | |
| | | | | | |
| Nine Months Ended September 30 | | | |
| (Dollars in millions) | 2020 | | 2019 | | |
| Derivative assets (CVA) | $ | (334) | | | $ | (39) | | | | |
| Derivative assets/liabilities (FVA) | (60) | | | (27) | | | | |
| Derivative liabilities (DVA) | 53 | | | (56) | | | | |
| | | | | | |
(1)At September 30, 2020 and December 31, 2019, cumulative CVA reduced the derivative assets balance by $862 million and $528 million, cumulative FVA reduced the net derivatives balance by $213 million and $153 million, and cumulative DVA reduced the derivative liabilities balance by $338 million and $285 million, respectively.
NOTE 4Securities
The table below presents the amortized cost, gross unrealized gains and losses, and fair value of AFS debt securities, other debt securities carried at fair value and HTM debt securities at September 30, 2020 and December 31, 2019.
| | | | | | | | | | | | | | | | | | | | | | | |
| | | | | | | |
| Debt Securities | | | | |
| |
| Amortized
Cost | | Gross
Unrealized
Gains | | Gross
Unrealized
Losses | | Fair
Value |
| (Dollars in millions) | September 30, 2020 |
| Available-for-sale debt securities | | | | | | | |
| Mortgage-backed securities: | | | | | | | |
| Agency | $ | 67,566 | | | $ | 2,349 | | | $ | (51) | | | $ | 69,864 | |
| Agency-collateralized mortgage obligations | 5,663 | | | 189 | | | (15) | | | 5,837 | |
| Commercial | 15,190 | | | 1,017 | | | (1) | | | 16,206 | |
Non-agency residential (1) | 1,167 | | | 146 | | | (30) | | | 1,283 | |
| Total mortgage-backed securities | 89,586 | | | 3,701 | | | (97) | | | 93,190 | |
| U.S. Treasury and agency securities | 100,508 | | | 2,377 | | | (7) | | | 102,878 | |
| Non-U.S. securities | 16,333 | | | 34 | | | (13) | | | 16,354 | |
| | | | | | | |
| Other taxable securities, substantially all asset-backed securities | 3,628 | | | 58 | | | (10) | | | 3,676 | |
| Total taxable securities | 210,055 | | | 6,170 | | | (127) | | | 216,098 | |
| Tax-exempt securities | 17,299 | | | 340 | | | (45) | | | 17,594 | |
| Total available-for-sale debt securities | 227,354 | | | 6,510 | | | (172) | | | 233,692 | |
Other debt securities carried at fair value (2) | 11,982 | | | 399 | | | (76) | | | 12,305 | |
| Total debt securities carried at fair value | 239,336 | | | 6,909 | | | (248) | | | 245,997 | |
| Held-to-maturity debt securities, substantially all U.S. agency mortgage-backed securities | 338,418 | | | 9,727 | | | (228) | | | 347,917 | |
Total debt securities (3,4) | $ | 577,754 | | | $ | 16,636 | | | $ | (476) | | | $ | 593,914 | |
| | | | | | | |
| | | | | | | |
| December 31, 2019 |
| Available-for-sale debt securities | | | | | | | |
| Mortgage-backed securities: | | | | | | | |
| Agency | $ | 121,698 | | | $ | 1,013 | | | $ | (183) | | | $ | 122,528 | |
| Agency-collateralized mortgage obligations | 4,587 | | | 78 | | | (24) | | | 4,641 | |
| Commercial | 14,797 | | | 249 | | | (25) | | | 15,021 | |
Non-agency residential (1) | 948 | | | 138 | | | (9) | | | 1,077 | |
| Total mortgage-backed securities | 142,030 | | | 1,478 | | | (241) | | | 143,267 | |
| U.S. Treasury and agency securities | 67,700 | | | 1,023 | | | (195) | | | 68,528 | |
| Non-U.S. securities | 11,987 | | | 6 | | | (2) | | | 11,991 | |
| | | | | | | |
| Other taxable securities, substantially all asset-backed securities | 3,874 | | | 67 | | | 0 | | | 3,941 | |
| Total taxable securities | 225,591 | | | 2,574 | | | (438) | | | 227,727 | |
| Tax-exempt securities | 17,716 | | | 202 | | | (6) | | | 17,912 | |
| Total available-for-sale debt securities | 243,307 | | | 2,776 | | | (444) | | | 245,639 | |
Other debt securities carried at fair value (2) | 10,596 | | | 255 | | | (23) | | | 10,828 | |
| Total debt securities carried at fair value | 253,903 | | | 3,031 | | | (467) | | | 256,467 | |
| Held-to-maturity debt securities, substantially all U.S. agency mortgage-backed securities | 215,730 | | | 4,433 | | | (342) | | | 219,821 | |
Total debt securities (3, 4) | $ | 469,633 | | | $ | 7,464 | | | $ | (809) | | | $ | 476,288 | |
| | | | | | | |
(1)At September 30, 2020 and December 31, 2019, the underlying collateral type included approximately 35 percent and 49 percent prime, 4 percent and 6 percent Alt-A and 61 percent and 45 percent subprime.
(2)Primarily includes non-U.S. securities used to satisfy certain international regulatory requirements. Any changes in value are reported in market making and similar activities. For detail on the components, see Note 14 – Fair Value Measurements.
(3)Includes securities pledged as collateral of $55.7 billion and $67.0 billion at September 30, 2020 and December 31, 2019.
(4)The Corporation held debt securities from Fannie Mae and Freddie Mac that each exceeded 10 percent of shareholders’ equity, with an amortized cost of $193.8 billion and $76.9 billion, and a fair value of $201.0 billion and $79.3 billion at September 30, 2020, and an amortized cost of $157.2 billion and $54.1 billion, and a fair value of $160.6 billion and $55.1 billion at December 31, 2019.
At September 30, 2020, the accumulated net unrealized gain on AFS debt securities, excluding the amount related to debt securities previously transferred to held to maturity, included in accumulated OCI was $4.8 billion, net of the related income tax expense of $1.6 billion. The Corporation had nonperforming AFS debt securities of $25 million and $9 million at September 30, 2020 and December 31, 2019.
Effective January 1, 2020, the Corporation adopted the new accounting standard for credit losses that requires evaluation of AFS and HTM debt securities for any expected losses with recognition of an allowance for credit losses, when applicable. For more information, see Note 1 – Summary of Significant Accounting Principles. At September 30, 2020, the Corporation had $194.8 billion in AFS debt securities, which were primarily
U.S. agency and U.S. Treasury securities that have a zero credit loss assumption. For the remaining $38.9 billion in AFS debt securities, the amount of ECL was insignificant. Substantially all of the Corporation's HTM debt securities are U.S. agency and U.S. Treasury securities and have a zero credit loss assumption.
At September 30, 2020, the Corporation held equity securities at an aggregate fair value of $809 million and other equity securities, as valued under the measurement alternative, at a carrying value of $261 million, both of which are included in other assets. At September 30, 2020, the Corporation also held money market investments at a fair value of $385 million, which are included in time deposits placed and other short-term investments.
In the three and nine months ended September 30, 2020, the Corporation recorded gross realized gains on sales of AFS debt securities of $4 million and $383 million and gross realized losses of $2 million and $4 million, resulting in net gains of $2 million and $379 million, with $1 million and $95 million of income taxes attributable to the realized net gain on sales of these AFS debt securities. Sales of AFS debt securities during the three months ended September 30, 2019 were not significant. In the nine months ended September 30, 2019, the Corporation recorded gross realized gains on sales of AFS debt
securities of $228 million and gross realized losses of $112 million, resulting in net gains of $116 million with $28 million of income taxes attributable to the realized net gains on sales of these AFS debt securities.
The table below presents the fair value and the associated gross unrealized losses on AFS debt securities and whether these securities have had gross unrealized losses for less than 12 months or for 12 months or longer at September 30, 2020 and December 31, 2019.
| | | | | | | | | | | | | | | | | | | | | | | | | | | | | | | | | | | |
| | | | | | | | | | | |
| Total AFS Debt Securities in a Continuous Unrealized Loss Position | | | | | | |
| |
| Less than Twelve Months | | Twelve Months or Longer | | Total |
| Fair
Value | | Gross Unrealized Losses | | Fair
Value | | Gross Unrealized Losses | | Fair
Value | | Gross Unrealized Losses |
| (Dollars in millions) | September 30, 2020 |
| Continuously unrealized loss-positioned AFS debt securities | | | | | | | | | | | |
| Mortgage-backed securities: | | | | | | | | | | | |
| Agency | $ | 5,284 | | | $ | (51) | | | $ | 2 | | | $ | 0 | | | $ | 5,286 | | | $ | (51) | |
| Agency-collateralized mortgage obligations | 242 | | | (3) | | | 447 | | | (12) | | | 689 | | | (15) | |
| Commercial | 244 | | | (1) | | | 190 | | | 0 | | | 434 | | | (1) | |
| Non-agency residential | 326 | | | (19) | | | 75 | | | (11) | | | 401 | | | (30) | |
| Total mortgage-backed securities | 6,096 | | | (74) | | | 714 | | | (23) | | | 6,810 | | | (97) | |
| U.S. Treasury and agency securities | 3,893 | | | (3) | | | 503 | | | (4) | | | 4,396 | | | (7) | |
| Non-U.S. securities | 2,749 | | | (11) | | | 224 | | | (2) | | | 2,973 | | | (13) | |
| | | | | | | | | | | |
| Other taxable securities, substantially all asset-backed securities | 984 | | | (5) | | | 342 | | | (5) | | | 1,326 | | | (10) | |
| Total taxable securities | 13,722 | | | (93) | | | 1,783 | | | (34) | | | 15,505 | | | (127) | |
| Tax-exempt securities | 4,135 | | | (35) | | | 964 | | | (10) | | | 5,099 | | | (45) | |
| | | | | | | | | | | |
| | | | | | | | | | | |
| | | | | | | | | | | |
Total AFS debt securities in a continuous
unrealized loss position | $ | 17,857 | | | $ | (128) | | | $ | 2,747 | | | $ | (44) | | | $ | 20,604 | | | $ | (172) | |
| | | | | | | | | | | |
| December 31, 2019 |
| Continuously unrealized loss-positioned AFS debt securities | | | | | | | | | | | |
| Mortgage-backed securities: | | | | | | | | | | | |
| Agency | $ | 17,641 | | | $ | (41) | | | $ | 17,238 | | | $ | (142) | | | $ | 34,879 | | | $ | (183) | |
| Agency-collateralized mortgage obligations | 255 | | | (1) | | | 925 | | | (23) | | | 1,180 | | | (24) | |
| Commercial | 2,180 | | | (22) | | | 442 | | | (3) | | | 2,622 | | | (25) | |
| Non-agency residential | 122 | | | (6) | | | 22 | | | (3) | | | 144 | | | (9) | |
| Total mortgage-backed securities | 20,198 | | | (70) | | | 18,627 | | | (171) | | | 38,825 | | | (241) | |
| U.S. Treasury and agency securities | 12,836 | | | (71) | | | 18,866 | | | (124) | | | 31,702 | | | (195) | |
| Non-U.S. securities | 851 | | | 0 | | | 837 | | | (2) | | | 1,688 | | | (2) | |
| | | | | | | | | | | |
| Other taxable securities, substantially all asset-backed securities | 938 | | | 0 | | | 222 | | | 0 | | | 1,160 | | | 0 | |
| Total taxable securities | 34,823 | | | (141) | | | 38,552 | | | (297) | | | 73,375 | | | (438) | |
| Tax-exempt securities | 4,286 | | | (5) | | | 190 | | | (1) | | | 4,476 | | | (6) | |
| | | | | | | | | | | |
| | | | | | | | | | | |
| | | | | | | | | | | |
Total AFS debt securities in a continuous
unrealized loss position | $ | 39,109 | | | $ | (146) | | | $ | 38,742 | | | $ | (298) | | | $ | 77,851 | | | $ | (444) | |
The remaining contractual maturity distribution and yields of the Corporation’s debt securities carried at fair value and HTM debt securities at September 30, 2020 are summarized in the table below. Actual duration and yields may differ as prepayments on the loans underlying the mortgages or other asset-backed securities (ABS) are passed through to the Corporation.
| | | | | | | | | | | | | | | | | | | | | | | | | | | | | | | | | | | | | | | | | | | | | | | | | | | | | | | | | | | |
| | | | | | | | | | | | | | | | | | | |
| Maturities of Debt Securities Carried at Fair Value and Held-to-maturity Debt Securities |
| | | | | | | | | | | | | | | | | | | |
| Due in One
Year or Less | | Due after One Year
through Five Years | | Due after Five Years
through Ten Years | | Due after
Ten Years | | Total |
| (Dollars in millions) | Amount | | Yield (1) | | Amount | | Yield (1) | | Amount | | Yield (1) | | Amount | | Yield (1) | | Amount | | Yield (1) |
| Amortized cost of debt securities carried at fair value | | | | | | | | | | | | | | | | | | | |
| Mortgage-backed securities: | | | | | | | | | | | | | | | | | | | |
| Agency | $ | 0 | | | 0 | % | | $ | 7 | | | 5.37 | % | | $ | 59 | | | 4.51 | % | | $ | 67,500 | | | 3.36 | % | | $ | 67,566 | | | 3.36 | % |
| Agency-collateralized mortgage obligations | 0 | | | 0 | | | 0 | | | 0 | | | 24 | | | 2.54 | | | 5,639 | | | 2.95 | | | 5,663 | | | 2.95 | |
| Commercial | 26 | | | 3.08 | | | 6,136 | | | 2.49 | | | 8,014 | | | 2.44 | | | 1,027 | | | 2.75 | | | 15,203 | | | 2.48 | |
| Non-agency residential | 0 | | | 0 | | | 0 | | | 0 | | | 11 | | | 0 | | | 2,313 | | | 7.35 | | | 2,324 | | | 7.32 | |
| Total mortgage-backed securities | 26 | | | 3.08 | | | 6,143 | | | 2.49 | | | 8,108 | | | 2.45 | | | 76,479 | | | 3.44 | | | 90,756 | | | 3.29 | |
| U.S. Treasury and agency securities | 10,398 | | | 1.19 | | | 29,682 | | | 1.81 | | | 60,399 | | | 0.78 | | | 32 | | | 2.62 | | | 100,511 | | | 1.13 | |
| Non-U.S. securities | 25,784 | | | 0.37 | | | 1,275 | | | 1.50 | | | 7 | | | 5.82 | | | 76 | | | 8.89 | | | 27,142 | | | 0.44 | |
| | | | | | | | | | | | | | | | | | | |
| Other taxable securities, substantially all asset-backed securities | 1,107 | | | 1.42 | | | 1,423 | | | 2.32 | | | 628 | | | 2.06 | | | 470 | | | 1.73 | | | 3,628 | | | 1.92 | |
| Total taxable securities | 37,315 | | | 0.63 | | | 38,523 | | | 1.93 | | | 69,142 | | | 0.99 | | | 77,057 | | | 3.44 | | | 222,037 | | | 1.94 | |
| Tax-exempt securities | 905 | | | 0.92 | | | 8,462 | | | 1.23 | | | 5,051 | | | 1.66 | | | 2,881 | | | 1.53 | | | 17,299 | | | 1.39 | |
| Total amortized cost of debt securities carried at fair value | $ | 38,220 | | | 0.64 | | | $ | 46,985 | | | 1.80 | | | $ | 74,193 | | | 1.03 | | | $ | 79,938 | | | 3.37 | | | $ | 239,336 | | | 1.90 | |
Amortized cost of HTM debt securities (2) | $ | 66 | | | 1.87 | | | $ | 81 | | | 3.29 | | | $ | 17,188 | | | 1.86 | | | $ | 321,083 | | | 2.71 | | | $ | 338,418 | | | 2.67 | |
| | | | | | | | | | | | | | | | | | | |
| Debt securities carried at fair value | | | | | | | | | | | | | | | | | | | |
| Mortgage-backed securities: | | | | | | | | | | | | | | | | | | | |
| Agency | $ | 0 | | | | | $ | 8 | | | | | $ | 63 | | | | | $ | 69,793 | | | | | $ | 69,864 | | | |
| Agency-collateralized mortgage obligations | 0 | | | | | 0 | | | | | 25 | | | | | 5,812 | | | | | 5,837 | | | |
| Commercial | 26 | | | | | 6,491 | | | | | 8,586 | | | | | 1,117 | | | | | 16,220 | | | |
| Non-agency residential | 0 | | | | | 0 | | | | | 22 | | | | | 2,469 | | | | | 2,491 | | | |
| Total mortgage-backed securities | 26 | | | | | 6,499 | | | | | 8,696 | | | | | 79,191 | | | | | 94,412 | | | |
| U.S. Treasury and agency securities | 10,452 | | | | | 31,020 | | | | | 61,377 | | | | | 32 | | | | | 102,881 | | | |
| Non-U.S. securities | 26,066 | | | | | 1,278 | | | | | 8 | | | | | 79 | | | | | 27,431 | | | |
| | | | | | | | | | | | | | | | | | | |
| Other taxable securities, substantially all asset-backed securities | 1,112 | | | | | 1,445 | | | | | 640 | | | | | 482 | | | | | 3,679 | | | |
| Total taxable securities | 37,656 | | | | | 40,242 | | | | | 70,721 | | | | | 79,784 | | | | | 228,403 | | | |
| Tax-exempt securities | 907 | | | | | 8,548 | | | | | 5,201 | | | | | 2,938 | | | | | 17,594 | | | |
| Total debt securities carried at fair value | $ | 38,563 | | | | | $ | 48,790 | | | | | $ | 75,922 | | | | | $ | 82,722 | | | | | $ | 245,997 | | | |
Fair value of HTM debt securities (2) | $ | 65 | | | | | $ | 83 | | | | | $ | 17,442 | | | | | $ | 330,327 | | | | | $ | 347,917 | | | |
(1)The weighted-average yield is computed based on a constant effective interest rate over the contractual life of each security. The average yield considers the contractual coupon and the amortization of premiums and accretion of discounts, excluding the effect of related hedging derivatives.
(2)Substantially all U.S. agency MBS.
NOTE 5Outstanding Loans and Leases and Allowance for Credit Losses
The following tables present certain credit quality indicatorstotal outstanding loans and leases and an aging analysis for the Corporation’s Consumer Real Estate, Credit Card and Other Consumer, and Commercial portfolio segments, by class of financing receivables, at September 30, 20172020 and December 31, 2016.2019.
| | | | | | | | | | | | | | | | | | | | | | | | | | | | | | | | | | | | | | | | | | | |
| | | | | | | | | | | | | | | |
| 30-59 Days Past Due (1) | | 60-89 Days Past Due (1) | | 90 Days or
More Past Due (1) | | Total Past
Due 30 Days
or More | | Total Current or Less Than 30 Days Past Due (1) | | | | Loans Accounted for Under the Fair Value Option | | Total
Outstandings |
| (Dollars in millions) | September 30, 2020 |
| Consumer real estate | | | | | | | | | | | | | | | |
| Core portfolio | | | | | | | | | | | | | | | |
| Residential mortgage | $ | 1,244 | | | $ | 280 | | | $ | 829 | | | $ | 2,353 | | | $ | 221,542 | | | | | | | $ | 223,895 | |
| Home equity | 129 | | | 77 | | | 261 | | | 467 | | | 31,871 | | | | | | | 32,338 | |
| Non-core portfolio | | | | | | | | | | | | | | | |
| Residential mortgage | 308 | | | 126 | | | 964 | | | 1,398 | | | 7,425 | | | | | | | 8,823 | |
| Home equity | 29 | | | 20 | | | 76 | | | 125 | | | 4,067 | | | | | | | 4,192 | |
| Credit card and other consumer | | | | | | | | | | | | | | | |
| Credit card | 486 | | | 238 | | | 546 | | | 1,270 | | | 78,564 | | | | | | | 79,834 | |
| | | | | | | | | | | | | | | |
Direct/Indirect consumer (2) | 209 | | | 58 | | | 31 | | | 298 | | | 89,616 | | | | | | | 89,914 | |
| Other consumer | 0 | | | 0 | | | 0 | | | 0 | | | 140 | | | | | | | 140 | |
| Total consumer | 2,405 | | | 799 | | | 2,707 | | | 5,911 | | | 433,225 | | | | | | | 439,136 | |
Consumer loans accounted for under the fair value option (3) | | | | | | | | | | | | | $ | 657 | | | 657 | |
| Total consumer loans and leases | 2,405 | | | 799 | | | 2,707 | | | 5,911 | | | 433,225 | | | | | 657 | | | 439,793 | |
| Commercial | | | | | | | | | | | | | | | |
| | | | | | | | | | | | | | | |
| U.S. commercial | 500 | | | 213 | | | 558 | | | 1,271 | | | 292,663 | | | | | | | 293,934 | |
| Non-U.S. commercial | 80 | | | 22 | | | 28 | | | 130 | | | 96,021 | | | | | | | 96,151 | |
Commercial real estate (4) | 58 | | | 3 | | | 206 | | | 267 | | | 62,187 | | | | | | | 62,454 | |
| Commercial lease financing | 67 | | | 92 | | | 42 | | | 201 | | | 17,212 | | | | | | | 17,413 | |
U.S. small business commercial (5) | 71 | | | 51 | | | 83 | | | 205 | | | 38,645 | | | | | | | 38,850 | |
| Total commercial | 776 | | | 381 | | | 917 | | | 2,074 | | | 506,728 | | | | | | | 508,802 | |
Commercial loans accounted for under the fair value option (3) | | | | | | | | | | | | | 6,577 | | | 6,577 | |
| Total commercial loans and leases | 776 | | | 381 | | | 917 | | | 2,074 | | | 506,728 | | | | | 6,577 | | | 515,379 | |
Total loans and leases (6) | $ | 3,181 | | | $ | 1,180 | | | $ | 3,624 | | | $ | 7,985 | | | $ | 939,953 | | | | | $ | 7,234 | | | $ | 955,172 | |
| Percentage of outstandings | 0.33 | % | | 0.12 | % | | 0.38 | % | | 0.83 | % | | 98.41 | % | | | | 0.76 | % | | 100.00 | % |
|
| | | | | | | | | | | | | | | | | | | | | | | |
| | | | | | | | | | | | |
Consumer Real Estate – Credit Quality Indicators (1) |
| | September 30, 2017 |
| (Dollars in millions) | Core Residential Mortgage (2) | | Non-core Residential
Mortgage (2) | | Residential Mortgage PCI (3) | | Core Home Equity (2) | | Non-core Home Equity (2) | | Home Equity PCI |
Refreshed LTV (4) | |
| | |
| | |
| | |
| | | | |
| Less than or equal to 90 percent | $ | 146,679 |
| | $ | 12,603 |
| | $ | 7,095 |
| | $ | 43,942 |
| | $ | 8,128 |
| | $ | 1,881 |
|
| Greater than 90 percent but less than or equal to 100 percent | 3,288 |
| | 1,016 |
| | 624 |
| | 660 |
| | 1,211 |
| | 420 |
|
| Greater than 100 percent | 1,444 |
| | 1,231 |
| | 680 |
| | 775 |
| | 2,123 |
| | 612 |
|
Fully-insured loans (5) | 19,246 |
| | 5,540 |
| | — |
| | — |
| | — |
| | — |
|
| Total consumer real estate | $ | 170,657 |
| | $ | 20,390 |
| | $ | 8,399 |
| | $ | 45,377 |
| | $ | 11,462 |
| | $ | 2,913 |
|
| Refreshed FICO score | | | | | | | | | | | |
| Less than 620 | $ | 2,285 |
| | $ | 2,560 |
| | $ | 2,102 |
| | $ | 1,192 |
| | $ | 2,268 |
| | $ | 470 |
|
| Greater than or equal to 620 and less than 680 | 4,652 |
| | 2,260 |
| | 1,740 |
| | 2,416 |
| | 2,506 |
| | 495 |
|
| Greater than or equal to 680 and less than 740 | 22,153 |
| | 3,720 |
| | 2,446 |
| | 8,484 |
| | 2,860 |
| | 862 |
|
| Greater than or equal to 740 | 122,321 |
| | 6,310 |
| | 2,111 |
| | 33,285 |
| | 3,828 |
| | 1,086 |
|
Fully-insured loans (5) | 19,246 |
| | 5,540 |
| | — |
| | — |
| | — |
| | — |
|
| Total consumer real estate | $ | 170,657 |
| | $ | 20,390 |
| | $ | 8,399 |
| | $ | 45,377 |
| | $ | 11,462 |
| | $ | 2,913 |
|
| |
(1)
| Excludes $978 million of loans accounted for under the fair value option.
|
| |
(3)
| Includes $1.3 billion of pay option loans. The Corporation no longer originates this product.
|
| |
(4)
| Refreshed LTV percentages for PCI loans are calculated using the carrying value net of the related valuation allowance. |
| |
(5)
| Credit quality indicators are not reported for fully-insured loans as principal repayment is insured. |
(1)Consumer real estate loans 30-59 days past due includes fully-insured loans of $258 million and nonperforming loans of $132 million. Consumer real estate loans 60-89 days past due includes fully-insured loans of $118 million and nonperforming loans of $96 million. Consumer real estate loans 90 days or more past due includes fully-insured loans of $1.0 billion. Consumer real estate loans current or less than 30 days past due includes $793 million and direct/indirect consumer includes $38 million of nonperforming loans. For information on the Corporation's interest accrual policies and delinquency status for loan modifications related to the COVID-19 pandemic, see Note 1 – Summary of Significant Accounting Principles. |
| | | | | | | | | | | |
| | | | | | |
| Credit Card and Other Consumer – Credit Quality Indicators |
| | September 30, 2017 |
| (Dollars in millions) | U.S. Credit Card | | Direct/Indirect Consumer | | Other Consumer |
| Refreshed FICO score | |
| | |
| | |
|
| Less than 620 | $ | 4,612 |
| | $ | 1,578 |
| | $ | 42 |
|
| Greater than or equal to 620 and less than 680 | 12,195 |
| | 2,003 |
| | 125 |
|
| Greater than or equal to 680 and less than 740 | 34,796 |
| | 12,161 |
| | 364 |
|
| Greater than or equal to 740 | 40,999 |
| | 34,731 |
| | 1,730 |
|
Other internal credit metrics (1, 2) | — |
| | 42,918 |
| | 163 |
|
| Total credit card and other consumer | $ | 92,602 |
| | $ | 93,391 |
| | $ | 2,424 |
|
| |
(1)
| Other internal credit metrics may include delinquency status, geography or other factors. |
| |
(2)
| Direct/indirect consumer includes $42.2 billion of securities-based(2)Total outstandings primarily includes auto and specialty lending which is overcollateralized and therefore has minimal credit risk.
|
|
| | | | | | | | | | | | | | | | | | | |
| | | | | | | | | | |
Commercial – Credit Quality Indicators (1) |
| | September 30, 2017 |
| (Dollars in millions) | U.S. Commercial | | Commercial Real Estate | | Commercial
Lease Financing | | Non-U.S. Commercial | | U.S. Small
Business Commercial (2) |
| Risk ratings | |
| | |
| | |
| | |
| | |
|
| Pass rated | $ | 273,670 |
| | $ | 59,001 |
| | $ | 20,763 |
| | $ | 93,498 |
| | $ | 354 |
|
| Reservable criticized | 9,007 |
| | 627 |
| | 650 |
| | 2,398 |
| | 50 |
|
Refreshed FICO score (3) | | | | | | | | | |
|
| Less than 620 | |
| | |
| | |
| | |
| | 224 |
|
| Greater than or equal to 620 and less than 680 | | | | | | | | | 615 |
|
| Greater than or equal to 680 and less than 740 | | | | | | | | | 1,842 |
|
| Greater than or equal to 740 | | | | | | | | | 3,683 |
|
Other internal credit metrics (3, 4) | | | | | | | | | 6,835 |
|
| Total commercial | $ | 282,677 |
| | $ | 59,628 |
| | $ | 21,413 |
| | $ | 95,896 |
| | $ | 13,603 |
|
| |
(1)
| Excludes $5.3 billion of loans accounted for under the fair value option.
|
| |
(2)
| U.S. small business commercial includes $825 million of criticized business card and small business loans which are evaluated using refreshed FICO scores or internal credit metrics, including delinquency status, rather than risk ratings. At September 30, 2017, 99 percent of the balances where internal credit metrics are used was current or less than 30 days past due.
|
| |
(3)
| Refreshed FICO score and other internal credit metrics are applicable only to the U.S. small business commercial portfolio. |
| |
(4)
| Other internal credit metrics may include delinquency status, application scores, geography or other factors. |
|
| | | | | | | | | | | | | | | | | | | | | | | |
| | | | | | | | | | | | |
Consumer Real Estate – Credit Quality Indicators (1) |
| | December 31, 2016 |
| (Dollars in millions) | Core Residential Mortgage (2) | | Non-core Residential
Mortgage (2) | | Residential Mortgage PCI (3) | | Core Home Equity (2) | | Non-core Home Equity (2) | | Home Equity PCI |
Refreshed LTV (4) | |
| | |
| | |
| | |
| | | | |
| Less than or equal to 90 percent | $ | 129,737 |
| | $ | 14,280 |
| | $ | 7,811 |
| | $ | 47,171 |
| | $ | 8,480 |
| | $ | 1,942 |
|
| Greater than 90 percent but less than or equal to 100 percent | 3,634 |
| | 1,446 |
| | 1,021 |
| | 1,006 |
| | 1,668 |
| | 630 |
|
| Greater than 100 percent | 1,872 |
| | 1,972 |
| | 1,295 |
| | 1,196 |
| | 3,311 |
| | 1,039 |
|
Fully-insured loans (5) | 21,254 |
| | 7,475 |
| | — |
| | — |
| | — |
| | — |
|
| Total consumer real estate | $ | 156,497 |
| | $ | 25,173 |
| | $ | 10,127 |
| | $ | 49,373 |
| | $ | 13,459 |
| | $ | 3,611 |
|
| Refreshed FICO score | |
| | |
| | |
| | |
| | |
| | |
|
| Less than 620 | $ | 2,479 |
| | $ | 3,198 |
| | $ | 2,741 |
| | $ | 1,254 |
| | $ | 2,692 |
| | $ | 559 |
|
| Greater than or equal to 620 and less than 680 | 5,094 |
| | 2,807 |
| | 2,241 |
| | 2,853 |
| | 3,094 |
| | 636 |
|
| Greater than or equal to 680 and less than 740 | 22,629 |
| | 4,512 |
| | 2,916 |
| | 10,069 |
| | 3,176 |
| | 1,069 |
|
| Greater than or equal to 740 | 105,041 |
| | 7,181 |
| | 2,229 |
| | 35,197 |
| | 4,497 |
| | 1,347 |
|
Fully-insured loans (5) | 21,254 |
| | 7,475 |
| | — |
| | — |
| | — |
| | — |
|
| Total consumer real estate | $ | 156,497 |
| | $ | 25,173 |
| | $ | 10,127 |
| | $ | 49,373 |
| | $ | 13,459 |
| | $ | 3,611 |
|
| |
(1)
| Excludes $1.1 billion of loans accounted for under the fair value option.
|
| |
(3)
| Includes $1.6 billion of pay option loans. The Corporation no longer originates this product.
|
| |
(4)
| Refreshed LTV percentages for PCI loans are calculated using the carrying value net of the related valuation allowance. |
| |
(5)
| Credit quality indicators are not reported for fully-insured loans as principal repayment is insured. |
|
| | | | | | | | | | | | | | | |
| | | | | | | | |
| Credit Card and Other Consumer – Credit Quality Indicators |
| | December 31, 2016 |
| (Dollars in millions) | U.S. Credit Card | | Non-U.S. Credit Card | | Direct/Indirect Consumer | | Other Consumer (1) |
| Refreshed FICO score | |
| | |
| | |
| | |
|
| Less than 620 | $ | 4,431 |
| | $ | — |
| | $ | 1,478 |
| | $ | 187 |
|
| Greater than or equal to 620 and less than 680 | 12,364 |
| | — |
| | 2,070 |
| | 222 |
|
| Greater than or equal to 680 and less than 740 | 34,828 |
| | — |
| | 12,491 |
| | 404 |
|
| Greater than or equal to 740 | 40,655 |
| | — |
| | 33,420 |
| | 1,525 |
|
Other internal credit metrics (2, 3, 4) | — |
| | 9,214 |
| | 44,630 |
| | 161 |
|
| Total credit card and other consumer | $ | 92,278 |
| | $ | 9,214 |
| | $ | 94,089 |
| | $ | 2,499 |
|
| |
(1)
| At December 31, 2016, 19 percent of the other consumer portfolio was associated with portfolios from certain consumer finance businesses that the Corporation previously exited.
|
| |
(2)
| Other internal credit metrics may include delinquency status, geography or other factors. |
| |
(3)
| Direct/indirect consumer includes $43.1 billion of securities-based lending which is overcollateralized and therefore has minimal credit risk and $499 million of loans the Corporation no longer originates, primarily student loans.
|
| |
(4)
| Non-U.S. credit card represents the U.K. credit card portfolio which was evaluated using internal credit metrics, including delinquency status. At December 31, 2016, 98 percent of this portfolio was current or less than 30 days past due, one percent was 30-89 days past due and one percent was 90 days or more past due.
|
|
| | | | | | | | | | | | | | | | | | | |
| | | | | | | | | | |
Commercial – Credit Quality Indicators (1) |
| | December 31, 2016 |
| (Dollars in millions) | U.S. Commercial | | Commercial Real Estate | | Commercial
Lease Financing | | Non-U.S. Commercial | | U.S. Small
Business Commercial (2) |
| Risk ratings | |
| | |
| | |
| | |
| | |
|
| Pass rated | $ | 261,214 |
| | $ | 56,957 |
| | $ | 21,565 |
| | $ | 85,689 |
| | $ | 453 |
|
| Reservable criticized | 9,158 |
| | 398 |
| | 810 |
| | 3,708 |
| | 71 |
|
Refreshed FICO score (3) | | | | | | | | | |
| Less than 620 | | | | | | | | | 200 |
|
| Greater than or equal to 620 and less than 680 | | | | | | | | | 591 |
|
| Greater than or equal to 680 and less than 740 | | | | | | | | | 1,741 |
|
| Greater than or equal to 740 | | | | | | | | | 3,264 |
|
Other internal credit metrics (3, 4) | | | | | | | | | 6,673 |
|
| Total commercial | $ | 270,372 |
| | $ | 57,355 |
| | $ | 22,375 |
| | $ | 89,397 |
| | $ | 12,993 |
|
| |
(1)
| Excludes $6.0 billion of loans accounted for under the fair value option.
|
| |
(2)
| U.S. small business commercial includes $755 million of criticized business card and small business loans which are evaluated using refreshed FICO scores or internal credit metrics, including delinquency status, rather than risk ratings. At December 31, 2016, 98 percent of the balances where internal credit metrics are used was current or less than 30 days past due.
|
| |
(3)
| Refreshed FICO score and other internal credit metrics are applicable only to the U.S. small business commercial portfolio. |
| |
(4)
| Other internal credit metrics may include delinquency status, application scores, geography or other factors. |
Impaired Loans and Troubled Debt Restructurings
A loan is considered impaired when, based on current information, it is probable that the Corporation will be unable to collect all amounts due from the borrower in accordance with the contractual terms of the loan. Impaired loans include nonperforming commercial loans and all consumerleases of $47.1 billion, U.S. securities-based lending loans of $39.0 billion and commercial TDRs. Impaired loans exclude nonperformingnon-U.S. consumer loans and nonperforming commercial leases unless they are classified as TDRs. Loansof $2.9 billion.
(3)Consumer loans accounted for under the fair value option are also excluded. PCIincludes residential mortgage loans are excludedof $314 million and reported separately on page 97.home equity loans of $343 million. Commercial loans accounted for under the fair value option includes U.S. commercial loans of $3.4 billion and non-U.S. commercial loans of $3.2 billion. For more information, see Note 14 – Fair Value Measurements and Note 15 – Fair Value Option.
(4)Total outstandings includes U.S. commercial real estate loans of $58.7 billion and non-U.S. commercial real estate loans of $3.7 billion.
(5)Includes PPP loans.
(6)Total outstandings includes loans and leases pledged as collateral of $15.9 billion. The Corporation also pledged $158.4 billion of loans with no related outstanding borrowings to secure potential borrowing capacity with the Federal Reserve Bank and Federal Home Loan Bank.
| | | | | | | | | | | | | | | | | | | | | | | | | | | | | | | | | | | | | | | | | | | |
| | | | | | | | | | | | | | | |
| 30-59 Days
Past Due (1) | | 60-89 Days Past Due (1) | | 90 Days or
More
Past Due (1) | | Total Past
Due 30 Days
or More | | Total Current or Less Than 30 Days Past Due (1) | | | | Loans
Accounted
for Under
the Fair
Value Option | | Total Outstandings |
| (Dollars in millions) | December 31, 2019 |
| Consumer real estate | | | | | | | | | | | | | | | |
| Core portfolio | | | | | | | | | | | | | | | |
| Residential mortgage | $ | 1,378 | | | $ | 261 | | | $ | 565 | | | $ | 2,204 | | | $ | 223,566 | | | | | | | $ | 225,770 | |
| Home equity | 135 | | | 70 | | | 198 | | | 403 | | | 34,823 | | | | | | | 35,226 | |
| Non-core portfolio | | | | | | | | | | | | | | | |
| Residential mortgage | 458 | | | 209 | | | 1,263 | | | 1,930 | | | 8,469 | | | | | | | 10,399 | |
| Home equity | 34 | | | 16 | | | 72 | | | 122 | | | 4,860 | | | | | | | 4,982 | |
| Credit card and other consumer | | | | | | | | | | | | | | | |
| Credit card | 564 | | | 429 | | | 1,042 | | | 2,035 | | | 95,573 | | | | | | | 97,608 | |
| | | | | | | | | | | | | | | |
Direct/Indirect consumer (2) | 297 | | | 85 | | | 35 | | | 417 | | | 90,581 | | | | | | | 90,998 | |
| Other consumer | 0 | | | 0 | | | 0 | | | 0 | | | 192 | | | | | | | 192 | |
| Total consumer | 2,866 | | | 1,070 | | | 3,175 | | | 7,111 | | | 458,064 | | | | | | | 465,175 | |
Consumer loans accounted for under the fair value option (3) | | | | | | | | | | | | | $ | 594 | | | 594 | |
| Total consumer loans and leases | 2,866 | | | 1,070 | | | 3,175 | | | 7,111 | | | 458,064 | | | | | 594 | | | 465,769 | |
| Commercial | | | | | | | | | | | | | | | |
| | | | | | | | | | | | | | | |
| U.S. commercial | 788 | | | 279 | | | 371 | | | 1,438 | | | 305,610 | | | | | | | 307,048 | |
| Non-U.S. commercial | 35 | | | 23 | | | 8 | | | 66 | | | 104,900 | | | | | | | 104,966 | |
Commercial real estate (4) | 144 | | | 19 | | | 119 | | | 282 | | | 62,407 | | | | | | | 62,689 | |
| Commercial lease financing | 100 | | | 56 | | | 39 | | | 195 | | | 19,685 | | | | | | | 19,880 | |
| U.S. small business commercial | 119 | | | 56 | | | 107 | | | 282 | | | 15,051 | | | | | | | 15,333 | |
| Total commercial | 1,186 | | | 433 | | | 644 | | | 2,263 | | | 507,653 | | | | | | | 509,916 | |
Commercial loans accounted for under the fair value option (3) | | | | | | | | | | | | | 7,741 | | | 7,741 | |
| Total commercial loans and leases | 1,186 | | | 433 | | | 644 | | | 2,263 | | | 507,653 | | | | | 7,741 | | | 517,657 | |
| | | | | | | | | | | | | | | |
| | | | | | | | | | | | | | | |
Total loans and leases (5) | $ | 4,052 | | | $ | 1,503 | | | $ | 3,819 | | | $ | 9,374 | | | $ | 965,717 | | | | | $ | 8,335 | | | $ | 983,426 | |
| Percentage of outstandings | 0.41 | % | | 0.15 | % | | 0.39 | % | | 0.95 | % | | 98.20 | % | | | | 0.85 | % | | 100.00 | % |
(1)Consumer real estate loans 30-59 days past due includes fully-insured loans of $517 million and nonperforming loans of $139 million. Consumer real estate loans 60-89 days past due includes fully-insured loans of $206 million and nonperforming loans of $114 million. Consumer real estate loans 90 days or more past due includes fully-insured loans of $1.1 billion. Consumer real estate loans current or less than 30 days past due includes $856 million and direct/indirect consumer includes $45 million of nonperforming loans.
(2)Total outstandings primarily includes auto and specialty lending loans and leases of $50.4 billion, U.S. securities-based lending loans of $36.7 billion and non-U.S. consumer loans of $2.8 billion.
(3)Consumer loans accounted for under the fair value option includes residential mortgage loans of $257 million and home equity loans of $337 million. Commercial loans accounted for under the fair value option includes U.S. commercial loans of $4.7 billion and non-U.S. commercial loans of $3.1 billion. For more information, see Note 14 – Fair Value Measurements and Note 15 – Fair Value Option.
(4)Total outstandings includes U.S. commercial real estate loans of $59.0 billion and non-U.S. commercial real estate loans of $3.7 billion.
(5)Total outstandings includes loans and leases pledged as collateral of $25.9 billion. The Corporation also pledged $168.2 billion of loans with no related outstanding borrowings to secure potential borrowing capacity with the Federal Reserve Bank and Federal Home Loan Bank.
The Corporation categorizes consumer real estate loans as core and non-core based on loan and customer characteristics such as origination date, product type, LTV, Fair Isaac Corporation (FICO) score and delinquency status consistent with its current consumer and mortgage servicing strategy. Generally, loans that were originated after January 1, 2010, qualified under government-sponsored enterprise (GSE) underwriting guidelines, or otherwise met the Corporation’s underwriting guidelines in place in 2015 are characterized as core loans. All other loans are generally characterized as non-core loans and represent runoff portfolios.
The Corporation has entered into long-term credit protection agreements with Fannie Mae and Freddie Mac on loans totaling $8.8 billion and $7.5 billion at September 30, 2020 and December 31, 2019, providing full credit protection on residential mortgage loans that become severely delinquent. All of these loans are individually insured, and therefore the Corporation does not record an allowance for credit losses related to these loans.
Nonperforming Loans and Leases
Commercial nonperforming loans increased to $2.2 billion at September 30, 2020 from $1.5 billion at December 31, 2019 with broad-based increases across multiple industries. Consumer nonperforming loans increased to $2.4 billion at September 30, 2020 from $2.1 billion at December 31, 2019 driven by loans with deferrals that expired and have subsequently become nonperforming, as well as the inclusion of $137 million of certain loans that were previously classified as purchased credit-impaired loans and accounted for under a pool basis.
The table below presents the Corporation’s nonperforming loans and leases including nonperforming TDRs, and loans accruing past due 90 days or more at September 30, 2020 and December 31, 2019. Nonperforming loans held-for-sale (LHFS) are excluded from nonperforming loans and leases as they are recorded at either fair value or the lower of cost or fair value. For information on the Corporation's interest accrual policies and delinquency status for loan modifications related to the COVID-19 pandemic, see Note 1 – Summary of Significant Accounting Principles. For more information on the criteria for classification as nonperforming, see Note 1 – Summary of Significant Accounting Principlesto the Consolidated Financial Statements of the Corporation's 2016Corporation’s 2019 Annual Report on Form 10-K.
| | | | | | | | | | | | | | | | | | | | | | | |
| | | | | | | |
| Credit Quality | | |
| | | | | | | |
| |
| Nonperforming Loans
and Leases | | Accruing Past Due 90 Days or More (1) |
| (Dollars in millions) | September 30
2020 | | December 31
2019 | | September 30
2020 | | December 31
2019 |
Residential mortgage (2) | $ | 1,675 | | | $ | 1,470 | | | $ | 837 | | | $ | 1,088 | |
With negative allowance (3) | 500 | | | 0 | | | | | |
Home equity (2) | 640 | | | 536 | | | 0 | | | 0 | |
With negative allowance (3) | 119 | | | 0 | | | | | |
| Credit Card | n/a | | n/a | | 546 | | | 1,042 | |
| Direct/indirect consumer | 42 | | | 47 | | | 27 | | | 33 | |
| | | | | | | |
| Total consumer | 2,357 | | | 2,053 | | | 1,410 | | | 2,163 | |
| U.S. commercial | 1,351 | | | 1,094 | | | 199 | | | 106 | |
| Non-U.S. commercial | 338 | | | 43 | | | 28 | | | 8 | |
| Commercial real estate | 414 | | | 280 | | | 2 | | | 19 | |
| Commercial lease financing | 14 | | | 32 | | | 32 | | | 20 | |
| U.S. small business commercial | 76 | | | 50 | | | 77 | | | 97 | |
| Total commercial | 2,193 | | | 1,499 | | | 338 | | | 250 | |
| Total nonperforming loans | $ | 4,550 | | | $ | 3,552 | | | $ | 1,748 | | | $ | 2,413 | |
| Percentage of outstanding loans and leases | 0.48 | % | | 0.36 | % | | 0.18 | % | | 0.25 | % |
(1)For information on the Corporation's interest accrual policies and delinquency status for loan modifications related to the COVID-19 pandemic, see Note 1 – Summary of Significant Accounting Principles.
(2)Residential mortgage loans accruing past due 90 days or more are fully-insured loans. At September 30, 2020 and December 31, 2019 residential mortgage includes $561 million and $740 million of loans on which interest had been curtailed by the FHA, and therefore were no longer accruing interest, although principal was still insured, and $276 million and $348 million of loans on which interest was still accruing.
(3)At September 30, 2020, Residential Mortgage and Home Equity include negative allowance on nonperforming loans of $170 million and $106 million.
n/a = not applicable
Included in the September 30, 2020 nonperforming loans are $120 million and $17 million of residential mortgage and home equity loans that prior to the January 1, 2020 adoption of the new credit loss standard were not included in nonperforming loans, as they were previously classified as purchased credit-impaired loans and accounted for under a pool basis.
Consumer Real Estate
ImpairedTo estimate ECL for consumer loans secured by residential real estate, the Corporation estimates the number of loans that will default over the life of the existing portfolio, after factoring in estimated prepayments, using quantitative modeling methodologies. The attributes that are most significant in estimating the Corporation’s ECL include refreshed loan-to-value (LTV) or, in the case of a subordinated lien, refreshed combined LTV (CLTV), borrower credit score, months since origination and geography, all of which are further broken down by present collection status (whether the loan is current, delinquent, in default, or in bankruptcy). The estimates are based on the Corporation’s historical experience with the loan portfolio,
adjusted to reflect the economic outlook. The outlook on the unemployment rate and consumer real estate prices are key factors that impact the frequency and severity of loss estimates. The Corporation does not reserve for credit losses on the unpaid principal balance of loans withininsured by the Consumer Real EstateFederal Housing Administration (FHA) and long-term standby loans, as these loans are fully insured. The Corporation records a reserve for unfunded lending commitments for the ECL associated with the undrawn portion of the Corporation’s HELOCs, which can only be canceled by the Corporation if certain criteria are met. The ECL associated with these unfunded lending commitments is calculated using the same models and methodologies noted above and incorporate utilization assumptions at time of default.
For loans that are more than 180 days past due and collateral-dependent TDRs, the Corporation bases the allowance on the estimated fair value of the underlying collateral as of the reporting date less costs to sell. The fair value of the collateral securing these loans is generally determined using an automated valuation model (AVM) that estimates the value of a property by reference to market data including sales of comparable properties and price trends specific to the Metropolitan Statistical Area in which the property being valued is located. In the event that an AVM value is not available, the Corporation utilizes publicized indices or if these methods provide less reliable valuations, the Corporation uses appraisals or broker price opinions to estimate the fair value of the collateral. While there is inherent imprecision in these valuations, the Corporation believes that they are representative of this portfolio segment consist entirelyin the aggregate.
For loans that are more than 180 days past due and collateral-dependent TDRs, with the exception of TDRs. Excluding PCIthe Corporation’s fully insured portfolio, the outstanding balance of loans most modificationsthat is in excess of the estimated property value after adjusting for costs to sell is charged off. If the estimated property value decreases in periods subsequent to the initial charge-off, the Corporation will record an additional charge-off; however, if the value increases in periods subsequent to the charge-off, the Corporation will adjust the allowance to account for the increase but not to a level above the cumulative charge-off amount.
Credit Cards and Other Consumer
Credit cards are revolving lines of credit without a defined maturity date. The estimated life of a credit card receivable is determined by estimating the amount and timing of expected future payments (e.g., borrowers making full payments, minimum payments or somewhere in between) that it will take for a receivable balance to pay off. The ECL on the future payments incorporates the spending behavior of a borrower through time using key borrower-specific factors and the economic outlook described above. The Corporation applies all expected payments in accordance with the Credit Card Accountability Responsibility and Disclosure Act of 2009 (i.e., paying down the highest interest rate bucket first). Then forecasted future payments are prioritized to pay off the oldest balance until it is brought to zero or an expected charge-off amount. Unemployment rate outlook, borrower credit score, delinquency status and historical payment behavior are all key inputs into the credit card receivable loss forecasting model. Future draws on the credit card lines are excluded from the ECL as they are unconditionally cancellable.
The ECL for the consumer vehicle lending portfolio is also determined using quantitative methods supplemented with qualitative analysis. The quantitative model estimates ECL giving consideration to key borrower and loan characteristics such as delinquency status, borrower credit score, LTV ratio, underlying collateral type and collateral value.
Commercial
The ECL on commercial loans is forecasted using models that estimate credit losses over the loan’s contractual life at an individual loan level. The models use the contractual terms to forecast future principal cash flows while also considering expected prepayments. For open-ended commitments such as revolving lines of credit, changes in funded balance are captured by forecasting a borrower’s draw and payment behavior over the remaining life of the commitment. For loans collateralized with commercial real estate and for which the underlying asset is the primary source of repayment, the loss forecasting models consider key loan and customer attributes such as LTV ratio, net operating income and debt service coverage, and captures variations in behavior according to property type and region. The commercial real estate model also utilizes key economic variables to forecast market indicators such as rent levels and vacancy rates, which impact the ECL estimate. For all other commercial loans and leases, the loss forecasting model determines the probabilities of transition to different credit risk ratings or default at each point over the life of the asset based on the borrower’s current credit risk rating, industry sector, size of the exposure and the geographic market. The severity of loss is determined based on the type of collateral securing the exposure, the size of the exposure, the borrower’s industry sector, any guarantors and the geographic market. Assumptions of expected loss are conditioned to the economic outlook and the model considers key economic variables such as unemployment rate, gross domestic product, credit risk spreads, asset prices and equity market returns.
In addition to the allowance for loan and lease losses, the Corporation also estimates ECL related to unfunded lending commitments such as letters of credit, financial guarantees, unfunded bankers acceptances and binding loan commitments, excluding commitments accounted for under the fair value option. Reserves are estimated for the unfunded exposure using the same models and methodologies as the funded exposure and are reported as reserves for unfunded lending commitments.
Securities
The Corporation evaluates each available-for-sale (AFS) security where the value has declined below amortized cost. If the Corporation intends to sell or believes it is more likely than not that it will be required to sell the debt security, it is written down to fair value through earnings. For AFS debt securities the Corporation intends to hold, the Corporation evaluates the debt securities for ECL except for debt securities that are guaranteed by the U.S. Treasury, U.S. government agencies or sovereign entities of high credit quality where the Corporation applies a zero credit loss assumption. For the remaining AFS debt securities, the Corporation considers qualitative parameters such as internal and external credit ratings and the value of underlying collateral. If an AFS debt security fails any of the qualitative parameters, a discounted cash flow analysis is used by the Corporation to determine if a portion of the unrealized loss is a result of a credit loss. Any credit losses determined are recognized as an increase to the allowance for credit losses through provision expense recorded in other income. Cash flows
expected to be collected are estimated using all relevant information available such as, remaining payment terms, prepayment speeds, the financial condition of the issuer, expected defaults and the value of the underlying collateral. If any of the decline in fair value is related to market factors, that amount is recognized in accumulated other comprehensive income (OCI). In certain instances, the credit loss may exceed the total decline in fair value, in which case, the allowance recorded is limited to the difference between the amortized cost and the fair value of the asset.
The Corporation separately evaluates its held-to-maturity (HTM) debt securities for any credit losses, of which substantially all qualify for the zero loss assumption. For the remaining securities, the Corporation performs a discounted cash flow analysis to estimate any credit losses which are then recognized as part of the allowance for credit losses.
Other Assets
For the Corporation’s financial assets that are measured at amortized cost and are not included in debt securities or loans and leases on the Consolidated Balance Sheet, the Corporation evaluates these assets for ECL using various techniques. For assets that are subject to collateral maintenance provisions, including federal funds sold and securities borrowed or purchased under agreements to resell, where the collateral consists of daily margining of liquid and marketable assets where the margining is expected to be maintained into the foreseeable future, the expected losses are assumed to be 0. For all other assets, the Corporation performs qualitative analyses, including consideration of historical losses and current economic conditions, to estimate any ECL which are then included in a valuation account that is recorded as a contra-asset against the amortized cost basis of the financial asset.
Troubled Debt Restructurings
The Corporation has implemented various consumer and commercial loan modification programs to provide its borrowers relief from the economic impacts of the COVID-19 pandemic. In accordance with the Coronavirus Aid, Relief, and Economic Security Act (CARES Act), the Corporation has elected to not apply TDR classification to any COVID-19 related loan modifications that were performed after March 1, 2020 to borrowers who were current as of December 31, 2019. Accordingly, these restructurings are not classified as TDRs. In addition, for loans modified in response to the COVID-19 pandemic that do not meet the definitionabove criteria (e.g., current payment status at December 31, 2019), the Corporation is applying the guidance included in an interagency statement issued by the bank regulatory agencies. This guidance states that loan modifications performed in light of the COVID-19 pandemic, including loan payment deferrals that are up to six months in duration, that were granted to borrowers who were current as of the implementation date of a loan modification program or modifications granted under government mandated modification programs, are not TDRs. For loan modifications that include a payment deferral and are not TDRs, the borrowers' past due and nonaccrual status have not been impacted during the deferral period. The Corporation has continued to accrue interest during the deferral period using a constant effective yield method. For most mortgage, HELOC and commercial loan modifications, the contractual interest that accrued during the deferral period is payable at the maturity of the loan. The Corporation includes these amounts with the unpaid principal balance when a binding offer is extended to a borrower.computing its allowance for credit losses. Amounts that are subsequently deemed uncollectible
are written off against the allowance for credit losses. For more information on impaired consumer real estate loans,the Corporation's TDR accounting, see Note 41 – Outstanding Loans and LeasesSummary of Significant Accounting Principles to the Consolidated Financial Statements of the Corporation's 2016Corporation’s 2019 Annual Report on Form 10-K.
Paycheck Protection Program
The Corporation is participating in the Paycheck Protection Program (PPP), which is a loan program that originated from the CARES Act and was subsequently expanded by the Paycheck Protection Program and Health Care Enhancement Act. The PPP is designed to provide U.S. small businesses with cash-flow assistance through loans fully guaranteed by the Small Business Administration (SBA). If the borrower meets certain criteria and uses the proceeds towards certain eligible expenses, the borrower’s obligation to repay the loan can be forgiven up to the full principal amount of the loan and any accrued interest. Upon borrower forgiveness, the SBA pays the Corporation for the principal and accrued interest owed on the loan. If the full principal of the loan is not forgiven, the loan will operate according to the original loan terms with the 100 percent SBA guaranty remaining. As of September 30, 2020,
the Corporation had approximately 343,000 PPP loans with outstanding balances totaling $24.7 billion. As compensation for originating the loans, the Corporation received lender processing fees from the SBA, which are capitalized, along with the loan origination costs, and will be amortized over the loans’ contractual lives and recognized as interest income. Upon forgiveness of a loan and repayment by the SBA, any unrecognized net capitalized fees and costs related to the loan will be recognized as interest income in that period.
NOTE 2Net Interest Income and Noninterest Income
The table below presents the Corporation’s net interest income and noninterest income disaggregated by revenue source for the three and nine months ended September 30, 2020 and 2019. For more information, see Note 1 – Summary of Significant Accounting Principles to the Consolidated Financial Statements of the Corporation’s 2019 Annual Report on Form 10-K. For a disaggregation of noninterest income by business segment and All Other, see Note 17 – Business Segment Information.
| | | | | | | | | | | | | | | | | | | | | | | | | | | | | | | | |
| | | | | | | | | | | | | | |
| | | | | | Three Months Ended September 30 | | Nine Months Ended September 30 |
| (Dollars in millions) | | | | | | | | | | 2020 | | 2019 | | 2020 | | 2019 |
| Net interest income | | | | | | | | | | | | | | | | |
| Interest income | | | | | | | | | | | | | | | | |
| Loans and leases | | | | | | | | | | $ | 7,894 | | | $ | 10,894 | | | $ | 26,426 | | | $ | 32,721 | |
| Debt securities | | | | | | | | | | 2,130 | | | 2,829 | | | 7,413 | | | 8,965 | |
| Federal funds sold and securities borrowed or purchased under agreements to resell | | | | | | | | | | 55 | | | 1,242 | | | 900 | | | 3,746 | |
| Trading account assets | | | | | | | | | | 948 | | | 1,319 | | | 3,203 | | | 3,962 | |
| Other interest income | | | | | | | | | | 459 | | | 1,632 | | | 2,182 | | | 4,916 | |
| Total interest income | | | | | | | | | | 11,486 | | | 17,916 | | | 40,124 | | | 54,310 | |
| | | | | | | | | | | | | | | | |
| Interest expense | | | | | | | | | | | | | | | | |
| Deposits | | | | | | | | | | 227 | | | 1,880 | | | 1,784 | | | 5,640 | |
| Short-term borrowings | | | | | | | | | | (24) | | | 1,876 | | | 1,024 | | | 5,725 | |
| Trading account liabilities | | | | | | | | | | 212 | | | 303 | | | 764 | | | 967 | |
| Long-term debt | | | | | | | | | | 942 | | | 1,670 | | | 3,445 | | | 5,227 | |
| Total interest expense | | | | | | | | | | 1,357 | | | 5,729 | | | 7,017 | | | 17,559 | |
| Net interest income | | | | | | | | | | $ | 10,129 | | | $ | 12,187 | | | $ | 33,107 | | | $ | 36,751 | |
| | | | | | | | | | | | | | | | |
| Noninterest income | | | | | | | | | | | | | | | | |
| Fees and commissions | | | | | | | | | | | | | | | | |
| Card income | | | | | | | | | | | | | | | | |
Interchange fees (1) | | | | | | | | | | $ | 1,172 | | | $ | 963 | | | $ | 2,794 | | | $ | 2,827 | |
| Other card income | | | | | | | | | | 396 | | | 502 | | | 1,295 | | | 1,459 | |
| Total card income | | | | | | | | | | 1,568 | | | 1,465 | | | 4,089 | | | 4,286 | |
| Service charges | | | | | | | | | | | | | | | | |
| Deposit-related fees | | | | | | | | | | 1,515 | | | 1,690 | | | 4,441 | | | 4,908 | |
| Lending-related fees | | | | | | | | | | 302 | | | 285 | | | 841 | | | 809 | |
| Total service charges | | | | | | | | | | 1,817 | | | 1,975 | | | 5,282 | | | 5,717 | |
| Investment and brokerage services | | | | | | | | | | | | | | | | |
| Asset management fees | | | | | | | | | | 2,740 | | | 2,597 | | | 7,905 | | | 7,591 | |
| Brokerage fees | | | | | | | | | | 883 | | | 897 | | | 2,898 | | | 2,733 | |
| Total investment and brokerage services | | | | | | | | | | 3,623 | | | 3,494 | | | 10,803 | | | 10,324 | |
| Investment banking fees | | | | | | | | | | | | | | | | |
| Underwriting income | | | | | | | | | | 1,239 | | | 740 | | | 3,610 | | | 2,198 | |
| Syndication fees | | | | | | | | | | 133 | | | 341 | | | 634 | | | 887 | |
| Financial advisory services | | | | | | | | | | 397 | | | 452 | | | 1,072 | | | 1,083 | |
| Total investment banking fees | | | | | | | | | | 1,769 | | | 1,533 | | | 5,316 | | | 4,168 | |
| Total fees and commissions | | | | | | | | | | 8,777 | | | 8,467 | | | 25,490 | | | 24,495 | |
| Market making and similar activities | | | | | | | | | | 1,689 | | | 2,118 | | | 6,983 | | | 7,267 | |
| Other income | | | | | | | | | | (259) | | | 35 | | | (151) | | | 382 | |
| Total noninterest income | | | | | | | | | | $ | 10,207 | | | $ | 10,620 | | | $ | 32,322 | | | $ | 32,144 | |
(1)Gross interchange fees were $2.4 billion and $2.6 billion for the three months ended September 30, 2020 and 2019 and are presented net of $1.4 billion and $1.6 billion of expenses for rewards and partner payments as well as certain other card costs. Gross interchange fees were $6.7 billion and $7.4 billion for the nine months ended September 30, 2020 and 2019 and are presented net of $4.1 billion and $4.6 billion of expenses for rewards and partner payments as well as certain other card costs for the same periods.
NOTE 3Derivatives
Derivative Balances
Derivatives are entered into on behalf of customers, for trading or to support risk management activities. Derivatives used in risk management activities include derivatives that may or may not be designated in qualifying hedge accounting relationships. Derivatives that are not designated in qualifying hedge accounting relationships are referred to as other risk management derivatives. For more information on the Corporation’s derivatives and hedging activities, see Note 1 –
Summary of Significant Accounting Principlesto the Consolidated Financial Statementsof the Corporation’s 2019 Annual Report on Form 10-K. The following tables present derivative instruments included on the Consolidated Balance Sheet in derivative assets and liabilities at September 30, 2020 and December 31, 2019. Balances are presented on a gross basis, prior to the application of counterparty and cash collateral netting. Total derivative assets and liabilities are adjusted on an aggregate basis to take into consideration the effects of legally enforceable master netting agreements and have been reduced by cash collateral received or paid.
| | | | | | | | | | | | | | | | | | | | | | | | | | | | | | | | | | | | | | | | | |
| | | | | | | | | | | | | |
| | | September 30, 2020 |
| | | Gross Derivative Assets | | Gross Derivative Liabilities |
| (Dollars in billions) | Contract/ Notional (1) | | Trading and Other Risk Management Derivatives | | Qualifying
Accounting
Hedges | | Total | | Trading and Other Risk Management Derivatives | | Qualifying
Accounting
Hedges | | Total |
| Interest rate contracts | | | | | | | | | | | | | |
| Swaps | $ | 16,869.8 | | | $ | 203.8 | | | $ | 13.0 | | | $ | 216.8 | | | $ | 214.9 | | | $ | 0.9 | | | $ | 215.8 | |
| Futures and forwards | 5,599.2 | | | 2.0 | | | 0.1 | | | 2.1 | | | 1.9 | | | 0 | | | 1.9 | |
| Written options | 1,599.1 | | | 0 | | | 0 | | | 0 | | | 44.8 | | | 0 | | | 44.8 | |
| Purchased options | 1,573.0 | | | 51.2 | | | 0 | | | 51.2 | | | 0 | | | 0 | | | 0 | |
| Foreign exchange contracts | | | | | | | | | | | | | |
| Swaps | 1,471.8 | | | 30.9 | | | 0.4 | | | 31.3 | | | 34.8 | | | 0.6 | | | 35.4 | |
| Spot, futures and forwards | 4,278.5 | | | 35.9 | | | 0.2 | | | 36.1 | | | 36.0 | | | 0.1 | | | 36.1 | |
| Written options | 297.6 | | | 0 | | | 0 | | | 0 | | | 4.4 | | | 0 | | | 4.4 | |
| Purchased options | 294.7 | | | 4.6 | | | 0 | | | 4.6 | | | 0 | | | 0 | | | 0 | |
| Equity contracts | | | | | | | | | | | | | |
| Swaps | 291.2 | | | 12.0 | | | 0 | | | 12.0 | | | 12.5 | | | 0 | | | 12.5 | |
| Futures and forwards | 109.3 | | | 0.7 | | | 0 | | | 0.7 | | | 0.7 | | | 0 | | | 0.7 | |
| Written options | 650.3 | | | 0 | | | 0 | | | 0 | | | 44.5 | | | 0 | | | 44.5 | |
| Purchased options | 586.8 | | | 46.6 | | | 0 | | | 46.6 | | | 0 | | | 0 | | | 0 | |
| Commodity contracts | | | | | | | | | | | | | |
| Swaps | 36.7 | | | 2.9 | | | 0 | | | 2.9 | | | 4.1 | | | 0 | | | 4.1 | |
| Futures and forwards | 62.2 | | | 2.2 | | | 0 | | | 2.2 | | | 1.0 | | | 0 | | | 1.0 | |
| Written options | 29.5 | | | 0 | | | 0 | | | 0 | | | 2.3 | | | 0 | | | 2.3 | |
| Purchased options | 29.6 | | | 2.1 | | | 0 | | | 2.1 | | | 0 | | | 0 | | | 0 | |
Credit derivatives (2) | | | | | | | | | | | | | |
| Purchased credit derivatives: | | | | | | | | | | | | | |
| Credit default swaps | 398.7 | | | 4.3 | | | 0 | | | 4.3 | | | 4.3 | | | 0 | | | 4.3 | |
| Total return swaps/options | 92.1 | | | 0.5 | | | 0 | | | 0.5 | | | 1.1 | | | 0 | | | 1.1 | |
| Written credit derivatives: | | | | | | | | | | | | | |
| Credit default swaps | 386.8 | | | 4.2 | | | 0 | | | 4.2 | | | 3.6 | | | 0 | | | 3.6 | |
| Total return swaps/options | 83.2 | | | 0.5 | | | 0 | | | 0.5 | | | 0.6 | | | 0 | | | 0.6 | |
| Gross derivative assets/liabilities | | | $ | 404.4 | | | $ | 13.7 | | | $ | 418.1 | | | $ | 411.5 | | | $ | 1.6 | | | $ | 413.1 | |
| Less: Legally enforceable master netting agreements | | | | | | | (332.5) | | | | | | | (332.5) | |
| Less: Cash collateral received/paid | | | | | | | (41.3) | | | | | | | (38.9) | |
| Total derivative assets/liabilities | | | | | | | $ | 44.3 | | | | | | | $ | 41.7 | |
(1)Represents the total contract/notional amount of derivative assets and liabilities outstanding.
(2)The net derivative asset (liability) and notional amount of written credit derivatives for which the Corporation held purchased credit derivatives with identical underlying referenced names were $217 million and $332.6 billion at September 30, 2020.
| | | | | | | | | | | | | | | | | | | | | | | | | | | | | | | | | | | | | | | | | |
| | | | | | | | | | | | | |
| | | December 31, 2019 |
| | | Gross Derivative Assets | | Gross Derivative Liabilities |
| (Dollars in billions) | Contract/ Notional (1) | | Trading and Other Risk Management Derivatives | | Qualifying
Accounting
Hedges | | Total | | Trading and Other Risk Management Derivatives | | Qualifying
Accounting
Hedges | | Total |
| Interest rate contracts | | | | | | | | | | | | | |
| Swaps | $ | 15,074.4 | | | $ | 162.0 | | | $ | 9.7 | | | $ | 171.7 | | | $ | 168.5 | | | $ | 0.4 | | | $ | 168.9 | |
| Futures and forwards | 3,279.8 | | | 1.0 | | | 0 | | | 1.0 | | | 1.0 | | | 0 | | | 1.0 | |
| Written options | 1,767.7 | | | 0 | | | 0 | | | 0 | | | 32.5 | | | 0 | | | 32.5 | |
| Purchased options | 1,673.6 | | | 37.4 | | | 0 | | | 37.4 | | | 0 | | | 0 | | | 0 | |
| Foreign exchange contracts | | | | | | | | | | | | | |
| Swaps | 1,657.7 | | | 30.3 | | | 0.7 | | | 31.0 | | | 31.7 | | | 0.9 | | | 32.6 | |
| Spot, futures and forwards | 3,792.7 | | | 35.9 | | | 0.1 | | | 36.0 | | | 38.7 | | | 0.3 | | | 39.0 | |
| Written options | 274.3 | | | 0 | | | 0 | | | 0 | | | 3.8 | | | 0 | | | 3.8 | |
| Purchased options | 261.6 | | | 4.0 | | | 0 | | | 4.0 | | | 0 | | | 0 | | | 0 | |
| Equity contracts | | | | | | | | | | | | | |
| Swaps | 315.0 | | | 6.5 | | | 0 | | | 6.5 | | | 8.1 | | | 0 | | | 8.1 | |
| Futures and forwards | 125.1 | | | 0.3 | | | 0 | | | 0.3 | | | 1.1 | | | 0 | | | 1.1 | |
| Written options | 731.1 | | | 0 | | | 0 | | | 0 | | | 34.6 | | | 0 | | | 34.6 | |
| Purchased options | 668.6 | | | 42.4 | | | 0 | | | 42.4 | | | 0 | | | 0 | | | 0 | |
| Commodity contracts | | | | | | | | | | | | | |
| Swaps | 42.0 | | | 2.1 | | | 0 | | | 2.1 | | | 4.4 | | | 0 | | | 4.4 | |
| Futures and forwards | 61.3 | | | 1.7 | | | 0 | | | 1.7 | | | 0.4 | | | 0 | | | 0.4 | |
| Written options | 33.2 | | | 0 | | | 0 | | | 0 | | | 1.4 | | | 0 | | | 1.4 | |
| Purchased options | 37.9 | | | 1.4 | | | 0 | | | 1.4 | | | 0 | | | 0 | | | 0 | |
Credit derivatives (2) | | | | | | | | | | | | | |
| Purchased credit derivatives: | | | | | | | | | | | | | |
| Credit default swaps | 321.6 | | | 2.7 | | | 0 | | | 2.7 | | | 5.6 | | | 0 | | | 5.6 | |
| Total return swaps/options | 86.6 | | | 0.4 | | | 0 | | | 0.4 | | | 1.3 | | | 0 | | | 1.3 | |
| Written credit derivatives: | | | | | | | | | | | | | |
| Credit default swaps | 300.2 | | | 5.4 | | | 0 | | | 5.4 | | | 2.0 | | | 0 | | | 2.0 | |
| Total return swaps/options | 86.2 | | | 0.8 | | | 0 | | | 0.8 | | | 0.4 | | | 0 | | | 0.4 | |
| Gross derivative assets/liabilities | | | $ | 334.3 | | | $ | 10.5 | | | $ | 344.8 | | | $ | 335.5 | | | $ | 1.6 | | | $ | 337.1 | |
| Less: Legally enforceable master netting agreements | | | | | | | (270.4) | | | | | | | (270.4) | |
| Less: Cash collateral received/paid | | | | | | | (33.9) | | | | | | | (28.5) | |
| Total derivative assets/liabilities | | | | | | | $ | 40.5 | | | | | | | $ | 38.2 | |
(1)Represents the total contract/notional amount of derivative assets and liabilities outstanding.
(2)The net derivative asset (liability) and notional amount of written credit derivatives for which the Corporation held purchased credit derivatives with identical underlying referenced names were $2.8 billion and $309.7 billion at December 31, 2019.
Offsetting of Derivatives
The Corporation enters into International Swaps and Derivatives Association, Inc. (ISDA) master netting agreements or similar agreements with substantially all of the Corporation’s derivative counterparties. For more information, see Note 3 – Derivatives to the Consolidated Financial Statementsof the Corporation’s 2019 Annual Report on Form 10-K.
The following table presents derivative instruments included in derivative assets and liabilities on the Consolidated Balance Sheet at September 30, 2020 and December 31, 2019 by primary risk (e.g., interest rate risk) and the platform, where
applicable, on which these derivatives are transacted. Balances are presented on a gross basis, prior to the application of counterparty and cash collateral netting. Total gross derivative assets and liabilities are adjusted on an aggregate basis to take into consideration the effects of legally enforceable master netting agreements which include reducing the balance for counterparty netting and cash collateral received or paid.
For more information on offsetting of securities financing agreements, see Note 9 – Federal Funds Sold or Purchased, Securities Financing Agreements, Short-term Borrowings and Restricted Cash.
| | | | | | | | | | | | | | | | | | | | | | | |
| | | | | | | |
Offsetting of Derivatives (1) | | | | | | | |
| | | | | | | |
| Derivative
Assets | | Derivative Liabilities | | Derivative
Assets | | Derivative Liabilities |
| (Dollars in billions) | September 30, 2020 | | December 31, 2019 |
| Interest rate contracts | | | | | | | |
| Over-the-counter | $ | 260.6 | | | $ | 253.1 | | | $ | 203.1 | | | $ | 196.6 | |
| Exchange-traded | 0.1 | | | 0.1 | | | 0.1 | | | 0.1 | |
| Over-the-counter cleared | 9.5 | | | 8.7 | | | 6.0 | | | 5.3 | |
| Foreign exchange contracts | | | | | | | |
| Over-the-counter | 69.3 | | | 73.5 | | | 69.2 | | | 73.1 | |
| Over-the-counter cleared | 1.1 | | | 1.0 | | | 0.5 | | | 0.5 | |
| Equity contracts | | | | | | | |
| Over-the-counter | 26.0 | | | 22.3 | | | 21.3 | | | 17.8 | |
| Exchange-traded | 31.9 | | | 32.2 | | | 26.4 | | | 22.8 | |
| Commodity contracts | | | | | | | |
| Over-the-counter | 5.0 | | | 5.3 | | | 2.8 | | | 4.2 | |
| Exchange-traded | 1.0 | | | 1.1 | | | 0.8 | | | 0.8 | |
| Over-the-counter cleared | 0 | | | 0 | | | 0 | | | 0.1 | |
| Credit derivatives | | | | | | | |
| Over-the-counter | 6.8 | | | 7.1 | | | 6.4 | | | 6.6 | |
| Over-the-counter cleared | 2.6 | | | 2.3 | | | 2.5 | | | 2.2 | |
| Total gross derivative assets/liabilities, before netting | | | | | | | |
| Over-the-counter | 367.7 | | | 361.3 | | | 302.8 | | | 298.3 | |
| Exchange-traded | 33.0 | | | 33.4 | | | 27.3 | | | 23.7 | |
| Over-the-counter cleared | 13.2 | | | 12.0 | | | 9.0 | | | 8.1 | |
| Less: Legally enforceable master netting agreements and cash collateral received/paid | | | | | | | |
| Over-the-counter | (332.6) | | | (330.8) | | | (274.7) | | | (269.3) | |
| Exchange-traded | (28.9) | | | (28.9) | | | (21.5) | | | (21.5) | |
| Over-the-counter cleared | (12.3) | | | (11.7) | | | (8.1) | | | (8.1) | |
| Derivative assets/liabilities, after netting | 40.1 | | | 35.3 | | | 34.8 | | | 31.2 | |
Other gross derivative assets/liabilities (2) | 4.2 | | | 6.4 | | | 5.7 | | | 7.0 | |
| Total derivative assets/liabilities | 44.3 | | | 41.7 | | | 40.5 | | | 38.2 | |
Less: Financial instruments collateral (3) | (15.8) | | | (16.4) | | | (14.6) | | | (16.1) | |
| Total net derivative assets/liabilities | $ | 28.5 | | | $ | 25.3 | | | $ | 25.9 | | | $ | 22.1 | |
(1)Over-the-counter derivatives include bilateral transactions between the Corporation and a particular counterparty. Over-the-counter-cleared derivatives include bilateral transactions between the Corporation and a counterparty where the transaction is cleared through a clearinghouse. Exchange-traded derivatives include listed options transacted on an exchange.
(2)Consists of derivatives entered into under master netting agreements where the enforceability of these agreements is uncertain under bankruptcy laws in some countries or industries.
(3)Amounts are limited to the derivative asset/liability balance and, accordingly, do not include excess collateral received/pledged. Financial instruments collateral includes securities collateral received or pledged and cash securities held and posted at third-party custodians that are not offset on the Consolidated Balance Sheet but shown as a reduction to derive net derivative assets and liabilities.
ALM and Risk Management Derivatives
The Corporation’s asset and liability management (ALM) and risk management activities include the use of derivatives to mitigate risk to the Corporation including derivatives designated in qualifying hedge accounting relationships and derivatives used in other risk management activities. For more information on ALM and risk management derivatives, see Note 3 – Derivatives to the Consolidated Financial Statements of the Corporation’s 2019 Annual Report on Form 10-K.
Derivatives Designated as Accounting Hedges
The Corporation uses various types of interest rate and foreign exchange derivative contracts to protect against changes in the fair value of its assets and liabilities due to fluctuations in
interest rates and exchange rates (fair value hedges). The Corporation also uses these types of contracts to protect against changes in the cash flows of its assets and liabilities, and other forecasted transactions (cash flow hedges). The Corporation hedges its net investment in consolidated non-U.S. operations determined to have functional currencies other than the U.S. dollar using forward exchange contracts and cross-currency basis swaps, and by issuing foreign currency-denominated debt (net investment hedges).
Fair Value Hedges
The following table summarizes information related to fair value hedges for the three and nine months ended September 30, 2020 and 2019.
| | | | | | | | | | | | | | | | | | | | | | | | | | | | | | | | | | | | | |
| | | | | | | | | | | | | | | | | | | | | |
| Gains and Losses on Derivatives Designated as Fair Value Hedges | | | | | | |
| | | | | | | | | | | | | | | | | | | | | |
| Three Months Ended September 30, 2020 | | | | Three Months Ended September 30, 2019 | | | | | | | | | | | | |
| | | | | | | | | | | | | | | | | |
| (Dollars in millions) | Derivative | | Hedged Item | | | | Derivative | | Hedged Item | | | | |
| | | | | | | | | | | | | | | | | |
Interest rate risk on long-term debt (1) | $ | (1,523) | | | $ | 1,473 | | | | | $ | 3,328 | | | $ | (3,342) | | | | | | | | | | | | | |
Interest rate and foreign currency risk on long-term debt (2) | 79 | | | (87) | | | | | (110) | | | 111 | | | | | | | | | | | | | |
Interest rate risk on available-for-sale securities (3) | 139 | | | (139) | | | | | (33) | | | 30 | | | | | | | | | | | | | |
| | | | | | | | | | | | | | | | | | | | | |
| Total | $ | (1,305) | | | $ | 1,247 | | | | | $ | 3,185 | | | $ | (3,201) | | | | | | | | | | | | | |
| | | | | | | | | | | | | | | | | | | | | |
| Nine Months Ended September 30, 2020 | | | | Nine Months Ended September 30, 2019 | | | | | | | | | | | |
| Derivative | | Hedged Item | | | | Derivative | | Hedged Item | | | | | | | | | | | | |
Interest rate risk on long-term debt (1) | $ | 9,286 | | | $ | (9,403) | | | | | $ | 9,373 | | | $ | (9,392) | | | | | | | | | | | | | |
Interest rate and foreign currency risk on long-term debt (2) | 644 | | | (638) | | | | | (12) | | | 31 | | | | | | | | | | | | | |
Interest rate risk on available-for-sale securities (3) | (572) | | | 559 | | | | | (133) | | | 128 | | | | | | | | | | | | | |
| | | | | | | | | | | | | | | | | | | | | |
| Total | $ | 9,358 | | | $ | (9,482) | | | | | $ | 9,228 | | | $ | (9,233) | | | | | | | | | | | | | |
(1)Amounts are recorded in interest expense in the Consolidated Statement of Income.
(2)For the three and nine months ended September 30, 2020, the derivative amount includes gains (losses) of $(13) million and $718 million in interest expense, $95 million and $(83) million in market making and similar activities, and $(3) million and $9 million in accumulated OCI. For the same periods in 2019, the derivative amount includes gains (losses) of $(59) million and $108 million in interest expense, $(53) million and $(142) million in market making and similar activities, and $2 million and $22 million in accumulated OCI. Line item totals are in the Consolidated Statement of Income and on the Consolidated Balance Sheet.
(3)Amounts are recorded in interest income in the Consolidated Statement of Income.
The table below summarizes the carrying value of hedged assets and liabilities that are designated and qualifying in fair value hedging relationships along with the cumulative amount of fair value hedging adjustments included in the carrying value that have been recorded in the current hedging relationships. These fair value hedging adjustments are open basis adjustments that are not subject to amortization as long as the hedging relationship remains designated.
| | | | | | | | | | | | | | | | | | | | | | | | | | | | |
| | | | | | | | | | | | |
| Designated Fair Value Hedged Assets (Liabilities) | |
| | | | | | | | | | | | |
| September 30, 2020 | | December 31, 2019 | | | | | |
| (Dollars in millions) | Carrying Value | | Cumulative Fair Value Adjustments (1) | | Carrying Value | | Cumulative Fair Value Adjustments (1) | | | | | |
| | | | | | | | |
Long-term debt (2) | $ | (126,852) | | | $ | (12,071) | | | $ | (162,389) | | | $ | (8,685) | | | | | | |
Available-for-sale debt securities (2, 3, 4) | 102,474 | | | 566 | | | 1,654 | | | 64 | | | | | | |
| | | | | | | | | | | | |
| |
| | | | | | | | | | | | |
| | | | | | |
| | | | | | |
| | | | | | | | | | | | |
| | | | | | | | | | | | |
| | | | | | | | | | | | |
(1)For assets, increase (decrease) to carrying value and for liabilities, (increase) decrease to carrying value.
(2)At September 30, 2020, the cumulative fair value adjustments remaining on long-term debt and AFS debt securities from discontinued hedging relationships resulted in an increase in the related liability of $1.3 billion and a decrease in the related asset of $6 million compared to a decrease in the related liability of $1.3 billion and an increase in the related asset of $8 million at December 31, 2019, which are being amortized over the remaining contractual life of the de-designated hedged items.
(3)These amounts include the amortized cost basis of the prepayable financial assets used to designate hedging relationships in which the hedged item is the last layer expected to be remaining at the end of the hedging relationship. At September 30, 2020, the amortized cost of the closed portfolios used in these hedging relationships was $40.2 billion, of which $8.4 billion was designated in the hedging relationship. The cumulative basis adjustments associated with these hedging relationships totaled $33 million.
(4)Carrying value represents amortized cost.
Cash Flow and Net Investment Hedges
The following table summarizes certain information related to cash flow hedges and net investment hedges for the three and nine months ended September 30, 2020 and 2019. Of the $408 million after-tax net gain ($542 million pretax) on derivatives in accumulated OCI at September 30, 2020, gains of $191 million after-tax ($252 million pretax) related to open cash flow hedges are expected to be reclassified into earnings
in the next 12 months. These net gains reclassified into earnings are expected to primarily increase net interest income related to the respective hedged items. For terminated cash flow hedges, the time period over which the majority of the forecasted transactions are hedged is approximately 3 years, with a maximum length of time for certain forecasted transactions of 16 years.
| | | | | | | | | | | | | | | | | | | | | | | | | | | | | | | | | | | | | | | | |
| | | | | | | | | | | | | | | | | | | | | | | | |
| Gains and Losses on Derivatives Designated as Cash Flow and Net Investment Hedges | | | |
| | | | | | | | | | | | | | | | | | | | | | | | |
| | | | | | | | | | |
| | | | | | | | | | | | | | | | | | | | |
| | | | | Gains (Losses) Recognized in
Accumulated OCI
on Derivatives | | Gains (Losses)
in Income
Reclassified from Accumulated OCI | | Gains (Losses) Recognized in
Accumulated OCI
on Derivatives | | Gains (Losses)
in Income
Reclassified from Accumulated OCI | | | | | | | | | | | | | |
| (Dollars in millions, amounts pretax) | | | | | Three Months Ended September 30, 2020 | | Nine Months Ended September 30, 2020 | | | | | | | | | | | | | |
| Cash flow hedges | | | | | | | | | | | | | | | | | | | | | | | | |
Interest rate risk on variable-rate assets (1) | | | | | $ | (101) | | | $ | 5 | | | $ | 810 | | | $ | (44) | | | | | | | | | | | | | | |
Price risk on forecasted MBS purchases (1) | | | | | 184 | | | 3 | | | 184 | | | 3 | | | | | | | | | | | | | | |
Price risk on certain compensation plans (2) | | | | | 32 | | | 5 | | | 23 | | | 5 | | | | | | | | | | | | | | |
| Total | | | | | $ | 115 | | | $ | 13 | | | $ | 1,017 | | | $ | (36) | | | | | | | | | | | | | | |
| Net investment hedges | | | | | | | | | | | | | | | | | | | | | | | | |
Foreign exchange risk (3) | | | | | $ | (703) | | | $ | 0 | | | $ | 265 | | | $ | 1 | | | | | | | | | | | | | | |
| | | | | | | | | | | | | | | | | | | | | | | | |
| | | | | Three Months Ended September 30, 2019 | | Nine Months Ended September 30, 2019 | | | | | | | | | | | | | |
| Cash flow hedges | | | | | | | | | | | | | | | | | | | | | | | | |
Interest rate risk on variable-rate assets (1) | | | | | $ | 125 | | | $ | (27) | | | $ | 743 | | | $ | (78) | | | | | | | | | | | | | | |
| | | | | | | | | | | | | | | | | | | | | | | | |
| | | | | | | | | | | | | | | | | | | | | | | | |
| Net investment hedges | | | | | | | | | | | | | | | | | | | | | | | | |
Foreign exchange risk (3) | | | | | $ | 786 | | | $ | 362 | | | $ | 590 | | | $ | 363 | | | | | | | | | | | | | | |
(1)Amounts reclassified from accumulated OCI are recorded in interest income in the Consolidated Statement of Income.
(2)Amounts reclassified from accumulated OCI are recorded in compensation and benefits expense in the Consolidated Statement of Income.
(3)Amounts reclassified from accumulated OCI are recorded in other income in the Consolidated Statement of Income. For the three and nine months ended September 30, 2020, amounts excluded from effectiveness testing and recognized in market making and similar activities were gains of $10 million and $115 million. For the same periods in 2019, amounts excluded from effectiveness testing and recognized in market making and similar activities were gains of $32 million and $109 million.
Other Risk Management Derivatives
Other risk management derivatives are used by the Corporation to reduce certain risk exposures by economically hedging various assets and liabilities. The following table presents gains (losses) on these derivatives for the three and nine months ended September 30, 2020 and 2019. These gains (losses) are largely offset by the income or expense recorded on the hedged item.
| | | | | | | | | | | | | | | | | | | | | | | | | |
| | | | | | | | | |
| Gains and Losses on Other Risk Management Derivatives |
| | | | | | | | | |
| | | | | | | | | |
| Three Months Ended September 30 | | Nine Months Ended September 30 |
| (Dollars in millions) | 2020 | | 2019 | | 2020 | | 2019 | | |
Interest rate risk on mortgage activities (1, 2) | $ | 32 | | | $ | 110 | | | $ | 473 | | | $ | 361 | | | |
Credit risk on loans (2) | (28) | | | (8) | | | (6) | | | (48) | | | |
Interest rate and foreign currency risk on ALM activities (3) | (2,571) | | | 1,576 | | | (2,060) | | | 2,450 | | | |
Price risk on certain compensation plans (4) | 263 | | | (7) | | | 109 | | | 629 | | | |
(1)Primarily related to hedges of interest rate risk on mortgage servicing rights and interest rate lock commitments to originate mortgage loans that will be held for sale. The net gains on interest rate lock commitments which are not included in the table but are considered derivative instruments, were $41 million and $128 million for the three and nine months ended September 30, 2020 compared to $20 million and $56 million for the same periods in 2019.
(2)Gains (losses) on these derivatives are recorded in other income.
(3)Gains (losses) on these derivatives are recorded in market making and similar activities.
(4)Gains (losses) on these derivatives are recorded in compensation and benefits expense.
Transfers of Financial Assets with Risk Retained through Derivatives
The Corporation enters into certain transactions involving the transfer of financial assets that are accounted for as sales where substantially all of the economic exposure to the transferred financial assets is retained through derivatives (e.g., interest rate and/or credit), but the Corporation does not retain control over the assets transferred. At September 30, 2020 and December 31, 2019, the Corporation had transferred $5.1 billion and $5.2 billion of non-U.S. government-guaranteed mortgage-backed securities (MBS) to a third-party trust and retained economic exposure to the transferred assets through derivative contracts. In connection with these transfers, the Corporation received gross cash proceeds of $5.1 billion and $5.2 billion at the transfer dates. At September 30, 2020 and December 31, 2019, the fair value of the transferred securities was $5.2 billion and $5.3 billion.
Sales and Trading Revenue
The Corporation enters into trading derivatives to facilitate client transactions and to manage risk exposures arising from trading
account assets and liabilities. It is the Corporation’s policy to include these derivative instruments in its trading activities, which include derivatives and non-derivative cash instruments. The resulting risk from these derivatives is managed on a portfolio basis as part of the Corporation’s Global Markets business segment. For more information on sales and trading revenue, see Note 3 – Derivatives to the Consolidated Financial Statements of the Corporation’s 2019 Annual Report on Form 10-K.
The following table, which includes both derivatives and non-derivative cash instruments, identifies the amounts in the respective income statement line items attributable to the Corporation’s sales and trading revenue in Global Markets, categorized by primary risk, for the three and nine months ended September 30, 2020 and 2019. This table includes debit valuation adjustment (DVA) and funding valuation adjustment (FVA) gains (losses). Global Markets results in Note 17 – Business Segment Information are presented on a fully taxable-equivalent (FTE) basis. The table below is not presented on an FTE basis.
| | | | | | | | | | | | | | | | | | | | | | | | | | | | | | | | | | | | | | | | | | | | | | | |
| | | | | | | | | | | | | | | |
| Sales and Trading Revenue |
| | | | | | | | | | | | | | | |
| Market making and similar activities | | Net Interest
Income | | Other (1) | | Total | | Market making and similar activities | | Net Interest
Income | | Other (1) | | Total |
| | | |
| (Dollars in millions) | Three Months Ended September 30, 2020 | | Nine Months Ended September 30, 2020 |
| Interest rate risk | $ | 65 | | | $ | 576 | | | $ | 58 | | | $ | 699 | | | $ | 2,253 | | | $ | 1,851 | | | $ | 179 | | | $ | 4,283 | |
| Foreign exchange risk | 340 | | | (10) | | | 4 | | | 334 | | | 1,145 | | | (8) | | | (3) | | | 1,134 | |
| Equity risk | 817 | | | (7) | | | 391 | | | 1,201 | | | 2,820 | | | (99) | | | 1,361 | | | 4,082 | |
| Credit risk | 411 | | | 370 | | | 74 | | | 855 | | | 567 | | | 1,239 | | | 250 | | | 2,056 | |
| Other risk | 92 | | | (7) | | | 12 | | | 97 | | | 272 | | | 21 | | | 24 | | | 317 | |
| Total sales and trading revenue | $ | 1,725 | | | $ | 922 | | | $ | 539 | | | $ | 3,186 | | | $ | 7,057 | | | $ | 3,004 | | | $ | 1,811 | | | $ | 11,872 | |
| | | | | | | | | | | | | | | |
| | | | | | | | | | | | | | | |
| Three Months Ended September 30, 2019 | | Nine Months Ended September 30, 2019 |
| Interest rate risk | $ | 30 | | | $ | 477 | | | $ | 212 | | | $ | 719 | | | $ | 659 | | | $ | 1,273 | | | $ | 357 | | | $ | 2,289 | |
| Foreign exchange risk | 313 | | | 16 | | | 12 | | | 341 | | | 954 | | | 50 | | | 28 | | | 1,032 | |
| Equity risk | 907 | | | (121) | | | 366 | | | 1,152 | | | 2,886 | | | (560) | | | 1,161 | | | 3,487 | |
| Credit risk | 273 | | | 451 | | | 140 | | | 864 | | | 1,039 | | | 1,349 | | | 405 | | | 2,793 | |
| Other risk | 57 | | | 11 | | | 12 | | | 80 | | | 83 | | | 58 | | | 40 | | | 181 | |
| Total sales and trading revenue | $ | 1,580 | | | $ | 834 | | | $ | 742 | | | $ | 3,156 | | | $ | 5,621 | | | $ | 2,170 | | | $ | 1,991 | | | $ | 9,782 | |
| | | | | | | | | | | | | | | |
| | | |
| | | | | | | | | | | | | | | |
| | | | | | | | | | | | | | | |
| | | | | | | | | | | | | | | |
| | | | | | | | | | | | | | | |
| | | | | | | | | | | | | | | |
| | | | | | | | | | | | | | | |
(1)Represents amounts in investment and brokerage services and other income that are recorded in Global Markets and included in the definition of sales and trading revenue. Includes investment and brokerage services revenue of $430 million and $1.5 billion for the three and nine months ended September 30, 2020 compared to $410 million and $1.3 billion for the same periods in 2019.
Credit Derivatives
The Corporation enters into credit derivatives primarily to facilitate client transactions and to manage credit risk exposures. Credit derivatives are classified as investment and non-investment grade based on the credit quality of the underlying referenced obligation. The Corporation considers ratings of BBB- or higher as investment grade. Non-investment grade includes non-rated credit derivative instruments. The Corporation discloses internal categorizations of investment
grade and non-investment grade consistent with how risk is managed for these instruments. For more information on credit derivatives, see Note 3 – Derivatives to the Consolidated Financial Statements of the Corporation’s 2019 Annual Report on Form 10-K.
Credit derivative instruments where the Corporation is the seller of credit protection and their expiration at September 30, 2020 and December 31, 2019 are summarized in the following table.
| | | | | | | | | | | | | | | | | | | | | | | | | | | | | |
| | | | | | | | | |
| Credit Derivative Instruments | | | | | | | | | |
| | | | | | | | | |
| Less than
One Year | | One to
Three Years | | Three to
Five Years | | Over Five
Years | | Total |
| September 30, 2020 |
| (Dollars in millions) | Carrying Value |
| Credit default swaps: | | | | | | | | | |
| Investment grade | $ | 0 | | | $ | 10 | | | $ | 79 | | | $ | 213 | | | $ | 302 | |
| Non-investment grade | 54 | | | 527 | | | 1,059 | | | 1,698 | | | 3,338 | |
| Total | 54 | | | 537 | | | 1,138 | | | 1,911 | | | 3,640 | |
| Total return swaps/options: | | | | | | | | | |
| Investment grade | 120 | | | 0 | | | 0 | | | 0 | | | 120 | |
| Non-investment grade | 508 | | | 1 | | | 0 | | | 0 | | | 509 | |
| Total | 628 | | | 1 | | | 0 | | | 0 | | | 629 | |
| Total credit derivatives | $ | 682 | | | $ | 538 | | | $ | 1,138 | | | $ | 1,911 | | | $ | 4,269 | |
| Credit-related notes: | | | | | | | | | |
| Investment grade | $ | 0 | | | $ | 2 | | | $ | 0 | | | $ | 579 | | | $ | 581 | |
| Non-investment grade | 6 | | | 2 | | | 4 | | | 1,019 | | | 1,031 | |
| Total credit-related notes | $ | 6 | | | $ | 4 | | | $ | 4 | | | $ | 1,598 | | | $ | 1,612 | |
| | Maximum Payout/Notional |
| Credit default swaps: | | | | | | | | | |
| Investment grade | $ | 45,486 | | | $ | 78,733 | | | $ | 116,365 | | | $ | 34,056 | | | $ | 274,640 | |
| Non-investment grade | 19,008 | | | 31,252 | | | 44,187 | | | 17,721 | | | 112,168 | |
| Total | 64,494 | | | 109,985 | | | 160,552 | | | 51,777 | | | 386,808 | |
| Total return swaps/options: | | | | | | | | | |
| Investment grade | 50,952 | | | 61 | | | 74 | | | 0 | | | 51,087 | |
| Non-investment grade | 31,484 | | | 656 | | | 0 | | | 5 | | | 32,145 | |
| Total | 82,436 | | | 717 | | | 74 | | | 5 | | | 83,232 | |
| Total credit derivatives | $ | 146,930 | | | $ | 110,702 | | | $ | 160,626 | | | $ | 51,782 | | | $ | 470,040 | |
| | | | | | | | | |
| December 31, 2019 |
| Carrying Value |
| Credit default swaps: | | | | | | | | | |
| Investment grade | $ | 0 | | | $ | 5 | | | $ | 60 | | | $ | 164 | | | $ | 229 | |
| Non-investment grade | 70 | | | 292 | | | 561 | | | 808 | | | 1,731 | |
| Total | 70 | | | 297 | | | 621 | | | 972 | | | 1,960 | |
| Total return swaps/options: | | | | | | | | | |
| Investment grade | 35 | | | 0 | | | 0 | | | 0 | | | 35 | |
| Non-investment grade | 344 | | | 0 | | | 0 | | | 0 | | | 344 | |
| Total | 379 | | | 0 | | | 0 | | | 0 | | | 379 | |
| Total credit derivatives | $ | 449 | | | $ | 297 | | | $ | 621 | | | $ | 972 | | | $ | 2,339 | |
| Credit-related notes: | | | | | | | | | |
| Investment grade | $ | 0 | | | $ | 3 | | | $ | 1 | | | $ | 639 | | | $ | 643 | |
| Non-investment grade | 6 | | | 2 | | | 1 | | | 1,125 | | | 1,134 | |
| Total credit-related notes | $ | 6 | | | $ | 5 | | | $ | 2 | | | $ | 1,764 | | | $ | 1,777 | |
| | Maximum Payout/Notional |
| Credit default swaps: | | | | | | | | | |
| Investment grade | $ | 55,827 | | | $ | 67,838 | | | $ | 71,320 | | | $ | 17,708 | | | $ | 212,693 | |
| Non-investment grade | 19,049 | | | 26,521 | | | 29,618 | | | 12,337 | | | 87,525 | |
| Total | 74,876 | | | 94,359 | | | 100,938 | | | 30,045 | | | 300,218 | |
| Total return swaps/options: | | | | | | | | | |
| Investment grade | 56,488 | | | 0 | | | 62 | | | 76 | | | 56,626 | |
| Non-investment grade | 28,707 | | | 657 | | | 104 | | | 60 | | | 29,528 | |
| Total | 85,195 | | | 657 | | | 166 | | | 136 | | | 86,154 | |
| Total credit derivatives | $ | 160,071 | | | $ | 95,016 | | | $ | 101,104 | | | $ | 30,181 | | | $ | 386,372 | |
The notional amount represents the maximum amount payable by the Corporation for most credit derivatives. However, the Corporation does not monitor its exposure to credit derivatives based solely on the notional amount because this measure does not take into consideration the probability of occurrence. As such, the notional amount is not a reliable indicator of the Corporation’s exposure to these contracts.
Instead, a risk framework is used to define risk tolerances and establish limits so that certain credit risk-related losses occur within acceptable, predefined limits.
Credit-related notes in the table above include investments in securities issued by collateralized debt obligation (CDO), collateralized loan obligation and credit-linked note vehicles. These instruments are primarily classified as trading securities.
The carrying value of these instruments equals the Corporation’s maximum exposure to loss. The Corporation is not obligated to make any payments to the entities under the terms of the securities owned.
Credit-related Contingent Features and Collateral
Certain of the Corporation’s derivative contracts contain credit risk-related contingent features, primarily in the form of ISDA master netting agreements and credit support documentation that enhance the creditworthiness of these instruments compared to other obligations of the respective counterparty with whom the Corporation has transacted. These contingent features may be for the benefit of the Corporation as well as its counterparties with respect to changes in the Corporation’s creditworthiness and the mark-to-market exposure under the derivative transactions. At September 30, 2020 and December 31, 2019, the Corporation held cash and securities collateral of $91.7 billion and $84.3 billion and posted cash and securities collateral of $79.9 billion and $69.1 billion in the normal course of business under derivative agreements, excluding cross-product margining agreements where clients are permitted to margin on a net basis for both derivative and secured financing arrangements.
In connection with certain over-the-counter derivative contracts and other trading agreements, the Corporation can be required to provide additional collateral or to terminate transactions with certain counterparties in the event of a downgrade of the senior debt ratings of the Corporation or certain subsidiaries. The amount of additional collateral required depends on the contract and is usually a fixed incremental amount and/or the market value of the exposure. For more information on credit-related contingent features and collateral, see Note 3 – Derivatives to the Consolidated Financial Statements of the Corporation’s 2019 Annual Report on Form 10-K.
At September 30, 2020, the amount of collateral, calculated based on the terms of the contracts, that the Corporation and certain subsidiaries could be required to post to counterparties but had not yet posted to counterparties was $1.9 billion, including $945 million for Bank of America, National Association.
Some counterparties are currently able to unilaterally terminate certain contracts, or the Corporation or certain subsidiaries may be required to take other action such as find a suitable replacement or obtain a guarantee. At September 30, 2020 and December 31, 2019, the liability recorded for these derivative contracts was not significant.
The following table presents the amount of additional collateral that would have been contractually required by derivative contracts and other trading agreements at September 30, 2020 if the rating agencies had downgraded their long-term senior debt ratings for the Corporation or certain subsidiaries by one incremental notch and by an additional second incremental notch.
| | | | | | | | | | | |
| | | |
| Additional Collateral Required to be Posted Upon Downgrade at September 30, 2020 |
| | | |
| (Dollars in millions) | One
incremental notch | | Second
incremental notch |
| Bank of America Corporation | $ | 303 | | | $ | 724 | |
Bank of America, N.A. and subsidiaries (1) | 85 | | | 536 | |
(1)Included in Bank of America Corporation collateral requirements in this table.
The following table presents the derivative liabilities that would be subject to unilateral termination by counterparties and the amounts of collateral that would have been contractually required at September 30, 2020 if the long-term senior debt ratings for the Corporation or certain subsidiaries had been lower by one incremental notch and by an additional second incremental notch.
| | | | | | | | | | | |
| | | |
| Derivative Liabilities Subject to Unilateral Termination Upon Downgrade at September 30, 2020 |
| | | |
| (Dollars in millions) | One
incremental notch | | Second
incremental notch |
| Derivative liabilities | $ | 14 | | | $ | 935 | |
| Collateral posted | 1 | | | 611 | |
Valuation Adjustments on Derivatives
The table below presents credit valuation adjustment (CVA), DVA and FVA gains (losses) on derivatives (excluding the effect of any related hedge activities), which are recorded in market making and similar activities, for the three and nine months ended September 30, 2020 and 2019. For more information on the valuation adjustments on derivatives, see Note 3 – Derivatives to the Consolidated Financial Statements of the Corporation’s 2019 Annual Report on Form 10-K.
| | | | | | | | | | | | | | |
| | | | | | |
Valuation Adjustments Gains (Losses) on Derivatives (1) |
| | | | | | |
| | | | |
| Three Months Ended September 30 | | | |
| (Dollars in millions) | 2020 | | 2019 | | |
| | | | | | |
| Derivative assets (CVA) | $ | 174 | | | $ | (41) | | | | |
| Derivative assets/liabilities (FVA) | 27 | | | (60) | | | | |
| Derivative liabilities (DVA) | (105) | | | 17 | | | | |
| | | | | | |
| Nine Months Ended September 30 | | | |
| (Dollars in millions) | 2020 | | 2019 | | |
| Derivative assets (CVA) | $ | (334) | | | $ | (39) | | | | |
| Derivative assets/liabilities (FVA) | (60) | | | (27) | | | | |
| Derivative liabilities (DVA) | 53 | | | (56) | | | | |
| | | | | | |
(1)At September 30, 2020 and December 31, 2019, cumulative CVA reduced the derivative assets balance by $862 million and $528 million, cumulative FVA reduced the net derivatives balance by $213 million and $153 million, and cumulative DVA reduced the derivative liabilities balance by $338 million and $285 million, respectively.
NOTE 4Securities
The table below presents the amortized cost, gross unrealized gains and losses, and fair value of AFS debt securities, other debt securities carried at fair value and HTM debt securities at September 30, 2020 and December 31, 2019.
| | | | | | | | | | | | | | | | | | | | | | | |
| | | | | | | |
| Debt Securities | | | | |
| |
| Amortized
Cost | | Gross
Unrealized
Gains | | Gross
Unrealized
Losses | | Fair
Value |
| (Dollars in millions) | September 30, 2020 |
| Available-for-sale debt securities | | | | | | | |
| Mortgage-backed securities: | | | | | | | |
| Agency | $ | 67,566 | | | $ | 2,349 | | | $ | (51) | | | $ | 69,864 | |
| Agency-collateralized mortgage obligations | 5,663 | | | 189 | | | (15) | | | 5,837 | |
| Commercial | 15,190 | | | 1,017 | | | (1) | | | 16,206 | |
Non-agency residential (1) | 1,167 | | | 146 | | | (30) | | | 1,283 | |
| Total mortgage-backed securities | 89,586 | | | 3,701 | | | (97) | | | 93,190 | |
| U.S. Treasury and agency securities | 100,508 | | | 2,377 | | | (7) | | | 102,878 | |
| Non-U.S. securities | 16,333 | | | 34 | | | (13) | | | 16,354 | |
| | | | | | | |
| Other taxable securities, substantially all asset-backed securities | 3,628 | | | 58 | | | (10) | | | 3,676 | |
| Total taxable securities | 210,055 | | | 6,170 | | | (127) | | | 216,098 | |
| Tax-exempt securities | 17,299 | | | 340 | | | (45) | | | 17,594 | |
| Total available-for-sale debt securities | 227,354 | | | 6,510 | | | (172) | | | 233,692 | |
Other debt securities carried at fair value (2) | 11,982 | | | 399 | | | (76) | | | 12,305 | |
| Total debt securities carried at fair value | 239,336 | | | 6,909 | | | (248) | | | 245,997 | |
| Held-to-maturity debt securities, substantially all U.S. agency mortgage-backed securities | 338,418 | | | 9,727 | | | (228) | | | 347,917 | |
Total debt securities (3,4) | $ | 577,754 | | | $ | 16,636 | | | $ | (476) | | | $ | 593,914 | |
| | | | | | | |
| | | | | | | |
| December 31, 2019 |
| Available-for-sale debt securities | | | | | | | |
| Mortgage-backed securities: | | | | | | | |
| Agency | $ | 121,698 | | | $ | 1,013 | | | $ | (183) | | | $ | 122,528 | |
| Agency-collateralized mortgage obligations | 4,587 | | | 78 | | | (24) | | | 4,641 | |
| Commercial | 14,797 | | | 249 | | | (25) | | | 15,021 | |
Non-agency residential (1) | 948 | | | 138 | | | (9) | | | 1,077 | |
| Total mortgage-backed securities | 142,030 | | | 1,478 | | | (241) | | | 143,267 | |
| U.S. Treasury and agency securities | 67,700 | | | 1,023 | | | (195) | | | 68,528 | |
| Non-U.S. securities | 11,987 | | | 6 | | | (2) | | | 11,991 | |
| | | | | | | |
| Other taxable securities, substantially all asset-backed securities | 3,874 | | | 67 | | | 0 | | | 3,941 | |
| Total taxable securities | 225,591 | | | 2,574 | | | (438) | | | 227,727 | |
| Tax-exempt securities | 17,716 | | | 202 | | | (6) | | | 17,912 | |
| Total available-for-sale debt securities | 243,307 | | | 2,776 | | | (444) | | | 245,639 | |
Other debt securities carried at fair value (2) | 10,596 | | | 255 | | | (23) | | | 10,828 | |
| Total debt securities carried at fair value | 253,903 | | | 3,031 | | | (467) | | | 256,467 | |
| Held-to-maturity debt securities, substantially all U.S. agency mortgage-backed securities | 215,730 | | | 4,433 | | | (342) | | | 219,821 | |
Total debt securities (3, 4) | $ | 469,633 | | | $ | 7,464 | | | $ | (809) | | | $ | 476,288 | |
| | | | | | | |
(1)At September 30, 2020 and December 31, 2019, the underlying collateral type included approximately 35 percent and 49 percent prime, 4 percent and 6 percent Alt-A and 61 percent and 45 percent subprime.
(2)Primarily includes non-U.S. securities used to satisfy certain international regulatory requirements. Any changes in value are reported in market making and similar activities. For detail on the components, see Note 14 – Fair Value Measurements.
(3)Includes securities pledged as collateral of $55.7 billion and $67.0 billion at September 30, 2020 and December 31, 2019.
(4)The Corporation held debt securities from Fannie Mae and Freddie Mac that each exceeded 10 percent of shareholders’ equity, with an amortized cost of $193.8 billion and $76.9 billion, and a fair value of $201.0 billion and $79.3 billion at September 30, 2020, and an amortized cost of $157.2 billion and $54.1 billion, and a fair value of $160.6 billion and $55.1 billion at December 31, 2019.
At September 30, 2020, the accumulated net unrealized gain on AFS debt securities, excluding the amount related to debt securities previously transferred to held to maturity, included in accumulated OCI was $4.8 billion, net of the related income tax expense of $1.6 billion. The Corporation had nonperforming AFS debt securities of $25 million and $9 million at September 30, 2020 and December 31, 2019.
Effective January 1, 2020, the Corporation adopted the new accounting standard for credit losses that requires evaluation of AFS and HTM debt securities for any expected losses with recognition of an allowance for credit losses, when applicable. For more information, see Note 1 – Summary of Significant Accounting Principles. At September 30, 2020, the Corporation had $194.8 billion in AFS debt securities, which were primarily
U.S. agency and U.S. Treasury securities that have a zero credit loss assumption. For the remaining $38.9 billion in AFS debt securities, the amount of ECL was insignificant. Substantially all of the Corporation's HTM debt securities are U.S. agency and U.S. Treasury securities and have a zero credit loss assumption.
At September 30, 2020, the Corporation held equity securities at an aggregate fair value of $809 million and other equity securities, as valued under the measurement alternative, at a carrying value of $261 million, both of which are included in other assets. At September 30, 2020, the Corporation also held money market investments at a fair value of $385 million, which are included in time deposits placed and other short-term investments.
In the three and nine months ended September 30, 2020, the Corporation recorded gross realized gains on sales of AFS debt securities of $4 million and $383 million and gross realized losses of $2 million and $4 million, resulting in net gains of $2 million and $379 million, with $1 million and $95 million of income taxes attributable to the realized net gain on sales of these AFS debt securities. Sales of AFS debt securities during the three months ended September 30, 2019 were not significant. In the nine months ended September 30, 2019, the Corporation recorded gross realized gains on sales of AFS debt
securities of $228 million and gross realized losses of $112 million, resulting in net gains of $116 million with $28 million of income taxes attributable to the realized net gains on sales of these AFS debt securities.
The table below presents the fair value and the associated gross unrealized losses on AFS debt securities and whether these securities have had gross unrealized losses for less than 12 months or for 12 months or longer at September 30, 2020 and December 31, 2019.
| | | | | | | | | | | | | | | | | | | | | | | | | | | | | | | | | | | |
| | | | | | | | | | | |
| Total AFS Debt Securities in a Continuous Unrealized Loss Position | | | | | | |
| |
| Less than Twelve Months | | Twelve Months or Longer | | Total |
| Fair
Value | | Gross Unrealized Losses | | Fair
Value | | Gross Unrealized Losses | | Fair
Value | | Gross Unrealized Losses |
| (Dollars in millions) | September 30, 2020 |
| Continuously unrealized loss-positioned AFS debt securities | | | | | | | | | | | |
| Mortgage-backed securities: | | | | | | | | | | | |
| Agency | $ | 5,284 | | | $ | (51) | | | $ | 2 | | | $ | 0 | | | $ | 5,286 | | | $ | (51) | |
| Agency-collateralized mortgage obligations | 242 | | | (3) | | | 447 | | | (12) | | | 689 | | | (15) | |
| Commercial | 244 | | | (1) | | | 190 | | | 0 | | | 434 | | | (1) | |
| Non-agency residential | 326 | | | (19) | | | 75 | | | (11) | | | 401 | | | (30) | |
| Total mortgage-backed securities | 6,096 | | | (74) | | | 714 | | | (23) | | | 6,810 | | | (97) | |
| U.S. Treasury and agency securities | 3,893 | | | (3) | | | 503 | | | (4) | | | 4,396 | | | (7) | |
| Non-U.S. securities | 2,749 | | | (11) | | | 224 | | | (2) | | | 2,973 | | | (13) | |
| | | | | | | | | | | |
| Other taxable securities, substantially all asset-backed securities | 984 | | | (5) | | | 342 | | | (5) | | | 1,326 | | | (10) | |
| Total taxable securities | 13,722 | | | (93) | | | 1,783 | | | (34) | | | 15,505 | | | (127) | |
| Tax-exempt securities | 4,135 | | | (35) | | | 964 | | | (10) | | | 5,099 | | | (45) | |
| | | | | | | | | | | |
| | | | | | | | | | | |
| | | | | | | | | | | |
Total AFS debt securities in a continuous
unrealized loss position | $ | 17,857 | | | $ | (128) | | | $ | 2,747 | | | $ | (44) | | | $ | 20,604 | | | $ | (172) | |
| | | | | | | | | | | |
| December 31, 2019 |
| Continuously unrealized loss-positioned AFS debt securities | | | | | | | | | | | |
| Mortgage-backed securities: | | | | | | | | | | | |
| Agency | $ | 17,641 | | | $ | (41) | | | $ | 17,238 | | | $ | (142) | | | $ | 34,879 | | | $ | (183) | |
| Agency-collateralized mortgage obligations | 255 | | | (1) | | | 925 | | | (23) | | | 1,180 | | | (24) | |
| Commercial | 2,180 | | | (22) | | | 442 | | | (3) | | | 2,622 | | | (25) | |
| Non-agency residential | 122 | | | (6) | | | 22 | | | (3) | | | 144 | | | (9) | |
| Total mortgage-backed securities | 20,198 | | | (70) | | | 18,627 | | | (171) | | | 38,825 | | | (241) | |
| U.S. Treasury and agency securities | 12,836 | | | (71) | | | 18,866 | | | (124) | | | 31,702 | | | (195) | |
| Non-U.S. securities | 851 | | | 0 | | | 837 | | | (2) | | | 1,688 | | | (2) | |
| | | | | | | | | | | |
| Other taxable securities, substantially all asset-backed securities | 938 | | | 0 | | | 222 | | | 0 | | | 1,160 | | | 0 | |
| Total taxable securities | 34,823 | | | (141) | | | 38,552 | | | (297) | | | 73,375 | | | (438) | |
| Tax-exempt securities | 4,286 | | | (5) | | | 190 | | | (1) | | | 4,476 | | | (6) | |
| | | | | | | | | | | |
| | | | | | | | | | | |
| | | | | | | | | | | |
Total AFS debt securities in a continuous
unrealized loss position | $ | 39,109 | | | $ | (146) | | | $ | 38,742 | | | $ | (298) | | | $ | 77,851 | | | $ | (444) | |
The remaining contractual maturity distribution and yields of the Corporation’s debt securities carried at fair value and HTM debt securities at September 30, 2020 are summarized in the table below. Actual duration and yields may differ as prepayments on the loans underlying the mortgages or other asset-backed securities (ABS) are passed through to the Corporation.
| | | | | | | | | | | | | | | | | | | | | | | | | | | | | | | | | | | | | | | | | | | | | | | | | | | | | | | | | | | |
| | | | | | | | | | | | | | | | | | | |
| Maturities of Debt Securities Carried at Fair Value and Held-to-maturity Debt Securities |
| | | | | | | | | | | | | | | | | | | |
| Due in One
Year or Less | | Due after One Year
through Five Years | | Due after Five Years
through Ten Years | | Due after
Ten Years | | Total |
| (Dollars in millions) | Amount | | Yield (1) | | Amount | | Yield (1) | | Amount | | Yield (1) | | Amount | | Yield (1) | | Amount | | Yield (1) |
| Amortized cost of debt securities carried at fair value | | | | | | | | | | | | | | | | | | | |
| Mortgage-backed securities: | | | | | | | | | | | | | | | | | | | |
| Agency | $ | 0 | | | 0 | % | | $ | 7 | | | 5.37 | % | | $ | 59 | | | 4.51 | % | | $ | 67,500 | | | 3.36 | % | | $ | 67,566 | | | 3.36 | % |
| Agency-collateralized mortgage obligations | 0 | | | 0 | | | 0 | | | 0 | | | 24 | | | 2.54 | | | 5,639 | | | 2.95 | | | 5,663 | | | 2.95 | |
| Commercial | 26 | | | 3.08 | | | 6,136 | | | 2.49 | | | 8,014 | | | 2.44 | | | 1,027 | | | 2.75 | | | 15,203 | | | 2.48 | |
| Non-agency residential | 0 | | | 0 | | | 0 | | | 0 | | | 11 | | | 0 | | | 2,313 | | | 7.35 | | | 2,324 | | | 7.32 | |
| Total mortgage-backed securities | 26 | | | 3.08 | | | 6,143 | | | 2.49 | | | 8,108 | | | 2.45 | | | 76,479 | | | 3.44 | | | 90,756 | | | 3.29 | |
| U.S. Treasury and agency securities | 10,398 | | | 1.19 | | | 29,682 | | | 1.81 | | | 60,399 | | | 0.78 | | | 32 | | | 2.62 | | | 100,511 | | | 1.13 | |
| Non-U.S. securities | 25,784 | | | 0.37 | | | 1,275 | | | 1.50 | | | 7 | | | 5.82 | | | 76 | | | 8.89 | | | 27,142 | | | 0.44 | |
| | | | | | | | | | | | | | | | | | | |
| Other taxable securities, substantially all asset-backed securities | 1,107 | | | 1.42 | | | 1,423 | | | 2.32 | | | 628 | | | 2.06 | | | 470 | | | 1.73 | | | 3,628 | | | 1.92 | |
| Total taxable securities | 37,315 | | | 0.63 | | | 38,523 | | | 1.93 | | | 69,142 | | | 0.99 | | | 77,057 | | | 3.44 | | | 222,037 | | | 1.94 | |
| Tax-exempt securities | 905 | | | 0.92 | | | 8,462 | | | 1.23 | | | 5,051 | | | 1.66 | | | 2,881 | | | 1.53 | | | 17,299 | | | 1.39 | |
| Total amortized cost of debt securities carried at fair value | $ | 38,220 | | | 0.64 | | | $ | 46,985 | | | 1.80 | | | $ | 74,193 | | | 1.03 | | | $ | 79,938 | | | 3.37 | | | $ | 239,336 | | | 1.90 | |
Amortized cost of HTM debt securities (2) | $ | 66 | | | 1.87 | | | $ | 81 | | | 3.29 | | | $ | 17,188 | | | 1.86 | | | $ | 321,083 | | | 2.71 | | | $ | 338,418 | | | 2.67 | |
| | | | | | | | | | | | | | | | | | | |
| Debt securities carried at fair value | | | | | | | | | | | | | | | | | | | |
| Mortgage-backed securities: | | | | | | | | | | | | | | | | | | | |
| Agency | $ | 0 | | | | | $ | 8 | | | | | $ | 63 | | | | | $ | 69,793 | | | | | $ | 69,864 | | | |
| Agency-collateralized mortgage obligations | 0 | | | | | 0 | | | | | 25 | | | | | 5,812 | | | | | 5,837 | | | |
| Commercial | 26 | | | | | 6,491 | | | | | 8,586 | | | | | 1,117 | | | | | 16,220 | | | |
| Non-agency residential | 0 | | | | | 0 | | | | | 22 | | | | | 2,469 | | | | | 2,491 | | | |
| Total mortgage-backed securities | 26 | | | | | 6,499 | | | | | 8,696 | | | | | 79,191 | | | | | 94,412 | | | |
| U.S. Treasury and agency securities | 10,452 | | | | | 31,020 | | | | | 61,377 | | | | | 32 | | | | | 102,881 | | | |
| Non-U.S. securities | 26,066 | | | | | 1,278 | | | | | 8 | | | | | 79 | | | | | 27,431 | | | |
| | | | | | | | | | | | | | | | | | | |
| Other taxable securities, substantially all asset-backed securities | 1,112 | | | | | 1,445 | | | | | 640 | | | | | 482 | | | | | 3,679 | | | |
| Total taxable securities | 37,656 | | | | | 40,242 | | | | | 70,721 | | | | | 79,784 | | | | | 228,403 | | | |
| Tax-exempt securities | 907 | | | | | 8,548 | | | | | 5,201 | | | | | 2,938 | | | | | 17,594 | | | |
| Total debt securities carried at fair value | $ | 38,563 | | | | | $ | 48,790 | | | | | $ | 75,922 | | | | | $ | 82,722 | | | | | $ | 245,997 | | | |
Fair value of HTM debt securities (2) | $ | 65 | | | | | $ | 83 | | | | | $ | 17,442 | | | | | $ | 330,327 | | | | | $ | 347,917 | | | |
(1)The weighted-average yield is computed based on a constant effective interest rate over the contractual life of each security. The average yield considers the contractual coupon and the amortization of premiums and accretion of discounts, excluding the effect of related hedging derivatives.
(2)Substantially all U.S. agency MBS.
NOTE 5Outstanding Loans and Leases and Allowance for Credit Losses
The following tables present total outstanding loans and leases and an aging analysis for the Consumer Real Estate, Credit Card and Other Consumer, and Commercial portfolio segments, by class of financing receivables, at September 30, 2020 and December 31, 2019.
| | | | | | | | | | | | | | | | | | | | | | | | | | | | | | | | | | | | | | | | | | | |
| | | | | | | | | | | | | | | |
| 30-59 Days Past Due (1) | | 60-89 Days Past Due (1) | | 90 Days or
More Past Due (1) | | Total Past
Due 30 Days
or More | | Total Current or Less Than 30 Days Past Due (1) | | | | Loans Accounted for Under the Fair Value Option | | Total
Outstandings |
| (Dollars in millions) | September 30, 2020 |
| Consumer real estate | | | | | | | | | | | | | | | |
| Core portfolio | | | | | | | | | | | | | | | |
| Residential mortgage | $ | 1,244 | | | $ | 280 | | | $ | 829 | | | $ | 2,353 | | | $ | 221,542 | | | | | | | $ | 223,895 | |
| Home equity | 129 | | | 77 | | | 261 | | | 467 | | | 31,871 | | | | | | | 32,338 | |
| Non-core portfolio | | | | | | | | | | | | | | | |
| Residential mortgage | 308 | | | 126 | | | 964 | | | 1,398 | | | 7,425 | | | | | | | 8,823 | |
| Home equity | 29 | | | 20 | | | 76 | | | 125 | | | 4,067 | | | | | | | 4,192 | |
| Credit card and other consumer | | | | | | | | | | | | | | | |
| Credit card | 486 | | | 238 | | | 546 | | | 1,270 | | | 78,564 | | | | | | | 79,834 | |
| | | | | | | | | | | | | | | |
Direct/Indirect consumer (2) | 209 | | | 58 | | | 31 | | | 298 | | | 89,616 | | | | | | | 89,914 | |
| Other consumer | 0 | | | 0 | | | 0 | | | 0 | | | 140 | | | | | | | 140 | |
| Total consumer | 2,405 | | | 799 | | | 2,707 | | | 5,911 | | | 433,225 | | | | | | | 439,136 | |
Consumer loans accounted for under the fair value option (3) | | | | | | | | | | | | | $ | 657 | | | 657 | |
| Total consumer loans and leases | 2,405 | | | 799 | | | 2,707 | | | 5,911 | | | 433,225 | | | | | 657 | | | 439,793 | |
| Commercial | | | | | | | | | | | | | | | |
| | | | | | | | | | | | | | | |
| U.S. commercial | 500 | | | 213 | | | 558 | | | 1,271 | | | 292,663 | | | | | | | 293,934 | |
| Non-U.S. commercial | 80 | | | 22 | | | 28 | | | 130 | | | 96,021 | | | | | | | 96,151 | |
Commercial real estate (4) | 58 | | | 3 | | | 206 | | | 267 | | | 62,187 | | | | | | | 62,454 | |
| Commercial lease financing | 67 | | | 92 | | | 42 | | | 201 | | | 17,212 | | | | | | | 17,413 | |
U.S. small business commercial (5) | 71 | | | 51 | | | 83 | | | 205 | | | 38,645 | | | | | | | 38,850 | |
| Total commercial | 776 | | | 381 | | | 917 | | | 2,074 | | | 506,728 | | | | | | | 508,802 | |
Commercial loans accounted for under the fair value option (3) | | | | | | | | | | | | | 6,577 | | | 6,577 | |
| Total commercial loans and leases | 776 | | | 381 | | | 917 | | | 2,074 | | | 506,728 | | | | | 6,577 | | | 515,379 | |
Total loans and leases (6) | $ | 3,181 | | | $ | 1,180 | | | $ | 3,624 | | | $ | 7,985 | | | $ | 939,953 | | | | | $ | 7,234 | | | $ | 955,172 | |
| Percentage of outstandings | 0.33 | % | | 0.12 | % | | 0.38 | % | | 0.83 | % | | 98.41 | % | | | | 0.76 | % | | 100.00 | % |
(1)Consumer real estate loans 30-59 days past due includes fully-insured loans of $258 million and nonperforming loans of $132 million. Consumer real estate loans 60-89 days past due includes fully-insured loans of $118 million and nonperforming loans of $96 million. Consumer real estate loans 90 days or more past due includes fully-insured loans of $1.0 billion. Consumer real estate loans current or less than 30 days past due includes $793 million and direct/indirect consumer includes $38 million of nonperforming loans. For information on the Corporation's interest accrual policies and delinquency status for loan modifications related to the COVID-19 pandemic, see Note 1 – Summary of Significant Accounting Principles.
(2)Total outstandings primarily includes auto and specialty lending loans and leases of $47.1 billion, U.S. securities-based lending loans of $39.0 billion and non-U.S. consumer loans of $2.9 billion.
(3)Consumer loans accounted for under the fair value option includes residential mortgage loans of $314 million and home equity loans of $343 million. Commercial loans accounted for under the fair value option includes U.S. commercial loans of $3.4 billion and non-U.S. commercial loans of $3.2 billion. For more information, see Note 14 – Fair Value Measurements and Note 15 – Fair Value Option.
(4)Total outstandings includes U.S. commercial real estate loans of $58.7 billion and non-U.S. commercial real estate loans of $3.7 billion.
(5)Includes PPP loans.
(6)Total outstandings includes loans and leases pledged as collateral of $15.9 billion. The Corporation also pledged $158.4 billion of loans with no related outstanding borrowings to secure potential borrowing capacity with the Federal Reserve Bank and Federal Home Loan Bank.
| | | | | | | | | | | | | | | | | | | | | | | | | | | | | | | | | | | | | | | | | | | |
| | | | | | | | | | | | | | | |
| 30-59 Days
Past Due (1) | | 60-89 Days Past Due (1) | | 90 Days or
More
Past Due (1) | | Total Past
Due 30 Days
or More | | Total Current or Less Than 30 Days Past Due (1) | | | | Loans
Accounted
for Under
the Fair
Value Option | | Total Outstandings |
| (Dollars in millions) | December 31, 2019 |
| Consumer real estate | | | | | | | | | | | | | | | |
| Core portfolio | | | | | | | | | | | | | | | |
| Residential mortgage | $ | 1,378 | | | $ | 261 | | | $ | 565 | | | $ | 2,204 | | | $ | 223,566 | | | | | | | $ | 225,770 | |
| Home equity | 135 | | | 70 | | | 198 | | | 403 | | | 34,823 | | | | | | | 35,226 | |
| Non-core portfolio | | | | | | | | | | | | | | | |
| Residential mortgage | 458 | | | 209 | | | 1,263 | | | 1,930 | | | 8,469 | | | | | | | 10,399 | |
| Home equity | 34 | | | 16 | | | 72 | | | 122 | | | 4,860 | | | | | | | 4,982 | |
| Credit card and other consumer | | | | | | | | | | | | | | | |
| Credit card | 564 | | | 429 | | | 1,042 | | | 2,035 | | | 95,573 | | | | | | | 97,608 | |
| | | | | | | | | | | | | | | |
Direct/Indirect consumer (2) | 297 | | | 85 | | | 35 | | | 417 | | | 90,581 | | | | | | | 90,998 | |
| Other consumer | 0 | | | 0 | | | 0 | | | 0 | | | 192 | | | | | | | 192 | |
| Total consumer | 2,866 | | | 1,070 | | | 3,175 | | | 7,111 | | | 458,064 | | | | | | | 465,175 | |
Consumer loans accounted for under the fair value option (3) | | | | | | | | | | | | | $ | 594 | | | 594 | |
| Total consumer loans and leases | 2,866 | | | 1,070 | | | 3,175 | | | 7,111 | | | 458,064 | | | | | 594 | | | 465,769 | |
| Commercial | | | | | | | | | | | | | | | |
| | | | | | | | | | | | | | | |
| U.S. commercial | 788 | | | 279 | | | 371 | | | 1,438 | | | 305,610 | | | | | | | 307,048 | |
| Non-U.S. commercial | 35 | | | 23 | | | 8 | | | 66 | | | 104,900 | | | | | | | 104,966 | |
Commercial real estate (4) | 144 | | | 19 | | | 119 | | | 282 | | | 62,407 | | | | | | | 62,689 | |
| Commercial lease financing | 100 | | | 56 | | | 39 | | | 195 | | | 19,685 | | | | | | | 19,880 | |
| U.S. small business commercial | 119 | | | 56 | | | 107 | | | 282 | | | 15,051 | | | | | | | 15,333 | |
| Total commercial | 1,186 | | | 433 | | | 644 | | | 2,263 | | | 507,653 | | | | | | | 509,916 | |
Commercial loans accounted for under the fair value option (3) | | | | | | | | | | | | | 7,741 | | | 7,741 | |
| Total commercial loans and leases | 1,186 | | | 433 | | | 644 | | | 2,263 | | | 507,653 | | | | | 7,741 | | | 517,657 | |
| | | | | | | | | | | | | | | |
| | | | | | | | | | | | | | | |
Total loans and leases (5) | $ | 4,052 | | | $ | 1,503 | | | $ | 3,819 | | | $ | 9,374 | | | $ | 965,717 | | | | | $ | 8,335 | | | $ | 983,426 | |
| Percentage of outstandings | 0.41 | % | | 0.15 | % | | 0.39 | % | | 0.95 | % | | 98.20 | % | | | | 0.85 | % | | 100.00 | % |
(1)Consumer real estate loans 30-59 days past due includes fully-insured loans of $517 million and nonperforming loans of $139 million. Consumer real estate loans 60-89 days past due includes fully-insured loans of $206 million and nonperforming loans of $114 million. Consumer real estate loans 90 days or more past due includes fully-insured loans of $1.1 billion. Consumer real estate loans current or less than 30 days past due includes $856 million and direct/indirect consumer includes $45 million of nonperforming loans.
(2)Total outstandings primarily includes auto and specialty lending loans and leases of $50.4 billion, U.S. securities-based lending loans of $36.7 billion and non-U.S. consumer loans of $2.8 billion.
(3)Consumer loans accounted for under the fair value option includes residential mortgage loans of $257 million and home equity loans of $337 million. Commercial loans accounted for under the fair value option includes U.S. commercial loans of $4.7 billion and non-U.S. commercial loans of $3.1 billion. For more information, see Note 14 – Fair Value Measurements and Note 15 – Fair Value Option.
(4)Total outstandings includes U.S. commercial real estate loans of $59.0 billion and non-U.S. commercial real estate loans of $3.7 billion.
(5)Total outstandings includes loans and leases pledged as collateral of $25.9 billion. The Corporation also pledged $168.2 billion of loans with no related outstanding borrowings to secure potential borrowing capacity with the Federal Reserve Bank and Federal Home Loan Bank.
The Corporation categorizes consumer real estate loans as core and non-core based on loan and customer characteristics such as origination date, product type, LTV, Fair Isaac Corporation (FICO) score and delinquency status consistent with its current consumer and mortgage servicing strategy. Generally, loans that were originated after January 1, 2010, qualified under government-sponsored enterprise (GSE) underwriting guidelines, or otherwise met the Corporation’s underwriting guidelines in place in 2015 are characterized as core loans. All other loans are generally characterized as non-core loans and represent runoff portfolios.
The Corporation has entered into long-term credit protection agreements with Fannie Mae and Freddie Mac on loans totaling $8.8 billion and $7.5 billion at September 30, 2020 and December 31, 2019, providing full credit protection on residential mortgage loans that become severely delinquent. All of these loans are individually insured, and therefore the Corporation does not record an allowance for credit losses related to these loans.
Nonperforming Loans and Leases
Commercial nonperforming loans increased to $2.2 billion at September 30, 2020 from $1.5 billion at December 31, 2019 with broad-based increases across multiple industries. Consumer nonperforming loans increased to $2.4 billion at September 30, 2020 from $2.1 billion at December 31, 2019 driven by loans with deferrals that expired and have subsequently become nonperforming, as well as the inclusion of $137 million of certain loans that were previously classified as purchased credit-impaired loans and accounted for under a pool basis.
The table below presents the Corporation’s nonperforming loans and leases including nonperforming TDRs, and loans accruing past due 90 days or more at September 30, 2020 and December 31, 2019. Nonperforming loans held-for-sale (LHFS) are excluded from nonperforming loans and leases as they are recorded at either fair value or the lower of cost or fair value. For information on the Corporation's interest accrual policies and delinquency status for loan modifications related to the COVID-19 pandemic, see Note 1 – Summary of Significant Accounting Principles. For more information on the criteria for classification as nonperforming, see Note 1 – Summary of Significant Accounting Principles to the Consolidated Financial Statements of the Corporation’s 2019 Annual Report on Form 10-K.
| | | | | | | | | | | | | | | | | | | | | | | |
| | | | | | | |
| Credit Quality | | |
| | | | | | | |
| |
| Nonperforming Loans
and Leases | | Accruing Past Due 90 Days or More (1) |
| (Dollars in millions) | September 30
2020 | | December 31
2019 | | September 30
2020 | | December 31
2019 |
Residential mortgage (2) | $ | 1,675 | | | $ | 1,470 | | | $ | 837 | | | $ | 1,088 | |
With negative allowance (3) | 500 | | | 0 | | | | | |
Home equity (2) | 640 | | | 536 | | | 0 | | | 0 | |
With negative allowance (3) | 119 | | | 0 | | | | | |
| Credit Card | n/a | | n/a | | 546 | | | 1,042 | |
| Direct/indirect consumer | 42 | | | 47 | | | 27 | | | 33 | |
| | | | | | | |
| Total consumer | 2,357 | | | 2,053 | | | 1,410 | | | 2,163 | |
| U.S. commercial | 1,351 | | | 1,094 | | | 199 | | | 106 | |
| Non-U.S. commercial | 338 | | | 43 | | | 28 | | | 8 | |
| Commercial real estate | 414 | | | 280 | | | 2 | | | 19 | |
| Commercial lease financing | 14 | | | 32 | | | 32 | | | 20 | |
| U.S. small business commercial | 76 | | | 50 | | | 77 | | | 97 | |
| Total commercial | 2,193 | | | 1,499 | | | 338 | | | 250 | |
| Total nonperforming loans | $ | 4,550 | | | $ | 3,552 | | | $ | 1,748 | | | $ | 2,413 | |
| Percentage of outstanding loans and leases | 0.48 | % | | 0.36 | % | | 0.18 | % | | 0.25 | % |
(1)For information on the Corporation's interest accrual policies and delinquency status for loan modifications related to the COVID-19 pandemic, see Note 1 – Summary of Significant Accounting Principles.
(2)Residential mortgage loans accruing past due 90 days or more are fully-insured loans. At September 30, 2020 and December 31, 2019 residential mortgage includes $561 million and $740 million of loans on which interest had been curtailed by the FHA, and therefore were no longer accruing interest, although principal was still insured, and $276 million and $348 million of loans on which interest was still accruing.
(3)At September 30, 2020, Residential Mortgage and Home Equity include negative allowance on nonperforming loans of $170 million and $106 million.
n/a = not applicable
Included in the September 30, 2020 nonperforming loans are $120 million and $17 million of residential mortgage and home equity loans that prior to the January 1, 2020 adoption of the new credit loss standard were not included in nonperforming loans, as they were previously classified as purchased credit-impaired loans and accounted for under a pool basis.
Credit Quality Indicators
The Corporation monitors credit quality within its Consumer Real Estate, Credit Card and Other Consumer, and Commercial portfolio segments based on primary credit quality indicators. For more information on the portfolio segments, see Note 1 – Summary of Significant Accounting Principles. Within the Consumer Real Estate portfolio segment, the primary credit quality indicators are refreshed LTV and refreshed FICO score. Refreshed LTV measures the carrying value of the loan as a percentage of the value of the property securing the loan, refreshed quarterly. Home equity loans are evaluated using CLTV, which measures the carrying value of the Corporation’s loan and available line of credit combined with any outstanding senior liens against the property as a percentage of the value of the property securing the loan, refreshed quarterly. FICO score measures the creditworthiness of the borrower based on the financial obligations of the borrower and the borrower’s credit history. FICO scores are typically refreshed quarterly or more
frequently. Certain borrowers (e.g., borrowers that have had debts discharged in a bankruptcy proceeding) may not have their FICO scores updated. FICO scores are also a primary credit quality indicator for the Credit Card and Other Consumer portfolio segment and the business card portfolio within U.S. small business commercial. Within the Commercial portfolio segment, loans are evaluated using the internal classifications of pass rated or reservable criticized as the primary credit quality indicators. The term reservable criticized refers to those commercial loans that are internally classified or listed by the Corporation as Special Mention, Substandard or Doubtful, which are asset quality categories defined by regulatory authorities. These assets have an elevated level of risk and may have a high probability of default or total loss. Pass rated refers to all loans not considered reservable criticized. In addition to these primary credit quality indicators, the Corporation uses other credit quality indicators for certain types of loans.
The following tables present certain credit quality indicators for the Corporation's Consumer Real Estate, Credit Card and Other Consumer, and Commercial portfolio segments by class of financing receivables and year of origination for term loan balances at September 30, 2020, including revolving loans that converted to term loans without an additional credit decision after origination or through a TDR.
| | | | | | | | | | | | | | | | | | | | | | | | | | | | | | | | | | | | | | | | | | | | | | | | | |
| | | | | | | | | | | | | | | | | | | | | |
| Residential Mortgage – Credit Quality Indicators By Vintage |
| | | | | | | | | | | | | | | | | | | | | |
| | | | | | | | | | | | | | | | | | | | | |
| | | | | | | | | |
| | | | | | | | | | | | | | | | | | | | | |
| | | | | | | | | | | | | | | | | | | | | |
| | | | | | | | | | | | | | | | | | | | | |
| | | | | | | | | | | | | | | | | | | | | |
| | | | | | | | | | | | | | | | | | | | | |
| | | | | | | | | | | | | | | | | | | | | |
| | | | | | | | | | | | | | | | | | | | | |
| | | | | | | | | | | | | | | | | | | | | |
| | | | | | | | | | | | | | | | | | | | | |
| | | | | | | | | | | | | | | | | | | | | |
| | | | | | | | | | | | | | | | | | | | | |
| | | | | | | | | | | | | | | | | | | | | |
| | | | | | | | | | | | | | | | | | | | | |
| | | | | | | | | | | | | |
| (Dollars in millions) | Total as of September 30, 2020 | | 2020 | | 2019 | | 2018 | | 2017 | | 2016 | | | | Prior | | | | | | |
| Total Residential Mortgage | | | | | | | | | | | | | | | | | | | | | |
Refreshed LTV | | | | | | | | | | | | | | | | | | | | | |
| Less than or equal to 90 percent | $ | 216,204 | | | $ | 60,442 | | | $ | 48,822 | | | $ | 17,053 | | | $ | 24,435 | | | $ | 25,616 | | | | | $ | 39,836 | | | | | | | |
| Greater than 90 percent but less than or equal to 100 percent | 3,482 | | | 1,743 | | | 989 | | | 244 | | | 104 | | | 127 | | | | | 275 | | | | | | | |
| Greater than 100 percent | 1,310 | | | 685 | | | 207 | | | 67 | | | 46 | | | 39 | | | | | 266 | | | | | | | |
| Fully-insured loans | 11,722 | | | 2,746 | | | 2,332 | | | 441 | | | 379 | | | 2,215 | | | | | 3,609 | | | | | | | |
| Total Residential Mortgage | $ | 232,718 | | | $ | 65,616 | | | $ | 52,350 | | | $ | 17,805 | | | $ | 24,964 | | | $ | 27,997 | | | | | $ | 43,986 | | | | | | | |
| | | | | | | | | | | | | | | | | | | | | |
| Total Residential Mortgage | | | | | | | | | | | | | | | | | | | | | |
| Refreshed FICO score | | | | | | | | | | | | | | | | | | | | | |
| Less than 620 | $ | 2,776 | | | $ | 711 | | | $ | 174 | | | $ | 157 | | | $ | 170 | | | $ | 179 | | | | | $ | 1,385 | | | | | | | |
| Greater than or equal to 620 and less than 680 | 5,505 | | | 1,596 | | | 710 | | | 471 | | | 408 | | | 414 | | | | | 1,906 | | | | | | | |
| Greater than or equal to 680 and less than 740 | 26,198 | | | 7,510 | | | 5,268 | | | 2,229 | | | 2,629 | | | 2,420 | | | | | 6,142 | | | | | | | |
| Greater than or equal to 740 | 186,517 | | | 53,053 | | | 43,866 | | | 14,507 | | | 21,378 | | | 22,769 | | | | | 30,944 | | | | | | | |
| Fully-insured loans | 11,722 | | | 2,746 | | | 2,332 | | | 441 | | | 379 | | | 2,215 | | | | | 3,609 | | | | | | | |
| Total Residential Mortgage | $ | 232,718 | | | $ | 65,616 | | | $ | 52,350 | | | $ | 17,805 | | | $ | 24,964 | | | $ | 27,997 | | | | | $ | 43,986 | | | | | | | |
| | | | | | | | | | | | | | | | | | | | | | | | | | | |
| | | | | | | | | | | |
| Home Equity - Credit Quality Indicators |
| | | | | | | | | | | |
| Total | | Home Equity Loans and Reverse Mortgages (1) | | Revolving Loans | | Revolving Loans Converted to Term Loans | | | | |
| (Dollars in millions) | September 30, 2020 | | |
| Total Home Equity | | | | | | | | | | | |
Refreshed LTV | | | | | | | | | | | |
| Less than or equal to 90 percent | $ | 35,542 | | | $ | 1,972 | | | $ | 24,067 | | | $ | 9,503 | | | | | |
| Greater than 90 percent but less than or equal to 100 percent | 415 | | | 133 | | | 115 | | | 167 | | | | | |
| Greater than 100 percent | 573 | | | 196 | | | 116 | | | 261 | | | | | |
| Total Home Equity | $ | 36,530 | | | $ | 2,301 | | | $ | 24,298 | | | $ | 9,931 | | | | | |
| | | | | | | | | | | |
| Total Home Equity | | | | | | | | | | | |
| Refreshed FICO score | | | | | | | | | | | |
| Less than 620 | $ | 1,112 | | | $ | 246 | | | $ | 241 | | | $ | 625 | | | | | |
| Greater than or equal to 620 and less than 680 | 1,912 | | | 278 | | | 577 | | | 1,057 | | | | | |
| Greater than or equal to 680 and less than 740 | 6,144 | | | 569 | | | 3,107 | | | 2,468 | | | | | |
| Greater than or equal to 740 | 27,362 | | | 1,208 | | | 20,373 | | | 5,781 | | | | | |
| Total Home Equity | $ | 36,530 | | | $ | 2,301 | | | $ | 24,298 | | | $ | 9,931 | | | | | |
(1)Includes reverse mortgages of $1.3 billion and home equity loans of $974 million which are no longer originated.
| | | | | | | | | | | | | | | | | | | | | | | | | | | | | | | | | | | | | | | | | | | | | | | | | | | | | | | | | | | | | | | | | |
| | | | | | | | | | | | | | | | | | | | | |
| Credit Card and Direct/Indirect Consumer – Credit Quality Indicators By Vintage |
| | | | | | | | | | | | | | | | | | | | | |
| | | | | | | | | | | | | | | | | | | | | |
| | | | | | | | | | | | | | |
| | | | | | | | | | | | | | | | | | | | | |
| | | | | | | | | | | | | | | | | | | | | |
| | | | | | | | | | | | | | | | | | | | | |
| | | | | | | | | | | | | | | | | | | | | |
| | | | | | | | | | | | | | | | | | | | | |
| | | | | | | | | | | | | | | | | | | | | |
| | | | | | | | | | | | | | | | | | | | | |
| Direct/Indirect | | |
| | | | | Term Loans by Origination Year | | Credit Card |
| (Dollars in millions) | Total Direct/Indirect as of September 30, 2020 | | Revolving Loans | | 2020 | | 2019 | | 2018 | | 2017 | | 2016 | | Prior | | Total Credit Card as of September 30, 2020 | | Revolving Loans | | Revolving Loans Converted to Term Loans (3) |
| Refreshed FICO score | | | | | | | | | | | | | | | | | | | | | |
| Less than 620 | $ | 1,041 | | | $ | 20 | | | $ | 81 | | | $ | 204 | | | $ | 194 | | | $ | 279 | | | $ | 181 | | | $ | 82 | | | $ | 3,878 | | | $ | 3,686 | | | $ | 192 | |
| Greater than or equal to 620 and less than 680 | 2,227 | | | 23 | | | 498 | | | 628 | | | 379 | | | 357 | | | 213 | | | 129 | | | 9,788 | | | 9,572 | | | 216 | |
| Greater than or equal to 680 and less than 740 | 7,483 | | | 84 | | | 2,171 | | | 2,280 | | | 1,188 | | | 894 | | | 489 | | | 377 | | | 28,496 | | | 28,311 | | | 185 | |
| Greater than or equal to 740 | 36,620 | | | 125 | | | 9,693 | | | 11,729 | | | 6,723 | | | 4,207 | | | 2,164 | | | 1,979 | | | 37,672 | | | 37,628 | | | 44 | |
Other internal credit metrics (1, 2) | 42,543 | | | 41,903 | | | 46 | | | 120 | | | 111 | | | 75 | | | 52 | | | 236 | | | 0 | | | 0 | | | 0 | |
Total credit card and other
consumer | $ | 89,914 | | | $ | 42,155 | | | $ | 12,489 | | | $ | 14,961 | | | $ | 8,595 | | | $ | 5,812 | | | $ | 3,099 | | | $ | 2,803 | | | $ | 79,834 | | | $ | 79,197 | | | $ | 637 | |
| | | | | | | | | | | | | | | | | | | | | |
| | | | | | | | | | | | | | | | | | | | | |
| | | | | | | | | | | | | | | | | | | | | |
| | | | | | | | | | | | | | | | | | | | | |
| | | | | | | | | | | | | | | | | | | | | |
| | | | | | | | | | | | | | | | | | | | | |
| | | | | | | | | | | | | | | | | | | | | |
| | | | | | | | | | | | | | | | | | | | | |
| | | | | | | | | | | | | | | | | | | | | |
(1)Other internal credit metrics may include delinquency status, geography or other factors.
(2)Direct/indirect consumer includes $41.9 billion of securities-based lending which is typically supported by highly liquid collateral with market value greater than or equal to the outstanding loan balance and therefore has minimal credit risk at September 30, 2020.
(3)Represents troubled debt restructurings that were modified into term loans.
| | | | | | | | | | | | | | | | | | | | | | | | | | | | | | | | | | | | | | | | | | | | | | | |
| | | | | | | | | | | | | | | |
Commercial – Credit Quality Indicators By Vintage (1, 2) | | | | | | |
| | | Term Loans | | |
| | | Amortized Cost Basis by Origination Year | | |
| | | | | | | | |
| (Dollars in millions) | Total as of September 30, 2020 | | 2020 | | 2019 | | 2018 | | 2017 | | 2016 | | Prior | | Revolving Loans |
| U.S. Commercial | | | | | | | | | | | | | | | |
| Risk ratings | | | | | | | | | | | | | | | |
| Pass rated | $ | 273,068 | | | $ | 29,791 | | | $ | 38,045 | | | $ | 19,560 | | | $ | 16,259 | | | $ | 8,621 | | | $ | 18,776 | | | $ | 142,016 | |
| Reservable criticized | 20,866 | | | 1,868 | | | 2,430 | | | 2,377 | | | 906 | | | 668 | | | 1,925 | | | 10,692 | |
| Total U.S. Commercial | $ | 293,934 | | | $ | 31,659 | | | $ | 40,475 | | | $ | 21,937 | | | $ | 17,165 | | | $ | 9,289 | | | $ | 20,701 | | | $ | 152,708 | |
| | | | | | | | | | | | | | | |
| Non-U.S. Commercial | | | | | | | | | | | | | | | |
| Risk ratings | | | | | | | | | | | | | | | |
| Pass rated | $ | 92,125 | | | $ | 12,666 | | | $ | 13,306 | | | $ | 8,519 | | | $ | 5,407 | | | $ | 1,557 | | | $ | 6,842 | | | $ | 43,828 | |
| Reservable criticized | 4,026 | | | 533 | | | 491 | | | 443 | | | 252 | | | 49 | | | 172 | | | 2,086 | |
| Total Non-U.S. Commercial | $ | 96,151 | | | $ | 13,199 | | | $ | 13,797 | | | $ | 8,962 | | | $ | 5,659 | | | $ | 1,606 | | | $ | 7,014 | | | $ | 45,914 | |
| | | | | | | | | | | | | | | |
| Commercial Real Estate | | | | | | | | | | | | | | | |
| Risk ratings | | | | | | | | | | | | | | | |
| Pass rated | $ | 55,528 | | | $ | 6,168 | | | $ | 15,968 | | | $ | 10,438 | | | $ | 5,800 | | | $ | 3,470 | | | $ | 7,503 | | | $ | 6,181 | |
| Reservable criticized | 6,926 | | | 348 | | | 1,613 | | | 1,430 | | | 1,393 | | | 617 | | | 1,106 | | | 419 | |
| Total Commercial Real Estate | $ | 62,454 | | | $ | 6,516 | | | $ | 17,581 | | | $ | 11,868 | | | $ | 7,193 | | | $ | 4,087 | | | $ | 8,609 | | | $ | 6,600 | |
| | | | | | | | | | | | | | | |
| Commercial Lease Financing | | | | | | | | | | | | | | | |
| Risk ratings | | | | | | | | | | | | | | | |
| Pass rated | $ | 16,756 | | | $ | 2,292 | | | $ | 3,433 | | | $ | 3,240 | | | $ | 2,753 | | | $ | 1,831 | | | $ | 3,207 | | | $ | 0 | |
| Reservable criticized | 657 | | | 71 | | | 89 | | | 164 | | | 68 | | | 63 | | | 202 | | | 0 | |
| Total Commercial Lease Financing | $ | 17,413 | | | $ | 2,363 | | | $ | 3,522 | | | $ | 3,404 | | | $ | 2,821 | | | $ | 1,894 | | | $ | 3,409 | | | $ | 0 | |
| | | | | | | | | | | | | | | |
U.S. Small Business Commercial (3) | | | | | | | | | | | | | | | |
| Risk ratings | | | | | | | | | | | | | | | |
| Pass rated | $ | 30,787 | | | $ | 25,856 | | | $ | 1,185 | | | $ | 880 | | | $ | 780 | | | $ | 563 | | | $ | 1,340 | | | $ | 183 | |
| Reservable criticized | 1,339 | | | 78 | | | 222 | | | 216 | | | 182 | | | 128 | | | 500 | | | 13 | |
| Total U.S. Small Business Commercial | $ | 32,126 | | | $ | 25,934 | | | $ | 1,407 | | | $ | 1,096 | | | $ | 962 | | | $ | 691 | | | $ | 1,840 | | | $ | 196 | |
Total (1, 2) | $ | 502,078 | | | $ | 79,671 | | | $ | 76,782 | | | $ | 47,267 | | | $ | 33,800 | | | $ | 17,567 | | | $ | 41,573 | | | $ | 205,418 | |
| | | | | | | | | | | | | | | |
| | | | | | | | |
| | | | | | | | | | | | | | | |
| | | | | | | | | | | | | | | |
| | | | | | | | | | | | | | | |
| | | | | | | | | | | | | | | |
| | | | | | | | | | | | | | | |
| | | | | | | | | | | | | | | |
| | | | | | | | | | | | | | | |
| | | | | | | | | | | | | | | |
| | | | | | | | | | | | | | | |
| | | | | | | | | | | | | | | |
(1) Excludes $6.6 billion of loans accounted for under the fair value option at September 30, 2020.
(2) Includes $54 million of loans that converted from revolving to term loans.
(3) Excludes U.S. Small Business Card loans of $6.7 billion. Refreshed FICO scores for this portfolio are $266 million for less than 620; $599 million for greater than or equal to 620 and less than 680; $1.8 billion for greater than or equal to 680 and less than 740; and $4.1 billion greater than or equal to 740.
As a result of the economic impact of COVID-19, commercial asset quality weakened during the three months ended September 30, 2020. Commercial reservable criticized utilized exposure increased to $35.7 billion at September 30, 2020 from $11.5 billion (to 6.55 percent from 2.09 percent of total commercial reservable utilized exposure) at December 31, 2019 with increases spread across multiple industries including travel and entertainment.
Troubled Debt Restructurings
The Corporation began entering into loan modifications with borrowers in response to the COVID-19 pandemic, which have not been classified as TDRs, and therefore are not included in the discussion below. For more information on the criteria for classifying loans as TDRs, see Note 1 – Summary of Significant Accounting Principles.
Consumer Real Estate
Modifications of consumer real estate loans are classified as TDRs when the borrower is experiencing financial difficulties and a concession has been granted. Concessions may include reductions in interest rates, capitalization of past due amounts, principal and/or interest forbearance, payment extensions, principal and/or interest forgiveness, or combinations thereof. Prior to permanently modifying a loan, the Corporation may enter into trial modifications with certain borrowers under both government and proprietary programs. Trial modifications generally represent a three- to four-month period during which
the borrower makes monthly payments under the anticipated modified payment terms. Upon successful completion of the trial period, the Corporation and the borrower enter into a permanent modification. Binding trial modifications are classified as TDRs when the trial offer is made and continue to be classified as TDRs regardless of whether the borrower enters into a permanent modification.
Consumer real estate loans of $385 million that have been discharged in Chapter 7 bankruptcy with no change in repayment terms and not reaffirmed by the borrower of $1.2 billion were included in TDRs at September 30, 2017,2020, of which $379$101 million were classified as nonperforming and $442$71 million were loans fully-insured byfully insured.
Consumer real estate TDRs are measured primarily based on the net present value of the estimated cash flows discounted at the loan’s original effective interest rate. If the carrying value of a TDR exceeds this amount, a specific allowance is recorded as a component of the allowance for loan and lease losses. Alternatively, consumer real estate TDRs that are considered to be dependent solely on the collateral for repayment (e.g., due to the lack of income verification) are measured based on the estimated fair value of the collateral, and a charge-off is recorded if the carrying value exceeds the fair value of the collateral. Consumer real estate loans that reach 180 days past due prior to modification are charged off to their net realizable value, less costs to sell, before they are modified as TDRs in accordance with established policy. Subsequent declines in the fair value of the collateral after a loan has reached 180 days
FHA. For more informationpast due are recorded as charge-offs. Fully-insured loans are protected against principal loss, and therefore, the Corporation does not record an allowance for loan and lease losses on loans dischargedthe outstanding principal balance, even after they have been modified in Chapter 7 bankruptcy, see Nonperforming Loans and Leases in this Note.a TDR.
At both September 30, 20172020 and December 31, 2016,2019, remaining commitments to lend additional funds to debtors whose terms have been modified in a consumer real estate TDR were immaterial.not significant. Consumer real estate foreclosed properties totaled $259$135 million and $363$229 million at September 30, 20172020 and December 31, 2016.2019. The carrying value of consumer real estate loans, including fully-insured and PCI loans, for which formal foreclosure proceedings were in process at September 30, 20172020 was $3.7$1.3 billion. DuringAlthough the threeCorporation has paused formal loan foreclosure proceedings and foreclosure sales for occupied properties, during the nine months ended September 30, 2017,2020, the Corporation reclassified $198 million and $624$169 million of consumer real
estate loans completed or which were in process prior to the pause in foreclosures, to foreclosed properties or, for properties acquired upon foreclosure of certain government-guaranteed loans (principally FHA-insured loans), to other assets. This compared to reclassifications of $326 million and $1.1 billion for the same periods in 2016. The reclassifications represent non-cash investing activities and, accordingly, are not reflected in the Consolidated Statement of Cash Flows.
The table below provides the unpaid principal balance, carrying value and related allowance at September 30, 2017 and December 31, 2016, and the average carrying value and interest income recognized for the three and nine months ended September 30, 2017 and 2016 for impaired loans in the Corporation’s Consumer Real Estate portfolio segment. Certain impaired consumer real estate loans do not have a related allowance as the current valuation of these impaired loans exceeded the carrying value, which is net of previously recorded charge-offs.
|
| | | | | | | | | | | | | | | | | | | | | | | | | | | | | | | |
| | | | | | | | | | | | | | | | |
| Impaired Loans – Consumer Real Estate | | |
| | | | | | September 30, 2017 | | December 31, 2016 |
| (Dollars in millions) | | | | | Unpaid
Principal Balance | | Carrying Value | | Related Allowance | | Unpaid
Principal Balance | | Carrying Value | | Related Allowance |
| With no recorded allowance | | | | | |
| | |
| | |
| | |
| | |
| | |
| Residential mortgage | | | | | $ | 9,212 |
| | $ | 7,172 |
| | $ | — |
| | $ | 11,151 |
| | $ | 8,695 |
| | $ | — |
|
| Home equity | | | | | 3,644 |
| | 1,962 |
| | — |
| | 3,704 |
| | 1,953 |
| | — |
|
| With an allowance recorded | | | | | | | | | |
| | | | | | |
| Residential mortgage | | | | | $ | 3,167 |
| | $ | 3,079 |
| | $ | 188 |
| | $ | 4,041 |
| | $ | 3,936 |
| | $ | 219 |
|
| Home equity | | | | | 990 |
| | 909 |
| | 181 |
| | 910 |
| | 824 |
| | 137 |
|
| Total | | | | | |
| | |
| | |
| | | | | | |
| Residential mortgage | | | | | $ | 12,379 |
| | $ | 10,251 |
| | $ | 188 |
| | $ | 15,192 |
| | $ | 12,631 |
| | $ | 219 |
|
| Home equity | | | | | 4,634 |
| | 2,871 |
| | 181 |
| | 4,614 |
| | 2,777 |
| | 137 |
|
| | | | | | | | | | | | | | | | |
| | Three Months Ended September 30 | | Nine Months Ended September 30 |
| | 2017 | | 2016 | | 2017 | | 2016 |
| | Average
Carrying
Value | | Interest
Income
Recognized (1) | | Average
Carrying
Value | | Interest
Income
Recognized (1) | | Average
Carrying
Value | | Interest
Income
Recognized (1) | | Average
Carrying
Value | | Interest
Income
Recognized (1) |
| With no recorded allowance | |
| | |
| | | | | | | | | | | | |
| Residential mortgage | $ | 7,498 |
| | $ | 77 |
| | $ | 9,673 |
| | $ | 83 |
| | $ | 7,964 |
| | $ | 237 |
| | $ | 10,523 |
| | $ | 277 |
|
| Home equity | 2,000 |
| | 27 |
| | 1,964 |
| | 37 |
| | 2,001 |
| | 82 |
| | 1,883 |
| | 67 |
|
| With an allowance recorded | | | | | | | | | | | | | | | |
| Residential mortgage | $ | 3,254 |
| | $ | 29 |
| | $ | 4,676 |
| | $ | 36 |
| | $ | 3,565 |
| | $ | 97 |
| | $ | 5,371 |
| | $ | 133 |
|
| Home equity | 873 |
| | 6 |
| | 822 |
| | 7 |
| | 850 |
| | 18 |
| | 863 |
| | 18 |
|
| Total | |
| | |
| | | | | | | | | | | | |
| Residential mortgage | $ | 10,752 |
| | $ | 106 |
| | $ | 14,349 |
| | $ | 119 |
| | $ | 11,529 |
| | $ | 334 |
| | $ | 15,894 |
| | $ | 410 |
|
| Home equity | 2,873 |
| | 33 |
| | 2,786 |
| | 44 |
| | 2,851 |
| | 100 |
| | 2,746 |
| | 85 |
|
| |
(1)
| Interest income recognized includes interest accrued and collected on the outstanding balances of accruing impaired loans as well as interest cash collections on nonaccruing impaired loans for which the principal is considered collectible. |
The table below presents the September 30, 20172020 and 20162019 unpaid principal balance, carrying value, and average pre- and post-modification interest rates onof consumer real estate loans that were modified in TDRs during the three and nine months ended September 30, 20172020 and 2016, and net charge-offs recorded during the period in which the modification occurred.2019. The following Consumer Real Estate portfolio segment tables include loans that were initially classified as TDRs during the period and also loans that had previously been classified as TDRs and were modified again during the period.
| | | | | | | | | | | | | |
Consumer Real Estate – TDRs Entered into During the Three Months Ended September 30, 2017 and 2016 (1) | |
Consumer Real Estate – TDRs Entered into During The Three and Nine Months Ended September 30, 2020 and 2019 (1) | | Consumer Real Estate – TDRs Entered into During The Three and Nine Months Ended September 30, 2020 and 2019 (1) |
| | | | |
| | September 30, 2017 | | Three Months Ended September 30, 2017 | | Unpaid Principal Balance | | Carrying
Value | | Pre-Modification Interest Rate | | Post-Modification Interest Rate (2) | | Unpaid Principal Balance | | Carrying
Value | | Pre-Modification Interest Rate | | Post-Modification Interest Rate (2) |
| (Dollars in millions) | Unpaid Principal Balance | | Carrying Value | | Pre-Modification Interest Rate | | Post-Modification Interest Rate (2) | | Net Charge-offs (3) | (Dollars in millions) | Three Months Ended September 30, 2020 | | Nine Months Ended September 30, 2020 |
| Residential mortgage | $ | 294 |
| | $ | 263 |
| | 4.42 | % | | 4.33 | % | | $ | 2 |
| Residential mortgage | $ | 103 | | | $ | 88 | | | 4.06 | % | | 3.99 | % | | $ | 294 | | | $ | 244 | | | 4.07 | % | | 3.90 | % |
| Home equity | 212 |
| | 172 |
| | 4.01 |
| | 3.96 |
| | 15 |
| Home equity | 12 | | | 10 | | | 4.25 | | | 4.08 | | | 56 | | | 45 | | | 3.85 | | | 3.73 | |
| Total | $ | 506 |
| | $ | 435 |
| | 4.25 |
| | 4.17 |
| | $ | 17 |
| Total | $ | 115 | | | $ | 98 | | | 4.08 | | | 4.00 | | | $ | 350 | | | $ | 289 | | | 4.03 | | | 3.87 | |
| | | | | | | | | | | |
| | September 30, 2016 | | Three Months Ended September 30, 2016 | | Three Months Ended September 30, 2019 | | Nine Months Ended September 30, 2019 |
| Residential mortgage | $ | 487 |
| | $ | 445 |
| | 4.83 | % | | 4.51 | % | | $ | 4 |
| Residential mortgage | $ | 148 | | | $ | 125 | | | 4.29 | % | | 4.25 | % | | $ | 368 | | | $ | 301 | | | 4.24 | % | | 4.22 | % |
| Home equity | 292 |
| | 223 |
| | 4.95 |
| | 3.41 |
| | 17 |
| Home equity | 34 | | | 27 | | | 5.28 | | | 5.27 | | | 129 | | | 94 | | | 5.19 | | | 4.60 | |
| Total | $ | 779 |
| | $ | 668 |
| | 4.87 |
| | 4.10 |
| | $ | 21 |
| Total | $ | 182 | | | $ | 152 | | | 4.48 | | | 4.44 | | | $ | 497 | | | $ | 395 | | | 4.49 | | | 4.32 | |
| | | | | | | | | | | |
Consumer Real Estate – TDRs Entered into During the Nine Months Ended September 30, 2017 and 2016 (1) | |
| | | |
| | September 30, 2017 | | Nine Months Ended September 30, 2017 | |
| Residential mortgage | $ | 738 |
| | $ | 657 |
| | 4.49 | % | | 4.25 | % | | $ | 5 |
| |
| Home equity | 630 |
| | 491 |
| | 4.16 |
| | 3.52 |
| | 32 |
| |
| Total | $ | 1,368 |
| | $ | 1,148 |
| | 4.33 |
| | 3.90 |
| | $ | 37 |
| |
| | | | | | | | | | | |
| | September 30, 2016 | | Nine Months Ended September 30, 2016 | |
| Residential mortgage | $ | 1,039 |
| | $ | 942 |
| | 4.77 | % | | 4.29 | % | | $ | 9 |
| |
| Home equity | 718 |
| | 552 |
| | 4.03 |
| | 2.87 |
| | 43 |
| |
| Total | $ | 1,757 |
| | $ | 1,494 |
| | 4.47 |
| | 3.71 |
| | $ | 52 |
| |
| | | | | | |
| |
(1)(1)For more information on the Corporation's loan modification programs offered in response to the COVID-19 pandemic, which are not TDRs, see Note 1 – Summary of Significant Accounting Principles. (2)The post-modification interest rate reflects the interest rate applicable only to permanently completed modifications, which exclude loans that are in a trial modification period. | During the three and nine months ended September 30, 2017, there was no forgiveness of principal related to residential mortgage loans in connection with TDRs compared to $1 million and $12 million for the same periods in 2016.
|
| |
(2)
| The post-modification interest rate reflects the interest rate applicable only to permanently completed modifications, which exclude loans that are in a trial modification period. |
| |
(3)
| Net charge-offs include amounts recorded on loans modified during the period that are no longer held by the Corporation at September 30, 2017 and 2016 due to sales and other dispositions.
|
The table below presents the September 30, 20172020 and 20162019 carrying value for consumer real estate loans that were modified in a TDR during the three and nine months ended September 30, 20172020 and 20162019, by type of modification.
| | | | | | | | | | | | | | | | | | | | | | | | | |
| | | | | | | | | |
Consumer Real Estate – Modification Programs (1) | | | | | | | | |
| | | | | | | | | |
| TDRs Entered into During the |
| Three Months Ended September 30 | | | | Nine Months Ended September 30 |
| (Dollars in millions) | 2020 | | 2019 | | | | 2020 | | 2019 |
| Modifications under government programs | $ | 0 | | | $ | 8 | | | | | $ | 8 | | | $ | 32 | |
| | | | | | | | | |
| | | | | | | | | |
| | | | | | | | | |
| | | | | | | | | |
| Modifications under proprietary programs | 50 | | | 18 | | | | | 136 | | | 125 | |
| | | | | | | | | |
| | | | | | | | | |
| | | | | | | | | |
| | | | | | | | | |
| | | | | | | | | |
Loans discharged in Chapter 7 bankruptcy (2) | 15 | | | 16 | | | | | 44 | | | 54 | |
| Trial modifications | 33 | | | 110 | | | | | 101 | | | 184 | |
| Total modifications | $ | 98 | | | $ | 152 | | | | | $ | 289 | | | $ | 395 | |
| | | | | | | | | |
| | |
| | | | | | | | | |
| | | | | | | | | |
| | | | | | | | | |
| | | | | | | | | |
| | | | | | | | | |
| | | | | | | | | |
| | | | | | | | | |
| | | | | | | | | |
| | | | | | | | | |
| | | | | | | | | |
| | | | | | | | | |
| | | | | | | | | |
| | | | | | | | | |
| | | | | | | | | |
| | | | | | | | | |
| | | | | | | | | |
| | | | | | | | | |
| | | | | | | | | |
| | | | | | | | | |
| | | | | | | | | |
| | | | | | | | | |
| | | | | | | | | |
| | | | | | | | | |
| | | | | | | | | |
| | | | | | | | | |
| | | | | | | | | |
| | | | | | | | | |
| | | | | | | | | |
| | | | | | | | | |
| | | | | | | | | |
| | | | | | | | | |
|
| | | | | | | | | | | | | | | |
| | | | | | | | |
| Consumer Real Estate – Modification Programs | | | | | | | |
| | TDRs Entered into During the |
| | Three Months Ended September 30 | | Nine Months Ended September 30 |
| (Dollars in millions) | 2017 | | 2016 | | 2017 | | 2016 |
| Modifications under government programs | | | | | | | |
| Contractual interest rate reduction | $ | 10 |
| | $ | 18 |
| | $ | 56 |
| | $ | 121 |
|
| Principal and/or interest forbearance | 1 |
| | 2 |
| | 4 |
| | 11 |
|
Other modifications (1) | 7 |
| | 3 |
| | 22 |
| | 21 |
|
| Total modifications under government programs | 18 |
| | 23 |
| | 82 |
| | 153 |
|
| Modifications under proprietary programs | | | | | | | |
| Contractual interest rate reduction | 15 |
| | 20 |
| | 178 |
| | 143 |
|
| Capitalization of past due amounts | 12 |
| | 4 |
| | 47 |
| | 27 |
|
| Principal and/or interest forbearance | 2 |
| | 2 |
| | 28 |
| | 47 |
|
Other modifications (1) | 1 |
| | 45 |
| | 45 |
| | 72 |
|
| Total modifications under proprietary programs | 30 |
| | 71 |
| | 298 |
| | 289 |
|
| Trial modifications | 329 |
| | 490 |
| | 605 |
| | 853 |
|
Loans discharged in Chapter 7 bankruptcy (2) | 58 |
| | 84 |
| | 163 |
| | 199 |
|
| Total modifications | $ | 435 |
| | $ | 668 |
| | $ | 1,148 |
| | $ | 1,494 |
|
| |
(1)
| Includes other modifications such as term or payment extensions and repayment plans. |
| |
(2)
| Includes loans discharged in Chapter 7 bankruptcy with no change in repayment terms that are classified as TDRs. |
(1)For more information on the Corporation's loan modification programs offered in response to the COVID-19 pandemic, which are not TDRs, see Note 1 – Summary of Significant Accounting Principles.
(2)Includes loans discharged in Chapter 7 bankruptcy with no change in repayment terms that are classified as TDRs.
The table below presents the carrying value of consumer real estate loans that entered into payment default during the three and nine months ended September 30, 20172020 and 20162019 that were modified in a TDR during the 12 months preceding payment default. A payment default for consumer real estate TDRs is recognized when a borrower has missed three3 monthly payments (not necessarily consecutively) since modification.
| | | | | | | | | | | | | | | | | | | | | | | | | | | | | | | | | | | |
| | | | | | | | | | | | | | | | | | | |
Consumer Real Estate – TDRs Entering Payment Default that were Modified During the Preceding 12 Months (1) | | | | | |
| | | | | | | | | | | | | | | | | | | |
| Three Months Ended September 30 | | Nine Months Ended September 30 | | | | | | |
| (Dollars in millions) | 2020 | | 2019 | | 2020 | | 2019 | | | | | | | | | | |
| Modifications under government programs | $ | 6 | | | $ | 7 | | | $ | 14 | | | $ | 20 | | | | | | | | | | | | | |
| Modifications under proprietary programs | 8 | | | 19 | | | 27 | | | 68 | | | | | | | | | | | | | |
Loans discharged in Chapter 7 bankruptcy (2) | 4 | | | 8 | | | 15 | | | 26 | | | | | | | | | | | | | |
Trial modifications (3) | 15 | | | 13 | | | 45 | | | 40 | | | | | | | | | | | | | |
| Total modifications | $ | 33 | | | $ | 47 | | | $ | 101 | | | $ | 154 | | | | | | | | | | | | | |
| | | | | | | | | | | | | | | | | | | |
| | | | | | | | | | | | | | | | | |
| | | | | | | | | | | | | | | | | | |
| | | | | | | | | | | | | | | | | | | |
| | | | | | | | | | | | | | | | | | | |
| | | | | | | | | | | | | | | | | | | |
| | | | | | | | | | | | | | | | | | | |
| | | | | | | | | | | | | | | | | | | |
| | | | | | | | | | | | | | | | | | | |
| | | | | | | | | | | | | | | | | | | |
| | | | | | | | | | | | | | | | | | | |
| | | | | | | | | | | | | | | | | | | |
| | | | | | | | | | | | | | | | | | | |
| | | | | | | | | | | | | | | | | | | |
| | | | | | | | | | | | | | | | | | | |
|
| | | | | | | | | | | | | | | |
| | | | | | | | |
| Consumer Real Estate – TDRs Entering Payment Default that were Modified During the Preceding 12 Months |
| | | | | | | | |
| | Three Months Ended September 30 | | Nine Months Ended September 30 |
| (Dollars in millions) | 2017 | | 2016 | | 2017 | | 2016 |
| Modifications under government programs | $ | 16 |
| | $ | 51 |
| | $ | 62 |
| | $ | 230 |
|
| Modifications under proprietary programs | 32 |
| | 40 |
| | 99 |
| | 145 |
|
Loans discharged in Chapter 7 bankruptcy (1) | 16 |
| | 42 |
| | 93 |
| | 124 |
|
Trial modifications (2) | 54 |
| | 161 |
| | 312 |
| | 648 |
|
| Total modifications | $ | 118 |
| | $ | 294 |
| | $ | 566 |
| | $ | 1,147 |
|
(2)Includes loans discharged in Chapter 7 bankruptcy with no change in repayment terms that are classified as TDRs.
(3)Includes trial modification offers to which the customer did not respond.
| | | | | | | | |
(1)75Bank of America
| Includes loans discharged in Chapter 7 bankruptcy with no change in repayment terms that are classified as TDRs. | |
| | | | | | | | |
(2)
| Includes trial modification offers to which the customer did not respond. | |
Credit Card and Other Consumer
Impaired loans within the Credit Card and Other Consumer portfolio segment consist entirely of loans that have been modified in TDRs. The Corporation seeks to assist customers that are experiencing financial difficulty by modifying loans while ensuring compliance with federal local and internationallocal laws and guidelines. Credit card and other consumer loan modifications generally involve reducing the interest rate on the account, and placing the customer on a fixed payment plan not exceeding 60 months all of which are considered TDRs. In substantially all cases,and canceling the customer’s available line of credit, is canceled.all of which are considered TDRs. The Corporation makes loan modifications directly with borrowers for debt held only by the Corporation (internal programs). Additionally, the Corporation makes loan modifications for borrowers working with third-party renegotiation
renegotiation agencies that provide solutions to customers’ entire unsecured debt structures (external programs). The Corporation classifies other secured consumer loans that have been discharged in Chapter 7 bankruptcy as TDRs which are written down to collateral value and placed on nonaccrual status no later than the time of discharge. For more information on the regulatory guidance on loans discharged in Chapter 7 bankruptcy, see Nonperforming Loans and Leases in this Note.
The table below provides the unpaid principal balance, carrying value and related allowance at September 30, 2017 and December 31, 2016, and the average carrying value and interest income recognized for the three and nine months ended September 30, 2017 and 2016 on TDRs within the Credit Card and Other Consumer portfolio segment.
|
| | | | | | | | | | | | | | | | | | | | | | | | | | | | | | | |
| | | | | | | | | | | | | | | | |
| Impaired Loans – Credit Card and Other Consumer | | |
| | | | | | September 30, 2017 | | December 31, 2016 |
| (Dollars in millions) | | | | | Unpaid
Principal Balance | | Carrying Value (1) | | Related Allowance | | Unpaid
Principal Balance | | Carrying Value (1) | | Related Allowance |
| With no recorded allowance | | | | | |
| | |
| | |
| | | | | | |
| Direct/Indirect consumer | | | | | $ | 53 |
| | $ | 25 |
| | $ | — |
| | $ | 49 |
| | $ | 22 |
| | $ | — |
|
| With an allowance recorded | | | | | |
| | |
| | |
| | | | | | |
| U.S. credit card | | | | | $ | 452 |
| | $ | 458 |
| | $ | 125 |
| | $ | 479 |
| | $ | 485 |
| | $ | 128 |
|
| Non-U.S. credit card | | | | | n/a |
| | n/a |
| | n/a |
| | 88 |
| | 100 |
| | 61 |
|
| Direct/Indirect consumer | | | | | 1 |
| | 2 |
| | — |
| | 3 |
| | 3 |
| | — |
|
| Total | | | | | |
| | |
| | |
| | |
| | |
| | |
| U.S. credit card | | | | | $ | 452 |
| | $ | 458 |
| | $ | 125 |
| | $ | 479 |
| | $ | 485 |
| | $ | 128 |
|
| Non-U.S. credit card | | | | | n/a |
| | n/a |
| | n/a |
| | 88 |
| | 100 |
| | 61 |
|
| Direct/Indirect consumer | | | | | 54 |
| | 27 |
| | — |
| | 52 |
| | 25 |
| | — |
|
| | | | | | | | | | | | | | | | |
| | Three Months Ended September 30 | | Nine Months Ended September 30 |
| | 2017 | | 2016 | | 2017 | | 2016 |
| | Average
Carrying
Value | | Interest
Income
Recognized (2) | | Average
Carrying
Value | | Interest
Income
Recognized (2) | | Average
Carrying
Value | | Interest
Income
Recognized (2) | | Average
Carrying
Value | | Interest
Income
Recognized (2) |
| With no recorded allowance | | | | | | | | | | | | | | | |
| Direct/Indirect consumer | $ | 20 |
| | $ | — |
| | $ | 21 |
| | $ | — |
| | $ | 19 |
| | $ | — |
| | $ | 21 |
| | $ | — |
|
| With an allowance recorded | |
| | |
| | | | | | |
| | |
| | | | |
| U.S. credit card | $ | 457 |
| | $ | 6 |
| | $ | 539 |
| | $ | 7 |
| | $ | 466 |
| | $ | 18 |
| | $ | 571 |
| | $ | 24 |
|
| Non-U.S. credit card | — |
| | — |
| | 107 |
| | — |
| | 62 |
| | 1 |
| | 115 |
| | 2 |
|
| Direct/Indirect consumer | 2 |
| | — |
| | 7 |
| | — |
| | 2 |
| | — |
| | 12 |
| | — |
|
| Total | |
| | |
| | | | | | |
| | |
| | | | |
| U.S. credit card | $ | 457 |
| | $ | 6 |
| | $ | 539 |
| | $ | 7 |
| | $ | 466 |
| | $ | 18 |
| | $ | 571 |
| | $ | 24 |
|
| Non-U.S. credit card | — |
| | — |
| | 107 |
| | — |
| | 62 |
| | 1 |
| | 115 |
| | 2 |
|
| Direct/Indirect consumer | 22 |
| | — |
| | 28 |
| | — |
| | 21 |
| | — |
| | 33 |
| | — |
|
| |
(1)
| Includes accrued interest and fees. |
| |
(2)
| Interest income recognized includes interest accrued and collected on the outstanding balances of accruing impaired loans as well as interest cash collections on nonaccruing impaired loans for which the principal is considered collectible. |
n/a = not applicable
The table below provides information on the Corporation’s primary modification programs for the Credit Card and Other Consumer TDR portfolio at September 30, 2017 and December 31, 2016.
|
| | | | | | | | | | | | | | | | | | | | | | | | | | | | | | | | | | | | | |
| | | | | | | | | | | | | | | | | | | | |
| Credit Card and Other Consumer – TDRs by Program Type |
| | Internal Programs | | External Programs | | Other (1) | | Total | | Percent of Balances Current or Less Than 30 Days Past Due |
| (Dollars in millions) | September 30
2017 | | December 31
2016 | | September 30
2017 | | December 31
2016 | | September 30
2017 | | December 31
2016 | | September 30
2017 | | December 31
2016 | | September 30
2017 | | December 31
2016 |
| U.S. credit card | $ | 201 |
| | $ | 220 |
| | $ | 256 |
| | $ | 264 |
| | $ | 1 |
| | $ | 1 |
| | $ | 458 |
| | $ | 485 |
| | 88.30 | % | | 88.99 | % |
| Non-U.S. credit card | n/a |
| | 11 |
| | n/a |
| | 7 |
| | n/a |
| | 82 |
| | n/a |
| | 100 |
| | n/a |
| | 38.47 |
|
| Direct/Indirect consumer | 1 |
| | 2 |
| | 1 |
| | 1 |
| | 25 |
| | 22 |
| | 27 |
| | 25 |
| | 89.05 |
| | 90.49 |
|
| Total TDRs by program type | $ | 202 |
| | $ | 233 |
| | $ | 257 |
| | $ | 272 |
| | $ | 26 |
| | $ | 105 |
| | $ | 485 |
| | $ | 610 |
| | 88.34 |
| | 80.79 |
|
| |
(1)
| Other TDRs for non-U.S. credit card included modifications of accounts that are ineligible for a fixed payment plan. |
n/a = not applicable
The table below provides information on the Corporation’s Credit Card and Other Consumer TDR portfolio including the September 30, 20172020 and 20162019 unpaid principal balance, carrying value, and average pre- and post-modification interest rates of loans that were modified in TDRs during the three and nine months ended September 30, 20172020 and 2016,2019.
| | | | | | | | | | | | | | | | | | | | | | | | | | | | | | | | | | | | | | | | | | | | | | | | | | | | |
| | | | | | | | | | | | | | | | | | | | |
Credit Card and Other Consumer – TDRs Entered into During the Three and Nine Months Ended September 30, 2020 and 2019 (1) |
| | | | | | | | | | | | | | | | | | | | |
| | Unpaid Principal Balance | | Carrying
Value (2) | | Pre-Modification Interest Rate | | Post-Modification Interest Rate | | Unpaid Principal Balance | | Carrying
Value (2) | | Pre-Modification Interest Rate | | Post-Modification Interest Rate | | | | | |
| | | | | | | | | | | | | |
| (Dollars in millions) | Three Months Ended September 30, 2020 | | Nine Months Ended September 30, 2020 | | | | | |
| Credit card | $ | 71 | | | $ | 77 | | | 18.19 | % | | 6.86 | % | | $ | 203 | | | $ | 214 | | | 18.06 % | | 5.82 % | | | | | |
| | | | | | | | | | | | | | | | | | | | |
| Direct/Indirect consumer | 35 | | | 29 | | | 6.02 | | | 6.02 | | | 50 | | | 37 | | | 5.87 | | | 5.87 | | | | | | |
| | | | | | | | | | | | | | | | | | | | |
| Total | $ | 106 | | | $ | 106 | | | 14.85 | | | 6.63 | | | $ | 253 | | | $ | 251 | | | 16.29 | | | 5.83 | | | | | | |
| | | | | | | | | | | | | | | | | | | | |
| Three Months Ended September 30, 2019 | | Nine Months Ended September 30, 2019 | | | | | |
| Credit card | $ | 100 | | | $ | 107 | | | 19.62 | % | | 5.36 | % | | $ | 267 | | | $ | 281 | | | 19.50 | % | | 5.35 | % | | | | | |
| | | | | | | | | | | | | | | | | | | | |
| Direct/Indirect consumer | 19 | | | 11 | | | 5.32 | | | 5.32 | | | 35 | | | 19 | | | 5.23 | | | 5.22 | | | | | | |
| | | | | | | | | | | | | | | | | | | | |
| Total | $ | 119 | | | $ | 118 | | | 18.36 | | | 5.36 | | | $ | 302 | | | $ | 300 | | | 18.62 | | | 5.34 | | | | | | |
| | | | | | | | | | | | | | | | | | | | |
| | | | | | | | | | | | | | |
| | | | | | | | | | | | | | | | | | | | |
| | | | | | | | | | | | | | | | | | | | |
| | | | | | | | | | | | | | | | | | | | |
| | | | | | | | | | | | | | | | | | | | |
| | | | | | | | | | | | | | | | | | | | |
| | | | | | | | | | | | | | | | | | | | |
|
| | | | | | | | | |
| | | | | | | | | | | | | | |
| | | | | | | | | | | | | | | | | | | | |
| | | | | | | | | | | | | | | | | | | | |
| | | | | | | | | | | | | | | | | | | | |
| | | | | | | | | | | | | | | | | | | | |
| | | | | | | | | | | | | | | | | | | | |
| | | | | | | | | | | | | | | | | | | | |
| | | | | | | | | | | | | | |
| | | | | | | | | | | | | | | | | | | | |
| | | | | | | | | | | | | | | | | | | | |
| | | | | | | | | | | | | | | | | | | | |
| | | | | | | | | | | | | | | | | | | | |
| | | | | | | | | | | | | | | | | | | | |
| | | | | | | | | | | | | | | | | | | | |
| | | | | | | | |
| | | | | | | | | | | | | | | | | | | | |
| | | | | | | | | | | | | | | | | | | | |
| | | | | | | | | | | | | | | | | | | | |
| | | | | | | | | | | | | | | | | | | | |
| | | | | | | | | | | | | | | | | | | | |
(1)For more information on the Corporation's loan modification programs offered in response to the COVID-19 pandemic, which are not TDRs, see Note 1 – Summary of Significant Accounting Principles.
(2)Includes accrued interest and net charge-offs recordedfees.
The table below presents the September 30, 2020 and 2019 carrying value for Credit Card and Other Consumer loans that were modified in a TDR during the periodthree and nine months ended September 30, 2020 and 2019, by program type.
| | | | | | | | | | | | | | | | | | | | | | | | | | | | | | | | | | | | | | | |
| | | | | | | | | | | | | | | | | | | | | | | |
Credit Card and Other Consumer – TDRs by Program Type (1) |
| |
| | | | | | | | | | | | | |
| | | | | | | | | | | | | |
| | | | | | | | | | | | | |
| TDRs Entered into During the Three Months Ended September 30 | | TDRs Entered into During the Nine Months Ended September 30 | | | | | | | | | | | | | | | | |
| (Dollars in millions) | 2020 | | 2019 | | 2020 | | 2019 | | | | | | | | | | | | | | | | |
| Internal programs | $ | 80 | | | $ | 76 | | | $ | 178 | | | $ | 196 | | | | | | | | | | | | | | | | | |
| External programs | 19 | | | 31 | | | 59 | | | 86 | | | | | | | | | | | | | | | | | |
| Other | 7 | | | 11 | | | 14 | | | 18 | | | | | | | | | | | | | | | | | |
| Total | $ | 106 | | | $ | 118 | | | $ | 251 | | | $ | 300 | | | | | | | | | | | | | | | | | |
| | | | | | | | | | | | | | | | | | | | | | | |
(1)Includes accrued interest and fees. For more information on the Corporation's loan modification programs offered in response to the COVID-19 pandemic, which the modification occurred.are not TDRs, see Note 1 – Summary of Significant Accounting Principles.
|
| | | | | | | | | | | | | | | | | | | | | | | | | | | |
| | | | | | | | | | | | | | | | |
| Credit Card and Other Consumer – TDRs Entered into During the Three and Nine Months Ended September 30, 2017 and 2016 |
| | Three Months Ended September 30 | | Nine Months Ended September 30 |
| | 2017 |
| (Dollars in millions) | Unpaid Principal Balance | | Carrying Value (1) | | Pre-Mod Interest Rate | | Post-Mod Interest Rate | | Unpaid Principal Balance | | Carrying Value (1) | | Pre-Mod Interest Rate | | Post-Mod Interest Rate |
| U.S. credit card | $ | 60 |
| | $ | 64 |
| | 17.96 | % | | 5.40 | % | | $ | 152 |
| | $ | 161 |
| | 17.88 | % | | 5.49 | % |
| Direct/Indirect consumer | 22 |
| | 14 |
| | 4.92 |
| | 4.53 |
| | 29 |
| | 18 |
| | 4.99 |
| | 4.37 |
|
Total (2) | $ | 82 |
| | $ | 78 |
| | 15.64 |
| | 5.25 |
| | $ | 181 |
| | $ | 179 |
| | 16.57 |
| | 5.37 |
|
| | | | | | | | | | | | | | | | |
| | 2016 |
| U.S. credit card | $ | 46 |
| | $ | 50 |
| | 17.48 | % | | 5.33 | % | | $ | 126 |
| | $ | 134 |
| | 17.42 | % | | 5.45 | % |
| Non-U.S. credit card | 32 |
| | 36 |
| | 24.11 |
| | 0.38 |
| | 63 |
| | 73 |
| | 23.93 |
| | 0.44 |
|
| Direct/Indirect consumer | 7 |
| | 4 |
| | 4.13 |
| | 4.08 |
| | 16 |
| | 9 |
| | 4.50 |
| | 4.33 |
|
Total (2) | $ | 85 |
| | $ | 90 |
| | 19.55 |
| | 3.27 |
| | $ | 205 |
| | $ | 216 |
| | 19.05 |
| | 3.72 |
|
| |
(1)
| Includes accrued interest and fees. |
| |
(2)
| Net charge-offs were $14 million and $33 million for the three and nine months ended September 30, 2017 compared to $26 million and $43 million for the same periods in 2016.
|
Credit card and other consumer loans are deemed to be in payment default during the quarter in which a borrower misses the second of two2 consecutive payments. Payment defaults are one of the factors considered when projecting future cash flows in the calculation of the allowance for loan and lease losses for impaired credit card and other consumer loans.consumer. Based on historical experience, the Corporation estimates that 1314 percent of both new U.S. credit card TDRs and 22 percent of new direct/indirect consumer TDRs may be in payment default within 12 months after modification. Loans that entered into payment default during the three and nine months ended September 30, 2017 that had been modified in a TDR during the preceding 12 months were $7 million and $19 million for U.S. credit card and $1 million and $3 million for direct/indirect consumer. During the three and nine months ended September 30, 2016, loans that entered into payment default that had been modified in a TDR during the preceding 12 months were $7 million
and $23 million for U.S. credit card, $31 million and $95 million for non-U.S. credit card, and $0 and $2 million for direct/indirect consumer.
Commercial Loans
ImpairedModifications of loans to commercial borrowers that are experiencing financial difficulty are designed to reduce the Corporation’s loss exposure while providing the borrower with an opportunity to work through financial difficulties, often to avoid foreclosure or bankruptcy. Each modification is unique and reflects the individual circumstances of the borrower. Modifications that result in a TDR may include extensions of maturity at a concessionary (below market) rate of interest, payment forbearances or other actions designed to benefit the borrower while mitigating the Corporation’s risk exposure.
Reductions in interest rates are rare. Instead, the interest rates are typically increased, although the increased rate may not represent a market rate of interest. Infrequently, concessions may also include principal forgiveness in connection with foreclosure, short sale or other settlement agreements leading to termination or sale of the loan.
At the time of restructuring, the loans include nonperforming loans and TDRs (both performing and nonperforming).are remeasured to reflect the impact, if any, on projected cash flows resulting from the modified terms. If a portion of the loan is deemed to be uncollectible, a charge-off may be recorded at the time of restructuring. Alternatively, a charge-off may have already been recorded in a previous period such that no charge-off is required at the time of modification. For more information on impairedmodifications for the U.S. small business commercial loans,portfolio, see Note 4 – Outstanding LoansCredit Card and Leases to the Consolidated Financial Statements of the Corporation's 2016 Annual Report on Form 10-K.Other Consumer in this Note.
At September 30, 20172020 and December 31, 2016,2019, remaining commitments to lend additional funds to debtors whose terms have been modified in a commercial loan TDR were $279$471 million and $461$445 million.
Commercial foreclosed properties totaled $40 million and $14 The balance of commercial TDRs in payment default was $391 million at September 30, 20172020 and $207 million at December 31, 2016.2019.
The table below provides information on impaired loans in the Commercial loan portfolio segment including the unpaid principal balance, carrying value and related allowance at September 30, 2017 and December 31, 2016, and the average carrying value and interest income recognized for the three and nine months ended September 30, 2017 and 2016. Certain impaired commercial loans do not have a related allowance as the valuation of these impaired loans exceeded the carrying value, which is net of previously recorded charge-offs.
|
| | | | | | | | | | | | | | | | | | | | | | | | | | | | | | | |
| | | | | | | | | | | | | | | | |
| Impaired Loans – Commercial | | |
| | | | | | September 30, 2017 | | December 31, 2016 |
| (Dollars in millions) | | | | | Unpaid
Principal Balance | | Carrying Value | | Related Allowance | | Unpaid
Principal Balance | | Carrying Value | | Related Allowance |
| With no recorded allowance | | | | | |
| | |
| | |
| | |
| | |
| | |
| U.S. commercial | | | | | $ | 683 |
| | $ | 675 |
| | $ | — |
| | $ | 860 |
| | $ | 827 |
| | $ | — |
|
| Commercial real estate | | | | | 117 |
| | 106 |
| | — |
| | 77 |
| | 71 |
| | — |
|
| Non-U.S. commercial | | | | | 44 |
| | 27 |
| | — |
| | 130 |
| | 130 |
| | — |
|
| With an allowance recorded | | | | | | | | | | | | | | | |
|
| U.S. commercial | | | | | $ | 1,466 |
| | $ | 1,132 |
| | $ | 123 |
| | $ | 2,018 |
| | $ | 1,569 |
| | $ | 132 |
|
| Commercial real estate | | | | | 151 |
| | 39 |
| | 13 |
| | 243 |
| | 96 |
| | 10 |
|
| Commercial lease financing | | | | | 13 |
| | 12 |
| | 2 |
| | 6 |
| | 4 |
| | — |
|
| Non-U.S. commercial | | | | | 497 |
| | 437 |
| | 67 |
| | 545 |
| | 432 |
| | 104 |
|
U.S. small business commercial (1) | | | | 82 |
| | 70 |
| | 27 |
| | 85 |
| | 73 |
| | 27 |
|
| Total | | | | | |
| | |
| | |
| | | | | | |
| U.S. commercial | | | | | $ | 2,149 |
| | $ | 1,807 |
| | $ | 123 |
| | $ | 2,878 |
| | $ | 2,396 |
| | $ | 132 |
|
| Commercial real estate | | | | | 268 |
| | 145 |
| | 13 |
| | 320 |
| | 167 |
| | 10 |
|
| Commercial lease financing | | | | | 13 |
| | 12 |
| | 2 |
| | 6 |
| | 4 |
| | — |
|
| Non-U.S. commercial | | | | | 541 |
| | 464 |
| | 67 |
| | 675 |
| | 562 |
| | 104 |
|
U.S. small business commercial (1) | | | | 82 |
| | 70 |
| | 27 |
| | 85 |
| | 73 |
| | 27 |
|
| | | | | | | | | | | | | | | | |
| | Three Months Ended September 30 | | Nine Months Ended September 30 |
| | 2017 | | 2016 | | 2017 | | 2016 |
| | Average
Carrying
Value | | Interest
Income
Recognized (2) | | Average
Carrying
Value | | Interest
Income
Recognized (2) | | Average
Carrying
Value | | Interest
Income
Recognized (2) | | Average
Carrying
Value | | Interest
Income
Recognized (2) |
| With no recorded allowance | |
| | |
| | | | | | |
| | |
| | | | |
| U.S. commercial | $ | 726 |
| | $ | 3 |
| | $ | 940 |
| | $ | 5 |
| | $ | 822 |
| | $ | 9 |
| | $ | 726 |
| | $ | 10 |
|
| Commercial real estate | 77 |
| | 1 |
| | 59 |
| | — |
| | 61 |
| | 1 |
| | 67 |
| | — |
|
| Non-U.S. commercial | 14 |
| | — |
| | 32 |
| | — |
| | 55 |
| | — |
| | 18 |
| | — |
|
| With an allowance recorded | | | | | | | | | | | | | | | |
| U.S. commercial | $ | 1,166 |
| | $ | 9 |
| | $ | 1,624 |
| | $ | 16 |
| | $ | 1,305 |
| | $ | 25 |
| | $ | 1,570 |
| | $ | 46 |
|
| Commercial real estate | 72 |
| | — |
| | 87 |
| | 1 |
| | 85 |
| | 2 |
| | 95 |
| | 3 |
|
| Commercial lease financing | 10 |
| | — |
| | 4 |
| | — |
| | 6 |
| | — |
| | 2 |
| | — |
|
| Non-U.S. commercial | 463 |
| | 3 |
| | 397 |
| | 5 |
| | 466 |
| | 9 |
| | 372 |
| | 11 |
|
U.S. small business commercial (1) | 72 |
| | — |
| | 81 |
| | 1 |
| | 74 |
| | — |
| | 91 |
| | 1 |
|
| Total | |
| | |
| | | | | | |
| | |
| | | | |
| U.S. commercial | $ | 1,892 |
| | $ | 12 |
| | $ | 2,564 |
| | $ | 21 |
| | $ | 2,127 |
| | $ | 34 |
| | $ | 2,296 |
| | $ | 56 |
|
| Commercial real estate | 149 |
| | 1 |
| | 146 |
| | 1 |
| | 146 |
| | 3 |
| | 162 |
| | 3 |
|
| Commercial lease financing | 10 |
| | — |
| | 4 |
| | — |
| | 6 |
| | — |
| | 2 |
| | — |
|
| Non-U.S. commercial | 477 |
| | 3 |
| | 429 |
| | 5 |
| | 521 |
| | 9 |
| | 390 |
| | 11 |
|
U.S. small business commercial (1) | 72 |
| | — |
| | 81 |
| | 1 |
| | 74 |
| | — |
| | 91 |
| | 1 |
|
| |
(1)
| Includes U.S. small business commercial renegotiated TDR loans and related allowance. |
| |
(2)
| Interest income recognized includes interest accrued and collected on the outstanding balances of accruing impaired loans as well as interest cash collections on nonaccruing impaired loans for which the principal is considered collectible. |
The table below presents the September 30, 2017 and 2016 unpaid principal balance and carrying value of commercial loans that were modified as TDRs during the three and nine months ended September 30, 2017 and 2016, and net charge-offs that were recorded during the period in which the modification occurred. The table below includes loans that were initially classified as TDRs during the period and also loans that had previously been classified as TDRs and were modified again during the period.
|
| | | | | | | | | | | | | | | |
| | | | | | | | |
| Commercial – TDRs Entered into During the Three and Nine Months Ended September 30, 2017 and 2016 |
| | |
| | Three Months Ended September 30 | | Nine Months Ended September 30 |
| | 2017 |
| (Dollars in millions) | Unpaid Principal Balance | | Carrying Value | | Unpaid Principal Balance | | Carrying Value |
| U.S. commercial | $ | 357 |
| | $ | 322 |
| | $ | 763 |
| | $ | 700 |
|
| Commercial real estate | — |
| | — |
| | 16 |
| | 9 |
|
| Commercial lease financing | 12 |
| | 12 |
| | 12 |
| | 12 |
|
| Non-U.S. commercial | 105 |
| | 105 |
| | 105 |
| | 105 |
|
U.S. small business commercial (1) | 3 |
| | 3 |
| | 11 |
| | 12 |
|
Total (2) | $ | 477 |
| | $ | 442 |
| | $ | 907 |
| | $ | 838 |
|
| | | | | | | | |
| | 2016 |
| U.S. commercial | $ | 793 |
| | $ | 768 |
| | $ | 1,483 |
| | $ | 1,447 |
|
| Commercial real estate | 4 |
| | 4 |
| | 11 |
| | 11 |
|
| Commercial lease financing | 2 |
| | 2 |
| | 7 |
| | 4 |
|
| Non-U.S. commercial | 17 |
| | 17 |
| | 265 |
| | 201 |
|
U.S. small business commercial (1) | 1 |
| | 1 |
| | 4 |
| | 4 |
|
Total (2) | $ | 817 |
| | $ | 792 |
| | $ | 1,770 |
| | $ | 1,667 |
|
| |
(1)
| U.S. small business commercial TDRs are comprised of renegotiated small business card loans. |
| |
(2)
| Net charge-offs were $27 million and $89 million for the three and nine months ended September 30, 2017 compared to $14 million and $94 million for the same periods in 2016.
|
A commercial TDR is generally deemed to be in payment default when the loan is 90 days or more past due, including delinquencies that were not resolved as part of the modification. U.S. small business commercial TDRs are deemed to be in payment default during the quarter in which a borrower misses the second of two consecutive payments. Payment defaults are one of the factors considered when projecting future cash flows, along with observable market prices or fair value of collateral when measuring the allowance for loan and lease losses. TDRs that were in payment default had a carrying value of $57 million and $123 million for U.S. commercial, $32 million and $17 million for commercial real estate and $0 and $2 million for U.S. small business commercial at September 30, 2017 and 2016.
Purchased Credit-impaired Loans
The table below shows activity for the accretable yield on PCI loans, which include the Countrywide Financial Corporation (Countrywide) portfolio and loans repurchased in connection with the 2013 settlement with FNMA. The amount of accretable yield is affected by changes in credit outlooks, including metrics such as default rates and loss severities, prepayment speeds, which can change the amount and period of time over which interest payments are expected to be received, and the interest rates on variable rate loans. The reclassifications from nonaccretable difference in the three and nine months ended September 30, 2017 were primarily due to an increase in the expected principal and interest cash flows due to lower default estimates.
|
| | | | | | | |
| | |
| | |
| Rollforward of Accretable Yield | | |
| | | | |
| (Dollars in millions) | Three Months Ended September 30, 2017 | | Nine Months Ended September 30, 2017 |
| Accretable yield, beginning of period | $ | 3,288 |
| | $ | 3,805 |
|
| Accretion | (147 | ) | | (465 | ) |
| Disposals/transfers | (282 | ) | | (521 | ) |
| Reclassifications from nonaccretable difference | 80 |
| | 120 |
|
| Accretable yield, September 30, 2017 | $ | 2,939 |
| | $ | 2,939 |
|
During the three and nine months ended September 30, 2017, the Corporation sold PCI loans with a carrying value of $538 million and $742 million, which excludes the related allowance of $45 million and $80 million. During the three and nine months ended September 30, 2016, the Corporation sold PCI loans with a carrying value of $111 million and $435 million, which excludes the related allowance of $11 million and $50 million. For more information on PCI loans, see Note 1 – Summary of Significant Accounting Principles to the Consolidated Financial Statements of the Corporation's 2016 Annual Report on Form 10-K, and for the carrying value and valuation allowance for PCI loans, see Note 5 – Allowance for Credit Losses.
Loans Held-for-sale
The Corporation had LHFS of $13.2$4.4 billion and $9.1$9.2 billion at September 30, 20172020 and December 31, 2016.2019. Cash and non-cash proceeds from sales and paydowns of loans originally classified as LHFS were $28.0$16.1 billion and $22.1$19.6 billion for the nine months ended September 30, 20172020 and 2016.2019. Cash used for originations and purchases of LHFS totaled $31.4approximately $11.1 billion and $24.2$18.7 billion for the nine months ended September 30, 20172020 and 2016.
Accrued Interest Receivable
Accrued interest receivable for loans and leases and loans held-for-sale at September 30, 2020 and December 31, 2019 was $2.5 billion and $2.6 billion and is reported in customer and other receivables on the Consolidated Balance Sheet.
97BankOutstanding credit card loan balances include unpaid principal, interest and fees. Credit card loans are not classified as nonperforming but are charged off no later than the end of America
NOTE 5 Allowance for Credit Losses
The table below summarizes the changesmonth in which the allowance for credit losses by portfolio segment foraccount becomes 180 days past due, within 60 days after receipt of notification of death or bankruptcy, or upon confirmation of fraud. During the three and nine months ended September 30, 20172020, the Corporation reversed $111 million and 2016.$417 million of interest and fee income against the income statement line item in which it was originally recorded upon charge-off of the principal balance of the loan.
For the outstanding residential mortgage, home equity, direct/indirect consumer and commercial loan balances classified as nonperforming during the three and nine months ended September 30, 2020, the Corporation reversed $11 million and $29 million of interest and fee income at the time the loans were classified as nonperforming against the income statement line item in which it was originally recorded. For more information on the Corporation's nonperforming loan policies, see Note 1 – Summary of Significant Accounting Principles to the Consolidated Financial Statements of the Corporation’s 2019 Annual Report on Form 10-K.
Allowance for Credit Losses
On January 1, 2020, the Corporation adopted the new accounting standard that requires the measurement of the allowance for credit losses to be based on management’s best estimate of lifetime ECL inherent in the Corporation’s relevant financial assets. Upon adoption of the new accounting standard, the Corporation recorded a $3.3 billion, or 32 percent, increase in the allowance for credit losses on January 1, 2020, which was comprised of a net increase of $2.9 billion in the allowance for loan and lease losses and a $310 million increase in the reserve for unfunded lending commitments. The net increase in the allowance for loan and lease losses was primarily driven by a $3.1 billion increase in credit card as the Corporation now reserves for the life of these receivables. The increase in the reserve for unfunded lending commitments included $119 million in the consumer portfolio for the undrawn portion of HELOCs and $191 million in the commercial portfolio. For more information on the Corporation's credit loss accounting policies including the allowance for credit losses see Note 1 – Summary of Significant Accounting Principles.
|
| | | | | | | | | | | | | | | |
| | | | | | | | |
| | Three Months Ended September 30, 2017 |
| (Dollars in millions) | Consumer Real Estate (1) | | Credit Card and Other Consumer | | Commercial | | Total Allowance |
| Allowance for loan and lease losses, July 1 | $ | 2,309 |
| | $ | 3,386 |
| | $ | 5,180 |
| | $ | 10,875 |
|
| Loans and leases charged off | (231 | ) | | (919 | ) | | (212 | ) | | (1,362 | ) |
| Recoveries of loans and leases previously charged off | 230 |
| | 189 |
| | 43 |
| | 462 |
|
| Net charge-offs | (1 | ) | | (730 | ) | | (169 | ) | | (900 | ) |
Write-offs of PCI loans (2) | (73 | ) | | — |
| | — |
| | (73 | ) |
Provision for loan and lease losses (3) | (204 | ) | | 934 |
| | 99 |
| | 829 |
|
Other (4) | 1 |
| | (40 | ) | | 1 |
| | (38 | ) |
Allowance for loan and lease losses, September 30 | 2,032 |
| | 3,550 |
| | 5,111 |
| | 10,693 |
|
| Reserve for unfunded lending commitments, July 1 | — |
| | — |
| | 757 |
| | 757 |
|
| Provision for unfunded lending commitments | — |
| | — |
| | 5 |
| | 5 |
|
| Reserve for unfunded lending commitments, September 30 | — |
| | — |
| | 762 |
| | 762 |
|
Allowance for credit losses, September 30 | $ | 2,032 |
| | $ | 3,550 |
| | $ | 5,873 |
| | $ | 11,455 |
|
|
| | | | | | | | | | | | | | | |
| | Three Months Ended September 30, 2016 |
| Allowance for loan and lease losses, July 1 | $ | 3,209 |
| | $ | 3,334 |
| | $ | 5,294 |
| | $ | 11,837 |
|
| Loans and leases charged off | (246 | ) | | (868 | ) | | (163 | ) | | (1,277 | ) |
| Recoveries of loans and leases previously charged off | 145 |
| | 191 |
| | 53 |
| | 389 |
|
| Net charge-offs | (101 | ) | | (677 | ) | | (110 | ) | | (888 | ) |
Write-offs of PCI loans (2) | (83 | ) | | — |
| | — |
| | (83 | ) |
Provision for loan and lease losses (3) | (36 | ) | | 741 |
| | 129 |
| | 834 |
|
Other (4) | — |
| | (8 | ) | | — |
| | (8 | ) |
| Allowance for loan and lease losses, September 30 | 2,989 |
| | 3,390 |
| | 5,313 |
| | 11,692 |
|
| Reserve for unfunded lending commitments, July 1 | — |
| | — |
| | 750 |
| | 750 |
|
| Provision for unfunded lending commitments | — |
| | — |
| | 16 |
| | 16 |
|
Other (4) | — |
| | — |
| | 1 |
| | 1 |
|
| Reserve for unfunded lending commitments, September 30 | — |
| | — |
| | 767 |
| | 767 |
|
| Allowance for credit losses, September 30 | $ | 2,989 |
| | $ | 3,390 |
| | $ | 6,080 |
| | $ | 12,459 |
|
The Corporation also factored into its allowance for credit losses an estimated impact from higher-risk segments that included leveraged loans and industries such as travel and entertainment, which have been adversely impacted from the effects of COVID-19, as well as the energy sector. The Corporation also holds additional reserves for borrowers who requested deferrals that take into account their credit characteristics and payment behavior subsequent to deferral.
The allowance for credit losses at September 30, 2020 was $21.5 billion, an increase of $8.0 billion compared to January 1, 2020. The increase in the allowance for credit losses was driven by the deterioration in the economic outlook resulting from the impact of COVID-19. The increase in the allowance for credit losses was comprised of a net increase of $7.2 billion in the allowance for loan and lease losses and a $787 million increase in the reserve for unfunded lending commitments. The increase in the allowance for loan and lease losses was attributed to $415 million in the consumer real estate portfolio, $2.4 billion in the credit card and other consumer portfolio, and $4.4 billion in the commercial portfolio.
Outstanding loans and leases excluding loans accounted for under the fair value option decreased $27.2 billion in the nine months ended September 30, 2020, driven by consumer loans, which decreased $26.0 billion primarily due to a decline in credit card loans from reduced consumer spending.
|
| | | | | | | | | | | | | | | |
| | Nine Months Ended September 30, 2017 |
| Allowance for loan and lease losses, January 1 | $ | 2,750 |
| | $ | 3,229 |
| | $ | 5,258 |
| | $ | 11,237 |
|
| Loans and leases charged off | (633 | ) | | (2,819 | ) | | (570 | ) | | (4,022 | ) |
| Recoveries of loans and leases previously charged off | 520 |
| | 623 |
| | 137 |
| | 1,280 |
|
Net charge-offs (5) | (113 | ) | | (2,196 | ) | | (433 | ) | | (2,742 | ) |
Write-offs of PCI loans (2) | (161 | ) | | — |
| | — |
| | (161 | ) |
Provision for loan and lease losses (3) | (445 | ) | | 2,553 |
| | 287 |
| | 2,395 |
|
Other (4) | 1 |
| | (36 | ) | | (1 | ) | | (36 | ) |
| Allowance for loan and lease losses, September 30 | 2,032 |
| | 3,550 |
| | 5,111 |
| | 10,693 |
|
| Reserve for unfunded lending commitments, January 1 | — |
| | — |
| | 762 |
| | 762 |
|
| Provision for unfunded lending commitments | — |
| | — |
| | — |
| | — |
|
| Reserve for unfunded lending commitments, September 30 | — |
| | — |
| | 762 |
| | 762 |
|
| Allowance for credit losses, September 30 | $ | 2,032 |
| | $ | 3,550 |
| | $ | 5,873 |
| | $ | 11,455 |
|
|
| | | | | | | | | | | | | | | |
| | Nine Months Ended September 30, 2016 |
| Allowance for loan and lease losses, January 1 | $ | 3,914 |
| | $ | 3,471 |
| | $ | 4,849 |
| | $ | 12,234 |
|
| Loans and leases charged off | (928 | ) | | (2,664 | ) | | (559 | ) | | (4,151 | ) |
| Recoveries of loans and leases previously charged off | 464 |
| | 584 |
| | 162 |
| | 1,210 |
|
| Net charge-offs | (464 | ) | | (2,080 | ) | | (397 | ) | | (2,941 | ) |
Write-offs of PCI loans (2) | (270 | ) | | — |
| | — |
| | (270 | ) |
Provision for loan and lease losses (3) | (191 | ) | | 2,031 |
| | 962 |
| | 2,802 |
|
Other (4) | — |
| | (32 | ) | | (101 | ) | | (133 | ) |
| Allowance for loan and lease losses, September 30 | 2,989 |
| | 3,390 |
| | 5,313 |
| | 11,692 |
|
| Reserve for unfunded lending commitments, January 1 | — |
| | — |
| | 646 |
| | 646 |
|
| Provision for unfunded lending commitments | — |
| | — |
| | 21 |
| | 21 |
|
Other (4) | — |
| | — |
| | 100 |
| | 100 |
|
| Reserve for unfunded lending commitments, September 30 | — |
| | — |
| | 767 |
| | 767 |
|
| Allowance for credit losses, September 30 | $ | 2,989 |
| | $ | 3,390 |
| | $ | 6,080 |
| | $ | 12,459 |
|
| | | | | | | | |
(1)77Bank of America
| Includes valuation allowance associated with the PCI loan portfolio. | |
| | | | | | | | |
(2)
| Write-offs included $45 million and $80 million associated with the sale of PCI loans during the three and nine months ended September 30, 2017 compared to $11 million and $50 million for the same periods in 2016.
|
| |
(3)
| During the three and nine months ended September 30, 2017, for the PCI loan portfolio, the Corporation recorded provision expense of $12 million and $56 million compared to provision expense of $8 million and a benefit of $81 million for the same periods in 2016.
|
| |
(4)
| Primarily represents the net impact of portfolio sales, consolidations and deconsolidations, foreign currency translation adjustments, transfers to held-for-sale and certain other reclassifications. |
| |
(5)
| Includes net charge-offs of non-U.S. credit card loans, which were previously included in assets of business held for sale. During the second quarter of 2017, the Corporation sold its non-U.S. consumer credit card business. |
The changes in the allowance for credit losses, including net charge-offs and provision for loan and lease losses, are detailed in the table below.
| | | | | | | | | | | | | | | | | | | | | | | |
| | | | | | | |
| Consumer
Real Estate | | Credit Card and Other Consumer | | Commercial | | Total |
| (Dollars in millions) | Three Months Ended September 30, 2020 |
| Allowance for loan and lease losses, July 1 | $ | 833 | | | $ | 10,122 | | | $ | 8,434 | | | $ | 19,389 | |
| Loans and leases charged off | (13) | | | (810) | | | (470) | | | (1,293) | |
| Recoveries of loans and leases previously charged off | 39 | | | 220 | | | 62 | | | 321 | |
| Net charge-offs | 26 | | | (590) | | | (408) | | | (972) | |
| | | | | | | |
| Provision for loan and lease losses | (6) | | | 304 | | | 882 | | | 1,180 | |
Other (1) | 2 | | | 0 | | | (3) | | | (1) | |
| Allowance for loan and lease losses, September 30 | 855 | | | 9,836 | | | 8,905 | | | 19,596 | |
| Reserve for unfunded lending commitments, July 1 | 141 | | | 0 | | | 1,561 | | | 1,702 | |
| Provision for unfunded lending commitments | (3) | | | 0 | | | 212 | | | 209 | |
Other (1) | 0 | | | 0 | | | (1) | | | (1) | |
| Reserve for unfunded lending commitments, September 30 | 138 | | | 0 | | | 1,772 | | | 1,910 | |
| Allowance for credit losses, September 30 | $ | 993 | | | $ | 9,836 | | | $ | 10,677 | | | $ | 21,506 | |
| | | | | | | |
| Three Months Ended September 30, 2019 |
| Allowance for loan and lease losses, July 1 | $ | 719 | | | $ | 3,970 | | | $ | 4,838 | | | $ | 9,527 | |
| Loans and leases charged off | (199) | | | (1,093) | | | (220) | | | (1,512) | |
| Recoveries of loans and leases previously charged off | 439 | | | 231 | | | 31 | | | 701 | |
| Net charge-offs | 240 | | | (862) | | | (189) | | | (811) | |
| | | | | | | |
| Provision for loan and lease losses | (312) | | | 876 | | | 212 | | | 776 | |
Other (1) | (56) | | | 1 | | | (4) | | | (59) | |
| Allowance for loan and lease losses, September 30 | 591 | | | 3,985 | | | 4,857 | | | 9,433 | |
| | | | | | | |
| | | | | | | |
| Reserve for unfunded lending commitments, July 1 | 0 | | | 0 | | | 806 | | | 806 | |
| Provision for unfunded lending commitments | 0 | | | 0 | | | 3 | | | 3 | |
| Reserve for unfunded lending commitments, September 30 | 0 | | | 0 | | | 809 | | | 809 | |
| Allowance for credit losses, September 30 | $ | 591 | | | $ | 3,985 | | | $ | 5,666 | | | $ | 10,242 | |
| | | | | | | |
| (Dollars in millions) | Nine Months Ended September 30, 2020 |
| Allowance for loan and lease losses, January 1 | $ | 440 | | | $ | 7,430 | | | $ | 4,488 | | | $ | 12,358 | |
| Loans and leases charged off | (75) | | | (2,916) | | | (1,199) | | | (4,190) | |
| Recoveries of loans and leases previously charged off | 147 | | | 674 | | | 129 | | | 950 | |
| Net charge-offs | 72 | | | (2,242) | | | (1,070) | | | (3,240) | |
| Provision for loan and lease losses | 336 | | | 4,648 | | | 5,496 | | | 10,480 | |
Other (1) | 7 | | | 0 | | | (9) | | | (2) | |
| Allowance for loan and lease losses, September 30 | 855 | | | 9,836 | | | 8,905 | | | 19,596 | |
| Reserve for unfunded lending commitments, January 1 | 119 | | | 0 | | | 1,004 | | | 1,123 | |
| Provision for unfunded lending commitments | 19 | | | 0 | | | 768 | | | 787 | |
| | | | | | | |
| Reserve for unfunded lending commitments, September 30 | 138 | | | 0 | | | 1,772 | | | 1,910 | |
| Allowance for credit losses, September 30 | $ | 993 | | | $ | 9,836 | | | $ | 10,677 | | | $ | 21,506 | |
| | | | | | | |
| Nine Months Ended September 30, 2019 |
| Allowance for loan and lease losses, January 1 | $ | 928 | | | $ | 3,874 | | | $ | 4,799 | | | $ | 9,601 | |
| Loans and leases charged off | (455) | | | (3,225) | | | (630) | | | (4,310) | |
| Recoveries of loans and leases previously charged off | 852 | | | 680 | | | 89 | | | 1,621 | |
| Net charge-offs | 397 | | | (2,545) | | | (541) | | | (2,689) | |
| Provision for loan and lease losses | (621) | | | 2,655 | | | 603 | | | 2,637 | |
Other (1) | (113) | | | 1 | | | (4) | | | (116) | |
| Allowance for loan and lease losses, September 30 | 591 | | | 3,985 | | | 4,857 | | | 9,433 | |
| Reserve for unfunded lending commitments, January 1 | 0 | | | 0 | | | 797 | | | 797 | |
| Provision for unfunded lending commitments | 0 | | | 0 | | | 12 | | | 12 | |
| Reserve for unfunded lending commitments, September 30 | 0 | | | 0 | | | 809 | | | 809 | |
| Allowance for credit losses, September 30 | $ | 591 | | | $ | 3,985 | | | $ | 5,666 | | | $ | 10,242 | |
| | | | | | | |
| | | | | | | |
| | | | | | | |
| | | | | | | |
| | | | | | | |
| | | | | | | |
| | | | | | | |
| | | | | | | |
| | | | | | | |
| | | | | | | |
| | | | | | | |
| | | | | | | |
| | | | | | | |
| | | | | | | |
| | | | | | | |
| | | | | | | |
| | | | | | | |
| | | | | | | |
| | | | | | | |
(1)Primarily represents write-offs of purchased credit-impaired loans in 2019, and the net impact of portfolio sales, transfers to held-for-sale and transfers to foreclosed properties.
The table below presentsSpecific to the three months ended September 30, 2020, there has been improvement in the U.S. and global macroeconomic consensus outlooks, which resulted in an improvement in the economic outlook used to determine the allowance andfor credit losses when compared to June 30, 2020. The provision for credit losses, including unfunded lending commitments, increased $610 million to $1.4 billion for the carrying value of outstanding loans and leases by portfolio segment atthree months ended September 30, 20172020 compared to the same period in 2019 primarily driven by the reserve build in commercial for high-risk industries such as travel and December 31, 2016.entertainment, and $8.6 billion to $11.3 billion for the nine months ended September 30, 2020 compared to the same period in 2019 driven by deterioration in the economic outlook resulting from the impact of COVID-19. At September 30, 2020, the allowance for credit losses for the Corporation’s other relevant assets was insignificant.
|
| | | | | | | | | | | | | | | |
| | | | | | | | |
| Allowance and Carrying Value by Portfolio Segment | | | | | | |
| | | | | | | | |
| | September 30, 2017 |
| (Dollars in millions) | Consumer Real Estate | | Credit Card and Other Consumer | | Commercial | | Total |
Impaired loans and troubled debt restructurings (1) | |
| | |
| | |
| | |
|
Allowance for loan and lease losses (2) | $ | 369 |
| | $ | 125 |
| | $ | 232 |
| | $ | 726 |
|
Carrying value (3) | 13,122 |
| | 485 |
| | 2,498 |
| | 16,105 |
|
| Allowance as a percentage of carrying value | 2.81 | % | | 25.77 | % | | 9.29 | % | | 4.51 | % |
| Loans collectively evaluated for impairment | |
| | |
| | |
| | |
|
| Allowance for loan and lease losses | $ | 1,348 |
| | $ | 3,425 |
| | $ | 4,879 |
| | $ | 9,652 |
|
Carrying value (3, 4) | 234,764 |
| | 187,932 |
| | 470,719 |
| | 893,415 |
|
Allowance as a percentage of carrying value (4) | 0.57 | % | | 1.82 | % | | 1.04 | % | | 1.08 | % |
| Purchased credit-impaired loans | |
| | | | |
| | |
|
| Valuation allowance | $ | 315 |
| | n/a |
| | n/a |
| | $ | 315 |
|
| Carrying value gross of valuation allowance | 11,312 |
| | n/a |
| | n/a |
| | 11,312 |
|
| Valuation allowance as a percentage of carrying value | 2.78 | % | | n/a |
| | n/a |
| | 2.78 | % |
| Total | |
| | |
| | |
| | |
|
| Total allowance for loan and lease losses | $ | 2,032 |
| | $ | 3,550 |
| | $ | 5,111 |
| | $ | 10,693 |
|
Carrying value (3, 4) | 259,198 |
| | 188,417 |
| | 473,217 |
| | 920,832 |
|
Total allowance as a percentage of carrying value (4) | 0.78 | % | | 1.88 | % | | 1.08 | % | | 1.16 | % |
|
| | | | | | | | | | | | | | | |
| | December 31, 2016 |
Impaired loans and troubled debt restructurings (1) | |
| | |
| | |
| | |
|
Allowance for loan and lease losses (2) | $ | 356 |
| | $ | 189 |
| | $ | 273 |
| | $ | 818 |
|
Carrying value (3) | 15,408 |
| | 610 |
| | 3,202 |
| | 19,220 |
|
| Allowance as a percentage of carrying value | 2.31 | % | | 30.98 | % | | 8.53 | % | | 4.26 | % |
| Loans collectively evaluated for impairment | |
| | |
| | |
| | |
| Allowance for loan and lease losses | $ | 1,975 |
| | $ | 3,283 |
| | $ | 4,985 |
| | $ | 10,243 |
|
Carrying value (3, 4) | 229,094 |
| | 197,470 |
| | 449,290 |
| | 875,854 |
|
Allowance as a percentage of carrying value (4) | 0.86 | % | | 1.66 | % | | 1.11 | % | | 1.17 | % |
| Purchased credit-impaired loans | |
| | | | |
| | |
| Valuation allowance | $ | 419 |
| | n/a |
| | n/a |
| | $ | 419 |
|
| Carrying value gross of valuation allowance | 13,738 |
| | n/a |
| | n/a |
| | 13,738 |
|
| Valuation allowance as a percentage of carrying value | 3.05 | % | | n/a |
| | n/a |
| | 3.05 | % |
Less: Assets of business held for sale (5) | | | | | | | |
Allowance for loan and lease losses (6) | n/a |
| | $ | (243 | ) | | n/a |
| | $ | (243 | ) |
Carrying value (3) | n/a |
| | (9,214 | ) | | n/a |
| | (9,214 | ) |
| Total | |
| | |
| | |
| | |
| Allowance for loan and lease losses | $ | 2,750 |
| | $ | 3,229 |
| | $ | 5,258 |
| | $ | 11,237 |
|
Carrying value (3, 4) | 258,240 |
| | 188,866 |
| | 452,492 |
| | 899,598 |
|
Allowance as a percentage of carrying value (4) | 1.06 | % | | 1.71 | % | | 1.16 | % | | 1.25 | % |
| |
(1)
| Impaired loans include nonperforming commercial loans and all TDRs, including both commercial and consumer TDRs. Impaired loans exclude nonperforming consumer loans unless they are TDRs, and all consumer and commercial loans accounted for under the fair value option. |
| |
(2)
| Allowance for loan and lease losses includes $27 million related to impaired U.S. small business commercial at both September 30, 2017 and December 31, 2016.
|
| |
(3)
| Amounts are presented gross of the allowance for loan and lease losses. |
| |
(4)
| Outstanding loan and lease balances and ratios do not include loans accounted for under the fair value option of $6.3 billion and $7.1 billion at September 30, 2017 and December 31, 2016.
|
| |
(5)
| Represents allowance for loan and lease losses and loans related to the non-U.S. credit card loan portfolio, which was included in assets of business held for sale on the Consolidated Balance Sheet at December 31, 2016. During the second quarter of 2017, the Corporation sold its non-U.S. consumer credit card business.
|
| |
(6)
| Includes $61 million of allowance for loan and lease losses related to impaired loans and TDRs and $182 million related to loans collectively evaluated for impairment at December 31, 2016.
|
n/a = not applicable
NOTE 6Securitizations and Other Variable Interest Entities
The Corporation utilizes VIEs in the ordinary course of business to support its own and its customers’ financing and investing needs. For more information on the Corporation’s use of VIEs, see Note 1 – Summary of Significant Accounting Principles and Note 6 – Securitizations and Other Variable Interest Entities to the Consolidated Financial Statements of the Corporation's 2016 Annual Report on Form 10-K.
The tables in this Note present the assets, liabilities and liabilitiesmaximum loss exposure of consolidated and unconsolidated VIEs at September 30, 20172020 and December 31, 2016,2019 in situations where the Corporation has continuing involvement with transferred assets or if the Corporation otherwise has a variable interest in the VIE. The tables also presentFor more information on the Corporation’sCorporation's use of VIEs and related maximum loss exposure, at September 30, 2017see Note 1 – Summary of Significant Accounting Principles and Note 7 – Securitizations and December 31, 2016 resulting from its involvement with consolidated VIEs and unconsolidated VIEs in whichOther Variable Interest Entities to the Corporation holds a variable interest. The Corporation’s maximum loss exposure is based on the unlikely event that all Consolidated Financial Statementsof the assets in the VIEs become worthless and incorporates not only potential losses associated with assets recordedCorporation’s 2019 Annual Report on the Consolidated Balance Sheet but also potential losses associated with off-balance sheet commitments, such as unfunded liquidity commitments and other contractual arrangements. The Corporation’s maximum loss exposure does not include losses previously recognized through write-downs of assets.Form 10-K.
The Corporation invests in ABS issued by third-party VIEs with which it has no other form of involvement and enters into certain commercial lending arrangements that may also incorporate the use of VIEs, for example to hold collateral. These securities and
loans are included in Note 34 – Securities or Note 45 – Outstanding Loans and Leases. In addition, the Corporation uses VIEs such as trust preferred securities trusts in connection with its funding activities. For additional information, see Note 11 – Long-term Debtto the Consolidated Financial Statements of the Corporation's 2016 Annual Report on Form 10-K. The Corporation uses VIEs, such as common trust funds managed within Global Wealth & Investment Management (GWIM), to provide investment opportunitiesLeases and Allowance for clients. These VIEs, which are generally not consolidated by the Corporation, as applicable, are not included in the tables herein.Credit Losses.
Except as described below, theThe Corporation did not provide financial support to consolidated or unconsolidated VIEs during the nine months ended September 30, 20172020 or the year ended December 31, 20162019 that it was not previously contractually required to provide, nor does it intend to do so.
The Corporation had liquidity commitments, including written put options and collateral value guarantees, with certain unconsolidated VIEs of $918 million and $1.1 billion at September 30, 2020 and December 31, 2019.
First-lien Mortgage Securitizations
First-lien Mortgages
As part of its mortgage banking activities, the Corporation securitizes a portion of the first-lien residential mortgage loans it originates or purchases from third parties. Except as described belowin Note 10 – Commitments and in Note 7 – Representations and Warranties Obligations and Corporate GuaranteesContingencies, the Corporation does not provide guarantees or recourse to the securitization trusts other than standard representations and warranties.
The table below summarizes select information related to first-lien mortgage securitizations for the three and nine months ended September 30, 20172020 and 2016.2019.
| | | | | | | | | | | | | | | | | | | | | | | | | | | | | | | | | | | | | | | | | | | | | | | | | | | |
| | | | | | | | | | | | | | | | | | | |
| First-lien Mortgage Securitizations | | |
| | | | | | | | | | | | | | | | | | | | |
| Residential Mortgage - Agency | | Commercial Mortgage |
| | | |
| Three Months Ended September 30 | | Nine Months Ended September 30 | | | | Three Months Ended September 30 | | Nine Months Ended September 30 | | |
| (Dollars in millions) | 2020 | | 2019 | | 2020 | | 2019 | | | | 2020 | | 2019 | | 2020 | | 2019 | | |
Proceeds from loan sales (1) | $ | 1,698 | | | $ | 2,718 | | | $ | 14,625 | | | $ | 6,020 | | | | | $ | 945 | | | $ | 1,360 | | | $ | 3,237 | | | $ | 4,541 | | | |
Gains (losses) on securitizations (2) | 3 | | | 8 | | | 724 | | | 23 | | | | | 17 | | | 28 | | | 57 | | | 73 | | | |
Repurchases from securitization trusts (3) | 68 | | | 209 | | | 363 | | | 695 | | | | | 0 | | | 0 | | | 0 | | | 0 | | | |
| | | | | | | | | | | | | | | | | | | |
| | | | | | | | | | | | | | | | | | | |
|
| | | | | | | | | | | | | | | | | | | | | | | | | | | |
| | | | | | | | | | | | |
| First-lien Mortgage Securitizations | | | | | | | | | | |
| | Residential Mortgage - Agency | | Commercial Mortgage |
| | Three Months Ended September 30 | | Nine Months Ended September 30 | | Three Months Ended September 30 | | Nine Months Ended September 30 |
| (Dollars in millions) | 2017 | 2016 | | 2017 | 2016 | | 2017 | 2016 | | 2017 | 2016 |
Cash proceeds from new securitizations (1) | $ | 3,833 |
| $ | 7,131 |
| | $ | 11,791 |
| $ | 18,580 |
| | $ | 1,225 |
| $ | 1,052 |
| | $ | 2,931 |
| $ | 3,031 |
|
Gains on securitizations (2) | 40 |
| 89 |
| | 140 |
| 322 |
| | 14 |
| 27 |
| | 67 |
| 18 |
|
Repurchases from securitization trusts (3) | 609 |
| 684 |
| | 2,083 |
| 2,058 |
| | — |
| — |
| | — |
| — |
|
| |
(1)
| The Corporation transfers residential mortgage loans to securitizations sponsored by the GSEs or Government National Mortgage Association (GNMA) in the normal course of business and receives RMBS in exchange which may then be sold into the market to third-party investors for cash proceeds. |
| |
(2)
| A majority of the first-lien residential and commercial mortgage loans securitized are initially classified as LHFS and accounted for under the fair value option. Gains recognized on these LHFS prior to securitization, which totaled $63(2)A majority of the first-lien residential mortgage loans securitized are initially classified as LHFS and accounted for under the fair value option. Gains recognized on these LHFS prior to securitization, which totaled $44 million and $105 million, and $195 million, net of hedges, during the three and nine months ended September 30, 2017 compared to $149 million and $349 million for the same periods in 2016, are not included in the table above. |
| |
(3)
| The Corporation may have the option to repurchase delinquent loans out of securitization trusts, which reduces the amount of servicing advances it is required to make. The Corporation may also repurchase loans from securitization trusts to perform modifications. Repurchased loans include FHA-insured mortgages collateralizing GNMA securities. |
In addition to cash proceeds as reported in the table above, the Corporation received securities with an initial fair value of $770 million and $1.3 billion in connection with first-lien mortgage securitizations for the three and nine months ended September 30, 20172020 compared to $1.2 billion$19 million and $3.1 billion$38 million for the same periods in 2016. The receipt of these securities represents non-cash operating and investing activities and, accordingly, is2019, are not reflectedincluded in the Consolidated Statementtable above.
(3)The Corporation may have the option to repurchase delinquent loans out of Cash Flows. Substantially allsecuritization trusts, which reduces the amount of these securities were initially classified as Level 2 assets within the fair value hierarchy. During the three and nine months ended September 30, 2017 and 2016, there were no changesservicing advances it is required to the initial classification.make. The Corporation may also repurchase loans from securitization trusts to perform modifications. Repurchased loans include FHA-insured mortgages collateralizing GNMA securities.
The Corporation recognizes consumer MSRsmortgage servicing rights (MSRs) from the sale or securitization of consumer real estate loans. The unpaid principal balance of loans serviced for investors, including residential mortgage and home equity loans, totaled $289.3$172.5 billion and $355.0$201.3 billion at September 30, 20172020 and 2016.2019. Servicing fee and ancillary fee income on serviced loans was $213$101 million and
$691 $353 million during the three and nine months ended September 30, 20172020 compared to $286$144 million and $887$436 million for the same periods in 2016.2019. Servicing advances on serviced loans, including loans serviced for others and loans held for investment, were $4.7$2.1 billion and $6.2$2.4 billion at September 30, 20172020 and December 31, 2016.2019. For more information on MSRs, see Note 14 – Fair Value Measurements.
During the three and nine months ended September 30, 2016,2019, the Corporation deconsolidated agency residential mortgage securitization vehiclestrusts with total assets of $326$65 million and $3.1 billion following$1.2 billion. During the nine months ended September 30, 2020, the Corporation completed the sale of retained interests to third parties, after which$9.3 billion of consumer real estate loans through GNMA loan securitizations. As part of the securitizations, the Corporation no longer hadretained $8.4 billion of MBS, which are classified as debt securities carried at fair value on the unilateral ability to liquidate the vehicles. GainsConsolidated Balance Sheet. Total gains on saleloan sales of $11$704 millionand$125 million related to these deconsolidations were recorded in other income in the Consolidated Statement of Income. No deconsolidations of agency residential mortgage securitization vehicles occurred during the three and nine months ended September 30, 2017.
The following table summarizes select information related to first-lien mortgage securitization trusts in which the Corporation held a variable interest at September 30, 20172020 and December 31, 2016.2019.
|
| | | | | | | | | | | | | | | | | | | | | | | | | | | | | | | | | | |
| | | | | | | | | | | | | | | |
| First-lien Mortgage VIEs | | | | | | | | | | | |
| | Residential Mortgage | | |
| |
|
| | |
| |
| | Non-agency | | |
| |
|
| | Agency | | Prime | | Subprime | | Alt-A | | Commercial Mortgage |
| (Dollars in millions) | September 30
2017 | December 31
2016 | | September 30
2017 | December 31
2016 | | September 30
2017 | December 31
2016 | | September 30
2017 | December 31
2016 | | September 30
2017 | December 31
2016 |
| Unconsolidated VIEs | |
| |
| | |
| |
| | |
| |
| | |
| |
| | |
| |
|
Maximum loss exposure (1) | $ | 19,585 |
| $ | 22,661 |
| | $ | 623 |
| $ | 757 |
| | $ | 2,677 |
| $ | 2,750 |
| | $ | 464 |
| $ | 560 |
| | $ | 420 |
| $ | 344 |
|
| On-balance sheet assets | |
| |
| | |
| |
| | |
| |
| | |
| |
| | |
| |
|
Senior securities held (2): | |
| |
| | |
| |
| | |
| |
| | |
| |
| | |
| |
|
| Trading account assets | $ | 300 |
| $ | 1,399 |
| | $ | 18 |
| $ | 20 |
| | $ | 51 |
| $ | 112 |
| | $ | 35 |
| $ | 118 |
| | $ | 58 |
| $ | 51 |
|
| Debt securities carried at FV | 15,827 |
| 17,620 |
| | 359 |
| 441 |
| | 2,226 |
| 2,235 |
| | 318 |
| 305 |
| | — |
| — |
|
| Held-to-maturity securities | 3,447 |
| 3,630 |
| | — |
| — |
| | — |
| — |
| | — |
| — |
| | 160 |
| 64 |
|
Subordinate securities held (2): | |
| |
| | |
| |
| | |
| |
| | |
| |
| | |
| |
|
| Trading account assets | — |
| — |
| | 1 |
| 1 |
| | 22 |
| 23 |
| | 1 |
| 1 |
| | 11 |
| 14 |
|
| Debt securities carried at FV | — |
| — |
| | 6 |
| 8 |
| | 2 |
| 2 |
| | 20 |
| 23 |
| | 48 |
| 54 |
|
| Held-to-maturity securities | — |
| — |
| | — |
| — |
| | — |
| — |
| | — |
| — |
| | — |
| 13 |
|
| Residual interests held | — |
| — |
| | — |
| — |
| | — |
| — |
| | — |
| — |
| | 25 |
| 25 |
|
All other assets (3) | 11 |
| 12 |
| | 23 |
| 28 |
| | — |
| — |
| | 90 |
| 113 |
| | — |
| — |
|
| Total retained positions | $ | 19,585 |
| $ | 22,661 |
| | $ | 407 |
| $ | 498 |
| | $ | 2,301 |
| $ | 2,372 |
| | $ | 464 |
| $ | 560 |
| | $ | 302 |
| $ | 221 |
|
Principal balance outstanding (4) | $ | 242,353 |
| $ | 265,332 |
| | $ | 11,152 |
| $ | 16,280 |
| | $ | 10,993 |
| $ | 19,373 |
| | $ | 29,550 |
| $ | 35,788 |
| | $ | 24,945 |
| $ | 23,826 |
|
| | | | | | | | | | | | | | | |
| Consolidated VIEs | |
| |
| | |
| |
| | |
| |
| | |
| |
| | |
| |
|
Maximum loss exposure (1) | $ | 15,040 |
| $ | 18,084 |
| | $ | 337 |
| $ | — |
| | $ | — |
| $ | — |
| | $ | — |
| $ | 25 |
| | $ | — |
| $ | — |
|
| On-balance sheet assets | |
| |
| | |
| |
| | |
| |
| | |
| |
| | |
| |
|
Trading account assets | $ | 37 |
| $ | 434 |
| | $ | 330 |
| $ | — |
| | $ | — |
| $ | — |
| | $ | — |
| $ | 99 |
| | $ | — |
| $ | — |
|
| Loans and leases | 14,762 |
| 17,223 |
| | — |
| — |
| | — |
| — |
| | — |
| — |
| | — |
| — |
|
| All other assets | 241 |
| 427 |
| | 7 |
| — |
| | — |
| — |
| | — |
| — |
| | — |
| — |
|
| Total assets | $ | 15,040 |
| $ | 18,084 |
| | $ | 337 |
| $ | — |
| | $ | — |
| $ | — |
| | $ | — |
| $ | 99 |
| | $ | — |
| $ | — |
|
| On-balance sheet liabilities | |
| |
| | |
| |
| | |
| |
| | |
| |
| | |
| |
|
| Long-term debt | $ | — |
| $ | — |
| | $ | — |
| $ | — |
| | $ | — |
| $ | — |
| | $ | — |
| $ | 74 |
| | $ | — |
| $ | — |
|
| All other liabilities | 2 |
| 4 |
| | — |
| — |
| | — |
| — |
| | — |
| — |
| | — |
| — |
|
| Total liabilities | $ | 2 |
| $ | 4 |
| | $ | — |
| $ | — |
| | $ | — |
| $ | — |
| | $ | — |
| $ | 74 |
| | $ | — |
| $ | — |
|
| | | | | | | | |
(1)79Bank of America
| Maximum loss exposure includes obligations under loss-sharing reinsurance and other arrangements for non-agency residential mortgage and commercial mortgage securitizations, but excludes the reserve for representations and warranties obligations and corporate guarantees and also excludes servicing advances and other servicing rights and obligations. For additional information, see Note 7 – Representations and Warranties Obligations and Corporate Guaranteesand Note 14 – Fair Value Measurements.
| |
| | | | | | | | |
(2)
| As a holder of these securities, the Corporation receives scheduled principal and interest payments. During the three and nine months ended September 30, 2017, the Corporation recognized $0 and $16 million compared to $1 million and $5 million for the same periods in 2016 of credit-related impairment losses in earnings on those securities classified as AFS debt securities. During the three and nine months ended September 30, 2017 and 2016, the Corporation recognized no credit-related impairment losses in earnings on those securities classified as HTM.
|
Not included in the table above are all other assets of $147 million and $189 million, representing the unpaid principal balance of mortgage loans eligible for repurchase from unconsolidated residential mortgage securitization vehicles, principally guaranteed by GNMA, and all other liabilities of $147 million and $189 million, representing the principal amount that would be payable to the securitization vehicles if the Corporation was to exercise the repurchase option, at September 30, 2017 and December 31, 2016.
| | |
(4)
| Principal balance outstanding includes loans where the Corporation was the transferor to securitization vehicles with which it has continuing involvement, which may include servicing the loans. |
| | | | | | | | | | | | | | | | | | | | | | | | | | | | | | | | | | | | | | | | | | | | |
| | | | | | | | | | | | | | |
| First-lien Mortgage VIEs | | | | | | | | | | | |
| | | | |
| Residential Mortgage | | | |
| | | | | Non-agency | | | |
| | Agency | | Prime | | Subprime | | Alt-A | | Commercial Mortgage |
| |
| (Dollars in millions) | Sep 30
2020 | December 31
2019 | | Sep 30
2020 | December 31
2019 | | Sep 30
2020 | December 31
2019 | | Sep 30
2020 | December 31
2019 | | Sep 30
2020 | December 31
2019 |
| Unconsolidated VIEs | | | | | | | | | | | | | | |
Maximum loss exposure (1) | $ | 14,199 | | $ | 12,554 | | | $ | 286 | | $ | 340 | | | $ | 1,440 | | $ | 1,622 | | | $ | 167 | | $ | 98 | | | $ | 1,138 | | $ | 1,036 | |
| On-balance sheet assets | | | | | | | | | | | | | | |
| Senior securities: | | | | | | | | | | | | | | |
| Trading account assets | $ | 152 | | $ | 627 | | | $ | 9 | | $ | 5 | | | $ | 8 | | $ | 54 | | | $ | 102 | | $ | 24 | | | $ | 60 | | $ | 65 | |
| Debt securities carried at fair value | 8,337 | | 6,392 | | | 156 | | 193 | | | 1,071 | | 1,178 | | | 64 | | 72 | | | 0 | | 0 | |
| Held-to-maturity securities | 5,710 | | 5,535 | | | 0 | | 0 | | | 0 | | 0 | | | 0 | | 0 | | | 887 | | 809 | |
| All other assets | 0 | | 0 | | | 6 | | 2 | | | 31 | | 49 | | | 1 | | 2 | | | 61 | | 38 | |
| Total retained positions | $ | 14,199 | | $ | 12,554 | | | $ | 171 | | $ | 200 | | | $ | 1,110 | | $ | 1,281 | | | $ | 167 | | $ | 98 | | | $ | 1,008 | | $ | 912 | |
Principal balance outstanding (2) | $ | 144,735 | | $ | 160,226 | | | $ | 6,555 | | $ | 7,268 | | | $ | 6,928 | | $ | 8,594 | | | $ | 17,478 | | $ | 19,878 | | | $ | 57,832 | | $ | 60,129 | |
| | | | | | | | | | | | | | |
| Consolidated VIEs | | | | | | | | | | | | | | |
Maximum loss exposure (1) | $ | 611 | | $ | 10,857 | | | $ | 0 | | $ | 5 | | | $ | 63 | | $ | 44 | | | $ | 0 | | $ | 0 | | | $ | 0 | | $ | 0 | |
| On-balance sheet assets | | | | | | | | | | | | | | |
| Trading account assets | $ | 611 | | $ | 780 | | | $ | 86 | | $ | 116 | | | $ | 260 | | $ | 149 | | | $ | 0 | | $ | 0 | | | $ | 0 | | $ | 0 | |
| Loans and leases, net | 0 | | 9,917 | | | 0 | | 0 | | | 0 | | 0 | | | 0 | | 0 | | | 0 | | 0 | |
| | | | | | | | | | | | | | |
| | | | | | | | | | | | | | |
| All other assets | 0 | | 161 | | | 0 | | 0 | | | 2 | | 0 | | | 0 | | 0 | | | 0 | | 0 | |
| Total assets | $ | 611 | | $ | 10,858 | | | $ | 86 | | $ | 116 | | | $ | 262 | | $ | 149 | | | $ | 0 | | $ | 0 | | | $ | 0 | | $ | 0 | |
| | | | | | | | | | | | | | |
| | | | | | | | | | | | | | |
| | | | | | | | | | | | | | |
| | | | | | | | | | | | | | |
| Total liabilities | $ | 0 | | $ | 4 | | | $ | 86 | | $ | 111 | | | $ | 199 | | $ | 105 | | | $ | 0 | | $ | 0 | | | $ | 0 | | $ | 0 | |
(1)Maximum loss exposure includes obligations under loss-sharing reinsurance and other arrangements for non-agency residential mortgage and commercial mortgage securitizations, but excludes the reserve for representations and warranties obligations and corporate guarantees and also excludes servicing advances and other servicing rights and obligations. For more information, see Note 10 – Commitments and Contingencies and Note 14 – Fair Value Measurements.
(2)Principal balance outstanding includes loans where the Corporation was the transferor to securitization VIEs with which it has continuing involvement, which may include servicing the loans.
Other Asset-backed Securitizations
The following table below summarizes select information related to home equity, loan, credit card and other asset-backed VIEs in which the Corporation held a variable interest at September 30, 20172020 and December 31, 2016.2019.
| | | | | | | | | | | | | | | | | | | | | | | | | | | | | | | | | | | | | | |
| | | | | | | | | | | | | | |
| Home Equity Loan, Credit Card and Other Asset-backed VIEs | | | | | | | |
| | | | | | | | | | | |
| | Home Equity (1) | | Credit Card (2) | | Resecuritization Trusts | | Municipal Bond Trusts | | |
| |
| | | | |
| (Dollars in millions) | Sep 30
2020 | December 31
2019 | | Sep 30
2020 | December 31
2019 | | Sep 30
2020 | December 31
2019 | | Sep 30
2020 | December 31
2019 | | | |
| Unconsolidated VIEs | | | | | | | | | | | | | | |
| Maximum loss exposure | $ | 329 | | $ | 412 | | | $ | 0 | | $ | 0 | | | $ | 9,201 | | $ | 7,526 | | | $ | 3,320 | | $ | 3,701 | | | | |
| On-balance sheet assets | | | | | | | | | | | | | | |
Securities (3): | | | | | | | | | | | | | | |
| Trading account assets | $ | 0 | | $ | 0 | | | $ | 0 | | $ | 0 | | | $ | 1,009 | | $ | 2,188 | | | $ | 3 | | $ | 0 | | | | |
| Debt securities carried at fair value | 9 | | 11 | | | 0 | | 0 | | | 2,990 | | 1,126 | | | 0 | | 0 | | | | |
| Held-to-maturity securities | 0 | | 0 | | | 0 | | 0 | | | 5,202 | | 4,212 | | | 0 | | 0 | | | | |
| | | | | | | | | | | | | | |
| | | | | | | | | | | | | | |
| Total retained positions | $ | 9 | | $ | 11 | | | $ | 0 | | $ | 0 | | | $ | 9,201 | | $ | 7,526 | | | $ | 3 | | $ | 0 | | | | |
| Total assets of VIEs | $ | 804 | | $ | 1,023 | | | $ | 0 | | $ | 0 | | | $ | 18,811 | | $ | 21,234 | | | $ | 3,835 | | $ | 4,395 | | | | |
| | | | | | | | | | | | | | |
| Consolidated VIEs | | | | | | | | | | | | | | |
| Maximum loss exposure | $ | 62 | | $ | 64 | | | $ | 14,770 | | $ | 17,915 | | | $ | 265 | | $ | 54 | | | $ | 1,246 | | $ | 2,656 | | | | |
| On-balance sheet assets | | | | | | | | | | | | | | |
| Trading account assets | $ | 0 | | $ | 0 | | | $ | 0 | | $ | 0 | | | $ | 265 | | $ | 73 | | | $ | 1,206 | | $ | 2,480 | | | | |
| | | | | | | | | | | | | | |
| Loans and leases | 122 | | 122 | | | 21,793 | | 26,985 | | | 0 | | 0 | | | 0 | | 0 | | | | |
| Allowance for loan and lease losses | 15 | | (2) | | | (1,824) | | (800) | | | 0 | | 0 | | | 0 | | 0 | | | | |
| | | | | | | | | | | | | | |
| All other assets | 3 | | 3 | | | 93 | | 119 | | | 0 | | 0 | | | 40 | | 176 | | | | |
| Total assets | $ | 140 | | $ | 123 | | | $ | 20,062 | | $ | 26,304 | | | $ | 265 | | $ | 73 | | | $ | 1,246 | | $ | 2,656 | | | | |
| On-balance sheet liabilities | | | | | | | | | | | | | | |
| Short-term borrowings | $ | 0 | | $ | 0 | | | $ | 0 | | $ | 0 | | | $ | 0 | | $ | 0 | | | $ | 714 | | $ | 2,175 | | | | |
| Long-term debt | 78 | | 64 | | | 5,273 | | 8,372 | | | 0 | | 19 | | | 0 | | 0 | | | | |
| All other liabilities | 0 | | 0 | | | 19 | | 17 | | | 0 | | 0 | | | 0 | | 0 | | | | |
| Total liabilities | $ | 78 | | $ | 64 | | | $ | 5,292 | | $ | 8,389 | | | $ | 0 | | $ | 19 | | | $ | 714 | | $ | 2,175 | | | | |
|
| | | | | | | | | | | | | | | | | | | | | | | | | | | |
| | | | | | | | | | | | |
| Home Equity Loan, Credit Card and Other Asset-backed VIEs | | | | |
| | Home Equity Loan (1) | | Credit Card (2, 3) | | Resecuritization Trusts | | Municipal Bond Trusts |
| (Dollars in millions) | September 30
2017 | December 31
2016 | | September 30
2017 | December 31
2016 | | September 30
2017 | December 31
2016 | | September 30
2017 | December 31
2016 |
| Unconsolidated VIEs | |
| |
| | | | | |
| |
| | |
| |
|
| Maximum loss exposure | $ | 1,632 |
| $ | 2,732 |
| | $ | — |
| $ | — |
| | $ | 9,107 |
| $ | 9,906 |
| | $ | 1,566 |
| $ | 1,635 |
|
| On-balance sheet assets | |
| |
| | | | | |
| |
| | |
| |
|
Senior securities held (4): | |
| |
| | | | | |
| |
| | |
| |
|
| Trading account assets | $ | — |
| $ | — |
| | $ | — |
| $ | — |
| | $ | 1,246 |
| $ | 902 |
| | $ | 9 |
| $ | — |
|
| Debt securities carried at fair value | 39 |
| 46 |
| | — |
| — |
| | 1,891 |
| 2,338 |
| | — |
| — |
|
| Held-to-maturity securities | — |
| — |
| | — |
| — |
| | 5,866 |
| 6,569 |
| | — |
| — |
|
Subordinate securities held (4): | |
| |
| | | | | |
| |
| | |
| |
|
| Trading account assets | — |
| — |
| | — |
| — |
| | 30 |
| 27 |
| | — |
| — |
|
| Debt securities carried at fair value | — |
| — |
| | — |
| — |
| | 74 |
| 70 |
| | — |
| — |
|
| Total retained positions | $ | 39 |
| $ | 46 |
| | $ | — |
| $ | — |
| | $ | 9,107 |
| $ | 9,906 |
| | $ | 9 |
| $ | — |
|
Total assets of VIEs (5) | $ | 2,598 |
| $ | 4,274 |
| | $ | — |
| $ | — |
| | $ | 21,822 |
| $ | 22,155 |
| | $ | 2,250 |
| $ | 2,406 |
|
| | | | | | | | | | | | |
| Consolidated VIEs | |
| |
| | | | | |
| |
| | |
| |
|
| Maximum loss exposure | $ | 119 |
| $ | 149 |
| | $ | 22,937 |
| $ | 25,859 |
| | $ | 343 |
| $ | 420 |
| | $ | 1,215 |
| $ | 1,442 |
|
| On-balance sheet assets | |
| |
| | | | | |
| |
| | |
| |
|
| Trading account assets | $ | — |
| $ | — |
| | $ | — |
| $ | — |
| | $ | 864 |
| $ | 1,428 |
| | $ | 1,214 |
| $ | 1,454 |
|
| Loans and leases | 192 |
| 244 |
| | 32,281 |
| 35,135 |
| | — |
| — |
| | — |
| — |
|
| Allowance for loan and lease losses | (13 | ) | (16 | ) | | (1,002 | ) | (1,007 | ) | | — |
| — |
| | — |
| — |
|
| All other assets | 6 |
| 7 |
| | 276 |
| 793 |
| | — |
| — |
| | 1 |
| — |
|
| Total assets | $ | 185 |
| $ | 235 |
| | $ | 31,555 |
| $ | 34,921 |
| | $ | 864 |
| $ | 1,428 |
| | $ | 1,215 |
| $ | 1,454 |
|
| On-balance sheet liabilities | |
| |
| | | | | |
| |
| | |
| |
|
| Short-term borrowings | $ | — |
| $ | — |
| | $ | — |
| $ | — |
| | $ | — |
| $ | — |
| | $ | 122 |
| $ | 348 |
|
| Long-term debt | 82 |
| 108 |
| | 8,598 |
| 9,049 |
| | 521 |
| 1,008 |
| | — |
| 12 |
|
| All other liabilities | — |
| — |
| | 20 |
| 13 |
| | — |
| — |
| | — |
| — |
|
| Total liabilities | $ | 82 |
| $ | 108 |
| | $ | 8,618 |
| $ | 9,062 |
| | $ | 521 |
| $ | 1,008 |
| | $ | 122 |
| $ | 360 |
|
| |
(1)(2)At September 30, 2020 and December 31, 2019, loans and leases in the consolidated credit card trust included $9.0 billion and $10.5 billion of seller’s interest. (3)The retained senior securities were valued using quoted market prices or observable market inputs (Level 2 of the fair value hierarchy). | For unconsolidated home equity loan VIEs, the maximum loss exposure includes outstanding trust certificates issued by trusts in rapid amortization, net of recorded reserves. For both consolidated and unconsolidated home equity loan VIEs, the maximum loss exposure excludes the reserve for representations and warranties obligations and corporate guarantees. For additional information, see Note 7 – Representations and Warranties Obligations and Corporate Guarantees.
|
| |
(2)
| At September 30, 2017 and December 31, 2016, loans and leases in the consolidated credit card trust included $15.3 billion and $17.6 billion of seller’s interest.
|
| |
(3)
| At September 30, 2017 and December 31, 2016, all other assets in the consolidated credit card trust included restricted cash, certain short-term investments, and unbilled accrued interest and fees.
|
| |
(4)
| The retained senior and subordinate securities were valued using quoted market prices or observable market inputs (Level 2 of the fair value hierarchy). |
| |
(5)
| Total assets include loans the Corporation transferred with which it has continuing involvement, which may include servicing the loan. |
Home Equity Loans
The Corporation retains interests, primarily senior securities, in home equity securitization trusts to which it transferred home equity loans. These retained interests include senior and subordinate securities and residual interests. In addition, the Corporation may be obligated to
provide subordinate funding to the trusts during a rapid amortization event. This obligation is included in the maximum loss exposure in the table above. The charges that will ultimately be recorded as a result of the rapid amortization
events depend on the undrawn available credit onportion of the home equity lines,HELOCs, performance of the loans, the amount of subsequent draws and the timing of related cash flows.
Credit Card Securitizations
The Corporation securitizes originated and purchased credit card loans. The Corporation’s continuing involvement with the securitization trust includes servicing the receivables, retaining an undivided interest (seller’s interest) in the receivables, and holding certain retained interests including senior and subordinate securities, subordinate interests in accrued interest and fees on the securitized receivables and cash reserve accounts.
ForDuring the nine months ended September 30, 2017, $3.12019, there were $1.3 billion of new senior debt securities issued to third-party investors from the credit card securitization trust. There were 0 new senior debt securities issued to third-party investors from the credit card securitization trust compared to $750 million forduring the same period in 2016.
nine months ended September 30, 2020.At September 30, 20172020 and December 31, 2016,2019, the Corporation held subordinate securities issued by the credit card securitization trust with a notional principal amount of $7.4$6.9 billion and $7.5$7.4 billion. These securities serve as a form of credit enhancement to the senior debt securities and have a stated interest rate of zero percent.0 percent. There were $500$202 million of these subordinate securities issued forby the credit card securitization trust during the nine months ended September 30, 2017 compared to $121 million for2019. There were 0 subordinate securities issued by the same period in 2016.credit card securitization trust during the nine months ended September 30, 2020.
Resecuritization Trusts
The Corporation transfers securities, typically MBS, into resecuritization vehiclesVIEs generally at the request of customers seeking securities with specific characteristics. Generally, there are no significant ongoing activities performed in a resecuritization trust, and no single investor has the unilateral ability to liquidate the trust.
The Corporation resecuritized $5.0$8.3 billion and $20.1$26.4 billionof securities during the three and nine months ended September 30, 20172020 compared to $5.6$5.2 billion and $20.3$13.7 billion for the same periods in 2016.2019. Securities transferred into
resecuritization vehicles during the three and nine months ended September 30, 2017 and 2016VIEs were measured at fair value with changes in fair value recorded in trading account profitsmarket making and similar activities prior to the resecuritization and, accordingly, no gain or loss on sale was recorded. Resecuritization proceeds included securities with an initialSecurities received from the resecuritization VIEs were recognized at their fair
value of $855$598 million and $2.7$5.5 billion during the three and nine months ended September 30, 20172020 compared to $430$750 million and $2.6$3.5 billion for the same periods in 2016.2019, of which substantially all of the securities in the prior-year period were classified as trading account assets. All of the securities received as resecuritization proceeds during the three months ended September 30, 2020 were classified as trading account assets. Of the securities received as resecuritizations proceeds during the nine months ended September 30, 2020, $1.8 billion, $2.1 billion and $1.7 billion were classified as trading account assets, debt securities carried at fair value and HTM securities, respectively. Substantially all of the trading account securities and debt securities carried at fair value were categorized as Level 2 within the fair value hierarchy.
Municipal Bond Trusts
The Corporation administers municipal bond trusts that hold highly-rated, long-term, fixed-rate municipal bonds. The trusts obtain financing by issuing floating-rate trust certificates that reprice on a weekly or other short-term basis to third-party investors.
The Corporation’s liquidity commitments to unconsolidated municipal bond trusts, including those for which the Corporation was transferor, totaled $1.6$3.3 billion and $3.7 billion at both September 30, 20172020 and December 31, 2016.2019. The weighted-average remaining life of bonds held in the trusts at September 30, 20172020 was 5.66.9 years. There were no materialsignificant write-downs or downgrades of assets or issuers during the nine months ended September 30, 20172020 and 2016.2019.
Other Variable Interest Entities
The table below summarizes select information related to other VIEs in which the Corporation held a variable interest at September 30, 20172020 and December 31, 2016.2019.
| | | | | | | | | | | | | | | | | | | | | | | | | | | | | | | | | | | |
| | | | | | | | | | | |
| Other VIEs | | | | | | | | |
| |
| | | |
| Consolidated | | Unconsolidated | | Total | | Consolidated | | Unconsolidated | | Total |
| | | | | | | | | | | |
| (Dollars in millions) | September 30, 2020 | | December 31, 2019 |
| Maximum loss exposure | $ | 4,162 | | | $ | 26,192 | | | $ | 30,354 | | | $ | 4,055 | | | $ | 26,326 | | | $ | 30,381 | |
| On-balance sheet assets | | | | | | | | | | | |
| Trading account assets | $ | 2,064 | | | $ | 601 | | | $ | 2,665 | | | $ | 2,213 | | | $ | 549 | | | $ | 2,762 | |
| Debt securities carried at fair value | 0 | | | 74 | | | 74 | | | 0 | | | 74 | | | 74 | |
| Loans and leases | 2,179 | | | 3,036 | | | 5,215 | | | 1,810 | | | 3,214 | | | 5,024 | |
| Allowance for loan and lease losses | (3) | | | (182) | | | (185) | | | (2) | | | (38) | | | (40) | |
| | | | | | | | | | | |
| | | | | | | | | | | |
| All other assets | 53 | | | 21,957 | | | 22,010 | | | 81 | | | 20,547 | | | 20,628 | |
| Total | $ | 4,293 | | | $ | 25,486 | | | $ | 29,779 | | | $ | 4,102 | | | $ | 24,346 | | | $ | 28,448 | |
| On-balance sheet liabilities | | | | | | | | | | | |
| | | | | | | | | | | |
| Short-term borrowings | $ | 25 | | | $ | 0 | | | $ | 25 | | | $ | 0 | | | $ | 0 | | | $ | 0 | |
| Long-term debt | 106 | | | 0 | | | 106 | | | 46 | | | 0 | | | 46 | |
| All other liabilities | 0 | | | 5,383 | | | 5,383 | | | 2 | | | 5,087 | | | 5,089 | |
| Total | $ | 131 | | | $ | 5,383 | | | $ | 5,514 | | | $ | 48 | | | $ | 5,087 | | | $ | 5,135 | |
| Total assets of VIEs | $ | 4,293 | | | $ | 105,922 | | | $ | 110,215 | | | $ | 4,102 | | | $ | 98,491 | | | $ | 102,593 | |
|
| | | | | | | | | | | | | | | | | | | | | | | |
| | | | | | | | | | | | |
| Other VIEs | | | | | | | | |
| | September 30, 2017 | | December 31, 2016 |
| (Dollars in millions) | Consolidated | | Unconsolidated | | Total | | Consolidated | | Unconsolidated | | Total |
| Maximum loss exposure | $ | 5,398 |
| | $ | 19,676 |
| | $ | 25,074 |
| | $ | 6,114 |
| | $ | 17,754 |
| | $ | 23,868 |
|
| On-balance sheet assets | |
| | |
| | |
| | |
| | |
| | |
|
| Trading account assets | $ | 2,697 |
| | $ | 303 |
| | $ | 3,000 |
| | $ | 2,358 |
| | $ | 233 |
| | $ | 2,591 |
|
| Debt securities carried at fair value | — |
| | 197 |
| | 197 |
| | — |
| | 122 |
| | 122 |
|
| Loans and leases | 2,787 |
| | 4,200 |
| | 6,987 |
| | 3,399 |
| | 3,249 |
| | 6,648 |
|
| Allowance for loan and lease losses | (8 | ) | | (33 | ) | | (41 | ) | | (9 | ) | | (24 | ) | | (33 | ) |
| Loans held-for-sale | 66 |
| | 843 |
| | 909 |
| | 188 |
| | 464 |
| | 652 |
|
| All other assets | 131 |
| | 13,717 |
| | 13,848 |
| | 369 |
| | 13,156 |
| | 13,525 |
|
| Total | $ | 5,673 |
| | $ | 19,227 |
| | $ | 24,900 |
| | $ | 6,305 |
| | $ | 17,200 |
| | $ | 23,505 |
|
| On-balance sheet liabilities | |
| | |
| | |
| | |
| | |
| | |
|
Long-term debt (1) | $ | 256 |
| | $ | — |
| | $ | 256 |
| | $ | 395 |
| | $ | — |
| | $ | 395 |
|
| All other liabilities | 32 |
| | 3,146 |
| | 3,178 |
| | 24 |
| | 2,959 |
| | 2,983 |
|
| Total | $ | 288 |
| | $ | 3,146 |
| | $ | 3,434 |
| | $ | 419 |
| | $ | 2,959 |
| | $ | 3,378 |
|
| Total assets of VIEs | $ | 5,673 |
| | $ | 69,817 |
| | $ | 75,490 |
| | $ | 6,305 |
| | $ | 62,269 |
| | $ | 68,574 |
|
| |
(1)
| Includes $13 million and $229 million of long-term debt at September 30, 2017 and December 31, 2016 issued by other consolidated VIEs, which has recourse to the general credit of the Corporation.
|
Customer VehiclesVIEs
Customer vehiclesVIEs include credit-linked, equity-linked and commodity-linked note vehicles,VIEs, repackaging vehicles,VIEs and asset acquisition vehicles,VIEs, which are typically created on behalf of customers who wish to obtain market or credit exposure to a specific company, index, commodity or financial instrument.
The Corporation’s maximum loss exposure to consolidated and unconsolidated customer vehiclesVIEs totaled $2.4 billion and $2.9$2.2 billion at September 30, 20172020 and December 31, 2016,2019, including the notional amount of derivatives to which the Corporation is a counterparty, net of losses previously recorded, and the Corporation’s investment, if any, in securities issued by the vehicles. The Corporation also had liquidity commitments, including written put options and collateral value guarantees, with certain unconsolidated vehicles of $55 million and $323 million at September 30, 2017 and December 31, 2016, that are included in the table above.VIEs.
Collateralized Debt Obligation VehiclesVIEs
The Corporation receives fees for structuring CDO vehicles,VIEs, which hold diversified pools of fixed-income securities, typically corporate debt or ABS, which the CDO vehiclesVIEs fund by issuing multiple tranches of debt and equity securities. CDOs are generally managed by third-party portfolio managers. The Corporation typically transfers assets to these CDOs, holds securities issued by the CDOs and may be a derivative counterparty to the CDOs. The Corporation’s maximum loss exposure to consolidated and unconsolidated CDOs totaled $428$252 million and $430$304 million at September 30, 20172020 and December 31, 2016.2019.
Investment VehiclesVIEs
The Corporation sponsors, invests in or provides financing, which may be in connection with the sale of assets, to a variety of investment vehiclesVIEs that hold loans, real estate, debt securities or other financial instruments and are designed to provide the desired investment profile to investors or the Corporation. At September 30, 20172020 and December 31, 2016,2019, the Corporation’s consolidated investment vehiclesVIEs had total assets of $683$552 million and $846 million.$104 million. The Corporation also held investments in unconsolidated vehiclesVIEs with total assets of $24.1$37.3 billion and $17.3$32.4 billion at September 30, 20172020 and December 31, 2016.2019. The Corporation’s maximum loss exposure associated with both consolidated and unconsolidated investment vehiclesVIEs totaled $6.4$5.9 billion and $5.1$6.4 billion at September 30, 20172020 and December 31, 20162019 comprised primarily of on-balance sheet assets less non-recourse liabilities.
In prior periods, the Corporation transferred servicing advance receivables to independent third parties in connection with the sale of MSRs. Portions of the receivables were transferred into unconsolidated securitization trusts. The Corporation retained senior interests in such receivables with a maximum loss exposure and funding obligation of $90 million and $150 million, including a funded balance of $45 million and $75 million at September 30, 2017 and December 31, 2016, which were classified in other debt securities carried at fair value.
Leveraged Lease Trusts
The Corporation’s net investment in consolidated leveraged lease trusts totaled $2.3 billion and $2.6$1.7 billion at both September 30, 20172020 and December 31, 2016.2019. The trusts hold long-lived equipment such as rail cars, power generation and distribution equipment, and commercial aircraft. The Corporation structures the trusts and holds a significant residual interest. The net investment
represents the Corporation’s maximum loss exposure to the trusts in the unlikely event that the leveraged lease investments become worthless. Debt issued by the leveraged lease trusts is non-recourse to the Corporation.
Tax Credit VehiclesVIEs
The Corporation holds investments in unconsolidated limited partnerships and similar entities that construct, own and operate affordable housing, wind and solar projects. An unrelated third party is typically the general partner or managing member and has control over the significant activities of the vehicle.VIE. The Corporation earns a return primarily through the receipt of tax credits allocated to the projects. The maximum loss exposure included in the Other VIEs table was $13.4$20.0 billion and $12.6$18.9 billion at September 30, 20172020 and December 31, 2016.2019. The Corporation’s risk of loss is generally mitigated by policies requiring that the project qualify for the expected tax credits prior to making its investment.
The Corporation'sCorporation’s investments in affordable housing partnerships, which are reported in other assets on the Consolidated Balance Sheet, totaled $7.6$10.6 billion and $7.4$10.0 billion, including unfunded commitments to provide capital contributions of $2.8$4.8 billion and $2.7$4.3 billion at September 30, 20172020 and December 31, 2016.2019. The unfunded commitments are expected to be paid over the next five years. The Corporation
recognized tax credits and other tax benefits from investments in affordable housing partnerships of $293$376 million and $825$986 million and reported pre-taxpretax losses in other noninterest income of $209$272 million and $612$799 million for the three and nine months ended September 30, 2017.2020. For the same periods in 2016,2019, the Corporation recognized tax credits and other tax benefits of $337$276 million and $819$847 million and pre-taxreported pretax losses in other income of $200$250 million and $596$732 million. Tax credits are recognized as part of the Corporation'sCorporation’s annual effective tax rate used to determine tax expense in a given quarter. Accordingly, the portion of a year'syear’s expected tax benefits recognized in any given quarter may differ from 25 percent. The Corporation may from time to time be asked to invest additional amounts to support a troubled affordable housing project. Such additional investments have not been and are not expected to be significant.
NOTE 7Representations and Warranties Obligations and Corporate Guarantees
For information on representations and warranties obligations and corporate guarantees and related settlement actions, see Note 7 – Representations and Warranties Obligations and Corporate Guarantees to the Consolidated Financial Statements of the Corporation's 2016 Annual Report on Form 10-K.
Unresolved Repurchase Claims
Unresolved representations and warranties repurchase claims represent the notional amount of repurchase claims made by counterparties, typically the outstanding principal balance or the unpaid principal balance at the time of default. In the case of first-lien mortgages, the claim amount is often significantly greater than the expected loss amount due to the benefit of collateral and, in some cases, mortgage insurance (MI) or mortgage guarantee payments. Claims received from a counterparty remain outstanding until the underlying loan is repurchased, the claim is rescinded by the counterparty, the Corporation determines that
the applicable statute of limitations has expired, or representations and warranties claims with respect to the applicable trust are settled, and fully and finally released. The Corporation does not include duplicate claims in the amounts disclosed.
The following table presents unresolved repurchase claims at September 30, 2017 and December 31, 2016. The unresolved repurchase claims include only claims where the Corporation believes that the counterparty has the contractual right to submit claims. The unresolved repurchase claims predominantly relate to subprime and pay option first-lien loans and home equity loans. For more information, see Private-label Securitizations and Whole-loan Sales Experience in the MD&A of the Corporation's 2016 Annual Report on Form 10-K, as well as Note 12 – Commitments and Contingenciesto the Consolidated Financial Statements of the Corporation's 2016 Annual Report on Form 10-K.
|
| | | | | | | |
| | | | |
| Unresolved Repurchase Claims by Counterparty, Net of Duplicate Claims |
| (Dollars in millions) | September 30
2017 | | December 31
2016 |
| By counterparty | |
| | |
|
Private-label securitization trustees, whole-loan investors, including third-party securitization sponsors and other (1) | $ | 16,019 |
| | $ | 16,685 |
|
| Monolines | 1,578 |
| | 1,583 |
|
| GSEs | 5 |
| | 9 |
|
| Total unresolved repurchase claims by counterparty, net of duplicate claims | $ | 17,602 |
| | $ | 18,277 |
|
| |
(1)
| Includes $11.3 billion and $11.9 billion of claims based on individual file reviews and $4.7 billion and $4.8 billion of claims submitted without individual file reviews at September 30, 2017 and December 31, 2016.
|
During the nine months ended September 30, 2017, the Corporation received $71 million in new repurchase claims and $746 million in claims were resolved, including $640 million related to settlements. Of the remaining unresolved monoline claims, substantially all of the claims pertain to second-lien loans and are currently the subject of litigation with a single monoline insurer. There may be additional claims or file requests in the future.
In addition to the unresolved repurchase claims in the Unresolved Repurchase Claims by Counterparty, net of Duplicate Claims table, the Corporation has received notifications from a sponsor of third-party securitizations with whom the Corporation engaged in whole-loan transactions indicating that the Corporation may have indemnity obligations with respect to specific loans for which the Corporation has not received a repurchase request. These notifications were received prior to 2015, and totaled $1.3 billion at both September 30, 2017 and December 31, 2016. During the three months ended September 30, 2017, the Corporation reached an agreement with the party requesting indemnity, subject to acceptance of a settlement agreement by a securitization trustee; the impact of this agreement is included in the reserve for representations and warranties.
The presence of repurchase claims on a given trust, receipt of notices of indemnification obligations and receipt of other communications, as discussed above, are all factors that inform the Corporation’s reserve for representations and warranties and the corresponding estimated range of possible loss.
Private-label Securitizations and Whole-loan Sales Experience
Prior to 2009, legacy companies and certain subsidiaries sold pools of first-lien residential mortgage loans and home equity loans as private-label securitizations or in the form of whole loans. For more information on private-label securitizations and whole-loan sales experience, see Note 7 – Representations and Warranties Obligations and Corporate Guarantees to the Consolidated Financial Statements of the Corporation's 2016 Annual Report on Form 10-K.
At September 30, 2017 and December 31, 2016, the notional amount of unresolved repurchase claims submitted by private-label securitization trustees, whole-loan investors, including third-party securitization sponsors, and others was $16.0 billion and $16.7 billion. The notional amount of unresolved repurchase claims at September 30, 2017 and December 31, 2016 included $6.9 billionand$5.6 billion of claims related to loans in specific private-label securitization groups or tranches where the Corporation owns substantially all of the outstanding securities or will otherwise realize the benefit of any repurchase claims paid.
The overall decrease in the notional amount of outstanding unresolved repurchase claims in the nine months ended September 30, 2017 was primarily due to claims that were resolved as a result of settlements. Outstanding repurchase claims remained unresolved primarily due to (1) the level of detail, support and analysis accompanying such claims, which impact
overall claim quality and, therefore, claims resolution, and (2) the lack of an established process to resolve disputes related to these claims.
Reserve for Representations and Warranties and Corporate Guarantees and Estimated Range of Possible Loss
The reserve for representations and warranties and corporate guarantees is included in accrued expenses and other liabilities on the Consolidated Balance Sheet and the related provision is included in mortgage banking income in the Consolidated Statement of Income.
The Corporation’s representations and warranties reserve and the corresponding estimated range of possible loss at September 30, 2017 considers, among other things, the repurchase experience implied in the settlements with BNY Mellon and other counterparties. Since the securitization trusts that were included in the settlements with BNY Mellon and other counterparties differ from other securitization trusts, the Corporation adjusts the experience implied by those prior settlements based on the characteristics of those trusts where the Corporation has a continuing possibility of timely claims in order to determine the representations and warranties reserve and the corresponding estimated range of possible loss.
The table below presents a rollforward of the reserve for representations and warranties and corporate guarantees.
|
| | | | | | | | | | | | | | | |
| | | | | | | | |
| Representations and Warranties and Corporate Guarantees | | | | |
| | Three Months Ended September 30 | | Nine Months Ended September 30 |
| (Dollars in millions) | 2017 | | 2016 | | 2017 | | 2016 |
| Reserve for representations and warranties and corporate guarantees, beginning of period | $ | 2,248 |
| | $ | 2,723 |
| | $ | 2,339 |
| | $ | 11,326 |
|
| Additions for new sales | 1 |
| | 1 |
| | 3 |
| | 3 |
|
Payments (1) | (297 | ) | | (23 | ) | | (385 | ) | | (8,687 | ) |
| Provision | 198 |
| | 99 |
| | 193 |
| | 158 |
|
| Reserve for representations and warranties and corporate guarantees, September 30 | $ | 2,150 |
| | $ | 2,800 |
| | $ | 2,150 |
| | $ | 2,800 |
|
| |
(1)
| In February 2016, the Corporation made an $8.5 billion settlement payment to BNY Mellon as part of the settlement with BNY Mellon.
|
The representations and warranties reserve represents the Corporation’s best estimate of probable incurred losses as of September 30, 2017. However, it is reasonably possible that future representations and warranties losses may occur in excess of the amounts recorded for these exposures. The Corporation currently estimates that the range of possible loss for representations and warranties exposures could be up to $2 billion over existing accruals at September 30, 2017. The Corporation treats claims that are time-barred as resolved and does not consider such claims in the estimated range of possible loss. The estimated range of possible loss reflects principally exposures related to loans in private-label securitization trusts, including related indemnity claims. It represents a reasonably possible loss, but does not
represent a probable loss, and is based on currently available information, significant judgment and a number of assumptions that are subject to change. For more information on the reserve for representations and warranties exposures and the corresponding estimated range of possible loss, see Note 7 – Representations and Warranties Obligations and Corporate Guarantees to the Consolidated Financial Statements of the Corporation's Quarterly Report on Form 10-Q for the quarterly period ended March 31, 2017, and Note 7 – Representations and Warranties Obligations and Corporate Guarantees to the Consolidated Financial Statements of the Corporation's 2016 Annual Report on Form 10-K.
NOTE 8 Goodwill and Intangible Assets
Goodwill
The table below presents goodwill balances by business segment and All Other at September 30, 20172020 and December 31, 2016.2019. The reporting units utilized for goodwill impairment testing are the operating segments or one level below. For additional information, see Note 8 – Goodwill and Intangible Assets to the Consolidated Financial Statements of the Corporation's 2016 Annual Report on Form 10-K.
| | | | | | | | | | | |
| | | |
| Goodwill | | | |
| | | |
| |
| (Dollars in millions) | September 30
2020 | | December 31
2019 |
| | | |
| | | |
| | | |
| | | |
| Consumer Banking | $ | 30,123 | | | $ | 30,123 | |
| | | |
| | | |
| Global Wealth & Investment Management | 9,677 | | | 9,677 | |
| | | |
| | | |
| | | |
| Global Banking | 23,923 | | | 23,923 | |
| Global Markets | 5,182 | | | 5,182 | |
| All Other | 46 | | | 46 | |
| Total goodwill | $ | 68,951 | | | $ | 68,951 | |
|
| | | | | | | |
| | | | |
| Goodwill | | | |
| (Dollars in millions) | September 30
2017 | | December 31
2016 |
| Consumer Banking | $ | 30,123 |
| | $ | 30,123 |
|
| Global Wealth & Investment Management | 9,680 |
| | 9,681 |
|
| Global Banking | 23,923 |
| | 23,923 |
|
| Global Markets | 5,197 |
| | 5,197 |
|
| All Other | 45 |
| | 820 |
|
Less: Goodwill of business held for sale (1) | — |
| | (775 | ) |
| Total goodwill | $ | 68,968 |
| | $ | 68,969 |
|
| |
(1)
| Reflects the goodwill assigned to the non-U.S. consumer credit card business, which was included in assets of business held for sale on the Consolidated Balance Sheet at December 31, 2016. During the second quarter of 2017, the Corporation sold its non-U.S. consumer credit card business. |
Intangible Assets
The table below presents the gross and net carrying values and accumulated amortization for intangible assets atAt September 30, 20172020 and December 31, 2016.2019, the net carrying value of intangible assets was $2.2 billion and $1.7 billion. During the three months ended September 30, 2020, the Corporation recognized a $585 million intangible asset, which is being amortized over a 10-year life, related to the merchant contracts that were distributed to the Corporation from its merchant servicing joint venture. For more information, see Note 10 – Commitments and Contingencies.
|
| | | | | | | | | | | | | | | | | | | | | | | |
| | | | | | | | | | | | |
Intangible Assets (1, 2) | | | | | | | | | | | |
| | September 30, 2017 | | December 31, 2016 |
| (Dollars in millions) | Gross Carrying Value | | Accumulated Amortization | | Net
Carrying Value | | Gross Carrying Value | | Accumulated Amortization | | Net
Carrying Value |
| Purchased credit card and affinity relationships | $ | 5,919 |
| | $ | 5,553 |
| | $ | 366 |
| | $ | 6,830 |
| | $ | 6,243 |
| | $ | 587 |
|
Core deposit and other intangibles (3) | 3,835 |
| | 2,120 |
| | 1,715 |
| | 3,836 |
| | 2,046 |
| | 1,790 |
|
| Customer relationships | 3,886 |
| | 3,509 |
| | 377 |
| | 3,887 |
| | 3,275 |
| | 612 |
|
Total intangible assets (4) | $ | 13,640 |
| | $ | 11,182 |
| | $ | 2,458 |
| | $ | 14,553 |
| | $ | 11,564 |
| | $ | 2,989 |
|
| |
(1)
| Excludes fully amortized intangible assets. |
| |
(2)
| At both September 30, 2017 and December 31, 2016, none of the intangible assets were impaired.
|
| |
(3)
| Includes $1.6 billion at both September 30, 2017 and December 31, 2016 of intangible assets associated with trade names that have an indefinite life and, accordingly, are not amortized.
|
| |
(4)
| Includes $67 million at December 31, 2016 of intangible assets assigned to the non-U.S. consumer credit card business, which was included in assets of business held for sale on the Consolidated Balance Sheet at December 31, 2016.
|
At September 30, 2020 and December 31, 2019, intangible assets included $1.6 billion of intangible assets associated with trade names, substantially all of which had an indefinite life and, accordingly, are not being amortized. Amortization of intangibles expense was $151$30 million and $473$62 million for the three and nine months ended September 30, 20172020 compared to $181$29 million and $554$84 million for the same periods in 2016. 2019.
NOTE 8Leases
The Corporation estimates aggregate amortization expense will be $147 millionenters into both lessor and lessee arrangements. For more information on lease accounting, see Note 1 – Summary of Significant Accounting Principles and Note 9 – Leases to the Consolidated Financial Statements of the Corporation’s 2019 Annual Report on Form 10-K. For more information on lease financing receivables, see Note 5 – Outstanding Loans and Leases and Allowance for the remainder of 2017, and $538 million, $105 million and $53 million for the years through 2020 and none for the years thereafter.Credit Losses.
Lessor Arrangements
The Corporation’s lessor arrangements primarily consist of operating, sales-type and direct financing leases for equipment. Lease agreements may include options to renew and for the lessee to purchase the leased equipment at the end of the lease term.
At September 30, 2020 and December 31, 2019, the total net investment in sales-type and direct financing leases was $19.9 billion and $21.9 billion, comprised of $17.6 billion and $19.3 billion in lease receivables and $2.3 billion and $2.6 billion in unguaranteed residuals. In certain cases, the Corporation obtains third-party residual value insurance to reduce its residual asset risk. The carrying value of residual assets with third-party residual value insurance for at least a portion of the asset value was $6.6 billion and $5.8 billion at September 30, 2020 and December 31, 2019.
The following table presents total lease income for the three and nine months ended September 30, 2020 and 2019.
| | | | | | | | | | | | | | | | | | | | | | | |
| | | | | | | |
| Lease Income | | | | | | | |
| | | | | | | |
| Three Months Ended
September 30 | | Nine Months Ended
September 30 |
| (Dollars in millions) | 2020 | | 2019 | | 2020 | | 2019 |
Sales-type and direct
financing leases | $ | 167 | | | $ | 198 | | | $ | 539 | | | $ | 601 | |
| Operating leases | 224 | | | 227 | | | 703 | | | 663 | |
| Total lease income | $ | 391 | | | $ | 425 | | | $ | 1,242 | | | $ | 1,264 | |
Lessee Arrangements
The Corporation’s lessee arrangements predominantly consist of operating leases for premises and equipment; the Corporation’s financing leases are not significant. Right-of-use assets were $9.9 billion and $9.7 billion and lease liabilities were $10.3 billion and $10.1 billion at September 30, 2020 and December 31, 2019.
NOTE 9 Federal Funds Sold or Purchased, Securities Financing Agreements, and Short-term Borrowings and Restricted Cash
The following table below presents federal funds sold or purchased, securities financing agreements which(which include securities borrowed or purchased under agreements to resell and securities loaned or sold under agreements to repurchase,repurchase) and short-term borrowings. The Corporation elects to account for certain securities financing agreements and short-term borrowings under the fair value option. For more information on the election of the fair value option, see Note 15 – Fair Value Option.
| | | | | | | | | | | | | | | | | | | |
| | Three Months Ended September 30 | | Nine Months Ended September 30 | | Amount | | Rate | | Amount | | Rate | | Amount | | Rate | | Amount | | Rate |
| | 2017 | | 2016 | | 2017 | | 2016 | | Three Months Ended September 30 | | Nine Months Ended September 30 |
| (Dollars in millions) | Amount | | Rate | | Amount | | Rate | | Amount | | Rate | | Amount | | Rate | (Dollars in millions) | 2020 | | 2019 | | 2020 | | 2019 |
| Federal funds sold and securities borrowed or purchased under agreements to resell | |
| | | | |
| | |
| | |
| | |
| | | | | Federal funds sold and securities borrowed or purchased under agreements to resell | | | | | | | | | |
| | Average during period | $ | 223,585 |
| | 1.17 | % | | $ | 214,254 |
| | 0.50 | % | | $ | 222,255 |
| | 1.00 | % | | $ | 215,476 |
| | 0.50 | % | Average during period | $ | 384,221 | | | 0.06 | % | | $ | 269,129 | | | 1.83 | % | | $ | 325,356 | | | 0.37 | % | | $ | 274,822 | | | 1.82 | % |
| Maximum month-end balance during period | 224,815 |
| | n/a |
| | 222,489 |
| | n/a |
| | 237,064 |
| | n/a |
| | 225,015 |
| | n/a |
| Maximum month-end balance during period | 420,830 | | | n/a | | 278,514 | | | n/a | | 451,179 | | | n/a | | 280,562 | | | n/a |
| | Federal funds purchased and securities loaned or sold under agreements to repurchase | |
| | |
| | |
| | |
| | |
| | |
| | | | |
| Federal funds purchased and securities loaned or sold under agreements to repurchase | | | | | | | | |
| | Average during period | $ | 197,794 |
| | 1.37 | % | | $ | 177,883 |
| | 0.93 | % | | $ | 199,433 |
| | 1.18 | % | | $ | 184,500 |
| | 1.00 | % | Average during period | $ | 192,376 | | | 0.41 | % | | $ | 203,702 | | | 2.35 | % | | $ | 193,029 | | | 0.81 | % | | $ | 202,632 | | | 2.43 | % |
| Maximum month-end balance during period | 197,604 |
| | n/a |
| | 192,536 |
| | n/a |
| | 218,017 |
| | n/a |
| | 196,631 |
| | n/a |
| Maximum month-end balance during period | 195,028 | | | n/a | | 202,208 | | | n/a | | 206,493 | | | n/a | | 203,063 | | | n/a |
| | Short-term borrowings | |
| | |
| | |
| | |
| | |
| | |
| | | | |
| Short-term borrowings | | | | | | | | |
| | Average during period | 32,153 |
| | 2.54 |
| | 29,751 |
| | 2.02 |
| | 38,329 |
| | 2.43 |
| | 30,631 |
| | 1.85 |
| Average during period | 17,770 | | | 0.08 | | | 26,579 | | | 2.29 | | | 23,347 | | | 0.68 | | | 21,728 | | | 2.62 | |
| Maximum month-end balance during period | 32,679 |
| | n/a |
| | 31,935 |
| | n/a |
| | 46,202 |
| | n/a |
| | 33,051 |
| | n/a |
| Maximum month-end balance during period | 19,530 | | | n/a | | 30,682 | | | n/a | | 30,118 | | | n/a | | 30,682 | | | n/a |
n/a = not applicable
Offsetting of Securities Financing Agreements
The Corporation enters into securities financing agreements to accommodate customers (also referred to as “matched-book transactions”), obtain securities to cover short positions and to finance inventory positions. Substantially all of the Corporation’s securities financing activities are transacted under legally enforceable master repurchase agreements or legally enforceable master securities lending agreements that give the Corporation, in the event of default by the counterparty, the right to liquidate securities held and to offset receivables and payables with the same counterparty. For more information on the securities financing agreements and the offsetting of securities financing transactions, see Note 1011 – Federal Funds Sold or Purchased, Securities Financing Agreements, and Short-term Borrowings and Restricted Cash to the Consolidated Financial Statements of the Corporation's 2016Corporation’s 2019 Annual Report on Form 10-K.
The Securities Financing Agreements table presents securities financing agreements included on the Consolidated Balance Sheet in federal funds sold and securities borrowed or purchased under agreements to resell, and in federal funds purchased and securities loaned or sold under agreements to repurchase at September 30, 20172020 and December 31, 2016.2019. Balances are presented on a gross basis, prior to the application of counterparty netting. Gross assets and liabilities are adjusted on an aggregate basis to take into consideration the effects of legally enforceable master netting agreements. For more information on the offsetting of derivatives, see Note 23 – Derivatives.
|
| | | | | | | | | | | | | | | | | | | |
| | | | | | | | | | |
| Securities Financing Agreements | | | | | | | | | |
| | September 30, 2017 |
| (Dollars in millions) | Gross Assets/Liabilities (1) | | Amounts Offset | | Net Balance Sheet Amount | | Financial Instruments (2) | | Net Assets/Liabilities |
Securities borrowed or purchased under agreements to resell (3) | $ | 362,065 |
| | $ | (144,851 | ) | | $ | 217,214 |
| | $ | (165,776 | ) | | $ | 51,438 |
|
| | | | | | | | | | |
| Securities loaned or sold under agreements to repurchase | $ | 334,627 |
| | $ | (144,851 | ) | | $ | 189,776 |
| | $ | (161,131 | ) | | $ | 28,645 |
|
Other (4) | 22,258 |
| | — |
| | 22,258 |
| | (22,258 | ) | | — |
|
| Total | $ | 356,885 |
| | $ | (144,851 | ) | | $ | 212,034 |
| | $ | (183,389 | ) | | $ | 28,645 |
|
| | | | | | | | | | |
| | December 31, 2016 |
Securities borrowed or purchased under agreements to resell (3) | $ | 326,970 |
| | $ | (128,746 | ) | | $ | 198,224 |
| | $ | (154,974 | ) | | $ | 43,250 |
|
| | | | | | | | | | |
| Securities loaned or sold under agreements to repurchase | $ | 299,028 |
| | $ | (128,746 | ) | | $ | 170,282 |
| | $ | (140,774 | ) | | $ | 29,508 |
|
Other (4) | 14,448 |
| | — |
| | 14,448 |
| | (14,448 | ) | | — |
|
| Total | $ | 313,476 |
| | $ | (128,746 | ) | | $ | 184,730 |
| | $ | (155,222 | ) | | $ | 29,508 |
|
| | | | | | | | |
(1)83Bank of America
| Includes activity where uncertainty exists as to the enforceability of certain master netting agreements under bankruptcy laws in some countries or industries. | |
| | | | | | | | |
(2)
| Financial instruments includes securities collateral received or pledged under repurchase or securities lending agreements where there is a legally enforceable master netting agreement. These amounts are not offset on the Consolidated Balance Sheet but are shown as a reduction to derive a net asset or liability. Securities collateral received or pledged where the legal enforceability of the master netting agreements is uncertain is excluded from the table. |
Excludes repurchase activity of $11.1 billion and $10.1 billion reported in loans and leases on the Consolidated Balance Sheet at September 30, 2017 and December 31, 2016.
| | |
(4)
| Balance is reported in accrued expenses and other liabilities on the Consolidated Balance Sheet and relates to transactions where the Corporation acts as the lender in a securities lending agreement and receives securities that can be pledged as collateral or sold. In these transactions, the Corporation recognizes an asset at fair value, representing the securities received, and a liability, representing the obligation to return those securities. |
| | | | | | | | | | | | | | | | | | | | | | | | | | | | | |
| | | | | | | | | |
| Securities Financing Agreements |
| | | | | | | | | |
| Gross Assets/Liabilities (1) | | Amounts Offset | | Net Balance Sheet Amount | | Financial Instruments (2) | | Net Assets/Liabilities |
| (Dollars in millions) | September 30, 2020 |
Securities borrowed or purchased under agreements to resell (3) | $ | 541,040 | | | $ | (214,295) | | | $ | 326,745 | | | $ | (300,403) | | | $ | 26,342 | |
| | | | | | | | | |
| Securities loaned or sold under agreements to repurchase | $ | 405,064 | | | $ | (214,295) | | | $ | 190,769 | | | $ | (179,875) | | | $ | 10,894 | |
Other (4) | 12,644 | | | 0 | | | 12,644 | | | (12,644) | | | 0 | |
| Total | $ | 417,708 | | | $ | (214,295) | | | $ | 203,413 | | | $ | (192,519) | | | $ | 10,894 | |
| | | | | | | | | |
| December 31, 2019 |
Securities borrowed or purchased under agreements to resell (3) | $ | 434,257 | | | $ | (159,660) | | | $ | 274,597 | | | $ | (244,486) | | | $ | 30,111 | |
| | | | | | | | | |
| Securities loaned or sold under agreements to repurchase | $ | 324,769 | | | $ | (159,660) | | | $ | 165,109 | | | $ | (141,482) | | | $ | 23,627 | |
Other (4) | 15,346 | | | 0 | | | 15,346 | | | (15,346) | | | 0 | |
| Total | $ | 340,115 | | | $ | (159,660) | | | $ | 180,455 | | | $ | (156,828) | | | $ | 23,627 | |
(1)Includes activity where uncertainty exists as to the enforceability of certain master netting agreements under bankruptcy laws in some countries or industries.
(2)Includes securities collateral received or pledged under repurchase or securities lending agreements where there is a legally enforceable master netting agreement. These amounts are not offset on the Consolidated Balance Sheet, but are shown as a reduction to derive a net asset or liability. Securities collateral received or pledged where the legal enforceability of the master netting agreements is uncertain is excluded from the table.
(3)Excludes repurchase activity of $15.2 billion and $12.9 billion reported in loans and leases on the Consolidated Balance Sheet at September 30, 2020 and December 31, 2019.
(4)Balance is reported in accrued expenses and other liabilities on the Consolidated Balance Sheet and relates to transactions where the Corporation acts as the lender in a securities lending agreement and receives securities that can be pledged as collateral or sold. In these transactions, the Corporation recognizes an asset at fair value, representing the securities received, and a liability, representing the obligation to return those securities.
Repurchase Agreements and Securities Loaned Transactions Accounted for as Secured Borrowings
The following tables below present securities sold under agreements to repurchase and securities loaned by remaining contractual term to maturity and class of collateral pledged. Included in “Other” are transactions where the Corporation acts as the lender in a
securities lending agreement and receives securities that can be pledged as collateral or sold. Certain agreements contain a right to substitute collateral and/or terminate the
agreement prior to maturity at the option of the Corporation or the counterparty. Such agreements are included in the table below based on the remaining contractual term to maturity. For more information on collateral requirements, see Note 11 – Federal Funds Sold or Purchased, Securities Financing Agreements, Short-term Borrowings and Restricted Cash to the Consolidated Financial Statements of the Corporation’s 2019 Annual Report on Form 10-K.
| | | | | | | | | | | | | | | | | | | | | | | | | | | | | |
| | | | | | | | | |
| Remaining Contractual Maturity |
| | | | | | | | | |
| |
| Overnight and Continuous | | 30 Days or Less | | After 30 Days Through 90 Days | | Greater than 90 Days (1) | | Total |
| (Dollars in millions) | September 30, 2020 |
| Securities sold under agreements to repurchase | $ | 199,516 | | | $ | 108,084 | | | $ | 23,509 | | | $ | 48,913 | | | $ | 380,022 | |
| Securities loaned | 20,284 | | | 16 | | | 427 | | | 4,315 | | | 25,042 | |
| Other | 12,644 | | | 0 | | | 0 | | | 0 | | | 12,644 | |
| Total | $ | 232,444 | | | $ | 108,100 | | | $ | 23,936 | | | $ | 53,228 | | | $ | 417,708 | |
| | | | | | | | | |
| December 31, 2019 |
| Securities sold under agreements to repurchase | $ | 129,455 | | | $ | 122,685 | | | $ | 25,322 | | | $ | 21,922 | | | $ | 299,384 | |
| Securities loaned | 18,766 | | | 3,329 | | | 1,241 | | | 2,049 | | | 25,385 | |
| Other | 15,346 | | | 0 | | | 0 | | | 0 | | | 15,346 | |
| Total | $ | 163,567 | | | $ | 126,014 | | | $ | 26,563 | | | $ | 23,971 | | | $ | 340,115 | |
|
| | | | | | | | | | | | | | | | | | | |
| | | | | | | | | | |
| Remaining Contractual Maturity | | | | | | | | | |
| | September 30, 2017 |
| (Dollars in millions) | Overnight and Continuous | | 30 Days or Less | | After 30 Days Through 90 Days | | Greater than 90 Days (1) | | Total |
| Securities sold under agreements to repurchase | $ | 119,610 |
| | $ | 89,934 |
| | $ | 41,358 |
| | $ | 59,174 |
| | $ | 310,076 |
|
| Securities loaned | 16,027 |
| | 404 |
| | 1,989 |
| | 6,131 |
| | 24,551 |
|
| Other | 22,258 |
| | — |
| | — |
| | — |
| | 22,258 |
|
| Total | $ | 157,895 |
| | $ | 90,338 |
| | $ | 43,347 |
| | $ | 65,305 |
| | $ | 356,885 |
|
| | | | | | | | | | |
| | December 31, 2016 |
| Securities sold under agreements to repurchase | $ | 129,853 |
| | $ | 77,780 |
| | $ | 31,851 |
| | $ | 40,752 |
| | $ | 280,236 |
|
| Securities loaned | 8,564 |
| | 6,602 |
| | 1,473 |
| | 2,153 |
| | 18,792 |
|
| Other | 14,448 |
| | — |
| | — |
| | — |
| | 14,448 |
|
| Total | $ | 152,865 |
| | $ | 84,382 |
| | $ | 33,324 |
| | $ | 42,905 |
| | $ | 313,476 |
|
| |
(1) | | | | | | | | | | | | | | | | | | | | | | | | | | | | | | | | | Class of Collateral Pledged | | | | | | | | | | | | Securities Sold Under Agreements to Repurchase | | Securities
Loaned | | Other | | Total | | (Dollars in millions) | September 30, 2020 | | U.S. government and agency securities | $ | 211,538 | | | $ | 0 | | | $ | 0 | | | $ | 211,538 | | | Corporate securities, trading loans and other | 12,177 | | | 1,763 | | | 786 | | | 14,726 | | | Equity securities | 14,495 | | | 22,635 | | | 11,800 | | | 48,930 | | | Non-U.S. sovereign debt | 138,518 | | | 644 | | | 58 | | | 139,220 | | | Mortgage trading loans and ABS | 3,294 | | | 0 | | | 0 | | | 3,294 | | | Total | $ | 380,022 | | | $ | 25,042 | | | $ | 12,644 | | | $ | 417,708 | | | | | | | | | | | December 31, 2019 | | U.S. government and agency securities | $ | 173,533 | | | $ | 1 | | | $ | 0 | | | $ | 173,534 | | | Corporate securities, trading loans and other | 10,467 | | | 2,014 | | | 258 | | | 12,739 | | | Equity securities | 14,933 | | | 20,026 | | | 15,024 | | | 49,983 | | | Non-U.S. sovereign debt | 96,576 | | | 3,344 | | | 64 | | | 99,984 | | | Mortgage trading loans and ABS | 3,875 | | | 0 | | | 0 | | | 3,875 | | | Total | $ | 299,384 | | | $ | 25,385 | | | $ | 15,346 | | | $ | 340,115 | |
| No agreements have maturities greater than three years.
|
|
| | | | | | | | | | | | | | | |
| | | | | | | | |
| Class of Collateral Pledged | | | | | | | |
| | September 30, 2017 |
| (Dollars in millions) | Securities Sold Under Agreements to Repurchase | | Securities Loaned | | Other | | Total |
| U.S. government and agency securities | $ | 169,501 |
| | $ | — |
| | $ | 281 |
| | $ | 169,782 |
|
| Corporate securities, trading loans and other | 8,933 |
| | 1,339 |
| | 443 |
| | 10,715 |
|
| Equity securities | 30,483 |
| | 17,892 |
| | 21,479 |
| | 69,854 |
|
| Non-U.S. sovereign debt | 95,997 |
| | 5,320 |
| | 55 |
| | 101,372 |
|
| Mortgage trading loans and ABS | 5,162 |
| | — |
| | — |
| | 5,162 |
|
| Total | $ | 310,076 |
| | $ | 24,551 |
| | $ | 22,258 |
| | $ | 356,885 |
|
| | | | | | | | |
| | December 31, 2016 |
| U.S. government and agency securities | $ | 153,184 |
| | $ | — |
| | $ | 70 |
| | $ | 153,254 |
|
| Corporate securities, trading loans and other | 11,086 |
| | 1,630 |
| | 127 |
| | 12,843 |
|
| Equity securities | 24,007 |
| | 11,175 |
| | 14,196 |
| | 49,378 |
|
| Non-U.S. sovereign debt | 84,171 |
| | 5,987 |
| | 55 |
| | 90,213 |
|
| Mortgage trading loans and ABS | 7,788 |
| | — |
| | — |
| | 7,788 |
|
| Total | $ | 280,236 |
| | $ | 18,792 |
| | $ | 14,448 |
| | $ | 313,476 |
|
The Corporation is required to post collateral with a market value equal to or in excess of the principal amount borrowed under repurchase agreements. For securities loaned transactions, the Corporation receives collateral in the form of cash, letters of credit or other securities. To help ensure that the market value of the underlying collateral remains sufficient, collateral is generally valued daily, and the Corporation may be required to deposit
additional collateral or may receive or return collateral pledged when appropriate. Repurchase agreements and securities loaned transactions are generally either overnight, continuous (i.e., no stated term) or short-term. The Corporation manages liquidity risks related to these agreements by sourcing funding from a diverse group of counterparties, providing a range of securities collateral and pursuing longer durations, when appropriate.
Restricted Cash
At September 30, 2020 and December 31, 2019, the Corporation held restricted cash included within cash and cash equivalents on the Consolidated Balance Sheet of $6.5 billion and $24.4 billion, predominantly related to cash held on deposit with the Federal Reserve Bank and non-U.S. central banks to meet reserve requirements and cash segregated in compliance with securities regulations.
NOTE 10Commitments and Contingencies
In the normal course of business, the Corporation enters into a number of off-balance sheet commitments. These commitments expose the Corporation to varying degrees of credit and market risk and are subject to the same credit and market risk limitation reviews as those instruments recorded on the Consolidated Balance Sheet. For more information on commitments and contingencies, see Note 1213 – Commitments and Contingencies to the Consolidated Financial Statements of the Corporation's 2016Corporation’s 2019 Annual Report on Form 10-K.
Credit Extension Commitments
The Corporation enters into commitments to extend credit such as loan commitments, standby letters of credit (SBLCs)SBLCs and commercial letters of credit to meet the financing needs of its customers. The following table below includes the notional amount of unfunded legally binding lending commitments net of amounts distributed (e.g.(i.e.,
syndicated or participated) to other financial institutions. The distributed amounts were $11.3$10.3 billion and $12.1
$10.6 billion at September 30, 20172020 and December 31, 2016.2019. At September 30, 2017,2020, the carrying value of these commitments, excluding commitments accounted for under the fair value option, was $780 million,$1.9 billion, including deferred revenue of $18$17 million and a reserve for unfunded lending commitments of $762 million.$1.9 billion. At December 31, 2016,2019, the comparable amounts were $779$829 million,, $17 $16 million and $762$813 million,, respectively. The carrying value of these commitments is classified in accrued expenses and other liabilities on the Consolidated Balance Sheet.
The table below also includes the notional amount of commitments of $4.9 billion and $7.0 billion at September 30, 2017 and December 31, 2016 that are accounted for under the fair value option. However, the table below excludes cumulative net fair value of $101 million and $173 million on these commitments, which is classified in accrued expenses and other liabilities. For more information regarding the Corporation’s loan commitments accounted for under the fair value option, see Note 15 – Fair Value Option.
|
| | | | | | | | | | | | | | | | | | | |
| | | | | | | | | | |
| Credit Extension Commitments | | | | | | | | | |
| | September 30, 2017 |
| (Dollars in millions) | Expire in One
Year or Less | | Expire After One
Year Through
Three Years | | Expire After Three
Years Through
Five Years | | Expire After Five
Years | | Total |
| Notional amount of credit extension commitments | |
| | |
| | |
| | |
| | |
|
| Loan commitments | $ | 81,579 |
| | $ | 133,609 |
| | $ | 145,154 |
| | $ | 18,639 |
| | $ | 378,981 |
|
| Home equity lines of credit | 7,400 |
| | 5,531 |
| | 2,212 |
| | 30,265 |
| | 45,408 |
|
Standby letters of credit and other (1) | 21,520 |
| | 10,814 |
| | 2,760 |
| | 1,221 |
| | 36,315 |
|
| Letters of credit | 1,220 |
| | 102 |
| | 95 |
| | 80 |
| | 1,497 |
|
| Legally binding commitments | 111,719 |
| | 150,056 |
| | 150,221 |
| | 50,205 |
| | 462,201 |
|
Credit card lines (2) | 365,007 |
| | — |
| | — |
| | — |
| | 365,007 |
|
| Total credit extension commitments | $ | 476,726 |
| | $ | 150,056 |
| | $ | 150,221 |
| | $ | 50,205 |
| | $ | 827,208 |
|
| | | | | | | | | | |
| | December 31, 2016 |
| Notional amount of credit extension commitments | |
| | |
| | |
| | |
| | |
|
| Loan commitments | $ | 82,609 |
| | $ | 133,063 |
| | $ | 152,854 |
| | $ | 22,129 |
| | $ | 390,655 |
|
| Home equity lines of credit | 8,806 |
| | 10,701 |
| | 2,644 |
| | 25,050 |
| | 47,201 |
|
Standby letters of credit and financial guarantees (1) | 19,165 |
| | 10,754 |
| | 3,225 |
| | 1,027 |
| | 34,171 |
|
| Letters of credit | 1,285 |
| | 103 |
| | 114 |
| | 53 |
| | 1,555 |
|
| Legally binding commitments | 111,865 |
| | 154,621 |
| | 158,837 |
| | 48,259 |
| | 473,582 |
|
Credit card lines (2) | 377,773 |
| | — |
| | — |
| | — |
| | 377,773 |
|
| Total credit extension commitments | $ | 489,638 |
| | $ | 154,621 |
| | $ | 158,837 |
| | $ | 48,259 |
| | $ | 851,355 |
|
| |
(1)
| The notional amounts of SBLCs and financial guarantees classified as investment grade and non-investment grade based on the credit quality of the underlying reference name within the instrument were $26.5 billion and $8.2 billion at September 30, 2017, and $25.5 billion and $8.3 billion at December 31, 2016. Amounts in the table include consumer SBLCs of $375 million and $376 million at September 30, 2017 and December 31, 2016.
|
| |
(2)
| Includes business card unused lines of credit. |
Legally binding commitments to extend credit generally have specified rates and maturities. Certain of these commitments have adverse change clauses that help to protect the Corporation against deterioration in the borrower’s ability to pay.
The table below includes the notional amount of commitments of $3.3 billion and $4.4 billion at September 30, 2020 and December 31, 2019 that are accounted for under the fair value option. However, the table excludes cumulative net fair value of $122 million and $90 million at September 30, 2020 and December 31, 2019 on these commitments, which is classified in accrued expenses and other liabilities. For more information regarding the Corporation’s loan commitments accounted for under the fair value option, see Note 15 – Fair Value Option.
| | | | | | | | | | | | | | | | | | | | | | | | | | | | | |
| | | | | | | | | |
| Credit Extension Commitments | | | | | | | | | |
| |
| Expire in One
Year or Less | | Expire After One
Year Through
Three Years | | Expire After Three Years Through
Five Years | | Expire After
Five Years | | Total |
| (Dollars in millions) | September 30, 2020 |
| Notional amount of credit extension commitments | | | | | | | | | |
Loan commitments (1) | $ | 107,984 | | | $ | 159,452 | | | $ | 145,645 | | | $ | 13,290 | | | $ | 426,371 | |
| Home equity lines of credit | 697 | | | 2,672 | | | 8,237 | | | 31,889 | | | 43,495 | |
Standby letters of credit and financial guarantees (2) | 21,648 | | | 11,145 | | | 2,532 | | | 1,133 | | | 36,458 | |
Letters of credit (3) | 825 | | | 224 | | | 33 | | | 32 | | | 1,114 | |
| Legally binding commitments | 131,154 | | | 173,493 | | | 156,447 | | | 46,344 | | | 507,438 | |
Credit card lines (4) | 387,059 | | | 0 | | | 0 | | | 0 | | | 387,059 | |
| Total credit extension commitments | $ | 518,213 | | | $ | 173,493 | | | $ | 156,447 | | | $ | 46,344 | | | $ | 894,497 | |
| | | | | | | | | |
| | December 31, 2019 |
| Notional amount of credit extension commitments | | | | | | | | | |
Loan commitments (1) | $ | 97,454 | | | $ | 148,000 | | | $ | 173,699 | | | $ | 24,487 | | | $ | 443,640 | |
| Home equity lines of credit | 1,137 | | | 1,948 | | | 6,351 | | | 34,134 | | | 43,570 | |
Standby letters of credit and financial guarantees (2) | 21,311 | | | 11,512 | | | 3,712 | | | 408 | | | 36,943 | |
Letters of credit (3) | 1,156 | | | 254 | | | 65 | | | 25 | | | 1,500 | |
| Legally binding commitments | 121,058 | | | 161,714 | | | 183,827 | | | 59,054 | | | 525,653 | |
Credit card lines (4) | 376,067 | | | 0 | | | 0 | | | 0 | | | 376,067 | |
| Total credit extension commitments | $ | 497,125 | | | $ | 161,714 | | | $ | 183,827 | | | $ | 59,054 | | | $ | 901,720 | |
(1) At both September 30, 2020 and December 31, 2019, $5.1 billion of these loan commitments were held in the form of a security.
(2) The notional amounts of SBLCs and financial guarantees classified as investment grade and non-investment grade based on the credit quality of the underlying reference name within the instrument were $25.4 billion and $10.5 billion at September 30, 2020, and $27.9 billion and $8.6 billion at December 31, 2019. Amounts in the table include consumer SBLCs of $521 million and $413 million at September 30, 2020 and December 31, 2019.
(3) At September 30, 2020 and December 31, 2019, included are letters of credit of $1.7 billion and $1.4 billion related to certain liquidity commitments of VIEs. For more information, see Note 6 – Securitizations and Other Variable Interest Entities.
(4) Includes business card unused lines of credit.
Other Commitments
At September 30, 20172020 and December 31, 2016,2019, the Corporation had commitments to purchase loans (e.g., residential mortgage and commercial real estate) of $452$169 million and $767 million, and commitments to purchase commercial loans of $2.0 billion and $636$86 million, which upon settlement will be included in trading account assets, loans or LHFS.LHFS, and commitments to purchase commercial loans of $365 million and $1.1 billion, which upon settlement will be included in trading account assets.
At September 30, 20172020 and December 31, 2016,2019, the Corporation had commitments to purchase commodities, primarily liquefied natural gas, of $1.6 billion$539 million and $1.9 billion,$830 million, which upon
settlement will be included in trading account assets.
At September 30, 20172020 and December 31, 2016,2019, the Corporation had commitments to enter into resale and forward-dated resale and securities borrowing agreements of $77.2$127.7 billion and $48.9$97.2 billion, and commitments to enter into forward-dated repurchase and securities lending agreements of $47.7 $68.7
billion and $24.4$24.9 billion. These commitments generally expire primarily within the next 12 months.
The Corporation has entered into agreements to purchase retail automotive loans from certain auto loan originators. These agreements provide for stated purchase amounts and contain cancellation provisions that allow the Corporation to terminate its commitment to purchase at any time, with a minimum notification period. At September 30, 20172020 and December 31, 2016, the Corporation’s maximum purchase commitment was $345 million
and $475 million. In addition,2019, the Corporation hashad a commitment to originate or purchase up to $3.8 billion and $3.3 billion on a rolling 12-month basis, of auto loans and leases from a strategic partner up to $950 million for the remainder of 2017,partner. This commitment extends through November 2022 and can be terminated with this commitment expiring on December 31, 2017.12 months prior notice.
The Corporation is a party to operating leases for certain of its premises and equipment. Commitments under these leases are approximately $576 million, $2.3 billion, $2.1 billion, $1.9 billion and $1.6 billion for the remainder of 2017 and the years through 2021, respectively, and $5.8 billion in the aggregate for all years thereafter.
Other Guarantees
Bank-owned Life Insurance Book Value Protection
The Corporation sells products that offer book value protection to insurance carriers who offer group life insurance policies to corporations, primarily banks. At September 30, 20172020 and December 31, 2016,2019, the notional amount of these guarantees which are recorded as derivatives totaled $14.0$7.1 billion and $13.9$7.3 billion. At both September 30, 20172020 and December 31, 2016,2019, the Corporation’s maximum exposure related to these guarantees totaled $3.2$1.1 billion, with estimated maturity dates between 20312033 and 2039. The net fair value including the fee receivable associated with these guarantees was $2 million and $4 million at September 30, 2017 and December 31, 2016, and reflects the probability of surrender as well as the multiple structural protection features in the contracts.
Merchant Services
In accordance with credit and debit card association rules, the Corporation sponsors merchant processing servicers that process credit and debit card transactions on behalf of various merchants. In connection with these services,Prior to July 1, 2020, a liability may arise in the event of a billing dispute between the merchant and a cardholder that is ultimately resolved in the cardholder’s favor. If the merchant defaults on its obligation to reimburse the cardholder, the cardholder, through its issuing bank, generally has until six months after the date of the transaction to present a chargeback to the merchant processor, which is primarily liable for any losses on covered transactions. However, if the merchant processor fails to meet its obligation to reimburse the cardholder for disputed transactions, then the Corporation, as the sponsor, could be held liable for the disputed amount. For the three and nine months ended September 30, 2017, the sponsored entities processed and settled $200.4 billion and $591.8 billion of transactions and recorded losses of $7 million and $22 million. For the three and nine months ended September 30, 2016, the sponsored entities processed and settled $189.9 billion and $527.7 billion of transactions and recorded losses of $9 million and $23 million. A significant portion of thisthe Corporation's merchant processing activity was processedperformed by a joint venture in which it held a 49 percent ownership interest. On July 29, 2019, the Corporation holdsgave notice to the joint venture partner of the termination of the joint venture upon the conclusion of its current term on June 30, 2020. Effective July 1, 2020, the Corporation received its share of the joint venture's merchant contracts and began performing merchant processing services for these merchants. While merchants bear responsibility for any credit or debit card charges properly reversed by the cardholder, the Corporation, in its role as merchant acquirer, may be held liable for any reversed charges that cannot be collected from the merchants due to, among other things, merchant fraud or insolvency.
The Corporation, as a 49 percent ownership,card network member bank, also sponsors other merchant acquirers, principally its former joint venture partner with respect to merchants distributed to that partner upon the termination of the joint venture. If reversed charges applicable to these merchants cannot be collected from either the merchants or merchant acquirers, the Corporation may be held liable for these reversed charges. The Corporation’s risk in this area primarily relates to circumstances where a cardholder has purchased goods or services for future delivery. The Corporation mitigates this risk by requiring cash deposits, guarantees, letters of credit or other types of collateral from certain merchants. The total amount of transactions processed for the preceding six-month period, which was $311.7 billion, is an estimate of the Corporation’s maximum potential exposure as of September 30, 2020. However, for the reasons described above, the Corporation does not believe the maximum potential exposure is representative of the actual potential loss exposure. At September 30, 2020 and 2019, the Corporation’s reserves for contingent losses and the losses incurred related to the merchant processing activity were not significant. The Corporation will continue to monitor its exposure in this area due to the potential economic impacts of COVID-19.
Representations and Warranties Obligations and Corporate Guarantees
For more information on representations and warranties obligations and corporate guarantees, see Note 13 – Commitments and Contingencies to the Consolidated Financial Statements of the Corporation’s 2019 Annual Report on Form 10-K.
The reserve for representations and warranties obligations and corporate guarantees was $1.4 billion and $1.8 billion at September 30, 2020 and December 31, 2019 and is recordedincluded in accrued expenses and other assetsliabilities on the Consolidated Balance Sheet and the related provision is included in All Other. At bothother income in the Consolidated Statement of Income. The representations and warranties reserve represents the Corporation’s best estimate of probable incurred losses, is based on our experience in previous negotiations, and is subject to judgment, a variety of assumptions, and known or unknown uncertainties. Future representations and warranties losses may occur in excess of the amounts recorded for these exposures; however, the Corporation does not expect such amounts to be material to the Corporation's financial condition and liquidity. See Litigation and Regulatory Matters below for the Corporation's combined range of possible loss in excess of the reserve for representations and warranties and the accrued liability for litigation.
Fixed Income Clearing Corporation Sponsored Member Repo Program
The Corporation acts as a sponsoring member in a repo program whereby the Corporation clears certain eligible resale and repurchase agreements through the Government Securities Division of the Fixed Income Clearing Corporation on behalf of clients that are sponsored members in accordance with the Fixed Income Clearing Corporation’s rules. As part of this program, the Corporation guarantees the payment and performance of its sponsored members to the Fixed Income Clearing Corporation. The Corporation’s guarantee obligation is secured by a security interest in cash or high-quality securities collateral placed by clients with the clearinghouse and therefore, the potential for the Corporation to incur significant losses under this arrangement is remote. The Corporation’s maximum potential exposure, without taking into consideration the related collateral, was $8.0 billion and $9.3 billion at September 30, 20172020 and December 31, 2016, the carrying value of the Corporation's investment in the merchant services joint venture was $2.9 billion.
As of September 30, 2017 and December 31, 2016, the maximum potential exposure for sponsored transactions totaled $334.9 billion and $325.7 billion. However, the Corporation believes that the maximum potential exposure is not representative of the actual potential loss exposure and does not expect to make material payments in connection with these guarantees.2019.
Other Guarantees
The Corporation has entered into additional guarantee agreements and commitments, including sold risk participation swaps, liquidity facilities, lease-end obligation agreements, partial credit guarantees on certain leases, real estate joint venture guarantees, divested business commitments and sold put options that require gross settlement. The maximum potential future paymentpayments under these agreements wasare approximately $6.5$9.0 billion and $6.7$8.7 billion at September 30, 20172020 and December 31, 2016.2019. The estimated maturity dates of these obligations extend up to 2040.2049. The Corporation has made no material payments under these guarantees. For more information on maximum potential future payments under VIE-related liquidity commitments, see Note 6 – Securitizations and Other Variable Interest Entities.
In the normal course of business, the Corporation periodically guarantees the obligations of its affiliates in a variety of transactions including ISDA-related transactions and non-ISDA related transactions such as commodities trading, repurchase agreements, prime brokerage agreements and other transactions.
Payment Protection Insurance Claims MatterGuarantees of Certain Long-term Debt
On June 1, 2017,The Corporation, as the parent company, fully and unconditionally guarantees the securities issued by BofA Finance LLC, a 100 percent owned finance subsidiary of the Corporation, sold its non-U.S. consumer credit card business. Included inand effectively provides for the calculationfull and unconditional guarantee of trust securities issued by certain statutory trust companies that are 100 percent owned finance subsidiaries of the gain on sale, the Corporation recorded an obligation to indemnify the purchaser for substantially all PPI exposure above reserves assumed by the purchaser.Corporation.
Litigation and Regulatory Matters
The following disclosure supplements the disclosure in Note 1213 – Commitments and Contingencies to the Consolidated Financial Statements of the Corporation's 2016Corporation’s 2019 Annual Report on Form 10-K and in Note 10 – Commitments and Contingencies to the Consolidated Financial Statements of the Corporation's Quarterly Report on Form 10-Q for the quarterly periods ended June 30, 2017 and March 31, 2017 (the prior commitments and contingencies disclosure).
In the ordinary course of business, the Corporation and its subsidiaries are routinely defendants in or parties to many pending and threatened legal, regulatory and governmental actions and proceedings.
In view of the inherent difficulty of predicting the outcome of such matters, particularly where the claimants seek very large or indeterminate damages or where the matters present novel legal theories or involve a large number of parties, the Corporation generally cannot predict what the eventual outcome of the pending matters, will be, what the timing of the ultimate resolution of these matters, will be, or what the expense,any eventual loss, fines or penalties related to each matter may be.
In accordance with applicable accounting guidance, the Corporation establishes an accrued liability when those matters present loss contingencies that are both probable and estimable. In such cases, there may be an exposure to loss in excess of any amounts accrued. As a matter develops, the Corporation, in conjunction with any outside counsel handling the matter, evaluates on an ongoing basis whether such matter presents a loss contingency that is probable and estimable. Once the loss contingency is deemed to be both probable and estimable, the Corporation will establish an accrued liability and record a corresponding amount of litigation-related expense. The Corporation continues to monitor the matter for further developments that could affect the amount of the accrued liability that has been previously established. Excluding expenses of internal and external legal service providers, litigation-related expense of $140$636 million and $606$717 million was recognized for the three and nine months ended September 30, 20172020 compared to $250$352 million and $908$539 million for the same periods in 2016.2019.
For a limited number of the matters disclosed in the prior commitments and contingencies disclosure, for which a loss, whether in excess of a related accrued liability or where there is no accrued liability, is reasonably possible in future periods, the Corporation is able to estimate a range of possible loss. In determining whether it is possible to estimate a range of possible loss, the Corporation reviews and evaluates itsthese matters on an ongoing basis, in conjunction with any outside counsel handling the matter, in light of potentially relevant factual and legal developments. InWith respect to such matters, in cases in which the Corporation possesses sufficient appropriate information to estimate a range of possible loss, that estimate is aggregated and disclosed below. There may be other previously disclosed matters for which a loss is probable or
reasonably possible but such an estimate of the range of possible loss may not be possible. For those disclosed matters where an estimate of the range of possible loss is possible, as well as for representations and warranties exposures, management currently estimates the aggregate range of reasonably possible loss for these exposures is $0 to $1.5$1.3 billion in excess of the accrued liability, (if any) related to those matters. Thisif any.
The estimated range of possible loss, as well as the Corporation's accrued liability, is based upon currently available information and is subject to significant judgment, and a variety of assumptions and known and unknown uncertainties. The matters underlying the estimated range of possible loss and liability accrual are unpredictable and will change from time to time, and actual resultslosses may vary significantly from the current estimate.estimate or accrual. Therefore, this estimated range of possible loss represents what the Corporation believes to be an estimate of possible loss only for certain matters meeting these criteria. It does not represent the Corporation’s maximum loss exposure.
Information has beenis provided in the prior commitments and contingencies disclosure regarding the nature of all of these contingenciesthe litigation and, where specified, the amount of the claim associated with these loss contingencies.claimed damages. Based on current knowledge, and taking into account accrued liabilities, management does not believe that loss contingencies arising from pending matters including the matters described in the prior commitments and contingencies disclosure will have a material adverse effect on the consolidated financial positioncondition or liquidity of the Corporation. However, in light of the inherentsignificant judgment, variety of assumptions and uncertainties involved in these matters, some of which are beyond the Corporation’s control, and the very large or indeterminate damages sought in some of these matters, an adverse outcome in one or more of these matters could be material to the Corporation’s businesses or results of operations or liquidity for any particular reporting period.period, or cause significant reputational harm.
NOTE 11Shareholders’ Equity
Common Stock
| | | | | | | | | | | | | | | | | | | | |
| | | | | | |
Declared Quarterly Cash Dividends on Common Stock (1) |
| | | | | | |
| Declaration Date | | Record Date | | Payment Date | | Dividend Per Share |
| | | | | | |
| October 21, 2020 | | December 4, 2020 | | December 24, 2020 | | $ | 0.18 | |
| July 22, 2020 | | September 4, 2020 | | September 25, 2020 | | 0.18 | |
| April 22, 2020 | | June 5, 2020 | | June 26, 2020 | | 0.18 | |
| January 29, 2020 | | March 6, 2020 | | March 27, 2020 | | 0.18 | |
(1)In 2020, and through October 30, 2020.
In June 2020, the Board of Governors of the Federal Reserve System (Federal Reserve) announced that due to economic uncertainty resulting from COVID-19, all large banks would be required to suspend share repurchase programs in the third quarter of 2020, except for repurchases to offset shares awarded under equity-based compensation plans, and to limit dividends to existing rates that do not exceed the average of the last four quarters’ net income.
The Federal Reserve’s directives regarding share repurchases aligned with the Corporation's decision to voluntarily suspend repurchases during the first half of 2020. The suspension of the Corporation's repurchases did not include repurchases to offset shares awarded under its equity-based compensation plans.
| | | | | | | | |
87Bank of America | | | | | | |
Declared Quarterly Cash Dividends on Common Stock (1)
|
Declaration Date | | Record Date | | Payment Date | | Dividend Per Share |
| | |
October 25, 2017 | | December 1, 2017 | | December 29, 2017 | | $ | 0.12 |
|
July 26, 2017 | | September 1, 2017 | | September 29, 2017 | | 0.12 |
|
April 26, 2017 | | June 2, 2017 | | June 30, 2017 | | 0.075 |
|
January 26, 2017 | | March 3, 2017 | | March 31, 2017 | | 0.075 |
|
| | | | | | | | |
(1)
| In 2017 and through October 30, 2017.
| |
During the three and nine months ended September 30, 2017,2020, the Corporation repurchased and retired 1244 million and 216 million shares of common stock, in connection with the 2017 Comprehensive Capital Analysis and Review capital plan, which reduced shareholders'shareholders’ equity by $3.0$114 million and $6.8 billion. This includes shares repurchased to offset the dilution resulting from certain equity-based compensation awards.
The Corporation has warrants outstanding and exercisable to purchase 122 million shares of its common stock expiring on October 28, 2018, and warrants outstanding and exercisable to purchase 150 million shares of common stock expiring on January 16, 2019. These warrants were originally issued in connection with preferred stock issuances to the U.S. Department of the Treasury in 2009 and 2008, and are listed on the New York Stock Exchange. The exercise price of the warrants expiring on January 16, 2019 is subject to continued adjustment each time the quarterly cash dividend is in excess of $0.01 per common share to compensate the holders of the warrants for dilution resulting from an increased dividend. As a result of the Corporation’s third-quarter 2017 dividend of $0.12 per common share, the exercise price of the warrants expiring on January 16, 2019 was adjusted to $12.807 per share. The warrants expiring on October 28, 2018, which have an exercise price of $30.79 per share, also contain this anti-dilution provision except the adjustment is triggered only when the Corporation declares quarterly dividends at a level greater than $0.32 per common share.
On August 24, 2017, the holders of the Corporation's Series T 6% Non-cumulative preferred stock (Series T) exercised warrants to acquire 700 million shares of the Corporation's common stock. The carrying amount of the preferred stock was $2.9 billion and, upon conversion, was recorded as additional paid-in capital. For additional information, see Note 13 - Earnings Per Common Share. During the nine months ended September 30, 2017,2020, in connection with employee stock plans, the Corporation issued approximately 66 million shares and repurchased approximately 27 million shares of its common stock and, to satisfy tax withholding obligations.obligations, repurchased 26 million shares of its common stock.At September 30, 2017,2020, the Corporation had reserved 873513 million unissued shares of common stock for future issuances under employee stock plans, common stock warrants, convertible notes and preferred stock.
On October 21, 2020 the Board declared a quarterly common stock dividend at the current rate of $0.18 per share.
Preferred Stock
During the three and nine months ended March 31, 2020, June 30, 2020 and September 30, 2017,2020, the Corporation recognizeddeclared $469 million, $249 million and $441 million of cash dividends of $465 million and $1.3 billion. There were no issuances ofon preferred stock, during the nine months ended September 30, 2017.
111Bankor a total of America
NOTE 12 Accumulated Other Comprehensive Income (Loss)
The table below presents the changes in accumulated OCI after-tax$1.2 billion for the nine months ended September 30, 20172020. On October 29, 2020, the
Corporation issued 44,000 shares of 4.375% Non-Cumulative Preferred Stock, Series NN for $1.1 billion, with quarterly dividends commencing in February 2021. The Series NN preferred stock has a liquidation preference of $25,000 per share and 2016.is subject to certain restrictions in the event the Corporation fails to declare and pay full dividends. For more information on the Corporation's preferred stock, including liquidation preference, dividend requirements and redemption period, see Note 14 – Shareholders’ Equity to the Consolidated Financial Statements of the Corporation’s 2019 Annual Report on Form 10-K.
|
| | | | | | | | | | | | | | | | | | | | | | | | | | | |
| | | | | | | | | | | | | | |
| (Dollars in millions) | Debt Securities | | Available-for-
Sale Marketable Equity Securities | | Debit Valuation Adjustments | | Derivatives | | Employee Benefit Plans | | Foreign Currency (1) | | Total |
| Balance, December 31, 2015 | $ | 16 |
| | $ | 62 |
| | $ | (611 | ) | | $ | (1,077 | ) | | $ | (2,956 | ) | | $ | (792 | ) | | $ | (5,358 | ) |
| Net change | 3,362 |
| | (43 | ) | | 49 |
| | 277 |
| | 29 |
| | (17 | ) | | 3,657 |
|
| Balance, September 30, 2016 | $ | 3,378 |
| | $ | 19 |
| | $ | (562 | ) | | $ | (800 | ) | | $ | (2,927 | ) | | $ | (809 | ) | | $ | (1,701 | ) |
| | | | | | | | | | | | | | |
| Balance, December 31, 2016 | $ | (1,299 | ) | | $ | 32 |
| | $ | (767 | ) | | $ | (895 | ) | | $ | (3,480 | ) | | $ | (879 | ) | | $ | (7,288 | ) |
| Net change | 945 |
| | (14 | ) | | (149 | ) | | 156 |
| | 80 |
| | 102 |
| | 1,120 |
|
| Balance, September 30, 2017 | $ | (354 | ) | | $ | 18 |
| | $ | (916 | ) | | $ | (739 | ) | | $ | (3,400 | ) | | $ | (777 | ) | | $ | (6,168 | ) |
The table below presents the net change in fair value recorded in accumulated OCI, net realized gains and losses reclassified into earnings and other changes for each component of OCI before- and after-tax for the nine months ended September 30, 2017 and 2016.
|
| | | | | | | | | | | | | | | | | | | | | | | |
| | | | | | | | | | | | |
| Changes in OCI Components Before- and After-tax | | | | | | | | |
| | Nine Months Ended September 30 |
| | 2017 | | 2016 |
| (Dollars in millions) | Before-tax | | Tax effect | | After-tax | | Before-tax | | Tax effect | | After-tax |
| Debt securities: | | | | | | | | | | | |
| Net increase in fair value | $ | 1,757 |
| | $ | (657 | ) | | $ | 1,100 |
| | $ | 5,896 |
| | $ | (2,239 | ) | | $ | 3,657 |
|
| Reclassifications into earnings: | | | | | | | | | | | |
| Gains on sales of debt securities | (278 | ) | | 106 |
| | (172 | ) | | (490 | ) | | 186 |
| | (304 | ) |
| Other income | 33 |
| | (16 | ) | | 17 |
| | 14 |
| | (5 | ) | | 9 |
|
| Net realized gains reclassified into earnings | (245 | ) | | 90 |
| | (155 | ) | | (476 | ) | | 181 |
| | (295 | ) |
| Net change | 1,512 |
| | (567 | ) | | 945 |
| | 5,420 |
| | (2,058 | ) | | 3,362 |
|
| Available-for-sale marketable equity securities: | | | | | | | | | | | |
| Net increase (decrease) in fair value | 45 |
| | (17 | ) | | 28 |
| | (70 | ) | | 27 |
| | (43 | ) |
Net realized gains reclassified into earnings (2) | (67 | ) | | 25 |
| | (42 | ) | | — |
| | — |
| | — |
|
| Net change | (22 | ) | | 8 |
| | (14 | ) | | (70 | ) | | 27 |
| | (43 | ) |
| Debit valuation adjustments: | | | | | | | | | | | |
| Net increase (decrease) in fair value | (255 | ) | | 96 |
| | (159 | ) | | 61 |
| | (23 | ) | | 38 |
|
Net realized losses reclassified into earnings (2) | 30 |
| | (20 | ) | | 10 |
| | 18 |
| | (7 | ) | | 11 |
|
| Net change | (225 | ) | | 76 |
| | (149 | ) | | 79 |
| | (30 | ) | | 49 |
|
| Derivatives: | | | | | | | | | | | |
| Net increase (decrease) in fair value | 79 |
| | (30 | ) | | 49 |
| | (64 | ) | | 23 |
| | (41 | ) |
| Reclassifications into earnings: | | | | | | | | | | | |
| Net interest income | 274 |
| | (103 | ) | | 171 |
| | 447 |
| | (167 | ) | | 280 |
|
| Personnel | (103 | ) | | 39 |
| | (64 | ) | | 61 |
| | (23 | ) | | 38 |
|
| Net realized losses reclassified into earnings | 171 |
| | (64 | ) | | 107 |
| | 508 |
| | (190 | ) | | 318 |
|
| Net change | 250 |
| | (94 | ) | | 156 |
| | 444 |
| | (167 | ) | | 277 |
|
| Employee benefit plans: | | | | | | | | | | | |
| Reclassifications into earnings: | | | | | | | | | | | |
| Prior service cost | 3 |
| | (1 | ) | | 2 |
| | 3 |
| | (1 | ) | | 2 |
|
| Net actuarial losses | 125 |
| | (47 | ) | | 78 |
| | 61 |
| | (24 | ) | | 37 |
|
Net realized losses reclassified into earnings (3) | 128 |
| | (48 | ) | | 80 |
| | 64 |
| | (25 | ) | | 39 |
|
| Settlements, curtailments and other | — |
| | — |
| | — |
| | — |
| | (10 | ) | | (10 | ) |
| Net change | 128 |
| | (48 | ) | | 80 |
| | 64 |
| | (35 | ) | | 29 |
|
| Foreign currency: | | | | | | | | | | | |
| Net increase (decrease) in fair value | (454 | ) | | 462 |
| | 8 |
| | 123 |
| | (140 | ) | | (17 | ) |
Net gains reclassified into earnings (1,2) | (608 | ) | | 702 |
| | 94 |
| | — |
| | — |
| | — |
|
| Net change | (1,062 | ) | | 1,164 |
| | 102 |
| | 123 |
| | (140 | ) | | (17 | ) |
| Total other comprehensive income (loss) | $ | 581 |
| | $ | 539 |
| | $ | 1,120 |
| | $ | 6,060 |
| | $ | (2,403 | ) | | $ | 3,657 |
|
| |
(1)
| The nine months ended September 30, 2017 included a pre-tax gain on derivatives and related income tax expense associated with the Corporation's net investment in its non-U.S. consumer credit card business, which was sold during the second quarter of 2017. The derivative gain was partially offset by a loss on the related foreign currency translation adjustment.
|
| |
(2)
| Reclassifications of pre-tax AFS marketable equity securities, DVA and foreign currency are recorded in other income in the Consolidated Statement of Income. |
| |
(3)
| Reclassifications of pre-tax employee benefit plan costs are recorded in personnel expense in the Consolidated Statement of Income. |
NOTE 13 12Earnings Per Common Share
The calculation of earnings per common share (EPS) and diluted EPS for the three and nine months ended September 30, 20172020 and 20162019 is presented below.on the following page. For more information on the calculation of EPS, see Note 1 – Summary of Significant Accounting Principles to the Consolidated Financial Statements of the Corporation's 2016Corporation’s 2019 Annual Report on Form 10-K.
| | | | | | | | | | | | Three Months Ended September 30 | | | Nine Months Ended September 30 | |
| | Three Months Ended September 30 | | Nine Months Ended September 30 | |
| (Dollars in millions, except per share information; shares in thousands) | 2017 | | 2016 | | 2017 | | 2016 | |
| (In millions, except per share information) | | (In millions, except per share information) | 2020 | | 2019 | | | 2020 | | 2019 | |
| Earnings per common share | |
| | |
| | | | |
| Earnings per common share | | | | | | | |
| Net income | $ | 5,587 |
| | $ | 4,955 |
| | $ | 15,712 |
| | $ | 13,210 |
| Net income | $ | 4,881 | | | $ | 5,777 | | | | $ | 12,424 | | | $ | 20,436 | | |
| Preferred stock dividends | (465 | ) | | (503 | ) | | (1,328 | ) | | (1,321 | ) | Preferred stock dividends | (441) | | | (505) | | | | (1,159) | | | (1,186) | | |
| Net income applicable to common shareholders | $ | 5,122 |
| | $ | 4,452 |
| | $ | 14,384 |
| | $ | 11,889 |
| Net income applicable to common shareholders | $ | 4,440 | | | $ | 5,272 | | | | $ | 11,265 | | | $ | 19,250 | | |
| | Average common shares issued and outstanding | 10,197,891 |
| | 10,250,124 |
| | 10,103,386 |
| | 10,312,878 |
| Average common shares issued and outstanding | 8,732.9 | | | 9,303.6 | | | | 8,762.6 | | | 9,516.2 | | |
| Earnings per common share | $ | 0.50 |
| | $ | 0.43 |
| | $ | 1.42 |
| | $ | 1.15 |
| Earnings per common share | $ | 0.51 | | | $ | 0.57 | | | | $ | 1.29 | | | $ | 2.02 | | |
| | | | | | | | | | | | | |
| Diluted earnings per common share | |
| | |
| | |
| | |
| Diluted earnings per common share | | | | | | | | | |
| | Net income applicable to common shareholders | $ | 5,122 |
| | $ | 4,452 |
| | $ | 14,384 |
| | $ | 11,889 |
| Net income applicable to common shareholders | $ | 4,440 | | | $ | 5,272 | | | | $ | 11,265 | | | $ | 19,250 | | |
Add preferred stock dividends due to assumed conversions (1) | 36 |
| | 75 |
| | 186 |
| | 225 |
| |
| Net income allocated to common shareholders | $ | 5,158 |
| | $ | 4,527 |
| | $ | 14,570 |
| | $ | 12,114 |
| |
| | Average common shares issued and outstanding | 10,197,891 |
| | 10,250,124 |
| | 10,103,386 |
| | 10,312,878 |
| Average common shares issued and outstanding | 8,732.9 | | | 9,303.6 | | | | 8,762.6 | | | 9,516.2 | | |
Dilutive potential common shares (2) | 527,591 |
| | 750,349 |
| | 717,039 |
| | 733,929 |
| |
Dilutive potential common shares (1) | | Dilutive potential common shares (1) | 44.6 | | | 49.4 | | | | 37.9 | | | 49.5 | | |
| Total diluted average common shares issued and outstanding | 10,725,482 |
| | 11,000,473 |
| | 10,820,425 |
| | 11,046,807 |
| Total diluted average common shares issued and outstanding | 8,777.5 | | | 9,353.0 | | | | 8,800.5 | | | 9,565.7 | | |
| Diluted earnings per common share | $ | 0.48 |
| | $ | 0.41 |
| | $ | 1.35 |
| | $ | 1.10 |
| Diluted earnings per common share | $ | 0.51 | | | $ | 0.56 | | | | $ | 1.28 | | | $ | 2.01 | | |
| |
(1)
| Represents the Series T dividends under the "if-converted" method prior to conversion. |
| |
(2)
| (1)Includes incremental dilutive shares from restricted stock units, restricted stock and warrants. |
In connection with an investment in the Corporation’s Series T preferred stock in 2011, the Series T holders also received warrants to purchase 700 million shares of the Corporation’s commonunits, restricted stock at an exercise price of $7.142857 per share. On August 24, 2017, the Series T holders exercised the warrants and acquired the 700 million shares of the Corporation’s common stock using the Series T preferred stock as consideration for the exercise price, which increased common shares outstanding, but had no effect on diluted earnings per share as this conversion had been included in the Corporation’s diluted earnings per share calculation under the applicable accounting guidance. The use of the Series T preferred stock as consideration represents a non-cash financing activity and, accordingly, is not reflected in the Consolidated Statement of Cash Flows. For the three and nine months ended September 30, 2016, the 700 million average dilutive potential common shares were included in the diluted share count under the “if-converted” method.warrants.
For both the three and nine months ended September 30, 20172020 and 2016,2019, 62 million average dilutive potential common shares associated with the Series L preferred stock were not included in the diluted share count because the result would have been antidilutive under the “if-converted” method. For
NOTE 13Accumulated Other Comprehensive Income (Loss)
The table below presents the three andchanges in accumulated OCI after-tax for the nine months ended September 30, 2017, average options to purchase 18 million2020 and 22 millionshares2019.
| | | | | | | | | | | | | | | | | | | | | | | | | | | | | | | | | | | |
| | | | | | | | | | | |
| (Dollars in millions) | Debt Securities | | Debit Valuation Adjustments | | Derivatives | | Employee
Benefit Plans | | Foreign
Currency | | Total |
| Balance, December 31, 2019 | $ | 323 | | | $ | (1,494) | | | $ | (400) | | | $ | (4,168) | | | $ | (894) | | | $ | (6,633) | |
| Net change | 4,794 | | | (5) | | | 808 | | | 144 | | | (86) | | | 5,655 | |
| Balance, September 30, 2020 | $ | 5,117 | | | $ | (1,499) | | | $ | 408 | | | $ | (4,024) | | | $ | (980) | | | $ | (978) | |
| | | | | | | | | | | |
| Balance, December 31, 2018 | $ | (5,552) | | | $ | (531) | | | $ | (1,016) | | | $ | (4,304) | | | $ | (808) | | | $ | (12,211) | |
| Net change | 6,231 | | | (272) | | | 651 | | | 83 | | | (99) | | | 6,594 | |
| Balance, September 30, 2019 | $ | 679 | | | $ | (803) | | | $ | (365) | | | $ | (4,221) | | | $ | (907) | | | $ | (5,617) | |
The table below presents the net change in fair value recorded in accumulated OCI, net realized gains and losses reclassified into earnings and other changes for each component of common stock were outstanding but not included in the computation of EPS because the result would have been antidilutive under the treasury stock method compared to 42 millionOCI pre- and 46 millionafter-tax for the same periods in 2016. For both the three and nine months ended September 30, 20172020 and 2016, average warrants to purchase 122 million shares2019.
| | | | | | | | | | | | | | | | | | | | | | | | | | | | | | | | | | | | | | | | | |
| | | | | | | | | | | | | | | | | |
| | | | | | | | | | | | | | |
| | | | | | | |
| Pretax | | Tax
effect | | After-
tax | | Pretax | | Tax
effect | | After-
tax | | | | | | |
| Nine Months Ended September 30 | | | | | | |
| (Dollars in millions) | 2020 | | 2019 | | |
| Debt securities: | | | | | | | | | | | | | | | | | |
| | | | | | | | | | | | | | | | | |
| | | | | | | | | | | | | | | | | |
| | | | | | | | | | | | | | | | | |
| Net increase in fair value | $ | 6,763 | | | $ | (1,685) | | | $ | 5,078 | | | $ | 8,388 | | | $ | (2,087) | | | $ | 6,301 | | | | | | | |
| | | | | | | | | | | | | | | | | |
| | | | | | | | | | | | | | | | | |
| | | | | | | | | | | | | | | | | |
Net realized (gains) reclassified into earnings (1) | (379) | | | 95 | | | (284) | | | (93) | | | 23 | | | (70) | | | | | | | |
| | | | | | | | | | | | | | | | | |
| Net change | 6,384 | | | (1,590) | | | 4,794 | | | 8,295 | | | (2,064) | | | 6,231 | | | | | | | |
| | | | | | | | | | | | | | | | | |
| | | | | | | | | | | | | | | | | |
| | | | | | | | | | | | | | | | | |
| | | | | | | | | | | | | | | | | |
| Debit valuation adjustments: | | | | | | | | | | | | | | | | | |
| Net (decrease) in fair value | (13) | | | 5 | | | (8) | | | (368) | | | 83 | | | (285) | | | | | | | |
Net realized losses reclassified into earnings (1) | 4 | | | (1) | | | 3 | | | 16 | | | (3) | | | 13 | | | | | | | |
| | | | | | | | | | | | | | | | | |
| Net change | (9) | | | 4 | | | (5) | | | (352) | | | 80 | | | (272) | | | | | | | |
| Derivatives: | | | | | | | | | | | | | | | | | |
| Net increase in fair value | 977 | | | (238) | | | 739 | | | 765 | | | (173) | | | 592 | | | | | | | |
| Reclassifications into earnings: | | | | | | | | | | | | | | | | | |
| Net interest income | 96 | | | (23) | | | 73 | | | 78 | | | (19) | | | 59 | | | | | | | |
| | | | | | | | | | | | | | | | | |
| | | | | | | | | | | | | | | | | |
| Compensation and benefits expense | (5) | | | 1 | | | (4) | | | 0 | | | 0 | | | 0 | | | | | | | |
| Net realized losses reclassified into earnings | 91 | | | (22) | | | 69 | | | 78 | | | (19) | | | 59 | | | | | | | |
| | | | | | | | | | | | | | | | | |
| Net change | 1,068 | | | (260) | | | 808 | | | 843 | | | (192) | | | 651 | | | | | | | |
| Employee benefit plans: | | | | | | | | | | | | | | | | | |
| | | | | | | | | | | | | | | | | |
| | | | | | | | | | | | | | | | | |
| | | | | | | | | | | | | | | | | |
| | | | | | | | | | | | | | | | | |
Net actuarial losses and other reclassified into earnings (2) | 191 | | | (47) | | | 144 | | | 109 | | | (26) | | | 83 | | | | | | | |
| | | | | | | | | | | | | | | | | |
| Net change | 191 | | | (47) | | | 144 | | | 109 | | | (26) | | | 83 | | | | | | | |
| Foreign currency: | | | | | | | | | | | | | | | | | |
| Net (decrease) in fair value | (29) | | | (57) | | | (86) | | | 114 | | | (185) | | | (71) | | | | | | | |
Net realized (gains) reclassified into earnings (1) | 0 | | | — | | | 0 | | | (117) | | | 89 | | | (28) | | | | | | | |
| | | | | | | | | | | | | | | | | |
| Net change | (29) | | | (57) | | | (86) | | | (3) | | | (96) | | | (99) | | | | | | | |
| Total other comprehensive income (loss) | $ | 7,605 | | | $ | (1,950) | | | $ | 5,655 | | | $ | 8,892 | | | $ | (2,298) | | | $ | 6,594 | | | | | | | |
(1) Reclassifications of common stock were outstanding but not includedpretax debt securities, DVA and foreign currency (gains) losses are recorded in the
computation of EPS because the result would have been antidilutive under the treasury stock method, and average warrants to purchase 150 million shares of common stock were includedother income in the diluted EPS calculation underConsolidated Statement of Income.
(2) Reclassifications of pretax employee benefit plan costs are recorded in other general operating expense in the treasury stock method.Consolidated Statement of Income.
NOTE 14Fair Value Measurements
Under applicable accounting standards, fair value is defined as the exchange price that would be received for an asset or paid to transfer a liability (an exit price) in the principal or most advantageous market for the asset or liability in an orderly transaction between market participants on the measurement date. The Corporation determines the fair values of its financial instruments under applicable accounting standards and conducts a review of its fair value hierarchy classifications on a quarterly basis. Transfers into or out of fair value hierarchy classifications are considered to be effective asmade if the significant inputs used in the financial models measuring the fair values of the beginning ofassets and liabilities become unobservable or observable in the quarter in which they occur.current
marketplace. During the nine months ended September 30, 2017,2020, there were no changes to valuation approaches or techniques that had, or are expected to have, a material impact on the Corporation’s consolidated financial position or results of operations.
For more information regarding the fair value hierarchy, and how the Corporation measures fair value and valuation processes and techniques, see Note 1 – Summary of Significant Accounting Principles and Note 2021 – Fair Value Measurements to the Consolidated Financial Statements of the Corporation's 2016Corporation’s 2019 Annual Report on Form 10-K. The Corporation accounts for certain financial instruments under the fair value option. For additionalmore information, see Note 15 – Fair Value Option.
Assets and liabilities carried at fair value on a recurring basis at September 30, 20172020 and December 31, 2016,2019, including financial instruments whichthat the Corporation accounts for under the fair value option, are summarized in the following tables.
| | | | | | | | | | | | | | | | | | | | | | | | | | | | | |
| | | | | | | | | |
| September 30, 2020 |
| | Fair Value Measurements | | | | |
| (Dollars in millions) | Level 1 | | Level 2 | | Level 3 | | Netting Adjustments (1) | | Assets/Liabilities at Fair Value |
| Assets | | | | | | | | | |
| Time deposits placed and other short-term investments | $ | 385 | | | $ | 0 | | | $ | 0 | | | $ | — | | | $ | 385 | |
| Federal funds sold and securities borrowed or purchased under agreements to resell | 0 | | | 103,101 | | | 0 | | | — | | | 103,101 | |
| Trading account assets: | | | | | | | | | |
| U.S. Treasury and agency securities | 43,143 | | | 2,439 | | | 0 | | | — | | | 45,582 | |
| Corporate securities, trading loans and other | 0 | | | 25,438 | | | 1,470 | | | — | | | 26,908 | |
| Equity securities | 82,015 | | | 34,097 | | | 207 | | | — | | | 116,319 | |
| Non-U.S. sovereign debt | 10,003 | | | 26,455 | | | 290 | | | — | | | 36,748 | |
| Mortgage trading loans, MBS and ABS: | | | | | | | | | |
U.S. government-sponsored agency guaranteed (2) | 0 | | | 20,896 | | | 133 | | | — | | | 21,029 | |
| Mortgage trading loans, ABS and other MBS | 0 | | | 7,277 | | | 1,637 | | | — | | | 8,914 | |
Total trading account assets (3) | 135,161 | | | 116,602 | | | 3,737 | | | — | | | 255,500 | |
| Derivative assets | 16,129 | | | 399,497 | | | 2,498 | | | (373,827) | | | 44,297 | |
| AFS debt securities: | | | | | | | | | |
| U.S. Treasury and agency securities | 101,693 | | | 1,185 | | | 0 | | | — | | | 102,878 | |
| Mortgage-backed securities: | | | | | | | | | |
| Agency | 0 | | | 69,864 | | | 0 | | | — | | | 69,864 | |
| Agency-collateralized mortgage obligations | 0 | | | 5,837 | | | 0 | | | — | | | 5,837 | |
| Non-agency residential | 0 | | | 843 | | | 440 | | | — | | | 1,283 | |
| Commercial | 0 | | | 16,206 | | | 0 | | | — | | | 16,206 | |
| Non-U.S. securities | 0 | | | 16,340 | | | 14 | | | — | | | 16,354 | |
| | | | | | | | | |
| Other taxable securities | 0 | | | 3,608 | | | 68 | | | — | | | 3,676 | |
| Tax-exempt securities | 0 | | | 17,414 | | | 180 | | | — | | | 17,594 | |
| Total AFS debt securities | 101,693 | | | 131,297 | | | 702 | | | — | | | 233,692 | |
| Other debt securities carried at fair value: | | | | | | | | | |
| U.S. Treasury and agency securities | 3 | | | 0 | | | 0 | | | — | | | 3 | |
| | | | | | | | | |
| | | | | | | | | |
| | | | | | | | | |
| Non-agency residential MBS | 0 | | | 751 | | | 458 | | | — | | | 1,209 | |
| | | | | | | | | |
| | | | | | | | | |
| | | | | | | | | |
| Non-U.S. and other securities | 5,961 | | | 5,132 | | | 0 | | | — | | | 11,093 | |
| Total other debt securities carried at fair value | 5,964 | | | 5,883 | | | 458 | | | — | | | 12,305 | |
| Loans and leases | 0 | | | 6,609 | | | 625 | | | — | | | 7,234 | |
| Loans held-for-sale | 0 | | | 983 | | | 922 | | | — | | | 1,905 | |
| | | | | | | | | |
| | | | | | | | | |
Other assets (4) | 6,802 | | | 4,048 | | | 1,875 | | | — | | | 12,725 | |
| | | | | | | | | |
Total assets (5) | $ | 266,134 | | | $ | 768,020 | | | $ | 10,817 | | | $ | (373,827) | | | $ | 671,144 | |
| | | | | | | | | |
| Liabilities | | | | | | | | | |
| Interest-bearing deposits in U.S. offices | $ | 0 | | | $ | 626 | | | $ | 0 | | | $ | — | | | $ | 626 | |
| Federal funds purchased and securities loaned or sold under agreements to repurchase | 0 | | | 132,322 | | | 0 | | | — | | | 132,322 | |
| Trading account liabilities: | | | | | | | | | |
| U.S. Treasury and agency securities | 11,013 | | | 200 | | | 0 | | | — | | | 11,213 | |
| Equity securities | 40,609 | | | 5,390 | | | 1 | | | — | | | 46,000 | |
| Non-U.S. sovereign debt | 9,966 | | | 10,731 | | | 0 | | | — | | | 20,697 | |
| Corporate securities and other | 0 | | | 6,755 | | | 16 | | | — | | | 6,771 | |
| | | | | | | | | |
| Total trading account liabilities | 61,588 | | | 23,076 | | | 17 | | | — | | | 84,681 | |
| Derivative liabilities | 17,292 | | | 389,769 | | | 6,029 | | | (371,362) | | | 41,728 | |
| Short-term borrowings | 0 | | | 4,577 | | | 0 | | | — | | | 4,577 | |
| Accrued expenses and other liabilities | 8,530 | | | 4,235 | | | 0 | | | — | | | 12,765 | |
| Long-term debt | 0 | | | 29,485 | | | 970 | | | — | | | 30,455 | |
Total liabilities (5) | $ | 87,410 | | | $ | 584,090 | | | $ | 7,016 | | | $ | (371,362) | | | $ | 307,154 | |
| | | | | | | | | |
|
| | | | | | | | | | | | | | | | | | | |
| | | | | | | | | | |
| | September 30, 2017 |
| | Fair Value Measurements | | | | |
| (Dollars in millions) | Level 1 | | Level 2 | | Level 3 | | Netting Adjustments (1) | | Assets/Liabilities at Fair Value |
| Assets | |
| | |
| | |
| | |
| | |
|
| Federal funds sold and securities borrowed or purchased under agreements to resell | $ | — |
| | $ | 56,780 |
| | $ | — |
| | $ | — |
| | $ | 56,780 |
|
| Trading account assets: | |
| | |
| | |
| | |
| | |
|
U.S. Treasury and agency securities (2) | 32,688 |
| | 589 |
| | — |
| | — |
| | 33,277 |
|
| Corporate securities, trading loans and other | 535 |
| | 27,760 |
| | 1,742 |
| | — |
| | 30,037 |
|
| Equity securities | 58,886 |
| | 29,149 |
| | 244 |
| | — |
| | 88,279 |
|
| Non-U.S. sovereign debt | 16,623 |
| | 14,346 |
| | 552 |
| | — |
| | 31,521 |
|
| Mortgage trading loans, MBS and ABS: | | | | | | | | | |
U.S. government-sponsored agency guaranteed (2) | — |
| | 18,973 |
| | — |
| | — |
| | 18,973 |
|
| Mortgage trading loans, ABS and other MBS | — |
| | 6,980 |
| | 1,252 |
| | — |
| | 8,232 |
|
Total trading account assets (3) | 108,732 |
| | 97,797 |
| | 3,790 |
| | — |
| | 210,319 |
|
Derivative assets (4, 5) | 6,756 |
| | 360,066 |
| | 3,878 |
| | (332,316 | ) | | 38,384 |
|
| AFS debt securities: | |
| | |
| | |
| | |
| | |
|
| U.S. Treasury and agency securities | 48,591 |
| | 1,677 |
| | — |
| | — |
| | 50,268 |
|
| Mortgage-backed securities: | |
| | |
| | |
| | |
| | |
|
| Agency | — |
| | 196,194 |
| | — |
| | — |
| | 196,194 |
|
| Agency-collateralized mortgage obligations | — |
| | 7,049 |
| | — |
| | — |
| | 7,049 |
|
| Non-agency residential | — |
| | 2,657 |
| | — |
| | — |
| | 2,657 |
|
| Commercial | — |
| | 12,464 |
| | — |
| | — |
| | 12,464 |
|
| Non-U.S. securities | 774 |
| | 4,630 |
| | 36 |
| | — |
| | 5,440 |
|
| Other taxable securities | — |
| | 6,555 |
| | 483 |
| | — |
| | 7,038 |
|
| Tax-exempt securities | — |
| | 18,725 |
| | 467 |
| | — |
| | 19,192 |
|
| Total AFS debt securities | 49,365 |
| | 249,951 |
| | 986 |
| | — |
| | 300,302 |
|
| Other debt securities carried at fair value: | | | | | | | | | |
| Mortgage-backed securities: | | | | | | | | | |
| Agency-collateralized mortgage obligations | — |
| | 5 |
| | — |
| | — |
| | 5 |
|
| Non-agency residential | — |
| | 3,036 |
| | 22 |
| | — |
| | 3,058 |
|
| Non-U.S. securities | 11,911 |
| | 1,349 |
| | — |
| | — |
| | 13,260 |
|
| Other taxable securities | — |
| | 239 |
| | — |
| | — |
| | 239 |
|
| Total other debt securities carried at fair value | 11,911 |
| | 4,629 |
| | 22 |
| | — |
| | 16,562 |
|
| Loans and leases | — |
| | 5,667 |
| | 618 |
| | — |
| | 6,285 |
|
Mortgage servicing rights (6) | — |
| | — |
| | 2,407 |
| | — |
| | 2,407 |
|
| Loans held-for-sale | — |
| | 2,353 |
| | 775 |
| | — |
| | 3,128 |
|
| Customer and other receivables | — |
| | 230 |
| | — |
| | — |
| | 230 |
|
| Other assets | 17,991 |
| | 1,083 |
| | 267 |
| | — |
| | 19,341 |
|
| Total assets | $ | 194,755 |
| | $ | 778,556 |
| | $ | 12,743 |
| | $ | (332,316 | ) | | $ | 653,738 |
|
| Liabilities | |
| | |
| | |
| | |
| | |
|
| Interest-bearing deposits in U.S. offices | $ | — |
| | $ | 468 |
| | $ | — |
| | $ | — |
| | $ | 468 |
|
| Federal funds purchased and securities loaned or sold under agreements to repurchase | — |
| | 38,852 |
| | — |
| | — |
| | 38,852 |
|
| Trading account liabilities: | |
| | |
| | |
| | |
| | |
| U.S. Treasury and agency securities | 20,390 |
| | 366 |
| | — |
| | — |
| | 20,756 |
|
| Equity securities | 31,647 |
| | 4,018 |
| | — |
| | — |
| | 35,665 |
|
| Non-U.S. sovereign debt | 16,606 |
| | 4,118 |
| | — |
| | — |
| | 20,724 |
|
| Corporate securities and other | 211 |
| | 9,053 |
| | 25 |
| | — |
| | 9,289 |
|
| Total trading account liabilities | 68,854 |
| | 17,555 |
| | 25 |
| | — |
| | 86,434 |
|
Derivative liabilities (4, 5) | 6,589 |
| | 349,863 |
| | 5,901 |
| | (330,572 | ) | | 31,781 |
|
| Short-term borrowings | — |
| | 1,904 |
| | — |
| | — |
| | 1,904 |
|
| Accrued expenses and other liabilities | 21,121 |
| | 1,239 |
| | 9 |
| | — |
| | 22,369 |
|
| Long-term debt | — |
| | 28,007 |
| | 1,890 |
| | — |
| | 29,897 |
|
| Total liabilities | $ | 96,564 |
| | $ | 437,888 |
| | $ | 7,825 |
| | $ | (330,572 | ) | | $ | 211,705 |
|
| |
(1)
| Amounts represent the impact of legally enforceable master netting agreements and also cash collateral held or placed with the same counterparties. |
| |
(2)
| Includes $19.5 billion of GSE obligations.
|
| |
(3)
| Includes securities with a fair value of $15.3 billion that were segregated in compliance with securities regulations or deposited with clearing organizations. This amount is included in the parenthetical disclosure on the Consolidated Balance Sheet.
|
| |
(4)
| During the nine months ended September 30, 2017, $3.0 billion of derivative assets and $2.4 billion of derivative liabilities were transferred from Level 1 to Level 2 and $543 million of derivative assets and $496 million of derivative liabilities were transferred from Level 2 to Level 1 based on the inputs used to measure fair value. For further disaggregation of derivative assets and liabilities, see Note 2 – Derivatives.
|
| |
(5)
| Derivative assets and liabilities reflect the effects of contractual amendments by two central clearing counterparties to legally re-characterize daily cash variation margin from collateral, which secures an outstanding exposure, to settlement, which discharges an outstanding exposure. One of these central clearing counterparties amended its governing documents, which became effective in January 2017. In addition, the Corporation elected to transfer its existing positions to the settlement platform for the other central clearing counterparty in September 2017.
|
| |
(6)
| MSRs include the $1.7 billion core MSR portfolio held in Consumer Banking, the $162 million non-core MSR portfolio held in All Other and the $518 million non-U.S. MSR portfolio held in Global Markets.
|
(2)Includes $21.5 billion of GSE obligations.
(3)Includes securities with a fair value of $13.6 billion that were segregated in compliance with securities regulations or deposited with clearing organizations. This amount is included in the parenthetical disclosure on the Consolidated Balance Sheet.
(4)Includes MSRs of $1.1 billionwhich are classified as Level 3 assets.
(5)Total recurring Level 3 assets were 0.40 percent of total consolidated assets, and total recurring Level 3 liabilities were 0.28 percent of total consolidated liabilities.
| | | | | | | | | | | | | | | | | | | | | | | | | | | | | |
| | | | | | | | | |
| December 31, 2019 |
| Fair Value Measurements | | | | |
| (Dollars in millions) | Level 1 | | Level 2 | | Level 3 | | Netting Adjustments (1) | | Assets/Liabilities at Fair Value |
| Assets | | | | | | | | | |
| Time deposits placed and other short-term investments | $ | 1,000 | | | $ | 0 | | | $ | 0 | | | $ | — | | | $ | 1,000 | |
| Federal funds sold and securities borrowed or purchased under agreements to resell | 0 | | | 50,364 | | | 0 | | | — | | | 50,364 | |
| Trading account assets: | | | | | | | | | |
| U.S. Treasury and agency securities | 49,517 | | | 4,157 | | | 0 | | | — | | | 53,674 | |
| Corporate securities, trading loans and other | 0 | | | 25,226 | | | 1,507 | | | — | | | 26,733 | |
| Equity securities | 53,597 | | | 32,619 | | | 239 | | | — | | | 86,455 | |
| Non-U.S. sovereign debt | 3,965 | | | 23,854 | | | 482 | | | — | | | 28,301 | |
| Mortgage trading loans, MBS and ABS: | | | | | | | | | |
U.S. government-sponsored agency guaranteed (2) | 0 | | | 24,324 | | | 0 | | | — | | | 24,324 | |
| Mortgage trading loans, ABS and other MBS | 0 | | | 8,786 | | | 1,553 | | | — | | | 10,339 | |
Total trading account assets (3) | 107,079 | | | 118,966 | | | 3,781 | | | — | | | 229,826 | |
| Derivative assets | 14,079 | | | 328,442 | | | 2,226 | | | (304,262) | | | 40,485 | |
| AFS debt securities: | | | | | | | | | |
| U.S. Treasury and agency securities | 67,332 | | | 1,196 | | | 0 | | | — | | | 68,528 | |
| Mortgage-backed securities: | | | | | | | | | |
| Agency | 0 | | | 122,528 | | | 0 | | | — | | | 122,528 | |
| Agency-collateralized mortgage obligations | 0 | | | 4,641 | | | 0 | | | — | | | 4,641 | |
| Non-agency residential | 0 | | | 653 | | | 424 | | | — | | | 1,077 | |
| Commercial | 0 | | | 15,021 | | | 0 | | | — | | | 15,021 | |
| Non-U.S. securities | 0 | | | 11,989 | | | 2 | | | — | | | 11,991 | |
| | | | | | | | | |
| Other taxable securities | 0 | | | 3,876 | | | 65 | | | — | | | 3,941 | |
| Tax-exempt securities | 0 | | | 17,804 | | | 108 | | | — | | | 17,912 | |
| Total AFS debt securities | 67,332 | | | 177,708 | | | 599 | | | — | | | 245,639 | |
| Other debt securities carried at fair value: | | | | | | | | | |
| U.S. Treasury and agency securities | 3 | | | 0 | | | 0 | | | — | | | 3 | |
| | | | | | | | | |
| Agency MBS | 0 | | | 3,003 | | | 0 | | | — | | | 3,003 | |
| Non-agency residential MBS | 0 | | | 1,035 | | | 299 | | | — | | | 1,334 | |
| | | | | | | | | |
| | | | | | | | | |
| | | | | | | | | |
| Non-U.S. and other securities | 400 | | | 6,088 | | | 0 | | | — | | | 6,488 | |
| Total other debt securities carried at fair value | 403 | | | 10,126 | | | 299 | | | — | | | 10,828 | |
| Loans and leases | 0 | | | 7,642 | | | 693 | | | — | | | 8,335 | |
| Loans held-for-sale | 0 | | | 3,334 | | | 375 | | | — | | | 3,709 | |
Other assets (4) | 11,782 | | | 1,376 | | | 2,360 | | | — | | | 15,518 | |
| | | | | | | | | |
Total assets (5) | $ | 201,675 | | | $ | 697,958 | | | $ | 10,333 | | | $ | (304,262) | | | $ | 605,704 | |
| | | | | | | | | |
| Liabilities | | | | | | | | | |
| Interest-bearing deposits in U.S. offices | $ | 0 | | | $ | 508 | | | $ | 0 | | | $ | — | | | $ | 508 | |
| Federal funds purchased and securities loaned or sold under agreements to repurchase | 0 | | | 16,008 | | | 0 | | | — | | | 16,008 | |
| Trading account liabilities: | | | | | | | | | |
| U.S. Treasury and agency securities | 13,140 | | | 282 | | | 0 | | | — | | | 13,422 | |
| Equity securities | 38,148 | | | 4,144 | | | 2 | | | — | | | 42,294 | |
| Non-U.S. sovereign debt | 10,751 | | | 11,310 | | | 0 | | | — | | | 22,061 | |
| Corporate securities and other | 0 | | | 5,478 | | | 15 | | | — | | | 5,493 | |
| Total trading account liabilities | 62,039 | | | 21,214 | | | 17 | | | — | | | 83,270 | |
| Derivative liabilities | 11,904 | | | 320,479 | | | 4,764 | | | (298,918) | | | 38,229 | |
| Short-term borrowings | 0 | | | 3,941 | | | 0 | | | — | | | 3,941 | |
| Accrued expenses and other liabilities | 13,927 | | | 1,507 | | | 0 | | | — | | | 15,434 | |
| Long-term debt | 0 | | | 33,826 | | | 1,149 | | | — | | | 34,975 | |
Total liabilities (5) | $ | 87,870 | | | $ | 397,483 | | | $ | 5,930 | | | $ | (298,918) | | | $ | 192,365 | |
| | | | | | | | | |
(1)Amounts represent the impact of legally enforceable master netting agreements and also cash collateral held or placed with the same counterparties.
(2)Includes $26.7 billion of GSE obligations.
(3)Includes securities with a fair value of $14.7 billion that were segregated in compliance with securities regulations or deposited with clearing organizations. This amount is included in the parenthetical disclosure on the Consolidated Balance Sheet.
(4)Includes MSRs of $1.5 billion which are classified as Level 3 assets.
(5)Total recurring Level 3 assets were 0.42 percent of total consolidated assets, and total recurring Level 3 liabilities were 0.27 percent of total consolidated liabilities.
Bank of America114
|
| | | | | | | | | | | | | | | | | | | |
| | | | | | | | | | |
| | December 31, 2016 |
| | Fair Value Measurements | | | | |
| (Dollars in millions) | Level 1 | | Level 2 | | Level 3 | | Netting Adjustments (1) | | Assets/Liabilities at Fair Value |
| Assets | |
| | |
| | |
| | |
| | |
|
| Federal funds sold and securities borrowed or purchased under agreements to resell | $ | — |
| | $ | 49,750 |
| | $ | — |
| | $ | — |
| | $ | 49,750 |
|
| Trading account assets: | |
| | |
| | |
| | |
| | |
|
U.S. Treasury and agency securities (2) | 34,587 |
| | 1,927 |
| | — |
| | — |
| | 36,514 |
|
| Corporate securities, trading loans and other | 171 |
| | 22,861 |
| | 2,777 |
| | — |
| | 25,809 |
|
| Equity securities | 50,169 |
| | 21,601 |
| | 281 |
| | — |
| | 72,051 |
|
| Non-U.S. sovereign debt | 9,578 |
| | 9,940 |
| | 510 |
| | — |
| | 20,028 |
|
| Mortgage trading loans, MBS and ABS: | | | | | | | | | |
U.S. government-sponsored agency guaranteed (2) | — |
| | 15,799 |
| | — |
| | — |
| | 15,799 |
|
| Mortgage trading loans, ABS and other MBS | — |
| | 8,797 |
| | 1,211 |
| | — |
| | 10,008 |
|
Total trading account assets (3) | 94,505 |
| | 80,925 |
| | 4,779 |
| | — |
| | 180,209 |
|
Derivative assets (4) | 7,337 |
| | 619,848 |
| | 3,931 |
| | (588,604 | ) | | 42,512 |
|
| AFS debt securities: | |
| | |
| | |
| | |
| | |
|
| U.S. Treasury and agency securities | 46,787 |
| | 1,465 |
| | — |
| | — |
| | 48,252 |
|
| Mortgage-backed securities: | |
| | |
| | |
| | |
| | |
|
| Agency | — |
| | 189,486 |
| | — |
| | — |
| | 189,486 |
|
| Agency-collateralized mortgage obligations | — |
| | 8,330 |
| | — |
| | — |
| | 8,330 |
|
| Non-agency residential | — |
| | 2,013 |
| | — |
| | — |
| | 2,013 |
|
| Commercial | — |
| | 12,322 |
| | — |
| | — |
| | 12,322 |
|
| Non-U.S. securities | 1,934 |
| | 3,600 |
| | 229 |
| | — |
| | 5,763 |
|
| Other taxable securities | — |
| | 10,020 |
| | 594 |
| | — |
| | 10,614 |
|
| Tax-exempt securities | — |
| | 16,618 |
| | 542 |
| | — |
| | 17,160 |
|
| Total AFS debt securities | 48,721 |
| | 243,854 |
| | 1,365 |
| | — |
| | 293,940 |
|
| Other debt securities carried at fair value: | | | | | | | | | |
| Mortgage-backed securities: | | | | | | | | | |
| Agency-collateralized mortgage obligations | — |
| | 5 |
| | — |
| | — |
| | 5 |
|
| Non-agency residential | — |
| | 3,114 |
| | 25 |
| | — |
| | 3,139 |
|
| Non-U.S. securities | 15,109 |
| | 1,227 |
| | — |
| | — |
| | 16,336 |
|
| Other taxable securities | — |
| | 240 |
| | — |
| | — |
| | 240 |
|
| Total other debt securities carried at fair value | 15,109 |
| | 4,586 |
| | 25 |
| | — |
| | 19,720 |
|
| Loans and leases | — |
| | 6,365 |
| | 720 |
| | — |
| | 7,085 |
|
Mortgage servicing rights (5) | — |
| | — |
| | 2,747 |
| | — |
| | 2,747 |
|
| Loans held-for-sale | — |
| | 3,370 |
| | 656 |
| | — |
| | 4,026 |
|
| Debt securities in assets of business held for sale | 619 |
| | — |
| | — |
| | — |
| | 619 |
|
| Other assets | 11,824 |
| | 1,739 |
| | 239 |
| | — |
| | 13,802 |
|
| Total assets | $ | 178,115 |
| | $ | 1,010,437 |
| | $ | 14,462 |
| | $ | (588,604 | ) | | $ | 614,410 |
|
| Liabilities | |
| | |
| | |
| | |
| | |
|
| Interest-bearing deposits in U.S. offices | $ | — |
| | $ | 731 |
| | $ | — |
| | $ | — |
| | $ | 731 |
|
| Federal funds purchased and securities loaned or sold under agreements to repurchase | — |
| | 35,407 |
| | 359 |
| | — |
| | 35,766 |
|
| Trading account liabilities: | |
| | |
| | |
| | |
| | |
| U.S. Treasury and agency securities | 15,854 |
| | 197 |
| | — |
| | — |
| | 16,051 |
|
| Equity securities | 25,884 |
| | 3,014 |
| | — |
| | — |
| | 28,898 |
|
| Non-U.S. sovereign debt | 9,409 |
| | 2,103 |
| | — |
| | — |
| | 11,512 |
|
| Corporate securities and other | 163 |
| | 6,380 |
| | 27 |
| | — |
| | 6,570 |
|
| Total trading account liabilities | 51,310 |
| | 11,694 |
| | 27 |
| | — |
| | 63,031 |
|
Derivative liabilities (4) | 7,173 |
| | 615,896 |
| | 5,244 |
| | (588,833 | ) | | 39,480 |
|
| Short-term borrowings | — |
| | 2,024 |
| | — |
| | — |
| | 2,024 |
|
| Accrued expenses and other liabilities | 12,978 |
| | 1,643 |
| | 9 |
| | — |
| | 14,630 |
|
| Long-term debt | — |
| | 28,523 |
| | 1,514 |
| | — |
| | 30,037 |
|
| Total liabilities | $ | 71,461 |
| | $ | 695,918 |
| | $ | 7,153 |
| | $ | (588,833 | ) | | $ | 185,699 |
|
| |
(1)
| Amounts represent the impact of legally enforceable master netting agreements and also cash collateral held or placed with the same counterparties. |
| |
(2)
| Includes $17.5 billion of GSE obligations.
|
| |
(3)
| Includes securities with a fair value of $14.6 billion that were segregated in compliance with securities regulations or deposited with clearing organizations. This amount is included in the parenthetical disclosure on the Consolidated Balance Sheet.
|
| |
(4)
| During 2016, $2.3 billion of derivative assets and $2.4 billion of derivative liabilities were transferred from Level 1 to Level 2 and $2.0 billion of derivative assets and $1.8 billion of derivative liabilities were transferred from Level 2 to Level 1 based on the inputs used to measure fair value. For further disaggregation of derivative assets and liabilities, see Note 2 – Derivatives.
|
| |
(5)
| MSRs include the $2.1 billion core MSR portfolio held in Consumer Banking, the $212 million non-core MSR portfolio held in All Other and the $469 million non-U.S. MSR portfolio held in Global Markets.
|
The following tables present a reconciliation of all assets and liabilities measured at fair value on a recurring basis using significant unobservable inputs (Level 3) during the three and nine months ended September 30, 20172020 and 2016,2019, including net realized and unrealized gains (losses) included in earnings and accumulated OCI.
|
| | | | | | | | | | | | | | | | | | | | | | | | | | | | | | | | | |
| | | | | | | | | | | | |
Level 3 – Fair Value Measurements (1) | | | | | | | | |
| | Three Months Ended September 30, 2017 | |
| | | | | Gross | | | | |
| (Dollars in millions) | Balance July 1 2017 | Total Realized/Unrealized Gains/(Losses) (2) | Gains
(Losses)
in OCI (3) | Purchases | Sales | Issuances | Settlements | Gross
Transfers
into Level 3 | Gross
Transfers
out of Level 3 | Balance
September 30
2017 | Change in Unrealized Gains/(Losses) Related to Financial Instruments Still Held (2) |
| Trading account assets: | |
| |
| |
| |
| | | | |
| |
| |
| |
| Corporate securities, trading loans and other | $ | 1,777 |
| $ | 77 |
| $ | — |
| $ | 35 |
| $ | (79 | ) | $ | 5 |
| $ | (208 | ) | $ | 288 |
| $ | (153 | ) | $ | 1,742 |
| $ | 35 |
|
| Equity securities | 229 |
| 8 |
| — |
| 3 |
| (3 | ) | — |
| — |
| 17 |
| (10 | ) | 244 |
| 10 |
|
| Non-U.S. sovereign debt | 506 |
| 33 |
| 18 |
| — |
| — |
| — |
| (5 | ) | — |
| — |
| 552 |
| 33 |
|
| Mortgage trading loans, ABS and other MBS | 1,232 |
| 10 |
| (1 | ) | 150 |
| (157 | ) | — |
| (46 | ) | 83 |
| (19 | ) | 1,252 |
| (2 | ) |
| Total trading account assets | 3,744 |
| 128 |
| 17 |
| 188 |
| (239 | ) | 5 |
| (259 | ) | 388 |
| (182 | ) | 3,790 |
| 76 |
|
Net derivative assets (4) | (1,803 | ) | (252 | ) | — |
| 150 |
| (367 | ) | — |
| 278 |
| 7 |
| (36 | ) | (2,023 | ) | (283 | ) |
| AFS debt securities: | |
| |
| |
| |
| |
| |
| |
| |
| |
| |
| |
| Non-U.S. securities | 139 |
| 1 |
| 4 |
| 7 |
| — |
| — |
| (115 | ) | — |
| — |
| 36 |
| — |
|
| Other taxable securities | 483 |
| — |
| 1 |
| — |
| — |
| — |
| (1 | ) | — |
| — |
| 483 |
| — |
|
| Tax-exempt securities | 518 |
| — |
| 1 |
| — |
| — |
| — |
| (7 | ) | — |
| (45 | ) | 467 |
| — |
|
| Total AFS debt securities | 1,140 |
| 1 |
| 6 |
| 7 |
| — |
| — |
| (123 | ) | — |
| (45 | ) | 986 |
| — |
|
| Other debt securities carried at fair value – Non-agency residential MBS | 23 |
| — |
| — |
| — |
| — |
| — |
| (1 | ) | — |
| — |
| 22 |
| — |
|
Loans and leases (5, 6) | 667 |
| 2 |
| — |
| 2 |
| (24 | ) | — |
| (29 | ) | — |
| — |
| 618 |
| 2 |
|
Mortgage servicing rights (6, 7) | 2,501 |
| 54 |
| — |
| — |
| (28 | ) | 69 |
| (189 | ) | — |
| — |
| 2,407 |
| (20 | ) |
Loans held-for-sale (5) | 766 |
| 38 |
| 10 |
| — |
| (4 | ) | — |
| (93 | ) | 58 |
| — |
| 775 |
| 27 |
|
| Other assets | 294 |
| 70 |
| (43 | ) | — |
| (52 | ) | — |
| (2 | ) | — |
| — |
| 267 |
| 28 |
|
Federal funds purchased and securities loaned or sold under agreements to repurchase (5) | (135 | ) | — |
| — |
| — |
| — |
| — |
| 135 |
| — |
| — |
| — |
| — |
|
| Trading account liabilities – Corporate securities and other | (22 | ) | 1 |
| — |
| — |
| (3 | ) | (1 | ) | — |
| — |
| — |
| (25 | ) | — |
|
Accrued expenses and other liabilities (5) | (9 | ) | — |
| — |
| — |
| — |
| — |
| — |
| — |
| — |
| (9 | ) | — |
|
Long-term debt (5) | (1,646 | ) | (87 | ) | (7 | ) | 63 |
| — |
| (129 | ) | 115 |
| (244 | ) | 45 |
| (1,890 | ) | (87 | ) |
| |
(1)
| Assets (liabilities). For assets, increase (decrease) to Level 3 and for liabilities, (increase) decrease to Level 3. |
| |
(2)
| Includes gains/losses reported in earnings in the following income statement line items: Trading account assets/liabilities - primarily trading account profits (losses); Net derivative assets - primarily trading account profits (losses) and mortgage banking income (loss); MSRs - primarily mortgage banking income (loss); Long-term debt - trading account profits (losses). For MSRs, the amounts reflect the changes in modeled MSR fair value due to observed changes in interest rates, volatility, spreads and the shape of the forward swap curve, and periodic adjustments to the valuation model to reflect changes in the modeled relationships between inputs and projected cash flows, as well as changes in cash flow assumptions including cost to service. |
| |
(3)
| Includes gains/losses in OCI related to unrealized gains/losses on AFS securities, foreign currency translation adjustments and the impact of changes in the Corporation’s credit spreads on long-term debt accounted for under the fair value option. For additional information, see Note 1 – Summary of Significant Accounting Principles to the Consolidated Financial Statements of the Corporation's 2016 Annual Report on Form 10-K.
|
| |
(4)
| Net derivatives include derivative assets of $3.9 billion and derivative liabilities of $5.9 billion.
|
| |
(5)
| Amounts represent instruments that are accounted for under the fair value option. |
| |
(6)
| Issuances represent loan originations and MSRs recognized following securitizations or whole-loan sales. |
| |
(7)
| Settlements represent the net change in fair value of the MSR asset due to the recognition of modeled cash flows and the passage of time. |
Significant transfers Transfers into Level 3 occur primarily due
to decreased price observability, during the three months ended September 30, 2017 included $388 million of trading account assets and $244 million of long-term debt. Transfers occur on a regular basis for long-term debt instruments due to changes in the impact of
unobservable inputs on the value of the embedded derivative in relation to the instrument as a whole.
Significant transfers out of Level 3 occur primarily due to increased price observability, during the three months ended September 30, 2017 included $182 million of trading account assets.
|
| | | | | | | | | | | | | | | | | | | | | | | | | | | | | | | | | |
| | | | | | | | | | | | |
Level 3 – Fair Value Measurements (1) | | | | | | | | |
| | Three Months Ended September 30, 2016 | |
| | | | | Gross | | | | |
| (Dollars in millions) | Balance
July 1 2016 | Total Realized/Unrealized Gains/(Losses) (2) | Gains
(Losses)
in OCI (3) | Purchases | Sales | Issuances | Settlements | Gross
Transfers
into Level 3 | Gross
Transfers
out of Level 3 | Balance
September 30 2016 | Change in Unrealized Gains/(Losses) Related to Financial Instruments Still Held (2) |
| Trading account assets: | |
| |
| |
| | | | |
| | |
| |
| |
| Corporate securities, trading loans and other | $ | 2,654 |
| $ | 57 |
| $ | — |
| $ | 226 |
| $ | (245 | ) | $ | — |
| $ | (134 | ) | $ | 202 |
| $ | (198 | ) | $ | 2,562 |
| $ | 20 |
|
| Equity securities | 455 |
| 11 |
| — |
| 10 |
| (98 | ) | — |
| — |
| 27 |
| (39 | ) | 366 |
| 5 |
|
| Non-U.S. sovereign debt | 630 |
| 20 |
| (7 | ) | — |
| — |
| — |
| (4 | ) | — |
| — |
| 639 |
| 19 |
|
| Mortgage trading loans, ABS and other MBS | 1,286 |
| 102 |
| — |
| 331 |
| (441 | ) | — |
| (103 | ) | 15 |
| (24 | ) | 1,166 |
| 62 |
|
| Total trading account assets | 5,025 |
| 190 |
| (7 | ) | 567 |
| (784 | ) | — |
| (241 | ) | 244 |
| (261 | ) | 4,733 |
| 106 |
|
Net derivative assets (4) | (648 | ) | (131 | ) | — |
| 114 |
| (346 | ) | — |
| 118 |
| (53 | ) | (41 | ) | (987 | ) | (198 | ) |
| AFS debt securities: | |
| |
| |
| | | | |
| |
| |
| |
| |
| Non-agency residential MBS | 134 |
| — |
| — |
| 189 |
| — |
| — |
| (102 | ) | 6 |
| — |
| 227 |
| — |
|
| Other taxable securities | 717 |
| 1 |
| (1 | ) | — |
| — |
| — |
| (30 | ) | — |
| — |
| 687 |
| — |
|
| Tax-exempt securities | 559 |
| — |
| 2 |
| — |
| — |
| — |
| — |
| 10 |
| — |
| 571 |
| — |
|
| Total AFS debt securities | 1,410 |
| 1 |
| 1 |
| 189 |
| — |
| — |
| (132 | ) | 16 |
| — |
| 1,485 |
| — |
|
| Other debt securities carried at fair value – Non-agency residential MBS | 28 |
| (2 | ) | — |
| — |
| — |
| — |
| — |
| — |
| — |
| 26 |
| — |
|
Loans and leases (5, 6) | 1,459 |
| (9 | ) | — |
| — |
| — |
| — |
| (54 | ) | — |
| (41 | ) | 1,355 |
| (8 | ) |
Mortgage servicing rights (6, 7) | 2,269 |
| 313 |
| — |
| — |
| — |
| 101 |
| (206 | ) | — |
| — |
| 2,477 |
| 262 |
|
Loans held-for-sale (5) | 690 |
| 13 |
| (4 | ) | — |
| (56 | ) | — |
| (25 | ) | 4 |
| (35 | ) | 587 |
| 10 |
|
| Other assets | 348 |
| 11 |
| — |
| 4 |
| — |
| — |
| — |
| — |
| — |
| 363 |
| 17 |
|
Federal funds purchased and securities loaned or sold under agreements to repurchase (5) | (313 | ) | (17 | ) | — |
| — |
| — |
| — |
| 10 |
| (19 | ) | 1 |
| (338 | ) | (17 | ) |
| Trading account liabilities – Corporate securities and other | (26 | ) | 2 |
| — |
| — |
| (2 | ) | — |
| — |
| — |
| — |
| (26 | ) | 1 |
|
Accrued expenses and other liabilities (5) | (9 | ) | — |
| — |
| — |
| — |
| — |
| — |
| — |
| — |
| (9 | ) | — |
|
Long-term debt (5) | (2,156 | ) | (22 | ) | (23 | ) | 15 |
| — |
| (3 | ) | 363 |
| (206 | ) | 98 |
| (1,934 | ) | (24 | ) |
| |
(1)
| Assets (liabilities). For assets, increase (decrease) to Level 3 and for liabilities, (increase) decrease to Level 3. |
| |
(2)
| Includes gains/losses reported in earnings in the following income statement line items: Trading account assets/liabilities - trading account profits (losses); Net derivative assets - primarily trading account profits (losses) and mortgage banking income (loss); MSRs - primarily mortgage banking income (loss); Long-term debt - trading account profits (losses). For MSRs, the amounts reflect the changes in modeled MSR fair value due principally to observed changes in interest rates, volatility, spreads and the shape of the forward swap curve. |
| |
(3)
| Includes gains/losses in OCI related to unrealized gains/losses on AFS securities, foreign currency translation adjustments and the impact of changes in the Corporation’s credit spreads on long-term debt accounted for under the fair value option. For additional information, see Note 1 – Summary of Significant Accounting Principles to the Consolidated Financial Statements of the Corporation's 2016 Annual Report on Form 10-K.
|
| |
(4)
| Net derivatives include derivative assets of $4.9 billion and derivative liabilities of $5.9 billion.
|
| |
(5)
| Amounts represent instruments that are accounted for under the fair value option. |
| |
(6)
| Issuances represent loan originations and MSRs recognized following securitizations or whole-loan sales. |
| |
(7)
| Settlements represent the net change in fair value of the MSR asset due to the recognition of modeled cash flows and the passage of time. |
Significant transfers into Level 3, primarily due to decreased price observability, during the three months ended September 30, 2016 included $244 million of trading account assets and $206 million of long-term debt. Transfers occur on a regular basis for long-term debt instruments due to changes in the impact of
unobservable inputs on the value of the embedded derivative in relation to the instrument as a whole.
Significant transfers out of Level 3, primarily due to increased price observability, during the three months ended September 30, 2016 included $261 million of trading account assets.
|
| | | | | | | | | | | | | | | | | | | | | | | | | | | | | | | | | |
| | | | | | | | | | | | |
Level 3 – Fair Value Measurements (1) | | | | | | | | |
| | Nine Months Ended September 30, 2017 | |
| | | | | Gross | | | | |
| (Dollars in millions) | Balance January 1 2017 | Total Realized/Unrealized Gains/(Losses) (2) | Gains
(Losses)
in OCI (3) | Purchases | Sales | Issuances | Settlements | Gross
Transfers
into Level 3 | Gross
Transfers
out of Level 3 | Balance
September 30
2017 | Change in Unrealized Gains/(Losses) Related to Financial Instruments Still Held (2) |
| Trading account assets: | |
| |
| |
| |
| | | | |
| |
| |
| |
| Corporate securities, trading loans and other | $ | 2,777 |
| $ | 225 |
| $ | — |
| $ | 353 |
| $ | (679 | ) | $ | 5 |
| $ | (443 | ) | $ | 506 |
| $ | (1,002 | ) | $ | 1,742 |
| $ | 72 |
|
| Equity securities | 281 |
| 23 |
| — |
| 45 |
| (67 | ) | — |
| (10 | ) | 119 |
| (147 | ) | 244 |
| 11 |
|
| Non-U.S. sovereign debt | 510 |
| 64 |
| 12 |
| 26 |
| (59 | ) | — |
| (73 | ) | 72 |
| — |
| 552 |
| 60 |
|
| Mortgage trading loans, ABS and other MBS | 1,211 |
| 195 |
| (2 | ) | 747 |
| (846 | ) | — |
| (169 | ) | 187 |
| (71 | ) | 1,252 |
| 107 |
|
| Total trading account assets | 4,779 |
| 507 |
| 10 |
| 1,171 |
| (1,651 | ) | 5 |
| (695 | ) | 884 |
| (1,220 | ) | 3,790 |
| 250 |
|
Net derivative assets (4) | (1,313 | ) | (1,098 | ) | — |
| 558 |
| (843 | ) | — |
| 722 |
| 36 |
| (85 | ) | (2,023 | ) | (561 | ) |
| AFS debt securities: | |
| |
| |
| |
| |
| |
| |
| |
| |
| |
| |
| Non-U.S. securities | 229 |
| 2 |
| 16 |
| 49 |
| — |
| — |
| (260 | ) | — |
| — |
| 36 |
| — |
|
| Other taxable securities | 594 |
| 3 |
| 6 |
| 5 |
| — |
| — |
| (31 | ) | — |
| (94 | ) | 483 |
| — |
|
| Tax-exempt securities | 542 |
| — |
| 1 |
| — |
| (56 | ) | — |
| (10 | ) | 35 |
| (45 | ) | 467 |
| — |
|
| Total AFS debt securities | 1,365 |
| 5 |
| 23 |
| 54 |
| (56 | ) | — |
| (301 | ) | 35 |
| (139 | ) | 986 |
| — |
|
| Other debt securities carried at fair value – Non-agency residential MBS | 25 |
| (1 | ) | — |
| — |
| — |
| — |
| (2 | ) | — |
| — |
| 22 |
| — |
|
Loans and leases (5, 6) | 720 |
| 20 |
| — |
| 2 |
| (24 | ) | — |
| (93 | ) | — |
| (7 | ) | 618 |
| 18 |
|
Mortgage servicing rights (6, 7) | 2,747 |
| 40 |
| — |
| — |
| (22 | ) | 207 |
| (565 | ) | — |
| — |
| 2,407 |
| (202 | ) |
Loans held-for-sale (5) | 656 |
| 109 |
| 7 |
| 2 |
| (159 | ) | — |
| (281 | ) | 473 |
| (32 | ) | 775 |
| 60 |
|
| Other assets | 239 |
| 53 |
| (31 | ) | 2 |
| (52 | ) | — |
| (8 | ) | 64 |
| — |
| 267 |
| 21 |
|
Federal funds purchased and securities loaned or sold under agreements to repurchase (5) | (359 | ) | (5 | ) | — |
| — |
| — |
| (12 | ) | 171 |
| (58 | ) | 263 |
| — |
| (5 | ) |
| Trading account liabilities – Corporate securities and other | (27 | ) | 13 |
| — |
| 4 |
| (13 | ) | (2 | ) | — |
| — |
| — |
| (25 | ) | (1 | ) |
Accrued expenses and other liabilities (5) | (9 | ) | — |
| — |
| — |
| — |
| — |
| — |
| — |
| — |
| (9 | ) | — |
|
Long-term debt (5) | (1,514 | ) | (160 | ) | (18 | ) | 81 |
| — |
| (279 | ) | 398 |
| (530 | ) | 132 |
| (1,890 | ) | (158 | ) |
| |
(1)
| Assets (liabilities). For assets, increase (decrease) to Level 3 and for liabilities, (increase) decrease to Level 3. |
| |
(2)
| Includes gains/losses reported in earnings in the following income statement line items: Trading account assets/liabilities - primarily trading account profits (losses); Net derivative assets - primarily trading account profits (losses) and mortgage banking income (loss); MSRs - primarily mortgage banking income (loss); Long-term debt - trading account profits (losses). For MSRs, the amounts reflect the changes in modeled MSR fair value due to observed changes in interest rates, volatility, spreads and the shape of the forward swap curve, and periodic adjustments to the valuation model to reflect changes in the modeled relationships between inputs and projected cash flows, as well as changes in cash flow assumptions including cost to service. |
| |
(3)
| Includes gains/losses in OCI related to unrealized gains/losses on AFS securities, foreign currency translation adjustments and the impact of changes in the Corporation’s credit spreads on long-term debt accounted for under the fair value option. For additional information, see Note 1 – Summary of Significant Accounting Principles to the Consolidated Financial Statements of the Corporation's 2016 Annual Report on Form 10-K.
|
| |
(4)
| Net derivatives include derivative assets of $3.9 billion and derivative liabilities of $5.9 billion.
|
| |
(5)
| Amounts represent instruments that are accounted for under the fair value option. |
| |
(6)
| Issuances represent loan originations and MSRs recognized following securitizations or whole-loan sales. |
| |
(7)
| Settlements represent the net change in fair value of the MSR asset due to the recognition of modeled cash flows and the passage of time. |
Significant transfers into Level 3, primarily due to decreased price observability, during the nine months ended September 30, 2017 included $884 million of trading account assets, $473 million of LHFS and $530 million of long-term debt.observability. Transfers occur on a regular basis for long-term debt instruments due to changes in the impact of unobservable inputs on the value of the embedded derivative in relation to the instrument as a whole.
| | | | | | | | | | | | | | | | | | | | | | | | | | | | | | | | | | | | |
| | | | | | | | | | | | |
Level 3 – Fair Value Measurements (1) |
| | | | | | | | | | | | |
| Balance
July 1 | | Total Realized/Unrealized Gains (Losses) in Net Income (2) | Gains
(Losses)
in OCI (3) | Gross | Gross
Transfers
into
Level 3 | Gross
Transfers
out of
Level 3 | Balance
September 30 | Change in Unrealized Gains (Losses) in Net Income Related to Financial Instruments Still Held (2) |
| (Dollars in millions) | | Purchases | Sales | Issuances | Settlements |
| Three Months Ended September 30, 2020 | | | | | | | | | | | | |
| Trading account assets: | | | | | | | | | | | | |
| | | | | | | | | | | | |
| Corporate securities, trading loans and other | $ | 1,548 | | | $ | (20) | | $ | 0 | | $ | 0 | | $ | (49) | | $ | 0 | | $ | (91) | | $ | 136 | | $ | (54) | | $ | 1,470 | | $ | (34) | |
| Equity securities | 194 | | | 8 | | 0 | | 4 | | (3) | | 0 | | 0 | | 7 | | (3) | | 207 | | 3 | |
| Non-U.S. sovereign debt | 248 | | | 7 | | (6) | | 1 | | (2) | | 0 | | (1) | | 83 | | (40) | | 290 | | 6 | |
| Mortgage trading loans, ABS and other MBS | 1,736 | | | 2 | | 0 | | 36 | | (108) | | 11 | | (12) | | 167 | | (62) | | 1,770 | | 10 | |
| Total trading account assets | 3,726 | | | (3) | | (6) | | 41 | | (162) | | 11 | | (104) | | 393 | | (159) | | 3,737 | | (15) | |
Net derivative assets (liabilities) (4) | (3,343) | | | 228 | | 0 | | 39 | | (177) | | 0 | | (58) | | 3 | | (223) | | (3,531) | | 196 | |
| AFS debt securities: | | | | | | | | | | | | |
| | | | | | | | | | | | |
| | | | | | | | | | | | |
| | | | | | | | | | | | |
| Non-agency residential MBS | 462 | | | 0 | | 5 | | 0 | | 0 | | 0 | | (10) | | 25 | | (42) | | 440 | | 0 | |
| | | | | | | | | | | | |
| Non-U.S. securities | 5 | | | 0 | | 0 | | 0 | | 0 | | 0 | | (1) | | 10 | | 0 | | 14 | | 0 | |
| | | | | | | | | | | | |
| Other taxable securities | 65 | | | 0 | | 0 | | 3 | | 0 | | 0 | | 0 | | 0 | | 0 | | 68 | | 0 | |
| Tax-exempt securities | 337 | | | 15 | | 0 | | 0 | | 0 | | 0 | | (167) | | 0 | | (5) | | 180 | | 15 | |
| Total AFS debt securities | 869 | | | 15 | | 5 | | 3 | | 0 | | 0 | | (178) | | 35 | | (47) | | 702 | | 15 | |
| Other debt securities carried at fair value – Non-agency residential MBS | 449 | | | 18 | | 0 | | 0 | | 0 | | 0 | | (11) | | 2 | | 0 | | 458 | | 17 | |
Loans and leases (5,6) | 741 | | | (2) | | 0 | | 0 | | (25) | | 0 | | (89) | | 0 | | 0 | | 625 | | (5) | |
| | | | | | | | | | | | |
Loans held-for-sale (5,6) | 970 | | | (7) | | (2) | | 0 | | (25) | | 0 | | (14) | | 0 | | 0 | | 922 | | (10) | |
Other assets (6,7) | 1,911 | | | 25 | | 6 | | 0 | | 1 | | 53 | | (121) | | 0 | | 0 | | 1,875 | | 4 | |
| Trading account liabilities – Equity securities | (1) | | | 0 | | 0 | | 0 | | 0 | | 0 | | 0 | | 0 | | 0 | | (1) | | 0 | |
Trading account liabilities – Corporate securities and other | (16) | | | 2 | | 0 | | 0 | | (2) | | 0 | | 0 | | 0 | | 0 | | (16) | | 0 | |
| | | | | | | | | | | | |
| | | | | | | | | | | | |
Long-term debt (5) | (956) | | | (50) | | (10) | | 0 | | 0 | | 0 | | 46 | | 0 | | 0 | | (970) | | (50) | |
| | | | | | | | | | | | |
| Three Months Ended September 30, 2019 | | | | | | | | | | | | |
| Trading account assets: | | | | | | | | | | | | |
| | | | | | | | | | | | |
| Corporate securities, trading loans and other | $ | 1,393 | | | $ | 28 | | $ | 0 | | $ | 158 | | $ | (153) | | $ | 0 | | $ | (143) | | $ | 356 | | $ | (48) | | $ | 1,591 | | $ | 0 | |
| Equity securities | 296 | | | (8) | | 0 | | 17 | | (81) | | 0 | | (1) | | 66 | | (10) | | 279 | | (31) | |
| Non-U.S. sovereign debt | 481 | | | 9 | | (28) | | 0 | | 0 | | 0 | | (36) | | 39 | | 0 | | 465 | | 10 | |
| Mortgage trading loans, ABS and other MBS | 1,389 | | | (8) | | 0 | | 91 | | (156) | | 0 | | (48) | | 316 | | (21) | | 1,563 | | (24) | |
| Total trading account assets | 3,559 | | | 21 | | (28) | | 266 | | (390) | | 0 | | (228) | | 777 | | (79) | | 3,898 | | (45) | |
Net derivative assets (liabilities) (4) | (1,114) | | | 73 | | 0 | | 81 | | (270) | | 0 | | (36) | | 0 | | 34 | | (1,232) | | 52 | |
| AFS debt securities: | | | | | | | | | | | | |
| | | | | | | | | | | | |
| | | | | | | | | | | | |
| | | | | | | | | | | | |
| Non-agency residential MBS | 568 | | | 0 | | (13) | | 0 | | 0 | | 0 | | (8) | | 0 | | (39) | | 508 | | 0 | |
| | | | | | | | | | | | |
| Non-U.S. securities | 2 | | | 0 | | 0 | | 0 | | 0 | | 0 | | 0 | | 0 | | 0 | | 2 | | 0 | |
| | | | | | | | | | | | |
| Other taxable securities | 3 | | | 0 | | 0 | | 0 | | 0 | | 0 | | 0 | | 0 | | 0 | | 3 | | 0 | |
| | | | | | | | | | | | |
| Total AFS debt securities | 573 | | | 0 | | (13) | | 0 | | 0 | | 0 | | (8) | | 0 | | (39) | | 513 | | 0 | |
| Other debt securities carried at fair value – Non-agency residential MBS | 273 | | | (8) | | 0 | | 0 | | 0 | | 0 | | (5) | | 48 | | 0 | | 308 | | (8) | |
Loans and leases (5,6) | 355 | | | 8 | | 0 | | 27 | | (17) | | 44 | | (16) | | 0 | | 0 | | 401 | | 8 | |
| | | | | | | | | | | | |
Loans held-for-sale (5,6) | 486 | | | 5 | | (11) | | 2 | | 0 | | 0 | | (96) | | 0 | | 0 | | 386 | | (7) | |
Other assets (6,7) | 2,551 | | | (40) | | (5) | | 0 | | 0 | | 53 | | (163) | | 4 | | 0 | | 2,400 | | (82) | |
| Trading account liabilities – Equity securities | (2) | | | 0 | | 0 | | 0 | | 0 | | 0 | | 0 | | 0 | | 0 | | (2) | | 0 | |
Trading account liabilities – Corporate securities and other | (13) | | | 1 | | 0 | | (1) | | 0 | | 0 | | 0 | | 0 | | 0 | | (13) | | (1) | |
| | | | | | | | | | | | |
| | | | | | | | | | | | |
Long-term debt (5) | (902) | | | 16 | | 1 | | (27) | | 0 | | 0 | | 49 | | (1) | | 0 | | (864) | | 16 | |
Significant transfers out of(1)Assets (liabilities). For assets, increase (decrease) to Level 3 primarily dueand for liabilities, (increase) decrease to increased price observability, duringLevel 3.
(2)Includes gains (losses) reported in earnings in the nine months ended September 30, 2017 included $1.2 billion of tradingfollowing income statement line items: Trading account assets/liabilities - predominantly market making and similar activities; Net derivative assets $139 million of(liabilities) - market making and similar activities and other income; AFS debt securities $263- other income; Other debt securities carried at fair value - other income; Loans and leases - primarily other income; Loans held-for-sale - other income; Other assets - primarily other income related to MSRs; Long-term debt - market making and similar activities.
(3)Includes unrealized gains (losses) in OCI on AFS debt securities, foreign currency translation adjustments and the impact of changes in the Corporation’s credit spreads on long-term debt accounted for under the fair value option. Amounts include net unrealized gains (losses) of $(8) million and $53 million related to financial instruments still held at September 30, 2020 and 2019.
(4)Net derivative assets (liabilities) include derivative assets of federal funds purchased$2.5 billion and securities loaned$3.4 billion and derivative liabilities of $6.0 billion and $4.6 billion at September 30, 2020 and 2019.
(5)Amounts represent instruments that are accounted for under the fair value option.
(6)Issuances represent loan originations and MSRs recognized following securitizations or sold under agreementswhole-loan sales.
(7)Settlements primarily represent the net change in fair value of the MSR asset due to repurchasethe recognition of modeled cash flows and $132 millionthe passage of long-term debt.
time.
| | | | | | | | | | | | | | | | | | | | | | | | | | | | | | | | | | | | |
| | | | | | | | | | | | |
Level 3 – Fair Value Measurements (1) |
| | |
| Balance
January 1 | | Total Realized/Unrealized Gains (Losses) in Net Income (2) | Gains
(Losses)
in OCI (3) | Gross | Gross
Transfers
into
Level 3 | Gross
Transfers
out of
Level 3 | Balance
September 30 | Change in Unrealized Gains (Losses) in Net Income Related to Financial Instruments Still Held (2) |
(Dollars in millions)
| | Purchases | Sales | Issuances | Settlements |
| Nine Months Ended September 30, 2020 | | | | | | | | | | | | |
| Trading account assets: | | | | | | | | | | | | |
| | | | | | | | | | | | |
| Corporate securities, trading loans and other | $ | 1,507 | | | $ | (150) | | $ | (1) | | $ | 280 | | $ | (181) | | $ | 8 | | $ | (165) | | $ | 520 | | $ | (348) | | $ | 1,470 | | $ | (128) | |
| Equity securities | 239 | | | (17) | | 0 | | 33 | | (37) | | 0 | | 0 | | 32 | | (43) | | 207 | | (20) | |
| Non-U.S. sovereign debt | 482 | | | 35 | | (69) | | 76 | | (61) | | 0 | | (20) | | 100 | | (253) | | 290 | | 33 | |
| Mortgage trading loans, ABS and other MBS | 1,553 | | | (145) | | (3) | | 502 | | (582) | | 11 | | (52) | | 659 | | (173) | | 1,770 | | (135) | |
| Total trading account assets | 3,781 | | | (277) | | (73) | | 891 | | (861) | | 19 | | (237) | | 1,311 | | (817) | | 3,737 | | (250) | |
Net derivative assets (liabilities) (4) | (2,538) | | | 111 | | 0 | | 216 | | (558) | | 0 | | (224) | | (273) | | (265) | | (3,531) | | (356) | |
| AFS debt securities: | | | | | | | | | | | | |
| | | | | | | | | | | | |
| | | | | | | | | | | | |
| | | | | | | | | | | | |
| Non-agency residential MBS | 424 | | | (5) | | (4) | | 23 | | 0 | | 0 | | (32) | | 158 | | (124) | | 440 | | (5) | |
| | | | | | | | | | | | |
| Non-U.S. securities | 2 | | | 0 | | 0 | | 0 | | (1) | | 0 | | (1) | | 14 | | 0 | | 14 | | 0 | |
| | | | | | | | | | | | |
| Other taxable securities | 65 | | | 0 | | 0 | | 6 | | (4) | | 0 | | 0 | | 1 | | 0 | | 68 | | 0 | |
| Tax-exempt securities | 108 | | | (19) | | 3 | | 0 | | 0 | | 0 | | (167) | | 265 | | (10) | | 180 | | (18) | |
| Total AFS debt securities | 599 | | | (24) | | (1) | | 29 | | (5) | | 0 | | (200) | | 438 | | (134) | | 702 | | (23) | |
| Other debt securities carried at fair value – Non-agency residential MBS | 299 | | | 12 | | 0 | | 0 | | 0 | | 0 | | (19) | | 178 | | (12) | | 458 | | (12) | |
Loans and leases (5,6) | 693 | | | (74) | | 0 | | 32 | | (26) | | 22 | | (120) | | 98 | | 0 | | 625 | | (61) | |
Loans held-for-sale (5,6) | 375 | | | (7) | | (35) | | 0 | | (106) | | 691 | | (89) | | 93 | | 0 | | 922 | | (19) | |
Other assets (6,7) | 2,360 | | | (294) | | (11) | | 0 | | 2 | | 206 | | (391) | | 5 | | (2) | | 1,875 | | (373) | |
| | | | | | | | | | | | |
| | | | | | | | | | | | |
| Trading account liabilities – Equity securities | (2) | | | 1 | | 0 | | 0 | | 0 | | 0 | | 0 | | 0 | | 0 | | (1) | | 1 | |
Trading account liabilities – Corporate securities and other | (15) | | | 7 | | 0 | | (7) | | (2) | | 0 | | 1 | | 0 | | 0 | | (16) | | 0 | |
| | | | | | | | | | | | |
| | | | | | | | | | | | |
Long-term debt (5) | (1,149) | | | 5 | | 50 | | 8 | | 0 | | (45) | | 201 | | (52) | | 12 | | (970) | | (10) | |
| | | | | | | | | | | | |
| Nine Months Ended September 30, 2019 | | | | | | | | | | | | |
| Trading account assets: | | | | | | | | | | | | |
| | | | | | | | | | | | |
| Corporate securities, trading loans and other | $ | 1,558 | | | $ | 86 | | $ | 0 | | $ | 352 | | $ | (305) | | $ | 0 | | $ | (349) | | $ | 602 | | $ | (353) | | $ | 1,591 | | $ | 33 | |
| Equity securities | 276 | | | 14 | | 0 | | 38 | | (87) | | 0 | | (4) | | 69 | | (27) | | 279 | | (14) | |
| Non-U.S. sovereign debt | 465 | | | 36 | | (24) | | 1 | | 0 | | 0 | | (47) | | 39 | | (5) | | 465 | | 37 | |
| Mortgage trading loans, ABS and other MBS | 1,635 | | | 80 | | (2) | | 488 | | (817) | | 0 | | (172) | | 583 | | (232) | | 1,563 | | 13 | |
| Total trading account assets | 3,934 | | | 216 | | (26) | | 879 | | (1,209) | | 0 | | (572) | | 1,293 | | (617) | | 3,898 | | 69 | |
Net derivative assets (liabilities) (4) | (935) | | | (43) | | 0 | | 248 | | (676) | | 0 | | (124) | | 139 | | 159 | | (1,232) | | (110) | |
| AFS debt securities: | | | | | | | | | | | | |
| | | | | | | | | | | | |
| | | | | | | | | | | | |
| | | | | | | | | | | | |
| | | | | | | | | | | | |
| Non-agency residential MBS | 597 | | | 0 | | 77 | | 0 | | 0 | | 0 | | (29) | | 206 | | (343) | | 508 | | 0 | |
| Non-U.S. securities | 2 | | | 0 | | 0 | | 0 | | 0 | | 0 | | 0 | | 0 | | 0 | | 2 | | 0 | |
| | | | | | | | | | | | |
| Other taxable securities | 7 | | | 0 | | 0 | | 0 | | 0 | | 0 | | (4) | | 0 | | 0 | | 3 | | 0 | |
| | | | | | | | | | | | |
| Total AFS debt securities | 606 | | | 0 | | 77 | | 0 | | 0 | | 0 | | (33) | | 206 | | (343) | | 513 | | 0 | |
| Other debt securities carried at fair value – Non-agency residential MBS | 172 | | | 41 | | 0 | | 0 | | 0 | | 0 | | (13) | | 155 | | (47) | | 308 | | 38 | |
Loans and leases (5,6) | 338 | | | 12 | | 0 | | 27 | | (32) | | 97 | | (41) | | 0 | | 0 | | 401 | | 11 | |
Loans held-for-sale (5,6) | 542 | | | 43 | | (11) | | 12 | | (71) | | 11 | | (199) | | 59 | | 0 | | 386 | | 13 | |
Other assets (6,7) | 2,932 | | | (194) | | 11 | | 0 | | (10) | | 161 | | (504) | | 4 | | 0 | | 2,400 | | (342) | |
| | | | | | | | | | | | |
| Trading account liabilities – Equity securities | 0 | | | (2) | | 0 | | 0 | | 0 | | 0 | | 0 | | 0 | | 0 | | (2) | | (2) | |
Trading account liabilities – Corporate securities and other | (18) | | | 8 | | 0 | | 0 | | (3) | | 0 | | 0 | | 0 | | 0 | | (13) | | (1) | |
| | | | | | | | | | | | |
| | | | | | | | | | | | |
Long-term debt (5) | (817) | | | (71) | | 0 | | (27) | | 0 | | (13) | | 125 | | (62) | | 1 | | (864) | | (64) | |
(1)Assets (liabilities). For assets, increase (decrease) to Level 3 and for liabilities, (increase) decrease to Level 3.
(2)Includes gains (losses) reported in earnings in the following income statement line items: Trading account assets/liabilities - predominantly market making and similar activities; Net derivative assets (liabilities) - market making and similar activities and other income; AFS debt securities - other income; Other debt securities carried at fair value - other income; Loans and leases - primarily other income; Loans held-for-sale - other income; Other assets - primarily other income related to MSRs; Long-term debt - market making and similar activities.
(3)Includes unrealized gains (losses) in OCI on AFS debt securities, foreign currency translation adjustments and the impact of changes in the Corporation’s credit spreads on long-term debt accounted for under the fair value option. Amounts include net unrealized gains (losses) of $(47) million and $47 million related to financial instruments still held at September 30, 2020 and 2019.
(4)Net derivative assets (liabilities) include derivative assets of $2.5 billion and $3.4 billion and derivative liabilities of $6.0 billion and $4.6 billion at September 30, 2020 and 2019.
(5)Amounts represent instruments that are accounted for under the fair value option.
(6)Issuances represent loan originations and MSRs recognized following securitizations or whole-loan sales.
(7)Settlements primarily represent the net change in fair value of the MSR asset due to the recognition of modeled cash flows and the passage of time.
|
| | | | | | | | | | | | | | | | | | | | | | | | | | | | | | | | | |
| | | | | | | | | | | | |
Level 3 – Fair Value Measurements (1) | | | | | | | | |
| | Nine Months Ended September 30, 2016 | |
| | | | | Gross | | | | |
| (Dollars in millions) | Balance
January 1 2016 | Total Realized/Unrealized Gains/(Losses) (2) | Gains
(Losses)
in OCI (3) | Purchases | Sales | Issuances | Settlements | Gross
Transfers
into Level 3 | Gross
Transfers
out of Level 3 | Balance
September 30 2016 | Change in Unrealized Gains/(Losses) Related to Financial Instruments Still Held (2) |
| Trading account assets: | |
| |
| |
| | | | |
| | |
| |
| |
| Corporate securities, trading loans and other | $ | 2,838 |
| $ | 118 |
| $ | 2 |
| $ | 925 |
| $ | (638 | ) | $ | — |
| $ | (479 | ) | $ | 432 |
| $ | (636 | ) | $ | 2,562 |
| $ | 11 |
|
| Equity securities | 407 |
| 93 |
| — |
| 53 |
| (135 | ) | — |
| (72 | ) | 60 |
| (40 | ) | 366 |
| (19 | ) |
| Non-U.S. sovereign debt | 521 |
| 112 |
| 91 |
| 3 |
| (1 | ) | — |
| (87 | ) | — |
| — |
| 639 |
| 110 |
|
| Mortgage trading loans, ABS and other MBS | 1,868 |
| 197 |
| (2 | ) | 681 |
| (1,264 | ) | — |
| (270 | ) | 91 |
| (135 | ) | 1,166 |
| 110 |
|
| Total trading account assets | 5,634 |
| 520 |
| 91 |
| 1,662 |
| (2,038 | ) | — |
| (908 | ) | 583 |
| (811 | ) | 4,733 |
| 212 |
|
Net derivative assets (4) | (441 | ) | 356 |
| — |
| 313 |
| (965 | ) | — |
| 7 |
| (177 | ) | (80 | ) | (987 | ) | (108 | ) |
| AFS debt securities: | |
| |
| |
| | | | |
| |
| |
| |
| |
| Non-agency residential MBS | 106 |
| — |
| 3 |
| 385 |
| (92 | ) | — |
| (181 | ) | 6 |
| — |
| 227 |
| — |
|
| Other taxable securities | 757 |
| 3 |
| (7 | ) | — |
| — |
| — |
| (66 | ) | — |
| — |
| 687 |
| — |
|
| Tax-exempt securities | 569 |
| — |
| (8 | ) | 1 |
| — |
| — |
| (1 | ) | 10 |
| — |
| 571 |
| — |
|
| Total AFS debt securities | 1,432 |
| 3 |
| (12 | ) | 386 |
| (92 | ) | — |
| (248 | ) | 16 |
| — |
| 1,485 |
| — |
|
| Other debt securities carried at fair value – Non-agency residential MBS | 30 |
| (4 | ) | — |
| — |
| — |
| — |
| — |
| — |
| — |
| 26 |
| — |
|
Loans and leases (5, 6) | 1,620 |
| (13 | ) | — |
| 69 |
| — |
| 50 |
| (143 | ) | 6 |
| (234 | ) | 1,355 |
| (3 | ) |
Mortgage servicing rights (6, 7) | 3,087 |
| (295 | ) | — |
| — |
| — |
| 307 |
| (622 | ) | — |
| — |
| 2,477 |
| (457 | ) |
Loans held-for-sale (5) | 787 |
| 97 |
| 51 |
| 20 |
| (236 | ) | — |
| (77 | ) | 43 |
| (98 | ) | 587 |
| 76 |
|
| Other assets | 374 |
| (27 | ) | — |
| 38 |
| — |
| — |
| (24 | ) | 2 |
| — |
| 363 |
| (15 | ) |
Federal funds purchased and securities loaned or sold under agreements to repurchase (5) | (335 | ) | 12 |
| — |
| — |
| — |
| (14 | ) | 17 |
| (19 | ) | 1 |
| (338 | ) | (21 | ) |
| Trading account liabilities – Corporate securities and other | (21 | ) | 4 |
| — |
| 1 |
| (10 | ) | — |
| — |
| — |
| — |
| (26 | ) | 3 |
|
Short-term borrowings (5) | (30 | ) | 1 |
| — |
| — |
| — |
| — |
| 29 |
| — |
| — |
| — |
| — |
|
Accrued expenses and other liabilities (5) | (9 | ) | — |
| — |
| — |
| — |
| — |
| — |
| — |
| — |
| (9 | ) | — |
|
Long-term debt (5) | (1,513 | ) | (192 | ) | (41 | ) | 44 |
| — |
| (326 | ) | 496 |
| (751 | ) | 349 |
| (1,934 | ) | (208 | ) |
| |
(1)
| Assets (liabilities). For assets, increase (decrease) to Level 3 and for liabilities, (increase) decrease to Level 3. |
| |
(2)
| Includes gains/losses reported in earnings in the following income statement line items: Trading account assets/liabilities - trading account profits (losses); Net derivative assets - primarily trading account profits (losses) and mortgage banking income (loss); MSRs - primarily mortgage banking income (loss); Long-term debt - primarily trading account profits (losses). For MSRs, the amounts reflect the changes in modeled MSR fair value due principally to observed changes in interest rates, volatility, spreads and the shape of the forward swap curve. |
| |
(3)
| Includes gains/losses in OCI related to unrealized gains/losses on AFS securities, foreign currency translation adjustments and the impact of changes in the Corporation’s credit spreads on long-term debt accounted for under the fair value option. For additional information, see Note 1 – Summary of Significant Accounting Principles to the Consolidated Financial Statements of the Corporation's 2016 Annual Report on Form 10-K.
|
| |
(4)
| Net derivatives include derivative assets of $4.9 billion and derivative liabilities of $5.9 billion.
|
| |
(5)
| Amounts represent instruments that are accounted for under the fair value option. |
| |
(6)
| Issuances represent loan originations and MSRs recognized following securitizations or whole-loan sales. |
| |
(7)
| Settlements represent the net change in fair value of the MSR asset due to the recognition of modeled cash flows and the passage of time. |
Significant transfers into Level 3, primarily due to decreased price observability, during the nine months ended September 30, 2016 included $583 million of trading account assets, $177 million of net derivative assets and $751 million of long-term debt. Transfers occur on a regular basis for long-term debt instruments due to changes in the impact of unobservable inputs on the value of the embedded derivative in relation to the instrument as a whole.
Significant transfers out of Level 3, primarily due to increased price observability, during the nine months ended September 30, 2016 included $811 million of trading account assets, $234 million of loans and leases and $349 million of long-term debt.
The following tables present information about significant unobservable inputs related to the Corporation’s material categories of Level 3 financial assets and liabilities at September 30, 20172020 and December 31, 2016.2019.
| | | | | | | | | | | | | | | | | |
| | | | | |
| Quantitative Information about Level 3 Fair Value Measurements at September 30, 2020 | |
| | | | |
| (Dollars in millions) | | | Inputs |
| Financial Instrument | Fair
Value | Valuation
Technique | Significant Unobservable
Inputs | Ranges of
Inputs | Weighted Average (1) |
Loans and Securities (2) | | | | | |
| Instruments backed by residential real estate assets | $ | 1,903 | | Discounted cash flow, Market comparables | Yield | 0% to 25% | 6 | % |
| Trading account assets – Mortgage trading loans, ABS and other MBS | 566 | | Prepayment speed | 1% to 31% CPR | 19% CPR |
| Loans and leases | 356 | | Default rate | 0% to 3% CDR | 1% CDR |
| Loans held-for-sale | 1 | | Loss severity | 0% to 48% | 19 | % |
| AFS debt securities, primarily non-agency residential | 440 | | Price | $0 to $160 | $80 |
| AFS debt securities – Other taxable securities | 82 | | | | |
| Other debt securities carried at fair value - Non-agency residential | 458 | | | | |
| Instruments backed by commercial real estate assets | $ | 1,158 | | Discounted cash
flow | Yield | 0% to 25% | 4 | % |
| Trading account assets – Corporate securities, trading loans and other | 288 | | Price | $0 to $117 | $62 |
| Trading account assets – Mortgage trading loans, ABS and other MBS | 156 | | | | |
| Loans held-for-sale | 714 | | | | |
| Commercial loans, debt securities and other | $ | 3,043 | | Discounted cash flow, Market comparables | Yield | 1% to 32% | 8 | % |
| Trading account assets – Corporate securities, trading loans and other | 1,182 | | Prepayment speed | 10% to 20% | 14 | % |
| Trading account assets – Non-U.S. sovereign debt | 290 | | Default rate | 3% to 4% | 4 | % |
| Trading account assets – Mortgage trading loans, ABS and other MBS | 915 | | Loss severity | 35% to 40% | 38 | % |
| AFS debt securities – Tax-exempt securities | 180 | | Price | $0 to $142 | $67 |
| Loans and leases | 269 | | Long-dated equity volatilities | 93% | n/a |
| Loans held-for-sale | 207 | | | | |
| | | | | |
| Other assets, primarily auction rate securities | $ | 793 | | Discounted cash flow, Market comparables | Price | $10 to $98 | $94 |
| | | | |
| | | | |
| | | | |
| MSRs | $ | 1,082 | | Discounted cash
flow | Weighted-average life, fixed rate (5) | 0 to 14 years | 4 years |
| | Weighted-average life, variable rate (5) | 0 to 10 years | 3 years |
| | Option-adjusted spread, fixed rate | 7% to 14% | 9 | % |
| | Option-adjusted spread, variable rate | 9% to 15% | 12 | % |
| Structured liabilities | | | | | |
| Long-term debt | $ | (970) | | Discounted cash flow, Market comparables, Industry standard derivative pricing (3) | Yield | 2% to 7% | 7 | % |
| | Equity correlation | 5% to 100% | 76 | % |
| | Long-dated equity volatilities | 15% to 79% | 35 | % |
| | Price | $0 to $118 | $82 |
| | Natural gas forward price | $1/MMBtu to $4/MMBtu | $3 /MMBtu |
| Net derivative assets (liabilities) | | | | | |
| Credit derivatives | $ | (50) | | Discounted cash flow, Stochastic recovery correlation model | Yield | 5% | n/a |
| | | | |
| | Upfront points | 0 to 100 points | 75 points |
| | | | |
| | | | |
| | Prepayment speed | 15% to 100% CPR | 23% CPR |
| | Default rate | 2% CDR | n/a |
| | Credit correlation | 24% to 69% | 49 | % |
| | Price | $0 to $122 | $53 |
| Equity derivatives | $ | (1,879) | | Industry standard derivative pricing (3) | Equity correlation | 5% to 100% | 76 | % |
| | Long-dated equity volatilities | 15% to 79% | 35 | % |
| Commodity derivatives | $ | (1,528) | | Discounted cash flow, Industry standard derivative pricing (3) | Natural gas forward price | $1/MMBtu to $4/MMBtu | $3 /MMBtu |
| | Correlation | 54% to 85% | 74 | % |
| | Volatilities | 22% to 89% | 43 | % |
| Interest rate derivatives | $ | (74) | | Industry standard derivative pricing (4) | Correlation (IR/IR) | 15% to 96% | 38 | % |
| | Correlation (FX/IR) | 0% to 46% | 2 | % |
| | Long-dated inflation rates | -5% to 84% | 15 | % |
| | Long-dated inflation volatilities | 0% to 2% | 1 | % |
| | | | |
| | | | |
| Total net derivative assets (liabilities) | $ | (3,531) | | | | | |
|
| | | | | | | | | |
| | | | | | |
| Quantitative Information about Level 3 Fair Value Measurements at September 30, 2017 | |
| | | | | |
| (Dollars in millions) | | | Inputs |
| Financial Instrument | Fair Value | Valuation Technique | Significant Unobservable Inputs | Ranges of Inputs | Weighted Average |
Loans and Securities (1) | | | | | |
| Instruments backed by residential real estate assets | $ | 914 |
| Discounted cash flow | Yield | 0% to 25% |
| 6 | % |
| Trading account assets – Mortgage trading loans, ABS and other MBS | 293 |
| Prepayment speed | 0% to 22% CPR |
| 12 | % |
| Loans and leases | 617 |
| Default rate | 0% to 3% CDR |
| 2 | % |
| Loans held-for-sale | 4 |
| Loss severity | 0% to 54% |
| 18 | % |
| Instruments backed by commercial real estate assets | $ | 264 |
| Discounted cash flow | Yield | 0% to 25% |
| 6 | % |
| Trading account assets – Corporate securities, trading loans and other | 218 |
| Price | $0 to $100 |
| $68 |
| Trading account assets – Mortgage trading loans, ABS and other MBS | 46 |
| | | |
| Commercial loans, debt securities and other | $ | 3,754 |
| Discounted cash flow, Market comparables | Yield | 0% to 12% |
| 4 | % |
| Trading account assets – Corporate securities, trading loans and other | 1,498 |
| Prepayment speed | 10% to 20% |
| 15 | % |
| Trading account assets – Non-U.S. sovereign debt | 552 |
| Default rate | 3% to 4% |
| 4 | % |
| Trading account assets – Mortgage trading loans, ABS and other MBS | 913 |
| Loss severity | 35% to 40% |
| 37 | % |
| AFS debt securities – Other taxable securities | 19 |
| Price | $0 to $185 |
| $63 |
Loans and leases
| 1 |
| | | |
Loans held-for-sale
| 771 |
| | | |
| Auction rate securities | $ | 957 |
| Discounted cash flow, Market comparables | Price | $10 to $100 |
| $94 |
| Trading account assets – Corporate securities, trading loans and other | 26 |
| | | |
| AFS debt securities – Other taxable securities | 464 |
| | | |
| AFS debt securities – Tax-exempt securities | 467 |
| | | |
| MSRs | $ | 2,407 |
| Discounted cash flow | Weighted-average life, fixed rate (4) | 0 to 14 years |
| 5 years |
|
| | | Weighted-average life, variable rate (4) | 0 to 10 years |
| 3 years |
|
| | | Option Adjusted Spread, fixed rate | 9% to 14% |
| 10 | % |
| | | Option Adjusted Spread, variable rate | 9% to 15% |
| 12 | % |
| Structured liabilities | | | | | |
| Long-term debt | $ | (1,890 | ) | Discounted cash flow, Market comparables, Industry standard derivative pricing (2) | Equity correlation | 3% to 100% |
| 64 | % |
| | | Long-dated equity volatilities | 4% to 76% |
| 22 | % |
| | | Yield | 7.5 | % | n/a |
|
| | | Price | $0 to $100 |
| $65 |
| Net derivative assets | | | | | |
| Credit derivatives | $ | (325 | ) | Discounted cash flow, Stochastic recovery correlation model | Yield | 1% to 5% |
| 3 | % |
| | | Upfront points | 0 points to 100 points |
| 73 points |
|
| | | Credit correlation | 12% to 90% |
| 58 | % |
| | | Prepayment speed | 15% to 20% CPR |
| 16 | % |
| | | Default rate | 1% to 4% CDR |
| 2 | % |
| | | Loss severity | 35 | % | n/a |
|
| | | Price | $0 to $102 |
| $76 |
| Equity derivatives | $ | (2,235 | ) | Industry standard derivative pricing (2) | Equity correlation | 3% to 100% |
| 64 | % |
| | | Long-dated equity volatilities | 4% to 76% |
| 22 | % |
| Commodity derivatives | $ | 2 |
| Discounted cash flow, Industry standard derivative pricing (2) | Natural gas forward price | $2/MMBtu to $6/MMBtu |
| $3/MMBtu |
|
| | | Correlation | 68% to 90% |
| 85 | % |
| | | Volatilities | 25% to 90% |
| 49 | % |
| Interest rate derivatives | $ | 535 |
| Industry standard derivative pricing (3) | Correlation (IR/IR) | 15% to 90% |
| 53 | % |
| | | Correlation (FX/IR) | 0% to 46% |
| 1 | % |
| | | Long-dated inflation rates | -10% to 38% |
| 6 | % |
| | | Long-dated inflation volatilities | 0% to 1% |
| 1 | % |
| Total net derivative assets | $ | (2,023 | ) | | | | |
| |
(1)(2)The categories are aggregated based upon product type which differs from financial statement classification. The following is a reconciliation to the line items in the table on page 90: Trading account assets – Corporate securities, trading loans and other of $1.5 billion, Trading account assets – Non-U.S. sovereign debt of $290 million, Trading account assets – Mortgage trading loans, ABS and other MBS of $1.6 billion, AFS debt securities of $702 million, Other debt securities carried at fair value - Non-agency residential of $458 million, Other assets, including MSRs, of $1.9 billion, Loans and leases of $625 million and LHFS of $922 million. (3)Includes models such as Monte Carlo simulation and Black-Scholes. (4)Includes models such as Monte Carlo simulation, Black-Scholes and other methods that model the joint dynamics of interest, inflation and foreign exchange rates. (5)The weighted-average life is a product of changes in market rates of interest, prepayment rates and other model and cash flow assumptions. | The categories are aggregated based upon product type which differs from financial statement classification. The following is a reconciliation to the line items in the table on page 114: Trading account assets – Corporate securities, trading loans and other of $1.7 billion, Trading account assets – Non-U.S. sovereign debt of $552 million, Trading account assets – Mortgage trading loans, ABS and other MBS of $1.3 billion, AFS debt securities – Other taxable securities of $483 million, AFS debt securities – Tax-exempt securities of $467 million, Loans and leases of $618 million and LHFS of $775 million. |
| |
(2)
| Includes models such as Monte Carlo simulation and Black-Scholes. |
| |
(3)
| Includes models such as Monte Carlo simulation, Black-Scholes and other methods that model the joint dynamics of interest, inflation and foreign exchange rates. |
| |
(4)
| The weighted-average life is a product of changes in market rates of interest, prepayment rates and other model and cash flow assumptions. |
CPR = Constant Prepayment Rate
CDR = Constant Default Rate
MMBtu = Million British thermal units
IR = Interest Rate
FX = Foreign Exchange
n/a = not applicable
| | | | | | | |
| Quantitative Information about Level 3 Fair Value Measurements at December 31, 2016 | |
| Quantitative Information about Level 3 Fair Value Measurements at December 31, 2019 | | Quantitative Information about Level 3 Fair Value Measurements at December 31, 2019 |
| | | | | | | | |
| (Dollars in millions) | | | Inputs | (Dollars in millions) | | Inputs |
| Financial Instrument | Fair
Value | Valuation
Technique | Significant Unobservable
Inputs | Ranges of
Inputs | Weighted Average | Financial Instrument | Fair
Value | Valuation
Technique | Significant Unobservable
Inputs | Ranges of
Inputs | Weighted Average (1) |
Loans and Securities (1) | | | | | | |
Loans and Securities (2) | | Loans and Securities (2) | | | | |
| Instruments backed by residential real estate assets | $ | 1,066 |
| Discounted cash flow, Market comparables | Yield | 0% to 50% |
| 7 | % | Instruments backed by residential real estate assets | $ | 1,407 | | Discounted cash flow, Market comparables | Yield | 0% to 25% | 6 | % |
| Trading account assets – Mortgage trading loans, ABS and other MBS | 337 |
| Prepayment speed | 0% to 27% CPR |
| 14 | % | Trading account assets – Mortgage trading loans, ABS and other MBS | 332 | | Prepayment speed | 1% to 27% CPR | 17% CPR |
| Loans and leases | 718 |
| Default rate | 0% to 3% CDR |
| 2 | % | Loans and leases | 281 | | Default rate | 0% to 3% CDR | 1% CDR |
| Loans held-for-sale | 11 |
| Loss severity | 0% to 54% |
| 18 | % | Loans held-for-sale | 4 | | Loss severity | 0% to 47% | 14 | % |
| AFS debt securities, primarily non-agency residential | | AFS debt securities, primarily non-agency residential | 491 | | Price | $0 to td60 | $94 |
| Other debt securities carried at fair value - Non-agency residential | | Other debt securities carried at fair value - Non-agency residential | 299 | | | |
| Instruments backed by commercial real estate assets | $ | 317 |
| Discounted cash flow, Market comparables | Yield | 0% to 39% |
| 11 | % | Instruments backed by commercial real estate assets | $ | 303 | | Discounted cash flow | Yield | 0% to 30% | 14 | % |
| Trading account assets – Corporate securities, trading loans and other | 178 |
| Price | $0 to td00 |
| $65 | Trading account assets – Corporate securities, trading loans and other | 201 | | Price | $0 to td00 | $55 |
| Trading account assets – Mortgage trading loans, ABS and other MBS | 53 |
| | | Trading account assets – Mortgage trading loans, ABS and other MBS | 85 | | | |
| Loans held-for-sale | 86 |
| | | Loans held-for-sale | 17 | | | |
| Commercial loans, debt securities and other | $ | 4,486 |
| Discounted cash flow, Market comparables | Yield | 1% to 37% |
| 14 | % | Commercial loans, debt securities and other | $ | 3,798 | | Discounted cash flow, Market comparables | Yield | 1% to 20% | 6 | % |
| Trading account assets – Corporate securities, trading loans and other | 2,565 |
| Prepayment speed | 5% to 20% |
| 19 | % | Trading account assets – Corporate securities, trading loans and other | 1,306 | | Prepayment speed | 10% to 20% | 13 | % |
| Trading account assets – Non-U.S. sovereign debt | 510 |
| Default rate | 3% to 4% |
| 4 | % | Trading account assets – Non-U.S. sovereign debt | 482 | | Default rate | 3% to 4% | 4 | % |
| Trading account assets – Mortgage trading loans, ABS and other MBS | 821 |
| Loss severity | 0% to 50% |
| 19 | % | Trading account assets – Mortgage trading loans, ABS and other MBS | 1,136 | | Loss severity | 35% to 40% | 38 | % |
| AFS debt securities – Other taxable securities | 29 |
| Price | $0 to td92 |
| $68 | |
| AFS debt securities – Tax-exempt securities | | AFS debt securities – Tax-exempt securities | 108 | | Price | $0 to td42 | $72 |
| Loans and leases | 2 |
| Discounted cash flow, Market comparables | Duration | 0 to 5 years |
| 3 years | Loans and leases | 412 | | Long-dated equity volatilities | 35% | n/a |
| Loans held-for-sale | 559 |
| Enterprise value/EBITDA multiple | 34x |
| n/a | Loans held-for-sale | 354 | | Discounted cash flow, Market comparables | | |
| Auction rate securities | $ | 1,141 |
| Price | td0 to td00 |
| $94 | |
| Trading account assets – Corporate securities, trading loans and other | 34 |
| | |
| AFS debt securities – Other taxable securities | 565 |
| | | |
| AFS debt securities – Tax-exempt securities | 542 |
| | | |
| Other assets, primarily auction rate securities | | Other assets, primarily auction rate securities | $ | 815 | | Price | td0 to td00 | $96 |
| |
| | | |
| | | | Discounted cash flow, Market comparables | | |
| MSRs | $ | 2,747 |
| Discounted cash flow | Weighted-average life, fixed rate (4) | 0 to 15 years |
| 6 years |
| MSRs | $ | 1,545 | | Weighted-average life, fixed rate (5) | 0 to 14 years | 5 years |
| | | Weighted-average life, variable rate (4) | 0 to 14 years |
| 4 years |
| | | Weighted-average life, variable rate (5) | 0 to 9 years | 3 years |
| | | Option Adjusted Spread, fixed rate | 9% to 14% |
| 10 | % | | | Discounted cash flow | Option-adjusted spread, fixed rate | 7% to 14% | 9 | % |
| | | Option Adjusted Spread, variable rate | 9% to 15% |
| 12 | % | | | Option-adjusted spread, variable rate | 9% to 15% | 11 | % |
| Structured liabilities | | | | | | Structured liabilities | | | | |
| Long-term debt | $ | (1,514 | ) | Discounted cash flow, Market comparables Industry standard derivative pricing (2) | Equity correlation | 13% to 100% |
| 68 | % | Long-term debt | $ | (1,149) | | Yield | 2% to 6% | 5 | % |
| | | Long-dated equity volatilities | 4% to 76% |
| 26 | % | | | Discounted cash flow, Market comparables, Industry standard derivative pricing (3) | Equity correlation | 9% to 100% | 63 | % |
| | | Yield | 6% to 37% |
| 20 | % | | | Long-dated equity volatilities | 4% to 101% | 32 | % |
| | | Price | td2 to $87 |
| $73 | | | Price | $0 to td16 | $74 |
| | | Duration | 0 to 5 years |
| 3 years |
| | | Natural gas forward price | td/MMBtu to $5/MMBtu | $3/MMBtu |
| Net derivative assets | | | | | | |
| Net derivative assets (liabilities) | | Net derivative assets (liabilities) | | | | |
| Credit derivatives | $ | (129 | ) | Discounted cash flow, Stochastic recovery correlation model | Yield | 0% to 24% |
| 13 | % | Credit derivatives | $ | 13 | | Discounted cash flow, Stochastic recovery correlation model | Yield | 5% | n/a |
| | | Upfront points | 0 to 100 points |
| 72 points |
| | | Upfront points | 0 to 100 points | 63 points |
| | | Credit spreads | 17 bps to 814 bps |
| 248 bps |
| |
| | | Credit correlation | 21% to 80% |
| 44 | % | | | Prepayment speed | 15% to 100% CPR | 22% CPR |
| | | Prepayment speed | 10% to 20% CPR |
| 18 | % | | | Default rate | 1% to 4% CDR | 2% CDR |
| | | Default rate | 1% to 4% CDR |
| 3 | % | | | Loss severity | 35% | n/a |
| | | Loss severity | 35 | % | n/a |
| | | Price | $0 to td04 | $73 |
| Equity derivatives | $ | (1,690 | ) | Industry standard derivative pricing (2) | Equity correlation | 13% to 100% |
| 68 | % | Equity derivatives | $ | (1,081) | | Industry standard derivative pricing (3) | Equity correlation | 9% to 100% | 63 | % |
| | | Long-dated equity volatilities | 4% to 76% |
| 26 | % | | | Long-dated equity volatilities | 4% to 101% | 32 | % |
| Commodity derivatives | $ | 6 |
| Discounted cash flow, Industry standard derivative pricing (2) | Natural gas forward price | td/MMBtu to $6/MMBtu |
| $4/MMBtu |
| Commodity derivatives | $ | (1,357) | | Discounted cash flow, Industry standard derivative pricing (3) | Natural gas forward price | td/MMBtu to $5/MMBtu | $3/MMBtu |
| | | Correlation | 66% to 95% |
| 85 | % | | | Correlation | 30% to 69% | 68 | % |
| | | Volatilities | 23% to 96% |
| 36 | % | | | Volatilities | 14% to 54% | 27 | % |
| | | | | |
| Interest rate derivatives | $ | 500 |
| Industry standard derivative pricing (3) | Correlation (IR/IR) | 15% to 99% |
| 56 | % | Interest rate derivatives | $ | (113) | | Industry standard derivative pricing (4) | Correlation (IR/IR) | 15% to 94% | 52 | % |
| | | Correlation (FX/IR) | 0% to 40% |
| 2 | % | | | Correlation (FX/IR) | 0% to 46% | 2 | % |
| | | Illiquid IR and long-dated inflation rates | -12% to 35% |
| 5 | % | | | Long-dated inflation rates | G-23% to 56% | 16 | % |
| | | Long-dated inflation volatilities | 0% to 2% |
| 1 | % | | | Long-dated inflation volatilities | 0% to 1% | 1 | % |
| Total net derivative assets | $ | (1,313 | ) | | | | | |
| Total net derivative assets (liabilities) | | Total net derivative assets (liabilities) | $ | (2,538) | | | | |
| |
(1)(1)For loans and securities, structured liabilities and net derivative assets (liabilities), the weighted average is calculated based upon the absolute fair value of the instruments. (2)The categories are aggregated based upon product type which differs from financial statement classification. The following is a reconciliation to the line items in the table on page 91: Trading account assets – Corporate securities, trading loans and other of $1.5 billion, Trading account assets – Non-U.S. sovereign debt of $482 million, Trading account assets – Mortgage trading loans, ABS and other MBS of $1.6 billion, AFS debt securities of $599 million, Other debt securities carried at fair value - Non-agency residential of $299 million, Other assets, including MSRs, of $2.4 billion, Loans and leases of $693 million and LHFS of $375 million. (3)Includes models such as Monte Carlo simulation and Black-Scholes. (4)Includes models such as Monte Carlo simulation, Black-Scholes and other methods that model the joint dynamics of interest, inflation and foreign exchange rates. (5)The weighted-average life is a product of changes in market rates of interest, prepayment rates and other model and cash flow assumptions. | The categories are aggregated based upon product type which differs from financial statement classification. The following is a reconciliation to the line items in the table on page 115: Trading account assets – Corporate securities, trading loans and other of $2.8 billion, Trading account assets – Non-U.S. sovereign debt of $510 million, Trading account assets – Mortgage trading loans, ABS and other MBS of $1.2 billion, AFS debt securities – Other taxable securities of $594 million, AFS debt securities – Tax-exempt securities of $542 million, Loans and leases of $720 million and LHFS of $656 million. |
| |
(2)
| Includes models such as Monte Carlo simulation and Black-Scholes. |
| |
(3)
| Includes models such as Monte Carlo simulation, Black-Scholes and other methods that model the joint dynamics of interest, inflation and foreign exchange rates. |
| |
(4)
| The weighted-average life is a product of changes in market rates of interest, prepayment rates and other model and cash flow assumptions. |
CPR = Constant Prepayment Rate
CDR = Constant Default Rate
EBITDA = Earnings before interest, taxes, depreciation and amortization
MMBtu = Million British thermal units
IR = Interest Rate
FX = Foreign Exchange
n/a = not applicable
In the previous tables, instruments backed by residential and commercial real estate assets include RMBS, commercial MBS, whole loans and mortgage CDOs. Commercial loans, debt securities and other include corporate CLOs and CDOs, commercial loans and bonds, and securities backed by non-real estate assets. Structured liabilities primarily include equity-linked notes that are accounted for under the fair value option.
The Corporation uses multiple market approaches in valuing certain of its Level 3 financial instruments. For example, market comparables and discounted cash flows are used together. For a given product, such as corporate debt securities, market comparables may be used to estimate some of the unobservable inputs and then these inputs are incorporated into a discounted cash flow model. Therefore, the balances disclosed encompass both of these techniques.
The level of aggregation and diversity within the products disclosed in the tables results in certain ranges of inputs being wide and unevenly distributed across asset and liability categories.
SensitivityUncertainty of Fair Value Measurements to Changes infrom Unobservable Inputs
LoansFor information on the types of instruments, valuation approaches and Securities
A significant increase in market yields, default rates, loss severities or duration would result in a significantly lower fair value for long positions. Short positions would be impacted in a directionally opposite way. Thethe impact of changes in prepayment speeds would have differing impacts depending onunobservable inputs used in Level 3 measurements, see Note 21 – Fair Value Measurements to the seniorityConsolidated Financial Statements of the instrument and, in the case of CLOs, whether prepayments can be reinvested. A significant increase in price would result in a significantly higher fair value for long positions and short positions would be impacted in a directionally opposite way.
Mortgage Servicing Rights
The weighted-average lives and fair value of MSRs are sensitive to changes in modeled assumptions. The weighted-average life is a product of changes in market rates of interest, prepayment rates and other model and cash flow assumptions. The weighted-average life represents the average period of time that the MSRs' cash flows are expected to be received. Absent other changes, an increase (decrease) to the weighted-average life would generally result in an increase (decrease) in the fair value of the MSRs. For example, a 10 percent or 20 percent decrease in prepayment rates, which impact the weighted-average life, could result in an increase in fair value of $88 million or $183 million, while a 10 percent or 20 percent increase in prepayment rates could result in a decrease in fair value of $81 million or $156 million. A 100 bp or 200 bp decrease in option-adjusted spread (OAS) levels could result in an increase in fair value of $74 million or $154 million, while a 100 bp or 200 bp increase in OAS levels could result in a decrease in
fair value of $69 million or $135 million. These sensitivities are hypothetical and actual amounts may vary materially. As the amounts indicate, changes in fair value basedCorporation’s 2019 Annual Report on variations in assumptions generally cannot be extrapolated because the relationship of the change in assumption to the change in fair value may not be linear. Also, the effect of a variation in a particular assumption on the fair value of MSRs that continue to be held by the Corporation is calculated without changing any other assumption. In reality, changes in one factor may result in changes in another, which might magnify or counteract the sensitivities. In addition, these sensitivities do not reflect any hedge strategies that may be undertaken to mitigate such risk. The Corporation manages the risk in MSRs with derivatives such as options and interest rate swaps, which are not designated as accounting hedges, as well as securities including MBS and U.S. Treasury securities. The securities used to manage the risk in the MSRs are classified in other assets on the Consolidated Balance Sheet.
Structured Liabilities and Derivatives
For credit derivatives, a significant increase in market yield, upfront points (i.e., a single upfront payment made by a protection buyer at inception), credit spreads, default rates or loss severities would result in a significantly lower fair value for protection sellers and higher fair value for protection buyers. The impact of changes in prepayment speeds would have differing impacts depending on the seniority of the instrument.
Structured credit derivatives are impacted by credit correlation. Default correlation is a parameter that describes the degree of dependence among credit default rates within a credit portfolio that underlies a credit derivative instrument. The sensitivity of this input on the fair value varies depending on the level of subordination of the tranche. For senior tranches that are net purchases of protection, a significant increase in default correlation would result in a significantly higher fair value. Net short protection positions would be impacted in a directionally opposite way.
For equity derivatives, commodity derivatives, interest rate derivatives and structured liabilities, a significant change in long-dated rates and volatilities and correlation inputs (i.e., the degree of correlation between an equity security and an index, between two different commodities, between two different interest rates, or between interest rates and foreign exchange rates) would result in a significant impact to the fair value; however, the magnitude and direction of the impact depend on whether the Corporation is long or short the exposure. For structured liabilities, a significant increase in yield or decrease in price would result in a significantly lower fair value. A significant decrease in duration may result in a significantly higher fair value.
Form 10-K.
Bank of America122
Nonrecurring Fair Value
The Corporation holds certain assets that are measured at fair value but only in certain situations (e.g., impairment)the impairment of an asset), and these measurements are referred to herein as nonrecurring. The amounts below represent assets still held as of the reporting date for which a nonrecurring fair value adjustment was recorded during the three and nine months ended September 30, 20172020 and 2016.2019.
| | | | | | | | | | | | | | | | | | | | | | | | | | |
| | | | | | | | | | |
| Assets Measured at Fair Value on a Nonrecurring Basis |
| |
| |
| September 30, 2020 | | Three Months Ended September 30, 2020 | | Nine Months Ended September 30, 2020 | |
| (Dollars in millions) | Level 2 | | Level 3 | | Gains (Losses) | | | |
| Assets | | | | | | | | | | |
| Loans held-for-sale | $ | 630 | | | $ | 903 | | | $ | (14) | | | $ | (121) | | | | |
Loans and leases (1) | 0 | | | 226 | | | (19) | | | (59) | | | | |
Foreclosed properties (2, 3) | 0 | | | 27 | | | (7) | | | (11) | | | | |
| Other assets | 209 | | | 576 | | | (32) | | | (58) | | | | |
| | | | | | | | | | |
| | September 30, 2019 | | Three Months Ended September 30, 2019 | | Nine Months Ended September 30, 2019 | |
| | | | | | | | | | |
| Assets | | | | | | | | | | |
| Loans held-for-sale | $ | 5 | | | $ | 111 | | | $ | (7) | | | $ | (18) | | | | |
Loans and leases (1) | 0 | | | 232 | | | (21) | | | (62) | | | | |
Foreclosed properties (2, 3) | 0 | | | 19 | | | (7) | | | (10) | | | | |
| Other assets | 165 | | | 658 | | | (2,085) | | | (2,104) | | | | |
| | | | | | | | | | |
| | | | | | | | | | |
| | | |
| | | | | | | | | | |
| | | | | | | | | | |
| | | | | | | | | | |
| | | | | | | | | | |
| | | | | | | | | | |
| | | | | | | | | | |
|
| | | | | | | | | | | | | | | |
| | | | | | | | |
| Assets Measured at Fair Value on a Nonrecurring Basis |
| | September 30, 2017 | | Three Months Ended September 30, 2017 | | Nine Months Ended September 30, 2017 |
| (Dollars in millions) | Level 2 | | Level 3 | | Gains (Losses) |
| Assets | |
| | |
| | | | |
| Loans held-for-sale | $ | 70 |
| | $ | 16 |
| | $ | — |
| | $ | (4 | ) |
Loans and leases (1) | — |
| | 813 |
| | (152 | ) | | (307 | ) |
Foreclosed properties (2, 3) | — |
| | 79 |
| | (21 | ) | | (35 | ) |
| Other assets | 353 |
| | — |
| | (1 | ) | | (121 | ) |
| | | | | | | | |
| | September 30, 2016 | | Three Months Ended September 30, 2016 | | Nine Months Ended September 30, 2016 |
| Assets | |
| | |
| | | | |
| Loans held-for-sale | $ | 191 |
| | $ | 48 |
| | $ | (1 | ) | | $ | (44 | ) |
Loans and leases (1) | — |
| | 1,333 |
| | (143 | ) | | (399 | ) |
Foreclosed properties (2, 3) | — |
| | 113 |
| | (23 | ) | | (41 | ) |
| Other assets | 173 |
| | — |
| | (18 | ) | | (44 | ) |
| |
(1)(2)Amounts are included in other assets on the Consolidated Balance Sheet and represent the carrying value of foreclosed properties that were written down subsequent to their initial classification as foreclosed properties. Losses on foreclosed properties include losses recorded during the first 90 days after transfer of a loan to foreclosed properties. (3)Excludes $131 million and $275 million of properties acquired upon foreclosure of certain government-guaranteed loans (principally FHA-insured loans) at September 30, 2020 and 2019. | Includes $71 million and $132 million of losses on loans that were written down to a collateral value of zero during the three and nine months ended September 30, 2017, compared to losses of $48 million and $112 million for the same periods in 2016.
|
| |
(2)
| Amounts are included in other assets on the Consolidated Balance Sheet and represent the carrying value of foreclosed properties that were written down subsequent to their initial classification as foreclosed properties. Losses on foreclosed properties include losses taken during the first 90 days after transfer of a loan to foreclosed properties. |
| |
(3)
| Excludes $879 million and $1.3 billion of properties acquired upon foreclosure of certain government-guaranteed loans (principally FHA-insured loans) at September 30, 2017 and 2016.
|
The table below presents information about significant unobservable inputs related to the Corporation’s nonrecurring Level 3 financial assets and liabilities at September 30, 20172020 and December 31, 2016. Loans and leases backed by residential real estate assets represent2019.
| | | | | | | | | | | | | | | | | |
| | | | | |
| Quantitative Information about Nonrecurring Level 3 Fair Value Measurements |
| | | | | |
| | | Inputs |
| Financial Instrument | Fair Value | Valuation
Technique | Significant Unobservable
Inputs | Ranges of
Inputs | Weighted Average (1) |
| (Dollars in millions) | September 30, 2020 |
| Loans held-for-sale | $ | 903 | | Discounted cash flow | Price | $8 to $99 | $94 |
Loans and leases (2) | 226 | | Market comparables | OREO discount | 13% to 59% | 24 | % |
| | | Costs to sell | 8% to 26% | 9 | % |
Other assets (3) | 576 | | Discounted cash flow | Revenue attrition | 2% to 19% | 7 | % |
| | | Discount rate | 11% to 14% | 12 | % |
| December 31, 2019 |
| Loans held-for-sale | $ | 102 | | Discounted cash flow | Price | $85 to $97 | $88 |
Loans and leases (2) | 257 | | Market comparables | OREO discount | 13% to 59% | 24 | % |
| | | Costs to sell | 8% to 26% | 9 | % |
Other assets (4) | 640 | | Discounted cash flow | Customer attrition | 0% to 19% | 5 | % |
| | | Cost to service | 11% to 19% | 15 | % |
(1)The weighted average is calculated based upon the fair value of the loans.
(2)Represents residential mortgages where the loan has been written down to the fair value of the underlying collateral.
|
| | | | | | | | |
| | | | | | |
| Quantitative Information about Nonrecurring Level 3 Fair Value Measurements |
| | | | | | |
| | September 30, 2017 |
| (Dollars in millions) | | | Inputs |
| Financial Instrument | Fair Value | Valuation Technique | Significant Unobservable Inputs | Ranges of Inputs | Weighted Average |
| Loans and leases backed by residential real estate assets | $ | 813 |
| Market comparables | OREO discount | 8% to 54% | 21 | % |
| | | | Costs to sell | 7% to 45% | 9 | % |
|
| | | | | | | | |
| | December 31, 2016 |
| Loans and leases backed by residential real estate assets | $ | 1,416 |
| Market comparables | OREO discount | 8% to 56% | 21 | % |
| | | | Costs to sell | 7% to 45% | 9 | % |
NOTE 15 Fair Value Option
The Corporation elects to account for certain financial instruments under the fair value option. For more information on the primary financial instruments for which the fair value option elections have been made, see Note 2122 – Fair Value Option to the Consolidated Financial Statements of the Corporation's 2016Corporation’s 2019 Annual Report on Form 10-K.
The following tables provide information about the fair value carrying amount and the
contractual principal outstanding of assets and liabilities accounted for under the fair value option at September 30, 20172020 and December 31, 2016,2019, and information about where changes in the fair value of assets and liabilities accounted for under the fair value option are included in the Consolidated Statement of Income for the three and nine months ended September 30, 20172020 and 2016.2019.
|
| | | | | | | | | | | | | | | | | | | | | | | |
| | | | | | | | | | | | |
| Fair Value Option Elections | | | | | | | | | | | |
| | | | | | | | | | | | |
| | September 30, 2017 | | December 31, 2016 |
| (Dollars in millions) | Fair Value Carrying Amount | | Contractual Principal Outstanding | | Fair Value Carrying Amount Less Unpaid Principal | | Fair Value Carrying Amount | | Contractual Principal Outstanding | | Fair Value Carrying Amount Less Unpaid Principal |
| Federal funds sold and securities borrowed or purchased under agreements to resell | $ | 56,780 |
| | $ | 56,720 |
| | $ | 60 |
| | $ | 49,750 |
| | $ | 49,615 |
| | $ | 135 |
|
Loans reported as trading account assets (1) | 5,734 |
| | 10,749 |
| | (5,015 | ) | | 6,215 |
| | 11,557 |
| | (5,342 | ) |
| Trading inventory – other | 11,096 |
| | n/a |
| | n/a |
| | 8,206 |
| | n/a |
| | n/a |
|
| Consumer and commercial loans | 6,285 |
| | 6,332 |
| | (47 | ) | | 7,085 |
| | 7,190 |
| | (105 | ) |
| Loans held-for-sale | 3,128 |
| | 4,751 |
| | (1,623 | ) | | 4,026 |
| | 5,595 |
| | (1,569 | ) |
| Customer receivables and other assets | 233 |
| | 230 |
| | 3 |
| | 253 |
| | 250 |
| | 3 |
|
| Long-term deposits | 468 |
| | 433 |
| | 35 |
| | 731 |
| | 672 |
| | 59 |
|
| Federal funds purchased and securities loaned or sold under agreements to repurchase | 38,852 |
| | 38,861 |
| | (9 | ) | | 35,766 |
| | 35,929 |
| | (163 | ) |
| Short-term borrowings | 1,904 |
| | 1,904 |
| | — |
| | 2,024 |
| | 2,024 |
| | — |
|
| Unfunded loan commitments | 101 |
| | n/a |
| | n/a |
| | 173 |
| | n/a |
| | n/a |
|
Long-term debt (2) | 29,897 |
| | 30,497 |
| | (600 | ) | | 30,037 |
| | 29,862 |
| | 175 |
|
| |
(1)
| A significant portion of the loans reported as trading account assets are distressed loans which trade and were purchased at a deep discount to par, and the remainder are loans with a fair value near contractual principal outstanding. |
| |
(2)
| Includes structured liabilities with a fair value of $29.5 billion and $29.7 billion, and contractual principal outstanding of $30.1 billion and $29.5 billion at September 30, 2017 and December 31, 2016.
|
n/a = not applicable
|
| | | | | | | | | | | | | | | |
| | | | | | | | |
| Gains (Losses) Relating to Assets and Liabilities Accounted for Under the Fair Value Option |
| | | | | | | | |
| | Three Months Ended September 30, 2017 |
| (Dollars in millions) | Trading Account Profits | | Mortgage Banking Income (Loss) | | Other Income | | Total |
| Loans reported as trading account assets | $ | 75 |
| | $ | — |
| | $ | — |
| | $ | 75 |
|
Trading inventory – other (1) | 1,217 |
| | — |
| | — |
| | 1,217 |
|
Loans held-for-sale (2) | — |
| | 73 |
| | 19 |
| | 92 |
|
| Unfunded loan commitments | — |
| | — |
| | 21 |
| | 21 |
|
Long-term debt (3, 4) | (416 | ) | | — |
| | (38 | ) | | (454 | ) |
Other (5) | 3 |
| | — |
| | (3 | ) | | — |
|
| Total | $ | 879 |
| | $ | 73 |
| | $ | (1 | ) | | $ | 951 |
|
| | | | | | | | |
| | Three Months Ended September 30, 2016 |
| Loans reported as trading account assets | $ | 125 |
| | $ | — |
| | $ | — |
| | $ | 125 |
|
Trading inventory – other (1) | 907 |
| | — |
| | — |
| | 907 |
|
Loans held-for-sale (2) | 5 |
| | 132 |
| | 2 |
| | 139 |
|
| Unfunded loan commitments | — |
| | — |
| | 133 |
| | 133 |
|
Long-term debt (3, 4) | (138 | ) | | — |
| | (24 | ) | | (162 | ) |
Other (5) | (32 | ) | | — |
| | 40 |
| | 8 |
|
| Total | $ | 867 |
| | $ | 132 |
| | $ | 151 |
| | $ | 1,150 |
|
|
| | | | | | | | | | | | | | | |
| | Nine Months Ended September 30, 2017 |
| Loans reported as trading account assets | $ | 272 |
| | $ | — |
| | $ | — |
| | $ | 272 |
|
Trading inventory – other (1) | 2,890 |
| | — |
| | — |
| | 2,890 |
|
Loans held-for-sale (2) | — |
| | 182 |
| | 93 |
| | 275 |
|
| Unfunded loan commitments | — |
| | — |
| | 55 |
| | 55 |
|
Long-term debt (3, 4) | (471 | ) | | — |
| | (109 | ) | | (580 | ) |
Other (5) | (41 | ) | | — |
| | 44 |
| | 3 |
|
| Total | $ | 2,650 |
| | $ | 182 |
| | $ | 83 |
| | $ | 2,915 |
|
| | | | | | | | |
| | Nine Months Ended September 30, 2016 |
| Loans reported as trading account assets | $ | 251 |
| | $ | — |
| | $ | — |
| | $ | 251 |
|
Trading inventory – other (1) | 551 |
| | — |
| | — |
| | 551 |
|
Loans held-for-sale (2) | 10 |
| | 493 |
| | 57 |
| | 560 |
|
| Unfunded loan commitments | — |
| | — |
| | 444 |
| | 444 |
|
Long-term debt (3, 4) | (718 | ) | | — |
| | (77 | ) | | (795 | ) |
Other (5) | (7 | ) | | — |
| | (14 | ) | | (21 | ) |
| Total | $ | 87 |
| | $ | 493 |
| | $ | 410 |
| | $ | 990 |
|
| |
(1)
| The gains (losses) in trading account profits are primarily offset by gains (losses) on trading liabilities that hedge these assets. |
| |
(2)
| Includes the value of IRLCs on funded loans, including those sold during the period. |
| |
(3)
| The majority of the net gains (losses) in trading account profits relate to the embedded derivative in structured liabilities and are offset by gains (losses) on derivatives and securities that hedge these liabilities. |
| |
(4)
| For the cumulative impact of changes in the Corporation’s own credit spreads and the amount recognized in OCI, see Note 12 – Accumulated Other Comprehensive Income (Loss). For information on how the Corporation’s own credit spread is determined, see Note 20 – Fair Value Measurements to the Consolidated Financial Statements of the Corporation's 2016 Annual Report on Form 10-K.
|
| |
(5)
| Includes gains (losses) on federal funds sold and securities borrowed or purchased under agreements to resell, consumer and commercial loans, other assets, short-term borrowings, long-term deposits, and federal funds purchased and securities loaned or sold under agreements to repurchase. |
| | | | | | | | | | | | | | | | | | | | | | | | | | | | | | | | | | | |
| | | | | | | | | | | |
| Fair Value Option Elections |
| | | | | | | | | | | |
| September 30, 2020 | | December 31, 2019 |
| (Dollars in millions) | Fair Value Carrying Amount | | Contractual Principal Outstanding | | Fair Value Carrying Amount Less Unpaid Principal | | Fair Value
Carrying
Amount | | Contractual Principal Outstanding | | Fair Value Carrying
Amount Less Unpaid Principal |
| Federal funds sold and securities borrowed or purchased under agreements to resell | $ | 103,101 | | | $ | 103,050 | | | $ | 51 | | | $ | 50,364 | | | $ | 50,318 | | | $ | 46 | |
Loans reported as trading account assets (1) | 6,003 | | | 15,294 | | | (9,291) | | | 6,989 | | | 14,703 | | | (7,714) | |
| Trading inventory – other | 20,833 | | | n/a | | n/a | | 19,574 | | | n/a | | n/a |
| Consumer and commercial loans | 7,234 | | | 7,414 | | | (180) | | | 8,335 | | | 8,372 | | | (37) | |
Loans held-for-sale (1) | 1,905 | | | 2,836 | | | (931) | | | 3,709 | | | 4,879 | | | (1,170) | |
| | | | | | | | | | | |
| Other assets | 27 | | | n/a | | n/a | | 4 | | | n/a | | n/a |
| Long-term deposits | 626 | | | 579 | | | 47 | | | 508 | | | 496 | | | 12 | |
| Federal funds purchased and securities loaned or sold under agreements to repurchase | 132,322 | | | 132,325 | | | (3) | | | 16,008 | | | 16,029 | | | (21) | |
| Short-term borrowings | 4,577 | | | 4,457 | | | 120 | | | 3,941 | | | 3,930 | | | 11 | |
| Unfunded loan commitments | 122 | | | n/a | | n/a | | 90 | | | n/a | | n/a |
| | | | | | | | | | | |
| Long-term debt | 30,455 | | | 31,896 | | | (1,441) | | | 34,975 | | | 35,730 | | | (755) | |
(1)A significant portion of the loans reported as trading account assets and LHFS are distressed loans that were purchased at a deep discount to par, and the remainder are loans with a fair value near contractual principal outstanding.
n/a = not applicable
| | | | | | | | | | | | | | | | | | | | | | | | | | | | | | | | | | | |
| | | | | | | | | | | |
| Gains (Losses) Relating to Assets and Liabilities Accounted for Under the Fair Value Option |
| | | | | | | | | | | |
| Three Months Ended September 30 |
| 2020 | | 2019 |
| (Dollars in millions) | Market making and similar activities | | Other
Income | | Total | | Market making and similar activities | | Other
Income | | Total |
| | | |
| | | | | | | | | | | |
| Loans reported as trading account assets | $ | 58 | | | $ | 0 | | | $ | 58 | | | $ | 4 | | | $ | 0 | | | $ | 4 | |
Trading inventory – other (1) | 709 | | | 0 | | | 709 | | | (156) | | | 0 | | | (156) | |
| Consumer and commercial loans | (2) | | | 102 | | | 100 | | | 81 | | | (6) | | | 75 | |
Loans held-for-sale (2) | 0 | | | 22 | | | 22 | | | 0 | | | 28 | | | 28 | |
| | | | | | | | | | | |
| | | | | | | | | | | |
| | | | | | | | | | | |
| | | | | | | | | | | |
| Short-term borrowings | (38) | | | 0 | | | (38) | | | 0 | | | 0 | | | 0 | |
| Unfunded loan commitments | 0 | | | (18) | | | (18) | | | 0 | | | 13 | | | 13 | |
| | | | | | | | | | | |
Long-term debt (3) | (347) | | | (6) | | | (353) | | | (127) | | | (20) | | | (147) | |
Other (4) | 19 | | | 7 | | | 26 | | | (1) | | | (14) | | | (15) | |
| Total | $ | 399 | | | $ | 107 | | | $ | 506 | | | $ | (199) | | | $ | 1 | | | $ | (198) | |
| | | | | | | | | | | |
| | | | | | | |
| | | | | | | | | | | |
| | | | | | | | | | | |
| | | | | | | | | | | |
| | | | | | | | | | | |
| | | | | | | | | | | |
| | | | | | | | | | | |
| | | | | | | | | | | |
| | | | | | | | | | | |
| | | | | | | | | | | |
| | | | | | | | | | | |
| | | | | | | | | | | |
| | | | | | | | | | | |
| | | | | | | | | | | |
| | | | | | | | | | | |
| | | | | | | | | | | |
| | | | | | | | | | | |
| Nine Months Ended September 30 |
| 2020 | | 2019 |
| | | | | | | | | | | |
| Loans reported as trading account assets | $ | (15) | | | $ | 0 | | | $ | (15) | | | $ | 167 | | | $ | 0 | | | $ | 167 | |
Trading inventory – other (1) | 1,259 | | | 0 | | | 1,259 | | | 4,211 | | | 0 | | | 4,211 | |
| Consumer and commercial loans | (49) | | | (85) | | | (134) | | | 98 | | | 11 | | | 109 | |
Loans held-for-sale (2) | 0 | | | 67 | | | 67 | | | 0 | | | 110 | | | 110 | |
| | | | | | | | | | | |
| | | | | | | | | | | |
| | | | | | | | | | | |
| | | | | | | | | | | |
| Short-term borrowings | 196 | | | 0 | | | 196 | | | 0 | | | 0 | | | 0 | |
| Unfunded loan commitments | 0 | | | (88) | | | (88) | | | 0 | | | 54 | | | 54 | |
| | | | | | | | | | | |
Long-term debt (3) | (1,300) | | | (31) | | | (1,331) | | | (1,412) | | | (65) | | | (1,477) | |
Other (4) | 28 | | | (31) | | | (3) | | | 8 | | | (34) | | | (26) | |
| Total | $ | 119 | | | $ | (168) | | | $ | (49) | | | $ | 3,072 | | | $ | 76 | | | $ | 3,148 | |
| | | | | | | | | | | |
| | | | | | | |
| | | | | | | | | | | |
| | | | | | | | | | | |
| | | | | | | | | | | |
| | | | | | | | | | | |
| | | | | | | | | | | |
| | | | | | | | | | | |
| | | | | | | | | | | |
| | | | | | | | | | | |
| | | | | | | | | | | |
| | | | | | | | | | | |
| | | | | | | | | | | |
| | | | | | | | | | | |
| | | | | | | | | | | |
| | | | | | | | | | | |
| | | | | | | | | | | |
| | | | | | | | | | | |
| | | | | | | |
| | | | | | | | | | | |
| | | | | | | | | | | |
| | | | | | | | | | | |
| | | | | | | | | | | |
| | | | | | | | | | | |
| | | | | | | | | | | |
| | | | | | | | | | | |
| | | | | | | | | | | |
| | | | | | | | | | | |
| | | | | | | | | | | |
| | | | | | | | | | | |
| | | | | | | | | | | |
| | | | | | | | | | | |
| | | | | | | | | | | |
(1) The gains (losses) in market making and similar activities are primarily offset by (losses) gains on trading liabilities that hedge these assets.
(2) Includes the value of interest rate lock commitments on funded loans, including those sold during the period.
(3) The net losses in market making and similar activities relate to the embedded derivatives in structured liabilities and are typically offset by gains on derivatives and securities that hedge these liabilities. For the cumulative impact of changes in the Corporation’s own credit spreads and the amount recognized in accumulated OCI, see Note 13 – Accumulated Other Comprehensive Income (Loss). For more information on how the Corporation’s own credit spread is determined, see Note 21 – Fair Value Measurements to the Consolidated Financial Statementsof the Corporation’s 2019 Annual Report on Form 10-K.
(4) Includes gains (losses) on federal funds sold and securities borrowed or purchased under agreements to resell, long-term deposits and federal funds purchased and securities loaned or sold under agreements to repurchase.
| | | | | | | | | | | | | | | | | | | | | | | |
| | | | | | | |
| Gains (Losses) Related to Borrower-specific Credit Risk for Assets and Liabilities Accounted for Under the Fair Value Option |
| | | | | | | |
| Three Months Ended September 30 | | Nine Months Ended September 30 |
| (Dollars in millions) | 2020 | | 2019 | | 2020 | | 2019 |
| Loans reported as trading account assets | $ | 11 | | | $ | 19 | | | $ | (225) | | | $ | 47 | |
| Consumer and commercial loans | 100 | | | (5) | | | (96) | | | 14 | |
| Loans held-for-sale | (24) | | | 29 | | | (117) | | | 70 | |
| Unfunded loan commitments | (18) | | | 13 | | | (88) | | | 54 | |
| | | | | | | |
Bank of America124
|
| | | | | | | | | | | | | | | |
| | | | | | | | |
| Gains (Losses) Related to Borrower-specific Credit Risk for Assets Accounted for Under the Fair Value Option | | |
| | | | | | | | |
| | Three Months Ended September 30 | | Nine Months Ended September 30 |
| (Dollars in millions) | 2017 | | 2016 | | 2017 | | 2016 |
| Loans reported as trading account assets | $ | 5 |
| | $ | — |
| | $ | 25 |
| | $ | 5 |
|
| Consumer and commercial loans | (10 | ) | | 14 |
| | 31 |
| | (25 | ) |
| Loans held-for-sale | (2 | ) | | (10 | ) | | (3 | ) | | (6 | ) |
NOTE 16 Fair Value of Financial Instruments
Financial instruments are classified into three levels based on the established fair value hierarchy. For additional information, see Note 1 – Summary of Significant Accounting Principles to the Consolidated Financial Statements of the Corporation's 2016 Annual Report on Form 10-K.
The following disclosures include financial instruments that are not carried at fair value or only a portion of the ending balance at September 30, 2017 and December 31, 2016 is carried at fair value on the Consolidated Balance Sheet. Certain loans, deposits, long-term debt and unfunded lending commitments are accounted for under the fair value option. For more information, on these financial instruments and their valuation methodologies, see Note 20 – Fair Value Measurements and Note 22 – Fair Value of Financial InstrumentsOption to the Consolidated Financial Statementsof the Corporation's 2016Corporation’s 2019 Annual Report on Form 10-K.10-K.
Fair Value of Financial Instruments
The carrying values and fair values by fair value hierarchy of certain financial instruments where only a portion of the ending balance was carried at fair value at September 30, 20172020 and December 31, 20162019 are presented in the following table.
|
| | | | | | | | | | | | | | | |
| | | | | | | | |
| Fair Value of Financial Instruments |
| | | | | | | | |
| | September 30, 2017 |
| | | | Fair Value |
| (Dollars in millions) | Carrying Value | | Level 2 | | Level 3 | | Total |
| Financial assets | | | | | | | |
| Loans | $ | 895,155 |
| | $ | 69,711 |
| | $ | 839,931 |
| | $ | 909,642 |
|
| Loans held-for-sale | 13,243 |
| | 12,261 |
| | 1,012 |
| | 13,273 |
|
| Financial liabilities | | | | | | | |
| Deposits | 1,284,417 |
| | 1,284,397 |
| | — |
| | 1,284,397 |
|
| Long-term debt | 228,666 |
| | 234,878 |
| | 1,890 |
| | 236,768 |
|
| | | | | | | | |
| | December 31, 2016 |
| Financial assets | | | | | | | |
| Loans | $ | 873,209 |
| | $ | 71,793 |
| | $ | 815,329 |
| | $ | 887,122 |
|
| Loans held-for-sale | 9,066 |
| | 8,082 |
| | 984 |
| | 9,066 |
|
| Financial liabilities | |
| | | | | | |
|
| Deposits | 1,260,934 |
| | 1,261,086 |
| | — |
| | 1,261,086 |
|
| Long-term debt | 216,823 |
| | 220,071 |
| | 1,514 |
| | 221,585 |
|
| | | | | | | | | | | | | | | | | | | | | | | |
| | | | | | | |
| Fair Value of Financial Instruments |
| | | |
| | | Fair Value |
| Carrying Value | | Level 2 | | Level 3 | | Total |
| (Dollars in millions) | September 30, 2020 |
| Financial assets | | | | | | | |
| Loans | $ | 913,679 | | | $ | 50,473 | | | $ | 905,856 | | | $ | 956,329 | |
| Loans held-for-sale | 4,434 | | | 2,047 | | | 2,388 | | | 4,435 | |
| Financial liabilities | | | | | | | |
Deposits (1) | 1,702,880 | | | 1,702,970 | | | 0 | | | 1,702,970 | |
| Long-term debt | 255,723 | | | 259,505 | | | 970 | | | 260,475 | |
Commercial unfunded lending commitments (2) | 2,032 | | | 122 | | | 5,277 | | | 5,399 | |
| | | | | | | |
| December 31, 2019 |
| Financial assets | | | | | | | |
| Loans | $ | 950,093 | | | $ | 63,633 | | | $ | 914,597 | | | $ | 978,230 | |
| Loans held-for-sale | 9,158 | | | 8,439 | | | 719 | | | 9,158 | |
| Financial liabilities | | | | | | | |
Deposits (1) | 1,434,803 | | | 1,434,809 | | | 0 | | | 1,434,809 | |
| Long-term debt | 240,856 | | | 247,376 | | | 1,149 | | | 248,525 | |
Commercial unfunded lending commitments (2) | 903 | | | 90 | | | 4,777 | | | 4,867 | |
(1) Includes demand deposits of $751.0 billion and $545.5 billion with no stated maturities at September 30, 2020 and December 31, 2019.
Commercial Unfunded Lending Commitments
Fair values were generally determined using a discounted cash flow valuation approach which is applied using market-based credit default swaps or internally developed benchmark credit curves. The Corporation accounts for certain loan commitments under the fair value option.(2) The carrying values and fair valuesvalue of the Corporation’s commercial unfunded lending commitments were $863 million and $3.8 billion at September 30, 2017, and $937 million and $4.9 billion at December 31, 2016. Commercial unfunded lending commitments are primarily classified as Level 3. The carrying value of these commitments is classifiedincluded in accrued expenses and other liabilities.
liabilities on the Consolidated Balance Sheet. The Corporation does not estimate the fair valuesvalue of consumer unfunded lending commitments because, in many instances, the Corporation can reduce or cancel these commitments by providing notice to the borrower. For more information on commitments, see Note 10 – Commitments and Contingencies.
NOTE 17Business Segment Information
The Corporation reports its results of operations through the following four4 business segments: Consumer Banking, GWIMGlobal Wealth & Investment Management, Global Banking and Global Markets, with the remaining operations recorded in All Other. For additionalmore information, see Note 24 – Business Segment Information to the Consolidated Financial Statements of the Corporation's 2016Corporation’s 2019 Annual Report on Form 10-K. The following tables below present net income (loss) and the associated components thereto (with net
interest income on an FTE basis)basis for the business segments, All Other and the total Corporation) for the three and nine months ended September 30, 20172020 and 2016,2019, and total assets at September 30, 20172020 and 20162019 for each business segment, as well as All Other, including a reconciliationof the four business segments’ total revenue, net of interest expense, on an FTE basis, and net income to the Consolidated Statement of Income, and total assets to the Consolidated Balance Sheet.
|
| | | | | | | | | | | | | | |
| | | | | | | |
| Results of Business Segments and All Other | | | | | | |
| | | | | | | |
| At and for the three months ended September 30 | | Total Corporation (1) | | Consumer Banking |
| (Dollars in millions) | | 2017 | 2016 | | 2017 | 2016 |
| Net interest income (FTE basis) | | $ | 11,401 |
| $ | 10,429 |
| | $ | 6,211 |
| $ | 5,289 |
|
| Noninterest income | | 10,678 |
| 11,434 |
| | 2,563 |
| 2,679 |
|
| Total revenue, net of interest expense (FTE basis) | | 22,079 |
| 21,863 |
| | 8,774 |
| 7,968 |
|
| Provision for credit losses | | 834 |
| 850 |
| | 967 |
| 698 |
|
| Noninterest expense | | 13,139 |
| 13,481 |
| | 4,459 |
| 4,371 |
|
| Income before income taxes (FTE basis) | | 8,106 |
| 7,532 |
| | 3,348 |
| 2,899 |
|
| Income tax expense (FTE basis) | | 2,519 |
| 2,577 |
| | 1,261 |
| 1,086 |
|
| Net income | | $ | 5,587 |
| $ | 4,955 |
| | $ | 2,087 |
| $ | 1,813 |
|
| Period-end total assets | | $ | 2,283,896 |
| $ | 2,195,314 |
| | $ | 742,513 |
| $ | 687,241 |
|
| | | | | | | |
| | | Global Wealth &
Investment Management | | Global Banking |
| | | 2017 | 2016 | | 2017 | 2016 |
| Net interest income (FTE basis) | | $ | 1,496 |
| $ | 1,394 |
| | $ | 2,743 |
| $ | 2,470 |
|
| Noninterest income | | 3,124 |
| 2,985 |
| | 2,243 |
| 2,276 |
|
| Total revenue, net of interest expense (FTE basis) | | 4,620 |
| 4,379 |
| | 4,986 |
| 4,746 |
|
| Provision for credit losses | | 16 |
| 7 |
| | 48 |
| 118 |
|
| Noninterest expense | | 3,370 |
| 3,255 |
| | 2,118 |
| 2,152 |
|
| Income before income taxes (FTE basis) | | 1,234 |
| 1,117 |
| | 2,820 |
| 2,476 |
|
| Income tax expense (FTE basis) | | 465 |
| 419 |
| | 1,062 |
| 925 |
|
| Net income | | $ | 769 |
| $ | 698 |
| | $ | 1,758 |
| $ | 1,551 |
|
| Period-end total assets | | $ | 276,187 |
| $ | 289,794 |
| | $ | 423,185 |
| $ | 397,869 |
|
| | | | | | | |
| | | Global Markets | | All Other |
| | | 2017 | 2016 | | 2017 | 2016 |
| Net interest income (FTE basis) | | $ | 899 |
| $ | 1,119 |
| | $ | 52 |
| $ | 157 |
|
| Noninterest income | | 3,001 |
| 3,239 |
| | (253 | ) | 255 |
|
| Total revenue, net of interest expense (FTE basis) | | 3,900 |
| 4,358 |
| | (201 | ) | 412 |
|
| Provision for credit losses | | (6 | ) | 19 |
| | (191 | ) | 8 |
|
| Noninterest expense | | 2,710 |
| 2,656 |
| | 482 |
| 1,047 |
|
| Income (loss) before income taxes (FTE basis) | | 1,196 |
| 1,683 |
| | (492 | ) | (643 | ) |
| Income tax expense (benefit) (FTE basis) | | 440 |
| 609 |
| | (709 | ) | (462 | ) |
| Net income (loss) | | $ | 756 |
| $ | 1,074 |
| | $ | 217 |
| $ | (181 | ) |
| Period-end total assets | | $ | 629,270 |
| $ | 595,165 |
| | $ | 212,741 |
| $ | 225,245 |
|
| |
(1)
| There were no material intersegment revenues. |
| | | | | | | | | | | | | | | | | | | | | | | | | | | | | | | | | | | | | | | | | | | | | |
| | | | | | | | | | | | | | | | | | | |
| Results of Business Segments and All Other | | | | | | | | | | | | | | | | |
| | | | | | | | | | | | | | | | | | | |
| At and for the three months ended September 30 | | | Total Corporation (1) | | | | Consumer Banking | | Global Wealth & Investment Management | | |
| (Dollars in millions) | | | | | 2020 | | 2019 | | | | 2020 | | 2019 | | 2020 | | 2019 | | |
| Net interest income | | | | | $ | 10,243 | | | $ | 12,335 | | | | | $ | 5,890 | | | $ | 7,031 | | | $ | 1,237 | | | $ | 1,609 | | | |
| Noninterest income | | | | | 10,207 | | | 10,620 | | | | | 2,149 | | | 2,693 | | | 3,309 | | | 3,295 | | | |
| Total revenue, net of interest expense | | | | | 20,450 | | | 22,955 | | | | | 8,039 | | | 9,724 | | | 4,546 | | | 4,904 | | | |
| Provision for credit losses | | | | | 1,389 | | | 779 | | | | | 479 | | | 917 | | | 24 | | | 37 | | | |
| Noninterest expense | | | | | 14,401 | | | 15,169 | | | | | 4,842 | | | 4,399 | | | 3,530 | | | 3,414 | | | |
| Income before income taxes | | | | | 4,660 | | | 7,007 | | | | | 2,718 | | | 4,408 | | | 992 | | | 1,453 | | | |
| Income tax expense | | | | | (221) | | | 1,230 | | | | | 666 | | | 1,080 | | | 243 | | | 356 | | | |
| Net income | | | | | $ | 4,881 | | | $ | 5,777 | | | | | $ | 2,052 | | | $ | 3,328 | | | $ | 749 | | | $ | 1,097 | | | |
| Period-end total assets | | | | | $ | 2,738,452 | | | $ | 2,426,330 | | | | | $ | 947,513 | | | $ | 788,814 | | | $ | 337,576 | | | $ | 288,332 | | | |
| | | | | | | | | | | | | | | | | | | |
| | | | Global Banking | | | | Global Markets | | All Other | | |
| | | | | | 2020 | | 2019 | | | | 2020 | | 2019 | | 2020 | | 2019 | | |
| Net interest income | | | | | $ | 2,028 | | | $ | 2,617 | | | | | $ | 1,108 | | | $ | 1,016 | | | $ | (20) | | | $ | 62 | | | |
| Noninterest income | | | | | 2,489 | | | 2,595 | | | | | 3,175 | | | 2,847 | | | (915) | | | (810) | | | |
| Total revenue, net of interest expense | | | | | 4,517 | | | 5,212 | | | | | 4,283 | | | 3,863 | | | (935) | | | (748) | | | |
| Provision for credit losses | | | | | 883 | | | 120 | | | | | 21 | | | 0 | | | (18) | | | (295) | | | |
| Noninterest expense | | | | | 2,365 | | | 2,219 | | | | | 3,104 | | | 2,677 | | | 560 | | | 2,460 | | | |
| Income before income taxes | | | | | 1,269 | | | 2,873 | | | | | 1,158 | | | 1,186 | | | (1,477) | | | (2,913) | | | |
| Income tax expense | | | | | 343 | | | 776 | | | | | 301 | | | 338 | | | (1,774) | | | (1,320) | | | |
| Net income | | | | | $ | 926 | | | $ | 2,097 | | | | | $ | 857 | | | $ | 848 | | | $ | 297 | | | $ | (1,593) | | | |
| Period-end total assets | | | | | $ | 553,776 | | | $ | 452,642 | | | | | $ | 676,242 | | | $ | 689,029 | | | $ | 223,345 | | | $ | 207,513 | | | |
| | | | | | | | | | | | | | | | | | | |
| | | | | |
| | | | | | | | | | | | | | | | | | | |
| | | | | | | | | | | | | | | | | | | |
| | | | | | | | | | | | | | | | | | | |
| | | | | | | | | | | | | | | | | | | |
| | | | | | | | | | | | | | | | | | | |
| | | | | | | | | | | | | | | | | | | |
| | | | | | | | | | | | | | | | | | | |
| | | | | | | | | | | | | | | | | | | |
| | | | | | | | | | | | | | | | | | | |
| | | | | | | | | | | | | | | | | | | |
(1)There were no material intersegment revenues.
| | | | | | | | | | | | | | | | | | | | | | | | | | | | | | | | | | | | | | | | | | | | | |
| | | | | | | | | | | | | | | | | | | |
| Results of Business Segments and All Other | | | | | | | | | | | | | | | | |
| | | | | | | | | | | | | | | | | | | |
| At and for the nine months ended September 30 | | | Total Corporation (1) | | | | Consumer Banking | | Global Wealth & Investment Management | | |
| (Dollars in millions) | | | | | 2020 | | 2019 | | | | 2020 | | 2019 | | 2020 | | 2019 | | |
| Net interest income | | | | | $ | 33,493 | | | $ | 37,201 | | | | | $ | 18,743 | | | $ | 21,253 | | | $ | 4,186 | | | $ | 4,917 | | | |
| Noninterest income | | | | | 32,322 | | | 32,144 | | | | | 6,277 | | | 7,820 | | | 9,721 | | | 9,708 | | | |
| Total revenue, net of interest expense | | | | | 65,815 | | | 69,345 | | | | | 25,020 | | | 29,073 | | | 13,907 | | | 14,625 | | | |
| Provision for credit losses | | | | | 11,267 | | | 2,649 | | | | | 5,761 | | | 2,838 | | | 349 | | | 63 | | | |
| Noninterest expense | | | | | 41,286 | | | 41,661 | | | | | 14,071 | | | 13,178 | | | 10,593 | | | 10,302 | | | |
| Income before income taxes | | | | | 13,262 | | | 25,035 | | | | | 5,188 | | | 13,057 | | | 2,965 | | | 4,260 | | | |
| Income tax expense | | | | | 838 | | | 4,599 | | | | | 1,271 | | | 3,199 | | | 726 | | | 1,044 | | | |
| Net income | | | | | $ | 12,424 | | | $ | 20,436 | | | | | $ | 3,917 | | | $ | 9,858 | | | $ | 2,239 | | | $ | 3,216 | | | |
| Period-end total assets | | | | | $ | 2,738,452 | | | $ | 2,426,330 | | | | | $ | 947,513 | | | $ | 788,814 | | | $ | 337,576 | | | $ | 288,332 | | | |
| | | | | | | | | | | | | | | | | | | |
| | | | Global Banking | | | | Global Markets | | All Other | | |
| | | | | | 2020 | | 2019 | | | | 2020 | | 2019 | | 2020 | | 2019 | | |
| Net interest income | | | | | $ | 7,003 | | | $ | 8,116 | | | | | $ | 3,558 | | | $ | 2,780 | | | $ | 3 | | | $ | 135 | | | |
| Noninterest income | | | | | 7,205 | | | 7,226 | | | | | 11,301 | | | 9,409 | | | (2,182) | | | (2,019) | | | |
| Total revenue, net of interest expense | | | | | 14,208 | | | 15,342 | | | | | 14,859 | | | 12,189 | | | (2,179) | | | (1,884) | | | |
| Provision for credit losses | | | | | 4,849 | | | 356 | | | | | 233 | | | (18) | | | 75 | | | (590) | | | |
| Noninterest expense | | | | | 6,910 | | | 6,697 | | | | | 8,598 | | | 8,109 | | | 1,114 | | | 3,375 | | | |
| Income before income taxes | | | | | 2,449 | | | 8,289 | | | | | 6,028 | | | 4,098 | | | (3,368) | | | (4,669) | | | |
| Income tax expense | | | | | 661 | | | 2,238 | | | | | 1,567 | | | 1,168 | | | (3,387) | | | (3,050) | | | |
| Net income | | | | | $ | 1,788 | | | $ | 6,051 | | | | | $ | 4,461 | | | $ | 2,930 | | | $ | 19 | | | $ | (1,619) | | | |
| Period-end total assets | | | | | $ | 553,776 | | | $ | 452,642 | | | | | $ | 676,242 | | | $ | 689,029 | | | $ | 223,345 | | | $ | 207,513 | | | |
| | | | | | | | | | | | | | | | | | | |
| | | | | |
| | | | | | | | | | | | | | | | | | | |
| | | | | | | | | | | | | | | | | | | |
| | | | | | | | | | | | | | | | | | | |
| | | | | | | | | | | | | | | | | | | |
| | | | | | | | | | | | | | | | | | | |
| | | | | | | | | | | | | | | | | | | |
| | | | | | | | | | | | | | | | | | | |
| | | | | | | | | | | | | | | | | | | |
| | | | | | | | | | | | | | | | | | | |
| | | | | | | | | | | | | | | | | | | |
(1)There were no material intersegment revenues.
The tables below present noninterest income and the associated components for the three and nine months ended September 30, 2020 and 2019 for each business segment, All Other and the total Corporation. For more information, see Note 2 – Net Interest Income and Noninterest Income.
| | | | | | | | | | | | | | | | | | | | | | | | | | | | | | | | | | | | | | | | | |
| | | | | | | | | | | | | | | | | |
| Noninterest Income by Business Segment and All Other | | | | | | | | | | |
| | | | | | | | | | | | | | | | | |
| Total Corporation | | | | Consumer Banking | | | | Global Wealth &
Investment Management | | |
| Three Months Ended September 30 | | |
| (Dollars in millions) | 2020 | | 2019 | | | | 2020 | | 2019 | | | | 2020 | | 2019 | | |
| Fees and commissions: | | | | | | | | | | | | | | | | | |
| Card income | | | | | | | | | | | | | | | | | |
| Interchange fees | $ | 1,172 | | | $ | 963 | | | | | $ | 840 | | | $ | 802 | | | | | $ | 10 | | | $ | 13 | | | |
| Other card income | 396 | | | 502 | | | | | 381 | | | 487 | | | | | 11 | | | 12 | | | |
| Total card income | 1,568 | | | 1,465 | | | | | 1,221 | | | 1,289 | | | | | 21 | | | 25 | | | |
| Service charges | | | | | | | | | | | | | | | | | |
| Deposit-related fees | 1,515 | | | 1,690 | | | | | 837 | | | 1,098 | | | | | 18 | | | 16 | | | |
| Lending-related fees | 302 | | | 285 | | | | | 0 | | | 0 | | | | | 0 | | | 0 | | | |
| Total service charges | 1,817 | | | 1,975 | | | | | 837 | | | 1,098 | | | | | 18 | | | 16 | | | |
| Investment and brokerage services | | | | | | | | | | | | | | | | | |
| Asset management fees | 2,740 | | | 2,597 | | | | | 37 | | | 36 | | | | | 2,706 | | | 2,571 | | | |
| Brokerage fees | 883 | | | 897 | | | | | 31 | | | 38 | | | | | 399 | | | 430 | | | |
| Total investment and brokerage services | 3,623 | | | 3,494 | | | | | 68 | | | 74 | | | | | 3,105 | | | 3,001 | | | |
| Investment banking fees | | | | | | | | | | | | | | | | | |
| Underwriting income | 1,239 | | | 740 | | | | | 0 | | | 0 | | | | | 93 | | | 89 | | | |
| Syndication fees | 133 | | | 341 | | | | | 0 | | | 0 | | | | | 0 | | | 0 | | | |
| Financial advisory services | 397 | | | 452 | | | | | 0 | | | 0 | | | | | 0 | | | 0 | | | |
| Total investment banking fees | 1,769 | | | 1,533 | | | | | 0 | | | 0 | | | | | 93 | | | 89 | | | |
| Total fees and commissions | 8,777 | | | 8,467 | | | | | 2,126 | | | 2,461 | | | | | 3,237 | | | 3,131 | | | |
| Market making and similar activities | 1,689 | | | 2,118 | | | | | 0 | | | 1 | | | | | 13 | | | 27 | | | |
| Other income (loss) | (259) | | | 35 | | | | | 23 | | | 231 | | | | | 59 | | | 137 | | | |
| Total noninterest income | $ | 10,207 | | | $ | 10,620 | | | | | $ | 2,149 | | | $ | 2,693 | | | | | $ | 3,309 | | | $ | 3,295 | | | |
| | | | | | | | | | | | | | | | | |
| | | | | | | | | | | | | | | | | |
| Global Banking | | | | Global Markets | | | | All Other (1) | | |
| Three Months Ended September 30 | | |
| 2020 | | 2019 | | | | 2020 | | 2019 | | | | 2020 | | 2019 | | |
| Fees and commissions: | | | | | | | | | | | | | | | | | |
| Card income | | | | | | | | | | | | | | | | | |
| Interchange fees | $ | 153 | | | $ | 130 | | | | | $ | 169 | | | $ | 18 | | | | | $ | 0 | | | $ | 0 | | | |
| Other card income | 3 | | | 3 | | | | | 0 | | | 0 | | | | | 1 | | | 0 | | | |
| Total card income | 156 | | | 133 | | | | | 169 | | | 18 | | | | | 1 | | | 0 | | | |
| Service charges | | | | | | | | | | | | | | | | | |
| Deposit-related fees | 597 | | | 533 | | | | | 53 | | | 38 | | | | | 10 | | | 5 | | | |
| Lending-related fees | 248 | | | 230 | | | | | 55 | | | 54 | | | | | (1) | | | 1 | | | |
| Total service charges | 845 | | | 763 | | | | | 108 | | | 92 | | | | | 9 | | | 6 | | | |
| Investment and brokerage services | | | | | | | | | | | | | | | | | |
| Asset management fees | 0 | | | 0 | | | | | 0 | | | 0 | | | | | (3) | | | (10) | | | |
| Brokerage fees | 15 | | | 9 | | | | | 440 | | | 419 | | | | | (2) | | | 1 | | | |
| Total investment and brokerage services | 15 | | | 9 | | | | | 440 | | | 419 | | | | | (5) | | | (9) | | | |
| Investment banking fees | | | | | | | | | | | | | | | | | |
| Underwriting income | 536 | | | 312 | | | | | 644 | | | 382 | | | | | (34) | | | (43) | | | |
| Syndication fees | 78 | | | 163 | | | | | 55 | | | 178 | | | | | 0 | | | 0 | | | |
| Financial advisory services | 356 | | | 427 | | | | | 40 | | | 25 | | | | | 1 | | | 0 | | | |
| Total investment banking fees | 970 | | | 902 | | | | | 739 | | | 585 | | | | | (33) | | | (43) | | | |
| Total fees and commissions | 1,986 | | | 1,807 | | | | | 1,456 | | | 1,114 | | | | | (28) | | | (46) | | | |
| Market making and similar activities | 16 | | | 85 | | | | | 1,726 | | | 1,580 | | | | | (66) | | | 425 | | | |
| Other income (loss) | 487 | | | 703 | | | | | (7) | | | 153 | | | | | (821) | | | (1,189) | | | |
| Total noninterest income | $ | 2,489 | | | $ | 2,595 | | | | | $ | 3,175 | | | $ | 2,847 | | | | | $ | (915) | | | $ | (810) | | | |
(1)All Other includes eliminations of intercompany transactions.
| | | | | | | | | | | | | | | | | | | | | | | | | | | | | | | | | | | | | | | | | |
| | | | | | | | | | | | | | | | | |
| Noninterest Income by Business Segment and All Other | | | | | | | | | | |
| | | | | | | | | | | | | | | | | |
| Total Corporation | | | | Consumer Banking | | | | Global Wealth &
Investment Management | | |
| Nine Months Ended September 30 | | |
| (Dollars in millions) | 2020 | | 2019 | | | | 2020 | | 2019 | | | | 2020 | | 2019 | | |
| Fees and commissions: | | | | | | | | | | | | | | | | | |
| Card income | | | | | | | | | | | | | | | | | |
| Interchange fees | $ | 2,794 | | | $ | 2,827 | | | | | $ | 2,129 | | | $ | 2,334 | | | | | $ | 26 | | | $ | 42 | | | |
| Other card income | 1,295 | | | 1,459 | | | | | 1,255 | | | 1,420 | | | | | 30 | | | 31 | | | |
| Total card income | 4,089 | | | 4,286 | | | | | 3,384 | | | 3,754 | | | | | 56 | | | 73 | | | |
| Service charges | | | | | | | | | | | | | | | | | |
| Deposit-related fees | 4,441 | | | 4,908 | | | | | 2,538 | | | 3,163 | | | | | 49 | | | 50 | | | |
| Lending-related fees | 841 | | | 809 | | | | | 0 | | | 0 | | | | | 0 | | | 0 | | | |
| Total service charges | 5,282 | | | 5,717 | | | | | 2,538 | | | 3,163 | | | | | 49 | | | 50 | | | |
| Investment and brokerage services | | | | | | | | | | | | | | | | | |
| Asset management fees | 7,905 | | | 7,591 | | | | | 108 | | | 108 | | | | | 7,811 | | | 7,510 | | | |
| Brokerage fees | 2,898 | | | 2,733 | | | | | 96 | | | 115 | | | | | 1,270 | | | 1,295 | | | |
| Total investment and brokerage services | 10,803 | | | 10,324 | | | | | 204 | | | 223 | | | | | 9,081 | | | 8,805 | | | |
| Investment banking fees | | | | | | | | | | | | | | | | | |
| Underwriting income | 3,610 | | | 2,198 | | | | | 0 | | | 0 | | | | | 292 | | | 296 | | | |
| Syndication fees | 634 | | | 887 | | | | | 0 | | | 0 | | | | | 0 | | | 0 | | | |
| Financial advisory services | 1,072 | | | 1,083 | | | | | 0 | | | 0 | | | | | 0 | | | 0 | | | |
| Total investment banking fees | 5,316 | | | 4,168 | | | | | 0 | | | 0 | | | | | 292 | | | 296 | | | |
| Total fees and commissions | 25,490 | | | 24,495 | | | | | 6,126 | | | 7,140 | | | | | 9,478 | | | 9,224 | | | |
| Market making and similar activities | 6,983 | | | 7,267 | | | | | 2 | | | 5 | | | | | 52 | | | 90 | | | |
| Other income (loss) | (151) | | | 382 | | | | | 149 | | | 675 | | | | | 191 | | | 394 | | | |
| Total noninterest income | $ | 32,322 | | | $ | 32,144 | | | | | $ | 6,277 | | | $ | 7,820 | | | | | $ | 9,721 | | | $ | 9,708 | | | |
| | | | | | | | | | | | | | | | | |
| | | | | | | | | | | | | | | | | |
| Global Banking | | | | Global Markets | | | | All Other (1) | | |
| Nine Months Ended September 30 | | |
| 2020 | | 2019 | | | | 2020 | | 2019 | | | | 2020 | | 2019 | | |
| Fees and commissions: | | | | | | | | | | | | | | | | | |
| Card income | | | | | | | | | | | | | | | | | |
| Interchange fees | $ | 337 | | | $ | 390 | | | | | $ | 301 | | | $ | 61 | | | | | $ | 1 | | | $ | 0 | | | |
| Other card income | 10 | | | 8 | | | | | 0 | | | 0 | | | | | 0 | | | 0 | | | |
| Total card income | 347 | | | 398 | | | | | 301 | | | 61 | | | | | 1 | | | 0 | | | |
| Service charges | | | | | | | | | | | | | | | | | |
| Deposit-related fees | 1,694 | | | 1,557 | | | | | 134 | | | 120 | | | | | 26 | | | 18 | | | |
| Lending-related fees | 685 | | | 668 | | | | | 156 | | | 141 | | | | | 0 | | | 0 | | | |
| Total service charges | 2,379 | | | 2,225 | | | | | 290 | | | 261 | | | | | 26 | | | 18 | | | |
| Investment and brokerage services | | | | | | | | | | | | | | | | | |
| Asset management fees | 0 | | | 0 | | | | | 0 | | | 0 | | | | | (14) | | | (27) | | | |
| Brokerage fees | 45 | | | 26 | | | | | 1,487 | | | 1,296 | | | | | 0 | | | 1 | | | |
| Total investment and brokerage services | 45 | | | 26 | | | | | 1,487 | | | 1,296 | | | | | (14) | | | (26) | | | |
| Investment banking fees | | | | | | | | | | | | | | | | | |
| Underwriting income | 1,607 | | | 917 | | | | | 1,880 | | | 1,147 | | | | | (169) | | | (162) | | | |
| Syndication fees | 357 | | | 427 | | | | | 277 | | | 461 | | | | | 0 | | | (1) | | | |
| Financial advisory services | 948 | | | 984 | | | | | 123 | | | 99 | | | | | 1 | | | 0 | | | |
| Total investment banking fees | 2,912 | | | 2,328 | | | | | 2,280 | | | 1,707 | | | | | (168) | | | (163) | | | |
| Total fees and commissions | 5,683 | | | 4,977 | | | | | 4,358 | | | 3,325 | | | | | (155) | | | (171) | | | |
| Market making and similar activities | 88 | | | 190 | | | | | 7,059 | | | 5,623 | | | | | (218) | | | 1,359 | | | |
| Other income (loss) | 1,434 | | | 2,059 | | | | | (116) | | | 461 | | | | | (1,809) | | | (3,207) | | | |
| Total noninterest income | $ | 7,205 | | | $ | 7,226 | | | | | $ | 11,301 | | | $ | 9,409 | | | | | $ | (2,182) | | | $ | (2,019) | | | |
(1)All Other includes eliminations of intercompany transactions.
|
| | | | | | | | | | | | | | |
| | | | | | | |
| Results of Business Segments and All Other | | | | | | |
| | | | | | | |
| At and for the nine months ended September 30 | | Total Corporation (1) | | Consumer Banking |
| (Dollars in millions) | | 2017 | 2016 | | 2017 | 2016 |
| Net interest income (FTE basis) | | $ | 33,879 |
| $ | 31,470 |
| | $ | 17,953 |
| $ | 15,825 |
|
| Noninterest income | | 33,711 |
| 32,907 |
| | 7,614 |
| 7,795 |
|
| Total revenue, net of interest expense (FTE basis) | | 67,590 |
| 64,377 |
| | 25,567 |
| 23,620 |
|
| Provision for credit losses | | 2,395 |
| 2,823 |
| | 2,639 |
| 1,955 |
|
| Noninterest expense | | 41,713 |
| 41,790 |
| | 13,280 |
| 13,324 |
|
| Income before income taxes (FTE basis) | | 23,482 |
| 19,764 |
| | 9,648 |
| 8,341 |
|
| Income tax expense (FTE basis) | | 7,770 |
| 6,554 |
| | 3,638 |
| 3,088 |
|
| Net income | | $ | 15,712 |
| $ | 13,210 |
| | $ | 6,010 |
| $ | 5,253 |
|
| Period-end total assets | | $ | 2,283,896 |
| $ | 2,195,314 |
| | $ | 742,513 |
| $ | 687,241 |
|
| | | | | | | |
| | | Global Wealth &
Investment Management | | Global Banking |
| | | 2017 | 2016 | | 2017 | 2016 |
| Net interest income (FTE basis) | | $ | 4,653 |
| $ | 4,310 |
| | $ | 8,229 |
| $ | 7,440 |
|
| Noninterest income | | 9,254 |
| 8,963 |
| | 6,751 |
| 6,456 |
|
| Total revenue, net of interest expense (FTE basis) | | 13,907 |
| 13,273 |
| | 14,980 |
| 13,896 |
|
| Provision for credit losses | | 50 |
| 46 |
| | 80 |
| 870 |
|
| Noninterest expense | | 10,091 |
| 9,816 |
| | 6,435 |
| 6,450 |
|
| Income before income taxes (FTE basis) | | 3,766 |
| 3,411 |
| | 8,465 |
| 6,576 |
|
| Income tax expense (FTE basis) | | 1,420 |
| 1,270 |
| | 3,192 |
| 2,435 |
|
| Net income | | $ | 2,346 |
| $ | 2,141 |
| | $ | 5,273 |
| $ | 4,141 |
|
| Period-end total assets | | $ | 276,187 |
| $ | 289,794 |
| | $ | 423,185 |
| $ | 397,869 |
|
| | | | | | | |
| | | Global Markets | | All Other |
| | | 2017 | 2016 | | 2017 | 2016 |
| Net interest income (FTE basis) | | $ | 2,812 |
| $ | 3,391 |
| | $ | 232 |
| $ | 504 |
|
| Noninterest income | | 9,743 |
| 9,227 |
| | 349 |
| 466 |
|
| Total revenue, net of interest expense (FTE basis) | | 12,555 |
| 12,618 |
| | 581 |
| 970 |
|
| Provision for credit losses | | 2 |
| 23 |
| | (376 | ) | (71 | ) |
| Noninterest expense | | 8,117 |
| 7,690 |
| | 3,790 |
| 4,510 |
|
| Income (loss) before income taxes (FTE basis) | | 4,436 |
| 4,905 |
| | (2,833 | ) | (3,469 | ) |
| Income tax expense (benefit) (FTE basis) | | 1,553 |
| 1,746 |
| | (2,033 | ) | (1,985 | ) |
| Net income (loss) | | $ | 2,883 |
| $ | 3,159 |
| | $ | (800 | ) | $ | (1,484 | ) |
| Period-end total assets | | $ | 629,270 |
| $ | 595,165 |
| | $ | 212,741 |
| $ | 225,245 |
|
|
| | | | | | | | | | | | | | |
| | | | | | | |
| Business Segment Reconciliations | | | | | | |
| | | Three Months Ended September 30 | | Nine Months Ended September 30 |
| | | 2017 | 2016 | | 2017 | 2016 |
| Segments’ total revenue, net of interest expense (FTE basis) | | $ | 22,280 |
| $ | 21,451 |
| | $ | 67,009 |
| $ | 63,407 |
|
Adjustments (2): | | |
| |
| | |
| |
|
| ALM activities | | 273 |
| (43 | ) | | 332 |
| (12 | ) |
| Liquidating businesses and other | | (474 | ) | 455 |
| | 249 |
| 982 |
|
| FTE basis adjustment | | (240 | ) | (228 | ) | | (674 | ) | (666 | ) |
| Consolidated revenue, net of interest expense | | $ | 21,839 |
| $ | 21,635 |
| | $ | 66,916 |
| $ | 63,711 |
|
| Segments’ total net income | | 5,370 |
| 5,136 |
| | 16,512 |
| 14,694 |
|
Adjustments, net-of-taxes (2): | | | |
| | | |
|
| ALM activities | | 57 |
| (136 | ) | | (208 | ) | (453 | ) |
| Liquidating businesses and other | | 160 |
| (45 | ) | | (592 | ) | (1,031 | ) |
| Consolidated net income | | $ | 5,587 |
| $ | 4,955 |
| | $ | 15,712 |
| $ | 13,210 |
|
| | | | | | | |
| | | | | September 30 |
| | | | | | 2017 | 2016 |
| Segments’ total assets | | | | | $ | 2,071,155 |
| $ | 1,970,069 |
|
Adjustments (2): | | |
| |
| | |
| |
|
| ALM activities, including securities portfolio | | | | | 635,305 |
| 616,730 |
|
| Liquidating businesses and other | | | | | 92,443 |
| 116,989 |
|
| Elimination of segment asset allocations to match liabilities | | | | | (515,007 | ) | (508,474 | ) |
| Consolidated total assets | | | | | $ | 2,283,896 |
| $ | 2,195,314 |
|
| | | | | | | | |
(1)101Bank of America
| There were no material intersegment revenues. | |
| | | | | | | | |
(2)
| Adjustments include consolidated income, expense and asset amounts not specifically allocated to individual business segments. | |
| | | | | | | | | | | | | | | | | | | | | | | | | | | | | | |
| | | | | | | | | | | | | | |
| Business Segment Reconciliations | | | | | | | | | | | | | | |
| | | | | | | | | | | | | | |
| | | | | Three Months Ended September 30 | | | Nine Months Ended September 30 |
| (Dollars in millions) | | | | | 2020 | | 2019 | | | 2020 | | 2019 | | |
| Segments’ total revenue, net of interest expense | | | | | $ | 21,385 | | | $ | 23,703 | | | | $ | 67,994 | | | $ | 71,229 | | | |
Adjustments (1): | | | | | | | | | | | | | | |
| ALM activities | | | | | (168) | | | (221) | | | | 425 | | | (175) | | | |
| Liquidating businesses, eliminations and other | | | | | (767) | | | (527) | | | | (2,604) | | | (1,709) | | | |
| FTE basis adjustment | | | | | (114) | | | (148) | | | | (386) | | | (450) | | | |
| Consolidated revenue, net of interest expense | | | | | $ | 20,336 | | | $ | 22,807 | | | | $ | 65,429 | | | $ | 68,895 | | | |
| Segments’ total net income | | | | | 4,584 | | | 7,370 | | | | 12,405 | | | 22,055 | | | |
Adjustments, net-of-tax (1): | | | | | | | | | | | | | | |
| ALM activities | | | | | (127) | | | (158) | | | | 316 | | | (112) | | | |
| Liquidating businesses, eliminations and other | | | | | 424 | | | (1,435) | | | | (297) | | | (1,507) | | | |
| Consolidated net income | | | | | $ | 4,881 | | | $ | 5,777 | | | | $ | 12,424 | | | $ | 20,436 | | | |
| | | | | | | | | | | | | | |
| | | | | | | | | | September 30 | | |
| | | | | | | | | | 2020 | | 2019 | | |
| Segments’ total assets | | | | | | | | | | $ | 2,515,107 | | | $ | 2,218,817 | | | |
Adjustments (1): | | | | | | | | | | | | | | |
| ALM activities, including securities portfolio | | | | | | | | | | 1,018,385 | | | 686,301 | | | |
| Elimination of segment asset allocations to match liabilities | | | | | | | | | | (857,787) | | | (546,529) | | | |
| | | | | | | | | | | | | | |
| Other | | | | | | | | | | 62,747 | | | 67,741 | | | |
| Consolidated total assets | | | | | | | | | | $ | 2,738,452 | | | $ | 2,426,330 | | | |
(1)Adjustments include consolidated income, expense and asset amounts not specifically allocated to individual business segments.
Glossary
Alt-A Mortgage –A type of U.S. mortgage that is considered riskier than A-paper, or "prime,"“prime,” and less risky than "subprime,"“subprime,” the riskiest category. Alt-A interest rates therefore tend to be between those of prime and subprime consumer real estate loans. Typically, Alt-A mortgages are characterized by borrowers with less than full documentation, lower credit scores and higher LTVs.
Assets in Custody – Consist largely of custodial and non-discretionary trust assets excluding brokerage assets administered for clients. Trust assets encompass a broad range of asset types including real estate, private company ownership interest, personal property and investments.
Assets Under Management (AUM)– The total market value of assets under the investment advisory and/or discretion of GWIM which generate asset management fees based on a percentage of the assets’ market values. AUM reflects assets that are generally managed for institutional, high net worth and retail clients, and are distributed through various investment products including mutual funds, other commingled vehicles and separate accounts.
Banking Book – All on- and off-balance sheet financial instruments of the Corporation except for those positions that are held for trading purposes.
Carrying Value (with respect to loans)Brokerage and Other Assets– The amount at which a loan is recorded on the balance sheet. For loans recorded at amortized cost, carrying value is the unpaid principal balance net of unamortized deferred loan origination fees and costs and unamortized purchase premiums or discounts, less net charge-offs and interest payments applied as a reduction of principal under the cost recovery method for loans that have been on nonaccrual status. For PCI loans, the carrying value equals fair value upon acquisition adjusted for subsequent cash collections and yield accreted to date. For credit card loans, the carrying value also includes interest that has been billed to the customer. For loans classified as held-for-sale, carrying value is the lower of carrying value as described above, or fair value. For loans where we have elected the fair value option, the carrying value is fair value.
Client Brokerage Assets– ClientNon-discretionary client assets which are held in brokerage accounts including non-discretionary brokerage and fee-based assets that generate brokerage income and asset management fee revenue.or held for safekeeping.
Committed Credit Exposure– Includes anyAny funded portion of a facility plus the unfunded portion of a facility on which the lender is legally bound to advance funds during a specified period under prescribed conditions.
Credit Derivatives – Contractual agreements that provide protection against a specified credit event on one or more referenced obligations. The nature of a credit event is established by the protection purchaser and the protection seller at the inception of the transaction, and such events generally include bankruptcy or insolvency of the referenced credit entity, failure to meet payment obligations when due, as well as acceleration of indebtedness and payment repudiation or moratorium. The purchaser of the credit derivative pays a periodic fee in return for a payment by the protection seller upon the occurrence, if any, of such a credit event. A CDS is a type of a credit derivative.
Credit Valuation Adjustment (CVA) – A portfolio adjustment required to properly reflect the counterparty credit risk exposure as part of the fair value of derivative instruments.
Debit Valuation Adjustment (DVA)– A portfolio adjustment required to properly reflect the Corporation’s own credit risk exposure as part of the fair value of derivative instruments and/or structured liabilities.
Funding Valuation Adjustment (FVA)– A portfolio adjustment required to include funding costs on uncollateralized derivatives and derivatives where the Corporation is not permitted to use the collateral it receives.
Interest Rate Lock Commitment (IRLC)– Commitment with a loan applicant in which the loan terms including interest rate and price, are guaranteed for a designated period of time subject to credit approval.
Letter of Credit– A document issued on behalf of a customer to a third party promising to pay the third party upon presentation of specified documents. A letter of credit effectively substitutes the issuer’s credit for that of the customer.
Loan-to-value (LTV)– A commonly used credit quality metric. LTV is calculated as the outstanding carrying value of the loan divided by the estimated value of the property securing the loan. Estimated property values are generally determined through the use of automated valuation models (AVMs) or the CoreLogic Case-Shiller Index. An AVM is a tool that estimates the value of a property by reference to large volumes of market data including sales of comparable properties and price trends specific to the Metropolitan Statistical Area in which the property being valued is located. CoreLogic Case-Shiller is a widely used index based on data from repeat sales of single family homes. CoreLogic Case-Shiller indexed-based values are reported on a three-month or one-quarter lag.
Margin Receivable– An extension of credit secured by eligible securities in certain brokerage accounts.
Matched Book – Repurchase and resale agreements or securities borrowed and loaned transactions where the overall asset and liability position is similar in size and/or maturity. Generally, these are entered into to accommodate customers where the Corporation earns the interest rate spread.
Mortgage Servicing Rights (MSR) – The right to service a mortgage loan when the underlying loan is sold or securitized. Servicing includes collections for principal, interest and escrow payments from borrowers and accounting for and remitting principal and interest payments to investors.
Net Interest Yield– Net interest income divided by average total interest-earning assets.
Nonperforming Loans and Leases– Includes loans and leases that have been placed on nonaccrual status, including nonaccruing loans whose contractual terms have been restructured in a manner that grants a concession to a borrower experiencing financial difficulties. Loans accounted for under the fair value option, PCI loans and LHFS are not reported as nonperforming loans and leases. Credit card receivables, residential mortgage loans that are insured by the FHA or through long-term credit protection agreements with FNMA and FHLMC (fully-insured loan portfolio) and certain other consumer loans are not placed on nonaccrual status and are, therefore, not reported as nonperforming loans and leases.
Operating Margin – Income before income taxes divided by total revenue, net of interest expense.
Pay Option Loans – Pay option adjustable-rate mortgages have interest rates that adjust monthly and minimum required payments that adjust annually. During an initial five- or ten-year period, minimum required payments may increase by no more than 7.5 percent. If payments are insufficient to pay all of the monthly interest charges, unpaid interest is added to the loan balance (i.e., negative amortization) until the loan balance increases to a specified limit, at which time a new monthly payment amount adequate to repay the loan over its remaining contractual life is established.
Prompt Corrective Action (PCA)– A framework established by the U.S. banking regulators requiring banks to maintain certain levels of regulatory capital ratios, comprised of five categories of capitalization: “well capitalized,” “adequately capitalized,” “undercapitalized,” “significantly undercapitalized” and “critically undercapitalized.” Insured depository institutions that fail to meet certain of these capital levels are subject to increasingly strict limits on their activities, including their ability to make capital distributions, pay management compensation, grow assets and take other actions.
Purchased Credit-impaired (PCI) Loan– A loan purchased as an individual loan, in a portfolio of loans or in a business combination with evidence of deterioration in credit quality since origination for which it is probable, upon acquisition, that the investor will be unable to collect all contractually required payments. These loans are recorded at fair value upon acquisition.
Subprime Loans – Although a standard industry definition for subprime loans (including subprime mortgage loans) does not exist, the Corporation defines subprime loans as specific product offerings for higher risk borrowers, including individuals with one or a combination of high credit risk factors, such as low FICO scores, high debt to income ratios and inferior payment history.borrowers.
Troubled Debt Restructurings (TDRs)– Loans whose contractual terms have been restructured in a manner that grants a concession to a borrower experiencing financial difficulties. Certain consumer loans for which a binding offer to restructure has been extended are also classified as TDRs. Concessions could include a reduction in the interest rate to a rate that is below market on the loan, payment extensions, forgiveness of principal, forbearance, loans discharged in bankruptcy or other actions intended to maximize collection. Secured consumer loans that have been discharged in Chapter 7 bankruptcy and have not been reaffirmed by the borrower are classified as TDRs at the time of discharge from bankruptcy.
Value-at-Risk (VaR)– VaR is a model that simulates the value of a portfolio under a range of hypothetical scenarios in order to generate a distribution of potential gains and losses. VaR represents the loss the portfolio is expected to experience with a given confidence level based on historical data. A VaR model is an effective tool in estimating ranges of potential gains and losses on our trading portfolios.
Key Metrics
129BankActive Digital Banking Users –Mobile and/or online users with activity over the last three months.
Active Mobile Banking Users – Mobile users with activity over the last three months.
Book Value – Ending common shareholders' equity divided by ending common shares outstanding.
Deposit Spread –Annualized net interest income divided by average deposits.
Efficiency Ratio – Noninterest expense divided by total revenue, net of Americainterest expense.
Financial advisor productivity –Adjusted MLGWM annualized revenue divided by average financial advisors.
Gross Interest Yield – Effective annual percentage rate divided by average loans.
Net Interest Yield– Net interest income divided by average total interest-earning assets.
Operating Margin – Income before income taxes divided by total revenue, net of interest expense.
Risk-adjusted Margin – Difference between total revenue, net of interest expense, and net credit losses divided by average loans.
Return on Average Allocated Capital –Adjusted net income divided by allocated capital.
Return on Average Assets – Net income divided by total average assets.
Return on Average Common Shareholders' Equity– Net income applicable to common shareholders divided by average common shareholders' equity.
Return on Average Shareholders' Equity– Net income divided by average shareholders' equity.
Acronyms
| | | | | |
| ABS | Asset-backed securities |
| AFS | Available-for-sale |
| ALM | Asset and liability management |
| ARR | Alternative reference rates |
| AUM | Assets under management |
| AVM | Automated valuation model |
| |
| BANA | Bank of America, National Association |
| BHC | Bank holding company |
| |
| BofAS | BofA Securities, Inc. |
| BofASE | BofA Securities Europe SA |
| bps | basis points |
| |
| |
ABSCCAR | Asset-backed securities |
AFS | Available-for-sale |
ALM | Asset and liability management |
AUM | Assets under management |
BANA | Bank of America, National Association |
BHC | Bank holding company |
bps | basis points |
CCAR | Comprehensive Capital Analysis and Review |
| CDO | Collateralized debt obligation |
CDS | Credit default swap |
CLOCECL | Collateralized loan obligationCurrent expected credit losses |
CLTVCET1 | Combined loan-to-valueCommon equity tier 1 |
CVA | |
| |
| CFTC | Commodity Futures Trading Commission |
| |
| CLTV | Combined loan-to-value |
| |
| CVA | Credit valuation adjustment |
DVA | |
| DVA | Debit valuation adjustment |
EPS | |
| |
| ECL | Expected credit losses |
| EPS | Earnings per common share |
ERC | Enterprise Risk Committee |
FASB | Financial Accounting Standards Board |
FCA | Financial Conduct Authority |
FDIC | Federal Deposit Insurance Corporation |
FHA | |
| |
| FHA | Federal Housing Administration |
FHLB | |
| FHLB | Federal Home Loan Bank |
FHLMC | Freddie Mac |
| FICC | Fixed-income,Fixed income, currencies and commodities |
| FICO | Fair Isaac Corporation (credit score) |
FNMA | Fannie Mae |
FTE | Fully taxable-equivalent |
FVAFTE | Fully taxable-equivalent |
| FVA | Funding valuation adjustment |
| GAAP | Accounting principles generally accepted in the United States of America |
| |
| GLS | Global Liquidity Sources |
| GNMA | Government National Mortgage Association |
GPI | Global Principal Investments |
| GSE | Government-sponsored enterprise |
| G-SIB | Global systemically important bank |
| GWIM | Global Wealth & Investment Management |
HELOC | Home equity line of credit |
HQLA | High Quality Liquid Assets |
HTM | Held-to-maturity |
ICAAP | Internal Capital Adequacy Assessment Process |
|
| |
IMM | Internal models methodology |
| |
| |
| |
| |
| |
| |
| | | | | |
| |
| |
| |
| |
| HELOC | Home equity line of credit |
| HQLA | High Quality Liquid Assets |
| HTM | Held-to-maturity |
| |
| |
| IBOR | Interbank Offered Rates |
| IRLC | Interest rate lock commitment |
| ISDA | International Swaps and Derivatives Association, Inc. |
| LCR | Liquidity Coverage Ratio |
LHFS | Loans held-for-sale |
LIBORLHFS | Loans held-for-sale |
| LIBOR | London InterBankInterbank Offered Rate |
| LTV | Loan-to-value |
| MBS | Mortgage-backed securities |
| |
| MD&A | Management’s Discussion and Analysis of Financial Condition and Results of Operations |
MI | Mortgage insurance |
| MLGWM | Merrill Lynch Global Wealth Management |
| MLI | Merrill Lynch International |
| MLPCC | Merrill Lynch Professional Clearing Corp |
| MLPF&S | Merrill Lynch, Pierce, Fenner & Smith Incorporated |
MSA | |
| MSA | Metropolitan Statistical Area |
| MSR | Mortgage servicing right |
NSFR | Net Stable Funding Ratio |
OAS | Option-adjusted spread |
OCI | |
| |
| OCI | Other comprehensive income |
| OREO | Other real estate owned |
OTC | Over-the-counter |
OTTI | Other-than-temporary impairment |
| PCA | Prompt Corrective Action |
PCI | Purchased credit-impaired |
PPI | Payment protection insurance |
RMBS | Residential mortgage-backed securities |
RSU | Restricted stock unit |
SBLCPPP | Paycheck Protection Program |
| |
| |
| RWA | Risk-weighted assets |
| SBA | Small Business Administration |
| SBLC | Standby letter of credit |
SEC | |
| |
| SCB | Stress capital buffer |
| SEC | Securities and Exchange Commission |
| SLR | Supplementary leverage ratio |
TDR | |
| TDR | Troubled debt restructurings |
| TLAC | Total loss-absorbing capacity |
TTF | Time-to-required funding |
VA | U.S. Department of Veterans Affairs |
| VaR | Value-at-Risk |
| VIE | Variable interest entity |
Part II. Other Information
Bank of America Corporation and Subsidiaries
Item 1. Legal Proceedings
See Litigation and Regulatory Matters in Note 10 – Commitments and Contingencies to the Consolidated Financial Statements, which is incorporated by reference in this Item 1, for litigation and regulatory disclosure that supplements the disclosure in Note 1213 – Commitments and Contingencies to the Consolidated Financial Statements of the Corporation's 2016Corporation’s 2019 Annual Report on Form 10-K.
Item 1A. Risk Factors
There are no material changes from the risk factors set forth under Part 1, Item 1A. Risk Factors of the Corporation's 2016Our Annual Report on Form 10-K for the year ended December 31, 2019 (2019 Form 10-K) describes market, credit, geopolitical and business operations risk factors that could affect our businesses, results of operations or financial condition due to, among other things, “widespread health emergencies or pandemics.” On March 11, 2020, the World Health Organization declared the outbreak of a strain of novel coronavirus disease, COVID-19, a global pandemic. As conditions and circumstances related to the COVID-19 pandemic evolved subsequent to our 2019 Form 10-K filing, the Corporation disclosed a risk factor in its Quarterly Reports on Form 10-Q for the periods ended March 31, 2020 and June 30, 2020 captioned “Coronavirus Disease 2019” to supplement the risk factors described in its 2019 Form 10-K. The following supplements the risk factors described in the Corporation’s 2019 Form 10-K and Quarterly Reports on Form 10-Q for the periods ended March 31, 2020 and June 30, 2020.
The COVID-19 pandemic has caused a significant global economic downturn that has adversely affected, and is expected to continue to adversely affect, the Corporation’s businesses and results of operations, and the duration and future impacts of the COVID-19 pandemic on the U.S. and/or global economy and the Corporation’s businesses, results of operations and financial condition remain uncertain.
The COVID-19 pandemic has resulted in authorities implementing numerous measures intended to contain the spread and impact of COVID-19, such as travel bans and restrictions, quarantines, shelter in place orders, and limitations on business activity, including closures. These measures have severely restricted economic activity, reduced economic output and resulted in a deterioration in economic conditions, globally and in the U.S. This has led to, among other things, high rates of unemployment and underemployment and caused volatility and disruptions in consumer spending and the global financial markets, including the energy and commodity markets. Although some of these restrictive measures have been eased in certain areas, many of the restrictive measures remain in place or have been reinstated, and in some cases additional restrictive measures are being or may need to be implemented. Businesses, market participants, our counterparties and clients, and the U.S. and global economy have been negatively impacted and may continue to be so for an extended period of time, as there remains significant uncertainty about the timing and strength of an economic recovery.
The negative economic conditions arising from the COVID-19 pandemic negatively impacted our financial results during the third quarter in various respects, including allowance for credit losses and noninterest expense. These negative economic conditions may have a continued adverse effect on
our businesses and results of operations, which could include, but not be limited to: decreased demand for and use of our products and services; protracted periods of historically low interest rates; lower fees, including asset management fees; lower sales and trading revenue due to decreased market liquidity resulting from heightened volatility; increased noninterest expense, including operational losses; and increased credit losses due to our customers' and clients' inability to fulfill contractual obligations and deterioration in the financial condition of our consumer and commercial borrowers, which may vary by region, sector or industry, that may increase our provision for credit losses and net charge-offs. Our provision for credit losses and net charge-offs may also continue to be impacted by volatility in the energy and commodity markets. Additionally, our liquidity and/or regulatory capital could be adversely impacted by customers’ withdrawal of deposits, volatility and disruptions in the capital and credit markets, volatility in foreign exchange rates and customer draws on lines of credit. Continued adverse macroeconomic conditions caused by COVID-19 could also result in potential downgrades to our credit ratings, negative impacts to regulatory capital and liquidity and further restrictions on dividends and/or repurchases of our common stock, which could limit the capital we return to shareholders.
If we become unable to operate our business from remote locations including, for example, because of an internal or external failure of our information technology infrastructure, we experience increased rates of employee illness or unavailability, or governmental restrictions are placed on our employees or operations, this could also have an adverse effect on our business continuity status and result in disruption to our businesses. Additionally we rely on third parties who could experience adverse effects on their business continuity status and business interruptions, which could increase our risks and have an adverse impact on the Corporation's businesses. To the extent the COVID-19 pandemic continues to adversely affect the U.S. and/or global economy and/or adversely affects our businesses, results of operations or financial condition, it may also have the effect of increasing the likelihood and/or magnitude of other risks described in the section captioned “Risk Factors” in our 2019 Form 10-K or risks described in our other filings with the Securities and Exchange Commission.
In response to the economic and market conditions resulting from the COVID-19 pandemic, governments and regulatory authorities, including central banks, have acted and may take further action to provide fiscal and monetary stimuli to support the global economy. However, there can be no assurance that these measures will stimulate the global economy or avert continued recessionary conditions in markets or economies in which we conduct operations. Our participation in and execution of measures taken by governments and regulatory authorities could result in reputational harm and government actions and proceedings, and has resulted in, and may continue to result in, litigation, including class actions. Such actions may result in judgments, settlements, penalties, and fines adverse to the Corporation.
We continue to closely monitor the COVID-19 pandemic and related risks as they evolve globally and in the U.S. The magnitude and duration of the current outbreak of COVID-19, the likelihood of further surges of COVID-19 cases, the timing and availability of effective medical treatments and vaccines, future actions taken by governmental authorities and/or other
third parties in response to the COVID-19 pandemic, and its future direct and indirect effects on the global economy and our businesses, results of operation and financial condition are highly uncertain. The COVID-19 pandemic may cause prolonged
global or national recessionary economic conditions or longer lasting effects on economic conditions than currently exist, which could have a material adverse effect on our businesses, results of operations and financial condition.
Item 2. Unregistered Sales of Equity Securities and Use of Proceeds
The table below presents share repurchase activity for the three months ended September 30, 2017.2020. The primary source of funds for cash distributions by the Corporation to its shareholders is dividends received from its banking subsidiaries. Each of the banking subsidiaries is subject to various regulatory policies and requirements relating to the payment of dividends, including requirements to maintain capital above regulatory minimums. All of the Corporation’s preferred stock outstanding has preference over the Corporation’s common stock with respect to payment of dividends.
| | | | | | | | | | | | | | | | | | | | | | | |
| | | | | | | |
| (Dollars in millions, except per share information; shares in thousands) | Total Common Shares Repurchased (1,2) | | Weighted-Average Per Share Price | | Total Shares
Purchased as
Part of Publicly
Announced Programs | | Remaining Buyback
Authority Amounts |
| July 1 - 31, 2020 | 5 | | | $ | 23.70 | | | — | | | $ | — | |
| August 1 - 31, 2020 | 5,391 | | | 27.90 | | | — | | | — | |
| September 1 - 30, 2020 | 104 | | | 26.47 | | | — | | | — | |
| Three months ended September 30, 2020 | 5,500 | | | 27.87 | | | — | | | |
|
| | | | | | | | | | | | | |
| | | | | | | | |
| (Dollars in millions, except per share information; shares in thousands) | Common Shares Repurchased (1) | | Weighted-Average Per Share Price | | Shares Purchased as
Part of Publicly
Announced Programs | | Remaining Buyback Authority Amounts (2) |
| July 1 - 31, 2017 | 30,236 |
| | $ | 24.02 |
| | 30,235 |
| | $ | 12,183 |
|
| August 1 - 31, 2017 | 61,880 |
| | 24.22 |
| | 59,353 |
| | 10,745 |
|
| September 1 - 30, 2017 | 34,368 |
| | 23.78 |
| | 34,368 |
| | 9,928 |
|
| Three months ended September 30, 2017 | 126,484 |
| | 24.06 |
| | |
| | |
|
| |
(1)
| Includes shares of the Corporation’s common stock acquired by the Corporation in connection with satisfaction of tax withholding obligations on vested restricted stock or restricted stock units and certain forfeitures and terminations of employment-related awards under equity incentive plans. |
| |
(2)
| On June 28, 2017, following the Federal Reserve's non-objection to our 2017 CCAR capital plan, the Board authorized the repurchase of $12.9 billion in common stock from July 1, 2017 through June 30, 2018, including approximately $900 million to offset the effect of equity-based compensation plans during the same period. During the three months ended September 30, 2017, pursuant to the Board's authorization, the Corporation repurchased approximately $3.0 billion of common stock, which included common stock to offset equity-based compensation awards. For additional information, see Capital Management -- CCAR and Capital Planning on page 28 and Note 11 – Shareholders’ Equity to the Consolidated Financial Statements.
|
On August 24, 2017, the holders of the Corporation's Series T preferred stock exercised warrants to acquire 700(1)Includes 1.5 million shares of the Corporation's common stock. To purchase the Corporation's common stock upon exercise of the warrants, the holders submitted as consideration $5 billion of Series T preferred stock. On August 29, 2017, the Corporation issued 700 million shares of common stock to the holders. The terms of the warrants were previously disclosed in the Corporation’s Current Report on Form 8-K filed on August 25, 2011. The sale of the Corporation’s common stock acquired by the Corporation in connection with satisfaction of tax withholding obligations on vested restricted stock or restricted stock units and certain forfeitures and terminations of employment-related awards and for potential re-issuance to certain employees under equity incentive plans.
(2)During the three months ended September 30, 2020, pursuant to exercisethe Board of Directors' authorization, the warrants has not been registered withCorporation repurchased four million shares, or $114 million, of it's common stock solely to offset shares awarded under equity-based compensation plans. For more information, see Capital Management - CCAR and Capital Planning in the SecuritiesMD&A on page 23 and Exchange Commission. Such sale is exempt from registration pursuantNote 11 – Shareholders’ Equity to Section 4(2) and Section 3(a)(9) of the Securities Act of 1933, as amended. Consolidated Financial Statements.
The Corporation did not receivehave any proceeds fromunregistered sales of equity securities during the sale of the common stock upon exercise of the warrants; the cash proceeds the Corporation received in connection with the sale of the Series T preferred stock in August 2011 were used for general corporate purposes.
three months ended September 30, 2020.
|
| | | | | | |
| | | | Incorporated by Reference |
| Exhibit No. | Description | Notes | Form | Exhibit | Filing Date | File No. |
| 3(a) | | | 10-Q | 3(a) | 5/2/16 | 1-6523 |
| | | | | | | |
| 3(b) | | | 8-K | 3.1 | 3/20/15 | 1-6523 |
| | | | | | | |
| 11 | | 1 | | | | |
| | | | | | | |
| 12 | | 1 | | | | |
| | | | | | | |
| 31(a) | | 1 | | | | |
| | | | | | | |
| 31(b) | | 1 | | | | |
| | | | | | | |
| 32(a) | | 1 | | | | |
| | | | | | | |
| 32(b) | | 1 | | | | |
| | | | | | | |
| 101.INS | XBRL Instance Document | 1 | | | | |
| | | | | | | |
| 101.SCH | XBRL Taxonomy Extension Schema Document | 1 | | | | |
| | | | | | | |
| 101.CAL | XBRL Taxonomy Extension Calculation Linkbase Document | 1 | | | | |
| | | | | | | |
| 101.LAB | XBRL Taxonomy Extension Label Linkbase Document | 1 | | | | |
| | | | | | | |
| 101.PRE | XBRL Taxonomy Extension Presentation Linkbase Document | 1 | | | | |
| | | | | | | |
| 101.DEF | XBRL Taxonomy Extension Definitions Linkbase Document | 1 | | | | |
| | | | | | | | | | | | | | | | | |
| | | | | |
| Exhibit No. | | Description | Notes | | | | | | | | |
| | | | | | | | | | | |
| 3.1 | | | 1 | | | | | | | | |
| | | | | | | | | | | |
| 3.2 | | | 1 | | | | | | | | |
| | | | | | | | | | | |
| 31.1 | | | 1 | | | | | | | | |
| | | | | | | | | | | |
| 31.2 | | | 1 | | | | | | | | |
| | | | | | | | | | | |
| 32.1 | | | 1 | | | | | | | | |
| | | | | | | | | | | |
| 32.2 | | | 1 | | | | | | | | |
| | | | | | | | | | | |
| 101.INS | | Inline XBRL Instance Document | 2 | | | | | | | | |
| | | | | | | | | | | |
| 101.SCH | | Inline XBRL Taxonomy Extension Schema Document | 1 | | | | | | | | |
| | | | | | | | | | | |
| 101.CAL | | Inline XBRL Taxonomy Extension Calculation Linkbase Document | 1 | | | | | | | | |
| | | | | | | | | | | |
| 101.LAB | | Inline XBRL Taxonomy Extension Label Linkbase Document | 1 | | | | | | | | |
| | | | | | | | | | | |
| 101.PRE | | Inline XBRL Taxonomy Extension Presentation Linkbase Document | 1 | | | | | | | | |
| | | | | | | | | | | |
| 101.DEF | | Inline XBRL Taxonomy Extension Definitions Linkbase Document | 1 | | | | | | | | |
| | | | | | | | | | | |
| 104 | | Cover Page Interactive Data File (formatted as Inline XBRL and contained in Exhibit 101) | | | | | | | | | |
(1) Filed herewith.
(2) The instance document does not appear in the interactive data file because its XBRL tags are embedded within the inline XBRL document.
Signature
Pursuant to the requirements of the Securities Exchange Act of 1934, the registrant has duly caused this report to be signed on its behalf by the undersigned, thereunto duly authorized.
|
| | | | | | | | | | | | | | | | |
| | Bank of America Corporation Registrant | |
| | | | |
| Date: | October 30, 20172020 | | /s/ Rudolf A. Bless | |
| | | Rudolf A. Bless
Chief Accounting Officer
| |