| Title of each class | Trading Symbol(s) | Name of each exchange on which registered |
| Common Stock, par value $0.01 per share | BAC | New York Stock Exchange |
| Depositary Shares, each representing a 1/1,000th interest in a share | BAC PrE | New York Stock Exchange |
| of Floating Rate Non-Cumulative Preferred Stock, Series E | ||
| Depositary Shares, each representing a 1/1,000th interest in a share | BAC PrY | New York Stock Exchange |
| of 6.500% Non-Cumulative Preferred Stock, Series Y | ||
| Depositary Shares, each representing a 1/1,000th interest in a share | BAC PrC | New York Stock Exchange |
| of 6.200% Non-Cumulative Preferred Stock, Series CC | ||
| Depositary Shares, each representing a 1/1,000th interest in a share | BAC PrA | New York Stock Exchange |
| of 6.000% Non-Cumulative Preferred Stock, Series EE | ||
| Depositary Shares, each representing a 1/1,000th interest in a share | BAC PrB | New York Stock Exchange |
| of 6.000% Non-Cumulative Preferred Stock, Series GG | ||
| Depositary Shares, each representing a 1/1,000th interest in a share | BAC PrK | New York Stock Exchange |
| of 5.875% Non-Cumulative Preferred Stock, Series HH | ||
| 7.25% Non-Cumulative Perpetual Convertible Preferred Stock, Series L | BAC PrL | New York Stock Exchange |
| Depositary Shares, each representing a 1/1,200th interest in a share | BML PrG | New York Stock Exchange |
| of Bank of America Corporation Floating Rate | ||
| Non-Cumulative Preferred Stock, Series 1 | ||
1Bank of America | ||
| Title of each class | Trading Symbol(s) | Name of each exchange on which registered |
| Depositary Shares, each representing a 1/1,200th interest in a share | BML PrH | New York Stock Exchange |
| of Bank of America Corporation Floating Rate | ||
| Non-Cumulative Preferred Stock, Series 2 | ||
| Depositary Shares, each representing a 1/1,200th interest in a share | BML PrJ | New York Stock Exchange |
| of Bank of America Corporation Floating Rate | ||
| Non-Cumulative Preferred Stock, Series 4 | ||
| Depositary Shares, each representing a 1/1,200th interest in a share | BML PrL | New York Stock Exchange |
| of Bank of America Corporation Floating Rate | ||
| Non-Cumulative Preferred Stock, Series 5 | ||
| Floating Rate Preferred Hybrid Income Term Securities of BAC Capital | BAC/PF | New York Stock Exchange |
| Trust XIII (and the guarantee related thereto) | ||
| 5.63% Fixed to Floating Rate Preferred Hybrid Income Term Securities | BAC/PG | New York Stock Exchange |
| of BAC Capital Trust XIV (and the guarantee related thereto) | ||
| Income Capital Obligation Notes initially due December 15, 2066 of | MER PrK | New York Stock Exchange |
| Bank of America Corporation | ||
| Senior Medium-Term Notes, Series A, Step Up Callable Notes, due | BAC/31B | New York Stock Exchange |
| November 28, 2031 of BofA Finance LLC (and the guarantee | ||
| of the Registrant with respect thereto) | ||
Depositary Shares, each representing a 1/1,000th interest in a share of | BAC PrM | New York Stock Exchange |
| 5.375% Non-Cumulative Preferred Stock, Series KK | ||
| Depositary Shares, each representing a 1/1,000th interest in a share | BAC PrN | New York Stock Exchange |
| 5.000% Non-Cumulative Preferred Stock, Series LL | ||
Large accelerated filer | ☑ | Accelerated filer | ☐ | Non-accelerated filer | ☐ | Smaller reporting company | ☐ | |||
Bank of America 2 | ||
| Item 1. Financial Statements | Page | |
| Item 2. Management’s Discussion and Analysis of Financial Condition and Results of Operations | ||
1 | ||
Bank of America2 | ||
3Bank of America | ||
| Table 1 | Summary Income Statement and Selected Financial Data | Summary Income Statement and Selected Financial Data | ||||||||||||||||||||||||||||||
| Three Months Ended September 30 | Nine Months Ended September 30 | Three Months Ended September 30 | Nine Months Ended September 30 | |||||||||||||||||||||||||||||
| (Dollars in millions, except per share information) | (Dollars in millions, except per share information) | 2018 | 2017 | 2018 | 2017 | (Dollars in millions, except per share information) | 2019 | 2018 | 2019 | 2018 | ||||||||||||||||||||||
| Income statement | Income statement | Income statement | ||||||||||||||||||||||||||||||
| Net interest income | Net interest income | $ | 11,870 | $ | 11,161 | $ | 35,128 | $ | 33,205 | Net interest income | $ | 12,187 | $ | 12,061 | $ | 36,751 | $ | 35,658 | ||||||||||||||
| Noninterest income | Noninterest income | 10,907 | 10,678 | 33,383 | 33,711 | Noninterest income | 10,620 | 10,663 | 32,144 | 32,685 | ||||||||||||||||||||||
| Total revenue, net of interest expense | Total revenue, net of interest expense | 22,777 | 21,839 | 68,511 | 66,916 | Total revenue, net of interest expense | 22,807 | 22,724 | 68,895 | 68,343 | ||||||||||||||||||||||
| Provision for credit losses | Provision for credit losses | 716 | 834 | 2,377 | 2,395 | Provision for credit losses | 779 | 716 | 2,649 | 2,377 | ||||||||||||||||||||||
| Noninterest expense | Noninterest expense | 13,067 | 13,394 | 40,248 | 41,469 | Noninterest expense | 15,169 | 13,014 | 41,661 | 40,080 | ||||||||||||||||||||||
| Income before income taxes | Income before income taxes | 8,994 | 7,611 | 25,886 | 23,052 | Income before income taxes | 6,859 | 8,994 | 24,585 | 25,886 | ||||||||||||||||||||||
| Income tax expense | Income tax expense | 1,827 | 2,187 | 5,017 | 7,185 | Income tax expense | 1,082 | 1,827 | 4,149 | 5,017 | ||||||||||||||||||||||
| Net income | Net income | 7,167 | 5,424 | 20,869 | 15,867 | Net income | 5,777 | 7,167 | 20,436 | 20,869 | ||||||||||||||||||||||
| Preferred stock dividends | Preferred stock dividends | 466 | 465 | 1,212 | 1,328 | Preferred stock dividends | 505 | 466 | 1,186 | 1,212 | ||||||||||||||||||||||
| Net income applicable to common shareholders | Net income applicable to common shareholders | $ | 6,701 | $ | 4,959 | $ | 19,657 | $ | 14,539 | Net income applicable to common shareholders | $ | 5,272 | $ | 6,701 | $ | 19,250 | $ | 19,657 | ||||||||||||||
| Per common share information | Per common share information | Per common share information | ||||||||||||||||||||||||||||||
| Earnings | Earnings | $ | 0.67 | $ | 0.49 | $ | 1.93 | $ | 1.44 | Earnings | $ | 0.57 | $ | 0.67 | $ | 2.02 | $ | 1.93 | ||||||||||||||
| Diluted earnings | Diluted earnings | 0.66 | 0.46 | 1.91 | 1.36 | Diluted earnings | 0.56 | 0.66 | 2.01 | 1.91 | ||||||||||||||||||||||
| Dividends paid | Dividends paid | 0.15 | 0.12 | 0.39 | 0.27 | Dividends paid | 0.18 | 0.15 | 0.48 | 0.39 | ||||||||||||||||||||||
| Performance ratios | Performance ratios | Performance ratios | ||||||||||||||||||||||||||||||
| Return on average assets | Return on average assets | 1.23 | % | 0.95 | % | 1.20 | % | 0.94 | % | Return on average assets | 0.95 | % | 1.23 | % | 1.14 | % | 1.20 | % | ||||||||||||||
| Return on average common shareholders’ equity | Return on average common shareholders’ equity | 10.99 | 7.89 | 10.86 | 7.91 | Return on average common shareholders’ equity | 8.48 | 10.99 | 10.49 | 10.86 | ||||||||||||||||||||||
Return on average tangible common shareholders’ equity (1) | Return on average tangible common shareholders’ equity (1) | 15.48 | 10.98 | 15.30 | 11.10 | Return on average tangible common shareholders’ equity (1) | 11.84 | 15.48 | 14.67 | 15.30 | ||||||||||||||||||||||
| Efficiency ratio | Efficiency ratio | 57.37 | 61.33 | 58.75 | 61.97 | Efficiency ratio | 66.51 | 57.27 | 60.47 | 58.65 | ||||||||||||||||||||||
| September 30 2018 | December 31 2017 | �� | September 30 2019 | December 31 2018 | ||||||||||||||||||||||||||||
| Balance sheet | Balance sheet | Balance sheet | ||||||||||||||||||||||||||||||
| Total loans and leases | Total loans and leases | $ | 929,801 | $ | 936,749 | Total loans and leases | $ | 972,910 | $ | 946,895 | ||||||||||||||||||||||
| Total assets | Total assets | 2,338,833 | 2,281,234 | Total assets | 2,426,330 | 2,354,507 | ||||||||||||||||||||||||||
| Total deposits | Total deposits | 1,345,649 | 1,309,545 | Total deposits | 1,392,836 | 1,381,476 | ||||||||||||||||||||||||||
| Total liabilities | Total liabilities | 2,157,943 | 2,089,182 | |||||||||||||||||||||||||||||
| Total common shareholders’ equity | Total common shareholders’ equity | 239,832 | 244,823 | Total common shareholders’ equity | 244,781 | 242,999 | ||||||||||||||||||||||||||
| Total shareholders’ equity | Total shareholders’ equity | 262,158 | 267,146 | Total shareholders’ equity | 268,387 | 265,325 | ||||||||||||||||||||||||||
(1) | Return on average tangible common shareholders’ equity is a non-GAAP financial measure. For more information and a corresponding reconciliation to the most closely related financial measures defined by accounting principles generally accepted in the United States of America (GAAP) 45. |
Bank of America 4 | ||
| Table 2 | Noninterest Income | Noninterest Income | ||||||||||||||||||||||||||||||
| Three Months Ended September 30 | Nine Months Ended September 30 | Three Months Ended September 30 | Nine Months Ended September 30 | |||||||||||||||||||||||||||||
| (Dollars in millions) | (Dollars in millions) | 2018 | 2017 | 2018 | 2017 | (Dollars in millions) | 2019 | 2018 | 2019 | 2018 | ||||||||||||||||||||||
| Fees and commissions: | Fees and commissions: | |||||||||||||||||||||||||||||||
| Card income | Card income | $ | 1,470 | $ | 1,429 | $ | 4,469 | $ | 4,347 | Card income | $ | 1,465 | $ | 1,417 | $ | 4,286 | $ | 4,302 | ||||||||||||||
| Service charges | Service charges | 1,961 | 1,968 | 5,836 | 5,863 | Service charges | 1,975 | 1,961 | 5,717 | 5,836 | ||||||||||||||||||||||
| Investment and brokerage services | Investment and brokerage services | 3,494 | 3,437 | 10,616 | 10,314 | Investment and brokerage services | 3,494 | 3,494 | 10,324 | 10,616 | ||||||||||||||||||||||
| Investment banking income | 1,204 | 1,477 | 3,979 | 4,593 | ||||||||||||||||||||||||||||
| Trading account profits | 1,893 | 1,837 | 6,907 | 6,124 | ||||||||||||||||||||||||||||
| Investment banking fees | Investment banking fees | 1,533 | 1,204 | 4,168 | 3,979 | |||||||||||||||||||||||||||
| Total fees and commissions | Total fees and commissions | 8,467 | 8,076 | 24,495 | 24,733 | |||||||||||||||||||||||||||
| Trading account income | Trading account income | 1,707 | 1,717 | 6,390 | 6,421 | |||||||||||||||||||||||||||
| Other income | Other income | 885 | 530 | 1,576 | 2,470 | Other income | 446 | 870 | 1,259 | 1,531 | ||||||||||||||||||||||
| Total noninterest income | Total noninterest income | $ | 10,907 | $ | 10,678 | $ | 33,383 | $ | 33,711 | Total noninterest income | $ | 10,620 | $ | 10,663 | $ | 32,144 | $ | 32,685 | ||||||||||||||
| ● |
| • | Investment and brokerage services income was unchanged for the three-month period and decreased$292 million for the nine-month period. The decline was primarily due to lower transactional revenue and a decrease in assets under management (AUM) pricing, partially offset by the positive impact of AUM flows. |
| ● | Investment banking |
| ● | Other income decreased$424 million and $272 million for the |
| Table 3 | Noninterest Expense | Noninterest Expense | ||||||||||||||||||||||||||||||
| Three Months Ended September 30 | Nine Months Ended September 30 | Three Months Ended September 30 | Nine Months Ended September 30 | |||||||||||||||||||||||||||||
| (Dollars in millions) | (Dollars in millions) | 2018 | 2017 | 2018 | 2017 | (Dollars in millions) | 2019 | 2018 | 2019 | 2018 | ||||||||||||||||||||||
| Personnel | $ | 7,721 | $ | 7,811 | $ | 24,145 | $ | 24,326 | ||||||||||||||||||||||||
| Occupancy | 1,015 | 999 | 3,051 | 3,000 | ||||||||||||||||||||||||||||
| Equipment | 421 | 416 | 1,278 | 1,281 | ||||||||||||||||||||||||||||
| Compensation and benefits | Compensation and benefits | $ | 7,779 | $ | 7,721 | $ | 24,000 | $ | 24,145 | |||||||||||||||||||||||
| Occupancy and equipment | Occupancy and equipment | 1,663 | 1,589 | 4,908 | 4,787 | |||||||||||||||||||||||||||
| Information processing and communications | Information processing and communications | 1,163 | 1,113 | 3,484 | 3,399 | |||||||||||||||||||||||||||
| Product delivery and transaction related | Product delivery and transaction related | 696 | 687 | 2,067 | 2,149 | |||||||||||||||||||||||||||
| Marketing | Marketing | 421 | 461 | 1,161 | 1,235 | Marketing | 440 | 421 | 1,410 | 1,161 | ||||||||||||||||||||||
| Professional fees | Professional fees | 439 | 476 | 1,219 | 1,417 | Professional fees | 386 | 439 | 1,155 | 1,219 | ||||||||||||||||||||||
| Data processing | 791 | 777 | 2,398 | 2,344 | ||||||||||||||||||||||||||||
| Telecommunications | 173 | 170 | 522 | 538 | ||||||||||||||||||||||||||||
| Other general operating | Other general operating | 2,086 | 2,284 | 6,474 | 7,328 | Other general operating | 3,042 | 1,044 | 4,637 | 3,220 | ||||||||||||||||||||||
| Total noninterest expense | Total noninterest expense | $ | 13,067 | $ | 13,394 | $ | 40,248 | $ | 41,469 | Total noninterest expense | $ | 15,169 | $ | 13,014 | $ | 41,661 | $ | 40,080 | ||||||||||||||
5Bank of America | ||
| Table 4 | Income Tax Expense | Income Tax Expense | ||||||||||||||||||||||||||||||
| Three Months Ended September 30 | Nine Months Ended September 30 | Three Months Ended September 30 | Nine Months Ended September 30 | |||||||||||||||||||||||||||||
| (Dollars in millions) | (Dollars in millions) | 2018 | 2017 | 2018 | 2017 | (Dollars in millions) | 2019 | 2018 | 2019 | 2018 | ||||||||||||||||||||||
| Income before income taxes | Income before income taxes | $ | 8,994 | $ | 7,611 | $ | 25,886 | $ | 23,052 | Income before income taxes | $ | 6,859 | $ | 8,994 | $ | 24,585 | $ | 25,886 | ||||||||||||||
| Income tax expense | Income tax expense | 1,827 | 2,187 | 5,017 | 7,185 | Income tax expense | 1,082 | 1,827 | 4,149 | 5,017 | ||||||||||||||||||||||
| Effective tax rate | Effective tax rate | 20.3 | % | 28.7 | % | 19.4 | % | 31.2 | % | Effective tax rate | 15.8 | % | 20.3 | % | 16.9 | % | 19.4 | % | ||||||||||||||
| ● | Return on average tangible common shareholders’ equity measures our |
| ● | Return on average tangible |
| ● | Tangible book value per common share represents adjusted ending common shareholders’ equity divided by ending common shares outstanding. |
Bank of America6 | ||
| Table 5 | Selected Quarterly Financial Data | Selected Financial Data | ||||||||||||||||||||||||||||||||||||||||||||||
| 2018 Quarters | 2017 Quarters | 2019 Quarters | 2018 Quarters | Nine-Month Period | ||||||||||||||||||||||||||||||||||||||||||||
| (In millions, except per share information) | (In millions, except per share information) | Third | Second | First | Fourth | Third | (In millions, except per share information) | Third | Second | First | Fourth | Third | 2019 | 2018 | ||||||||||||||||||||||||||||||||||
| Income statement | Income statement | Income statement | ||||||||||||||||||||||||||||||||||||||||||||||
| Net interest income | Net interest income | $ | 11,870 | $ | 11,650 | $ | 11,608 | $ | 11,462 | $ | 11,161 | Net interest income | $ | 12,187 | $ | 12,189 | $ | 12,375 | $ | 12,504 | $ | 12,061 | $ | 36,751 | $ | 35,658 | ||||||||||||||||||||||
Noninterest income | Noninterest income | 10,907 | 10,959 | 11,517 | 8,974 | 10,678 | Noninterest income | 10,620 | 10,895 | 10,629 | 10,173 | 10,663 | 32,144 | 32,685 | ||||||||||||||||||||||||||||||||||
| Total revenue, net of interest expense | Total revenue, net of interest expense | 22,777 | 22,609 | 23,125 | 20,436 | 21,839 | Total revenue, net of interest expense | 22,807 | 23,084 | 23,004 | 22,677 | 22,724 | 68,895 | 68,343 | ||||||||||||||||||||||||||||||||||
| Provision for credit losses | Provision for credit losses | 716 | 827 | 834 | 1,001 | 834 | Provision for credit losses | 779 | 857 | 1,013 | 905 | 716 | 2,649 | 2,377 | ||||||||||||||||||||||||||||||||||
| Noninterest expense | Noninterest expense | 13,067 | 13,284 | 13,897 | 13,274 | 13,394 | Noninterest expense | 15,169 | 13,268 | 13,224 | 13,074 | 13,014 | 41,661 | 40,080 | ||||||||||||||||||||||||||||||||||
| Income before income taxes | Income before income taxes | 8,994 | 8,498 | 8,394 | 6,161 | 7,611 | Income before income taxes | 6,859 | 8,959 | 8,767 | 8,698 | 8,994 | 24,585 | 25,886 | ||||||||||||||||||||||||||||||||||
Income tax expense | Income tax expense | 1,827 | 1,714 | 1,476 | 3,796 | 2,187 | Income tax expense | 1,082 | 1,611 | 1,456 | 1,420 | 1,827 | 4,149 | 5,017 | ||||||||||||||||||||||||||||||||||
Net income | Net income | 7,167 | 6,784 | 6,918 | 2,365 | 5,424 | Net income | 5,777 | 7,348 | 7,311 | 7,278 | 7,167 | 20,436 | 20,869 | ||||||||||||||||||||||||||||||||||
| Net income applicable to common shareholders | Net income applicable to common shareholders | 6,701 | 6,466 | 6,490 | 2,079 | 4,959 | Net income applicable to common shareholders | 5,272 | 7,109 | 6,869 | 7,039 | 6,701 | 19,250 | 19,657 | ||||||||||||||||||||||||||||||||||
| Average common shares issued and outstanding | Average common shares issued and outstanding | 10,031.6 | 10,181.7 | 10,322.4 | 10,470.7 | 10,197.9 | Average common shares issued and outstanding | 9,303.6 | 9,523.2 | 9,725.9 | 9,855.8 | 10,031.6 | 9,516.2 | 10,177.5 | ||||||||||||||||||||||||||||||||||
| Average diluted common shares issued and outstanding | Average diluted common shares issued and outstanding | 10,170.8 | 10,309.4 | 10,472.7 | 10,621.8 | 10,746.7 | Average diluted common shares issued and outstanding | 9,353.0 | 9,559.6 | 9,787.3 | 9,996.0 | 10,170.8 | 9,565.7 | 10,317.9 | ||||||||||||||||||||||||||||||||||
| Performance ratios | Performance ratios | Performance ratios | ||||||||||||||||||||||||||||||||||||||||||||||
| Return on average assets | Return on average assets | 1.23 | % | 1.17 | % | 1.21 | % | 0.41 | % | 0.95 | % | Return on average assets | 0.95 | % | 1.23 | % | 1.26 | % | 1.24 | % | 1.23 | % | 1.14 | % | 1.20 | % | ||||||||||||||||||||||
Four quarter trailing return on average assets (2) | 1.00 | 0.93 | 0.86 | 0.80 | 0.91 | |||||||||||||||||||||||||||||||||||||||||||
Four-quarter trailing return on average assets (1) | Four-quarter trailing return on average assets (1) | 1.17 | 1.24 | 1.22 | 1.21 | 1.00 | n/a | n/a | ||||||||||||||||||||||||||||||||||||||||
| Return on average common shareholders’ equity | Return on average common shareholders’ equity | 10.99 | 10.75 | 10.85 | 3.29 | 7.89 | Return on average common shareholders’ equity | 8.48 | 11.62 | 11.42 | 11.57 | 10.99 | 10.49 | 10.86 | ||||||||||||||||||||||||||||||||||
Return on average tangible common shareholders’ equity | Return on average tangible common shareholders’ equity | 15.48 | 15.15 | 15.26 | 4.56 | 10.98 | Return on average tangible common shareholders’ equity | 11.84 | 16.24 | 16.01 | 16.29 | 15.48 | 14.67 | 15.30 | ||||||||||||||||||||||||||||||||||
| Return on average shareholders’ equity | Return on average shareholders’ equity | 10.74 | 10.26 | 10.57 | 3.43 | 7.88 | Return on average shareholders’ equity | 8.48 | 11.00 | 11.14 | 10.95 | 10.74 | 10.19 | 10.52 | ||||||||||||||||||||||||||||||||||
Return on average tangible shareholders’ equity | Return on average tangible shareholders’ equity | 14.61 | 13.95 | 14.37 | 4.62 | 10.59 | Return on average tangible shareholders’ equity | 11.43 | 14.88 | 15.10 | 14.90 | 14.61 | 13.78 | 14.31 | ||||||||||||||||||||||||||||||||||
| Total ending equity to total ending assets | Total ending equity to total ending assets | 11.21 | 11.53 | 11.43 | 11.71 | 11.91 | Total ending equity to total ending assets | 11.06 | 11.33 | 11.23 | 11.27 | 11.21 | 11.06 | 11.21 | ||||||||||||||||||||||||||||||||||
| Total average equity to total average assets | Total average equity to total average assets | 11.42 | 11.42 | 11.41 | 11.87 | 12.03 | Total average equity to total average assets | 11.21 | 11.17 | 11.28 | 11.30 | 11.42 | 11.22 | 11.42 | ||||||||||||||||||||||||||||||||||
| Dividend payout | Dividend payout | 22.35 | 18.83 | 19.06 | 60.35 | 25.59 | Dividend payout | 31.48 | 19.95 | 21.20 | 20.90 | 22.35 | 23.56 | 20.10 | ||||||||||||||||||||||||||||||||||
| Per common share data | Per common share data | Per common share data | ||||||||||||||||||||||||||||||||||||||||||||||
| Earnings | Earnings | $ | 0.67 | $ | 0.64 | $ | 0.63 | $ | 0.20 | $ | 0.49 | Earnings | $ | 0.57 | $ | 0.75 | $ | 0.71 | $ | 0.71 | $ | 0.67 | 2.02 | 1.93 | ||||||||||||||||||||||||
| Diluted earnings | Diluted earnings | 0.66 | 0.63 | 0.62 | 0.20 | 0.46 | Diluted earnings | 0.56 | 0.74 | 0.70 | 0.70 | 0.66 | 2.01 | 1.91 | ||||||||||||||||||||||||||||||||||
| Dividends paid | Dividends paid | 0.15 | 0.12 | 0.12 | 0.12 | 0.12 | Dividends paid | 0.18 | 0.15 | 0.15 | 0.15 | 0.15 | 0.48 | 0.39 | ||||||||||||||||||||||||||||||||||
| Book value | Book value | 24.33 | 24.07 | 23.74 | 23.80 | 23.87 | Book value | 26.96 | 26.41 | 25.57 | 25.13 | 24.33 | 26.96 | 24.33 | ||||||||||||||||||||||||||||||||||
Tangible book value | Tangible book value | 17.23 | 17.07 | 16.84 | 16.96 | 17.18 | Tangible book value | 19.26 | 18.92 | 18.26 | 17.91 | 17.23 | 19.26 | 17.23 | ||||||||||||||||||||||||||||||||||
| Market price per share of common stock | ||||||||||||||||||||||||||||||||||||||||||||||||
| Closing | $ | 29.46 | $ | 28.19 | $ | 29.99 | $ | 29.52 | $ | 25.34 | ||||||||||||||||||||||||||||||||||||||
| High closing | 31.80 | 31.22 | 32.84 | 29.88 | 25.45 | |||||||||||||||||||||||||||||||||||||||||||
| Low closing | 27.78 | 28.19 | 29.17 | 25.45 | 22.89 | |||||||||||||||||||||||||||||||||||||||||||
| Market capitalization | $ | 290,424 | $ | 282,259 | $ | 305,176 | $ | 303,681 | $ | 264,992 | ||||||||||||||||||||||||||||||||||||||
| Market capitalization, at period end | Market capitalization, at period end | $ | 264,842 | $ | 270,935 | $ | 263,992 | $ | 238,251 | $ | 290,424 | $ | 264,842 | $ | 290,424 | |||||||||||||||||||||||||||||||||
| Average balance sheet | Average balance sheet | Average balance sheet | ||||||||||||||||||||||||||||||||||||||||||||||
| Total loans and leases | Total loans and leases | $ | 930,736 | $ | 934,818 | $ | 931,915 | $ | 927,790 | $ | 918,129 | Total loans and leases | $ | 964,733 | $ | 950,525 | $ | 944,020 | $ | 934,721 | $ | 930,736 | ||||||||||||||||||||||||||
| Total assets | Total assets | 2,317,829 | 2,322,678 | 2,325,878 | 2,301,687 | 2,271,104 | Total assets | 2,412,223 | 2,399,051 | 2,360,992 | 2,334,586 | 2,317,829 | ||||||||||||||||||||||||||||||||||||
| Total deposits | Total deposits | 1,316,345 | 1,300,659 | 1,297,268 | 1,293,572 | 1,271,711 | Total deposits | 1,375,052 | 1,375,450 | 1,359,864 | 1,344,951 | 1,316,345 | ||||||||||||||||||||||||||||||||||||
| Long-term debt | Long-term debt | 233,475 | 229,037 | 229,603 | 227,644 | 227,309 | Long-term debt | 202,620 | 201,007 | 196,726 | 201,056 | 203,239 | ||||||||||||||||||||||||||||||||||||
| Common shareholders’ equity | Common shareholders’ equity | 241,812 | 241,313 | 242,713 | 250,838 | 249,214 | Common shareholders’ equity | 246,630 | 245,438 | 243,891 | 241,372 | 241,812 | ||||||||||||||||||||||||||||||||||||
| Total shareholders’ equity | Total shareholders’ equity | 264,653 | 265,181 | 265,480 | 273,162 | 273,238 | Total shareholders’ equity | 270,430 | 267,975 | 266,217 | 263,698 | 264,653 | ||||||||||||||||||||||||||||||||||||
| Asset quality | Asset quality | Asset quality | ||||||||||||||||||||||||||||||||||||||||||||||
Allowance for credit losses (4) | $ | 10,526 | $ | 10,837 | $ | 11,042 | $ | 11,170 | $ | 11,455 | ||||||||||||||||||||||||||||||||||||||
Nonperforming loans, leases and foreclosed properties (5) | 5,449 | 6,181 | 6,694 | 6,758 | 6,869 | |||||||||||||||||||||||||||||||||||||||||||
Allowance for loan and lease losses as a percentage of total loans and leases outstanding (5) | 1.05 | % | 1.08 | % | 1.11 | % | 1.12 | % | 1.16 | % | ||||||||||||||||||||||||||||||||||||||
Allowance for loan and lease losses as a percentage of total nonperforming loans and leases (5) | 189 | 170 | 161 | 161 | 163 | |||||||||||||||||||||||||||||||||||||||||||
Net charge-offs (6) | $ | 932 | $ | 996 | $ | 911 | $ | 1,237 | $ | 900 | ||||||||||||||||||||||||||||||||||||||
Annualized net charge-offs as a percentage of average loans and leases outstanding (5, 6) | 0.40 | % | 0.43 | % | 0.40 | % | 0.53 | % | 0.39 | % | ||||||||||||||||||||||||||||||||||||||
Capital ratios at period end (7) | ||||||||||||||||||||||||||||||||||||||||||||||||
Allowance for credit losses (3) | Allowance for credit losses (3) | $ | 10,242 | $ | 10,333 | $ | 10,379 | $ | 10,398 | $ | 10,526 | |||||||||||||||||||||||||||||||||||||
Nonperforming loans, leases and foreclosed properties (4) | Nonperforming loans, leases and foreclosed properties (4) | 3,723 | 4,452 | 5,145 | 5,244 | 5,449 | ||||||||||||||||||||||||||||||||||||||||||
Allowance for loan and lease losses as a percentage of total loans and leases outstanding (4) | Allowance for loan and lease losses as a percentage of total loans and leases outstanding (4) | 0.98 | % | 1.00 | % | 1.02 | % | 1.02 | % | 1.05 | % | |||||||||||||||||||||||||||||||||||||
Allowance for loan and lease losses as a percentage of total nonperforming loans and leases (4) | Allowance for loan and lease losses as a percentage of total nonperforming loans and leases (4) | 271 | 228 | 197 | 194 | 189 | ||||||||||||||||||||||||||||||||||||||||||
| Net charge-offs | Net charge-offs | $ | 811 | $ | 887 | $ | 991 | $ | 924 | $ | 932 | |||||||||||||||||||||||||||||||||||||
Annualized net charge-offs as a percentage of average loans and leases outstanding (4) | Annualized net charge-offs as a percentage of average loans and leases outstanding (4) | 0.34 | % | 0.38 | % | 0.43 | % | 0.39 | % | 0.40 | % | |||||||||||||||||||||||||||||||||||||
Capital ratios at period end (5) | Capital ratios at period end (5) | |||||||||||||||||||||||||||||||||||||||||||||||
| Common equity tier 1 capital | Common equity tier 1 capital | 11.4 | % | 11.4 | % | 11.3 | % | 11.5 | % | 11.9 | % | Common equity tier 1 capital | 11.4 | % | 11.7 | % | 11.6 | % | 11.6 | % | 11.4 | % | ||||||||||||||||||||||||||
| Tier 1 capital | Tier 1 capital | 12.9 | 13.0 | 13.0 | 13.0 | 13.4 | Tier 1 capital | 12.9 | 13.3 | 13.1 | 13.2 | 12.9 | ||||||||||||||||||||||||||||||||||||
| Total capital | Total capital | 14.7 | 14.8 | 14.8 | 14.8 | 15.1 | Total capital | 15.1 | 15.4 | 15.2 | 15.1 | 14.7 | ||||||||||||||||||||||||||||||||||||
| Tier 1 leverage | Tier 1 leverage | 8.3 | 8.4 | 8.4 | 8.6 | 8.9 | Tier 1 leverage | 8.2 | 8.4 | 8.4 | 8.4 | 8.3 | ||||||||||||||||||||||||||||||||||||
| Supplementary leverage ratio | Supplementary leverage ratio | 6.7 | 6.7 | 6.8 | n/a | n/a | Supplementary leverage ratio | 6.6 | 6.8 | 6.8 | 6.8 | 6.7 | ||||||||||||||||||||||||||||||||||||
Tangible equity (3) | 8.5 | 8.7 | 8.7 | 8.9 | 9.1 | |||||||||||||||||||||||||||||||||||||||||||
Tangible common equity (3) | 7.5 | 7.7 | 7.6 | 7.9 | 8.1 | |||||||||||||||||||||||||||||||||||||||||||
Tangible equity (2) | Tangible equity (2) | 8.4 | 8.7 | 8.5 | 8.6 | 8.5 | ||||||||||||||||||||||||||||||||||||||||||
Tangible common equity (2) | Tangible common equity (2) | 7.4 | 7.6 | 7.6 | 7.6 | 7.5 | ||||||||||||||||||||||||||||||||||||||||||
Total loss-absorbing capacity and long-term debt metrics (6) | Total loss-absorbing capacity and long-term debt metrics (6) | |||||||||||||||||||||||||||||||||||||||||||||||
| Total loss-absorbing capacity to risk-weighted assets | Total loss-absorbing capacity to risk-weighted assets | 24.8 | % | 25.5 | % | 24.8 | % | |||||||||||||||||||||||||||||||||||||||||
| Total loss-absorbing capacity to supplementary leverage exposure | Total loss-absorbing capacity to supplementary leverage exposure | 12.7 | 13.0 | 12.8 | ||||||||||||||||||||||||||||||||||||||||||||
| Eligible long-term debt to risk-weighted assets | Eligible long-term debt to risk-weighted assets | 11.4 | 11.8 | 11.4 | ||||||||||||||||||||||||||||||||||||||||||||
| Eligible long-term debt to supplementary leverage exposure | Eligible long-term debt to supplementary leverage exposure | 5.8 | 6.0 | 5.9 | ||||||||||||||||||||||||||||||||||||||||||||
(1) |
| Calculated as total net income for four consecutive quarters divided by annualized average assets for four consecutive quarters. |
Tangible equity ratios and tangible book value per share of common stock are non-GAAP financial measures. For more information on these ratios, see Supplemental Financial Data on page 6 |
| Includes the allowance for loan and lease losses and the reserve for unfunded lending commitments. |
Balances and ratios do not include loans accounted for under the fair value option. For additional exclusions from nonperforming loans, leases and foreclosed properties, see Consumer Portfolio Credit Risk Management – Nonperforming Consumer Loans, Leases and Foreclosed Properties Activity on page |
(6) | Effective January 1, 2019, the Corporation became subject to minimum total loss-absorbing capacity and long-term debt requirements. For more information, see Capital Management on page 20. |
7Bank of America | ||
| Table 6 | Selected Year-to-Date Financial Data | |||||||
| Nine Months Ended September 30 | ||||||||
| (In millions, except per share information) | 2018 | 2017 | ||||||
| Income statement | ||||||||
| Net interest income | $ | 35,128 | $ | 33,205 | ||||
| Noninterest income | 33,383 | 33,711 | ||||||
| Total revenue, net of interest expense | 68,511 | 66,916 | ||||||
| Provision for credit losses | 2,377 | 2,395 | ||||||
| Noninterest expense | 40,248 | 41,469 | ||||||
| Income before income taxes | 25,886 | 23,052 | ||||||
| Income tax expense | 5,017 | 7,185 | ||||||
| Net income | 20,869 | 15,867 | ||||||
| Net income applicable to common shareholders | 19,657 | 14,539 | ||||||
| Average common shares issued and outstanding | 10,177.5 | 10,103.4 | ||||||
| Average diluted common shares issued and outstanding | 10,317.9 | 10,832.1 | ||||||
| Performance ratios | ||||||||
| Return on average assets | 1.20 | % | 0.94 | % | ||||
| Return on average common shareholders’ equity | 10.86 | 7.91 | ||||||
Return on average tangible common shareholders’ equity (1) | 15.30 | 11.10 | ||||||
| Return on average shareholders’ equity | 10.52 | 7.84 | ||||||
Return on average tangible shareholders’ equity (1) | 14.31 | 10.61 | ||||||
| Total ending equity to total ending assets | 11.21 | 11.91 | ||||||
| Total average equity to total average assets | 11.42 | 11.99 | ||||||
| Dividend payout | 20.10 | 19.08 | ||||||
| Per common share data | ||||||||
| Earnings | $ | 1.93 | $ | 1.44 | ||||
| Diluted earnings | 1.91 | 1.36 | ||||||
| Dividends paid | 0.39 | 0.27 | ||||||
| Book value | 24.33 | 23.87 | ||||||
Tangible book value (1) | 17.23 | 17.18 | ||||||
| Market price per share of common stock | ||||||||
| Closing | $ | 29.46 | $ | 25.34 | ||||
| High closing | 32.84 | 25.50 | ||||||
| Low closing | 27.78 | 22.05 | ||||||
| Market capitalization | $ | 290,424 | $ | 264,992 | ||||
| Table 6 | Quarterly Average Balances and Interest Rates - FTE Basis | |||||||||||||||||||||
| (Dollars in millions) | Average Balance | Interest Income/ Expense (1) | Yield/ Rate | Average Balance | Interest Income/ Expense (1) | Yield/ Rate | ||||||||||||||||
| Third Quarter 2019 | Third Quarter 2018 | |||||||||||||||||||||
| Earning assets | ||||||||||||||||||||||
| Interest-bearing deposits with the Federal Reserve, non-U.S. central banks and other banks | $ | 122,033 | $ | 453 | 1.47 | % | $ | 144,411 | $ | 523 | 1.44 | % | ||||||||||
| Time deposits placed and other short-term investments | 9,863 | 47 | 1.87 | 8,328 | 48 | 2.26 | ||||||||||||||||
| Federal funds sold and securities borrowed or purchased under agreements to resell | 269,129 | 1,242 | 1.83 | 241,426 | 799 | 1.31 | ||||||||||||||||
| Trading account assets | 157,818 | 1,338 | 3.37 | 128,896 | 1,195 | 3.68 | ||||||||||||||||
| Debt securities | 447,126 | 2,856 | 2.56 | 445,813 | 3,014 | 2.66 | ||||||||||||||||
Loans and leases (2): | ||||||||||||||||||||||
| Residential mortgage | 224,084 | 1,937 | 3.46 | 209,460 | 1,857 | 3.54 | ||||||||||||||||
| Home equity | 43,616 | 552 | 5.03 | 53,050 | 656 | 4.91 | ||||||||||||||||
| U.S. credit card | 94,370 | 2,581 | 10.85 | 94,710 | 2,435 | 10.20 | ||||||||||||||||
Direct/Indirect and other consumer (3) | 90,813 | 824 | 3.59 | 91,828 | 787 | 3.40 | ||||||||||||||||
| Total consumer | 452,883 | 5,894 | 5.18 | 449,048 | 5,735 | 5.08 | ||||||||||||||||
| U.S. commercial | 324,436 | 3,279 | 4.01 | 303,680 | 3,034 | 3.97 | ||||||||||||||||
| Non-U.S. commercial | 105,003 | 905 | 3.42 | 96,019 | 831 | 3.43 | ||||||||||||||||
Commercial real estate (4) | 62,185 | 687 | 4.38 | 60,754 | 682 | 4.45 | ||||||||||||||||
| Commercial lease financing | 20,226 | 182 | 3.58 | 21,235 | 173 | 3.25 | ||||||||||||||||
| Total commercial | 511,850 | 5,053 | 3.92 | 481,688 | 4,720 | 3.89 | ||||||||||||||||
| Total loans and leases | 964,733 | 10,947 | 4.51 | 930,736 | 10,455 | 4.46 | ||||||||||||||||
| Other earning assets | 68,018 | 1,181 | 6.90 | 72,827 | 1,082 | 5.91 | ||||||||||||||||
| Total earning assets | 2,038,720 | 18,064 | 3.52 | 1,972,437 | 17,116 | 3.45 | ||||||||||||||||
| Cash and due from banks | 25,588 | 25,639 | ||||||||||||||||||||
| Other assets, less allowance for loan and lease losses | 347,915 | 319,753 | ||||||||||||||||||||
| Total assets | $ | 2,412,223 | $ | 2,317,829 | ||||||||||||||||||
| Interest-bearing liabilities | ||||||||||||||||||||||
| U.S. interest-bearing deposits: | ||||||||||||||||||||||
| Savings | $ | 51,277 | $ | 1 | 0.01 | % | $ | 53,929 | $ | 1 | 0.01 | % | ||||||||||
| NOW and money market deposit accounts | 741,602 | 1,172 | 0.63 | 680,285 | 737 | 0.43 | ||||||||||||||||
| Consumer CDs and IRAs | 49,811 | 136 | 1.08 | 39,160 | 40 | 0.41 | ||||||||||||||||
| Negotiable CDs, public funds and other deposits | 63,936 | 354 | 2.19 | 54,192 | 275 | 2.01 | ||||||||||||||||
| Total U.S. interest-bearing deposits | 906,626 | 1,663 | 0.73 | 827,566 | 1,053 | 0.50 | ||||||||||||||||
| Non-U.S. interest-bearing deposits: | ||||||||||||||||||||||
| Banks located in non-U.S. countries | 1,721 | 5 | 1.13 | 2,353 | 12 | 2.06 | ||||||||||||||||
| Governments and official institutions | 188 | — | 0.02 | 709 | — | 0.01 | ||||||||||||||||
| Time, savings and other | 70,234 | 212 | 1.20 | 63,179 | 165 | 1.04 | ||||||||||||||||
| Total non-U.S. interest-bearing deposits | 72,143 | 217 | 1.19 | 66,241 | 177 | 1.07 | ||||||||||||||||
| Total interest-bearing deposits | 978,769 | 1,880 | 0.76 | 893,807 | 1,230 | 0.55 | ||||||||||||||||
| Federal funds purchased, securities loaned or sold under agreements to repurchase, short-term borrowings and other interest-bearing liabilities | 280,123 | 1,876 | 2.66 | 264,168 | 1,526 | 2.30 | ||||||||||||||||
| Trading account liabilities | 45,750 | 303 | 2.63 | 50,904 | 335 | 2.60 | ||||||||||||||||
| Long-term debt | 202,620 | 1,670 | 3.28 | 203,239 | 1,813 | 3.55 | ||||||||||||||||
| Total interest-bearing liabilities | 1,507,262 | 5,729 | 1.51 | 1,412,118 | 4,904 | 1.38 | ||||||||||||||||
| Noninterest-bearing sources: | ||||||||||||||||||||||
| Noninterest-bearing deposits | 396,283 | 422,538 | ||||||||||||||||||||
Other liabilities (5) | 238,248 | 218,520 | ||||||||||||||||||||
| Shareholders’ equity | 270,430 | 264,653 | ||||||||||||||||||||
| Total liabilities and shareholders’ equity | $ | 2,412,223 | $ | 2,317,829 | ||||||||||||||||||
| Net interest spread | 2.01 | % | 2.07 | % | ||||||||||||||||||
| Impact of noninterest-bearing sources | 0.40 | 0.38 | ||||||||||||||||||||
Net interest income/yield on earning assets (6) | $ | 12,335 | 2.41 | % | $ | 12,212 | 2.45 | % | ||||||||||||||
(1) |
| Table 7 | Quarterly Average Balances and Interest Rates - FTE Basis | |||||||||||||||||||||
Average Balance | Interest Income/ Expense | Yield/ Rate | Average Balance | Interest Income/ Expense | Yield/ Rate | |||||||||||||||||
| (Dollars in millions) | Third Quarter 2018 | Third Quarter 2017 | ||||||||||||||||||||
| Earning assets | ||||||||||||||||||||||
| Interest-bearing deposits with the Federal Reserve, non-U.S. central banks and other banks | $ | 144,411 | $ | 523 | 1.44 | % | $ | 127,835 | $ | 323 | 1.00 | % | ||||||||||
| Time deposits placed and other short-term investments | 8,328 | 48 | 2.26 | 12,503 | 68 | 2.17 | ||||||||||||||||
Federal funds sold and securities borrowed or purchased under agreements to resell (1) | 241,426 | 799 | 1.31 | 223,585 | 487 | 0.86 | ||||||||||||||||
| Trading account assets | 128,896 | 1,195 | 3.68 | 124,068 | 1,125 | 3.60 | ||||||||||||||||
| Debt securities | 445,813 | 3,014 | 2.66 | 436,886 | 2,670 | 2.44 | ||||||||||||||||
Loans and leases (2): | ||||||||||||||||||||||
| Residential mortgage | 209,460 | 1,857 | 3.54 | 199,240 | 1,724 | 3.46 | ||||||||||||||||
| Home equity | 53,050 | 656 | 4.91 | 61,225 | 664 | 4.31 | ||||||||||||||||
| U.S. credit card | 94,710 | 2,435 | 10.20 | 91,602 | 2,253 | 9.76 | ||||||||||||||||
Direct/Indirect and other consumer (3) | 91,828 | 787 | 3.40 | 96,272 | 706 | 2.91 | ||||||||||||||||
| Total consumer | 449,048 | 5,735 | 5.08 | 448,339 | 5,347 | 4.74 | ||||||||||||||||
| U.S. commercial | 303,680 | 3,034 | 3.97 | 293,203 | 2,542 | 3.44 | ||||||||||||||||
| Non-U.S. commercial | 96,019 | 831 | 3.43 | 95,725 | 676 | 2.80 | ||||||||||||||||
Commercial real estate (4) | 60,754 | 682 | 4.45 | 59,044 | 552 | 3.71 | ||||||||||||||||
| Commercial lease financing | 21,235 | 173 | 3.25 | 21,818 | 160 | 2.92 | ||||||||||||||||
| Total commercial | 481,688 | 4,720 | 3.89 | 469,790 | 3,930 | 3.32 | ||||||||||||||||
| Total loans and leases | 930,736 | 10,455 | 4.46 | 918,129 | 9,277 | 4.02 | ||||||||||||||||
Other earning assets (1) | 72,827 | 1,082 | 5.91 | 76,496 | 849 | 4.41 | ||||||||||||||||
Total earning assets (1,5) | 1,972,437 | 17,116 | 3.45 | 1,919,502 | 14,799 | 3.06 | ||||||||||||||||
| Cash and due from banks | 25,639 | 28,990 | ||||||||||||||||||||
| Other assets, less allowance for loan and lease losses | 319,753 | 322,612 | ||||||||||||||||||||
| Total assets | $ | 2,317,829 | $ | 2,271,104 | ||||||||||||||||||
| Interest-bearing liabilities | ||||||||||||||||||||||
| U.S. interest-bearing deposits: | ||||||||||||||||||||||
| Savings | $ | 53,929 | $ | 1 | 0.01 | % | $ | 54,328 | $ | 1 | 0.01 | % | ||||||||||
| NOW and money market deposit accounts | 680,285 | 737 | 0.43 | 631,270 | 333 | 0.21 | ||||||||||||||||
| Consumer CDs and IRAs | 39,160 | 40 | 0.41 | 44,239 | 31 | 0.27 | ||||||||||||||||
| Negotiable CDs, public funds and other deposits | 54,192 | 275 | 2.01 | 38,119 | 101 | 1.05 | ||||||||||||||||
| Total U.S. interest-bearing deposits | 827,566 | 1,053 | 0.50 | 767,956 | 466 | 0.24 | ||||||||||||||||
| Non-U.S. interest-bearing deposits: | ||||||||||||||||||||||
| Banks located in non-U.S. countries | 2,353 | 12 | 2.06 | 2,259 | 5 | 0.97 | ||||||||||||||||
| Governments and official institutions | 709 | — | 0.01 | 1,012 | 3 | 1.04 | ||||||||||||||||
| Time, savings and other | 63,179 | 165 | 1.04 | 63,716 | 150 | 0.93 | ||||||||||||||||
| Total non-U.S. interest-bearing deposits | 66,241 | 177 | 1.07 | 66,987 | 158 | 0.93 | ||||||||||||||||
| Total interest-bearing deposits | 893,807 | 1,230 | 0.55 | 834,943 | 624 | 0.30 | ||||||||||||||||
Federal funds purchased, securities loaned or sold under agreements to repurchase, short-term borrowings and other interest-bearing liabilities (1) | 264,168 | 1,526 | 2.30 | 270,364 | 846 | 1.24 | ||||||||||||||||
| Trading account liabilities | 50,904 | 335 | 2.60 | 48,390 | 319 | 2.62 | ||||||||||||||||
| Long-term debt | 233,475 | 2,004 | 3.42 | 227,309 | 1,609 | 2.82 | ||||||||||||||||
Total interest-bearing liabilities (1,5) | 1,442,354 | 5,095 | 1.40 | 1,381,006 | 3,398 | 0.98 | ||||||||||||||||
| Noninterest-bearing sources: | ||||||||||||||||||||||
| Noninterest-bearing deposits | 422,538 | 436,768 | ||||||||||||||||||||
Other liabilities (1) | 188,284 | 180,092 | ||||||||||||||||||||
| Shareholders’ equity | 264,653 | 273,238 | ||||||||||||||||||||
| Total liabilities and shareholders’ equity | $ | 2,317,829 | $ | 2,271,104 | ||||||||||||||||||
| Net interest spread | 2.05 | % | 2.08 | % | ||||||||||||||||||
| Impact of noninterest-bearing sources | 0.37 | 0.28 | ||||||||||||||||||||
| Net interest income/yield on earning assets | $ | 12,021 | 2.42 | % | $ | 11,401 | 2.36 | % | ||||||||||||||
(2) | Nonperforming loans are included in the respective average loan balances. Income on these nonperforming loans is generally recognized on a cost recovery basis. |
(3) | Includes non-U.S. consumer loans of $2.9 billion and $2.8 billion |
(4) | Includes U.S. commercial real estate loans of $57.6 billion and $56.8 billion |
(5) |
(6) | Net interest income includes FTE adjustments of $148 million and $151 million for the |
Bank of America | ||
| Table 8 | Year-to-Date Average Balances and Interest Rates - FTE Basis | |||||||||||||||||||||||||||||||||||||||||||
| Table 7 | Year-to-Date Average Balances and Interest Rates - FTE Basis | |||||||||||||||||||||||||||||||||||||||||||
| Average Balance | Interest Income/ Expense | Yield/ Rate | Average Balance | Interest Income/ Expense | Yield/ Rate | Average Balance | Interest Income/ Expense (1) | Yield/ Rate | Average Balance | Interest Income/ Expense (1) | Yield/ Rate | |||||||||||||||||||||||||||||||||
| Nine Months Ended September 30 | Nine Months Ended September 30 | |||||||||||||||||||||||||||||||||||||||||||
(Dollars in millions) | (Dollars in millions) | 2018 | 2017 | (Dollars in millions) | 2019 | 2018 | ||||||||||||||||||||||||||||||||||||||
| Earning assets | Earning assets | Earning assets | ||||||||||||||||||||||||||||||||||||||||||
| Interest-bearing deposits with the Federal Reserve, non-U.S. central banks and other banks | Interest-bearing deposits with the Federal Reserve, non-U.S. central banks and other banks | $ | 143,229 | $ | 1,432 | 1.34 | % | $ | 127,000 | $ | 786 | 0.83 | % | Interest-bearing deposits with the Federal Reserve, non-U.S. central banks and other banks | $ | 126,416 | $ | 1,454 | 1.54 | % | $ | 143,229 | $ | 1,432 | 1.34 | % | ||||||||||||||||||
| Time deposits placed and other short-term investments | Time deposits placed and other short-term investments | 9,700 | 157 | 2.16 | 11,820 | 173 | 1.96 | Time deposits placed and other short-term investments | 9,377 | 167 | 2.38 | 9,700 | 157 | 2.16 | ||||||||||||||||||||||||||||||
Federal funds sold and securities borrowed or purchased under agreements to resell | Federal funds sold and securities borrowed or purchased under agreements to resell | 247,183 | 2,130 | 1.15 | 222,255 | 1,278 | 0.77 | Federal funds sold and securities borrowed or purchased under agreements to resell | 274,822 | 3,746 | 1.82 | 247,183 | 2,130 | 1.15 | ||||||||||||||||||||||||||||||
| Trading account assets | Trading account assets | 130,931 | 3,574 | 3.65 | 128,547 | 3,435 | 3.57 | Trading account assets | 148,368 | 4,016 | 3.62 | 130,931 | 3,574 | 3.65 | ||||||||||||||||||||||||||||||
| Debt securities | Debt securities | 436,080 | 8,729 | 2.62 | 432,775 | 7,875 | 2.42 | Debt securities | 445,104 | 9,051 | 2.71 | 436,080 | 8,729 | 2.62 | ||||||||||||||||||||||||||||||
Loans and leases (2): | Loans and leases (2): | Loans and leases (2): | ||||||||||||||||||||||||||||||||||||||||||
| Residential mortgage | Residential mortgage | 206,808 | 5,437 | 3.51 | 196,288 | 5,082 | 3.45 | Residential mortgage | 216,744 | 5,698 | 3.51 | 206,808 | 5,437 | 3.51 | ||||||||||||||||||||||||||||||
| Home equity | Home equity | 54,941 | 1,939 | 4.72 | 63,339 | 1,967 | 4.15 | Home equity | 45,735 | 1,732 | 5.06 | 54,941 | 1,939 | 4.72 | ||||||||||||||||||||||||||||||
| U.S. credit card | U.S. credit card | 94,222 | 7,046 | 10.00 | 90,238 | 6,492 | 9.62 | U.S. credit card | 94,333 | 7,622 | 10.80 | 94,222 | 7,046 | 10.00 | ||||||||||||||||||||||||||||||
Non-U.S. credit card (3) | — | — | — | 5,253 | 358 | 9.12 | ||||||||||||||||||||||||||||||||||||||
Direct/Indirect and other consumer (4) | 93,568 | 2,281 | 3.26 | 95,964 | 2,010 | 2.80 | ||||||||||||||||||||||||||||||||||||||
Direct/Indirect and other consumer (3) | Direct/Indirect and other consumer (3) | 90,567 | 2,475 | 3.65 | 93,568 | 2,281 | 3.26 | |||||||||||||||||||||||||||||||||||||
| Total consumer | Total consumer | 449,539 | 16,703 | 4.96 | 451,082 | 15,909 | 4.71 | Total consumer | 447,379 | 17,527 | 5.23 | 449,539 | 16,703 | 4.96 | ||||||||||||||||||||||||||||||
| U.S. commercial | U.S. commercial | 302,981 | 8,734 | 3.85 | 290,632 | 7,167 | 3.30 | U.S. commercial | 319,621 | 10,010 | 4.19 | 302,981 | 8,734 | 3.85 | ||||||||||||||||||||||||||||||
| Non-U.S. commercial | Non-U.S. commercial | 98,246 | 2,385 | 3.25 | 93,762 | 1,886 | 2.69 | Non-U.S. commercial | 103,625 | 2,685 | 3.46 | 98,246 | 2,385 | 3.25 | ||||||||||||||||||||||||||||||
Commercial real estate (5) | 60,218 | 1,915 | 4.25 | 58,340 | 1,545 | 3.54 | ||||||||||||||||||||||||||||||||||||||
Commercial real estate (4) | Commercial real estate (4) | 61,612 | 2,109 | 4.58 | 60,218 | 1,915 | 4.25 | |||||||||||||||||||||||||||||||||||||
| Commercial lease financing | Commercial lease financing | 21,501 | 516 | 3.20 | 21,862 | 547 | 3.33 | Commercial lease financing | 20,932 | 550 | 3.50 | 21,501 | 516 | 3.20 | ||||||||||||||||||||||||||||||
| Total commercial | Total commercial | 482,946 | 13,550 | 3.75 | 464,596 | 11,145 | 3.21 | Total commercial | 505,790 | 15,354 | 4.06 | 482,946 | 13,550 | 3.75 | ||||||||||||||||||||||||||||||
Total loans and leases (3) | 932,485 | 30,253 | 4.34 | 915,678 | 27,054 | 3.95 | ||||||||||||||||||||||||||||||||||||||
Other earning assets (1) | 78,431 | 3,113 | 5.31 | 74,554 | 2,322 | 4.16 | ||||||||||||||||||||||||||||||||||||||
Total earning assets (1,6) | 1,978,039 | 49,388 | 3.34 | 1,912,629 | 42,923 | 3.00 | ||||||||||||||||||||||||||||||||||||||
| Total loans and leases | Total loans and leases | 953,169 | 32,881 | 4.61 | 932,485 | 30,253 | 4.34 | |||||||||||||||||||||||||||||||||||||
| Other earning assets | Other earning assets | 67,431 | 3,445 | 6.83 | 78,431 | 3,113 | 5.31 | |||||||||||||||||||||||||||||||||||||
| Total earning assets | Total earning assets | 2,024,687 | 54,760 | 3.61 | 1,978,039 | 49,388 | 3.34 | |||||||||||||||||||||||||||||||||||||
| Cash and due from banks | Cash and due from banks | 25,746 | 27,955 | Cash and due from banks | 25,787 | 25,746 | ||||||||||||||||||||||||||||||||||||||
| Other assets, less allowance for loan and lease losses | Other assets, less allowance for loan and lease losses | 318,314 | 316,909 | Other assets, less allowance for loan and lease losses | 340,469 | 318,314 | ||||||||||||||||||||||||||||||||||||||
| Total assets | Total assets | $ | 2,322,099 | $ | 2,257,493 | Total assets | $ | 2,390,943 | $ | 2,322,099 | ||||||||||||||||||||||||||||||||||
| Interest-bearing liabilities | Interest-bearing liabilities | Interest-bearing liabilities | ||||||||||||||||||||||||||||||||||||||||||
| U.S. interest-bearing deposits: | U.S. interest-bearing deposits: | U.S. interest-bearing deposits: | ||||||||||||||||||||||||||||||||||||||||||
| Savings | Savings | $ | 54,800 | $ | 4 | 0.01 | % | $ | 53,679 | $ | 4 | 0.01 | % | Savings | $ | 52,604 | $ | 4 | 0.01 | % | $ | 54,800 | $ | 4 | 0.01 | % | ||||||||||||||||||
| NOW and money market deposit accounts | NOW and money market deposit accounts | 667,851 | 1,679 | 0.34 | 622,920 | 512 | 0.11 | NOW and money market deposit accounts | 736,613 | 3,557 | 0.65 | 667,851 | 1,679 | 0.34 | ||||||||||||||||||||||||||||||
| Consumer CDs and IRAs | Consumer CDs and IRAs | 40,134 | 109 | 0.36 | 45,535 | 92 | 0.27 | Consumer CDs and IRAs | 45,688 | 315 | 0.92 | 40,134 | 109 | 0.36 | ||||||||||||||||||||||||||||||
| Negotiable CDs, public funds and other deposits | Negotiable CDs, public funds and other deposits | 46,507 | 629 | 1.81 | 35,968 | 221 | 0.82 | Negotiable CDs, public funds and other deposits | 66,618 | 1,129 | 2.27 | 46,507 | 629 | 1.81 | ||||||||||||||||||||||||||||||
| Total U.S. interest-bearing deposits | Total U.S. interest-bearing deposits | 809,292 | 2,421 | 0.40 | 758,102 | 829 | 0.15 | Total U.S. interest-bearing deposits | 901,523 | 5,005 | 0.74 | 809,292 | 2,421 | 0.40 | ||||||||||||||||||||||||||||||
| Non-U.S. interest-bearing deposits: | Non-U.S. interest-bearing deposits: | Non-U.S. interest-bearing deposits: | ||||||||||||||||||||||||||||||||||||||||||
| Banks located in non-U.S. countries | Banks located in non-U.S. countries | 2,309 | 32 | 1.88 | 2,643 | 16 | 0.82 | Banks located in non-U.S. countries | 2,044 | 16 | 1.03 | 2,309 | 32 | 1.88 | ||||||||||||||||||||||||||||||
| Governments and official institutions | Governments and official institutions | 990 | — | 0.01 | 1,002 | 7 | 0.92 | Governments and official institutions | 182 | — | 0.06 | 990 | — | 0.01 | ||||||||||||||||||||||||||||||
| Time, savings and other | Time, savings and other | 65,264 | 480 | 0.98 | 60,747 | 400 | 0.88 | Time, savings and other | 67,740 | 619 | 1.22 | 65,264 | 480 | 0.98 | ||||||||||||||||||||||||||||||
| Total non-U.S. interest-bearing deposits | Total non-U.S. interest-bearing deposits | 68,563 | 512 | 1.00 | 64,392 | 423 | 0.88 | Total non-U.S. interest-bearing deposits | 69,966 | 635 | 1.21 | 68,563 | 512 | 1.00 | ||||||||||||||||||||||||||||||
| Total interest-bearing deposits | Total interest-bearing deposits | 877,855 | 2,933 | 0.45 | 822,494 | 1,252 | 0.20 | Total interest-bearing deposits | 971,489 | 5,640 | 0.78 | 877,855 | 2,933 | 0.45 | ||||||||||||||||||||||||||||||
Federal funds purchased, securities loaned or sold under agreements to repurchase, short-term borrowings and other interest-bearing liabilities (1) | 272,192 | 4,123 | 2.03 | 275,731 | 2,244 | 1.09 | ||||||||||||||||||||||||||||||||||||||
| Federal funds purchased, securities loaned or sold under agreements to repurchase, short-term borrowings and other interest-bearing liabilities | Federal funds purchased, securities loaned or sold under agreements to repurchase, short-term borrowings and other interest-bearing liabilities | 274,550 | 5,725 | 2.79 | 272,192 | 4,123 | 2.03 | |||||||||||||||||||||||||||||||||||||
| Trading account liabilities | Trading account liabilities | 52,815 | 1,040 | 2.63 | 44,128 | 890 | 2.70 | Trading account liabilities | 46,122 | 967 | 2.80 | 52,815 | 1,040 | 2.63 | ||||||||||||||||||||||||||||||
| Long-term debt | Long-term debt | 230,719 | 5,709 | 3.30 | 224,287 | 4,658 | 2.77 | Long-term debt | 200,139 | 5,227 | 3.49 | 200,178 | 5,179 | 3.45 | ||||||||||||||||||||||||||||||
Total interest-bearing liabilities (1,6) | 1,433,581 | 13,805 | 1.29 | 1,366,640 | 9,044 | 0.88 | ||||||||||||||||||||||||||||||||||||||
| Total interest-bearing liabilities | Total interest-bearing liabilities | 1,492,300 | 17,559 | 1.57 | 1,403,040 | 13,275 | 1.26 | |||||||||||||||||||||||||||||||||||||
| Noninterest-bearing sources: | Noninterest-bearing sources: | Noninterest-bearing sources: | ||||||||||||||||||||||||||||||||||||||||||
| Noninterest-bearing deposits | Noninterest-bearing deposits | 426,972 | 439,288 | Noninterest-bearing deposits | 398,689 | 426,972 | ||||||||||||||||||||||||||||||||||||||
Other liabilities (1) | 196,444 | 180,907 | ||||||||||||||||||||||||||||||||||||||||||
Other liabilities (5) | Other liabilities (5) | 231,731 | 226,985 | |||||||||||||||||||||||||||||||||||||||||
| Shareholders’ equity | Shareholders’ equity | 265,102 | 270,658 | Shareholders’ equity | 268,223 | 265,102 | ||||||||||||||||||||||||||||||||||||||
| Total liabilities and shareholders’ equity | Total liabilities and shareholders’ equity | $ | 2,322,099 | $ | 2,257,493 | Total liabilities and shareholders’ equity | $ | 2,390,943 | $ | 2,322,099 | ||||||||||||||||||||||||||||||||||
| Net interest spread | Net interest spread | 2.05 | % | 2.12 | % | Net interest spread | 2.04 | % | 2.08 | % | ||||||||||||||||||||||||||||||||||
| Impact of noninterest-bearing sources | Impact of noninterest-bearing sources | 0.34 | 0.24 | Impact of noninterest-bearing sources | 0.41 | 0.35 | ||||||||||||||||||||||||||||||||||||||
| Net interest income/yield on earning assets | $ | 35,583 | 2.39 | % | $ | 33,879 | 2.36 | % | ||||||||||||||||||||||||||||||||||||
Net interest income/yield on earning assets (6) | Net interest income/yield on earning assets (6) | $ | 37,201 | 2.45 | % | $ | 36,113 | 2.43 | % | |||||||||||||||||||||||||||||||||||
(1) | Includes the impact of interest rate risk management contracts. For additional information, see Interest Rate Risk Management for the Banking Book on page 43. |
(2) | Nonperforming loans are included in the respective average loan balances. Income on these nonperforming loans is generally recognized on a cost recovery basis. |
(3) |
(4) |
Includes U.S. commercial real estate loans of $57.0 billion and $56.2 billion |
(6) | Net interest income includes |
9Bank of America | ||
| Deposits | Consumer Lending | Total Consumer Banking | Deposits | Consumer Lending | Total Consumer Banking | |||||||||||||||||||||||||||||||||||||||||||
| Three Months Ended September 30 | Three Months Ended September 30 | |||||||||||||||||||||||||||||||||||||||||||||||
| (Dollars in millions) | (Dollars in millions) | 2018 | 2017 | 2018 | 2017 | 2018 | 2017 | % Change | (Dollars in millions) | 2019 | 2018 | 2019 | 2018 | 2019 | 2018 | % Change | ||||||||||||||||||||||||||||||||
| Net interest income (FTE basis) | $ | 4,068 | $ | 3,440 | $ | 2,795 | $ | 2,772 | $ | 6,863 | $ | 6,212 | 10 | % | ||||||||||||||||||||||||||||||||||
| Net interest income | Net interest income | $ | 4,197 | $ | 4,052 | $ | 2,834 | $ | 2,792 | $ | 7,031 | $ | 6,844 | 3 | % | |||||||||||||||||||||||||||||||||
| Noninterest income: | Noninterest income: | Noninterest income: | ||||||||||||||||||||||||||||||||||||||||||||||
| Card income | Card income | 2 | 1 | 1,279 | 1,242 | 1,281 | 1,243 | 3 | Card income | (11 | ) | (10 | ) | 1,300 | 1,247 | 1,289 | 1,237 | 4 | ||||||||||||||||||||||||||||||
| Service charges | Service charges | 1,097 | 1,082 | 1 | — | 1,098 | 1,082 | 1 | Service charges | 1,096 | 1,098 | 1 | — | 1,097 | 1,098 | — | ||||||||||||||||||||||||||||||||
| All other income | All other income | 100 | 97 | 61 | 140 | 161 | 237 | (32 | ) | All other income | 233 | 189 | 74 | 74 | 307 | 263 | 17 | |||||||||||||||||||||||||||||||
| Total noninterest income | Total noninterest income | 1,199 | 1,180 | 1,341 | 1,382 | 2,540 | 2,562 | (1 | ) | Total noninterest income | 1,318 | 1,277 | 1,375 | 1,321 | 2,693 | 2,598 | 4 | |||||||||||||||||||||||||||||||
| Total revenue, net of interest expense (FTE basis) | 5,267 | 4,620 | 4,136 | 4,154 | 9,403 | 8,774 | 7 | |||||||||||||||||||||||||||||||||||||||||
| Total revenue, net of interest expense | Total revenue, net of interest expense | 5,515 | 5,329 | 4,209 | 4,113 | 9,724 | 9,442 | 3 | ||||||||||||||||||||||||||||||||||||||||
| Provision for credit losses | Provision for credit losses | 48 | 47 | 822 | 920 | 870 | 967 | (10 | ) | Provision for credit losses | 84 | 48 | 833 | 822 | 917 | 870 | 5 | |||||||||||||||||||||||||||||||
| Noninterest expense | Noninterest expense | 2,618 | 2,617 | 1,737 | 1,844 | 4,355 | 4,461 | (2 | ) | Noninterest expense | 2,651 | 2,620 | 1,742 | 1,705 | 4,393 | 4,325 | 2 | |||||||||||||||||||||||||||||||
| Income before income taxes (FTE basis) | 2,601 | 1,956 | 1,577 | 1,390 | 4,178 | 3,346 | 25 | |||||||||||||||||||||||||||||||||||||||||
| Income tax expense (FTE basis) | 663 | 737 | 402 | 523 | 1,065 | 1,260 | (15 | ) | ||||||||||||||||||||||||||||||||||||||||
| Income before income taxes | Income before income taxes | 2,780 | 2,661 | 1,634 | 1,586 | 4,414 | 4,247 | 4 | ||||||||||||||||||||||||||||||||||||||||
| Income tax expense | Income tax expense | 681 | 678 | 400 | 404 | 1,081 | 1,082 | — | ||||||||||||||||||||||||||||||||||||||||
| Net income | Net income | $ | 1,938 | $ | 1,219 | $ | 1,175 | $ | 867 | $ | 3,113 | $ | 2,086 | 49 | Net income | $ | 2,099 | $ | 1,983 | $ | 1,234 | $ | 1,182 | $ | 3,333 | $ | 3,165 | 5 | ||||||||||||||||||||
Effective tax rate (FTE basis) (1) | 25.5 | % | 37.7 | % | ||||||||||||||||||||||||||||||||||||||||||||
Effective tax rate (1) | Effective tax rate (1) | 24.5 | % | 25.5 | % | |||||||||||||||||||||||||||||||||||||||||||
| Net interest yield (FTE basis) | 2.35 | % | 2.08 | % | 3.95 | % | 4.16 | % | 3.78 | 3.56 | ||||||||||||||||||||||||||||||||||||||
| Net interest yield | Net interest yield | 2.37 | % | 2.34 | % | 3.76 | % | 3.95 | % | 3.77 | 3.77 | |||||||||||||||||||||||||||||||||||||
| Return on average allocated capital | Return on average allocated capital | 64 | 40 | 19 | 14 | 33 | 22 | Return on average allocated capital | 69 | 66 | 20 | 19 | 36 | 34 | ||||||||||||||||||||||||||||||||||
| Efficiency ratio (FTE basis) | 49.70 | 56.65 | 41.97 | 44.40 | 46.30 | 50.85 | ||||||||||||||||||||||||||||||||||||||||||
| Efficiency ratio | Efficiency ratio | 48.08 | 49.17 | 41.38 | 41.45 | 45.18 | 45.81 | |||||||||||||||||||||||||||||||||||||||||
| Balance Sheet | ||||||||||||||||||||||||||||||||||||||||||||||||
| Three Months Ended September 30 | Three Months Ended September 30 | |||||||||||||||||||||||||||||||||||||||||||||||
| Average | 2018 | 2017 | 2018 | 2017 | 2018 | 2017 | % Change | 2019 | 2018 | 2019 | 2018 | 2019 | 2018 | % Change | ||||||||||||||||||||||||||||||||||
| Total loans and leases | Total loans and leases | $ | 5,269 | $ | 5,079 | $ | 279,725 | $ | 263,731 | $ | 284,994 | $ | 268,810 | 6 | % | Total loans and leases | $ | 5,405 | $ | 5,269 | $ | 298,428 | $ | 279,725 | $ | 303,833 | $ | 284,994 | 7 | % | ||||||||||||||||||
Total earning assets (2) | Total earning assets (2) | 685,662 | 657,036 | 280,637 | 264,665 | 720,652 | 692,122 | 4 | Total earning assets (2) | 703,889 | 685,653 | 299,041 | 280,637 | 739,765 | 720,643 | 3 | ||||||||||||||||||||||||||||||||
Total assets (2) | Total assets (2) | 713,942 | 684,642 | 291,370 | 276,014 | 759,665 | 731,077 | 4 | Total assets (2) | 735,844 | 713,942 | 308,991 | 291,370 | 781,670 | 759,665 | 3 | ||||||||||||||||||||||||||||||||
| Total deposits | Total deposits | 681,726 | 652,286 | 5,804 | 6,688 | 687,530 | 658,974 | 4 | Total deposits | 703,562 | 681,726 | 5,711 | 5,804 | 709,273 | 687,530 | 3 | ||||||||||||||||||||||||||||||||
| Allocated capital | Allocated capital | 12,000 | 12,000 | 25,000 | 25,000 | 37,000 | 37,000 | — | Allocated capital | 12,000 | 12,000 | 25,000 | 25,000 | 37,000 | 37,000 | — | ||||||||||||||||||||||||||||||||
(1) | Estimated at the segment level only. |
(2) | In segments and businesses where the total of liabilities and equity exceeds assets, we allocate assets from All Other to match the segments’ and businesses’ liabilities and allocated shareholders’ equity. As a result, total earning assets and total assets of the businesses may not equal total Consumer Banking. |
| Deposits | Consumer Lending | Total Consumer Banking | Deposits | Consumer Lending | Total Consumer Banking | |||||||||||||||||||||||||||||||||||||||||||
| Nine Months Ended September 30 | Nine Months Ended September 30 | |||||||||||||||||||||||||||||||||||||||||||||||
| (Dollars in millions) | (Dollars in millions) | 2018 | 2017 | 2018 | 2017 | 2018 | 2017 | % Change | (Dollars in millions) | 2019 | 2018 | 2019 | 2018 | 2019 | 2018 | % Change | ||||||||||||||||||||||||||||||||
| Net interest income (FTE basis) | $ | 11,728 | $ | 9,804 | $ | 8,265 | $ | 8,149 | $ | 19,993 | $ | 17,953 | 11 | % | ||||||||||||||||||||||||||||||||||
| Net interest income | Net interest income | $ | 12,867 | $ | 11,658 | $ | 8,386 | $ | 8,256 | $ | 21,253 | $ | 19,914 | 7 | % | |||||||||||||||||||||||||||||||||
| Noninterest income: | Noninterest income: | Noninterest income: | ||||||||||||||||||||||||||||||||||||||||||||||
| Card income | Card income | 6 | 6 | 3,896 | 3,710 | 3,902 | 3,716 | 5 | Card income | (24 | ) | (25 | ) | 3,778 | 3,788 | 3,754 | 3,763 | — | ||||||||||||||||||||||||||||||
| Service charges | Service charges | 3,213 | 3,193 | 1 | 1 | 3,214 | 3,194 | 1 | Service charges | 3,162 | 3,213 | 1 | 1 | 3,163 | 3,214 | (2 | ) | |||||||||||||||||||||||||||||||
| All other income | All other income | 310 | 294 | 227 | 410 | 537 | 704 | (24 | ) | All other income | 673 | 510 | 230 | 255 | 903 | 765 | 18 | |||||||||||||||||||||||||||||||
| Total noninterest income | Total noninterest income | 3,529 | 3,493 | 4,124 | 4,121 | 7,653 | 7,614 | 1 | Total noninterest income | 3,811 | 3,698 | 4,009 | 4,044 | 7,820 | 7,742 | 1 | ||||||||||||||||||||||||||||||||
| Total revenue, net of interest expense (FTE basis) | 15,257 | 13,297 | 12,389 | 12,270 | 27,646 | 25,567 | 8 | |||||||||||||||||||||||||||||||||||||||||
| Total revenue, net of interest expense | Total revenue, net of interest expense | 16,678 | 15,356 | 12,395 | 12,300 | 29,073 | 27,656 | 5 | ||||||||||||||||||||||||||||||||||||||||
| Provision for credit losses | Provision for credit losses | 135 | 148 | 2,614 | 2,491 | 2,749 | 2,639 | 4 | Provision for credit losses | 173 | 135 | 2,665 | 2,614 | 2,838 | 2,749 | 3 | ||||||||||||||||||||||||||||||||
| Noninterest expense | Noninterest expense | 7,907 | 7,708 | 5,324 | 5,578 | 13,231 | 13,286 | — | Noninterest expense | 7,956 | 7,986 | 5,201 | 5,255 | 13,157 | 13,241 | (1 | ) | |||||||||||||||||||||||||||||||
| Income before income taxes (FTE basis) | 7,215 | 5,441 | 4,451 | 4,201 | 11,666 | 9,642 | 21 | |||||||||||||||||||||||||||||||||||||||||
| Income tax expense (FTE basis) | 1,840 | 2,052 | 1,135 | 1,584 | 2,975 | 3,636 | (18 | ) | ||||||||||||||||||||||||||||||||||||||||
| Income before income taxes | Income before income taxes | 8,549 | 7,235 | 4,529 | 4,431 | 13,078 | 11,666 | 12 | ||||||||||||||||||||||||||||||||||||||||
| Income tax expense | Income tax expense | 2,094 | 1,845 | 1,110 | 1,130 | 3,204 | 2,975 | 8 | ||||||||||||||||||||||||||||||||||||||||
| Net income | Net income | $ | 5,375 | $ | 3,389 | $ | 3,316 | $ | 2,617 | $ | 8,691 | $ | 6,006 | 45 | Net income | $ | 6,455 | $ | 5,390 | $ | 3,419 | $ | 3,301 | $ | 9,874 | $ | 8,691 | 14 | ||||||||||||||||||||
Effective tax rate (FTE basis) (1) | 25.5 | % | 37.7 | % | ||||||||||||||||||||||||||||||||||||||||||||
Effective tax rate (1) | Effective tax rate (1) | 24.5 | % | 25.5 | % | |||||||||||||||||||||||||||||||||||||||||||
| Net interest yield (FTE basis) | 2.30 | % | 2.02 | % | 3.99 | % | 4.21 | % | 3.73 | 3.52 | ||||||||||||||||||||||||||||||||||||||
| Net interest yield | Net interest yield | 2.46 | % | 2.29 | % | 3.83 | % | 3.98 | % | 3.87 | 3.72 | |||||||||||||||||||||||||||||||||||||
| Return on average allocated capital | Return on average allocated capital | 60 | 38 | 18 | 14 | 31 | 22 | Return on average allocated capital | 72 | 60 | 18 | 18 | 36 | 31 | ||||||||||||||||||||||||||||||||||
| Efficiency ratio (FTE basis) | 51.83 | 57.97 | 42.97 | 45.46 | 47.86 | 51.96 | ||||||||||||||||||||||||||||||||||||||||||
| Efficiency ratio | Efficiency ratio | 47.70 | 52.01 | 41.97 | 42.72 | 45.26 | 47.88 | |||||||||||||||||||||||||||||||||||||||||
| Balance Sheet | ||||||||||||||||||||||||||||||||||||||||||||||||
| Nine Months Ended September 30 | Nine Months Ended September 30 | |||||||||||||||||||||||||||||||||||||||||||||||
| Average | 2018 | 2017 | 2018 | 2017 | 2018 | 2017 | % Change | 2019 | 2018 | 2019 | 2018 | 2019 | 2018 | % Change | ||||||||||||||||||||||||||||||||||
| Total loans and leases | Total loans and leases | $ | 5,211 | $ | 5,025 | $ | 276,556 | $ | 257,779 | $ | 281,767 | $ | 262,804 | 7 | % | Total loans and leases | $ | 5,351 | $ | 5,211 | $ | 292,188 | $ | 276,556 | $ | 297,539 | $ | 281,767 | 6 | % | ||||||||||||||||||
Total earning assets (2) | Total earning assets (2) | 681,922 | 647,887 | 277,295 | 258,659 | 716,475 | 682,436 | 5 | Total earning assets (2) | 699,907 | 681,914 | 292,641 | 277,295 | 734,976 | 716,467 | 3 | ||||||||||||||||||||||||||||||||
Total assets (2) | Total assets (2) | 709,997 | 675,159 | 288,224 | 270,196 | 755,479 | 721,245 | 5 | Total assets (2) | 731,528 | 709,997 | 302,862 | 288,224 | 776,818 | 755,479 | 3 | ||||||||||||||||||||||||||||||||
| Total deposits | Total deposits | 677,684 | 642,783 | 5,595 | 6,421 | 683,279 | 649,204 | 5 | Total deposits | 699,217 | 677,684 | 5,242 | 5,595 | 704,459 | 683,279 | 3 | ||||||||||||||||||||||||||||||||
| Allocated capital | Allocated capital | 12,000 | 12,000 | 25,000 | 25,000 | 37,000 | 37,000 | — | Allocated capital | 12,000 | 12,000 | 25,000 | 25,000 | 37,000 | 37,000 | — | ||||||||||||||||||||||||||||||||
| Period end | September 30 2018 | December 31 2017 | September 30 2018 | December 31 2017 | September 30 2018 | December 31 2017 | % Change | September 30 2019 | December 31 2018 | September 30 2019 | December 31 2018 | September 30 2019 | December 31 2018 | % Change | ||||||||||||||||||||||||||||||||||
| Total loans and leases | Total loans and leases | $ | 5,276 | $ | 5,143 | $ | 282,001 | $ | 275,330 | $ | 287,277 | $ | 280,473 | 2 | % | Total loans and leases | $ | 5,447 | $ | 5,470 | $ | 302,478 | $ | 288,865 | $ | 307,925 | $ | 294,335 | 5 | % | ||||||||||||||||||
Total earning assets (2) | Total earning assets (2) | 690,968 | 675,485 | 282,921 | 275,742 | 726,494 | 709,832 | 2 | Total earning assets (2) | 711,024 | 694,672 | 303,195 | 289,249 | 747,251 | 728,813 | 3 | ||||||||||||||||||||||||||||||||
Total assets (2) | Total assets (2) | 719,126 | 703,330 | 293,766 | 287,390 | 765,497 | 749,325 | 2 | Total assets (2) | 742,583 | 724,019 | 313,128 | 299,970 | 788,743 | 768,881 | 3 | ||||||||||||||||||||||||||||||||
| Total deposits | Total deposits | 686,723 | 670,802 | 6,047 | 5,728 | 692,770 | 676,530 | 2 | Total deposits | 710,149 | 691,666 | 5,566 | 4,480 | 715,715 | 696,146 | 3 | ||||||||||||||||||||||||||||||||
11Bank of America | ||
| Key Statistics – Deposits | ||||||||||||||||||||||||||
| Three Months Ended September 30 | Nine Months Ended September 30 | Three Months Ended September 30 | Nine Months Ended September 30 | |||||||||||||||||||||||
| 2018 | 2017 | 2018 | 2017 | 2019 | 2018 | 2019 | 2018 | |||||||||||||||||||
Total deposit spreads (excludes noninterest costs) (1) | 2.19 | % | 1.88 | % | 2.10 | % | 1.82 | % | 2.35 | % | 2.19 | % | 2.38 | % | 2.10 | % | ||||||||||
| Period end | ||||||||||||||||||||||||||
| Client brokerage assets (in millions) | $ | 203,882 | $ | 167,274 | ||||||||||||||||||||||
Consumer investment assets (in millions) (2) | $ | 223,199 | $ | 203,882 | ||||||||||||||||||||||
Active digital banking users (units in thousands) | 36,174 | 34,472 | 37,981 | 36,174 | ||||||||||||||||||||||
| Active mobile banking users (units in thousands) | 25,990 | 23,572 | 28,703 | 25,990 | ||||||||||||||||||||||
| Financial centers | 4,385 | 4,515 | 4,302 | 4,385 | ||||||||||||||||||||||
| ATMs | 16,089 | 15,973 | 16,626 | 16,089 | ||||||||||||||||||||||
(1) | Includes deposits held in Consumer Lending. |
(2) | Includes client brokerage assets, certain deposit sweep balances and AUM in Consumer Banking. |
(3) | Active digital banking users represents mobile and/or online |
| Key Statistics – Consumer Lending | ||||||||||||||||||||||||||||||
| Three Months Ended September 30 | Nine Months Ended September 30 | Three Months Ended September 30 | Nine Months Ended September 30 | |||||||||||||||||||||||||||
| (Dollars in millions) | 2018 | 2017 | 2018 | 2017 | 2019 | 2018 | 2019 | 2018 | ||||||||||||||||||||||
Total U.S. credit card (1) | ||||||||||||||||||||||||||||||
| Gross interest yield | 10.20 | % | 9.76 | % | 10.00 | % | 9.62 | % | 10.85 | % | 10.20 | % | 10.80 | % | 10.00 | % | ||||||||||||||
| Risk-adjusted margin | 8.15 | 8.63 | 8.18 | 8.64 | 8.46 | 8.08 | 8.14 | 8.09 | ||||||||||||||||||||||
| New accounts (in thousands) | 1,116 | 1,315 | 3,496 | 3,801 | 1,172 | 1,116 | 3,274 | 3,496 | ||||||||||||||||||||||
| Purchase volumes | $ | 66,490 | $ | 62,244 | $ | 194,658 | $ | 179,230 | $ | 71,096 | $ | 66,490 | $ | 204,135 | $ | 194,658 | ||||||||||||||
| Debit card purchase volumes | $ | 79,920 | $ | 74,769 | $ | 236,669 | $ | 220,729 | $ | 90,942 | $ | 85,529 | $ | 267,204 | $ | 250,715 | ||||||||||||||
(1) | In addition to the U.S. credit card portfolio in Consumer Banking, the remaining U.S. credit card portfolio is in GWIM. |
Bank of America 12 | ||
Key Statistics – Loan Production (1) | Key Statistics – Loan Production (1) | Key Statistics – Loan Production (1) | ||||||||||||||||||||||||||||
| Three Months Ended September 30 | Nine Months Ended September 30 | Three Months Ended September 30 | Nine Months Ended September 30 | |||||||||||||||||||||||||||
| (Dollars in millions) | 2018 | 2017 | 2018 | 2017 | 2019 | 2018 | 2019 | 2018 | ||||||||||||||||||||||
Total (2): | ||||||||||||||||||||||||||||||
| First mortgage | $ | 10,682 | $ | 13,183 | $ | 31,778 | $ | 37,876 | $ | 20,664 | $ | 10,682 | $ | 50,353 | $ | 31,778 | ||||||||||||||
| Home equity | 3,399 | 4,133 | 11,229 | 12,871 | 2,539 | 3,399 | 8,132 | 11,229 | ||||||||||||||||||||||
| Consumer Banking: | ||||||||||||||||||||||||||||||
| First mortgage | $ | 7,208 | $ | 9,044 | $ | 21,053 | $ | 25,679 | $ | 13,622 | $ | 7,208 | $ | 34,534 | $ | 21,053 | ||||||||||||||
| Home equity | 3,053 | 3,722 | 10,042 | 11,604 | 2,219 | 3,053 | 7,109 | 10,042 | ||||||||||||||||||||||
(1) | The loan production amounts represent the unpaid principal balance of loans and, in the case of home equity, the principal amount of the total line of credit. |
(2) | In addition to loan production in Consumer Banking, there is also first mortgage and home equity loan production in GWIM. |
| Three Months Ended September 30 | Nine Months Ended September 30 | |||||||||||||||||||||
| (Dollars in millions) | 2019 | 2018 | % Change | 2019 | 2018 | % Change | ||||||||||||||||
| Net interest income | $ | 1,609 | $ | 1,531 | 5 | % | $ | 4,917 | $ | 4,653 | 6 | % | ||||||||||
| Noninterest income: | ||||||||||||||||||||||
| Investment and brokerage services | 3,001 | 3,004 | — | 8,805 | 8,981 | (2 | ) | |||||||||||||||
| All other income | 294 | 282 | 4 | 902 | 780 | 16 | ||||||||||||||||
| Total noninterest income | 3,295 | 3,286 | — | 9,707 | 9,761 | (1 | ) | |||||||||||||||
| Total revenue, net of interest expense | 4,904 | 4,817 | 2 | 14,624 | 14,414 | 1 | ||||||||||||||||
| Provision for credit losses | 37 | 13 | n/m | 63 | 63 | — | ||||||||||||||||
| Noninterest expense | 3,413 | 3,443 | (1 | ) | 10,300 | 10,451 | (1 | ) | ||||||||||||||
| Income before income taxes | 1,454 | 1,361 | 7 | 4,261 | 3,900 | 9 | ||||||||||||||||
| Income tax expense | 356 | 347 | 3 | 1,044 | 994 | 5 | ||||||||||||||||
| Net income | $ | 1,098 | $ | 1,014 | 8 | $ | 3,217 | $ | 2,906 | 11 | ||||||||||||
| Effective tax rate | 24.5 | % | 25.5 | % | 24.5 | % | 25.5 | % | ||||||||||||||
| Net interest yield | 2.30 | 2.37 | 2.35 | 2.41 | ||||||||||||||||||
| Return on average allocated capital | 30 | 28 | 30 | 27 | ||||||||||||||||||
| Efficiency ratio | 69.60 | 71.48 | 70.43 | 72.50 | ||||||||||||||||||
| Balance Sheet | ||||||||||||||||||||||
| Three Months Ended September 30 | Nine Months Ended September 30 | |||||||||||||||||||||
| Average | 2019 | 2018 | % Change | 2019 | 2018 | % Change | ||||||||||||||||
| Total loans and leases | $ | 170,414 | $ | 161,869 | 5 | % | $ | 167,069 | $ | 160,609 | 4 | % | ||||||||||
| Total earning assets | 277,349 | 256,286 | 8 | 279,790 | 258,046 | 8 | ||||||||||||||||
| Total assets | 289,447 | 273,582 | 6 | 292,102 | 275,183 | 6 | ||||||||||||||||
| Total deposits | 254,449 | 238,291 | 7 | 256,708 | 239,176 | 7 | ||||||||||||||||
| Allocated capital | 14,500 | 14,500 | — | 14,500 | 14,500 | — | ||||||||||||||||
| Period end | September 30 2019 | December 31 2018 | % Change | |||||||||||||||||||
| Total loans and leases | $ | 172,677 | $ | 164,854 | 5 | % | ||||||||||||||||
| Total earning assets | 275,884 | 287,199 | (4 | ) | ||||||||||||||||||
| Total assets | 288,317 | 305,907 | (6 | ) | ||||||||||||||||||
| Total deposits | 252,466 | 268,700 | (6 | ) | ||||||||||||||||||
13Bank of America | ||
| Three Months Ended September 30 | Nine Months Ended September 30 | |||||||||||||||||||||
| (Dollars in millions) | 2018 | 2017 | % Change | 2018 | 2017 | % Change | ||||||||||||||||
| Net interest income (FTE basis) | $ | 1,536 | $ | 1,496 | 3 | % | $ | 4,673 | $ | 4,653 | — | % | ||||||||||
| Noninterest income: | ||||||||||||||||||||||
| Investment and brokerage services | 3,004 | 2,854 | 5 | 8,981 | 8,474 | 6 | ||||||||||||||||
| All other income | 243 | 270 | (10 | ) | 694 | 780 | (11 | ) | ||||||||||||||
| Total noninterest income | 3,247 | 3,124 | 4 | 9,675 | 9,254 | 5 | ||||||||||||||||
| Total revenue, net of interest expense (FTE basis) | 4,783 | 4,620 | 4 | 14,348 | 13,907 | 3 | ||||||||||||||||
| Provision for credit losses | 13 | 16 | (19 | ) | 63 | 50 | 26 | |||||||||||||||
| Noninterest expense | 3,414 | 3,369 | 1 | 10,235 | 10,085 | 1 | ||||||||||||||||
| Income before income taxes (FTE basis) | 1,356 | 1,235 | 10 | 4,050 | 3,772 | 7 | ||||||||||||||||
| Income tax expense (FTE basis) | 346 | 465 | (26 | ) | 1,033 | 1,422 | (27 | ) | ||||||||||||||
| Net income | $ | 1,010 | $ | 770 | 31 | $ | 3,017 | $ | 2,350 | 28 | ||||||||||||
| Effective tax rate (FTE basis) | 25.5 | % | 37.7 | % | 25.5 | % | 37.7 | % | ||||||||||||||
| Net interest yield (FTE basis) | 2.38 | 2.29 | 2.42 | 2.32 | ||||||||||||||||||
| Return on average allocated capital | 28 | 22 | 28 | 23 | ||||||||||||||||||
| Efficiency ratio (FTE basis) | 71.40 | 72.91 | 71.34 | 72.52 | ||||||||||||||||||
| Balance Sheet | ||||||||||||||||||||||
| Three Months Ended September 30 | Nine Months Ended September 30 | |||||||||||||||||||||
| Average | 2018 | 2017 | % Change | 2018 | 2017 | % Change | ||||||||||||||||
| Total loans and leases | $ | 161,869 | $ | 154,333 | 5 | % | $ | 160,609 | $ | 151,205 | 6 | % | ||||||||||
| Total earning assets | 256,285 | 259,564 | (1 | ) | 258,044 | 267,732 | (4 | ) | ||||||||||||||
| Total assets | 273,581 | 275,570 | (1 | ) | 275,182 | 283,324 | (3 | ) | ||||||||||||||
| Total deposits | 238,291 | 239,647 | (1 | ) | 239,176 | 247,389 | (3 | ) | ||||||||||||||
| Allocated capital | 14,500 | 14,000 | 4 | 14,500 | 14,000 | 4 | ||||||||||||||||
| Period end | September 30 2018 | December 31 2017 | % Change | |||||||||||||||||||
| Total loans and leases | $ | 162,191 | $ | 159,378 | 2 | % | ||||||||||||||||
| Total earning assets | 258,561 | 267,026 | (3 | ) | ||||||||||||||||||
| Total assets | 276,146 | 284,321 | (3 | ) | ||||||||||||||||||
| Total deposits | 239,654 | 246,994 | (3 | ) | ||||||||||||||||||
| Key Indicators and Metrics | |||||||||||||||||||||||||||||||
| Three Months Ended September 30 | Nine Months Ended September 30 | Three Months Ended September 30 | Nine Months Ended September 30 | ||||||||||||||||||||||||||||
| (Dollars in millions, except as noted) | 2018 | 2017 | 2018 | 2017 | 2019 | 2018 | 2019 | 2018 | |||||||||||||||||||||||
| Revenue by Business | |||||||||||||||||||||||||||||||
| Merrill Lynch Global Wealth Management | $ | 3,924 | $ | 3,796 | $ | 11,780 | $ | 11,452 | $ | 4,053 | $ | 3,951 | $ | 12,065 | $ | 11,834 | |||||||||||||||
| U.S. Trust | 859 | 822 | 2,567 | 2,450 | |||||||||||||||||||||||||||
| Other | — | 2 | 1 | 5 | |||||||||||||||||||||||||||
| Total revenue, net of interest expense (FTE basis) | $ | 4,783 | $ | 4,620 | $ | 14,348 | $ | 13,907 | |||||||||||||||||||||||
| Bank of America Private Bank | 851 | 866 | 2,559 | 2,580 | |||||||||||||||||||||||||||
| Total revenue, net of interest expense | $ | 4,904 | $ | 4,817 | $ | 14,624 | $ | 14,414 | |||||||||||||||||||||||
| Client Balances by Business, at period end | |||||||||||||||||||||||||||||||
| Merrill Lynch Global Wealth Management | $ | 2,385,479 | $ | 2,245,499 | $ | 2,443,614 | $ | 2,385,479 | |||||||||||||||||||||||
| U.S. Trust | 455,894 | 430,684 | |||||||||||||||||||||||||||||
| Bank of America Private Bank | 462,347 | 455,894 | |||||||||||||||||||||||||||||
| Total client balances | $ | 2,841,373 | $ | 2,676,183 | $ | 2,905,961 | $ | 2,841,373 | |||||||||||||||||||||||
| Client Balances by Type, at period end | |||||||||||||||||||||||||||||||
| Assets under management | $ | 1,144,375 | $ | 1,036,048 | |||||||||||||||||||||||||||
Assets under management (1) | $ | 1,212,120 | $ | 1,182,504 | |||||||||||||||||||||||||||
| Brokerage and other assets | 1,292,219 | 1,243,858 | 1,305,926 | 1,292,219 | |||||||||||||||||||||||||||
| Deposits | 239,654 | 237,771 | 252,466 | 239,654 | |||||||||||||||||||||||||||
Loans and leases (1) | 165,125 | 158,506 | |||||||||||||||||||||||||||||
Loans and leases (2) | 175,579 | 165,125 | |||||||||||||||||||||||||||||
Less: Managed deposits in assets under management (1) | (40,130 | ) | (38,129 | ) | |||||||||||||||||||||||||||
| Total client balances | $ | 2,841,373 | $ | 2,676,183 | $ | 2,905,961 | $ | 2,841,373 | |||||||||||||||||||||||
| Assets Under Management Rollforward | |||||||||||||||||||||||||||||||
| Assets under management, beginning of period | $ | 1,101,001 | $ | 990,709 | $ | 1,080,747 | $ | 886,148 | $ | 1,203,783 | $ | 1,138,500 | $ | 1,072,234 | $ | 1,121,383 | |||||||||||||||
| Net client flows | 7,572 | 20,749 | 42,587 | 77,479 | 5,529 | 8,202 | 16,721 | 40,080 | |||||||||||||||||||||||
Market valuation/other | 35,802 | 24,590 | 21,041 | 72,421 | 2,808 | 35,802 | 123,165 | 21,041 | |||||||||||||||||||||||
| Total assets under management, end of period | $ | 1,144,375 | $ | 1,036,048 | $ | 1,144,375 | $ | 1,036,048 | $ | 1,212,120 | $ | 1,182,504 | $ | 1,212,120 | $ | 1,182,504 | |||||||||||||||
Associates, at period end | |||||||||||||||||||||||||||||||
| Number of financial advisors | 17,456 | 17,221 | 17,657 | 17,456 | |||||||||||||||||||||||||||
| Total wealth advisors, including financial advisors | 19,344 | 19,108 | 19,672 | 19,343 | |||||||||||||||||||||||||||
| Total primary sales professionals, including financial advisors and wealth advisors | 20,437 | 20,089 | 20,775 | 20,466 | |||||||||||||||||||||||||||
| Merrill Lynch Global Wealth Management Metric | |||||||||||||||||||||||||||||||
Financial advisor productivity (3) (in thousands) | $ | 1,035 | $ | 994 | $ | 1,030 | $ | 1,009 | |||||||||||||||||||||||
| Financial advisor productivity (in thousands) | $ | 1,096 | $ | 1,035 | $ | 1,073 | $ | 1,030 | |||||||||||||||||||||||
| U.S. Trust Metric, at period end | |||||||||||||||||||||||||||||||
| Bank of America Private Bank Metric, at period end | |||||||||||||||||||||||||||||||
| Primary sales professionals | 1,711 | 1,696 | 1,811 | 1,711 | |||||||||||||||||||||||||||
(1) | AUM includes deposits that are managed within investment accounts. |
(2) | Includes margin receivables which are classified in customer and other receivables on the Consolidated Balance Sheet. |
Bank of America | ||
| Three Months Ended September 30 | Nine Months Ended September 30 | Three Months Ended September 30 | Nine Months Ended September 30 | |||||||||||||||||||||||||||||||||||||||||
| (Dollars in millions) | (Dollars in millions) | 2018 | 2017 | % Change | 2018 | 2017 | % Change | (Dollars in millions) | 2019 | 2018 | % Change | 2019 | 2018 | % Change | ||||||||||||||||||||||||||||||
| Net interest income (FTE basis) | $ | 2,706 | $ | 2,642 | 2 | % | $ | 8,057 | $ | 7,786 | 3 | % | ||||||||||||||||||||||||||||||||
| Net interest income | Net interest income | $ | 2,617 | $ | 2,726 | (4 | %) | $ | 8,116 | $ | 8,144 | —% | ||||||||||||||||||||||||||||||||
| Noninterest income: | Noninterest income: | Noninterest income: | ||||||||||||||||||||||||||||||||||||||||||
| Service charges | Service charges | 754 | 776 | (3 | ) | 2,285 | 2,351 | (3 | ) | Service charges | 763 | 753 | 1 | 2,225 | 2,285 | (3 | ) | |||||||||||||||||||||||||||
| Investment banking fees | Investment banking fees | 643 | 806 | (20 | ) | 2,130 | 2,661 | (20 | ) | Investment banking fees | 902 | 644 | 40 | 2,328 | 2,130 | 9 | ||||||||||||||||||||||||||||
| All other income | All other income | 635 | 763 | (17 | ) | 2,122 | 2,182 | (3 | ) | All other income | 930 | 700 | 33 | 2,673 | 2,273 | 18 | ||||||||||||||||||||||||||||
| Total noninterest income | Total noninterest income | 2,032 | 2,345 | (13 | ) | 6,537 | 7,194 | (9 | ) | Total noninterest income | 2,595 | 2,097 | 24 | 7,226 | 6,688 | 8 | ||||||||||||||||||||||||||||
| Total revenue, net of interest expense (FTE basis) | 4,738 | 4,987 | (5 | ) | 14,594 | 14,980 | (3 | ) | ||||||||||||||||||||||||||||||||||||
| Total revenue, net of interest expense | Total revenue, net of interest expense | 5,212 | 4,823 | 8 | 15,342 | 14,832 | 3 | |||||||||||||||||||||||||||||||||||||
| Provision for credit losses | Provision for credit losses | (70 | ) | 48 | n/m | (77 | ) | 80 | n/m | Provision for credit losses | 120 | (70 | ) | n/m | 356 | (77 | ) | n/m | ||||||||||||||||||||||||||
| Noninterest expense | Noninterest expense | 2,120 | 2,119 | — | 6,471 | 6,435 | 1 | Noninterest expense | 2,220 | 2,142 | 4 | 6,697 | 6,618 | 1 | ||||||||||||||||||||||||||||||
| Income before income taxes (FTE basis) | 2,688 | 2,820 | (5 | ) | 8,200 | 8,465 | (3 | ) | ||||||||||||||||||||||||||||||||||||
| Income tax expense (FTE basis) | 699 | 1,062 | (34 | ) | 2,132 | 3,192 | (33 | ) | ||||||||||||||||||||||||||||||||||||
| Income before income taxes | Income before income taxes | 2,872 | 2,751 | 4 | 8,289 | 8,291 | — | |||||||||||||||||||||||||||||||||||||
| Income tax expense | Income tax expense | 775 | 714 | 9 | 2,238 | 2,154 | 4 | |||||||||||||||||||||||||||||||||||||
| Net income | Net income | $ | 1,989 | $ | 1,758 | 13 | $ | 6,068 | $ | 5,273 | 15 | Net income | $ | 2,097 | $ | 2,037 | 3 | $ | 6,051 | $ | 6,137 | (1 | ) | |||||||||||||||||||||
| Effective tax rate (FTE basis) | 26.0 | % | 37.7 | % | 26.0 | % | 37.7 | % | ||||||||||||||||||||||||||||||||||||
| Effective tax rate | Effective tax rate | 27.0 | % | 26.0 | % | 27.0 | % | 26.0 | % | |||||||||||||||||||||||||||||||||||
| Net interest yield (FTE basis) | 2.96 | 2.94 | 2.97 | 2.91 | ||||||||||||||||||||||||||||||||||||||||
| Net interest yield | Net interest yield | 2.69 | 2.99 | 2.84 | 3.00 | |||||||||||||||||||||||||||||||||||||||
| Return on average allocated capital | Return on average allocated capital | 19 | 17 | 20 | 18 | Return on average allocated capital | 20 | 20 | 20 | 20 | ||||||||||||||||||||||||||||||||||
| Efficiency ratio (FTE basis) | 44.79 | 42.52 | 44.34 | 42.97 | ||||||||||||||||||||||||||||||||||||||||
| Efficiency ratio | Efficiency ratio | 42.58 | 44.42 | 43.65 | 44.62 | |||||||||||||||||||||||||||||||||||||||
| Balance Sheet | ||||||||||||||||||||||||||||||||||||||||||||
| Three Months Ended September 30 | Nine Months Ended September 30 | Three Months Ended September 30 | Nine Months Ended September 30 | |||||||||||||||||||||||||||||||||||||||||
| Average | Average | 2018 | 2017 | % Change | 2018 | 2017 | % Change | Average | 2019 | 2018 | % Change | 2019 | 2018 | % Change | ||||||||||||||||||||||||||||||
| Total loans and leases | Total loans and leases | $ | 352,712 | $ | 346,093 | 2 | % | $ | 353,167 | $ | 344,683 | 2 | % | Total loans and leases | $ | 377,109 | $ | 352,712 | 7 | % | $ | 373,275 | $ | 353,167 | 6 | % | ||||||||||||||||||
| Total earning assets | Total earning assets | 362,316 | 357,014 | 1 | 362,910 | 357,999 | 1 | Total earning assets | 385,999 | 362,316 | 7 | 382,711 | 362,910 | 5 | ||||||||||||||||||||||||||||||
| Total assets | Total assets | 422,255 | 414,755 | 2 | 422,041 | 414,867 | 2 | Total assets | 441,186 | 423,643 | 4 | 437,570 | 423,355 | 3 | ||||||||||||||||||||||||||||||
| Total deposits | Total deposits | 337,685 | 315,692 | 7 | 328,484 | 307,163 | 7 | Total deposits | 360,457 | 337,685 | 7 | 357,413 | 328,484 | 9 | ||||||||||||||||||||||||||||||
| Allocated capital | Allocated capital | 41,000 | 40,000 | 3 | 41,000 | 40,000 | 3 | Allocated capital | 41,000 | 41,000 | — | 41,000 | 41,000 | — | ||||||||||||||||||||||||||||||
| Period end | Period end | September 30 2018 | December 31 2017 | % Change | Period end | September 30 2019 | December 31 2018 | % Change | ||||||||||||||||||||||||||||||||||||
| Total loans and leases | Total loans and leases | $ | 352,332 | $ | 350,668 | — | % | Total loans and leases | $ | 377,658 | $ | 365,717 | 3 | % | ||||||||||||||||||||||||||||||
| Total earning assets | Total earning assets | 369,555 | 365,560 | 1 | Total earning assets | 397,589 | 377,812 | 5 | ||||||||||||||||||||||||||||||||||||
| Total assets | Total assets | 430,846 | 424,533 | 1 | Total assets | 452,642 | 442,330 | 2 | ||||||||||||||||||||||||||||||||||||
| Total deposits | Total deposits | 350,748 | 329,273 | 7 | Total deposits | 371,887 | 360,248 | 3 | ||||||||||||||||||||||||||||||||||||
| Global Corporate, Global Commercial and Business Banking | Global Corporate, Global Commercial and Business Banking | Global Corporate, Global Commercial and Business Banking | ||||||||||||||||||||||||||||||||||||||||||||||||||||||||||||||
| Global Corporate Banking | Global Commercial Banking | Business Banking | Total | Global Corporate Banking | Global Commercial Banking | Business Banking | Total | |||||||||||||||||||||||||||||||||||||||||||||||||||||||||
| Three Months Ended September 30 | Three Months Ended September 30 | |||||||||||||||||||||||||||||||||||||||||||||||||||||||||||||||
| (Dollars in millions) | (Dollars in millions) | 2018 | 2017 | 2018 | 2017 | 2018 | 2017 | 2018 | 2017 | (Dollars in millions) | 2019 | 2018 | 2019 | 2018 | 2019 | 2018 | 2019 | 2018 | ||||||||||||||||||||||||||||||||||||||||||||||
Revenue (FTE basis) | ||||||||||||||||||||||||||||||||||||||||||||||||||||||||||||||||
| Revenue | Revenue | |||||||||||||||||||||||||||||||||||||||||||||||||||||||||||||||
| Business Lending | Business Lending | $ | 960 | $ | 1,127 | $ | 1,025 | $ | 1,090 | $ | 99 | $ | 101 | $ | 2,084 | $ | 2,318 | Business Lending | $ | 1,024 | $ | 908 | $ | 1,020 | $ | 1,095 | $ | 91 | $ | 108 | $ | 2,135 | $ | 2,111 | ||||||||||||||||||||||||||||||
| Global Transaction Services | Global Transaction Services | 914 | 840 | 814 | 758 | 244 | 217 | 1,972 | 1,815 | Global Transaction Services | 967 | 951 | 862 | 832 | 267 | 248 | 2,096 | 2,031 | ||||||||||||||||||||||||||||||||||||||||||||||
| Total revenue, net of interest expense | Total revenue, net of interest expense | $ | 1,874 | $ | 1,967 | $ | 1,839 | $ | 1,848 | $ | 343 | $ | 318 | $ | 4,056 | $ | 4,133 | Total revenue, net of interest expense | $ | 1,991 | $ | 1,859 | $ | 1,882 | $ | 1,927 | $ | 358 | $ | 356 | $ | 4,231 | $ | 4,142 | ||||||||||||||||||||||||||||||
| Balance Sheet | ||||||||||||||||||||||||||||||||||||||||||||||||||||||||||||||||
| Average | Average | Average | ||||||||||||||||||||||||||||||||||||||||||||||||||||||||||||||
| Total loans and leases | Total loans and leases | $ | 162,249 | $ | 159,417 | $ | 174,315 | $ | 168,945 | $ | 16,127 | $ | 17,659 | $ | 352,691 | $ | 346,021 | Total loans and leases | $ | 179,191 | $ | 162,249 | $ | 183,031 | $ | 174,315 | $ | 14,868 | $ | 16,127 | $ | 377,090 | $ | 352,691 | ||||||||||||||||||||||||||||||
| Total deposits | Total deposits | 165,522 | 149,564 | 134,486 | 129,440 | 37,703 | 36,687 | 337,711 | 315,691 | Total deposits | 175,914 | 165,522 | 143,835 | 134,486 | 40,707 | 37,703 | 360,456 | 337,711 | ||||||||||||||||||||||||||||||||||||||||||||||
| Global Corporate Banking | Global Commercial Banking | Business Banking | Total | Global Corporate Banking | Global Commercial Banking | Business Banking | Total | |||||||||||||||||||||||||||||||||||||||||||||||||||||||||
| Nine Months Ended September 30 | Nine Months Ended September 30 | |||||||||||||||||||||||||||||||||||||||||||||||||||||||||||||||
| 2018 | 2017 | 2018 | 2017 | 2018 | 2017 | 2018 | 2017 | 2019 | 2018 | 2019 | 2018 | 2019 | 2018 | 2019 | 2018 | |||||||||||||||||||||||||||||||||||||||||||||||||
Revenue (FTE basis) | ||||||||||||||||||||||||||||||||||||||||||||||||||||||||||||||||
| (Dollars in millions) | (Dollars in millions) | |||||||||||||||||||||||||||||||||||||||||||||||||||||||||||||||
| Revenue | Revenue | |||||||||||||||||||||||||||||||||||||||||||||||||||||||||||||||
| Business Lending | Business Lending | $ | 3,103 | $ | 3,322 | $ | 2,974 | $ | 3,186 | $ | 297 | $ | 301 | $ | 6,374 | $ | 6,809 | Business Lending | $ | 2,992 | $ | 2,940 | $ | 3,100 | $ | 3,188 | $ | 275 | $ | 324 | $ | 6,367 | $ | 6,452 | ||||||||||||||||||||||||||||||
| Global Transaction Services | Global Transaction Services | 2,708 | 2,470 | 2,441 | 2,217 | 713 | 625 | 5,862 | 5,312 | Global Transaction Services | 2,979 | 2,828 | 2,642 | 2,474 | 800 | 721 | 6,421 | 6,023 | ||||||||||||||||||||||||||||||||||||||||||||||
| Total revenue, net of interest expense | Total revenue, net of interest expense | $ | 5,811 | $ | 5,792 | $ | 5,415 | $ | 5,403 | $ | 1,010 | $ | 926 | $ | 12,236 | $ | 12,121 | Total revenue, net of interest expense | $ | 5,971 | $ | 5,768 | $ | 5,742 | $ | 5,662 | $ | 1,075 | $ | 1,045 | $ | 12,788 | $ | 12,475 | ||||||||||||||||||||||||||||||
| Balance Sheet | ||||||||||||||||||||||||||||||||||||||||||||||||||||||||||||||||
| Average | Average | Average | ||||||||||||||||||||||||||||||||||||||||||||||||||||||||||||||
| Total loans and leases | Total loans and leases | $ | 162,652 | $ | 157,144 | $ | 173,788 | $ | 169,751 | $ | 16,720 | $ | 17,762 | $ | 353,160 | $ | 344,657 | Total loans and leases | $ | 177,071 | $ | 162,652 | $ | 181,091 | $ | 173,788 | $ | 15,108 | $ | 16,720 | $ | 373,270 | $ | 353,160 | ||||||||||||||||||||||||||||||
| Total deposits | Total deposits | 159,500 | 146,627 | 132,115 | 124,446 | 36,889 | 36,092 | 328,504 | 307,165 | Total deposits | 175,239 | 159,500 | 142,665 | 132,115 | 39,522 | 36,889 | 357,426 | 328,504 | ||||||||||||||||||||||||||||||||||||||||||||||
| Period end | Period end | Period end | ||||||||||||||||||||||||||||||||||||||||||||||||||||||||||||||
| Total loans and leases | Total loans and leases | $ | 162,004 | $ | 161,441 | $ | 174,452 | $ | 170,825 | $ | 15,880 | $ | 17,579 | $ | 352,336 | $ | 349,845 | Total loans and leases | $ | 179,291 | $ | 162,004 | $ | 183,314 | $ | 174,452 | $ | 14,919 | $ | 15,880 | $ | 377,524 | $ | 352,336 | ||||||||||||||||||||||||||||||
| Total deposits | Total deposits | 174,709 | 147,893 | 138,425 | 135,249 | 37,640 | 36,402 | 350,774 | 319,544 | Total deposits | 183,678 | 174,709 | 147,119 | 138,425 | 41,089 | 37,640 | 371,886 | 350,774 | ||||||||||||||||||||||||||||||||||||||||||||||
Bank of America | ||
| Investment Banking Fees | Investment Banking Fees | Investment Banking Fees | ||||||||||||||||||||||||||||||||||||||||||||||||||||||||||||
| Global Banking | Total Corporation | Global Banking | Total Corporation | Global Banking | Total Corporation | Global Banking | Total Corporation | |||||||||||||||||||||||||||||||||||||||||||||||||||||||
| Three Months Ended September 30 | Nine Months Ended September 30 | Three Months Ended September 30 | Nine Months Ended September 30 | |||||||||||||||||||||||||||||||||||||||||||||||||||||||||||
| (Dollars in millions) | 2018 | 2017 | 2018 | 2017 | 2018 | 2017 | 2018 | 2017 | 2019 | 2018 | 2019 | 2018 | 2019 | 2018 | 2019 | 2018 | ||||||||||||||||||||||||||||||||||||||||||||||
| Products | ||||||||||||||||||||||||||||||||||||||||||||||||||||||||||||||
| Advisory | $ | 237 | $ | 321 | $ | 262 | $ | 374 | $ | 782 | $ | 1,177 | $ | 861 | $ | 1,262 | $ | 427 | $ | 237 | $ | 452 | $ | 262 | $ | 984 | $ | 782 | $ | 1,083 | $ | 861 | ||||||||||||||||||||||||||||||
| Debt issuance | 295 | 397 | 684 | 962 | 1,018 | 1,170 | 2,385 | 2,789 | 356 | 295 | 816 | 684 | 1,007 | 1,017 | 2,310 | 2,385 | ||||||||||||||||||||||||||||||||||||||||||||||
| Equity issuance | 111 | 88 | 307 | 193 | 330 | 314 | 911 | 736 | 119 | 112 | 308 | 307 | 337 | 331 | 937 | 911 | ||||||||||||||||||||||||||||||||||||||||||||||
| Gross investment banking fees | 643 | 806 | 1,253 | 1,529 | 2,130 | 2,661 | 4,157 | 4,787 | 902 | 644 | 1,576 | 1,253 | 2,328 | 2,130 | 4,330 | 4,157 | ||||||||||||||||||||||||||||||||||||||||||||||
| Self-led deals | (14 | ) | (18 | ) | (49 | ) | (52 | ) | (63 | ) | (89 | ) | (178 | ) | (194 | ) | (11 | ) | (15 | ) | (43 | ) | (49 | ) | (54 | ) | (63 | ) | (162 | ) | (178 | ) | ||||||||||||||||||||||||||||||
| Total investment banking fees | $ | 629 | $ | 788 | $ | 1,204 | $ | 1,477 | $ | 2,067 | $ | 2,572 | $ | 3,979 | $ | 4,593 | $ | 891 | $ | 629 | $ | 1,533 | $ | 1,204 | $ | 2,274 | $ | 2,067 | $ | 4,168 | $ | 3,979 | ||||||||||||||||||||||||||||||
| Three Months Ended September 30 | Nine Months Ended September 30 | Three Months Ended September 30 | Nine Months Ended September 30 | |||||||||||||||||||||||||||||||||||||||||
| (Dollars in millions) | (Dollars in millions) | 2018 | 2017 | % Change | 2018 | 2017 | % Change | (Dollars in millions) | 2019 | 2018 | % Change | 2019 | 2018 | % Change | ||||||||||||||||||||||||||||||
| Net interest income (FTE basis) | $ | 754 | $ | 899 | (16 | )% | $ | 2,425 | $ | 2,812 | (14 | )% | ||||||||||||||||||||||||||||||||
| Net interest income | Net interest income | $ | 1,016 | $ | 933 | 9 | % | $ | 2,780 | $ | 2,922 | (5 | )% | |||||||||||||||||||||||||||||||
| Noninterest income: | Noninterest income: | Noninterest income: | ||||||||||||||||||||||||||||||||||||||||||
| Investment and brokerage services | Investment and brokerage services | 388 | 496 | (22 | ) | 1,306 | 1,548 | (16 | ) | Investment and brokerage services | 419 | 388 | 8 | 1,296 | 1,306 | (1 | ) | |||||||||||||||||||||||||||
| Investment banking fees | Investment banking fees | 523 | 624 | (16 | ) | 1,783 | 1,879 | (5 | ) | Investment banking fees | 585 | 522 | 12 | 1,707 | 1,783 | (4 | ) | |||||||||||||||||||||||||||
| Trading account profits | 1,727 | 1,714 | 1 | 6,614 | 5,634 | 17 | ||||||||||||||||||||||||||||||||||||||
| Trading account income | Trading account income | 1,580 | 1,551 | 2 | 5,623 | 6,129 | (8 | ) | ||||||||||||||||||||||||||||||||||||
| All other income | All other income | 451 | 168 | n/m | 722 | 682 | 6 | All other income | 264 | 479 | (45 | ) | 783 | 795 | (2 | ) | ||||||||||||||||||||||||||||
| Total noninterest income | Total noninterest income | 3,089 | 3,002 | 3 | 10,425 | 9,743 | 7 | Total noninterest income | 2,848 | 2,940 | (3 | ) | 9,409 | 10,013 | (6 | ) | ||||||||||||||||||||||||||||
| Total revenue, net of interest expense (FTE basis) | 3,843 | 3,901 | (1 | ) | 12,850 | 12,555 | 2 | |||||||||||||||||||||||||||||||||||||
| Total revenue, net of interest expense | Total revenue, net of interest expense | 3,864 | 3,873 | — | 12,189 | 12,935 | (6 | ) | ||||||||||||||||||||||||||||||||||||
| Provision for credit losses | Provision for credit losses | (2 | ) | (6 | ) | (67 | ) | (6 | ) | 2 | n/m | Provision for credit losses | — | (2 | ) | n/m | (18 | ) | (6 | ) | n/m | |||||||||||||||||||||||
| Noninterest expense | Noninterest expense | 2,612 | 2,711 | (4 | ) | 8,145 | 8,117 | — | Noninterest expense | 2,679 | 2,633 | 2 | 8,109 | 8,283 | (2 | ) | ||||||||||||||||||||||||||||
| Income before income taxes (FTE basis) | 1,233 | 1,196 | 3 | 4,711 | 4,436 | 6 | ||||||||||||||||||||||||||||||||||||||
| Income tax expense (FTE basis) | 321 | 440 | (27 | ) | 1,225 | 1,553 | (21 | ) | ||||||||||||||||||||||||||||||||||||
| Income before income taxes | Income before income taxes | 1,185 | 1,242 | (5 | ) | 4,098 | 4,658 | (12 | ) | |||||||||||||||||||||||||||||||||||
| Income tax expense | Income tax expense | 338 | 323 | 5 | 1,168 | 1,211 | (4 | ) | ||||||||||||||||||||||||||||||||||||
| Net income | Net income | $ | 912 | $ | 756 | 21 | $ | 3,486 | $ | 2,883 | 21 | Net income | $ | 847 | $ | 919 | (8 | ) | $ | 2,930 | $ | 3,447 | (15 | ) | ||||||||||||||||||||
| Effective tax rate (FTE basis) | 26.0 | % | 36.8 | % | 26.0 | % | 35.0 | % | ||||||||||||||||||||||||||||||||||||
| Effective tax rate | Effective tax rate | 28.5 | % | 26.0 | % | 28.5 | % | 26.0 | % | |||||||||||||||||||||||||||||||||||
| Return on average allocated capital | Return on average allocated capital | 10 | 9 | 13 | 11 | Return on average allocated capital | 10 | 10 | 11 | 13 | ||||||||||||||||||||||||||||||||||
| Efficiency ratio (FTE basis) | 67.99 | 69.48 | 63.39 | 64.64 | ||||||||||||||||||||||||||||||||||||||||
| Efficiency ratio | Efficiency ratio | 69.32 | 68.00 | 66.53 | 64.04 | |||||||||||||||||||||||||||||||||||||||
| Balance Sheet | ||||||||||||||||||||||||||||||||||||||||||||
| Three Months Ended September 30 | Nine Months Ended September 30 | Three Months Ended September 30 | Nine Months Ended September 30 | |||||||||||||||||||||||||||||||||||||||||
| Average | Average | 2018 | 2017 | % Change | 2018 | 2017 | % Change | Average | 2019 | 2018 | % Change | 2019 | 2018 | % Change | ||||||||||||||||||||||||||||||
| Trading-related assets: | Trading-related assets: | Trading-related assets: | ||||||||||||||||||||||||||||||||||||||||||
| Trading account securities | Trading account securities | $ | 215,397 | $ | 216,988 | (1 | )% | $ | 211,668 | $ | 214,190 | (1 | )% | Trading account securities | $ | 261,182 | $ | 215,397 | 21 | % | $ | 246,077 | $ | 211,668 | 16 | % | ||||||||||||||||||
| Reverse repurchases | Reverse repurchases | 124,842 | 101,556 | 23 | 127,019 | 99,998 | 27 | Reverse repurchases | 110,907 | 124,842 | (11 | ) | 117,087 | 127,019 | (8 | ) | ||||||||||||||||||||||||||||
| Securities borrowed | Securities borrowed | 74,648 | 81,950 | (9 | ) | 80,073 | 83,770 | (4 | ) | Securities borrowed | 80,641 | 74,648 | 8 | 82,772 | 80,073 | 3 | ||||||||||||||||||||||||||||
| Derivative assets | Derivative assets | 45,392 | 41,789 | 9 | 46,754 | 41,184 | 14 | Derivative assets | 46,061 | 45,392 | 1 | 43,920 | 46,754 | (6 | ) | |||||||||||||||||||||||||||||
| Total trading-related assets | Total trading-related assets | 460,279 | 442,283 | 4 | 465,514 | 439,142 | 6 | Total trading-related assets | 498,791 | 460,279 | 8 | 489,856 | 465,514 | 5 | ||||||||||||||||||||||||||||||
| Total loans and leases | Total loans and leases | 71,231 | 72,347 | (2 | ) | 73,340 | 70,692 | 4 | Total loans and leases | 71,589 | 71,231 | 1 | 70,757 | 73,340 | (4 | ) | ||||||||||||||||||||||||||||
| Total earning assets | Total earning assets | 459,073 | 446,754 | 3 | 478,455 | 444,478 | 8 | Total earning assets | 476,919 | 459,073 | 4 | 474,481 | 478,455 | (1 | ) | |||||||||||||||||||||||||||||
| Total assets | Total assets | 652,481 | 642,428 | 2 | 669,688 | 631,684 | 6 | Total assets | 687,393 | 652,481 | 5 | 679,038 | 669,684 | 1 | ||||||||||||||||||||||||||||||
| Total deposits | Total deposits | 30,721 | 32,125 | (4 | ) | 31,253 | 32,397 | (4 | ) | Total deposits | 30,155 | 30,721 | (2 | ) | 30,878 | 31,253 | (1 | ) | ||||||||||||||||||||||||||
| Allocated capital | Allocated capital | 35,000 | 35,000 | — | 35,000 | 35,000 | — | Allocated capital | 35,000 | 35,000 | — | 35,000 | 35,000 | — | ||||||||||||||||||||||||||||||
| Period end | Period end | September 30 2018 | December 31 2017 | % Change | Period end | September 30 2019 | December 31 2018 | % Change | ||||||||||||||||||||||||||||||||||||
| Total trading-related assets | Total trading-related assets | $ | 456,643 | $ | 419,375 | 9 | % | Total trading-related assets | $ | 497,206 | $ | 447,998 | 11 | % | ||||||||||||||||||||||||||||||
| Total loans and leases | Total loans and leases | 73,023 | 76,778 | (5 | ) | Total loans and leases | 74,979 | 73,928 | 1 | |||||||||||||||||||||||||||||||||||
| Total earning assets | Total earning assets | 447,304 | 449,314 | — | Total earning assets | 478,303 | 457,224 | 5 | ||||||||||||||||||||||||||||||||||||
| Total assets | Total assets | 646,359 | 629,013 | 3 | Total assets | 689,023 | 641,923 | 7 | ||||||||||||||||||||||||||||||||||||
| Total deposits | Total deposits | 41,102 | 34,029 | 21 | Total deposits | 30,885 | 37,841 | (18 | ) | |||||||||||||||||||||||||||||||||||
17Bank of America | ||
Sales and Trading Revenue (1, 2) | ||||||||||||||||||||||||||||||
Sales and Trading Revenue (1, 2, 3) | Sales and Trading Revenue (1, 2, 3) | |||||||||||||||||||||||||||||
| Three Months Ended September 30 | Nine Months Ended September 30 | Three Months Ended September 30 | Nine Months Ended September 30 | |||||||||||||||||||||||||||
| (Dollars in millions) | 2018 | 2017 | 2018 | 2017 | 2019 | 2018 | 2019 | 2018 | ||||||||||||||||||||||
| Sales and trading revenue | ||||||||||||||||||||||||||||||
| Fixed-income, currencies and commodities | $ | 1,982 | $ | 2,152 | $ | 6,702 | $ | 7,068 | $ | 2,056 | $ | 1,989 | $ | 6,433 | $ | 6,754 | ||||||||||||||
| Equities | 990 | 977 | 3,804 | 3,170 | 1,148 | 998 | 3,473 | 3,829 | ||||||||||||||||||||||
| Total sales and trading revenue | $ | 2,972 | $ | 3,129 | $ | 10,506 | $ | 10,238 | $ | 3,204 | $ | 2,987 | $ | 9,906 | $ | 10,583 | ||||||||||||||
Sales and trading revenue, excluding net DVA | ||||||||||||||||||||||||||||||
| Fixed-income, currencies and commodities | $ | 2,062 | $ | 2,166 | $ | 6,888 | $ | 7,350 | $ | 2,074 | $ | 2,069 | $ | 6,560 | $ | 6,941 | ||||||||||||||
| Equities | 1,009 | 984 | 3,832 | 3,198 | 1,145 | 1,017 | 3,482 | 3,856 | ||||||||||||||||||||||
| Total sales and trading revenue, excluding net DVA | $ | 3,071 | $ | 3,150 | $ | 10,720 | $ | 10,548 | $ | 3,219 | $ | 3,086 | $ | 10,042 | $ | 10,797 | ||||||||||||||
(1) |
(2) | Includes |
(3) | Includes Global Banking sales and trading revenue of $147 million and $390 million for the three and nine months ended September 30, 2019 compared to $51 million and $297 million for the same periods in 2018. |
(4) | FICC and Equities sales and trading revenue, excluding net DVA, is a non-GAAP financial measure. FICC net DVA losses were $ |
Bank of America | ||
| Three Months Ended September 30 | Nine Months Ended September 30 | Three Months Ended September 30 | Nine Months Ended September 30 | |||||||||||||||||||||||||||||||||||||||||
| (Dollars in millions) | (Dollars in millions) | 2018 | 2017 | % Change | 2018 | 2017 | % Change | (Dollars in millions) | 2019 | 2018 | % Change | 2019 | 2018 | % Change | ||||||||||||||||||||||||||||||
| Net interest income (FTE basis) | $ | 162 | $ | 152 | 7 | % | $ | 435 | $ | 675 | (36 | )% | ||||||||||||||||||||||||||||||||
| Net interest income | Net interest income | $ | 62 | $ | 178 | (65 | )% | $ | 135 | $ | 480 | (72 | )% | |||||||||||||||||||||||||||||||
| Noninterest income (loss) | Noninterest income (loss) | (1 | ) | (355 | ) | (100 | )% | (907 | ) | (94 | ) | n/m | Noninterest income (loss) | (811 | ) | (258 | ) | n/m | (2,018 | ) | (1,519 | ) | 33 | |||||||||||||||||||||
| Total revenue, net of interest expense (FTE basis) | 161 | (203 | ) | n/m | (472 | ) | 581 | n/m | ||||||||||||||||||||||||||||||||||||
| Total revenue, net of interest expense | Total revenue, net of interest expense | (749 | ) | (80 | ) | n/m | (1,883 | ) | (1,039 | ) | 81 | |||||||||||||||||||||||||||||||||
| Provision for credit losses | Provision for credit losses | (95 | ) | (191 | ) | (50 | ) | (352 | ) | (376 | ) | (6 | ) | Provision for credit losses | (295 | ) | (95 | ) | n/m | (590 | ) | (352 | ) | 68 | ||||||||||||||||||||
| Noninterest expense | Noninterest expense | 566 | 734 | (23 | ) | 2,166 | 3,546 | (39 | ) | Noninterest expense | 2,464 | 471 | n/m | 3,398 | 1,487 | 129 | ||||||||||||||||||||||||||||
| Loss before income taxes (FTE basis) | (310 | ) | (746 | ) | (58 | ) | (2,286 | ) | (2,589 | ) | (12 | ) | ||||||||||||||||||||||||||||||||
| Income tax expense (benefit) (FTE basis) | (453 | ) | (800 | ) | (43 | ) | (1,893 | ) | (1,944 | ) | (3 | ) | ||||||||||||||||||||||||||||||||
| Loss before income taxes | Loss before income taxes | (2,918 | ) | (456 | ) | n/m | (4,691 | ) | (2,174 | ) | 116 | |||||||||||||||||||||||||||||||||
| Income tax benefit | Income tax benefit | (1,320 | ) | (488 | ) | n/m | (3,055 | ) | (1,862 | ) | 64 | |||||||||||||||||||||||||||||||||
| Net income (loss) | Net income (loss) | $ | 143 | $ | 54 | n/m | $ | (393 | ) | $ | (645 | ) | (39 | ) | Net income (loss) | $ | (1,598 | ) | $ | 32 | n/m | $ | (1,636 | ) | $ | (312 | ) | n/m | ||||||||||||||||
| Balance Sheet | ||||||||||||||||||||||||||||||||||||||||||||
| Three Months Ended September 30 | Nine Months Ended September 30 | Three Months Ended September 30 | Nine Months Ended September 30 | |||||||||||||||||||||||||||||||||||||||||
| Average | 2018 | 2017 | % Change | 2018 | 2017 | % Change | 2019 | 2018 | % Change | 2019 | 2018 | % Change | ||||||||||||||||||||||||||||||||
| Total loans and leases | Total loans and leases | $ | 59,930 | $ | 76,546 | (22 | )% | $ | 63,602 | $ | 86,294 | (26 | )% | Total loans and leases | $ | 41,788 | $ | 59,930 | (30 | )% | $ | 44,529 | $ | 63,602 | (30 | )% | ||||||||||||||||||
Total assets (1) | Total assets (1) | 209,847 | 207,274 | 1 | 199,709 | 206,373 | (3 | ) | Total assets (1) | 212,527 | 208,458 | 2 | 205,415 | 198,398 | 4 | |||||||||||||||||||||||||||||
| Total deposits | Total deposits | 22,118 | 25,273 | (12 | ) | 22,635 | 25,629 | (12 | ) | Total deposits | 20,718 | 22,118 | (6 | ) | 20,720 | 22,635 | (8 | ) | ||||||||||||||||||||||||||
| Period end | September 30 2018 | December 31 2017 | % Change | September 30 2019 | December 31 2018 | % Change | ||||||||||||||||||||||||||||||||||||||
| Total loans and leases | Total loans and leases | $ | 54,978 | $ | 69,452 | (21 | )% | Total loans and leases | $ | 39,671 | $ | 48,061 | (17 | )% | ||||||||||||||||||||||||||||||
Total assets (1) | Total assets (1) | 219,985 | 194,042 | 13 | Total assets (1) | 207,605 | 195,466 | 6 | ||||||||||||||||||||||||||||||||||||
| Total deposits | Total deposits | 21,375 | 22,719 | (6 | ) | Total deposits | 21,883 | 18,541 | 18 | |||||||||||||||||||||||||||||||||||
(1) | In segments where the total of liabilities and equity exceeds assets, which are generally deposit-taking segments, we allocate assets from All Other to those segments to match liabilities (i.e., deposits) and allocated shareholders’ equity. Average allocated assets were $ |
19Bank of America | ||
Bank of America 20 | ||
| Table 9 | Bank of America Corporation Regulatory Capital under Basel 3 (1) | ||||||||||||||||||||||||
| Table 8 | Bank of America Corporation Regulatory Capital under Basel 3 | ||||||||||||||||||||||||
| Standardized Approach | Advanced Approaches | Current Regulatory Minimum (2) | 2019 Regulatory Minimum (3) | Standardized Approach | Advanced Approaches | Regulatory Minimum (1) | |||||||||||||||||||
| (Dollars in millions, except as noted) | (Dollars in millions, except as noted) | September 30, 2018 | (Dollars in millions, except as noted) | September 30, 2019 | |||||||||||||||||||||
| Risk-based capital metrics: | Risk-based capital metrics: | Risk-based capital metrics: | |||||||||||||||||||||||
| Common equity tier 1 capital | Common equity tier 1 capital | $ | 164,386 | $ | 164,386 | Common equity tier 1 capital | $ | 169,203 | $ | 169,203 | |||||||||||||||
| Tier 1 capital | Tier 1 capital | 186,189 | 186,189 | Tier 1 capital | 192,029 | 192,029 | |||||||||||||||||||
Total capital (4) | 218,159 | 209,950 | |||||||||||||||||||||||
Total capital (2) | Total capital (2) | 225,430 | 217,247 | ||||||||||||||||||||||
| Risk-weighted assets (in billions) | Risk-weighted assets (in billions) | 1,439 | 1,424 | Risk-weighted assets (in billions) | 1,484 | 1,440 | |||||||||||||||||||
| Common equity tier 1 capital ratio | Common equity tier 1 capital ratio | 11.4 | % | 11.5 | % | 8.25 | % | 9.5 | % | Common equity tier 1 capital ratio | 11.4 | % | 11.7 | % | 9.5 | % | |||||||||
| Tier 1 capital ratio | Tier 1 capital ratio | 12.9 | 13.1 | 9.75 | 11.0 | Tier 1 capital ratio | 12.9 | 13.3 | 11.0 | ||||||||||||||||
| Total capital ratio | Total capital ratio | 15.2 | 14.7 | 11.75 | 13.0 | Total capital ratio | 15.2 | 15.1 | 13.0 | ||||||||||||||||
| Leverage-based metrics: | Leverage-based metrics: | Leverage-based metrics: | |||||||||||||||||||||||
Adjusted quarterly average assets (in billions) (5) | $ | 2,240 | $ | 2,240 | |||||||||||||||||||||
Adjusted quarterly average assets (in billions) (3) | Adjusted quarterly average assets (in billions) (3) | $ | 2,336 | $ | 2,336 | ||||||||||||||||||||
| Tier 1 leverage ratio | Tier 1 leverage ratio | 8.3 | % | 8.3 | % | 4.0 | 4.0 | Tier 1 leverage ratio | 8.2 | % | 8.2 | % | 4.0 | ||||||||||||
| SLR leverage exposure (in billions) | SLR leverage exposure (in billions) | $ | 2,788 | SLR leverage exposure (in billions) | $ | 2,898 | |||||||||||||||||||
| SLR | SLR | 6.7 | % | 5.0 | 5.0 | SLR | 6.6 | % | 5.0 | ||||||||||||||||
| December 31, 2017 | December 31, 2018 | ||||||||||||||||||||||||
| Risk-based capital metrics: | Risk-based capital metrics: | Risk-based capital metrics: | |||||||||||||||||||||||
| Common equity tier 1 capital | Common equity tier 1 capital | $ | 168,461 | $ | 168,461 | Common equity tier 1 capital | $ | 167,272 | $ | 167,272 | |||||||||||||||
| Tier 1 capital | Tier 1 capital | 190,189 | 190,189 | Tier 1 capital | 189,038 | 189,038 | |||||||||||||||||||
Total capital (4) | 224,209 | 215,311 | |||||||||||||||||||||||
Total capital (2) | Total capital (2) | 221,304 | 212,878 | ||||||||||||||||||||||
| Risk-weighted assets (in billions) | Risk-weighted assets (in billions) | 1,443 | 1,459 | Risk-weighted assets (in billions) | 1,437 | 1,409 | |||||||||||||||||||
| Common equity tier 1 capital ratio | Common equity tier 1 capital ratio | 11.7 | % | 11.5 | % | 7.25 | % | 9.5 | % | Common equity tier 1 capital ratio | 11.6 | % | 11.9 | % | 8.25 | % | |||||||||
| Tier 1 capital ratio | Tier 1 capital ratio | 13.2 | 13.0 | 8.75 | 11.0 | Tier 1 capital ratio | 13.2 | 13.4 | 9.75 | ||||||||||||||||
| Total capital ratio | Total capital ratio | 15.5 | 14.8 | 10.75 | 13.0 | Total capital ratio | 15.4 | 15.1 | 11.75 | ||||||||||||||||
| Leverage-based metrics: | Leverage-based metrics: | Leverage-based metrics: | |||||||||||||||||||||||
Adjusted quarterly average assets (in billions) (5) | $ | 2,223 | $ | 2,223 | |||||||||||||||||||||
Adjusted quarterly average assets (in billions) (3) | Adjusted quarterly average assets (in billions) (3) | $ | 2,258 | $ | 2,258 | ||||||||||||||||||||
| Tier 1 leverage ratio | Tier 1 leverage ratio | 8.6 | % | 8.6 | % | 4.0 | 4.0 | Tier 1 leverage ratio | 8.4 | % | 8.4 | % | 4.0 | ||||||||||||
| SLR leverage exposure (in billions) | SLR leverage exposure (in billions) | $ | 2,791 | ||||||||||||||||||||||
| SLR | SLR | 6.8 | % | 5.0 | |||||||||||||||||||||
(1) |
The |
| Total capital under the Advanced approaches differs from the Standardized approach due to differences in the amount permitted in Tier 2 capital related to the qualifying allowance for credit losses. |
Reflects total average assets adjusted certain Tier 1 capital deductions. |
| Table 10 | Capital Composition under Basel 3 (1) | |||||||||||||||
| Table 9 | Capital Composition under Basel 3 | |||||||||||||||
| (Dollars in millions) | (Dollars in millions) | September 30 2018 | December 31 2017 | (Dollars in millions) | September 30 2019 | December 31 2018 | ||||||||||
| Total common shareholders’ equity | Total common shareholders’ equity | $ | 239,832 | $ | 244,823 | Total common shareholders’ equity | $ | 244,781 | $ | 242,999 | ||||||
| Goodwill, net of related deferred tax liabilities | Goodwill, net of related deferred tax liabilities | (68,574 | ) | (68,576 | ) | Goodwill, net of related deferred tax liabilities | (68,571 | ) | (68,572 | ) | ||||||
| Deferred tax assets arising from net operating loss and tax credit carryforwards | Deferred tax assets arising from net operating loss and tax credit carryforwards | (6,166 | ) | (6,555 | ) | Deferred tax assets arising from net operating loss and tax credit carryforwards | (5,210 | ) | (5,981 | ) | ||||||
| Intangibles, other than mortgage servicing rights and goodwill, net of related deferred tax liabilities | Intangibles, other than mortgage servicing rights and goodwill, net of related deferred tax liabilities | (1,407 | ) | (1,743 | ) | Intangibles, other than mortgage servicing rights and goodwill, net of related deferred tax liabilities | (1,335 | ) | (1,294 | ) | ||||||
| Other | Other | 701 | 512 | Other | (462 | ) | 120 | |||||||||
| Common equity tier 1 capital | Common equity tier 1 capital | 164,386 | 168,461 | Common equity tier 1 capital | 169,203 | 167,272 | ||||||||||
| Qualifying preferred stock, net of issuance cost | Qualifying preferred stock, net of issuance cost | 22,326 | 22,323 | Qualifying preferred stock, net of issuance cost | 23,400 | 22,326 | ||||||||||
| Other | Other | (523 | ) | (595 | ) | Other | (574 | ) | (560 | ) | ||||||
| Tier 1 capital | Tier 1 capital | 186,189 | 190,189 | Tier 1 capital | 192,029 | 189,038 | ||||||||||
| Tier 2 capital instruments | Tier 2 capital instruments | 21,444 | 22,938 | Tier 2 capital instruments | 23,160 | 21,887 | ||||||||||
| Eligible credit reserves included in Tier 2 capital | Eligible credit reserves included in Tier 2 capital | 2,317 | 2,272 | Eligible credit reserves included in Tier 2 capital | 2,059 | 1,972 | ||||||||||
| Other | Other | — | (88 | ) | Other | (1 | ) | (19 | ) | |||||||
| Total capital under the Advanced approaches | Total capital under the Advanced approaches | $ | 209,950 | $ | 215,311 | Total capital under the Advanced approaches | $ | 217,247 | $ | 212,878 | ||||||
| Table 11 | Risk-weighted Assets under Basel 3 (1) | |||||||||||||||||||||||||||||||
| Table 10 | Risk-weighted Assets under Basel 3 | |||||||||||||||||||||||||||||||
| Standardized Approach | Advanced Approaches | Standardized Approach | Advanced Approaches | Standardized Approach | Advanced Approaches | Standardized Approach | Advanced Approaches | |||||||||||||||||||||||||
(Dollars in billions) | (Dollars in billions) | September 30, 2018 | December 31, 2017 | (Dollars in billions) | September 30, 2019 | December 31, 2018 | ||||||||||||||||||||||||||
| Credit risk | Credit risk | $ | 1,387 | $ | 840 | $ | 1,384 | $ | 867 | Credit risk | $ | 1,433 | $ | 854 | $ | 1,384 | $ | 827 | ||||||||||||||
| Market risk | Market risk | 52 | 51 | 59 | 58 | Market risk | 51 | 50 | 53 | 52 | ||||||||||||||||||||||
| Operational risk | Operational risk | n/a | 500 | n/a | 500 | Operational risk | n/a | 500 | n/a | 500 | ||||||||||||||||||||||
| Risks related to credit valuation adjustments | Risks related to credit valuation adjustments | n/a | 33 | n/a | 34 | Risks related to credit valuation adjustments | n/a | 36 | n/a | 30 | ||||||||||||||||||||||
| Total risk-weighted assets | Total risk-weighted assets | $ | 1,439 | $ | 1,424 | $ | 1,443 | $ | 1,459 | Total risk-weighted assets | $ | 1,484 | $ | 1,440 | $ | 1,437 | $ | 1,409 | ||||||||||||||
| Table 12 | Bank of America, N.A. Regulatory Capital under Basel 3 | ||||||||||||||||
| Standardized Approach | Advanced Approaches | ||||||||||||||||
| Ratio | Amount | Ratio | Amount | Minimum Required (1) | |||||||||||||
(Dollars in millions) | September 30, 2018 | ||||||||||||||||
| Common equity tier 1 capital | 12.2 | % | $ | 146,659 | 14.8 | % | $ | 146,659 | 6.5 | % | |||||||
| Tier 1 capital | 12.2 | 146,659 | 14.8 | 146,659 | 8.0 | ||||||||||||
| Total capital | 13.2 | 158,657 | 15.3 | 150,754 | 10.0 | ||||||||||||
| Tier 1 leverage | 8.6 | 146,659 | 8.6 | 146,659 | 5.0 | ||||||||||||
| SLR | 7.0 | 146,659 | 6.0 | ||||||||||||||
| December 31, 2017 | |||||||||||||||||
| Common equity tier 1 capital | 12.5 | % | $ | 150,552 | 14.9 | % | $ | 150,552 | 6.5 | % | |||||||
| Tier 1 capital | 12.5 | 150,552 | 14.9 | 150,552 | 8.0 | ||||||||||||
| Total capital | 13.6 | 163,243 | 15.4 | 154,675 | 10.0 | ||||||||||||
| Tier 1 leverage | 9.0 | 150,552 | 9.0 | 150,552 | 5.0 | ||||||||||||
| Table 11 | Bank of America, N.A. Regulatory Capital under Basel 3 | ||||||||||
| Standardized Approach | Advanced Approaches | Regulatory Minimum (1) | |||||||||
(Dollars in millions, except as noted) | September 30, 2019 | ||||||||||
| Risk-based capital metrics: | |||||||||||
| Common equity tier 1 capital | $ | 154,045 | $ | 154,045 | |||||||
| Tier 1 capital | 154,045 | 154,045 | |||||||||
Total capital (2) | 166,062 | 158,158 | |||||||||
| Risk-weighted assets (in billions) | 1,229 | 982 | |||||||||
| Common equity tier 1 capital ratio | 12.5 | % | 15.7 | % | 7.0 | % | |||||
| Tier 1 capital ratio | 12.5 | 15.7 | 8.5 | ||||||||
| Total capital ratio | 13.5 | 16.1 | 10.5 | ||||||||
| Leverage-based metrics: | |||||||||||
Adjusted quarterly average assets (in billions) (3) | 1,741 | 1,741 | |||||||||
| Tier 1 leverage ratio | 8.8 | % | 8.8 | % | 5.0 | ||||||
| SLR leverage exposure (in billions) | 2,137 | ||||||||||
| SLR | 7.2 | % | 6.0 | ||||||||
| December 31, 2018 | |||||||||||
| Risk-based capital metrics: | |||||||||||
| Common equity tier 1 capital | $ | 149,824 | $ | 149,824 | |||||||
| Tier 1 capital | 149,824 | 149,824 | |||||||||
Total capital (2) | 161,760 | 153,627 | |||||||||
| Risk-weighted assets (in billions) | 1,195 | 959 | |||||||||
| Common equity tier 1 capital ratio | 12.5 | % | 15.6 | % | 6.5 | % | |||||
| Tier 1 capital ratio | 12.5 | 15.6 | 8.0 | ||||||||
| Total capital ratio | 13.5 | 16.0 | 10.0 | ||||||||
| Leverage-based metrics: | |||||||||||
Adjusted quarterly average assets (in billions) (3) | 1,719 | 1,719 | |||||||||
| Tier 1 leverage ratio | 8.7 | % | 8.7 | % | 5.0 | ||||||
| SLR leverage exposure (in billions) | 2,112 | ||||||||||
| SLR | 7.1 | % | 6.0 | ||||||||
(1) | Risk-based capital regulatory minimums at September 30, 2019 are the minimum ratios under Basel 3 including a capital conservation buffer of 2.5 percent. The regulatory minimums for the leverage ratios as of both period ends and risk-based capital ratios as of December 31, 2018 are the percent required |
(2) | Total capital under the Advanced approaches differs from the Standardized approach due to differences in the amount permitted in Tier 2 capital related to the qualifying allowance for credit losses. |
(3) | Reflects total average assets adjusted for certain Tier 1 capital deductions. |
Bank of America | ||
| Table 12 | Bank of America Corporation Total Loss-Absorbing Capacity and Long-Term Debt | |||||||||||||
TLAC | Regulatory Minimum (1) | Long-term Debt | Regulatory Minimum (2) | |||||||||||
(Dollars in millions) | September 30, 2019 | |||||||||||||
| Total eligible balance | $ | 368,490 | $ | 168,864 | ||||||||||
Percentage of risk-weighted assets (3) | 24.8 | % | 22.0 | % | 11.4 | % | 8.5 | % | ||||||
| Percentage of SLR leverage exposure | 12.7 | 9.5 | 5.8 | 4.5 | ||||||||||
(1) | The TLAC risk-weighted assets regulatory minimum consists of 18.0 percent plus a TLAC risk-weighted assets buffer comprised of 2.5 percent plus the method 1 G-SIB surcharge of 1.5 percent. The countercyclical buffer is zero for this period. The TLAC SLR leverage exposure regulatory minimum consists of 7.5 percent plus a 2.0 percent TLAC leverage buffer. The TLAC risk-weighted assets and leverage buffers must be comprised solely of CET1 capital and Tier 1 capital, respectively. |
(2) | The long-term debt risk-weighted assets regulatory minimum is comprised of 6.0 percent plus an additional 2.5 percent requirement based on the Corporation’s method 2 G-SIB surcharge. |
(3) | The approach that yields the higher risk-weighted assets is used to calculate TLAC and long-term debt ratios, which was the Standardized approach as of September 30, 2019. |
| Table 13 | Average Global Liquidity Sources | |||||||
| Three Months Ended | ||||||||
| (Dollars in billions) | September 30 2018 | December 31 2017 | ||||||
| Parent company and NB Holdings | $ | 80 | $ | 79 | ||||
| Bank subsidiaries | 410 | 394 | ||||||
| Other regulated entities | 47 | 49 | ||||||
| Total Average Global Liquidity Sources | $ | 537 | $ | 522 | ||||
23Bank of America | ||
| Table 13 | Average Global Liquidity Sources | |||||||
| Three Months Ended | ||||||||
| (Dollars in billions) | September 30 2019 | December 31 2018 | ||||||
| Parent company and NB Holdings | $ | 65 | $ | 76 | ||||
| Bank subsidiaries | 426 | 420 | ||||||
| Other regulated entities | 61 | 48 | ||||||
| Total Average Global Liquidity Sources | $ | 552 | $ | 544 | ||||
| Table 14 | Average Global Liquidity Sources Composition | |||||||
| Three Months Ended | ||||||||
| (Dollars in billions) | September 30 2019 | December 31 2018 | ||||||
| Cash on deposit | $ | 103 | $ | 113 | ||||
| U.S. Treasury securities | 81 | 81 | ||||||
| U.S. agency securities and mortgage-backed securities | 353 | 340 | ||||||
| Non-U.S. government securities | 15 | 10 | ||||||
| Total Average Global Liquidity Sources | $ | 552 | $ | 544 | ||||
| Table 14 | Average Global Liquidity Sources Composition | |||||||
| Three Months Ended | ||||||||
| (Dollars in billions) | September 30 2018 | December 31 2017 | ||||||
| Cash on deposit | $ | 130 | $ | 118 | ||||
| U.S. Treasury securities | 64 | 62 | ||||||
| U.S. agency securities and mortgage-backed securities | 334 | 330 | ||||||
| Non-U.S. government securities | 9 | 12 | ||||||
| Total Average Global Liquidity Sources | $ | 537 | $ | 522 | ||||
Bank of America 24 | ||
| Table 15 | Long-term Debt by Maturity | Long-term Debt by Maturity | ||||||||||||||||||||||||||||||||||||||||||||||||||||||
| (Dollars in millions) | (Dollars in millions) | Remainder of 2018 | 2019 | 2020 | 2021 | 2022 | Thereafter | Total | (Dollars in millions) | Remainder of 2019 | 2020 | 2021 | 2022 | 2023 | Thereafter | Total | ||||||||||||||||||||||||||||||||||||||||
| Bank of America Corporation | Bank of America Corporation | Bank of America Corporation | ||||||||||||||||||||||||||||||||||||||||||||||||||||||
| Senior notes | $ | 1,127 | $ | 14,888 | $ | 10,340 | $ | 15,836 | $ | 14,933 | $ | 88,562 | $ | 145,686 | ||||||||||||||||||||||||||||||||||||||||||
Senior notes (1) | Senior notes (1) | $ | 1,739 | $ | 10,191 | $ | 15,826 | $ | 14,733 | $ | 23,077 | $ | 94,266 | $ | 159,832 | |||||||||||||||||||||||||||||||||||||||||
| Senior structured notes | Senior structured notes | 150 | 1,401 | 866 | 495 | 1,946 | 9,005 | 13,863 | Senior structured notes | 1,115 | 814 | 503 | 2,045 | 283 | 12,628 | 17,388 | ||||||||||||||||||||||||||||||||||||||||
| Subordinated notes | Subordinated notes | — | 1,516 | — | 354 | 387 | 19,848 | 22,105 | Subordinated notes | — | — | 336 | 378 | — | 22,198 | 22,912 | ||||||||||||||||||||||||||||||||||||||||
| Junior subordinated notes | Junior subordinated notes | — | — | — | — | — | 740 | 740 | Junior subordinated notes | — | — | — | — | — | 736 | 736 | ||||||||||||||||||||||||||||||||||||||||
| Total Bank of America Corporation | Total Bank of America Corporation | 1,277 | 17,805 | 11,206 | 16,685 | 17,266 | 118,155 | 182,394 | Total Bank of America Corporation | 2,854 | 11,005 | 16,665 | 17,156 | 23,360 | 129,828 | 200,868 | ||||||||||||||||||||||||||||||||||||||||
| Bank of America, N.A. | Bank of America, N.A. | Bank of America, N.A. | ||||||||||||||||||||||||||||||||||||||||||||||||||||||
| Senior notes | Senior notes | 2,209 | — | 1,740 | — | — | 20 | 3,969 | Senior notes | — | 3,000 | 3,448 | — | 511 | 20 | 6,979 | ||||||||||||||||||||||||||||||||||||||||
| Subordinated notes | Subordinated notes | — | 1 | — | — | — | 1,576 | 1,577 | Subordinated notes | — | — | — | — | — | 1,812 | 1,812 | ||||||||||||||||||||||||||||||||||||||||
| Advances from Federal Home Loan Banks | Advances from Federal Home Loan Banks | 2,501 | 11,762 | 3,010 | 2 | 3 | 105 | 17,383 | Advances from Federal Home Loan Banks | 3 | 2,510 | 2 | 3 | 1 | 99 | 2,618 | ||||||||||||||||||||||||||||||||||||||||
Securitizations and other Bank VIEs | Securitizations and other Bank VIEs | — | 3,200 | 3,098 | 4,022 | — | 59 | 10,379 | Securitizations and other Bank VIEs | — | 3,099 | 3,957 | 1,249 | — | — | 8,305 | ||||||||||||||||||||||||||||||||||||||||
| Other | Other | 1 | 178 | 78 | — | 10 | 61 | 328 | Other | 235 | 40 | 78 | — | 134 | 99 | 586 | ||||||||||||||||||||||||||||||||||||||||
| Total Bank of America, N.A. | Total Bank of America, N.A. | 4,711 | 15,141 | 7,926 | 4,024 | 13 | 1,821 | 33,636 | Total Bank of America, N.A. | 238 | 8,649 | 7,485 | 1,252 | 646 | 2,030 | 20,300 | ||||||||||||||||||||||||||||||||||||||||
| Other debt | Other debt | Other debt | ||||||||||||||||||||||||||||||||||||||||||||||||||||||
| Structured liabilities | Structured liabilities | 1,382 | 4,843 | 2,061 | 1,088 | 576 | 7,475 | 17,425 | Structured liabilities | 1,531 | 4,637 | 1,662 | 905 | 1,337 | 11,909 | 21,981 | ||||||||||||||||||||||||||||||||||||||||
Nonbank VIEs | Nonbank VIEs | 6 | 41 | — | — | — | 598 | 645 | Nonbank VIEs | — | — | — | — | 1 | 255 | 256 | ||||||||||||||||||||||||||||||||||||||||
| Total other debt | Total other debt | 1,388 | 4,884 | 2,061 | 1,088 | 576 | 8,073 | 18,070 | Total other debt | 1,531 | 4,637 | 1,662 | 905 | 1,338 | 12,164 | 22,237 | ||||||||||||||||||||||||||||||||||||||||
| Total long-term debt | Total long-term debt | $ | 7,376 | $ | 37,830 | $ | 21,193 | $ | 21,797 | $ | 17,855 | $ | 128,049 | $ | 234,100 | Total long-term debt | $ | 4,623 | $ | 24,291 | $ | 25,812 | $ | 19,313 | $ | 25,344 | $ | 144,022 | $ | 243,405 | ||||||||||||||||||||||||||
(1) | Total includes $106.0 billion of outstanding notes that are both TLAC eligible and callable at least one year before their stated maturities, including $1.0 billion that will be callable and become TLAC ineligible during the remainder of 2019, and $7.3 billion, $11.6 billion, $14.8 billion and $10.7 billion that will do so during each of 2020 through 2023, respectively, and $60.6 billion thereafter. |
(2) | Represents the total long-term debt included in the liabilities of consolidated variable interest entities (VIEs) on the Consolidated Balance Sheet. |
| Table 16 | Long-term Debt by Major Currency | Long-term Debt by Major Currency | ||||||||||||||
| (Dollars in millions) | (Dollars in millions) | September 30 2018 | December 31 2017 | (Dollars in millions) | September 30 2019 | December 31 2018 | ||||||||||
| U.S. dollar | U.S. dollar | $ | 184,299 | $ | 175,623 | U.S. dollar | $ | 193,583 | $ | 180,724 | ||||||
| Euro | Euro | 34,802 | 35,481 | Euro | 32,866 | 34,328 | ||||||||||
| British pound | British pound | 5,480 | 7,016 | British pound | 5,345 | 5,450 | ||||||||||
| Japanese yen | Japanese yen | 4,325 | 3,038 | |||||||||||||
| Canadian dollar | Canadian dollar | 3,044 | 1,966 | Canadian dollar | 3,805 | 2,936 | ||||||||||
| Japanese yen | 2,927 | 2,993 | ||||||||||||||
| Australian dollar | Australian dollar | 2,341 | 3,046 | Australian dollar | 1,878 | 1,722 | ||||||||||
| Other | Other | 1,207 | 1,277 | Other | 1,603 | 1,194 | ||||||||||
| Total long-term debt | Total long-term debt | $ | 234,100 | $ | 227,402 | Total long-term debt | $ | 243,405 | $ | 229,392 | ||||||
25Bank of America | ||
| Table 17 | Senior Debt Ratings | |||||||||||||||||
| Moody’s Investors Service | Standard & Poor’s Global Ratings | Fitch Ratings | ||||||||||||||||
| Long-term | Short-term | Outlook | Long-term | Short-term | Outlook | Long-term | Short-term | Outlook | ||||||||||
| Bank of America Corporation | Stable | A- | A-2 | Stable | A+ | F1 | Stable | |||||||||||
| Bank of America, N.A. | P-1 | Stable | A+ | A-1 | Stable | AA- | F1+ | Stable | ||||||||||
| Bank of America Merrill Lynch International Designated Activity Company | NR | NR | NR | A+ | A-1 | Stable | AA- | F1+ | Stable | |||||||||
| Merrill Lynch, Pierce, Fenner & Smith Incorporated | NR | NR | NR | A+ | A-1 | Stable | AA- | F1+ | Stable | |||||||||
| BofA Securities, Inc. | NR | NR | NR | A+ | A-1 | Stable | AA- | F1+ | Stable | |||||||||
| Merrill Lynch International | NR | NR | NR | A+ | A-1 | Stable | A+ | F1 | Stable | |||||||||
| BofA Securities Europe SA | NR | NR | NR | A+ | A-1 | Stable | A+ | F1 | Stable | |||||||||
Bank of America | ||
| Table 18 | Consumer Credit Quality | Consumer Credit Quality | ||||||||||||||||||||||||||||||||||||||||||||||
| Outstandings | Nonperforming | Accruing Past Due 90 Days or More | Outstandings | Nonperforming | Accruing Past Due 90 Days or More | |||||||||||||||||||||||||||||||||||||||||||
| (Dollars in millions) | (Dollars in millions) | September 30 2018 | December 31 2017 | September 30 2018 | December 31 2017 | September 30 2018 | December 31 2017 | (Dollars in millions) | September 30 2019 | December 31 2018 | September 30 2019 | December 31 2018 | September 30 2019 | December 31 2018 | ||||||||||||||||||||||||||||||||||
Residential mortgage (1) | Residential mortgage (1) | $ | 208,186 | $ | 203,811 | $ | 2,034 | $ | 2,476 | $ | 2,161 | $ | 3,230 | Residential mortgage (1) | $ | 227,472 | $ | 208,557 | $ | 1,551 | $ | 1,893 | $ | 1,203 | $ | 1,884 | ||||||||||||||||||||||
| Home equity | Home equity | 51,235 | 57,744 | 2,226 | 2,644 | — | — | Home equity | 41,574 | 48,286 | 585 | 1,893 | — | — | ||||||||||||||||||||||||||||||||||
| U.S. credit card | U.S. credit card | 94,829 | 96,285 | n/a | n/a | 872 | 900 | U.S. credit card | 94,946 | 98,338 | n/a | n/a | 960 | 994 | ||||||||||||||||||||||||||||||||||
Direct/Indirect consumer (2) | Direct/Indirect consumer (2) | 91,338 | 96,342 | 46 | 46 | 35 | 40 | Direct/Indirect consumer (2) | 90,836 | 91,166 | 53 | 56 | 29 | 38 | ||||||||||||||||||||||||||||||||||
Other consumer | Other consumer | 203 | 166 | — | — | — | — | Other consumer | 208 | 202 | — | — | — | — | ||||||||||||||||||||||||||||||||||
| Consumer loans excluding loans accounted for under the fair value option | Consumer loans excluding loans accounted for under the fair value option | $ | 445,791 | $ | 454,348 | $ | 4,306 | $ | 5,166 | $ | 3,068 | $ | 4,170 | Consumer loans excluding loans accounted for under the fair value option | $ | 455,036 | $ | 446,549 | $ | 2,189 | $ | 3,842 | $ | 2,192 | $ | 2,916 | ||||||||||||||||||||||
Loans accounted for under the fair value option | Loans accounted for under the fair value option | 755 | 928 | Loans accounted for under the fair value option | 640 | 682 | ||||||||||||||||||||||||||||||||||||||||||
| Total consumer loans and leases | Total consumer loans and leases | $ | 446,546 | $ | 455,276 | Total consumer loans and leases | $ | 455,676 | $ | 447,231 | ||||||||||||||||||||||||||||||||||||||
Percentage of outstanding consumer loans and leases | Percentage of outstanding consumer loans and leases | n/a | n/a | 0.97 | % | 1.14 | % | 0.69 | % | 0.92 | % | Percentage of outstanding consumer loans and leases | n/a | n/a | 0.48 | % | 0.86 | % | 0.48 | % | 0.65 | % | ||||||||||||||||||||||||||
Percentage of outstanding consumer loans and leases, excluding PCI and fully-insured loan portfolios (5) | n/a | n/a | 1.03 | 1.23 | 0.22 | 0.22 | ||||||||||||||||||||||||||||||||||||||||||
Percentage of outstanding consumer loans and leases, excluding fully-insured loan portfolios (4) | Percentage of outstanding consumer loans and leases, excluding fully-insured loan portfolios (4) | n/a | n/a | 0.50 | 0.90 | 0.23 | 0.24 | |||||||||||||||||||||||||||||||||||||||||
(1) | Residential mortgage loans accruing past due 90 days or more are fully-insured loans. At September 30, |
(2) | Outstandings include auto and specialty lending loans and leases of $50.3 billion and $50.1 billion |
(3) |
Consumer loans accounted for under the fair value option include residential mortgage loans of $ |
Excludes consumer loans accounted for under the fair value option. At September 30, |
| Table 19 | Consumer Net Charge-offs and Related Ratios | Consumer Net Charge-offs and Related Ratios | ||||||||||||||||||||||||||||||||||||||||||||||||||||||
Net Charge-offs (1) | Net Charge-off Ratios (1, 2) | Net Charge-offs | Net Charge-off Ratios (1) | |||||||||||||||||||||||||||||||||||||||||||||||||||||
| Three Months Ended September 30 | Nine Months Ended September 30 | Three Months Ended September 30 | Nine Months Ended September 30 | Three Months Ended September 30 | Nine Months Ended September 30 | Three Months Ended September 30 | Nine Months Ended September 30 | |||||||||||||||||||||||||||||||||||||||||||||||||
| (Dollars in millions) | (Dollars in millions) | 2018 | 2017 | 2018 | 2017 | 2018 | 2017 | 2018 | 2017 | (Dollars in millions) | 2019 | 2018 | 2019 | 2018 | 2019 | 2018 | 2019 | 2018 | ||||||||||||||||||||||||||||||||||||||
| Residential mortgage | Residential mortgage | $ | 12 | $ | (82 | ) | $ | 13 | $ | (84 | ) | 0.02 | % | (0.16 | )% | 0.01 | % | (0.06 | )% | Residential mortgage | $ | (38 | ) | $ | 12 | $ | (51 | ) | $ | 13 | (0.07 | )% | 0.02 | % | (0.03 | )% | 0.01 | % | ||||||||||||||||||
| Home equity | Home equity | (20 | ) | 83 | 13 | 197 | (0.15 | ) | 0.54 | 0.03 | 0.42 | Home equity | (202 | ) | (20 | ) | (346 | ) | 13 | (1.85 | ) | (0.15 | ) | (1.02 | ) | 0.03 | ||||||||||||||||||||||||||||||
| U.S. credit card | U.S. credit card | 698 | 612 | 2,138 | 1,858 | 2.92 | 2.65 | 3.03 | 2.75 | U.S. credit card | 717 | 698 | 2,224 | 2,138 | 3.01 | 2.92 | 3.15 | 3.03 | ||||||||||||||||||||||||||||||||||||||
Non-U.S. credit card (3) | — | — | — | 75 | — | — | — | 1.91 | ||||||||||||||||||||||||||||||||||||||||||||||||
| Direct/Indirect consumer | Direct/Indirect consumer | 42 | 68 | 142 | 149 | 0.18 | 0.28 | 0.20 | 0.21 | Direct/Indirect consumer | 76 | 42 | 170 | 142 | 0.33 | 0.18 | 0.25 | 0.20 | ||||||||||||||||||||||||||||||||||||||
| Other consumer | Other consumer | 44 | 50 | 130 | 114 | n/m | n/m | n/m | n/m | Other consumer | 69 | 44 | 151 | 130 | n/m | n/m | n/m | n/m | ||||||||||||||||||||||||||||||||||||||
| Total | Total | $ | 776 | $ | 731 | $ | 2,436 | $ | 2,309 | 0.69 | 0.65 | 0.73 | 0.69 | Total | $ | 622 | $ | 776 | $ | 2,148 | $ | 2,436 | 0.55 | 0.69 | 0.64 | 0.73 | ||||||||||||||||||||||||||||||
(1) |
| Net charge-off ratios are calculated as annualized net charge-offs divided by average outstanding loans and leases excluding loans accounted for under the fair value option. |
| Table 20 | Consumer Real Estate Portfolio (1) | Consumer Real Estate Portfolio (1) | ||||||||||||||||||||||||||||||||||||||||||||||||||||||||||||||
| Outstandings | Nonperforming | Net Charge-offs (2) | Outstandings | Nonperforming | Net Charge-offs | |||||||||||||||||||||||||||||||||||||||||||||||||||||||||||
| September 30 2018 | December 31 2017 | September 30 2018 | December 31 2017 | Three Months Ended September 30 | Nine Months Ended September 30 | September 30 2019 | December 31 2018 | September 30 2019 | December 31 2018 | Three Months Ended September 30 | Nine Months Ended September 30 | |||||||||||||||||||||||||||||||||||||||||||||||||||||
| (Dollars in millions) | (Dollars in millions) | 2018 | 2017 | 2018 | 2017 | (Dollars in millions) | 2019 | 2018 | 2019 | 2018 | ||||||||||||||||||||||||||||||||||||||||||||||||||||||
| Core portfolio | Core portfolio | Core portfolio | ||||||||||||||||||||||||||||||||||||||||||||||||||||||||||||||
| Residential mortgage | Residential mortgage | $ | 189,290 | $ | 176,618 | $ | 1,011 | $ | 1,087 | $ | — | $ | (42 | ) | $ | 13 | $ | (40 | ) | Residential mortgage | $ | 216,223 | $ | 193,695 | $ | 930 | $ | 1,010 | $ | (6 | ) | $ | — | $ | (2 | ) | $ | 13 | ||||||||||||||||||||||||||
| Home equity | Home equity | 40,596 | 44,245 | 1,056 | 1,079 | 15 | 26 | 52 | 85 | Home equity | 36,116 | 40,010 | 380 | 955 | 8 | 15 | 39 | 52 | ||||||||||||||||||||||||||||||||||||||||||||||
| Total core portfolio | Total core portfolio | 229,886 | 220,863 | 2,067 | 2,166 | 15 | (16 | ) | 65 | 45 | Total core portfolio | 252,339 | 233,705 | 1,310 | 1,965 | 2 | 15 | 37 | 65 | |||||||||||||||||||||||||||||||||||||||||||||
| Non-core portfolio | Non-core portfolio | Non-core portfolio | ||||||||||||||||||||||||||||||||||||||||||||||||||||||||||||||
| Residential mortgage | Residential mortgage | 18,896 | 27,193 | 1,023 | 1,389 | 12 | (40 | ) | — | (44 | ) | Residential mortgage | 11,249 | 14,862 | 621 | 883 | (32 | ) | 12 | (49 | ) | — | ||||||||||||||||||||||||||||||||||||||||||
| Home equity | Home equity | 10,639 | 13,499 | 1,170 | 1,565 | (35 | ) | 57 | (39 | ) | 112 | Home equity | 5,458 | 8,276 | 205 | 938 | (210 | ) | (35 | ) | (385 | ) | (39 | ) | ||||||||||||||||||||||||||||||||||||||||
| Total non-core portfolio | Total non-core portfolio | 29,535 | 40,692 | 2,193 | 2,954 | (23 | ) | 17 | (39 | ) | 68 | Total non-core portfolio | 16,707 | 23,138 | 826 | 1,821 | (242 | ) | (23 | ) | (434 | ) | (39 | ) | ||||||||||||||||||||||||||||||||||||||||
| Consumer real estate portfolio | Consumer real estate portfolio | Consumer real estate portfolio | ||||||||||||||||||||||||||||||||||||||||||||||||||||||||||||||
| Residential mortgage | Residential mortgage | 208,186 | 203,811 | 2,034 | 2,476 | 12 | (82 | ) | 13 | (84 | ) | Residential mortgage | 227,472 | 208,557 | 1,551 | 1,893 | (38 | ) | 12 | (51 | ) | 13 | ||||||||||||||||||||||||||||||||||||||||||
| Home equity | Home equity | 51,235 | 57,744 | 2,226 | 2,644 | (20 | ) | 83 | 13 | 197 | Home equity | 41,574 | 48,286 | 585 | 1,893 | (202 | ) | (20 | ) | (346 | ) | 13 | ||||||||||||||||||||||||||||||||||||||||||
| Total consumer real estate portfolio | Total consumer real estate portfolio | $ | 259,421 | $ | 261,555 | $ | 4,260 | $ | 5,120 | $ | (8 | ) | $ | 1 | $ | 26 | $ | 113 | Total consumer real estate portfolio | $ | 269,046 | $ | 256,843 | $ | 2,136 | $ | 3,786 | $ | (240 | ) | $ | (8 | ) | $ | (397 | ) | $ | 26 | ||||||||||||||||||||||||||
Allowance for Loan and Lease Losses | Provision for Loan and Lease Losses | Allowance for Loan and Lease Losses | Provision for Loan and Lease Losses | |||||||||||||||||||||||||||||||||||||||||||||||||||||||||||||
| September 30 2018 | December 31 2017 | Three Months Ended September 30 | Nine Months Ended September 30 | September 30 2019 | December 31 2018 | Three Months Ended September 30 | Nine Months Ended September 30 | |||||||||||||||||||||||||||||||||||||||||||||||||||||||||
| 2018 | 2017 | 2018 | 2017 | 2019 | 2018 | 2019 | 2018 | |||||||||||||||||||||||||||||||||||||||||||||||||||||||||
| Core portfolio | Core portfolio | Core portfolio | ||||||||||||||||||||||||||||||||||||||||||||||||||||||||||||||
| Residential mortgage | Residential mortgage | $ | 211 | $ | 218 | $ | (2 | ) | $ | (49 | ) | $ | 7 | $ | (60 | ) | Residential mortgage | $ | 219 | $ | 214 | $ | (4 | ) | $ | (2 | ) | $ | 3 | $ | 7 | |||||||||||||||||||||||||||||||||
| Home equity | Home equity | 264 | 367 | (27 | ) | (10 | ) | (51 | ) | (19 | ) | Home equity | 135 | 228 | (19 | ) | (27 | ) | (52 | ) | (51 | ) | ||||||||||||||||||||||||||||||||||||||||||
| Total core portfolio | Total core portfolio | 475 | 585 | (29 | ) | (59 | ) | (44 | ) | (79 | ) | Total core portfolio | 354 | 442 | (23 | ) | (29 | ) | (49 | ) | (44 | ) | ||||||||||||||||||||||||||||||||||||||||||
| Non-core portfolio | Non-core portfolio | Non-core portfolio | ||||||||||||||||||||||||||||||||||||||||||||||||||||||||||||||
| Residential mortgage | Residential mortgage | 289 | 483 | 22 | (59 | ) | (103 | ) | (111 | ) | Residential mortgage | 122 | 208 | (39 | ) | 22 | (91 | ) | (103 | ) | ||||||||||||||||||||||||||||||||||||||||||||
| Home equity | Home equity | 394 | 652 | (112 | ) | (86 | ) | (221 | ) | (255 | ) | Home equity | 115 | 278 | (250 | ) | (112 | ) | (481 | ) | (221 | ) | ||||||||||||||||||||||||||||||||||||||||||
| Total non-core portfolio | Total non-core portfolio | 683 | 1,135 | (90 | ) | (145 | ) | (324 | ) | (366 | ) | Total non-core portfolio | 237 | 486 | (289 | ) | (90 | ) | (572 | ) | (324 | ) | ||||||||||||||||||||||||||||||||||||||||||
| Consumer real estate portfolio | Consumer real estate portfolio | Consumer real estate portfolio | ||||||||||||||||||||||||||||||||||||||||||||||||||||||||||||||
| Residential mortgage | Residential mortgage | 500 | 701 | 20 | (108 | ) | (96 | ) | (171 | ) | Residential mortgage | 341 | 422 | (43 | ) | 20 | (88 | ) | (96 | ) | ||||||||||||||||||||||||||||||||||||||||||||
| Home equity | Home equity | 658 | 1,019 | (139 | ) | (96 | ) | (272 | ) | (274 | ) | Home equity | 250 | 506 | (269 | ) | (139 | ) | (533 | ) | (272 | ) | ||||||||||||||||||||||||||||||||||||||||||
| Total consumer real estate portfolio | Total consumer real estate portfolio | $ | 1,158 | $ | 1,720 | $ | (119 | ) | $ | (204 | ) | $ | (368 | ) | $ | (445 | ) | Total consumer real estate portfolio | $ | 591 | $ | 928 | $ | (312 | ) | $ | (119 | ) | $ | (621 | ) | $ | (368 | ) | ||||||||||||||||||||||||||||||
(1) | Outstandings and nonperforming loans exclude loans accounted for under the fair value option. Consumer loans accounted for under the fair value option |
Bank of America 28 | ||
| Table 21 | Residential Mortgage – Key Credit Statistics | Residential Mortgage – Key Credit Statistics | ||||||||||||||||||||||||||||||||||||||||||||||||||
Reported Basis (1) | Excluding Purchased Credit-impaired and Fully-insured Loans (1) | Reported Basis (1) | Excluding Fully-insured Loans (1) | |||||||||||||||||||||||||||||||||||||||||||||||||
| (Dollars in millions) | (Dollars in millions) | September 30 2018 | December 31 2017 | September 30 2018 | December 31 2017 | (Dollars in millions) | September 30 2019 | December 31 2018 | September 30 2019 | December 31 2018 | ||||||||||||||||||||||||||||||||||||||||||
| Outstandings | Outstandings | $ | 208,186 | $ | 203,811 | $ | 181,996 | $ | 172,069 | Outstandings | $ | 227,472 | $ | 208,557 | $ | 208,781 | $ | 188,427 | ||||||||||||||||||||||||||||||||||
| Accruing past due 30 days or more | Accruing past due 30 days or more | 4,533 | 5,987 | 1,350 | 1,521 | Accruing past due 30 days or more | 2,989 | 3,945 | 1,070 | 1,155 | ||||||||||||||||||||||||||||||||||||||||||
| Accruing past due 90 days or more | Accruing past due 90 days or more | 2,161 | 3,230 | — | — | Accruing past due 90 days or more | 1,203 | 1,884 | — | — | ||||||||||||||||||||||||||||||||||||||||||
| Nonperforming loans | Nonperforming loans | 2,034 | 2,476 | 2,034 | 2,476 | Nonperforming loans | 1,551 | 1,893 | 1,551 | 1,893 | ||||||||||||||||||||||||||||||||||||||||||
| Percent of portfolio | Percent of portfolio | Percent of portfolio | ||||||||||||||||||||||||||||||||||||||||||||||||||
| Refreshed LTV greater than 90 but less than or equal to 100 | Refreshed LTV greater than 90 but less than or equal to 100 | 2 | % | 3 | % | 2 | % | 2 | % | Refreshed LTV greater than 90 but less than or equal to 100 | 2 | % | 2 | % | 2 | % | 2 | % | ||||||||||||||||||||||||||||||||||
| Refreshed LTV greater than 100 | Refreshed LTV greater than 100 | 1 | 2 | 1 | 1 | Refreshed LTV greater than 100 | 1 | 1 | 1 | 1 | ||||||||||||||||||||||||||||||||||||||||||
| Refreshed FICO below 620 | Refreshed FICO below 620 | 4 | 6 | 2 | 3 | Refreshed FICO below 620 | 3 | 4 | 2 | 2 | ||||||||||||||||||||||||||||||||||||||||||
2006 and 2007 vintages (2) | 2006 and 2007 vintages (2) | 7 | 10 | 6 | 8 | 2006 and 2007 vintages (2) | 4 | 6 | 4 | 6 | ||||||||||||||||||||||||||||||||||||||||||
| Reported Basis | Excluding Purchased Credit-impaired and Fully-insured Loans | |||||||||||||||||||||||||||||||||||||||||||||||||||
| Three Months Ended September 30 | Nine Months Ended September 30 | Three Months Ended September 30 | Nine Months Ended September 30 | |||||||||||||||||||||||||||||||||||||||||||||||||
| 2018 | 2017 | 2018 | 2017 | 2018 | 2017 | 2018 | 2017 | |||||||||||||||||||||||||||||||||||||||||||||
Net charge-off ratio (3) | 0.02 | % | (0.16 | )% | 0.01 | % | (0.06 | )% | 0.03 | % | (0.20 | )% | 0.01 | % | (0.07 | )% | ||||||||||||||||||||||||||||||||||||
(1) | Outstandings, accruing past due, nonperforming loans and percentages of portfolio exclude loans accounted for under the fair value option. |
(2) | These vintages of loans accounted for $ |
| Table 22 | Residential Mortgage State Concentrations | Residential Mortgage State Concentrations | ||||||||||||||||||||||||||||||||||||||||||||||||||||||||||||||
Outstandings (1) | Nonperforming (1) | Net Charge-offs (2) | Outstandings (1) | Nonperforming (1) | Net Charge-offs | |||||||||||||||||||||||||||||||||||||||||||||||||||||||||||
| September 30 2018 | December 31 2017 | September 30 2018 | December 31 2017 | Three Months Ended September 30 | Nine Months Ended September 30 | September 30 2019 | December 31 2018 | September 30 2019 | December 31 2018 | Three Months Ended September 30 | Nine Months Ended September 30 | |||||||||||||||||||||||||||||||||||||||||||||||||||||
| (Dollars in millions) | (Dollars in millions) | 2018 | 2017 | 2018 | 2017 | (Dollars in millions) | 2019 | 2018 | 2019 | 2018 | ||||||||||||||||||||||||||||||||||||||||||||||||||||||
| California | California | $ | 73,127 | $ | 68,455 | $ | 353 | $ | 433 | $ | (1 | ) | $ | (59 | ) | $ | (18 | ) | $ | (84 | ) | California | $ | 85,308 | $ | 76,323 | $ | 294 | $ | 314 | $ | (12 | ) | $ | (1 | ) | $ | (22 | ) | $ | (18 | ) | ||||||||||||||||||||||
New York | New York | 18,669 | 17,239 | 217 | 227 | 4 | (1 | ) | 10 | (2 | ) | New York | 21,444 | 19,219 | 186 | 222 | 1 | 4 | 2 | 10 | ||||||||||||||||||||||||||||||||||||||||||||
Florida | Florida | 11,235 | 10,880 | 249 | 280 | (2 | ) | (9 | ) | (7 | ) | (11 | ) | Florida | 12,494 | 11,624 | 157 | 221 | (8 | ) | (2 | ) | (12 | ) | (7 | ) | ||||||||||||||||||||||||||||||||||||||
| Texas | Texas | 7,658 | 7,237 | 115 | 126 | — | 1 | 3 | 2 | Texas | 8,593 | 7,820 | 76 | 102 | — | — | (1 | ) | 3 | |||||||||||||||||||||||||||||||||||||||||||||
New Jersey | New Jersey | 6,761 | 6,099 | 100 | 130 | — | (1 | ) | 5 | 1 | New Jersey | 8,289 | 7,051 | 83 | 98 | (2 | ) | — | (4 | ) | 5 | |||||||||||||||||||||||||||||||||||||||||||
| Other | Other | 64,546 | 62,159 | 1,000 | 1,280 | 11 | (13 | ) | 20 | 10 | Other | 72,653 | 66,390 | 755 | 936 | (17 | ) | 11 | (14 | ) | 20 | |||||||||||||||||||||||||||||||||||||||||||
Residential mortgage loans | Residential mortgage loans | $ | 181,996 | $ | 172,069 | $ | 2,034 | $ | 2,476 | $ | 12 | $ | (82 | ) | $ | 13 | $ | (84 | ) | Residential mortgage loans | $ | 208,781 | $ | 188,427 | $ | 1,551 | $ | 1,893 | $ | (38 | ) | $ | 12 | $ | (51 | ) | $ | 13 | ||||||||||||||||||||||||||
| Fully-insured loan portfolio | Fully-insured loan portfolio | 20,849 | 23,741 | Fully-insured loan portfolio | 18,691 | 20,130 | ||||||||||||||||||||||||||||||||||||||||||||||||||||||||||
Purchased credit-impaired residential mortgage loan portfolio (5) | 5,341 | 8,001 | ||||||||||||||||||||||||||||||||||||||||||||||||||||||||||||||
| Total residential mortgage loan portfolio | Total residential mortgage loan portfolio | $ | 208,186 | $ | 203,811 | Total residential mortgage loan portfolio | $ | 227,472 | $ | 208,557 | ||||||||||||||||||||||||||||||||||||||||||||||||||||||
(1) | Outstandings and nonperforming loans exclude loans accounted for under the fair value option. |
(2) |
| In these states, foreclosure requires a court order following a legal proceeding (judicial states). |
| Amounts exclude the |
29Bank of America | ||
| Table 23 | Home Equity – Key Credit Statistics | Home Equity – Key Credit Statistics (1) | ||||||||||||||||||||||||||||||||||||||||||
Reported Basis (1) | Excluding Purchased Credit-impaired Loans (1) | |||||||||||||||||||||||||||||||||||||||||||
| (Dollars in millions) | (Dollars in millions) | September 30 2018 | December 31 2017 | September 30 2018 | December 31 2017 | (Dollars in millions) | September 30 2019 | December 31 2018 | ||||||||||||||||||||||||||||||||||||
| Outstandings | Outstandings | $ | 51,235 | $ | 57,744 | $ | 49,424 | $ | 55,028 | Outstandings | $ | 41,574 | $ | 48,286 | ||||||||||||||||||||||||||||||
Accruing past due 30 days or more (2) | Accruing past due 30 days or more (2) | 404 | 502 | 404 | 502 | Accruing past due 30 days or more (2) | 224 | 363 | ||||||||||||||||||||||||||||||||||||
Nonperforming loans (2) | Nonperforming loans (2) | 2,226 | 2,644 | 2,226 | 2,644 | Nonperforming loans (2) | 585 | 1,893 | ||||||||||||||||||||||||||||||||||||
| Percent of portfolio | Percent of portfolio | Percent of portfolio | ||||||||||||||||||||||||||||||||||||||||||
| Refreshed CLTV greater than 90 but less than or equal to 100 | Refreshed CLTV greater than 90 but less than or equal to 100 | 3 | % | 3 | % | 2 | % | 3 | % | Refreshed CLTV greater than 90 but less than or equal to 100 | 2 | % | 2 | % | ||||||||||||||||||||||||||||||
| Refreshed CLTV greater than 100 | Refreshed CLTV greater than 100 | 4 | 5 | 3 | 4 | Refreshed CLTV greater than 100 | 2 | 3 | ||||||||||||||||||||||||||||||||||||
| Refreshed FICO below 620 | Refreshed FICO below 620 | 6 | 6 | 6 | 6 | Refreshed FICO below 620 | 3 | 5 | ||||||||||||||||||||||||||||||||||||
2006 and 2007 vintages (3) | 2006 and 2007 vintages (3) | 25 | 29 | 23 | 27 | 2006 and 2007 vintages (3) | 19 | 22 | ||||||||||||||||||||||||||||||||||||
| Reported Basis | Excluding Purchased Credit-impaired Loans | |||||||||||||||||||||||||||||||||||||||||||
| Three Months Ended September 30 | Nine Months Ended September 30 | Three Months Ended September 30 | Nine Months Ended September 30 | |||||||||||||||||||||||||||||||||||||||||
| 2018 | 2017 | 2018 | 2017 | 2018 | 2017 | 2018 | 2017 | |||||||||||||||||||||||||||||||||||||
Net charge-off ratio (4) | (0.15 | )% | 0.54 | % | 0.03 | % | 0.42 | % | (0.15 | )% | 0.56 | % | 0.03 | % | 0.44 | % | ||||||||||||||||||||||||||||
(1) | Outstandings, accruing past due, nonperforming loans and percentages of the portfolio exclude loans accounted for under the fair value option. |
(2) | Accruing past due 30 days or more include $ |
(3) | These vintages of loans have higher refreshed combined loan-to-value (CLTV) ratios and accounted for |
Bank of America 30 | ||
| Table 24 | Home Equity State Concentrations | Home Equity State Concentrations | ||||||||||||||||||||||||||||||||||||||||||||||||||||||||||||||
Outstandings (1) | Nonperforming (1) | Net Charge-offs (2) | Outstandings (1) | Nonperforming (1) | Net Charge-offs | |||||||||||||||||||||||||||||||||||||||||||||||||||||||||||
| September 30 2018 | December 31 2017 | September 30 2018 | December 31 2017 | Three Months Ended September 30 | Nine Months Ended September 30 | September 30 2019 | December 31 2018 | September 30 2019 | December 31 2018 | Three Months Ended September 30 | Nine Months Ended September 30 | |||||||||||||||||||||||||||||||||||||||||||||||||||||
| (Dollars in millions) | (Dollars in millions) | 2018 | 2017 | 2018 | 2017 | (Dollars in millions) | 2019 | 2018 | 2019 | 2018 | ||||||||||||||||||||||||||||||||||||||||||||||||||||||
| California | California | $ | 13,685 | $ | 15,145 | $ | 650 | $ | 766 | $ | (20 | ) | $ | (9 | ) | $ | (41 | ) | $ | (24 | ) | California | $ | 11,627 | $ | 13,515 | $ | 110 | $ | 536 | $ | (54 | ) | $ | (20 | ) | $ | (109 | ) | $ | (41 | ) | ||||||||||||||||||||||
Florida | Florida | 5,592 | 6,308 | 366 | 411 | (4 | ) | 13 | 9 | 34 | Florida | 4,487 | 5,418 | 77 | 315 | (30 | ) | (4 | ) | (72 | ) | 9 | ||||||||||||||||||||||||||||||||||||||||||
New Jersey | New Jersey | 4,005 | 4,546 | 168 | 191 | 6 | 16 | 20 | 37 | New Jersey | 3,337 | 3,871 | 64 | 150 | (13 | ) | 6 | (11 | ) | 20 | ||||||||||||||||||||||||||||||||||||||||||||
New York | New York | 3,732 | 4,195 | 222 | 252 | 8 | 14 | 16 | 31 | New York | 3,018 | 3,590 | 95 | 194 | (10 | ) | 8 | (4 | ) | 16 | ||||||||||||||||||||||||||||||||||||||||||||
| Massachusetts | Massachusetts | 2,471 | 2,751 | 76 | 92 | (1 | ) | 5 | 2 | 7 | Massachusetts | 2,102 | 2,400 | 35 | 65 | (6 | ) | (1 | ) | (6 | ) | 2 | ||||||||||||||||||||||||||||||||||||||||||
| Other | Other | 19,939 | 22,083 | 744 | 932 | (9 | ) | 44 | 7 | 112 | Other | 17,003 | 19,492 | 204 | 633 | (89 | ) | (9 | ) | (144 | ) | 7 | ||||||||||||||||||||||||||||||||||||||||||
Home equity loans (4) | $ | 49,424 | $ | 55,028 | $ | 2,226 | $ | 2,644 | $ | (20 | ) | $ | 83 | $ | 13 | $ | 197 | |||||||||||||||||||||||||||||||||||||||||||||||
Purchased credit-impaired home equity portfolio (5) | 1,811 | 2,716 | ||||||||||||||||||||||||||||||||||||||||||||||||||||||||||||||
| Total home equity loan portfolio | Total home equity loan portfolio | $ | 51,235 | $ | 57,744 | Total home equity loan portfolio | $ | 41,574 | $ | 48,286 | $ | 585 | $ | 1,893 | $ | (202 | ) | $ | (20 | ) | $ | (346 | ) | $ | 13 | |||||||||||||||||||||||||||||||||||||||
(1) | Outstandings and nonperforming loans exclude loans accounted for under the fair value option. |
(2) |
| In these states, foreclosure requires a court order following a legal proceeding (judicial states). |
| Table 25 | Purchased Credit-impaired Loan Portfolio | ||||||||||||||||||
| Unpaid Principal Balance | Gross Carrying Value | Related Valuation Allowance | Carrying Value Net of Valuation Allowance | Percent of Unpaid Principal Balance | |||||||||||||||
| (Dollars in millions) | September 30, 2018 | ||||||||||||||||||
Residential mortgage (1) | $ | 5,454 | $ | 5,341 | $ | 51 | $ | 5,290 | 96.99 | % | |||||||||
| Home equity | 1,872 | 1,811 | 99 | 1,712 | 91.45 | ||||||||||||||
| Total purchased credit-impaired loan portfolio | $ | 7,326 | $ | 7,152 | $ | 150 | $ | 7,002 | 95.58 | ||||||||||
| December 31, 2017 | |||||||||||||||||||
Residential mortgage (1) | $ | 8,117 | $ | 8,001 | $ | 117 | $ | 7,884 | 97.13 | % | |||||||||
| Home equity | 2,787 | 2,716 | 172 | 2,544 | 91.28 | ||||||||||||||
| Total purchased credit-impaired loan portfolio | $ | 10,904 | $ | 10,717 | $ | 289 | $ | 10,428 | 95.63 | ||||||||||
| Table 26 | U.S. Credit Card State Concentrations | |||||||||||||||||||||||||||||||||||||||||||||||||||||||||||||||
| Table 25 | U.S. Credit Card State Concentrations | |||||||||||||||||||||||||||||||||||||||||||||||||||||||||||||||
| Outstandings | Accruing Past Due 90 Days or More | Net Charge-offs | Outstandings | Accruing Past Due 90 Days or More | Net Charge-offs | |||||||||||||||||||||||||||||||||||||||||||||||||||||||||||
| September 30 2018 | December 31 2017 | September 30 2018 | December 31 2017 | Three Months Ended September 30 | Nine Months Ended September 30 | September 30 2019 | December 31 2018 | September 30 2019 | December 31 2018 | Three Months Ended September 30 | Nine Months Ended September 30 | |||||||||||||||||||||||||||||||||||||||||||||||||||||
| (Dollars in millions) | (Dollars in millions) | 2018 | 2017 | 2018 | 2017 | (Dollars in millions) | 2019 | 2018 | 2019 | 2018 | ||||||||||||||||||||||||||||||||||||||||||||||||||||||
| California | California | $ | 15,304 | $ | 15,254 | $ | 141 | $ | 136 | $ | 119 | $ | 104 | $ | 357 | $ | 303 | California | $ | 15,623 | $ | 16,062 | $ | 164 | $ | 163 | $ | 132 | $ | 119 | $ | 398 | $ | 357 | ||||||||||||||||||||||||||||||
| Florida | Florida | 8,408 | 8,359 | 102 | 94 | 80 | 58 | 248 | 195 | Florida | 8,708 | 8,840 | 121 | 119 | 90 | 80 | 272 | 248 | ||||||||||||||||||||||||||||||||||||||||||||||
| Texas | Texas | 7,448 | 7,451 | 75 | 76 | 54 | 46 | 169 | 143 | Texas | 7,575 | 7,730 | 84 | 84 | 58 | 54 | 180 | 169 | ||||||||||||||||||||||||||||||||||||||||||||||
| New York | New York | 5,886 | 5,977 | 74 | 91 | 66 | 59 | 208 | 155 | New York | 5,866 | 6,066 | 79 | 81 | 63 | 66 | 183 | 208 | ||||||||||||||||||||||||||||||||||||||||||||||
| Washington | Washington | 4,329 | 4,350 | 20 | 20 | 15 | 13 | 47 | 41 | Washington | 4,504 | 4,558 | 25 | 24 | 17 | 15 | 53 | 47 | ||||||||||||||||||||||||||||||||||||||||||||||
| Other | Other | 53,454 | 54,894 | 460 | 483 | 364 | 332 | 1,109 | 1,021 | Other | 52,670 | 55,082 | 487 | 523 | 357 | 364 | 1,138 | 1,109 | ||||||||||||||||||||||||||||||||||||||||||||||
| Total U.S. credit card portfolio | Total U.S. credit card portfolio | $ | 94,829 | $ | 96,285 | $ | 872 | $ | 900 | $ | 698 | $ | 612 | $ | 2,138 | $ | 1,858 | Total U.S. credit card portfolio | $ | 94,946 | $ | 98,338 | $ | 960 | $ | 994 | $ | 717 | $ | 698 | $ | 2,224 | $ | 2,138 | ||||||||||||||||||||||||||||||
| Table 27 | Direct/Indirect State Concentrations | |||||||||||||||||||||||||||||||
| Outstandings | Accruing Past Due 90 Days or More | Net Charge-offs | ||||||||||||||||||||||||||||||
| September 30 2018 | December 31 2017 | September 30 2018 | December 31 2017 | Three Months Ended September 30 | Nine Months Ended September 30 | |||||||||||||||||||||||||||
| (Dollars in millions) | 2018 | 2017 | 2018 | 2017 | ||||||||||||||||||||||||||||
| California | $ | 11,868 | $ | 12,897 | $ | 3 | $ | 3 | $ | 5 | $ | 7 | $ | 16 | $ | 14 | ||||||||||||||||
| Florida | 10,242 | 11,184 | 4 | 5 | 9 | 15 | 28 | 31 | ||||||||||||||||||||||||
| Texas | 9,951 | 10,676 | 6 | 5 | 6 | 13 | 22 | 29 | ||||||||||||||||||||||||
| New York | 6,403 | 6,557 | 2 | 2 | 2 | 2 | 7 | 3 | ||||||||||||||||||||||||
| New Jersey | 3,306 | 3,449 | 1 | 1 | — | — | 2 | 2 | ||||||||||||||||||||||||
| Other | 49,568 | 51,579 | 19 | 24 | 20 | 31 | 67 | 70 | ||||||||||||||||||||||||
| Total direct/indirect loan portfolio | $ | 91,338 | $ | 96,342 | $ | 35 | $ | 40 | $ | 42 | $ | 68 | $ | 142 | $ | 149 | ||||||||||||||||
| Table 26 | Direct/Indirect State Concentrations | |||||||||||||||||||||||||||||||
| Outstandings | Accruing Past Due 90 Days or More | Net Charge-offs | ||||||||||||||||||||||||||||||
| September 30 2019 | December 31 2018 | September 30 2019 | December 31 2018 | Three Months Ended September 30 | Nine Months Ended September 30 | |||||||||||||||||||||||||||
| (Dollars in millions) | 2019 | 2018 | 2019 | 2018 | ||||||||||||||||||||||||||||
| California | $ | 11,942 | $ | 11,734 | $ | 3 | $ | 4 | $ | 32 | $ | 5 | $ | 44 | $ | 16 | ||||||||||||||||
| Florida | 10,099 | 10,240 | 4 | 4 | 5 | 9 | 21 | 28 | ||||||||||||||||||||||||
| Texas | 9,600 | 9,876 | 4 | 6 | 8 | 6 | 23 | 22 | ||||||||||||||||||||||||
| New York | 6,302 | 6,296 | 1 | 2 | 3 | 2 | 9 | 7 | ||||||||||||||||||||||||
| New Jersey | 3,405 | 3,308 | 1 | 1 | 1 | — | 3 | 2 | ||||||||||||||||||||||||
| Other | 49,488 | 49,712 | 16 | 21 | 27 | 20 | 70 | 67 | ||||||||||||||||||||||||
| Total direct/indirect loan portfolio | $ | 90,836 | $ | 91,166 | $ | 29 | $ | 38 | $ | 76 | $ | 42 | $ | 170 | $ | 142 | ||||||||||||||||
| Table 28 | Nonperforming Consumer Loans, Leases and Foreclosed Properties Activity | |||||||||||||||||||||||||||||||
| Table 27 | Nonperforming Consumer Loans, Leases and Foreclosed Properties Activity | |||||||||||||||||||||||||||||||
| Three Months Ended September 30 | Nine Months Ended September 30 | Three Months Ended September 30 | Nine Months Ended September 30 | |||||||||||||||||||||||||||||
| (Dollars in millions) | (Dollars in millions) | 2018 | 2017 | 2018 | 2017 | (Dollars in millions) | 2019 | 2018 | 2019 | 2018 | ||||||||||||||||||||||
| Nonperforming loans and leases, beginning of period | Nonperforming loans and leases, beginning of period | $ | 4,639 | $ | 5,282 | $ | 5,166 | $ | 6,004 | Nonperforming loans and leases, beginning of period | $ | 3,027 | $ | 4,639 | $ | 3,842 | $ | 5,166 | ||||||||||||||
| Additions | Additions | 484 | 999 | 1,895 | 2,499 | Additions | 335 | 484 | 1,116 | 1,895 | ||||||||||||||||||||||
| Reductions: | Reductions: | Reductions: | ||||||||||||||||||||||||||||||
| Paydowns and payoffs | Paydowns and payoffs | (238 | ) | (253 | ) | (744 | ) | (811 | ) | Paydowns and payoffs | (197 | ) | (238 | ) | (580 | ) | (744 | ) | ||||||||||||||
| Sales | Sales | (145 | ) | (162 | ) | (531 | ) | (423 | ) | Sales | (748 | ) | (145 | ) | (1,414 | ) | (531 | ) | ||||||||||||||
Returns to performing status (1) | Returns to performing status (1) | (309 | ) | (347 | ) | (1,009 | ) | (1,101 | ) | Returns to performing status (1) | (185 | ) | (309 | ) | (623 | ) | (1,009 | ) | ||||||||||||||
| Charge-offs | Charge-offs | (89 | ) | (210 | ) | (350 | ) | (551 | ) | Charge-offs | (23 | ) | (89 | ) | (80 | ) | (350 | ) | ||||||||||||||
| Transfers to foreclosed properties | Transfers to foreclosed properties | (36 | ) | (57 | ) | (119 | ) | (167 | ) | Transfers to foreclosed properties | (20 | ) | (36 | ) | (72 | ) | (119 | ) | ||||||||||||||
| Transfers to loans held-for-sale | Transfers to loans held-for-sale | — | — | (2 | ) | (198 | ) | Transfers to loans held-for-sale | — | — | — | (2 | ) | |||||||||||||||||||
| Total net reductions to nonperforming loans and leases | Total net reductions to nonperforming loans and leases | (333 | ) | (30 | ) | (860 | ) | (752 | ) | Total net reductions to nonperforming loans and leases | (838 | ) | (333 | ) | (1,653 | ) | (860 | ) | ||||||||||||||
| Total nonperforming loans and leases, September 30 | Total nonperforming loans and leases, September 30 | 4,306 | 5,252 | 4,306 | 5,252 | Total nonperforming loans and leases, September 30 | 2,189 | 4,306 | 2,189 | 4,306 | ||||||||||||||||||||||
Foreclosed properties, September 30 (2) | Foreclosed properties, September 30 (2) | 265 | 259 | 265 | 259 | Foreclosed properties, September 30 (2) | 188 | 265 | 188 | 265 | ||||||||||||||||||||||
| Nonperforming consumer loans, leases and foreclosed properties, September 30 | Nonperforming consumer loans, leases and foreclosed properties, September 30 | $ | 4,571 | $ | 5,511 | $ | 4,571 | $ | 5,511 | Nonperforming consumer loans, leases and foreclosed properties, September 30 | $ | 2,377 | $ | 4,571 | $ | 2,377 | $ | 4,571 | ||||||||||||||
Nonperforming consumer loans and leases as a percentage of outstanding consumer loans and leases (3) | Nonperforming consumer loans and leases as a percentage of outstanding consumer loans and leases (3) | 0.97 | % | 1.17 | % | Nonperforming consumer loans and leases as a percentage of outstanding consumer loans and leases (3) | 0.48 | % | 0.97 | % | ||||||||||||||||||||||
Nonperforming consumer loans, leases and foreclosed properties as a percentage of outstanding consumer loans, leases and foreclosed properties (3) | Nonperforming consumer loans, leases and foreclosed properties as a percentage of outstanding consumer loans, leases and foreclosed properties (3) | 1.03 | 1.23 | Nonperforming consumer loans, leases and foreclosed properties as a percentage of outstanding consumer loans, leases and foreclosed properties (3) | 0.52 | 1.03 | ||||||||||||||||||||||||||
(1) | Consumer loans may be returned to performing status when all principal and interest is current and full repayment of the remaining contractual principal and interest is expected, or when the loan otherwise becomes well-secured and is in the process of collection. |
(2) | Foreclosed property balances do not include properties insured by certain government-guaranteed loans, principally FHA-insured, of $275 million and $500 million |
(3) | Outstanding consumer loans and leases exclude loans accounted for under the fair value option. |
| Table 29 | Consumer Real Estate Troubled Debt Restructurings | |||||||||||||||||||||||||||||||||||||||||||||||
| Table 28 | Consumer Real Estate Troubled Debt Restructurings | |||||||||||||||||||||||||||||||||||||||||||||||
| September 30, 2018 | December 31, 2017 | September 30, 2019 | December 31, 2018 | |||||||||||||||||||||||||||||||||||||||||||||
| (Dollars in millions) | (Dollars in millions) | Nonperforming | Performing | Total | Nonperforming | Performing | Total | (Dollars in millions) | Nonperforming | Performing | Total | Nonperforming | Performing | Total | ||||||||||||||||||||||||||||||||||
Residential mortgage (1, 2) | Residential mortgage (1, 2) | $ | 1,295 | $ | 5,703 | $ | 6,998 | $ | 1,535 | $ | 8,163 | $ | 9,698 | Residential mortgage (1, 2) | $ | 956 | $ | 4,066 | $ | 5,022 | $ | 1,209 | $ | 4,988 | $ | 6,197 | ||||||||||||||||||||||
Home equity (3) | Home equity (3) | 1,308 | 1,369 | 2,677 | 1,457 | 1,399 | 2,856 | Home equity (3) | 272 | 1,023 | 1,295 | 1,107 | 1,252 | 2,359 | ||||||||||||||||||||||||||||||||||
| Total consumer real estate troubled debt restructurings | Total consumer real estate troubled debt restructurings | $ | 2,603 | $ | 7,072 | $ | 9,675 | $ | 2,992 | $ | 9,562 | $ | 12,554 | Total consumer real estate troubled debt restructurings | $ | 1,228 | $ | 5,089 | $ | 6,317 | $ | 2,316 | $ | 6,240 | $ | 8,556 | ||||||||||||||||||||||
(1) | At September 30, |
(2) | Residential mortgage performing TDRs |
(3) |
Bank of America | ||
| Table 30 | Commercial Credit Exposure by Type | |||||||||||||||||||||||||||||||||||||||||||||||
| Table 29 | Commercial Credit Exposure by Type | |||||||||||||||||||||||||||||||||||||||||||||||
Commercial Utilized (1) | Commercial Unfunded (2, 3, 4) | Total Commercial Committed | Commercial Utilized (1) | Commercial Unfunded (2, 3, 4) | Total Commercial Committed | |||||||||||||||||||||||||||||||||||||||||||
| (Dollars in millions) | (Dollars in millions) | September 30 2018 | December 31 2017 | September 30 2018 | December 31 2017 | September 30 2018 | December 31 2017 | (Dollars in millions) | September 30 2019 | December 31 2018 | September 30 2019 | December 31 2018 | September 30 2019 | December 31 2018 | ||||||||||||||||||||||||||||||||||
Loans and leases | Loans and leases | $ | 489,368 | $ | 487,748 | $ | 369,332 | $ | 364,743 | $ | 858,700 | $ | 852,491 | Loans and leases | $ | 517,234 | $ | 499,664 | $ | 393,361 | $ | 369,282 | $ | 910,595 | $ | 868,946 | ||||||||||||||||||||||
Derivative assets | Derivative assets | 45,617 | 37,762 | — | — | 45,617 | 37,762 | Derivative assets | 45,123 | 43,725 | — | — | 45,123 | 43,725 | ||||||||||||||||||||||||||||||||||
| Standby letters of credit and financial guarantees | Standby letters of credit and financial guarantees | 33,271 | 34,517 | 524 | 863 | 33,795 | 35,380 | Standby letters of credit and financial guarantees | 34,281 | 34,941 | 593 | 491 | 34,874 | 35,432 | ||||||||||||||||||||||||||||||||||
| Debt securities and other investments | Debt securities and other investments | 25,636 | 28,161 | 4,692 | 4,864 | 30,328 | 33,025 | Debt securities and other investments | 23,897 | 25,425 | 5,322 | 4,250 | 29,219 | 29,675 | ||||||||||||||||||||||||||||||||||
| Loans held-for-sale | Loans held-for-sale | 3,737 | 10,257 | 16,171 | 9,742 | 19,908 | 19,999 | Loans held-for-sale | 8,191 | 9,090 | 11,221 | 14,812 | 19,412 | 23,902 | ||||||||||||||||||||||||||||||||||
| Operating leases | Operating leases | 6,476 | 6,060 | — | — | 6,476 | 6,060 | |||||||||||||||||||||||||||||||||||||||||
| Commercial letters of credit | Commercial letters of credit | 1,336 | 1,467 | 296 | 155 | 1,632 | 1,622 | Commercial letters of credit | 1,003 | 1,210 | 408 | 168 | 1,411 | 1,378 | ||||||||||||||||||||||||||||||||||
| Other | Other | 940 | 888 | — | — | 940 | 888 | Other | 965 | 898 | — | — | 965 | 898 | ||||||||||||||||||||||||||||||||||
| Total | $ | 599,905 | $ | 600,800 | $ | 391,015 | $ | 380,367 | $ | 990,920 | $ | 981,167 | Total | $ | 637,170 | $ | 621,013 | $ | 410,905 | $ | 389,003 | $ | 1,048,075 | $ | 1,010,016 | |||||||||||||||||||||||
(1) | Commercial utilized exposure includes loans of $ |
(2) | Commercial unfunded exposure includes commitments accounted for under the fair value option with a notional amount of $ |
(3) | Excludes unused business card lines, which are not legally binding. |
(4) | Includes the notional amount of unfunded legally binding lending commitments net of amounts distributed (i.e., syndicated or participated) to other financial institutions. The distributed amounts were $ |
(5) |
Derivative assets are carried at fair value, reflect the effects of legally enforceable master netting agreements and have been reduced by cash collateral of $ |
| Table 31 | Commercial Credit Quality | |||||||||||||||||||||||||||||||||||||||||||||||
| Table 30 | Commercial Credit Quality | |||||||||||||||||||||||||||||||||||||||||||||||
| Outstandings | Nonperforming | Accruing Past Due 90 Days or More | Outstandings | Nonperforming | Accruing Past Due 90 Days or More | |||||||||||||||||||||||||||||||||||||||||||
| (Dollars in millions) | (Dollars in millions) | September 30 2018 | December 31 2017 | September 30 2018 | December 31 2017 | September 30 2018 | December 31 2017 | (Dollars in millions) | September 30 2019 | December 31 2018 | September 30 2019 | December 31 2018 | September 30 2019 | December 31 2018 | ||||||||||||||||||||||||||||||||||
| Commercial and industrial: | Commercial and industrial: | Commercial and industrial: | ||||||||||||||||||||||||||||||||||||||||||||||
| U.S. commercial | U.S. commercial | $ | 285,662 | $ | 284,836 | $ | 699 | $ | 814 | $ | 114 | $ | 144 | U.S. commercial | $ | 310,982 | $ | 299,277 | $ | 966 | $ | 794 | $ | 338 | $ | 197 | ||||||||||||||||||||||
| Non-U.S. commercial | Non-U.S. commercial | 96,002 | 97,792 | 31 | 299 | — | 3 | Non-U.S. commercial | 101,084 | 98,776 | 51 | 80 | 10 | — | ||||||||||||||||||||||||||||||||||
| Total commercial and industrial | Total commercial and industrial | 381,664 | 382,628 | 730 | 1,113 | 114 | 147 | Total commercial and industrial | 412,066 | 398,053 | 1,017 | 874 | 348 | 197 | ||||||||||||||||||||||||||||||||||
Commercial real estate (1) | Commercial real estate (1) | 60,835 | 58,298 | 46 | 112 | 1 | 4 | Commercial real estate (1) | 62,798 | 60,845 | 185 | 156 | 3 | 4 | ||||||||||||||||||||||||||||||||||
| Commercial lease financing | Commercial lease financing | 21,546 | 22,116 | 14 | 24 | 33 | 19 | Commercial lease financing | 20,107 | 22,534 | 35 | 18 | 22 | 29 | ||||||||||||||||||||||||||||||||||
| 464,045 | 463,042 | 790 | 1,249 | 148 | 170 | 494,971 | 481,432 | 1,237 | 1,048 | 373 | 230 | |||||||||||||||||||||||||||||||||||||
U.S. small business commercial (2) | U.S. small business commercial (2) | 14,234 | 13,649 | 58 | 55 | 73 | 75 | U.S. small business commercial (2) | 15,229 | 14,565 | 50 | 54 | 94 | 84 | ||||||||||||||||||||||||||||||||||
| Commercial loans excluding loans accounted for under the fair value option | Commercial loans excluding loans accounted for under the fair value option | 478,279 | 476,691 | 848 | 1,304 | 221 | 245 | Commercial loans excluding loans accounted for under the fair value option | 510,200 | 495,997 | 1,287 | 1,102 | 467 | 314 | ||||||||||||||||||||||||||||||||||
Loans accounted for under the fair value option (3) | Loans accounted for under the fair value option (3) | 4,976 | 4,782 | — | 43 | — | — | Loans accounted for under the fair value option (3) | 7,034 | 3,667 | — | — | — | — | ||||||||||||||||||||||||||||||||||
| Total commercial loans and leases | Total commercial loans and leases | $ | 483,255 | $ | 481,473 | $ | 848 | $ | 1,347 | $ | 221 | $ | 245 | Total commercial loans and leases | $ | 517,234 | $ | 499,664 | $ | 1,287 | $ | 1,102 | $ | 467 | $ | 314 | ||||||||||||||||||||||
(1) | Includes U.S. commercial real estate of $ |
(2) | Includes card-related products. |
(3) | Commercial loans accounted for under the fair value option include U.S. commercial of $ |
| Table 32 | Commercial Net Charge-offs and Related Ratios | |||||||||||||||||||||||||||||||||||||||||||||||||||||||
| Table 31 | Commercial Net Charge-offs and Related Ratios | |||||||||||||||||||||||||||||||||||||||||||||||||||||||
| Net Charge-offs | Net Charge-off Ratios (1) | Net Charge-offs | Net Charge-off Ratios (1) | |||||||||||||||||||||||||||||||||||||||||||||||||||||
| Three Months Ended September 30 | Nine Months Ended September 30 | Three Months Ended September 30 | Nine Months Ended September 30 | Three Months Ended September 30 | Nine Months Ended September 30 | Three Months Ended September 30 | Nine Months Ended September 30 | |||||||||||||||||||||||||||||||||||||||||||||||||
| (Dollars in millions) | (Dollars in millions) | 2018 | 2017 | 2018 | 2017 | 2018 | 2017 | 2018 | 2017 | (Dollars in millions) | 2019 | 2018 | 2019 | 2018 | 2019 | 2018 | 2019 | 2018 | ||||||||||||||||||||||||||||||||||||||
| Commercial and industrial: | Commercial and industrial: | Commercial and industrial: | ||||||||||||||||||||||||||||||||||||||||||||||||||||||
| U.S. commercial | U.S. commercial | $ | 70 | $ | 80 | $ | 172 | $ | 176 | 0.10 | % | 0.11 | % | 0.08 | % | 0.09 | % | U.S. commercial | $ | 53 | $ | 70 | $ | 202 | $ | 172 | 0.07 | % | 0.10 | % | 0.09 | % | 0.08 | % | ||||||||||||||||||||||
| Non-U.S. commercial | Non-U.S. commercial | 25 | 33 | 48 | 94 | 0.10 | 0.14 | 0.07 | 0.14 | Non-U.S. commercial | 67 | 25 | 115 | 48 | 0.26 | 0.10 | 0.15 | 0.07 | ||||||||||||||||||||||||||||||||||||||
| Total commercial and industrial | Total commercial and industrial | 95 | 113 | 220 | 270 | 0.10 | 0.12 | 0.08 | 0.10 | Total commercial and industrial | 120 | 95 | 317 | 220 | 0.12 | 0.10 | 0.11 | 0.08 | ||||||||||||||||||||||||||||||||||||||
| Commercial real estate | Commercial real estate | 2 | 2 | 3 | 3 | 0.02 | 0.02 | 0.01 | 0.01 | Commercial real estate | (1 | ) | 2 | 8 | 3 | — | 0.02 | 0.02 | 0.01 | |||||||||||||||||||||||||||||||||||||
| Commercial lease financing | Commercial lease financing | — | (1 | ) | — | — | — | (0.02 | ) | — | — | Commercial lease financing | 1 | — | 14 | — | 0.02 | — | 0.09 | — | ||||||||||||||||||||||||||||||||||||
| 97 | 114 | 223 | 273 | 0.08 | 0.10 | 0.06 | 0.08 | 120 | 97 | 339 | 223 | 0.10 | 0.08 | 0.09 | 0.06 | |||||||||||||||||||||||||||||||||||||||||
| U.S. small business commercial | U.S. small business commercial | 59 | 55 | 180 | 160 | 1.67 | 1.61 | 1.72 | 1.60 | U.S. small business commercial | 69 | 59 | 202 | 180 | 1.83 | 1.67 | 1.83 | 1.72 | ||||||||||||||||||||||||||||||||||||||
| Total commercial | Total commercial | $ | 156 | $ | 169 | $ | 403 | $ | 433 | 0.13 | 0.14 | 0.11 | 0.13 | Total commercial | $ | 189 | $ | 156 | $ | 541 | $ | 403 | 0.15 | 0.13 | 0.15 | 0.11 | ||||||||||||||||||||||||||||||
(1) | Net charge-off ratios are calculated as annualized net charge-offs divided by average outstanding loans and leases excluding loans accounted for under the fair value option. |
| Table 33 | Commercial Reservable Criticized Utilized Exposure (1, 2) | |||||||||||||||||||||||||||
| Table 32 | Commercial Reservable Criticized Utilized Exposure (1, 2) | |||||||||||||||||||||||||||
| (Dollars in millions) | (Dollars in millions) | September 30, 2018 | December 31, 2017 | (Dollars in millions) | September 30, 2019 | December 31, 2018 | Commercial and industrial: | |||||||||||||||||||||
| U.S. commercial | U.S. commercial | $ | 8,631 | 2.75 | % | $ | 9,891 | 3.15 | % | U.S. commercial | $ | 8,789 | 2.59 | % | $ | 7,986 | 2.43 | % | ||||||||||
| Non-U.S. commercial | Non-U.S. commercial | 1,298 | 1.27 | 1,766 | 1.70 | Non-U.S. commercial | 1,063 | 0.99 | 1,013 | 0.97 | ||||||||||||||||||
| Total commercial and industrial | Total commercial and industrial | 9,929 | 2.39 | 11,657 | 2.79 | Total commercial and industrial | 9,852 | 2.21 | 8,999 | 2.08 | ||||||||||||||||||
| Commercial real estate | Commercial real estate | 565 | 0.91 | 566 | 0.95 | Commercial real estate | 897 | 1.39 | 936 | 1.50 | ||||||||||||||||||
| Commercial lease financing | Commercial lease financing | 373 | 1.73 | 581 | 2.63 | Commercial lease financing | 349 | 1.74 | 366 | 1.62 | ||||||||||||||||||
| 10,867 | 2.18 | 12,804 | 2.57 | 11,098 | 2.09 | 10,301 | 1.99 | |||||||||||||||||||||
| U.S. small business commercial | U.S. small business commercial | 730 | 5.13 | 759 | 5.56 | U.S. small business commercial | 737 | 4.84 | 760 | 5.22 | ||||||||||||||||||
Total commercial reservable criticized utilized exposure (1) | Total commercial reservable criticized utilized exposure (1) | $ | 11,597 | 2.26 | $ | 13,563 | 2.65 | Total commercial reservable criticized utilized exposure (1) | $ | 11,835 | 2.17 | $ | 11,061 | 2.08 | ||||||||||||||
(1) | Total commercial reservable criticized utilized exposure includes loans and leases of $ |
(2) | Percentages are calculated as commercial reservable criticized utilized exposure divided by total commercial reservable utilized exposure for each exposure category. |
Bank of America | ||
| Table 34 | Outstanding Commercial Real Estate Loans | |||||||||||||||
| Table 33 | Outstanding Commercial Real Estate Loans | |||||||||||||||
| (Dollars in millions) | (Dollars in millions) | September 30 2018 | December 31 2017 | (Dollars in millions) | September 30 2019 | December 31 2018 | ||||||||||
| By Geographic Region | By Geographic Region | By Geographic Region | ||||||||||||||
| California | California | $ | 14,227 | $ | 13,607 | California | $ | 15,227 | $ | 14,002 | ||||||
| Northeast | Northeast | 10,954 | 10,072 | Northeast | 11,558 | 10,895 | ||||||||||
| Southwest | Southwest | 7,374 | 6,970 | Southwest | 7,585 | 7,339 | ||||||||||
| Southeast | Southeast | 5,718 | 5,487 | Southeast | 5,727 | 5,726 | ||||||||||
| Florida | Florida | 4,075 | 3,680 | |||||||||||||
| Midsouth | Midsouth | 3,300 | 2,919 | |||||||||||||
| Midwest | Midwest | 3,916 | 3,769 | Midwest | 3,187 | 3,772 | ||||||||||
| Florida | 3,559 | 3,170 | ||||||||||||||
| Illinois | Illinois | 2,970 | 3,263 | Illinois | 2,917 | 2,989 | ||||||||||
| Midsouth | 2,917 | 2,962 | ||||||||||||||
| Northwest | Northwest | 2,290 | 2,657 | Northwest | 1,847 | 2,178 | ||||||||||
| Non-U.S. | Non-U.S. | 3,937 | 3,538 | Non-U.S. | 4,661 | 4,240 | ||||||||||
Other (1) | Other (1) | 2,973 | 2,803 | Other (1) | 2,714 | 3,105 | ||||||||||
| Total outstanding commercial real estate loans | Total outstanding commercial real estate loans | $ | 60,835 | $ | 58,298 | Total outstanding commercial real estate loans | $ | 62,798 | $ | 60,845 | ||||||
| By Property Type | By Property Type | By Property Type | ||||||||||||||
| Non-residential | Non-residential | Non-residential | ||||||||||||||
| Office | Office | $ | 17,680 | $ | 16,718 | Office | $ | 17,470 | $ | 17,246 | ||||||
| Shopping centers / Retail | Shopping centers / Retail | 8,752 | 8,825 | Shopping centers / Retail | 8,418 | 8,798 | ||||||||||
| Multi-family rental | Multi-family rental | 8,180 | 8,280 | Multi-family rental | 8,035 | 7,762 | ||||||||||
| Industrial / Warehouse | Industrial / Warehouse | 7,495 | 5,379 | |||||||||||||
| Hotels / Motels | Hotels / Motels | 6,944 | 6,344 | Hotels / Motels | 7,012 | 7,248 | ||||||||||
| Industrial / Warehouse | 5,364 | 6,070 | ||||||||||||||
| Unsecured | Unsecured | 3,146 | 2,187 | Unsecured | 2,937 | 2,956 | ||||||||||
| Multi-use | Multi-use | 2,390 | 2,771 | Multi-use | 1,973 | 2,848 | ||||||||||
| Land and land development | 140 | 160 | ||||||||||||||
| Other | Other | 6,642 | 5,485 | Other | 7,853 | 7,029 | ||||||||||
| Total non-residential | Total non-residential | 59,238 | 56,840 | Total non-residential | 61,193 | 59,266 | ||||||||||
| Residential | Residential | 1,597 | 1,458 | Residential | 1,605 | 1,579 | ||||||||||
| Total outstanding commercial real estate loans | Total outstanding commercial real estate loans | $ | 60,835 | $ | 58,298 | Total outstanding commercial real estate loans | $ | 62,798 | $ | 60,845 | ||||||
(1) | Includes unsecured loans to real estate investment trusts and national home builders whose portfolios of properties span multiple geographic regions and properties in the states of Colorado, Utah, Hawaii, Wyoming and Montana. |
35Bank of America | ||
| Table 35 | Nonperforming Commercial Loans, Leases and Foreclosed Properties Activity (1, 2) | |||||||||||||||||||||||||||||||
| Table 34 | Nonperforming Commercial Loans, Leases and Foreclosed Properties Activity (1, 2) | |||||||||||||||||||||||||||||||
| Three Months Ended September 30 | Nine Months Ended September 30 | Three Months Ended September 30 | Nine Months Ended September 30 | |||||||||||||||||||||||||||||
| (Dollars in millions) | (Dollars in millions) | 2018 | 2017 | 2018 | 2017 | (Dollars in millions) | 2019 | 2018 | 2019 | 2018 | ||||||||||||||||||||||
| Nonperforming loans and leases, beginning of period | Nonperforming loans and leases, beginning of period | $ | 1,258 | $ | 1,520 | $ | 1,304 | $ | 1,703 | Nonperforming loans and leases, beginning of period | $ | 1,160 | $ | 1,258 | $ | 1,102 | $ | 1,304 | ||||||||||||||
| Additions | Additions | 235 | 412 | 915 | 1,172 | Additions | 492 | 235 | 1,521 | 915 | ||||||||||||||||||||||
| Reductions: | Reductions: | Reductions: | ||||||||||||||||||||||||||||||
| Paydowns | Paydowns | (287 | ) | (270 | ) | (649 | ) | (803 | ) | Paydowns | (161 | ) | (287 | ) | (479 | ) | (649 | ) | ||||||||||||||
| Sales | Sales | (130 | ) | (61 | ) | (204 | ) | (116 | ) | Sales | (33 | ) | (130 | ) | (193 | ) | (204 | ) | ||||||||||||||
Returns to performing status (3) | Returns to performing status (3) | (95 | ) | (100 | ) | (213 | ) | (240 | ) | Returns to performing status (3) | (48 | ) | (95 | ) | (105 | ) | (213 | ) | ||||||||||||||
| Charge-offs | Charge-offs | (116 | ) | (145 | ) | (276 | ) | (312 | ) | Charge-offs | (123 | ) | (116 | ) | (371 | ) | (276 | ) | ||||||||||||||
| Transfers to foreclosed properties | Transfers to foreclosed properties | (12 | ) | — | (12 | ) | (27 | ) | Transfers to foreclosed properties | — | (12 | ) | (7 | ) | (12 | ) | ||||||||||||||||
| Transfers to loans held-for-sale | Transfers to loans held-for-sale | (5 | ) | (38 | ) | (17 | ) | (59 | ) | Transfers to loans held-for-sale | — | (5 | ) | (181 | ) | (17 | ) | |||||||||||||||
| Total net reductions to nonperforming loans and leases | Total net reductions to nonperforming loans and leases | (410 | ) | (202 | ) | (456 | ) | (385 | ) | Total net reductions to nonperforming loans and leases | 127 | (410 | ) | 185 | (456 | ) | ||||||||||||||||
| Total nonperforming loans and leases, September 30 | Total nonperforming loans and leases, September 30 | 848 | 1,318 | 848 | 1,318 | Total nonperforming loans and leases, September 30 | 1,287 | 848 | 1,287 | 848 | ||||||||||||||||||||||
| Foreclosed properties, September 30 | Foreclosed properties, September 30 | 30 | 40 | 30 | 40 | Foreclosed properties, September 30 | 59 | 30 | 59 | 30 | ||||||||||||||||||||||
| Nonperforming commercial loans, leases and foreclosed properties, September 30 | Nonperforming commercial loans, leases and foreclosed properties, September 30 | $ | 878 | $ | 1,358 | $ | 878 | $ | 1,358 | Nonperforming commercial loans, leases and foreclosed properties, September 30 | $ | 1,346 | $ | 878 | $ | 1,346 | $ | 878 | ||||||||||||||
Nonperforming commercial loans and leases as a percentage of outstanding commercial loans and leases (4) | Nonperforming commercial loans and leases as a percentage of outstanding commercial loans and leases (4) | 0.18 | % | 0.28 | % | Nonperforming commercial loans and leases as a percentage of outstanding commercial loans and leases (4) | 0.25 | % | 0.18 | % | ||||||||||||||||||||||
Nonperforming commercial loans, leases and foreclosed properties as a percentage of outstanding commercial loans, leases and foreclosed properties (4) | Nonperforming commercial loans, leases and foreclosed properties as a percentage of outstanding commercial loans, leases and foreclosed properties (4) | 0.18 | 0.29 | Nonperforming commercial loans, leases and foreclosed properties as a percentage of outstanding commercial loans, leases and foreclosed properties (4) | 0.26 | 0.18 | ||||||||||||||||||||||||||
(1) | Balances do not include nonperforming |
(2) | Includes U.S. small business commercial activity. Small business card loans are excluded as they are not classified as nonperforming. |
(3) | Commercial loans and leases may be returned to performing status when all principal and interest is current and full repayment of the remaining contractual principal and interest is expected, or when the loan otherwise becomes well-secured and is in the process of collection. TDRs are generally classified as performing after a sustained period of demonstrated payment performance. |
(4) | Outstanding commercial loans exclude loans accounted for under the fair value option. |
| Table 36 | Commercial Troubled Debt Restructurings | |||||||||||||||||||||||
| September 30, 2018 | December 31, 2017 | |||||||||||||||||||||||
| (Dollars in millions) | Nonperforming | Performing | Total | Nonperforming | Performing | Total | ||||||||||||||||||
| Commercial and industrial: | ||||||||||||||||||||||||
| U.S. commercial | $ | 285 | $ | 1,058 | $ | 1,343 | $ | 370 | $ | 866 | $ | 1,236 | ||||||||||||
| Non-U.S. commercial | 9 | 204 | 213 | 11 | 219 | 230 | ||||||||||||||||||
| Total commercial and industrial | 294 | 1,262 | 1,556 | 381 | 1,085 | 1,466 | ||||||||||||||||||
| Commercial real estate | 4 | 6 | 10 | 38 | 9 | 47 | ||||||||||||||||||
| Commercial lease financing | 2 | 72 | 74 | 5 | 13 | 18 | ||||||||||||||||||
| 300 | 1,340 | 1,640 | 424 | 1,107 | 1,531 | |||||||||||||||||||
| U.S. small business commercial | 4 | 18 | 22 | 4 | 15 | 19 | ||||||||||||||||||
| Total commercial troubled debt restructurings | $ | 304 | $ | 1,358 | $ | 1,662 | $ | 428 | $ | 1,122 | $ | 1,550 | ||||||||||||
| Table 35 | Commercial Troubled Debt Restructurings | |||||||||||||||||||||||
| September 30, 2019 | December 31, 2018 | |||||||||||||||||||||||
| (Dollars in millions) | Nonperforming | Performing | Total | Nonperforming | Performing | Total | ||||||||||||||||||
| Commercial and industrial: | ||||||||||||||||||||||||
| U.S. commercial | $ | 379 | $ | 1,135 | $ | 1,514 | $ | 306 | $ | 1,092 | $ | 1,398 | ||||||||||||
| Non-U.S. commercial | 51 | 226 | 277 | 78 | 162 | 240 | ||||||||||||||||||
| Total commercial and industrial | 430 | 1,361 | 1,791 | 384 | 1,254 | 1,638 | ||||||||||||||||||
| Commercial real estate | 109 | 79 | 188 | 114 | 6 | 120 | ||||||||||||||||||
| Commercial lease financing | 17 | 35 | 52 | 3 | 68 | 71 | ||||||||||||||||||
| 556 | 1,475 | 2,031 | 501 | 1,328 | 1,829 | |||||||||||||||||||
| U.S. small business commercial | 3 | 25 | 28 | 3 | 18 | 21 | ||||||||||||||||||
| Total commercial troubled debt restructurings | $ | 559 | $ | 1,500 | $ | 2,059 | $ | 504 | $ | 1,346 | $ | 1,850 | ||||||||||||
Bank of America 36 | ||
| Table 37 | Commercial Credit Exposure by Industry (1) | |||||||||||||||||||||||||||||||
| Table 36 | Commercial Credit Exposure by Industry (1) | |||||||||||||||||||||||||||||||
Commercial Utilized | Total Commercial Committed (2) | Commercial Utilized | Total Commercial Committed (2) | |||||||||||||||||||||||||||||
| (Dollars in millions) | (Dollars in millions) | September 30 2018 | December 31 2017 | September 30 2018 | December 31 2017 | (Dollars in millions) | September 30 2019 | December 31 2018 | September 30 2019 | December 31 2018 | ||||||||||||||||||||||
| Asset managers and funds | Asset managers and funds | $ | 68,733 | $ | 59,190 | $ | 103,066 | $ | 91,092 | Asset managers and funds | $ | 73,822 | $ | 71,756 | $ | 109,841 | $ | 107,888 | ||||||||||||||
Real estate (3) | Real estate (3) | 64,460 | 61,940 | 90,664 | 83,773 | Real estate (3) | 70,643 | 65,328 | 93,625 | 86,514 | ||||||||||||||||||||||
| Capital goods | Capital goods | 40,327 | 36,705 | 74,720 | 70,417 | Capital goods | 41,651 | 39,192 | 79,308 | 75,080 | ||||||||||||||||||||||
| Finance companies | Finance companies | 37,502 | 36,662 | 59,923 | 56,659 | |||||||||||||||||||||||||||
| Healthcare equipment and services | Healthcare equipment and services | 34,563 | 35,763 | 56,649 | 56,489 | |||||||||||||||||||||||||||
| Government and public education | Government and public education | 44,436 | 48,684 | 55,296 | 58,067 | Government and public education | 42,802 | 43,675 | 54,177 | 54,749 | ||||||||||||||||||||||
| Healthcare equipment and services | 34,943 | 37,780 | 54,889 | 57,256 | ||||||||||||||||||||||||||||
| Finance companies | 33,549 | 34,050 | 53,375 | 53,107 | ||||||||||||||||||||||||||||
| Materials | Materials | 25,727 | 24,001 | 49,461 | 47,386 | Materials | 27,647 | 27,347 | 52,293 | 51,865 | ||||||||||||||||||||||
| Retailing | Retailing | 25,714 | 26,117 | 47,823 | 48,796 | Retailing | 27,354 | 25,333 | 48,874 | 47,507 | ||||||||||||||||||||||
| Consumer services | Consumer services | 25,959 | 25,702 | 46,335 | 43,298 | |||||||||||||||||||||||||||
| Food, beverage and tobacco | Food, beverage and tobacco | 23,199 | 23,252 | 45,166 | 42,815 | Food, beverage and tobacco | 23,587 | 23,586 | 44,609 | 42,745 | ||||||||||||||||||||||
| Consumer services | 24,975 | 27,191 | 42,276 | 43,605 | ||||||||||||||||||||||||||||
| Commercial services and supplies | Commercial services and supplies | 21,861 | 22,100 | 37,644 | 35,496 | Commercial services and supplies | 22,328 | 22,623 | 37,855 | 39,349 | ||||||||||||||||||||||
| Energy | Energy | 16,319 | 16,345 | 34,462 | 36,765 | Energy | 15,660 | 13,727 | 35,750 | 32,279 | ||||||||||||||||||||||
| Transportation | Transportation | 21,887 | 21,704 | 30,694 | 29,946 | Transportation | 25,440 | 22,814 | 34,638 | 31,523 | ||||||||||||||||||||||
| Utilities | Utilities | 11,938 | 12,035 | 28,899 | 27,623 | |||||||||||||||||||||||||||
| Pharmaceuticals and biotechnology | Pharmaceuticals and biotechnology | 6,261 | 7,430 | 27,051 | 23,634 | |||||||||||||||||||||||||||
| Individuals and trusts | Individuals and trusts | 18,887 | 18,643 | 26,303 | 25,019 | |||||||||||||||||||||||||||
| Global commercial banks | Global commercial banks | 23,602 | 26,583 | 25,687 | 28,627 | |||||||||||||||||||||||||||
| Technology hardware and equipment | Technology hardware and equipment | 11,287 | 13,014 | 25,379 | 26,228 | |||||||||||||||||||||||||||
| Media | Media | 10,581 | 19,155 | 28,523 | 33,955 | Media | 13,285 | 12,132 | 23,645 | 24,502 | ||||||||||||||||||||||
| Global commercial banks | 25,471 | 29,491 | 27,752 | 31,764 | ||||||||||||||||||||||||||||
| Utilities | 11,496 | 11,342 | 27,495 | 27,935 | ||||||||||||||||||||||||||||
| Individuals and trusts | 18,706 | 18,549 | 25,332 | 25,097 | ||||||||||||||||||||||||||||
| Technology hardware and equipment | 10,054 | 10,728 | 21,759 | 22,071 | ||||||||||||||||||||||||||||
| Pharmaceuticals and biotechnology | 7,430 | 5,653 | 19,396 | 18,623 | ||||||||||||||||||||||||||||
| Consumer durables and apparel | Consumer durables and apparel | 10,174 | 9,904 | 21,459 | 20,199 | |||||||||||||||||||||||||||
| Vehicle dealers | Vehicle dealers | 15,930 | 16,896 | 19,128 | 20,361 | Vehicle dealers | 17,332 | 17,603 | 20,580 | 20,446 | ||||||||||||||||||||||
| Consumer durables and apparel | 9,432 | 8,859 | 18,129 | 17,296 | ||||||||||||||||||||||||||||
| Software and services | Software and services | 7,489 | 8,562 | 16,558 | 18,202 | Software and services | 10,257 | 8,809 | 20,098 | 19,172 | ||||||||||||||||||||||
| Telecommunication services | Telecommunication services | 8,580 | 8,686 | 15,980 | 14,166 | |||||||||||||||||||||||||||
| Automobiles and components | Automobiles and components | 6,990 | 5,988 | 14,271 | 13,318 | Automobiles and components | 8,033 | 7,131 | 15,176 | 13,893 | ||||||||||||||||||||||
| Financial markets infrastructure (clearinghouses) | Financial markets infrastructure (clearinghouses) | 11,864 | 8,317 | 14,316 | 10,042 | |||||||||||||||||||||||||||
| Insurance | Insurance | 5,818 | 6,411 | 13,785 | 12,990 | Insurance | 6,966 | 8,674 | 13,804 | 15,807 | ||||||||||||||||||||||
| Telecommunication services | 6,837 | 6,389 | 12,786 | 13,108 | ||||||||||||||||||||||||||||
| Food and staples retailing | Food and staples retailing | 4,840 | 4,955 | 10,100 | 15,589 | Food and staples retailing | 5,642 | 4,787 | 9,871 | 9,093 | ||||||||||||||||||||||
| Religious and social organizations | Religious and social organizations | 3,705 | 4,454 | 5,586 | 6,318 | Religious and social organizations | 4,104 | 3,757 | 5,950 | 5,620 | ||||||||||||||||||||||
| Financial markets infrastructure (clearinghouses) | 1,111 | 688 | 2,906 | 2,403 | ||||||||||||||||||||||||||||
| Other | 7,885 | 3,621 | 7,878 | 3,616 | ||||||||||||||||||||||||||||
| Total commercial credit exposure by industry | Total commercial credit exposure by industry | $ | 599,905 | $ | 600,800 | $ | 990,920 | $ | 981,167 | Total commercial credit exposure by industry | $ | 637,170 | $ | 621,013 | $ | 1,048,075 | $ | 1,010,016 | ||||||||||||||
Net credit default protection purchased on total commitments (4) | Net credit default protection purchased on total commitments (4) | $ | (2,197 | ) | $ | (2,129 | ) | Net credit default protection purchased on total commitments (4) | $ | (3,858 | ) | $ | (2,663 | ) | ||||||||||||||||||
(1) | Includes U.S. small business commercial exposure. |
(2) | Includes the notional amount of unfunded legally binding lending commitments net of amounts distributed (i.e., syndicated or participated) to other financial institutions. The distributed amounts were $ |
(3) | Industries are viewed from a variety of perspectives to best isolate the perceived risks. For purposes of this table, the real estate industry is defined based on the primary business activity of the borrowers or counterparties using operating cash flows and primary source of repayment as key factors. |
(4) | Represents net notional credit protection |
| Table 37 | Net Credit Default Protection by Maturity | |||||
| September 30 2019 | December 31 2018 | |||||
| Less than or equal to one year | 37 | % | 20 | % | ||
| Greater than one year and less than or equal to five years | 42 | 78 | ||||
| Greater than five years | 21 | 2 | ||||
| Total net credit default protection | 100 | % | 100 | % | ||
| Table 38 | Net Credit Default Protection by Maturity | |||||
| September 30 2018 | December 31 2017 | |||||
| Less than or equal to one year | 33 | % | 42 | % | ||
| Greater than one year and less than or equal to five years | 61 | 58 | ||||
| Greater than five years | 6 | — | ||||
| Total net credit default protection | 100 | % | 100 | % | ||
37Bank of America | ||
| Table 39 | Net Credit Default Protection by Credit Exposure Debt Rating | |||||||||||||
Net Notional (1) | Percent of Total | Net Notional (1) | Percent of Total | |||||||||||
| (Dollars in millions) | September 30, 2018 | December 31, 2017 | ||||||||||||
Ratings (2, 3) | ||||||||||||||
| A | $ | (546 | ) | 24.9 | % | $ | (280 | ) | 13.2 | % | ||||
| BBB | (259 | ) | 11.8 | (459 | ) | 21.6 | ||||||||
| BB | (794 | ) | 36.1 | (893 | ) | 41.9 | ||||||||
| B | (373 | ) | 17.0 | (403 | ) | 18.9 | ||||||||
| CCC and below | (198 | ) | 9.0 | (84 | ) | 3.9 | ||||||||
NR (4) | (27 | ) | 1.2 | (10 | ) | 0.5 | ||||||||
| Total net credit default protection | $ | (2,197 | ) | 100.0 | % | $ | (2,129 | ) | 100.0 | % | ||||
| Table 38 | Net Credit Default Protection by Credit Exposure Debt Rating | |||||||||||||
Net Notional (1) | Percent of Total | Net Notional (1) | Percent of Total | |||||||||||
| (Dollars in millions) | September 30, 2019 | December 31, 2018 | ||||||||||||
Ratings (2, 3) | ||||||||||||||
| A | $ | (612 | ) | 15.9 | % | $ | (700 | ) | 26.3 | % | ||||
| BBB | (1,177 | ) | 30.5 | (501 | ) | 18.8 | ||||||||
| BB | (800 | ) | 20.7 | (804 | ) | 30.2 | ||||||||
| B | (523 | ) | 13.6 | (422 | ) | 15.8 | ||||||||
| CCC and below | (85 | ) | 2.2 | (205 | ) | 7.7 | ||||||||
NR (4) | (661 | ) | 17.1 | (31 | ) | 1.2 | ||||||||
Total net credit default protection | $ | (3,858 | ) | 100.0 | % | $ | (2,663 | ) | 100.0 | % | ||||
(1) | Represents net credit default protection purchased. |
(2) | Ratings are refreshed on a quarterly basis. |
(3) | Ratings of BBB- or higher are considered to meet the definition of investment grade. |
(4) | NR is comprised of index positions held and any names that have not been rated. |
| Table 40 | Credit Derivatives | |||||||
| Contract/ Notional | Credit Risk | |||||||
| (Dollars in billions) | September 30, 2018 | |||||||
| Purchased credit derivatives: | ||||||||
| Credit default swaps | $ | 430.3 | $ | 2.2 | ||||
| Total return swaps/options | 64.6 | 0.5 | ||||||
| Total purchased credit derivatives | $ | 494.9 | $ | 2.7 | ||||
| Written credit derivatives: | ||||||||
| Credit default swaps | $ | 398.2 | n/a | |||||
| Total return swaps/options | 62.5 | n/a | ||||||
| Total written credit derivatives | $ | 460.7 | n/a | |||||
| December 31, 2017 | ||||||||
| Purchased credit derivatives: | ||||||||
| Credit default swaps | $ | 470.9 | $ | 2.4 | ||||
| Total return swaps/options | 54.1 | 0.3 | ||||||
| Total purchased credit derivatives | $ | 525.0 | $ | 2.7 | ||||
| Written credit derivatives: | ||||||||
| Credit default swaps | $ | 448.2 | n/a | |||||
| Total return swaps/options | 55.2 | n/a | ||||||
| Total written credit derivatives | $ | 503.4 | n/a | |||||
| Table 41 | Top 20 Non-U.S. Countries Exposure | |||||||||||||||||||||||||||||||||||||||||||||||||||||||||||||||
| Table 39 | Top 20 Non-U.S. Countries Exposure | |||||||||||||||||||||||||||||||||||||||||||||||||||||||||||||||
| (Dollars in millions) | (Dollars in millions) | Funded Loans and Loan Equivalents | Unfunded Loan Commitments | Net Counterparty Exposure | Securities/ Other Investments | Country Exposure at September 30 2018 | Hedges and Credit Default Protection | Net Country Exposure at September 30 2018 | Increase (Decrease) from December 31 2017 | (Dollars in millions) | Funded Loans and Loan Equivalents | Unfunded Loan Commitments | Net Counterparty Exposure | Securities/ Other Investments | Country Exposure at September 30 2019 | Hedges and Credit Default Protection | Net Country Exposure at September 30 2019 | Increase (Decrease) from December 31 2018 | ||||||||||||||||||||||||||||||||||||||||||||||
| United Kingdom | United Kingdom | $ | 39,114 | $ | 15,034 | $ | 5,601 | $ | 1,111 | $ | 60,860 | $ | (3,757 | ) | $ | 57,103 | $ | 19,508 | United Kingdom | $ | 32,387 | $ | 16,610 | $ | 7,154 | $ | 2,506 | $ | 58,657 | $ | (3,107 | ) | $ | 55,550 | $ | 696 | ||||||||||||||||||||||||||||
| Germany | Germany | 26,417 | 6,278 | 2,428 | 789 | 35,912 | (3,499 | ) | 32,413 | 10,910 | Germany | 21,600 | 7,190 | 1,992 | 1,133 | 31,915 | (5,826 | ) | 26,089 | (2,568 | ) | |||||||||||||||||||||||||||||||||||||||||||
| Japan | Japan | 17,109 | 2,280 | 1,397 | 2,781 | 23,567 | (1,418 | ) | 22,149 | 13,059 | Japan | 18,774 | 879 | 1,591 | 1,441 | 22,685 | (1,403 | ) | 21,282 | 1,259 | ||||||||||||||||||||||||||||||||||||||||||||
| Canada | Canada | 7,515 | 6,944 | 1,669 | 2,682 | 18,810 | (462 | ) | 18,348 | (375 | ) | Canada | 7,774 | 7,829 | 1,298 | 3,336 | 20,237 | (680 | ) | 19,557 | 42 | |||||||||||||||||||||||||||||||||||||||||||
| France | France | 6,654 | 5,590 | 2,935 | 3,347 | 18,526 | (3,429 | ) | 15,097 | 4,554 | France | 7,631 | 7,386 | 1,255 | 2,802 | 19,074 | (2,650 | ) | 16,424 | 3,773 | ||||||||||||||||||||||||||||||||||||||||||||
| China | China | 12,307 | 377 | 1,096 | 866 | 14,646 | (292 | ) | 14,354 | (1,571 | ) | China | 12,167 | 495 | 1,304 | 919 | 14,885 | (357 | ) | 14,528 | (113 | ) | ||||||||||||||||||||||||||||||||||||||||||
| India | India | 7,786 | 538 | 467 | 4,058 | 12,849 | (224 | ) | 12,625 | 1,513 | ||||||||||||||||||||||||||||||||||||||||||||||||||||||
| Brazil | Brazil | 7,610 | 663 | 201 | 3,689 | 12,163 | (420 | ) | 11,743 | 1,494 | ||||||||||||||||||||||||||||||||||||||||||||||||||||||
| Australia | Australia | 6,031 | 3,024 | 603 | 1,735 | 11,393 | (377 | ) | 11,016 | 1,086 | ||||||||||||||||||||||||||||||||||||||||||||||||||||||
| Netherlands | Netherlands | 7,220 | 2,044 | 817 | 1,306 | 11,387 | (922 | ) | 10,465 | 1,998 | Netherlands | 6,510 | 3,435 | 498 | 1,193 | 11,636 | (992 | ) | 10,644 | (933 | ) | |||||||||||||||||||||||||||||||||||||||||||
| Australia | 5,188 | 3,524 | 589 | 1,550 | 10,851 | (612 | ) | 10,239 | (350 | ) | ||||||||||||||||||||||||||||||||||||||||||||||||||||||
| Brazil | 6,779 | 811 | 326 | 2,323 | 10,239 | (391 | ) | 9,848 | (868 | ) | ||||||||||||||||||||||||||||||||||||||||||||||||||||||
| India | 6,656 | 513 | 343 | 2,205 | 9,717 | (104 | ) | 9,613 | (884 | ) | ||||||||||||||||||||||||||||||||||||||||||||||||||||||
| Switzerland | Switzerland | 5,627 | 3,051 | 331 | 237 | 9,246 | (644 | ) | 8,602 | 838 | ||||||||||||||||||||||||||||||||||||||||||||||||||||||
| South Korea | South Korea | 5,561 | 613 | 684 | 1,554 | 8,412 | (284 | ) | 8,128 | 227 | South Korea | 6,018 | 604 | 389 | 1,762 | 8,773 | (196 | ) | 8,577 | (593 | ) | |||||||||||||||||||||||||||||||||||||||||||
| Hong Kong | Hong Kong | 6,144 | 216 | 475 | 1,289 | 8,124 | (34 | ) | 8,090 | (588 | ) | Hong Kong | 5,645 | 257 | 327 | 1,218 | 7,447 | (32 | ) | 7,415 | 179 | |||||||||||||||||||||||||||||||||||||||||||
| Switzerland | 4,752 | 3,128 | 331 | 199 | 8,410 | (1,030 | ) | 7,380 | 1,583 | |||||||||||||||||||||||||||||||||||||||||||||||||||||||
| Singapore | Singapore | 3,305 | 142 | 602 | 1,739 | 5,788 | (71 | ) | 5,717 | (546 | ) | Singapore | 4,031 | 223 | 456 | 2,591 | 7,301 | (53 | ) | 7,248 | 1,731 | |||||||||||||||||||||||||||||||||||||||||||
| Mexico | Mexico | 3,349 | 1,450 | 99 | 684 | 5,582 | (151 | ) | 5,431 | (56 | ) | Mexico | 4,023 | 1,876 | 260 | 1,041 | 7,200 | (185 | ) | 7,015 | 779 | |||||||||||||||||||||||||||||||||||||||||||
| Belgium | Belgium | 3,444 | 1,029 | 124 | 407 | 5,004 | (509 | ) | 4,495 | 530 | Belgium | 4,556 | 1,093 | 216 | 215 | 6,080 | (214 | ) | 5,866 | 288 | ||||||||||||||||||||||||||||||||||||||||||||
| Spain | Spain | 4,076 | 1,314 | 155 | 796 | 6,341 | (950 | ) | 5,391 | 741 | ||||||||||||||||||||||||||||||||||||||||||||||||||||||
| United Arab Emirates | United Arab Emirates | 2,895 | 154 | 142 | 107 | 3,298 | (17 | ) | 3,281 | (106 | ) | United Arab Emirates | 3,082 | 226 | 130 | 102 | 3,540 | (33 | ) | 3,507 | (142 | ) | ||||||||||||||||||||||||||||||||||||||||||
| Spain | 2,470 | 990 | 144 | 860 | 4,464 | (1,379 | ) | 3,085 | (23 | ) | ||||||||||||||||||||||||||||||||||||||||||||||||||||||
| Taiwan | 1,741 | 13 | 405 | 597 | 2,756 | — | 2,756 | 44 | ||||||||||||||||||||||||||||||||||||||||||||||||||||||||
| Italy | Italy | 2,256 | 1,007 | 615 | 527 | 4,405 | (1,679 | ) | 2,726 | (1,520 | ) | Italy | 2,310 | 1,486 | 589 | 542 | 4,927 | (1,450 | ) | 3,477 | 396 | |||||||||||||||||||||||||||||||||||||||||||
| Sweden | Sweden | 1,572 | 705 | 268 | 245 | 2,790 | (274 | ) | 2,516 | 476 | ||||||||||||||||||||||||||||||||||||||||||||||||||||||
| Total top 20 non-U.S. countries exposure | Total top 20 non-U.S. countries exposure | $ | 170,876 | $ | 52,137 | $ | 20,822 | $ | 26,923 | $ | 270,758 | $ | (20,040 | ) | $ | 250,718 | $ | 45,526 | Total top 20 non-U.S. countries exposure | $ | 169,210 | $ | 58,884 | $ | 19,484 | $ | 31,561 | $ | 279,139 | $ | (20,067 | ) | $ | 259,072 | $ | 10,942 | ||||||||||||||||||||||||||||
| Table 42 | Allowance for Credit Losses | |||||||||||||||
| Three Months Ended September 30 | Nine Months Ended September 30 | |||||||||||||||
| (Dollars in millions) | 2018 | 2017 | 2018 | 2017 | ||||||||||||
| Allowance for loan and lease losses, beginning of period | $ | 10,050 | $ | 10,875 | $ | 10,393 | $ | 11,237 | ||||||||
| Loans and leases charged off | ||||||||||||||||
| Residential mortgage | (45 | ) | (51 | ) | (137 | ) | (157 | ) | ||||||||
| Home equity | (110 | ) | (180 | ) | (329 | ) | (476 | ) | ||||||||
| U.S. credit card | (826 | ) | (727 | ) | (2,515 | ) | (2,198 | ) | ||||||||
Non-U.S. credit card (1) | — | — | — | (103 | ) | |||||||||||
| Direct/Indirect consumer | (120 | ) | (136 | ) | (376 | ) | (358 | ) | ||||||||
| Other consumer | (46 | ) | (56 | ) | (140 | ) | (160 | ) | ||||||||
| Total consumer charge-offs | (1,147 | ) | (1,150 | ) | (3,497 | ) | (3,452 | ) | ||||||||
U.S. commercial (2) | (161 | ) | (171 | ) | (437 | ) | (449 | ) | ||||||||
| Non-U.S. commercial | (25 | ) | (34 | ) | (61 | ) | (100 | ) | ||||||||
| Commercial real estate | (2 | ) | (4 | ) | (9 | ) | (12 | ) | ||||||||
| Commercial lease financing | (1 | ) | (3 | ) | (6 | ) | (9 | ) | ||||||||
| Total commercial charge-offs | (189 | ) | (212 | ) | (513 | ) | (570 | ) | ||||||||
| Total loans and leases charged off | (1,336 | ) | (1,362 | ) | (4,010 | ) | (4,022 | ) | ||||||||
| Recoveries of loans and leases previously charged off | ||||||||||||||||
| Residential mortgage | 33 | 133 | 124 | 241 | ||||||||||||
| Home equity | 130 | 97 | 316 | 279 | ||||||||||||
| U.S. credit card | 128 | 115 | 377 | 340 | ||||||||||||
Non-U.S. credit card (1) | — | — | — | 28 | ||||||||||||
| Direct/Indirect consumer | 78 | 68 | 234 | 209 | ||||||||||||
| Other consumer | 2 | 6 | 10 | 46 | ||||||||||||
| Total consumer recoveries | 371 | 419 | 1,061 | 1,143 | ||||||||||||
U.S. commercial (3) | 32 | 36 | 85 | 113 | ||||||||||||
| Non-U.S. commercial | — | 1 | 13 | 6 | ||||||||||||
| Commercial real estate | — | 2 | 6 | 9 | ||||||||||||
| Commercial lease financing | 1 | 4 | 6 | 9 | ||||||||||||
| Total commercial recoveries | 33 | 43 | 110 | 137 | ||||||||||||
| Total recoveries of loans and leases previously charged off | 404 | 462 | 1,171 | 1,280 | ||||||||||||
| Net charge-offs | (932 | ) | (900 | ) | (2,839 | ) | (2,742 | ) | ||||||||
| Write-offs of PCI loans | (95 | ) | (73 | ) | (166 | ) | (161 | ) | ||||||||
| Provision for loan and lease losses | 711 | 829 | 2,362 | 2,395 | ||||||||||||
Other (4) | — | (38 | ) | (16 | ) | (36 | ) | |||||||||
| Allowance for loan and lease losses, September 30 | 9,734 | 10,693 | 9,734 | 10,693 | ||||||||||||
| Reserve for unfunded lending commitments, beginning of period | 787 | 757 | 777 | 762 | ||||||||||||
| Provision for unfunded lending commitments | 5 | 5 | 15 | — | ||||||||||||
| Reserve for unfunded lending commitments, September 30 | 792 | 762 | 792 | 762 | ||||||||||||
| Allowance for credit losses, September 30 | $ | 10,526 | $ | 11,455 | $ | 10,526 | $ | 11,455 | ||||||||
| Table 42 | Allowance for Credit Losses (continued) | |||||||||||||||
| Three Months Ended September 30 | Nine Months Ended September 30 | |||||||||||||||
| (Dollars in millions) | 2018 | 2017 | 2018 | 2017 | ||||||||||||
| Loan and allowance ratios: | ||||||||||||||||
Loans and leases outstanding at September 30 (5) | $ | 924,070 | $ | 920,832 | $ | 924,070 | $ | 920,832 | ||||||||
Allowance for loan and lease losses as a percentage of total loans and leases outstanding at September 30 (5) | 1.05 | % | 1.16 | % | 1.05 | % | 1.16 | % | ||||||||
Consumer allowance for loan and lease losses as a percentage of total consumer loans and leases outstanding at September 30 (6) | 1.12 | 1.25 | 1.12 | 1.25 | ||||||||||||
Commercial allowance for loan and lease losses as a percentage of total commercial loans and leases outstanding at September 30 (7) | 0.99 | 1.08 | 0.99 | 1.08 | ||||||||||||
Average loans and leases outstanding (5) | $ | 925,091 | $ | 911,945 | $ | 926,664 | $ | 908,670 | ||||||||
Annualized net charge-offs as a percentage of average loans and leases outstanding (5, 8) | 0.40 | % | 0.39 | % | 0.41 | % | 0.40 | % | ||||||||
Annualized net charge-offs and PCI write-offs as a percentage of average loans and leases outstanding (5) | 0.44 | 0.42 | 0.43 | 0.43 | ||||||||||||
Allowance for loan and lease losses as a percentage of total nonperforming loans and leases at September 30 (5) | 189 | 163 | 189 | 163 | ||||||||||||
Ratio of the allowance for loan and lease losses at September 30 to annualized net charge-offs (8) | 2.63 | 3.00 | 2.56 | 2.92 | ||||||||||||
| Ratio of the allowance for loan and lease losses at September 30 to annualized net charge-offs and PCI write-offs | 2.39 | 2.77 | 2.42 | 2.76 | ||||||||||||
Amounts included in allowance for loan and lease losses for loans and leases that are excluded from nonperforming loans and leases at September 30 (9) | $ | 4,027 | $ | 3,880 | $ | 4,027 | $ | 3,880 | ||||||||
Allowance for loan and lease losses as a percentage of total nonperforming loans and leases, excluding the allowance for loan and lease losses for loans and leases that are excluded from nonperforming loans and leases at September 30 (5, 9) | 111 | % | 104 | % | 111 | % | 104 | % | ||||||||
| Table 40 | Allowance for Credit Losses | |||||||||||||||
| Three Months Ended September 30 | Nine Months Ended September 30 | |||||||||||||||
| (Dollars in millions) | 2019 | 2018 | 2019 | 2018 | ||||||||||||
| Allowance for loan and lease losses, beginning of period | $ | 9,527 | $ | 10,050 | $ | 9,601 | $ | 10,393 | ||||||||
| Loans and leases charged off | ||||||||||||||||
| Residential mortgage | (28 | ) | (45 | ) | (69 | ) | (137 | ) | ||||||||
| Home equity | (171 | ) | (110 | ) | (386 | ) | (329 | ) | ||||||||
| U.S. credit card | (865 | ) | (826 | ) | (2,659 | ) | (2,515 | ) | ||||||||
| Direct/Indirect consumer | (157 | ) | (120 | ) | (403 | ) | (376 | ) | ||||||||
| Other consumer | (71 | ) | (46 | ) | (163 | ) | (140 | ) | ||||||||
| Total consumer charge-offs | (1,292 | ) | (1,147 | ) | (3,680 | ) | (3,497 | ) | ||||||||
U.S. commercial (1) | (151 | ) | (161 | ) | (486 | ) | (437 | ) | ||||||||
| Non-U.S. commercial | (66 | ) | (25 | ) | (115 | ) | (61 | ) | ||||||||
| Commercial real estate | — | (2 | ) | (10 | ) | (9 | ) | |||||||||
| Commercial lease financing | (3 | ) | (1 | ) | (19 | ) | (6 | ) | ||||||||
| Total commercial charge-offs | (220 | ) | (189 | ) | (630 | ) | (513 | ) | ||||||||
| Total loans and leases charged off | (1,512 | ) | (1,336 | ) | (4,310 | ) | (4,010 | ) | ||||||||
| Recoveries of loans and leases previously charged off | ||||||||||||||||
| Residential mortgage | 66 | 33 | 120 | 124 | ||||||||||||
| Home equity | 373 | 130 | 732 | 316 | ||||||||||||
| U.S. credit card | 148 | 128 | 435 | 377 | ||||||||||||
| Direct/Indirect consumer | 81 | 78 | 233 | 234 | ||||||||||||
| Other consumer | 2 | 2 | 12 | 10 | ||||||||||||
| Total consumer recoveries | 670 | 371 | 1,532 | 1,061 | ||||||||||||
U.S. commercial (2) | 29 | 32 | 82 | 85 | ||||||||||||
| Non-U.S. commercial | (1 | ) | — | — | 13 | |||||||||||
| Commercial real estate | 1 | — | 2 | 6 | ||||||||||||
| Commercial lease financing | 2 | 1 | 5 | 6 | ||||||||||||
| Total commercial recoveries | 31 | 33 | 89 | 110 | ||||||||||||
| Total recoveries of loans and leases previously charged off | 701 | 404 | 1,621 | 1,171 | ||||||||||||
| Net charge-offs | (811 | ) | (932 | ) | (2,689 | ) | (2,839 | ) | ||||||||
| Provision for loan and lease losses | 776 | 711 | 2,637 | 2,362 | ||||||||||||
Other (3) | (59 | ) | (95 | ) | (116 | ) | (182 | ) | ||||||||
| Allowance for loan and lease losses, September 30 | 9,433 | 9,734 | 9,433 | 9,734 | ||||||||||||
| Reserve for unfunded lending commitments, beginning of period | 806 | 787 | 797 | 777 | ||||||||||||
| Provision for unfunded lending commitments | 3 | 5 | 12 | 15 | ||||||||||||
| Reserve for unfunded lending commitments, September 30 | 809 | 792 | 809 | 792 | ||||||||||||
| Allowance for credit losses, September 30 | $ | 10,242 | $ | 10,526 | $ | 10,242 | $ | 10,526 | ||||||||
| Loan and allowance ratios: | ||||||||||||||||
Loans and leases outstanding at September 30 (4) | $ | 965,236 | $ | 924,070 | $ | 965,236 | $ | 924,070 | ||||||||
Allowance for loan and lease losses as a percentage of total loans and leases outstanding at September 30 (4) | 0.98 | % | 1.05 | % | 0.98 | % | 1.05 | % | ||||||||
Consumer allowance for loan and lease losses as a percentage of total consumer loans and leases outstanding at September 30 (5) | 1.01 | 1.12 | 1.01 | 1.12 | ||||||||||||
Commercial allowance for loan and lease losses as a percentage of total commercial loans and leases outstanding at September 30 (6) | 0.95 | 0.99 | 0.95 | 0.99 | ||||||||||||
Average loans and leases outstanding (4) | $ | 956,850 | $ | 925,091 | $ | 946,546 | $ | 926,664 | ||||||||
Annualized net charge-offs as a percentage of average loans and leases outstanding (4) | 0.34 | % | 0.40 | % | 0.38 | % | 0.41 | % | ||||||||
Allowance for loan and lease losses as a percentage of total nonperforming loans and leases at September 30 (4) | 271 | 189 | 271 | 189 | ||||||||||||
| Ratio of the allowance for loan and lease losses at September 30 to annualized net charge-offs | 2.93 | 2.63 | 2.62 | 2.56 | ||||||||||||
Amounts included in allowance for loan and lease losses for loans and leases that are excluded from nonperforming loans and leases at September 30 (7) | $ | 4,144 | $ | 4,027 | $ | 4,144 | $ | 4,027 | ||||||||
Allowance for loan and lease losses as a percentage of total nonperforming loans and leases, excluding the allowance for loan and lease losses for loans and leases that are excluded from nonperforming loans and leases at September 30 (4, 7) | 152 | % | 111 | % | 152 | % | 111 | % | ||||||||
Includes U.S. small business commercial charge-offs of $79 million and $239 million for the three and nine months ended September 30, 2019 compared to $72 million and $215 million for the same periods in 2018. |
(2) | Includes U.S. small business commercial recoveries of $10 million and $37 million for the three and nine months ended September 30, 2019 compared to $13 million and $35 million for the same periods in 2018. |
(3) | Primarily represents write-offs of purchased credit-impaired (PCI) loans, the net impact of portfolio sales, and transfers to held for sale. |
(4) | Outstanding loan and lease balances and ratios do not include loans accounted for under the fair value option of $7.7 billion and $5.7 billion |
Excludes consumer loans accounted for under the fair value option of $640 million and $755 million |
Excludes commercial loans accounted for under the fair value option of $7.0 billion and $5.0 billion |
Primarily includes amounts allocated to U.S. credit card and unsecured consumer lending portfolios in Consumer Banking and PCI loans in All Other. |
Bank of America 40 | ||
| Table 43 | Allocation of the Allowance for Credit Losses by Product Type | |||||||||||||||||||||||||||||||||||||||
| Table 41 | Allocation of the Allowance for Credit Losses by Product Type | |||||||||||||||||||||||||||||||||||||||
| Amount | Percent of Total | Percent of Loans and Leases Outstanding (1) | Amount | Percent of Total | Percent of Loans and Leases Outstanding (1) | Amount | Percent of Total | Percent of Loans and Leases Outstanding (1) | Amount | Percent of Total | Percent of Loans and Leases Outstanding (1) | |||||||||||||||||||||||||||||
| (Dollars in millions) | (Dollars in millions) | September 30, 2018 | December 31, 2017 | (Dollars in millions) | September 30, 2019 | December 31, 2018 | ||||||||||||||||||||||||||||||||||
| Allowance for loan and lease losses | Allowance for loan and lease losses | Allowance for loan and lease losses | ||||||||||||||||||||||||||||||||||||||
| Residential mortgage | Residential mortgage | $ | 500 | 5.14 | % | 0.24 | % | $ | 701 | 6.74 | % | 0.34 | % | Residential mortgage | $ | 341 | 3.61 | % | 0.15 | % | $ | 422 | 4.40 | % | 0.20 | % | ||||||||||||||
| Home equity | Home equity | 658 | 6.76 | 1.28 | 1,019 | 9.80 | 1.76 | Home equity | 250 | 2.65 | 0.60 | 506 | 5.27 | 1.05 | ||||||||||||||||||||||||||
| U.S. credit card | U.S. credit card | 3,530 | 36.26 | 3.72 | 3,368 | 32.41 | 3.50 | U.S. credit card | 3,709 | 39.32 | 3.91 | 3,597 | 37.47 | 3.66 | ||||||||||||||||||||||||||
| Direct/Indirect consumer | Direct/Indirect consumer | 262 | 2.69 | 0.29 | 264 | 2.54 | 0.27 | Direct/Indirect consumer | 234 | 2.48 | 0.26 | 248 | 2.58 | 0.27 | ||||||||||||||||||||||||||
| Other consumer | Other consumer | 30 | 0.31 | n/m | 31 | 0.30 | n/m | Other consumer | 42 | 0.45 | n/m | 29 | 0.30 | n/m | ||||||||||||||||||||||||||
| Total consumer | Total consumer | 4,980 | 51.16 | 1.12 | 5,383 | 51.79 | 1.18 | Total consumer | 4,576 | 48.51 | 1.01 | 4,802 | 50.02 | 1.08 | ||||||||||||||||||||||||||
U.S. commercial (2) | U.S. commercial (2) | 2,974 | 30.55 | 0.99 | 3,113 | 29.95 | 1.04 | U.S. commercial (2) | 3,038 | 32.21 | 0.93 | 3,010 | 31.35 | 0.96 | ||||||||||||||||||||||||||
| Non-U.S. commercial | Non-U.S. commercial | 687 | 7.06 | 0.72 | 803 | 7.73 | 0.82 | Non-U.S. commercial | 669 | 7.09 | 0.66 | 677 | 7.05 | 0.69 | ||||||||||||||||||||||||||
| Commercial real estate | Commercial real estate | 946 | 9.72 | 1.56 | 935 | 9.00 | 1.60 | Commercial real estate | 992 | 10.52 | 1.58 | 958 | 9.98 | 1.57 | ||||||||||||||||||||||||||
| Commercial lease financing | Commercial lease financing | 147 | 1.51 | 0.68 | 159 | 1.53 | 0.72 | Commercial lease financing | 158 | 1.67 | 0.79 | 154 | 1.60 | 0.68 | ||||||||||||||||||||||||||
| Total commercial | Total commercial | 4,754 | 48.84 | 0.99 | 5,010 | 48.21 | 1.05 | Total commercial | 4,857 | 51.49 | 0.95 | 4,799 | 49.98 | 0.97 | ||||||||||||||||||||||||||
Allowance for loan and lease losses | Allowance for loan and lease losses | 9,734 | 100.00 | % | 1.05 | 10,393 | 100.00 | % | 1.12 | Allowance for loan and lease losses | 9,433 | 100.00 | % | 0.98 | 9,601 | 100.00 | % | 1.02 | ||||||||||||||||||||||
| Reserve for unfunded lending commitments | Reserve for unfunded lending commitments | 792 | 777 | Reserve for unfunded lending commitments | 809 | 797 | ||||||||||||||||||||||||||||||||||
| Allowance for credit losses | Allowance for credit losses | $ | 10,526 | $ | 11,170 | Allowance for credit losses | $ | 10,242 | $ | 10,398 | ||||||||||||||||||||||||||||||
(1) | Ratios are calculated as allowance for loan and lease losses as a percentage of loans and leases outstanding excluding loans accounted for under the fair value option. Consumer loans accounted for under the fair value option |
(2) | Includes allowance for loan and lease losses for U.S. small business commercial loans of $ |
| Table 44 | Market Risk VaR for Trading Activities | |||||||||||||||||||||||||||||||||||||||||||||||||||||||||||||||||||||||||||||||||||||||||||||||||||||||||||||||
| Table 42 | Market Risk VaR for Trading Activities | |||||||||||||||||||||||||||||||||||||||||||||||||||||||||||||||||||||||||||||||||||||||||||||||||||||||||||||||
| Three Months Ended | Nine Months Ended September 30 | Three Months Ended | Nine Months Ended September 30 | |||||||||||||||||||||||||||||||||||||||||||||||||||||||||||||||||||||||||||||||||||||||||||||||||||||||||||||
| September 30, 2018 | June 30, 2018 | September 30, 2017 | September 30, 2019 | June 30, 2019 | September 30, 2018 | |||||||||||||||||||||||||||||||||||||||||||||||||||||||||||||||||||||||||||||||||||||||||||||||||||||||||||
| (Dollars in millions) | (Dollars in millions) | Period End | Average | High (1) | Low (1) | Period End | Average | High (1) | Low (1) | Period End | Average | High (1) | Low (1) | 2018 Average | 2017 Average | (Dollars in millions) | Period End | Average | High (1) | Low (1) | Period End | Average | High (1) | Low (1) | Period End | Average | High (1) | Low (1) | 2019 Average | 2018 Average | ||||||||||||||||||||||||||||||||||||||||||||||||||||||||||||||||||||||||||||||||||
| Foreign exchange | Foreign exchange | $ | 3 | $ | 7 | $ | 12 | $ | 2 | $ | 8 | $ | 10 | $ | 15 | $ | 7 | $ | 6 | $ | 10 | $ | 15 | $ | 5 | $ | 8 | $ | 12 | Foreign exchange | $ | 3 | $ | 6 | $ | 11 | $ | 3 | $ | 6 | $ | 5 | $ | 11 | $ | 4 | $ | 3 | $ | 7 | $ | 12 | $ | 2 | $ | 6 | $ | 8 | ||||||||||||||||||||||||||||||||||||||||||||||||||||||
| Interest rate | Interest rate | 22 | 26 | 36 | 16 | 27 | 23 | 32 | 15 | 15 | 21 | 41 | 14 | 24 | 20 | Interest rate | 22 | 20 | 26 | 14 | 20 | 26 | 38 | 18 | 22 | 26 | 36 | 16 | 25 | 24 | ||||||||||||||||||||||||||||||||||||||||||||||||||||||||||||||||||||||||||||||||||
| Credit | Credit | 24 | 24 | 30 | 20 | 30 | 25 | 30 | 20 | 24 | 25 | 29 | 23 | 25 | 25 | Credit | 26 | 24 | 27 | 20 | 26 | 22 | 27 | 16 | 24 | 24 | 30 | 20 | 22 | 25 | ||||||||||||||||||||||||||||||||||||||||||||||||||||||||||||||||||||||||||||||||||
| Equity | Equity | 17 | 18 | 27 | 13 | 24 | 16 | 26 | 11 | 17 | 17 | 33 | 12 | 18 | 18 | Equity | 24 | 23 | 29 | 17 | 21 | 20 | 25 | 15 | 17 | 18 | 27 | 13 | 21 | 18 | ||||||||||||||||||||||||||||||||||||||||||||||||||||||||||||||||||||||||||||||||||
| Commodities | Commodities | 7 | 6 | 8 | 5 | 7 | 9 | 14 | 4 | 4 | 5 | 7 | 4 | 7 | 5 | Commodities | 4 | 6 | 31 | 4 | 6 | 6 | 8 | 4 | 7 | 6 | 8 | 5 | 6 | 7 | ||||||||||||||||||||||||||||||||||||||||||||||||||||||||||||||||||||||||||||||||||
| Portfolio diversification | Portfolio diversification | (47 | ) | (52 | ) | — | — | (65 | ) | (55 | ) | — | — | (40 | ) | (44 | ) | — | — | (52 | ) | (45 | ) | Portfolio diversification | (50 | ) | (48 | ) | — | — | (45 | ) | (48 | ) | — | — | (47 | ) | (52 | ) | — | — | (48 | ) | (52 | ) | ||||||||||||||||||||||||||||||||||||||||||||||||||||||||||||||||||
| Total covered positions portfolio | Total covered positions portfolio | 26 | 29 | 36 | 21 | 31 | 28 | 38 | 20 | 26 | 34 | 51 | 24 | 30 | 35 | Total covered positions portfolio | 29 | 31 | 36 | 24 | 34 | 31 | 37 | 28 | 26 | 29 | 36 | 21 | 32 | 30 | ||||||||||||||||||||||||||||||||||||||||||||||||||||||||||||||||||||||||||||||||||
| Impact from less liquid exposures | Impact from less liquid exposures | 2 | 2 | — | — | 2 | 2 | — | — | 3 | 7 | — | — | 4 | 6 | Impact from less liquid exposures | 2 | 3 | — | — | 1 | 3 | — | — | 2 | 2 | — | — | 3 | 4 | ||||||||||||||||||||||||||||||||||||||||||||||||||||||||||||||||||||||||||||||||||
| Total covered positions and less liquid trading positions portfolio | Total covered positions and less liquid trading positions portfolio | 28 | 31 | 38 | 23 | 33 | 30 | 42 | 24 | 29 | 41 | 63 | 26 | 34 | 41 | Total covered positions and less liquid trading positions portfolio | 31 | 34 | 38 | 27 | 35 | 34 | 40 | 29 | 28 | 31 | 38 | 23 | 35 | 34 | ||||||||||||||||||||||||||||||||||||||||||||||||||||||||||||||||||||||||||||||||||
| Fair value option loans | Fair value option loans | 10 | 13 | 15 | 10 | 12 | 13 | 18 | 8 | 10 | 10 | 12 | 9 | 12 | 11 | Fair value option loans | 11 | 11 | 13 | 9 | 10 | 9 | 11 | 7 | 10 | 13 | 15 | 10 | 9 | 12 | ||||||||||||||||||||||||||||||||||||||||||||||||||||||||||||||||||||||||||||||||||
| Fair value option hedges | Fair value option hedges | 6 | 9 | 11 | 6 | 8 | 11 | 17 | 5 | 8 | 8 | 9 | 6 | 9 | 6 | Fair value option hedges | 10 | 11 | 13 | 9 | 10 | 7 | 11 | 4 | 6 | 9 | 11 | 6 | 9 | 9 | ||||||||||||||||||||||||||||||||||||||||||||||||||||||||||||||||||||||||||||||||||
| Fair value option portfolio diversification | Fair value option portfolio diversification | (8 | ) | (13 | ) | — | — | (12 | ) | (13 | ) | — | — | (11 | ) | (9 | ) | — | — | (11 | ) | (8 | ) | Fair value option portfolio diversification | (6 | ) | (10 | ) | — | — | (11 | ) | (9 | ) | — | — | (8 | ) | (13 | ) | — | — | (9 | ) | (11 | ) | ||||||||||||||||||||||||||||||||||||||||||||||||||||||||||||||||||
| Total fair value option portfolio | Total fair value option portfolio | 8 | 9 | 11 | 8 | 8 | 11 | 16 | 5 | 7 | 9 | 10 | 7 | 10 | 9 | Total fair value option portfolio | 15 | 12 | 16 | 9 | 9 | 7 | 10 | 5 | 8 | 9 | 11 | 8 | 9 | 10 | ||||||||||||||||||||||||||||||||||||||||||||||||||||||||||||||||||||||||||||||||||
| Portfolio diversification | Portfolio diversification | (6 | ) | (6 | ) | — | — | (5 | ) | (7 | ) | — | — | (4 | ) | (3 | ) | — | — | (6 | ) | (4 | ) | Portfolio diversification | (12 | ) | (9 | ) | — | — | (7 | ) | (5 | ) | — | — | (6 | ) | (6 | ) | — | — | (6 | ) | (6 | ) | ||||||||||||||||||||||||||||||||||||||||||||||||||||||||||||||||||
| Total market-based portfolio | Total market-based portfolio | $ | 30 | $ | 34 | 44 | 26 | $ | 36 | $ | 34 | 47 | 28 | $ | 32 | $ | 47 | 69 | 29 | $ | 38 | $ | 46 | Total market-based portfolio | $ | 34 | $ | 37 | 44 | 28 | $ | 37 | $ | 36 | 42 | 31 | $ | 30 | $ | 34 | 44 | 26 | $ | 38 | $ | 38 | ||||||||||||||||||||||||||||||||||||||||||||||||||||||||||||||||||
(1) | The high and low for each portfolio may have occurred on different trading days than the high and low for the components. Therefore the impact from less liquid exposures and the amount of portfolio diversification, which is the difference between the total portfolio and the sum of the individual components, is not relevant. |
| Table 45 | Average Market Risk VaR for Trading Activities – 99 percent and 95 percent VaR Statistics | |||||||||||||||||||||||||||||||||||||||||||||||||
| Table 43 | Average Market Risk VaR for Trading Activities – 99 percent and 95 percent VaR Statistics | |||||||||||||||||||||||||||||||||||||||||||||||||
| �� | ||||||||||||||||||||||||||||||||||||||||||||||||||
| Three Months Ended | Three Months Ended | |||||||||||||||||||||||||||||||||||||||||||||||||
| September 30, 2018 | June 30, 2018 | September 30, 2017 | September 30, 2019 | June 30, 2019 | September 30, 2018 | |||||||||||||||||||||||||||||||||||||||||||||
| (Dollars in millions) | (Dollars in millions) | 99 percent | 95 percent | 99 percent | 95 percent | 99 percent | 95 percent | (Dollars in millions) | 99 percent | 95 percent | 99 percent | 95 percent | 99 percent | 95 percent | ||||||||||||||||||||||||||||||||||||
| Foreign exchange | Foreign exchange | $ | 7 | $ | 4 | $ | 10 | $ | 6 | $ | 10 | $ | 6 | Foreign exchange | $ | 6 | $ | 4 | $ | 5 | $ | 3 | $ | 7 | $ | 4 | ||||||||||||||||||||||||
| Interest rate | Interest rate | 26 | 16 | 23 | 14 | 21 | 14 | Interest rate | 20 | 13 | 26 | 16 | 26 | 16 | ||||||||||||||||||||||||||||||||||||
| Credit | Credit | 24 | 14 | 25 | 15 | 25 | 15 | Credit | 24 | 16 | 22 | 13 | 24 | 14 | ||||||||||||||||||||||||||||||||||||
| Equity | Equity | 18 | 10 | 16 | 9 | 17 | 9 | Equity | 23 | 12 | 20 | 10 | 18 | 10 | ||||||||||||||||||||||||||||||||||||
| Commodities | Commodities | 6 | 3 | 9 | 5 | 5 | 3 | Commodities | 6 | 3 | 6 | 3 | 6 | 3 | ||||||||||||||||||||||||||||||||||||
| Portfolio diversification | Portfolio diversification | (52 | ) | (31 | ) | (55 | ) | (34 | ) | (44 | ) | (30 | ) | Portfolio diversification | (48 | ) | (31 | ) | (48 | ) | (28 | ) | (52 | ) | (31 | ) | ||||||||||||||||||||||||
| Total covered positions portfolio | Total covered positions portfolio | 29 | 16 | 28 | 15 | 34 | 17 | Total covered positions portfolio | 31 | 17 | 31 | 17 | 29 | 16 | ||||||||||||||||||||||||||||||||||||
| Impact from less liquid exposures | Impact from less liquid exposures | 2 | 1 | 2 | 2 | 7 | 2 | Impact from less liquid exposures | 3 | 2 | 3 | 2 | 2 | 1 | ||||||||||||||||||||||||||||||||||||
| Total covered positions and less liquid trading positions portfolio | Total covered positions and less liquid trading positions portfolio | 31 | 17 | 30 | 17 | 41 | 19 | Total covered positions and less liquid trading positions portfolio | 34 | 19 | 34 | 19 | 31 | 17 | ||||||||||||||||||||||||||||||||||||
| Fair value option loans | Fair value option loans | 13 | 7 | 13 | 7 | 10 | 6 | Fair value option loans | 11 | 6 | 9 | 5 | 13 | 7 | ||||||||||||||||||||||||||||||||||||
| Fair value option hedges | Fair value option hedges | 9 | 6 | 11 | 8 | 8 | 6 | Fair value option hedges | 11 | 7 | 7 | 5 | 9 | 6 | ||||||||||||||||||||||||||||||||||||
| Fair value option portfolio diversification | Fair value option portfolio diversification | (13 | ) | (8 | ) | (13 | ) | (10 | ) | (9 | ) | (7 | ) | Fair value option portfolio diversification | (10 | ) | (7 | ) | (9 | ) | (6 | ) | (13 | ) | (8 | ) | ||||||||||||||||||||||||
| Total fair value option portfolio | Total fair value option portfolio | 9 | 5 | 11 | 5 | 9 | 5 | Total fair value option portfolio | 12 | 6 | 7 | 4 | 9 | 5 | ||||||||||||||||||||||||||||||||||||
| Portfolio diversification | Portfolio diversification | (6 | ) | (4 | ) | (7 | ) | (3 | ) | (3 | ) | (3 | ) | Portfolio diversification | (9 | ) | (4 | ) | (5 | ) | (3 | ) | (6 | ) | (4 | ) | ||||||||||||||||||||||||
| Total market-based portfolio | Total market-based portfolio | $ | 34 | $ | 18 | $ | 34 | $ | 19 | $ | 47 | $ | 21 | Total market-based portfolio | $ | 37 | $ | 21 | $ | 36 | $ | 20 | $ | 34 | $ | 18 | ||||||||||||||||||||||||
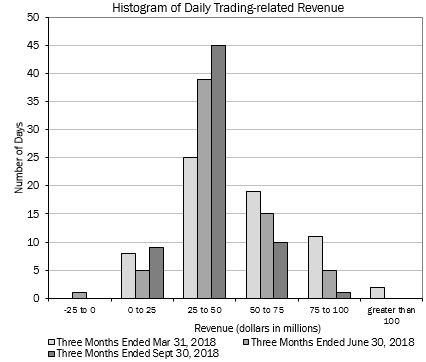
Bank of America 42 | ||
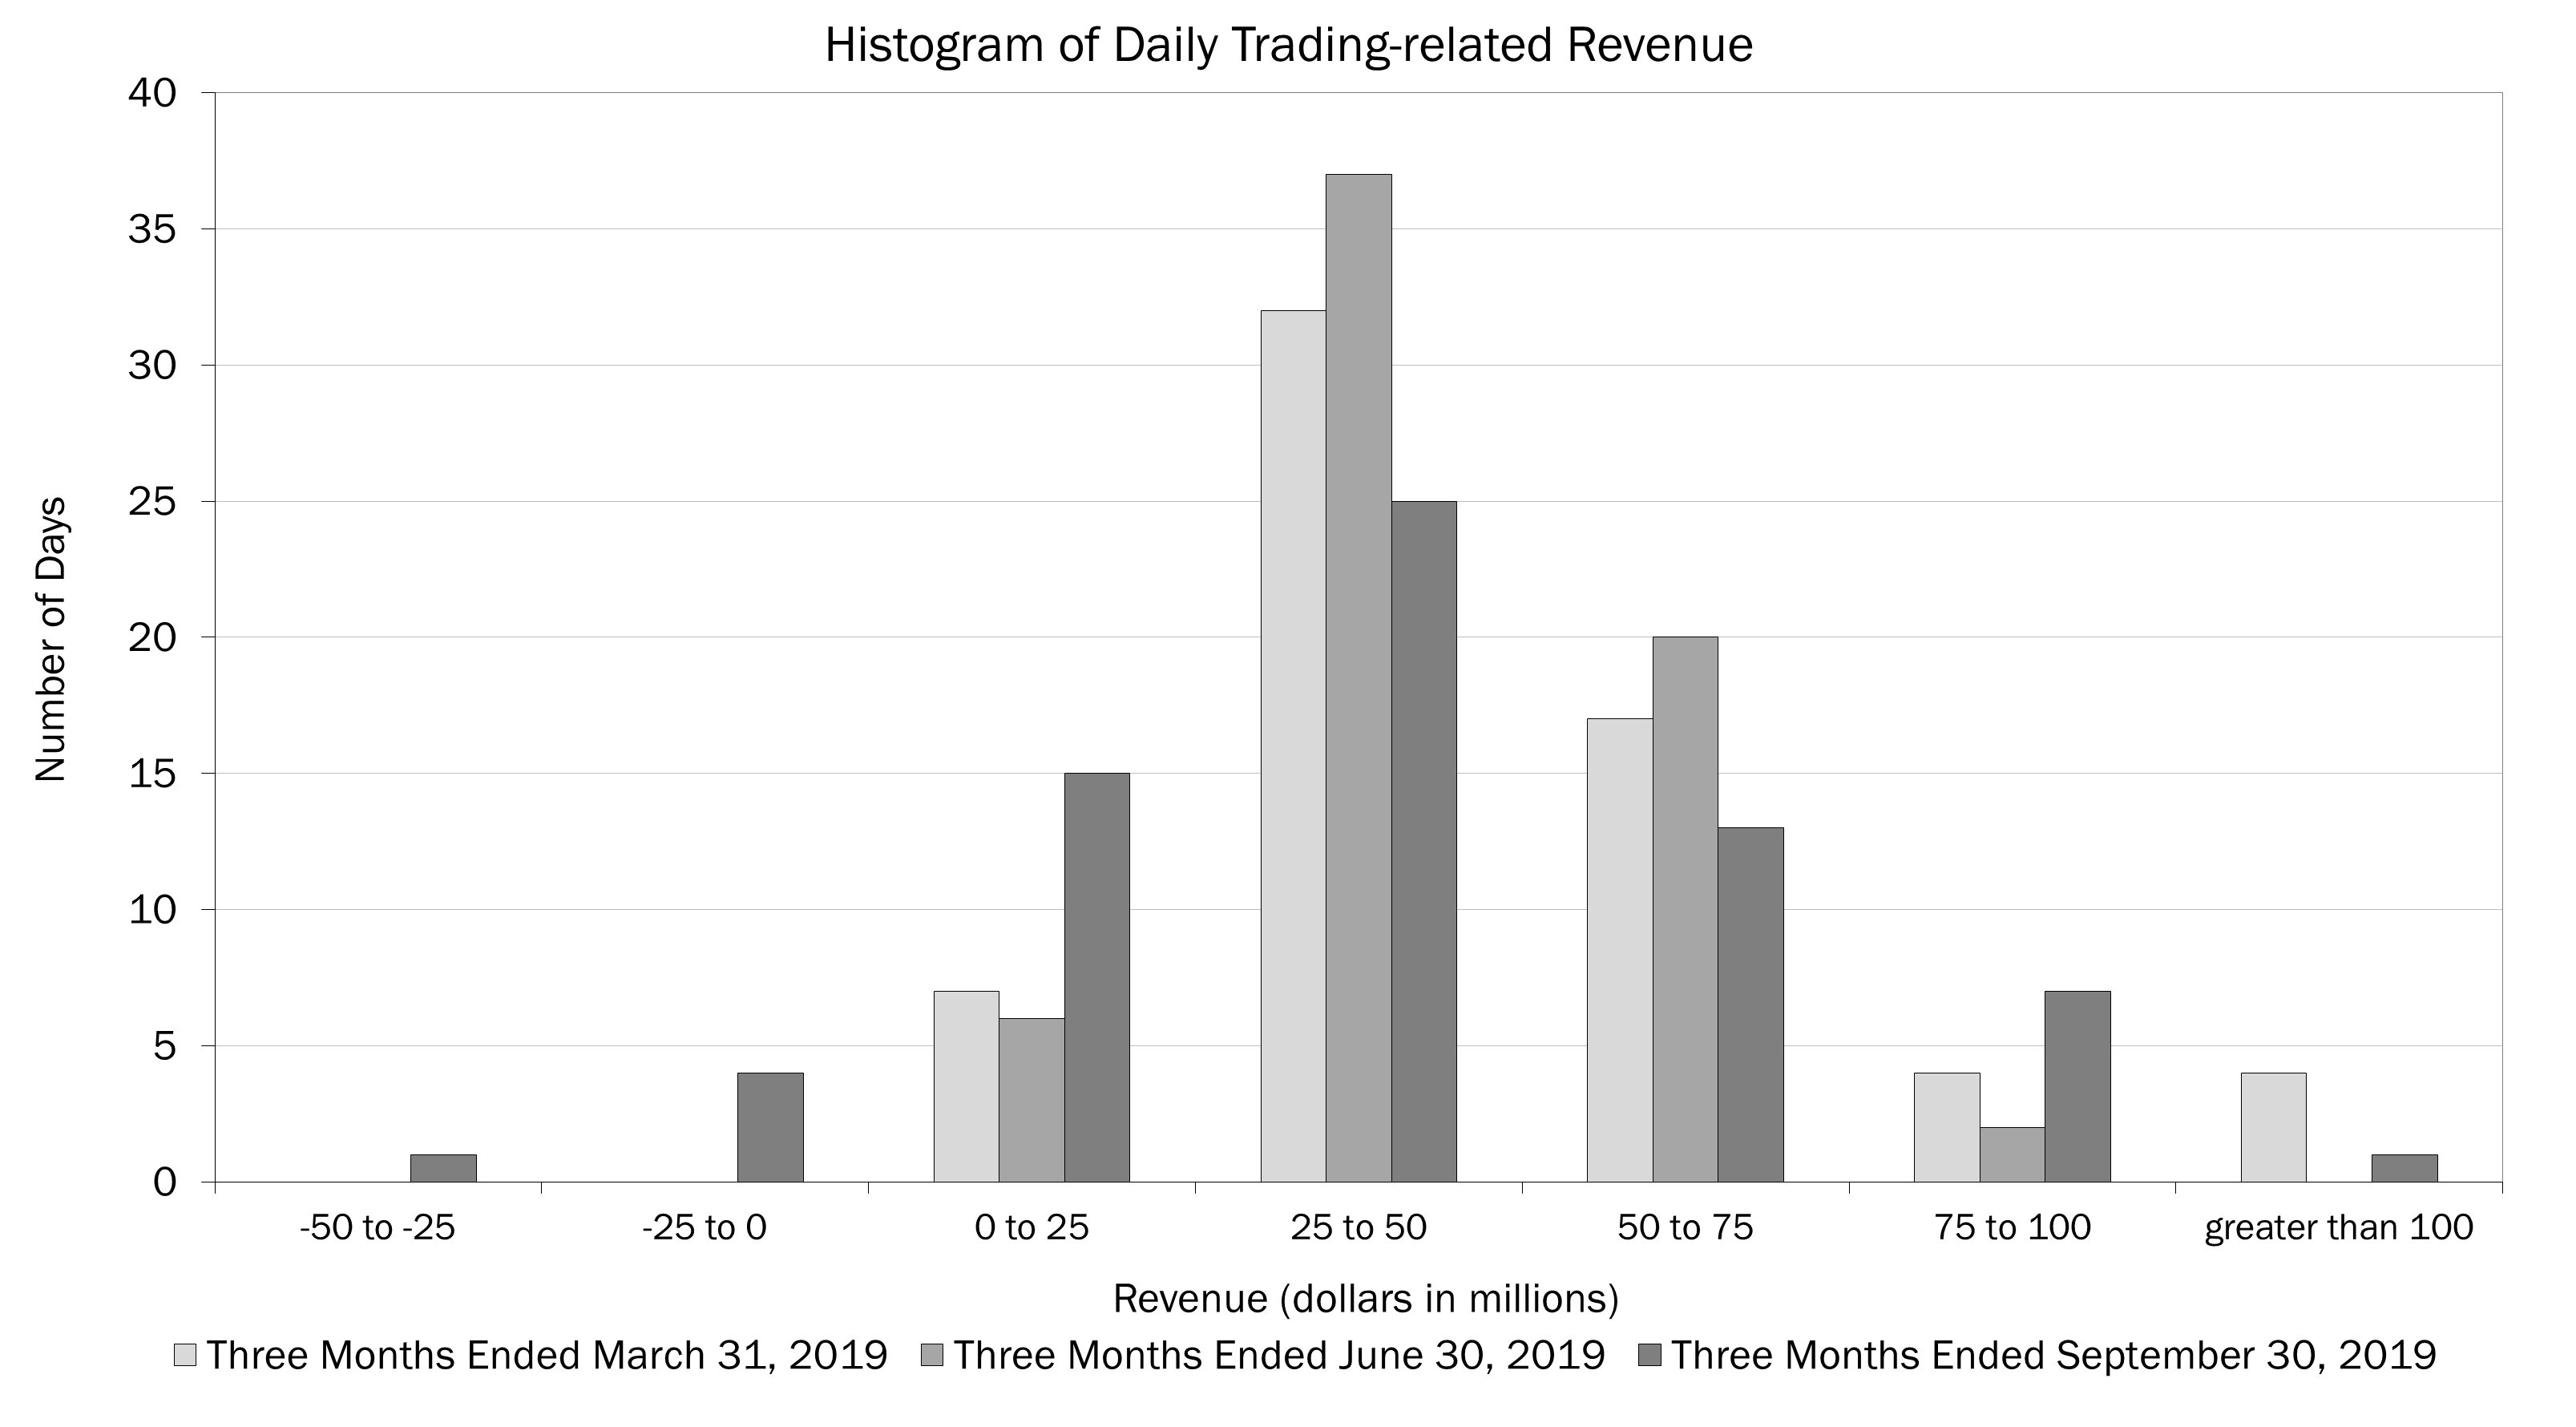 Trading Portfolio Stress Testing
| Table 46 | Forward Rates | |||||||||||||||||
| Table 44 | Forward Rates | |||||||||||||||||
| September 30, 2018 | September 30, 2019 | |||||||||||||||||
Federal Funds | Three-month LIBOR | 10-Year Swap | Federal Funds | Three-month LIBOR | 10-Year Swap | |||||||||||||
| Spot rates | Spot rates | 2.25 | % | 2.40 | % | 3.12 | % | Spot rates | 2.00 | % | 2.09 | % | 1.56 | % | ||||
| 12-month forward rates | 12-month forward rates | 3.00 | 3.07 | 3.16 | 12-month forward rates | 1.50 | 1.47 | 1.56 | ||||||||||
| December 31, 2017 | December 31, 2018 | |||||||||||||||||
| Spot rates | Spot rates | 1.50 | % | 1.69 | % | 2.40 | % | Spot rates | 2.50 | % | 2.81 | % | 2.71 | % | ||||
| 12-month forward rates | 12-month forward rates | 2.00 | 2.14 | 2.48 | 12-month forward rates | 2.50 | 2.64 | 2.75 | ||||||||||
| Table 47 | Estimated Banking Book Net Interest Income Sensitivity to Curve Changes | |||||||||||||
Short Rate (bps) | Long Rate (bps) | |||||||||||||
| September 30 2018 | December 31 2017 | |||||||||||||
| (Dollars in millions) | ||||||||||||||
| Parallel Shifts | ||||||||||||||
+100 bps instantaneous shift | +100 | +100 | $ | 2,927 | $ | 3,317 | ||||||||
-100 bps instantaneous shift | -100 | -100 | (4,256 | ) | (5,183 | ) | ||||||||
| Flatteners | ||||||||||||||
Short-end instantaneous change | +100 | — | 2,316 | 2,182 | ||||||||||
Long-end instantaneous change | — | -100 | (1,421 | ) | (2,765 | ) | ||||||||
| Steepeners | ||||||||||||||
Short-end instantaneous change | -100 | — | (2,798 | ) | (2,394 | ) | ||||||||
Long-end instantaneous change | — | +100 | 628 | 1,135 | ||||||||||
| Table 45 | Estimated Banking Book Net Interest Income Sensitivity to Curve Changes | |||||||||||||
Short Rate (bps) | Long Rate (bps) | |||||||||||||
| September 30 2019 | December 31 2018 | |||||||||||||
| (Dollars in millions) | ||||||||||||||
| Parallel Shifts | ||||||||||||||
+100 bps instantaneous shift | +100 | +100 | $ | 4,576 | $ | 2,833 | ||||||||
-100 bps instantaneous shift | -100 | -100 | (6,479 | ) | (4,280 | ) | ||||||||
| Flatteners | ||||||||||||||
Short-end instantaneous change | +100 | — | 2,696 | 2,158 | ||||||||||
Long-end instantaneous change | — | -100 | (3,050 | ) | (1,618 | ) | ||||||||
| Steepeners | ||||||||||||||
Short-end instantaneous change | -100 | — | (3,343 | ) | (2,648 | ) | ||||||||
Long-end instantaneous change | — | +100 | 1,917 | 675 | ||||||||||
43Bank of America | ||
| Table 48 | Asset and Liability Management Interest Rate and Foreign Exchange Contracts | |||||||||||||||||||||||||||||||||||||||||||||||||||||||||||||||||||||
| Table 46 | Asset and Liability Management Interest Rate and Foreign Exchange Contracts | |||||||||||||||||||||||||||||||||||||||||||||||||||||||||||||||||||||
| September 30, 2018 | September 30, 2019 | |||||||||||||||||||||||||||||||||||||||||||||||||||||||||||||||||||||
| Expected Maturity | Expected Maturity | |||||||||||||||||||||||||||||||||||||||||||||||||||||||||||||||||||||
| (Dollars in millions, average estimated duration in years) | (Dollars in millions, average estimated duration in years) | Fair Value | Total | Remainder of 2018 | 2019 | 2020 | 2021 | 2022 | Thereafter | Average Estimated Duration | (Dollars in millions, average estimated duration in years) | Fair Value | Total | Remainder of 2019 | 2020 | 2021 | 2022 | 2023 | Thereafter | Average Estimated Duration | ||||||||||||||||||||||||||||||||||||||||||||||||||
Receive-fixed interest rate swaps (1) | Receive-fixed interest rate swaps (1) | $ | (4,571 | ) | 4.85 | Receive-fixed interest rate swaps (1) | $ | 17,416 | 6.86 | |||||||||||||||||||||||||||||||||||||||||||||||||||||||||||||
| Notional amount | Notional amount | $ | 254,129 | $ | 4,879 | $ | 27,176 | $ | 26,229 | $ | 21,581 | $ | 30,365 | $ | 143,899 | Notional amount | $ | 218,014 | $ | 4,738 | $ | 16,347 | $ | 14,642 | $ | 21,616 | $ | 36,356 | $ | 124,315 | ||||||||||||||||||||||||||||||||||||||||
| Weighted-average fixed-rate | Weighted-average fixed-rate | 2.51 | % | 2.57 | % | 1.87 | % | 2.28 | % | 2.85 | % | 2.40 | % | 2.65 | % | Weighted-average fixed-rate | 2.72 | % | 1.74 | % | 2.68 | % | 3.17 | % | 2.48 | % | 2.36 | % | 2.86 | % | ||||||||||||||||||||||||||||||||||||||||
Pay-fixed interest rate swaps (1) | Pay-fixed interest rate swaps (1) | 1,842 | 4.62 | Pay-fixed interest rate swaps (1) | (5,089 | ) | 7.45 | |||||||||||||||||||||||||||||||||||||||||||||||||||||||||||||||
| Notional amount | Notional amount | $ | 111,131 | $ | 11,247 | $ | 1,210 | $ | 14,226 | $ | 8,949 | $ | 11,245 | $ | 64,254 | Notional amount | $ | 72,949 | $ | 1,210 | $ | 4,344 | $ | 2,117 | $ | — | $ | 13,993 | $ | 51,285 | ||||||||||||||||||||||||||||||||||||||||
| Weighted-average fixed-rate | Weighted-average fixed-rate | 2.60 | % | 1.70 | % | 2.07 | % | 2.70 | % | 2.80 | % | 2.91 | % | 2.66 | % | Weighted-average fixed-rate | 2.47 | % | 2.07 | % | 2.16 | % | 2.15 | % | — | % | 2.52 | % | 2.51 | % | ||||||||||||||||||||||||||||||||||||||||
Same-currency basis swaps (2) | Same-currency basis swaps (2) | 10 | Same-currency basis swaps (2) | 21 | ||||||||||||||||||||||||||||||||||||||||||||||||||||||||||||||||||
| Notional amount | Notional amount | $ | 162,172 | $ | 1,085 | $ | 13,755 | $ | 34,628 | $ | 26,227 | $ | 22,849 | $ | 63,628 | Notional amount | $ | 142,128 | $ | 1,898 | $ | 17,293 | $ | 18,008 | $ | 4,306 | $ | 2,017 | $ | 98,606 | ||||||||||||||||||||||||||||||||||||||||
Foreign exchange basis swaps (1, 3, 4) | Foreign exchange basis swaps (1, 3, 4) | (1,572 | ) | Foreign exchange basis swaps (1, 3, 4) | (1,685 | ) | ||||||||||||||||||||||||||||||||||||||||||||||||||||||||||||||||
| Notional amount | Notional amount | 110,129 | 7,290 | 13,326 | 21,156 | 17,395 | 10,377 | 40,585 | Notional amount | 115,945 | 6,552 | 22,415 | 24,026 | 14,461 | 7,056 | 41,435 | ||||||||||||||||||||||||||||||||||||||||||||||||||||||
| Option products | Option products | — | Option products | 1 | ||||||||||||||||||||||||||||||||||||||||||||||||||||||||||||||||||
| Notional amount | Notional amount | 16 | — | — | — | — | — | 16 | Notional amount | 1,176 | 1,161 | — | — | — | 15 | — | ||||||||||||||||||||||||||||||||||||||||||||||||||||||
Foreign exchange contracts (1, 4, 5) | Foreign exchange contracts (1, 4, 5) | 339 | Foreign exchange contracts (1, 4, 5) | 2,127 | ||||||||||||||||||||||||||||||||||||||||||||||||||||||||||||||||||
Notional amount (6) | Notional amount (6) | (4,571 | ) | (24,033 | ) | (326 | ) | 3 | 4,273 | 2,826 | 12,686 | Notional amount (6) | (98,175 | ) | (118,122 | ) | (4,072 | ) | 3,845 | 2,608 | 2,283 | 15,283 | ||||||||||||||||||||||||||||||||||||||||||||||||
| Net ALM contracts | Net ALM contracts | $ | (3,952 | ) | Net ALM contracts | $ | 12,791 | |||||||||||||||||||||||||||||||||||||||||||||||||||||||||||||||
| December 31, 2017 | ||||||||||||||||||||||||||||||||||||||||||||||||||||||||||||||||||||||
| Expected Maturity | ||||||||||||||||||||||||||||||||||||||||||||||||||||||||||||||||||||||
| (Dollars in millions, average estimated duration in years) | Fair Value | Total | 2018 | 2019 | 2020 | 2021 | 2022 | Thereafter | Average Estimated Duration | |||||||||||||||||||||||||||||||||||||||||||||||||||||||||||||
Receive-fixed interest rate swaps (1) | $ | 2,330 | 5.38 | |||||||||||||||||||||||||||||||||||||||||||||||||||||||||||||||||||
| Notional amount | $ | 176,390 | $ | 21,850 | $ | 27,176 | $ | 16,347 | $ | 6,498 | $ | 19,120 | $ | 85,399 | ||||||||||||||||||||||||||||||||||||||||||||||||||||||||
| Weighted-average fixed-rate | 2.42 | % | 3.20 | % | 1.87 | % | 1.88 | % | 2.99 | % | 2.10 | % | 2.52 | % | ||||||||||||||||||||||||||||||||||||||||||||||||||||||||
Pay-fixed interest rate swaps (1) | (37 | ) | 5.63 | |||||||||||||||||||||||||||||||||||||||||||||||||||||||||||||||||||
| Notional amount | $ | 45,873 | $ | 11,555 | $ | 1,210 | $ | 4,344 | $ | 1,616 | $ | — | $ | 27,148 | ||||||||||||||||||||||||||||||||||||||||||||||||||||||||
| Weighted-average fixed-rate | 2.15 | % | 1.73 | % | 2.07 | % | 2.16 | % | 2.22 | % | — | % | 2.32 | % | ||||||||||||||||||||||||||||||||||||||||||||||||||||||||
Same-currency basis swaps (2) | (17 | ) | ||||||||||||||||||||||||||||||||||||||||||||||||||||||||||||||||||||
| Notional amount | $ | 38,622 | $ | 11,028 | $ | 6,789 | $ | 1,180 | $ | 2,807 | $ | 955 | $ | 15,863 | ||||||||||||||||||||||||||||||||||||||||||||||||||||||||
Foreign exchange basis swaps (1, 3, 4) | (1,616 | ) | ||||||||||||||||||||||||||||||||||||||||||||||||||||||||||||||||||||
| Notional amount | 107,263 | 24,886 | 11,922 | 13,367 | 9,301 | 6,860 | 40,927 | |||||||||||||||||||||||||||||||||||||||||||||||||||||||||||||||
| Option products | 13 | |||||||||||||||||||||||||||||||||||||||||||||||||||||||||||||||||||||
| Notional amount | 1,218 | 1,201 | — | — | — | — | 17 | |||||||||||||||||||||||||||||||||||||||||||||||||||||||||||||||
Foreign exchange contracts (1, 4, 5) | 1,424 | |||||||||||||||||||||||||||||||||||||||||||||||||||||||||||||||||||||
Notional amount (6) | (11,783 | ) | (28,689 | ) | 2,231 | (24 | ) | 2,471 | 2,919 | 9,309 | ||||||||||||||||||||||||||||||||||||||||||||||||||||||||||||
| Net ALM contracts | $ | 2,097 | ||||||||||||||||||||||||||||||||||||||||||||||||||||||||||||||||||||
| December 31, 2018 | |||||||||||||||||||||||||||||||||||
| Expected Maturity | |||||||||||||||||||||||||||||||||||
| (Dollars in millions, average estimated duration in years) | Fair Value | Total | 2019 | 2020 | 2021 | 2022 | 2023 | Thereafter | Average Estimated Duration | ||||||||||||||||||||||||||
Receive-fixed interest rate swaps (1) | $ | 2,128 | 5.17 | ||||||||||||||||||||||||||||||||
| Notional amount | $ | 198,914 | $ | 27,176 | $ | 16,347 | $ | 14,640 | $ | 19,866 | $ | 36,215 | $ | 84,670 | |||||||||||||||||||||
| Weighted-average fixed-rate | 2.66 | % | 1.87 | % | 2.68 | % | 3.17 | % | 2.56 | % | 2.37 | % | 2.97 | % | |||||||||||||||||||||
Pay-fixed interest rate swaps (1) | 295 | 6.30 | |||||||||||||||||||||||||||||||||
| Notional amount | $ | 49,275 | $ | 1,210 | $ | 4,344 | $ | 1,616 | $ | — | $ | 10,801 | $ | 31,304 | |||||||||||||||||||||
| Weighted-average fixed-rate | 2.50 | % | 2.07 | % | 2.16 | % | 2.22 | % | — | % | 2.59 | % | 2.55 | % | |||||||||||||||||||||
Same-currency basis swaps (2) | 21 | ||||||||||||||||||||||||||||||||||
| Notional amount | $ | 101,203 | $ | 7,628 | $ | 15,097 | $ | 15,493 | $ | 2,586 | $ | 2,017 | $ | 58,382 | |||||||||||||||||||||
Foreign exchange basis swaps (1, 3, 4) | (1,716 | ) | |||||||||||||||||||||||||||||||||
| Notional amount | 106,742 | 13,946 | 21,448 | 19,241 | 10,239 | 6,260 | 35,608 | ||||||||||||||||||||||||||||
| Option products | 2 | ||||||||||||||||||||||||||||||||||
| Notional amount | 587 | 572 | — | — | — | 15 | — | ||||||||||||||||||||||||||||
Foreign exchange contracts (1, 4, 5) | 82 | ||||||||||||||||||||||||||||||||||
Notional amount (6) | (8,447 | ) | (27,823 | ) | 13 | 4,196 | 2,741 | 2,448 | 9,978 | ||||||||||||||||||||||||||
| Net ALM contracts | $ | 812 | |||||||||||||||||||||||||||||||||
(1) | Does not include basis adjustments on either fixed-rate debt issued by the Corporation or AFS debt securities, which are hedged using derivatives designated as fair value hedging instruments, that substantially offset the fair values of these derivatives. |
(2) | At September 30, |
(3) | Foreign exchange basis swaps consisted of cross-currency variable interest rate swaps used separately or in conjunction with receive-fixed interest rate swaps. |
(4) | Does not include foreign currency translation adjustments on certain non-U.S. debt issued by the Corporation that substantially offset the fair values of these derivatives. |
(5) | The notional amount of foreign exchange contracts of |
(6) | Reflects the net of long and short positions. Amounts shown as negative reflect a net short position. |
Bank of America 44 | ||
| Table 49 | Quarterly Supplemental Financial Data and Reconciliations to GAAP Financial Measures | |||||||||||||||||||||||
| Three Months Ended September 30 | ||||||||||||||||||||||||
| 2018 | 2017 | |||||||||||||||||||||||
| (Dollars in millions) | As Reported | Fully taxable-equivalent adjustment | Fully taxable-equivalent basis | As Reported | Fully taxable-equivalent adjustment | Fully taxable-equivalent basis | ||||||||||||||||||
| Net interest income | $ | 11,870 | $ | 151 | $ | 12,021 | $ | 11,161 | $ | 240 | $ | 11,401 | ||||||||||||
| Total revenue, net of interest expense | 22,777 | 151 | 22,928 | 21,839 | 240 | 22,079 | ||||||||||||||||||
| Income tax expense | 1,827 | 151 | 1,978 | 2,187 | 240 | 2,427 | ||||||||||||||||||
| Nine Months Ended September 30 | ||||||||||||||||||||||||
| 2018 | 2017 | |||||||||||||||||||||||
| Net interest income | $ | 35,128 | $ | 455 | $ | 35,583 | $ | 33,205 | $ | 674 | $ | 33,879 | ||||||||||||
| Total revenue, net of interest expense | 68,511 | 455 | 68,966 | 66,916 | 674 | 67,590 | ||||||||||||||||||
| Income tax expense | 5,017 | 455 | 5,472 | 7,185 | 674 | 7,859 | ||||||||||||||||||
| Table 47 | Period-end and Average Supplemental Financial Data and Reconciliations to GAAP Financial Measures (1) | |||||||||||||||||||||||
| Period-end | Average | |||||||||||||||||||||||
| September 30 2019 | December 31 2018 | Three Months Ended September 30 | Nine Months Ended September 30 | |||||||||||||||||||||
| (Dollars in millions) | 2019 | 2018 | 2019 | 2018 | ||||||||||||||||||||
| Shareholders’ equity | $ | 268,387 | $ | 265,325 | $ | 270,430 | $ | 264,653 | $ | 268,223 | $ | 265,102 | ||||||||||||
| Goodwill | (68,951 | ) | (68,951 | ) | (68,951 | ) | (68,951 | ) | (68,951 | ) | (68,951 | ) | ||||||||||||
| Intangible assets (excluding MSRs) | (1,690 | ) | (1,774 | ) | (1,707 | ) | (1,992 | ) | (1,735 | ) | (2,125 | ) | ||||||||||||
| Related deferred tax liabilities | 734 | 858 | 752 | 896 | 787 | 917 | ||||||||||||||||||
| Tangible shareholders’ equity | $ | 198,480 | $ | 195,458 | $ | 200,524 | $ | 194,606 | $ | 198,324 | $ | 194,943 | ||||||||||||
| Preferred stock | (23,606 | ) | (22,326 | ) | (23,800 | ) | (22,841 | ) | (22,894 | ) | (23,159 | ) | ||||||||||||
| Tangible common shareholders’ equity | $ | 174,874 | $ | 173,132 | $ | 176,724 | $ | 171,765 | $ | 175,430 | $ | 171,784 | ||||||||||||
| Total assets | $ | 2,426,330 | $ | 2,354,507 | ||||||||||||||||||||
| Goodwill | (68,951 | ) | (68,951 | ) | ||||||||||||||||||||
| Intangible assets (excluding MSRs) | (1,690 | ) | (1,774 | ) | ||||||||||||||||||||
| Related deferred tax liabilities | 734 | 858 | ||||||||||||||||||||||
| Tangible assets | $ | 2,356,423 | $ | 2,284,640 | ||||||||||||||||||||
| Table 50 | Period-end and Average Supplemental Financial Data and Reconciliations to GAAP Financial Measures | |||||||||||||||||||||||
| Period-end | Average | |||||||||||||||||||||||
| September 30 2018 | December 31 2017 | Three Months Ended September 30 | Nine Months Ended September 30 | |||||||||||||||||||||
| (Dollars in millions) | 2018 | 2017 | 2018 | 2017 | ||||||||||||||||||||
| Common shareholders’ equity | $ | 239,832 | $ | 244,823 | $ | 241,812 | $ | 249,214 | $ | 241,943 | $ | 245,841 | ||||||||||||
| Goodwill | (68,951 | ) | (68,951 | ) | (68,951 | ) | (68,969 | ) | (68,951 | ) | (69,398 | ) | ||||||||||||
| Intangible assets (excluding MSRs) | (1,908 | ) | (2,312 | ) | (1,992 | ) | (2,549 | ) | (2,125 | ) | (2,737 | ) | ||||||||||||
| Related deferred tax liabilities | 878 | 943 | 896 | 1,465 | 917 | 1,503 | ||||||||||||||||||
| Tangible common shareholders’ equity | $ | 169,851 | $ | 174,503 | $ | 171,765 | $ | 179,161 | $ | 171,784 | $ | 175,209 | ||||||||||||
| Shareholders’ equity | $ | 262,158 | $ | 267,146 | $ | 264,653 | $ | 273,238 | $ | 265,102 | $ | 270,658 | ||||||||||||
| Goodwill | (68,951 | ) | (68,951 | ) | (68,951 | ) | (68,969 | ) | (68,951 | ) | (69,398 | ) | ||||||||||||
| Intangible assets (excluding MSRs) | (1,908 | ) | (2,312 | ) | (1,992 | ) | (2,549 | ) | (2,125 | ) | (2,737 | ) | ||||||||||||
| Related deferred tax liabilities | 878 | 943 | 896 | 1,465 | 917 | 1,503 | ||||||||||||||||||
| Tangible shareholders’ equity | $ | 192,177 | $ | 196,826 | $ | 194,606 | $ | 203,185 | $ | 194,943 | $ | 200,026 | ||||||||||||
| Total assets | $ | 2,338,833 | $ | 2,281,234 | ||||||||||||||||||||
| Goodwill | (68,951 | ) | (68,951 | ) | ||||||||||||||||||||
| Intangible assets (excluding MSRs) | (1,908 | ) | (2,312 | ) | ||||||||||||||||||||
| Related deferred tax liabilities | 878 | 943 | ||||||||||||||||||||||
| Tangible assets | $ | 2,268,852 | $ | 2,210,914 | ||||||||||||||||||||
(1) | ||
| Consolidated Statement of Income | ||||||||||||||||||||||||||||||
| Three Months Ended September 30 | Nine Months Ended September 30 | |||||||||||||||||||||||||||||
| Three Months Ended September 30 | Nine Months Ended September 30 | |||||||||||||||||||||||||||||
| (In millions, except per share information) | 2018 | 2017 | 2018 | 2017 | 2019 | 2018 | 2019 | 2018 | ||||||||||||||||||||||
| Net interest income | ||||||||||||||||||||||||||||||
| Interest income | $ | 17,916 | $ | 16,965 | $ | 54,310 | $ | 48,933 | ||||||||||||||||||||||
| Loans and leases | $ | 10,401 | $ | 9,203 | $ | 30,095 | $ | 26,877 | ||||||||||||||||||||||
| Debt securities | 2,986 | 2,629 | 8,646 | 7,764 | ||||||||||||||||||||||||||
| Federal funds sold and securities borrowed or purchased under agreements to resell | 799 | 659 | 2,130 | 1,658 | ||||||||||||||||||||||||||
| Trading account assets | 1,172 | 1,091 | 3,506 | 3,330 | ||||||||||||||||||||||||||
| Other interest income | 1,607 | 1,075 | 4,556 | 2,884 | ||||||||||||||||||||||||||
| Total interest income | 16,965 | 14,657 | 48,933 | 42,513 | ||||||||||||||||||||||||||
| Interest expense | 5,729 | 4,904 | 17,559 | 13,275 | ||||||||||||||||||||||||||
| Deposits | 1,230 | 624 | 2,933 | 1,252 | ||||||||||||||||||||||||||
| Short-term borrowings | 1,526 | 944 | 4,123 | 2,508 | ||||||||||||||||||||||||||
| Trading account liabilities | 335 | 319 | 1,040 | 890 | ||||||||||||||||||||||||||
| Long-term debt | 2,004 | 1,609 | 5,709 | 4,658 | ||||||||||||||||||||||||||
| Total interest expense | 5,095 | 3,496 | 13,805 | 9,308 | ||||||||||||||||||||||||||
| Net interest income | 11,870 | 11,161 | 35,128 | 33,205 | 12,187 | 12,061 | 36,751 | 35,658 | ||||||||||||||||||||||
| Noninterest income | ||||||||||||||||||||||||||||||
| Card income | 1,470 | 1,429 | 4,469 | 4,347 | ||||||||||||||||||||||||||
| Service charges | 1,961 | 1,968 | 5,836 | 5,863 | ||||||||||||||||||||||||||
| Investment and brokerage services | 3,494 | 3,437 | 10,616 | 10,314 | ||||||||||||||||||||||||||
| Investment banking income | 1,204 | 1,477 | 3,979 | 4,593 | ||||||||||||||||||||||||||
| Trading account profits | 1,893 | 1,837 | 6,907 | 6,124 | ||||||||||||||||||||||||||
| Fees and commissions | 8,467 | 8,076 | 24,495 | 24,733 | ||||||||||||||||||||||||||
| Trading account income | 1,707 | 1,717 | 6,390 | 6,421 | ||||||||||||||||||||||||||
| Other income | 885 | 530 | 1,576 | 2,470 | 446 | 870 | 1,259 | 1,531 | ||||||||||||||||||||||
| Total noninterest income | 10,907 | 10,678 | 33,383 | 33,711 | 10,620 | 10,663 | 32,144 | 32,685 | ||||||||||||||||||||||
| Total revenue, net of interest expense | 22,777 | 21,839 | 68,511 | 66,916 | 22,807 | 22,724 | 68,895 | 68,343 | ||||||||||||||||||||||
| Provision for credit losses | 716 | 834 | 2,377 | 2,395 | 779 | 716 | 2,649 | 2,377 | ||||||||||||||||||||||
| Noninterest expense | ||||||||||||||||||||||||||||||
| Personnel | 7,721 | 7,811 | 24,145 | 24,326 | ||||||||||||||||||||||||||
| Occupancy | 1,015 | 999 | 3,051 | 3,000 | ||||||||||||||||||||||||||
| Equipment | 421 | 416 | 1,278 | 1,281 | ||||||||||||||||||||||||||
| Compensation and benefits | 7,779 | 7,721 | 24,000 | 24,145 | ||||||||||||||||||||||||||
| Occupancy and equipment | 1,663 | 1,589 | 4,908 | 4,787 | ||||||||||||||||||||||||||
| Information processing and communications | 1,163 | 1,113 | 3,484 | 3,399 | ||||||||||||||||||||||||||
| Product delivery and transaction related | 696 | 687 | 2,067 | 2,149 | ||||||||||||||||||||||||||
| Marketing | 421 | 461 | 1,161 | 1,235 | 440 | 421 | 1,410 | 1,161 | ||||||||||||||||||||||
| Professional fees | 439 | 476 | 1,219 | 1,417 | 386 | 439 | 1,155 | 1,219 | ||||||||||||||||||||||
| Data processing | 791 | 777 | 2,398 | 2,344 | ||||||||||||||||||||||||||
| Telecommunications | 173 | 170 | 522 | 538 | ||||||||||||||||||||||||||
| Other general operating | 2,086 | 2,284 | 6,474 | 7,328 | 3,042 | 1,044 | 4,637 | 3,220 | ||||||||||||||||||||||
| Total noninterest expense | 13,067 | 13,394 | 40,248 | 41,469 | 15,169 | 13,014 | 41,661 | 40,080 | ||||||||||||||||||||||
| Income before income taxes | 8,994 | 7,611 | 25,886 | 23,052 | 6,859 | 8,994 | 24,585 | 25,886 | ||||||||||||||||||||||
| Income tax expense | 1,827 | 2,187 | 5,017 | 7,185 | 1,082 | 1,827 | 4,149 | 5,017 | ||||||||||||||||||||||
| Net income | $ | 7,167 | $ | 5,424 | $ | 20,869 | $ | 15,867 | $ | 5,777 | $ | 7,167 | $ | 20,436 | $ | 20,869 | ||||||||||||||
| Preferred stock dividends | 466 | 465 | 1,212 | 1,328 | 505 | 466 | 1,186 | 1,212 | ||||||||||||||||||||||
| Net income applicable to common shareholders | $ | 6,701 | $ | 4,959 | $ | 19,657 | $ | 14,539 | $ | 5,272 | $ | 6,701 | $ | 19,250 | $ | 19,657 | ||||||||||||||
| Per common share information | ||||||||||||||||||||||||||||||
| Earnings | $ | 0.67 | $ | 0.49 | $ | 1.93 | $ | 1.44 | $ | 0.57 | $ | 0.67 | $ | 2.02 | $ | 1.93 | ||||||||||||||
| Diluted earnings | 0.66 | 0.46 | 1.91 | 1.36 | 0.56 | 0.66 | 2.01 | 1.91 | ||||||||||||||||||||||
| Dividends paid | 0.15 | 0.12 | 0.39 | 0.27 | ||||||||||||||||||||||||||
| Average common shares issued and outstanding | 10,031.6 | 10,197.9 | 10,177.5 | 10,103.4 | 9,303.6 | 10,031.6 | 9,516.2 | 10,177.5 | ||||||||||||||||||||||
| Average diluted common shares issued and outstanding | 10,170.8 | 10,746.7 | 10,317.9 | 10,832.1 | 9,353.0 | 10,170.8 | 9,565.7 | 10,317.9 | ||||||||||||||||||||||
| Consolidated Statement of Comprehensive Income | |||||||||||||||
| Three Months Ended September 30 | Nine Months Ended September 30 | ||||||||||||||
| (Dollars in millions) | 2019 | 2018 | 2019 | 2018 | |||||||||||
| Net income | $ | 5,777 | $ | 7,167 | $ | 20,436 | $ | 20,869 | |||||||
| Other comprehensive income (loss), net-of-tax: | |||||||||||||||
| Net change in debt securities | 1,538 | (1,172 | ) | 6,231 | (6,166 | ) | |||||||||
| Net change in debit valuation adjustments | 229 | (269 | ) | (272 | ) | 183 | |||||||||
| Net change in derivatives | 118 | 21 | 651 | (346 | ) | ||||||||||
| Employee benefit plan adjustments | 26 | 31 | 83 | 91 | |||||||||||
| Net change in foreign currency translation adjustments | (51 | ) | (114 | ) | (99 | ) | (303 | ) | |||||||
| Other comprehensive income (loss) | 1,860 | (1,503 | ) | 6,594 | (6,541 | ) | |||||||||
| Comprehensive income | $ | 7,637 | $ | 5,664 | $ | 27,030 | $ | 14,328 | |||||||
Bank of America | ||
| Consolidated Statement of Comprehensive Income | |||||||||||||||
| Three Months Ended September 30 | Nine Months Ended September 30 | ||||||||||||||
| (Dollars in millions) | 2018 | 2017 | 2018 | 2017 | |||||||||||
| Net income | $ | 7,167 | $ | 5,424 | $ | 20,869 | $ | 15,867 | |||||||
| Other comprehensive income (loss), net-of-tax: | |||||||||||||||
| Net change in debt and equity securities | (1,172 | ) | 462 | (6,166 | ) | 931 | |||||||||
| Net change in debit valuation adjustments | (269 | ) | (80 | ) | 183 | (149 | ) | ||||||||
| Net change in derivatives | 21 | 24 | (346 | ) | 156 | ||||||||||
| Employee benefit plan adjustments | 31 | 26 | 91 | 80 | |||||||||||
| Net change in foreign currency translation adjustments | (114 | ) | 5 | (303 | ) | 102 | |||||||||
| Other comprehensive income (loss) | (1,503 | ) | 437 | (6,541 | ) | 1,120 | |||||||||
| Comprehensive income | $ | 5,664 | $ | 5,861 | $ | 14,328 | $ | 16,987 | |||||||
| Consolidated Balance Sheet | ||||||||
| September 30 | December 31 | |||||||
| (Dollars in millions) | 2019 | 2018 | ||||||
| Assets | ||||||||
| Cash and due from banks | $ | 26,939 | $ | 29,063 | ||||
| Interest-bearing deposits with the Federal Reserve, non-U.S. central banks and other banks | 130,155 | 148,341 | ||||||
| Cash and cash equivalents | 157,094 | 177,404 | ||||||
| Time deposits placed and other short-term investments | 7,557 | 7,494 | ||||||
Federal funds sold and securities borrowed or purchased under agreements to resell (includes $50,298 and $56,399 measured at fair value) | 271,595 | 261,131 | ||||||
Trading account assets (includes $131,008 and $119,363 pledged as collateral) | 263,684 | 214,348 | ||||||
| Derivative assets | 45,123 | 43,725 | ||||||
| Debt securities: | ||||||||
| Carried at fair value | 254,342 | 238,101 | ||||||
Held-to-maturity, at cost (fair value – $194,274 and $200,435) | 190,252 | 203,652 | ||||||
| Total debt securities | 444,594 | 441,753 | ||||||
Loans and leases (includes $7,674 and $4,349 measured at fair value) | 972,910 | 946,895 | ||||||
| Allowance for loan and lease losses | (9,433 | ) | (9,601 | ) | ||||
| Loans and leases, net of allowance | 963,477 | 937,294 | ||||||
| Premises and equipment, net | 10,493 | 9,906 | ||||||
| Goodwill | 68,951 | 68,951 | ||||||
Loans held-for-sale (includes $5,011 and $2,942 measured at fair value) | 9,811 | 10,367 | ||||||
| Customer and other receivables | 52,560 | 65,814 | ||||||
Other assets (includes $22,952 and $19,739 measured at fair value) | 131,391 | 116,320 | ||||||
| Total assets | $ | 2,426,330 | $ | 2,354,507 | ||||
| Liabilities | ||||||||
| Deposits in U.S. offices: | ||||||||
| Noninterest-bearing | $ | 394,379 | $ | 412,587 | ||||
Interest-bearing (includes $626 and $492 measured at fair value) | 917,401 | 891,636 | ||||||
| Deposits in non-U.S. offices: | ||||||||
| Noninterest-bearing | 13,138 | 14,060 | ||||||
| Interest-bearing | 67,918 | 63,193 | ||||||
| Total deposits | 1,392,836 | 1,381,476 | ||||||
Federal funds purchased and securities loaned or sold under agreements to repurchase (includes $21,963 and $28,875 measured at fair value) | 202,067 | 186,988 | ||||||
| Trading account liabilities | 78,642 | 68,220 | ||||||
| Derivative liabilities | 38,025 | 37,891 | ||||||
Short-term borrowings (includes $3,458 and $1,648 measured at fair value) | 30,682 | 20,189 | ||||||
Accrued expenses and other liabilities (includes $23,512 and $20,075 measured at fair value and $809 and $797 of reserve for unfunded lending commitments) | 172,286 | 165,026 | ||||||
Long-term debt (includes $36,773 and $27,689 measured at fair value) | 243,405 | 229,392 | ||||||
| Total liabilities | 2,157,943 | 2,089,182 | ||||||
Commitments and contingencies (Note 7 – Securitizations and Other Variable Interest Entities and Note 11 – Commitments and Contingencies) | ||||||||
| Shareholders’ equity | ||||||||
Preferred stock, $0.01 par value; authorized – 100,000,000 shares; issued and outstanding – 3,895,685 and 3,843,140 shares | 23,606 | 22,326 | ||||||
Common stock and additional paid-in capital, $0.01 par value; authorized – 12,800,000,000 shares; issued and outstanding – 9,079,264,535 and 9,669,286,370 shares | 99,215 | 118,896 | ||||||
| Retained earnings | 151,183 | 136,314 | ||||||
| Accumulated other comprehensive income (loss) | (5,617 | ) | (12,211 | ) | ||||
| Total shareholders’ equity | 268,387 | 265,325 | ||||||
| Total liabilities and shareholders’ equity | $ | 2,426,330 | $ | 2,354,507 | ||||
| Assets of consolidated variable interest entities included in total assets above (isolated to settle the liabilities of the variable interest entities) | ||||||||
| Trading account assets | $ | 5,758 | $ | 5,798 | ||||
| Loans and leases | 39,387 | 43,850 | ||||||
| Allowance for loan and lease losses | (835 | ) | (912 | ) | ||||
| Loans and leases, net of allowance | 38,552 | 42,938 | ||||||
| All other assets | 555 | 337 | ||||||
| Total assets of consolidated variable interest entities | $ | 44,865 | $ | 49,073 | ||||
| Liabilities of consolidated variable interest entities included in total liabilities above | ||||||||
| Short-term borrowings | $ | 2,274 | $ | 742 | ||||
Long-term debt (includes $8,559 and $10,943 of non-recourse debt) | 8,560 | 10,944 | ||||||
All other liabilities (includes $23 and $27 of non-recourse liabilities) | 26 | 30 | ||||||
| Total liabilities of consolidated variable interest entities | $ | 10,860 | $ | 11,716 | ||||
| Consolidated Balance Sheet | |||||||
| (Dollars in millions) | September 30 2018 | December 31 2017 | |||||
| Assets | |||||||
| Cash and due from banks | $ | 27,440 | $ | 29,480 | |||
| Interest-bearing deposits with the Federal Reserve, non-U.S. central banks and other banks | 157,418 | 127,954 | |||||
| Cash and cash equivalents | 184,858 | 157,434 | |||||
| Time deposits placed and other short-term investments | 7,865 | 11,153 | |||||
Federal funds sold and securities borrowed or purchased under agreements to resell (includes $52,524 and $52,906 measured at fair value) | 248,237 | 212,747 | |||||
Trading account assets (includes $110,199 and $106,274 pledged as collateral) | 219,118 | 209,358 | |||||
| Derivative assets | 45,617 | 37,762 | |||||
| Debt securities: | |||||||
| Carried at fair value | 251,635 | 315,117 | |||||
Held-to-maturity, at cost (fair value – $187,988 and $123,299) | 194,472 | 125,013 | |||||
| Total debt securities | 446,107 | 440,130 | |||||
Loans and leases (includes $5,731 and $5,710 measured at fair value) | 929,801 | 936,749 | |||||
| Allowance for loan and lease losses | (9,734 | ) | (10,393 | ) | |||
| Loans and leases, net of allowance | 920,067 | 926,356 | |||||
| Premises and equipment, net | 9,680 | 9,247 | |||||
| Goodwill | 68,951 | 68,951 | |||||
Loans held-for-sale (includes $3,116 and $2,156 measured at fair value) | 5,576 | 11,430 | |||||
| Customer and other receivables | 56,962 | 61,623 | |||||
Other assets (includes $23,738 and $22,581 measured at fair value) | 125,795 | 135,043 | |||||
| Total assets | $ | 2,338,833 | $ | 2,281,234 | |||
| Assets of consolidated variable interest entities included in total assets above (isolated to settle the liabilities of the variable interest entities) | |||||||
| Trading account assets | $ | 6,145 | $ | 6,521 | |||
| Loans and leases | 44,163 | 48,929 | |||||
| Allowance for loan and lease losses | (920 | ) | (1,016 | ) | |||
| Loans and leases, net of allowance | 43,243 | 47,913 | |||||
| All other assets | 357 | 1,721 | |||||
| Total assets of consolidated variable interest entities | $ | 49,745 | $ | 56,155 | |||
| Consolidated Statement of Changes in Shareholders’ Equity | ||||||||||||||||||||||
Preferred Stock | Common Stock and Additional Paid-in Capital | Retained Earnings | Accumulated Other Comprehensive Income (Loss) | Total Shareholders’ Equity | ||||||||||||||||||
| (In millions) | Shares | Amount | ||||||||||||||||||||
| Balance, June 30, 2019 | $ | 24,689 | 9,342.6 | $ | 106,619 | $ | 147,577 | $ | (7,477 | ) | $ | 271,408 | ||||||||||
| Net income | 5,777 | 5,777 | ||||||||||||||||||||
| Net change in debt securities | 1,538 | 1,538 | ||||||||||||||||||||
| Net change in debit valuation adjustments | 229 | 229 | ||||||||||||||||||||
| Net change in derivatives | 118 | 118 | ||||||||||||||||||||
| Employee benefit plan adjustments | 26 | 26 | ||||||||||||||||||||
| Net change in foreign currency translation adjustments | (51 | ) | (51 | ) | ||||||||||||||||||
| Dividends declared: | ||||||||||||||||||||||
| Common | (1,659 | ) | (1,659 | ) | ||||||||||||||||||
| Preferred | (505 | ) | (505 | ) | ||||||||||||||||||
| Issuance of preferred stock | 1,280 | 1,280 | ||||||||||||||||||||
| Redemption of preferred stock | (2,363 | ) | (2,363 | ) | ||||||||||||||||||
| Common stock issued under employee plans, net, and other | 4.3 | 222 | (7 | ) | 215 | |||||||||||||||||
| Common stock repurchased | (267.6 | ) | (7,626 | ) | (7,626 | ) | ||||||||||||||||
| Balance, September 30, 2019 | $ | 23,606 | 9,079.3 | $ | 99,215 | $ | 151,183 | $ | (5,617 | ) | $ | 268,387 | ||||||||||
| Balance, December 31, 2018 | $ | 22,326 | 9,669.3 | $ | 118,896 | $ | 136,314 | $ | (12,211 | ) | $ | 265,325 | ||||||||||
| Cumulative adjustment for adoption of lease accounting standard | 165 | 165 | ||||||||||||||||||||
| Net income | 20,436 | 20,436 | ||||||||||||||||||||
| Net change in debt securities | 6,231 | 6,231 | ||||||||||||||||||||
| Net change in debit valuation adjustments | (272 | ) | (272 | ) | ||||||||||||||||||
| Net change in derivatives | 651 | 651 | ||||||||||||||||||||
| Employee benefit plan adjustments | 83 | 83 | ||||||||||||||||||||
| Net change in foreign currency translation adjustments | (99 | ) | (99 | ) | ||||||||||||||||||
| Dividends declared: | ||||||||||||||||||||||
| Common | (4,535 | ) | (4,535 | ) | ||||||||||||||||||
| Preferred | (1,186 | ) | (1,186 | ) | ||||||||||||||||||
| Issuance of preferred stock | 3,643 | 3,643 | ||||||||||||||||||||
| Redemption of preferred stock | (2,363 | ) | (2,363 | ) | ||||||||||||||||||
| Common stock issued under employee plans, net, and other | 123.4 | 715 | (11 | ) | 704 | |||||||||||||||||
| Common stock repurchased | (713.4 | ) | (20,396 | ) | (20,396 | ) | ||||||||||||||||
| Balance, September 30, 2019 | $ | 23,606 | 9,079.3 | $ | 99,215 | $ | 151,183 | $ | (5,617 | ) | $ | 268,387 | ||||||||||
| Balance, June 30, 2018 | $ | 23,181 | 10,012.7 | $ | 128,822 | $ | 125,546 | $ | (13,333 | ) | $ | 264,216 | ||||||||||
| Net income | 7,167 | 7,167 | ||||||||||||||||||||
| Net change in debt securities | (1,172 | ) | (1,172 | ) | ||||||||||||||||||
| Net change in debit valuation adjustments | (269 | ) | (269 | ) | ||||||||||||||||||
| Net change in derivatives | 21 | 21 | ||||||||||||||||||||
| Employee benefit plan adjustments | 31 | 31 | ||||||||||||||||||||
| Net change in foreign currency translation adjustments | (114 | ) | (114 | ) | ||||||||||||||||||
| Dividends declared: | ||||||||||||||||||||||
| Common | (1,497 | ) | (1,497 | ) | ||||||||||||||||||
| Preferred | (466 | ) | (466 | ) | ||||||||||||||||||
| Issuance of preferred stock | 844 | 844 | ||||||||||||||||||||
| Redemption of preferred stock | (1,699 | ) | (1,699 | ) | ||||||||||||||||||
| Common stock issued under employee plans, net, and other | 9.1 | 139 | (3 | ) | 136 | |||||||||||||||||
| Common stock repurchased | (163.5 | ) | (5,040 | ) | (5,040 | ) | ||||||||||||||||
| Balance, September 30, 2018 | $ | 22,326 | 9,858.3 | $ | 123,921 | $ | 130,747 | $ | (14,836 | ) | $ | 262,158 | ||||||||||
| Balance, December 31, 2017 | $ | 22,323 | 10,287.3 | $ | 138,089 | $ | 113,816 | $ | (7,082 | ) | $ | 267,146 | ||||||||||
| Cumulative adjustment for adoption of hedge accounting standard | (32 | ) | 57 | 25 | ||||||||||||||||||
| Adoption of accounting standard related to certain tax effects stranded in accumulated other comprehensive income (loss) | 1,270 | (1,270 | ) | — | ||||||||||||||||||
| Net income | 20,869 | 20,869 | ||||||||||||||||||||
| Net change in debt securities | (6,166 | ) | (6,166 | ) | ||||||||||||||||||
| Net change in debit valuation adjustments | 183 | 183 | ||||||||||||||||||||
| Net change in derivatives | (346 | ) | (346 | ) | ||||||||||||||||||
| Employee benefit plan adjustments | 91 | 91 | ||||||||||||||||||||
| Net change in foreign currency translation adjustments | (303 | ) | (303 | ) | ||||||||||||||||||
| Dividends declared: | ||||||||||||||||||||||
| Common | (3,952 | ) | (3,952 | ) | ||||||||||||||||||
| Preferred | (1,212 | ) | (1,212 | ) | ||||||||||||||||||
| Issuance of preferred stock | 4,515 | 4,515 | ||||||||||||||||||||
| Redemption of preferred stock | (4,512 | ) | (4,512 | ) | ||||||||||||||||||
| Common stock issued under employee plans, net, and other | 52.8 | 695 | (12 | ) | 683 | |||||||||||||||||
| Common stock repurchased | (481.8 | ) | (14,863 | ) | (14,863 | ) | ||||||||||||||||
| Balance, September 30, 2018 | $ | 22,326 | 9,858.3 | $ | 123,921 | $ | 130,747 | $ | (14,836 | ) | $ | 262,158 | ||||||||||
Bank of America | ||
| Consolidated Statement of Cash Flows | |||||||
| Nine Months Ended September 30 | |||||||
| (Dollars in millions) | 2019 | 2018 | |||||
| Operating activities | |||||||
| Net income | $ | 20,436 | $ | 20,869 | |||
| Adjustments to reconcile net income to net cash provided by operating activities: | |||||||
| Provision for credit losses | 2,649 | 2,377 | |||||
| Gains on sales of debt securities | (116 | ) | (76 | ) | |||
| Depreciation and amortization | 1,290 | 1,539 | |||||
| Net amortization of premium/discount on debt securities | 1,419 | 1,411 | |||||
| Deferred income taxes | 1,789 | 2,845 | |||||
| Stock-based compensation | 1,495 | 1,323 | |||||
| Impairment of equity method investment | 2,072 | — | |||||
| Loans held-for-sale: | |||||||
| Originations and purchases | (18,732 | ) | (16,830 | ) | |||
Proceeds from sales and paydowns of loans originally classified as held for sale and instruments from related securitization activities | 19,350 | 23,221 | |||||
| Net change in: | |||||||
| Trading and derivative assets/liabilities | (30,541 | ) | (13,347 | ) | |||
| Other assets | 613 | 13,648 | |||||
| Accrued expenses and other liabilities | (4,053 | ) | 18,266 | ||||
| Other operating activities, net | 5,003 | (1,804 | ) | ||||
| Net cash provided by operating activities | 2,674 | 53,442 | |||||
| Investing activities | |||||||
| Net change in: | |||||||
| Time deposits placed and other short-term investments | (63 | ) | 3,288 | ||||
| Federal funds sold and securities borrowed or purchased under agreements to resell | (10,464 | ) | (35,490 | ) | |||
| Debt securities carried at fair value: | |||||||
| Proceeds from sales | 43,845 | 3,070 | |||||
| Proceeds from paydowns and maturities | 57,868 | 56,458 | |||||
| Purchases | (110,658 | ) | (54,923 | ) | |||
| Held-to-maturity debt securities: | |||||||
| Proceeds from paydowns and maturities | 22,832 | 13,566 | |||||
| Purchases | (9,825 | ) | (35,215 | ) | |||
| Loans and leases: | |||||||
Proceeds from sales of loans originally classified as held for investment and instruments from related securitization activities | 9,757 | 13,600 | |||||
| Purchases | (4,016 | ) | (3,323 | ) | |||
| Other changes in loans and leases, net | (34,439 | ) | (6,432 | ) | |||
| Other investing activities, net | (2,188 | ) | (1,750 | ) | |||
| Net cash used in investing activities | (37,351 | ) | (47,151 | ) | |||
| Financing activities | |||||||
| Net change in: | |||||||
| Deposits | 11,360 | 36,104 | |||||
| Federal funds purchased and securities loaned or sold under agreements to repurchase | 15,079 | (5,313 | ) | ||||
| Short-term borrowings | 10,493 | (3,631 | ) | ||||
| Long-term debt: | |||||||
| Proceeds from issuance | 45,149 | 60,873 | |||||
| Retirement | (42,842 | ) | (44,817 | ) | |||
| Preferred stock: | |||||||
| Proceeds from issuance | 3,643 | 4,515 | |||||
| Redemption | (2,363 | ) | (4,512 | ) | |||
| Common stock repurchased | (20,396 | ) | (14,863 | ) | |||
| Cash dividends paid | (4,086 | ) | (5,150 | ) | |||
| Other financing activities, net | (794 | ) | (644 | ) | |||
| Net cash provided by financing activities | 15,243 | 22,562 | |||||
| Effect of exchange rate changes on cash and cash equivalents | (876 | ) | (1,429 | ) | |||
| Net increase (decrease) in cash and cash equivalents | (20,310 | ) | 27,424 | ||||
| Cash and cash equivalents at January 1 | 177,404 | 157,434 | |||||
| Cash and cash equivalents at September 30 | $ | 157,094 | $ | 184,858 | |||
| Consolidated Balance Sheet (continued) | |||||||
| (Dollars in millions) | September 30 2018 | December 31 2017 | |||||
| Liabilities | |||||||
| Deposits in U.S. offices: | |||||||
| Noninterest-bearing | $ | 414,853 | $ | 430,650 | |||
Interest-bearing (includes $529 and $449 measured at fair value) | 844,204 | 796,576 | |||||
| Deposits in non-U.S. offices: | |||||||
| Noninterest-bearing | 12,896 | 14,024 | |||||
| Interest-bearing | 73,696 | 68,295 | |||||
| Total deposits | 1,345,649 | 1,309,545 | |||||
Federal funds purchased and securities loaned or sold under agreements to repurchase (includes $34,242 and $36,182 measured at fair value) | 171,600 | 176,865 | |||||
| Trading account liabilities | 89,964 | 81,187 | |||||
| Derivative liabilities | 36,189 | 34,300 | |||||
Short-term borrowings (includes $1,789 and $1,494 measured at fair value) | 29,035 | 32,666 | |||||
Accrued expenses and other liabilities (includes $24,516 and $22,840 measured at fair value and $792 and $777 of reserve for unfunded lending commitments) | 170,138 | 152,123 | |||||
Long-term debt (includes $28,677 and $31,786 measured at fair value) | 234,100 | 227,402 | |||||
| Total liabilities | 2,076,675 | 2,014,088 | |||||
Commitments and contingencies (Note 7 – Securitizations and Other Variable Interest Entities and Note 10 – Commitments and Contingencies) | |||||||
| Shareholders’ equity | |||||||
Preferred stock, $0.01 par value; authorized – 100,000,000 shares; issued and outstanding – 3,843,140 and 3,837,683 shares | 22,326 | 22,323 | |||||
Common stock and additional paid-in capital, $0.01 par value; authorized – 12,800,000,000 shares; issued and outstanding – 9,858,252,641 and 10,287,302,431 shares | 123,921 | 138,089 | |||||
| Retained earnings | 130,747 | 113,816 | |||||
| Accumulated other comprehensive income (loss) | (14,836 | ) | (7,082 | ) | |||
| Total shareholders’ equity | 262,158 | 267,146 | |||||
| Total liabilities and shareholders’ equity | $ | 2,338,833 | $ | 2,281,234 | |||
| Liabilities of consolidated variable interest entities included in total liabilities above | |||||||
| Short-term borrowings | $ | 905 | $ | 312 | |||
Long-term debt (includes $11,024 and $9,872 of non-recourse debt) | 11,024 | 9,873 | |||||
All other liabilities (includes $37 and $34 of non-recourse liabilities) | 39 | 37 | |||||
| Total liabilities of consolidated variable interest entities | $ | 11,968 | $ | 10,222 | |||
| Consolidated Statement of Changes in Shareholders’ Equity | ||||||||||||||||||||||
Preferred Stock | Common Stock and Additional Paid-in Capital | Retained Earnings | Accumulated Other Comprehensive Income (Loss) | Total Shareholders’ Equity | ||||||||||||||||||
| (In millions) | Shares | Amount | ||||||||||||||||||||
| Balance, December 31, 2016 | $ | 25,220 | 10,052.6 | $ | 147,038 | $ | 101,225 | $ | (7,288 | ) | $ | 266,195 | ||||||||||
| Net income | 15,867 | 15,867 | ||||||||||||||||||||
| Net change in debt and equity securities | 931 | 931 | ||||||||||||||||||||
| Net change in debit valuation adjustments | (149 | ) | (149 | ) | ||||||||||||||||||
| Net change in derivatives | 156 | 156 | ||||||||||||||||||||
| Employee benefit plan adjustments | 80 | 80 | ||||||||||||||||||||
| Net change in foreign currency translation adjustments | 102 | 102 | ||||||||||||||||||||
| Dividends declared: | ||||||||||||||||||||||
| Common | (2,768 | ) | (2,768 | ) | ||||||||||||||||||
| Preferred | (1,292 | ) | (1,292 | ) | ||||||||||||||||||
| Common stock issued in connection with exercise of warrants and exchange of preferred stock | (2,897 | ) | 700.0 | 2,933 | (36 | ) | — | |||||||||||||||
| Common stock issued under employee plans, net and other | 39.5 | 792 | 792 | |||||||||||||||||||
| Common stock repurchased | (334.6 | ) | (7,945 | ) | (7,945 | ) | ||||||||||||||||
| Balance, September 30, 2017 | $ | 22,323 | 10,457.5 | $ | 142,818 | $ | 112,996 | $ | (6,168 | ) | $ | 271,969 | ||||||||||
| Balance, December 31, 2017 | $ | 22,323 | 10,287.3 | $ | 138,089 | $ | 113,816 | $ | (7,082 | ) | $ | 267,146 | ||||||||||
| Cumulative adjustment for adoption of hedge accounting standard | (32 | ) | 57 | 25 | ||||||||||||||||||
| Adoption of accounting standard related to certain tax effects stranded in accumulated other comprehensive income (loss) | 1,270 | (1,270 | ) | — | ||||||||||||||||||
| Net income | 20,869 | 20,869 | ||||||||||||||||||||
| Net change in debt and equity securities | (6,166 | ) | (6,166 | ) | ||||||||||||||||||
| Net change in debit valuation adjustments | 183 | 183 | ||||||||||||||||||||
| Net change in derivatives | (346 | ) | (346 | ) | ||||||||||||||||||
| Employee benefit plan adjustments | 91 | 91 | ||||||||||||||||||||
| Net change in foreign currency translation adjustments | (303 | ) | (303 | ) | ||||||||||||||||||
| Dividends declared: | ||||||||||||||||||||||
| Common | (3,952 | ) | (3,952 | ) | ||||||||||||||||||
| Preferred | (1,212 | ) | (1,212 | ) | ||||||||||||||||||
| Issuance of preferred stock | 4,515 | 4,515 | ||||||||||||||||||||
| Redemption of preferred stock | (4,512 | ) | (4,512 | ) | ||||||||||||||||||
| Common stock issued under employee plans, net and other | 52.8 | 695 | (12 | ) | 683 | |||||||||||||||||
| Common stock repurchased | (481.8 | ) | (14,863 | ) | (14,863 | ) | ||||||||||||||||
| Balance, September 30, 2018 | $ | 22,326 | 9,858.3 | $ | 123,921 | $ | 130,747 | $ | (14,836 | ) | $ | 262,158 | ||||||||||
| Consolidated Statement of Cash Flows | |||||||
| Nine Months Ended September 30 | |||||||
| (Dollars in millions) | 2018 | 2017 | |||||
| Operating activities | |||||||
| Net income | $ | 20,869 | $ | 15,867 | |||
| Adjustments to reconcile net income to net cash provided by operating activities: | |||||||
| Provision for credit losses | 2,377 | 2,395 | |||||
| Gains on sales of debt securities | (76 | ) | (278 | ) | |||
| Depreciation and premises improvements amortization | 1,135 | 1,115 | |||||
| Amortization of intangibles | 404 | 473 | |||||
| Net amortization of premium/discount on debt securities | 1,411 | 1,647 | |||||
| Deferred income taxes | 2,845 | 5,131 | |||||
| Stock-based compensation | 1,323 | 1,222 | |||||
| Loans held-for-sale: | |||||||
| Originations and purchases | (16,830 | ) | (31,404 | ) | |||
Proceeds from sales and paydowns of loans originally classified as held for sale and instruments from related securitization activities | 23,221 | 27,484 | |||||
| Net change in: | |||||||
| Trading and derivative instruments | (13,347 | ) | (12,553 | ) | |||
| Other assets | 13,648 | (9,993 | ) | ||||
| Accrued expenses and other liabilities | 18,266 | 11,201 | |||||
| Other operating activities, net | (1,804 | ) | 4,657 | ||||
| Net cash provided by operating activities | 53,442 | 16,964 | |||||
| Investing activities | |||||||
| Net change in: | |||||||
| Time deposits placed and other short-term investments | 3,288 | 368 | |||||
| Federal funds sold and securities borrowed or purchased under agreements to resell | (35,490 | ) | (18,990 | ) | |||
| Debt securities carried at fair value: | |||||||
| Proceeds from sales | 3,070 | 64,597 | |||||
| Proceeds from paydowns and maturities | 56,458 | 71,628 | |||||
| Purchases | (54,923 | ) | (134,915 | ) | |||
| Held-to-maturity debt securities: | |||||||
| Proceeds from paydowns and maturities | 13,566 | 12,194 | |||||
| Purchases | (35,215 | ) | (17,850 | ) | |||
| Loans and leases: | |||||||
Proceeds from sales of loans originally classified as held for investment and instruments from related securitization activities | 13,600 | 8,874 | |||||
| Purchases | (3,323 | ) | (4,511 | ) | |||
| Other changes in loans and leases, net | (6,432 | ) | (29,654 | ) | |||
| Other investing activities, net | (1,750 | ) | 8,635 | ||||
| Net cash used in investing activities | (47,151 | ) | (39,624 | ) | |||
| Financing activities | |||||||
| Net change in: | |||||||
| Deposits | 36,104 | 23,483 | |||||
| Federal funds purchased and securities loaned or sold under agreements to repurchase | (5,313 | ) | 19,987 | ||||
| Short-term borrowings | (3,631 | ) | 8,583 | ||||
| Long-term debt: | |||||||
| Proceeds from issuance | 60,873 | 50,702 | |||||
| Retirement | (44,817 | ) | (44,652 | ) | |||
| Preferred stock: | |||||||
| Proceeds from issuance | 4,515 | — | |||||
| Redemption | (4,512 | ) | — | ||||
| Common stock repurchased | (14,863 | ) | (7,945 | ) | |||
| Cash dividends paid | (5,150 | ) | (4,124 | ) | |||
| Other financing activities, net | (644 | ) | (609 | ) | |||
| Net cash provided by financing activities | 22,562 | 45,425 | |||||
| Effect of exchange rate changes on cash and cash equivalents | (1,429 | ) | 1,878 | ||||
| Net increase in cash and cash equivalents | 27,424 | 24,643 | |||||
| Cash and cash equivalents at January 1 | 157,434 | 147,738 | |||||
| Cash and cash equivalents at September 30 | $ | 184,858 | $ | 172,381 | |||
Bank of America | ||
| Three Months Ended September 30 | Nine Months Ended September 30 | Three Months Ended September 30 | Nine Months Ended September 30 | |||||||||||||||||||||||||||
| (Dollars in millions) | 2018 | 2017 | 2018 | 2017 | 2019 | 2018 | 2019 | 2018 | ||||||||||||||||||||||
| Net interest income | ||||||||||||||||||||||||||||||
| Interest income | ||||||||||||||||||||||||||||||
| Loans and leases | $ | 10,894 | $ | 10,401 | $ | 32,721 | $ | 30,095 | ||||||||||||||||||||||
| Debt securities | 2,829 | 2,986 | 8,965 | 8,646 | ||||||||||||||||||||||||||
| Federal funds sold and securities borrowed or purchased under agreements to resell | 1,242 | 799 | 3,746 | 2,130 | ||||||||||||||||||||||||||
| Trading account assets | 1,319 | 1,172 | 3,962 | 3,506 | ||||||||||||||||||||||||||
| Other interest income | 1,632 | 1,607 | 4,916 | 4,556 | ||||||||||||||||||||||||||
| Total interest income | 17,916 | 16,965 | 54,310 | 48,933 | ||||||||||||||||||||||||||
| Interest expense | ||||||||||||||||||||||||||||||
| Deposits | 1,880 | 1,230 | 5,640 | 2,933 | ||||||||||||||||||||||||||
| Short-term borrowings | 1,876 | 1,526 | 5,725 | 4,123 | ||||||||||||||||||||||||||
| Trading account liabilities | 303 | 335 | 967 | 1,040 | ||||||||||||||||||||||||||
| Long-term debt | 1,670 | 1,813 | 5,227 | 5,179 | ||||||||||||||||||||||||||
| Total interest expense | 5,729 | 4,904 | 17,559 | 13,275 | ||||||||||||||||||||||||||
| Net interest income | $ | 12,187 | $ | 12,061 | $ | 36,751 | $ | 35,658 | ||||||||||||||||||||||
| Noninterest income | ||||||||||||||||||||||||||||||
| Fees and commissions | ||||||||||||||||||||||||||||||
| Card income | ||||||||||||||||||||||||||||||
Interchange fees (1) | $ | 978 | $ | 941 | $ | 3,018 | $ | 2,883 | $ | 963 | $ | 925 | $ | 2,827 | $ | 2,850 | ||||||||||||||
| Other card income | 492 | 488 | 1,451 | 1,464 | 502 | 492 | 1,459 | 1,452 | ||||||||||||||||||||||
| Total card income | 1,470 | 1,429 | 4,469 | 4,347 | 1,465 | 1,417 | 4,286 | 4,302 | ||||||||||||||||||||||
| Service charges | ||||||||||||||||||||||||||||||
| Deposit-related fees | 1,682 | 1,691 | 5,009 | 5,040 | 1,690 | 1,682 | 4,908 | 5,008 | ||||||||||||||||||||||
| Lending-related fees | 279 | 277 | 827 | 823 | 285 | 279 | 809 | 828 | ||||||||||||||||||||||
| Total service charges | 1,961 | 1,968 | 5,836 | 5,863 | 1,975 | 1,961 | 5,717 | 5,836 | ||||||||||||||||||||||
| Investment and brokerage services | ||||||||||||||||||||||||||||||
| Asset management fees | 2,576 | 2,367 | 7,652 | 6,855 | 2,597 | 2,576 | 7,591 | 7,653 | ||||||||||||||||||||||
| Brokerage fees | 918 | 1,070 | 2,964 | 3,459 | 897 | 918 | 2,733 | 2,963 | ||||||||||||||||||||||
| Total investment and brokerage services | 3,494 | 3,437 | 10,616 | 10,314 | 3,494 | 3,494 | 10,324 | 10,616 | ||||||||||||||||||||||
| Investment banking income | ||||||||||||||||||||||||||||||
| Investment banking fees | ||||||||||||||||||||||||||||||
| Underwriting income | 701 | 698 | 2,160 | 2,185 | 740 | 701 | 2,198 | 2,160 | ||||||||||||||||||||||
| Syndication fees | 241 | 405 | 958 | 1,146 | 341 | 241 | 887 | 958 | ||||||||||||||||||||||
| Financial advisory services | 262 | 374 | 861 | 1,262 | 452 | 262 | 1,083 | 861 | ||||||||||||||||||||||
| Total investment banking income | 1,204 | 1,477 | 3,979 | 4,593 | ||||||||||||||||||||||||||
| Trading account profits | 1,893 | 1,837 | 6,907 | 6,124 | ||||||||||||||||||||||||||
| Total investment banking fees | 1,533 | 1,204 | 4,168 | 3,979 | ||||||||||||||||||||||||||
| Total fees and commissions | 8,467 | 8,076 | 24,495 | 24,733 | ||||||||||||||||||||||||||
| Trading account income | 1,707 | 1,717 | 6,390 | 6,421 | ||||||||||||||||||||||||||
| Other income | 885 | 530 | 1,576 | 2,470 | 446 | 870 | 1,259 | 1,531 | ||||||||||||||||||||||
| Total noninterest income | $ | 10,907 | $ | 10,678 | $ | 33,383 | $ | 33,711 | $ | 10,620 | $ | 10,663 | $ | 32,144 | $ | 32,685 | ||||||||||||||
(1) | Gross interchange fees were $2.6 billion and $2.4 billion |
51Bank of America | ||
| September 30, 2018 | September 30, 2019 | |||||||||||||||||||||||||||||||||||||||||||||||||||||
| Gross Derivative Assets | Gross Derivative Liabilities | Gross Derivative Assets | Gross Derivative Liabilities | |||||||||||||||||||||||||||||||||||||||||||||||||||
| (Dollars in billions) | Contract/ Notional (1) | Trading and Other Risk Management Derivatives | Qualifying Accounting Hedges | Total | Trading and Other Risk Management Derivatives | Qualifying Accounting Hedges | Total | Contract/ Notional (1) | Trading and Other Risk Management Derivatives | Qualifying Accounting Hedges | Total | Trading and Other Risk Management Derivatives | Qualifying Accounting Hedges | Total | ||||||||||||||||||||||||||||||||||||||||
| Interest rate contracts | ||||||||||||||||||||||||||||||||||||||||||||||||||||||
| Swaps | $ | 17,788.7 | $ | 138.9 | $ | 1.3 | $ | 140.2 | $ | 132.7 | $ | 4.5 | $ | 137.2 | $ | 19,994.7 | $ | 184.3 | $ | 12.6 | $ | 196.9 | $ | 194.3 | $ | 0.3 | $ | 194.6 | ||||||||||||||||||||||||||
| Futures and forwards | 6,270.1 | 1.3 | — | 1.3 | 1.2 | — | 1.2 | 5,564.1 | 1.4 | — | 1.4 | 1.3 | — | 1.3 | ||||||||||||||||||||||||||||||||||||||||
| Written options | 1,433.4 | — | — | — | 26.7 | — | 26.7 | 1,777.5 | — | — | — | 42.1 | — | 42.1 | ||||||||||||||||||||||||||||||||||||||||
| Purchased options | 1,488.2 | 28.7 | — | 28.7 | — | — | — | 1,841.9 | 47.9 | — | 47.9 | — | — | — | ||||||||||||||||||||||||||||||||||||||||
| Foreign exchange contracts | ||||||||||||||||||||||||||||||||||||||||||||||||||||||
| Swaps | 1,904.9 | 49.6 | 1.6 | 51.2 | 50.4 | 2.4 | 52.8 | 1,821.8 | 34.8 | 1.3 | 36.1 | 38.5 | 1.8 | 40.3 | ||||||||||||||||||||||||||||||||||||||||
| Spot, futures and forwards | 4,568.7 | 42.1 | 0.7 | 42.8 | 41.7 | 0.5 | 42.2 | 5,037.1 | 41.8 | 0.6 | 42.4 | 42.0 | 0.2 | 42.2 | ||||||||||||||||||||||||||||||||||||||||
| Written options | 300.4 | — | — | — | 5.1 | — | 5.1 | 305.5 | — | — | — | 4.4 | — | 4.4 | ||||||||||||||||||||||||||||||||||||||||
| Purchased options | 296.0 | 4.4 | — | 4.4 | — | — | — | 322.0 | 4.8 | — | 4.8 | — | — | — | ||||||||||||||||||||||||||||||||||||||||
| Equity contracts | ||||||||||||||||||||||||||||||||||||||||||||||||||||||
| Swaps | 278.2 | 4.9 | — | 4.9 | 4.7 | — | 4.7 | 282.4 | 5.4 | — | 5.4 | 6.0 | — | 6.0 | ||||||||||||||||||||||||||||||||||||||||
| Futures and forwards | 104.8 | 1.0 | — | 1.0 | 1.3 | — | 1.3 | 122.2 | 0.3 | — | 0.3 | 0.9 | — | 0.9 | ||||||||||||||||||||||||||||||||||||||||
| Written options | 651.4 | — | — | — | 30.0 | — | 30.0 | 784.4 | — | — | — | 32.1 | — | 32.1 | ||||||||||||||||||||||||||||||||||||||||
| Purchased options | 586.1 | 40.0 | — | 40.0 | — | — | — | 734.5 | 39.1 | — | 39.1 | — | — | — | ||||||||||||||||||||||||||||||||||||||||
| Commodity contracts | ||||||||||||||||||||||||||||||||||||||||||||||||||||||
| Swaps | 48.2 | 2.4 | — | 2.4 | 5.0 | — | 5.0 | 41.2 | 2.1 | — | 2.1 | 4.0 | — | 4.0 | ||||||||||||||||||||||||||||||||||||||||
| Futures and forwards | 63.5 | 3.2 | — | 3.2 | 0.5 | — | 0.5 | 63.3 | 3.3 | — | 3.3 | 0.6 | — | 0.6 | ||||||||||||||||||||||||||||||||||||||||
| Written options | 32.5 | — | — | — | 2.1 | — | 2.1 | 36.2 | — | — | — | 1.9 | — | 1.9 | ||||||||||||||||||||||||||||||||||||||||
| Purchased options | 29.5 | 2.1 | — | 2.1 | — | — | — | 36.8 | 1.8 | — | 1.8 | — | — | — | ||||||||||||||||||||||||||||||||||||||||
Credit derivatives (2) | ||||||||||||||||||||||||||||||||||||||||||||||||||||||
| Purchased credit derivatives: | ||||||||||||||||||||||||||||||||||||||||||||||||||||||
| Credit default swaps | 430.3 | 4.9 | — | 4.9 | 9.8 | — | 9.8 | 403.4 | 3.5 | — | 3.5 | 5.5 | — | 5.5 | ||||||||||||||||||||||||||||||||||||||||
| Total return swaps/options | 64.6 | 0.4 | — | 0.4 | 0.9 | — | 0.9 | 64.2 | 0.2 | — | 0.2 | 1.7 | — | 1.7 | ||||||||||||||||||||||||||||||||||||||||
| Written credit derivatives: | ||||||||||||||||||||||||||||||||||||||||||||||||||||||
| Credit default swaps | 398.2 | 9.3 | — | 9.3 | 4.3 | — | 4.3 | 363.0 | 5.3 | — | 5.3 | 2.5 | — | 2.5 | ||||||||||||||||||||||||||||||||||||||||
| Total return swaps/options | 62.5 | 0.5 | — | 0.5 | 0.3 | — | 0.3 | 58.3 | 0.9 | — | 0.9 | 0.4 | — | 0.4 | ||||||||||||||||||||||||||||||||||||||||
| Gross derivative assets/liabilities | $ | 333.7 | $ | 3.6 | $ | 337.3 | $ | 316.7 | $ | 7.4 | $ | 324.1 | $ | 376.9 | $ | 14.5 | $ | 391.4 | $ | 378.2 | $ | 2.3 | $ | 380.5 | ||||||||||||||||||||||||||||||
| Less: Legally enforceable master netting agreements | (259.7 | ) | (259.7 | ) | (305.6 | ) | (305.6 | ) | ||||||||||||||||||||||||||||||||||||||||||||||
| Less: Cash collateral received/paid | (32.0 | ) | (28.2 | ) | (40.7 | ) | (36.9 | ) | ||||||||||||||||||||||||||||||||||||||||||||||
| Total derivative assets/liabilities | $ | 45.6 | $ | 36.2 | $ | 45.1 | $ | 38.0 | ||||||||||||||||||||||||||||||||||||||||||||||
(1) | Represents the total contract/notional amount of derivative assets and liabilities outstanding. |
(2) | The net derivative asset (liability) and notional amount of written credit derivatives for which the Corporation held purchased credit derivatives with identical underlying referenced names were $ |
| December 31, 2017 | December 31, 2018 | |||||||||||||||||||||||||||||||||||||||||||||||||||||
| Gross Derivative Assets | Gross Derivative Liabilities | Gross Derivative Assets | Gross Derivative Liabilities | |||||||||||||||||||||||||||||||||||||||||||||||||||
| (Dollars in billions) | Contract/ Notional (1) | Trading and Other Risk Management Derivatives | Qualifying Accounting Hedges | Total | Trading and Other Risk Management Derivatives | Qualifying Accounting Hedges | Total | Contract/ Notional (1) | Trading and Other Risk Management Derivatives | Qualifying Accounting Hedges | Total | Trading and Other Risk Management Derivatives | Qualifying Accounting Hedges | Total | ||||||||||||||||||||||||||||||||||||||||
| Interest rate contracts | ||||||||||||||||||||||||||||||||||||||||||||||||||||||
| Swaps | $ | 15,416.4 | $ | 175.1 | $ | 2.9 | $ | 178.0 | $ | 172.5 | $ | 1.7 | $ | 174.2 | $ | 15,977.9 | $ | 141.0 | $ | 3.2 | $ | 144.2 | $ | 138.9 | $ | 2.0 | $ | 140.9 | ||||||||||||||||||||||||||
| Futures and forwards | 4,332.4 | 0.5 | — | 0.5 | 0.5 | — | 0.5 | 3,656.6 | 4.7 | — | 4.7 | 5.0 | — | 5.0 | ||||||||||||||||||||||||||||||||||||||||
| Written options | 1,170.5 | — | — | — | 35.5 | — | 35.5 | 1,584.9 | — | — | — | 28.6 | — | 28.6 | ||||||||||||||||||||||||||||||||||||||||
| Purchased options | 1,184.5 | 37.6 | — | 37.6 | — | — | — | 1,614.0 | 30.8 | — | 30.8 | — | — | — | ||||||||||||||||||||||||||||||||||||||||
| Foreign exchange contracts | ||||||||||||||||||||||||||||||||||||||||||||||||||||||
| Swaps | 2,011.1 | 35.6 | 2.2 | 37.8 | 36.1 | 2.7 | 38.8 | 1,704.8 | 38.8 | 1.4 | 40.2 | 42.2 | 2.3 | 44.5 | ||||||||||||||||||||||||||||||||||||||||
| Spot, futures and forwards | 3,543.3 | 39.1 | 0.7 | 39.8 | 39.1 | 0.8 | 39.9 | 4,276.0 | 39.8 | 0.4 | 40.2 | 39.3 | 0.3 | 39.6 | ||||||||||||||||||||||||||||||||||||||||
| Written options | 291.8 | — | — | — | 5.1 | — | 5.1 | 256.7 | — | — | — | 5.0 | — | 5.0 | ||||||||||||||||||||||||||||||||||||||||
| Purchased options | 271.9 | 4.6 | — | 4.6 | — | — | — | 240.4 | 4.6 | — | 4.6 | — | — | — | ||||||||||||||||||||||||||||||||||||||||
| Equity contracts | ||||||||||||||||||||||||||||||||||||||||||||||||||||||
| Swaps | 265.6 | 4.8 | — | 4.8 | 4.4 | — | 4.4 | 253.6 | 7.7 | — | 7.7 | 8.4 | — | 8.4 | ||||||||||||||||||||||||||||||||||||||||
| Futures and forwards | 106.9 | 1.5 | — | 1.5 | 0.9 | — | 0.9 | 100.0 | 2.1 | — | 2.1 | 0.3 | — | 0.3 | ||||||||||||||||||||||||||||||||||||||||
| Written options | 480.8 | — | — | — | 23.9 | — | 23.9 | 597.1 | — | — | — | 27.5 | — | 27.5 | ||||||||||||||||||||||||||||||||||||||||
| Purchased options | 428.2 | 24.7 | — | 24.7 | — | — | — | 549.4 | 36.0 | — | 36.0 | — | — | — | ||||||||||||||||||||||||||||||||||||||||
| Commodity contracts | ||||||||||||||||||||||||||||||||||||||||||||||||||||||
| Swaps | 46.1 | 1.8 | — | 1.8 | 4.6 | — | 4.6 | 43.1 | 2.7 | — | 2.7 | 4.5 | — | 4.5 | ||||||||||||||||||||||||||||||||||||||||
| Futures and forwards | 47.1 | 3.5 | — | 3.5 | 0.6 | — | 0.6 | 51.7 | 3.2 | — | 3.2 | 0.5 | — | 0.5 | ||||||||||||||||||||||||||||||||||||||||
| Written options | 21.7 | — | — | — | 1.4 | — | 1.4 | 27.5 | — | — | — | 2.2 | — | 2.2 | ||||||||||||||||||||||||||||||||||||||||
| Purchased options | 22.9 | 1.4 | — | 1.4 | — | — | — | 23.4 | 1.7 | — | 1.7 | — | — | — | ||||||||||||||||||||||||||||||||||||||||
Credit derivatives (2) | ||||||||||||||||||||||||||||||||||||||||||||||||||||||
| Purchased credit derivatives: | ||||||||||||||||||||||||||||||||||||||||||||||||||||||
| Credit default swaps | 470.9 | 4.1 | — | 4.1 | 11.1 | — | 11.1 | 408.1 | 5.3 | — | 5.3 | 4.9 | — | 4.9 | ||||||||||||||||||||||||||||||||||||||||
| Total return swaps/options | 54.1 | 0.1 | — | 0.1 | 1.3 | — | 1.3 | 84.5 | 0.4 | — | 0.4 | 1.0 | — | 1.0 | ||||||||||||||||||||||||||||||||||||||||
| Written credit derivatives: | ||||||||||||||||||||||||||||||||||||||||||||||||||||||
| Credit default swaps | 448.2 | 10.6 | — | 10.6 | 3.6 | — | 3.6 | 371.9 | 4.4 | — | 4.4 | 4.3 | — | 4.3 | ||||||||||||||||||||||||||||||||||||||||
| Total return swaps/options | 55.2 | 0.8 | — | 0.8 | 0.2 | — | 0.2 | 87.3 | 0.6 | — | 0.6 | 0.6 | — | 0.6 | ||||||||||||||||||||||||||||||||||||||||
| Gross derivative assets/liabilities | $ | 345.8 | $ | 5.8 | $ | 351.6 | $ | 340.8 | $ | 5.2 | $ | 346.0 | $ | 323.8 | $ | 5.0 | $ | 328.8 | $ | 313.2 | $ | 4.6 | $ | 317.8 | ||||||||||||||||||||||||||||||
| Less: Legally enforceable master netting agreements | (279.2 | ) | (279.2 | ) | (252.7 | ) | (252.7 | ) | ||||||||||||||||||||||||||||||||||||||||||||||
| Less: Cash collateral received/paid | (34.6 | ) | (32.5 | ) | (32.4 | ) | (27.2 | ) | ||||||||||||||||||||||||||||||||||||||||||||||
| Total derivative assets/liabilities | $ | 37.8 | $ | 34.3 | $ | 43.7 | $ | 37.9 | ||||||||||||||||||||||||||||||||||||||||||||||
(1) | Represents the total contract/notional amount of derivative assets and liabilities outstanding. |
(2) | The net derivative asset (liability) and notional amount of written credit derivatives for which the Corporation held purchased credit derivatives with identical underlying referenced names were $ |
53Bank of America | ||
Offsetting of Derivatives (1) | ||||||||||||||||||||||||||||||
Derivative Assets | Derivative Liabilities | Derivative Assets | Derivative Liabilities | Derivative Assets | Derivative Liabilities | Derivative Assets | Derivative Liabilities | |||||||||||||||||||||||
| (Dollars in billions) | September 30, 2018 | December 31, 2017 | September 30, 2019 | December 31, 2018 | ||||||||||||||||||||||||||
| Interest rate contracts | ||||||||||||||||||||||||||||||
| Over-the-counter | $ | 165.9 | $ | 161.0 | $ | 211.7 | $ | 206.0 | $ | 237.1 | $ | 229.7 | $ | 174.2 | $ | 169.4 | ||||||||||||||
| Exchange-traded | — | 0.1 | — | — | ||||||||||||||||||||||||||
| Over-the-counter cleared | 2.7 | 2.5 | 1.9 | 1.8 | 7.0 | 6.5 | 4.8 | 4.0 | ||||||||||||||||||||||
| Foreign exchange contracts | ||||||||||||||||||||||||||||||
| Over-the-counter | 95.2 | 97.1 | 78.7 | 80.8 | 80.8 | 84.3 | 82.5 | 86.3 | ||||||||||||||||||||||
| Over-the-counter cleared | 1.1 | 1.0 | 0.9 | 0.7 | 0.6 | 0.6 | 0.9 | 0.9 | ||||||||||||||||||||||
| Equity contracts | ||||||||||||||||||||||||||||||
| Over-the-counter | 27.2 | 17.3 | 18.3 | 16.2 | 19.8 | 14.6 | 24.6 | 14.6 | ||||||||||||||||||||||
| Exchange-traded | 13.5 | 12.2 | 9.1 | 8.5 | 16.8 | 16.7 | 16.1 | 15.1 | ||||||||||||||||||||||
| Commodity contracts | ||||||||||||||||||||||||||||||
| Over-the-counter | 3.6 | 5.1 | 2.9 | 4.4 | 3.2 | 4.4 | 3.5 | 4.5 | ||||||||||||||||||||||
| Exchange-traded | 1.0 | 1.1 | 0.7 | 0.8 | 0.9 | 0.8 | 1.0 | 0.9 | ||||||||||||||||||||||
| Over-the-counter cleared | 0.1 | 0.1 | — | — | ||||||||||||||||||||||||||
| Credit derivatives | ||||||||||||||||||||||||||||||
| Over-the-counter | 7.9 | 8.4 | 9.1 | 9.6 | 6.7 | 7.3 | 7.7 | 8.2 | ||||||||||||||||||||||
| Over-the-counter cleared | 6.9 | 6.6 | 6.1 | 6.0 | 2.7 | 2.3 | 2.5 | 2.3 | ||||||||||||||||||||||
| Total gross derivative assets/liabilities, before netting | ||||||||||||||||||||||||||||||
| Over-the-counter | 299.8 | 288.9 | 320.7 | 317.0 | 347.6 | 340.3 | 292.5 | 283.0 | ||||||||||||||||||||||
| Exchange-traded | 14.5 | 13.3 | 9.8 | 9.3 | 17.7 | 17.6 | 17.1 | 16.0 | ||||||||||||||||||||||
| Over-the-counter cleared | 10.7 | 10.1 | 8.9 | 8.5 | 10.4 | 9.5 | 8.2 | 7.2 | ||||||||||||||||||||||
| Less: Legally enforceable master netting agreements and cash collateral received/paid | ||||||||||||||||||||||||||||||
| Over-the-counter | (270.1 | ) | (266.1 | ) | (296.9 | ) | (294.6 | ) | (323.8 | ) | (320.3 | ) | (264.4 | ) | (259.2 | ) | ||||||||||||||
| Exchange-traded | (11.9 | ) | (11.9 | ) | (8.6 | ) | (8.6 | ) | (12.7 | ) | (12.7 | ) | (13.5 | ) | (13.5 | ) | ||||||||||||||
| Over-the-counter cleared | (9.7 | ) | (9.9 | ) | (8.3 | ) | (8.5 | ) | (9.8 | ) | (9.5 | ) | (7.2 | ) | (7.2 | ) | ||||||||||||||
| Derivative assets/liabilities, after netting | 33.3 | 24.4 | 25.6 | 23.1 | 29.4 | 24.9 | 32.7 | 26.3 | ||||||||||||||||||||||
Other gross derivative assets/liabilities (2) | 12.3 | 11.8 | 12.2 | 11.2 | 15.7 | 13.1 | 11.0 | 11.6 | ||||||||||||||||||||||
| Total derivative assets/liabilities | 45.6 | 36.2 | 37.8 | 34.3 | 45.1 | 38.0 | 43.7 | 37.9 | ||||||||||||||||||||||
Less: Financial instruments collateral (3) | (18.4 | ) | (9.3 | ) | (11.2 | ) | (10.4 | ) | (15.0 | ) | (12.7 | ) | (16.3 | ) | (8.6 | ) | ||||||||||||||
| Total net derivative assets/liabilities | $ | 27.2 | $ | 26.9 | $ | 26.6 | $ | 23.9 | $ | 30.1 | $ | 25.3 | $ | 27.4 | $ | 29.3 | ||||||||||||||
(1) | Over-the-counter (OTC) derivatives include bilateral transactions between the Corporation and a particular counterparty. OTC-cleared derivatives include bilateral transactions between the Corporation and a counterparty where the transaction is cleared through a |
(2) | Consists of derivatives entered into under master netting agreements where the enforceability of these agreements is uncertain under bankruptcy laws in some countries or industries. |
(3) | Amounts are limited to the derivative asset/liability balance and, accordingly, do not include excess collateral received/pledged. Financial instruments collateral includes securities collateral received or pledged and cash securities held and posted at third-party custodians that are not offset on the Consolidated Balance Sheet but shown as a reduction to derive net derivative assets and liabilities. |
| Gains and Losses on Derivatives Designated as Fair Value Hedges | |||||||||||||||
| Three Months Ended September 30, 2019 | Three Months Ended September 30, 2018 | ||||||||||||||
| (Dollars in millions) | Derivative | Hedged Item | Derivative | Hedged Item | |||||||||||
Interest rate risk on long-term debt (1) | $ | 3,328 | $ | (3,342 | ) | $ | (1,129 | ) | $ | 1,122 | |||||
Interest rate and foreign currency risk on long-term debt (2) | (110 | ) | 111 | (182 | ) | 207 | |||||||||
Interest rate risk on available-for-sale securities (3) | (33 | ) | 30 | 12 | (12 | ) | |||||||||
| Total | $ | 3,185 | $ | (3,201 | ) | $ | (1,299 | ) | $ | 1,317 | |||||
| Nine Months Ended September 30, 2019 | Nine Months Ended September 30, 2018 | ||||||||||||||
| Derivative | Hedged Item | Derivative | Hedged Item | ||||||||||||
Interest rate risk on long-term debt (1) | $ | 9,373 | $ | (9,392 | ) | $ | (4,303 | ) | $ | 4,179 | |||||
Interest rate and foreign currency risk on long-term debt (2) | (12 | ) | 31 | (927 | ) | 795 | |||||||||
Interest rate risk on available-for-sale securities (3) | (133 | ) | 128 | (20 | ) | 19 | |||||||||
| Total | $ | 9,228 | $ | (9,233 | ) | $ | (5,250 | ) | $ | 4,993 | |||||
| Gains and Losses on Derivatives Designated as Fair Value Hedges | |||||||||||||||||||
| Three Months Ended September 30, 2018 | Three Months Ended September 30, 2017 | ||||||||||||||||||
| (Dollars in millions) | Derivative | Hedged Item | Derivative | Hedged Item | Hedge Ineffectiveness | ||||||||||||||
Interest rate risk on long-term debt (1) | $ | (1,129 | ) | $ | 1,122 | $ | (273 | ) | $ | 169 | $ | (104 | ) | ||||||
Interest rate and foreign currency risk on long-term debt (2, 3) | (182 | ) | 207 | 607 | (593 | ) | 14 | ||||||||||||
Interest rate risk on available-for-sale securities (4) | 12 | (12 | ) | (8 | ) | 7 | (1 | ) | |||||||||||
| Total | $ | (1,299 | ) | $ | 1,317 | $ | 326 | $ | (417 | ) | $ | (91 | ) | ||||||
| Nine Months Ended September 30, 2018 | Nine Months Ended September 30, 2017 | ||||||||||||||||||
| Derivative | Hedged Item | Derivative | Hedged Item | Hedge Ineffectiveness | |||||||||||||||
Interest rate risk on long-term debt (1) | $ | (4,303 | ) | $ | 4,179 | $ | (751 | ) | $ | 313 | $ | (438 | ) | ||||||
Interest rate and foreign currency risk on long-term debt (2, 3) | (927 | ) | 795 | 1,631 | (1,603 | ) | 28 | ||||||||||||
Interest rate risk on available-for-sale securities (4) | (20 | ) | 19 | (71 | ) | 40 | (31 | ) | |||||||||||
| Total | $ | (5,250 | ) | $ | 4,993 | $ | 809 | $ | (1,250 | ) | $ | (441 | ) | ||||||
(1) | Amounts are recorded in interest expense in the Consolidated Statement of Income. |
(2) | For the three and nine months ended September 30, |
(3) |
| Amounts are recorded in interest income in the Consolidated Statement of Income. |
| Designated Fair Value Hedged Assets (Liabilities) | ||||||||||||||||||||||
| September 30, 2018 | September 30, 2019 | December 31, 2018 | ||||||||||||||||||||
| (Dollars in millions) | Carrying Value | Cumulative Fair Value Adjustments (1) | Carrying Value | Cumulative Fair Value Adjustments (1) | Carrying Value | Cumulative Fair Value Adjustments (1) | ||||||||||||||||
| Long-term debt | $ | (137,610 | ) | $ | 1,839 | $ | (165,021 | ) | $ | (11,932 | ) | $ | (138,682 | ) | $ | (2,117 | ) | |||||
Available-for-sale securities (2) | 951 | (61 | ) | |||||||||||||||||||
Available-for-sale debt securities (2) | 1,684 | 92 | 981 | (29 | ) | |||||||||||||||||
(1) | For assets, increase (decrease) to carrying value and for liabilities, (increase) decrease to carrying value. |
(2) |
| Gains and Losses on Derivatives Designated as Cash Flow and Net Investment Hedges | |||||||||||||||
Gains (Losses) Recognized in Accumulated OCI on Derivatives | Gains (Losses) in Income Reclassified from Accumulated OCI | Gains (Losses) Recognized in Accumulated OCI on Derivatives | Gains (Losses) in Income Reclassified from Accumulated OCI | ||||||||||||
| (Dollars in millions, amounts pretax) | Three Months Ended September 30, 2019 | Nine Months Ended September 30, 2019 | |||||||||||||
| Cash flow hedges | |||||||||||||||
Interest rate risk on variable-rate assets (1) | $ | 125 | $ | (27 | ) | $ | 743 | $ | (78 | ) | |||||
| Net investment hedges | |||||||||||||||
Foreign exchange risk (2) | $ | 786 | $ | 362 | $ | 590 | $ | 363 | |||||||
| Three Months Ended September 30, 2018 | Nine Months Ended September 30, 2018 | ||||||||||||||
| Cash flow hedges | |||||||||||||||
Interest rate risk on variable-rate assets (1) | $ | (54 | ) | $ | (51 | ) | $ | (553 | ) | $ | (134 | ) | |||
Price risk on certain restricted stock awards (3) | — | — | 4 | 27 | |||||||||||
| Total | $ | (54 | ) | $ | (51 | ) | $ | (549 | ) | $ | (107 | ) | |||
| Net investment hedges | |||||||||||||||
Foreign exchange risk (2) | $ | 181 | $ | 383 | $ | 860 | $ | 382 | |||||||
| Gains and Losses on Derivatives Designated as Cash Flow and Net Investment Hedges | |||||||||||||||
| Gains (Losses) Recognized in Accumulated OCI on Derivatives | Gains (Losses) in Income Reclassified from Accumulated OCI | Gains (Losses) Recognized in Accumulated OCI on Derivatives | Gains (Losses) in Income Reclassified from Accumulated OCI | ||||||||||||
| (Dollars in millions, amounts pretax) | Three Months Ended September 30, 2018 | Nine Months Ended September 30, 2018 | |||||||||||||
| Cash flow hedges | |||||||||||||||
Interest rate risk on variable-rate assets (1) | $ | (54 | ) | $ | (51 | ) | $ | (553 | ) | $ | (134 | ) | |||
Price risk on certain restricted stock awards (2) | — | — | 4 | 27 | |||||||||||
| Total | $ | (54 | ) | $ | (51 | ) | $ | (549 | ) | $ | (107 | ) | |||
| Net investment hedges | |||||||||||||||
Foreign exchange risk (3) | $ | 181 | $ | 383 | $ | 860 | $ | 382 | |||||||
| Three Months Ended September 30, 2017 | Nine Months Ended September 30, 2017 | ||||||||||||||
| Cash flow hedges | |||||||||||||||
Interest rate risk on variable-rate assets (1) | $ | 11 | $ | (54 | ) | $ | 38 | $ | (274 | ) | |||||
Price risk on certain restricted stock awards (2) | 7 | 32 | 41 | 103 | |||||||||||
| Total | $ | 18 | $ | (22 | ) | $ | 79 | $ | (171 | ) | |||||
| Net investment hedges | |||||||||||||||
Foreign exchange risk (3) | $ | (427 | ) | $ | (3 | ) | $ | (1,541 | ) | $ | 1,811 | ||||
(1) | Amounts reclassified from accumulated OCI are recorded in interest income in the Consolidated Statement of Income. |
(2) |
Amounts reclassified from accumulated OCI are recorded in other income in the Consolidated Statement of Income. For the three and nine months ended September 30, |
(3) | Amounts reclassified from accumulated OCI are recorded in compensation and benefits expense in the Consolidated Statement of Income. |
55Bank of America | ||
| Gains and Losses on Other Risk Management Derivatives | |||||||||||||||
| Three Months Ended September 30 | Nine Months Ended September 30 | ||||||||||||||
| (Dollars in millions) | 2019 | 2018 | 2019 | 2018 | |||||||||||
Interest rate risk on mortgage activities (1) | $ | 110 | $ | (45 | ) | $ | 361 | $ | (206 | ) | |||||
| Credit risk on loans | (8 | ) | (2 | ) | (48 | ) | (7 | ) | |||||||
Interest rate and foreign currency risk on ALM activities (2) | 2,517 | 487 | 3,337 | 1,050 | |||||||||||
| Gains and Losses on Other Risk Management Derivatives | |||||||||||||||
| Three Months Ended September 30 | Nine Months Ended September 30 | ||||||||||||||
| (Dollars in millions) | 2018 | 2017 | 2018 | 2017 | |||||||||||
Interest rate risk on mortgage activities (1) | $ | (45 | ) | $ | 1 | $ | (206 | ) | $ | 32 | |||||
| Credit risk on loans | (2 | ) | — | (7 | ) | (3 | ) | ||||||||
Interest rate and foreign currency risk on ALM activities (2) | 487 | 26 | 1,050 | (26 | ) | ||||||||||
(1) | Primarily related to hedges of interest rate risk on mortgage servicing rights (MSRs) and interest rate lock commitments (IRLCs) to originate mortgage loans that will be held for sale. The net gains on IRLCs, which are not included in the table but are considered derivative instruments, were $ |
(2) | Primarily related to hedges of debt securities carried at fair value and hedges of foreign currency-denominated debt. |
| Sales and Trading Revenue | Sales and Trading Revenue | |||||||||||||||||||||||||||||||||||||||||||||||||||||||||||||
| Trading Account Profits | Net Interest Income | Other (1) | Total | Trading Account Profits | Net Interest Income | Other (1) | Total | Trading Account Income | Net Interest Income | Other (1) | Total | Trading Account Income | Net Interest Income | Other (1) | Total | |||||||||||||||||||||||||||||||||||||||||||||||
| (Dollars in millions) | Three Months Ended September 30, 2018 | Nine Months Ended September 30, 2018 | Three Months Ended September 30, 2019 | Nine Months Ended September 30, 2019 | ||||||||||||||||||||||||||||||||||||||||||||||||||||||||||
| Interest rate risk | $ | 182 | $ | 307 | $ | 134 | $ | 623 | $ | 1,070 | $ | 946 | $ | 203 | $ | 2,219 | $ | 5 | $ | 480 | $ | 217 | $ | 702 | $ | 595 | $ | 1,289 | $ | 362 | $ | 2,246 | ||||||||||||||||||||||||||||||
| Foreign exchange risk | 379 | (2 | ) | 2 | 379 | 1,175 | (15 | ) | 5 | 1,165 | 325 | 14 | 9 | 348 | 965 | 42 | 19 | 1,026 | ||||||||||||||||||||||||||||||||||||||||||||
| Equity risk | 853 | (215 | ) | 350 | 988 | 3,105 | (542 | ) | 1,196 | 3,759 | 907 | (122 | ) | 364 | 1,149 | 2,886 | (563 | ) | 1,159 | 3,482 | ||||||||||||||||||||||||||||||||||||||||||
| Credit risk | 266 | 465 | 106 | 837 | 1,093 | 1,424 | 377 | 2,894 | 286 | 451 | 136 | 873 | 1,092 | 1,341 | 400 | 2,833 | ||||||||||||||||||||||||||||||||||||||||||||||
| Other risk | 47 | 26 | 19 | 92 | 171 | 39 | 60 | 270 | 57 | 11 | 12 | 80 | 83 | 61 | 43 | 187 | ||||||||||||||||||||||||||||||||||||||||||||||
| Total sales and trading revenue | $ | 1,727 | $ | 581 | $ | 611 | $ | 2,919 | $ | 6,614 | $ | 1,852 | $ | 1,841 | $ | 10,307 | $ | 1,580 | $ | 834 | $ | 738 | $ | 3,152 | $ | 5,621 | $ | 2,170 | $ | 1,983 | $ | 9,774 | ||||||||||||||||||||||||||||||
| Three Months Ended September 30, 2017 | Nine Months Ended September 30, 2017 | Three Months Ended September 30, 2018 | Nine Months Ended September 30, 2018 | |||||||||||||||||||||||||||||||||||||||||||||||||||||||||||
| Interest rate risk | $ | 330 | $ | 365 | $ | 49 | $ | 744 | $ | 833 | $ | 1,182 | $ | 200 | $ | 2,215 | $ | 76 | $ | 418 | $ | 141 | $ | 635 | $ | 789 | $ | 1,242 | $ | 228 | $ | 2,259 | ||||||||||||||||||||||||||||||
| Foreign exchange risk | 348 | 2 | 2 | 352 | 1,063 | (2 | ) | 5 | 1,066 | 373 | 3 | 3 | 379 | 1,163 | (2 | ) | 10 | 1,171 | ||||||||||||||||||||||||||||||||||||||||||||
| Equity risk | 639 | (142 | ) | 467 | 964 | 2,088 | (372 | ) | 1,427 | 3,143 | 823 | (183 | ) | 356 | 996 | 3,015 | (449 | ) | 1,218 | 3,784 | ||||||||||||||||||||||||||||||||||||||||||
| Credit risk | 362 | 482 | 105 | 949 | 1,482 | 1,467 | 450 | 3,399 | 268 | 458 | 113 | 839 | 1,091 | 1,407 | 408 | 2,906 | ||||||||||||||||||||||||||||||||||||||||||||||
| Other risk | 35 | 8 | 16 | 59 | 168 | 18 | 67 | 253 | 10 | 64 | 10 | 84 | 68 | 152 | 43 | 263 | ||||||||||||||||||||||||||||||||||||||||||||||
| Total sales and trading revenue | $ | 1,714 | $ | 715 | $ | 639 | $ | 3,068 | $ | 5,634 | $ | 2,293 | $ | 2,149 | $ | 10,076 | $ | 1,550 | $ | 760 | $ | 623 | $ | 2,933 | $ | 6,126 | $ | 2,350 | $ | 1,907 | $ | 10,383 | ||||||||||||||||||||||||||||||
(1) | Represents amounts in investment and brokerage services and other income that are recorded in Global Markets and included in the definition of sales and trading revenue. Includes investment and brokerage services revenue of $ |
| Credit Derivative Instruments | |||||||||||||||||||
Less than One Year | One to Three Years | Three to Five Years | Over Five Years | Total | |||||||||||||||
| September 30, 2018 | |||||||||||||||||||
| (Dollars in millions) | Carrying Value | ||||||||||||||||||
| Credit default swaps: | |||||||||||||||||||
| Investment grade | $ | 2 | $ | 38 | $ | 335 | $ | 590 | $ | 965 | |||||||||
| Non-investment grade | 61 | 492 | 1,007 | 1,802 | 3,362 | ||||||||||||||
| Total | 63 | 530 | 1,342 | 2,392 | 4,327 | ||||||||||||||
| Total return swaps/options: | |||||||||||||||||||
| Investment grade | 22 | — | — | — | 22 | ||||||||||||||
| Non-investment grade | 263 | 28 | — | — | 291 | ||||||||||||||
| Total | 285 | 28 | — | — | 313 | ||||||||||||||
| Total credit derivatives | $ | 348 | $ | 558 | $ | 1,342 | $ | 2,392 | $ | 4,640 | |||||||||
| Credit-related notes: | |||||||||||||||||||
| Investment grade | $ | — | $ | — | $ | 5 | $ | 602 | $ | 607 | |||||||||
| Non-investment grade | 3 | 1 | 4 | 1,455 | 1,463 | ||||||||||||||
| Total credit-related notes | $ | 3 | $ | 1 | $ | 9 | $ | 2,057 | $ | 2,070 | |||||||||
| Maximum Payout/Notional | |||||||||||||||||||
| Credit default swaps: | |||||||||||||||||||
| Investment grade | $ | 61,224 | $ | 93,646 | $ | 82,657 | $ | 30,883 | $ | 268,410 | |||||||||
| Non-investment grade | 22,980 | 37,907 | 47,164 | 21,785 | 129,836 | ||||||||||||||
| Total | 84,204 | 131,553 | 129,821 | 52,668 | 398,246 | ||||||||||||||
| Total return swaps/options: | |||||||||||||||||||
| Investment grade | 40,115 | 1,263 | 62 | 76 | 41,516 | ||||||||||||||
| Non-investment grade | 20,648 | 207 | 39 | 72 | 20,966 | ||||||||||||||
| Total | 60,763 | 1,470 | 101 | 148 | 62,482 | ||||||||||||||
| Total credit derivatives | $ | 144,967 | $ | 133,023 | $ | 129,922 | $ | 52,816 | $ | 460,728 | |||||||||
| December 31, 2017 | |||||||||||||||||||
| Carrying Value | |||||||||||||||||||
| Credit default swaps: | |||||||||||||||||||
| Investment grade | $ | 4 | $ | 3 | $ | 61 | $ | 245 | $ | 313 | |||||||||
| Non-investment grade | 203 | 453 | 484 | 2,133 | 3,273 | ||||||||||||||
| Total | 207 | 456 | 545 | 2,378 | 3,586 | ||||||||||||||
| Total return swaps/options: | |||||||||||||||||||
| Investment grade | 30 | — | — | — | 30 | ||||||||||||||
| Non-investment grade | 150 | — | — | 3 | 153 | ||||||||||||||
| Total | 180 | — | — | 3 | 183 | ||||||||||||||
| Total credit derivatives | $ | 387 | $ | 456 | $ | 545 | $ | 2,381 | $ | 3,769 | |||||||||
| Credit-related notes: | |||||||||||||||||||
| Investment grade | $ | — | $ | — | $ | 7 | $ | 689 | $ | 696 | |||||||||
| Non-investment grade | 12 | 4 | 34 | 1,548 | 1,598 | ||||||||||||||
| Total credit-related notes | $ | 12 | $ | 4 | $ | 41 | $ | 2,237 | $ | 2,294 | |||||||||
| Maximum Payout/Notional | |||||||||||||||||||
| Credit default swaps: | |||||||||||||||||||
| Investment grade | $ | 61,388 | $ | 115,480 | $ | 107,081 | $ | 21,579 | $ | 305,528 | |||||||||
| Non-investment grade | 39,312 | 49,843 | 39,098 | 14,420 | 142,673 | ||||||||||||||
| Total | 100,700 | 165,323 | 146,179 | 35,999 | 448,201 | ||||||||||||||
| Total return swaps/options: | |||||||||||||||||||
| Investment grade | 37,394 | 2,581 | — | 143 | 40,118 | ||||||||||||||
| Non-investment grade | 13,751 | 514 | 143 | 697 | 15,105 | ||||||||||||||
| Total | 51,145 | 3,095 | 143 | 840 | 55,223 | ||||||||||||||
| Total credit derivatives | $ | 151,845 | $ | 168,418 | $ | 146,322 | $ | 36,839 | $ | 503,424 | |||||||||
Bank of America 56 | ||
| Credit Derivative Instruments | |||||||||||||||||||
Less than One Year | One to Three Years | Three to Five Years | Over Five Years | Total | |||||||||||||||
| September 30, 2019 | |||||||||||||||||||
| (Dollars in millions) | Carrying Value | ||||||||||||||||||
| Credit default swaps: | |||||||||||||||||||
| Investment grade | $ | — | $ | 10 | $ | 90 | $ | 249 | $ | 349 | |||||||||
| Non-investment grade | 69 | 264 | 738 | 1,086 | 2,157 | ||||||||||||||
| Total | 69 | 274 | 828 | 1,335 | 2,506 | ||||||||||||||
| Total return swaps/options: | |||||||||||||||||||
| Investment grade | 20 | — | — | — | 20 | ||||||||||||||
| Non-investment grade | 365 | 12 | — | — | 377 | ||||||||||||||
| Total | 385 | 12 | — | — | 397 | ||||||||||||||
| Total credit derivatives | $ | 454 | $ | 286 | $ | 828 | $ | 1,335 | $ | 2,903 | |||||||||
| Credit-related notes: | |||||||||||||||||||
| Investment grade | $ | — | $ | 3 | $ | — | $ | 646 | $ | 649 | |||||||||
| Non-investment grade | 12 | 2 | 1 | 1,402 | 1,417 | ||||||||||||||
| Total credit-related notes | $ | 12 | $ | 5 | $ | 1 | $ | 2,048 | $ | 2,066 | |||||||||
| Maximum Payout/Notional | |||||||||||||||||||
| Credit default swaps: | |||||||||||||||||||
| Investment grade | $ | 48,416 | $ | 82,184 | $ | 102,206 | $ | 30,639 | $ | 263,445 | |||||||||
| Non-investment grade | 17,211 | 27,707 | 36,737 | 17,887 | 99,542 | ||||||||||||||
| Total | 65,627 | 109,891 | 138,943 | 48,526 | 362,987 | ||||||||||||||
| Total return swaps/options: | |||||||||||||||||||
| Investment grade | 29,218 | — | 61 | 74 | 29,353 | ||||||||||||||
| Non-investment grade | 28,306 | 511 | 51 | 61 | 28,929 | ||||||||||||||
| Total | 57,524 | 511 | 112 | 135 | 58,282 | ||||||||||||||
| Total credit derivatives | $ | 123,151 | $ | 110,402 | $ | 139,055 | $ | 48,661 | $ | 421,269 | |||||||||
| December 31, 2018 | |||||||||||||||||||
| Carrying Value | |||||||||||||||||||
| Credit default swaps: | |||||||||||||||||||
| Investment grade | $ | 2 | $ | 44 | $ | 436 | $ | 488 | $ | 970 | |||||||||
| Non-investment grade | 132 | 636 | 914 | 1,691 | 3,373 | ||||||||||||||
| Total | 134 | 680 | 1,350 | 2,179 | 4,343 | ||||||||||||||
| Total return swaps/options: | |||||||||||||||||||
| Investment grade | 105 | — | — | — | 105 | ||||||||||||||
| Non-investment grade | 472 | 21 | — | — | 493 | ||||||||||||||
| Total | 577 | 21 | — | — | 598 | ||||||||||||||
| Total credit derivatives | $ | 711 | $ | 701 | $ | 1,350 | $ | 2,179 | $ | 4,941 | |||||||||
| Credit-related notes: | |||||||||||||||||||
| Investment grade | $ | — | $ | — | $ | 4 | $ | 532 | $ | 536 | |||||||||
| Non-investment grade | 1 | 1 | 1 | 1,500 | 1,503 | ||||||||||||||
| Total credit-related notes | $ | 1 | $ | 1 | $ | 5 | $ | 2,032 | $ | 2,039 | |||||||||
| Maximum Payout/Notional | |||||||||||||||||||
| Credit default swaps: | |||||||||||||||||||
| Investment grade | $ | 53,758 | $ | 95,699 | $ | 95,274 | $ | 20,054 | $ | 264,785 | |||||||||
| Non-investment grade | 24,297 | 33,881 | 34,530 | 14,426 | 107,134 | ||||||||||||||
| Total | 78,055 | 129,580 | 129,804 | 34,480 | 371,919 | ||||||||||||||
| Total return swaps/options: | |||||||||||||||||||
| Investment grade | 60,042 | 822 | 59 | 72 | 60,995 | ||||||||||||||
| Non-investment grade | 24,524 | 1,649 | 39 | 70 | 26,282 | ||||||||||||||
| Total | 84,566 | 2,471 | 98 | 142 | 87,277 | ||||||||||||||
| Total credit derivatives | $ | 162,621 | $ | 132,051 | $ | 129,902 | $ | 34,622 | $ | 459,196 | |||||||||
57Bank of America | ||
| Additional Collateral Required to be Posted Upon Downgrade at September 30, 2019 | |||||||
| (Dollars in millions) | One incremental notch | Second incremental notch | |||||
| Bank of America Corporation | $ | 571 | $ | 510 | |||
Bank of America, N.A. and subsidiaries (1) | 240 | 422 | |||||
| Additional Collateral Required to be Posted Upon Downgrade at September 30, 2018 | |||||||
| (Dollars in millions) | One incremental notch | Second incremental notch | |||||
| Bank of America Corporation | $ | 554 | $ | 314 | |||
Bank of America, N.A. and subsidiaries (1) | 212 | 264 | |||||
(1) | Included in Bank of America Corporation collateral requirements in this table. |
| Derivative Liabilities Subject to Unilateral Termination Upon Downgrade at September 30, 2019 | |||||||
| (Dollars in millions) | One incremental notch | Second incremental notch | |||||
| Derivative liabilities | $ | 12 | $ | 1,127 | |||
| Collateral posted | 4 | 785 | |||||
| Derivative Liabilities Subject to Unilateral Termination Upon Downgrade at September 30, 2018 | |||||||
| (Dollars in millions) | One incremental notch | Second incremental notch | |||||
| Derivative liabilities | $ | 260 | $ | 607 | |||
| Collateral posted | 201 | 399 | |||||
Valuation Adjustments on Derivatives (1) | ||||||||||||||||||||||||||
Valuation Adjustments Gains (Losses) on Derivatives (1) | Valuation Adjustments Gains (Losses) on Derivatives (1) | |||||||||||||||||||||||||
| Gains (Losses) | Three Months Ended September 30 | |||||||||||||||||||||||||
| Three Months Ended September 30 | ||||||||||||||||||||||||||
| 2018 | 2017 | 2019 | 2018 | |||||||||||||||||||||||
| (Dollars in millions) | Gross | Net | Gross | Net | Gross | Net | Gross | Net | ||||||||||||||||||
| Derivative assets (CVA) | $ | 71 | $ | 27 | $ | 23 | $ | 15 | $ | (41 | ) | $ | 16 | $ | 71 | $ | 27 | |||||||||
| Derivative assets/liabilities (FVA) | 45 | 35 | 37 | 43 | (60 | ) | (4 | ) | 45 | 35 | ||||||||||||||||
| Derivative liabilities (DVA) | (69 | ) | (79 | ) | 29 | 17 | 17 | 8 | (69 | ) | (79 | ) | ||||||||||||||
| Nine Months Ended September 30 | Nine Months Ended September 30 | |||||||||||||||||||||||||
| 2018 | 2017 | 2019 | 2018 | |||||||||||||||||||||||
| Derivative assets (CVA) | $ | 186 | $ | 172 | $ | 281 | $ | 93 | $ | (39 | ) | $ | 38 | $ | 186 | $ | 172 | |||||||||
| Derivative assets/liabilities (FVA) | 36 | 16 | 113 | 140 | (27 | ) | 35 | 36 | 16 | |||||||||||||||||
| Derivative liabilities (DVA) | (112 | ) | (132 | ) | (249 | ) | (201 | ) | (56 | ) | (64 | ) | (112 | ) | (132 | ) | ||||||||||
(1) | At September 30, |
Bank of America | ||
| Debt Securities | Debt Securities | Debt Securities | ||||||||||||||||||||||||||||
Amortized Cost | Gross Unrealized Gains | Gross Unrealized Losses | Fair Value | Amortized Cost | Gross Unrealized Gains | Gross Unrealized Losses | Fair Value | |||||||||||||||||||||||
| (Dollars in millions) | September 30, 2018 | September 30, 2019 | ||||||||||||||||||||||||||||
| Available-for-sale debt securities | ||||||||||||||||||||||||||||||
| Mortgage-backed securities: | ||||||||||||||||||||||||||||||
| Agency | $ | 141,721 | $ | 101 | $ | (5,710 | ) | $ | 136,112 | $ | 133,973 | $ | 1,250 | $ | (274 | ) | $ | 134,949 | ||||||||||||
| Agency-collateralized mortgage obligations | 5,878 | 9 | (209 | ) | 5,678 | 4,877 | 103 | (18 | ) | 4,962 | ||||||||||||||||||||
| Commercial | 14,138 | 2 | (630 | ) | 13,510 | 14,301 | 380 | (4 | ) | 14,677 | ||||||||||||||||||||
Non-agency residential (1) | 1,926 | 217 | (6 | ) | 2,137 | 1,725 | 227 | (9 | ) | 1,943 | ||||||||||||||||||||
| Total mortgage-backed securities | 163,663 | 329 | (6,555 | ) | 157,437 | 154,876 | 1,960 | (305 | ) | 156,531 | ||||||||||||||||||||
| U.S. Treasury and agency securities | 54,664 | 8 | (2,366 | ) | 52,306 | 55,746 | 1,364 | (163 | ) | 56,947 | ||||||||||||||||||||
| Non-U.S. securities | 7,076 | 5 | (2 | ) | 7,079 | 11,074 | 7 | (2 | ) | 11,079 | ||||||||||||||||||||
| Other taxable securities, substantially all asset-backed securities | 3,806 | 77 | (7 | ) | 3,876 | 3,806 | 77 | — | 3,883 | |||||||||||||||||||||
| Total taxable securities | 229,209 | 419 | (8,930 | ) | 220,698 | 225,502 | 3,408 | (470 | ) | 228,440 | ||||||||||||||||||||
| Tax-exempt securities | 18,401 | 36 | (87 | ) | 18,350 | 16,263 | 203 | (34 | ) | 16,432 | ||||||||||||||||||||
| Total available-for-sale debt securities | 247,610 | 455 | (9,017 | ) | 239,048 | 241,765 | 3,611 | (504 | ) | 244,872 | ||||||||||||||||||||
| Other debt securities carried at fair value | 12,409 | 205 | (27 | ) | 12,587 | |||||||||||||||||||||||||
Other debt securities carried at fair value (2) | 9,284 | 205 | (19 | ) | 9,470 | |||||||||||||||||||||||||
| Total debt securities carried at fair value | 260,019 | 660 | (9,044 | ) | 251,635 | 251,049 | 3,816 | (523 | ) | 254,342 | ||||||||||||||||||||
Held-to-maturity debt securities, substantially all U.S. agency mortgage-backed securities (2) | 194,472 | 1 | (6,485 | ) | 187,988 | |||||||||||||||||||||||||
| Held-to-maturity debt securities, substantially all U.S. agency mortgage-backed securities | 190,252 | 4,358 | (336 | ) | 194,274 | |||||||||||||||||||||||||
Total debt securities (3, 4) | $ | 454,491 | $ | 661 | $ | (15,529 | ) | $ | 439,623 | $ | 441,301 | $ | 8,174 | $ | (859 | ) | $ | 448,616 | ||||||||||||
| December 31, 2017 | December 31, 2018 | |||||||||||||||||||||||||||||
| Available-for-sale debt securities | ||||||||||||||||||||||||||||||
| Mortgage-backed securities: | ||||||||||||||||||||||||||||||
| Agency | $ | 194,119 | $ | 506 | $ | (1,696 | ) | $ | 192,929 | $ | 125,116 | $ | 138 | $ | (3,428 | ) | $ | 121,826 | ||||||||||||
| Agency-collateralized mortgage obligations | 6,846 | 39 | (81 | ) | 6,804 | 5,621 | 19 | (110 | ) | 5,530 | ||||||||||||||||||||
| Commercial | 13,864 | 28 | (208 | ) | 13,684 | 14,469 | 11 | (402 | ) | 14,078 | ||||||||||||||||||||
Non-agency residential (1) | 2,410 | 267 | (8 | ) | 2,669 | 1,792 | 136 | (11 | ) | 1,917 | ||||||||||||||||||||
| Total mortgage-backed securities | 217,239 | 840 | (1,993 | ) | 216,086 | 146,998 | 304 | (3,951 | ) | 143,351 | ||||||||||||||||||||
| U.S. Treasury and agency securities | 54,523 | 18 | (1,018 | ) | 53,523 | 56,239 | 62 | (1,378 | ) | 54,923 | ||||||||||||||||||||
| Non-U.S. securities | 6,669 | 9 | (1 | ) | 6,677 | 9,307 | 5 | (6 | ) | 9,306 | ||||||||||||||||||||
| Other taxable securities, substantially all asset-backed securities | 5,699 | 73 | (2 | ) | 5,770 | 4,387 | 29 | (6 | ) | 4,410 | ||||||||||||||||||||
| Total taxable securities | 284,130 | 940 | (3,014 | ) | 282,056 | 216,931 | 400 | (5,341 | ) | 211,990 | ||||||||||||||||||||
| Tax-exempt securities | 20,541 | 138 | (104 | ) | 20,575 | 17,349 | 99 | (72 | ) | 17,376 | ||||||||||||||||||||
| Total available-for-sale debt securities | 304,671 | 1,078 | (3,118 | ) | 302,631 | 234,280 | 499 | (5,413 | ) | 229,366 | ||||||||||||||||||||
| Other debt securities carried at fair value | 12,273 | 252 | (39 | ) | 12,486 | |||||||||||||||||||||||||
Other debt securities carried at fair value (2) | 8,595 | 172 | (32 | ) | 8,735 | |||||||||||||||||||||||||
| Total debt securities carried at fair value | 316,944 | 1,330 | (3,157 | ) | 315,117 | 242,875 | 671 | (5,445 | ) | 238,101 | ||||||||||||||||||||
| Held-to-maturity debt securities, substantially all U.S. agency mortgage-backed securities | 125,013 | 111 | (1,825 | ) | 123,299 | 203,652 | 747 | (3,964 | ) | 200,435 | ||||||||||||||||||||
Total debt securities (3, 4) | $ | 441,957 | $ | 1,441 | $ | (4,982 | ) | $ | 438,416 | $ | 446,527 | $ | 1,418 | $ | (9,409 | ) | $ | 438,536 | ||||||||||||
Available-for-sale marketable equity securities (5) | $ | 27 | $ | — | $ | (2 | ) | $ | 25 | |||||||||||||||||||||
(1) | At September 30, |
(2) |
(3) | Includes securities pledged as collateral of $ |
(4) | The Corporation |
| Other Debt Securities Carried at Fair Value | |||||||
| (Dollars in millions) | September 30 2018 | December 31 2017 | |||||
| Mortgage-backed securities | $ | 1,696 | $ | 2,769 | |||
Non-U.S. securities (1) | 10,888 | 9,488 | |||||
| Other taxable securities, substantially all asset-backed securities | 3 | 229 | |||||
| Total | $ | 12,587 | $ | 12,486 | |||
| Gains and Losses on Sales of AFS Debt Securities | |||||||||||||||
| Three Months Ended September 30 | Nine Months Ended September 30 | ||||||||||||||
| (Dollars in millions) | 2018 | 2017 | 2018 | 2017 | |||||||||||
| Gross gains | $ | 83 | $ | 130 | $ | 86 | $ | 286 | |||||||
| Gross losses | (10 | ) | (5 | ) | (10 | ) | (8 | ) | |||||||
| Net gains on sales of AFS debt securities | $ | 73 | $ | 125 | $ | 76 | $ | 278 | |||||||
| Income tax expense attributable to realized net gains on sales of AFS debt securities | $ | 17 | $ | 48 | $ | 18 | $ | 106 | |||||||
| Temporarily Impaired and Other-than-temporarily Impaired AFS Debt Securities | Temporarily Impaired and Other-than-temporarily Impaired AFS Debt Securities | Temporarily Impaired and Other-than-temporarily Impaired AFS Debt Securities | ||||||||||||||||||||||||||||||||||||||||||||
| Less than Twelve Months | Twelve Months or Longer | Total | Less than Twelve Months | Twelve Months or Longer | Total | |||||||||||||||||||||||||||||||||||||||||
Fair Value | Gross Unrealized Losses | Fair Value | Gross Unrealized Losses | Fair Value | Gross Unrealized Losses | Fair Value | Gross Unrealized Losses | Fair Value | Gross Unrealized Losses | Fair Value | Gross Unrealized Losses | |||||||||||||||||||||||||||||||||||
| (Dollars in millions) | September 30, 2018 | September 30, 2019 | ||||||||||||||||||||||||||||||||||||||||||||
| Temporarily impaired AFS debt securities | ||||||||||||||||||||||||||||||||||||||||||||||
| Mortgage-backed securities: | ||||||||||||||||||||||||||||||||||||||||||||||
| Agency | $ | 45,433 | $ | (1,190 | ) | $ | 87,214 | $ | (4,520 | ) | $ | 132,647 | $ | (5,710 | ) | $ | 7,409 | $ | (10 | ) | $ | 28,226 | $ | (264 | ) | $ | 35,635 | $ | (274 | ) | ||||||||||||||||
| Agency-collateralized mortgage obligations | 1,959 | (47 | ) | 3,344 | (162 | ) | 5,303 | (209 | ) | 64 | — | 1,014 | (18 | ) | 1,078 | (18 | ) | |||||||||||||||||||||||||||||
| Commercial | 4,923 | (146 | ) | 7,962 | (484 | ) | 12,885 | (630 | ) | 928 | (3 | ) | 114 | (1 | ) | 1,042 | (4 | ) | ||||||||||||||||||||||||||||
| Non-agency residential | 23 | (2 | ) | 51 | (4 | ) | 74 | (6 | ) | 33 | (1 | ) | 1 | — | 34 | (1 | ) | |||||||||||||||||||||||||||||
| Total mortgage-backed securities | 52,338 | (1,385 | ) | 98,571 | (5,170 | ) | 150,909 | (6,555 | ) | 8,434 | (14 | ) | 29,355 | (283 | ) | 37,789 | (297 | ) | ||||||||||||||||||||||||||||
| U.S. Treasury and agency securities | 10,651 | (409 | ) | 40,337 | (1,957 | ) | 50,988 | (2,366 | ) | 4,193 | (18 | ) | 18,628 | (145 | ) | 22,821 | (163 | ) | ||||||||||||||||||||||||||||
| Non-U.S. securities | 706 | (1 | ) | 81 | (1 | ) | 787 | (2 | ) | 1,234 | (2 | ) | 140 | — | 1,374 | (2 | ) | |||||||||||||||||||||||||||||
| Other taxable securities, substantially all asset-backed securities | 208 | (3 | ) | 150 | (4 | ) | 358 | (7 | ) | 354 | — | 280 | — | 634 | — | |||||||||||||||||||||||||||||||
| Total taxable securities | 63,903 | (1,798 | ) | 139,139 | (7,132 | ) | 203,042 | (8,930 | ) | 14,215 | (34 | ) | 48,403 | (428 | ) | 62,618 | (462 | ) | ||||||||||||||||||||||||||||
| Tax-exempt securities | 474 | (1 | ) | 4,324 | (86 | ) | 4,798 | (87 | ) | 233 | — | 1,039 | (34 | ) | 1,272 | (34 | ) | |||||||||||||||||||||||||||||
| Total temporarily impaired AFS debt securities | 64,377 | (1,799 | ) | 143,463 | (7,218 | ) | 207,840 | (9,017 | ) | 14,448 | (34 | ) | 49,442 | (462 | ) | 63,890 | (496 | ) | ||||||||||||||||||||||||||||
Other-than-temporarily impaired AFS debt securities (1) | ||||||||||||||||||||||||||||||||||||||||||||||
| Non-agency residential mortgage-backed securities | 93 | — | — | — | 93 | — | 118 | (4 | ) | 28 | (4 | ) | 146 | (8 | ) | |||||||||||||||||||||||||||||||
Total temporarily impaired and other-than-temporarily impaired AFS debt securities | $ | 64,470 | $ | (1,799 | ) | $ | 143,463 | $ | (7,218 | ) | $ | 207,933 | $ | (9,017 | ) | $ | 14,566 | $ | (38 | ) | $ | 49,470 | $ | (466 | ) | $ | 64,036 | $ | (504 | ) | ||||||||||||||||
| December 31, 2017 | December 31, 2018 | |||||||||||||||||||||||||||||||||||||||||||||
| Temporarily impaired AFS debt securities | ||||||||||||||||||||||||||||||||||||||||||||||
| Mortgage-backed securities: | ||||||||||||||||||||||||||||||||||||||||||||||
| Agency | $ | 73,535 | $ | (352 | ) | $ | 72,612 | $ | (1,344 | ) | $ | 146,147 | $ | (1,696 | ) | $ | 14,771 | $ | (49 | ) | $ | 99,211 | $ | (3,379 | ) | $ | 113,982 | $ | (3,428 | ) | ||||||||||||||||
| Agency-collateralized mortgage obligations | 2,743 | (29 | ) | 1,684 | (52 | ) | 4,427 | (81 | ) | 3 | — | 4,452 | (110 | ) | 4,455 | (110 | ) | |||||||||||||||||||||||||||||
| Commercial | 5,575 | (50 | ) | 4,586 | (158 | ) | 10,161 | (208 | ) | 1,344 | (8 | ) | 11,991 | (394 | ) | 13,335 | (402 | ) | ||||||||||||||||||||||||||||
| Non-agency residential | 335 | (7 | ) | — | — | 335 | (7 | ) | 106 | (8 | ) | 49 | (3 | ) | 155 | (11 | ) | |||||||||||||||||||||||||||||
| Total mortgage-backed securities | 82,188 | (438 | ) | 78,882 | (1,554 | ) | 161,070 | (1,992 | ) | 16,224 | (65 | ) | 115,703 | (3,886 | ) | 131,927 | (3,951 | ) | ||||||||||||||||||||||||||||
| U.S. Treasury and agency securities | 27,537 | (251 | ) | 24,035 | (767 | ) | 51,572 | (1,018 | ) | 288 | (1 | ) | 51,374 | (1,377 | ) | 51,662 | (1,378 | ) | ||||||||||||||||||||||||||||
| Non-U.S. securities | 772 | (1 | ) | — | — | 772 | (1 | ) | 773 | (5 | ) | 21 | (1 | ) | 794 | (6 | ) | |||||||||||||||||||||||||||||
| Other taxable securities, substantially all asset-backed securities | — | — | 92 | (2 | ) | 92 | (2 | ) | 183 | (1 | ) | 185 | (5 | ) | 368 | (6 | ) | |||||||||||||||||||||||||||||
| Total taxable securities | 110,497 | (690 | ) | 103,009 | (2,323 | ) | 213,506 | (3,013 | ) | 17,468 | (72 | ) | 167,283 | (5,269 | ) | 184,751 | (5,341 | ) | ||||||||||||||||||||||||||||
| Tax-exempt securities | 1,090 | (2 | ) | 7,100 | (102 | ) | 8,190 | (104 | ) | 232 | (2 | ) | 2,148 | (70 | ) | 2,380 | (72 | ) | ||||||||||||||||||||||||||||
| Total temporarily impaired AFS debt securities | 111,587 | (692 | ) | 110,109 | (2,425 | ) | 221,696 | (3,117 | ) | 17,700 | (74 | ) | 169,431 | (5,339 | ) | 187,131 | (5,413 | ) | ||||||||||||||||||||||||||||
Other-than-temporarily impaired AFS debt securities (1) | ||||||||||||||||||||||||||||||||||||||||||||||
| Non-agency residential mortgage-backed securities | 58 | (1 | ) | — | — | 58 | (1 | ) | 131 | — | 3 | — | 134 | — | ||||||||||||||||||||||||||||||||
Total temporarily impaired and other-than-temporarily impaired AFS debt securities | $ | 111,645 | $ | (693 | ) | $ | 110,109 | $ | (2,425 | ) | $ | 221,754 | $ | (3,118 | ) | $ | 17,831 | $ | (74 | ) | $ | 169,434 | $ | (5,339 | ) | $ | 187,265 | $ | (5,413 | ) | ||||||||||||||||
(1) | Includes other-than-temporarily impaired |
Bank of America 60 | ||
| Significant Assumptions | ||||||||||||||||
Range (1) | Range (1) | |||||||||||||||
| Weighted average | 10th Percentile (2) | 90th Percentile (2) | Weighted average | 10th Percentile (2) | 90th Percentile (2) | |||||||||||
| Prepayment speed | 12.0 | % | 3.1 | % | 23.3 | % | 16.2 | % | 4.9 | % | 28.1 | % | ||||
| Loss severity | 18.1 | 8.4 | 31.0 | 15.5 | 8.0 | 32.3 | ||||||||||
| Life default rate | 20.1 | 0.7 | 73.5 | 12.6 | 0.8 | 41.1 | ||||||||||
(1) | Represents the range of inputs/assumptions based upon the underlying collateral. |
(2) | The value of a variable below which the indicated percentile of observations will fall. |
| Maturities of Debt Securities Carried at Fair Value and Held-to-maturity Debt Securities | ||||||||||||||||||||||||||||||||||||||||||||||||||||||||||||||||||||
| �� | ||||||||||||||||||||||||||||||||||||||||||||||||||||||||||||||||||||
Due in One Year or Less | Due after One Year through Five Years | Due after Five Years through Ten Years | Due after Ten Years | Total | Due in One Year or Less | Due after One Year through Five Years | Due after Five Years through Ten Years | Due after Ten Years | Total | |||||||||||||||||||||||||||||||||||||||||||||||||||||||||||
| (Dollars in millions) | Amount | Yield (1) | Amount | Yield (1) | Amount | Yield (1) | Amount | Yield (1) | Amount | Yield (1) | Amount | Yield (1) | Amount | Yield (1) | Amount | Yield (1) | Amount | Yield (1) | Amount | Yield (1) | ||||||||||||||||||||||||||||||||||||||||||||||||
| Amortized cost of debt securities carried at fair value | ||||||||||||||||||||||||||||||||||||||||||||||||||||||||||||||||||||
| Mortgage-backed securities: | ||||||||||||||||||||||||||||||||||||||||||||||||||||||||||||||||||||
| Agency | $ | — | — | % | $ | 24 | 4.12 | % | $ | 463 | 2.62 | % | $ | 141,234 | 3.31 | % | $ | 141,721 | 3.31 | % | $ | — | — | % | $ | 120 | 2.37 | % | $ | 1,715 | 2.42 | % | $ | 132,139 | 3.29 | % | $ | 133,974 | 3.28 | % | ||||||||||||||||||||||||||||
| Agency-collateralized mortgage obligations | — | — | — | — | 31 | 2.48 | 5,847 | 3.17 | 5,878 | 3.17 | — | — | — | — | 27 | 2.56 | 4,850 | 3.17 | 4,877 | 3.17 | ||||||||||||||||||||||||||||||||||||||||||||||||
| Commercial | 314 | 1.74 | 2,391 | 2.36 | 10,658 | 2.50 | 775 | 2.97 | 14,138 | 2.49 | — | — | 3,326 | 2.28 | 10,100 | 2.60 | 888 | 2.99 | 14,314 | 2.55 | ||||||||||||||||||||||||||||||||||||||||||||||||
| Non-agency residential | — | — | — | — | 19 | n/m | 3,439 | 9.66 | 3,458 | 9.61 | — | — | — | — | 12 | — | 3,083 | 10.49 | 3,095 | 10.46 | ||||||||||||||||||||||||||||||||||||||||||||||||
| Total mortgage-backed securities | 314 | 1.74 | 2,415 | 2.38 | 11,171 | 2.50 | 151,295 | 3.45 | 165,195 | 3.36 | — | — | 3,446 | 2.28 | 11,854 | 2.57 | 140,960 | 3.44 | 156,260 | 3.35 | ||||||||||||||||||||||||||||||||||||||||||||||||
| U.S. Treasury and agency securities | 643 | 0.71 | 33,567 | 1.47 | 20,418 | 2.27 | 36 | 2.70 | 54,664 | 1.76 | 482 | 0.33 | 36,446 | 1.65 | 18,803 | 2.50 | 18 | 2.54 | 55,749 | 1.92 | ||||||||||||||||||||||||||||||||||||||||||||||||
| Non-U.S. securities | 16,518 | 0.77 | 1,305 | 1.08 | 2 | 3.56 | 128 | 6.15 | 17,953 | 0.83 | 18,097 | 1.07 | 762 | 1.50 | 11 | 4.38 | 101 | 6.24 | 18,971 | 1.12 | ||||||||||||||||||||||||||||||||||||||||||||||||
| Other taxable securities, substantially all asset-backed securities | 685 | 3.88 | 2,236 | 3.28 | 789 | 3.47 | 96 | 4.68 | 3,806 | 3.46 | 520 | 3.36 | 2,175 | 3.20 | 436 | 3.29 | 675 | 3.61 | 3,806 | 3.31 | ||||||||||||||||||||||||||||||||||||||||||||||||
| Total taxable securities | 18,160 | 0.90 | 39,523 | 1.61 | 32,380 | 2.38 | 151,555 | 3.45 | 241,618 | 2.82 | 19,099 | 1.12 | 42,829 | 1.78 | 31,104 | 2.54 | 141,754 | 3.44 | 234,786 | 2.83 | ||||||||||||||||||||||||||||||||||||||||||||||||
| Tax-exempt securities | 1,737 | 2.57 | 7,234 | 2.42 | 6,929 | 2.38 | 2,501 | 2.78 | 18,401 | 2.47 | 724 | 1.98 | 7,169 | 2.22 | 5,483 | 2.20 | 2,887 | 2.33 | 16,263 | 2.23 | ||||||||||||||||||||||||||||||||||||||||||||||||
| Total amortized cost of debt securities carried at fair value | $ | 19,897 | 1.05 | $ | 46,757 | 1.74 | $ | 39,309 | 2.38 | $ | 154,056 | 3.44 | $ | 260,019 | 2.79 | $ | 19,823 | 1.16 | $ | 49,998 | 1.84 | $ | 36,587 | 2.49 | $ | 144,641 | 3.42 | $ | 251,049 | 2.79 | ||||||||||||||||||||||||||||||||||||||
Amortized cost of HTM debt securities (2) | $ | 4 | 3.36 | $ | 55 | 3.62 | $ | 1,484 | 2.76 | $ | 192,929 | 3.22 | $ | 194,472 | 3.22 | $ | 354 | 3.96 | $ | 50 | 3.80 | $ | 1,112 | 2.53 | $ | 188,736 | 3.24 | $ | 190,252 | 3.24 | ||||||||||||||||||||||||||||||||||||||
| Debt securities carried at fair value | ||||||||||||||||||||||||||||||||||||||||||||||||||||||||||||||||||||
| Mortgage-backed securities: | ||||||||||||||||||||||||||||||||||||||||||||||||||||||||||||||||||||
| Agency | $ | — | $ | 25 | $ | 452 | $ | 135,635 | $ | 136,112 | $ | — | $ | 120 | $ | 1,719 | $ | 133,111 | $ | 134,950 | ||||||||||||||||||||||||||||||||||||||||||||||||
| Agency-collateralized mortgage obligations | — | — | 29 | 5,649 | 5,678 | — | — | 28 | 4,934 | 4,962 | ||||||||||||||||||||||||||||||||||||||||||||||||||||||||||
| Commercial | 312 | 2,323 | 10,138 | 737 | 13,510 | — | 3,364 | 10,395 | 931 | 14,690 | ||||||||||||||||||||||||||||||||||||||||||||||||||||||||||
| Non-agency residential | — | — | 36 | 3,797 | 3,833 | — | — | 26 | 3,459 | 3,485 | ||||||||||||||||||||||||||||||||||||||||||||||||||||||||||
| Total mortgage-backed securities | 312 | 2,348 | 10,655 | 145,818 | 159,133 | — | 3,484 | 12,168 | 142,435 | 158,087 | ||||||||||||||||||||||||||||||||||||||||||||||||||||||||||
| U.S. Treasury and agency securities | 642 | 32,106 | 19,523 | 35 | 52,306 | 483 | 36,629 | 19,820 | 18 | 56,950 | ||||||||||||||||||||||||||||||||||||||||||||||||||||||||||
| Non-U.S. securities | 16,519 | 1,314 | 2 | 132 | 17,967 | 18,099 | 772 | 12 | 104 | 18,987 | ||||||||||||||||||||||||||||||||||||||||||||||||||||||||||
| Other taxable securities, substantially all asset-backed securities | 681 | 2,255 | 829 | 114 | 3,879 | 527 | 2,214 | 463 | 682 | 3,886 | ||||||||||||||||||||||||||||||||||||||||||||||||||||||||||
| Total taxable securities | 18,154 | 38,023 | 31,009 | 146,099 | 233,285 | 19,109 | 43,099 | 32,463 | 143,239 | 237,910 | ||||||||||||||||||||||||||||||||||||||||||||||||||||||||||
| Tax-exempt securities | 1,736 | 7,235 | 6,897 | 2,482 | 18,350 | 724 | 7,186 | 5,608 | 2,914 | 16,432 | ||||||||||||||||||||||||||||||||||||||||||||||||||||||||||
| Total debt securities carried at fair value | $ | 19,890 | $ | 45,258 | $ | 37,906 | $ | 148,581 | $ | 251,635 | $ | 19,833 | $ | 50,285 | $ | 38,071 | $ | 146,153 | $ | 254,342 | ||||||||||||||||||||||||||||||||||||||||||||||||
Fair value of HTM debt securities (2) | $ | 4 | $ | 55 | $ | 1,415 | $ | 186,514 | $ | 187,988 | $ | 354 | $ | 50 | $ | 1,139 | $ | 192,731 | $ | 194,274 | ||||||||||||||||||||||||||||||||||||||||||||||||
(1) | The |
(2) | Substantially all U.S. agency MBS. |
30-59 Days Past Due (1) | 60-89 Days Past Due (1) | 90 Days or More Past Due (2) | Total Past Due 30 Days or More | Total Current or Less Than 30 Days Past Due (3) | Purchased Credit-impaired (4) | Loans Accounted for Under the Fair Value Option | Total Outstandings | 30-59 Days Past Due (1) | 60-89 Days Past Due (1) | 90 Days or More Past Due (2) | Total Past Due 30 Days or More | Total Current or Less Than 30 Days Past Due (3) | Loans Accounted for Under the Fair Value Option | Total Outstandings | ||||||||||||||||||||||||||||||||||||||||||||
| (Dollars in millions) | September 30, 2018 | September 30, 2019 | ||||||||||||||||||||||||||||||||||||||||||||||||||||||||
| Consumer real estate | ||||||||||||||||||||||||||||||||||||||||||||||||||||||||||
| Core portfolio | ||||||||||||||||||||||||||||||||||||||||||||||||||||||||||
| Residential mortgage | $ | 1,248 | $ | 253 | $ | 814 | $ | 2,315 | $ | 186,975 | $ | 189,290 | $ | 1,156 | $ | 232 | $ | 665 | $ | 2,053 | $ | 214,170 | $ | 216,223 | ||||||||||||||||||||||||||||||||||
| Home equity | 200 | 89 | 453 | 742 | 39,854 | 40,596 | 145 | 63 | 202 | 410 | 35,706 | 36,116 | ||||||||||||||||||||||||||||||||||||||||||||||
| Non-core portfolio | ||||||||||||||||||||||||||||||||||||||||||||||||||||||||||
| Residential mortgage | 815 | 351 | 2,345 | 3,511 | 10,044 | $ | 5,341 | 18,896 | 491 | 211 | 1,390 | 2,092 | 9,157 | 11,249 | ||||||||||||||||||||||||||||||||||||||||||||
| Home equity | 162 | 78 | 398 | 638 | 8,190 | 1,811 | 10,639 | 41 | 19 | 88 | 148 | 5,310 | 5,458 | |||||||||||||||||||||||||||||||||||||||||||||
| Credit card and other consumer | ||||||||||||||||||||||||||||||||||||||||||||||||||||||||||
| U.S. credit card | 546 | 387 | 872 | 1,805 | 93,024 | 94,829 | 564 | 413 | 960 | 1,937 | 93,009 | 94,946 | ||||||||||||||||||||||||||||||||||||||||||||||
Direct/Indirect consumer | 297 | 84 | 37 | 418 | 90,920 | 91,338 | 271 | 80 | 31 | 382 | 90,454 | 90,836 | ||||||||||||||||||||||||||||||||||||||||||||||
Other consumer | — | — | — | — | 203 | 203 | — | — | — | — | 208 | 208 | ||||||||||||||||||||||||||||||||||||||||||||||
| Total consumer | 3,268 | 1,242 | 4,919 | 9,429 | 429,210 | 7,152 | 445,791 | 2,668 | 1,018 | 3,336 | 7,022 | 448,014 | 455,036 | |||||||||||||||||||||||||||||||||||||||||||||
Consumer loans accounted for under the fair value option | $ | 755 | 755 | $ | 640 | 640 | ||||||||||||||||||||||||||||||||||||||||||||||||||||
| Total consumer loans and leases | 3,268 | 1,242 | 4,919 | 9,429 | 429,210 | 7,152 | 755 | 446,546 | 2,668 | 1,018 | 3,336 | 7,022 | 448,014 | 640 | 455,676 | |||||||||||||||||||||||||||||||||||||||||||
| Commercial | ||||||||||||||||||||||||||||||||||||||||||||||||||||||||||
| U.S. commercial | 433 | 127 | 469 | 1,029 | 284,633 | 285,662 | 589 | 222 | 624 | 1,435 | 309,547 | 310,982 | ||||||||||||||||||||||||||||||||||||||||||||||
| Non-U.S. commercial | 29 | — | — | 29 | 95,973 | 96,002 | 60 | 9 | 10 | 79 | 101,005 | 101,084 | ||||||||||||||||||||||||||||||||||||||||||||||
Commercial real estate | 20 | 33 | 10 | 63 | 60,772 | 60,835 | 135 | 12 | 23 | 170 | 62,628 | 62,798 | ||||||||||||||||||||||||||||||||||||||||||||||
| Commercial lease financing | 48 | 94 | 41 | 183 | 21,363 | 21,546 | 31 | 14 | 47 | 92 | 20,015 | 20,107 | ||||||||||||||||||||||||||||||||||||||||||||||
| U.S. small business commercial | 68 | 48 | 89 | 205 | 14,029 | 14,234 | 84 | 52 | 102 | 238 | 14,991 | 15,229 | ||||||||||||||||||||||||||||||||||||||||||||||
| Total commercial | 598 | 302 | 609 | 1,509 | 476,770 | 478,279 | 899 | 309 | 806 | 2,014 | 508,186 | 510,200 | ||||||||||||||||||||||||||||||||||||||||||||||
Commercial loans accounted for under the fair value option | 4,976 | 4,976 | 7,034 | 7,034 | ||||||||||||||||||||||||||||||||||||||||||||||||||||||
| Total commercial loans and leases | 598 | 302 | 609 | 1,509 | 476,770 | 4,976 | 483,255 | 899 | 309 | 806 | 2,014 | 508,186 | 7,034 | 517,234 | ||||||||||||||||||||||||||||||||||||||||||||
Total loans and leases | $ | 3,866 | $ | 1,544 | $ | 5,528 | $ | 10,938 | $ | 905,980 | $ | 7,152 | $ | 5,731 | $ | 929,801 | $ | 3,567 | $ | 1,327 | $ | 4,142 | $ | 9,036 | $ | 956,200 | $ | 7,674 | $ | 972,910 | ||||||||||||||||||||||||||||
| Percentage of outstandings | 0.42 | % | 0.17 | % | 0.59 | % | 1.18 | % | 97.44 | % | 0.77 | % | 0.61 | % | 100.00 | % | 0.37 | % | 0.14 | % | 0.42 | % | 0.93 | % | 98.28 | % | 0.79 | % | 100.00 | % | ||||||||||||||||||||||||||||
(1) | Consumer real estate loans 30-59 days past due includes fully-insured loans of $ |
(2) | Consumer real estate includes fully-insured loans of $ |
(3) | Consumer real estate includes $ |
(4) |
Total outstandings includes auto and specialty lending loans and leases of $ |
Consumer loans accounted for under the fair value option includes residential mortgage loans of $ |
Total outstandings includes U.S. commercial real estate loans of $ |
Total outstandings includes loans and leases pledged as collateral of $ |
Bank of America | ||
30-59 Days Past Due (1) | 60-89 Days Past Due (1) | 90 Days or More Past Due (2) | Total Past Due 30 Days or More | Total Current or Less Than 30 Days Past Due (3) | Loans Accounted for Under the Fair Value Option | Total Outstandings | |||||||||||||||||||||
| (Dollars in millions) | December 31, 2018 | ||||||||||||||||||||||||||
| Consumer real estate | |||||||||||||||||||||||||||
| Core portfolio | |||||||||||||||||||||||||||
| Residential mortgage | $ | 1,188 | $ | 249 | $ | 793 | $ | 2,230 | $ | 191,465 | $ | 193,695 | |||||||||||||||
| Home equity | 200 | 85 | 387 | 672 | 39,338 | 40,010 | |||||||||||||||||||||
| Non-core portfolio | |||||||||||||||||||||||||||
| Residential mortgage | 757 | 309 | 2,201 | 3,267 | 11,595 | 14,862 | |||||||||||||||||||||
| Home equity | 139 | 69 | 339 | 547 | 7,729 | 8,276 | |||||||||||||||||||||
| Credit card and other consumer | |||||||||||||||||||||||||||
| U.S. credit card | 577 | 418 | 994 | 1,989 | 96,349 | 98,338 | |||||||||||||||||||||
Direct/Indirect consumer (4) | 317 | 90 | 40 | 447 | 90,719 | 91,166 | |||||||||||||||||||||
Other consumer (5) | — | — | — | — | 202 | 202 | |||||||||||||||||||||
| Total consumer | 3,178 | 1,220 | 4,754 | 9,152 | 437,397 | 446,549 | |||||||||||||||||||||
Consumer loans accounted for under the fair value option (6) | $ | 682 | 682 | ||||||||||||||||||||||||
| Total consumer loans and leases | 3,178 | 1,220 | 4,754 | 9,152 | 437,397 | 682 | 447,231 | ||||||||||||||||||||
| Commercial | |||||||||||||||||||||||||||
| U.S. commercial | 594 | 232 | 573 | 1,399 | 297,878 | 299,277 | |||||||||||||||||||||
| Non-U.S. commercial | 1 | 49 | — | 50 | 98,726 | 98,776 | |||||||||||||||||||||
Commercial real estate (7) | 29 | 16 | 14 | 59 | 60,786 | 60,845 | |||||||||||||||||||||
| Commercial lease financing | 124 | 114 | 37 | 275 | 22,259 | 22,534 | |||||||||||||||||||||
| U.S. small business commercial | 83 | 54 | 96 | 233 | 14,332 | 14,565 | |||||||||||||||||||||
| Total commercial | 831 | 465 | 720 | 2,016 | 493,981 | 495,997 | |||||||||||||||||||||
Commercial loans accounted for under the fair value option (6) | 3,667 | 3,667 | |||||||||||||||||||||||||
| Total commercial loans and leases | 831 | 465 | 720 | 2,016 | 493,981 | 3,667 | 499,664 | ||||||||||||||||||||
Total loans and leases (8) | $ | 4,009 | $ | 1,685 | $ | 5,474 | $ | 11,168 | $ | 931,378 | $ | 4,349 | $ | 946,895 | |||||||||||||
| Percentage of outstandings | 0.42 | % | 0.18 | % | 0.58 | % | 1.18 | % | 98.36 | % | 0.46 | % | 100.00 | % | |||||||||||||
30-59 Days Past Due (1) | 60-89 Days Past Due (1) | 90 Days or More Past Due (2) | Total Past Due 30 Days or More | Total Current or Less Than 30 Days Past Due (3) | Purchased Credit-impaired (4) | Loans Accounted for Under the Fair Value Option | Total Outstandings | ||||||||||||||||||||||||
| (Dollars in millions) | December 31, 2017 | ||||||||||||||||||||||||||||||
| Consumer real estate | |||||||||||||||||||||||||||||||
| Core portfolio | |||||||||||||||||||||||||||||||
| Residential mortgage | $ | 1,242 | $ | 321 | $ | 1,040 | $ | 2,603 | $ | 174,015 | $ | 176,618 | |||||||||||||||||||
| Home equity | 215 | 108 | 473 | 796 | 43,449 | 44,245 | |||||||||||||||||||||||||
| Non-core portfolio | |||||||||||||||||||||||||||||||
| Residential mortgage | 1,028 | 468 | 3,535 | 5,031 | 14,161 | $ | 8,001 | 27,193 | |||||||||||||||||||||||
| Home equity | 224 | 121 | 572 | 917 | 9,866 | 2,716 | 13,499 | ||||||||||||||||||||||||
| Credit card and other consumer | |||||||||||||||||||||||||||||||
| U.S. credit card | 542 | 405 | 900 | 1,847 | 94,438 | 96,285 | |||||||||||||||||||||||||
Direct/Indirect consumer (5) | 330 | 104 | 44 | 478 | 95,864 | 96,342 | |||||||||||||||||||||||||
Other consumer (6) | — | — | — | — | 166 | 166 | |||||||||||||||||||||||||
| Total consumer | 3,581 | 1,527 | 6,564 | 11,672 | 431,959 | 10,717 | 454,348 | ||||||||||||||||||||||||
Consumer loans accounted for under the fair value option (7) | $ | 928 | 928 | ||||||||||||||||||||||||||||
| Total consumer loans and leases | 3,581 | 1,527 | 6,564 | 11,672 | 431,959 | 10,717 | 928 | 455,276 | |||||||||||||||||||||||
| Commercial | |||||||||||||||||||||||||||||||
| U.S. commercial | 547 | 244 | 425 | 1,216 | 283,620 | 284,836 | |||||||||||||||||||||||||
| Non-U.S. commercial | 52 | 1 | 3 | 56 | 97,736 | 97,792 | |||||||||||||||||||||||||
Commercial real estate (8) | 48 | 10 | 29 | 87 | 58,211 | 58,298 | |||||||||||||||||||||||||
| Commercial lease financing | 110 | 68 | 26 | 204 | 21,912 | 22,116 | |||||||||||||||||||||||||
| U.S. small business commercial | 95 | 45 | 88 | 228 | 13,421 | 13,649 | |||||||||||||||||||||||||
| Total commercial | 852 | 368 | 571 | 1,791 | 474,900 | 476,691 | |||||||||||||||||||||||||
Commercial loans accounted for under the fair value option (7) | 4,782 | 4,782 | |||||||||||||||||||||||||||||
| Total commercial loans and leases | 852 | 368 | 571 | 1,791 | 474,900 | 4,782 | 481,473 | ||||||||||||||||||||||||
Total loans and leases (9) | $ | 4,433 | $ | 1,895 | $ | 7,135 | $ | 13,463 | $ | 906,859 | $ | 10,717 | $ | 5,710 | $ | 936,749 | |||||||||||||||
| Percentage of outstandings | 0.48 | % | 0.20 | % | 0.76 | % | 1.44 | % | 96.81 | % | 1.14 | % | 0.61 | % | 100.00 | % | |||||||||||||||
(1) | Consumer real estate loans 30-59 days past due includes fully-insured loans of $ |
(2) | Consumer real estate includes fully-insured loans of $ |
(3) | Consumer real estate includes $ |
(4) |
Total outstandings includes auto and specialty lending loans and leases of $ |
| Substantially all of other consumer is consumer overdrafts. |
Consumer loans accounted for under the fair value option includes residential mortgage loans of $ |
Total outstandings includes U.S. commercial real estate loans of $ |
Total outstandings includes loans and leases pledged as collateral of $ |
| Credit Quality | Credit Quality | Credit Quality | ||||||||||||||||||||||||||||
Nonperforming Loans and Leases | Accruing Past Due 90 Days or More | Nonperforming Loans and Leases | Accruing Past Due 90 Days or More | |||||||||||||||||||||||||||
| (Dollars in millions) | September 30 2018 | December 31 2017 | September 30 2018 | December 31 2017 | September 30 2019 | December 31 2018 | September 30 2019 | December 31 2018 | ||||||||||||||||||||||
| Consumer real estate | ||||||||||||||||||||||||||||||
| Core portfolio | ||||||||||||||||||||||||||||||
Residential mortgage (1) | $ | 1,011 | $ | 1,087 | $ | 308 | $ | 417 | $ | 930 | $ | 1,010 | $ | 186 | $ | 274 | ||||||||||||||
| Home equity | 1,056 | 1,079 | — | — | 380 | 955 | — | — | ||||||||||||||||||||||
| Non-core portfolio | ||||||||||||||||||||||||||||||
Residential mortgage (1) | 1,023 | 1,389 | 1,853 | 2,813 | 621 | 883 | 1,017 | 1,610 | ||||||||||||||||||||||
| Home equity | 1,170 | 1,565 | — | — | 205 | 938 | — | — | ||||||||||||||||||||||
| Credit card and other consumer | ||||||||||||||||||||||||||||||
| U.S. credit card | n/a | n/a | 872 | 900 | n/a | n/a | 960 | 994 | ||||||||||||||||||||||
| Direct/Indirect consumer | 46 | 46 | 35 | 40 | 53 | 56 | 29 | 38 | ||||||||||||||||||||||
| Other consumer | — | — | — | — | ||||||||||||||||||||||||||
| Total consumer | 4,306 | 5,166 | 3,068 | 4,170 | 2,189 | 3,842 | 2,192 | 2,916 | ||||||||||||||||||||||
| Commercial | ||||||||||||||||||||||||||||||
| U.S. commercial | 699 | 814 | 114 | 144 | 966 | 794 | 338 | 197 | ||||||||||||||||||||||
| Non-U.S. commercial | 31 | 299 | — | 3 | 51 | 80 | 10 | — | ||||||||||||||||||||||
| Commercial real estate | 46 | 112 | 1 | 4 | 185 | 156 | 3 | 4 | ||||||||||||||||||||||
| Commercial lease financing | 14 | 24 | 33 | 19 | 35 | 18 | 22 | 29 | ||||||||||||||||||||||
| U.S. small business commercial | 58 | 55 | 73 | 75 | 50 | 54 | 94 | 84 | ||||||||||||||||||||||
| Total commercial | 848 | 1,304 | 221 | 245 | 1,287 | 1,102 | 467 | 314 | ||||||||||||||||||||||
| Total loans and leases | $ | 5,154 | $ | 6,470 | $ | 3,289 | $ | 4,415 | $ | 3,476 | $ | 4,944 | $ | 2,659 | $ | 3,230 | ||||||||||||||
(1) | Residential mortgage loans in the core and non-core portfolios accruing past due 90 days or more are fully-insured loans. At September 30, |
Consumer Real Estate – Credit Quality Indicators (1) | Consumer Real Estate – Credit Quality Indicators (1) | Consumer Real Estate – Credit Quality Indicators (1) | ||||||||||||||||||||||||||||||||||||||||||||||||||||
Core Residential Mortgage (2) | Non-core Residential Mortgage (2) | Residential Mortgage PCI | Core Home Equity (2) | Non-core Home Equity (2) | Home Equity PCI | Core Residential Mortgage | Non-core Residential Mortgage | Core Home Equity | Non-core Home Equity | Core Residential Mortgage | Non-core Residential Mortgage | Core Home Equity | Non-core Home Equity | |||||||||||||||||||||||||||||||||||||||||
| (Dollars in millions) | September 30, 2018 | September 30, 2019 | December 31, 2018 | |||||||||||||||||||||||||||||||||||||||||||||||||||
Refreshed LTV | ||||||||||||||||||||||||||||||||||||||||||||||||||||||
| Less than or equal to 90 percent | $ | 168,949 | $ | 8,594 | $ | 4,720 | $ | 39,719 | $ | 6,862 | $ | 1,277 | $ | 195,967 | $ | 7,952 | $ | 35,548 | $ | 4,415 | $ | 173,911 | $ | 10,272 | $ | 39,246 | $ | 6,478 | ||||||||||||||||||||||||||
| Greater than 90 percent but less than or equal to 100 percent | 2,483 | 503 | 310 | 409 | 757 | 248 | 3,142 | 346 | 267 | 413 | 2,349 | 533 | 354 | 715 | ||||||||||||||||||||||||||||||||||||||||
| Greater than 100 percent | 923 | 544 | 311 | 468 | 1,209 | 286 | 1,041 | 333 | 301 | 630 | 817 | 545 | 410 | 1,083 | ||||||||||||||||||||||||||||||||||||||||
Fully-insured loans (4) | 16,935 | 3,914 | ||||||||||||||||||||||||||||||||||||||||||||||||||||
Fully-insured loans (2) | 16,073 | 2,618 | 16,618 | 3,512 | ||||||||||||||||||||||||||||||||||||||||||||||||||
| Total consumer real estate | $ | 189,290 | $ | 13,555 | $ | 5,341 | $ | 40,596 | $ | 8,828 | $ | 1,811 | $ | 216,223 | $ | 11,249 | $ | 36,116 | $ | 5,458 | $ | 193,695 | $ | 14,862 | $ | 40,010 | $ | 8,276 | ||||||||||||||||||||||||||
| Refreshed FICO score | ||||||||||||||||||||||||||||||||||||||||||||||||||||||
| Less than 620 | $ | 2,115 | $ | 1,673 | $ | 1,185 | $ | 1,118 | $ | 1,650 | $ | 290 | $ | 2,040 | $ | 1,306 | $ | 782 | $ | 627 | $ | 2,125 | $ | 1,974 | $ | 1,064 | $ | 1,503 | ||||||||||||||||||||||||||
| Greater than or equal to 620 and less than 680 | 4,379 | 1,387 | 1,010 | 2,096 | 1,883 | 288 | 4,716 | 1,160 | 1,581 | 885 | 4,538 | �� | 1,719 | 2,008 | 1,720 | |||||||||||||||||||||||||||||||||||||||
| Greater than or equal to 680 and less than 740 | 22,973 | 2,327 | 1,574 | 7,113 | 2,288 | 511 | 25,555 | 2,198 | 6,157 | 1,550 | 23,841 | 3,042 | 7,008 | 2,188 | ||||||||||||||||||||||||||||||||||||||||
| Greater than or equal to 740 | 142,888 | 4,254 | 1,572 | 30,269 | 3,007 | 722 | 167,839 | 3,967 | 27,596 | 2,396 | 146,573 | 4,615 | 29,930 | 2,865 | ||||||||||||||||||||||||||||||||||||||||
Fully-insured loans (4) | 16,935 | 3,914 | ||||||||||||||||||||||||||||||||||||||||||||||||||||
Fully-insured loans (2) | 16,073 | 2,618 | 16,618 | 3,512 | ||||||||||||||||||||||||||||||||||||||||||||||||||
| Total consumer real estate | $ | 189,290 | $ | 13,555 | $ | 5,341 | $ | 40,596 | $ | 8,828 | $ | 1,811 | $ | 216,223 | $ | 11,249 | $ | 36,116 | $ | 5,458 | $ | 193,695 | $ | 14,862 | $ | 40,010 | $ | 8,276 | ||||||||||||||||||||||||||
(1) | Excludes $ |
(2) |
| Credit quality indicators are not reported for fully-insured loans as principal repayment is insured. |
Bank of America 64 | ||
| Credit Card and Other Consumer – Credit Quality Indicators | Credit Card and Other Consumer – Credit Quality Indicators | Credit Card and Other Consumer – Credit Quality Indicators | ||||||||||||||||||||||||||||||||
U.S. Credit Card | Direct/Indirect Consumer | Other Consumer | U.S. Credit Card | Direct/Indirect Consumer | Other Consumer | U.S. Credit Card | Direct/Indirect Consumer | Other Consumer | ||||||||||||||||||||||||||
| (Dollars in millions) | September 30, 2018 | September 30, 2019 | December 31, 2018 | |||||||||||||||||||||||||||||||
| Refreshed FICO score | ||||||||||||||||||||||||||||||||||
| Less than 620 | $ | 4,683 | $ | 1,752 | $ | 4,970 | $ | 1,470 | $ | 5,016 | $ | 1,719 | ||||||||||||||||||||||
| Greater than or equal to 620 and less than 680 | 11,974 | 3,260 | 11,908 | 2,757 | 12,415 | 3,124 | ||||||||||||||||||||||||||||
| Greater than or equal to 680 and less than 740 | 34,896 | 9,090 | 34,652 | 8,490 | 35,781 | 8,921 | ||||||||||||||||||||||||||||
| Greater than or equal to 740 | 43,276 | 36,351 | 43,416 | 37,953 | 45,126 | 36,709 | ||||||||||||||||||||||||||||
Other internal credit metrics (1, 2) | 40,885 | $ | 203 | 40,166 | $ | 208 | 40,693 | $ | 202 | |||||||||||||||||||||||||
| Total credit card and other consumer | $ | 94,829 | $ | 91,338 | $ | 203 | $ | 94,946 | $ | 90,836 | $ | 208 | $ | 98,338 | $ | 91,166 | $ | 202 | ||||||||||||||||
(1) | Other internal credit metrics may include delinquency status, geography or other factors. |
(2) | Direct/indirect consumer includes $ |
Commercial – Credit Quality Indicators (1) | |||||||||||||||||||
U.S. Commercial | Non-U.S. Commercial | Commercial Real Estate | Commercial Lease Financing | U.S. Small Business Commercial (2) | |||||||||||||||
| (Dollars in millions) | September 30, 2019 | ||||||||||||||||||
| Risk ratings | |||||||||||||||||||
| Pass rated | $ | 302,826 | $ | 100,152 | $ | 61,901 | $ | 19,757 | $ | 235 | |||||||||
| Reservable criticized | 8,156 | 932 | 897 | 350 | 21 | ||||||||||||||
| Refreshed FICO score | |||||||||||||||||||
| Less than 620 | 293 | ||||||||||||||||||
| Greater than or equal to 620 and less than 680 | 738 | ||||||||||||||||||
| Greater than or equal to 680 and less than 740 | 2,229 | ||||||||||||||||||
| Greater than or equal to 740 | 4,767 | ||||||||||||||||||
Other internal credit metrics (3) | 6,946 | ||||||||||||||||||
| Total commercial | $ | 310,982 | $ | 101,084 | $ | 62,798 | $ | 20,107 | $ | 15,229 | |||||||||
| December 31, 2018 | |||||||||||||||||||
| Risk ratings | |||||||||||||||||||
| Pass rated | $ | 291,918 | $ | 97,916 | $ | 59,910 | $ | 22,168 | $ | 389 | |||||||||
| Reservable criticized | 7,359 | 860 | 935 | 366 | 29 | ||||||||||||||
| Refreshed FICO score | |||||||||||||||||||
| Less than 620 | 264 | ||||||||||||||||||
| Greater than or equal to 620 and less than 680 | 684 | ||||||||||||||||||
| Greater than or equal to 680 and less than 740 | 2,072 | ||||||||||||||||||
| Greater than or equal to 740 | 4,254 | ||||||||||||||||||
Other internal credit metrics (3) | 6,873 | ||||||||||||||||||
| Total commercial | $ | 299,277 | $ | 98,776 | $ | 60,845 | $ | 22,534 | $ | 14,565 | |||||||||
Commercial – Credit Quality Indicators (1) | |||||||||||||||||||
U.S. Commercial | Non-U.S. Commercial | Commercial Real Estate | Commercial Lease Financing | U.S. Small Business Commercial (2) | |||||||||||||||
| (Dollars in millions) | September 30, 2018 | ||||||||||||||||||
| Risk ratings | |||||||||||||||||||
| Pass rated | $ | 277,732 | $ | 94,868 | $ | 60,271 | $ | 21,173 | $ | 275 | |||||||||
| Reservable criticized | 7,930 | 1,134 | 564 | 373 | 31 | ||||||||||||||
Refreshed FICO score (3) | |||||||||||||||||||
| Less than 620 | 242 | ||||||||||||||||||
| Greater than or equal to 620 and less than 680 | 650 | ||||||||||||||||||
| Greater than or equal to 680 and less than 740 | 1,993 | ||||||||||||||||||
| Greater than or equal to 740 | 4,181 | ||||||||||||||||||
Other internal credit metrics (3, 4) | 6,862 | ||||||||||||||||||
| Total commercial | $ | 285,662 | $ | 96,002 | $ | 60,835 | $ | 21,546 | $ | 14,234 | |||||||||
(1) | Excludes $ |
(2) | At September 30, 2019 and December 31, 2018, U.S. small business commercial includes $ |
| Refreshed FICO score and other internal credit metrics are applicable only to the U.S. small business commercial portfolio. |
Other internal credit metrics may include delinquency status, application scores, geography or other factors. |
Consumer Real Estate – Credit Quality Indicators (1) | |||||||||||||||||||||||
Core Residential Mortgage (2) | Non-core Residential Mortgage (2) | Residential Mortgage PCI | Core Home Equity (2) | Non-core Home Equity (2) | Home Equity PCI | ||||||||||||||||||
| (Dollars in millions) | December 31, 2017 | ||||||||||||||||||||||
Refreshed LTV (3) | |||||||||||||||||||||||
| Less than or equal to 90 percent | $ | 153,669 | $ | 12,135 | $ | 6,872 | $ | 43,048 | $ | 7,944 | $ | 1,781 | |||||||||||
| Greater than 90 percent but less than or equal to 100 percent | 3,082 | 850 | 559 | 549 | 1,053 | 412 | |||||||||||||||||
| Greater than 100 percent | 1,322 | 1,011 | 570 | 648 | 1,786 | 523 | |||||||||||||||||
Fully-insured loans (4) | 18,545 | 5,196 | |||||||||||||||||||||
| Total consumer real estate | $ | 176,618 | $ | 19,192 | $ | 8,001 | $ | 44,245 | $ | 10,783 | $ | 2,716 | |||||||||||
| Refreshed FICO score | |||||||||||||||||||||||
| Less than 620 | $ | 2,234 | $ | 2,390 | $ | 1,941 | $ | 1,169 | $ | 2,098 | $ | 452 | |||||||||||
| Greater than or equal to 620 and less than 680 | 4,531 | 2,086 | 1,657 | 2,371 | 2,393 | 466 | |||||||||||||||||
| Greater than or equal to 680 and less than 740 | 22,934 | 3,519 | 2,396 | 8,115 | 2,723 | 786 | |||||||||||||||||
| Greater than or equal to 740 | 128,374 | 6,001 | 2,007 | 32,590 | 3,569 | 1,012 | |||||||||||||||||
Fully-insured loans (4) | 18,545 | 5,196 | |||||||||||||||||||||
| Total consumer real estate | $ | 176,618 | $ | 19,192 | $ | 8,001 | $ | 44,245 | $ | 10,783 | $ | 2,716 | |||||||||||
| Credit Card and Other Consumer – Credit Quality Indicators | |||||||||||
U.S. Credit Card | Direct/Indirect Consumer | Other Consumer | |||||||||
| (Dollars in millions) | December 31, 2017 | ||||||||||
| Refreshed FICO score | |||||||||||
| Less than 620 | $ | 4,730 | $ | 2,005 | |||||||
| Greater than or equal to 620 and less than 680 | 12,422 | 4,064 | |||||||||
| Greater than or equal to 680 and less than 740 | 35,656 | 10,371 | |||||||||
| Greater than or equal to 740 | 43,477 | 36,445 | |||||||||
Other internal credit metrics (1, 2) | 43,457 | $ | 166 | ||||||||
| Total credit card and other consumer | $ | 96,285 | $ | 96,342 | $ | 166 | |||||
Commercial – Credit Quality Indicators (1) | |||||||||||||||||||
U.S. Commercial | Non-U.S. Commercial | Commercial Real Estate | Commercial Lease Financing | U.S. Small Business Commercial (2) | |||||||||||||||
| (Dollars in millions) | December 31, 2017 | ||||||||||||||||||
| Risk ratings | |||||||||||||||||||
| Pass rated | $ | 275,904 | $ | 96,199 | $ | 57,732 | $ | 21,535 | $ | 322 | |||||||||
| Reservable criticized | 8,932 | 1,593 | 566 | 581 | 50 | ||||||||||||||
Refreshed FICO score (3) | |||||||||||||||||||
| Less than 620 | 223 | ||||||||||||||||||
| Greater than or equal to 620 and less than 680 | 625 | ||||||||||||||||||
| Greater than or equal to 680 and less than 740 | 1,875 | ||||||||||||||||||
| Greater than or equal to 740 | 3,713 | ||||||||||||||||||
Other internal credit metrics (3, 4) | 6,841 | ||||||||||||||||||
| Total commercial | $ | 284,836 | $ | 97,792 | $ | 58,298 | $ | 22,116 | $ | 13,649 | |||||||||
65Bank of America | ||
| Impaired Loans – Consumer Real Estate | Impaired Loans – Consumer Real Estate | Impaired Loans – Consumer Real Estate | ||||||||||||||||||||||||||||||||||||||||||||||||||||||||||||
Unpaid Principal Balance | Carrying Value | Related Allowance | Unpaid Principal Balance | Carrying Value | Related Allowance | Unpaid Principal Balance | Carrying Value | Related Allowance | Unpaid Principal Balance | Carrying Value | Related Allowance | |||||||||||||||||||||||||||||||||||||||||||||||||||
| (Dollars in millions) | September 30, 2018 | December 31, 2017 | September 30, 2019 | December 31, 2018 | ||||||||||||||||||||||||||||||||||||||||||||||||||||||||||
| With no recorded allowance | ||||||||||||||||||||||||||||||||||||||||||||||||||||||||||||||
| Residential mortgage | $ | 6,016 | $ | 4,783 | $ | — | $ | 8,856 | $ | 6,870 | $ | — | $ | 4,436 | $ | 3,534 | $ | — | $ | 5,396 | $ | 4,268 | $ | — | ||||||||||||||||||||||||||||||||||||||
| Home equity | 3,345 | 1,828 | — | 3,622 | 1,956 | — | 1,262 | 756 | — | 2,948 | 1,599 | — | ||||||||||||||||||||||||||||||||||||||||||||||||||
| With an allowance recorded | ||||||||||||||||||||||||||||||||||||||||||||||||||||||||||||||
| Residential mortgage | $ | 2,271 | $ | 2,215 | $ | 134 | $ | 2,908 | $ | 2,828 | $ | 174 | $ | 1,516 | $ | 1,488 | $ | 74 | $ | 1,977 | $ | 1,929 | $ | 114 | ||||||||||||||||||||||||||||||||||||||
| Home equity | 910 | 849 | 165 | 972 | 900 | 174 | 560 | 539 | 71 | 812 | 760 | 144 | ||||||||||||||||||||||||||||||||||||||||||||||||||
Total (1) | ||||||||||||||||||||||||||||||||||||||||||||||||||||||||||||||
| Total | ||||||||||||||||||||||||||||||||||||||||||||||||||||||||||||||
| Residential mortgage | $ | 8,287 | $ | 6,998 | $ | 134 | $ | 11,764 | $ | 9,698 | $ | 174 | $ | 5,952 | $ | 5,022 | $ | 74 | $ | 7,373 | $ | 6,197 | $ | 114 | ||||||||||||||||||||||||||||||||||||||
| Home equity | 4,255 | 2,677 | 165 | 4,594 | 2,856 | 174 | 1,822 | 1,295 | 71 | 3,760 | 2,359 | 144 | ||||||||||||||||||||||||||||||||||||||||||||||||||
| Average Carrying Value | Interest Income Recognized (2) | Average Carrying Value | Interest Income Recognized (2) | Average Carrying Value | Interest Income Recognized (2) | Average Carrying Value | Interest Income Recognized (2) | Average Carrying Value | Interest Income Recognized (1) | Average Carrying Value | Interest Income Recognized (1) | Average Carrying Value | Interest Income Recognized (1) | Average Carrying Value | Interest Income Recognized (1) | |||||||||||||||||||||||||||||||||||||||||||||||
| Three Months Ended September 30 | Nine Months Ended September 30 | Three Months Ended September 30 | Nine Months Ended September 30 | |||||||||||||||||||||||||||||||||||||||||||||||||||||||||||
| 2018 | 2017 | 2018 | 2017 | 2019 | 2018 | 2019 | 2018 | |||||||||||||||||||||||||||||||||||||||||||||||||||||||
| With no recorded allowance | ||||||||||||||||||||||||||||||||||||||||||||||||||||||||||||||
| Residential mortgage | $ | 5,056 | $ | 52 | $ | 7,498 | $ | 77 | $ | 5,685 | $ | 167 | $ | 7,964 | $ | 237 | $ | 3,746 | $ | 37 | $ | 5,056 | $ | 52 | $ | 3,955 | $ | 122 | $ | 5,685 | $ | 167 | ||||||||||||||||||||||||||||||
| Home equity | 1,908 | 27 | 2,000 | 27 | 1,937 | 79 | 2,001 | 82 | 1,041 | 16 | 1,908 | 27 | 1,368 | 64 | 1,937 | 79 | ||||||||||||||||||||||||||||||||||||||||||||||
| With an allowance recorded | ||||||||||||||||||||||||||||||||||||||||||||||||||||||||||||||
| Residential mortgage | $ | 2,330 | $ | 22 | $ | 3,254 | $ | 29 | $ | 2,508 | $ | 71 | $ | 3,565 | $ | 97 | $ | 1,551 | $ | 13 | $ | 2,330 | $ | 22 | $ | 1,696 | $ | 47 | $ | 2,508 | $ | 71 | ||||||||||||||||||||||||||||||
| Home equity | 864 | 7 | 873 | 6 | 879 | 19 | 850 | 18 | 591 | 5 | 864 | 7 | 670 | 17 | 879 | 19 | ||||||||||||||||||||||||||||||||||||||||||||||
Total (1) | ||||||||||||||||||||||||||||||||||||||||||||||||||||||||||||||
| Total | ||||||||||||||||||||||||||||||||||||||||||||||||||||||||||||||
| Residential mortgage | $ | 7,386 | $ | 74 | $ | 10,752 | $ | 106 | $ | 8,193 | $ | 238 | $ | 11,529 | $ | 334 | $ | 5,297 | $ | 50 | $ | 7,386 | $ | 74 | $ | 5,651 | $ | 169 | $ | 8,193 | $ | 238 | ||||||||||||||||||||||||||||||
| Home equity | 2,772 | 34 | 2,873 | 33 | 2,816 | 98 | 2,851 | 100 | 1,632 | 21 | 2,772 | 34 | 2,038 | 81 | 2,816 | 98 | ||||||||||||||||||||||||||||||||||||||||||||||
(1) |
| Interest income recognized includes interest accrued and collected on the outstanding balances of accruing impaired loans as well as interest cash collections on nonaccruing impaired loans for which the principal is considered collectible. |
| Consumer Real Estate – TDRs Entered into During the Three and Nine Months Ended September 30, 2018 and 2017 | ||||||||||||||||||||||||||||||||||||||||||||||||||||||
| Consumer Real Estate – TDRs Entered into During the Three and Nine Months Ended September 30, 2019 and 2018 | Consumer Real Estate – TDRs Entered into During the Three and Nine Months Ended September 30, 2019 and 2018 | |||||||||||||||||||||||||||||||||||||||||||||||||||||
| Unpaid Principal Balance | Carrying Value | Pre-Modification Interest Rate | Post-Modification Interest Rate (1) | Unpaid Principal Balance | Carrying Value | Pre-Modification Interest Rate | Post-Modification Interest Rate (1) | Unpaid Principal Balance | Carrying Value | Pre-Modification Interest Rate | Post-Modification Interest Rate (1) | Unpaid Principal Balance | Carrying Value | Pre-Modification Interest Rate | Post-Modification Interest Rate (1) | |||||||||||||||||||||||||||||||||||||||
| (Dollars in millions) | Three Months Ended September 30, 2018 | Nine Months Ended September 30, 2018 | Three Months Ended September 30, 2019 | Nine Months Ended September 30, 2019 | ||||||||||||||||||||||||||||||||||||||||||||||||||
| Residential mortgage | $ | 226 | $ | 195 | 4.27 | % | 4.12 | % | $ | 747 | $ | 635 | 4.22 | % | 4.03 | % | $ | 148 | $ | 125 | 4.29 | % | 4.25 | % | $ | 368 | $ | 301 | 4.24 | % | 4.22 | % | ||||||||||||||||||||||
| Home equity | 120 | 90 | 4.67 | 4.60 | 482 | 356 | 4.42 | 3.78 | 34 | 27 | 5.28 | 5.27 | 129 | 94 | 5.19 | 4.60 | ||||||||||||||||||||||||||||||||||||||
Total | $ | 346 | $ | 285 | 4.41 | 4.29 | $ | 1,229 | $ | 991 | 4.30 | 3.94 | $ | 182 | $ | 152 | 4.48 | 4.44 | $ | 497 | $ | 395 | 4.49 | 4.32 | ||||||||||||||||||||||||||||||
| Three Months Ended September 30, 2017 | Nine Months Ended September 30, 2017 | Three Months Ended September 30, 2018 | Nine Months Ended September 30, 2018 | |||||||||||||||||||||||||||||||||||||||||||||||||||
| Residential mortgage | $ | 294 | $ | 263 | 4.42 | % | 4.33 | % | $ | 738 | $ | 657 | 4.49 | % | 4.25 | % | $ | 226 | $ | 195 | 4.27 | % | 4.12 | % | $ | 747 | $ | 635 | 4.22 | % | 4.03 | % | ||||||||||||||||||||||
| Home equity | 212 | 172 | 4.01 | 3.96 | 630 | 491 | 4.16 | 3.52 | 120 | 90 | 4.67 | 4.60 | 482 | 356 | 4.42 | 3.78 | ||||||||||||||||||||||||||||||||||||||
Total | $ | 506 | $ | 435 | 4.25 | 4.17 | $ | 1,368 | $ | 1,148 | 4.33 | 3.90 | $ | 346 | $ | 285 | 4.41 | 4.29 | $ | 1,229 | $ | 991 | 4.30 | 3.94 | ||||||||||||||||||||||||||||||
(1) | The post-modification interest rate reflects the interest rate applicable only to permanently completed modifications, which exclude loans that are in a trial modification period. |
Bank of America 66 | ||
| Consumer Real Estate – Modification Programs | |||||||||||||||
| TDRs Entered into During the | |||||||||||||||
| Three Months Ended September 30 | Nine Months Ended September 30 | ||||||||||||||
| (Dollars in millions) | 2018 | 2017 | 2018 | 2017 | |||||||||||
| Modifications under government programs | |||||||||||||||
| Contractual interest rate reduction | $ | 5 | $ | 10 | $ | 19 | $ | 56 | |||||||
| Principal and/or interest forbearance | — | 1 | — | 4 | |||||||||||
Other modifications (1) | 7 | 7 | 29 | 22 | |||||||||||
| Total modifications under government programs | 12 | 18 | 48 | 82 | |||||||||||
| Modifications under proprietary programs | |||||||||||||||
| Contractual interest rate reduction | 7 | 15 | 159 | 178 | |||||||||||
| Capitalization of past due amounts | 10 | 12 | 67 | 47 | |||||||||||
| Principal and/or interest forbearance | 2 | 2 | 25 | 28 | |||||||||||
Other modifications (1) | 14 | 1 | 195 | 45 | |||||||||||
| Total modifications under proprietary programs | 33 | 30 | 446 | 298 | |||||||||||
| Trial modifications | 201 | 329 | 376 | 605 | |||||||||||
Loans discharged in Chapter 7 bankruptcy (2) | 39 | 58 | 121 | 163 | |||||||||||
| Total modifications | $ | 285 | $ | 435 | $ | 991 | $ | 1,148 | |||||||
| Consumer Real Estate – Modification Programs | |||||||||||||||
| TDRs Entered into During the | |||||||||||||||
| Three Months Ended September 30 | Nine Months Ended September 30 | ||||||||||||||
| (Dollars in millions) | 2019 | 2018 | 2019 | 2018 | |||||||||||
Modifications under government programs (1) | $ | 8 | $ | 12 | $ | 32 | $ | 48 | |||||||
Modifications under proprietary programs (1) | 18 | 33 | 125 | 446 | |||||||||||
Loans discharged in Chapter 7 bankruptcy (2) | 16 | 39 | 54 | 121 | |||||||||||
| Trial modifications | 110 | 201 | 184 | 376 | |||||||||||
| Total modifications | $ | 152 | $ | 285 | $ | 395 | $ | 991 | |||||||
(1) | Includes other modifications such as term or payment extensions and repayment plans. During the nine months ended September 30, 2018, this included $197 million of modifications that met the definition of a TDR related to the 2017 hurricanes. These modifications had been written down to their net realizable value less costs to sell or were fully insured as of September 30, |
(2) | Includes loans discharged in Chapter 7 bankruptcy with no change in repayment terms that are classified as TDRs. |
| Consumer Real Estate – TDRs Entering Payment Default that were Modified During the Preceding 12 Months | ||||||||||||||||||||||||||||||
| Three Months Ended September 30 | Nine Months Ended September 30 | Three Months Ended September 30 | Nine Months Ended September 30 | |||||||||||||||||||||||||||
| (Dollars in millions) | 2018 | 2017 | 2018 | 2017 | 2019 | 2018 | 2019 | 2018 | ||||||||||||||||||||||
| Modifications under government programs | $ | 8 | $ | 16 | $ | 32 | $ | 62 | $ | 7 | $ | 8 | $ | 20 | $ | 32 | ||||||||||||||
| Modifications under proprietary programs | 43 | 32 | 130 | 99 | 19 | 43 | 68 | 130 | ||||||||||||||||||||||
Loans discharged in Chapter 7 bankruptcy (1) | 12 | 16 | 51 | 93 | 8 | 12 | 26 | 51 | ||||||||||||||||||||||
Trial modifications (2) | 18 | 54 | 85 | 312 | 13 | 18 | 40 | 85 | ||||||||||||||||||||||
| Total modifications | $ | 81 | $ | 118 | $ | 298 | $ | 566 | $ | 47 | $ | 81 | $ | 154 | $ | 298 | ||||||||||||||
(1) | Includes loans discharged in Chapter 7 bankruptcy with no change in repayment terms that are classified as TDRs. |
(2) | Includes trial modification offers to which the customer did not respond. |
| Impaired Loans – Credit Card and Other Consumer | Impaired Loans – Credit Card and Other Consumer | Impaired Loans – Credit Card and Other Consumer | ||||||||||||||||||||||||||||||||||||||||||||||||||||||||
Unpaid Principal Balance | Carrying Value (1) | Related Allowance | Unpaid Principal Balance | Carrying Value (1) | Related Allowance | |||||||||||||||||||||||||||||||||||||||||||||||||||||
Unpaid Principal Balance | Carrying Value (1) | Related Allowance | Unpaid Principal Balance | Carrying Value (1) | Related Allowance | |||||||||||||||||||||||||||||||||||||||||||||||||||||
| (Dollars in millions) | September 30, 2018 | December 31, 2017 | September 30, 2019 | December 31, 2018 | ||||||||||||||||||||||||||||||||||||||||||||||||||||||
| With no recorded allowance | ||||||||||||||||||||||||||||||||||||||||||||||||||||||||||
| Direct/Indirect consumer | $ | 63 | $ | 29 | $ | — | $ | 58 | $ | 28 | $ | — | $ | 74 | $ | 33 | $ | — | $ | 72 | $ | 33 | $ | — | ||||||||||||||||||||||||||||||||||
| With an allowance recorded | ||||||||||||||||||||||||||||||||||||||||||||||||||||||||||
| U.S. credit card | $ | 501 | $ | 512 | $ | 143 | $ | 454 | $ | 461 | $ | 125 | $ | 610 | $ | 624 | $ | 179 | $ | 522 | $ | 533 | $ | 154 | ||||||||||||||||||||||||||||||||||
| Direct/Indirect consumer | — | — | — | 1 | 1 | — | ||||||||||||||||||||||||||||||||||||||||||||||||||||
| Total | ||||||||||||||||||||||||||||||||||||||||||||||||||||||||||
| U.S. credit card | $ | 501 | $ | 512 | $ | 143 | $ | 454 | $ | 461 | $ | 125 | $ | 610 | $ | 624 | $ | 179 | $ | 522 | $ | 533 | $ | 154 | ||||||||||||||||||||||||||||||||||
| Direct/Indirect consumer | 63 | 29 | — | 59 | 29 | — | 74 | 33 | — | 72 | 33 | — | ||||||||||||||||||||||||||||||||||||||||||||||
| Average Carrying Value | Interest Income Recognized (2) | Average Carrying Value | Interest Income Recognized (2) | Average Carrying Value | Interest Income Recognized (2) | Average Carrying Value | Interest Income Recognized (2) | Average Carrying Value (2) | ||||||||||||||||||||||||||||||||||||||||||||||||||
| Three Months Ended September 30 | Nine Months Ended September 30 | Three Months Ended September 30 | Nine Months Ended September 30 | |||||||||||||||||||||||||||||||||||||||||||||||||||||||
| 2018 | 2017 | 2018 | 2017 | 2019 | 2018 | 2019 | 2018 | |||||||||||||||||||||||||||||||||||||||||||||||||||
| With no recorded allowance | ||||||||||||||||||||||||||||||||||||||||||||||||||||||||||
| Direct/Indirect consumer | $ | 30 | $ | 1 | $ | 20 | $ | — | $ | 29 | $ | 2 | $ | 19 | $ | — | $ | 33 | $ | 30 | $ | 33 | $ | 29 | ||||||||||||||||||||||||||||||||||
| With an allowance recorded | ||||||||||||||||||||||||||||||||||||||||||||||||||||||||||
| U.S. credit card | $ | 498 | $ | 7 | $ | 457 | $ | 6 | $ | 481 | $ | 19 | $ | 466 | $ | 18 | $ | 609 | $ | 498 | $ | 579 | $ | 481 | ||||||||||||||||||||||||||||||||||
Non-U.S. credit card (3) | — | — | — | — | — | — | 62 | 1 | ||||||||||||||||||||||||||||||||||||||||||||||||||
| Direct/Indirect consumer | 1 | — | 2 | — | 1 | — | 2 | — | ||||||||||||||||||||||||||||||||||||||||||||||||||
| Total | ||||||||||||||||||||||||||||||||||||||||||||||||||||||||||
| U.S. credit card | $ | 498 | $ | 7 | $ | 457 | $ | 6 | $ | 481 | $ | 19 | $ | 466 | $ | 18 | ||||||||||||||||||||||||||||||||||||||||||
Non-U.S. credit card (3) | — | — | — | — | — | — | 62 | 1 | ||||||||||||||||||||||||||||||||||||||||||||||||||
| Direct/Indirect consumer | 31 | 1 | 22 | — | 30 | 2 | 21 | — | ||||||||||||||||||||||||||||||||||||||||||||||||||
(1) | Includes accrued interest and fees. |
(2) | The related interest income recognized, which includes interest accrued and collected on the outstanding balances of accruing impaired loans as well as interest cash collections on nonaccruing impaired loans for which the principal |
| Credit Card and Other Consumer – TDRs by Program Type | |||||||||||||||||||||||
| U.S. Credit Card | Direct/Indirect Consumer | Total TDRs by Program Type | |||||||||||||||||||||
| (Dollars in millions) | September 30 2019 | December 31 2018 | September 30 2019 | December 31 2018 | September 30 2019 | December 31 2018 | |||||||||||||||||
| Internal programs | $ | 322 | $ | 259 | $ | — | $ | — | $ | 322 | $ | 259 | |||||||||||
| External programs | 301 | 273 | — | — | 301 | 273 | |||||||||||||||||
| Other | 1 | 1 | 33 | 33 | 34 | 34 | |||||||||||||||||
| Total | $ | 624 | $ | 533 | $ | 33 | $ | 33 | $ | 657 | $ | 566 | |||||||||||
| Percent of balances current or less than 30 days past due | 85 | % | 85 | % | 80 | % | 81 | % | 85 | % | 85 | % | |||||||||||
| Credit Card and Other Consumer – TDRs by Program Type | |||||||||||||||||||||||
| U.S. Credit Card | Direct/Indirect Consumer | Total TDRs by Program Type | |||||||||||||||||||||
| (Dollars in millions) | September 30 2018 | December 31 2017 | September 30 2018 | December 31 2017 | September 30 2018 | December 31 2017 | |||||||||||||||||
| Internal programs | $ | 242 | $ | 203 | $ | — | $ | 1 | $ | 242 | $ | 204 | |||||||||||
| External programs | 269 | 257 | — | — | 269 | 257 | |||||||||||||||||
| Other | 1 | 1 | 29 | 28 | 30 | 29 | |||||||||||||||||
| Total | $ | 512 | $ | 461 | $ | 29 | $ | 29 | $ | 541 | $ | 490 | |||||||||||
| Percent of balances current or less than 30 days past due | 86 | % | 87 | % | 90 | % | 88 | % | 86 | % | 87 | % | |||||||||||
| Credit Card and Other Consumer – TDRs Entered into During the Three and Nine Months Ended September 30, 2018 and 2017 | ||||||||||||||||||||||||||||||||||||||||||||||||||||||
| Credit Card and Other Consumer – TDRs Entered into During the Three and Nine Months Ended September 30, 2019 and 2018 | Credit Card and Other Consumer – TDRs Entered into During the Three and Nine Months Ended September 30, 2019 and 2018 | |||||||||||||||||||||||||||||||||||||||||||||||||||||
| Unpaid Principal Balance | Carrying Value (1) | Pre-Modification Interest Rate | Post-Modification Interest Rate | Unpaid Principal Balance | Carrying Value (1) | Pre-Modification Interest Rate | Post-Modification Interest Rate | Unpaid Principal Balance | Carrying Value (1) | Pre-Modification Interest Rate | Post-Modification Interest Rate | Unpaid Principal Balance | Carrying Value (1) | Pre-Modification Interest Rate | Post-Modification Interest Rate | |||||||||||||||||||||||||||||||||||||||
| (Dollars in millions) | Three Months Ended September 30, 2018 | Nine Months Ended September 30, 2018 | Three Months Ended September 30, 2019 | Nine Months Ended September 30, 2019 | ||||||||||||||||||||||||||||||||||||||||||||||||||
| U.S. credit card | $ | 84 | $ | 91 | 19.45 | % | 5.19 | % | $ | 212 | $ | 224 | 19.30 | % | 5.24 | % | $ | 100 | $ | 107 | 19.62 | % | 5.36 | % | $ | 267 | $ | 281 | 19.50 | % | 5.35 | % | ||||||||||||||||||||||
| Direct/Indirect consumer | 18 | 10 | 4.61 | 4.50 | 33 | 19 | 4.77 | 4.58 | 19 | 11 | 5.32 | 5.32 | 35 | 19 | 5.23 | 5.22 | ||||||||||||||||||||||||||||||||||||||
Total | $ | 102 | $ | 101 | 17.94 | 5.12 | $ | 245 | $ | 243 | 18.16 | 5.19 | $ | 119 | $ | 118 | 18.36 | 5.36 | $ | 302 | $ | 300 | 18.62 | 5.34 | ||||||||||||||||||||||||||||||
| Three Months Ended September 30, 2017 | Nine Months Ended September 30, 2017 | Three Months Ended September 30, 2018 | Nine Months Ended September 30, 2018 | |||||||||||||||||||||||||||||||||||||||||||||||||||
| U.S. credit card | $ | 60 | $ | 64 | 17.96 | % | 5.40 | % | $ | 152 | $ | 161 | 17.88 | % | 5.49 | % | $ | 84 | $ | 91 | 19.45 | % | 5.19 | % | $ | 212 | $ | 224 | 19.30 | % | 5.24 | % | ||||||||||||||||||||||
| Direct/Indirect consumer | 22 | 14 | 4.92 | 4.53 | 29 | 18 | 4.99 | 4.37 | 18 | 10 | 4.61 | 4.50 | 33 | 19 | 4.77 | 4.58 | ||||||||||||||||||||||||||||||||||||||
Total | $ | 82 | $ | 78 | 15.64 | 5.25 | $ | 181 | $ | 179 | 16.57 | 5.37 | $ | 102 | $ | 101 | 17.94 | 5.12 | $ | 245 | $ | 243 | 18.16 | 5.19 | ||||||||||||||||||||||||||||||
(1) | Includes accrued interest and fees. |
| Impaired Loans – Commercial | |||||||||||||||||||||||||||||||
Unpaid Principal Balance | Carrying Value | Related Allowance | Unpaid Principal Balance | Carrying Value | Related Allowance | ||||||||||||||||||||||||||
| (Dollars in millions) | September 30, 2018 | December 31, 2017 | |||||||||||||||||||||||||||||
| With no recorded allowance | |||||||||||||||||||||||||||||||
| U.S. commercial | $ | 697 | $ | 684 | $ | — | $ | 576 | $ | 571 | $ | — | |||||||||||||||||||
| Non-U.S. commercial | 10 | 10 | — | 14 | 11 | — | |||||||||||||||||||||||||
| Commercial real estate | 42 | 32 | — | 83 | 80 | — | |||||||||||||||||||||||||
| Commercial lease financing | 2 | 2 | — | — | — | — | |||||||||||||||||||||||||
| With an allowance recorded | |||||||||||||||||||||||||||||||
| U.S. commercial | $ | 1,334 | $ | 1,073 | $ | 115 | $ | 1,393 | $ | 1,109 | $ | 98 | |||||||||||||||||||
| Non-U.S. commercial | 233 | 225 | 19 | 528 | 507 | 58 | |||||||||||||||||||||||||
| Commercial real estate | 104 | 20 | 2 | 133 | 41 | 4 | |||||||||||||||||||||||||
| Commercial lease financing | 72 | 72 | — | 20 | 18 | 3 | |||||||||||||||||||||||||
U.S. small business commercial (1) | 90 | 76 | 29 | 84 | 70 | 27 | |||||||||||||||||||||||||
| Total | |||||||||||||||||||||||||||||||
| U.S. commercial | $ | 2,031 | $ | 1,757 | $ | 115 | $ | 1,969 | $ | 1,680 | $ | 98 | |||||||||||||||||||
| Non-U.S. commercial | 243 | 235 | 19 | 542 | 518 | 58 | |||||||||||||||||||||||||
| Commercial real estate | 146 | 52 | 2 | 216 | 121 | 4 | |||||||||||||||||||||||||
| Commercial lease financing | 74 | 74 | — | 20 | 18 | 3 | |||||||||||||||||||||||||
U.S. small business commercial (1) | 90 | 76 | 29 | 84 | 70 | 27 | |||||||||||||||||||||||||
| Average Carrying Value | Interest Income Recognized (2) | Average Carrying Value | Interest Income Recognized (2) | Average Carrying Value | Interest Income Recognized (2) | Average Carrying Value | Interest Income Recognized (2) | ||||||||||||||||||||||||
| Three Months Ended September 30 | Nine Months Ended September 30 | ||||||||||||||||||||||||||||||
| 2018 | 2017 | 2018 | 2017 | ||||||||||||||||||||||||||||
| With no recorded allowance | |||||||||||||||||||||||||||||||
| U.S. commercial | $ | 640 | $ | 4 | $ | 726 | $ | 3 | $ | 659 | $ | 12 | $ | 822 | $ | 9 | |||||||||||||||
| Non-U.S. commercial | 9 | — | 14 | — | 35 | 2 | 55 | — | |||||||||||||||||||||||
| Commercial real estate | 68 | — | 77 | 1 | 72 | 1 | 61 | 1 | |||||||||||||||||||||||
| Commercial lease financing | 3 | — | — | — | 4 | — | — | — | |||||||||||||||||||||||
| With an allowance recorded | |||||||||||||||||||||||||||||||
| U.S. commercial | $ | 1,159 | $ | 11 | $ | 1,166 | $ | 9 | $ | 1,168 | $ | 32 | $ | 1,305 | $ | 25 | |||||||||||||||
| Non-U.S. commercial | 287 | 3 | 463 | 3 | 381 | 9 | 466 | 9 | |||||||||||||||||||||||
| Commercial real estate | 10 | — | 72 | — | 19 | — | 85 | 2 | |||||||||||||||||||||||
| Commercial lease financing | 58 | 1 | 10 | — | 32 | 1 | 6 | — | |||||||||||||||||||||||
U.S. small business commercial (1) | 74 | — | 72 | — | 74 | — | 74 | — | |||||||||||||||||||||||
| Total | |||||||||||||||||||||||||||||||
| U.S. commercial | $ | 1,799 | $ | 15 | $ | 1,892 | $ | 12 | $ | 1,827 | $ | 44 | $ | 2,127 | $ | 34 | |||||||||||||||
| Non-U.S. commercial | 296 | 3 | 477 | 3 | 416 | 11 | 521 | 9 | |||||||||||||||||||||||
| Commercial real estate | 78 | — | 149 | 1 | 91 | 1 | 146 | 3 | |||||||||||||||||||||||
| Commercial lease financing | 61 | 1 | 10 | — | 36 | 1 | 6 | — | |||||||||||||||||||||||
U.S. small business commercial (1) | 74 | — | 72 | — | 74 | — | 74 | — | |||||||||||||||||||||||
Bank of America 68 | ||
| Impaired Loans – Commercial | |||||||||||||||||||||||||
Unpaid Principal Balance | Carrying Value | Related Allowance | Unpaid Principal Balance | Carrying Value | Related Allowance | ||||||||||||||||||||
| (Dollars in millions) | September 30, 2019 | December 31, 2018 | |||||||||||||||||||||||
| With no recorded allowance | |||||||||||||||||||||||||
| U.S. commercial | $ | 620 | $ | 606 | $ | — | $ | 638 | $ | 616 | $ | — | |||||||||||||
| Non-U.S. commercial | 24 | 24 | — | 93 | 93 | — | |||||||||||||||||||
| Commercial real estate | 22 | 22 | — | — | — | — | |||||||||||||||||||
| Commercial lease financing | 13 | 13 | — | — | — | — | |||||||||||||||||||
| With an allowance recorded | |||||||||||||||||||||||||
| U.S. commercial | $ | 1,659 | $ | 1,495 | $ | 144 | $ | 1,437 | $ | 1,270 | $ | 121 | |||||||||||||
| Non-U.S. commercial | 254 | 253 | 10 | 155 | 149 | 30 | |||||||||||||||||||
| Commercial real estate | 319 | 242 | 59 | 247 | 162 | 16 | |||||||||||||||||||
| Commercial lease financing | 58 | 57 | 3 | 71 | 71 | — | |||||||||||||||||||
U.S. small business commercial (1) | 84 | 75 | 28 | 83 | 72 | 29 | |||||||||||||||||||
| Total | |||||||||||||||||||||||||
| U.S. commercial | $ | 2,279 | $ | 2,101 | $ | 144 | $ | 2,075 | $ | 1,886 | $ | 121 | |||||||||||||
| Non-U.S. commercial | 278 | 277 | 10 | 248 | 242 | 30 | |||||||||||||||||||
| Commercial real estate | 341 | 264 | 59 | 247 | 162 | 16 | |||||||||||||||||||
| Commercial lease financing | 71 | 70 | 3 | 71 | 71 | — | |||||||||||||||||||
U.S. small business commercial (1) | 84 | 75 | 28 | 83 | 72 | 29 | |||||||||||||||||||
Average Carrying Value (2) | |||||||||||||||||||||||||
| Three Months Ended September 30 | Nine Months Ended September 30 | ||||||||||||||||||||||||
| 2019 | 2018 | 2019 | 2018 | ||||||||||||||||||||||
| With no recorded allowance | |||||||||||||||||||||||||
| U.S. commercial | $ | 612 | $ | 640 | $ | 659 | $ | 659 | |||||||||||||||||
| Non-U.S. commercial | 57 | 9 | 81 | 35 | |||||||||||||||||||||
| Commercial real estate | 65 | 68 | 115 | 72 | |||||||||||||||||||||
| Commercial lease financing | 7 | 3 | 2 | 4 | |||||||||||||||||||||
| With an allowance recorded | |||||||||||||||||||||||||
| U.S. commercial | $ | 1,296 | $ | 1,159 | $ | 1,242 | $ | 1,168 | |||||||||||||||||
| Non-U.S. commercial | 251 | 287 | 230 | 381 | |||||||||||||||||||||
| Commercial real estate | 158 | 10 | 118 | 19 | |||||||||||||||||||||
| Commercial lease financing | 72 | 58 | 80 | 32 | |||||||||||||||||||||
U.S. small business commercial (1) | 74 | 74 | 74 | 74 | |||||||||||||||||||||
| Total | |||||||||||||||||||||||||
| U.S. commercial | $ | 1,908 | $ | 1,799 | $ | 1,901 | $ | 1,827 | |||||||||||||||||
| Non-U.S. commercial | 308 | 296 | 311 | 416 | |||||||||||||||||||||
| Commercial real estate | 223 | 78 | 233 | 91 | |||||||||||||||||||||
| Commercial lease financing | 79 | 61 | 82 | 36 | |||||||||||||||||||||
U.S. small business commercial (1) | 74 | 74 | 74 | 74 | |||||||||||||||||||||
(1) | Includes U.S. small business commercial renegotiated TDR loans and related allowance. |
(2) | The related interest income recognized, which includes interest accrued and collected on the outstanding balances of accruing impaired loans as well as interest cash collections on nonaccruing impaired loans for which the principal |
| Commercial – TDRs Entered into During the Three and Nine Months Ended September 30, 2018 and 2017 | |||||||||||||||
| Unpaid Principal Balance | Carrying Value | Unpaid Principal Balance | Carrying Value | ||||||||||||
| (Dollars in millions) | Three Months Ended September 30, 2018 | Nine Months Ended September 30, 2018 | |||||||||||||
| U.S. commercial | $ | 595 | $ | 544 | $ | 1,111 | $ | 1,006 | |||||||
| Non-U.S. commercial | 11 | 9 | 4 | 4 | |||||||||||
| Commercial real estate | — | — | 71 | 71 | |||||||||||
| Commercial lease financing | 29 | 29 | 92 | 91 | |||||||||||
U.S. small business commercial (1) | 3 | 2 | 8 | 6 | |||||||||||
Total (2) | $ | 638 | $ | 584 | $ | 1,286 | $ | 1,178 | |||||||
| Three Months Ended September 30, 2017 | Nine Months Ended September 30, 2017 | ||||||||||||||
| U.S. commercial | $ | 357 | $ | 322 | $ | 763 | $ | 700 | |||||||
| Non-U.S. commercial | 105 | 105 | 105 | 105 | |||||||||||
| Commercial real estate | — | — | 16 | 9 | |||||||||||
| Commercial lease financing | 12 | 12 | 12 | 12 | |||||||||||
U.S. small business commercial (1) | 3 | 3 | 11 | 12 | |||||||||||
Total (2) | $ | 477 | $ | 442 | $ | 907 | $ | 838 | |||||||
| Rollforward of Accretable Yield | |||||||
| (Dollars in millions) | Three Months Ended September 30, 2018 | Nine Months Ended September 30, 2018 | |||||
| Accretable yield, beginning of period | $ | 2,558 | $ | 2,789 | |||
| Accretion | (117 | ) | (371 | ) | |||
| Disposals/transfers | (612 | ) | (824 | ) | |||
| Reclassifications from nonaccretable difference | 56 | 291 | |||||
| Accretable yield, September 30, 2018 | $ | 1,885 | $ | 1,885 | |||
69Bank of America | ||
| Consumer Real Estate | Credit Card and Other Consumer | Commercial | Total | ||||||||||||
| (Dollars in millions) | Three Months Ended September 30, 2019 | ||||||||||||||
| Allowance for loan and lease losses, July 1 | $ | 719 | $ | 3,970 | $ | 4,838 | $ | 9,527 | |||||||
| Loans and leases charged off | (199 | ) | (1,093 | ) | (220 | ) | (1,512 | ) | |||||||
| Recoveries of loans and leases previously charged off | 439 | 231 | 31 | 701 | |||||||||||
| Net charge-offs | 240 | (862 | ) | (189 | ) | (811 | ) | ||||||||
| Provision for loan and lease losses | (312 | ) | 876 | 212 | 776 | ||||||||||
Other (1) | (56 | ) | 1 | (4 | ) | (59 | ) | ||||||||
| Allowance for loan and lease losses, September 30 | 591 | 3,985 | 4,857 | 9,433 | |||||||||||
| Reserve for unfunded lending commitments, July 1 | — | — | 806 | 806 | |||||||||||
| Provision for unfunded lending commitments | — | — | 3 | 3 | |||||||||||
| Reserve for unfunded lending commitments, September 30 | — | — | 809 | 809 | |||||||||||
| Allowance for credit losses, September 30 | $ | 591 | $ | 3,985 | $ | 5,666 | $ | 10,242 | |||||||
| Three Months Ended September 30, 2018 | |||||||||||||||
| Allowance for loan and lease losses, July 1 | $ | 1,366 | $ | 3,774 | $ | 4,910 | $ | 10,050 | |||||||
| Loans and leases charged off | (155 | ) | (992 | ) | (189 | ) | (1,336 | ) | |||||||
| Recoveries of loans and leases previously charged off | 163 | 208 | 33 | 404 | |||||||||||
| Net charge-offs | 8 | (784 | ) | (156 | ) | (932 | ) | ||||||||
| Provision for loan and lease losses | (119 | ) | 829 | 1 | 711 | ||||||||||
Other (1) | (97 | ) | 3 | (1 | ) | (95 | ) | ||||||||
| Allowance for loan and lease losses, September 30 | 1,158 | 3,822 | 4,754 | 9,734 | |||||||||||
| Reserve for unfunded lending commitments, July 1 | — | — | 787 | 787 | |||||||||||
| Provision for unfunded lending commitments | — | — | 5 | 5 | |||||||||||
| Reserve for unfunded lending commitments, September 30 | — | — | 792 | 792 | |||||||||||
| Allowance for credit losses, September 30 | $ | 1,158 | $ | 3,822 | $ | 5,546 | $ | 10,526 | |||||||
| (Dollars in millions) | Nine Months Ended September 30, 2019 | ||||||||||||||
| Allowance for loan and lease losses, January 1 | $ | 928 | $ | 3,874 | $ | 4,799 | $ | 9,601 | |||||||
| Loans and leases charged off | (455 | ) | (3,225 | ) | (630 | ) | (4,310 | ) | |||||||
| Recoveries of loans and leases previously charged off | 852 | 680 | 89 | 1,621 | |||||||||||
| Net charge-offs | 397 | (2,545 | ) | (541 | ) | (2,689 | ) | ||||||||
| Provision for loan and lease losses | (621 | ) | 2,655 | 603 | 2,637 | ||||||||||
Other (1) | (113 | ) | 1 | (4 | ) | (116 | ) | ||||||||
| Allowance for loan and lease losses, September 30 | 591 | 3,985 | 4,857 | 9,433 | |||||||||||
| Reserve for unfunded lending commitments, January 1 | — | — | 797 | 797 | |||||||||||
| Provision for unfunded lending commitments | — | — | 12 | 12 | |||||||||||
| Reserve for unfunded lending commitments, September 30 | — | — | 809 | 809 | |||||||||||
| Allowance for credit losses, September 30 | $ | 591 | $ | 3,985 | $ | 5,666 | $ | 10,242 | |||||||
| Nine Months Ended September 30, 2018 | |||||||||||||||
| Allowance for loan and lease losses, January 1 | $ | 1,720 | $ | 3,663 | $ | 5,010 | $ | 10,393 | |||||||
| Loans and leases charged off | (466 | ) | (3,031 | ) | (513 | ) | (4,010 | ) | |||||||
| Recoveries of loans and leases previously charged off | 440 | 621 | 110 | 1,171 | |||||||||||
| Net charge-offs | (26 | ) | (2,410 | ) | (403 | ) | (2,839 | ) | |||||||
| Provision for loan and lease losses | (368 | ) | 2,583 | 147 | 2,362 | ||||||||||
Other (1) | (168 | ) | (14 | ) | — | (182 | ) | ||||||||
| Allowance for loan and lease losses, September 30 | 1,158 | 3,822 | 4,754 | 9,734 | |||||||||||
| Reserve for unfunded lending commitments, January 1 | — | — | 777 | 777 | |||||||||||
| Provision for unfunded lending commitments | — | — | 15 | 15 | |||||||||||
| Reserve for unfunded lending commitments, September 30 | — | — | 792 | 792 | |||||||||||
| Allowance for credit losses, September 30 | $ | 1,158 | $ | 3,822 | $ | 5,546 | $ | 10,526 | |||||||
Consumer Real Estate (1) | Credit Card and Other Consumer | Commercial | Total Allowance | ||||||||||||
| (Dollars in millions) | Three Months Ended September 30, 2018 | ||||||||||||||
| Allowance for loan and lease losses, July 1 | $ | 1,366 | $ | 3,774 | $ | 4,910 | $ | 10,050 | |||||||
| Loans and leases charged off | (155 | ) | (992 | ) | (189 | ) | (1,336 | ) | |||||||
| Recoveries of loans and leases previously charged off | 163 | 208 | 33 | 404 | |||||||||||
| Net charge-offs | 8 | (784 | ) | (156 | ) | (932 | ) | ||||||||
Write-offs of PCI loans (2) | (95 | ) | — | — | (95 | ) | |||||||||
Provision for loan and lease losses (3) | (119 | ) | 829 | 1 | 711 | ||||||||||
Other (4) | (2 | ) | 3 | (1 | ) | — | |||||||||
| Allowance for loan and lease losses, September 30 | 1,158 | 3,822 | 4,754 | 9,734 | |||||||||||
| Reserve for unfunded lending commitments, July 1 | — | — | 787 | 787 | |||||||||||
| Provision for unfunded lending commitments | — | — | 5 | 5 | |||||||||||
| Reserve for unfunded lending commitments, September 30 | — | — | 792 | 792 | |||||||||||
| Allowance for credit losses, September 30 | $ | 1,158 | $ | 3,822 | $ | 5,546 | $ | 10,526 | |||||||
| Three Months Ended September 30, 2017 | |||||||||||||||
| Allowance for loan and lease losses, July 1 | $ | 2,309 | $ | 3,386 | $ | 5,180 | $ | 10,875 | |||||||
| Loans and leases charged off | (231 | ) | (919 | ) | (212 | ) | (1,362 | ) | |||||||
| Recoveries of loans and leases previously charged off | 230 | 189 | 43 | 462 | |||||||||||
| Net charge-offs | (1 | ) | (730 | ) | (169 | ) | (900 | ) | |||||||
Write-offs of PCI loans (2) | (73 | ) | — | — | (73 | ) | |||||||||
Provision for loan and lease losses (3) | (204 | ) | 934 | 99 | 829 | ||||||||||
Other (4) | 1 | (40 | ) | 1 | (38 | ) | |||||||||
| Allowance for loan and lease losses, September 30 | 2,032 | 3,550 | 5,111 | 10,693 | |||||||||||
| Reserve for unfunded lending commitments, July 1 | — | — | 757 | 757 | |||||||||||
| Provision for unfunded lending commitments | — | — | 5 | 5 | |||||||||||
| Reserve for unfunded lending commitments, September 30 | — | — | 762 | 762 | |||||||||||
| Allowance for credit losses, September 30 | $ | 2,032 | $ | 3,550 | $ | 5,873 | $ | 11,455 | |||||||
| Nine Months Ended September 30, 2018 | |||||||||||||||
| Allowance for loan and lease losses, January 1 | $ | 1,720 | $ | 3,663 | $ | 5,010 | $ | 10,393 | |||||||
| Loans and leases charged off | (466 | ) | (3,031 | ) | (513 | ) | (4,010 | ) | |||||||
| Recoveries of loans and leases previously charged off | 440 | 621 | 110 | 1,171 | |||||||||||
| Net charge-offs | (26 | ) | (2,410 | ) | (403 | ) | (2,839 | ) | |||||||
Write-offs of PCI loans (2) | (166 | ) | — | — | (166 | ) | |||||||||
Provision for loan and lease losses (3) | (368 | ) | 2,583 | 147 | 2,362 | ||||||||||
Other (4) | (2 | ) | (14 | ) | — | (16 | ) | ||||||||
| Allowance for loan and lease losses, September 30 | 1,158 | 3,822 | 4,754 | 9,734 | |||||||||||
| Reserve for unfunded lending commitments, January 1 | — | — | 777 | 777 | |||||||||||
| Provision for unfunded lending commitments | — | — | 15 | 15 | |||||||||||
| Reserve for unfunded lending commitments, September 30 | — | — | 792 | 792 | |||||||||||
| Allowance for credit losses, September 30 | $ | 1,158 | $ | 3,822 | $ | 5,546 | $ | 10,526 | |||||||
| Nine Months Ended September 30, 2017 | |||||||||||||||
| Allowance for loan and lease losses, January 1 | $ | 2,750 | $ | 3,229 | $ | 5,258 | $ | 11,237 | |||||||
| Loans and leases charged off | (633 | ) | (2,819 | ) | (570 | ) | (4,022 | ) | |||||||
| Recoveries of loans and leases previously charged off | 520 | 623 | 137 | 1,280 | |||||||||||
| Net charge-offs | (113 | ) | (2,196 | ) | (433 | ) | (2,742 | ) | |||||||
Write-offs of PCI loans (2) | (161 | ) | — | — | (161 | ) | |||||||||
Provision for loan and lease losses (3) | (445 | ) | 2,553 | 287 | 2,395 | ||||||||||
Other (4) | 1 | (36 | ) | (1 | ) | (36 | ) | ||||||||
| Allowance for loan and lease losses, September 30 | 2,032 | 3,550 | 5,111 | 10,693 | |||||||||||
| Reserve for unfunded lending commitments, January 1 and September 30 | — | — | 762 | 762 | |||||||||||
| Allowance for credit losses, September 30 | $ | 2,032 | $ | 3,550 | $ | 5,873 | $ | 11,455 | |||||||
(1) |
| Primarily represents write-offs of purchased credit-impaired loans, the net impact of portfolio sales, |
| Consumer Real Estate | Credit Card and Other Consumer | Commercial | Total | ||||||||||||
| (Dollars in millions) | September 30, 2019 | ||||||||||||||
Impaired loans and troubled debt restructurings (1) | |||||||||||||||
| Allowance for loan and lease losses | $ | 145 | $ | 179 | $ | 244 | $ | 568 | |||||||
Carrying value (2) | 6,317 | 657 | 2,787 | 9,761 | |||||||||||
| Allowance as a percentage of carrying value | 2.30 | % | 27.25 | % | 8.75 | % | 5.82 | % | |||||||
| Loans collectively evaluated for impairment | |||||||||||||||
| Allowance for loan and lease losses | $ | 446 | $ | 3,806 | $ | 4,613 | $ | 8,865 | |||||||
Carrying value (2, 3) | 262,729 | 185,333 | 507,413 | 955,475 | |||||||||||
Allowance as a percentage of carrying value (3) | 0.17 | % | 2.05 | % | 0.91 | % | 0.93 | % | |||||||
| Total | |||||||||||||||
| Allowance for loan and lease losses | $ | 591 | $ | 3,985 | $ | 4,857 | $ | 9,433 | |||||||
Carrying value (2, 3) | 269,046 | 185,990 | 510,200 | 965,236 | |||||||||||
Allowance as a percentage of carrying value (3) | 0.22 | % | 2.14 | % | 0.95 | % | 0.98 | % | |||||||
| December 31, 2018 | |||||||||||||||
Impaired loans and troubled debt restructurings (1) | |||||||||||||||
| Allowance for loan and lease losses | $ | 258 | $ | 154 | $ | 196 | $ | 608 | |||||||
Carrying value (2) | 8,556 | 566 | 2,433 | 11,555 | |||||||||||
| Allowance as a percentage of carrying value | 3.02 | % | 27.21 | % | 8.06 | % | 5.26 | % | |||||||
| Loans collectively evaluated for impairment | |||||||||||||||
| Allowance for loan and lease losses | $ | 670 | $ | 3,720 | $ | 4,603 | $ | 8,993 | |||||||
Carrying value (2, 3) | 248,287 | 189,140 | 493,564 | 930,991 | |||||||||||
Allowance as a percentage of carrying value (3) | 0.27 | % | 1.97 | % | 0.93 | % | 0.97 | % | |||||||
| Total | |||||||||||||||
| Allowance for loan and lease losses | $ | 928 | $ | 3,874 | $ | 4,799 | $ | 9,601 | |||||||
Carrying value (2, 3) | 256,843 | 189,706 | 495,997 | 942,546 | |||||||||||
Allowance as a percentage of carrying value (3) | 0.36 | % | 2.04 | % | 0.97 | % | 1.02 | % | |||||||
| Allowance and Carrying Value by Portfolio Segment | |||||||||||||||
| Consumer Real Estate | Credit Card and Other Consumer | Commercial | Total | ||||||||||||
| (Dollars in millions) | September 30, 2018 | ||||||||||||||
Impaired loans and troubled debt restructurings (1) | |||||||||||||||
| Allowance for loan and lease losses | $ | 299 | $ | 143 | $ | 165 | $ | 607 | |||||||
Carrying value (2) | 9,675 | 541 | 2,194 | 12,410 | |||||||||||
| Allowance as a percentage of carrying value | 3.09 | % | 26.43 | % | 7.52 | % | 4.89 | % | |||||||
| Loans collectively evaluated for impairment | |||||||||||||||
| Allowance for loan and lease losses | $ | 709 | $ | 3,679 | $ | 4,589 | $ | 8,977 | |||||||
Carrying value (2, 3) | 242,594 | 185,829 | 476,085 | 904,508 | |||||||||||
Allowance as a percentage of carrying value (3) | 0.29 | % | 1.98 | % | 0.96 | % | 0.99 | % | |||||||
| Purchased credit-impaired loans | |||||||||||||||
| Valuation allowance | $ | 150 | n/a | n/a | $ | 150 | |||||||||
| Carrying value gross of valuation allowance | 7,152 | n/a | n/a | 7,152 | |||||||||||
| Valuation allowance as a percentage of carrying value | 2.10 | % | n/a | n/a | 2.10 | % | |||||||||
| Total | |||||||||||||||
| Allowance for loan and lease losses | $ | 1,158 | $ | 3,822 | $ | 4,754 | $ | 9,734 | |||||||
Carrying value (2, 3) | 259,421 | 186,370 | 478,279 | 924,070 | |||||||||||
Allowance as a percentage of carrying value (3) | 0.45 | % | 2.05 | % | 0.99 | % | 1.05 | % | |||||||
| December 31, 2017 | |||||||||||||||
Impaired loans and troubled debt restructurings (1) | |||||||||||||||
| Allowance for loan and lease losses | $ | 348 | $ | 125 | $ | 190 | $ | 663 | |||||||
Carrying value (2) | 12,554 | 490 | 2,407 | 15,451 | |||||||||||
| Allowance as a percentage of carrying value | 2.77 | % | 25.51 | % | 7.89 | % | 4.29 | % | |||||||
| Loans collectively evaluated for impairment | |||||||||||||||
| Allowance for loan and lease losses | $ | 1,083 | $ | 3,538 | $ | 4,820 | $ | 9,441 | |||||||
Carrying value (2, 3) | 238,284 | 192,303 | 474,284 | 904,871 | |||||||||||
Allowance as a percentage of carrying value (3) | 0.45 | % | 1.84 | % | 1.02 | % | 1.04 | % | |||||||
| Purchased credit-impaired loans | |||||||||||||||
| Valuation allowance | $ | 289 | n/a | n/a | $ | 289 | |||||||||
| Carrying value gross of valuation allowance | 10,717 | n/a | n/a | 10,717 | |||||||||||
| Valuation allowance as a percentage of carrying value | 2.70 | % | n/a | n/a | 2.70 | % | |||||||||
| Total | |||||||||||||||
| Allowance for loan and lease losses | $ | 1,720 | $ | 3,663 | $ | 5,010 | $ | 10,393 | |||||||
Carrying value (2, 3) | 261,555 | 192,793 | 476,691 | 931,039 | |||||||||||
Allowance as a percentage of carrying value (3) | 0.66 | % | 1.90 | % | 1.05 | % | 1.12 | % | |||||||
(1) | Impaired loans include nonperforming commercial loans and leases, as well as all TDRs, including both commercial and consumer TDRs. Impaired loans exclude nonperforming consumer loans unless they are TDRs, and all consumer and commercial loans accounted for under the fair value option. |
(2) | Amounts are presented gross of the allowance for loan and lease losses. |
(3) | Outstanding loan and lease balances and ratios do not include loans accounted for under the fair value option of $ |
71Bank of America | ||
| First-lien Mortgage Securitizations | First-lien Mortgage Securitizations | First-lien Mortgage Securitizations | ||||||||||||||||||||||||||||||||||||||||||||||||||||||||||||
| Residential Mortgage - Agency | Commercial Mortgage | Residential Mortgage - Agency | Commercial Mortgage | |||||||||||||||||||||||||||||||||||||||||||||||||||||||||||
| Three Months Ended September 30 | Nine Months Ended September 30 | Three Months Ended September 30 | Nine Months Ended September 30 | Three Months Ended September 30 | Nine Months Ended September 30 | Three Months Ended September 30 | Nine Months Ended September 30 | |||||||||||||||||||||||||||||||||||||||||||||||||||||||
| (Dollars in millions) | 2018 | 2017 | 2018 | 2017 | 2018 | 2017 | 2018 | 2017 | 2019 | 2018 | 2019 | 2018 | 2019 | 2018 | 2019 | 2018 | ||||||||||||||||||||||||||||||||||||||||||||||
Cash proceeds from new securitizations (1) | $ | 1,596 | $ | 3,833 | $ | 4,661 | $ | 11,791 | $ | 1,797 | $ | 1,225 | $ | 3,981 | $ | 2,931 | ||||||||||||||||||||||||||||||||||||||||||||||
Proceeds from loan sales (1) | $ | 2,718 | $ | 1,650 | $ | 6,020 | $ | 4,800 | $ | 1,360 | $ | 1,868 | $ | 4,541 | $ | 4,146 | ||||||||||||||||||||||||||||||||||||||||||||||
Gains on securitizations (2) | 13 | 40 | 54 | 140 | 29 | 14 | 68 | 67 | 8 | 13 | 23 | 54 | 28 | 29 | 73 | 68 | ||||||||||||||||||||||||||||||||||||||||||||||
Repurchases from securitization trusts (3) | 357 | 609 | 1,215 | 2,083 | — | — | — | — | 209 | 357 | 695 | 1,215 | — | — | — | — | ||||||||||||||||||||||||||||||||||||||||||||||
(1) | The Corporation transfers residential mortgage loans to securitizations sponsored primarily by the GSEs or Government National Mortgage Association (GNMA) in the normal course of business and primarily receives RMBS in |
(2) | A majority of the first-lien residential mortgage loans securitized are initially classified as LHFS and accounted for under the fair value option. Gains recognized on these LHFS prior to securitization, which totaled $ |
(3) | The Corporation may have the option to repurchase delinquent loans out of securitization trusts, which reduces the amount of servicing advances it is required to make. The Corporation may also repurchase loans from securitization trusts to perform modifications. Repurchased loans include FHA-insured mortgages collateralizing GNMA securities. |
| First-lien Mortgage VIEs | First-lien Mortgage VIEs | First-lien Mortgage VIEs | ||||||||||||||||||||||||||||||||||||||||||||||||||||||||||||||||||
| Residential Mortgage | Residential Mortgage | |||||||||||||||||||||||||||||||||||||||||||||||||||||||||||||||||||
| Non-agency | Non-agency | |||||||||||||||||||||||||||||||||||||||||||||||||||||||||||||||||||
| Agency | Prime | Subprime | Alt-A | Commercial Mortgage | Agency | Prime | Subprime | Alt-A | Commercial Mortgage | |||||||||||||||||||||||||||||||||||||||||||||||||||||||||||
| (Dollars in millions) | Sept 30 2018 | December 31 2017 | Sept 30 2018 | December 31 2017 | Sept 30 2018 | December 31 2017 | Sept 30 2018 | December 31 2017 | Sept 30 2018 | December 31 2017 | Sept 30 2019 | December 31 2018 | Sept 30 2019 | December 31 2018 | Sept 30 2019 | December 31 2018 | Sept 30 2019 | December 31 2018 | Sept 30 2019 | December 31 2018 | ||||||||||||||||||||||||||||||||||||||||||||||||
| Unconsolidated VIEs | ||||||||||||||||||||||||||||||||||||||||||||||||||||||||||||||||||||
Maximum loss exposure (1) | $ | 16,461 | $ | 19,110 | $ | 458 | $ | 689 | $ | 2,063 | $ | 2,643 | $ | 218 | $ | 403 | $ | 659 | $ | 585 | $ | 15,446 | $ | 16,011 | $ | 362 | $ | 448 | $ | 1,825 | $ | 1,897 | $ | 150 | $ | 217 | $ | 959 | $ | 767 | ||||||||||||||||||||||||||||
| On-balance sheet assets | ||||||||||||||||||||||||||||||||||||||||||||||||||||||||||||||||||||
| Senior securities: | ||||||||||||||||||||||||||||||||||||||||||||||||||||||||||||||||||||
| Trading account assets | $ | 509 | $ | 716 | $ | 21 | $ | 6 | $ | 47 | $ | 10 | $ | 71 | $ | 50 | $ | 57 | $ | 108 | $ | 1,221 | $ | 460 | $ | 8 | $ | 30 | $ | 56 | $ | 36 | $ | 30 | $ | 90 | $ | 141 | $ | 97 | ||||||||||||||||||||||||||||
| Debt securities carried at fair value | 10,232 | 15,036 | 262 | 477 | 1,592 | 2,221 | 145 | 351 | — | — | 8,608 | 9,381 | 207 | 246 | 1,397 | 1,470 | 118 | 125 | — | — | ||||||||||||||||||||||||||||||||||||||||||||||||
| Held-to-maturity securities | 5,720 | 3,348 | — | — | — | — | — | — | 419 | 274 | 5,617 | 6,170 | — | — | — | — | — | — | 642 | 528 | ||||||||||||||||||||||||||||||||||||||||||||||||
All other assets (2) | — | 10 | 3 | 5 | 66 | 38 | 2 | 2 | 44 | 88 | ||||||||||||||||||||||||||||||||||||||||||||||||||||||||||
| All other assets | — | — | 3 | 3 | 34 | 37 | 2 | 2 | 56 | 40 | ||||||||||||||||||||||||||||||||||||||||||||||||||||||||||
| Total retained positions | $ | 16,461 | $ | 19,110 | $ | 286 | $ | 488 | $ | 1,705 | $ | 2,269 | $ | 218 | $ | 403 | $ | 520 | $ | 470 | $ | 15,446 | $ | 16,011 | $ | 218 | $ | 279 | $ | 1,487 | $ | 1,543 | $ | 150 | $ | 217 | $ | 839 | $ | 665 | ||||||||||||||||||||||||||||
Principal balance outstanding (3) | $ | 195,110 | $ | 232,761 | $ | 9,448 | $ | 10,549 | $ | 9,156 | $ | 10,254 | $ | 24,439 | $ | 28,129 | $ | 31,251 | $ | 26,504 | ||||||||||||||||||||||||||||||||||||||||||||||||
Principal balance outstanding (2) | $ | 167,502 | $ | 187,512 | $ | 7,696 | $ | 8,954 | $ | 8,512 | $ | 8,719 | $ | 20,769 | $ | 23,467 | $ | 50,128 | $ | 43,593 | ||||||||||||||||||||||||||||||||||||||||||||||||
| Consolidated VIEs | ||||||||||||||||||||||||||||||||||||||||||||||||||||||||||||||||||||
Maximum loss exposure (1) | $ | 13,206 | $ | 14,502 | $ | 551 | $ | 571 | $ | — | $ | — | $ | — | $ | — | $ | — | $ | — | $ | 11,321 | $ | 13,296 | $ | 5 | $ | 7 | $ | — | $ | — | $ | — | $ | — | $ | — | $ | 76 | ||||||||||||||||||||||||||||
| On-balance sheet assets | ||||||||||||||||||||||||||||||||||||||||||||||||||||||||||||||||||||
| Trading account assets | $ | 733 | $ | 232 | $ | 704 | $ | 571 | $ | — | $ | — | $ | — | $ | — | $ | — | $ | — | $ | 718 | $ | 1,318 | $ | 126 | $ | 150 | $ | — | $ | — | $ | — | $ | — | $ | — | $ | 76 | ||||||||||||||||||||||||||||
| Loans and leases, net | 12,312 | 14,030 | — | — | — | — | — | — | — | — | 10,426 | 11,858 | — | — | — | — | — | — | — | — | ||||||||||||||||||||||||||||||||||||||||||||||||
| All other assets | 162 | 240 | — | — | — | — | — | — | — | — | 178 | 143 | — | — | — | — | — | — | — | — | ||||||||||||||||||||||||||||||||||||||||||||||||
| Total assets | $ | 13,207 | $ | 14,502 | $ | 704 | $ | 571 | $ | — | $ | — | $ | — | $ | — | $ | — | $ | — | $ | 11,322 | $ | 13,319 | $ | 126 | $ | 150 | $ | — | $ | — | $ | — | $ | — | $ | — | $ | 76 | ||||||||||||||||||||||||||||
| Total liabilities | $ | 3 | $ | 3 | $ | 153 | $ | — | $ | — | $ | — | $ | — | $ | — | $ | — | $ | — | $ | 4 | $ | 26 | $ | 121 | $ | 143 | $ | — | $ | — | $ | — | $ | — | $ | — | $ | — | ||||||||||||||||||||||||||||
(1) | Maximum loss exposure includes obligations under loss-sharing reinsurance and other arrangements for non-agency residential mortgage and commercial mortgage securitizations, but excludes the reserve for representations and warranties obligations and corporate guarantees and also excludes servicing advances and other servicing rights and obligations. For |
(2) |
| Principal balance outstanding includes loans where the Corporation was the transferor to securitization VIEs with which it has continuing involvement, which may include servicing the loans. |
Bank of America 72 | ||
| Home Equity Loan, Credit Card and Other Asset-backed VIEs | Home Equity Loan, Credit Card and Other Asset-backed VIEs | Home Equity Loan, Credit Card and Other Asset-backed VIEs | ||||||||||||||||||||||||||||||||||||||||||||||||||||
Home Equity (1) | Credit Card (2, 3) | Resecuritization Trusts | Municipal Bond Trusts | Home Equity (1) | Credit Card (2, 3) | Resecuritization Trusts | Municipal Bond Trusts | |||||||||||||||||||||||||||||||||||||||||||||||
| (Dollars in millions) | Sept 30 2018 | December 31 2017 | Sept 30 2018 | December 31 2017 | Sept 30 2018 | December 31 2017 | Sept 30 2018 | December 31 2017 | Sept 30 2019 | December 31 2018 | Sept 30 2019 | December 31 2018 | Sept 30 2019 | December 31 2018 | Sept 30 2019 | December 31 2018 | ||||||||||||||||||||||||||||||||||||||
| Unconsolidated VIEs | ||||||||||||||||||||||||||||||||||||||||||||||||||||||
| Maximum loss exposure | $ | 1,101 | $ | 1,522 | $ | — | $ | — | $ | 8,185 | $ | 8,204 | $ | 1,837 | $ | 1,631 | $ | 661 | $ | 908 | $ | — | $ | — | $ | 6,979 | $ | 7,647 | $ | 3,424 | $ | 2,150 | ||||||||||||||||||||||
| On-balance sheet assets | ||||||||||||||||||||||||||||||||||||||||||||||||||||||
Senior securities (4): | ||||||||||||||||||||||||||||||||||||||||||||||||||||||
| Trading account assets | $ | — | $ | — | $ | — | $ | — | $ | 1,757 | $ | 869 | $ | 22 | $ | 33 | $ | — | $ | — | $ | — | $ | — | $ | 1,368 | $ | 1,419 | $ | — | $ | 26 | ||||||||||||||||||||||
| Debt securities carried at fair value | 29 | 36 | — | — | 1,380 | 1,661 | — | — | 23 | 27 | — | — | 1,204 | 1,337 | — | — | ||||||||||||||||||||||||||||||||||||||
| Held-to-maturity securities | — | — | — | — | 5,048 | 5,644 | — | — | — | — | — | — | 4,407 | 4,891 | — | — | ||||||||||||||||||||||||||||||||||||||
All other assets (4) | — | — | — | — | — | 30 | — | — | ||||||||||||||||||||||||||||||||||||||||||||||
| Total retained positions | $ | 29 | $ | 36 | $ | — | $ | — | $ | 8,185 | $ | 8,204 | $ | 22 | $ | 33 | $ | 23 | $ | 27 | $ | — | $ | — | $ | 6,979 | $ | 7,647 | $ | — | $ | 26 | ||||||||||||||||||||||
Total assets of VIEs (5) | $ | 1,944 | $ | 2,432 | $ | — | $ | — | $ | 18,469 | $ | 19,281 | $ | 2,560 | $ | 2,287 | $ | 1,102 | $ | 1,813 | $ | — | $ | — | $ | 17,713 | $ | 16,949 | $ | 4,120 | $ | 2,829 | ||||||||||||||||||||||
| Consolidated VIEs | ||||||||||||||||||||||||||||||||||||||||||||||||||||||
| Maximum loss exposure | $ | 91 | $ | 112 | $ | 18,600 | $ | 24,337 | $ | 109 | $ | 628 | $ | 1,726 | $ | 1,453 | $ | 68 | $ | 85 | $ | 17,983 | $ | 18,800 | $ | 122 | $ | 128 | $ | 2,780 | $ | 1,540 | ||||||||||||||||||||||
| On-balance sheet assets | ||||||||||||||||||||||||||||||||||||||||||||||||||||||
| Trading account assets | $ | — | $ | — | $ | — | $ | — | $ | 376 | $ | 1,557 | $ | 1,740 | $ | 1,452 | $ | — | $ | — | $ | — | $ | — | $ | 141 | $ | 366 | $ | 2,603 | $ | 1,553 | ||||||||||||||||||||||
| Loans and leases | 143 | 177 | 29,726 | 32,554 | — | — | — | — | 130 | 133 | 27,024 | 29,906 | — | — | — | — | ||||||||||||||||||||||||||||||||||||||
| Allowance for loan and lease losses | (6 | ) | (9 | ) | (907 | ) | (988 | ) | — | — | — | — | (1 | ) | (5 | ) | (829 | ) | (901 | ) | — | — | — | — | ||||||||||||||||||||||||||||||
| All other assets | 4 | 6 | 128 | 1,385 | — | — | 1 | 1 | 4 | 4 | 114 | 136 | — | — | 177 | 1 | ||||||||||||||||||||||||||||||||||||||
| Total assets | $ | 141 | $ | 174 | $ | 28,947 | $ | 32,951 | $ | 376 | $ | 1,557 | $ | 1,741 | $ | 1,453 | $ | 133 | $ | 132 | $ | 26,309 | $ | 29,141 | $ | 141 | $ | 366 | $ | 2,780 | $ | 1,554 | ||||||||||||||||||||||
| On-balance sheet liabilities | ||||||||||||||||||||||||||||||||||||||||||||||||||||||
| Short-term borrowings | $ | — | $ | — | $ | — | $ | — | $ | — | $ | — | $ | 905 | $ | 312 | $ | — | $ | — | $ | — | $ | — | $ | — | $ | — | $ | 2,274 | $ | 742 | ||||||||||||||||||||||
| Long-term debt | 59 | 76 | 10,320 | 8,598 | 267 | 929 | 12 | — | 70 | 55 | 8,305 | 10,321 | 19 | 238 | — | 12 | ||||||||||||||||||||||||||||||||||||||
| All other liabilities | — | — | 27 | 16 | — | — | — | — | — | — | 21 | 20 | — | — | — | — | ||||||||||||||||||||||||||||||||||||||
| Total liabilities | $ | 59 | $ | 76 | $ | 10,347 | $ | 8,614 | $ | 267 | $ | 929 | $ | 917 | $ | 312 | $ | 70 | $ | 55 | $ | 8,326 | $ | 10,341 | $ | 19 | $ | 238 | $ | 2,274 | $ | 754 | ||||||||||||||||||||||
(1) | For unconsolidated home equity loan VIEs, the maximum loss exposure includes outstanding trust certificates issued by trusts in rapid amortization, net of recorded reserves. For both consolidated and unconsolidated home equity loan VIEs, the maximum loss exposure excludes the reserve for representations and warranties obligations and corporate guarantees. For |
(2) | At September 30, |
(3) | At September 30, |
(4) |
(5) | Total assets of VIEs includes loans the Corporation transferred with which it has continuing involvement, which may include servicing the loan. |
73Bank of America | ||
| Other VIEs | |||||||||||||||||||||||
| Consolidated | Unconsolidated | Total | Consolidated | Unconsolidated | Total | ||||||||||||||||||
| (Dollars in millions) | September 30, 2019 | December 31, 2018 | |||||||||||||||||||||
| Maximum loss exposure | $ | 4,009 | $ | 25,706 | $ | 29,715 | $ | 4,177 | $ | 24,498 | $ | 28,675 | |||||||||||
| On-balance sheet assets | |||||||||||||||||||||||
| Trading account assets | $ | 2,170 | $ | 715 | $ | 2,885 | $ | 2,335 | $ | 860 | $ | 3,195 | |||||||||||
| Debt securities carried at fair value | — | 76 | 76 | — | 84 | 84 | |||||||||||||||||
| Loans and leases | 1,804 | 3,416 | 5,220 | 1,949 | 3,940 | 5,889 | |||||||||||||||||
| Allowance for loan and lease losses | (2 | ) | (34 | ) | (36 | ) | (2 | ) | (30 | ) | (32 | ) | |||||||||||
| All other assets | 82 | 18,944 | 19,026 | 53 | 18,885 | 18,938 | |||||||||||||||||
| Total | $ | 4,054 | $ | 23,117 | $ | 27,171 | $ | 4,335 | $ | 23,739 | $ | 28,074 | |||||||||||
| On-balance sheet liabilities | |||||||||||||||||||||||
| Long-term debt | $ | 44 | $ | — | $ | 44 | $ | 152 | $ | — | $ | 152 | |||||||||||
| All other liabilities | 2 | 4,652 | 4,654 | 7 | 4,231 | 4,238 | |||||||||||||||||
| Total | $ | 46 | $ | 4,652 | $ | 4,698 | $ | 159 | $ | 4,231 | $ | 4,390 | |||||||||||
| Total assets of VIEs | $ | 4,054 | $ | 96,045 | $ | 100,099 | $ | 4,335 | $ | 94,746 | $ | 99,081 | |||||||||||
| Other VIEs | |||||||||||||||||||||||
| Consolidated | Unconsolidated | Total | Consolidated | Unconsolidated | Total | ||||||||||||||||||
| (Dollars in millions) | September 30, 2018 | December 31, 2017 | |||||||||||||||||||||
| Maximum loss exposure | $ | 4,407 | $ | 21,188 | $ | 25,595 | $ | 4,660 | $ | 19,785 | $ | 24,445 | |||||||||||
| On-balance sheet assets | |||||||||||||||||||||||
| Trading account assets | $ | 2,592 | $ | 331 | $ | 2,923 | $ | 2,709 | $ | 346 | $ | 3,055 | |||||||||||
| Debt securities carried at fair value | — | 20 | 20 | — | 160 | 160 | |||||||||||||||||
| Loans and leases | 1,977 | 4,155 | 6,132 | 2,152 | 3,596 | 5,748 | |||||||||||||||||
| Allowance for loan and lease losses | (2 | ) | (29 | ) | (31 | ) | (3 | ) | (32 | ) | (35 | ) | |||||||||||
| All other assets | 62 | 15,300 | 15,362 | 89 | 15,216 | 15,305 | |||||||||||||||||
| Total | $ | 4,629 | $ | 19,777 | $ | 24,406 | $ | 4,947 | $ | 19,286 | $ | 24,233 | |||||||||||
| On-balance sheet liabilities | |||||||||||||||||||||||
| Long-term debt | $ | 213 | $ | — | $ | 213 | $ | 270 | $ | — | $ | 270 | |||||||||||
| All other liabilities | 10 | 4,067 | 4,077 | 18 | 3,417 | 3,435 | |||||||||||||||||
| Total | $ | 223 | $ | 4,067 | $ | 4,290 | $ | 288 | $ | 3,417 | $ | 3,705 | |||||||||||
| Total assets of VIEs | $ | 4,629 | $ | 79,564 | $ | 84,193 | $ | 4,947 | $ | 69,746 | $ | 74,693 | |||||||||||
Bank of America | ||
| Goodwill | |||||||
| (Dollars in millions) | September 30 2019 | December 31 2018 | |||||
| Consumer Banking | $ | 30,123 | $ | 30,123 | |||
| Global Wealth & Investment Management | 9,677 | 9,677 | |||||
| Global Banking | 23,923 | 23,923 | |||||
| Global Markets | 5,182 | 5,182 | |||||
| All Other | 46 | 46 | |||||
| Total goodwill | $ | 68,951 | $ | 68,951 | |||
| Goodwill | |||||||
| (Dollars in millions) | September 30 2018 | December 31 2017 | |||||
| Consumer Banking | $ | 30,123 | $ | 30,123 | |||
| Global Wealth & Investment Management | 9,677 | 9,677 | |||||
| Global Banking | 23,923 | 23,923 | |||||
| Global Markets | 5,182 | 5,182 | |||||
| All Other | 46 | 46 | |||||
| Total goodwill | $ | 68,951 | $ | 68,951 | |||
Intangible Assets (1, 2) | |||||||||||||||||||||||
| Gross Carrying Value | Accumulated Amortization | Net Carrying Value | Gross Carrying Value | Accumulated Amortization | Net Carrying Value | ||||||||||||||||||
| (Dollars in millions) | September 30, 2018 | December 31, 2017 | |||||||||||||||||||||
| Purchased credit card and affinity relationships | $ | 5,919 | $ | 5,721 | $ | 198 | $ | 5,919 | $ | 5,604 | $ | 315 | |||||||||||
Core deposit and other intangibles (3) | 3,835 | 2,201 | 1,634 | 3,835 | 2,140 | 1,695 | |||||||||||||||||
| Customer relationships | 3,886 | 3,810 | 76 | 3,886 | 3,584 | 302 | |||||||||||||||||
| Total intangible assets | $ | 13,640 | $ | 11,732 | $ | 1,908 | $ | 13,640 | $ | 11,328 | $ | 2,312 | |||||||||||
| Lease Cost and Supplemental Information | |||||||
| (Dollars in millions) | Three Months Ended September 30, 2019 | Nine Months Ended September 30, 2019 | |||||
| Operating lease cost | $ | 522 | $ | 1,561 | |||
Variable lease cost (1) | 124 | 364 | |||||
Total lease cost (2) | $ | 646 | $ | 1,925 | |||
Right-of-use assets obtained in exchange for new operating lease liabilities (3) | $ | 108 | $ | 756 | |||
Operating cash flows from operating leases (4) | 507 | 1,507 | |||||
(1) | Primarily consists of payments for common area maintenance and property taxes. |
(2) | Amounts are recorded in occupancy and equipment expense in the Consolidated Statement of Income. |
(3) | Represents non-cash activity and, accordingly, is not reflected in the Consolidated Statement of Cash Flows. |
(4) | Represents cash paid for amounts included in the measurement of lease liabilities. |
| Maturities of Lessor and Lessee Arrangements | |||||||||||
| Lessor | Lessee (1) | ||||||||||
Operating Leases | Sales-type and Direct Financing Leases (2) | Operating Leases | |||||||||
| (Dollars in millions) | September 30, 2019 | ||||||||||
| Remainder of 2019 | $ | 204 | $ | 1,540 | $ | 503 | |||||
| 2020 | 775 | 5,810 | 1,944 | ||||||||
| 2021 | 672 | 4,858 | 1,722 | ||||||||
| 2022 | 578 | 3,674 | 1,464 | ||||||||
| 2023 | 466 | 1,654 | 1,202 | ||||||||
| Thereafter | 1,369 | 3,432 | 5,036 | ||||||||
Total undiscounted cash flows | $ | 4,064 | $ | 20,968 | $ | 11,871 | |||||
Less: Net present value adjustment | 1,510 | 1,741 | |||||||||
Total (3) | $ | 19,458 | $ | 10,130 | |||||||
(1) | Excludes $1.7 billion in commitments under lessee arrangements that have not yet commenced with lease terms that will begin later in 2019. |
(2) | Includes $15.5 billion in commercial lease financing receivables and $4.0 billion in direct/indirect consumer lease financing receivables. |
(3) | Represents lease receivables for lessor arrangements and lease liabilities for lessee arrangements. |
| Amount | Rate | Amount | Rate | Amount | Rate | Amount | Rate | Amount | Rate | Amount | Rate | Amount | Rate | Amount | Rate | |||||||||||||||||||||||||||||||||||||||
| Three Months Ended September 30 | Nine Months Ended September 30 | Three Months Ended September 30 | Nine Months Ended September 30 | |||||||||||||||||||||||||||||||||||||||||||||||||||
| (Dollars in millions) | 2018 | 2017 | 2018 | 2017 | 2019 | 2018 | 2019 | 2018 | ||||||||||||||||||||||||||||||||||||||||||||||
| Federal funds sold and securities borrowed or purchased under agreements to resell | ||||||||||||||||||||||||||||||||||||||||||||||||||||||
| Average during period | $ | 241,426 | 1.31 | % | $ | 223,585 | 0.86 | % | $ | 247,183 | 1.15 | % | $ | 222,255 | 0.77 | % | $ | 269,129 | 1.83 | % | $ | 241,426 | 1.31 | % | $ | 274,822 | 1.82 | % | $ | 247,183 | 1.15 | % | ||||||||||||||||||||||
| Maximum month-end balance during period | 267,989 | n/a | 224,815 | n/a | 267,989 | n/a | 237,064 | n/a | 278,514 | n/a | 267,989 | n/a | 280,562 | n/a | 267,989 | n/a | ||||||||||||||||||||||||||||||||||||||
| Federal funds purchased and securities loaned or sold under agreements to repurchase | ||||||||||||||||||||||||||||||||||||||||||||||||||||||
| Average during period | $ | 191,693 | 1.88 | % | $ | 197,794 | 1.37 | % | $ | 193,854 | 1.71 | % | $ | 199,433 | 1.18 | % | $ | 203,702 | 2.35 | % | $ | 191,693 | 1.88 | % | $ | 202,632 | 2.43 | % | $ | 193,854 | 1.71 | % | ||||||||||||||||||||||
| Maximum month-end balance during period | 189,206 | n/a | 197,604 | n/a | 199,419 | n/a | 218,017 | n/a | 202,208 | n/a | 189,206 | n/a | 203,063 | n/a | 199,419 | n/a | ||||||||||||||||||||||||||||||||||||||
| Short-term borrowings | ||||||||||||||||||||||||||||||||||||||||||||||||||||||
| Average during period | 33,410 | 2.89 | 32,153 | 2.54 | 40,048 | 2.49 | 38,329 | 2.43 | 26,579 | 2.29 | 33,410 | 2.89 | 21,728 | 2.62 | 40,048 | 2.49 | ||||||||||||||||||||||||||||||||||||||
| Maximum month-end balance during period | 36,043 | n/a | 32,679 | n/a | 52,480 | n/a | 46,202 | n/a | 30,682 | n/a | 36,043 | n/a | 30,682 | n/a | 52,480 | n/a | ||||||||||||||||||||||||||||||||||||||
| Securities Financing Agreements | |||||||||||||||||||
Gross Assets/Liabilities (1) | Amounts Offset | Net Balance Sheet Amount | Financial Instruments (2) | Net Assets/Liabilities | |||||||||||||||
| (Dollars in millions) | September 30, 2019 | ||||||||||||||||||
Securities borrowed or purchased under agreements to resell (3) | $ | 436,856 | $ | (165,261 | ) | $ | 271,595 | $ | (246,906 | ) | $ | 24,689 | |||||||
| Securities loaned or sold under agreements to repurchase | $ | 367,328 | $ | (165,261 | ) | $ | 202,067 | $ | (180,143 | ) | $ | 21,924 | |||||||
Other (4) | 23,399 | — | 23,399 | (23,399 | ) | — | |||||||||||||
| Total | $ | 390,727 | $ | (165,261 | ) | $ | 225,466 | $ | (203,542 | ) | $ | 21,924 | |||||||
| December 31, 2018 | |||||||||||||||||||
Securities borrowed or purchased under agreements to resell (3) | $ | 366,274 | $ | (106,865 | ) | $ | 259,409 | $ | (240,790 | ) | $ | 18,619 | |||||||
| Securities loaned or sold under agreements to repurchase | $ | 293,853 | $ | (106,865 | ) | $ | 186,988 | $ | (176,740 | ) | $ | 10,248 | |||||||
Other (4) | 19,906 | — | 19,906 | (19,906 | ) | — | |||||||||||||
| Total | $ | 313,759 | $ | (106,865 | ) | $ | 206,894 | $ | (196,646 | ) | $ | 10,248 | |||||||
| Securities Financing Agreements | |||||||||||||||||||
Gross Assets/Liabilities (1) | Amounts Offset | Net Balance Sheet Amount | Financial Instruments (2) | Net Assets/Liabilities | |||||||||||||||
| (Dollars in millions) | September 30, 2018 | ||||||||||||||||||
Securities borrowed or purchased under agreements to resell (3) | $ | 373,800 | $ | (125,563 | ) | $ | 248,237 | $ | (218,291 | ) | $ | 29,946 | |||||||
| Securities loaned or sold under agreements to repurchase | $ | 297,163 | $ | (125,563 | ) | $ | 171,600 | $ | (151,842 | ) | $ | 19,758 | |||||||
Other (4) | 24,446 | — | 24,446 | (24,446 | ) | — | |||||||||||||
| Total | $ | 321,609 | $ | (125,563 | ) | $ | 196,046 | $ | (176,288 | ) | $ | 19,758 | |||||||
| December 31, 2017 | |||||||||||||||||||
Securities borrowed or purchased under agreements to resell (3) | $ | 348,472 | $ | (135,725 | ) | $ | 212,747 | $ | (165,720 | ) | $ | 47,027 | |||||||
| Securities loaned or sold under agreements to repurchase | $ | 312,582 | $ | (135,725 | ) | $ | 176,857 | $ | (146,205 | ) | $ | 30,652 | |||||||
Other (4) | 22,711 | — | 22,711 | (22,711 | ) | — | |||||||||||||
| Total | $ | 335,293 | $ | (135,725 | ) | $ | 199,568 | $ | (168,916 | ) | $ | 30,652 | |||||||
(1) | Includes activity where uncertainty exists as to the enforceability of certain master netting agreements under bankruptcy laws in some countries or industries. |
(2) | Includes securities collateral received or pledged under repurchase or securities lending agreements where there is a legally enforceable master netting agreement. These amounts are not offset on the Consolidated Balance Sheet, but are shown as a reduction to derive a net asset or liability. Securities collateral received or pledged where the legal enforceability of the master netting agreements is uncertain is excluded from the table. |
(3) | Excludes repurchase activity of $ |
(4) | Balance is reported in accrued expenses and other liabilities on the Consolidated Balance Sheet and relates to transactions where the Corporation acts as the lender in a securities lending agreement and receives securities that can be pledged as collateral or sold. In these transactions, the Corporation recognizes an asset at fair value, representing the securities received, and a liability, representing the obligation to return those securities. |
Bank of America 76 | ||
| Remaining Contractual Maturity | ||||||||||||||||||||||||||||||||||||||
| September 30, 2018 | Overnight and Continuous | 30 Days or Less | After 30 Days Through 90 Days | Greater than 90 Days (1) | Total | |||||||||||||||||||||||||||||||||
| (Dollars in millions) | Overnight and Continuous | 30 Days or Less | After 30 Days Through 90 Days | Greater than 90 Days (1) | Total | September 30, 2019 | ||||||||||||||||||||||||||||||||
| Securities sold under agreements to repurchase | $ | 128,222 | $ | 68,852 | $ | 22,920 | $ | 58,089 | $ | 278,083 | $ | 193,237 | $ | 80,022 | $ | 31,557 | $ | 45,706 | $ | 350,522 | ||||||||||||||||||
| Securities loaned | 13,364 | 738 | 896 | 4,082 | 19,080 | 11,925 | 1,212 | 364 | 3,305 | 16,806 | ||||||||||||||||||||||||||||
| Other | 24,446 | — | — | — | 24,446 | 23,399 | — | — | — | 23,399 | ||||||||||||||||||||||||||||
| Total | $ | 166,032 | $ | 69,590 | $ | 23,816 | $ | 62,171 | $ | 321,609 | $ | 228,561 | $ | 81,234 | $ | 31,921 | $ | 49,011 | $ | 390,727 | ||||||||||||||||||
| December 31, 2017 | December 31, 2018 | |||||||||||||||||||||||||||||||||||||
| Securities sold under agreements to repurchase | $ | 125,956 | $ | 79,913 | $ | 46,091 | $ | 38,935 | $ | 290,895 | $ | 139,017 | $ | 81,917 | $ | 34,204 | $ | 21,476 | $ | 276,614 | ||||||||||||||||||
| Securities loaned | 9,853 | 5,658 | 2,043 | 4,133 | 21,687 | 7,753 | 4,197 | 1,783 | 3,506 | 17,239 | ||||||||||||||||||||||||||||
| Other | 22,711 | — | — | — | 22,711 | 19,906 | — | — | — | 19,906 | ||||||||||||||||||||||||||||
| Total | $ | 158,520 | $ | 85,571 | $ | 48,134 | $ | 43,068 | $ | 335,293 | $ | 166,676 | $ | 86,114 | $ | 35,987 | $ | 24,982 | $ | 313,759 | ||||||||||||||||||
(1) | No agreements have maturities greater than three years. |
| Class of Collateral Pledged | |||||||||||||||
| Securities Sold Under Agreements to Repurchase | Securities Loaned | Other | Total | ||||||||||||
| (Dollars in millions) | September 30, 2019 | ||||||||||||||
| U.S. government and agency securities | $ | 207,348 | $ | 31 | $ | — | $ | 207,379 | |||||||
| Corporate securities, trading loans and other | 11,976 | 3,485 | 232 | 15,693 | |||||||||||
| Equity securities | 15,542 | 10,313 | 23,116 | 48,971 | |||||||||||
| Non-U.S. sovereign debt | 111,371 | 2,977 | 51 | 114,399 | |||||||||||
| Mortgage trading loans and ABS | 4,285 | — | — | 4,285 | |||||||||||
| Total | $ | 350,522 | $ | 16,806 | $ | 23,399 | $ | 390,727 | |||||||
| December 31, 2018 | |||||||||||||||
| U.S. government and agency securities | $ | 164,664 | $ | — | $ | — | $ | 164,664 | |||||||
| Corporate securities, trading loans and other | 11,400 | 2,163 | 287 | 13,850 | |||||||||||
| Equity securities | 14,090 | 10,869 | 19,572 | 44,531 | |||||||||||
| Non-U.S. sovereign debt | 81,329 | 4,207 | 47 | 85,583 | |||||||||||
| Mortgage trading loans and ABS | 5,131 | — | — | 5,131 | |||||||||||
| Total | $ | 276,614 | $ | 17,239 | $ | 19,906 | $ | 313,759 | |||||||
| Class of Collateral Pledged | |||||||||||||||
| September 30, 2018 | |||||||||||||||
| (Dollars in millions) | Securities Sold Under Agreements to Repurchase | Securities Loaned | Other | Total | |||||||||||
| U.S. government and agency securities | $ | 158,567 | $ | 10 | $ | 2 | $ | 158,579 | |||||||
| Corporate securities, trading loans and other | 13,448 | 2,656 | 363 | 16,467 | |||||||||||
| Equity securities | 17,268 | 10,953 | 24,028 | 52,249 | |||||||||||
| Non-U.S. sovereign debt | 84,435 | 5,461 | 53 | 89,949 | |||||||||||
| Mortgage trading loans and ABS | 4,365 | — | — | 4,365 | |||||||||||
| Total | $ | 278,083 | $ | 19,080 | $ | 24,446 | $ | 321,609 | |||||||
| December 31, 2017 | |||||||||||||||
| U.S. government and agency securities | $ | 158,299 | $ | — | $ | 409 | $ | 158,708 | |||||||
| Corporate securities, trading loans and other | 12,787 | 2,669 | 624 | 16,080 | |||||||||||
| Equity securities | 23,975 | 13,523 | 21,628 | 59,126 | |||||||||||
| Non-U.S. sovereign debt | 90,857 | 5,495 | 50 | 96,402 | |||||||||||
| Mortgage trading loans and ABS | 4,977 | — | — | 4,977 | |||||||||||
| Total | $ | 290,895 | $ | 21,687 | $ | 22,711 | $ | 335,293 | |||||||
77Bank of America | ||
| Credit Extension Commitments | ||||||||||||||||||||||||||||||||||||||
| Expire in One Year or Less | Expire After One Year Through Three Years | Expire After Three Years Through Five Years | Expire After Five Years | Total | Expire in One Year or Less | Expire After One Year Through Three Years | Expire After Three Years Through Five Years | Expire After Five Years | Total | |||||||||||||||||||||||||||||
| (Dollars in millions) | September 30, 2018 | September 30, 2019 | ||||||||||||||||||||||||||||||||||||
| Notional amount of credit extension commitments | ||||||||||||||||||||||||||||||||||||||
| Loan commitments | $ | 86,501 | $ | 142,327 | $ | 154,991 | $ | 22,724 | $ | 406,543 | ||||||||||||||||||||||||||||
Loan commitments (1) | $ | 90,401 | $ | 150,634 | $ | 166,467 | $ | 20,344 | $ | 427,846 | ||||||||||||||||||||||||||||
| Home equity lines of credit | 3,203 | 2,494 | 3,115 | 34,411 | 43,223 | 1,379 | 1,854 | 5,459 | 34,601 | 43,293 | ||||||||||||||||||||||||||||
Standby letters of credit and financial guarantees (1) | 20,653 | 9,838 | 2,555 | 1,151 | 34,197 | |||||||||||||||||||||||||||||||||
| Letters of credit | 1,262 | 223 | 74 | 73 | 1,632 | |||||||||||||||||||||||||||||||||
Standby letters of credit and financial guarantees (2) | 20,206 | 10,530 | 3,365 | 1,179 | 35,280 | |||||||||||||||||||||||||||||||||
Letters of credit (3) | 1,060 | 246 | 60 | 45 | 1,411 | |||||||||||||||||||||||||||||||||
| Legally binding commitments | 111,619 | 154,882 | 160,735 | 58,359 | 485,595 | 113,046 | 163,264 | 175,351 | 56,169 | 507,830 | ||||||||||||||||||||||||||||
Credit card lines (2) | 373,295 | — | — | — | 373,295 | |||||||||||||||||||||||||||||||||
Credit card lines (4) | 377,392 | — | — | — | 377,392 | |||||||||||||||||||||||||||||||||
| Total credit extension commitments | $ | 484,914 | $ | 154,882 | $ | 160,735 | $ | 58,359 | $ | 858,890 | $ | 490,438 | $ | 163,264 | $ | 175,351 | $ | 56,169 | $ | 885,222 | ||||||||||||||||||
| December 31, 2017 | December 31, 2018 | |||||||||||||||||||||||||||||||||||||
| Notional amount of credit extension commitments | ||||||||||||||||||||||||||||||||||||||
| Loan commitments | $ | 85,804 | $ | 140,942 | $ | 147,043 | $ | 21,342 | $ | 395,131 | ||||||||||||||||||||||||||||
Loan commitments (1) | $ | 84,910 | $ | 142,271 | $ | 155,298 | $ | 22,683 | $ | 405,162 | ||||||||||||||||||||||||||||
| Home equity lines of credit | 6,172 | 4,457 | 2,288 | 31,250 | 44,167 | 2,578 | 2,249 | 3,530 | 34,702 | 43,059 | ||||||||||||||||||||||||||||
Standby letters of credit and financial guarantees (1) | 19,976 | 11,261 | 3,420 | 1,144 | 35,801 | |||||||||||||||||||||||||||||||||
| Letters of credit | 1,291 | 117 | 129 | 87 | 1,624 | |||||||||||||||||||||||||||||||||
Standby letters of credit and financial guarantees (2) | 22,571 | 9,702 | 2,457 | 1,074 | 35,804 | |||||||||||||||||||||||||||||||||
Letters of credit (3) | 1,168 | 84 | 69 | 57 | 1,378 | |||||||||||||||||||||||||||||||||
| Legally binding commitments | 113,243 | 156,777 | 152,880 | 53,823 | 476,723 | 111,227 | 154,306 | 161,354 | 58,516 | 485,403 | ||||||||||||||||||||||||||||
Credit card lines (2) | 362,030 | — | — | — | 362,030 | |||||||||||||||||||||||||||||||||
Credit card lines (4) | 371,658 | — | — | — | 371,658 | |||||||||||||||||||||||||||||||||
| Total credit extension commitments | $ | 475,273 | $ | 156,777 | $ | 152,880 | $ | 53,823 | $ | 838,753 | $ | 482,885 | $ | 154,306 | $ | 161,354 | $ | 58,516 | $ | 857,061 | ||||||||||||||||||
(1) | At September 30, 2019 andDecember 31, 2018, $5.3 billion and $4.3 billion of these loan commitments are held in the form of a security. |
(2) | The notional amounts of SBLCs and financial guarantees classified as investment grade and non-investment grade based on the credit quality of the underlying reference name within the instrument were |
(3) | At September 30, 2019 and December 31, 2018, included are letters of credit of $1.1 billion and $422 million related to certain liquidity commitments of VIEs. For additional information, see Note 7 – Securitizations and Other Variable Interest Entities. |
| Includes business card unused lines of credit. |
Bank of America 78 | ||
79Bank of America | ||
Declared Quarterly Cash Dividends on Common Stock (1) | ||||||||
| Declaration Date | Record Date | Payment Date | Dividend Per Share | |||||
| October 22, 2019 | December 6, 2019 | December 27, 2019 | $ | 0.18 | ||||
| July 25, 2019 | September 6, 2019 | September 27, 2019 | 0.18 | |||||
| April 24, 2019 | June 7, 2019 | June 28, 2019 | 0.15 | |||||
| January 30, 2019 | March 1, 2019 | March 29, 2019 | 0.15 | |||||
Declared Quarterly Cash Dividends on Common Stock (1) | ||||||||
| Declaration Date | Record Date | Payment Date | Dividend Per Share | |||||
| October 24, 2018 | December 7, 2018 | December 28, 2018 | $ | 0.15 | ||||
| July 26, 2018 | September 7, 2018 | September 28, 2018 | 0.15 | |||||
| April 25, 2018 | June 1, 2018 | June 29, 2018 | 0.12 | |||||
| January 31, 2018 | March 2, 2018 | March 30, 2018 | 0.12 | |||||
(1) | In |
| (Dollars in millions) | Debt and Equity Securities | Debit Valuation Adjustments | Derivatives | Employee Benefit Plans | Foreign Currency | Total | |||||||||||||||||
| Balance, December 31, 2016 | $ | (1,267 | ) | $ | (767 | ) | $ | (895 | ) | $ | (3,480 | ) | $ | (879 | ) | $ | (7,288 | ) | |||||
| Net change | 931 | (149 | ) | 156 | 80 | 102 | 1,120 | ||||||||||||||||
| Balance, September 30, 2017 | $ | (336 | ) | $ | (916 | ) | $ | (739 | ) | $ | (3,400 | ) | $ | (777 | ) | $ | (6,168 | ) | |||||
| Balance, December 31, 2017 | $ | (1,206 | ) | $ | (1,060 | ) | $ | (831 | ) | $ | (3,192 | ) | $ | (793 | ) | $ | (7,082 | ) | |||||
Accounting change related to certain tax effects (1) | (393 | ) | (220 | ) | (189 | ) | (707 | ) | 239 | (1,270 | ) | ||||||||||||
Cumulative adjustment for hedge accounting change (2) | — | — | 57 | — | — | 57 | |||||||||||||||||
| Net change | (6,166 | ) | 183 | (346 | ) | 91 | (303 | ) | (6,541 | ) | |||||||||||||
| Balance, September 30, 2018 | $ | (7,765 | ) | $ | (1,097 | ) | $ | (1,309 | ) | $ | (3,808 | ) | $ | (857 | ) | $ | (14,836 | ) | |||||
| Changes in OCI Components Pre- and After-tax | |||||||||||||||||||||||
| Pretax | Tax effect | After- tax | Pretax | Tax effect | After- tax | ||||||||||||||||||
| Nine Months Ended September 30 | |||||||||||||||||||||||
| (Dollars in millions) | 2018 | 2017 | |||||||||||||||||||||
| Debt and equity securities: | |||||||||||||||||||||||
| Net increase (decrease) in fair value | $ | (8,198 | ) | $ | 2,075 | $ | (6,123 | ) | $ | 1,802 | $ | (674 | ) | $ | 1,128 | ||||||||
Net realized (gains) reclassified into earnings (3) | (55 | ) | 12 | (43 | ) | (312 | ) | 115 | (197 | ) | |||||||||||||
| Net change | (8,253 | ) | 2,087 | (6,166 | ) | 1,490 | (559 | ) | 931 | ||||||||||||||
| Debit valuation adjustments: | |||||||||||||||||||||||
| Net increase (decrease) in fair value | 220 | (52 | ) | 168 | (255 | ) | 96 | (159 | ) | ||||||||||||||
Net realized losses reclassified into earnings (3) | 20 | (5 | ) | 15 | 30 | (20 | ) | 10 | |||||||||||||||
| Net change | 240 | (57 | ) | 183 | (225 | ) | 76 | (149 | ) | ||||||||||||||
| Derivatives: | |||||||||||||||||||||||
| Net increase (decrease) in fair value | (601 | ) | 174 | (427 | ) | 79 | (30 | ) | 49 | ||||||||||||||
| Reclassifications into earnings: | |||||||||||||||||||||||
| Net interest income | 134 | (33 | ) | 101 | 274 | (103 | ) | 171 | |||||||||||||||
| Personnel expense | (27 | ) | 7 | (20 | ) | (103 | ) | 39 | (64 | ) | |||||||||||||
| Net realized losses reclassified into earnings | 107 | (26 | ) | 81 | 171 | (64 | ) | 107 | |||||||||||||||
| Net change | (494 | ) | 148 | (346 | ) | 250 | (94 | ) | 156 | ||||||||||||||
| Employee benefit plans: | |||||||||||||||||||||||
| Reclassifications into earnings: | |||||||||||||||||||||||
| Net actuarial losses and other | 119 | (28 | ) | 91 | 128 | (48 | ) | 80 | |||||||||||||||
Net realized losses reclassified into earnings (4) | 119 | (28 | ) | 91 | 128 | (48 | ) | 80 | |||||||||||||||
| Net change | 119 | (28 | ) | 91 | 128 | (48 | ) | 80 | |||||||||||||||
| Foreign currency: | |||||||||||||||||||||||
| Net increase (decrease) in fair value | (87 | ) | (165 | ) | (252 | ) | (454 | ) | 462 | 8 | |||||||||||||
Net realized (gains) losses reclassified into earnings (3) | (143 | ) | 92 | (51 | ) | (608 | ) | 702 | 94 | ||||||||||||||
| Net change | (230 | ) | (73 | ) | (303 | ) | (1,062 | ) | 1,164 | 102 | |||||||||||||
| Total other comprehensive income (loss) | $ | (8,618 | ) | $ | 2,077 | $ | (6,541 | ) | $ | 581 | $ | 539 | $ | 1,120 | |||||||||
| Three Months Ended September 30 | Nine Months Ended September 30 | Three Months Ended September 30 | Nine Months Ended September 30 | |||||||||||||||||||||||||||
| (In millions, except per share information) | 2018 | 2017 | 2018 | 2017 | 2019 | 2018 | 2019 | 2018 | ||||||||||||||||||||||
| Earnings per common share | ||||||||||||||||||||||||||||||
| Net income | $ | 7,167 | $ | 5,424 | $ | 20,869 | $ | 15,867 | $ | 5,777 | $ | 7,167 | $ | 20,436 | $ | 20,869 | ||||||||||||||
| Preferred stock dividends | (466 | ) | (465 | ) | (1,212 | ) | (1,328 | ) | (505 | ) | (466 | ) | (1,186 | ) | (1,212 | ) | ||||||||||||||
| Net income applicable to common shareholders | $ | 6,701 | $ | 4,959 | $ | 19,657 | $ | 14,539 | $ | 5,272 | $ | 6,701 | $ | 19,250 | $ | 19,657 | ||||||||||||||
| Average common shares issued and outstanding | 10,031.6 | 10,197.9 | 10,177.5 | 10,103.4 | 9,303.6 | 10,031.6 | 9,516.2 | 10,177.5 | ||||||||||||||||||||||
| Earnings per common share | $ | 0.67 | $ | 0.49 | $ | 1.93 | $ | 1.44 | $ | 0.57 | $ | 0.67 | $ | 2.02 | $ | 1.93 | ||||||||||||||
| Diluted earnings per common share | ||||||||||||||||||||||||||||||
| Net income applicable to common shareholders | $ | 6,701 | $ | 4,959 | $ | 19,657 | $ | 14,539 | $ | 5,272 | $ | 6,701 | $ | 19,250 | $ | 19,657 | ||||||||||||||
Add preferred stock dividends due to assumed conversions (1) | — | 37 | — | 187 | ||||||||||||||||||||||||||
| Net income allocated to common shareholders | $ | 6,701 | $ | 4,996 | $ | 19,657 | $ | 14,726 | ||||||||||||||||||||||
| Average common shares issued and outstanding | 10,031.6 | 10,197.9 | 10,177.5 | 10,103.4 | 9,303.6 | 10,031.6 | 9,516.2 | 10,177.5 | ||||||||||||||||||||||
Dilutive potential common shares (2) | 139.2 | 548.8 | 140.4 | 728.7 | ||||||||||||||||||||||||||
Dilutive potential common shares (1) | 49.4 | 139.2 | 49.5 | 140.4 | ||||||||||||||||||||||||||
| Total diluted average common shares issued and outstanding | 10,170.8 | 10,746.7 | 10,317.9 | 10,832.1 | 9,353.0 | 10,170.8 | 9,565.7 | 10,317.9 | ||||||||||||||||||||||
| Diluted earnings per common share | $ | 0.66 | $ | 0.46 | $ | 1.91 | $ | 1.36 | $ | 0.56 | $ | 0.66 | $ | 2.01 | $ | 1.91 | ||||||||||||||
(1) |
| Includes incremental dilutive shares from restricted stock units, restricted stock and warrants. |
Bank of America 80 | ||
| (Dollars in millions) | Debt Securities | Debit Valuation Adjustments | Derivatives | Employee Benefit Plans | Foreign Currency | Total | |||||||||||||||||
| Balance, December 31, 2017 | $ | (1,206 | ) | $ | (1,060 | ) | $ | (831 | ) | $ | (3,192 | ) | $ | (793 | ) | $ | (7,082 | ) | |||||
Accounting change related to certain tax effects (1) | (393 | ) | (220 | ) | (189 | ) | (707 | ) | 239 | (1,270 | ) | ||||||||||||
Cumulative adjustment for hedge accounting change (2) | — | — | 57 | — | — | 57 | |||||||||||||||||
| Net change | (6,166 | ) | 183 | (346 | ) | 91 | (303 | ) | (6,541 | ) | |||||||||||||
| Balance, September 30, 2018 | $ | (7,765 | ) | $ | (1,097 | ) | $ | (1,309 | ) | $ | (3,808 | ) | $ | (857 | ) | $ | (14,836 | ) | |||||
| Balance, December 31, 2018 | $ | (5,552 | ) | $ | (531 | ) | $ | (1,016 | ) | $ | (4,304 | ) | $ | (808 | ) | $ | (12,211 | ) | |||||
| Net change | 6,231 | (272 | ) | 651 | 83 | (99 | ) | 6,594 | |||||||||||||||
| Balance, September 30, 2019 | $ | 679 | $ | (803 | ) | $ | (365 | ) | $ | (4,221 | ) | $ | (907 | ) | $ | (5,617 | ) | ||||||
(1) | Effective January 1, 2018, the Corporation adopted the accounting standard on tax effects in accumulated OCI related to the Tax Act. Accordingly, certain tax effects were reclassified from accumulated OCI to retained earnings. |
(2) | Effective January 1, 2018, the Corporation adopted the hedge accounting standard. |
| Pretax | Tax effect | After- tax | Pretax | Tax effect | After- tax | ||||||||||||||||||
| Nine Months Ended September 30 | |||||||||||||||||||||||
| (Dollars in millions) | 2019 | 2018 | |||||||||||||||||||||
| Debt securities: | |||||||||||||||||||||||
| Net increase (decrease) in fair value | $ | 8,388 | $ | (2,087 | ) | $ | 6,301 | $ | (8,198 | ) | $ | 2,075 | $ | (6,123 | ) | ||||||||
Net realized (gains) losses reclassified into earnings (1) | (93 | ) | 23 | (70 | ) | (55 | ) | 12 | (43 | ) | |||||||||||||
| Net change | 8,295 | (2,064 | ) | 6,231 | (8,253 | ) | 2,087 | (6,166 | ) | ||||||||||||||
| Debit valuation adjustments: | |||||||||||||||||||||||
| Net increase (decrease) in fair value | (368 | ) | 83 | (285 | ) | 220 | (52 | ) | 168 | ||||||||||||||
Net realized (gains) losses reclassified into earnings (1) | 16 | (3 | ) | 13 | 20 | (5 | ) | 15 | |||||||||||||||
| Net change | (352 | ) | 80 | (272 | ) | 240 | (57 | ) | 183 | ||||||||||||||
| Derivatives: | |||||||||||||||||||||||
| Net increase (decrease) in fair value | 765 | (173 | ) | 592 | (601 | ) | 174 | (427 | ) | ||||||||||||||
| Reclassifications into earnings: | |||||||||||||||||||||||
| Net interest income | 78 | (19 | ) | 59 | 134 | (33 | ) | 101 | |||||||||||||||
| Compensation and benefits expense | — | — | — | (27 | ) | 7 | (20 | ) | |||||||||||||||
| Net realized (gains) losses reclassified into earnings | 78 | (19 | ) | 59 | 107 | (26 | ) | 81 | |||||||||||||||
| Net change | 843 | (192 | ) | 651 | (494 | ) | 148 | (346 | ) | ||||||||||||||
| Employee benefit plans: | |||||||||||||||||||||||
Net actuarial losses and other reclassified into earnings (2) | 109 | (26 | ) | 83 | 119 | (28 | ) | 91 | |||||||||||||||
| Net change | 109 | (26 | ) | 83 | 119 | (28 | ) | 91 | |||||||||||||||
| Foreign currency: | |||||||||||||||||||||||
| Net increase (decrease) in fair value | 114 | (185 | ) | (71 | ) | (87 | ) | (165 | ) | (252 | ) | ||||||||||||
Net realized (gains) losses reclassified into earnings (3) | (117 | ) | 89 | (28 | ) | (143 | ) | 92 | (51 | ) | |||||||||||||
| Net change | (3 | ) | (96 | ) | (99 | ) | (230 | ) | (73 | ) | (303 | ) | |||||||||||
| Total other comprehensive income (loss) | $ | 8,892 | $ | (2,298 | ) | $ | 6,594 | $ | (8,618 | ) | $ | 2,077 | $ | (6,541 | ) | ||||||||
(1) | Reclassifications of pretax debt securities and DVA are recorded in other income in the Consolidated Statement of Income. |
(2) | Reclassifications of pretax employee benefit plan costs are recorded in other general operating expense in the Consolidated Statement of Income. |
(3) | Reclassifications of pretax debt securities, DVA and foreign currency (gains) losses are recorded in other income in the Consolidated Statement of Income. |
81Bank of America | ||
| September 30, 2018 | September 30, 2019 | |||||||||||||||||||||||||||||||||||||
| Fair Value Measurements | Fair Value Measurements | |||||||||||||||||||||||||||||||||||||
| (Dollars in millions) | Level 1 | Level 2 | Level 3 | Netting Adjustments (1) | Assets/Liabilities at Fair Value | Level 1 | Level 2 | Level 3 | Netting Adjustments (1) | Assets/Liabilities at Fair Value | ||||||||||||||||||||||||||||
| Assets | ||||||||||||||||||||||||||||||||||||||
| Time deposits placed and other short-term investments | $ | 1,528 | $ | — | $ | — | $ | — | $ | 1,528 | $ | 1,356 | $ | — | $ | — | $ | — | $ | 1,356 | ||||||||||||||||||
| Federal funds sold and securities borrowed or purchased under agreements to resell | — | 52,524 | — | — | 52,524 | — | 50,298 | — | — | 50,298 | ||||||||||||||||||||||||||||
| Trading account assets: | ||||||||||||||||||||||||||||||||||||||
U.S. Treasury and agency securities (2) | 39,677 | 1,251 | — | — | 40,928 | 46,103 | 1,952 | — | — | 48,055 | ||||||||||||||||||||||||||||
| Corporate securities, trading loans and other | — | 27,281 | 1,534 | — | 28,815 | — | 29,625 | 1,591 | — | 31,216 | ||||||||||||||||||||||||||||
| Equity securities | 66,850 | 28,049 | 290 | — | 95,189 | 77,822 | 31,823 | 279 | — | 109,924 | ||||||||||||||||||||||||||||
| Non-U.S. sovereign debt | 5,667 | 19,524 | 469 | — | 25,660 | 11,554 | 27,237 | 465 | — | 39,256 | ||||||||||||||||||||||||||||
| Mortgage trading loans, MBS and ABS: | ||||||||||||||||||||||||||||||||||||||
| U.S. government-sponsored agency guaranteed | — | 18,697 | — | — | 18,697 | — | 25,268 | — | — | 25,268 | ||||||||||||||||||||||||||||
| Mortgage trading loans, ABS and other MBS | — | 8,350 | 1,479 | — | 9,829 | — | 8,402 | 1,563 | — | 9,965 | ||||||||||||||||||||||||||||
Total trading account assets (3) | 112,194 | 103,152 | 3,772 | — | 219,118 | 135,479 | 124,307 | 3,898 | — | 263,684 | ||||||||||||||||||||||||||||
| Derivative assets | 9,961 | 322,940 | 4,380 | (291,664 | ) | 45,617 | 15,501 | 372,583 | 3,370 | (346,331 | ) | 45,123 | ||||||||||||||||||||||||||
| AFS debt securities: | ||||||||||||||||||||||||||||||||||||||
| U.S. Treasury and agency securities | 50,900 | 1,406 | — | — | 52,306 | 55,704 | 1,243 | — | — | 56,947 | ||||||||||||||||||||||||||||
| Mortgage-backed securities: | ||||||||||||||||||||||||||||||||||||||
| Agency | — | 136,112 | — | — | 136,112 | — | 134,949 | — | — | 134,949 | ||||||||||||||||||||||||||||
| Agency-collateralized mortgage obligations | — | 5,678 | — | — | 5,678 | — | 4,962 | — | — | 4,962 | ||||||||||||||||||||||||||||
| Non-agency residential | — | 1,593 | 544 | — | 2,137 | — | 1,435 | 508 | — | 1,943 | ||||||||||||||||||||||||||||
| Commercial | — | 13,510 | — | — | 13,510 | — | 14,677 | — | — | 14,677 | ||||||||||||||||||||||||||||
| Non-U.S. securities | 759 | 6,317 | 3 | — | 7,079 | — | 11,077 | 2 | — | 11,079 | ||||||||||||||||||||||||||||
| Other taxable securities | — | 3,869 | 7 | — | 3,876 | — | 3,880 | 3 | — | 3,883 | ||||||||||||||||||||||||||||
| Tax-exempt securities | — | 18,349 | 1 | — | 18,350 | — | 16,432 | — | — | 16,432 | ||||||||||||||||||||||||||||
| Total AFS debt securities | 51,659 | 186,834 | 555 | — | 239,048 | 55,704 | 188,655 | 513 | — | 244,872 | ||||||||||||||||||||||||||||
| Other debt securities carried at fair value: | ||||||||||||||||||||||||||||||||||||||
| Mortgage-backed securities: | ||||||||||||||||||||||||||||||||||||||
| Non-agency residential | — | 1,400 | 296 | — | 1,696 | |||||||||||||||||||||||||||||||||
| U.S. Treasury and agency securities | 3 | — | — | — | 3 | |||||||||||||||||||||||||||||||||
| Non-agency residential MBS | — | 1,235 | 308 | — | 1,543 | |||||||||||||||||||||||||||||||||
| Commercial | — | 13 | — | — | 13 | |||||||||||||||||||||||||||||||||
| Non-U.S. securities | 9,943 | 945 | — | — | 10,888 | 2,531 | 5,377 | — | — | 7,908 | ||||||||||||||||||||||||||||
| Other taxable securities | — | 3 | — | — | 3 | — | 3 | — | — | 3 | ||||||||||||||||||||||||||||
| Total other debt securities carried at fair value | 9,943 | 2,348 | 296 | — | 12,587 | 2,534 | 6,628 | 308 | — | 9,470 | ||||||||||||||||||||||||||||
| Loans and leases | — | 5,321 | 410 | — | 5,731 | — | 7,273 | 401 | — | 7,674 | ||||||||||||||||||||||||||||
| Loans held-for-sale | — | 2,590 | 526 | — | 3,116 | — | 4,625 | 386 | — | 5,011 | ||||||||||||||||||||||||||||
Other assets (4) | 18,858 | 1,740 | 3,140 | — | 23,738 | 18,471 | 2,081 | 2,400 | — | 22,952 | ||||||||||||||||||||||||||||
| Total assets | $ | 204,143 | $ | 677,449 | $ | 13,079 | $ | (291,664 | ) | $ | 603,007 | |||||||||||||||||||||||||||
Total assets (5) | $ | 229,045 | $ | 756,450 | $ | 11,276 | $ | (346,331 | ) | $ | 650,440 | |||||||||||||||||||||||||||
| Liabilities | ||||||||||||||||||||||||||||||||||||||
| Interest-bearing deposits in U.S. offices | $ | — | $ | 529 | $ | — | $ | — | $ | 529 | $ | — | $ | 626 | $ | — | $ | — | $ | 626 | ||||||||||||||||||
| Federal funds purchased and securities loaned or sold under agreements to repurchase | — | 34,242 | — | — | 34,242 | — | 21,963 | — | — | 21,963 | ||||||||||||||||||||||||||||
| Trading account liabilities: | ||||||||||||||||||||||||||||||||||||||
| U.S. Treasury and agency securities | 15,403 | 362 | — | — | 15,765 | 13,948 | 195 | — | — | 14,143 | ||||||||||||||||||||||||||||
| Equity securities | 38,743 | 4,673 | — | — | 43,416 | 34,161 | 3,930 | 2 | — | 38,093 | ||||||||||||||||||||||||||||
| Non-U.S. sovereign debt | 12,496 | 9,863 | — | — | 22,359 | 9,995 | 9,011 | — | — | 19,006 | ||||||||||||||||||||||||||||
| Corporate securities and other | — | 8,407 | 17 | — | 8,424 | — | 7,387 | 13 | — | 7,400 | ||||||||||||||||||||||||||||
| Total trading account liabilities | 66,642 | 23,305 | 17 | — | 89,964 | 58,104 | 20,523 | 15 | — | 78,642 | ||||||||||||||||||||||||||||
| Derivative liabilities | 9,142 | 309,966 | 4,950 | (287,869 | ) | 36,189 | 14,741 | 361,185 | 4,602 | (342,503 | ) | 38,025 | ||||||||||||||||||||||||||
| Short-term borrowings | — | 1,789 | — | — | 1,789 | — | 3,458 | — | — | 3,458 | ||||||||||||||||||||||||||||
| Accrued expenses and other liabilities | 22,667 | 1,849 | — | — | 24,516 | 21,210 | 2,302 | — | — | 23,512 | ||||||||||||||||||||||||||||
| Long-term debt | — | 27,754 | 923 | — | 28,677 | — | 35,909 | 864 | — | 36,773 | ||||||||||||||||||||||||||||
| Total liabilities | $ | 98,451 | $ | 399,434 | $ | 5,890 | $ | (287,869 | ) | $ | 215,906 | |||||||||||||||||||||||||||
Total liabilities (5) | $ | 94,055 | $ | 445,966 | $ | 5,481 | $ | (342,503 | ) | $ | 202,999 | |||||||||||||||||||||||||||
(1) | Amounts represent the impact of legally enforceable master netting agreements and also cash collateral held or placed with the same counterparties. |
(2) | Includes $ |
(3) | Includes securities with a fair value of $ |
(4) | Includes MSRs of $ |
(5) | Total recurring Level 3 assets were 0.46 percent of total consolidated assets, and total recurring Level 3 liabilities were 0.25 percent of total consolidated liabilities. |
| December 31, 2018 | |||||||||||||||||||
| Fair Value Measurements | |||||||||||||||||||
| (Dollars in millions) | Level 1 | Level 2 | Level 3 | Netting Adjustments (1) | Assets/Liabilities at Fair Value | ||||||||||||||
| Assets | |||||||||||||||||||
| Time deposits placed and other short-term investments | $ | 1,214 | $ | — | $ | — | $ | — | $ | 1,214 | |||||||||
| Federal funds sold and securities borrowed or purchased under agreements to resell | — | 56,399 | — | — | 56,399 | ||||||||||||||
| Trading account assets: | |||||||||||||||||||
U.S. Treasury and agency securities (2) | 53,131 | 1,593 | — | — | 54,724 | ||||||||||||||
| Corporate securities, trading loans and other | — | 24,630 | 1,558 | — | 26,188 | ||||||||||||||
| Equity securities | 53,840 | 23,163 | 276 | — | 77,279 | ||||||||||||||
| Non-U.S. sovereign debt | 5,818 | 19,210 | 465 | — | 25,493 | ||||||||||||||
| Mortgage trading loans, MBS and ABS: | |||||||||||||||||||
U.S. government-sponsored agency guaranteed (2) | — | 19,586 | — | — | 19,586 | ||||||||||||||
| Mortgage trading loans, ABS and other MBS | — | 9,443 | 1,635 | — | 11,078 | ||||||||||||||
Total trading account assets (3) | 112,789 | 97,625 | 3,934 | — | 214,348 | ||||||||||||||
| Derivative assets | 9,967 | 315,413 | 3,466 | (285,121 | ) | 43,725 | |||||||||||||
| AFS debt securities: | |||||||||||||||||||
| U.S. Treasury and agency securities | 53,663 | 1,260 | — | — | 54,923 | ||||||||||||||
| Mortgage-backed securities: | |||||||||||||||||||
| Agency | — | 121,826 | — | — | 121,826 | ||||||||||||||
| Agency-collateralized mortgage obligations | — | 5,530 | — | — | 5,530 | ||||||||||||||
| Non-agency residential | — | 1,320 | 597 | — | 1,917 | ||||||||||||||
| Commercial | — | 14,078 | — | — | 14,078 | ||||||||||||||
| Non-U.S. securities | — | 9,304 | 2 | — | 9,306 | ||||||||||||||
| Other taxable securities | — | 4,403 | 7 | — | 4,410 | ||||||||||||||
| Tax-exempt securities | — | 17,376 | — | — | 17,376 | ||||||||||||||
| Total AFS debt securities | 53,663 | 175,097 | 606 | — | 229,366 | ||||||||||||||
| Other debt securities carried at fair value: | |||||||||||||||||||
| U.S. Treasury and agency securities | 1,282 | — | — | — | 1,282 | ||||||||||||||
| Non-agency residential MBS | — | 1,434 | 172 | — | 1,606 | ||||||||||||||
| Non-U.S. securities | 490 | 5,354 | — | — | 5,844 | ||||||||||||||
| Other taxable securities | — | 3 | — | — | 3 | ||||||||||||||
| Total other debt securities carried at fair value | 1,772 | 6,791 | 172 | — | 8,735 | ||||||||||||||
| Loans and leases | — | 4,011 | 338 | — | 4,349 | ||||||||||||||
| Loans held-for-sale | — | 2,400 | 542 | — | 2,942 | ||||||||||||||
Other assets (4) | 15,032 | 1,775 | 2,932 | — | 19,739 | ||||||||||||||
Total assets (5) | $ | 194,437 | $ | 659,511 | $ | 11,990 | $ | (285,121 | ) | $ | 580,817 | ||||||||
| Liabilities | |||||||||||||||||||
| Interest-bearing deposits in U.S. offices | $ | — | $ | 492 | $ | — | $ | — | $ | 492 | |||||||||
| Federal funds purchased and securities loaned or sold under agreements to repurchase | — | 28,875 | — | — | 28,875 | ||||||||||||||
| Trading account liabilities: | |||||||||||||||||||
| U.S. Treasury and agency securities | 7,894 | 761 | — | — | 8,655 | ||||||||||||||
| Equity securities | 33,739 | 4,070 | — | — | 37,809 | ||||||||||||||
| Non-U.S. sovereign debt | 7,452 | 9,182 | — | — | 16,634 | ||||||||||||||
| Corporate securities and other | — | 5,104 | 18 | — | 5,122 | ||||||||||||||
| Total trading account liabilities | 49,085 | 19,117 | 18 | — | 68,220 | ||||||||||||||
| Derivative liabilities | 9,931 | 303,441 | 4,401 | (279,882 | ) | 37,891 | |||||||||||||
| Short-term borrowings | — | 1,648 | — | — | 1,648 | ||||||||||||||
| Accrued expenses and other liabilities | 18,096 | 1,979 | — | — | 20,075 | ||||||||||||||
| Long-term debt | — | 26,872 | 817 | — | 27,689 | ||||||||||||||
Total liabilities (5) | $ | 77,112 | $ | 382,424 | $ | 5,236 | $ | (279,882 | ) | $ | 184,890 | ||||||||
| December 31, 2017 | |||||||||||||||||||
| Fair Value Measurements | |||||||||||||||||||
| (Dollars in millions) | Level 1 | Level 2 | Level 3 | Netting Adjustments (1) | Assets/Liabilities at Fair Value | ||||||||||||||
| Assets | |||||||||||||||||||
| Time deposits placed and other short-term investments | $ | 2,234 | $ | — | $ | — | $ | — | $ | 2,234 | |||||||||
| Federal funds sold and securities borrowed or purchased under agreements to resell | — | 52,906 | — | — | 52,906 | ||||||||||||||
| Trading account assets: | |||||||||||||||||||
U.S. Treasury and agency securities (2) | 38,720 | 1,922 | — | — | 40,642 | ||||||||||||||
| Corporate securities, trading loans and other | — | 28,714 | 1,864 | — | 30,578 | ||||||||||||||
| Equity securities | 60,747 | 23,958 | 235 | — | 84,940 | ||||||||||||||
| Non-U.S. sovereign debt | 6,545 | 15,839 | 556 | — | 22,940 | ||||||||||||||
| Mortgage trading loans, MBS and ABS: | |||||||||||||||||||
| U.S. government-sponsored agency guaranteed | — | 20,586 | — | — | 20,586 | ||||||||||||||
| Mortgage trading loans, ABS and other MBS | — | 8,174 | 1,498 | — | 9,672 | ||||||||||||||
Total trading account assets (3) | 106,012 | 99,193 | 4,153 | — | 209,358 | ||||||||||||||
| Derivative assets | 6,305 | 341,178 | 4,067 | (313,788 | ) | 37,762 | |||||||||||||
| AFS debt securities: | |||||||||||||||||||
| U.S. Treasury and agency securities | 51,915 | 1,608 | — | — | 53,523 | ||||||||||||||
| Mortgage-backed securities: | |||||||||||||||||||
| Agency | — | 192,929 | — | — | 192,929 | ||||||||||||||
| Agency-collateralized mortgage obligations | — | 6,804 | — | — | 6,804 | ||||||||||||||
| Non-agency residential | — | 2,669 | — | — | 2,669 | ||||||||||||||
| Commercial | — | 13,684 | — | — | 13,684 | ||||||||||||||
| Non-U.S. securities | 772 | 5,880 | 25 | — | 6,677 | ||||||||||||||
| Other taxable securities | — | 5,261 | 509 | — | 5,770 | ||||||||||||||
| Tax-exempt securities | — | 20,106 | 469 | — | 20,575 | ||||||||||||||
| Total AFS debt securities | 52,687 | 248,941 | 1,003 | — | 302,631 | ||||||||||||||
| Other debt securities carried at fair value: | |||||||||||||||||||
| Mortgage-backed securities: | |||||||||||||||||||
| Non-agency residential | — | 2,769 | — | — | 2,769 | ||||||||||||||
| Non-U.S. securities | 8,191 | 1,297 | — | — | 9,488 | ||||||||||||||
| Other taxable securities | — | 229 | — | — | 229 | ||||||||||||||
| Total other debt securities carried at fair value | 8,191 | 4,295 | — | — | 12,486 | ||||||||||||||
| Loans and leases | — | 5,139 | 571 | — | 5,710 | ||||||||||||||
| Loans held-for-sale | — | 1,466 | 690 | — | 2,156 | ||||||||||||||
Other assets (4) | 19,367 | 789 | 2,425 | — | 22,581 | ||||||||||||||
| Total assets | $ | 194,796 | $ | 753,907 | $ | 12,909 | $ | (313,788 | ) | $ | 647,824 | ||||||||
| Liabilities | |||||||||||||||||||
| Interest-bearing deposits in U.S. offices | $ | — | $ | 449 | $ | — | $ | — | $ | 449 | |||||||||
| Federal funds purchased and securities loaned or sold under agreements to repurchase | — | 36,182 | — | — | 36,182 | ||||||||||||||
| Trading account liabilities: | |||||||||||||||||||
| U.S. Treasury and agency securities | 17,266 | 734 | — | — | 18,000 | ||||||||||||||
| Equity securities | 33,019 | 3,885 | — | — | 36,904 | ||||||||||||||
| Non-U.S. sovereign debt | 11,976 | 7,382 | — | — | 19,358 | ||||||||||||||
| Corporate securities and other | — | 6,901 | 24 | — | 6,925 | ||||||||||||||
| Total trading account liabilities | 62,261 | 18,902 | 24 | — | 81,187 | ||||||||||||||
| Derivative liabilities | 6,029 | 334,261 | 5,781 | (311,771 | ) | 34,300 | |||||||||||||
| Short-term borrowings | — | 1,494 | — | — | 1,494 | ||||||||||||||
| Accrued expenses and other liabilities | 21,887 | 945 | 8 | — | 22,840 | ||||||||||||||
| Long-term debt | — | 29,923 | 1,863 | — | 31,786 | ||||||||||||||
| Total liabilities | $ | 90,177 | $ | 422,156 | $ | 7,676 | $ | (311,771 | ) | $ | 208,238 | ||||||||
(1) | Amounts represent the impact of legally enforceable master netting agreements and also cash collateral held or placed with the same counterparties. |
(2) | Includes $ |
(3) | Includes securities with a fair value of $ |
(4) | Includes MSRs of $ |
(5) | Total recurring Level 3 assets were 0.51 percent of total consolidated assets, and total recurring Level 3 liabilities were 0.25 percent of total consolidated liabilities. |
83Bank of America | ||
Level 3 – Fair Value Measurements for the Three Months Ended September 30, 2018 (1) | ||||||||||||||||||||||||||||||||||||||||||||||||||||||||||||||||||
Level 3 – Fair Value Measurements (1) | Level 3 – Fair Value Measurements (1) | |||||||||||||||||||||||||||||||||||||||||||||||||||||||||||||||||
Balance July 1 2018 | Total Realized/Unrealized Gains (Losses) (2) | Gains (Losses) in OCI (3) | Gross | Gross Transfers into Level 3 | Gross Transfers out of Level 3 | Balance September 30 2018 | Change in Unrealized Gains (Losses) Related to Financial Instruments Still Held (2) | Balance July 1 | Total Realized/Unrealized Gains (Losses) in Net Income (2) | Gains (Losses) in OCI (3) | Gross | Gross Transfers into Level 3 | Gross Transfers out of Level 3 | Balance September 30 | Change in Unrealized Gains (Losses) in Net Income Related to Financial Instruments Still Held (2) | |||||||||||||||||||||||||||||||||||||||||||||||||||
| (Dollars in millions) | Purchases | Sales | Issuances | Settlements | Purchases | Sales | Issuances | Settlements | ||||||||||||||||||||||||||||||||||||||||||||||||||||||||||
| Three Months Ended September 30, 2019 | ||||||||||||||||||||||||||||||||||||||||||||||||||||||||||||||||||
| Trading account assets: | ||||||||||||||||||||||||||||||||||||||||||||||||||||||||||||||||||
| Corporate securities, trading loans and other | $ | 1,393 | $ | 28 | $ | — | $ | 158 | $ | (153 | ) | $ | — | $ | (143 | ) | $ | 356 | $ | (48 | ) | $ | 1,591 | $ | — | |||||||||||||||||||||||||||||||||||||||||
| Equity securities | 296 | (8 | ) | — | 17 | (81 | ) | — | (1 | ) | 66 | (10 | ) | 279 | (31 | ) | ||||||||||||||||||||||||||||||||||||||||||||||||||
| Non-U.S. sovereign debt | 481 | 9 | (28 | ) | — | — | — | (36 | ) | 39 | — | 465 | 10 | |||||||||||||||||||||||||||||||||||||||||||||||||||||
| Mortgage trading loans, ABS and other MBS | 1,389 | (8 | ) | — | 91 | (156 | ) | — | (48 | ) | 316 | (21 | ) | 1,563 | (24 | ) | ||||||||||||||||||||||||||||||||||||||||||||||||||
| Total trading account assets | 3,559 | 21 | (28 | ) | 266 | (390 | ) | — | (228 | ) | 777 | (79 | ) | 3,898 | (45 | ) | ||||||||||||||||||||||||||||||||||||||||||||||||||
Net derivative assets (4) | (1,114 | ) | 73 | — | 81 | (270 | ) | — | (36 | ) | — | 34 | (1,232 | ) | 52 | |||||||||||||||||||||||||||||||||||||||||||||||||||
| AFS debt securities: | ||||||||||||||||||||||||||||||||||||||||||||||||||||||||||||||||||
| Non-agency residential MBS | 568 | — | (13 | ) | — | — | — | (8 | ) | — | (39 | ) | 508 | — | ||||||||||||||||||||||||||||||||||||||||||||||||||||
| Non-U.S. securities | 2 | — | — | — | — | — | — | — | — | 2 | — | |||||||||||||||||||||||||||||||||||||||||||||||||||||||
| Other taxable securities | 3 | — | — | — | — | — | — | — | — | 3 | — | |||||||||||||||||||||||||||||||||||||||||||||||||||||||
| Total AFS debt securities | 573 | — | (13 | ) | — | — | — | (8 | ) | — | (39 | ) | 513 | — | ||||||||||||||||||||||||||||||||||||||||||||||||||||
| Other debt securities carried at fair value – Non-agency residential MBS | 273 | (8 | ) | — | — | — | — | (5 | ) | 48 | — | 308 | (8 | ) | ||||||||||||||||||||||||||||||||||||||||||||||||||||
Loans and leases (5,6) | 355 | 8 | — | 27 | (17 | ) | 44 | (16 | ) | — | — | 401 | 8 | |||||||||||||||||||||||||||||||||||||||||||||||||||||
Loans held-for-sale (5) | 486 | 5 | (11 | ) | 2 | — | — | (96 | ) | — | — | 386 | (7 | ) | ||||||||||||||||||||||||||||||||||||||||||||||||||||
Other assets (6, 7) | 2,551 | (40 | ) | (5 | ) | — | — | 53 | (163 | ) | 4 | — | 2,400 | (82 | ) | |||||||||||||||||||||||||||||||||||||||||||||||||||
| Trading account liabilities – Equity securities | (2 | ) | — | — | — | — | — | — | — | — | (2 | ) | — | |||||||||||||||||||||||||||||||||||||||||||||||||||||
Trading account liabilities – Corporate securities and other | (13 | ) | 1 | — | (1 | ) | — | — | — | — | — | (13 | ) | (1 | ) | |||||||||||||||||||||||||||||||||||||||||||||||||||
Long-term debt (5) | (902 | ) | 16 | 1 | (27 | ) | — | — | 49 | (1 | ) | — | (864 | ) | 16 | |||||||||||||||||||||||||||||||||||||||||||||||||||
| Three Months Ended September 30, 2018 | ||||||||||||||||||||||||||||||||||||||||||||||||||||||||||||||||||
| Trading account assets: | ||||||||||||||||||||||||||||||||||||||||||||||||||||||||||||||||||
| Corporate securities, trading loans and other | $ | 1,638 | $ | 14 | $ | — | $ | 54 | $ | (87 | ) | $ | — | $ | (175 | ) | $ | 269 | $ | (179 | ) | $ | 1,534 | $ | (14 | ) | $ | 1,638 | $ | 14 | $ | — | $ | 54 | $ | (87 | ) | $ | — | $ | (175 | ) | $ | 269 | $ | (179 | ) | $ | 1,534 | $ | (14 | ) | ||||||||||||||
| Equity securities | 228 | 8 | — | 21 | — | — | — | 43 | (10 | ) | 290 | 8 | 228 | 8 | — | 21 | — | — | — | 43 | (10 | ) | 290 | 8 | ||||||||||||||||||||||||||||||||||||||||||
| Non-U.S. sovereign debt | 368 | 10 | (13 | ) | — | — | — | — | 109 | (5 | ) | 469 | 11 | 368 | 10 | (13 | ) | — | — | — | — | 109 | (5 | ) | 469 | 11 | ||||||||||||||||||||||||||||||||||||||||
| Mortgage trading loans, ABS and other MBS | 1,523 | 16 | (1 | ) | 75 | (184 | ) | — | (29 | ) | 191 | (112 | ) | 1,479 | 8 | 1,523 | 16 | (1 | ) | 75 | (184 | ) | — | (29 | ) | 191 | (112 | ) | 1,479 | 8 | ||||||||||||||||||||||||||||||||||||
| Total trading account assets | 3,757 | 48 | (14 | ) | 150 | (271 | ) | — | (204 | ) | 612 | (306 | ) | 3,772 | 13 | 3,757 | 48 | (14 | ) | 150 | (271 | ) | — | (204 | ) | 612 | (306 | ) | 3,772 | 13 | ||||||||||||||||||||||||||||||||||||
Net derivative assets (4) | (1,588 | ) | (53 | ) | — | 23 | (66 | ) | — | 111 | 20 | 983 | (570 | ) | (51 | ) | (1,588 | ) | (53 | ) | — | 23 | (66 | ) | — | 111 | 20 | 983 | (570 | ) | (51 | ) | ||||||||||||||||||||||||||||||||||
| AFS debt securities: | ||||||||||||||||||||||||||||||||||||||||||||||||||||||||||||||||||
| Non-agency residential MBS | 453 | 31 | (28 | ) | — | (72 | ) | — | — | 235 | (75 | ) | 544 | — | 453 | 31 | (28 | ) | — | (72 | ) | — | — | 235 | (75 | ) | 544 | — | ||||||||||||||||||||||||||||||||||||||
| Non-U.S. securities | 3 | — | — | — | — | — | — | — | — | 3 | — | 3 | — | — | — | — | — | — | — | — | 3 | — | ||||||||||||||||||||||||||||||||||||||||||||
| Other taxable securities | 99 | (1 | ) | (3 | ) | — | (22 | ) | — | — | — | (66 | ) | 7 | — | 99 | (1 | ) | (3 | ) | — | (22 | ) | — | — | — | (66 | ) | 7 | — | ||||||||||||||||||||||||||||||||||||
| Tax-exempt securities | 1 | — | — | — | — | — | — | — | — | 1 | — | 1 | — | — | — | — | — | — | — | — | 1 | — | ||||||||||||||||||||||||||||||||||||||||||||
| Total AFS debt securities | 556 | 30 | (31 | ) | — | (94 | ) | — | — | 235 | (141 | ) | 555 | — | 556 | 30 | (31 | ) | — | (94 | ) | — | — | 235 | (141 | ) | 555 | — | ||||||||||||||||||||||||||||||||||||||
| Other debt securities carried at fair value – Non-agency residential MBS | 287 | (23 | ) | — | — | — | — | — | 60 | (28 | ) | 296 | (10 | ) | 287 | (23 | ) | — | — | — | — | — | 60 | (28 | ) | 296 | (10 | ) | ||||||||||||||||||||||||||||||||||||||
Loans and leases (5, 6) | 493 | — | — | — | (62 | ) | — | (21 | ) | — | — | 410 | (1 | ) | ||||||||||||||||||||||||||||||||||||||||||||||||||||
Loans and leases (5) | 493 | — | — | — | (62 | ) | — | (21 | ) | — | — | 410 | (1 | ) | ||||||||||||||||||||||||||||||||||||||||||||||||||||
Loans held-for-sale (5) | 577 | 12 | (4 | ) | 39 | — | — | (82 | ) | 12 | (28 | ) | 526 | 9 | 577 | 12 | (4 | ) | 39 | — | — | (82 | ) | 12 | (28 | ) | 526 | 9 | ||||||||||||||||||||||||||||||||||||||
Other assets (6, 7) | 3,184 | 121 | — | — | (22 | ) | 31 | (174 | ) | — | — | 3,140 | 55 | 3,184 | 121 | — | — | (22 | ) | 31 | (174 | ) | — | — | 3,140 | 55 | ||||||||||||||||||||||||||||||||||||||||
| Trading account liabilities – Corporate securities and other | (35 | ) | 9 | — | 9 | — | — | — | — | — | (17 | ) | (6 | ) | (35 | ) | 9 | — | 9 | — | — | — | — | — | (17 | ) | (6 | ) | ||||||||||||||||||||||||||||||||||||||
Long-term debt (5) | (1,225 | ) | 11 | (1 | ) | — | — | (11 | ) | 106 | (106 | ) | 303 | (923 | ) | 13 | (1,225 | ) | 11 | (1 | ) | — | — | (11 | ) | 106 | (106 | ) | 303 | (923 | ) | 13 | ||||||||||||||||||||||||||||||||||
(1) | Assets (liabilities). For assets, increase (decrease) to Level 3 and for liabilities, (increase) decrease to Level 3. |
(2) | Includes gains (losses) reported in earnings in the following income statement line items: Trading account assets/liabilities - predominantly trading account |
(3) | Includes unrealized gains (losses) in OCI on AFS debt securities, foreign currency translation adjustments and the impact of changes in the Corporation’s credit spreads on long-term debt accounted for under the fair value option. |
(4) | Net derivative assets include derivative assets of $3.4 billion and $4.4 billion and derivative liabilities of $4.6 billion and $5.0 billion at September 30, 2019 and 2018. |
(5) | Amounts represent instruments that are accounted for under the fair value option. |
(6) | Issuances represent loan originations and MSRs recognized following securitizations or whole-loan sales. |
(7) | Settlements primarily represent the net change in fair value of the MSR asset due to the recognition of modeled cash flows and the passage of time. |
Level 3 – Fair Value Measurements for the Three Months Ended September 30, 2017 (1) | ||||||||||||||||||||||||||||||||||||||||||||||||||||||||||||||||||
Level 3 – Fair Value Measurements (1) | Level 3 – Fair Value Measurements (1) | |||||||||||||||||||||||||||||||||||||||||||||||||||||||||||||||||
Balance July 1 2017 | Total Realized/Unrealized Gains (Losses) (2) | Gains (Losses) in OCI (3) | Gross | Gross Transfers into Level 3 | Gross Transfers out of Level 3 | Balance September 30 2017 | Change in Unrealized Gains (Losses) Related to Financial Instruments Still Held (2) | Balance January 1 | Total Realized/Unrealized Gains (Losses) in Net Income (2) | Gains (Losses) in OCI (3) | Gross | Gross Transfers into Level 3 | Gross Transfers out of Level 3 | Balance September 30 | Change in Unrealized Gains (Losses) in Net Income Related to Financial Instruments Still Held (2) | |||||||||||||||||||||||||||||||||||||||||||||||||||
| (Dollars in millions) | Purchases | Sales | Issuances | Settlements | Purchases | Sales | Issuances | Settlements | ||||||||||||||||||||||||||||||||||||||||||||||||||||||||||
| Nine Months Ended September 30, 2019 | ||||||||||||||||||||||||||||||||||||||||||||||||||||||||||||||||||
| Trading account assets: | ||||||||||||||||||||||||||||||||||||||||||||||||||||||||||||||||||
| Corporate securities, trading loans and other | $ | 1,777 | $ | 77 | $ | — | $ | 35 | $ | (79 | ) | $ | 5 | $ | (208 | ) | $ | 288 | $ | (153 | ) | $ | 1,742 | $ | 35 | $ | 1,558 | $ | 86 | $ | — | $ | 352 | $ | (305 | ) | $ | — | $ | (349 | ) | $ | 602 | $ | (353 | ) | $ | 1,591 | $ | 33 | ||||||||||||||||
| Equity securities | 229 | 8 | — | 3 | (3 | ) | — | — | 17 | (10 | ) | 244 | 10 | 276 | 14 | — | 38 | (87 | ) | — | (4 | ) | 69 | (27 | ) | 279 | (14 | ) | ||||||||||||||||||||||||||||||||||||||
| Non-U.S. sovereign debt | 506 | 33 | 18 | — | — | — | (5 | ) | — | — | 552 | 33 | 465 | 36 | (24 | ) | 1 | — | — | (47 | ) | 39 | (5 | ) | 465 | 37 | ||||||||||||||||||||||||||||||||||||||||
| Mortgage trading loans, ABS and other MBS | 1,232 | 10 | (1 | ) | 150 | (157 | ) | — | (46 | ) | 83 | (19 | ) | 1,252 | (2 | ) | 1,635 | 80 | (2 | ) | 488 | (817 | ) | — | (172 | ) | 583 | (232 | ) | 1,563 | 13 | |||||||||||||||||||||||||||||||||||
| Total trading account assets | 3,744 | 128 | 17 | 188 | (239 | ) | 5 | (259 | ) | 388 | (182 | ) | 3,790 | 76 | 3,934 | 216 | (26 | ) | 879 | (1,209 | ) | — | (572 | ) | 1,293 | (617 | ) | 3,898 | 69 | |||||||||||||||||||||||||||||||||||||
Net derivative assets (4) | (1,803 | ) | (252 | ) | — | 150 | (367 | ) | — | 278 | 7 | (36 | ) | (2,023 | ) | (283 | ) | (935 | ) | (43 | ) | — | 248 | (676 | ) | — | (124 | ) | 139 | 159 | (1,232 | ) | (110 | ) | ||||||||||||||||||||||||||||||||
| AFS debt securities: | ||||||||||||||||||||||||||||||||||||||||||||||||||||||||||||||||||
| Non-agency residential MBS | 597 | — | 77 | — | — | — | (29 | ) | 206 | (343 | ) | 508 | — | |||||||||||||||||||||||||||||||||||||||||||||||||||||
| Non-U.S. securities | 2 | — | — | — | — | — | — | — | — | 2 | — | |||||||||||||||||||||||||||||||||||||||||||||||||||||||
| Other taxable securities | 7 | — | — | — | — | — | (4 | ) | — | — | 3 | — | ||||||||||||||||||||||||||||||||||||||||||||||||||||||
| Total AFS debt securities | 606 | — | 77 | — | — | — | (33 | ) | 206 | (343 | ) | 513 | — | |||||||||||||||||||||||||||||||||||||||||||||||||||||
| Other debt securities carried at fair value – Non-agency residential MBS | 172 | 41 | — | — | — | — | (13 | ) | 155 | (47 | ) | 308 | 38 | |||||||||||||||||||||||||||||||||||||||||||||||||||||
Loans and leases (5,6) | 338 | 12 | — | 27 | (32 | ) | 97 | (41 | ) | — | — | 401 | 11 | |||||||||||||||||||||||||||||||||||||||||||||||||||||
Loans held-for-sale (5,6) | 542 | 43 | (11 | ) | 12 | (71 | ) | 11 | (199 | ) | 59 | — | 386 | 13 | ||||||||||||||||||||||||||||||||||||||||||||||||||||
Other assets (6, 7) | 2,932 | (194 | ) | 11 | — | (10 | ) | 161 | (504 | ) | 4 | — | 2,400 | (342 | ) | |||||||||||||||||||||||||||||||||||||||||||||||||||
| Trading account liabilities – Equity securities | — | (2 | ) | — | — | — | — | — | — | — | (2 | ) | (2 | ) | ||||||||||||||||||||||||||||||||||||||||||||||||||||
Trading account liabilities – Corporate securities and other | (18 | ) | 8 | — | — | (3 | ) | — | — | — | — | (13 | ) | (1 | ) | |||||||||||||||||||||||||||||||||||||||||||||||||||
Long-term debt (5) | (817 | ) | (71 | ) | — | (27 | ) | — | (13 | ) | 125 | (62 | ) | 1 | (864 | ) | (64 | ) | ||||||||||||||||||||||||||||||||||||||||||||||||
| Nine Months Ended September 30, 2018 | ||||||||||||||||||||||||||||||||||||||||||||||||||||||||||||||||||
| Trading account assets: | ||||||||||||||||||||||||||||||||||||||||||||||||||||||||||||||||||
| Corporate securities, trading loans and other | $ | 1,864 | $ | (14 | ) | $ | (1 | ) | $ | 328 | $ | (298 | ) | $ | — | $ | (388 | ) | $ | 517 | $ | (474 | ) | $ | 1,534 | $ | (88 | ) | ||||||||||||||||||||||||||||||||||||||
| Equity securities | 235 | 17 | — | 29 | (11 | ) | — | (4 | ) | 73 | (49 | ) | 290 | 17 | ||||||||||||||||||||||||||||||||||||||||||||||||||||
| Non-U.S. sovereign debt | 556 | 39 | (55 | ) | 7 | (50 | ) | — | (8 | ) | 117 | (137 | ) | 469 | 40 | |||||||||||||||||||||||||||||||||||||||||||||||||||
| Mortgage trading loans, ABS and other MBS | 1,498 | 157 | 2 | 392 | (760 | ) | — | (136 | ) | 541 | (215 | ) | 1,479 | 92 | ||||||||||||||||||||||||||||||||||||||||||||||||||||
| Total trading account assets | 4,153 | 199 | (54 | ) | 756 | (1,119 | ) | — | (536 | ) | 1,248 | (875 | ) | 3,772 | 61 | |||||||||||||||||||||||||||||||||||||||||||||||||||
Net derivative assets (4) | (1,714 | ) | 203 | — | 371 | (919 | ) | — | 488 | 87 | 914 | (570 | ) | (138 | ) | |||||||||||||||||||||||||||||||||||||||||||||||||||
| AFS debt securities: | ||||||||||||||||||||||||||||||||||||||||||||||||||||||||||||||||||
| Non-agency residential MBS | — | 39 | (42 | ) | — | (72 | ) | — | — | 694 | (75 | ) | 544 | — | ||||||||||||||||||||||||||||||||||||||||||||||||||||
| Non-U.S. securities | 139 | 1 | 4 | 7 | — | — | (115 | ) | — | — | 36 | — | 25 | — | (1 | ) | — | (10 | ) | — | (14 | ) | 3 | — | 3 | — | ||||||||||||||||||||||||||||||||||||||||
| Other taxable securities | 483 | — | 1 | — | — | — | (1 | ) | — | — | 483 | — | 509 | 1 | (5 | ) | — | (22 | ) | — | (10 | ) | 60 | (526 | ) | 7 | — | |||||||||||||||||||||||||||||||||||||||
| Tax-exempt securities | 518 | — | 1 | — | — | — | (7 | ) | — | (45 | ) | 467 | — | 469 | — | — | — | — | — | — | 1 | (469 | ) | 1 | — | |||||||||||||||||||||||||||||||||||||||||
| Total AFS debt securities | 1,140 | 1 | 6 | 7 | — | — | (123 | ) | — | (45 | ) | 986 | — | |||||||||||||||||||||||||||||||||||||||||||||||||||||
Total AFS debt securities (8) | 1,003 | 40 | (48 | ) | — | (104 | ) | — | (24 | ) | 758 | (1,070 | ) | 555 | — | |||||||||||||||||||||||||||||||||||||||||||||||||||
| Other debt securities carried at fair value – Non-agency residential MBS | 23 | — | — | — | — | — | (1 | ) | — | — | 22 | — | — | (27 | ) | — | — | (7 | ) | — | — | 358 | (28 | ) | 296 | (5 | ) | |||||||||||||||||||||||||||||||||||||||
Loans and leases (5, 6) | 667 | 2 | — | 2 | (24 | ) | — | (29 | ) | — | — | 618 | 2 | |||||||||||||||||||||||||||||||||||||||||||||||||||||
Loans and leases (5) | 571 | (20 | ) | — | — | (71 | ) | — | (70 | ) | — | — | 410 | (17 | ) | |||||||||||||||||||||||||||||||||||||||||||||||||||
Loans held-for-sale (5) | 766 | 38 | 10 | — | (4 | ) | — | (93 | ) | 58 | — | 775 | 27 | 690 | 24 | (31 | ) | 51 | — | — | (160 | ) | 12 | (60 | ) | 526 | 18 | |||||||||||||||||||||||||||||||||||||||
Other assets (6, 7) | 2,795 | 124 | (43 | ) | — | (80 | ) | 69 | (191 | ) | — | — | 2,674 | 8 | ||||||||||||||||||||||||||||||||||||||||||||||||||||
Federal funds purchased and securities loaned or sold under agreements to repurchase (5) | (135 | ) | — | — | — | — | — | 135 | — | — | — | — | ||||||||||||||||||||||||||||||||||||||||||||||||||||||
Other assets (6,7,8) | 2,425 | 389 | — | 2 | (68 | ) | 83 | (585 | ) | 929 | (35 | ) | 3,140 | 188 | ||||||||||||||||||||||||||||||||||||||||||||||||||||
| Trading account liabilities – Corporate securities and other | (22 | ) | 1 | — | — | (3 | ) | (1 | ) | — | — | — | (25 | ) | — | (24 | ) | 11 | — | 9 | (11 | ) | (2 | ) | — | — | — | (17 | ) | (7 | ) | |||||||||||||||||||||||||||||||||||
Accrued expenses and other liabilities (5) | (9 | ) | — | — | — | — | — | — | — | — | (9 | ) | — | (8 | ) | — | — | — | — | — | 8 | — | — | — | — | |||||||||||||||||||||||||||||||||||||||||
Long-term debt (5) | (1,646 | ) | (87 | ) | (7 | ) | 63 | — | (129 | ) | 115 | (244 | ) | 45 | (1,890 | ) | (87 | ) | (1,863 | ) | 97 | 2 | 9 | — | (131 | ) | 429 | (253 | ) | 787 | (923 | ) | 87 | |||||||||||||||||||||||||||||||||
(1) | Assets (liabilities). For assets, increase (decrease) to Level 3 and for liabilities, (increase) decrease to Level 3. |
(2) | Includes gains (losses) reported in earnings in the following income statement line items: Trading account assets/liabilities - predominantly trading account |
Level 3 – Fair Value Measurements for the Nine Months Ended September 30, 2018 (1) | |||||||||||||||||||||||||||||||||
| (Dollars in millions) | Balance January 1 2018 | Total Realized/Unrealized Gains (Losses) (2) | Gains (Losses) in OCI (3) | Gross | Gross Transfers into Level 3 | Gross Transfers out of Level 3 | Balance September 30 2018 | Change in Unrealized Gains (Losses) Related to Financial Instruments Still Held (2) | |||||||||||||||||||||||||
| Purchases | Sales | Issuances | Settlements | ||||||||||||||||||||||||||||||
| Trading account assets: | |||||||||||||||||||||||||||||||||
| Corporate securities, trading loans and other | $ | 1,864 | $ | (14 | ) | $ | (1 | ) | $ | 328 | $ | (298 | ) | $ | — | $ | (388 | ) | $ | 517 | $ | (474 | ) | $ | 1,534 | $ | (88 | ) | |||||
| Equity securities | 235 | 17 | — | 29 | (11 | ) | — | (4 | ) | 73 | (49 | ) | 290 | 17 | |||||||||||||||||||
| Non-U.S. sovereign debt | 556 | 39 | (55 | ) | 7 | (50 | ) | — | (8 | ) | 117 | (137 | ) | 469 | 40 | ||||||||||||||||||
| Mortgage trading loans, ABS and other MBS | 1,498 | 157 | 2 | 392 | (760 | ) | — | (136 | ) | 541 | (215 | ) | 1,479 | 92 | |||||||||||||||||||
| Total trading account assets | 4,153 | 199 | (54 | ) | 756 | (1,119 | ) | — | (536 | ) | 1,248 | (875 | ) | 3,772 | 61 | ||||||||||||||||||
Net derivative assets (4) | (1,714 | ) | 203 | — | 371 | (919 | ) | — | 488 | 87 | 914 | (570 | ) | (138 | ) | ||||||||||||||||||
| AFS debt securities: | |||||||||||||||||||||||||||||||||
| Non-agency residential MBS | — | 39 | (42 | ) | — | (72 | ) | — | — | 694 | (75 | ) | 544 | — | |||||||||||||||||||
| Non-U.S. securities | 25 | — | (1 | ) | — | (10 | ) | — | (14 | ) | 3 | — | 3 | — | |||||||||||||||||||
| Other taxable securities | 509 | 1 | (5 | ) | — | (22 | ) | — | (10 | ) | 60 | (526 | ) | 7 | — | ||||||||||||||||||
| Tax-exempt securities | 469 | — | — | — | — | — | — | 1 | (469 | ) | 1 | — | |||||||||||||||||||||
Total AFS debt securities (5) | 1,003 | 40 | (48 | ) | — | (104 | ) | — | (24 | ) | 758 | (1,070 | ) | 555 | — | ||||||||||||||||||
| Other debt securities carried at fair value – Non-agency residential MBS | — | (27 | ) | — | — | (7 | ) | — | — | 358 | (28 | ) | 296 | (5 | ) | ||||||||||||||||||
Loans and leases (6, 7) | 571 | (20 | ) | — | — | (71 | ) | — | (70 | ) | — | — | 410 | (17 | ) | ||||||||||||||||||
Loans held-for-sale (6) | 690 | 24 | (31 | ) | 51 | — | — | (160 | ) | 12 | (60 | ) | 526 | 18 | |||||||||||||||||||
Other assets (5, 7, 8) | 2,425 | 389 | — | 2 | (68 | ) | 83 | (585 | ) | 929 | (35 | ) | 3,140 | 188 | |||||||||||||||||||
| Trading account liabilities – Corporate securities and other | (24 | ) | 11 | — | 9 | (11 | ) | (2 | ) | — | — | — | (17 | ) | (7 | ) | |||||||||||||||||
Accrued expenses and other liabilities (6) | (8 | ) | — | — | — | — | — | 8 | — | — | — | — | |||||||||||||||||||||
Long-term debt (6) | (1,863 | ) | 97 | 2 | 9 | — | (131 | ) | 429 | (253 | ) | 787 | (923 | ) | 87 | ||||||||||||||||||
(3) | Includes unrealized gains (losses) in OCI on AFS debt securities, foreign currency translation adjustments and the impact of changes in the Corporation’s credit spreads on long-term debt accounted for under the fair value option. |
(4) | Net derivative assets include derivative assets of $3.4 billion and $4.4 billion and derivative liabilities of $4.6 billion and $5.0 billion at September 30, 2019 and 2018. |
(5) |
| Amounts represent instruments that are accounted for under the fair value option. |
| Issuances represent loan originations and MSRs recognized following securitizations or whole-loan sales. |
| Settlements primarily represent the net change in fair value of the MSR asset due to the recognition of modeled cash flows and the passage of time. |
(8) | Transfers out of AFS debt securities and into other assets primarily relate to the reclassification of certain securities. |
Level 3 – Fair Value Measurements for the Nine Months Ended September 30, 2017 (1) | |||||||||||||||||||||||||||||||||
Balance January 1 2017 | Total Realized/Unrealized Gains (Losses) (2) | Gains (Losses) in OCI (3) | Gross | Gross Transfers into Level 3 | Gross Transfers out of Level 3 | Balance September 30 2017 | Change in Unrealized Gains (Losses) Related to Financial Instruments Still Held (2) | ||||||||||||||||||||||||||
| (Dollars in millions) | Purchases | Sales | Issuances | Settlements | |||||||||||||||||||||||||||||
| Trading account assets: | |||||||||||||||||||||||||||||||||
| Corporate securities, trading loans and other | $ | 2,777 | $ | 225 | $ | — | $ | 353 | $ | (679 | ) | $ | 5 | $ | (443 | ) | $ | 506 | $ | (1,002 | ) | $ | 1,742 | $ | 72 | ||||||||
| Equity securities | 281 | 23 | — | 45 | (67 | ) | — | (10 | ) | 119 | (147 | ) | 244 | 11 | |||||||||||||||||||
| Non-U.S. sovereign debt | 510 | 64 | 12 | 26 | (59 | ) | — | (73 | ) | 72 | — | 552 | 60 | ||||||||||||||||||||
| Mortgage trading loans, ABS and other MBS | 1,211 | 195 | (2 | ) | 747 | (846 | ) | — | (169 | ) | 187 | (71 | ) | 1,252 | 107 | ||||||||||||||||||
| Total trading account assets | 4,779 | 507 | 10 | 1,171 | (1,651 | ) | 5 | (695 | ) | 884 | (1,220 | ) | 3,790 | 250 | |||||||||||||||||||
Net derivative assets (4) | (1,313 | ) | (1,098 | ) | — | 558 | (843 | ) | — | 722 | 36 | (85 | ) | (2,023 | ) | (561 | ) | ||||||||||||||||
| AFS debt securities: | |||||||||||||||||||||||||||||||||
| Non-U.S. securities | 229 | 2 | 16 | 49 | — | — | (260 | ) | — | — | 36 | — | |||||||||||||||||||||
| Other taxable securities | 594 | 3 | 6 | 5 | — | — | (31 | ) | — | (94 | ) | 483 | — | ||||||||||||||||||||
| Tax-exempt securities | 542 | — | 1 | — | (56 | ) | — | (10 | ) | 35 | (45 | ) | 467 | — | |||||||||||||||||||
| Total AFS debt securities | 1,365 | 5 | 23 | 54 | (56 | ) | — | (301 | ) | 35 | (139 | ) | 986 | — | |||||||||||||||||||
| Other debt securities carried at fair value – Non-agency residential MBS | 25 | (1 | ) | — | — | — | — | (2 | ) | — | — | 22 | — | ||||||||||||||||||||
Loans and leases (5, 6) | 720 | 20 | — | 2 | (24 | ) | — | (93 | ) | — | (7 | ) | 618 | 18 | |||||||||||||||||||
Loans held-for-sale (5) | 656 | 109 | 7 | 2 | (159 | ) | — | (281 | ) | 473 | (32 | ) | 775 | 60 | |||||||||||||||||||
Other assets (6, 7) | 2,986 | 93 | (31 | ) | 2 | (74 | ) | 207 | (573 | ) | 64 | — | 2,674 | (181 | ) | ||||||||||||||||||
Federal funds purchased and securities loaned or sold under agreements to repurchase (5) | (359 | ) | (5 | ) | — | — | — | (12 | ) | 171 | (58 | ) | 263 | — | (5 | ) | |||||||||||||||||
| Trading account liabilities – Corporate securities and other | (27 | ) | 13 | — | 4 | (13 | ) | (2 | ) | — | — | — | (25 | ) | (1 | ) | |||||||||||||||||
Accrued expenses and other liabilities (5) | (9 | ) | — | — | — | — | — | — | — | — | (9 | ) | — | ||||||||||||||||||||
Long-term debt (5) | (1,514 | ) | (160 | ) | (18 | ) | 81 | — | (279 | ) | 398 | (530 | ) | 132 | (1,890 | ) | (158 | ) | |||||||||||||||
| Quantitative Information about Level 3 Fair Value Measurements at September 30, 2018 | ||||||||||||||
| Quantitative Information about Level 3 Fair Value Measurements at September 30, 2019 | Quantitative Information about Level 3 Fair Value Measurements at September 30, 2019 | |||||||||||||
| (Dollars in millions) | Inputs | Inputs | ||||||||||||
| Financial Instrument | Fair Value | Valuation Technique | Significant Unobservable Inputs | Ranges of Inputs | Weighted Average | Fair Value | Valuation Technique | Significant Unobservable Inputs | Ranges of Inputs | Weighted Average (1) | ||||
Loans and Securities | ||||||||||||||
| Instruments backed by residential real estate assets | $ | 1,615 | Discounted cash flow, Market comparables | Yield | 0% to 25% | 7% | $ | 1,515 | Discounted cash flow, Market comparables | Yield | 0% to 25% | 6% | ||
| Trading account assets – Mortgage trading loans, ABS and other MBS | 353 | Prepayment speed | 0% to 19% CPR | 11% | 287 | Prepayment speed | 1% to 28% CPR | 18% CPR | ||||||
| Loans and leases | 410 | Default rate | 0% to 3% CDR | 1% | 401 | Default rate | 0% to 3% CDR | 1% CDR | ||||||
| Loans held-for-sale | 1 | Loss severity | 0% to 51% | 17% | 6 | Loss severity | 0% to 48% | 15% | ||||||
| AFS debt securities, primarily non-agency residential | 555 | Price | $0 to td41 | $75 | 513 | Price | $0 to $680 | $92 | ||||||
| Other debt securities carried at fair value - Non-agency residential | 296 | 308 | ||||||||||||
| Instruments backed by commercial real estate assets | $ | 361 | Discounted cash flow | Yield | 0% to 25% | 7% | $ | 183 | Discounted cash flow | Yield | 0% to 25% | 18% | ||
| Trading account assets – Corporate securities, trading loans and other | 272 | Price | $0 to td02 | $78 | 158 | Price | $0 to td00 | $60 | ||||||
| Trading account assets – Mortgage trading loans, ABS and other MBS | 89 | 23 | ||||||||||||
| Loans held-for-sale | 2 | |||||||||||||
| Commercial loans, debt securities and other | $ | 3,293 | Discounted cash flow, Market comparables | Yield | 1% to 46% | 14% | $ | 3,529 | Discounted cash flow, Market comparables | Yield | 1% to 15% | 6% | ||
| Trading account assets – Corporate securities, trading loans and other | 1,262 | Prepayment speed | 10% to 20% | 14% | 1,433 | Prepayment speed | 10% to 20% | 17% | ||||||
| Trading account assets – Non-U.S. sovereign debt | 469 | Default rate | 3% to 4% | 4% | 465 | Default rate | 3% to 4% | 4% | ||||||
| Trading account assets – Mortgage trading loans, ABS and other MBS | 1,037 | Loss severity | 35% to 40% | 38% | 1,253 | Loss severity | 35% to 40% | 37% | ||||||
| Loans held-for-sale | 525 | Price | $0 to td41 | $65 | 378 | Price | $0 to td58 | $70 | ||||||
| Other assets, primarily auction rate securities | $ | 950 | Discounted cash flow, Market comparables | Price | td0 to td00 | $96 | $ | 844 | Discounted cash flow, Market comparables | Price | td0 to td00 | $96 | ||
| MSRs | $ | 2,190 | Discounted cash flow | Weighted-average life, fixed rate (4) | 0 to 14 years | 6 years | $ | 1,556 | Discounted cash flow | Weighted-average life, fixed rate (5) | 0 to 14 years | 4 years | ||
Weighted-average life, variable rate (4) | 0 to 10 years | 3 years | Weighted-average life, variable rate (5) | 0 to 9 years | 3 years | |||||||||
| Option-adjusted spread, fixed rate | 9% to 14% | 10% | Option-adjusted spread, fixed rate | 9% to 14% | 9% | |||||||||
| Option-adjusted spread, variable rate | 9% to 15% | 12% | Option-adjusted spread, variable rate | 9% to 15% | 11% | |||||||||
| Structured liabilities | ||||||||||||||
| Long-term debt | $ | (923 | ) | Discounted cash flow, Market comparables, Industry standard derivative pricing (2) | Equity correlation | 9% to 100% | 61% | $ | (864 | ) | Discounted cash flow, Market comparables, Industry standard derivative pricing (3) | Equity correlation | 16% to 97% | 69% |
| Long-dated equity volatilities | 4% to 79% | 27% | Long-dated equity volatilities | 4% to 80% | 32% | |||||||||
| Yield | 7% to 46% | 18% | Price | $0 to td13 | $76 | |||||||||
| Price | $0 to td00 | $70 | ||||||||||||
| Net derivative assets | ||||||||||||||
| Credit derivatives | $ | (304 | ) | Discounted cash flow, Stochastic recovery correlation model | Yield | 2% to 12% | 4% | $ | (9 | ) | Discounted cash flow, Stochastic recovery correlation model | Yield | 5% | n/a |
| Upfront points | 0 points to 100 points | 69 points | Upfront points | 0 to 100 points | 69 points | |||||||||
| Credit correlation | 70% | n/a | Prepayment speed | 15% to 100% CPR | 32% CPR | |||||||||
| Prepayment speed | 15% to 20% CPR | 15% | Default rate | 1% to 4% CDR | 2% CDR | |||||||||
| Default rate | 1% to 4% CDR | 2% | Loss severity | 35% | n/a | |||||||||
| Loss severity | 35% | n/a | Price | $0 to td38 | $81 | |||||||||
| Price | $0 to td01 | $77 | ||||||||||||
| Equity derivatives | $ | (857 | ) | Industry standard derivative pricing (2) | Equity correlation | 9% to 100% | 61% | $ | (1,107 | ) | Industry standard derivative pricing (3) | Equity correlation | 16% to 97% | 69% |
| Long-dated equity volatilities | 4% to 79% | 27% | Long-dated equity volatilities | 4% to 80% | 32% | |||||||||
| Commodity derivatives | $ | 11 | Discounted cash flow, Industry standard derivative pricing (2) | Natural gas forward price | td/MMBtu to td1/MMBtu | $3/MMBtu | $ | 18 | Discounted cash flow, Industry standard derivative pricing (3) | Natural gas forward price | td/MMBtu to $7/MMBtu | $3/MMBtu | ||
| Correlation | 53% to 89% | 78% | Correlation | 30% to 69% | 68% | |||||||||
| Volatilities | 13% to 495% | 55% | Volatilities | 15% to 62% | 33% | |||||||||
| Interest rate derivatives | $ | 580 | Industry standard derivative pricing (3) | Correlation (IR/IR) | 15% to 80% | 53% | $ | (134 | ) | Industry standard derivative pricing (4) | Correlation (IR/IR) | 15% to 97% | 51% | |
| Correlation (FX/IR) | 0% to 46% | 1% | Correlation (FX/IR) | 0% to 46% | 3% | |||||||||
| Long-dated inflation rates | -20% to 38% | 2% | Long-dated inflation rates | -15% to 148% | 84% | |||||||||
| Long-dated inflation volatilities | 0% to 1% | 1% | Long-dated inflation volatilities | 0% to 1% | 1% | |||||||||
| Total net derivative assets | $ | (570 | ) | $ | (1,232 | ) | ||||||||
(1) | For loans and securities, structured liabilities and net derivative assets, the weighted average is calculated based upon the absolute fair value of the instruments. |
(2) | The categories are aggregated based upon product type which differs from financial statement classification. The following is a reconciliation to the line items in the table on page |
| Includes models such as Monte Carlo simulation and Black-Scholes. |
| Includes models such as Monte Carlo simulation, Black-Scholes and other methods that model the joint dynamics of interest, inflation and foreign exchange rates. |
| The weighted-average life is a product of changes in market rates of interest, prepayment rates and other model and cash flow assumptions. |
| Quantitative Information about Level 3 Fair Value Measurements at December 31, 2018 | |||||||
| (Dollars in millions) | Inputs | ||||||
| Financial Instrument | Fair Value | Valuation Technique | Significant Unobservable Inputs | Ranges of Inputs | Weighted Average (1) | ||
Loans and Securities (2) | |||||||
| Instruments backed by residential real estate assets | $ | 1,536 | Discounted cash flow, Market comparables | Yield | 0% to 25% | 8% | |
| Trading account assets – Mortgage trading loans, ABS and other MBS | 419 | Prepayment speed | 0% to 21% CPR | 12% CPR | |||
| Loans and leases | 338 | Default rate | 0% to 3% CDR | 1% CDR | |||
| Loans held-for-sale | 1 | Loss severity | 0% to 51% | 17% | |||
| AFS debt securities, primarily non-agency residential | 606 | Price | $0 to $128 | $72 | |||
| Other debt securities carried at fair value - Non-agency residential | 172 | ||||||
| Instruments backed by commercial real estate assets | $ | 291 | Discounted cash flow | Yield | 0% to 25% | 7% | |
| Trading account assets – Corporate securities, trading loans and other | 200 | Price | $0 to $100 | $79 | |||
| Trading account assets – Mortgage trading loans, ABS and other MBS | 91 | ||||||
| Commercial loans, debt securities and other | $ | 3,489 | Discounted cash flow, Market comparables | Yield | 1% to 18% | 13% | |
| Trading account assets – Corporate securities, trading loans and other | 1,358 | Prepayment speed | 10% to 20% | 15% | |||
| Trading account assets – Non-U.S. sovereign debt | 465 | Default rate | 3% to 4% | 4% | |||
| Trading account assets – Mortgage trading loans, ABS and other MBS | 1,125 | Loss severity | 35% to 40% | 38% | |||
| Loans held-for-sale | 541 | Price | $0 to $141 | $68 | |||
| Other assets, primarily auction rate securities | $ | 890 | Discounted cash flow, Market comparables | Price | $10 to $100 | $95 | |
| MSRs | $ | 2,042 | Discounted cash flow | Weighted-average life, fixed rate (5) | 0 to 14 years | 5 years | |
Weighted-average life, variable rate (5) | 0 to 10 years | 3 years | |||||
| Option-adjusted spread, fixed rate | 7% to 14% | 9% | |||||
| Option-adjusted spread, variable rate | 9% to 15% | 12% | |||||
| Structured liabilities | |||||||
| Long-term debt | $ | (817 | ) | Discounted cash flow, Market comparables, Industry standard derivative pricing (3) | Equity correlation | 11% to 100% | 67% |
| Long-dated equity volatilities | 4% to 84% | 32% | |||||
| Yield | 7% to 18% | 16% | |||||
| Price | $0 to $100 | $72 | |||||
| Net derivative assets | |||||||
| Credit derivatives | $ | (565 | ) | Discounted cash flow, Stochastic recovery correlation model | Yield | 0% to 5% | 4% |
| Upfront points | 0 points to 100 points | 70 points | |||||
| Credit correlation | 70% | n/a | |||||
| Prepayment speed | 15% to 20% CPR | 15% CPR | |||||
| Default rate | 1% to 4% CDR | 2% CDR | |||||
| Loss severity | 35% | n/a | |||||
| Price | $0 to $138 | $93 | |||||
| Equity derivatives | $ | (348 | ) | Industry standard derivative pricing (3) | Equity correlation | 11% to 100% | 67% |
| Long-dated equity volatilities | 4% to 84% | 32% | |||||
| Commodity derivatives | $ | 10 | Discounted cash flow, Industry standard derivative pricing (3) | Natural gas forward price | $1/MMBtu to $12/MMBtu | $3/MMBtu | |
| Correlation | 38% to 87% | 71% | |||||
| Volatilities | 15% to 132% | 38% | |||||
| Interest rate derivatives | $ | (32 | ) | Industry standard derivative pricing (4) | Correlation (IR/IR) | 15% to 70% | 61% |
| Correlation (FX/IR) | 0% to 46% | 1% | |||||
| Long-dated inflation rates | -20% to 38% | 2% | |||||
| Long-dated inflation volatilities | 0% to 1% | 1% | |||||
| Total net derivative assets | $ | (935 | ) | ||||
| Quantitative Information about Level 3 Fair Value Measurements at December 31, 2017 | |||||||
| (Dollars in millions) | Inputs | ||||||
| Financial Instrument | Fair Value | Valuation Technique | Significant Unobservable Inputs | Ranges of Inputs | Weighted Average | ||
Loans and Securities (1) | |||||||
| Instruments backed by residential real estate assets | $ | 871 | Discounted cash flow | Yield | 0% to 25% | 6% | |
| Trading account assets – Mortgage trading loans, ABS and other MBS | 298 | Prepayment speed | 0% to 22% CPR | 12% | |||
| Loans and leases | 570 | Default rate | 0% to 3% CDR | 1% | |||
| Loans held-for-sale | 3 | Loss severity | 0% to 53% | 17% | |||
| Instruments backed by commercial real estate assets | $ | 286 | Discounted cash flow | Yield | 0% to 25% | 9% | |
| Trading account assets – Corporate securities, trading loans and other | 244 | Price | $0 to $100 | $67 | |||
| Trading account assets – Mortgage trading loans, ABS and other MBS | 42 | ||||||
| Commercial loans, debt securities and other | $ | 4,023 | Discounted cash flow, Market comparables | Yield | 0% to 12% | 5% | |
| Trading account assets – Corporate securities, trading loans and other | 1,613 | Prepayment speed | 10% to 20% | 16% | |||
| Trading account assets – Non-U.S. sovereign debt | 556 | Default rate | 3% to 4% | 4% | |||
| Trading account assets – Mortgage trading loans, ABS and other MBS | 1,158 | Loss severity | 35% to 40% | 37% | |||
| AFS debt securities – Other taxable securities | 8 | Price | $0 to $145 | $63 | |||
| Loans and leases | 1 | ||||||
| Loans held-for-sale | 687 | ||||||
| Auction rate securities | $ | 977 | Discounted cash flow, Market comparables | Price | $10 to $100 | $94 | |
| Trading account assets – Corporate securities, trading loans and other | 7 | ||||||
| AFS debt securities – Other taxable securities | 501 | ||||||
| AFS debt securities – Tax-exempt securities | 469 | ||||||
| MSRs | $ | 2,302 | Discounted cash flow | Weighted-average life, fixed rate (4) | 0 to 14 years | 5 years | |
Weighted-average life, variable rate (4) | 0 to 10 years | 3 years | |||||
| Option-adjusted spread, fixed rate | 9% to 14% | 10% | |||||
| Option-adjusted spread, variable rate | 9% to 15% | 12% | |||||
| Structured liabilities | |||||||
| Long-term debt | $ | (1,863 | ) | Discounted cash flow, Market comparables, Industry standard derivative pricing (2) | Equity correlation | 15% to 100% | 63% |
| Long-dated equity volatilities | 4% to 84% | 22% | |||||
| Yield | 7.5% | n/a | |||||
| Price | $0 to $100 | $66 | |||||
| Net derivative assets | |||||||
| Credit derivatives | $ | (282 | ) | Discounted cash flow, Stochastic recovery correlation model | Yield | 1% to 5% | 3% |
| Upfront points | 0 points to 100 points | 71 points | |||||
| Credit correlation | 35% to 83% | 42% | |||||
| Prepayment speed | 15% to 20% CPR | 16% | |||||
| Default rate | 1% to 4% CDR | 2% | |||||
| Loss severity | 35% | n/a | |||||
| Price | $0 to $102 | $82 | |||||
| Equity derivatives | $ | (2,059 | ) | Industry standard derivative pricing (2) | Equity correlation | 15% to 100% | 63% |
| Long-dated equity volatilities | 4% to 84% | 22% | |||||
| Commodity derivatives | $ | (3 | ) | Discounted cash flow, Industry standard derivative pricing (2) | Natural gas forward price | $1/MMBtu to $5/MMBtu | $3/MMBtu |
| Correlation | 71% to 87% | 81% | |||||
| Volatilities | 26% to 132% | 57% | |||||
| Interest rate derivatives | $ | 630 | Industry standard derivative pricing (3) | Correlation (IR/IR) | 15% to 92% | 50% | |
| Correlation (FX/IR) | 0% to 46% | 1% | |||||
| Long-dated inflation rates | -14% to 38% | 4% | |||||
| Long-dated inflation volatilities | 0% to 1% | 1% | |||||
| Total net derivative assets | $ | (1,714 | ) | ||||
(1) | For loans and securities, structured liabilities and net derivative assets, the weighted average is calculated based upon the absolute fair value of the instruments. |
(2) | The categories are aggregated based upon product type which differs from financial statement classification. The following is a reconciliation to the line items in the table on page |
| Includes models such as Monte Carlo simulation and Black-Scholes. |
| Includes models such as Monte Carlo simulation, Black-Scholes and other methods that model the joint dynamics of interest, inflation and foreign exchange rates. |
| The weighted-average life is a product of changes in market rates of interest, prepayment rates and other model and cash flow assumptions. |
87Bank of America | ||
| Assets Measured at Fair Value on a Nonrecurring Basis | ||||||||||||||||||||||||||||||
| September 30, 2018 | Three Months Ended September 30, 2018 | Nine Months Ended September 30, 2018 | September 30, 2019 | Three Months Ended September 30, 2019 | Nine Months Ended September 30, 2019 | |||||||||||||||||||||||||
(Dollars in millions) | Level 2 | Level 3 | Gains (Losses) | Level 2 | Level 3 | Gains (Losses) | ||||||||||||||||||||||||
| Assets | ||||||||||||||||||||||||||||||
| Loans held-for-sale | $ | 45 | $ | 12 | $ | (2 | ) | $ | (2 | ) | $ | 5 | $ | 111 | $ | (7 | ) | $ | (18 | ) | ||||||||||
Loans and leases (1) | — | 492 | (63 | ) | (194 | ) | — | 232 | (21 | ) | (62 | ) | ||||||||||||||||||
Foreclosed properties (2, 3) | — | 87 | (8 | ) | (22 | ) | — | 19 | (7 | ) | (10 | ) | ||||||||||||||||||
| Other assets | 294 | 3 | (22 | ) | (58 | ) | 165 | 658 | (2,085 | ) | (2,104 | ) | ||||||||||||||||||
| September 30, 2017 | Three Months Ended September 30, 2017 | Nine Months Ended September 30, 2017 | September 30, 2018 | Three Months Ended September 30, 2018 | Nine Months Ended September 30, 2018 | |||||||||||||||||||||||||
| Assets | ||||||||||||||||||||||||||||||
| Loans held-for-sale | $ | 70 | $ | 16 | $ | — | $ | (4 | ) | $ | 45 | $ | 12 | $ | (2 | ) | $ | (2 | ) | |||||||||||
Loans and leases (1) | — | 813 | (152 | ) | (307 | ) | — | 492 | (63 | ) | (194 | ) | ||||||||||||||||||
Foreclosed properties (2, 3) | — | 79 | (21 | ) | (35 | ) | — | 87 | (8 | ) | (22 | ) | ||||||||||||||||||
| Other assets | 353 | — | (1 | ) | (121 | ) | 294 | 3 | (22 | ) | (58 | ) | ||||||||||||||||||
(1) | Includes $ |
(2) | Amounts are included in other assets on the Consolidated Balance Sheet and represent the carrying value of foreclosed properties that were written down subsequent to their initial classification as foreclosed properties. Losses on foreclosed properties include losses recorded during the first 90 days after transfer of a loan to foreclosed properties. |
(3) | Excludes $275 million and $500 million |
| Quantitative Information about Nonrecurring Level 3 Fair Value Measurements | ||||||||
| Inputs | ||||||||
| Financial Instrument | Fair Value | Valuation Technique | Significant Unobservable Inputs | Ranges of Inputs | Weighted Average (1) | |||
| (Dollars in millions) | September 30, 2019 | |||||||
| Loans held-for-sale | $ | 111 | Discounted cash flow | Price | $77 to $100 | $86 | ||
Loans and leases (2) | 232 | Market comparables | OREO discount | 13% to 59% | 24 | % | ||
| Costs to sell | 8% to 26% | 9 | % | |||||
Other assets (3) | 652 | Discounted cash flow | Customer attrition | 0% to 19% | 5 | % | ||
| Costs to service | 11% to 19% | 15 | % | |||||
| December 31, 2018 | ||||||||
Loans and leases (2) | $ | 474 | Market comparables | OREO discount | 13% to 59% | 25 | % | |
| Costs to sell | 8% to 26% | 9 | % | |||||
(1) | The weighted average is calculated based upon the fair value of the loans. |
(2) | Represents residential mortgages where the loan has been written down to the fair value of the underlying collateral. |
(3) | The fair value of the merchant services joint venture was measured using a discounted cash flow method in which the two primary drivers of fair value were the customer attrition rate and certain costs to service the customers. The weighted averages are calculated based on variations of the attrition rates and costs to service the customers. |
| Quantitative Information about Nonrecurring Level 3 Fair Value Measurements | ||||||||||||
| Inputs | ||||||||||||
| Financial Instrument | Fair Value | Valuation Technique | Significant Unobservable Inputs | Ranges of Inputs | Weighted Average | |||||||
(Dollars in millions) | September 30, 2018 | |||||||||||
| Loans and leases backed by residential real estate assets | $ | 492 | Market comparables | OREO discount | 13% to 59% | 24 | % | |||||
| Costs to sell | 8% to 26% | 9 | % | |||||||||
| December 31, 2017 | ||||||||||||
| Loans and leases backed by residential real estate assets | $ | 894 | Market comparables | OREO discount | 15% to 58% | 23 | % | |||||
| Costs to sell | 5% to 49% | 7 | % | |||||||||
Bank of America 88 | ||
| Fair Value Option Elections | |||||||||||||||||||||||
| September 30, 2019 | December 31, 2018 | ||||||||||||||||||||||
| (Dollars in millions) | Fair Value Carrying Amount | Contractual Principal Outstanding | Fair Value Carrying Amount Less Unpaid Principal | Fair Value Carrying Amount | Contractual Principal Outstanding | Fair Value Carrying Amount Less Unpaid Principal | |||||||||||||||||
| Federal funds sold and securities borrowed or purchased under agreements to resell | $ | 50,298 | $ | 50,238 | $ | 60 | $ | 56,399 | $ | 56,376 | $ | 23 | |||||||||||
Loans reported as trading account assets (1) | 5,362 | 12,390 | (7,028 | ) | 6,195 | 13,088 | (6,893 | ) | |||||||||||||||
| Trading inventory – other | 17,989 | n/a | n/a | 13,778 | n/a | n/a | |||||||||||||||||
| Consumer and commercial loans | 7,674 | 7,738 | (64 | ) | 4,349 | 4,399 | (50 | ) | |||||||||||||||
Loans held-for-sale (1) | 5,011 | 6,119 | (1,108 | ) | 2,942 | 4,749 | (1,807 | ) | |||||||||||||||
| Other assets | 1 | n/a | n/a | 3 | n/a | n/a | |||||||||||||||||
| Long-term deposits | 626 | 599 | 27 | 492 | 454 | 38 | |||||||||||||||||
| Federal funds purchased and securities loaned or sold under agreements to repurchase | 21,963 | 21,966 | (3 | ) | 28,875 | 28,881 | (6 | ) | |||||||||||||||
| Short-term borrowings | 3,458 | 3,458 | — | 1,648 | 1,648 | — | |||||||||||||||||
| Unfunded loan commitments | 116 | n/a | n/a | 169 | n/a | n/a | |||||||||||||||||
Long-term debt (2) | 36,773 | 36,626 | 147 | 27,689 | 29,198 | (1,509 | ) | ||||||||||||||||
| Fair Value Option Elections | |||||||||||||||||||||||
| September 30, 2018 | December 31, 2017 | ||||||||||||||||||||||
| (Dollars in millions) | Fair Value Carrying Amount | Contractual Principal Outstanding | Fair Value Carrying Amount Less Unpaid Principal | Fair Value Carrying Amount | Contractual Principal Outstanding | Fair Value Carrying Amount Less Unpaid Principal | |||||||||||||||||
| Federal funds sold and securities borrowed or purchased under agreements to resell | $ | 52,524 | $ | 52,498 | $ | 26 | $ | 52,906 | $ | 52,907 | $ | (1 | ) | ||||||||||
Loans reported as trading account assets (1) | 5,538 | 12,414 | (6,876 | ) | 5,735 | 11,804 | (6,069 | ) | |||||||||||||||
| Trading inventory – other | 15,676 | n/a | n/a | 12,027 | n/a | n/a | |||||||||||||||||
| Consumer and commercial loans | 5,731 | 5,776 | (45 | ) | 5,710 | 5,744 | (34 | ) | |||||||||||||||
Loans held-for-sale (1) | 3,116 | 4,375 | (1,259 | ) | 2,156 | 3,717 | (1,561 | ) | |||||||||||||||
| Other assets | 3 | n/a | n/a | 3 | n/a | n/a | |||||||||||||||||
| Long-term deposits | 529 | 496 | 33 | 449 | 421 | 28 | |||||||||||||||||
| Federal funds purchased and securities loaned or sold under agreements to repurchase | 34,242 | 34,252 | (10 | ) | 36,182 | 36,187 | (5 | ) | |||||||||||||||
| Short-term borrowings | 1,789 | 1,789 | — | 1,494 | 1,494 | — | |||||||||||||||||
| Unfunded loan commitments | 70 | n/a | n/a | 120 | n/a | n/a | |||||||||||||||||
Long-term debt (2) | 28,677 | 29,265 | (588 | ) | 31,786 | 31,512 | 274 | ||||||||||||||||
(1) | A significant portion of the loans reported as trading account assets and |
(2) | Includes structured liabilities with a fair value of $ |
| Gains (Losses) Relating to Assets and Liabilities Accounted for Under the Fair Value Option | |||||||||||||||||||||||
| Three Months Ended September 30 | |||||||||||||||||||||||
| 2019 | 2018 | ||||||||||||||||||||||
| (Dollars in millions) | Trading Account Income | Other Income | Total | Trading Account Income | Other Income | Total | |||||||||||||||||
Loans reported as trading account assets (1) | $ | 4 | $ | — | $ | 4 | $ | 74 | $ | — | $ | 74 | |||||||||||
Trading inventory – other (2) | (156 | ) | — | (156 | ) | 1,693 | — | 1,693 | |||||||||||||||
Consumer and commercial loans (1) | 81 | (6 | ) | 75 | 176 | 8 | 184 | ||||||||||||||||
Loans held-for-sale (1) | — | 28 | 28 | — | 8 | 8 | |||||||||||||||||
Long-term debt (3, 4) | (127 | ) | (20 | ) | (147 | ) | 143 | (19 | ) | 124 | |||||||||||||
Other (5) | (1 | ) | (1 | ) | (2 | ) | 2 | 52 | 54 | ||||||||||||||
| Total | $ | (199 | ) | $ | 1 | $ | (198 | ) | $ | 2,088 | $ | 49 | $ | 2,137 | |||||||||
| Nine Months Ended September 30 | |||||||||||||||||||||||
| 2019 | 2018 | ||||||||||||||||||||||
Loans reported as trading account assets (1) | $ | 167 | $ | — | $ | 167 | $ | 145 | $ | — | $ | 145 | |||||||||||
Trading inventory – other (2) | 4,211 | — | 4,211 | 3,649 | — | 3,649 | |||||||||||||||||
Consumer and commercial loans (1) | 98 | 11 | 109 | 301 | (24 | ) | 277 | ||||||||||||||||
Loans held-for-sale (1) | — | 110 | 110 | 1 | 12 | 13 | |||||||||||||||||
Long-term debt (3, 4) | (1,412 | ) | (65 | ) | (1,477 | ) | 1,497 | (75 | ) | 1,422 | |||||||||||||
Other (5) | 8 | 20 | 28 | 15 | 75 | 90 | |||||||||||||||||
| Total | $ | 3,072 | $ | 76 | $ | 3,148 | $ | 5,608 | $ | (12 | ) | $ | 5,596 | ||||||||||
| Gains (Losses) Relating to Assets and Liabilities Accounted for Under the Fair Value Option | |||||||||||||||||||||||
| Trading Account Profits | Other Income | Total | Trading Account Profits | Other Income | Total | ||||||||||||||||||
| Three Months Ended September 30 | |||||||||||||||||||||||
| (Dollars in millions) | 2018 | 2017 | |||||||||||||||||||||
| Loans reported as trading account assets | $ | 74 | $ | — | $ | 74 | $ | 75 | $ | — | $ | 75 | |||||||||||
Trading inventory – other (1) | 1,693 | — | 1,693 | 1,217 | — | 1,217 | |||||||||||||||||
| Consumer and commercial loans | 176 | 8 | 184 | 10 | (4 | ) | 6 | ||||||||||||||||
Loans held-for-sale (2) | — | 8 | 8 | — | 92 | 92 | |||||||||||||||||
Long-term debt (3, 4) | 143 | (19 | ) | 124 | (416 | ) | (38 | ) | (454 | ) | |||||||||||||
Other (5) | 2 | 52 | 54 | (7 | ) | 22 | 15 | ||||||||||||||||
| Total | $ | 2,088 | $ | 49 | $ | 2,137 | $ | 879 | $ | 72 | $ | 951 | |||||||||||
| Nine Months Ended September 30 | |||||||||||||||||||||||
| 2018 | 2017 | ||||||||||||||||||||||
| Loans reported as trading account assets | $ | 145 | $ | — | $ | 145 | $ | 272 | $ | — | $ | 272 | |||||||||||
Trading inventory – other (1) | 3,649 | — | 3,649 | 2,890 | — | 2,890 | |||||||||||||||||
| Consumer and commercial loans | 301 | (24 | ) | 277 | 19 | 35 | 54 | ||||||||||||||||
Loans held-for-sale (2) | 1 | 12 | 13 | — | 275 | 275 | |||||||||||||||||
Long-term debt (3, 4) | 1,497 | (75 | ) | 1,422 | (471 | ) | (109 | ) | (580 | ) | |||||||||||||
Other (5) | 15 | 75 | 90 | (60 | ) | 64 | 4 | ||||||||||||||||
| Total | $ | 5,608 | $ | (12 | ) | $ | 5,596 | $ | 2,650 | $ | 265 | $ | 2,915 | ||||||||||
(1) | Gains (losses) related to borrower-specific credit risk were not significant. |
(2) | The gains (losses) in trading account |
(3) | The |
(4) | For the cumulative impact of changes in the Corporation’s own credit spreads and the amount recognized in accumulated OCI, see Note |
(5) | Includes gains (losses) on federal funds sold and securities borrowed or purchased under agreements to resell, long-term deposits, federal funds purchased and securities loaned or sold under agreements to repurchase, short-term borrowings and unfunded loan commitments. |
| Gains (Losses) Related to Borrower-specific Credit Risk for Assets Accounted for Under the Fair Value Option | |||||||||||||||
| Three Months Ended September 30 | Nine Months Ended September 30 | ||||||||||||||
| (Dollars in millions) | 2018 | 2017 | 2018 | 2017 | |||||||||||
| Loans reported as trading account assets | $ | 36 | $ | 5 | $ | 47 | $ | 25 | |||||||
| Consumer and commercial loans | 8 | (10 | ) | (19 | ) | 31 | |||||||||
| Loans held-for-sale | 5 | (2 | ) | 6 | (3 | ) | |||||||||
89Bank of America | ||
| Fair Value of Financial Instruments | |||||||||||||||
| Fair Value | |||||||||||||||
| Carrying Value | Level 2 | Level 3 | Total | ||||||||||||
| (Dollars in millions) | September 30, 2019 | ||||||||||||||
| Financial assets | |||||||||||||||
| Loans | $ | 939,548 | $ | 63,448 | $ | 904,921 | $ | 968,369 | |||||||
| Loans held-for-sale | 9,811 | 9,028 | 783 | 9,811 | |||||||||||
| Financial liabilities | |||||||||||||||
Deposits (1) | 1,392,836 | 1,392,934 | — | 1,392,934 | |||||||||||
| Long-term debt | 243,405 | 246,781 | 864 | 247,645 | |||||||||||
Commercial unfunded lending commitments (2) | 925 | 116 | 4,752 | 4,868 | |||||||||||
| December 31, 2018 | |||||||||||||||
| Financial assets | |||||||||||||||
| Loans | $ | 911,520 | $ | 58,228 | $ | 859,160 | $ | 917,388 | |||||||
| Loans held-for-sale | 10,367 | 9,592 | 775 | 10,367 | |||||||||||
| Financial liabilities | |||||||||||||||
Deposits (1) | 1,381,476 | 1,381,239 | — | 1,381,239 | |||||||||||
| Long-term debt | 229,392 | 230,019 | 817 | 230,836 | |||||||||||
Commercial unfunded lending commitments (2) | 966 | 169 | 5,558 | 5,727 | |||||||||||
| Fair Value of Financial Instruments | |||||||||||||||
| Fair Value | |||||||||||||||
| Carrying Value | Level 2 | Level 3 | Total | ||||||||||||
| (Dollars in millions) | September 30, 2018 | ||||||||||||||
| Financial assets | |||||||||||||||
| Loans | $ | 895,452 | $ | 59,840 | $ | 839,262 | $ | 899,102 | |||||||
| Loans held-for-sale | 5,576 | 4,287 | 1,331 | 5,618 | |||||||||||
| Financial liabilities | |||||||||||||||
Deposits (1) | 1,345,649 | 1,345,360 | — | 1,345,360 | |||||||||||
| Long-term debt | 234,100 | 238,908 | 923 | 239,831 | |||||||||||
Commercial unfunded lending commitments (2) | 862 | 70 | 4,345 | 4,415 | |||||||||||
| December 31, 2017 | |||||||||||||||
| Financial assets | |||||||||||||||
| Loans | $ | 904,399 | $ | 68,586 | $ | 849,576 | $ | 918,162 | |||||||
| Loans held-for-sale | 11,430 | 10,521 | 909 | 11,430 | |||||||||||
| Financial liabilities | |||||||||||||||
Deposits (1) | 1,309,545 | 1,309,398 | — | 1,309,398 | |||||||||||
| Long-term debt | 227,402 | 235,126 | 1,863 | 236,989 | |||||||||||
Commercial unfunded lending commitments (2) | 897 | 120 | 3,908 | 4,028 | |||||||||||
(1) | Includes demand deposits of |
(2) | The carrying value of commercial unfunded lending commitments is included in accrued expenses and other liabilities on the Consolidated Balance Sheet. The Corporation does not estimate the fair value of consumer unfunded lending commitments because, in many instances, the Corporation can reduce or cancel these commitments by providing notice to the borrower. For more information on commitments, see Note |
| Results of Business Segments and All Other | |||||||||||||||||||||||||||||||||||||||||||||||
| At and for the three months ended September 30 | Total Corporation (1) | Consumer Banking | Global Wealth & Investment Management | Total Corporation (1) | Consumer Banking | Global Wealth & Investment Management | |||||||||||||||||||||||||||||||||||||||||
| (Dollars in millions) | 2018 | 2017 | 2018 | 2017 | 2018 | 2017 | 2019 | 2018 | 2019 | 2018 | 2019 | 2018 | |||||||||||||||||||||||||||||||||||
| Net interest income (FTE basis) | $ | 12,021 | $ | 11,401 | $ | 6,863 | $ | 6,212 | $ | 1,536 | $ | 1,496 | |||||||||||||||||||||||||||||||||||
| Net interest income | $ | 12,335 | $ | 12,212 | $ | 7,031 | $ | 6,844 | $ | 1,609 | $ | 1,531 | |||||||||||||||||||||||||||||||||||
| Noninterest income | 10,907 | 10,678 | 2,540 | 2,562 | 3,247 | 3,124 | 10,620 | 10,663 | 2,693 | 2,598 | 3,295 | 3,286 | |||||||||||||||||||||||||||||||||||
| Total revenue, net of interest expense (FTE basis) | 22,928 | 22,079 | 9,403 | 8,774 | 4,783 | 4,620 | |||||||||||||||||||||||||||||||||||||||||
| Total revenue, net of interest expense | 22,955 | 22,875 | 9,724 | 9,442 | 4,904 | 4,817 | |||||||||||||||||||||||||||||||||||||||||
| Provision for credit losses | 716 | 834 | 870 | 967 | 13 | 16 | 779 | 716 | 917 | 870 | 37 | 13 | |||||||||||||||||||||||||||||||||||
| Noninterest expense | 13,067 | 13,394 | 4,355 | 4,461 | 3,414 | 3,369 | 15,169 | 13,014 | 4,393 | 4,325 | 3,413 | 3,443 | |||||||||||||||||||||||||||||||||||
| Income before income taxes (FTE basis) | 9,145 | 7,851 | 4,178 | 3,346 | 1,356 | 1,235 | |||||||||||||||||||||||||||||||||||||||||
| Income tax expense (FTE basis) | 1,978 | 2,427 | 1,065 | 1,260 | 346 | 465 | |||||||||||||||||||||||||||||||||||||||||
| Income before income taxes | 7,007 | 9,145 | 4,414 | 4,247 | 1,454 | 1,361 | |||||||||||||||||||||||||||||||||||||||||
| Income tax expense | 1,230 | 1,978 | 1,081 | 1,082 | 356 | 347 | |||||||||||||||||||||||||||||||||||||||||
| Net income | $ | 7,167 | $ | 5,424 | $ | 3,113 | $ | 2,086 | $ | 1,010 | $ | 770 | $ | 5,777 | $ | 7,167 | $ | 3,333 | $ | 3,165 | $ | 1,098 | $ | 1,014 | |||||||||||||||||||||||
| Period-end total assets | $ | 2,338,833 | $ | 2,284,174 | $ | 765,497 | $ | 742,513 | $ | 276,146 | $ | 276,187 | $ | 2,426,330 | $ | 2,338,833 | $ | 788,743 | $ | 765,498 | $ | 288,317 | $ | 276,146 | |||||||||||||||||||||||
| Global Banking | Global Markets | All Other | Global Banking | Global Markets | All Other | ||||||||||||||||||||||||||||||||||||||||||
| 2018 | 2017 | 2018 | 2017 | 2018 | 2017 | 2019 | 2018 | 2019 | 2018 | 2019 | 2018 | ||||||||||||||||||||||||||||||||||||
| Net interest income (FTE basis) | $ | 2,706 | $ | 2,642 | $ | 754 | $ | 899 | $ | 162 | $ | 152 | |||||||||||||||||||||||||||||||||||
| Noninterest income (loss) | 2,032 | 2,345 | 3,089 | 3,002 | (1 | ) | (355 | ) | |||||||||||||||||||||||||||||||||||||||
| Total revenue, net of interest expense (FTE basis) | 4,738 | 4,987 | 3,843 | 3,901 | 161 | (203 | ) | ||||||||||||||||||||||||||||||||||||||||
| Net interest income | $ | 2,617 | $ | 2,726 | $ | 1,016 | $ | 933 | $ | 62 | $ | 178 | |||||||||||||||||||||||||||||||||||
| Noninterest income | 2,595 | 2,097 | 2,848 | 2,940 | (811 | ) | (258 | ) | |||||||||||||||||||||||||||||||||||||||
| Total revenue, net of interest expense | 5,212 | 4,823 | 3,864 | 3,873 | (749 | ) | (80 | ) | |||||||||||||||||||||||||||||||||||||||
| Provision for credit losses | (70 | ) | 48 | (2 | ) | (6 | ) | (95 | ) | (191 | ) | 120 | (70 | ) | — | (2 | ) | (295 | ) | (95 | ) | ||||||||||||||||||||||||||
| Noninterest expense | 2,120 | 2,119 | 2,612 | 2,711 | 566 | 734 | 2,220 | 2,142 | 2,679 | 2,633 | 2,464 | 471 | |||||||||||||||||||||||||||||||||||
| Income (loss) before income taxes (FTE basis) | 2,688 | 2,820 | 1,233 | 1,196 | (310 | ) | (746 | ) | |||||||||||||||||||||||||||||||||||||||
| Income tax expense (benefit) (FTE basis) | 699 | 1,062 | 321 | 440 | (453 | ) | (800 | ) | |||||||||||||||||||||||||||||||||||||||
| Income before income taxes | 2,872 | 2,751 | 1,185 | 1,242 | (2,918 | ) | (456 | ) | |||||||||||||||||||||||||||||||||||||||
| Income tax expense | 775 | 714 | 338 | 323 | (1,320 | ) | (488 | ) | |||||||||||||||||||||||||||||||||||||||
| Net income | $ | 1,989 | $ | 1,758 | $ | 912 | $ | 756 | $ | 143 | $ | 54 | $ | 2,097 | $ | 2,037 | $ | 847 | $ | 919 | $ | (1,598 | ) | $ | 32 | ||||||||||||||||||||||
| Period-end total assets | $ | 430,846 | $ | 423,185 | $ | 646,359 | $ | 629,222 | $ | 219,985 | $ | 213,067 | $ | 452,642 | $ | 430,846 | $ | 689,023 | $ | 646,359 | $ | 207,605 | $ | 219,984 | |||||||||||||||||||||||
(1) | There were no material intersegment revenues. |
| Results of Business Segments and All Other | |||||||||||||||||||||||||||||||||||||||||||||||
| At and for the nine months ended September 30 | Total Corporation (1) | Consumer Banking | Global Wealth & Investment Management | Total Corporation (1) | Consumer Banking | Global Wealth & Investment Management | |||||||||||||||||||||||||||||||||||||||||
| (Dollars in millions) | 2018 | 2017 | 2018 | 2017 | 2018 | 2017 | 2019 | 2018 | 2019 | 2018 | 2019 | 2018 | |||||||||||||||||||||||||||||||||||
| Net interest income (FTE basis) | $ | 35,583 | $ | 33,879 | $ | 19,993 | $ | 17,953 | $ | 4,673 | $ | 4,653 | |||||||||||||||||||||||||||||||||||
| Net interest income | $ | 37,201 | $ | 36,113 | $ | 21,253 | $ | 19,914 | $ | 4,917 | $ | 4,653 | |||||||||||||||||||||||||||||||||||
| Noninterest income | 33,383 | 33,711 | 7,653 | 7,614 | 9,675 | 9,254 | 32,144 | 32,685 | 7,820 | 7,742 | 9,707 | 9,761 | |||||||||||||||||||||||||||||||||||
| Total revenue, net of interest expense (FTE basis) | 68,966 | 67,590 | 27,646 | 25,567 | 14,348 | 13,907 | |||||||||||||||||||||||||||||||||||||||||
| Total revenue, net of interest expense | 69,345 | 68,798 | 29,073 | 27,656 | 14,624 | 14,414 | |||||||||||||||||||||||||||||||||||||||||
| Provision for credit losses | 2,377 | 2,395 | 2,749 | 2,639 | 63 | 50 | 2,649 | 2,377 | 2,838 | 2,749 | 63 | 63 | |||||||||||||||||||||||||||||||||||
| Noninterest expense | 40,248 | 41,469 | 13,231 | 13,286 | 10,235 | 10,085 | 41,661 | 40,080 | 13,157 | 13,241 | 10,300 | 10,451 | |||||||||||||||||||||||||||||||||||
| Income before income taxes (FTE basis) | 26,341 | 23,726 | 11,666 | 9,642 | 4,050 | 3,772 | |||||||||||||||||||||||||||||||||||||||||
| Income tax expense (FTE basis) | 5,472 | 7,859 | 2,975 | 3,636 | 1,033 | 1,422 | |||||||||||||||||||||||||||||||||||||||||
| Income before income taxes | 25,035 | 26,341 | 13,078 | 11,666 | 4,261 | 3,900 | |||||||||||||||||||||||||||||||||||||||||
| Income tax expense | 4,599 | 5,472 | 3,204 | 2,975 | 1,044 | 994 | |||||||||||||||||||||||||||||||||||||||||
| Net income | $ | 20,869 | $ | 15,867 | $ | 8,691 | $ | 6,006 | $ | 3,017 | $ | 2,350 | $ | 20,436 | $ | 20,869 | $ | 9,874 | $ | 8,691 | $ | 3,217 | $ | 2,906 | |||||||||||||||||||||||
| Period-end total assets | $ | 2,338,833 | $ | 2,284,174 | $ | 765,497 | $ | 742,513 | $ | 276,146 | $ | 276,187 | $ | 2,426,330 | $ | 2,338,833 | $ | 788,743 | $ | 765,498 | $ | 288,317 | $ | 276,146 | |||||||||||||||||||||||
| Global Banking | Global Markets | All Other | Global Banking | Global Markets | All Other | ||||||||||||||||||||||||||||||||||||||||||
| 2018 | 2017 | 2018 | 2017 | 2018 | 2017 | 2019 | 2018 | 2019 | 2018 | 2019 | 2018 | ||||||||||||||||||||||||||||||||||||
| Net interest income (FTE basis) | $ | 8,057 | $ | 7,786 | $ | 2,425 | $ | 2,812 | $ | 435 | $ | 675 | |||||||||||||||||||||||||||||||||||
| Noninterest income (loss) | 6,537 | 7,194 | 10,425 | 9,743 | (907 | ) | (94 | ) | |||||||||||||||||||||||||||||||||||||||
| Total revenue, net of interest expense (FTE basis) | 14,594 | 14,980 | 12,850 | 12,555 | (472 | ) | 581 | ||||||||||||||||||||||||||||||||||||||||
| Net interest income | $ | 8,116 | $ | 8,144 | $ | 2,780 | $ | 2,922 | $ | 135 | $ | 480 | |||||||||||||||||||||||||||||||||||
| Noninterest income | 7,226 | 6,688 | 9,409 | 10,013 | (2,018 | ) | (1,519 | ) | |||||||||||||||||||||||||||||||||||||||
| Total revenue, net of interest expense | 15,342 | 14,832 | 12,189 | 12,935 | (1,883 | ) | (1,039 | ) | |||||||||||||||||||||||||||||||||||||||
| Provision for credit losses | (77 | ) | 80 | (6 | ) | 2 | (352 | ) | (376 | ) | 356 | (77 | ) | (18 | ) | (6 | ) | (590 | ) | (352 | ) | ||||||||||||||||||||||||||
| Noninterest expense | 6,471 | 6,435 | 8,145 | 8,117 | 2,166 | 3,546 | 6,697 | 6,618 | 8,109 | 8,283 | 3,398 | 1,487 | |||||||||||||||||||||||||||||||||||
| Income (loss) before income taxes (FTE basis) | 8,200 | 8,465 | 4,711 | 4,436 | (2,286 | ) | (2,589 | ) | |||||||||||||||||||||||||||||||||||||||
| Income tax expense (benefit) (FTE basis) | 2,132 | 3,192 | 1,225 | 1,553 | (1,893 | ) | (1,944 | ) | |||||||||||||||||||||||||||||||||||||||
| Net income (loss) | $ | 6,068 | $ | 5,273 | $ | 3,486 | $ | 2,883 | $ | (393 | ) | $ | (645 | ) | |||||||||||||||||||||||||||||||||
| Income before income taxes | 8,289 | 8,291 | 4,098 | 4,658 | (4,691 | ) | (2,174 | ) | |||||||||||||||||||||||||||||||||||||||
| Income tax expense | 2,238 | 2,154 | 1,168 | 1,211 | (3,055 | ) | (1,862 | ) | |||||||||||||||||||||||||||||||||||||||
| Net income | $ | 6,051 | $ | 6,137 | $ | 2,930 | $ | 3,447 | $ | (1,636 | ) | $ | (312 | ) | |||||||||||||||||||||||||||||||||
| Period-end total assets | $ | 430,846 | $ | 423,185 | $ | 646,359 | $ | 629,222 | $ | 219,985 | $ | 213,067 | $ | 452,642 | $ | 430,846 | $ | 689,023 | $ | 646,359 | $ | 207,605 | $ | 219,984 | |||||||||||||||||||||||
(1) | There were no material intersegment revenues. |
| Business Segment Reconciliations | ||||||||||||||||||||||||||||||
| Three Months Ended September 30 | Nine Months Ended September 30 | Three Months Ended September 30 | Nine Months Ended September 30 | |||||||||||||||||||||||||||
| (Dollars in millions) | 2018 | 2017 | 2018 | 2017 | 2019 | 2018 | 2019 | 2018 | ||||||||||||||||||||||
| Segments’ total revenue, net of interest expense (FTE basis) | $ | 22,767 | $ | 22,282 | $ | 69,438 | $ | 67,009 | ||||||||||||||||||||||
| Segments’ total revenue, net of interest expense | $ | 23,704 | $ | 22,955 | $ | 71,228 | $ | 69,837 | ||||||||||||||||||||||
Adjustments (1): | ||||||||||||||||||||||||||||||
| ALM activities | 273 | 273 | 118 | 332 | (221 | ) | 32 | (175 | ) | (450 | ) | |||||||||||||||||||
| Liquidating businesses, eliminations and other | (112 | ) | (476 | ) | (590 | ) | 249 | (528 | ) | (112 | ) | (1,708 | ) | (589 | ) | |||||||||||||||
| FTE basis adjustment | (151 | ) | (240 | ) | (455 | ) | (674 | ) | (148 | ) | (151 | ) | (450 | ) | (455 | ) | ||||||||||||||
| Consolidated revenue, net of interest expense | $ | 22,777 | $ | 21,839 | $ | 68,511 | $ | 66,916 | $ | 22,807 | $ | 22,724 | $ | 68,895 | $ | 68,343 | ||||||||||||||
| Segments’ total net income | 7,024 | 5,370 | 21,262 | 16,512 | 7,375 | 7,135 | 22,072 | 21,181 | ||||||||||||||||||||||
Adjustments, net-of-taxes (1): | ||||||||||||||||||||||||||||||
Adjustments, net-of-tax (1): | ||||||||||||||||||||||||||||||
| ALM activities | 88 | 57 | (294 | ) | (208 | ) | (158 | ) | 29 | (112 | ) | (323 | ) | |||||||||||||||||
| Liquidating businesses, eliminations and other | 55 | (3 | ) | (99 | ) | (437 | ) | (1,440 | ) | 3 | (1,524 | ) | 11 | |||||||||||||||||
| Consolidated net income | $ | 7,167 | $ | 5,424 | $ | 20,869 | $ | 15,867 | $ | 5,777 | $ | 7,167 | $ | 20,436 | $ | 20,869 | ||||||||||||||
| September 30 | September 30 | |||||||||||||||||||||||||||||
| 2018 | 2017 | 2019 | 2018 | |||||||||||||||||||||||||||
| Segments’ total assets | $ | 2,118,848 | $ | 2,071,107 | $ | 2,218,725 | $ | 2,118,849 | ||||||||||||||||||||||
Adjustments (1): | ||||||||||||||||||||||||||||||
| ALM activities, including securities portfolio | 675,886 | 635,353 | 686,301 | 674,426 | ||||||||||||||||||||||||||
| Elimination of segment asset allocations to match liabilities | (531,297 | ) | (515,007 | ) | (546,529 | ) | (529,830 | ) | ||||||||||||||||||||||
| Other | 75,396 | 92,721 | 67,833 | 75,388 | ||||||||||||||||||||||||||
| Consolidated total assets | $ | 2,338,833 | $ | 2,284,174 | $ | 2,426,330 | $ | 2,338,833 | ||||||||||||||||||||||
(1) | Adjustments include consolidated income, expense and asset amounts not specifically allocated to individual business segments. |
91Bank of America | ||
| Noninterest Income by Business Segment and All Other | Noninterest Income by Business Segment and All Other | Noninterest Income by Business Segment and All Other | ||||||||||||||||||||||||||||||||||||||||||||
| Total Corporation | Consumer Banking | Global Wealth & Investment Management | Total Corporation | Consumer Banking | Global Wealth & Investment Management | |||||||||||||||||||||||||||||||||||||||||
| Three Months Ended September 30 | Three Months Ended September 30 | |||||||||||||||||||||||||||||||||||||||||||||
| (Dollars in millions) | 2018 | 2017 | 2018 | 2017 | 2018 | 2017 | 2019 | 2018 | 2019 | 2018 | 2019 | 2018 | ||||||||||||||||||||||||||||||||||
| Fees and commissions: | ||||||||||||||||||||||||||||||||||||||||||||||
| Card income | ||||||||||||||||||||||||||||||||||||||||||||||
| Interchange fees | $ | 978 | $ | 941 | $ | 802 | $ | 768 | $ | 22 | $ | 29 | $ | 963 | $ | 925 | $ | 802 | $ | 757 | $ | 15 | $ | 23 | ||||||||||||||||||||||
| Other card income | 492 | 488 | 479 | 475 | 11 | 11 | 502 | 492 | 487 | 480 | 11 | 11 | ||||||||||||||||||||||||||||||||||
| Total card income | 1,470 | 1,429 | 1,281 | 1,243 | 33 | 40 | 1,465 | 1,417 | 1,289 | 1,237 | 26 | 34 | ||||||||||||||||||||||||||||||||||
| Service charges | ||||||||||||||||||||||||||||||||||||||||||||||
| Deposit-related fees | 1,682 | 1,691 | 1,098 | 1,082 | 19 | 19 | 1,690 | 1,682 | 1,097 | 1,098 | 16 | 19 | ||||||||||||||||||||||||||||||||||
| Lending-related fees | 279 | 277 | — | — | — | — | 285 | 279 | — | — | — | — | ||||||||||||||||||||||||||||||||||
| Total service charges | 1,961 | 1,968 | 1,098 | 1,082 | 19 | 19 | 1,975 | 1,961 | 1,097 | 1,098 | 16 | 19 | ||||||||||||||||||||||||||||||||||
| Investment and brokerage services | ||||||||||||||||||||||||||||||||||||||||||||||
| Asset management fees | 2,576 | 2,367 | 38 | 34 | 2,538 | 2,333 | 2,597 | 2,576 | 36 | 38 | 2,572 | 2,538 | ||||||||||||||||||||||||||||||||||
| Brokerage fees | 918 | 1,070 | 42 | 40 | 466 | 521 | 897 | 918 | 39 | 42 | 429 | 466 | ||||||||||||||||||||||||||||||||||
| Total investment and brokerage services | 3,494 | 3,437 | 80 | 74 | 3,004 | 2,854 | 3,494 | 3,494 | 75 | 80 | 3,001 | 3,004 | ||||||||||||||||||||||||||||||||||
| Investment banking income | ||||||||||||||||||||||||||||||||||||||||||||||
| Investment banking fees | ||||||||||||||||||||||||||||||||||||||||||||||
| Underwriting income | 701 | 698 | — | — | 87 | 100 | 740 | 701 | — | — | 88 | 86 | ||||||||||||||||||||||||||||||||||
| Syndication fees | 241 | 405 | — | — | — | — | 341 | 241 | — | — | — | — | ||||||||||||||||||||||||||||||||||
| Financial advisory services | 262 | 374 | — | — | 1 | — | 452 | 262 | — | — | 1 | 1 | ||||||||||||||||||||||||||||||||||
| Total investment banking income | 1,204 | 1,477 | — | — | 88 | 100 | ||||||||||||||||||||||||||||||||||||||||
| Trading account profits | 1,893 | 1,837 | 2 | 1 | 24 | 29 | ||||||||||||||||||||||||||||||||||||||||
| Total investment banking fees | 1,533 | 1,204 | — | — | 89 | 87 | ||||||||||||||||||||||||||||||||||||||||
| Total fees and commissions | 8,467 | 8,076 | 2,461 | 2,415 | 3,132 | 3,144 | ||||||||||||||||||||||||||||||||||||||||
| Trading account income | 1,707 | 1,717 | 1 | 2 | 26 | 24 | ||||||||||||||||||||||||||||||||||||||||
| Other income | 885 | 530 | 79 | 162 | 79 | 82 | 446 | 870 | 231 | 181 | 137 | 118 | ||||||||||||||||||||||||||||||||||
| Total noninterest income | $ | 10,907 | $ | 10,678 | $ | 2,540 | $ | 2,562 | $ | 3,247 | $ | 3,124 | $ | 10,620 | $ | 10,663 | $ | 2,693 | $ | 2,598 | $ | 3,295 | $ | 3,286 | ||||||||||||||||||||||
| Global Banking | Global Markets | All Other (1) | Global Banking | Global Markets | All Other (1) | |||||||||||||||||||||||||||||||||||||||||
| Three Months Ended September 30 | Three Months Ended September 30 | |||||||||||||||||||||||||||||||||||||||||||||
| 2018 | 2017 | 2018 | 2017 | 2018 | 2017 | 2019 | 2018 | 2019 | 2018 | 2019 | 2018 | |||||||||||||||||||||||||||||||||||
| Fees and commissions: | ||||||||||||||||||||||||||||||||||||||||||||||
| Card income | ||||||||||||||||||||||||||||||||||||||||||||||
| Interchange fees | $ | 130 | $ | 122 | $ | 24 | $ | 22 | $ | — | $ | — | $ | 129 | $ | 122 | $ | 19 | $ | 21 | $ | (2 | ) | $ | 2 | |||||||||||||||||||||
| Other card income | 2 | 2 | (1 | ) | — | 1 | — | 3 | 2 | — | — | 1 | (1 | ) | ||||||||||||||||||||||||||||||||
| Total card income | 132 | 124 | 23 | 22 | 1 | — | 132 | 124 | 19 | 21 | (1 | ) | 1 | |||||||||||||||||||||||||||||||||
| Service charges | ||||||||||||||||||||||||||||||||||||||||||||||
| Deposit-related fees | 520 | 546 | 41 | 38 | 4 | 6 | 533 | 520 | 37 | 41 | 7 | 4 | ||||||||||||||||||||||||||||||||||
| Lending-related fees | 234 | 230 | 45 | 47 | — | — | 230 | 233 | 55 | 45 | — | 1 | ||||||||||||||||||||||||||||||||||
| Total service charges | 754 | 776 | 86 | 85 | 4 | 6 | 763 | 753 | 92 | 86 | 7 | 5 | ||||||||||||||||||||||||||||||||||
| Investment and brokerage services | ||||||||||||||||||||||||||||||||||||||||||||||
| Asset management fees | — | — | — | — | — | — | — | — | — | — | (11 | ) | — | |||||||||||||||||||||||||||||||||
| Brokerage fees | 28 | 18 | 388 | 496 | (6 | ) | (5 | ) | 10 | 27 | 419 | 388 | — | (5 | ) | |||||||||||||||||||||||||||||||
| Total investment and brokerage services | 28 | 18 | 388 | 496 | (6 | ) | (5 | ) | 10 | 27 | 419 | 388 | (11 | ) | (5 | ) | ||||||||||||||||||||||||||||||
| Investment banking income | ||||||||||||||||||||||||||||||||||||||||||||||
| Investment banking fees | ||||||||||||||||||||||||||||||||||||||||||||||
| Underwriting income | 189 | 105 | 474 | 545 | (49 | ) | (52 | ) | 312 | 289 | 383 | 374 | (43 | ) | (48 | ) | ||||||||||||||||||||||||||||||
| Syndication fees | 217 | 380 | 25 | 26 | (1 | ) | (1 | ) | 163 | 118 | 178 | 124 | — | (1 | ) | |||||||||||||||||||||||||||||||
| Financial advisory services | 237 | 321 | 24 | 53 | — | — | 427 | 237 | 24 | 24 | — | — | ||||||||||||||||||||||||||||||||||
| Total investment banking income | 643 | 806 | 523 | 624 | (50 | ) | (53 | ) | ||||||||||||||||||||||||||||||||||||||
| Trading account profits | 59 | (5 | ) | 1,727 | 1,714 | 81 | 98 | |||||||||||||||||||||||||||||||||||||||
| Total investment banking fees | 902 | 644 | 585 | 522 | (43 | ) | (49 | ) | ||||||||||||||||||||||||||||||||||||||
| Total fees and commissions | 1,807 | 1,548 | 1,115 | 1,017 | (48 | ) | (48 | ) | ||||||||||||||||||||||||||||||||||||||
| Trading account income | 84 | 60 | 1,580 | 1,551 | 16 | 80 | ||||||||||||||||||||||||||||||||||||||||
| Other income | 416 | 626 | 342 | 61 | (31 | ) | (401 | ) | 704 | 489 | 153 | 372 | (779 | ) | (290 | ) | ||||||||||||||||||||||||||||||
| Total noninterest income | $ | 2,032 | $ | 2,345 | $ | 3,089 | $ | 3,002 | $ | (1 | ) | $ | (355 | ) | $ | 2,595 | $ | 2,097 | $ | 2,848 | $ | 2,940 | $ | (811 | ) | $ | (258 | ) | ||||||||||||||||||
(1) | All Other includes eliminations of intercompany transactions. |
| Noninterest Income by Business Segment and All Other | |||||||||||||||||||||||
| Total Corporation | Consumer Banking | Global Wealth & Investment Management | |||||||||||||||||||||
| Nine Months Ended September 30 | |||||||||||||||||||||||
| (Dollars in millions) | 2018 | 2017 | 2018 | 2017 | 2018 | 2017 | |||||||||||||||||
| Card income | |||||||||||||||||||||||
| Interchange fees | $ | 3,018 | $ | 2,883 | $ | 2,488 | $ | 2,352 | $ | 59 | $ | 79 | |||||||||||
| Other card income | 1,451 | 1,464 | 1,414 | 1,364 | 33 | 31 | |||||||||||||||||
| Total card income | 4,469 | 4,347 | 3,902 | 3,716 | 92 | 110 | |||||||||||||||||
| Service charges | |||||||||||||||||||||||
| Deposit-related fees | 5,009 | 5,040 | 3,214 | 3,194 | 55 | 57 | |||||||||||||||||
| Lending-related fees | 827 | 823 | — | — | — | — | |||||||||||||||||
| Total service charges | 5,836 | 5,863 | 3,214 | 3,194 | 55 | 57 | |||||||||||||||||
| Investment and brokerage services | |||||||||||||||||||||||
| Asset management fees | 7,652 | 6,855 | 111 | 98 | 7,541 | 6,757 | |||||||||||||||||
| Brokerage fees | 2,964 | 3,459 | 131 | 135 | 1,440 | 1,717 | |||||||||||||||||
| Total investment and brokerage services | 10,616 | 10,314 | 242 | 233 | 8,981 | 8,474 | |||||||||||||||||
| Investment banking income | |||||||||||||||||||||||
| Underwriting income | 2,160 | 2,185 | — | — | 243 | 246 | |||||||||||||||||
| Syndication fees | 958 | 1,146 | — | — | — | — | |||||||||||||||||
| Financial advisory services | 861 | 1,262 | — | — | 1 | 1 | |||||||||||||||||
| Total investment banking income | 3,979 | 4,593 | — | — | 244 | 247 | |||||||||||||||||
| Trading account profits | 6,907 | 6,124 | 6 | 2 | 81 | 120 | |||||||||||||||||
| Other income | 1,576 | 2,470 | 289 | 469 | 222 | 246 | |||||||||||||||||
| Total noninterest income | $ | 33,383 | $ | 33,711 | $ | 7,653 | $ | 7,614 | $ | 9,675 | $ | 9,254 | |||||||||||
| Global Banking | Global Markets | All Other (1) | |||||||||||||||||||||
| Nine Months Ended September 30 | |||||||||||||||||||||||
| 2018 | 2017 | 2018 | 2017 | 2018 | 2017 | ||||||||||||||||||
| Card income | |||||||||||||||||||||||
| Interchange fees | $ | 400 | $ | 375 | $ | 71 | $ | 68 | $ | — | $ | 9 | |||||||||||
| Other card income | 5 | 8 | (1 | ) | (1 | ) | — | 62 | |||||||||||||||
| Total card income | 405 | 383 | 70 | 67 | — | 71 | |||||||||||||||||
| Service charges | |||||||||||||||||||||||
| Deposit-related fees | 1,598 | 1,662 | 126 | 111 | 16 | 16 | |||||||||||||||||
| Lending-related fees | 687 | 689 | 140 | 134 | — | — | |||||||||||||||||
| Total service charges | 2,285 | 2,351 | 266 | 245 | 16 | 16 | |||||||||||||||||
| Investment and brokerage services | |||||||||||||||||||||||
| Asset management fees | — | — | — | — | — | — | |||||||||||||||||
| Brokerage fees | 71 | 72 | 1,306 | 1,548 | 16 | (13 | ) | ||||||||||||||||
| Total investment and brokerage services | 71 | 72 | 1,306 | 1,548 | 16 | (13 | ) | ||||||||||||||||
| Investment banking income | |||||||||||||||||||||||
| Underwriting income | 458 | 404 | 1,637 | 1,729 | (178 | ) | (194 | ) | |||||||||||||||
| Syndication fees | 890 | 1,080 | 68 | 66 | — | — | |||||||||||||||||
| Financial advisory services | 782 | 1,177 | 78 | 84 | — | — | |||||||||||||||||
| Total investment banking income | 2,130 | 2,661 | 1,783 | 1,879 | (178 | ) | (194 | ) | |||||||||||||||
| Trading account profits | 184 | 82 | 6,614 | 5,634 | 22 | 286 | |||||||||||||||||
| Other income | 1,462 | 1,645 | 386 | 370 | (783 | ) | (260 | ) | |||||||||||||||
| Total noninterest income | $ | 6,537 | $ | 7,194 | $ | 10,425 | $ | 9,743 | $ | (907 | ) | $ | (94 | ) | |||||||||
Bank of America | ||
| Noninterest Income by Business Segment and All Other | |||||||||||||||||||||||
| Total Corporation | Consumer Banking | Global Wealth & Investment Management | |||||||||||||||||||||
| Nine Months Ended September 30 | |||||||||||||||||||||||
| (Dollars in millions) | 2019 | 2018 | 2019 | 2018 | 2019 | 2018 | |||||||||||||||||
| Fees and commissions: | |||||||||||||||||||||||
| Card income | |||||||||||||||||||||||
| Interchange fees | $ | 2,827 | $ | 2,850 | $ | 2,334 | $ | 2,349 | $ | 43 | $ | 59 | |||||||||||
| Other card income | 1,459 | 1,452 | 1,420 | 1,414 | 30 | 33 | |||||||||||||||||
| Total card income | 4,286 | 4,302 | 3,754 | 3,763 | 73 | 92 | |||||||||||||||||
| Service charges | |||||||||||||||||||||||
| Deposit-related fees | 4,908 | 5,008 | 3,163 | 3,214 | 50 | 55 | |||||||||||||||||
| Lending-related fees | 809 | 828 | — | — | — | — | |||||||||||||||||
| Total service charges | 5,717 | 5,836 | 3,163 | 3,214 | 50 | 55 | |||||||||||||||||
| Investment and brokerage services | |||||||||||||||||||||||
| Asset management fees | 7,591 | 7,653 | 107 | 111 | 7,510 | 7,541 | |||||||||||||||||
| Brokerage fees | 2,733 | 2,963 | 116 | 131 | 1,295 | 1,440 | |||||||||||||||||
| Total investment and brokerage services | 10,324 | 10,616 | 223 | 242 | 8,805 | 8,981 | |||||||||||||||||
| Investment banking fees | |||||||||||||||||||||||
| Underwriting income | 2,198 | 2,160 | — | — | 295 | 243 | |||||||||||||||||
| Syndication fees | 887 | 958 | — | — | — | — | |||||||||||||||||
| Financial advisory services | 1,083 | 861 | — | — | 1 | 1 | |||||||||||||||||
| Total investment banking fees | 4,168 | 3,979 | — | — | 296 | 244 | |||||||||||||||||
| Total fees and commissions | 24,495 | 24,733 | 7,140 | 7,219 | 9,224 | 9,372 | |||||||||||||||||
| Trading account income | 6,390 | 6,421 | 5 | 6 | 90 | 81 | |||||||||||||||||
| Other income | 1,259 | 1,531 | 675 | 517 | 393 | 308 | |||||||||||||||||
| Total noninterest income | $ | 32,144 | $ | 32,685 | $ | 7,820 | $ | 7,742 | $ | 9,707 | $ | 9,761 | |||||||||||
| Global Banking | Global Markets | All Other (1) | |||||||||||||||||||||
| Nine Months Ended September 30 | |||||||||||||||||||||||
| 2019 | 2018 | 2019 | 2018 | 2019 | 2018 | ||||||||||||||||||
| Fees and commissions: | |||||||||||||||||||||||
| Card income | |||||||||||||||||||||||
| Interchange fees | $ | 390 | $ | 377 | $ | 61 | $ | 63 | $ | (1 | ) | $ | 2 | ||||||||||
| Other card income | 8 | 5 | — | — | 1 | — | |||||||||||||||||
| Total card income | 398 | 382 | 61 | 63 | — | 2 | |||||||||||||||||
| Service charges | |||||||||||||||||||||||
| Deposit-related fees | 1,557 | 1,598 | 120 | 126 | 18 | 15 | |||||||||||||||||
| Lending-related fees | 668 | 687 | 141 | 140 | — | 1 | |||||||||||||||||
| Total service charges | 2,225 | 2,285 | 261 | 266 | 18 | 16 | |||||||||||||||||
| Investment and brokerage services | |||||||||||||||||||||||
| Asset management fees | — | — | — | — | (26 | ) | 1 | ||||||||||||||||
| Brokerage fees | 26 | 71 | 1,296 | 1,306 | — | 15 | |||||||||||||||||
| Total investment and brokerage services | 26 | 71 | 1,296 | 1,306 | (26 | ) | 16 | ||||||||||||||||
| Investment banking fees | |||||||||||||||||||||||
| Underwriting income | 917 | 876 | 1,147 | 1,220 | (161 | ) | (179 | ) | |||||||||||||||
| Syndication fees | 427 | 472 | 461 | 486 | (1 | ) | — | ||||||||||||||||
| Financial advisory services | 984 | 782 | 99 | 77 | (1 | ) | 1 | ||||||||||||||||
| Total investment banking fees | 2,328 | 2,130 | 1,707 | 1,783 | (163 | ) | (178 | ) | |||||||||||||||
| Total fees and commissions | 4,977 | 4,868 | 3,325 | 3,418 | (171 | ) | (144 | ) | |||||||||||||||
| Trading account income | 190 | 184 | 5,623 | 6,129 | 482 | 21 | |||||||||||||||||
| Other income | 2,059 | 1,636 | 461 | 466 | (2,329 | ) | (1,396 | ) | |||||||||||||||
| Total noninterest income | $ | 7,226 | $ | 6,688 | $ | 9,409 | $ | 10,013 | $ | (2,018 | ) | $ | (1,519 | ) | |||||||||
(1) | All Other includes eliminations of intercompany transactions. |
93Bank of America | ||
| ABS | Asset-backed securities |
| AFS | Available-for-sale |
| ALM | Asset and liability management |
| ARR | Alternative reference rates |
| AUM | Assets under management |
| BANA | Bank of America, National Association |
| BHC | Bank holding company |
| BofAS | BofA Securities, Inc. |
| BofASE | BofA Securities Europe SA |
| bps | basis points |
| CCAR | Comprehensive Capital Analysis and Review |
| CDO | Collateralized debt obligation |
| CET1 | Common equity tier 1 |
| CFTC | Commodity Futures Trading Commission |
| CLTV | Combined loan-to-value |
| CVA | Credit valuation adjustment |
| DVA | Debit valuation adjustment |
| EPS | Earnings per common share |
| FDIC | Federal Deposit Insurance Corporation |
| FHA | Federal Housing Administration |
| FHLB | Federal Home Loan Bank |
| FHLMC | Freddie Mac |
| FICC | Fixed-income, currencies and commodities |
| FICO | Fair Isaac Corporation (credit score) |
| FNMA | Fannie Mae |
| FTE | Fully taxable-equivalent |
| FVA | Funding valuation adjustment |
| GAAP | Accounting principles generally accepted in the United States of America |
| GLS | Global Liquidity Sources |
| GNMA | Government National Mortgage Association |
| GSE | Government-sponsored enterprise |
| G-SIB | Global systemically important bank |
| GWIM | Global Wealth & Investment Management |
| HELOC | Home equity line of credit |
| HQLA | High Quality Liquid Assets |
| HTM | Held-to-maturity |
| IRLC | Interest rate lock commitment |
| ISDA | International Swaps and Derivatives Association, Inc. |
| LCR | Liquidity Coverage Ratio |
| LHFS | Loans held-for-sale |
| LIBOR | London InterBank Offered Rate |
| LTV | Loan-to-value |
| MBS | Mortgage-backed securities |
| MD&A | Management’s Discussion and Analysis of Financial Condition and Results of Operations |
| MLGWM | Merrill Lynch Global Wealth Management |
| MLI | Merrill Lynch International |
| MLPCC | Merrill Lynch Professional Clearing Corp |
| MLPF&S | Merrill Lynch, Pierce, Fenner & Smith Incorporated |
| MSA | Metropolitan Statistical Area |
| MSR | Mortgage servicing right |
| OCI | Other comprehensive income |
| OREO | Other real estate owned |
| OTC | Over-the-counter |
| OTTI | Other-than-temporary impairment |
| PCA | Prompt Corrective Action |
| PCI | Purchased credit-impaired |
| RMBS | Residential mortgage-backed securities |
| SBLC | Standby letter of credit |
| SLR | Supplementary leverage ratio |
| TDR | Troubled debt restructurings |
| TLAC | Total loss-absorbing capacity |
| VaR | Value-at-Risk |
| VIE | Variable interest entity |
95Bank of America | ||
| (Dollars in millions, except per share information; shares in thousands) | Total Common Shares Repurchased (1) | Weighted-Average Per Share Price | Total Shares Purchased as Part of Publicly Announced Programs | Remaining Buyback Authority Amounts (2) | |||||||||
| July 1 - 31, 2018 | 32,160 | $ | 30.32 | 32,160 | $ | 19,625 | |||||||
| August 1 - 31, 2018 | 76,287 | 31.07 | 72,831 | 17,360 | |||||||||
| September 1 - 30, 2018 | 58,578 | 30.74 | 58,558 | 15,560 | |||||||||
| Three months ended September 30, 2018 | 167,025 | 30.81 | 163,549 | ||||||||||
| (Dollars in millions, except per share information; shares in thousands) | Total Common Shares Repurchased (1) | Weighted-Average Per Share Price | Total Shares Purchased as Part of Publicly Announced Programs | Remaining Buyback Authority Amounts (2) | |||||||||
| July 1 - 31, 2019 | 43,183 | $ | 30.34 | 43,183 | $ | 29,635 | |||||||
| August 1 - 31, 2019 | 129,976 | 27.68 | 126,469 | 26,129 | |||||||||
| September 1 - 30, 2019 | 97,365 | 28.89 | 97,281 | 23,319 | |||||||||
| Three months ended September 30, 2019 | 270,524 | 28.54 | 266,933 | ||||||||||
(1) | Includes shares of the Corporation’s common stock acquired by the Corporation in connection with satisfaction of tax withholding obligations on vested restricted stock or restricted stock units and certain forfeitures and terminations of employment-related awards and for potential re-issuance to certain employees under equity incentive plans. |
(2) | On June |
| Exhibit No. | Description | Notes |
| 3(a) | 1 | |
| 3(b) | 1 | |
| 31(a) | 1 | |
| 31(b) | 1 | |
| 32(a) | 1 | |
| 32(b) | 1 | |
| 101.INS | XBRL Instance Document | 2 |
| 101.SCH | XBRL Taxonomy Extension Schema Document | 1 |
| 101.CAL | XBRL Taxonomy Extension Calculation Linkbase Document | 1 |
| 101.LAB | XBRL Taxonomy Extension Label Linkbase Document | 1 |
| 101.PRE | XBRL Taxonomy Extension Presentation Linkbase Document | 1 |
| 101.DEF | XBRL Taxonomy Extension Definitions Linkbase Document | 1 |
| 104 | Cover Page Interactive Data File (formatted as Inline XBRL and contained in Exhibit 101) | |
| Incorporated by Reference | ||||||
| Exhibit No. | Description | Notes | Form | Exhibit | Filing Date | File No. |
| 3(a) | 10-Q | 3(a) | 7/30/18 | 1-6523 | ||
| 3(b) | 8-K | 3.1 | 3/20/15 | 1-6523 | ||
| 11 | 1 | |||||
| 12 | 1 | |||||
| 31(a) | 1 | |||||
| 31(b) | 1 | |||||
| 32(a) | 1 | |||||
| 32(b) | 1 | |||||
| 101.INS | XBRL Instance Document | 1 | ||||
| 101.SCH | XBRL Taxonomy Extension Schema Document | 1 | ||||
| 101.CAL | XBRL Taxonomy Extension Calculation Linkbase Document | 1 | ||||
| 101.LAB | XBRL Taxonomy Extension Label Linkbase Document | 1 | ||||
| 101.PRE | XBRL Taxonomy Extension Presentation Linkbase Document | 1 | ||||
| 101.DEF | XBRL Taxonomy Extension Definitions Linkbase Document | 1 | ||||
Bank of America Corporation Registrant | |||||
| Date: | October | /s/ Rudolf A. Bless | |||
Rudolf A. Bless Chief Accounting Officer | |||||
97Bank of America | ||