| Title of each class | Trading Symbol(s) | Name of each exchange on which registered | ||||||
| Common Stock, par value $0.01 per share | BAC | New York Stock Exchange | ||||||
| Depositary Shares, each representing a 1/1,000th interest in a share | BAC PrE | New York Stock Exchange | ||||||
| of Floating Rate Non-Cumulative Preferred Stock, Series E | ||||||||
| Depositary Shares, each representing a 1/1,000th interest in a share | BAC PrB | New York Stock Exchange | ||||||
| of 6.000% Non-Cumulative Preferred Stock, Series GG | ||||||||
| Depositary Shares, each representing a 1/1,000th interest in a share | BAC PrK | New York Stock Exchange | ||||||
| of 5.875% Non-Cumulative Preferred Stock, Series HH | ||||||||
| 7.25% Non-Cumulative Perpetual Convertible Preferred Stock, Series L | BAC PrL | New York Stock Exchange | ||||||
| Depositary Shares, each representing a 1/1,200th interest in a share | BML PrG | New York Stock Exchange | ||||||
| of Bank of America Corporation Floating Rate | ||||||||
| Non-Cumulative Preferred Stock, Series 1 | ||||||||
| Title of each class | Trading Symbol(s) | Name of each exchange on which registered | ||||||
| Depositary Shares, each representing a 1/1,200th interest in a share | BML PrH | New York Stock Exchange | ||||||
| of Bank of America Corporation Floating Rate | ||||||||
| Non-Cumulative Preferred Stock, Series 2 | ||||||||
| Depositary Shares, each representing a 1/1,200th interest in a share | BML PrJ | New York Stock Exchange | ||||||
| of Bank of America Corporation Floating Rate | ||||||||
| Non-Cumulative Preferred Stock, Series 4 | ||||||||
| Depositary Shares, each representing a 1/1,200th interest in a share | BML PrL | New York Stock Exchange | ||||||
| of Bank of America Corporation Floating Rate | ||||||||
| Non-Cumulative Preferred Stock, Series 5 | ||||||||
| Floating Rate Preferred Hybrid Income Term Securities of BAC Capital | BAC/PF | New York Stock Exchange | ||||||
| Trust XIII (and the guarantee related thereto) | ||||||||
| 5.63% Fixed to Floating Rate Preferred Hybrid Income Term Securities | BAC/PG | New York Stock Exchange | ||||||
| of BAC Capital Trust XIV (and the guarantee related thereto) | ||||||||
| Income Capital Obligation Notes initially due December 15, 2066 of | MER PrK | New York Stock Exchange | ||||||
| Bank of America Corporation | ||||||||
| Senior Medium-Term Notes, Series A, Step Up Callable Notes, due | BAC/31B | New York Stock Exchange | ||||||
| November 28, 2031 of BofA Finance LLC (and the guarantee | ||||||||
| of the Registrant with respect thereto) | ||||||||
| Depositary Shares, each representing a 1/1,000th interest in a share of | BAC PrM | New York Stock Exchange | ||||||
| 5.375% Non-Cumulative Preferred Stock, Series KK | ||||||||
| Depositary Shares, each representing a 1/1,000th interest in a share | BAC PrN | New York Stock Exchange | ||||||
| of 5.000% Non-Cumulative Preferred Stock, Series LL | ||||||||
| Depositary Shares, each representing a 1/1,000th interest in a share of | BAC PrO | New York Stock Exchange | ||||||
| 4.375% Non-Cumulative Preferred Stock, Series NN | ||||||||
| Depositary Shares, each representing a 1/1,000th interest in a share of | BAC PrP | New York Stock Exchange | ||||||
| 4.125% Non-Cumulative Preferred Stock, Series PP | ||||||||
| Depositary Shares, each representing a 1/1,000th interest in a share of | BAC PrQ | New York Stock Exchange | ||||||
| 4.250% Non-Cumulative Preferred Stock, Series QQ | ||||||||
| Large accelerated filer | ☑ | Accelerated filer | ☐ | Non-accelerated filer | ☐ | Smaller reporting company | ☐ | |||||||||||||||||||||||||
| Item 1. Financial Statements | Page | |||||||
Note 5 – Outstanding Loans and Leases and Allowance for Credit Losses | ||||||||
| Item 2. Management’s Discussion and Analysis of Financial Condition and Results of Operations | ||||||||
1 Bank of America | ||||||||
Bank of America 2 | ||||||||
3Bank of America | ||||||||
| Table 1 | Table 1 | Summary Income Statement and Selected Financial Data | Table 1 | Summary Income Statement and Selected Financial Data | ||||||||||||||||||||||||||||||||||||||||||||||||
| Three Months Ended March 31 | Three Months Ended September 30 | Nine Months Ended September 30 | ||||||||||||||||||||||||||||||||||||||||||||||||||
| (Dollars in millions, except per share information) | (Dollars in millions, except per share information) | 2021 | 2020 | (Dollars in millions, except per share information) | 2021 | 2020 | 2021 | 2020 | ||||||||||||||||||||||||||||||||||||||||||||
| Income statement | Income statement | Income statement | ||||||||||||||||||||||||||||||||||||||||||||||||||
| Net interest income | Net interest income | $ | 10,197 | $ | 12,130 | Net interest income | $ | 11,094 | $ | 10,129 | $ | 31,524 | $ | 33,107 | ||||||||||||||||||||||||||||||||||||||
| Noninterest income | Noninterest income | 12,624 | 10,637 | Noninterest income | 11,672 | 10,207 | 35,529 | 32,322 | ||||||||||||||||||||||||||||||||||||||||||||
| Total revenue, net of interest expense | Total revenue, net of interest expense | 22,821 | 22,767 | Total revenue, net of interest expense | 22,766 | 20,336 | 67,053 | 65,429 | ||||||||||||||||||||||||||||||||||||||||||||
| Provision for credit losses | Provision for credit losses | (1,860) | 4,761 | Provision for credit losses | (624) | 1,389 | (4,105) | 11,267 | ||||||||||||||||||||||||||||||||||||||||||||
| Noninterest expense | Noninterest expense | 15,515 | 13,475 | Noninterest expense | 14,440 | 14,401 | 45,000 | 41,286 | ||||||||||||||||||||||||||||||||||||||||||||
| Income before income taxes | Income before income taxes | 9,166 | 4,531 | Income before income taxes | 8,950 | 4,546 | 26,158 | 12,876 | ||||||||||||||||||||||||||||||||||||||||||||
| Income tax expense | Income tax expense | 1,116 | 521 | Income tax expense | 1,259 | (335) | 1,193 | 452 | ||||||||||||||||||||||||||||||||||||||||||||
| Net income | Net income | 8,050 | 4,010 | Net income | 7,691 | 4,881 | 24,965 | 12,424 | ||||||||||||||||||||||||||||||||||||||||||||
| Preferred stock dividends | Preferred stock dividends | 490 | 469 | Preferred stock dividends | 431 | 441 | 1,181 | 1,159 | ||||||||||||||||||||||||||||||||||||||||||||
| Net income applicable to common shareholders | Net income applicable to common shareholders | $ | 7,560 | $ | 3,541 | Net income applicable to common shareholders | $ | 7,260 | $ | 4,440 | $ | 23,784 | $ | 11,265 | ||||||||||||||||||||||||||||||||||||||
| Per common share information | Per common share information | Per common share information | ||||||||||||||||||||||||||||||||||||||||||||||||||
| Earnings | Earnings | $ | 0.87 | $ | 0.40 | Earnings | $ | 0.86 | $ | 0.51 | $ | 2.77 | $ | 1.29 | ||||||||||||||||||||||||||||||||||||||
| Diluted earnings | Diluted earnings | 0.86 | 0.40 | Diluted earnings | 0.85 | 0.51 | 2.75 | 1.28 | ||||||||||||||||||||||||||||||||||||||||||||
| Dividends paid | Dividends paid | 0.18 | 0.18 | Dividends paid | 0.21 | 0.18 | 0.57 | 0.54 | ||||||||||||||||||||||||||||||||||||||||||||
| Performance ratios | Performance ratios | Performance ratios | ||||||||||||||||||||||||||||||||||||||||||||||||||
Return on average assets (1) | Return on average assets (1) | 1.13 | % | 0.65 | % | Return on average assets (1) | 0.99 | % | 0.71 | % | 1.12 | % | 0.63 | % | ||||||||||||||||||||||||||||||||||||||
Return on average common shareholders’ equity (1) | Return on average common shareholders’ equity (1) | 12.28 | 5.91 | Return on average common shareholders’ equity (1) | 11.43 | 7.24 | 12.67 | 6.20 | ||||||||||||||||||||||||||||||||||||||||||||
Return on average tangible common shareholders’ equity (2) | Return on average tangible common shareholders’ equity (2) | 17.08 | 8.32 | Return on average tangible common shareholders’ equity (2) | 15.85 | 10.16 | 17.61 | 8.71 | ||||||||||||||||||||||||||||||||||||||||||||
Efficiency ratio (1) | Efficiency ratio (1) | 67.98 | 59.19 | Efficiency ratio (1) | 63.43 | 70.81 | 67.11 | 63.10 | ||||||||||||||||||||||||||||||||||||||||||||
March 31 2021 | December 31 2020 | September 30 2021 | December 31 2020 | |||||||||||||||||||||||||||||||||||||||||||||||||
| Balance sheet | Balance sheet | Balance sheet | ||||||||||||||||||||||||||||||||||||||||||||||||||
| Total loans and leases | Total loans and leases | $ | 903,088 | $ | 927,861 | Total loans and leases | $ | 927,736 | $ | 927,861 | ||||||||||||||||||||||||||||||||||||||||||
| Total assets | Total assets | 2,969,992 | 2,819,627 | Total assets | 3,085,446 | 2,819,627 | ||||||||||||||||||||||||||||||||||||||||||||||
| Total deposits | Total deposits | 1,884,938 | 1,795,480 | Total deposits | 1,964,804 | 1,795,480 | ||||||||||||||||||||||||||||||||||||||||||||||
| Total liabilities | Total liabilities | 2,695,992 | 2,546,703 | Total liabilities | 2,812,982 | 2,546,703 | ||||||||||||||||||||||||||||||||||||||||||||||
| Total common shareholders’ equity | Total common shareholders’ equity | 249,681 | 248,414 | Total common shareholders’ equity | 249,023 | 248,414 | ||||||||||||||||||||||||||||||||||||||||||||||
| Total shareholders’ equity | Total shareholders’ equity | 274,000 | 272,924 | Total shareholders’ equity | 272,464 | 272,924 | ||||||||||||||||||||||||||||||||||||||||||||||
Bank of America 4 | ||||||||
| Table 2 | Table 2 | Noninterest Income | Table 2 | Noninterest Income | ||||||||||||||||||||||||||||||||||||||||||||||||
| Three Months Ended March 31 | ||||||||||||||||||||||||||||||||||||||||||||||||||||
| Three Months Ended September 30 | Nine Months Ended September 30 | |||||||||||||||||||||||||||||||||||||||||||||||||||
| (Dollars in millions) | (Dollars in millions) | 2021 | 2020 | (Dollars in millions) | 2021 | 2020 | 2021 | 2020 | ||||||||||||||||||||||||||||||||||||||||||||
| Fees and commissions: | Fees and commissions: | Fees and commissions: | ||||||||||||||||||||||||||||||||||||||||||||||||||
| Card income | Card income | $ | 1,435 | $ | 1,272 | Card income | $ | 1,583 | $ | 1,568 | $ | 4,604 | $ | 4,089 | ||||||||||||||||||||||||||||||||||||||
| Service charges | Service charges | 1,792 | 1,903 | Service charges | 1,928 | 1,817 | 5,594 | 5,282 | ||||||||||||||||||||||||||||||||||||||||||||
| Investment and brokerage services | Investment and brokerage services | 4,063 | 3,758 | Investment and brokerage services | 4,236 | 3,623 | 12,422 | 10,803 | ||||||||||||||||||||||||||||||||||||||||||||
| Investment banking fees | Investment banking fees | 2,246 | 1,388 | Investment banking fees | 2,168 | 1,769 | 6,536 | 5,316 | ||||||||||||||||||||||||||||||||||||||||||||
| Total fees and commissions | Total fees and commissions | 9,536 | 8,321 | Total fees and commissions | 9,915 | 8,777 | 29,156 | 25,490 | ||||||||||||||||||||||||||||||||||||||||||||
| Market making and similar activities | Market making and similar activities | 3,529 | 2,807 | Market making and similar activities | 2,005 | 1,689 | 7,360 | 6,983 | ||||||||||||||||||||||||||||||||||||||||||||
| Other income | Other income | (441) | (491) | Other income | (248) | (259) | (987) | (151) | ||||||||||||||||||||||||||||||||||||||||||||
| Total noninterest income | Total noninterest income | $ | 12,624 | $ | 10,637 | Total noninterest income | $ | 11,672 | $ | 10,207 | $ | 35,529 | $ | 32,322 | ||||||||||||||||||||||||||||||||||||||
5Bank of America | ||||||||
| Table 3 | Table 3 | Noninterest Expense | Table 3 | Noninterest Expense | ||||||||||||||||||||||||||||||||||||||||||||||||
| Three Months Ended March 31 | ||||||||||||||||||||||||||||||||||||||||||||||||||||
| Three Months Ended September 30 | Nine Months Ended September 30 | |||||||||||||||||||||||||||||||||||||||||||||||||||
| (Dollars in millions) | (Dollars in millions) | 2021 | 2020 | (Dollars in millions) | 2021 | 2020 | 2021 | 2020 | ||||||||||||||||||||||||||||||||||||||||||||
| Compensation and benefits | Compensation and benefits | $ | 9,736 | $ | 8,341 | Compensation and benefits | $ | 8,714 | $ | 8,200 | $ | 27,103 | $ | 24,535 | ||||||||||||||||||||||||||||||||||||||
| Occupancy and equipment | Occupancy and equipment | 1,830 | 1,702 | Occupancy and equipment | 1,764 | 1,798 | 5,353 | 5,302 | ||||||||||||||||||||||||||||||||||||||||||||
| Information processing and communications | Information processing and communications | 1,425 | 1,209 | Information processing and communications | 1,416 | 1,333 | 4,289 | 3,807 | ||||||||||||||||||||||||||||||||||||||||||||
| Product delivery and transaction related | Product delivery and transaction related | 977 | 777 | Product delivery and transaction related | 987 | 930 | 2,940 | 2,518 | ||||||||||||||||||||||||||||||||||||||||||||
| Marketing | Marketing | 371 | 438 | Marketing | 347 | 308 | 1,528 | 1,238 | ||||||||||||||||||||||||||||||||||||||||||||
| Professional fees | Professional fees | 403 | 375 | Professional fees | 434 | 450 | 1,263 | 1,206 | ||||||||||||||||||||||||||||||||||||||||||||
| Other general operating | Other general operating | 773 | 633 | Other general operating | 778 | 1,382 | 2,524 | 2,680 | ||||||||||||||||||||||||||||||||||||||||||||
| Total noninterest expense | Total noninterest expense | $ | 15,515 | $ | 13,475 | Total noninterest expense | $ | 14,440 | $ | 14,401 | $ | 45,000 | $ | 41,286 | ||||||||||||||||||||||||||||||||||||||
| Table 4 | Table 4 | Income Tax Expense | Table 4 | Income Tax Expense | ||||||||||||||||||||||||||||||||||||||||||||||||
| Three Months Ended March 31 | ||||||||||||||||||||||||||||||||||||||||||||||||||||
| Three Months Ended September 30 | Nine Months Ended September 30 | |||||||||||||||||||||||||||||||||||||||||||||||||||
| (Dollars in millions) | (Dollars in millions) | 2021 | 2020 | (Dollars in millions) | 2021 | 2020 | 2021 | 2020 | ||||||||||||||||||||||||||||||||||||||||||||
| Income before income taxes | Income before income taxes | $ | 9,166 | $ | 4,531 | Income before income taxes | $ | 8,950 | $ | 4,546 | $ | 26,158 | $ | 12,876 | ||||||||||||||||||||||||||||||||||||||
| Income tax expense | Income tax expense | 1,116 | 521 | Income tax expense | 1,259 | (335) | 1,193 | 452 | ||||||||||||||||||||||||||||||||||||||||||||
| Effective tax rate | Effective tax rate | 12.2 | % | 11.5 | % | Effective tax rate | 14.1 | % | (7.4) | % | 4.6 | % | 3.5 | % | ||||||||||||||||||||||||||||||||||||||
Bank of America6 | ||||||||
| Table 5 | Selected Quarterly Financial Data | |||||||||||||||||||||||||||||||||||||||||||||||||||||||||||||||||||||||||
| 2021 Quarter | 2020 Quarters | |||||||||||||||||||||||||||||||||||||||||||||||||||||||||||||||||||||||||
| (In millions, except per share information) | First | Fourth | Third | Second | First | |||||||||||||||||||||||||||||||||||||||||||||||||||||||||||||||||||||
| Income statement | ||||||||||||||||||||||||||||||||||||||||||||||||||||||||||||||||||||||||||
| Net interest income | $ | 10,197 | $ | 10,253 | $ | 10,129 | $ | 10,848 | $ | 12,130 | ||||||||||||||||||||||||||||||||||||||||||||||||||||||||||||||||
| Noninterest income | 12,624 | 9,846 | 10,207 | 11,478 | 10,637 | |||||||||||||||||||||||||||||||||||||||||||||||||||||||||||||||||||||
| Total revenue, net of interest expense | 22,821 | 20,099 | 20,336 | 22,326 | 22,767 | |||||||||||||||||||||||||||||||||||||||||||||||||||||||||||||||||||||
| Provision for credit losses | (1,860) | 53 | 1,389 | 5,117 | 4,761 | |||||||||||||||||||||||||||||||||||||||||||||||||||||||||||||||||||||
| Noninterest expense | 15,515 | 13,927 | 14,401 | 13,410 | 13,475 | |||||||||||||||||||||||||||||||||||||||||||||||||||||||||||||||||||||
| Income before income taxes | 9,166 | 6,119 | 4,546 | 3,799 | 4,531 | |||||||||||||||||||||||||||||||||||||||||||||||||||||||||||||||||||||
| Income tax expense | 1,116 | 649 | (335) | 266 | 521 | |||||||||||||||||||||||||||||||||||||||||||||||||||||||||||||||||||||
| Net income | 8,050 | 5,470 | 4,881 | 3,533 | 4,010 | |||||||||||||||||||||||||||||||||||||||||||||||||||||||||||||||||||||
| Net income applicable to common shareholders | 7,560 | 5,208 | 4,440 | 3,284 | 3,541 | |||||||||||||||||||||||||||||||||||||||||||||||||||||||||||||||||||||
| Average common shares issued and outstanding | 8,700.1 | 8,724.9 | 8,732.9 | 8,739.9 | 8,815.6 | |||||||||||||||||||||||||||||||||||||||||||||||||||||||||||||||||||||
| Average diluted common shares issued and outstanding | 8,755.6 | 8,785.0 | 8,777.5 | 8,768.1 | 8,862.7 | |||||||||||||||||||||||||||||||||||||||||||||||||||||||||||||||||||||
| Performance ratios | ||||||||||||||||||||||||||||||||||||||||||||||||||||||||||||||||||||||||||
Return on average assets (1) | 1.13 | % | 0.78 | % | 0.71 | % | 0.53 | % | 0.65 | % | ||||||||||||||||||||||||||||||||||||||||||||||||||||||||||||||||
Four-quarter trailing return on average assets (2) | 0.79 | 0.67 | 0.75 | 0.81 | 0.99 | |||||||||||||||||||||||||||||||||||||||||||||||||||||||||||||||||||||
Return on average common shareholders’ equity (1) | 12.28 | 8.39 | 7.24 | 5.44 | 5.91 | |||||||||||||||||||||||||||||||||||||||||||||||||||||||||||||||||||||
Return on average tangible common shareholders’ equity (3) | 17.08 | 11.73 | 10.16 | 7.63 | 8.32 | |||||||||||||||||||||||||||||||||||||||||||||||||||||||||||||||||||||
Return on average shareholders’ equity (1) | 11.91 | 8.03 | 7.26 | 5.34 | 6.10 | |||||||||||||||||||||||||||||||||||||||||||||||||||||||||||||||||||||
Return on average tangible shareholders’ equity (3) | 16.01 | 10.84 | 9.84 | 7.23 | 8.29 | |||||||||||||||||||||||||||||||||||||||||||||||||||||||||||||||||||||
| Total ending equity to total ending assets | 9.23 | 9.68 | 9.82 | 9.69 | 10.11 | |||||||||||||||||||||||||||||||||||||||||||||||||||||||||||||||||||||
| Total average equity to total average assets | 9.52 | 9.71 | 9.76 | 9.85 | 10.60 | |||||||||||||||||||||||||||||||||||||||||||||||||||||||||||||||||||||
| Dividend payout | 20.68 | 30.11 | 35.36 | 47.87 | 44.57 | |||||||||||||||||||||||||||||||||||||||||||||||||||||||||||||||||||||
| Per common share data | ||||||||||||||||||||||||||||||||||||||||||||||||||||||||||||||||||||||||||
| Earnings | $ | 0.87 | $ | 0.60 | $ | 0.51 | $ | 0.38 | $ | 0.40 | ||||||||||||||||||||||||||||||||||||||||||||||||||||||||||||||||
| Diluted earnings | 0.86 | 0.59 | 0.51 | 0.37 | 0.40 | |||||||||||||||||||||||||||||||||||||||||||||||||||||||||||||||||||||
| Dividends paid | 0.18 | 0.18 | 0.18 | 0.18 | 0.18 | |||||||||||||||||||||||||||||||||||||||||||||||||||||||||||||||||||||
Book value (1) | 29.07 | 28.72 | 28.33 | 27.96 | 27.84 | |||||||||||||||||||||||||||||||||||||||||||||||||||||||||||||||||||||
Tangible book value (3) | 20.90 | 20.60 | 20.23 | 19.90 | 19.79 | |||||||||||||||||||||||||||||||||||||||||||||||||||||||||||||||||||||
| Market capitalization | $ | 332,337 | $ | 262,206 | $ | 208,656 | $ | 205,772 | $ | 184,181 | ||||||||||||||||||||||||||||||||||||||||||||||||||||||||||||||||
| Average balance sheet | ||||||||||||||||||||||||||||||||||||||||||||||||||||||||||||||||||||||||||
| Total loans and leases | $ | 907,723 | $ | 934,798 | $ | 974,018 | $ | 1,031,387 | $ | 990,283 | ||||||||||||||||||||||||||||||||||||||||||||||||||||||||||||||||
| Total assets | 2,879,221 | 2,791,874 | 2,739,684 | 2,704,186 | 2,494,928 | |||||||||||||||||||||||||||||||||||||||||||||||||||||||||||||||||||||
| Total deposits | 1,805,747 | 1,737,139 | 1,695,488 | 1,658,197 | 1,439,336 | |||||||||||||||||||||||||||||||||||||||||||||||||||||||||||||||||||||
| Long-term debt | 220,836 | 225,423 | 224,254 | 221,167 | 210,816 | |||||||||||||||||||||||||||||||||||||||||||||||||||||||||||||||||||||
| Common shareholders’ equity | 249,648 | 246,840 | 243,896 | 242,889 | 241,078 | |||||||||||||||||||||||||||||||||||||||||||||||||||||||||||||||||||||
| Total shareholders’ equity | 274,047 | 271,020 | 267,323 | 266,316 | 264,534 | |||||||||||||||||||||||||||||||||||||||||||||||||||||||||||||||||||||
| Asset quality | ||||||||||||||||||||||||||||||||||||||||||||||||||||||||||||||||||||||||||
Allowance for credit losses (4) | $ | 17,997 | $ | 20,680 | $ | 21,506 | $ | 21,091 | $ | 17,126 | ||||||||||||||||||||||||||||||||||||||||||||||||||||||||||||||||
Nonperforming loans, leases and foreclosed properties (5) | 5,299 | 5,116 | 4,730 | 4,611 | 4,331 | |||||||||||||||||||||||||||||||||||||||||||||||||||||||||||||||||||||
Allowance for loan and lease losses as a percentage of total loans and leases outstanding (5) | 1.80 | % | 2.04 | % | 2.07 | % | 1.96 | % | 1.51 | % | ||||||||||||||||||||||||||||||||||||||||||||||||||||||||||||||||
Allowance for loan and lease losses as a percentage of total nonperforming loans and leases (5) | 313 | 380 | 431 | 441 | 389 | |||||||||||||||||||||||||||||||||||||||||||||||||||||||||||||||||||||
| Net charge-offs | $ | 823 | $ | 881 | $ | 972 | $ | 1,146 | $ | 1,122 | ||||||||||||||||||||||||||||||||||||||||||||||||||||||||||||||||
Annualized net charge-offs as a percentage of average loans and leases outstanding (5) | 0.37 | % | 0.38 | % | 0.40 | % | 0.45 | % | 0.46 | % | ||||||||||||||||||||||||||||||||||||||||||||||||||||||||||||||||
Capital ratios at period end (6) | ||||||||||||||||||||||||||||||||||||||||||||||||||||||||||||||||||||||||||
| Common equity tier 1 capital | 11.8 | % | 11.9 | % | 11.9 | % | 11.4 | % | 10.8 | % | ||||||||||||||||||||||||||||||||||||||||||||||||||||||||||||||||
| Tier 1 capital | 13.3 | 13.5 | 13.5 | 12.9 | 12.3 | |||||||||||||||||||||||||||||||||||||||||||||||||||||||||||||||||||||
| Total capital | 15.6 | 16.1 | 16.1 | 14.8 | 14.6 | |||||||||||||||||||||||||||||||||||||||||||||||||||||||||||||||||||||
| Tier 1 leverage | 7.2 | 7.4 | 7.4 | 7.4 | 7.9 | |||||||||||||||||||||||||||||||||||||||||||||||||||||||||||||||||||||
| Supplementary leverage ratio | 7.0 | 7.2 | 6.9 | 7.1 | 6.4 | |||||||||||||||||||||||||||||||||||||||||||||||||||||||||||||||||||||
Tangible equity (3) | 7.0 | 7.4 | 7.4 | 7.3 | 7.7 | |||||||||||||||||||||||||||||||||||||||||||||||||||||||||||||||||||||
Tangible common equity (3) | 6.2 | 6.5 | 6.6 | 6.5 | 6.7 | |||||||||||||||||||||||||||||||||||||||||||||||||||||||||||||||||||||
| Total loss-absorbing capacity and long-term debt metrics | ||||||||||||||||||||||||||||||||||||||||||||||||||||||||||||||||||||||||||
| Total loss-absorbing capacity to risk-weighted assets | 26.8 | % | 27.4 | % | 26.9 | % | 26.0 | % | 24.6 | % | ||||||||||||||||||||||||||||||||||||||||||||||||||||||||||||||||
| Total loss-absorbing capacity to supplementary leverage exposure | 14.1 | 14.5 | 13.7 | 14.2 | 12.8 | |||||||||||||||||||||||||||||||||||||||||||||||||||||||||||||||||||||
| Eligible long-term debt to risk-weighted assets | 13.0 | 13.3 | 12.9 | 12.4 | 11.6 | |||||||||||||||||||||||||||||||||||||||||||||||||||||||||||||||||||||
| Eligible long-term debt to supplementary leverage exposure | 6.8 | 7.1 | 6.6 | 6.7 | 6.1 | |||||||||||||||||||||||||||||||||||||||||||||||||||||||||||||||||||||
| Table 6 | Quarterly Average Balances and Interest Rates - FTE Basis | |||||||||||||||||||||||||||||||||||||
| Average Balance | Interest Income/ Expense (1) | Yield/ Rate | Average Balance | Interest Income/ Expense (1) | Yield/ Rate | |||||||||||||||||||||||||||||||||
| (Dollars in millions) | First Quarter 2021 | First Quarter 2020 | ||||||||||||||||||||||||||||||||||||
| Earning assets | ||||||||||||||||||||||||||||||||||||||
Interest-bearing deposits with the Federal Reserve, non-U.S. central banks and other banks | $ | 278,098 | $ | 29 | 0.04 | % | $ | 130,282 | $ | 268 | 0.83 | % | ||||||||||||||||||||||||||
| Time deposits placed and other short-term investments | 8,742 | 4 | 0.18 | 10,894 | 30 | 1.11 | ||||||||||||||||||||||||||||||||
Federal funds sold and securities borrowed or purchased under agreements to resell | 249,985 | (7) | (0.01) | 278,794 | 819 | 1.18 | ||||||||||||||||||||||||||||||||
| Trading account assets | 145,089 | 885 | 2.47 | 156,685 | 1,266 | 3.25 | ||||||||||||||||||||||||||||||||
| Debt securities | 788,638 | 2,745 | 1.41 | 465,215 | 2,868 | 2.49 | ||||||||||||||||||||||||||||||||
Loans and leases (2) | ||||||||||||||||||||||||||||||||||||||
| Residential mortgage | 219,005 | 1,529 | 2.80 | 239,994 | 1,987 | 3.31 | ||||||||||||||||||||||||||||||||
| Home equity | 33,634 | 281 | 3.38 | 40,040 | 421 | 4.22 | ||||||||||||||||||||||||||||||||
| Credit card | 74,165 | 1,947 | 10.65 | 94,471 | 2,464 | 10.49 | ||||||||||||||||||||||||||||||||
Direct/Indirect and other consumer (3) | 91,430 | 559 | 2.48 | 90,954 | 746 | 3.30 | ||||||||||||||||||||||||||||||||
| Total consumer | 418,234 | 4,316 | 4.17 | 465,459 | 5,618 | 4.85 | ||||||||||||||||||||||||||||||||
U.S. commercial (4) | 322,010 | 2,051 | 2.58 | 330,420 | 2,910 | 3.54 | ||||||||||||||||||||||||||||||||
Non-U.S. commercial (4) | 90,904 | 409 | 1.83 | 111,388 | 738 | 2.66 | ||||||||||||||||||||||||||||||||
Commercial real estate (5) | 59,736 | 365 | 2.48 | 63,418 | 583 | 3.70 | ||||||||||||||||||||||||||||||||
| Commercial lease financing | 16,839 | 132 | 3.15 | 19,598 | 161 | 3.29 | ||||||||||||||||||||||||||||||||
| Total commercial | 489,489 | 2,957 | 2.45 | 524,824 | 4,392 | 3.36 | ||||||||||||||||||||||||||||||||
| Total loans and leases | 907,723 | 7,273 | 3.24 | 990,283 | 10,010 | 4.06 | ||||||||||||||||||||||||||||||||
| Other earning assets | 103,650 | 577 | 2.26 | 87,876 | 981 | 4.49 | ||||||||||||||||||||||||||||||||
| Total earning assets | 2,481,925 | 11,506 | 1.87 | 2,120,029 | 16,242 | 3.08 | ||||||||||||||||||||||||||||||||
| Cash and due from banks | 33,925 | 27,997 | ||||||||||||||||||||||||||||||||||||
| Other assets, less allowance for loan and lease losses | 363,371 | 346,902 | ||||||||||||||||||||||||||||||||||||
| Total assets | $ | 2,879,221 | $ | 2,494,928 | ||||||||||||||||||||||||||||||||||
| Interest-bearing liabilities | ||||||||||||||||||||||||||||||||||||||
| U.S. interest-bearing deposits | ||||||||||||||||||||||||||||||||||||||
| Savings | $ | 67,588 | $ | 2 | 0.01 | % | $ | 50,600 | $ | 1 | 0.01 | % | ||||||||||||||||||||||||||
| Demand and money market deposit accounts | 889,793 | 77 | 0.04 | 770,474 | 653 | 0.34 | ||||||||||||||||||||||||||||||||
| Consumer CDs and IRAs | 38,207 | 26 | 0.28 | 53,363 | 151 | 1.14 | ||||||||||||||||||||||||||||||||
| Negotiable CDs, public funds and other deposits | 52,780 | 23 | 0.18 | 67,985 | 209 | 1.23 | ||||||||||||||||||||||||||||||||
| Total U.S. interest-bearing deposits | 1,048,368 | 128 | 0.05 | 942,422 | 1,014 | 0.43 | ||||||||||||||||||||||||||||||||
| Non-U.S. interest-bearing deposits | ||||||||||||||||||||||||||||||||||||||
| Banks located in non-U.S. countries | 1,030 | — | 0.12 | 1,904 | 3 | 0.60 | ||||||||||||||||||||||||||||||||
| Governments and official institutions | 199 | — | — | 161 | — | 0.05 | ||||||||||||||||||||||||||||||||
| Time, savings and other | 80,737 | 5 | 0.02 | 75,625 | 167 | 0.89 | ||||||||||||||||||||||||||||||||
| Total non-U.S. interest-bearing deposits | 81,966 | 5 | 0.02 | 77,690 | 170 | 0.88 | ||||||||||||||||||||||||||||||||
| Total interest-bearing deposits | 1,130,334 | 133 | 0.05 | 1,020,112 | 1,184 | 0.47 | ||||||||||||||||||||||||||||||||
| Federal funds purchased, securities loaned or sold under agreements to repurchase, short-term borrowings and other interest-bearing liabilities | 293,236 | (79) | (0.11) | 304,503 | 1,120 | 1.48 | ||||||||||||||||||||||||||||||||
| Trading account liabilities | 42,923 | 246 | 2.32 | 48,142 | 329 | 2.75 | ||||||||||||||||||||||||||||||||
| Long-term debt | 220,836 | 898 | 1.65 | 210,816 | 1,335 | 2.54 | ||||||||||||||||||||||||||||||||
| Total interest-bearing liabilities | 1,687,329 | 1,198 | 0.29 | 1,583,573 | 3,968 | 1.01 | ||||||||||||||||||||||||||||||||
| Noninterest-bearing sources | ||||||||||||||||||||||||||||||||||||||
| Noninterest-bearing deposits | 675,413 | 419,224 | ||||||||||||||||||||||||||||||||||||
Other liabilities (6) | 242,432 | 227,597 | ||||||||||||||||||||||||||||||||||||
| Shareholders’ equity | 274,047 | 264,534 | ||||||||||||||||||||||||||||||||||||
| Total liabilities and shareholders’ equity | $ | 2,879,221 | $ | 2,494,928 | ||||||||||||||||||||||||||||||||||
| Net interest spread | 1.58 | % | 2.07 | % | ||||||||||||||||||||||||||||||||||
| Impact of noninterest-bearing sources | 0.10 | 0.26 | ||||||||||||||||||||||||||||||||||||
Net interest income/yield on earning assets (7) | $ | 10,308 | 1.68 | % | $ | 12,274 | 2.33 | % | ||||||||||||||||||||||||||||||
7Bank of America | ||||||||
| Table 5 | Selected Quarterly Financial Data | |||||||||||||||||||||||||||||||||||||||||||||||||||||||||||||||||||||||||||||||
| 2021 Quarters | 2020 Quarters | Nine Months Ended September 30 | ||||||||||||||||||||||||||||||||||||||||||||||||||||||||||||||||||||||||||||||
| (In millions, except per share information) | Third | Second | First | Fourth | Third | 2021 | 2020 | |||||||||||||||||||||||||||||||||||||||||||||||||||||||||||||||||||||||||
| Income statement | ||||||||||||||||||||||||||||||||||||||||||||||||||||||||||||||||||||||||||||||||
| Net interest income | $ | 11,094 | $ | 10,233 | $ | 10,197 | $ | 10,253 | $ | 10,129 | $ | 31,524 | $ | 33,107 | ||||||||||||||||||||||||||||||||||||||||||||||||||||||||||||||||||
| Noninterest income | 11,672 | 11,233 | 12,624 | 9,846 | 10,207 | 35,529 | 32,322 | |||||||||||||||||||||||||||||||||||||||||||||||||||||||||||||||||||||||||
| Total revenue, net of interest expense | 22,766 | 21,466 | 22,821 | 20,099 | 20,336 | 67,053 | 65,429 | |||||||||||||||||||||||||||||||||||||||||||||||||||||||||||||||||||||||||
| Provision for credit losses | (624) | (1,621) | (1,860) | 53 | 1,389 | (4,105) | 11,267 | |||||||||||||||||||||||||||||||||||||||||||||||||||||||||||||||||||||||||
| Noninterest expense | 14,440 | 15,045 | 15,515 | 13,927 | 14,401 | 45,000 | 41,286 | |||||||||||||||||||||||||||||||||||||||||||||||||||||||||||||||||||||||||
| Income before income taxes | 8,950 | 8,042 | 9,166 | 6,119 | 4,546 | 26,158 | 12,876 | |||||||||||||||||||||||||||||||||||||||||||||||||||||||||||||||||||||||||
| Income tax expense | 1,259 | (1,182) | 1,116 | 649 | (335) | 1,193 | 452 | |||||||||||||||||||||||||||||||||||||||||||||||||||||||||||||||||||||||||
| Net income | 7,691 | 9,224 | 8,050 | 5,470 | 4,881 | 24,965 | 12,424 | |||||||||||||||||||||||||||||||||||||||||||||||||||||||||||||||||||||||||
| Net income applicable to common shareholders | 7,260 | 8,964 | 7,560 | 5,208 | 4,440 | 23,784 | 11,265 | |||||||||||||||||||||||||||||||||||||||||||||||||||||||||||||||||||||||||
| Average common shares issued and outstanding | 8,430.7 | 8,620.8 | 8,700.1 | 8,724.9 | 8,732.9 | 8,583.1 | 8,762.6 | |||||||||||||||||||||||||||||||||||||||||||||||||||||||||||||||||||||||||
| Average diluted common shares issued and outstanding | 8,492.8 | 8,735.5 | 8,755.6 | 8,785.0 | 8,777.5 | 8,702.2 | 8,800.5 | |||||||||||||||||||||||||||||||||||||||||||||||||||||||||||||||||||||||||
| Performance ratios | ||||||||||||||||||||||||||||||||||||||||||||||||||||||||||||||||||||||||||||||||
Return on average assets (1) | 0.99 | % | 1.23 | % | 1.13 | % | 0.78 | % | 0.71 | % | 1.12 | % | 0.63 | % | ||||||||||||||||||||||||||||||||||||||||||||||||||||||||||||||||||
Four-quarter trailing return on average assets (2) | 1.04 | 0.97 | 0.79 | 0.67 | 0.75 | n/a | n/a | |||||||||||||||||||||||||||||||||||||||||||||||||||||||||||||||||||||||||
Return on average common shareholders’ equity (1) | 11.43 | 14.33 | 12.28 | 8.39 | 7.24 | 12.67 | 6.20 | |||||||||||||||||||||||||||||||||||||||||||||||||||||||||||||||||||||||||
Return on average tangible common shareholders’ equity (3) | 15.85 | 19.90 | 17.08 | 11.73 | 10.16 | 17.61 | 8.71 | |||||||||||||||||||||||||||||||||||||||||||||||||||||||||||||||||||||||||
Return on average shareholders’ equity (1) | 11.08 | 13.47 | 11.91 | 8.03 | 7.26 | 12.15 | 6.24 | |||||||||||||||||||||||||||||||||||||||||||||||||||||||||||||||||||||||||
Return on average tangible shareholders’ equity (3) | 14.87 | 18.11 | 16.01 | 10.84 | 9.84 | 16.33 | 8.46 | |||||||||||||||||||||||||||||||||||||||||||||||||||||||||||||||||||||||||
| Total ending equity to total ending assets | 8.83 | 9.15 | 9.23 | 9.68 | 9.82 | 8.83 | 9.82 | |||||||||||||||||||||||||||||||||||||||||||||||||||||||||||||||||||||||||
| Total average equity to total average assets | 8.95 | 9.11 | 9.52 | 9.71 | 9.76 | 9.19 | 10.05 | |||||||||||||||||||||||||||||||||||||||||||||||||||||||||||||||||||||||||
| Dividend payout | 24.10 | 17.25 | 20.68 | 30.11 | 35.36 | 20.43 | 41.90 | |||||||||||||||||||||||||||||||||||||||||||||||||||||||||||||||||||||||||
| Per common share data | ||||||||||||||||||||||||||||||||||||||||||||||||||||||||||||||||||||||||||||||||
| Earnings | $ | 0.86 | $ | 1.04 | $ | 0.87 | $ | 0.60 | $ | 0.51 | $ | 2.77 | $ | 1.29 | ||||||||||||||||||||||||||||||||||||||||||||||||||||||||||||||||||
| Diluted earnings | 0.85 | 1.03 | 0.86 | 0.59 | 0.51 | 2.75 | 1.28 | |||||||||||||||||||||||||||||||||||||||||||||||||||||||||||||||||||||||||
| Dividends paid | 0.21 | 0.18 | 0.18 | 0.18 | 0.18 | 0.57 | 0.54 | |||||||||||||||||||||||||||||||||||||||||||||||||||||||||||||||||||||||||
Book value (1) | 30.22 | 29.89 | 29.07 | 28.72 | 28.33 | 30.22 | 28.33 | |||||||||||||||||||||||||||||||||||||||||||||||||||||||||||||||||||||||||
Tangible book value (3) | 21.69 | 21.61 | 20.90 | 20.60 | 20.23 | 21.69 | 20.23 | |||||||||||||||||||||||||||||||||||||||||||||||||||||||||||||||||||||||||
| Market capitalization | $ | 349,841 | $ | 349,925 | $ | 332,337 | $ | 262,206 | $ | 208,656 | $ | 349,841 | $ | 208,656 | ||||||||||||||||||||||||||||||||||||||||||||||||||||||||||||||||||
| Average balance sheet | ||||||||||||||||||||||||||||||||||||||||||||||||||||||||||||||||||||||||||||||||
| Total loans and leases | $ | 920,509 | $ | 907,900 | $ | 907,723 | $ | 934,798 | $ | 974,018 | ||||||||||||||||||||||||||||||||||||||||||||||||||||||||||||||||||||||
| Total assets | 3,076,452 | 3,015,113 | 2,879,221 | 2,791,874 | 2,739,684 | |||||||||||||||||||||||||||||||||||||||||||||||||||||||||||||||||||||||||||
| Total deposits | 1,942,705 | 1,888,834 | 1,805,747 | 1,737,139 | 1,695,488 | |||||||||||||||||||||||||||||||||||||||||||||||||||||||||||||||||||||||||||
| Long-term debt | 248,988 | 232,034 | 220,836 | 225,423 | 224,254 | |||||||||||||||||||||||||||||||||||||||||||||||||||||||||||||||||||||||||||
| Common shareholders’ equity | 252,043 | 250,948 | 249,648 | 246,840 | 243,896 | |||||||||||||||||||||||||||||||||||||||||||||||||||||||||||||||||||||||||||
| Total shareholders’ equity | 275,484 | 274,632 | 274,047 | 271,020 | 267,323 | |||||||||||||||||||||||||||||||||||||||||||||||||||||||||||||||||||||||||||
| Asset quality | ||||||||||||||||||||||||||||||||||||||||||||||||||||||||||||||||||||||||||||||||
Allowance for credit losses (4) | $ | 14,693 | $ | 15,782 | $ | 17,997 | $ | 20,680 | $ | 21,506 | ||||||||||||||||||||||||||||||||||||||||||||||||||||||||||||||||||||||
Nonperforming loans, leases and foreclosed properties (5) | 4,831 | 5,031 | 5,299 | 5,116 | 4,730 | |||||||||||||||||||||||||||||||||||||||||||||||||||||||||||||||||||||||||||
Allowance for loan and lease losses as a percentage of total loans and leases outstanding (5) | 1.43 | % | 1.55 | % | 1.80 | % | 2.04 | % | 2.07 | % | ||||||||||||||||||||||||||||||||||||||||||||||||||||||||||||||||||||||
Allowance for loan and lease losses as a percentage of total nonperforming loans and leases (5) | 279 | 287 | 313 | 380 | 431 | |||||||||||||||||||||||||||||||||||||||||||||||||||||||||||||||||||||||||||
| Net charge-offs | $ | 463 | $ | 595 | $ | 823 | $ | 881 | $ | 972 | ||||||||||||||||||||||||||||||||||||||||||||||||||||||||||||||||||||||
Annualized net charge-offs as a percentage of average loans and leases outstanding (5) | 0.20 | % | 0.27 | % | 0.37 | % | 0.38 | % | 0.40 | % | ||||||||||||||||||||||||||||||||||||||||||||||||||||||||||||||||||||||
Capital ratios at period end (6) | ||||||||||||||||||||||||||||||||||||||||||||||||||||||||||||||||||||||||||||||||
| Common equity tier 1 capital | 11.1 | % | 11.5 | % | 11.8 | % | 11.9 | % | 11.9 | % | ||||||||||||||||||||||||||||||||||||||||||||||||||||||||||||||||||||||
| Tier 1 capital | 12.6 | 13.0 | 13.3 | 13.5 | 13.5 | |||||||||||||||||||||||||||||||||||||||||||||||||||||||||||||||||||||||||||
| Total capital | 14.7 | 15.1 | 15.6 | 16.1 | 16.1 | |||||||||||||||||||||||||||||||||||||||||||||||||||||||||||||||||||||||||||
| Tier 1 leverage | 6.6 | 6.9 | 7.2 | 7.4 | 7.4 | |||||||||||||||||||||||||||||||||||||||||||||||||||||||||||||||||||||||||||
| Supplementary leverage ratio | 5.6 | 5.9 | 7.0 | 7.2 | 6.9 | |||||||||||||||||||||||||||||||||||||||||||||||||||||||||||||||||||||||||||
Tangible equity (3) | 6.7 | 7.0 | 7.0 | 7.4 | 7.4 | |||||||||||||||||||||||||||||||||||||||||||||||||||||||||||||||||||||||||||
Tangible common equity (3) | 5.9 | 6.2 | 6.2 | 6.5 | 6.6 | |||||||||||||||||||||||||||||||||||||||||||||||||||||||||||||||||||||||||||
| Total loss-absorbing capacity and long-term debt metrics | ||||||||||||||||||||||||||||||||||||||||||||||||||||||||||||||||||||||||||||||||
| Total loss-absorbing capacity to risk-weighted assets | 27.7 | % | 27.7 | % | 26.8 | % | 27.4 | % | 26.9 | % | ||||||||||||||||||||||||||||||||||||||||||||||||||||||||||||||||||||||
| Total loss-absorbing capacity to supplementary leverage exposure | 12.4 | 12.5 | 14.1 | 14.5 | 13.7 | |||||||||||||||||||||||||||||||||||||||||||||||||||||||||||||||||||||||||||
| Eligible long-term debt to risk-weighted assets | 14.4 | 14.1 | 13.0 | 13.3 | 12.9 | |||||||||||||||||||||||||||||||||||||||||||||||||||||||||||||||||||||||||||
| Eligible long-term debt to supplementary leverage exposure | 6.4 | 6.3 | 6.8 | 7.1 | 6.6 | |||||||||||||||||||||||||||||||||||||||||||||||||||||||||||||||||||||||||||
Bank of America8 | ||||||||
| Table 6 | Quarterly Average Balances and Interest Rates - FTE Basis | |||||||||||||||||||||||||||||||||||||
| Average Balance | Interest Income/ Expense (1) | Yield/ Rate | Average Balance | Interest Income/ Expense (1) | Yield/ Rate | |||||||||||||||||||||||||||||||||
| (Dollars in millions) | Third Quarter 2021 | Third Quarter 2020 | ||||||||||||||||||||||||||||||||||||
| Earning assets | ||||||||||||||||||||||||||||||||||||||
Interest-bearing deposits with the Federal Reserve, non-U.S. central banks and other banks | $ | 240,054 | $ | 50 | 0.08 | % | $ | 245,682 | $ | 10 | 0.02 | % | ||||||||||||||||||||||||||
| Time deposits placed and other short-term investments | 6,419 | 4 | 0.24 | 7,686 | (4) | (0.25) | ||||||||||||||||||||||||||||||||
Federal funds sold and securities borrowed or purchased under agreements to resell | 270,094 | 6 | 0.01 | 384,221 | 55 | 0.06 | ||||||||||||||||||||||||||||||||
| Trading account assets | 147,196 | 979 | 2.64 | 146,972 | 960 | 2.60 | ||||||||||||||||||||||||||||||||
| Debt securities | 949,009 | 3,296 | 1.39 | 533,261 | 2,147 | 1.63 | ||||||||||||||||||||||||||||||||
Loans and leases (2) | ||||||||||||||||||||||||||||||||||||||
| Residential mortgage | 215,652 | 1,487 | 2.76 | 237,414 | 1,811 | 3.05 | ||||||||||||||||||||||||||||||||
| Home equity | 30,069 | 263 | 3.47 | 37,897 | 284 | 2.99 | ||||||||||||||||||||||||||||||||
| Credit card | 75,569 | 1,952 | 10.25 | 81,309 | 2,086 | 10.20 | ||||||||||||||||||||||||||||||||
Direct/Indirect and other consumer (3) | 98,148 | 578 | 2.34 | 89,559 | 593 | 2.63 | ||||||||||||||||||||||||||||||||
| Total consumer | 419,438 | 4,280 | 4.06 | 446,179 | 4,774 | 4.26 | ||||||||||||||||||||||||||||||||
| U.S. commercial | 323,659 | 2,315 | 2.84 | 343,533 | 2,165 | 2.51 | ||||||||||||||||||||||||||||||||
| Non-U.S. commercial | 101,967 | 446 | 1.73 | 102,938 | 465 | 1.80 | ||||||||||||||||||||||||||||||||
Commercial real estate (4) | 59,881 | 378 | 2.51 | 63,262 | 393 | 2.47 | ||||||||||||||||||||||||||||||||
| Commercial lease financing | 15,564 | 116 | 2.98 | 18,106 | 138 | 3.04 | ||||||||||||||||||||||||||||||||
| Total commercial | 501,071 | 3,255 | 2.58 | 527,839 | 3,161 | 2.38 | ||||||||||||||||||||||||||||||||
| Total loans and leases | 920,509 | 7,535 | 3.25 | 974,018 | 7,935 | 3.25 | ||||||||||||||||||||||||||||||||
| Other earning assets | 120,734 | 567 | 1.86 | 83,086 | 497 | 2.39 | ||||||||||||||||||||||||||||||||
| Total earning assets | 2,654,015 | 12,437 | 1.86 | 2,374,926 | 11,600 | 1.95 | ||||||||||||||||||||||||||||||||
| Cash and due from banks | 30,101 | 32,714 | ||||||||||||||||||||||||||||||||||||
| Other assets, less allowance for loan and lease losses | 392,336 | 332,044 | ||||||||||||||||||||||||||||||||||||
| Total assets | $ | 3,076,452 | $ | 2,739,684 | ||||||||||||||||||||||||||||||||||
| Interest-bearing liabilities | ||||||||||||||||||||||||||||||||||||||
| U.S. interest-bearing deposits | ||||||||||||||||||||||||||||||||||||||
| Demand and money market deposits | $ | 931,964 | $ | 79 | 0.03 | % | $ | 842,987 | $ | 93 | 0.04 | % | ||||||||||||||||||||||||||
| Time and savings deposits | 162,337 | 41 | 0.10 | 164,648 | 116 | 0.28 | ||||||||||||||||||||||||||||||||
| Total U.S. interest-bearing deposits | 1,094,301 | 120 | 0.04 | 1,007,635 | 209 | 0.08 | ||||||||||||||||||||||||||||||||
| Non-U.S. interest-bearing deposits | 84,098 | 13 | 0.06 | 75,485 | 18 | 0.09 | ||||||||||||||||||||||||||||||||
| Total interest-bearing deposits | 1,178,399 | 133 | 0.04 | 1,083,120 | 227 | 0.08 | ||||||||||||||||||||||||||||||||
| Federal funds purchased, securities loaned or sold under agreements to repurchase, short-term borrowings and other interest-bearing liabilities | 324,582 | (41) | (0.05) | 286,582 | (24) | (0.03) | ||||||||||||||||||||||||||||||||
| Trading account liabilities | 56,496 | 285 | 2.00 | 39,689 | 212 | 2.13 | ||||||||||||||||||||||||||||||||
| Long-term debt | 248,988 | 865 | 1.37 | 224,254 | 942 | 1.67 | ||||||||||||||||||||||||||||||||
| Total interest-bearing liabilities | 1,808,465 | 1,242 | 0.27 | 1,633,645 | 1,357 | 0.33 | ||||||||||||||||||||||||||||||||
| Noninterest-bearing sources | ||||||||||||||||||||||||||||||||||||||
| Noninterest-bearing deposits | 764,306 | 612,368 | ||||||||||||||||||||||||||||||||||||
Other liabilities (5) | 228,197 | 226,348 | ||||||||||||||||||||||||||||||||||||
| Shareholders’ equity | 275,484 | 267,323 | ||||||||||||||||||||||||||||||||||||
| Total liabilities and shareholders’ equity | $ | 3,076,452 | $ | 2,739,684 | ||||||||||||||||||||||||||||||||||
| Net interest spread | 1.59 | % | 1.62 | % | ||||||||||||||||||||||||||||||||||
| Impact of noninterest-bearing sources | 0.09 | 0.10 | ||||||||||||||||||||||||||||||||||||
Net interest income/yield on earning assets (6) | $ | 11,195 | 1.68 | % | $ | 10,243 | 1.72 | % | ||||||||||||||||||||||||||||||
9Bank of America | ||||||||
| Table 7 | Year-to-Date Average Balances and Interest Rates - FTE Basis | |||||||||||||||||||||||||||||||||||||||||||||||||||||||
| Average Balance | Interest Income/ Expense (1) | Yield/ Rate | Average Balance | Interest Income/ Expense (1) | Yield/ Rate | |||||||||||||||||||||||||||||||||||||||||||||||||||
| Nine Months Ended September 30 | ||||||||||||||||||||||||||||||||||||||||||||||||||||||||
| (Dollars in millions) | 2021 | 2020 | ||||||||||||||||||||||||||||||||||||||||||||||||||||||
| Earning assets | ||||||||||||||||||||||||||||||||||||||||||||||||||||||||
| Interest-bearing deposits with the Federal Reserve, non-U.S. central banks and other banks | $ | 255,136 | $ | 106 | 0.06 | % | $ | 230,265 | $ | 311 | 0.18 | % | ||||||||||||||||||||||||||||||||||||||||||||
| Time deposits placed and other short-term investments | 7,738 | 8 | 0.14 | 9,070 | 31 | 0.45 | ||||||||||||||||||||||||||||||||||||||||||||||||||
| Federal funds sold and securities borrowed or purchased under agreements to resell | 263,581 | (43) | (0.02) | 325,356 | 900 | 0.37 | ||||||||||||||||||||||||||||||||||||||||||||||||||
| Trading account assets | 148,205 | 2,831 | 2.55 | 149,002 | 3,247 | 2.91 | ||||||||||||||||||||||||||||||||||||||||||||||||||
| Debt securities | 878,437 | 8,875 | 1.36 | 491,664 | 7,477 | 2.05 | ||||||||||||||||||||||||||||||||||||||||||||||||||
Loans and leases (2) | ||||||||||||||||||||||||||||||||||||||||||||||||||||||||
| Residential mortgage | 216,239 | 4,514 | 2.78 | 239,623 | 5,678 | 3.16 | ||||||||||||||||||||||||||||||||||||||||||||||||||
| Home equity | 31,761 | 811 | 3.41 | 39,078 | 1,013 | 3.46 | ||||||||||||||||||||||||||||||||||||||||||||||||||
| Credit card | 74,383 | 5,775 | 10.38 | 87,302 | 6,690 | 10.24 | ||||||||||||||||||||||||||||||||||||||||||||||||||
Direct/Indirect and other consumer (3) | 94,658 | 1,698 | 2.40 | 89,824 | 1,962 | 2.92 | ||||||||||||||||||||||||||||||||||||||||||||||||||
| Total consumer | 417,041 | 12,798 | 4.10 | 455,827 | 15,343 | 4.49 | ||||||||||||||||||||||||||||||||||||||||||||||||||
U.S. commercial (4) | 322,773 | 6,415 | 2.66 | 349,616 | 7,601 | 2.90 | ||||||||||||||||||||||||||||||||||||||||||||||||||
Non-U.S. commercial (4) | 96,445 | 1,284 | 1.78 | 110,096 | 1,781 | 2.16 | ||||||||||||||||||||||||||||||||||||||||||||||||||
Commercial real estate (5) | 59,632 | 1,114 | 2.50 | 64,062 | 1,406 | 2.93 | ||||||||||||||||||||||||||||||||||||||||||||||||||
| Commercial lease financing | 16,200 | 356 | 2.94 | 18,872 | 427 | 3.02 | ||||||||||||||||||||||||||||||||||||||||||||||||||
| Total commercial | 495,050 | 9,169 | 2.48 | 542,646 | 11,215 | 2.76 | ||||||||||||||||||||||||||||||||||||||||||||||||||
| Total loans and leases | 912,091 | 21,967 | 3.22 | 998,473 | 26,558 | 3.55 | ||||||||||||||||||||||||||||||||||||||||||||||||||
| Other earning assets | 106,978 | 1,696 | 2.12 | 81,079 | 1,986 | 3.27 | ||||||||||||||||||||||||||||||||||||||||||||||||||
| Total earning assets | 2,572,166 | 35,440 | 1.84 | 2,284,909 | 40,510 | 2.37 | ||||||||||||||||||||||||||||||||||||||||||||||||||
| Cash and due from banks | 31,886 | 30,663 | ||||||||||||||||||||||||||||||||||||||||||||||||||||||
| Other assets, less allowance for loan and lease losses | 386,932 | 331,035 | ||||||||||||||||||||||||||||||||||||||||||||||||||||||
| Total assets | $ | 2,990,984 | $ | 2,646,607 | ||||||||||||||||||||||||||||||||||||||||||||||||||||
| Interest-bearing liabilities | ||||||||||||||||||||||||||||||||||||||||||||||||||||||||
| U.S. interest-bearing deposits | ||||||||||||||||||||||||||||||||||||||||||||||||||||||||
| Demand and money market deposits | $ | 912,547 | $ | 234 | 0.03 | % | $ | 821,324 | $ | 898 | 0.15 | % | ||||||||||||||||||||||||||||||||||||||||||||
| Time and savings deposits | 161,156 | 132 | 0.11 | 175,275 | 658 | 0.50 | ||||||||||||||||||||||||||||||||||||||||||||||||||
| Total U.S. interest-bearing deposits | 1,073,703 | 366 | 0.05 | 996,599 | 1,556 | 0.21 | ||||||||||||||||||||||||||||||||||||||||||||||||||
| Non-U.S. interest-bearing deposits | 82,743 | 28 | 0.04 | 76,438 | 228 | 0.40 | ||||||||||||||||||||||||||||||||||||||||||||||||||
| Total interest-bearing deposits | 1,156,446 | 394 | 0.05 | 1,073,037 | 1,784 | 0.22 | ||||||||||||||||||||||||||||||||||||||||||||||||||
| Federal funds purchased, securities loaned or sold under agreements to repurchase, short-term borrowings and other interest-bearing liabilities | 312,826 | (205) | (0.09) | 295,483 | 1,024 | 0.46 | ||||||||||||||||||||||||||||||||||||||||||||||||||
| Trading account liabilities | 52,797 | 824 | 2.09 | 42,838 | 764 | 2.38 | ||||||||||||||||||||||||||||||||||||||||||||||||||
| Long-term debt | 234,056 | 2,581 | 1.48 | 218,766 | 3,445 | 2.10 | ||||||||||||||||||||||||||||||||||||||||||||||||||
| Total interest-bearing liabilities | 1,756,125 | 3,594 | 0.27 | 1,630,124 | 7,017 | 0.58 | ||||||||||||||||||||||||||||||||||||||||||||||||||
| Noninterest-bearing sources | ||||||||||||||||||||||||||||||||||||||||||||||||||||||||
| Noninterest-bearing deposits | 723,151 | 524,994 | ||||||||||||||||||||||||||||||||||||||||||||||||||||||
Other liabilities (6) | 236,982 | 225,427 | ||||||||||||||||||||||||||||||||||||||||||||||||||||||
| Shareholders’ equity | 274,726 | 266,062 | ||||||||||||||||||||||||||||||||||||||||||||||||||||||
| Total liabilities and shareholders’ equity | $ | 2,990,984 | $ | 2,646,607 | ||||||||||||||||||||||||||||||||||||||||||||||||||||
| Net interest spread | 1.57 | % | 1.79 | % | ||||||||||||||||||||||||||||||||||||||||||||||||||||
| Impact of noninterest-bearing sources | 0.09 | 0.17 | ||||||||||||||||||||||||||||||||||||||||||||||||||||||
Net interest income/yield on earning assets (7) | $ | 31,846 | 1.66 | % | $ | 33,493 | 1.96 | % | ||||||||||||||||||||||||||||||||||||||||||||||||
Bank of America10 | ||||||||
| Deposits | Consumer Lending | Total Consumer Banking | Deposits | Consumer Lending | Total Consumer Banking | ||||||||||||||||||||||||||||||||||||||||||||||||||||||||||||||||||||
| Three Months Ended March 31 | Three Months Ended September 30 | ||||||||||||||||||||||||||||||||||||||||||||||||||||||||||||||||||||||||
| (Dollars in millions) | (Dollars in millions) | 2021 | 2020 | 2021 | 2020 | 2021 | 2020 | % Change | (Dollars in millions) | 2021 | 2020 | 2021 | 2020 | 2021 | 2020 | % Change | |||||||||||||||||||||||||||||||||||||||||||||||||||||||||
| Net interest income | Net interest income | $ | 3,278 | $ | 3,948 | $ | 2,642 | $ | 2,914 | $ | 5,920 | $ | 6,862 | (14) | % | Net interest income | $ | 3,731 | $ | 3,245 | $ | 2,762 | $ | 2,645 | $ | 6,493 | $ | 5,890 | 10 | % | |||||||||||||||||||||||||||||||||||||||||||
| Noninterest income: | Noninterest income: | Noninterest income: | |||||||||||||||||||||||||||||||||||||||||||||||||||||||||||||||||||||||
| Card income | Card income | (5) | (8) | 1,194 | 1,118 | 1,189 | 1,110 | 7 | Card income | (7) | (4) | 1,324 | 1,224 | 1,317 | 1,220 | 8 | |||||||||||||||||||||||||||||||||||||||||||||||||||||||||
| Service charges | Service charges | 830 | 995 | 1 | — | 831 | 995 | (16) | Service charges | 935 | 837 | — | — | 935 | 837 | 12 | |||||||||||||||||||||||||||||||||||||||||||||||||||||||||
| All other income | All other income | 73 | 97 | 56 | 65 | 129 | 162 | (20) | All other income | 56 | 84 | 37 | 8 | 93 | 92 | 1 | |||||||||||||||||||||||||||||||||||||||||||||||||||||||||
| Total noninterest income | Total noninterest income | 898 | 1,084 | 1,251 | 1,183 | 2,149 | 2,267 | (5) | Total noninterest income | 984 | 917 | 1,361 | 1,232 | 2,345 | 2,149 | 9 | |||||||||||||||||||||||||||||||||||||||||||||||||||||||||
| Total revenue, net of interest expense | Total revenue, net of interest expense | 4,176 | 5,032 | 3,893 | 4,097 | 8,069 | 9,129 | (12) | Total revenue, net of interest expense | 4,715 | 4,162 | 4,123 | 3,877 | 8,838 | 8,039 | 10 | |||||||||||||||||||||||||||||||||||||||||||||||||||||||||
| Provision for credit losses | Provision for credit losses | 74 | 115 | (691) | 2,143 | (617) | 2,258 | (127) | Provision for credit losses | 53 | 59 | 194 | 420 | 247 | 479 | (48) | |||||||||||||||||||||||||||||||||||||||||||||||||||||||||
| Noninterest expense | Noninterest expense | 3,209 | 2,725 | 1,922 | 1,771 | 5,131 | 4,496 | 14 | Noninterest expense | 2,725 | 2,937 | 1,833 | 1,905 | 4,558 | 4,842 | (6) | |||||||||||||||||||||||||||||||||||||||||||||||||||||||||
| Income before income taxes | Income before income taxes | 893 | 2,192 | 2,662 | 183 | 3,555 | 2,375 | 50 | Income before income taxes | 1,937 | 1,166 | 2,096 | 1,552 | 4,033 | 2,718 | 48 | |||||||||||||||||||||||||||||||||||||||||||||||||||||||||
| Income tax expense | Income tax expense | 219 | 537 | 652 | 45 | 871 | 582 | 50 | Income tax expense | 474 | 286 | 514 | 380 | 988 | 666 | 48 | |||||||||||||||||||||||||||||||||||||||||||||||||||||||||
| Net income | Net income | $ | 674 | $ | 1,655 | $ | 2,010 | $ | 138 | $ | 2,684 | $ | 1,793 | 50 | Net income | $ | 1,463 | $ | 880 | $ | 1,582 | $ | 1,172 | $ | 3,045 | $ | 2,052 | 48 | |||||||||||||||||||||||||||||||||||||||||||||
Effective tax rate (1) | Effective tax rate (1) | 24.5 | % | 24.5 | % | Effective tax rate (1) | 24.5 | % | 24.5 | % | |||||||||||||||||||||||||||||||||||||||||||||||||||||||||||||||
| Net interest yield | Net interest yield | 1.46 | % | 2.17 | % | 3.74 | % | 3.76 | % | 2.51 | 3.57 | Net interest yield | 1.49 | % | 1.52 | % | 3.95 | % | 3.35 | % | 2.49 | 2.61 | |||||||||||||||||||||||||||||||||||||||||||||||||||
| Return on average allocated capital | Return on average allocated capital | 23 | 55 | 31 | 2 | 28 | 19 | Return on average allocated capital | 48 | 29 | 24 | 18 | 31 | 21 | |||||||||||||||||||||||||||||||||||||||||||||||||||||||||||
| Efficiency ratio | Efficiency ratio | 76.87 | 54.14 | 49.34 | 43.23 | 63.59 | 49.24 | Efficiency ratio | 57.75 | 70.60 | 44.48 | 49.13 | 51.56 | 60.24 | |||||||||||||||||||||||||||||||||||||||||||||||||||||||||||
| Balance Sheet | Balance Sheet | Balance Sheet | |||||||||||||||||||||||||||||||||||||||||||||||||||||||||||||||||||||||
| Three Months Ended March 31 | Three Months Ended September 30 | ||||||||||||||||||||||||||||||||||||||||||||||||||||||||||||||||||||||||
| Average | Average | 2021 | 2020 | 2021 | 2020 | 2021 | 2020 | % Change | Average | 2021 | 2020 | 2021 | 2020 | 2021 | 2020 | % Change | |||||||||||||||||||||||||||||||||||||||||||||||||||||||||
| Total loans and leases | Total loans and leases | $ | 4,607 | $ | 5,435 | $ | 286,284 | $ | 311,511 | $ | 290,891 | $ | 316,946 | (8) | % | Total loans and leases | $ | 4,387 | $ | 5,046 | $ | 276,993 | $ | 313,705 | $ | 281,380 | $ | 318,751 | (12) | % | |||||||||||||||||||||||||||||||||||||||||||
Total earning assets (2) | Total earning assets (2) | 912,135 | 731,928 | 286,720 | 312,127 | 957,112 | 773,635 | 24 | Total earning assets (2) | 991,186 | 849,190 | 277,491 | 314,079 | 1,034,471 | 896,867 | 15 | |||||||||||||||||||||||||||||||||||||||||||||||||||||||||
Total assets (2) | Total assets (2) | 950,803 | 764,117 | 290,709 | 317,580 | 999,769 | 811,277 | 23 | Total assets (2) | 1,026,811 | 886,406 | 283,631 | 316,107 | 1,076,236 | 936,112 | 15 | |||||||||||||||||||||||||||||||||||||||||||||||||||||||||
| Total deposits | Total deposits | 917,319 | 731,277 | 6,818 | 5,392 | 924,137 | 736,669 | 25 | Total deposits | 993,624 | 853,452 | 7,141 | 7,547 | 1,000,765 | 860,999 | 16 | |||||||||||||||||||||||||||||||||||||||||||||||||||||||||
| Allocated capital | Allocated capital | 12,000 | 12,000 | 26,500 | 26,500 | 38,500 | 38,500 | — | Allocated capital | 12,000 | 12,000 | 26,500 | 26,500 | 38,500 | 38,500 | — | |||||||||||||||||||||||||||||||||||||||||||||||||||||||||
| Period end | March 31 2021 | December 31 2020 | March 31 2021 | December 31 2020 | March 31 2021 | December 31 2020 | % Change | ||||||||||||||||||||||||||||||||||||||||||||||||||||||||||||||||||
| Total loans and leases | $ | 4,490 | $ | 4,673 | $ | 278,445 | $ | 295,261 | $ | 282,935 | $ | 299,934 | (6) | % | |||||||||||||||||||||||||||||||||||||||||||||||||||||||||||
Total earning assets (2) | 960,132 | 899,951 | 278,984 | 295,627 | 1,004,896 | 945,343 | 6 | ||||||||||||||||||||||||||||||||||||||||||||||||||||||||||||||||||
Total assets (2) | 997,601 | 939,629 | 284,032 | 299,185 | 1,047,413 | 988,580 | 6 | ||||||||||||||||||||||||||||||||||||||||||||||||||||||||||||||||||
| Total deposits | 964,406 | 906,092 | 7,303 | 6,560 | 971,709 | 912,652 | 6 | ||||||||||||||||||||||||||||||||||||||||||||||||||||||||||||||||||
| Deposits | Consumer Lending | Total Consumer Banking | |||||||||||||||||||||||||||||||||
| Nine Months Ended September 30 | |||||||||||||||||||||||||||||||||||
| (Dollars in millions) | 2021 | 2020 | 2021 | 2020 | 2021 | 2020 | % Change | ||||||||||||||||||||||||||||
| Net interest income | $ | 10,489 | $ | 10,491 | $ | 7,897 | $ | 8,252 | $ | 18,386 | $ | 18,743 | (2) | % | |||||||||||||||||||||
| Noninterest income: | |||||||||||||||||||||||||||||||||||
| Card income | (19) | (15) | 3,837 | 3,399 | 3,818 | 3,384 | 13 | ||||||||||||||||||||||||||||
| Service charges | 2,615 | 2,537 | 2 | 1 | 2,617 | 2,538 | 3 | ||||||||||||||||||||||||||||
| All other income | 151 | 244 | 121 | 111 | 272 | 355 | (23) | ||||||||||||||||||||||||||||
| Total noninterest income | 2,747 | 2,766 | 3,960 | 3,511 | 6,707 | 6,277 | 7 | ||||||||||||||||||||||||||||
| Total revenue, net of interest expense | 13,236 | 13,257 | 11,857 | 11,763 | 25,093 | 25,020 | — | ||||||||||||||||||||||||||||
| Provision for credit losses | 174 | 328 | (1,241) | 5,433 | (1,067) | 5,761 | (119) | ||||||||||||||||||||||||||||
| Noninterest expense | 8,789 | 8,532 | 5,759 | 5,542 | 14,548 | 14,074 | 3 | ||||||||||||||||||||||||||||
| Income before income taxes | 4,273 | 4,397 | 7,339 | 788 | 11,612 | 5,185 | 124 | ||||||||||||||||||||||||||||
| Income tax expense | 1,047 | 1,077 | 1,798 | 193 | 2,845 | 1,270 | 124 | ||||||||||||||||||||||||||||
| Net income | $ | 3,226 | $ | 3,320 | $ | 5,541 | $ | 595 | $ | 8,767 | $ | 3,915 | 124 | ||||||||||||||||||||||
Effective tax rate (1) | 24.5 | % | 24.5 | % | |||||||||||||||||||||||||||||||
| Net interest yield | 1.46 | % | 1.76 | % | 3.76 | % | 3.51 | % | 2.45 | 2.98 | |||||||||||||||||||||||||
| Return on average allocated capital | 36 | 37 | 28 | 3 | 30 | 14 | |||||||||||||||||||||||||||||
| Efficiency ratio | 66.40 | 64.36 | 48.57 | 47.11 | 57.97 | 56.25 | |||||||||||||||||||||||||||||
| Balance Sheet | |||||||||||||||||||||||||||||||||||
| Nine Months Ended September 30 | |||||||||||||||||||||||||||||||||||
| Average | 2021 | 2020 | 2021 | 2020 | 2021 | 2020 | % Change | ||||||||||||||||||||||||||||
| Total loans and leases | $ | 4,479 | $ | 5,264 | $ | 280,165 | $ | 313,820 | $ | 284,644 | $ | 319,084 | (11) | % | |||||||||||||||||||||
Total earning assets (2) | 957,561 | 794,371 | 280,617 | 314,275 | 1,001,590 | 838,792 | 19 | ||||||||||||||||||||||||||||
Total assets (2) | 994,562 | 829,505 | 285,813 | 318,214 | 1,043,787 | 877,866 | 19 | ||||||||||||||||||||||||||||
| Total deposits | 961,266 | 796,591 | 7,006 | 6,411 | 968,272 | 803,002 | 21 | ||||||||||||||||||||||||||||
| Allocated capital | 12,000 | 12,000 | 26,500 | 26,500 | 38,500 | 38,500 | — | ||||||||||||||||||||||||||||
| Period end | September 30 2021 | December 31 2020 | September 30 2021 | December 31 2020 | September 30 2021 | December 31 2020 | % Change | ||||||||||||||||||||||||||||
| Total loans and leases | $ | 4,345 | $ | 4,673 | $ | 276,458 | $ | 295,261 | $ | 280,803 | $ | 299,934 | (6) | % | |||||||||||||||||||||
Total earning assets (2) | 1,006,593 | 899,951 | 277,056 | 295,627 | 1,050,331 | 945,343 | 11 | ||||||||||||||||||||||||||||
Total assets (2) | 1,041,487 | 939,629 | 283,262 | 299,185 | 1,091,431 | 988,580 | 10 | ||||||||||||||||||||||||||||
| Total deposits | 1,008,051 | 906,092 | 7,225 | 6,560 | 1,015,276 | 912,652 | 11 | ||||||||||||||||||||||||||||
Bank of America12 | ||||||||
| Key Statistics – Deposits | Key Statistics – Deposits | Key Statistics – Deposits | ||||||||||||||||||||||||||||||||||||||||||||
| Three Months Ended March 31 | Three Months Ended September 30 | Nine Months Ended September 30 | ||||||||||||||||||||||||||||||||||||||||||||
| 2021 | 2020 | 2021 | 2020 | 2021 | 2020 | |||||||||||||||||||||||||||||||||||||||||
Total deposit spreads (excludes noninterest costs) (1) | Total deposit spreads (excludes noninterest costs) (1) | 1.73% | 2.17% | Total deposit spreads (excludes noninterest costs) (1) | 1.68% | 1.87% | 1.70% | 1.98% | ||||||||||||||||||||||||||||||||||||||
| Period End | Period End | Period End | ||||||||||||||||||||||||||||||||||||||||||||
Consumer investment assets (in millions) (2) | Consumer investment assets (in millions) (2) | $ | 324,479 | $ | 212,227 | Consumer investment assets (in millions) (2) | $ | 353,280 | $ | 266,733 | ||||||||||||||||||||||||||||||||||||
Active digital banking users (units in thousands) (3) | 40,286 | 39,075 | ||||||||||||||||||||||||||||||||||||||||||||
Active mobile banking users (units in thousands) (4) | 31,487 | 29,820 | ||||||||||||||||||||||||||||||||||||||||||||
Active digital banking users (in thousands) (3) | Active digital banking users (in thousands) (3) | 40,911 | 39,267 | |||||||||||||||||||||||||||||||||||||||||||
Active mobile banking users (in thousands) (4) | Active mobile banking users (in thousands) (4) | 32,455 | 30,601 | |||||||||||||||||||||||||||||||||||||||||||
| Financial centers | Financial centers | 4,324 | 4,297 | Financial centers | 4,215 | 4,309 | ||||||||||||||||||||||||||||||||||||||||
| ATMs | ATMs | 16,905 | 16,855 | ATMs | 16,513 | 16,962 | ||||||||||||||||||||||||||||||||||||||||
13Bank of America | ||||||||
| Key Statistics – Consumer Lending | Key Statistics – Consumer Lending | Key Statistics – Consumer Lending | ||||||||||||||||||||||||||||||||||||||||||||
| Three Months Ended March 31 | Three Months Ended September 30 | Nine Months Ended September 30 | ||||||||||||||||||||||||||||||||||||||||||||
| (Dollars in millions) | (Dollars in millions) | 2021 | 2020 | (Dollars in millions) | 2021 | 2020 | 2021 | 2020 | ||||||||||||||||||||||||||||||||||||||
Total credit card (1) | Total credit card (1) | Total credit card (1) | ||||||||||||||||||||||||||||||||||||||||||||
Gross interest yield (2) | Gross interest yield (2) | 10.52 | % | 10.49 | % | Gross interest yield (2) | 10.10 | % | 10.16 | % | 10.24 | % | 10.21 | % | ||||||||||||||||||||||||||||||||
Risk-adjusted margin (3) | Risk-adjusted margin (3) | 9.29 | 7.94 | Risk-adjusted margin (3) | 10.70 | 9.66 | 9.93 | 8.66 | ||||||||||||||||||||||||||||||||||||||
| New accounts (in thousands) | New accounts (in thousands) | 674 | 1,055 | New accounts (in thousands) | 1,049 | 487 | 2,654 | 1,991 | ||||||||||||||||||||||||||||||||||||||
| Purchase volumes | Purchase volumes | $ | 64,591 | $ | 64,379 | Purchase volumes | $ | 80,925 | $ | 64,060 | $ | 223,900 | $ | 182,133 | ||||||||||||||||||||||||||||||||
| Debit card purchase volumes | Debit card purchase volumes | $ | 107,907 | $ | 88,588 | Debit card purchase volumes | $ | 119,680 | $ | 102,004 | $ | 349,492 | $ | 280,222 | ||||||||||||||||||||||||||||||||
Key Statistics – Residential Mortgage Loan Production (1) | Key Statistics – Residential Mortgage Loan Production (1) | Key Statistics – Residential Mortgage Loan Production (1) | ||||||||||||||||||||||||||||||||||||||||||||
| Three Months Ended March 31 | Three Months Ended September 30 | Nine Months Ended September 30 | ||||||||||||||||||||||||||||||||||||||||||||
| (Dollars in millions) | (Dollars in millions) | 2021 | 2020 | (Dollars in millions) | 2021 | 2020 | 2021 | 2020 | ||||||||||||||||||||||||||||||||||||||
| Consumer Banking: | Consumer Banking: | Consumer Banking: | ||||||||||||||||||||||||||||||||||||||||||||
| First mortgage | First mortgage | $ | 9,182 | $ | 12,881 | First mortgage | $ | 12,510 | $ | 7,298 | $ | 33,194 | $ | 35,228 | ||||||||||||||||||||||||||||||||
| Home equity | Home equity | 410 | 2,641 | Home equity | 1,262 | 738 | 2,579 | 6,555 | ||||||||||||||||||||||||||||||||||||||
Total (2): | Total (2): | Total (2): | ||||||||||||||||||||||||||||||||||||||||||||
| First mortgage | First mortgage | $ | 15,233 | $ | 18,938 | First mortgage | $ | 21,232 | $ | 13,360 | $ | 56,731 | $ | 55,422 | ||||||||||||||||||||||||||||||||
| Home equity | Home equity | 503 | 3,024 | Home equity | 1,523 | 984 | 3,192 | 7,691 | ||||||||||||||||||||||||||||||||||||||
Bank of America14 | ||||||||
| Three Months Ended March 31 | Three Months Ended September 30 | Nine Months Ended September 30 | ||||||||||||||||||||||||||||||||||||||||||||||||||||||||||||||||||||||||||
| (Dollars in millions) | (Dollars in millions) | 2021 | 2020 | % Change | (Dollars in millions) | 2021 | 2020 | % Change | 2021 | 2020 | % Change | |||||||||||||||||||||||||||||||||||||||||||||||||||||||||||||||||
| Net interest income | Net interest income | $ | 1,331 | $ | 1,571 | (15) | % | Net interest income | $ | 1,451 | $ | 1,237 | 17 | % | $ | 4,137 | $ | 4,186 | (1) | % | ||||||||||||||||||||||||||||||||||||||||||||||||||||||||
| Noninterest income: | Noninterest income: | Noninterest income: | ||||||||||||||||||||||||||||||||||||||||||||||||||||||||||||||||||||||||||
| Investment and brokerage services | Investment and brokerage services | 3,391 | 3,122 | 9 | Investment and brokerage services | 3,683 | 3,105 | 19 | 10,610 | 9,081 | 17 | |||||||||||||||||||||||||||||||||||||||||||||||||||||||||||||||||
| All other income | All other income | 249 | 243 | 2 | All other income | 176 | 204 | (14) | 599 | 640 | (6) | |||||||||||||||||||||||||||||||||||||||||||||||||||||||||||||||||
| Total noninterest income | Total noninterest income | 3,640 | 3,365 | 8 | Total noninterest income | 3,859 | 3,309 | 17 | 11,209 | 9,721 | 15 | |||||||||||||||||||||||||||||||||||||||||||||||||||||||||||||||||
| Total revenue, net of interest expense | Total revenue, net of interest expense | 4,971 | 4,936 | 1 | Total revenue, net of interest expense | 5,310 | 4,546 | 17 | 15,346 | 13,907 | 10 | |||||||||||||||||||||||||||||||||||||||||||||||||||||||||||||||||
| Provision for credit losses | Provision for credit losses | (65) | 189 | (134) | Provision for credit losses | (58) | 24 | n/m | (185) | 349 | n/m | |||||||||||||||||||||||||||||||||||||||||||||||||||||||||||||||||
| Noninterest expense | Noninterest expense | 3,869 | 3,606 | 7 | Noninterest expense | 3,745 | 3,533 | 6 | 11,425 | 10,596 | 8 | |||||||||||||||||||||||||||||||||||||||||||||||||||||||||||||||||
| Income before income taxes | Income before income taxes | 1,167 | 1,141 | 2 | Income before income taxes | 1,623 | 989 | 64 | 4,106 | 2,962 | 39 | |||||||||||||||||||||||||||||||||||||||||||||||||||||||||||||||||
| Income tax expense | Income tax expense | 286 | 280 | 2 | Income tax expense | 398 | 242 | 64 | 1,006 | 726 | 39 | |||||||||||||||||||||||||||||||||||||||||||||||||||||||||||||||||
| Net income | Net income | $ | 881 | $ | 861 | 2 | Net income | $ | 1,225 | $ | 747 | 64 | $ | 3,100 | $ | 2,236 | 39 | |||||||||||||||||||||||||||||||||||||||||||||||||||||||||||
| Effective tax rate | Effective tax rate | 24.5 | % | 24.5 | % | Effective tax rate | 24.5 | % | 24.5 | % | 24.5 | % | 24.5 | % | ||||||||||||||||||||||||||||||||||||||||||||||||||||||||||||||
| Net interest yield | Net interest yield | 1.50 | 2.17 | Net interest yield | 1.54 | 1.53 | 1.51 | 1.81 | ||||||||||||||||||||||||||||||||||||||||||||||||||||||||||||||||||||
| Return on average allocated capital | Return on average allocated capital | 22 | 23 | Return on average allocated capital | 30 | 20 | 25 | 20 | ||||||||||||||||||||||||||||||||||||||||||||||||||||||||||||||||||||
| Efficiency ratio | Efficiency ratio | 77.85 | 73.06 | Efficiency ratio | 70.51 | 77.70 | 74.45 | 76.19 | ||||||||||||||||||||||||||||||||||||||||||||||||||||||||||||||||||||
| Balance Sheet | Balance Sheet | Balance Sheet | ||||||||||||||||||||||||||||||||||||||||||||||||||||||||||||||||||||||||||
| Three Months Ended March 31 | Three Months Ended September 30 | Nine Months Ended September 30 | ||||||||||||||||||||||||||||||||||||||||||||||||||||||||||||||||||||||||||
| Average | Average | 2021 | 2020 | % Change | Average | 2021 | 2020 | % Change | 2021 | 2020 | % Change | |||||||||||||||||||||||||||||||||||||||||||||||||||||||||||||||||
| Total loans and leases | Total loans and leases | $ | 188,495 | $ | 178,639 | 6 | % | Total loans and leases | $ | 199,664 | $ | 185,587 | 8 | % | $ | 194,090 | $ | 182,138 | 7 | % | ||||||||||||||||||||||||||||||||||||||||||||||||||||||||
| Total earning assets | Total earning assets | 360,099 | 290,919 | 24 | Total earning assets | 373,691 | 321,410 | 16 | 367,239 | 309,240 | 19 | |||||||||||||||||||||||||||||||||||||||||||||||||||||||||||||||||
| Total assets | Total assets | 372,594 | 303,173 | 23 | Total assets | 386,346 | 333,794 | 16 | 379,802 | 321,565 | 18 | |||||||||||||||||||||||||||||||||||||||||||||||||||||||||||||||||
| Total deposits | Total deposits | 326,370 | 263,411 | 24 | Total deposits | 339,357 | 291,845 | 16 | 333,119 | 280,828 | 19 | |||||||||||||||||||||||||||||||||||||||||||||||||||||||||||||||||
| Allocated capital | Allocated capital | 16,500 | 15,000 | 10 | Allocated capital | 16,500 | 15,000 | 10 | 16,500 | 15,000 | 10 | |||||||||||||||||||||||||||||||||||||||||||||||||||||||||||||||||
| March 31 | December 31 | September 30 | December 31 | |||||||||||||||||||||||||||||||||||||||||||||||||||||||||||||||||||||||||
| Period end | Period end | 2021 | 2020 | % Change | Period end | 2021 | 2020 | % Change | ||||||||||||||||||||||||||||||||||||||||||||||||||||||||||||||||||||
| Total loans and leases | Total loans and leases | $ | 190,060 | $ | 188,562 | 1 | % | Total loans and leases | $ | 202,268 | $ | 188,562 | 7 | % | ||||||||||||||||||||||||||||||||||||||||||||||||||||||||||||||
| Total earning assets | Total earning assets | 365,854 | 356,874 | 3 | Total earning assets | 380,857 | 356,873 | 7 | ||||||||||||||||||||||||||||||||||||||||||||||||||||||||||||||||||||
| Total assets | Total assets | 378,655 | 369,738 | 2 | Total assets | 393,708 | 369,736 | 6 | ||||||||||||||||||||||||||||||||||||||||||||||||||||||||||||||||||||
| Total deposits | Total deposits | 333,254 | 322,157 | 3 | Total deposits | 345,590 | 322,157 | 7 | ||||||||||||||||||||||||||||||||||||||||||||||||||||||||||||||||||||
15Bank of America | ||||||||
| Key Indicators and Metrics | Key Indicators and Metrics | Key Indicators and Metrics | ||||||||||||||||||||||||||||||||||||||||||||
| Three Months Ended March 31 | Three Months Ended September 30 | Nine Months Ended September 30 | ||||||||||||||||||||||||||||||||||||||||||||
| (Dollars in millions) | (Dollars in millions) | 2021 | 2020 | (Dollars in millions) | 2021 | 2020 | 2021 | 2020 | ||||||||||||||||||||||||||||||||||||||
| Revenue by Business | Revenue by Business | Revenue by Business | ||||||||||||||||||||||||||||||||||||||||||||
| Merrill Lynch Global Wealth Management | Merrill Lynch Global Wealth Management | $ | 4,185 | $ | 4,073 | Merrill Lynch Global Wealth Management | $ | 4,471 | $ | 3,748 | $ | 12,916 | $ | 11,446 | ||||||||||||||||||||||||||||||||
| Bank of America Private Bank | Bank of America Private Bank | 786 | 863 | Bank of America Private Bank | 839 | 798 | 2,430 | 2,461 | ||||||||||||||||||||||||||||||||||||||
| Total revenue, net of interest expense | Total revenue, net of interest expense | $ | 4,971 | $ | 4,936 | Total revenue, net of interest expense | $ | 5,310 | $ | 4,546 | $ | 15,346 | $ | 13,907 | ||||||||||||||||||||||||||||||||
| Client Balances by Business, at period end | Client Balances by Business, at period end | Client Balances by Business, at period end | ||||||||||||||||||||||||||||||||||||||||||||
| Merrill Lynch Global Wealth Management | Merrill Lynch Global Wealth Management | $ | 2,922,770 | $ | 2,215,531 | Merrill Lynch Global Wealth Management | $ | 3,108,358 | $ | 2,570,252 | ||||||||||||||||||||||||||||||||||||
| Bank of America Private Bank | Bank of America Private Bank | 557,569 | 443,080 | Bank of America Private Bank | 584,475 | 496,369 | ||||||||||||||||||||||||||||||||||||||||
| Total client balances | Total client balances | $ | 3,480,339 | $ | 2,658,611 | Total client balances | $ | 3,692,833 | $ | 3,066,621 | ||||||||||||||||||||||||||||||||||||
| Client Balances by Type, at period end | Client Balances by Type, at period end | Client Balances by Type, at period end | ||||||||||||||||||||||||||||||||||||||||||||
| Assets under management | Assets under management | $ | 1,467,487 | $ | 1,092,482 | Assets under management | $ | 1,578,630 | $ | 1,286,145 | ||||||||||||||||||||||||||||||||||||
| Brokerage and other assets | Brokerage and other assets | 1,535,424 | 1,155,461 | Brokerage and other assets | 1,612,472 | 1,344,538 | ||||||||||||||||||||||||||||||||||||||||
| Deposits | Deposits | 333,254 | 282,395 | Deposits | 345,590 | 295,893 | ||||||||||||||||||||||||||||||||||||||||
Loans and leases (1) | Loans and leases (1) | 192,725 | 184,011 | Loans and leases (1) | 205,055 | 189,952 | ||||||||||||||||||||||||||||||||||||||||
| Less: Managed deposits in assets under management | Less: Managed deposits in assets under management | (48,551) | (55,738) | Less: Managed deposits in assets under management | (48,914) | (49,907) | ||||||||||||||||||||||||||||||||||||||||
| Total client balances | Total client balances | $ | 3,480,339 | $ | 2,658,611 | Total client balances | $ | 3,692,833 | $ | 3,066,621 | ||||||||||||||||||||||||||||||||||||
| Assets Under Management Rollforward | Assets Under Management Rollforward | Assets Under Management Rollforward | ||||||||||||||||||||||||||||||||||||||||||||
| Assets under management, beginning of period | Assets under management, beginning of period | $ | 1,408,465 | $ | 1,275,555 | Assets under management, beginning of period | $ | 1,549,069 | $ | 1,219,748 | $ | 1,408,465 | $ | 1,275,555 | ||||||||||||||||||||||||||||||||
| Net client flows | Net client flows | 18,208 | 7,035 | Net client flows | 14,776 | 1,385 | 44,698 | 11,993 | ||||||||||||||||||||||||||||||||||||||
Market valuation/other | Market valuation/other | 40,814 | (190,108) | Market valuation/other | 14,785 | 65,012 | 125,467 | (1,403) | ||||||||||||||||||||||||||||||||||||||
| Total assets under management, end of period | Total assets under management, end of period | $ | 1,467,487 | $ | 1,092,482 | Total assets under management, end of period | $ | 1,578,630 | $ | 1,286,145 | $ | 1,578,630 | $ | 1,286,145 | ||||||||||||||||||||||||||||||||
Total wealth advisors, at period end (2) | Total wealth advisors, at period end (2) | 19,808 | 20,393 | Total wealth advisors, at period end (2) | 18,855 | 20,487 | ||||||||||||||||||||||||||||||||||||||||
Bank of America16 | ||||||||
| Three Months Ended March 31 | Three Months Ended September 30 | Nine Months Ended September 30 | ||||||||||||||||||||||||||||||||||||||||||||||||||||||||||||||||||||||||||
| (Dollars in millions) | (Dollars in millions) | 2021 | 2020 | % Change | (Dollars in millions) | 2021 | 2020 | % Change | 2021 | 2020 | % Change | |||||||||||||||||||||||||||||||||||||||||||||||||||||||||||||||||
| Net interest income | Net interest income | $ | 1,980 | $ | 2,612 | (24 | %) | Net interest income | $ | 2,186 | $ | 2,028 | 8 | % | $ | 6,150 | $ | 7,003 | (12) | % | ||||||||||||||||||||||||||||||||||||||||||||||||||||||||
| Noninterest income: | Noninterest income: | Noninterest income: | ||||||||||||||||||||||||||||||||||||||||||||||||||||||||||||||||||||||||||
| Service charges | Service charges | 847 | 796 | 6 | Service charges | 890 | 846 | 5 | 2,637 | 2,379 | 11 | |||||||||||||||||||||||||||||||||||||||||||||||||||||||||||||||||
| Investment banking fees | Investment banking fees | 1,172 | 761 | 54 | Investment banking fees | 1,297 | 970 | 34 | 3,642 | 2,912 | 25 | |||||||||||||||||||||||||||||||||||||||||||||||||||||||||||||||||
| All other income | All other income | 634 | 431 | 47 | All other income | 871 | 673 | 29 | 2,538 | 1,914 | 33 | |||||||||||||||||||||||||||||||||||||||||||||||||||||||||||||||||
| Total noninterest income | Total noninterest income | 2,653 | 1,988 | 33 | Total noninterest income | 3,058 | 2,489 | 23 | 8,817 | 7,205 | 22 | |||||||||||||||||||||||||||||||||||||||||||||||||||||||||||||||||
| Total revenue, net of interest expense | Total revenue, net of interest expense | 4,633 | 4,600 | 1 | Total revenue, net of interest expense | 5,244 | 4,517 | 16 | 14,967 | 14,208 | 5 | |||||||||||||||||||||||||||||||||||||||||||||||||||||||||||||||||
| Provision for credit losses | Provision for credit losses | (1,126) | 2,093 | n/m | Provision for credit losses | (781) | 883 | n/m | (2,738) | 4,849 | n/m | |||||||||||||||||||||||||||||||||||||||||||||||||||||||||||||||||
| Noninterest expense | Noninterest expense | 2,781 | 2,318 | 20 | Noninterest expense | 2,534 | 2,365 | 7 | 7,915 | 6,910 | 15 | |||||||||||||||||||||||||||||||||||||||||||||||||||||||||||||||||
| Income before income taxes | Income before income taxes | 2,978 | 189 | n/m | Income before income taxes | 3,491 | 1,269 | n/m | 9,790 | 2,449 | n/m | |||||||||||||||||||||||||||||||||||||||||||||||||||||||||||||||||
| Income tax expense | Income tax expense | 804 | 51 | n/m | Income tax expense | 942 | 343 | n/m | 2,643 | 661 | n/m | |||||||||||||||||||||||||||||||||||||||||||||||||||||||||||||||||
| Net income | Net income | $ | 2,174 | $ | 138 | n/m | Net income | $ | 2,549 | $ | 926 | n/m | $ | 7,147 | $ | 1,788 | n/m | |||||||||||||||||||||||||||||||||||||||||||||||||||||||||||
| Effective tax rate | Effective tax rate | 27.0 | % | 27.0 | % | Effective tax rate | 27.0 | % | 27.0 | % | 27.0 | % | 27.0 | % | ||||||||||||||||||||||||||||||||||||||||||||||||||||||||||||||
| Net interest yield | Net interest yield | 1.56 | 2.57 | Net interest yield | 1.55 | 1.61 | 1.53 | 1.96 | ||||||||||||||||||||||||||||||||||||||||||||||||||||||||||||||||||||
| Return on average allocated capital | Return on average allocated capital | 21 | 1 | Return on average allocated capital | 24 | 9 | 22 | 6 | ||||||||||||||||||||||||||||||||||||||||||||||||||||||||||||||||||||
| Efficiency ratio | Efficiency ratio | 60.03 | 50.40 | Efficiency ratio | 48.31 | 52.36 | 52.88 | 48.63 | ||||||||||||||||||||||||||||||||||||||||||||||||||||||||||||||||||||
| Balance Sheet | Balance Sheet | Balance Sheet | ||||||||||||||||||||||||||||||||||||||||||||||||||||||||||||||||||||||||||
| Three Months Ended March 31 | Three Months Ended September 30 | Nine Months Ended September 30 | ||||||||||||||||||||||||||||||||||||||||||||||||||||||||||||||||||||||||||
| Average | Average | 2021 | 2020 | % Change | Average | 2021 | 2020 | % Change | 2021 | 2020 | % Change | |||||||||||||||||||||||||||||||||||||||||||||||||||||||||||||||||
Total loans and leases | Total loans and leases | $ | 330,107 | $ | 386,483 | (15 | %) | Total loans and leases | $ | 324,736 | $ | 373,118 | (13) | % | $ | 326,632 | $ | 394,331 | (17) | % | ||||||||||||||||||||||||||||||||||||||||||||||||||||||||
| Total earning assets | Total earning assets | 515,880 | 409,052 | 26 | Total earning assets | 560,181 | 501,572 | 12 | 537,037 | 477,606 | 12 | |||||||||||||||||||||||||||||||||||||||||||||||||||||||||||||||||
| Total assets | Total assets | 576,145 | 465,926 | 24 | Total assets | 621,699 | 557,889 | 11 | 597,947 | 534,061 | 12 | |||||||||||||||||||||||||||||||||||||||||||||||||||||||||||||||||
| Total deposits | Total deposits | 487,034 | 382,373 | 27 | Total deposits | 534,166 | 471,288 | 13 | 509,445 | 449,273 | 13 | |||||||||||||||||||||||||||||||||||||||||||||||||||||||||||||||||
| Allocated capital | Allocated capital | 42,500 | 42,500 | — | Allocated capital | 42,500 | 42,500 | — | 42,500 | 42,500 | — | |||||||||||||||||||||||||||||||||||||||||||||||||||||||||||||||||
| Period end | Period end | March 31 2021 | December 31 2020 | % Change | Period end | September 30 2021 | December 31 2020 | % Change | ||||||||||||||||||||||||||||||||||||||||||||||||||||||||||||||||||||
| Total loans and leases | Total loans and leases | $ | 325,996 | $ | 339,649 | (4) | % | Total loans and leases | $ | 328,893 | $ | 339,649 | (3) | % | ||||||||||||||||||||||||||||||||||||||||||||||||||||||||||||||
| Total earning assets | Total earning assets | 533,852 | 522,650 | 2 | Total earning assets | 561,239 | 522,650 | 7 | ||||||||||||||||||||||||||||||||||||||||||||||||||||||||||||||||||||
| Total assets | Total assets | 594,235 | 580,561 | 2 | Total assets | 623,640 | 580,561 | 7 | ||||||||||||||||||||||||||||||||||||||||||||||||||||||||||||||||||||
| Total deposits | Total deposits | 506,012 | 493,748 | 2 | Total deposits | 536,476 | 493,748 | 9 | ||||||||||||||||||||||||||||||||||||||||||||||||||||||||||||||||||||
17Bank of America | ||||||||||||||
| Global Corporate, Global Commercial and Business Banking | Global Corporate, Global Commercial and Business Banking | Global Corporate, Global Commercial and Business Banking | ||||||||||||||||||||||||||||||||||||||||||||||||||||||||||||||||||||||||||||||||||||||||||||||||||
| Global Corporate Banking | Global Commercial Banking | Business Banking | Total | |||||||||||||||||||||||||||||||||||||||||||||||||||||||||||||||||||||||||||||||||||||||||||||||||
| Three Months Ended September 30 | ||||||||||||||||||||||||||||||||||||||||||||||||||||||||||||||||||||||||||||||||||||||||||||||||||||
| (Dollars in millions) | (Dollars in millions) | 2021 | 2020 | 2021 | 2020 | 2021 | 2020 | 2021 | 2020 | |||||||||||||||||||||||||||||||||||||||||||||||||||||||||||||||||||||||||||||||||||||||||||
| Revenue | Revenue | |||||||||||||||||||||||||||||||||||||||||||||||||||||||||||||||||||||||||||||||||||||||||||||||||||
| Business Lending | Business Lending | $ | 886 | $ | 791 | $ | 924 | $ | 953 | $ | 55 | $ | 59 | $ | 1,865 | $ | 1,803 | |||||||||||||||||||||||||||||||||||||||||||||||||||||||||||||||||||||||||||||||||||
| Global Transaction Services | Global Transaction Services | 821 | 658 | 819 | 745 | 227 | 209 | 1,867 | 1,612 | |||||||||||||||||||||||||||||||||||||||||||||||||||||||||||||||||||||||||||||||||||||||||||
| Total revenue, net of interest expense | Total revenue, net of interest expense | $ | 1,707 | $ | 1,449 | $ | 1,743 | $ | 1,698 | $ | 282 | $ | 268 | $ | 3,732 | $ | 3,415 | |||||||||||||||||||||||||||||||||||||||||||||||||||||||||||||||||||||||||||||||||||
| Balance Sheet | Balance Sheet | |||||||||||||||||||||||||||||||||||||||||||||||||||||||||||||||||||||||||||||||||||||||||||||||||||
| Average | Average | |||||||||||||||||||||||||||||||||||||||||||||||||||||||||||||||||||||||||||||||||||||||||||||||||||
| Total loans and leases | Total loans and leases | $ | 147,906 | $ | 174,235 | $ | 159,986 | $ | 175,536 | $ | 12,635 | $ | 13,972 | $ | 320,527 | $ | 363,743 | |||||||||||||||||||||||||||||||||||||||||||||||||||||||||||||||||||||||||||||||||||
| Total deposits | Total deposits | 261,951 | 218,593 | 213,319 | 201,523 | 56,891 | 50,946 | 532,161 | 471,062 | |||||||||||||||||||||||||||||||||||||||||||||||||||||||||||||||||||||||||||||||||||||||||||
| Global Corporate Banking | Global Commercial Banking | Business Banking | Total | Global Corporate Banking | Global Commercial Banking | Business Banking | Total | |||||||||||||||||||||||||||||||||||||||||||||||||||||||||||||||||||||||||||||||||||||||||||||
| Three Months Ended March 31 | Nine Months Ended September 30 | |||||||||||||||||||||||||||||||||||||||||||||||||||||||||||||||||||||||||||||||||||||||||||||||||||
| (Dollars in millions) | (Dollars in millions) | 2021 | 2020 | 2021 | 2020 | 2021 | 2020 | 2021 | 2020 | (Dollars in millions) | 2021 | 2020 | 2021 | 2020 | 2021 | 2020 | 2021 | 2020 | ||||||||||||||||||||||||||||||||||||||||||||||||||||||||||||||||||||||||||||||||||
| Revenue | Revenue | Revenue | ||||||||||||||||||||||||||||||||||||||||||||||||||||||||||||||||||||||||||||||||||||||||||||||||||
| Business Lending | Business Lending | $ | 654 | $ | 951 | $ | 898 | $ | 981 | $ | 55 | $ | 82 | $ | 1,607 | $ | 2,014 | Business Lending | $ | 2,529 | $ | 2,658 | $ | 2,689 | $ | 2,815 | $ | 166 | $ | 207 | $ | 5,384 | $ | 5,680 | ||||||||||||||||||||||||||||||||||||||||||||||||||||||||||||||||||
| Global Transaction Services | Global Transaction Services | 690 | 871 | 744 | 878 | 211 | 256 | 1,645 | 2,005 | Global Transaction Services | 2,245 | 2,314 | 2,334 | 2,432 | 653 | 682 | 5,232 | 5,428 | ||||||||||||||||||||||||||||||||||||||||||||||||||||||||||||||||||||||||||||||||||
| Total revenue, net of interest expense | Total revenue, net of interest expense | $ | 1,344 | $ | 1,822 | $ | 1,642 | $ | 1,859 | $ | 266 | $ | 338 | $ | 3,252 | $ | 4,019 | Total revenue, net of interest expense | $ | 4,774 | $ | 4,972 | $ | 5,023 | $ | 5,247 | $ | 819 | $ | 889 | $ | 10,616 | $ | 11,108 | ||||||||||||||||||||||||||||||||||||||||||||||||||||||||||||||||||
| Balance Sheet | Balance Sheet | Balance Sheet | ||||||||||||||||||||||||||||||||||||||||||||||||||||||||||||||||||||||||||||||||||||||||||||||||||
| Average | Average | Average | ||||||||||||||||||||||||||||||||||||||||||||||||||||||||||||||||||||||||||||||||||||||||||||||||||
Total loans and leases | Total loans and leases | $ | 148,237 | $ | 182,705 | $ | 160,309 | $ | 188,581 | $ | 13,001 | $ | 15,181 | $ | 321,547 | $ | 386,467 | Total loans and leases | $ | 148,101 | $ | 186,220 | $ | 158,939 | $ | 188,147 | $ | 12,778 | $ | 14,721 | $ | 319,818 | $ | 389,088 | ||||||||||||||||||||||||||||||||||||||||||||||||||||||||||||||||||
| Total deposits | Total deposits | 229,590 | 187,920 | 203,645 | 153,880 | 53,293 | 40,571 | 486,528 | 382,371 | Total deposits | 245,483 | 214,327 | 207,520 | 188,271 | 55,331 | 46,599 | 508,334 | 449,197 | ||||||||||||||||||||||||||||||||||||||||||||||||||||||||||||||||||||||||||||||||||
| Period end | Period end | Period end | ||||||||||||||||||||||||||||||||||||||||||||||||||||||||||||||||||||||||||||||||||||||||||||||||||
| Total loans and leases | Total loans and leases | $ | 148,914 | $ | 209,028 | $ | 155,842 | $ | 212,443 | $ | 12,813 | $ | 15,658 | $ | 317,569 | $ | 437,129 | Total loans and leases | $ | 150,797 | $ | 165,498 | $ | 162,371 | $ | 168,385 | $ | 12,640 | $ | 13,665 | $ | 325,808 | $ | 347,548 | ||||||||||||||||||||||||||||||||||||||||||||||||||||||||||||||||||
| Total deposits | Total deposits | 242,524 | 246,237 | 207,580 | 189,584 | 55,222 | 41,286 | 505,326 | 477,107 | Total deposits | 255,981 | 212,564 | 220,738 | 200,591 | 57,766 | 51,889 | 534,485 | 465,044 | ||||||||||||||||||||||||||||||||||||||||||||||||||||||||||||||||||||||||||||||||||
| Investment Banking Fees | |||||||||||||||||||||||||||||||||||||||||||||||
| Global Banking | Total Corporation | ||||||||||||||||||||||||||||||||||||||||||||||
| Three Months Ended March 31 | |||||||||||||||||||||||||||||||||||||||||||||||
| (Dollars in millions) | 2021 | 2020 | 2021 | 2020 | |||||||||||||||||||||||||||||||||||||||||||
| Products | |||||||||||||||||||||||||||||||||||||||||||||||
| Advisory | $ | 357 | $ | 247 | $ | 400 | $ | 269 | |||||||||||||||||||||||||||||||||||||||
| Debt issuance | 423 | 424 | 988 | 927 | |||||||||||||||||||||||||||||||||||||||||||
| Equity issuance | 392 | 90 | 900 | 283 | |||||||||||||||||||||||||||||||||||||||||||
| Gross investment banking fees | 1,172 | 761 | 2,288 | 1,479 | |||||||||||||||||||||||||||||||||||||||||||
| Self-led deals | (17) | (43) | (42) | (91) | |||||||||||||||||||||||||||||||||||||||||||
| Total investment banking fees | $ | 1,155 | $ | 718 | $ | 2,246 | $ | 1,388 | |||||||||||||||||||||||||||||||||||||||
Bank of America18 | ||||||||
| Investment Banking Fees | |||||||||||||||||||||||||||||||||||||||||||||||
| Global Banking | Total Corporation | Global Banking | Total Corporation | ||||||||||||||||||||||||||||||||||||||||||||
| Three Months Ended September 30 | Nine Months Ended September 30 | ||||||||||||||||||||||||||||||||||||||||||||||
| (Dollars in millions) | 2021 | 2020 | 2021 | 2020 | 2021 | 2020 | 2021 | 2020 | |||||||||||||||||||||||||||||||||||||||
| Products | |||||||||||||||||||||||||||||||||||||||||||||||
| Advisory | $ | 608 | $ | 356 | $ | 654 | $ | 397 | $ | 1,341 | $ | 948 | $ | 1,461 | $ | 1,072 | |||||||||||||||||||||||||||||||
| Debt issuance | 401 | 320 | 933 | 740 | 1,306 | 1,247 | 3,031 | 2,725 | |||||||||||||||||||||||||||||||||||||||
| Equity issuance | 288 | 294 | 637 | 664 | 995 | 717 | 2,239 | 1,687 | |||||||||||||||||||||||||||||||||||||||
| Gross investment banking fees | 1,297 | 970 | 2,224 | 1,801 | 3,642 | 2,912 | 6,731 | 5,484 | |||||||||||||||||||||||||||||||||||||||
| Self-led deals | (23) | (13) | (56) | (32) | (85) | (73) | (195) | (168) | |||||||||||||||||||||||||||||||||||||||
| Total investment banking fees | $ | 1,274 | $ | 957 | $ | 2,168 | $ | 1,769 | $ | 3,557 | $ | 2,839 | $ | 6,536 | $ | 5,316 | |||||||||||||||||||||||||||||||
| Three Months Ended September 30 | Nine Months Ended September 30 | |||||||||||||||||||||||||||||||||||||
| (Dollars in millions) | 2021 | 2020 | % Change | 2021 | 2020 | % Change | ||||||||||||||||||||||||||||||||
| Net interest income | $ | 1,000 | $ | 1,108 | (10) | % | $ | 2,980 | $ | 3,558 | (16) | % | ||||||||||||||||||||||||||
| Noninterest income: | ||||||||||||||||||||||||||||||||||||||
| Investment and brokerage services | 470 | 439 | 7 | 1,504 | 1,487 | 1 | ||||||||||||||||||||||||||||||||
| Investment banking fees | 844 | 738 | 14 | 2,784 | 2,280 | 22 | ||||||||||||||||||||||||||||||||
| Market making and similar activities | 2,014 | 1,725 | 17 | 7,448 | 7,059 | 6 | ||||||||||||||||||||||||||||||||
| All other income | 191 | 273 | (30) | 721 | 475 | 52 | ||||||||||||||||||||||||||||||||
| Total noninterest income | 3,519 | 3,175 | 11 | 12,457 | 11,301 | 10 | ||||||||||||||||||||||||||||||||
| Total revenue, net of interest expense | 4,519 | 4,283 | 6 | 15,437 | 14,859 | 4 | ||||||||||||||||||||||||||||||||
| Provision for credit losses | 16 | 21 | (24) | 33 | 233 | (86) | ||||||||||||||||||||||||||||||||
| Noninterest expense | 3,252 | 3,102 | 5 | 10,150 | 8,598 | 18 | ||||||||||||||||||||||||||||||||
| Income before income taxes | 1,251 | 1,160 | 8 | 5,254 | 6,028 | (13) | ||||||||||||||||||||||||||||||||
| Income tax expense | 325 | 302 | 8 | 1,366 | 1,567 | (13) | ||||||||||||||||||||||||||||||||
| Net income | $ | 926 | $ | 858 | 8 | $ | 3,888 | $ | 4,461 | (13) | ||||||||||||||||||||||||||||
| Effective tax rate | 26.0 | % | 26.0 | % | 26.0 | % | 26.0 | % | ||||||||||||||||||||||||||||||
| Return on average allocated capital | 10 | 9 | 14 | 17 | ||||||||||||||||||||||||||||||||||
| Efficiency ratio | 71.94 | 72.42 | 65.75 | 57.86 | ||||||||||||||||||||||||||||||||||
| Balance Sheet | ||||||||||||||||||||||||||||||||||||||
| Three Months Ended September 30 | Nine Months Ended September 30 | |||||||||||||||||||||||||||||||||||||
| 2021 | 2020 | % Change | 2021 | 2020 | % Change | |||||||||||||||||||||||||||||||||
| Average | ||||||||||||||||||||||||||||||||||||||
| Trading-related assets: | ||||||||||||||||||||||||||||||||||||||
| Trading account securities | $ | 304,133 | $ | 251,735 | 21 | % | $ | 291,500 | $ | 241,753 | 21 | % | ||||||||||||||||||||||||||
| Reverse repurchases | 117,486 | 100,395 | 17 | 111,330 | 106,968 | 4 | ||||||||||||||||||||||||||||||||
| Securities borrowed | 101,086 | 86,508 | 17 | 97,205 | 88,734 | 10 | ||||||||||||||||||||||||||||||||
| Derivative assets | 41,010 | 46,676 | (12) | 44,308 | 47,687 | (7) | ||||||||||||||||||||||||||||||||
| Total trading-related assets | 563,715 | 485,314 | 16 | 544,343 | 485,142 | 12 | ||||||||||||||||||||||||||||||||
| Total loans and leases | 97,148 | 72,319 | 34 | 87,535 | 72,702 | 20 | ||||||||||||||||||||||||||||||||
| Total earning assets | 557,333 | 476,182 | 17 | 528,113 | 485,448 | 9 | ||||||||||||||||||||||||||||||||
| Total assets | 804,938 | 680,983 | 18 | 775,552 | 685,685 | 13 | ||||||||||||||||||||||||||||||||
| Total deposits | 54,650 | 56,475 | (3) | 54,699 | 45,002 | 22 | ||||||||||||||||||||||||||||||||
| Allocated capital | 38,000 | 36,000 | 6 | 38,000 | 36,000 | 6 | ||||||||||||||||||||||||||||||||
| Period end | September 30 2021 | December 31 2020 | % Change | |||||||||||||||||||||||||||||||||||
| Total trading-related assets | $ | 536,125 | $ | 421,698 | 27 | % | ||||||||||||||||||||||||||||||||
| Total loans and leases | 98,892 | 78,415 | 26 | |||||||||||||||||||||||||||||||||||
| Total earning assets | 526,585 | 447,350 | 18 | |||||||||||||||||||||||||||||||||||
| Total assets | 776,929 | 616,609 | 26 | |||||||||||||||||||||||||||||||||||
| Total deposits | 54,941 | 53,925 | 2 | |||||||||||||||||||||||||||||||||||
| Three Months Ended March 31 | ||||||||||||||||||||||||||||||||||||||
| (Dollars in millions) | 2021 | 2020 | % Change | |||||||||||||||||||||||||||||||||||
| Net interest income | $ | 990 | $ | 1,153 | (14) | % | ||||||||||||||||||||||||||||||||
| Noninterest income: | ||||||||||||||||||||||||||||||||||||||
| Investment and brokerage services | 560 | 567 | (1) | |||||||||||||||||||||||||||||||||||
| Investment banking fees | 981 | 602 | 63 | |||||||||||||||||||||||||||||||||||
| Market making and similar activities | 3,470 | 2,973 | 17 | |||||||||||||||||||||||||||||||||||
| All other income | 197 | (69) | n/m | |||||||||||||||||||||||||||||||||||
| Total noninterest income | 5,208 | 4,073 | 28 | |||||||||||||||||||||||||||||||||||
| Total revenue, net of interest expense | 6,198 | 5,226 | 19 | |||||||||||||||||||||||||||||||||||
| Provision for credit losses | (5) | 107 | (105) | |||||||||||||||||||||||||||||||||||
| Noninterest expense | 3,427 | 2,815 | 22 | |||||||||||||||||||||||||||||||||||
| Income before income taxes | 2,776 | 2,304 | 20 | |||||||||||||||||||||||||||||||||||
| Income tax expense | 722 | 599 | 21 | |||||||||||||||||||||||||||||||||||
| Net income | $ | 2,054 | $ | 1,705 | 20 | |||||||||||||||||||||||||||||||||
| Effective tax rate | 26.0 | % | 26.0 | % | ||||||||||||||||||||||||||||||||||
| Return on average allocated capital | 22 | 19 | ||||||||||||||||||||||||||||||||||||
| Efficiency ratio | 55.30 | 53.85 | ||||||||||||||||||||||||||||||||||||
| Balance Sheet | ||||||||||||||||||||||||||||||||||||||
| Three Months Ended March 31 | ||||||||||||||||||||||||||||||||||||||
| 2021 | 2020 | % Change | ||||||||||||||||||||||||||||||||||||
| Average | ||||||||||||||||||||||||||||||||||||||
| Trading-related assets: | ||||||||||||||||||||||||||||||||||||||
| Trading account securities | $ | 265,181 | $ | 257,254 | 3 | % | ||||||||||||||||||||||||||||||||
| Reverse repurchases | 99,886 | 115,698 | (14) | |||||||||||||||||||||||||||||||||||
| Securities borrowed | 89,253 | 83,271 | 7 | |||||||||||||||||||||||||||||||||||
| Derivative assets | 47,469 | 46,896 | 1 | |||||||||||||||||||||||||||||||||||
| Total trading-related assets | 501,789 | 503,119 | — | |||||||||||||||||||||||||||||||||||
| Total loans and leases | 77,415 | 71,660 | 8 | |||||||||||||||||||||||||||||||||||
| Total earning assets | 495,324 | 501,616 | (1) | |||||||||||||||||||||||||||||||||||
| Total assets | 723,264 | 713,051 | 1 | |||||||||||||||||||||||||||||||||||
| Total deposits | 53,852 | 33,323 | 62 | |||||||||||||||||||||||||||||||||||
| Allocated capital | 38,000 | 36,000 | 6 | |||||||||||||||||||||||||||||||||||
| Period end | March 31 2021 | December 31 2020 | % Change | |||||||||||||||||||||||||||||||||||
| Total trading-related assets | $ | 524,188 | $ | 421,698 | 24 | % | ||||||||||||||||||||||||||||||||
| Total loans and leases | 84,247 | 78,415 | 7 | |||||||||||||||||||||||||||||||||||
| Total earning assets | 496,103 | 447,350 | 11 | |||||||||||||||||||||||||||||||||||
| Total assets | 745,681 | 616,609 | 21 | |||||||||||||||||||||||||||||||||||
| Total deposits | 61,450 | 53,925 | 14 | |||||||||||||||||||||||||||||||||||
Sales and Trading Revenue (1, 2, 3) | Sales and Trading Revenue (1, 2, 3) | Sales and Trading Revenue (1, 2, 3) | ||||||||||||||||||||||||||||||||||||||||||||
| Three Months Ended March 31 | Three Months Ended September 30 | Nine Months Ended September 30 | ||||||||||||||||||||||||||||||||||||||||||||
| (Dollars in millions) | (Dollars in millions) | 2021 | 2020 | (Dollars in millions) | 2021 | 2020 | 2021 | 2020 | ||||||||||||||||||||||||||||||||||||||
| Sales and trading revenue | Sales and trading revenue | Sales and trading revenue | ||||||||||||||||||||||||||||||||||||||||||||
| Fixed income, currencies and commodities | Fixed income, currencies and commodities | $ | 3,242 | $ | 2,945 | Fixed income, currencies and commodities | $ | 2,009 | $ | 2,019 | $ | 7,188 | $ | 7,905 | ||||||||||||||||||||||||||||||||
| Equities | Equities | 1,836 | 1,690 | Equities | 1,605 | 1,205 | 5,065 | 4,105 | ||||||||||||||||||||||||||||||||||||||
| Total sales and trading revenue | Total sales and trading revenue | $ | 5,078 | $ | 4,635 | Total sales and trading revenue | $ | 3,614 | $ | 3,224 | $ | 12,253 | $ | 12,010 | ||||||||||||||||||||||||||||||||
Sales and trading revenue, excluding net DVA (4) | Sales and trading revenue, excluding net DVA (4) | Sales and trading revenue, excluding net DVA (4) | ||||||||||||||||||||||||||||||||||||||||||||
| Fixed income, currencies and commodities | Fixed income, currencies and commodities | $ | 3,251 | $ | 2,671 | Fixed income, currencies and commodities | $ | 2,025 | $ | 2,126 | $ | 7,241 | $ | 7,983 | ||||||||||||||||||||||||||||||||
| Equities | Equities | 1,829 | 1,664 | Equities | 1,609 | 1,214 | 5,068 | 4,104 | ||||||||||||||||||||||||||||||||||||||
| Total sales and trading revenue, excluding net DVA | Total sales and trading revenue, excluding net DVA | $ | 5,080 | $ | 4,335 | Total sales and trading revenue, excluding net DVA | $ | 3,634 | $ | 3,340 | $ | 12,309 | $ | 12,087 | ||||||||||||||||||||||||||||||||
Bank of America20 | ||||||||
| Three Months Ended March 31 | Three Months Ended September 30 | Nine Months Ended September 30 | ||||||||||||||||||||||||||||||||||||||||||||||||||||||||||||||||||||||||||
| (Dollars in millions) | (Dollars in millions) | 2021 | 2020 | % Change | (Dollars in millions) | 2021 | 2020 | % Change | 2021 | 2020 | % Change | |||||||||||||||||||||||||||||||||||||||||||||||||||||||||||||||||
| Net interest income | Net interest income | $ | 87 | $ | 76 | 14 | % | Net interest income | $ | 65 | $ | (20) | n/m | $ | 193 | $ | 3 | n/m | ||||||||||||||||||||||||||||||||||||||||||||||||||||||||||
| Noninterest income (loss) | Noninterest income (loss) | (1,026) | (1,056) | (3) | Noninterest income (loss) | (1,109) | (915) | 21 | % | (3,661) | (2,182) | 68 | % | |||||||||||||||||||||||||||||||||||||||||||||||||||||||||||||||
| Total revenue, net of interest expense | Total revenue, net of interest expense | (939) | (980) | (4) | Total revenue, net of interest expense | (1,044) | (935) | 12 | (3,468) | (2,179) | 59 | |||||||||||||||||||||||||||||||||||||||||||||||||||||||||||||||||
| Provision for credit losses | Provision for credit losses | (47) | 114 | (141) | Provision for credit losses | (48) | (18) | n/m | (148) | 75 | n/m | |||||||||||||||||||||||||||||||||||||||||||||||||||||||||||||||||
| Noninterest expense | Noninterest expense | 307 | 240 | 28 | Noninterest expense | 351 | 559 | (37) | 962 | 1,108 | (13) | |||||||||||||||||||||||||||||||||||||||||||||||||||||||||||||||||
| Loss before income taxes | Loss before income taxes | (1,199) | (1,334) | (10) | Loss before income taxes | (1,347) | (1,476) | (9) | (4,282) | (3,362) | 27 | |||||||||||||||||||||||||||||||||||||||||||||||||||||||||||||||||
| Income tax benefit | Income tax benefit | (1,456) | (847) | 72 | Income tax benefit | (1,293) | (1,774) | (27) | (6,345) | (3,386) | 87 | |||||||||||||||||||||||||||||||||||||||||||||||||||||||||||||||||
| Net income (loss) | Net income (loss) | $ | 257 | $ | (487) | n/m | Net income (loss) | $ | (54) | $ | 298 | (118) | $ | 2,063 | $ | 24 | n/m | |||||||||||||||||||||||||||||||||||||||||||||||||||||||||||
| Balance Sheet | Balance Sheet | Balance Sheet | ||||||||||||||||||||||||||||||||||||||||||||||||||||||||||||||||||||||||||
| Three Months Ended March 31 | Three Months Ended September 30 | Nine Months Ended September 30 | ||||||||||||||||||||||||||||||||||||||||||||||||||||||||||||||||||||||||||
| Average | Average | 2021 | 2020 | % Change | Average | 2021 | 2020 | % Change | 2021 | 2020 | % Change | |||||||||||||||||||||||||||||||||||||||||||||||||||||||||||||||||
| Total loans and leases | Total loans and leases | $ | 20,815 | $ | 36,555 | (43) | % | Total loans and leases | $ | 17,581 | $ | 24,243 | (27) | % | $ | 19,190 | $ | 30,218 | (36) | % | ||||||||||||||||||||||||||||||||||||||||||||||||||||||||
Total assets (1) | Total assets (1) | 207,449 | 201,501 | 3 | Total assets (1) | 187,233 | 230,906 | (19) | 193,896 | 227,430 | (15) | |||||||||||||||||||||||||||||||||||||||||||||||||||||||||||||||||
| Total deposits | Total deposits | 14,354 | 23,560 | (39) | Total deposits | 13,767 | 14,881 | (7) | 14,062 | 19,926 | (29) | |||||||||||||||||||||||||||||||||||||||||||||||||||||||||||||||||
| Period end | Period end | March 31 2021 | December 31 2020 | % Change | Period end | September 30 2021 | December 31 2020 | % Change | ||||||||||||||||||||||||||||||||||||||||||||||||||||||||||||||||||||
| Total loans and leases | Total loans and leases | $ | 19,850 | $ | 21,301 | (7) | % | Total loans and leases | $ | 16,880 | $ | 21,301 | (21) | % | ||||||||||||||||||||||||||||||||||||||||||||||||||||||||||||||
Total assets (1) | Total assets (1) | 204,008 | 264,139 | (23) | Total assets (1) | 199,738 | 264,141 | (24) | ||||||||||||||||||||||||||||||||||||||||||||||||||||||||||||||||||||
| Total deposits | Total deposits | 12,513 | 12,998 | (4) | Total deposits | 12,521 | 12,998 | (4) | ||||||||||||||||||||||||||||||||||||||||||||||||||||||||||||||||||||
21Bank of America | ||||||||
Bank of America22 | ||||||||
| Table 7 | Bank of America Corporation Regulatory Capital under Basel 3 | |||||||||||||||||||||||||||||||||||||||||||||||||||||||||||||||||||||||||||||||||||||||||||||||||||
| Table 8 | Table 8 | Bank of America Corporation Regulatory Capital under Basel 3 | ||||||||||||||||||||||||||||||||||||||||||||||||||||||||||||||||||||||||||||||||||||||||||||||||||
Standardized Approach (1) | Advanced Approaches (1) | Regulatory Minimum (2) | Standardized Approach (1) | Advanced Approaches (1) | Regulatory Minimum (2) | |||||||||||||||||||||||||||||||||||||||||||||||||||||||||||||||||||||||||||||||||||||||||||||||
| (Dollars in millions, except as noted) | (Dollars in millions, except as noted) | March 31, 2021 | (Dollars in millions, except as noted) | September 30, 2021 | ||||||||||||||||||||||||||||||||||||||||||||||||||||||||||||||||||||||||||||||||||||||||||||||||
| Risk-based capital metrics: | Risk-based capital metrics: | Risk-based capital metrics: | ||||||||||||||||||||||||||||||||||||||||||||||||||||||||||||||||||||||||||||||||||||||||||||||||||
| Common equity tier 1 capital | Common equity tier 1 capital | $ | 177,789 | $ | 177,789 | Common equity tier 1 capital | $ | 174,407 | $ | 174,407 | ||||||||||||||||||||||||||||||||||||||||||||||||||||||||||||||||||||||||||||||||||||||||||
| Tier 1 capital | Tier 1 capital | 201,224 | 201,224 | Tier 1 capital | 197,842 | 197,842 | ||||||||||||||||||||||||||||||||||||||||||||||||||||||||||||||||||||||||||||||||||||||||||||||
Total capital (3) | Total capital (3) | 236,000 | 227,693 | Total capital (3) | 230,506 | 223,997 | ||||||||||||||||||||||||||||||||||||||||||||||||||||||||||||||||||||||||||||||||||||||||||||||
| Risk-weighted assets (in billions) | Risk-weighted assets (in billions) | 1,508 | 1,365 | Risk-weighted assets (in billions) | 1,568 | 1,380 | ||||||||||||||||||||||||||||||||||||||||||||||||||||||||||||||||||||||||||||||||||||||||||||||
| Common equity tier 1 capital ratio | Common equity tier 1 capital ratio | 11.8 | % | 13.0 | % | 9.5 | % | Common equity tier 1 capital ratio | 11.1 | % | 12.6 | % | 9.5 | % | ||||||||||||||||||||||||||||||||||||||||||||||||||||||||||||||||||||||||||||||||||||||
| Tier 1 capital ratio | Tier 1 capital ratio | 13.3 | 14.7 | 11.0 | Tier 1 capital ratio | 12.6 | 14.3 | 11.0 | ||||||||||||||||||||||||||||||||||||||||||||||||||||||||||||||||||||||||||||||||||||||||||||
| Total capital ratio | Total capital ratio | 15.6 | 16.7 | 13.0 | Total capital ratio | 14.7 | 16.2 | 13.0 | ||||||||||||||||||||||||||||||||||||||||||||||||||||||||||||||||||||||||||||||||||||||||||||
| Leverage-based metrics: | Leverage-based metrics: | Leverage-based metrics: | ||||||||||||||||||||||||||||||||||||||||||||||||||||||||||||||||||||||||||||||||||||||||||||||||||
Adjusted quarterly average assets (in billions) (4) | Adjusted quarterly average assets (in billions) (4) | $ | 2,805 | $ | 2,805 | Adjusted quarterly average assets (in billions) (4) | $ | 3,000 | $ | 3,000 | ||||||||||||||||||||||||||||||||||||||||||||||||||||||||||||||||||||||||||||||||||||||||||
| Tier 1 leverage ratio | Tier 1 leverage ratio | 7.2 | % | 7.2 | % | 4.0 | Tier 1 leverage ratio | 6.6 | % | 6.6 | % | 4.0 | ||||||||||||||||||||||||||||||||||||||||||||||||||||||||||||||||||||||||||||||||||||||||
Supplementary leverage exposure (in billions) (5) | Supplementary leverage exposure (in billions) (5) | $ | 2,868 | Supplementary leverage exposure (in billions) (5) | $ | 3,516 | ||||||||||||||||||||||||||||||||||||||||||||||||||||||||||||||||||||||||||||||||||||||||||||||
| Supplementary leverage ratio | Supplementary leverage ratio | 7.0 | % | 5.0 | Supplementary leverage ratio | 5.6 | % | 5.0 | ||||||||||||||||||||||||||||||||||||||||||||||||||||||||||||||||||||||||||||||||||||||||||||
| December 31, 2020 | December 31, 2020 | |||||||||||||||||||||||||||||||||||||||||||||||||||||||||||||||||||||||||||||||||||||||||||||||||||
| Risk-based capital metrics: | Risk-based capital metrics: | Risk-based capital metrics: | ||||||||||||||||||||||||||||||||||||||||||||||||||||||||||||||||||||||||||||||||||||||||||||||||||
| Common equity tier 1 capital | Common equity tier 1 capital | $ | 176,660 | $ | 176,660 | Common equity tier 1 capital | $ | 176,660 | $ | 176,660 | ||||||||||||||||||||||||||||||||||||||||||||||||||||||||||||||||||||||||||||||||||||||||||
| Tier 1 capital | Tier 1 capital | 200,096 | 200,096 | Tier 1 capital | 200,096 | 200,096 | ||||||||||||||||||||||||||||||||||||||||||||||||||||||||||||||||||||||||||||||||||||||||||||||
Total capital (3) | Total capital (3) | 237,936 | 227,685 | Total capital (3) | 237,936 | 227,685 | ||||||||||||||||||||||||||||||||||||||||||||||||||||||||||||||||||||||||||||||||||||||||||||||
| Risk-weighted assets (in billions) | Risk-weighted assets (in billions) | 1,480 | 1,371 | Risk-weighted assets (in billions) | 1,480 | 1,371 | ||||||||||||||||||||||||||||||||||||||||||||||||||||||||||||||||||||||||||||||||||||||||||||||
| Common equity tier 1 capital ratio | Common equity tier 1 capital ratio | 11.9 | % | 12.9 | % | 9.5 | % | Common equity tier 1 capital ratio | 11.9 | % | 12.9 | % | 9.5 | % | ||||||||||||||||||||||||||||||||||||||||||||||||||||||||||||||||||||||||||||||||||||||
| Tier 1 capital ratio | Tier 1 capital ratio | 13.5 | 14.6 | 11.0 | Tier 1 capital ratio | 13.5 | 14.6 | 11.0 | ||||||||||||||||||||||||||||||||||||||||||||||||||||||||||||||||||||||||||||||||||||||||||||
| Total capital ratio | Total capital ratio | 16.1 | 16.6 | 13.0 | Total capital ratio | 16.1 | 16.6 | 13.0 | ||||||||||||||||||||||||||||||||||||||||||||||||||||||||||||||||||||||||||||||||||||||||||||
| Leverage-based metrics: | Leverage-based metrics: | Leverage-based metrics: | ||||||||||||||||||||||||||||||||||||||||||||||||||||||||||||||||||||||||||||||||||||||||||||||||||
Adjusted quarterly average assets (in billions) (4) | Adjusted quarterly average assets (in billions) (4) | $ | 2,719 | $ | 2,719 | Adjusted quarterly average assets (in billions) (4) | $ | 2,719 | $ | 2,719 | ||||||||||||||||||||||||||||||||||||||||||||||||||||||||||||||||||||||||||||||||||||||||||
| Tier 1 leverage ratio | Tier 1 leverage ratio | 7.4 | % | 7.4 | % | 4.0 | Tier 1 leverage ratio | 7.4 | % | 7.4 | % | 4.0 | ||||||||||||||||||||||||||||||||||||||||||||||||||||||||||||||||||||||||||||||||||||||||
Supplementary leverage exposure (in billions) (5) | Supplementary leverage exposure (in billions) (5) | $ | 2,786 | Supplementary leverage exposure (in billions) (5) | $ | 2,786 | ||||||||||||||||||||||||||||||||||||||||||||||||||||||||||||||||||||||||||||||||||||||||||||||
| Supplementary leverage ratio | Supplementary leverage ratio | 7.2 | % | 5.0 | Supplementary leverage ratio | 7.2 | % | 5.0 | ||||||||||||||||||||||||||||||||||||||||||||||||||||||||||||||||||||||||||||||||||||||||||||
23Bank of America | ||||||||
| Table 8 | Capital Composition under Basel 3 | |||||||||||||||||||||||||||
| Table 9 | Table 9 | Capital Composition under Basel 3 | ||||||||||||||||||||||||||
| (Dollars in millions) | (Dollars in millions) | March 31 2021 | December 31 2020 | (Dollars in millions) | September 30 2021 | December 31 2020 | ||||||||||||||||||||||
| Total common shareholders’ equity | Total common shareholders’ equity | $ | 249,681 | $ | 248,414 | Total common shareholders’ equity | $ | 249,023 | $ | 248,414 | ||||||||||||||||||
CECL transitional amount (1) | CECL transitional amount (1) | 3,544 | 4,213 | CECL transitional amount (1) | 2,722 | 4,213 | ||||||||||||||||||||||
| Goodwill, net of related deferred tax liabilities | Goodwill, net of related deferred tax liabilities | (68,565) | (68,565) | Goodwill, net of related deferred tax liabilities | (68,638) | (68,565) | ||||||||||||||||||||||
| Deferred tax assets arising from net operating loss and tax credit carryforwards | Deferred tax assets arising from net operating loss and tax credit carryforwards | (5,904) | (5,773) | Deferred tax assets arising from net operating loss and tax credit carryforwards | (7,638) | (5,773) | ||||||||||||||||||||||
| Intangibles, other than mortgage servicing rights, net of related deferred tax liabilities | Intangibles, other than mortgage servicing rights, net of related deferred tax liabilities | (1,604) | (1,617) | Intangibles, other than mortgage servicing rights, net of related deferred tax liabilities | (1,644) | (1,617) | ||||||||||||||||||||||
| Defined benefit pension plan net assets | Defined benefit pension plan net assets | (1,181) | (1,164) | Defined benefit pension plan net assets | (1,223) | (1,164) | ||||||||||||||||||||||
| Cumulative unrealized net (gain) loss related to changes in fair value of financial liabilities attributable to own creditworthiness, net-of-tax | Cumulative unrealized net (gain) loss related to changes in fair value of financial liabilities attributable to own creditworthiness, net-of-tax | 1,625 | 1,753 | Cumulative unrealized net (gain) loss related to changes in fair value of financial liabilities attributable to own creditworthiness, net-of-tax | 1,477 | 1,753 | ||||||||||||||||||||||
| Other | Other | 193 | (601) | Other | 328 | (601) | ||||||||||||||||||||||
| Common equity tier 1 capital | Common equity tier 1 capital | 177,789 | 176,660 | Common equity tier 1 capital | 174,407 | 176,660 | ||||||||||||||||||||||
| Qualifying preferred stock, net of issuance cost | Qualifying preferred stock, net of issuance cost | 23,440 | 23,437 | Qualifying preferred stock, net of issuance cost | 23,440 | 23,437 | ||||||||||||||||||||||
| Other | Other | (5) | (1) | Other | (5) | (1) | ||||||||||||||||||||||
| Tier 1 capital | Tier 1 capital | 201,224 | 200,096 | Tier 1 capital | 197,842 | 200,096 | ||||||||||||||||||||||
| Tier 2 capital instruments | Tier 2 capital instruments | 21,137 | 22,213 | Tier 2 capital instruments | 21,756 | 22,213 | ||||||||||||||||||||||
| Qualifying allowance for credit losses | Qualifying allowance for credit losses | 13,642 | 15,649 | Qualifying allowance for credit losses | 11,177 | 15,649 | ||||||||||||||||||||||
| Other | Other | (3) | (22) | Other | (269) | (22) | ||||||||||||||||||||||
| Total capital under the Standardized approach | Total capital under the Standardized approach | 236,000 | 237,936 | Total capital under the Standardized approach | 230,506 | 237,936 | ||||||||||||||||||||||
Adjustment in qualifying allowance for credit losses under the Advanced approaches (2) | Adjustment in qualifying allowance for credit losses under the Advanced approaches (2) | (8,307) | (10,251) | Adjustment in qualifying allowance for credit losses under the Advanced approaches (2) | (6,509) | (10,251) | ||||||||||||||||||||||
| Total capital under the Advanced approaches | Total capital under the Advanced approaches | $ | 227,693 | $ | 227,685 | Total capital under the Advanced approaches | $ | 223,997 | $ | 227,685 | ||||||||||||||||||
| Table 9 | Risk-weighted Assets under Basel 3 | |||||||||||||||||||||||||||||||||||||||||||||||||||
| Table 10 | Table 10 | Risk-weighted Assets under Basel 3 | ||||||||||||||||||||||||||||||||||||||||||||||||||
| Standardized Approach | Advanced Approaches | Standardized Approach | Advanced Approaches | Standardized Approach | Advanced Approaches | Standardized Approach | Advanced Approaches | |||||||||||||||||||||||||||||||||||||||||||||
| (Dollars in billions) | (Dollars in billions) | March 31, 2021 | December 31, 2020 | (Dollars in billions) | September 30, 2021 | December 31, 2020 | ||||||||||||||||||||||||||||||||||||||||||||||
| Credit risk | Credit risk | $ | 1,444 | $ | 888 | $ | 1,420 | $ | 896 | Credit risk | $ | 1,506 | $ | 901 | $ | 1,420 | $ | 896 | ||||||||||||||||||||||||||||||||||
| Market risk | Market risk | 64 | 63 | 60 | 60 | Market risk | 62 | 62 | 60 | 60 | ||||||||||||||||||||||||||||||||||||||||||
| Operational risk | Operational risk | n/a | 372 | n/a | 372 | Operational risk | n/a | 375 | n/a | 372 | ||||||||||||||||||||||||||||||||||||||||||
| Risks related to credit valuation adjustments | Risks related to credit valuation adjustments | n/a | 42 | n/a | 43 | Risks related to credit valuation adjustments | n/a | 42 | n/a | 43 | ||||||||||||||||||||||||||||||||||||||||||
| Total risk-weighted assets | Total risk-weighted assets | $ | 1,508 | $ | 1,365 | $ | 1,480 | $ | 1,371 | Total risk-weighted assets | $ | 1,568 | $ | 1,380 | $ | 1,480 | $ | 1,371 | ||||||||||||||||||||||||||||||||||
Bank of America24 | ||||||||
| Table 10 | Bank of America, N.A. Regulatory Capital under Basel 3 | |||||||||||||||||||||||||||||||||||||||||||||||||||
| Table 11 | Table 11 | Bank of America, N.A. Regulatory Capital under Basel 3 | ||||||||||||||||||||||||||||||||||||||||||||||||||
Standardized Approach (1) | Advanced Approaches (1) | Regulatory Minimum (2) | Standardized Approach (1) | Advanced Approaches (1) | Regulatory Minimum (2) | |||||||||||||||||||||||||||||||||||||||||||||||
| (Dollars in millions, except as noted) | (Dollars in millions, except as noted) | March 31, 2021 | (Dollars in millions, except as noted) | September 30, 2021 | ||||||||||||||||||||||||||||||||||||||||||||||||
| Risk-based capital metrics: | Risk-based capital metrics: | Risk-based capital metrics: | ||||||||||||||||||||||||||||||||||||||||||||||||||
| Common equity tier 1 capital | Common equity tier 1 capital | $ | 166,685 | $ | 166,685 | Common equity tier 1 capital | $ | 173,710 | $ | 173,710 | ||||||||||||||||||||||||||||||||||||||||||
| Tier 1 capital | Tier 1 capital | 166,685 | 166,685 | Tier 1 capital | 173,710 | 173,710 | ||||||||||||||||||||||||||||||||||||||||||||||
Total capital (3) | Total capital (3) | 181,994 | 172,785 | Total capital (3) | 186,588 | 179,901 | ||||||||||||||||||||||||||||||||||||||||||||||
| Risk-weighted assets (in billions) | Risk-weighted assets (in billions) | 1,230 | 1,002 | Risk-weighted assets (in billions) | 1,288 | 1,012 | ||||||||||||||||||||||||||||||||||||||||||||||
| Common equity tier 1 capital ratio | Common equity tier 1 capital ratio | 13.5 | % | 16.6 | % | 7.0 | % | Common equity tier 1 capital ratio | 13.5 | % | 17.2 | % | 7.0 | % | ||||||||||||||||||||||||||||||||||||||
| Tier 1 capital ratio | Tier 1 capital ratio | 13.5 | 16.6 | 8.5 | Tier 1 capital ratio | 13.5 | 17.2 | 8.5 | ||||||||||||||||||||||||||||||||||||||||||||
| Total capital ratio | Total capital ratio | 14.8 | 17.2 | 10.5 | Total capital ratio | 14.5 | 17.8 | 10.5 | ||||||||||||||||||||||||||||||||||||||||||||
| Leverage-based metrics: | Leverage-based metrics: | Leverage-based metrics: | ||||||||||||||||||||||||||||||||||||||||||||||||||
Adjusted quarterly average assets (in billions) (4) | Adjusted quarterly average assets (in billions) (4) | $ | 2,182 | $ | 2,182 | Adjusted quarterly average assets (in billions) (4) | $ | 2,329 | $ | 2,329 | ||||||||||||||||||||||||||||||||||||||||||
| Tier 1 leverage ratio | Tier 1 leverage ratio | 7.6 | % | 7.6 | % | 5.0 | Tier 1 leverage ratio | 7.5 | % | 7.5 | % | 5.0 | ||||||||||||||||||||||||||||||||||||||||
| Supplementary leverage exposure (in billions) | Supplementary leverage exposure (in billions) | $ | 2,574 | Supplementary leverage exposure (in billions) | $ | 2,736 | ||||||||||||||||||||||||||||||||||||||||||||||
| Supplementary leverage ratio | Supplementary leverage ratio | 6.5 | % | 6.0 | Supplementary leverage ratio | 6.3 | % | 6.0 | ||||||||||||||||||||||||||||||||||||||||||||
| December 31, 2020 | December 31, 2020 | |||||||||||||||||||||||||||||||||||||||||||||||||||
| Risk-based capital metrics: | Risk-based capital metrics: | Risk-based capital metrics: | ||||||||||||||||||||||||||||||||||||||||||||||||||
| Common equity tier 1 capital | Common equity tier 1 capital | $ | 164,593 | $ | 164,593 | Common equity tier 1 capital | $ | 164,593 | $ | 164,593 | ||||||||||||||||||||||||||||||||||||||||||
| Tier 1 capital | Tier 1 capital | 164,593 | 164,593 | Tier 1 capital | 164,593 | 164,593 | ||||||||||||||||||||||||||||||||||||||||||||||
Total capital (3) | Total capital (3) | 181,370 | 170,992 | Total capital (3) | 181,370 | 170,922 | ||||||||||||||||||||||||||||||||||||||||||||||
| Risk-weighted assets (in billions) | Risk-weighted assets (in billions) | 1,221 | 1,014 | Risk-weighted assets (in billions) | 1,221 | 1,014 | ||||||||||||||||||||||||||||||||||||||||||||||
| Common equity tier 1 capital ratio | Common equity tier 1 capital ratio | 13.5 | % | 16.2 | % | 7.0 | % | Common equity tier 1 capital ratio | 13.5 | % | 16.2 | % | 7.0 | % | ||||||||||||||||||||||||||||||||||||||
| Tier 1 capital ratio | Tier 1 capital ratio | 13.5 | 16.2 | 8.5 | Tier 1 capital ratio | 13.5 | 16.2 | 8.5 | ||||||||||||||||||||||||||||||||||||||||||||
| Total capital ratio | Total capital ratio | 14.9 | 16.9 | 10.5 | Total capital ratio | 14.9 | 16.9 | 10.5 | ||||||||||||||||||||||||||||||||||||||||||||
| Leverage-based metrics: | Leverage-based metrics: | Leverage-based metrics: | ||||||||||||||||||||||||||||||||||||||||||||||||||
Adjusted quarterly average assets (in billions) (4) | Adjusted quarterly average assets (in billions) (4) | $ | 2,143 | $ | 2,143 | Adjusted quarterly average assets (in billions) (4) | $ | 2,143 | $ | 2,143 | ||||||||||||||||||||||||||||||||||||||||||
| Tier 1 leverage ratio | Tier 1 leverage ratio | 7.7 | % | 7.7 | % | 5.0 | Tier 1 leverage ratio | 7.7 | % | 7.7 | % | 5.0 | ||||||||||||||||||||||||||||||||||||||||
| Supplementary leverage exposure (in billions) | Supplementary leverage exposure (in billions) | $ | 2,525 | Supplementary leverage exposure (in billions) | $ | 2,525 | ||||||||||||||||||||||||||||||||||||||||||||||
| Supplementary leverage ratio | Supplementary leverage ratio | 6.5 | % | 6.0 | Supplementary leverage ratio | 6.5 | % | 6.0 | ||||||||||||||||||||||||||||||||||||||||||||
25Bank of America | ||||||||||||||
| Table 11 | Bank of America Corporation Total Loss-Absorbing Capacity and Long-Term Debt | |||||||||||||||||||||||||||||||||||||||||||||||||||||||||||||||
| Table 12 | Table 12 | Bank of America Corporation Total Loss-Absorbing Capacity and Long-Term Debt | ||||||||||||||||||||||||||||||||||||||||||||||||||||||||||||||
TLAC (1) | Regulatory Minimum (2) | Long-term Debt | Regulatory Minimum (3) | TLAC (1) | Regulatory Minimum (2) | Long-term Debt | Regulatory Minimum (3) | |||||||||||||||||||||||||||||||||||||||||||||||||||||||||
| (Dollars in millions) | (Dollars in millions) | March 31, 2021 | (Dollars in millions) | September 30, 2021 | ||||||||||||||||||||||||||||||||||||||||||||||||||||||||||||
| Total eligible balance | Total eligible balance | $ | 404,440 | $ | 195,323 | Total eligible balance | $ | 434,224 | $ | 226,431 | ||||||||||||||||||||||||||||||||||||||||||||||||||||||
Percentage of risk-weighted assets (4) | Percentage of risk-weighted assets (4) | 26.8 | % | 22.0 | % | 13.0 | % | 8.5 | % | Percentage of risk-weighted assets (4) | 27.7 | % | 22.0 | % | 14.4 | % | 8.5 | % | ||||||||||||||||||||||||||||||||||||||||||||||
Percentage of supplementary leverage exposure (5) | Percentage of supplementary leverage exposure (5) | 14.1 | 9.5 | 6.8 | 4.5 | Percentage of supplementary leverage exposure (5) | 12.4 | 9.5 | 6.4 | 4.5 | ||||||||||||||||||||||||||||||||||||||||||||||||||||||
| December 31, 2020 | December 31, 2020 | |||||||||||||||||||||||||||||||||||||||||||||||||||||||||||||||
| Total eligible balance | Total eligible balance | $ | 405,153 | $ | 196,997 | Total eligible balance | $ | 405,153 | $ | 196,997 | ||||||||||||||||||||||||||||||||||||||||||||||||||||||
Percentage of risk-weighted assets (4) | Percentage of risk-weighted assets (4) | 27.4 | % | 22.0 | % | 13.3 | % | 8.5 | % | Percentage of risk-weighted assets (4) | 27.4 | % | 22.0 | % | 13.3 | % | 8.5 | % | ||||||||||||||||||||||||||||||||||||||||||||||
Percentage of supplementary leverage exposure (5) | Percentage of supplementary leverage exposure (5) | 14.5 | 9.5 | 7.1 | 4.5 | Percentage of supplementary leverage exposure (5) | 14.5 | 9.5 | 7.1 | 4.5 | ||||||||||||||||||||||||||||||||||||||||||||||||||||||
Bank of America26 | ||||||||
| Table 12 | Average Global Liquidity Sources | |||||||||||||||||||||||||||
| Table 13 | Table 13 | Average Global Liquidity Sources | ||||||||||||||||||||||||||
| Three Months Ended | Three Months Ended | |||||||||||||||||||||||||||
| (Dollars in billions) | (Dollars in billions) | March 31 2021 | December 31 2020 | (Dollars in billions) | September 30 2021 | December 31 2020 | ||||||||||||||||||||||
| Bank entities | Bank entities | $ | 858 | $ | 773 | Bank entities | $ | 960 | $ | 773 | ||||||||||||||||||
Nonbank and other entities (1) | Nonbank and other entities (1) | 145 | 170 | Nonbank and other entities (1) | 160 | 170 | ||||||||||||||||||||||
| Total Average Global Liquidity Sources | Total Average Global Liquidity Sources | $ | 1,003 | $ | 943 | Total Average Global Liquidity Sources | $ | 1,120 | $ | 943 | ||||||||||||||||||
| Table 13 | Average Global Liquidity Sources Composition | |||||||||||||||||||||||||||
| Table 14 | Table 14 | Average Global Liquidity Sources Composition | ||||||||||||||||||||||||||
| Three Months Ended December 31 | Three Months Ended | |||||||||||||||||||||||||||
| (Dollars in billions) | (Dollars in billions) | March 31 2021 | December 31 2020 | (Dollars in billions) | September 30 2021 | December 31 2020 | ||||||||||||||||||||||
| Cash on deposit | Cash on deposit | $ | 276 | $ | 322 | Cash on deposit | $ | 241 | $ | 322 | ||||||||||||||||||
| U.S. Treasury securities | U.S. Treasury securities | 206 | 141 | U.S. Treasury securities | 265 | 141 | ||||||||||||||||||||||
| U.S. agency securities, mortgage-backed securities, and other investment-grade securities | U.S. agency securities, mortgage-backed securities, and other investment-grade securities | 502 | 462 | U.S. agency securities, mortgage-backed securities, and other investment-grade securities | 596 | 462 | ||||||||||||||||||||||
| Non-U.S. government securities | Non-U.S. government securities | 19 | 18 | Non-U.S. government securities | 18 | 18 | ||||||||||||||||||||||
| Total Average Global Liquidity Sources | Total Average Global Liquidity Sources | $ | 1,003 | $ | 943 | Total Average Global Liquidity Sources | $ | 1,120 | $ | 943 | ||||||||||||||||||
27Bank of America | ||||||||||||||
| Table 14 | Long-term Debt by Maturity | |||||||||||||||||||||||||||||||||||||||||||||||||||||||||||||||||||||||||||||||||||||||
| Table 15 | Table 15 | Long-term Debt by Maturity | ||||||||||||||||||||||||||||||||||||||||||||||||||||||||||||||||||||||||||||||||||||||
| (Dollars in millions) | (Dollars in millions) | Remainder of 2021 | 2022 | 2023 | 2024 | 2025 | Thereafter | Total | (Dollars in millions) | Remainder of 2021 | 2022 | 2023 | 2024 | 2025 | Thereafter | Total | ||||||||||||||||||||||||||||||||||||||||||||||||||||||||||||||||||||||||
| Bank of America Corporation | Bank of America Corporation | Bank of America Corporation | ||||||||||||||||||||||||||||||||||||||||||||||||||||||||||||||||||||||||||||||||||||||
Senior notes (1) | Senior notes (1) | $ | 7,920 | $ | 9,298 | $ | 23,670 | $ | 21,148 | $ | 15,365 | $ | 105,467 | $ | 182,868 | Senior notes (1) | $ | — | $ | 5,759 | $ | 23,451 | $ | 23,642 | $ | 19,800 | $ | 138,303 | $ | 210,955 | ||||||||||||||||||||||||||||||||||||||||||||||||||||||||||
| Senior structured notes | Senior structured notes | 298 | 1,984 | 597 | 355 | 416 | 11,819 | 15,469 | Senior structured notes | 80 | 1,937 | 594 | 292 | 412 | 11,384 | 14,699 | ||||||||||||||||||||||||||||||||||||||||||||||||||||||||||||||||||||||||
| Subordinated notes | Subordinated notes | 372 | 399 | — | 3,334 | 5,475 | 14,125 | 23,705 | Subordinated notes | 354 | — | — | 3,300 | 5,434 | 16,064 | 25,152 | ||||||||||||||||||||||||||||||||||||||||||||||||||||||||||||||||||||||||
| Junior subordinated notes | Junior subordinated notes | — | — | — | — | — | 740 | 740 | Junior subordinated notes | — | — | — | — | — | 741 | 741 | ||||||||||||||||||||||||||||||||||||||||||||||||||||||||||||||||||||||||
| Total Bank of America Corporation | Total Bank of America Corporation | 8,590 | 11,681 | 24,267 | 24,837 | 21,256 | 132,151 | 222,782 | Total Bank of America Corporation | 434 | 7,696 | 24,045 | 27,234 | 25,646 | 166,492 | 251,547 | ||||||||||||||||||||||||||||||||||||||||||||||||||||||||||||||||||||||||
| Bank of America, N.A. | Bank of America, N.A. | Bank of America, N.A. | ||||||||||||||||||||||||||||||||||||||||||||||||||||||||||||||||||||||||||||||||||||||
| Senior notes | Senior notes | 750 | 2,275 | 510 | — | — | 8 | 3,543 | Senior notes | — | 3,245 | 504 | — | — | 1 | 3,750 | ||||||||||||||||||||||||||||||||||||||||||||||||||||||||||||||||||||||||
| Subordinated notes | Subordinated notes | — | — | — | — | — | 1,739 | 1,739 | Subordinated notes | — | — | — | — | — | 1,775 | 1,775 | ||||||||||||||||||||||||||||||||||||||||||||||||||||||||||||||||||||||||
| Advances from Federal Home Loan Banks | Advances from Federal Home Loan Banks | 500 | 3 | 1 | — | 17 | 74 | 595 | Advances from Federal Home Loan Banks | 500 | 203 | 1 | — | 16 | 72 | 792 | ||||||||||||||||||||||||||||||||||||||||||||||||||||||||||||||||||||||||
Securitizations and other Bank VIEs (2) | Securitizations and other Bank VIEs (2) | 2,461 | 1,258 | 975 | 4 | — | 56 | 4,754 | Securitizations and other Bank VIEs (2) | — | 1,249 | 999 | 999 | — | 84 | 3,331 | ||||||||||||||||||||||||||||||||||||||||||||||||||||||||||||||||||||||||
| Other | Other | 63 | 17 | 160 | 1 | 22 | 59 | 322 | Other | 7 | 67 | 316 | 66 | 153 | 21 | 630 | ||||||||||||||||||||||||||||||||||||||||||||||||||||||||||||||||||||||||
| Total Bank of America, N.A. | Total Bank of America, N.A. | 3,774 | 3,553 | 1,646 | 5 | 39 | 1,936 | 10,953 | Total Bank of America, N.A. | 507 | 4,764 | 1,820 | 1,065 | 169 | 1,953 | 10,278 | ||||||||||||||||||||||||||||||||||||||||||||||||||||||||||||||||||||||||
| Other debt | Other debt | Other debt | ||||||||||||||||||||||||||||||||||||||||||||||||||||||||||||||||||||||||||||||||||||||
| Structured Liabilities | Structured Liabilities | 3,201 | 3,199 | 2,132 | 1,277 | 734 | 6,387 | 16,930 | Structured Liabilities | 1,105 | 3,777 | 2,507 | 1,733 | 671 | 6,503 | 16,296 | ||||||||||||||||||||||||||||||||||||||||||||||||||||||||||||||||||||||||
Nonbank VIEs (2) | Nonbank VIEs (2) | 1 | — | — | — | — | 531 | 532 | Nonbank VIEs (2) | 1 | — | — | — | — | 499 | 500 | ||||||||||||||||||||||||||||||||||||||||||||||||||||||||||||||||||||||||
| Other | — | — | — | — | — | 14 | 14 | |||||||||||||||||||||||||||||||||||||||||||||||||||||||||||||||||||||||||||||||||
| Total other debt | Total other debt | 3,202 | 3,199 | 2,132 | 1,277 | 734 | 6,932 | 17,476 | Total other debt | 1,106 | 3,777 | 2,507 | 1,733 | 671 | 7,002 | 16,796 | ||||||||||||||||||||||||||||||||||||||||||||||||||||||||||||||||||||||||
| Total long-term debt | Total long-term debt | $ | 15,566 | $ | 18,433 | $ | 28,045 | $ | 26,119 | $ | 22,029 | $ | 141,019 | $ | 251,211 | Total long-term debt | $ | 2,047 | $ | 16,237 | $ | 28,372 | $ | 30,032 | $ | 26,486 | $ | 175,447 | $ | 278,621 | ||||||||||||||||||||||||||||||||||||||||||||||||||||||||||
Bank of America28 | ||||||||
| Table | Senior Debt Ratings | |||||||||||||||||||||||||||||||||||||||||||||||||||||||
| Moody’s Investors Service | Standard & Poor’s Global Ratings | Fitch Ratings | ||||||||||||||||||||||||||||||||||||||||||||||||||||||
| Long-term | Short-term | Outlook | Long-term | Short-term | Outlook | Long-term | Short-term | Outlook | ||||||||||||||||||||||||||||||||||||||||||||||||
| Bank of America Corporation | A2 | P-1 | Stable | A- | A-2 | Stable | ||||||||||||||||||||||||||||||||||||||||||||||||||
| Bank of America, N.A. | Aa2 | P-1 | Stable | A+ | A-1 | F1+ | Stable | |||||||||||||||||||||||||||||||||||||||||||||||||
| Bank of America Europe Designated Activity Company | NR | NR | NR | A+ | A-1 | F1+ | Stable | |||||||||||||||||||||||||||||||||||||||||||||||||
| Merrill Lynch, Pierce, Fenner & Smith Incorporated | NR | NR | NR | A+ | A-1 | F1+ | Stable | |||||||||||||||||||||||||||||||||||||||||||||||||
| BofA Securities, Inc. | NR | NR | NR | A+ | A-1 | F1+ | Stable | |||||||||||||||||||||||||||||||||||||||||||||||||
| Merrill Lynch International | NR | NR | NR | A+ | A-1 | F1+ | Stable | |||||||||||||||||||||||||||||||||||||||||||||||||
| BofA Securities Europe SA | NR | NR | NR | A+ | A-1 | F1+ | Stable | |||||||||||||||||||||||||||||||||||||||||||||||||
29Bank of America | ||||||||
| Table 16 | Consumer Credit Quality | |||||||||||||||||||||||||||||||||||||||||||||||||||||||||||||||||||||||||||
| Table 17 | Table 17 | Consumer Credit Quality | ||||||||||||||||||||||||||||||||||||||||||||||||||||||||||||||||||||||||||
Outstandings (1) | Nonperforming | Accruing Past Due 90 Days or More | Outstandings (1) | Nonperforming | Accruing Past Due 90 Days or More | |||||||||||||||||||||||||||||||||||||||||||||||||||||||||||||||||||||||
| (Dollars in millions) | (Dollars in millions) | March 31 2021 | December 31 2020 | March 31 2021 | December 31 2020 | March 31 2021 | December 31 2020 | (Dollars in millions) | September 30 2021 | December 31 2020 | September 30 2021 | December 31 2020 | September 30 2021 | December 31 2020 | ||||||||||||||||||||||||||||||||||||||||||||||||||||||||||||||
Residential mortgage (2) | Residential mortgage (2) | $ | 214,779 | $ | 223,555 | $ | 2,366 | $ | 2,005 | $ | 728 | $ | 762 | Residential mortgage (2) | $ | 216,940 | $ | 223,555 | $ | 2,296 | $ | 2,005 | $ | 648 | $ | 762 | ||||||||||||||||||||||||||||||||||||||||||||||||||
| Home equity | Home equity | 32,078 | 34,311 | 669 | 649 | — | — | Home equity | 29,000 | 34,311 | 676 | 649 | — | — | ||||||||||||||||||||||||||||||||||||||||||||||||||||||||||||||
| Credit card | Credit card | 72,786 | 78,708 | n/a | n/a | 755 | 903 | Credit card | 76,869 | 78,708 | n/a | n/a | 450 | 903 | ||||||||||||||||||||||||||||||||||||||||||||||||||||||||||||||
Direct/Indirect consumer (3) | Direct/Indirect consumer (3) | 91,737 | 91,363 | 56 | 71 | 25 | 33 | Direct/Indirect consumer (3) | 99,845 | 91,363 | 45 | 71 | 8 | 33 | ||||||||||||||||||||||||||||||||||||||||||||||||||||||||||||||
| Other consumer | Other consumer | 132 | 124 | — | — | — | — | Other consumer | 202 | 124 | — | — | — | — | ||||||||||||||||||||||||||||||||||||||||||||||||||||||||||||||
| Consumer loans excluding loans accounted for under the fair value option | Consumer loans excluding loans accounted for under the fair value option | $ | 411,512 | $ | 428,061 | $ | 3,091 | $ | 2,725 | $ | 1,508 | $ | 1,698 | Consumer loans excluding loans accounted for under the fair value option | $ | 422,856 | $ | 428,061 | $ | 3,017 | $ | 2,725 | $ | 1,106 | $ | 1,698 | ||||||||||||||||||||||||||||||||||||||||||||||||||
Loans accounted for under the fair value option (4) | Loans accounted for under the fair value option (4) | 693 | 735 | Loans accounted for under the fair value option (4) | 616 | 735 | ||||||||||||||||||||||||||||||||||||||||||||||||||||||||||||||||||||||
| Total consumer loans and leases | Total consumer loans and leases | $ | 412,205 | $ | 428,796 | Total consumer loans and leases | $ | 423,472 | $ | 428,796 | ||||||||||||||||||||||||||||||||||||||||||||||||||||||||||||||||||
Percentage of outstanding consumer loans and leases (5) | Percentage of outstanding consumer loans and leases (5) | n/a | n/a | 0.75 | % | 0.64 | % | 0.37 | % | 0.40 | % | Percentage of outstanding consumer loans and leases (5) | n/a | n/a | 0.71 | % | 0.64 | % | 0.26 | % | 0.40 | % | ||||||||||||||||||||||||||||||||||||||||||||||||||||||
Percentage of outstanding consumer loans and leases, excluding fully-insured loan portfolios (5) | Percentage of outstanding consumer loans and leases, excluding fully-insured loan portfolios (5) | n/a | n/a | 0.77 | 0.65 | 0.20 | 0.22 | Percentage of outstanding consumer loans and leases, excluding fully-insured loan portfolios (5) | n/a | n/a | 0.74 | 0.65 | 0.11 | 0.22 | ||||||||||||||||||||||||||||||||||||||||||||||||||||||||||||||
| Table 17 | Consumer Net Charge-offs and Related Ratios | |||||||||||||||||||||||||||||||||||||||||||||||||||||||||||||||||||||||||||||||||||||||||||||||||||
| Table 18 | Table 18 | Consumer Net Charge-offs and Related Ratios | ||||||||||||||||||||||||||||||||||||||||||||||||||||||||||||||||||||||||||||||||||||||||||||||||||
| Net Charge-offs | Net Charge-off Ratios (1) | Net Charge-offs | Net Charge-off Ratios (1) | |||||||||||||||||||||||||||||||||||||||||||||||||||||||||||||||||||||||||||||||||||||||||||||||||
| Three Months Ended March 31 | Three Months Ended September 30 | Nine Months Ended September 30 | Three Months Ended September 30 | Nine Months Ended September 30 | ||||||||||||||||||||||||||||||||||||||||||||||||||||||||||||||||||||||||||||||||||||||||||||||||
| (Dollars in millions) | (Dollars in millions) | 2021 | 2020 | 2021 | 2020 | (Dollars in millions) | 2021 | 2020 | 2021 | 2020 | 2021 | 2020 | 2021 | 2020 | ||||||||||||||||||||||||||||||||||||||||||||||||||||||||||||||||||||||||||||||||||||||
| Residential mortgage | Residential mortgage | $ | (4) | $ | (1) | (0.01) | % | — | % | Residential mortgage | $ | (7) | $ | (6) | $ | (17) | $ | (27) | (0.01) | % | (0.01) | % | (0.01) | % | (0.02) | % | ||||||||||||||||||||||||||||||||||||||||||||||||||||||||||||||||||||||||||
| Home equity | Home equity | (35) | (11) | (0.42) | (0.11) | Home equity | (34) | (20) | (93) | (45) | (0.46) | (0.21) | (0.40) | (0.16) | ||||||||||||||||||||||||||||||||||||||||||||||||||||||||||||||||||||||||||||||||||||||
| Credit card | Credit card | 634 | 770 | 3.47 | 3.28 | Credit card | 321 | 509 | 1,443 | 1,944 | 1.69 | 2.49 | 2.59 | 2.97 | ||||||||||||||||||||||||||||||||||||||||||||||||||||||||||||||||||||||||||||||||||||||
| Direct/Indirect consumer | Direct/Indirect consumer | 31 | 40 | 0.14 | 0.18 | Direct/Indirect consumer | (18) | 18 | 4 | 84 | (0.07) | 0.08 | 0.01 | 0.13 | ||||||||||||||||||||||||||||||||||||||||||||||||||||||||||||||||||||||||||||||||||||||
| Other consumer | Other consumer | 67 | 74 | n/m | n/m | Other consumer | 67 | 63 | 198 | 214 | n/m | n/m | n/m | n/m | ||||||||||||||||||||||||||||||||||||||||||||||||||||||||||||||||||||||||||||||||||||||
| Total | Total | $ | 693 | $ | 872 | 0.67 | 0.75 | Total | $ | 329 | $ | 564 | $ | 1,535 | $ | 2,170 | 0.31 | 0.50 | 0.49 | 0.64 | ||||||||||||||||||||||||||||||||||||||||||||||||||||||||||||||||||||||||||||||||
Bank of America30 | ||||||||
| Table 18 | Residential Mortgage – Key Credit Statistics | |||||||||||||||||||||||||||||||||||||||||||||||||||||||||||||||||||||||||||||||||||||||||||||||||||
| Table 19 | Table 19 | Residential Mortgage – Key Credit Statistics | ||||||||||||||||||||||||||||||||||||||||||||||||||||||||||||||||||||||||||||||||||||||||||||||||||
Reported Basis (1) | Excluding Fully-insured Loans (1) | Reported Basis (1) | Excluding Fully-insured Loans (1) | |||||||||||||||||||||||||||||||||||||||||||||||||||||||||||||||||||||||||||||||||||||||||||||||||
| (Dollars in millions) | (Dollars in millions) | March 31 2021 | December 31 2020 | March 31 2021 | December 31 2020 | (Dollars in millions) | September 30 2021 | December 31 2020 | September 30 2021 | December 31 2020 | ||||||||||||||||||||||||||||||||||||||||||||||||||||||||||||||||||||||||||||||||||||||||||
| Outstandings | Outstandings | $ | 214,779 | $ | 223,555 | $ | 202,812 | $ | 211,737 | Outstandings | $ | 216,940 | $ | 223,555 | $ | 204,316 | $ | 211,737 | ||||||||||||||||||||||||||||||||||||||||||||||||||||||||||||||||||||||||||||||||||
| Accruing past due 30 days or more | Accruing past due 30 days or more | 2,166 | 2,314 | 1,136 | 1,224 | Accruing past due 30 days or more | 1,752 | 2,314 | 822 | 1,224 | ||||||||||||||||||||||||||||||||||||||||||||||||||||||||||||||||||||||||||||||||||||||||||
| Accruing past due 90 days or more | Accruing past due 90 days or more | 728 | 762 | — | — | Accruing past due 90 days or more | 648 | 762 | — | — | ||||||||||||||||||||||||||||||||||||||||||||||||||||||||||||||||||||||||||||||||||||||||||
Nonperforming loans (2) | Nonperforming loans (2) | 2,366 | 2,005 | 2,366 | 2,005 | Nonperforming loans (2) | 2,296 | 2,005 | 2,296 | 2,005 | ||||||||||||||||||||||||||||||||||||||||||||||||||||||||||||||||||||||||||||||||||||||||||
| Percent of portfolio | Percent of portfolio | Percent of portfolio | ||||||||||||||||||||||||||||||||||||||||||||||||||||||||||||||||||||||||||||||||||||||||||||||||||
| Refreshed LTV greater than 90 but less than or equal to 100 | Refreshed LTV greater than 90 but less than or equal to 100 | 1 | % | 2 | % | 1 | % | 1 | % | Refreshed LTV greater than 90 but less than or equal to 100 | 1 | % | 2 | % | 1 | % | 1 | % | ||||||||||||||||||||||||||||||||||||||||||||||||||||||||||||||||||||||||||||||||||
| Refreshed LTV greater than 100 | Refreshed LTV greater than 100 | 1 | 1 | 1 | 1 | Refreshed LTV greater than 100 | — | 1 | — | 1 | ||||||||||||||||||||||||||||||||||||||||||||||||||||||||||||||||||||||||||||||||||||||||||
| Refreshed FICO below 620 | Refreshed FICO below 620 | 2 | 2 | 1 | 1 | Refreshed FICO below 620 | 2 | 2 | 1 | 1 | ||||||||||||||||||||||||||||||||||||||||||||||||||||||||||||||||||||||||||||||||||||||||||
2006 and 2007 vintages (3) | 3 | 3 | 3 | 3 | ||||||||||||||||||||||||||||||||||||||||||||||||||||||||||||||||||||||||||||||||||||||||||||||||
| Table 19 | Residential Mortgage State Concentrations | ||||||||||||||||||||||||||||||||||||||||||||||||||||||||||||||||||||||||||||||||||||||||||||||||||||||||||||||||||||||||||||||
Outstandings (1) | Nonperforming (1) | Net Charge-offs | |||||||||||||||||||||||||||||||||||||||||||||||||||||||||||||||||||||||||||||||||||||||||||||||||||||||||||||||||||||||||||||
| Table 20 | Table 20 | Residential Mortgage State Concentrations | |||||||||||||||||||||||||||||||||||||||||||||||||||||||||||||||||||||||||||||||||||||||||||||||||||||||||||||||||||||||||||||
Outstandings (1) | Nonperforming (1) | Net Charge-offs | |||||||||||||||||||||||||||||||||||||||||||||||||||||||||||||||||||||||||||||||||||||||||||||||||||||||||||||||||||||||||||||
| March 31 2021 | December 31 2020 | March 31 2021 | December 31 2020 | Three Months Ended March 31 | September 30 2021 | December 31 2020 | September 30 2021 | December 31 2020 | Three Months Ended September 30 | Nine Months Ended September 30 | |||||||||||||||||||||||||||||||||||||||||||||||||||||||||||||||||||||||||||||||||||||||||||||||||||||||||||||||||||||
| (Dollars in millions) | (Dollars in millions) | 2021 | 2020 | (Dollars in millions) | December 31 2020 | 2021 | 2020 | 2021 | 2020 | ||||||||||||||||||||||||||||||||||||||||||||||||||||||||||||||||||||||||||||||||||||||||||||||||||||||||||||||||||||||
| California | California | $ | 77,054 | $ | 83,185 | $ | 747 | $ | 570 | $ | (2) | $ | (3) | California | $ | 75,884 | $ | 83,185 | $ | 708 | $ | (3) | $ | (5) | $ | (10) | $ | (16) | |||||||||||||||||||||||||||||||||||||||||||||||||||||||||||||||||||||||||||||||||||||||||||||||||||
| New York | New York | 23,716 | 23,832 | 329 | 272 | 2 | 1 | New York | 24,402 | 23,832 | 351 | 272 | — | 1 | 2 | 2 | |||||||||||||||||||||||||||||||||||||||||||||||||||||||||||||||||||||||||||||||||||||||||||||||||||||||||||||||
| Florida | Florida | 12,900 | 13,017 | 193 | 175 | (2) | (2) | Florida | 13,524 | 13,017 | 160 | 175 | (1) | (1) | (5) | (4) | |||||||||||||||||||||||||||||||||||||||||||||||||||||||||||||||||||||||||||||||||||||||||||||||||||||||||||||||
| Texas | Texas | 8,662 | 8,868 | 92 | 78 | — | — | Texas | 8,810 | 8,868 | 91 | 78 | — | — | — | — | |||||||||||||||||||||||||||||||||||||||||||||||||||||||||||||||||||||||||||||||||||||||||||||||||||||||||||||||
| New Jersey | New Jersey | 8,454 | 8,806 | 112 | 98 | — | — | New Jersey | 8,526 | 8,806 | 108 | 98 | — | (1) | — | (1) | |||||||||||||||||||||||||||||||||||||||||||||||||||||||||||||||||||||||||||||||||||||||||||||||||||||||||||||||
| Other | Other | 72,026 | 74,029 | 893 | 812 | (2) | 3 | Other | 73,170 | 74,029 | 878 | 812 | (3) | — | (4) | (8) | |||||||||||||||||||||||||||||||||||||||||||||||||||||||||||||||||||||||||||||||||||||||||||||||||||||||||||||||
| Residential mortgage loans | Residential mortgage loans | $ | 202,812 | $ | 211,737 | $ | 2,366 | $ | 2,005 | $ | (4) | $ | (1) | Residential mortgage loans | $ | 204,316 | $ | 211,737 | $ | 2,296 | $ | 2,005 | $ | (7) | $ | (6) | $ | (17) | $ | (27) | |||||||||||||||||||||||||||||||||||||||||||||||||||||||||||||||||||||||||||||||||||||||||||||||||
| Fully-insured loan portfolio | Fully-insured loan portfolio | 11,967 | 11,818 | Fully-insured loan portfolio | 12,624 | 11,818 | |||||||||||||||||||||||||||||||||||||||||||||||||||||||||||||||||||||||||||||||||||||||||||||||||||||||||||||||||||||||||
| Total residential mortgage loan portfolio | Total residential mortgage loan portfolio | $ | 214,779 | $ | 223,555 | Total residential mortgage loan portfolio | $ | 216,940 | $ | 223,555 | |||||||||||||||||||||||||||||||||||||||||||||||||||||||||||||||||||||||||||||||||||||||||||||||||||||||||||||||||||||
31Bank of America | ||||||||
| Table 20 | Home Equity – Key Credit Statistics (1) | |||||||||||||||||||||||||||||||||||||||||||||||||||||||||||||||||||||||||||||||||||||||||||||||||||
| Table 21 | Table 21 | Home Equity – Key Credit Statistics (1) | ||||||||||||||||||||||||||||||||||||||||||||||||||||||||||||||||||||||||||||||||||||||||||||||||||
| (Dollars in millions) | (Dollars in millions) | March 31 2021 | December 31 2020 | (Dollars in millions) | September 30 2021 | December 31 2020 | ||||||||||||||||||||||||||||||||||||||||||||||||||||||||||||||||||||||||||||||||||||||||||||||
| Outstandings | Outstandings | $ | 32,078 | $ | 34,311 | Outstandings | $ | 29,000 | $ | 34,311 | ||||||||||||||||||||||||||||||||||||||||||||||||||||||||||||||||||||||||||||||||||||||||||
Accruing past due 30 days or more (2) | Accruing past due 30 days or more (2) | 169 | 186 | Accruing past due 30 days or more (2) | 165 | 186 | ||||||||||||||||||||||||||||||||||||||||||||||||||||||||||||||||||||||||||||||||||||||||||||||
Nonperforming loans (2, 3) | Nonperforming loans (2, 3) | 669 | 649 | Nonperforming loans (2, 3) | 676 | 649 | ||||||||||||||||||||||||||||||||||||||||||||||||||||||||||||||||||||||||||||||||||||||||||||||
| Percent of portfolio | Percent of portfolio | Percent of portfolio | ||||||||||||||||||||||||||||||||||||||||||||||||||||||||||||||||||||||||||||||||||||||||||||||||||
| Refreshed CLTV greater than 90 but less than or equal to 100 | Refreshed CLTV greater than 90 but less than or equal to 100 | 1 | % | 1 | % | Refreshed CLTV greater than 90 but less than or equal to 100 | 1 | % | 1 | % | ||||||||||||||||||||||||||||||||||||||||||||||||||||||||||||||||||||||||||||||||||||||||||
| Refreshed CLTV greater than 100 | Refreshed CLTV greater than 100 | 1 | 1 | Refreshed CLTV greater than 100 | 1 | 1 | ||||||||||||||||||||||||||||||||||||||||||||||||||||||||||||||||||||||||||||||||||||||||||||||
| Refreshed FICO below 620 | Refreshed FICO below 620 | 3 | 3 | Refreshed FICO below 620 | 3 | 3 | ||||||||||||||||||||||||||||||||||||||||||||||||||||||||||||||||||||||||||||||||||||||||||||||
2006 and 2007 vintages (4) | 16 | 16 | ||||||||||||||||||||||||||||||||||||||||||||||||||||||||||||||||||||||||||||||||||||||||||||||||||
Bank of America32 | ||||||||
| Table 21 | Home Equity State Concentrations | |||||||||||||||||||||||||||||||||||||||||||||||||||||||||||||||||||||||||||||||||||||||||||||||||||||||||||||||
| Table 22 | Table 22 | Home Equity State Concentrations | ||||||||||||||||||||||||||||||||||||||||||||||||||||||||||||||||||||||||||||||||||||||||||||||||||||||||||||||
Outstandings (1) | Nonperforming (1) | Net Charge-offs | Outstandings (1) | Nonperforming (1) | Net Charge-offs | |||||||||||||||||||||||||||||||||||||||||||||||||||||||||||||||||||||||||||||||||||||||||||||||||||||||||||
| March 31 2021 | December 31 2020 | March 31 2021 | December 31 2020 | Three Months Ended March 31 | September 30 2021 | December 31 2020 | September 30 2021 | December 31 2020 | Three Months Ended September 30 | Nine Months Ended September 30 | ||||||||||||||||||||||||||||||||||||||||||||||||||||||||||||||||||||||||||||||||||||||||||||||||||||||
| (Dollars in millions) | (Dollars in millions) | 2021 | 2020 | (Dollars in millions) | December 31 2020 | 2021 | 2020 | 2021 | 2020 | |||||||||||||||||||||||||||||||||||||||||||||||||||||||||||||||||||||||||||||||||||||||||||||||||||||||
| California | California | $ | 8,811 | $ | 9,488 | $ | 145 | $ | 143 | $ | (12) | $ | (5) | California | $ | 7,886 | $ | 9,488 | $ | 149 | $ | (9) | $ | (8) | $ | (31) | $ | (17) | ||||||||||||||||||||||||||||||||||||||||||||||||||||||||||||||||||||||||||||||||||||
| Florida | Florida | 3,492 | 3,715 | 80 | 80 | (6) | (3) | Florida | 3,113 | 3,715 | 83 | 80 | (5) | (2) | (16) | (7) | ||||||||||||||||||||||||||||||||||||||||||||||||||||||||||||||||||||||||||||||||||||||||||||||||
| New Jersey | New Jersey | 2,588 | 2,749 | 71 | 67 | (2) | — | New Jersey | 2,346 | 2,749 | 72 | 67 | (1) | — | (3) | (1) | ||||||||||||||||||||||||||||||||||||||||||||||||||||||||||||||||||||||||||||||||||||||||||||||||
| New York | New York | 2,363 | 2,495 | 107 | 103 | (3) | 1 | New York | 2,157 | 2,495 | 101 | 103 | (2) | (1) | (3) | — | ||||||||||||||||||||||||||||||||||||||||||||||||||||||||||||||||||||||||||||||||||||||||||||||||
| Massachusetts | Massachusetts | 1,601 | 1,719 | 34 | 32 | 1 | 1 | Massachusetts | 1,484 | 1,719 | 33 | 32 | (2) | — | (2) | 1 | ||||||||||||||||||||||||||||||||||||||||||||||||||||||||||||||||||||||||||||||||||||||||||||||||
| Other | Other | 13,223 | 14,145 | 232 | 224 | (13) | (5) | Other | 12,014 | 14,145 | 238 | 224 | (15) | (9) | (38) | (21) | ||||||||||||||||||||||||||||||||||||||||||||||||||||||||||||||||||||||||||||||||||||||||||||||||
| Total home equity loan portfolio | Total home equity loan portfolio | $ | 32,078 | $ | 34,311 | $ | 669 | $ | 649 | $ | (35) | $ | (11) | Total home equity loan portfolio | $ | 29,000 | $ | 34,311 | $ | 676 | $ | 649 | $ | (34) | $ | (20) | $ | (93) | $ | (45) | ||||||||||||||||||||||||||||||||||||||||||||||||||||||||||||||||||||||||||||||||||
| Table 22 | Credit Card State Concentrations | |||||||||||||||||||||||||||||||||||||||||||||||||||||||||||||||||||||||||||||||||||||||||||||||||||||||||||||||
| Table 23 | Table 23 | Credit Card State Concentrations | ||||||||||||||||||||||||||||||||||||||||||||||||||||||||||||||||||||||||||||||||||||||||||||||||||||||||||||||
| Outstandings | Accruing Past Due 90 Days or More (1) | Net Charge-offs | Outstandings | Accruing Past Due 90 Days or More (1) | Net Charge-offs | |||||||||||||||||||||||||||||||||||||||||||||||||||||||||||||||||||||||||||||||||||||||||||||||||||||||||||
| March 31 2021 | December 31 2020 | March 31 2021 | December 31 2020 | Three Months Ended March 31 | September 30 2021 | December 31 2020 | September 30 2021 | December 31 2020 | Three Months Ended September 30 | Nine Months Ended September 30 | ||||||||||||||||||||||||||||||||||||||||||||||||||||||||||||||||||||||||||||||||||||||||||||||||||||||
| (Dollars in millions) | (Dollars in millions) | 2021 | 2020 | (Dollars in millions) | September 30 2021 | December 31 2020 | 2021 | 2020 | 2021 | 2020 | ||||||||||||||||||||||||||||||||||||||||||||||||||||||||||||||||||||||||||||||||||||||||||||||||||||||
| California | California | $ | 11,632 | $ | 12,543 | $ | 141 | $ | 166 | $ | 119 | $ | 136 | California | $ | 12,248 | $ | 12,543 | $ | 60 | $ | 92 | $ | 273 | $ | 347 | ||||||||||||||||||||||||||||||||||||||||||||||||||||||||||||||||||||||||||||||||||||||
| Florida | Florida | 7,144 | 7,666 | 111 | 135 | 91 | 101 | Florida | 7,504 | 7,666 | 64 | 135 | 46 | 66 | 205 | 252 | ||||||||||||||||||||||||||||||||||||||||||||||||||||||||||||||||||||||||||||||||||||||||||||||||
| Texas | Texas | 6,112 | 6,499 | 71 | 87 | 58 | 65 | Texas | 6,483 | 6,499 | 44 | 87 | 30 | 45 | 132 | 166 | ||||||||||||||||||||||||||||||||||||||||||||||||||||||||||||||||||||||||||||||||||||||||||||||||
| New York | New York | 4,254 | 4,654 | 57 | 76 | 54 | 60 | New York | 4,488 | 4,654 | 32 | 76 | 24 | 43 | 116 | 154 | ||||||||||||||||||||||||||||||||||||||||||||||||||||||||||||||||||||||||||||||||||||||||||||||||
| Washington | Washington | 3,462 | 3,685 | 18 | 21 | 15 | 18 | Washington | 3,840 | 3,685 | 12 | 21 | 7 | 12 | 32 | 47 | ||||||||||||||||||||||||||||||||||||||||||||||||||||||||||||||||||||||||||||||||||||||||||||||||
| Other | Other | 40,182 | 43,661 | 357 | 418 | 297 | 390 | Other | 42,306 | 43,661 | 217 | 418 | 154 | 251 | 685 | 978 | ||||||||||||||||||||||||||||||||||||||||||||||||||||||||||||||||||||||||||||||||||||||||||||||||
| Total credit card portfolio | Total credit card portfolio | $ | 72,786 | $ | 78,708 | $ | 755 | $ | 903 | $ | 634 | $ | 770 | Total credit card portfolio | $ | 76,869 | $ | 78,708 | $ | 450 | $ | 903 | $ | 321 | $ | 509 | $ | 1,443 | $ | 1,944 | ||||||||||||||||||||||||||||||||||||||||||||||||||||||||||||||||||||||||||||||||||
33Bank of America | ||||||||
| Table 23 | Direct/Indirect State Concentrations | |||||||||||||||||||||||||||||||||||||||||||||||||||||||||||||||||||||||||||||||||||||||||||||||||||||||||||||||||||||||||||
| Table 24 | Table 24 | Direct/Indirect State Concentrations | ||||||||||||||||||||||||||||||||||||||||||||||||||||||||||||||||||||||||||||||||||||||||||||||||||||||||||||||||||||||||||
| Outstandings | Accruing Past Due 90 Days or More (1) | Net Charge-offs | Outstandings | Accruing Past Due 90 Days or More (1) | Net Charge-offs | |||||||||||||||||||||||||||||||||||||||||||||||||||||||||||||||||||||||||||||||||||||||||||||||||||||||||||||||||||||||
| March 31 2021 | December 31 2020 | March 31 2021 | December 31 2020 | Three Months Ended March 31 | September 30 2021 | December 31 2020 | September 30 2021 | December 31 2020 | Three Months Ended September 30 | Nine Months Ended September 30 | ||||||||||||||||||||||||||||||||||||||||||||||||||||||||||||||||||||||||||||||||||||||||||||||||||||||||||||||||||
| (Dollars in millions) | (Dollars in millions) | 2021 | 2020 | (Dollars in millions) | December 31 2020 | 2021 | 2020 | 2021 | 2020 | |||||||||||||||||||||||||||||||||||||||||||||||||||||||||||||||||||||||||||||||||||||||||||||||||||||||||||||||||||
| California | California | $ | 12,459 | $ | 12,248 | $ | 3 | $ | 6 | $ | 7 | $ | 6 | California | $ | 14,225 | $ | 12,248 | $ | 1 | $ | 6 | $ | (2) | $ | 2 | $ | 3 | $ | 13 | ||||||||||||||||||||||||||||||||||||||||||||||||||||||||||||||||||||||||||||||||||||||||||||||
| Florida | Florida | 11,132 | 10,891 | 3 | 4 | 3 | 7 | Florida | 12,590 | 10,891 | 1 | 4 | (2) | 3 | — | 14 | ||||||||||||||||||||||||||||||||||||||||||||||||||||||||||||||||||||||||||||||||||||||||||||||||||||||||||||
| Texas | Texas | 8,939 | 8,981 | 4 | 6 | 5 | 6 | Texas | 9,402 | 8,981 | 1 | 6 | (4) | 4 | 2 | 13 | ||||||||||||||||||||||||||||||||||||||||||||||||||||||||||||||||||||||||||||||||||||||||||||||||||||||||||||
| New York | New York | 6,754 | 6,609 | 2 | 2 | 3 | 2 | New York | 7,511 | 6,609 | 1 | 2 | 1 | 2 | 4 | 6 | ||||||||||||||||||||||||||||||||||||||||||||||||||||||||||||||||||||||||||||||||||||||||||||||||||||||||||||
| New Jersey | New Jersey | 3,563 | 3,572 | 1 | — | — | — | New Jersey | 3,988 | 3,572 | — | — | — | — | (1) | 1 | ||||||||||||||||||||||||||||||||||||||||||||||||||||||||||||||||||||||||||||||||||||||||||||||||||||||||||||
| Other | Other | 48,890 | 49,062 | 12 | 15 | 13 | 19 | Other | 52,129 | 49,062 | 4 | 15 | (11) | 7 | (4) | 37 | ||||||||||||||||||||||||||||||||||||||||||||||||||||||||||||||||||||||||||||||||||||||||||||||||||||||||||||
| Total direct/indirect loan portfolio | Total direct/indirect loan portfolio | $ | 91,737 | $ | 91,363 | $ | 25 | $ | 33 | $ | 31 | $ | 40 | Total direct/indirect loan portfolio | $ | 99,845 | $ | 91,363 | $ | 8 | $ | 33 | $ | (18) | $ | 18 | $ | 4 | $ | 84 | ||||||||||||||||||||||||||||||||||||||||||||||||||||||||||||||||||||||||||||||||||||||||||||||
| Table 24 | Nonperforming Consumer Loans, Leases and Foreclosed Properties Activity | |||||||||||||||||||||||||||||||||||||||||||||||||||
| Table 25 | Table 25 | Nonperforming Consumer Loans, Leases and Foreclosed Properties Activity | ||||||||||||||||||||||||||||||||||||||||||||||||||
| Three Months Ended March 31 | Three Months Ended September 30 | Nine Months Ended September 30 | ||||||||||||||||||||||||||||||||||||||||||||||||||
| (Dollars in millions) | (Dollars in millions) | 2021 | 2020 | (Dollars in millions) | 2021 | 2020 | 2021 | 2020 | ||||||||||||||||||||||||||||||||||||||||||||
| Nonperforming loans and leases, January 1 | $ | 2,725 | $ | 2,053 | ||||||||||||||||||||||||||||||||||||||||||||||||
| Nonperforming loans and leases, beginning of period | Nonperforming loans and leases, beginning of period | $ | 3,044 | $ | 2,191 | $ | 2,725 | $ | 2,053 | |||||||||||||||||||||||||||||||||||||||||||
| Additions | Additions | 851 | 477 | Additions | 353 | 587 | 1,635 | 1,418 | ||||||||||||||||||||||||||||||||||||||||||||
| Reductions: | Reductions: | Reductions: | ||||||||||||||||||||||||||||||||||||||||||||||||||
| Paydowns and payoffs | Paydowns and payoffs | (123) | (106) | Paydowns and payoffs | (163) | (113) | (446) | (303) | ||||||||||||||||||||||||||||||||||||||||||||
| Sales | Sales | (1) | (6) | Sales | (1) | — | (3) | (31) | ||||||||||||||||||||||||||||||||||||||||||||
Returns to performing status (1) | Returns to performing status (1) | (347) | (165) | Returns to performing status (1) | (201) | (291) | (839) | (689) | ||||||||||||||||||||||||||||||||||||||||||||
| Charge-offs | Charge-offs | (12) | (27) | Charge-offs | (12) | (13) | (49) | (62) | ||||||||||||||||||||||||||||||||||||||||||||
| Transfers to foreclosed properties | Transfers to foreclosed properties | (2) | (22) | Transfers to foreclosed properties | (3) | (4) | (6) | (29) | ||||||||||||||||||||||||||||||||||||||||||||
| Total net additions to nonperforming loans and leases | 366 | 151 | ||||||||||||||||||||||||||||||||||||||||||||||||||
| Total nonperforming loans and leases, March 31 | 3,091 | 2,204 | ||||||||||||||||||||||||||||||||||||||||||||||||||
Foreclosed properties, March 31 (2) | 101 | 226 | ||||||||||||||||||||||||||||||||||||||||||||||||||
| Nonperforming consumer loans, leases and foreclosed properties, March 31 | $ | 3,192 | $ | 2,430 | ||||||||||||||||||||||||||||||||||||||||||||||||
| Total net additions/(reductions) to nonperforming loans and leases | Total net additions/(reductions) to nonperforming loans and leases | (27) | 166 | 292 | 304 | |||||||||||||||||||||||||||||||||||||||||||||||
| Total nonperforming loans and leases, September 30 | Total nonperforming loans and leases, September 30 | 3,017 | 2,357 | 3,017 | 2,357 | |||||||||||||||||||||||||||||||||||||||||||||||
Foreclosed properties, September 30 (2) | Foreclosed properties, September 30 (2) | 87 | 135 | 87 | 135 | |||||||||||||||||||||||||||||||||||||||||||||||
| Nonperforming consumer loans, leases and foreclosed properties, September 30 | Nonperforming consumer loans, leases and foreclosed properties, September 30 | $ | 3,104 | $ | 2,492 | $ | 3,104 | $ | 2,492 | |||||||||||||||||||||||||||||||||||||||||||
Nonperforming consumer loans and leases as a percentage of outstanding consumer loans and leases (3) | Nonperforming consumer loans and leases as a percentage of outstanding consumer loans and leases (3) | 0.75 | % | 0.47 | % | Nonperforming consumer loans and leases as a percentage of outstanding consumer loans and leases (3) | 0.71 | % | 0.54 | % | ||||||||||||||||||||||||||||||||||||||||||
Nonperforming consumer loans, leases and foreclosed properties as a percentage of outstanding consumer loans, leases and foreclosed properties (3) | Nonperforming consumer loans, leases and foreclosed properties as a percentage of outstanding consumer loans, leases and foreclosed properties (3) | 0.78 | 0.52 | Nonperforming consumer loans, leases and foreclosed properties as a percentage of outstanding consumer loans, leases and foreclosed properties (3) | 0.73 | 0.57 | ||||||||||||||||||||||||||||||||||||||||||||||
Bank of America34 | ||||||||
| Table 25 | Consumer Real Estate Troubled Debt Restructurings | |||||||||||||||||||||||||||||||||||||||||||||||||||||||||||||||||||||||||||
| Table 26 | Table 26 | Consumer Real Estate Troubled Debt Restructurings | ||||||||||||||||||||||||||||||||||||||||||||||||||||||||||||||||||||||||||
| March 31, 2021 | December 31, 2020 | September 30, 2021 | December 31, 2020 | |||||||||||||||||||||||||||||||||||||||||||||||||||||||||||||||||||||||||
| (Dollars in millions) | (Dollars in millions) | Nonperforming | Performing | Total | Nonperforming | Performing | Total | (Dollars in millions) | Nonperforming | Performing | Total | Nonperforming | Performing | Total | ||||||||||||||||||||||||||||||||||||||||||||||||||||||||||||||
Residential mortgage (1, 2) | Residential mortgage (1, 2) | $ | 1,560 | $ | 2,752 | $ | 4,312�� | $ | 1,195 | $ | 2,899 | $ | 4,094 | Residential mortgage (1, 2) | $ | 1,530 | $ | 2,422 | $ | 3,952 | $ | 1,195 | $ | 2,899 | $ | 4,094 | ||||||||||||||||||||||||||||||||||||||||||||||||||
Home equity (3) | Home equity (3) | 271 | 786 | 1,057 | 248 | 836 | 1,084 | Home equity (3) | 265 | 692 | 957 | 248 | 836 | 1,084 | ||||||||||||||||||||||||||||||||||||||||||||||||||||||||||||||
| Total consumer real estate troubled debt restructurings | Total consumer real estate troubled debt restructurings | $ | 1,831 | $ | 3,538 | $ | 5,369 | $ | 1,443 | $ | 3,735 | $ | 5,178 | Total consumer real estate troubled debt restructurings | $ | 1,795 | $ | 3,114 | $ | 4,909 | $ | 1,443 | $ | 3,735 | $ | 5,178 | ||||||||||||||||||||||||||||||||||||||||||||||||||
| Table 26 | Commercial Credit Exposure by Type | |||||||||||||||||||||||||||||||||||||
Commercial Utilized (1) | Commercial Unfunded (2, 3, 4) | Total Commercial Committed | ||||||||||||||||||||||||||||||||||||
| (Dollars in millions) | March 31 2021 | December 31 2020 | March 31 2021 | December 31 2020 | March 31 2021 | December 31 2020 | ||||||||||||||||||||||||||||||||
| Loans and leases | $ | 490,883 | $ | 499,065 | $ | 423,589 | $ | 404,740 | $ | 914,472 | $ | 903,805 | ||||||||||||||||||||||||||
Derivative assets (5) | 45,898 | 47,179 | — | — | 45,898 | 47,179 | ||||||||||||||||||||||||||||||||
| Standby letters of credit and financial guarantees | 34,088 | 34,616 | 745 | 538 | 34,833 | 35,154 | ||||||||||||||||||||||||||||||||
| Debt securities and other investments | 21,981 | 22,618 | 4,845 | 4,827 | 26,826 | 27,445 | ||||||||||||||||||||||||||||||||
| Loans held-for-sale | 6,776 | 8,378 | 14,818 | 9,556 | 21,594 | 17,934 | ||||||||||||||||||||||||||||||||
| Operating leases | 6,292 | 6,424 | — | — | 6,292 | 6,424 | ||||||||||||||||||||||||||||||||
| Commercial letters of credit | 1,030 | 855 | 297 | 280 | 1,327 | 1,135 | ||||||||||||||||||||||||||||||||
| Other | 1,166 | 1,168 | — | — | 1,166 | 1,168 | ||||||||||||||||||||||||||||||||
| Total | $ | 608,114 | $ | 620,303 | $ | 444,294 | $ | 419,941 | $ | 1,052,408 | $ | 1,040,244 | ||||||||||||||||||||||||||
35Bank of America | ||||||||
| Table 27 | Commercial Credit Exposure by Type | |||||||||||||||||||||||||||||||||||||
Commercial Utilized (1) | Commercial Unfunded (2, 3, 4) | Total Commercial Committed | ||||||||||||||||||||||||||||||||||||
| (Dollars in millions) | September 30 2021 | December 31 2020 | September 30 2021 | December 31 2020 | September 30 2021 | December 31 2020 | ||||||||||||||||||||||||||||||||
| Loans and leases | $ | 504,264 | $ | 499,065 | $ | 446,891 | $ | 404,740 | $ | 951,155 | $ | 903,805 | ||||||||||||||||||||||||||
Derivative assets (5) | 40,829 | 47,179 | — | — | 40,829 | 47,179 | ||||||||||||||||||||||||||||||||
| Standby letters of credit and financial guarantees | 33,766 | 34,616 | 829 | 538 | 34,595 | 35,154 | ||||||||||||||||||||||||||||||||
| Debt securities and other investments | 20,738 | 22,618 | 5,448 | 4,827 | 26,186 | 27,445 | ||||||||||||||||||||||||||||||||
| Loans held-for-sale | 7,440 | 8,378 | 24,674 | 9,556 | 32,114 | 17,934 | ||||||||||||||||||||||||||||||||
| Operating leases | 5,885 | 6,424 | — | — | 5,885 | 6,424 | ||||||||||||||||||||||||||||||||
| Commercial letters of credit | 1,299 | 855 | 511 | 280 | 1,810 | 1,135 | ||||||||||||||||||||||||||||||||
| Other | 1,146 | 1,168 | — | — | 1,146 | 1,168 | ||||||||||||||||||||||||||||||||
| Total | $ | 615,367 | $ | 620,303 | $ | 478,353 | $ | 419,941 | $ | 1,093,720 | $ | 1,040,244 | ||||||||||||||||||||||||||
| Table 27 | Commercial Credit Quality | |||||||||||||||||||||||||||||||||||||||||||||||||||||||||||||||||||||||||||
| Table 28 | Table 28 | Commercial Credit Quality | ||||||||||||||||||||||||||||||||||||||||||||||||||||||||||||||||||||||||||
| Outstandings | Nonperforming | Accruing Past Due 90 Days or More | Outstandings | Nonperforming | Accruing Past Due 90 Days or More | |||||||||||||||||||||||||||||||||||||||||||||||||||||||||||||||||||||||
| (Dollars in millions) | (Dollars in millions) | March 31 2021 | December 31 2020 | March 31 2021 | December 31 2020 | March 31 2021 | December 31 2020 | (Dollars in millions) | September 30 2021 | December 31 2020 | September 30 2021 | December 31 2020 | September 30 2021 | December 31 2020 | ||||||||||||||||||||||||||||||||||||||||||||||||||||||||||||||
| Commercial and industrial: | Commercial and industrial: | Commercial and industrial: | ||||||||||||||||||||||||||||||||||||||||||||||||||||||||||||||||||||||||||
| U.S. commercial | U.S. commercial | $ | 283,229 | $ | 288,728 | $ | 1,228 | $ | 1,243 | $ | 99 | $ | 228 | U.S. commercial | $ | 295,927 | $ | 288,728 | $ | 909 | $ | 1,243 | $ | 84 | $ | 228 | ||||||||||||||||||||||||||||||||||||||||||||||||||
| Non-U.S. commercial | Non-U.S. commercial | 91,335 | 90,460 | 342 | 418 | 4 | 10 | Non-U.S. commercial | 102,850 | 90,460 | 272 | 418 | 60 | 10 | ||||||||||||||||||||||||||||||||||||||||||||||||||||||||||||||
| Total commercial and industrial | Total commercial and industrial | 374,564 | 379,188 | 1,570 | 1,661 | 103 | 238 | Total commercial and industrial | 398,777 | 379,188 | 1,181 | 1,661 | 144 | 238 | ||||||||||||||||||||||||||||||||||||||||||||||||||||||||||||||
| Commercial real estate | Commercial real estate | 58,764 | 60,364 | 354 | 404 | 63 | 6 | Commercial real estate | 60,723 | 60,364 | 414 | 404 | 5 | 6 | ||||||||||||||||||||||||||||||||||||||||||||||||||||||||||||||
| Commercial lease financing | Commercial lease financing | 16,359 | 17,098 | 80 | 87 | 20 | 25 | Commercial lease financing | 15,044 | 17,098 | 70 | 87 | 11 | 25 | ||||||||||||||||||||||||||||||||||||||||||||||||||||||||||||||
| 449,687 | 456,650 | 2,004 | 2,152 | 186 | 269 | 474,544 | 456,650 | 1,665 | 2,152 | 160 | 269 | |||||||||||||||||||||||||||||||||||||||||||||||||||||||||||||||||
U.S. small business commercial (1) | U.S. small business commercial (1) | 34,886 | 36,469 | 67 | 75 | 98 | 115 | U.S. small business commercial (1) | 22,770 | 36,469 | 32 | 75 | 64 | 115 | ||||||||||||||||||||||||||||||||||||||||||||||||||||||||||||||
| Commercial loans excluding loans accounted for under the fair value option | Commercial loans excluding loans accounted for under the fair value option | 484,573 | 493,119 | $ | 2,071 | $ | 2,227 | $ | 284 | $ | 384 | Commercial loans excluding loans accounted for under the fair value option | 497,314 | 493,119 | $ | 1,697 | $ | 2,227 | $ | 224 | $ | 384 | ||||||||||||||||||||||||||||||||||||||||||||||||||||||
Loans accounted for under the fair value option (2) | Loans accounted for under the fair value option (2) | 6,310 | 5,946 | Loans accounted for under the fair value option (2) | 6,950 | 5,946 | ||||||||||||||||||||||||||||||||||||||||||||||||||||||||||||||||||||||
| Total commercial loans and leases | Total commercial loans and leases | $ | 490,883 | $ | 499,065 | Total commercial loans and leases | $ | 504,264 | $ | 499,065 | ||||||||||||||||||||||||||||||||||||||||||||||||||||||||||||||||||
| Table 28 | Commercial Net Charge-offs and Related Ratios | |||||||||||||||||||||||||||||||||||||||||||||||||||||||||||||||||||||||||||||||||||||||||||||||||||
| Table 29 | Table 29 | Commercial Net Charge-offs and Related Ratios | ||||||||||||||||||||||||||||||||||||||||||||||||||||||||||||||||||||||||||||||||||||||||||||||||||
| Net Charge-offs | Net Charge-off Ratios (1) | Net Charge-offs | Net Charge-off Ratios (1) | |||||||||||||||||||||||||||||||||||||||||||||||||||||||||||||||||||||||||||||||||||||||||||||||||
| Three Months Ended March 31 | Three Months Ended September 30 | Nine Months Ended September 30 | Three Months Ended September 30 | Nine Months Ended September 30 | ||||||||||||||||||||||||||||||||||||||||||||||||||||||||||||||||||||||||||||||||||||||||||||||||
| (Dollars in millions) | (Dollars in millions) | 2021 | 2020 | 2021 | 2020 | (Dollars in millions) | 2021 | 2020 | 2021 | 2020 | 2021 | 2020 | 2021 | 2020 | ||||||||||||||||||||||||||||||||||||||||||||||||||||||||||||||||||||||||||||||||||||||
| Commercial and industrial: | Commercial and industrial: | Commercial and industrial: | ||||||||||||||||||||||||||||||||||||||||||||||||||||||||||||||||||||||||||||||||||||||||||||||||||
| U.S. commercial | U.S. commercial | $ | 12 | $ | 163 | 0.02 | % | 0.21 | % | U.S. commercial | $ | 15 | $ | 154 | $ | (4) | $ | 536 | 0.02 | % | 0.20 | % | — | % | 0.23 | % | ||||||||||||||||||||||||||||||||||||||||||||||||||||||||||||||||||||||||||
| Non-U.S. commercial | Non-U.S. commercial | 26 | 1 | 0.12 | — | Non-U.S. commercial | 1 | 57 | 41 | 90 | — | 0.23 | 0.06 | 0.11 | ||||||||||||||||||||||||||||||||||||||||||||||||||||||||||||||||||||||||||||||||||||||
| Total commercial and industrial | Total commercial and industrial | 38 | 164 | 0.04 | 0.16 | Total commercial and industrial | 16 | 211 | 37 | 626 | 0.02 | 0.21 | 0.01 | 0.20 | ||||||||||||||||||||||||||||||||||||||||||||||||||||||||||||||||||||||||||||||||||||||
| Commercial real estate | Commercial real estate | 11 | 6 | 0.07 | 0.04 | Commercial real estate | — | 106 | 28 | 169 | — | 0.66 | 0.06 | 0.35 | ||||||||||||||||||||||||||||||||||||||||||||||||||||||||||||||||||||||||||||||||||||||
| Commercial lease financing | Commercial lease financing | — | 5 | — | 0.10 | Commercial lease financing | (1) | 24 | (1) | 60 | — | 0.53 | — | 0.43 | ||||||||||||||||||||||||||||||||||||||||||||||||||||||||||||||||||||||||||||||||||||||
| 49 | 175 | 0.04 | 0.14 | 15 | 341 | 64 | 855 | 0.01 | 0.28 | 0.02 | 0.23 | |||||||||||||||||||||||||||||||||||||||||||||||||||||||||||||||||||||||||||||||||||||||||
| U.S. small business commercial | U.S. small business commercial | 81 | 75 | 0.89 | 1.95 | U.S. small business commercial | 119 | 67 | 282 | 215 | 1.76 | 0.69 | 1.16 | 1.01 | ||||||||||||||||||||||||||||||||||||||||||||||||||||||||||||||||||||||||||||||||||||||
| Total commercial | Total commercial | $ | 130 | $ | 250 | 0.11 | 0.19 | Total commercial | $ | 134 | $ | 408 | $ | 346 | $ | 1,070 | 0.11 | 0.31 | 0.09 | 0.27 | ||||||||||||||||||||||||||||||||||||||||||||||||||||||||||||||||||||||||||||||||
Bank of America36 | ||||||||
| Table 29 | Commercial Reservable Criticized Utilized Exposure (1, 2) | |||||||||||||||||||||||||||||||||||||||||||||||||||
| Table 30 | Table 30 | Commercial Reservable Criticized Utilized Exposure (1, 2) | ||||||||||||||||||||||||||||||||||||||||||||||||||
| (Dollars in millions) | (Dollars in millions) | March 31, 2021 | December 31, 2020 | (Dollars in millions) | September 30, 2021 | December 31, 2020 | ||||||||||||||||||||||||||||||||||||||||||||||
| Commercial and industrial: | Commercial and industrial: | Commercial and industrial: | ||||||||||||||||||||||||||||||||||||||||||||||||||
| U.S. commercial | U.S. commercial | $ | 18,208 | 5.85 | % | $ | 21,388 | 6.83 | % | U.S. commercial | $ | 12,275 | 3.78 | % | $ | 21,388 | 6.83 | % | ||||||||||||||||||||||||||||||||||
| Non-U.S. commercial | Non-U.S. commercial | 4,384 | 4.53 | 5,051 | 5.03 | Non-U.S. commercial | 2,904 | 2.69 | 5,051 | 5.03 | ||||||||||||||||||||||||||||||||||||||||||
| Total commercial and industrial | Total commercial and industrial | 22,592 | 5.53 | 26,439 | 6.40 | Total commercial and industrial | 15,179 | 3.51 | 26,439 | 6.40 | ||||||||||||||||||||||||||||||||||||||||||
| Commercial real estate | Commercial real estate | 9,959 | 16.43 | 10,213 | 16.42 | Commercial real estate | 7,933 | 12.70 | 10,213 | 16.42 | ||||||||||||||||||||||||||||||||||||||||||
| Commercial lease financing | Commercial lease financing | 693 | 4.24 | 714 | 4.18 | Commercial lease financing | 404 | 2.68 | 714 | 4.18 | ||||||||||||||||||||||||||||||||||||||||||
| 33,244 | 6.85 | 37,366 | 7.59 | 23,516 | 4.61 | 37,366 | 7.59 | |||||||||||||||||||||||||||||||||||||||||||||
| U.S. small business commercial | U.S. small business commercial | 1,039 | 2.98 | 1,300 | 3.56 | U.S. small business commercial | 626 | 2.75 | 1,300 | 3.56 | ||||||||||||||||||||||||||||||||||||||||||
| Total commercial reservable criticized utilized exposure | Total commercial reservable criticized utilized exposure | $ | 34,283 | 6.59 | $ | 38,666 | 7.31 | Total commercial reservable criticized utilized exposure | $ | 24,142 | 4.53 | $ | 38,666 | 7.31 | ||||||||||||||||||||||||||||||||||||||
37Bank of America | ||||||||
| Table 30 | Outstanding Commercial Real Estate Loans | |||||||||||||
| (Dollars in millions) | March 31 2021 | December 31 2020 | ||||||||||||
| By Geographic Region | ||||||||||||||
| California | $ | 13,671 | $ | 14,028 | ||||||||||
| Northeast | 11,579 | 11,628 | ||||||||||||
| Southwest | 7,824 | 8,551 | ||||||||||||
| Southeast | 6,637 | 6,588 | ||||||||||||
| Florida | 4,401 | 4,294 | ||||||||||||
| Midwest | 2,921 | 3,483 | ||||||||||||
| Illinois | 2,676 | 2,594 | ||||||||||||
| Midsouth | 2,308 | 2,370 | ||||||||||||
| Northwest | 1,697 | 1,634 | ||||||||||||
| Non-U.S. | 2,976 | 3,187 | ||||||||||||
Other (1) | 2,074 | 2,007 | ||||||||||||
| Total outstanding commercial real estate loans | $ | 58,764 | $ | 60,364 | ||||||||||
| By Property Type | ||||||||||||||
| Non-residential | ||||||||||||||
| Office | $ | 17,333 | $ | 17,667 | ||||||||||
| Industrial / Warehouse | 8,312 | 8,330 | ||||||||||||
| Multi-family rental | 7,178 | 7,051 | ||||||||||||
| Hotels / Motels | 7,100 | 7,226 | ||||||||||||
| Shopping centers / Retail | 7,057 | 7,931 | ||||||||||||
| Unsecured | 2,310 | 2,336 | ||||||||||||
| Multi-use | 1,428 | 1,460 | ||||||||||||
| Other | 6,635 | 7,146 | ||||||||||||
| Total non-residential | 57,353 | 59,147 | ||||||||||||
| Residential | 1,411 | 1,217 | ||||||||||||
| Total outstanding commercial real estate loans | $ | 58,764 | $ | 60,364 | ||||||||||
| Table 31 | Outstanding Commercial Real Estate Loans | ||||||||||||||||
| (Dollars in millions) | September 30 2021 | December 31 2020 | |||||||||||||||
| By Geographic Region | |||||||||||||||||
| California | $ | 13,559 | $ | 14,028 | |||||||||||||
| Northeast | 13,057 | 11,628 | |||||||||||||||
| Southwest | 7,762 | 8,551 | |||||||||||||||
| Southeast | 6,630 | 6,588 | |||||||||||||||
| Florida | 4,316 | 4,294 | |||||||||||||||
| Illinois | 2,906 | 2,594 | |||||||||||||||
| Midwest | 2,487 | 3,483 | |||||||||||||||
| Midsouth | 2,265 | 2,370 | |||||||||||||||
| Northwest | 1,574 | 1,634 | |||||||||||||||
| Non-U.S. | 4,101 | 3,187 | |||||||||||||||
| Other | 2,066 | 2,007 | |||||||||||||||
| Total outstanding commercial real estate loans | $ | 60,723 | $ | 60,364 | |||||||||||||
| By Property Type | |||||||||||||||||
| Non-residential | |||||||||||||||||
| Office | $ | 18,327 | $ | 17,667 | |||||||||||||
| Industrial / Warehouse | 9,292 | 8,330 | |||||||||||||||
| Multi-family rental | 7,780 | 7,051 | |||||||||||||||
| Shopping centers /Retail | 6,642 | 7,931 | |||||||||||||||
| Hotel / Motels | 6,364 | 7,226 | |||||||||||||||
| Unsecured | 3,137 | 2,336 | |||||||||||||||
| Multi-use | 1,294 | 1,460 | |||||||||||||||
| Other | 6,700 | 7,146 | |||||||||||||||
| Total non-residential | 59,536 | 59,147 | |||||||||||||||
| Residential | 1,187 | 1,217 | |||||||||||||||
| Total outstanding commercial real estate loans | $ | 60,723 | $ | 60,364 | |||||||||||||
| Table 31 | Nonperforming Commercial Loans, Leases and Foreclosed Properties Activity (1, 2) | |||||||||||||||||||||||||
| Three Months Ended March 31 | ||||||||||||||||||||||||||
| (Dollars in millions) | 2021 | 2020 | ||||||||||||||||||||||||
| Nonperforming loans and leases, January 1 | $ | 2,227 | $ | 1,499 | ||||||||||||||||||||||
| Additions | 472 | 781 | ||||||||||||||||||||||||
| Reductions: | ||||||||||||||||||||||||||
| Paydowns | (312) | (212) | ||||||||||||||||||||||||
| Sales | (22) | (16) | ||||||||||||||||||||||||
Returns to performing status (3) | (28) | (16) | ||||||||||||||||||||||||
| Charge-offs | (78) | (184) | ||||||||||||||||||||||||
| Transfers to loans held-for-sale | (188) | — | ||||||||||||||||||||||||
| Total net additions (decreases) to nonperforming loans and leases | (156) | 353 | ||||||||||||||||||||||||
| Total nonperforming loans and leases, March 31 | 2,071 | 1,852 | ||||||||||||||||||||||||
| Foreclosed properties, March 31 | 36 | 49 | ||||||||||||||||||||||||
| Nonperforming commercial loans, leases and foreclosed properties, March 31 | $ | 2,107 | $ | 1,901 | ||||||||||||||||||||||
Nonperforming commercial loans and leases as a percentage of outstanding commercial loans and leases (4) | 0.43 | % | 0.32 | % | ||||||||||||||||||||||
Nonperforming commercial loans, leases and foreclosed properties as a percentage of outstanding commercial loans, leases and foreclosed properties (4) | 0.43 | 0.33 | ||||||||||||||||||||||||
Bank of America38 | ||||||||
| Table 32 | Nonperforming Commercial Loans, Leases and Foreclosed Properties Activity (1, 2) | |||||||||||||||||||||||||
| Three Months Ended September 30 | Nine Months Ended September 30 | |||||||||||||||||||||||||
| (Dollars in millions) | 2021 | 2020 | 2021 | 2020 | ||||||||||||||||||||||
| Nonperforming loans and leases, beginning of period | $ | 1,863 | $ | 2,202 | $ | 2,227 | $ | 1,499 | ||||||||||||||||||
| Additions | 275 | 656 | 1,250 | 2,326 | ||||||||||||||||||||||
| Reductions: | ||||||||||||||||||||||||||
| Paydowns | (297) | (216) | (873) | (605) | ||||||||||||||||||||||
| Sales | (29) | (50) | (128) | (76) | ||||||||||||||||||||||
Returns to performing status (3) | (82) | (21) | (169) | (45) | ||||||||||||||||||||||
| Charge-offs | (33) | (367) | (219) | (895) | ||||||||||||||||||||||
| Transfers to loans held-for-sale | — | (11) | (391) | (11) | ||||||||||||||||||||||
| Total net additions (reductions) to nonperforming loans and leases | (166) | (9) | (530) | 694 | ||||||||||||||||||||||
| Total nonperforming loans and leases, September 30 | 1,697 | 2,193 | 1,697 | 2,193 | ||||||||||||||||||||||
| Foreclosed properties, September 30 | 30 | 45 | 30 | 45 | ||||||||||||||||||||||
| Nonperforming commercial loans, leases and foreclosed properties, September 30 | $ | 1,727 | $ | 2,238 | $ | 1,727 | $ | 2,238 | ||||||||||||||||||
Nonperforming commercial loans and leases as a percentage of outstanding commercial loans and leases (4) | 0.34 | % | 0.43 | % | ||||||||||||||||||||||
Nonperforming commercial loans, leases and foreclosed properties as a percentage of outstanding commercial loans, leases and foreclosed properties (4) | 0.35 | 0.44 | ||||||||||||||||||||||||
| Table 32 | Commercial Troubled Debt Restructurings | |||||||||||||||||||||||||||||||||||||||||||||||||||||||||||||||||||||||||||
| Table 33 | Table 33 | Commercial Troubled Debt Restructurings | ||||||||||||||||||||||||||||||||||||||||||||||||||||||||||||||||||||||||||
| March 31, 2021 | December 31, 2020 | September 30, 2021 | December 31, 2020 | |||||||||||||||||||||||||||||||||||||||||||||||||||||||||||||||||||||||||
| (Dollars in millions) | (Dollars in millions) | Nonperforming | Performing | Total | Nonperforming | Performing | Total | (Dollars in millions) | Nonperforming | Performing | Total | Nonperforming | Performing | Total | ||||||||||||||||||||||||||||||||||||||||||||||||||||||||||||||
| Commercial and industrial: | Commercial and industrial: | Commercial and industrial: | ||||||||||||||||||||||||||||||||||||||||||||||||||||||||||||||||||||||||||
| U.S. commercial | U.S. commercial | $ | 484 | $ | 694 | $ | 1,178 | $ | 509 | $ | 850 | $ | 1,359 | U.S. commercial | $ | 377 | $ | 776 | $ | 1,153 | $ | 509 | $ | 850 | $ | 1,359 | ||||||||||||||||||||||||||||||||||||||||||||||||||
| Non-U.S. commercial | Non-U.S. commercial | 106 | 464 | 570 | 49 | 119 | 168 | Non-U.S. commercial | 65 | 30 | 95 | 49 | 119 | 168 | ||||||||||||||||||||||||||||||||||||||||||||||||||||||||||||||
| Total commercial and industrial | Total commercial and industrial | 590 | 1,158 | 1,748 | 558 | 969 | 1,527 | Total commercial and industrial | 442 | 806 | 1,248 | 558 | 969 | 1,527 | ||||||||||||||||||||||||||||||||||||||||||||||||||||||||||||||
| Commercial real estate | Commercial real estate | 156 | — | 156 | 137 | — | 137 | Commercial real estate | 158 | 440 | 598 | 137 | — | 137 | ||||||||||||||||||||||||||||||||||||||||||||||||||||||||||||||
| Commercial lease financing | Commercial lease financing | 17 | 1 | 18 | 42 | 2 | 44 | Commercial lease financing | 34 | 8 | 42 | 42 | 2 | 44 | ||||||||||||||||||||||||||||||||||||||||||||||||||||||||||||||
| 763 | 1,159 | 1,922 | 737 | 971 | 1,708 | 634 | 1,254 | 1,888 | 737 | 971 | 1,708 | |||||||||||||||||||||||||||||||||||||||||||||||||||||||||||||||||
| U.S. small business commercial | U.S. small business commercial | — | 33 | 33 | — | 29 | 29 | U.S. small business commercial | — | 35 | 35 | — | 29 | 29 | ||||||||||||||||||||||||||||||||||||||||||||||||||||||||||||||
| Total commercial troubled debt restructurings | Total commercial troubled debt restructurings | $ | 763 | $ | 1,192 | $ | 1,955 | $ | 737 | $ | 1,000 | $ | 1,737 | Total commercial troubled debt restructurings | $ | 634 | $ | 1,289 | $ | 1,923 | $ | 737 | $ | 1,000 | $ | 1,737 | ||||||||||||||||||||||||||||||||||||||||||||||||||
| Table 33 | Commercial Credit Exposure by Industry (1) | |||||||||||||||||||||||||
| Commercial Utilized | Total Commercial Committed (2) | |||||||||||||||||||||||||
| (Dollars in millions) | March 31 2021 | December 31 2020 | March 31 2021 | December 31 2020 | ||||||||||||||||||||||
| Asset managers and funds | $ | 68,863 | $ | 68,093 | $ | 106,681 | $ | 101,540 | ||||||||||||||||||
Real estate (3) | 66,477 | 69,267 | 90,604 | 92,414 | ||||||||||||||||||||||
| Capital goods | 37,231 | 39,911 | 78,372 | 80,959 | ||||||||||||||||||||||
| Finance companies | 49,483 | 46,948 | 76,246 | 70,004 | ||||||||||||||||||||||
| Healthcare equipment and services | 32,022 | 33,759 | 56,458 | 57,880 | ||||||||||||||||||||||
| Government and public education | 39,093 | 41,669 | 51,381 | 56,212 | ||||||||||||||||||||||
| Materials | 23,506 | 24,548 | 50,739 | 50,792 | ||||||||||||||||||||||
| Retailing | 24,843 | 24,749 | 48,962 | 49,710 | ||||||||||||||||||||||
| Consumer services | 29,881 | 32,000 | 47,503 | 48,026 | ||||||||||||||||||||||
| Food, beverage and tobacco | 22,701 | 22,871 | 44,861 | 44,628 | ||||||||||||||||||||||
| Commercial services and supplies | 21,187 | 21,154 | 37,830 | 38,149 | ||||||||||||||||||||||
| Energy | 13,602 | 13,936 | 32,425 | 32,983 | ||||||||||||||||||||||
| Transportation | 22,044 | 23,426 | 32,394 | 33,444 | ||||||||||||||||||||||
| Utilities | 11,681 | 12,387 | 29,481 | 29,234 | ||||||||||||||||||||||
| Individuals and trusts | 22,029 | 18,784 | 29,150 | 25,881 | ||||||||||||||||||||||
| Software and services | 11,690 | 11,709 | 27,198 | 23,647 | ||||||||||||||||||||||
| Media | 12,906 | 13,144 | 25,832 | 24,677 | ||||||||||||||||||||||
| Technology hardware and equipment | 9,846 | 10,515 | 25,034 | 24,796 | ||||||||||||||||||||||
| Telecommunication services | 8,752 | 9,411 | 24,422 | 15,605 | ||||||||||||||||||||||
| Global commercial banks | 21,232 | 20,751 | 23,380 | 22,922 | ||||||||||||||||||||||
| Automobiles and components | 11,858 | 10,956 | 20,528 | 20,765 | ||||||||||||||||||||||
| Consumer durables and apparel | 8,507 | 9,232 | 19,484 | 20,223 | ||||||||||||||||||||||
| Pharmaceuticals and biotechnology | 4,617 | 5,217 | 17,410 | 16,349 | ||||||||||||||||||||||
| Vehicle dealers | 13,487 | 15,028 | 16,877 | 18,696 | ||||||||||||||||||||||
| Insurance | 6,208 | 5,921 | 14,783 | 13,491 | ||||||||||||||||||||||
| Food and staples retailing | 5,499 | 5,209 | 10,585 | 11,810 | ||||||||||||||||||||||
| Financial markets infrastructure (clearinghouses) | 4,271 | 4,939 | 7,275 | 8,648 | ||||||||||||||||||||||
| Religious and social organizations | 4,598 | 4,769 | 6,513 | 6,759 | ||||||||||||||||||||||
| Total commercial credit exposure by industry | $ | 608,114 | $ | 620,303 | $ | 1,052,408 | $ | 1,040,244 | ||||||||||||||||||
39Bank of America | ||||||||
| Table 34 | Commercial Credit Exposure by Industry (1) | |||||||||||||||||||||||||
| Commercial Utilized | Total Commercial Committed (2) | |||||||||||||||||||||||||
| (Dollars in millions) | September 30 2021 | December 31 2020 | September 30 2021 | December 31 2020 | ||||||||||||||||||||||
| Asset managers & funds | $ | 84,420 | $ | 67,360 | $ | 132,205 | $ | 100,296 | ||||||||||||||||||
Real estate (3) | 67,925 | 68,967 | 94,462 | 91,730 | ||||||||||||||||||||||
| Capital goods | 40,501 | 39,807 | 87,011 | 80,815 | ||||||||||||||||||||||
| Finance companies | 49,979 | 46,948 | 78,110 | 70,004 | ||||||||||||||||||||||
| Healthcare equipment and services | 30,442 | 33,488 | 59,632 | 57,540 | ||||||||||||||||||||||
| Materials | 24,629 | 24,516 | 53,967 | 50,757 | ||||||||||||||||||||||
| Government & public education | 37,468 | 41,669 | 49,730 | 56,212 | ||||||||||||||||||||||
| Consumer services | 27,856 | 31,993 | 48,559 | 47,997 | ||||||||||||||||||||||
| Retailing | 22,882 | 23,700 | 47,037 | 48,306 | ||||||||||||||||||||||
| Food, beverage and tobacco | 21,813 | 22,755 | 44,508 | 44,417 | ||||||||||||||||||||||
| Commercial Services And Supplies | 19,192 | 21,107 | 38,222 | 38,092 | ||||||||||||||||||||||
| Individuals And Trusts | 28,379 | 24,727 | 38,119 | 34,036 | ||||||||||||||||||||||
| Energy | 14,850 | 13,930 | 33,378 | 32,974 | ||||||||||||||||||||||
| Utilities | 14,475 | 12,387 | 32,975 | 29,234 | ||||||||||||||||||||||
| Transportation | 21,862 | 23,126 | 32,753 | 33,082 | ||||||||||||||||||||||
| Media | 12,450 | 12,632 | 26,521 | 24,120 | ||||||||||||||||||||||
| Technology hardware and equipment | 9,866 | 9,935 | 25,520 | 24,196 | ||||||||||||||||||||||
| Software and services | 9,553 | 10,853 | 24,549 | 22,524 | ||||||||||||||||||||||
| Global commercial banks | 19,017 | 20,544 | 21,168 | 22,595 | ||||||||||||||||||||||
| Consumer durables and apparel | 9,028 | 9,232 | 20,243 | 20,223 | ||||||||||||||||||||||
| Telecommunication services | 8,435 | 9,411 | 19,072 | 15,605 | ||||||||||||||||||||||
| Pharmaceuticals and biotechnology | 4,534 | 4,830 | 17,672 | 15,901 | ||||||||||||||||||||||
| Automobiles and components | 9,104 | 10,792 | 16,967 | 20,575 | ||||||||||||||||||||||
| Vehicle dealers | 9,282 | 15,028 | 15,247 | 18,696 | ||||||||||||||||||||||
| Insurance | 4,977 | 5,772 | 13,381 | 13,277 | ||||||||||||||||||||||
| Food and staples retailing | 5,322 | 5,209 | 11,424 | 11,795 | ||||||||||||||||||||||
| Financial markets infrastructure (clearinghouses) | 3,680 | 4,939 | 5,905 | 8,648 | ||||||||||||||||||||||
| Religious and social organizations | 3,446 | 4,646 | 5,383 | 6,597 | ||||||||||||||||||||||
| Total commercial credit exposure by industry | $ | 615,367 | $ | 620,303 | $ | 1,093,720 | $ | 1,040,244 | ||||||||||||||||||
| Table 34 | Net Credit Default Protection by Maturity | |||||||||||||||||||||||||||
| Table 35 | Table 35 | Net Credit Default Protection by Maturity | ||||||||||||||||||||||||||
| March 31 2021 | December 31 2020 | September 30 2021 | December 31 2020 | |||||||||||||||||||||||||
| Less than or equal to one year | Less than or equal to one year | 62 | % | 65 | % | Less than or equal to one year | 37 | % | 65 | % | ||||||||||||||||||
| Greater than one year and less than or equal to five years | Greater than one year and less than or equal to five years | 37 | 34 | Greater than one year and less than or equal to five years | 60 | 34 | ||||||||||||||||||||||
| Greater than five years | Greater than five years | 1 | 1 | Greater than five years | 3 | 1 | ||||||||||||||||||||||
| Total net credit default protection | Total net credit default protection | 100 | % | 100 | % | Total net credit default protection | 100 | % | 100 | % | ||||||||||||||||||
Bank of America | ||||||||
| Table 35 | Net Credit Default Protection by Credit Exposure Debt Rating | |||||||||||||||||||||||||||||||||||||||||||||||||||
| Table 36 | Table 36 | Net Credit Default Protection by Credit Exposure Debt Rating | ||||||||||||||||||||||||||||||||||||||||||||||||||
Net Notional (1) | Percent of Total | Net Notional (1) | Percent of Total | Net Notional (1) | Percent of Total | Net Notional (1) | Percent of Total | |||||||||||||||||||||||||||||||||||||||||||||
| (Dollars in millions) | (Dollars in millions) | March 31, 2021 | December 31, 2020 | (Dollars in millions) | September 30, 2021 | December 31, 2020 | ||||||||||||||||||||||||||||||||||||||||||||||
Ratings (2, 3) | Ratings (2, 3) | Ratings (2, 3) | ||||||||||||||||||||||||||||||||||||||||||||||||||
| A | A | $ | (315) | 7.3 | % | $ | (250) | 6.0 | % | A | $ | (350) | 9.4 | % | $ | (250) | 6.0 | % | ||||||||||||||||||||||||||||||||||
| BBB | BBB | (1,815) | 42.1 | (1,856) | 44.5 | BBB | (1,423) | 38.3 | (1,856) | 44.5 | ||||||||||||||||||||||||||||||||||||||||||
| BB | BB | (1,327) | 30.8 | (1,363) | 32.7 | BB | (854) | 23.0 | (1,363) | 32.7 | ||||||||||||||||||||||||||||||||||||||||||
| B | B | (656) | 15.2 | (465) | 11.2 | B | (650) | 17.5 | (465) | 11.2 | ||||||||||||||||||||||||||||||||||||||||||
| CCC and below | CCC and below | (163) | 3.8 | (182) | 4.4 | CCC and below | (138) | 3.7 | (182) | 4.4 | ||||||||||||||||||||||||||||||||||||||||||
NR (4) | NR (4) | (33) | 0.8 | (54) | 1.2 | NR (4) | (303) | 8.1 | (54) | 1.2 | ||||||||||||||||||||||||||||||||||||||||||
Total net credit default protection | Total net credit default protection | $ | (4,309) | 100.0 | % | $ | (4,170) | 100.0 | % | Total net credit default protection | $ | (3,718) | 100.0 | % | $ | (4,170) | 100.0 | % | ||||||||||||||||||||||||||||||||||
| Table 36 | Top 20 Non-U.S. Countries Exposure | |||||||||||||||||||||||||||||||||||||||||||||||||||||||||||||||||||||||||||||||||||||||||||||||||||
| Table 37 | Table 37 | Top 20 Non-U.S. Countries Exposure | ||||||||||||||||||||||||||||||||||||||||||||||||||||||||||||||||||||||||||||||||||||||||||||||||||
| (Dollars in millions) | (Dollars in millions) | Funded Loans and Loan Equivalents | Unfunded Loan Commitments | Net Counterparty Exposure | Securities/ Other Investments | Country Exposure at March 31 2021 | Hedges and Credit Default Protection | Net Country Exposure at March 31 2021 | Increase (Decrease) from December 31 2020 | (Dollars in millions) | Funded Loans and Loan Equivalents | Unfunded Loan Commitments | Net Counterparty Exposure | Securities/ Other Investments | Country Exposure at September 30 2021 | Hedges and Credit Default Protection | Net Country Exposure at September 30 2021 | Increase (Decrease) from December 31 2020 | ||||||||||||||||||||||||||||||||||||||||||||||||||||||||||||||||||||||||||||||||||
| United Kingdom | United Kingdom | $ | 32,750 | $ | 17,379 | $ | 6,245 | $ | 3,585 | $ | 59,959 | $ | (1,172) | $ | 58,787 | $ | (685) | United Kingdom | $ | 31,193 | $ | 17,767 | $ | 6,891 | $ | 2,903 | $ | 58,754 | $ | (1,135) | $ | 57,619 | $ | (1,853) | ||||||||||||||||||||||||||||||||||||||||||||||||||||||||||||||||||
| Germany | Germany | 30,236 | 9,504 | 2,020 | 3,296 | 45,056 | (1,543) | 43,513 | (1,390) | Germany | 23,506 | 11,439 | 1,404 | 1,704 | 38,053 | (1,775) | 36,278 | (8,625) | ||||||||||||||||||||||||||||||||||||||||||||||||||||||||||||||||||||||||||||||||||
| Canada | Canada | 8,071 | 16,428 | 1,725 | 2,743 | 28,967 | (376) | 28,591 | 7,457 | Canada | 8,249 | 12,936 | 1,853 | 3,641 | 26,679 | (363) | 26,316 | 5,182 | ||||||||||||||||||||||||||||||||||||||||||||||||||||||||||||||||||||||||||||||||||
| Japan | Japan | 19,846 | 1,228 | 2,688 | 1,852 | 25,614 | (632) | 24,982 | 7,486 | Japan | 19,811 | 1,412 | 2,663 | 1,921 | 25,807 | (704) | 25,103 | 7,607 | ||||||||||||||||||||||||||||||||||||||||||||||||||||||||||||||||||||||||||||||||||
| France | France | 12,356 | 8,806 | 1,256 | 3,013 | 25,431 | (1,025) | 24,406 | 3,615 | France | 12,673 | 8,668 | 1,211 | 3,012 | 25,564 | (871) | 24,693 | 3,902 | ||||||||||||||||||||||||||||||||||||||||||||||||||||||||||||||||||||||||||||||||||
| Australia | Australia | 6,764 | 5,378 | 485 | 2,603 | 15,230 | (323) | 14,907 | 1,820 | Australia | 8,139 | 6,462 | 717 | 2,767 | 18,085 | (176) | 17,909 | 4,822 | ||||||||||||||||||||||||||||||||||||||||||||||||||||||||||||||||||||||||||||||||||
| China | China | 10,315 | 269 | 1,152 | 1,322 | 13,058 | (311) | 12,747 | (673) | China | 10,103 | 225 | 954 | 1,009 | 12,291 | (372) | 11,919 | (1,501) | ||||||||||||||||||||||||||||||||||||||||||||||||||||||||||||||||||||||||||||||||||
| Brazil | Brazil | 5,707 | 780 | 411 | 4,231 | 11,129 | (291) | 10,838 | 545 | Brazil | 6,188 | 1,005 | 446 | 4,123 | 11,762 | (180) | 11,582 | 1,289 | ||||||||||||||||||||||||||||||||||||||||||||||||||||||||||||||||||||||||||||||||||
| Netherlands | Netherlands | 5,498 | 4,042 | 671 | 803 | 11,014 | (424) | 10,590 | 906 | Netherlands | 6,006 | 3,412 | 861 | 1,007 | 11,286 | (446) | 10,840 | 1,156 | ||||||||||||||||||||||||||||||||||||||||||||||||||||||||||||||||||||||||||||||||||
| Singapore | Singapore | 4,844 | 335 | 431 | 4,057 | 9,667 | (54) | 9,613 | 331 | Singapore | 3,923 | 503 | 302 | 5,443 | 10,171 | (54) | 10,117 | 835 | ||||||||||||||||||||||||||||||||||||||||||||||||||||||||||||||||||||||||||||||||||
| Switzerland | Switzerland | 5,167 | 3,084 | 240 | 392 | 8,883 | (258) | 8,625 | 1,730 | |||||||||||||||||||||||||||||||||||||||||||||||||||||||||||||||||||||||||||||||||||||||||||
| South Korea | South Korea | 5,536 | 861 | 678 | 1,414 | 8,489 | (141) | 8,348 | (203) | |||||||||||||||||||||||||||||||||||||||||||||||||||||||||||||||||||||||||||||||||||||||||||
| Ireland | Ireland | 6,765 | 1,021 | 152 | 191 | 8,129 | (45) | 8,084 | 3,919 | |||||||||||||||||||||||||||||||||||||||||||||||||||||||||||||||||||||||||||||||||||||||||||
| Spain | Spain | 2,715 | 4,233 | 461 | 931 | 8,340 | (393) | 7,947 | 3,131 | |||||||||||||||||||||||||||||||||||||||||||||||||||||||||||||||||||||||||||||||||||||||||||
| India | India | 5,427 | 180 | 493 | 2,649 | 8,749 | (173) | 8,576 | 765 | India | 5,596 | 171 | 464 | 1,739 | 7,970 | (190) | 7,780 | (31) | ||||||||||||||||||||||||||||||||||||||||||||||||||||||||||||||||||||||||||||||||||
| South Korea | 5,253 | 883 | 448 | 2,075 | 8,659 | (154) | 8,505 | (46) | ||||||||||||||||||||||||||||||||||||||||||||||||||||||||||||||||||||||||||||||||||||||||||||
| Switzerland | 4,922 | 2,921 | 436 | 267 | 8,546 | (271) | 8,275 | 1,380 | ||||||||||||||||||||||||||||||||||||||||||||||||||||||||||||||||||||||||||||||||||||||||||||
| Hong Kong | Hong Kong | 4,791 | 565 | 534 | 1,154 | 7,044 | (27) | 7,017 | 480 | Hong Kong | 5,656 | 225 | 450 | 1,143 | 7,474 | (18) | 7,456 | 919 | ||||||||||||||||||||||||||||||||||||||||||||||||||||||||||||||||||||||||||||||||||
| Sweden | Sweden | 1,163 | 5,355 | 212 | 322 | 7,052 | (142) | 6,910 | 4,354 | |||||||||||||||||||||||||||||||||||||||||||||||||||||||||||||||||||||||||||||||||||||||||||
| Mexico | Mexico | 4,247 | 1,374 | 119 | 778 | 6,518 | (296) | 6,222 | (65) | |||||||||||||||||||||||||||||||||||||||||||||||||||||||||||||||||||||||||||||||||||||||||||
| Italy | Italy | 2,325 | 1,415 | 540 | 2,746 | 7,026 | (711) | 6,315 | 623 | Italy | 2,564 | 1,688 | 515 | 1,492 | 6,259 | (563) | 5,696 | 4 | ||||||||||||||||||||||||||||||||||||||||||||||||||||||||||||||||||||||||||||||||||
| Ireland | 4,416 | 1,035 | 113 | 343 | 5,907 | (19) | 5,888 | 1,723 | ||||||||||||||||||||||||||||||||||||||||||||||||||||||||||||||||||||||||||||||||||||||||||||
| Mexico | 3,264 | 1,268 | 174 | 1,179 | 5,885 | (360) | 5,525 | (762) | ||||||||||||||||||||||||||||||||||||||||||||||||||||||||||||||||||||||||||||||||||||||||||||
| Belgium | Belgium | 2,906 | 1,303 | 297 | 615 | 5,121 | (144) | 4,977 | 10 | Belgium | 2,643 | 1,291 | 355 | 364 | 4,653 | (202) | 4,451 | (516) | ||||||||||||||||||||||||||||||||||||||||||||||||||||||||||||||||||||||||||||||||||
| Spain | 2,655 | 1,009 | 248 | 702 | 4,614 | (290) | 4,324 | (492) | ||||||||||||||||||||||||||||||||||||||||||||||||||||||||||||||||||||||||||||||||||||||||||||
| Sweden | 1,190 | 903 | 217 | 434 | 2,744 | (159) | 2,585 | 29 | ||||||||||||||||||||||||||||||||||||||||||||||||||||||||||||||||||||||||||||||||||||||||||||
| Total top 20 non-U.S. countries exposure | Total top 20 non-U.S. countries exposure | $ | 173,536 | $ | 75,631 | $ | 20,584 | $ | 39,669 | $ | 309,420 | $ | (8,459) | $ | 300,961 | $ | 23,122 | Total top 20 non-U.S. countries exposure | $ | 171,843 | $ | 83,132 | $ | 20,948 | $ | 36,296 | $ | 312,219 | $ | (8,324) | $ | 303,895 | $ | 26,056 | ||||||||||||||||||||||||||||||||||||||||||||||||||||||||||||||||||
| Table 37 | Allocation of the Allowance for Credit Losses by Product Type | |||||||||||||||||||||||||||||||||||||||||||||||||||||||||||||||||||||||||||||||||||||||||||||||||||||||||||||||
| Table 38 | Table 38 | Allocation of the Allowance for Credit Losses by Product Type | ||||||||||||||||||||||||||||||||||||||||||||||||||||||||||||||||||||||||||||||||||||||||||||||||||||||||||||||
| Amount | Percent of Total | Percent of Loans and Leases Outstanding (1) | Amount | Percent of Total | Percent of Loans and Leases Outstanding (1) | Amount | Percent of Total | Percent of Loans and Leases Outstanding (1) | Amount | Percent of Total | Percent of Loans and Leases Outstanding (1) | |||||||||||||||||||||||||||||||||||||||||||||||||||||||||||||||||||||||||||||||||||||||||||||||||||||
| (Dollars in millions) | (Dollars in millions) | March 31, 2021 | December 31, 2020 | (Dollars in millions) | September 30, 2021 | December 31, 2020 | ||||||||||||||||||||||||||||||||||||||||||||||||||||||||||||||||||||||||||||||||||||||||||||||||||||||||||
| Allowance for loan and lease losses | Allowance for loan and lease losses | Allowance for loan and lease losses | ||||||||||||||||||||||||||||||||||||||||||||||||||||||||||||||||||||||||||||||||||||||||||||||||||||||||||||||
| Residential mortgage | Residential mortgage | $ | 428 | 2.65 | % | 0.20 | % | $ | 459 | 2.44 | % | 0.21 | % | Residential mortgage | $ | 353 | 2.68 | % | 0.16 | % | $ | 459 | 2.44 | % | 0.21 | % | ||||||||||||||||||||||||||||||||||||||||||||||||||||||||||||||||||||||||||||||||||||||
| Home equity | Home equity | 261 | 1.61 | 0.81 | 399 | 2.12 | 1.16 | Home equity | 202 | 1.54 | 0.70 | 399 | 2.12 | 1.16 | ||||||||||||||||||||||||||||||||||||||||||||||||||||||||||||||||||||||||||||||||||||||||||||||||||
| Credit card | Credit card | 7,278 | 45.00 | 10.00 | 8,420 | 44.79 | 10.70 | Credit card | 6,055 | 46.04 | 7.88 | 8,420 | 44.79 | 10.70 | ||||||||||||||||||||||||||||||||||||||||||||||||||||||||||||||||||||||||||||||||||||||||||||||||||
| Direct/Indirect consumer | Direct/Indirect consumer | 617 | 3.82 | 0.67 | 752 | 4.00 | 0.82 | Direct/Indirect consumer | 541 | 4.11 | 0.54 | 752 | 4.00 | 0.82 | ||||||||||||||||||||||||||||||||||||||||||||||||||||||||||||||||||||||||||||||||||||||||||||||||||
| Other consumer | Other consumer | 51 | 0.32 | n/m | 41 | 0.22 | n/m | Other consumer | 43 | 0.33 | n/m | 41 | 0.22 | n/m | ||||||||||||||||||||||||||||||||||||||||||||||||||||||||||||||||||||||||||||||||||||||||||||||||||
| Total consumer | Total consumer | 8,635 | 53.40 | 2.10 | 10,071 | 53.57 | 2.35 | Total consumer | 7,194 | 54.70 | 1.70 | 10,071 | 53.57 | 2.35 | ||||||||||||||||||||||||||||||||||||||||||||||||||||||||||||||||||||||||||||||||||||||||||||||||||
U.S. commercial (2) | U.S. commercial (2) | 4,131 | 25.55 | 1.30 | 5,043 | 26.82 | 1.55 | U.S. commercial (2) | 3,235 | 24.59 | 1.02 | 5,043 | 26.82 | 1.55 | ||||||||||||||||||||||||||||||||||||||||||||||||||||||||||||||||||||||||||||||||||||||||||||||||||
| Non-U.S. commercial | Non-U.S. commercial | 1,154 | 7.14 | 1.26 | 1,241 | 6.60 | 1.37 | Non-U.S. commercial | 1,032 | 7.84 | 1.00 | 1,241 | 6.60 | 1.37 | ||||||||||||||||||||||||||||||||||||||||||||||||||||||||||||||||||||||||||||||||||||||||||||||||||
| Commercial real estate | Commercial real estate | 2,148 | 13.29 | 3.66 | 2,285 | 12.15 | 3.79 | Commercial real estate | 1,621 | 12.32 | 2.67 | 2,285 | 12.15 | 3.79 | ||||||||||||||||||||||||||||||||||||||||||||||||||||||||||||||||||||||||||||||||||||||||||||||||||
| Commercial lease financing | Commercial lease financing | 100 | 0.62 | 0.61 | 162 | 0.86 | 0.95 | Commercial lease financing | 73 | 0.55 | 0.48 | 162 | 0.86 | 0.95 | ||||||||||||||||||||||||||||||||||||||||||||||||||||||||||||||||||||||||||||||||||||||||||||||||||
| Total commercial | Total commercial | 7,533 | 46.60 | 1.55 | 8,731 | 46.43 | 1.77 | Total commercial | 5,961 | 45.30 | 1.20 | 8,731 | 46.43 | 1.77 | ||||||||||||||||||||||||||||||||||||||||||||||||||||||||||||||||||||||||||||||||||||||||||||||||||
| Allowance for loan and lease losses | Allowance for loan and lease losses | 16,168 | 100.00 | % | 1.80 | 18,802 | 100.00 | % | 2.04 | Allowance for loan and lease losses | 13,155 | 100.00 | % | 1.43 | 18,802 | 100.00 | % | 2.04 | ||||||||||||||||||||||||||||||||||||||||||||||||||||||||||||||||||||||||||||||||||||||||||||||
| Reserve for unfunded lending commitments | Reserve for unfunded lending commitments | 1,829 | 1,878 | Reserve for unfunded lending commitments | 1,538 | 1,878 | ||||||||||||||||||||||||||||||||||||||||||||||||||||||||||||||||||||||||||||||||||||||||||||||||||||||||||
| Allowance for credit losses | Allowance for credit losses | $ | 17,997 | $ | 20,680 | Allowance for credit losses | $ | 14,693 | $ | 20,680 | ||||||||||||||||||||||||||||||||||||||||||||||||||||||||||||||||||||||||||||||||||||||||||||||||||||||
Bank of America | ||||||||
| Table 38 | Allowance for Credit Losses | |||||||||||||||||||||||||||||||||||||||||||||||||||
| Table 39 | Table 39 | Allowance for Credit Losses | ||||||||||||||||||||||||||||||||||||||||||||||||||
| Three Months Ended March 31 | Three Months Ended September 30 | Nine Months Ended September 30 | ||||||||||||||||||||||||||||||||||||||||||||||||||
| (Dollars in millions) | (Dollars in millions) | 2021 | 2020 | (Dollars in millions) | 2021 | 2020 | 2021 | 2020 | ||||||||||||||||||||||||||||||||||||||||||||
| Allowance for loan and lease losses, January 1 | Allowance for loan and lease losses, January 1 | $ | 18,802 | $ | 12,358 | Allowance for loan and lease losses, January 1 | $ | 14,095 | $ | 19,389 | $ | 18,802 | $ | 12,358 | ||||||||||||||||||||||||||||||||||||||
| Loans and leases charged off | Loans and leases charged off | Loans and leases charged off | ||||||||||||||||||||||||||||||||||||||||||||||||||
| Residential mortgage | Residential mortgage | (9) | (11) | Residential mortgage | (7) | (5) | (27) | (28) | ||||||||||||||||||||||||||||||||||||||||||||
| Home equity | Home equity | (6) | (24) | Home equity | (8) | (8) | (33) | (47) | ||||||||||||||||||||||||||||||||||||||||||||
| Credit card | Credit card | (800) | (924) | Credit card | (495) | (665) | (1,956) | (2,407) | ||||||||||||||||||||||||||||||||||||||||||||
| Direct/Indirect consumer | Direct/Indirect consumer | (102) | (116) | Direct/Indirect consumer | (59) | (75) | (229) | (277) | ||||||||||||||||||||||||||||||||||||||||||||
| Other consumer | Other consumer | (75) | (81) | Other consumer | (72) | (70) | (217) | (232) | ||||||||||||||||||||||||||||||||||||||||||||
| Total consumer charge-offs | Total consumer charge-offs | (992) | (1,156) | Total consumer charge-offs | (641) | (823) | (2,462) | (2,991) | ||||||||||||||||||||||||||||||||||||||||||||
U.S. commercial (1) | U.S. commercial (1) | (156) | (267) | U.S. commercial (1) | (159) | (279) | (509) | (870) | ||||||||||||||||||||||||||||||||||||||||||||
| Non-U.S. commercial | Non-U.S. commercial | (26) | (1) | Non-U.S. commercial | (2) | (57) | (44) | (91) | ||||||||||||||||||||||||||||||||||||||||||||
| Commercial real estate | Commercial real estate | (12) | (7) | Commercial real estate | (4) | (106) | (38) | (170) | ||||||||||||||||||||||||||||||||||||||||||||
| Commercial lease financing | Commercial lease financing | — | (7) | Commercial lease financing | — | (28) | — | (68) | ||||||||||||||||||||||||||||||||||||||||||||
| Total commercial charge-offs | Total commercial charge-offs | (194) | (282) | Total commercial charge-offs | (165) | (470) | (591) | (1,199) | ||||||||||||||||||||||||||||||||||||||||||||
| Total loans and leases charged off | Total loans and leases charged off | (1,186) | (1,438) | Total loans and leases charged off | (806) | (1,293) | (3,053) | (4,190) | ||||||||||||||||||||||||||||||||||||||||||||
| Recoveries of loans and leases previously charged off | Recoveries of loans and leases previously charged off | Recoveries of loans and leases previously charged off | ||||||||||||||||||||||||||||||||||||||||||||||||||
| Residential mortgage | Residential mortgage | 13 | 12 | Residential mortgage | 14 | 11 | 44 | 55 | ||||||||||||||||||||||||||||||||||||||||||||
| Home equity | Home equity | 41 | 35 | Home equity | 42 | 28 | 126 | 92 | ||||||||||||||||||||||||||||||||||||||||||||
| Credit card | Credit card | 166 | 154 | Credit card | 174 | 156 | 513 | 463 | ||||||||||||||||||||||||||||||||||||||||||||
| Direct/Indirect consumer | Direct/Indirect consumer | 71 | 76 | Direct/Indirect consumer | 77 | 57 | 225 | 193 | ||||||||||||||||||||||||||||||||||||||||||||
| Other consumer | Other consumer | 8 | 7 | Other consumer | 5 | 7 | 19 | 18 | ||||||||||||||||||||||||||||||||||||||||||||
| Total consumer recoveries | Total consumer recoveries | 299 | 284 | Total consumer recoveries | 312 | 259 | 927 | 821 | ||||||||||||||||||||||||||||||||||||||||||||
U.S. commercial (2) | U.S. commercial (2) | 63 | 29 | U.S. commercial (2) | 25 | 58 | 231 | 119 | ||||||||||||||||||||||||||||||||||||||||||||
| Non-U.S. commercial | Non-U.S. commercial | 1 | — | 3 | 1 | |||||||||||||||||||||||||||||||||||||||||||||||
| Commercial real estate | Commercial real estate | 1 | 1 | Commercial real estate | 4 | — | 10 | 1 | ||||||||||||||||||||||||||||||||||||||||||||
| Commercial lease financing | Commercial lease financing | — | 2 | Commercial lease financing | 1 | 4 | 1 | 8 | ||||||||||||||||||||||||||||||||||||||||||||
| Total commercial recoveries | Total commercial recoveries | 64 | 32 | Total commercial recoveries | 31 | 62 | 245 | 129 | ||||||||||||||||||||||||||||||||||||||||||||
| Total recoveries of loans and leases previously charged off | Total recoveries of loans and leases previously charged off | 363 | 316 | Total recoveries of loans and leases previously charged off | 343 | 321 | 1,172 | 950 | ||||||||||||||||||||||||||||||||||||||||||||
| Net charge-offs | Net charge-offs | (823) | (1,122) | Net charge-offs | (463) | (972) | (1,881) | (3,240) | ||||||||||||||||||||||||||||||||||||||||||||
| Provision for loan and lease losses | Provision for loan and lease losses | (1,811) | 4,525 | Provision for loan and lease losses | (475) | 1,180 | (3,766) | 10,480 | ||||||||||||||||||||||||||||||||||||||||||||
| Other | Other | — | 5 | Other | (2) | (1) | — | (2) | ||||||||||||||||||||||||||||||||||||||||||||
| Allowance for loan and lease losses, March 31 | 16,168 | 15,766 | ||||||||||||||||||||||||||||||||||||||||||||||||||
| Allowance for loan and lease losses, September 30 | Allowance for loan and lease losses, September 30 | 13,155 | 19,596 | 13,155 | 19,596 | |||||||||||||||||||||||||||||||||||||||||||||||
| Reserve for unfunded lending commitments, January 1 | Reserve for unfunded lending commitments, January 1 | 1,878 | 1,123 | Reserve for unfunded lending commitments, January 1 | 1,687 | 1,702 | 1,878 | 1,123 | ||||||||||||||||||||||||||||||||||||||||||||
| Provision for unfunded lending commitments | Provision for unfunded lending commitments | (49) | 236 | Provision for unfunded lending commitments | (149) | 209 | (339) | 787 | ||||||||||||||||||||||||||||||||||||||||||||
| Other | Other | — | 1 | Other | — | (1) | (1) | — | ||||||||||||||||||||||||||||||||||||||||||||
| Reserve for unfunded lending commitments, March 31 | 1,829 | 1,360 | ||||||||||||||||||||||||||||||||||||||||||||||||||
| Allowance for credit losses, March 31 | $ | 17,997 | $ | 17,126 | ||||||||||||||||||||||||||||||||||||||||||||||||
| Reserve for unfunded lending commitments, September 30 | Reserve for unfunded lending commitments, September 30 | 1,538 | 1,910 | 1,538 | 1,910 | |||||||||||||||||||||||||||||||||||||||||||||||
| Allowance for credit losses, September 30 | Allowance for credit losses, September 30 | $ | 14,693 | $ | 21,506 | $ | 14,693 | $ | 21,506 | |||||||||||||||||||||||||||||||||||||||||||
Loan and allowance ratios (3): | Loan and allowance ratios (3): | Loan and allowance ratios (3): | ||||||||||||||||||||||||||||||||||||||||||||||||||
| Loans and leases outstanding at March 31 | $ | 896,085 | $ | 1,041,769 | ||||||||||||||||||||||||||||||||||||||||||||||||
| Allowance for loan and lease losses as a percentage of total loans and leases outstanding at March 31 | 1.80 | % | 1.51 | % | ||||||||||||||||||||||||||||||||||||||||||||||||
| Consumer allowance for loan and lease losses as a percentage of total consumer loans and leases outstanding at March 31 | 2.10 | 1.95 | ||||||||||||||||||||||||||||||||||||||||||||||||||
| Commercial allowance for loan and lease losses as a percentage of total commercial loans and leases outstanding at March 31 | 1.55 | 1.16 | ||||||||||||||||||||||||||||||||||||||||||||||||||
| Loans and leases outstanding at September 30 | Loans and leases outstanding at September 30 | $ | 920,170 | $ | 947,938 | $ | 920,170 | $ | 947,938 | |||||||||||||||||||||||||||||||||||||||||||
| Allowance for loan and lease losses as a percentage of total loans and leases outstanding at September 30 | Allowance for loan and lease losses as a percentage of total loans and leases outstanding at September 30 | 1.43 | % | 2.07 | % | 1.43 | % | 2.07 | % | |||||||||||||||||||||||||||||||||||||||||||
| Consumer allowance for loan and lease losses as a percentage of total consumer loans and leases outstanding at September 30 | Consumer allowance for loan and lease losses as a percentage of total consumer loans and leases outstanding at September 30 | 1.70 | 2.43 | 1.70 | 2.43 | |||||||||||||||||||||||||||||||||||||||||||||||
| Commercial allowance for loan and lease losses as a percentage of total commercial loans and leases outstanding at September 30 | Commercial allowance for loan and lease losses as a percentage of total commercial loans and leases outstanding at September 30 | 1.20 | 1.75 | 1.20 | 1.75 | |||||||||||||||||||||||||||||||||||||||||||||||
| Average loans and leases outstanding | Average loans and leases outstanding | $ | 901,587 | $ | 981,652 | Average loans and leases outstanding | $ | 913,113 | $ | 965,836 | $ | 905,214 | $ | 989,839 | ||||||||||||||||||||||||||||||||||||||
| Annualized net charge-offs as a percentage of average loans and leases outstanding | Annualized net charge-offs as a percentage of average loans and leases outstanding | 0.37 | % | 0.46 | % | Annualized net charge-offs as a percentage of average loans and leases outstanding | 0.20 | % | 0.40 | % | 0.28 | % | 0.44 | % | ||||||||||||||||||||||||||||||||||||||
| Allowance for loan and lease losses as a percentage of total nonperforming loans and leases at March 31 | 313 | 389 | ||||||||||||||||||||||||||||||||||||||||||||||||||
| Ratio of the allowance for loan and lease losses at March 31 to net charge-offs | 4.85 | 3.49 | ||||||||||||||||||||||||||||||||||||||||||||||||||
| Allowance for loan and lease losses as a percentage of total nonperforming loans and leases at September 30 | Allowance for loan and lease losses as a percentage of total nonperforming loans and leases at September 30 | 279 | 431 | 279 | 431 | |||||||||||||||||||||||||||||||||||||||||||||||
| Ratio of the allowance for loan and lease losses at September 30 to net charge-offs | Ratio of the allowance for loan and lease losses at September 30 to net charge-offs | 7.16 | 5.07 | 5.23 | 4.53 | |||||||||||||||||||||||||||||||||||||||||||||||
Amounts included in allowance for loan and lease losses for loans and leases that are excluded from nonperforming loans and leases at March 31 (4) | $ | 8,710 | $ | 8,552 | ||||||||||||||||||||||||||||||||||||||||||||||||
Allowance for loan and lease losses as a percentage of total nonperforming loans and leases, excluding the allowance for loan and lease losses for loans and leases that are excluded from nonperforming loans and leases at March 31 (4) | 144 | % | 178 | % | ||||||||||||||||||||||||||||||||||||||||||||||||
Amounts included in allowance for loan and lease losses for loans and leases that are excluded from nonperforming loans and leases at September 30 (4) | Amounts included in allowance for loan and lease losses for loans and leases that are excluded from nonperforming loans and leases at September 30 (4) | $ | 7,375 | $ | 10,331 | $ | 7,375 | $ | 10,331 | |||||||||||||||||||||||||||||||||||||||||||
Allowance for loan and lease losses as a percentage of total nonperforming loans and leases, excluding the allowance for loan and lease losses for loans and leases that are excluded from nonperforming loans and leases at September 30 (4) | Allowance for loan and lease losses as a percentage of total nonperforming loans and leases, excluding the allowance for loan and lease losses for loans and leases that are excluded from nonperforming loans and leases at September 30 (4) | 123 | % | 204 | % | 123 | % | 204 | % | |||||||||||||||||||||||||||||||||||||||||||
43Bank of America | ||||||||
| Table 39 | Market Risk VaR for Trading Activities | |||||||||||||||||||||||||||||||||||||||||||||||||||||||||||||||||||||||||||||||||||||||||||||||||||||||||||||||||||||||||||||||||||||||||||||||||||||||||||||||||||||||||||
| Table 40 | Table 40 | Market Risk VaR for Trading Activities | ||||||||||||||||||||||||||||||||||||||||||||||||||||||||||||||||||||||||||||||||||||||||||||||||||||||||||||||||||||||||||||||||||||||||||||||||||||||||||||||||||||||||||
| Three Months Ended | Three Months Ended | Nine Months Ended September 30 | ||||||||||||||||||||||||||||||||||||||||||||||||||||||||||||||||||||||||||||||||||||||||||||||||||||||||||||||||||||||||||||||||||||||||||||||||||||||||||||||||||||||||||
| Nine Months Ended September 30 | ||||||||||||||||||||||||||||||||||||||||||||||||||||||||||||||||||||||||||||||||||||||||||||||||||||||||||||||||||||||||||||||||||||||||||||||||||||||||||||||||||||||||||||
| March 31, 2021 | December 31, 2020 | March 31, 2020 | September 30, 2021 | June 30, 2021 | September 30, 2020 | Nine Months Ended September 30 | ||||||||||||||||||||||||||||||||||||||||||||||||||||||||||||||||||||||||||||||||||||||||||||||||||||||||||||||||||||||||||||||||||||||||||||||||||||||||||||||||||||||
| (Dollars in millions) | (Dollars in millions) | Period End | Average | High (1) | Period End | Average | High (1) | Low (1) | Period End | Average | High (1) | Low (1) | (Dollars in millions) | Period End | Average | High (1) | Low (1) | Period End | Average | High (1) | Low (1) | Period End | Average | High (1) | Low (1) | 2021 Average | 2020 Average | |||||||||||||||||||||||||||||||||||||||||||||||||||||||||||||||||||||||||||||||||||||||||||||||||||||||||||||||||||||||||||||||||||||||||||||||||
| Foreign exchange | Foreign exchange | $ | 13 | $ | 10 | $ | 17 | $ | 5 | $ | 8 | $ | 6 | $ | 10 | $ | 4 | $ | 8 | $ | 5 | $ | 11 | $ | 2 | Foreign exchange | $ | 12 | $ | 13 | $ | 21 | $ | 9 | $ | 15 | $ | 16 | $ | 20 | $ | 10 | $ | 7 | $ | 7 | $ | 25 | $ | 5 | $ | 13 | $ | 7 | ||||||||||||||||||||||||||||||||||||||||||||||||||||||||||||||||||||||||||||||||||||||||||||||||||||||||||||||||||||||
| Interest rate | Interest rate | 53 | 35 | 53 | 18 | 30 | 20 | 31 | 11 | 13 | 21 | 39 | 13 | Interest rate | 33 | 32 | 48 | 20 | 37 | 58 | 80 | 30 | 14 | 18 | 27 | 13 | 42 | 18 | ||||||||||||||||||||||||||||||||||||||||||||||||||||||||||||||||||||||||||||||||||||||||||||||||||||||||||||||||||||||||||||||||||||||||||||||||
| Credit | Credit | 58 | 64 | 82 | 53 | 79 | 68 | 84 | 52 | 86 | 35 | 86 | 25 | Credit | 72 | 66 | 80 | 54 | 77 | 73 | 84 | 58 | 61 | 62 | 68 | 54 | 68 | 54 | ||||||||||||||||||||||||||||||||||||||||||||||||||||||||||||||||||||||||||||||||||||||||||||||||||||||||||||||||||||||||||||||||||||||||||||||||
| Equity | Equity | 22 | 24 | 35 | 19 | 20 | 19 | 33 | 14 | 26 | 36 | 162 | 19 | Equity | 32 | 24 | 32 | 19 | 23 | 23 | 27 | 20 | 16 | 17 | 22 | 12 | 24 | 26 | ||||||||||||||||||||||||||||||||||||||||||||||||||||||||||||||||||||||||||||||||||||||||||||||||||||||||||||||||||||||||||||||||||||||||||||||||
| Commodities | Commodities | 4 | 9 | 28 | 4 | 4 | 6 | 9 | 3 | 8 | 6 | 10 | 4 | Commodities | 6 | 8 | 11 | 5 | 9 | 8 | 12 | 4 | 4 | 6 | 10 | 4 | 8 | 6 | ||||||||||||||||||||||||||||||||||||||||||||||||||||||||||||||||||||||||||||||||||||||||||||||||||||||||||||||||||||||||||||||||||||||||||||||||
| Portfolio diversification | Portfolio diversification | (96) | (90) | — | — | (72) | (68) | — | — | (82) | (57) | — | — | Portfolio diversification | (94) | (91) | — | — | (106) | (119) | — | — | (71) | (56) | — | — | (101) | (58) | ||||||||||||||||||||||||||||||||||||||||||||||||||||||||||||||||||||||||||||||||||||||||||||||||||||||||||||||||||||||||||||||||||||||||||||||||
| Total covered positions portfolio | Total covered positions portfolio | 54 | 52 | 85 | 34 | 69 | 51 | 84 | 31 | 59 | 46 | 171 | 27 | Total covered positions portfolio | 61 | 52 | 71 | 41 | 55 | 59 | 73 | 47 | 31 | 54 | 96 | 31 | 54 | 53 | ||||||||||||||||||||||||||||||||||||||||||||||||||||||||||||||||||||||||||||||||||||||||||||||||||||||||||||||||||||||||||||||||||||||||||||||||
| Impact from less liquid exposures | Impact from less liquid exposures | 9 | 22 | — | — | 52 | 30 | — | — | 39 | 2 | — | — | Impact from less liquid exposures | 40 | 26 | — | — | 23 | 18 | — | — | 50 | 55 | — | — | 22 | 26 | ||||||||||||||||||||||||||||||||||||||||||||||||||||||||||||||||||||||||||||||||||||||||||||||||||||||||||||||||||||||||||||||||||||||||||||||||
| Total covered positions and less liquid trading positions portfolio | Total covered positions and less liquid trading positions portfolio | 63 | 74 | 125 | 47 | 121 | 81 | 129 | 49 | 98 | 48 | 169 | 30 | Total covered positions and less liquid trading positions portfolio | 101 | 78 | 123 | 51 | 78 | 77 | 119 | 52 | 81 | 109 | 149 | 55 | 76 | 79 | ||||||||||||||||||||||||||||||||||||||||||||||||||||||||||||||||||||||||||||||||||||||||||||||||||||||||||||||||||||||||||||||||||||||||||||||||
| Fair value option loans | Fair value option loans | 48 | 56 | 64 | 37 | 52 | 62 | 70 | 51 | 75 | 16 | 78 | 7 | Fair value option loans | 50 | 45 | 54 | 31 | 50 | 50 | 55 | 42 | 71 | 62 | 72 | 54 | 50 | 48 | ||||||||||||||||||||||||||||||||||||||||||||||||||||||||||||||||||||||||||||||||||||||||||||||||||||||||||||||||||||||||||||||||||||||||||||||||
| Fair value option hedges | Fair value option hedges | 15 | 13 | 16 | 11 | 11 | 12 | 13 | 11 | 13 | 11 | 16 | 9 | Fair value option hedges | 18 | 17 | 20 | 14 | 14 | 16 | 17 | 14 | 11 | 13 | 15 | 11 | 15 | 13 | ||||||||||||||||||||||||||||||||||||||||||||||||||||||||||||||||||||||||||||||||||||||||||||||||||||||||||||||||||||||||||||||||||||||||||||||||
| Fair value option portfolio diversification | Fair value option portfolio diversification | (33) | (24) | — | — | (17) | (19) | — | — | (13) | (11) | — | — | Fair value option portfolio diversification | (44) | (36) | — | — | (34) | (37) | — | — | (27) | (32) | — | — | (32) | (24) | ||||||||||||||||||||||||||||||||||||||||||||||||||||||||||||||||||||||||||||||||||||||||||||||||||||||||||||||||||||||||||||||||||||||||||||||||
| Total fair value option portfolio | Total fair value option portfolio | 30 | 45 | 53 | 30 | 46 | 55 | 64 | 46 | 75 | 16 | 75 | 9 | Total fair value option portfolio | 24 | 26 | 33 | 23 | 30 | 29 | 31 | 24 | 55 | 43 | 58 | 34 | 33 | 37 | ||||||||||||||||||||||||||||||||||||||||||||||||||||||||||||||||||||||||||||||||||||||||||||||||||||||||||||||||||||||||||||||||||||||||||||||||
| Portfolio diversification | Portfolio diversification | (19) | (1) | — | — | (4) | (18) | — | — | (21) | (11) | — | — | Portfolio diversification | (21) | (12) | — | — | (14) | (9) | — | — | (10) | (18) | — | — | (7) | (14) | ||||||||||||||||||||||||||||||||||||||||||||||||||||||||||||||||||||||||||||||||||||||||||||||||||||||||||||||||||||||||||||||||||||||||||||||||
| Total market-based portfolio | Total market-based portfolio | $ | 74 | $ | 118 | 169 | 62 | $ | 163 | $ | 118 | 164 | 92 | $ | 152 | $ | 53 | 171 | 32 | Total market-based portfolio | $ | 104 | $ | 92 | 141 | 60 | $ | 94 | $ | 97 | 146 | 64 | $ | 126 | $ | 134 | 160 | 99 | $ | 102 | $ | 102 | ||||||||||||||||||||||||||||||||||||||||||||||||||||||||||||||||||||||||||||||||||||||||||||||||||||||||||||||||||||||||||||||||||
Bank of America | ||||||||
| Table 40 | Average Market Risk VaR for Trading Activities – 99 percent and 95 percent VaR Statistics | |||||||||||||||||||||||||||||||||||||||||||||||||||||||||||||||||||||||||||||||||
| Table 41 | Table 41 | Average Market Risk VaR for Trading Activities – 99 percent and 95 percent VaR Statistics | ||||||||||||||||||||||||||||||||||||||||||||||||||||||||||||||||||||||||||||||||
| Three Months Ended | Three Months Ended | |||||||||||||||||||||||||||||||||||||||||||||||||||||||||||||||||||||||||||||||||
| March 31, 2021 | December 31, 2020 | March 31, 2020 | September 30, 2021 | June 30, 2021 | September 30, 2020 | |||||||||||||||||||||||||||||||||||||||||||||||||||||||||||||||||||||||||||||
| (Dollars in millions) | (Dollars in millions) | 99 percent | 95 percent | 99 percent | 95 percent | 99 percent | 95 percent | (Dollars in millions) | 99 percent | 95 percent | 99 percent | 95 percent | 99 percent | 95 percent | ||||||||||||||||||||||||||||||||||||||||||||||||||||||||||||||||||||
| Foreign exchange | Foreign exchange | $ | 10 | $ | 6 | $ | 6 | $ | 4 | $ | 5 | $ | 4 | Foreign exchange | $ | 13 | $ | 9 | $ | 16 | $ | 9 | $ | 7 | $ | 4 | ||||||||||||||||||||||||||||||||||||||||||||||||||||||||
| Interest rate | Interest rate | 35 | 17 | 20 | 10 | 21 | 13 | Interest rate | 32 | 16 | 58 | 28 | 18 | 8 | ||||||||||||||||||||||||||||||||||||||||||||||||||||||||||||||||||||
| Credit | Credit | 64 | 18 | 68 | 19 | 35 | 18 | Credit | 66 | 20 | 73 | 21 | 62 | 18 | ||||||||||||||||||||||||||||||||||||||||||||||||||||||||||||||||||||
| Equity | Equity | 24 | 12 | 19 | 9 | 36 | 21 | Equity | 24 | 11 | 23 | 12 | 17 | 9 | ||||||||||||||||||||||||||||||||||||||||||||||||||||||||||||||||||||
| Commodities | Commodities | 9 | 4 | 6 | 2 | 6 | 4 | Commodities | 8 | 4 | 8 | 4 | 6 | 3 | ||||||||||||||||||||||||||||||||||||||||||||||||||||||||||||||||||||
| Portfolio diversification | Portfolio diversification | (90) | (34) | (68) | (24) | (57) | (34) | Portfolio diversification | (91) | (35) | (119) | (44) | (56) | (25) | ||||||||||||||||||||||||||||||||||||||||||||||||||||||||||||||||||||
| Total covered positions portfolio | Total covered positions portfolio | 52 | 23 | 51 | 20 | 46 | 26 | Total covered positions portfolio | 52 | 25 | 59 | 30 | 54 | 17 | ||||||||||||||||||||||||||||||||||||||||||||||||||||||||||||||||||||
| Impact from less liquid exposures | Impact from less liquid exposures | 22 | 3 | 30 | 3 | 2 | 1 | Impact from less liquid exposures | 26 | 3 | 18 | 2 | 55 | 5 | ||||||||||||||||||||||||||||||||||||||||||||||||||||||||||||||||||||
| Total covered positions and less liquid trading positions portfolio | Total covered positions and less liquid trading positions portfolio | 74 | 26 | 81 | 23 | 48 | 27 | Total covered positions and less liquid trading positions portfolio | 78 | 28 | 77 | 32 | 109 | 22 | ||||||||||||||||||||||||||||||||||||||||||||||||||||||||||||||||||||
| Fair value option loans | Fair value option loans | 56 | 14 | 62 | 16 | 16 | 7 | Fair value option loans | 45 | 10 | 50 | 11 | 62 | 14 | ||||||||||||||||||||||||||||||||||||||||||||||||||||||||||||||||||||
| Fair value option hedges | Fair value option hedges | 13 | 7 | 12 | 6 | 11 | 7 | Fair value option hedges | 17 | 9 | 16 | 9 | 13 | 6 | ||||||||||||||||||||||||||||||||||||||||||||||||||||||||||||||||||||
| Fair value option portfolio diversification | Fair value option portfolio diversification | (24) | (6) | (19) | (5) | (11) | (7) | Fair value option portfolio diversification | (36) | (9) | (37) | (10) | (32) | (7) | ||||||||||||||||||||||||||||||||||||||||||||||||||||||||||||||||||||
| Total fair value option portfolio | Total fair value option portfolio | 45 | 15 | 55 | 17 | 16 | 7 | Total fair value option portfolio | 26 | 10 | 29 | 10 | 43 | 13 | ||||||||||||||||||||||||||||||||||||||||||||||||||||||||||||||||||||
| Portfolio diversification | Portfolio diversification | (1) | (8) | (18) | (7) | (11) | (6) | Portfolio diversification | (12) | (6) | (9) | (6) | (18) | (7) | ||||||||||||||||||||||||||||||||||||||||||||||||||||||||||||||||||||
| Total market-based portfolio | Total market-based portfolio | $ | 118 | $ | 33 | $ | 118 | $ | 33 | $ | 53 | $ | 28 | Total market-based portfolio | $ | 92 | $ | 32 | $ | 97 | $ | 36 | $ | 134 | $ | 28 | ||||||||||||||||||||||||||||||||||||||||||||||||||||||||
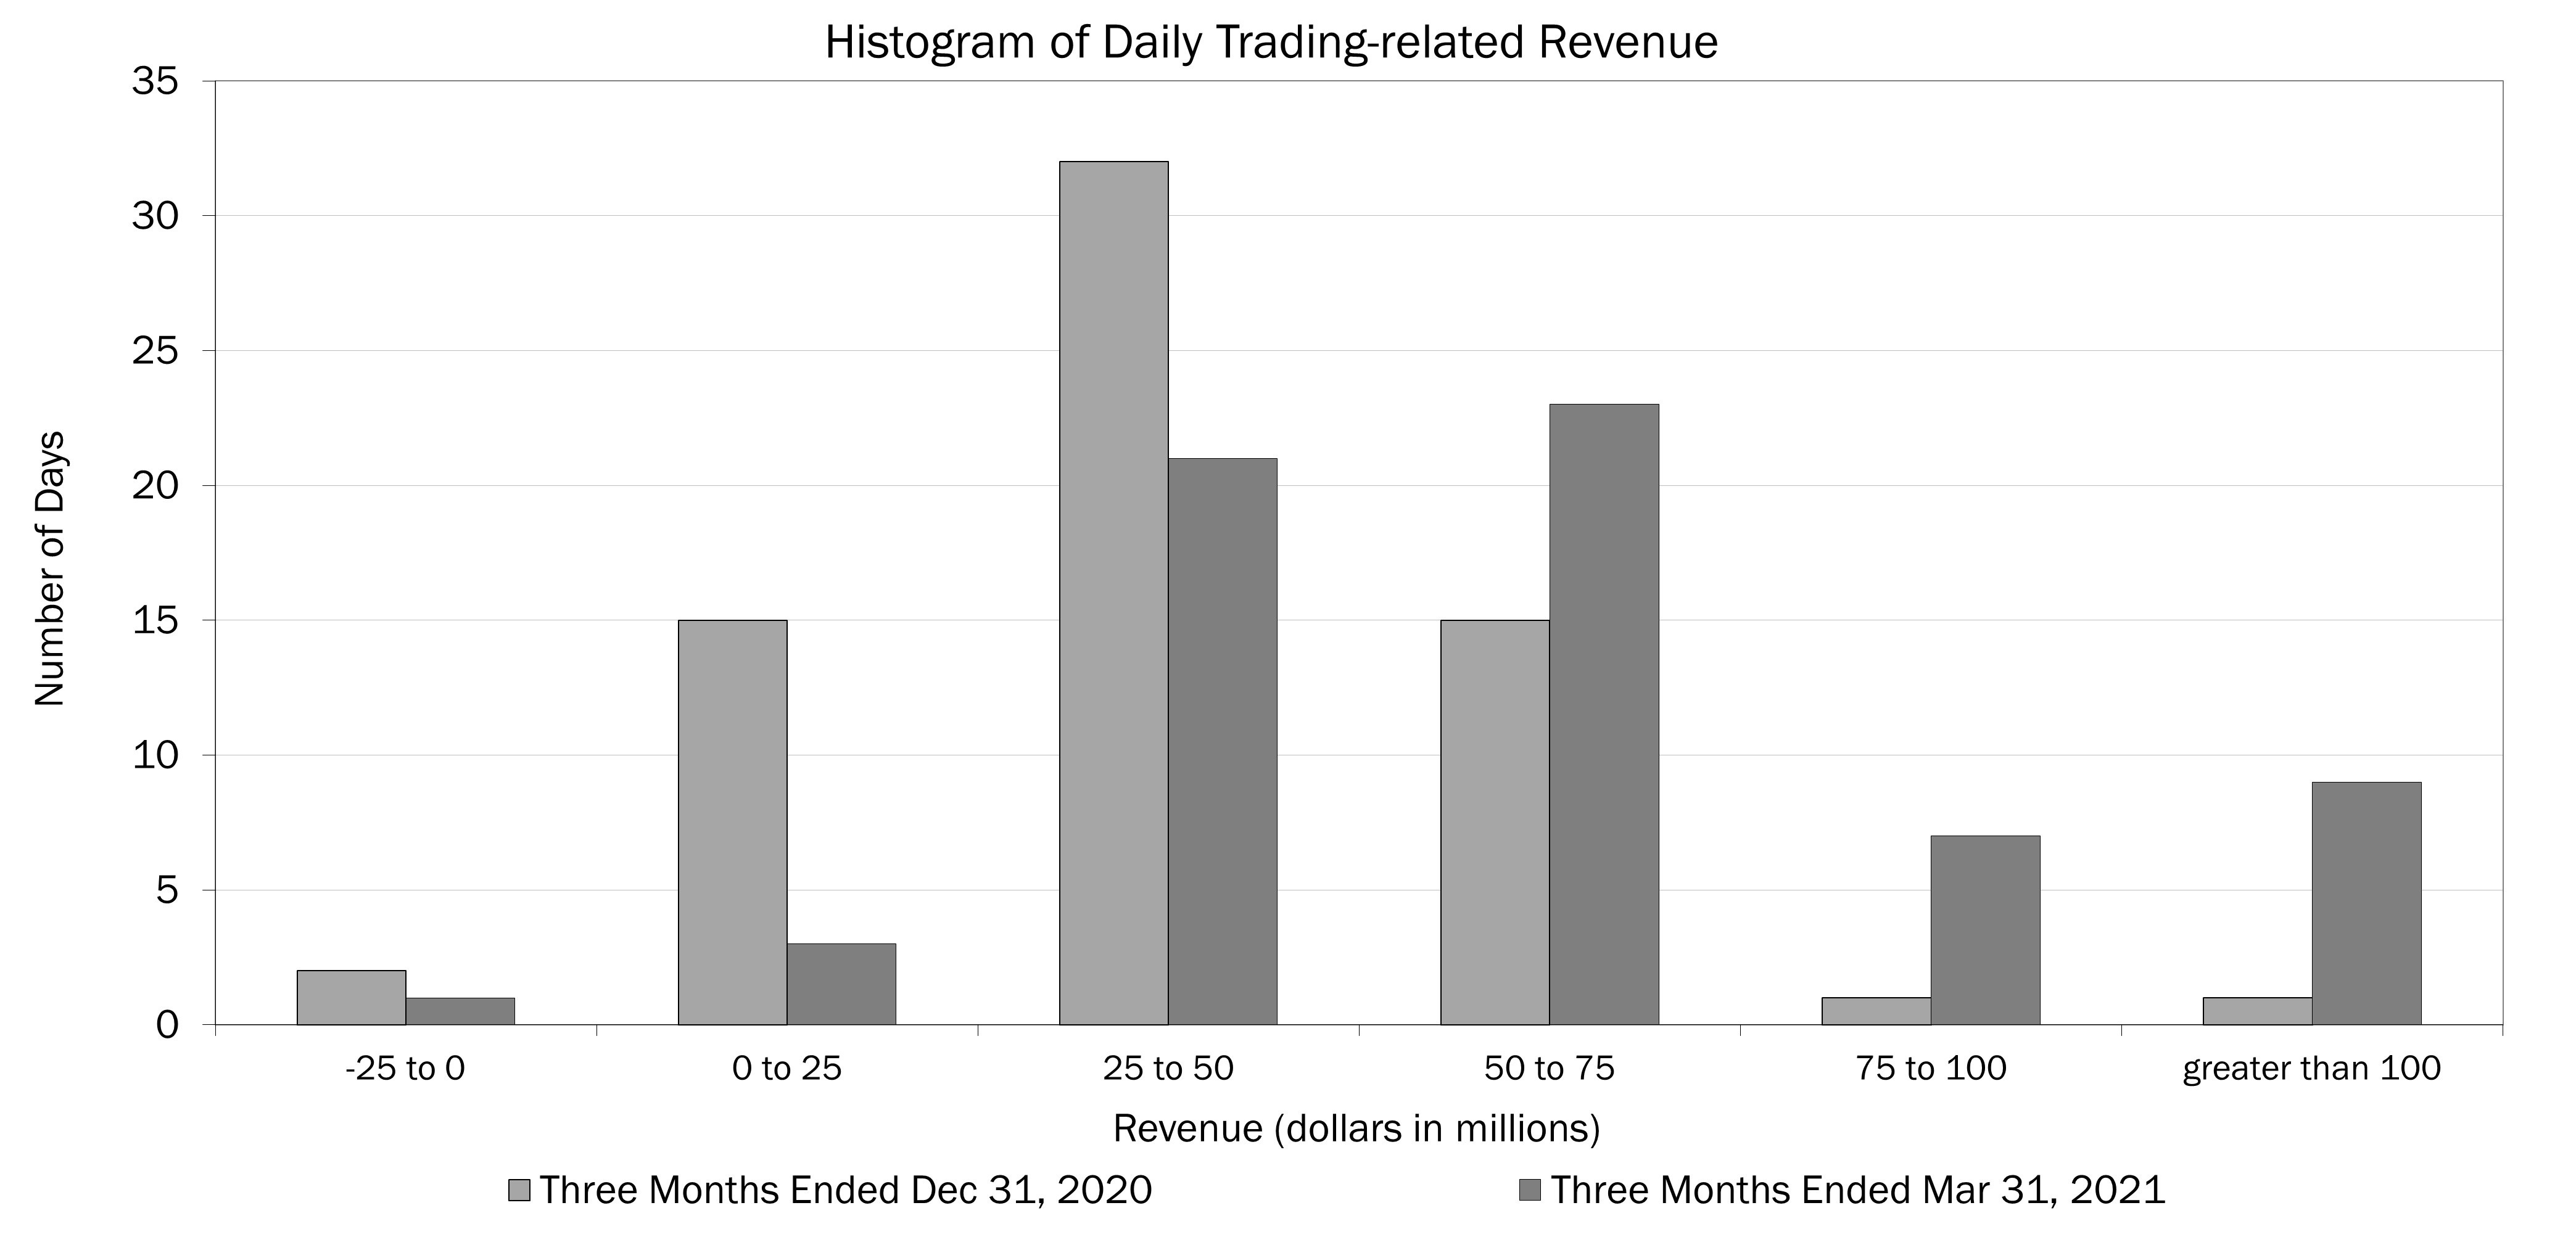
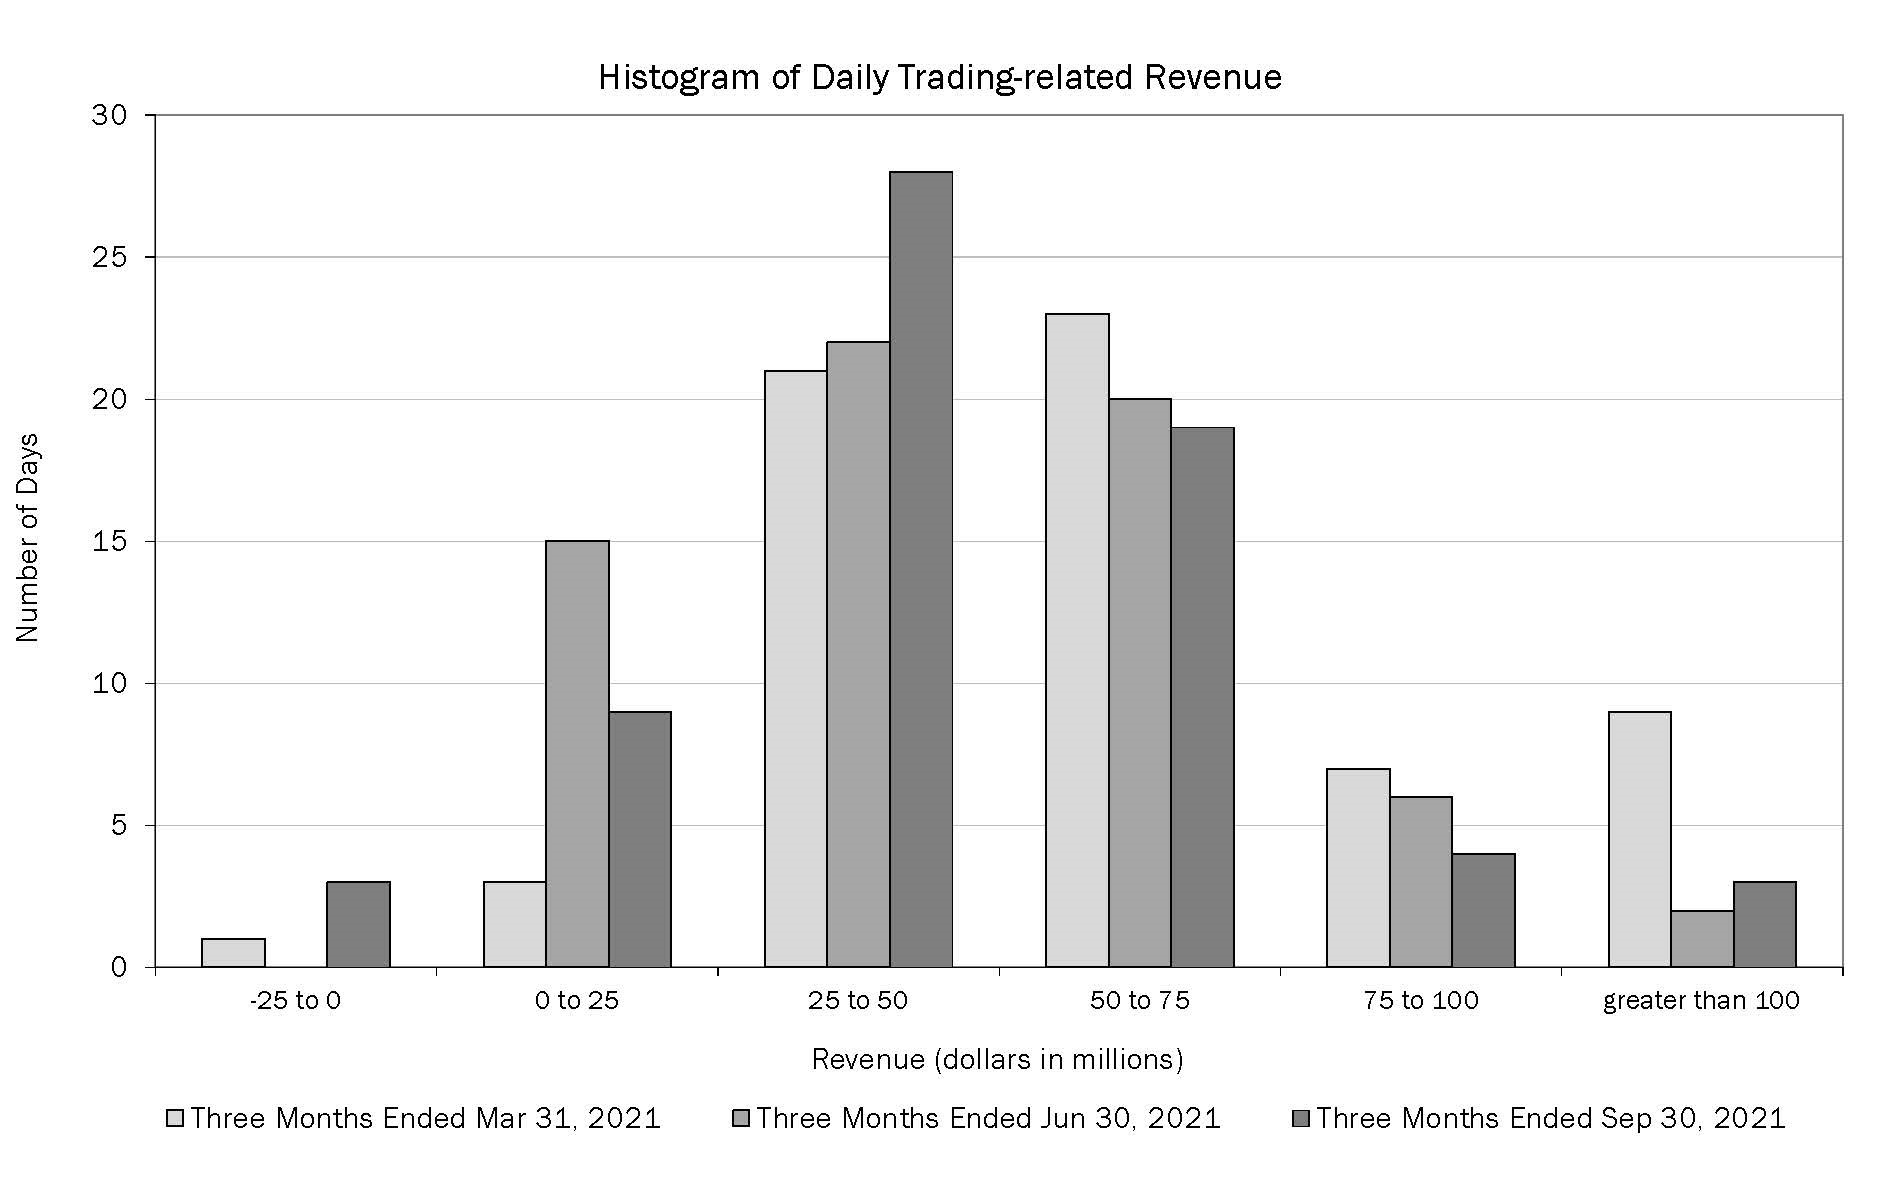
45Bank of America | ||||||||
| Table 41 | Forward Rates | |||||||||||||||||||||||||||||||||||||||
| Table 42 | Table 42 | Forward Rates | ||||||||||||||||||||||||||||||||||||||
| March 31, 2021 | September 30, 2021 | |||||||||||||||||||||||||||||||||||||||
| Federal Funds | Three-month LIBOR | 10-Year Swap | Federal Funds | Three-month LIBOR | 10-Year Swap | |||||||||||||||||||||||||||||||||||
| Spot rates | Spot rates | 0.25 | % | 0.19 | % | 1.78 | % | Spot rates | 0.25 | % | 0.13 | % | 1.51 | % | ||||||||||||||||||||||||||
| 12-month forward rates | 12-month forward rates | 0.25 | 0.24 | 1.95 | 12-month forward rates | 0.25 | 0.30 | 1.67 | ||||||||||||||||||||||||||||||||
| December 31, 2020 | December 31, 2020 | |||||||||||||||||||||||||||||||||||||||
| Spot rates | Spot rates | 0.25 | % | 0.24 | % | 0.93 | % | Spot rates | 0.25 | % | 0.24 | % | 0.93 | % | ||||||||||||||||||||||||||
| 12-month forward rates | 12-month forward rates | 0.25 | 0.19 | 1.06 | 12-month forward rates | 0.25 | 0.19 | 1.06 | ||||||||||||||||||||||||||||||||
| Table 42 | Estimated Banking Book Net Interest Income Sensitivity to Curve Changes | |||||||||||||||||||||||||||||||||||||||||||||||||||
| Table 43 | Table 43 | Estimated Banking Book Net Interest Income Sensitivity to Curve Changes | ||||||||||||||||||||||||||||||||||||||||||||||||||
| Short Rate (bps) | Long Rate (bps) | Short Rate (bps) | Long Rate (bps) | |||||||||||||||||||||||||||||||||||||||||||||||||
| Short Rate (bps) | Long Rate (bps) | |||||||||||||||||||||||||||||||||||||||||||||||||||
| (Dollars in millions) | (Dollars in millions) | March 31 2021 | December 31 2020 | (Dollars in millions) | September 30 2021 | December 31 2020 | ||||||||||||||||||||||||||||||||||||||||||||||
| Parallel Shifts | Parallel Shifts | Parallel Shifts | ||||||||||||||||||||||||||||||||||||||||||||||||||
+100 bps instantaneous shift | +100 bps instantaneous shift | +100 | +100 | $ | 8,324 | $ | 10,468 | +100 bps instantaneous shift | +100 | +100 | $ | 7,163 | $ | 10,468 | ||||||||||||||||||||||||||||||||||||||
-25 bps instantaneous shift | -25 bps instantaneous shift | -25 | -25 | (1,963) | (2,766) | -25 bps instantaneous shift | -25 | -25 | (2,031) | (2,766) | ||||||||||||||||||||||||||||||||||||||||||
| Flatteners | Flatteners | Flatteners | ||||||||||||||||||||||||||||||||||||||||||||||||||
Short-end instantaneous change | Short-end instantaneous change | +100 | — | 6,281 | 6,321 | Short-end instantaneous change | +100 | — | 4,931 | 6,321 | ||||||||||||||||||||||||||||||||||||||||||
Long-end instantaneous change | Long-end instantaneous change | — | -25 | (829) | (1,686) | Long-end instantaneous change | — | -25 | (1,064) | (1,686) | ||||||||||||||||||||||||||||||||||||||||||
| Steepeners | Steepeners | Steepeners | ||||||||||||||||||||||||||||||||||||||||||||||||||
Short-end instantaneous change | Short-end instantaneous change | -25 | — | (1,135) | (1,084) | Short-end instantaneous change | -25 | — | (942) | (1,084) | ||||||||||||||||||||||||||||||||||||||||||
Long-end instantaneous change | Long-end instantaneous change | — | +100 | 2,079 | 4,333 | Long-end instantaneous change | — | +100 | 2,440 | 4,333 | ||||||||||||||||||||||||||||||||||||||||||
Bank of America46 | ||||||||
47Bank of America | ||||||||
| Table 43 | Period-end and Average Supplemental Financial Data and Reconciliations to GAAP Financial Measures (1) | |||||||||||||||||||||||||||||||||||||||||||||||||||||||||||||||||||||||||||||||||||||||||||||||||||
| Table 44 | Table 44 | Period-end and Average Supplemental Financial Data and Reconciliations to GAAP Financial Measures (1) | ||||||||||||||||||||||||||||||||||||||||||||||||||||||||||||||||||||||||||||||||||||||||||||||||||
| Period-end | Average | Period-end | Average | |||||||||||||||||||||||||||||||||||||||||||||||||||||||||||||||||||||||||||||||||||||||||||||||||
| March 31 2021 | December 31 2020 | Three Months Ended March 31 | September 30 2021 | December 31 2020 | Three Months Ended September 30 | Nine Months Ended September 30 | ||||||||||||||||||||||||||||||||||||||||||||||||||||||||||||||||||||||||||||||||||||||||||||||
| (Dollars in millions) | (Dollars in millions) | 2021 | 2020 | (Dollars in millions) | December 31 2020 | 2021 | 2020 | 2021 | 2020 | |||||||||||||||||||||||||||||||||||||||||||||||||||||||||||||||||||||||||||||||||||||||||||
| Shareholders’ equity | Shareholders’ equity | $ | 274,000 | $ | 272,924 | $ | 274,047 | $ | 264,534 | Shareholders’ equity | $ | 272,464 | $ | 272,924 | $ | 275,484 | $ | 267,323 | $ | 274,726 | $ | 266,062 | ||||||||||||||||||||||||||||||||||||||||||||||||||||||||||||||||||||||||||||||
| Goodwill | Goodwill | (68,951) | (68,951) | (68,951) | (68,951) | Goodwill | (69,023) | (68,951) | (69,023) | (68,951) | (68,999) | (68,951) | ||||||||||||||||||||||||||||||||||||||||||||||||||||||||||||||||||||||||||||||||||||||||
| Intangible assets (excluding MSRs) | Intangible assets (excluding MSRs) | (2,134) | (2,151) | (2,146) | (1,655) | Intangible assets (excluding MSRs) | (2,172) | (2,151) | (2,185) | (1,976) | (2,181) | (1,758) | ||||||||||||||||||||||||||||||||||||||||||||||||||||||||||||||||||||||||||||||||||||||||
| Related deferred tax liabilities | Related deferred tax liabilities | 915 | 920 | 920 | 728 | Related deferred tax liabilities | 913 | 920 | 915 | 855 | 916 | 791 | ||||||||||||||||||||||||||||||||||||||||||||||||||||||||||||||||||||||||||||||||||||||||
| Tangible shareholders’ equity | Tangible shareholders’ equity | $ | 203,830 | $ | 202,742 | $ | 203,870 | $ | 194,656 | Tangible shareholders’ equity | $ | 202,182 | $ | 202,742 | $ | 205,191 | $ | 197,251 | $ | 204,462 | $ | 196,144 | ||||||||||||||||||||||||||||||||||||||||||||||||||||||||||||||||||||||||||||||
| Preferred stock | Preferred stock | (24,319) | (24,510) | (24,399) | (23,456) | Preferred stock | (23,441) | (24,510) | (23,441) | (23,427) | (23,837) | (23,437) | ||||||||||||||||||||||||||||||||||||||||||||||||||||||||||||||||||||||||||||||||||||||||
| Tangible common shareholders’ equity | Tangible common shareholders’ equity | $ | 179,511 | $ | 178,232 | $ | 179,471 | $ | 171,200 | Tangible common shareholders’ equity | $ | 178,741 | $ | 178,232 | $ | 181,750 | $ | 173,824 | $ | 180,625 | $ | 172,707 | ||||||||||||||||||||||||||||||||||||||||||||||||||||||||||||||||||||||||||||||
| Total assets | Total assets | $ | 2,969,992 | $ | 2,819,627 | Total assets | $ | 3,085,446 | $ | 2,819,627 | ||||||||||||||||||||||||||||||||||||||||||||||||||||||||||||||||||||||||||||||||||||||||||
| Goodwill | Goodwill | (68,951) | (68,951) | Goodwill | (69,023) | (68,951) | ||||||||||||||||||||||||||||||||||||||||||||||||||||||||||||||||||||||||||||||||||||||||||||||
| Intangible assets (excluding MSRs) | Intangible assets (excluding MSRs) | (2,134) | (2,151) | Intangible assets (excluding MSRs) | (2,172) | (2,151) | ||||||||||||||||||||||||||||||||||||||||||||||||||||||||||||||||||||||||||||||||||||||||||||||
| Related deferred tax liabilities | Related deferred tax liabilities | 915 | 920 | Related deferred tax liabilities | 913 | 920 | ||||||||||||||||||||||||||||||||||||||||||||||||||||||||||||||||||||||||||||||||||||||||||||||
| Tangible assets | Tangible assets | $ | 2,899,822 | $ | 2,749,445 | Tangible assets | $ | 3,015,164 | $ | 2,749,445 | ||||||||||||||||||||||||||||||||||||||||||||||||||||||||||||||||||||||||||||||||||||||||||
Bank of America48 | ||||||||
| Consolidated Statement of Income | ||||||||||||||||||||||||||||||||||||||||||||||||||||||||||
| Three Months Ended March 31 | Three Months Ended September 30 | Nine Months Ended September 30 | ||||||||||||||||||||||||||||||||||||||||||||||||||||||||
| (In millions, except per share information) | (In millions, except per share information) | 2021 | 2020 | (In millions, except per share information) | 2021 | 2020 | 2021 | 2020 | ||||||||||||||||||||||||||||||||||||||||||||||||||
| Net interest income | Net interest income | Net interest income | ||||||||||||||||||||||||||||||||||||||||||||||||||||||||
| Interest income | Interest income | $ | 11,395 | $ | 16,098 | Interest income | $ | 12,336 | $ | 11,486 | $ | 35,118 | $ | 40,124 | ||||||||||||||||||||||||||||||||||||||||||||
| Interest expense | Interest expense | 1,198 | 3,968 | Interest expense | 1,242 | 1,357 | 3,594 | 7,017 | ||||||||||||||||||||||||||||||||||||||||||||||||||
| Net interest income | Net interest income | 10,197 | 12,130 | Net interest income | 11,094 | 10,129 | 31,524 | 33,107 | ||||||||||||||||||||||||||||||||||||||||||||||||||
| Noninterest income | Noninterest income | Noninterest income | ||||||||||||||||||||||||||||||||||||||||||||||||||||||||
| Fees and commissions | Fees and commissions | 9,536 | 8,321 | Fees and commissions | 9,915 | 8,777 | 29,156 | 25,490 | ||||||||||||||||||||||||||||||||||||||||||||||||||
| Market making and similar activities | Market making and similar activities | 3,529 | 2,807 | Market making and similar activities | 2,005 | 1,689 | 7,360 | 6,983 | ||||||||||||||||||||||||||||||||||||||||||||||||||
| Other income | Other income | (441) | (491) | Other income | (248) | (259) | (987) | (151) | ||||||||||||||||||||||||||||||||||||||||||||||||||
| Total noninterest income | Total noninterest income | 12,624 | 10,637 | Total noninterest income | 11,672 | 10,207 | 35,529 | 32,322 | ||||||||||||||||||||||||||||||||||||||||||||||||||
| Total revenue, net of interest expense | Total revenue, net of interest expense | 22,821 | 22,767 | Total revenue, net of interest expense | 22,766 | 20,336 | 67,053 | 65,429 | ||||||||||||||||||||||||||||||||||||||||||||||||||
| Provision for credit losses | Provision for credit losses | (1,860) | 4,761 | Provision for credit losses | (624) | 1,389 | (4,105) | 11,267 | ||||||||||||||||||||||||||||||||||||||||||||||||||
| Noninterest expense | Noninterest expense | Noninterest expense | ||||||||||||||||||||||||||||||||||||||||||||||||||||||||
| Compensation and benefits | Compensation and benefits | 9,736 | 8,341 | Compensation and benefits | 8,714 | 8,200 | 27,103 | 24,535 | ||||||||||||||||||||||||||||||||||||||||||||||||||
| Occupancy and equipment | Occupancy and equipment | 1,830 | 1,702 | Occupancy and equipment | 1,764 | 1,798 | 5,353 | 5,302 | ||||||||||||||||||||||||||||||||||||||||||||||||||
| Information processing and communications | Information processing and communications | 1,425 | 1,209 | Information processing and communications | 1,416 | 1,333 | 4,289 | 3,807 | ||||||||||||||||||||||||||||||||||||||||||||||||||
| Product delivery and transaction related | Product delivery and transaction related | 977 | 777 | Product delivery and transaction related | 987 | 930 | 2,940 | 2,518 | ||||||||||||||||||||||||||||||||||||||||||||||||||
| Marketing | Marketing | 371 | 438 | Marketing | 347 | 308 | 1,528 | 1,238 | ||||||||||||||||||||||||||||||||||||||||||||||||||
| Professional fees | Professional fees | 403 | 375 | Professional fees | 434 | 450 | 1,263 | 1,206 | ||||||||||||||||||||||||||||||||||||||||||||||||||
| Other general operating | Other general operating | 773 | 633 | Other general operating | 778 | 1,382 | 2,524 | 2,680 | ||||||||||||||||||||||||||||||||||||||||||||||||||
| Total noninterest expense | Total noninterest expense | 15,515 | 13,475 | Total noninterest expense | 14,440 | 14,401 | 45,000 | 41,286 | ||||||||||||||||||||||||||||||||||||||||||||||||||
| Income before income taxes | Income before income taxes | 9,166 | 4,531 | Income before income taxes | 8,950 | 4,546 | 26,158 | 12,876 | ||||||||||||||||||||||||||||||||||||||||||||||||||
| Income tax expense | Income tax expense | 1,116 | 521 | Income tax expense | 1,259 | (335) | 1,193 | 452 | ||||||||||||||||||||||||||||||||||||||||||||||||||
| Net income | Net income | $ | 8,050 | $ | 4,010 | Net income | $ | 7,691 | $ | 4,881 | $ | 24,965 | $ | 12,424 | ||||||||||||||||||||||||||||||||||||||||||||
| Preferred stock dividends | Preferred stock dividends | 490 | 469 | Preferred stock dividends | 431 | 441 | 1,181 | 1,159 | ||||||||||||||||||||||||||||||||||||||||||||||||||
| Net income applicable to common shareholders | Net income applicable to common shareholders | $ | 7,560 | $ | 3,541 | Net income applicable to common shareholders | $ | 7,260 | $ | 4,440 | $ | 23,784 | $ | 11,265 | ||||||||||||||||||||||||||||||||||||||||||||
| Per common share information | Per common share information | Per common share information | ||||||||||||||||||||||||||||||||||||||||||||||||||||||||
| Earnings | Earnings | $ | 0.87 | $ | 0.40 | Earnings | $ | 0.86 | $ | 0.51 | $ | 2.77 | $ | 1.29 | ||||||||||||||||||||||||||||||||||||||||||||
| Diluted earnings | Diluted earnings | 0.86 | 0.40 | Diluted earnings | 0.85 | 0.51 | 2.75 | 1.28 | ||||||||||||||||||||||||||||||||||||||||||||||||||
| Average common shares issued and outstanding | Average common shares issued and outstanding | 8,700.1 | 8,815.6 | Average common shares issued and outstanding | 8,430.7 | 8,732.9 | 8,583.1 | 8,762.6 | ||||||||||||||||||||||||||||||||||||||||||||||||||
| Average diluted common shares issued and outstanding | Average diluted common shares issued and outstanding | 8,755.6 | 8,862.7 | Average diluted common shares issued and outstanding | 8,492.8 | 8,777.5 | 8,702.2 | 8,800.5 | ||||||||||||||||||||||||||||||||||||||||||||||||||
| Consolidated Statement of Comprehensive Income | Consolidated Statement of Comprehensive Income | Consolidated Statement of Comprehensive Income | ||||||||||||||||||||||||||||||||||||||||||||||||||||||||
| Three Months Ended March 31 | Three Months Ended September 30 | Nine Months Ended September 30 | ||||||||||||||||||||||||||||||||||||||||||||||||||||||||
| (Dollars in millions) | (Dollars in millions) | 2021 | 2020 | (Dollars in millions) | 2021 | 2020 | 2021 | 2020 | ||||||||||||||||||||||||||||||||||||||||||||||||||
| Net income | Net income | $ | 8,050 | $ | 4,010 | Net income | $ | 7,691 | $ | 4,881 | $ | 24,965 | $ | 12,424 | ||||||||||||||||||||||||||||||||||||||||||||
| Other comprehensive income (loss), net-of-tax: | Other comprehensive income (loss), net-of-tax: | Other comprehensive income (loss), net-of-tax: | ||||||||||||||||||||||||||||||||||||||||||||||||||||||||
| Net change in debt securities | Net change in debt securities | (840) | 4,795 | Net change in debt securities | (153) | 101 | (1,243) | 4,794 | ||||||||||||||||||||||||||||||||||||||||||||||||||
| Net change in debit valuation adjustments | Net change in debit valuation adjustments | 116 | 1,346 | Net change in debit valuation adjustments | 27 | (58) | 292 | (5) | ||||||||||||||||||||||||||||||||||||||||||||||||||
| Net change in derivatives | Net change in derivatives | (1,114) | 417 | Net change in derivatives | (431) | 76 | (1,130) | 808 | ||||||||||||||||||||||||||||||||||||||||||||||||||
| Employee benefit plan adjustments | Employee benefit plan adjustments | 51 | 43 | Employee benefit plan adjustments | 50 | 44 | 170 | 144 | ||||||||||||||||||||||||||||||||||||||||||||||||||
| Net change in foreign currency translation adjustments | Net change in foreign currency translation adjustments | (29) | (88) | Net change in foreign currency translation adjustments | (26) | 21 | (29) | (86) | ||||||||||||||||||||||||||||||||||||||||||||||||||
| Other comprehensive income (loss) | Other comprehensive income (loss) | (1,816) | 6,513 | Other comprehensive income (loss) | (533) | 184 | (1,940) | 5,655 | ||||||||||||||||||||||||||||||||||||||||||||||||||
| Comprehensive income | Comprehensive income | $ | 6,234 | $ | 10,523 | Comprehensive income | $ | 7,158 | $ | 5,065 | $ | 23,025 | $ | 18,079 | ||||||||||||||||||||||||||||||||||||||||||||
49Bank of America | ||||||||||||||
| Consolidated Balance Sheet | ||||||||||||||||||||||||||||
| March 31 | December 31 | September 30 | December 31 | |||||||||||||||||||||||||
| (Dollars in millions) | (Dollars in millions) | 2021 | 2020 | (Dollars in millions) | 2021 | 2020 | ||||||||||||||||||||||
| Assets | Assets | Assets | ||||||||||||||||||||||||||
| Cash and due from banks | Cash and due from banks | $ | 33,560 | $ | 36,430 | Cash and due from banks | $ | 28,689 | $ | 36,430 | ||||||||||||||||||
| Interest-bearing deposits with the Federal Reserve, non-U.S. central banks and other banks | Interest-bearing deposits with the Federal Reserve, non-U.S. central banks and other banks | 292,541 | 344,033 | Interest-bearing deposits with the Federal Reserve, non-U.S. central banks and other banks | 251,165 | 344,033 | ||||||||||||||||||||||
| Cash and cash equivalents | Cash and cash equivalents | 326,101 | 380,463 | Cash and cash equivalents | 279,854 | 380,463 | ||||||||||||||||||||||
| Time deposits placed and other short-term investments | Time deposits placed and other short-term investments | 7,859 | 6,546 | Time deposits placed and other short-term investments | 6,518 | 6,546 | ||||||||||||||||||||||
Federal funds sold and securities borrowed or purchased under agreements to resell (includes $153,387 and $108,856 measured at fair value) | 259,147 | 304,058 | ||||||||||||||||||||||||||
Trading account assets (includes $104,445 and $91,510 pledged as collateral) | 276,881 | 198,854 | ||||||||||||||||||||||||||
Federal funds sold and securities borrowed or purchased under agreements to resell (includes $154,137 and $108,856 measured at fair value) | Federal funds sold and securities borrowed or purchased under agreements to resell (includes $154,137 and $108,856 measured at fair value) | 261,934 | 304,058 | |||||||||||||||||||||||||
Trading account assets (includes $121,259 and $91,510 pledged as collateral) | Trading account assets (includes $121,259 and $91,510 pledged as collateral) | 288,566 | 198,854 | |||||||||||||||||||||||||
| Derivative assets | Derivative assets | 45,898 | 47,179 | Derivative assets | 40,829 | 47,179 | ||||||||||||||||||||||
| Debt securities: | Debt securities: | Debt securities: | ||||||||||||||||||||||||||
| Carried at fair value | Carried at fair value | 280,912 | 246,601 | Carried at fair value | 285,377 | 246,601 | ||||||||||||||||||||||
Held-to-maturity, at cost (fair value – $569,258 and $448,180) | 576,000 | 438,249 | ||||||||||||||||||||||||||
Held-to-maturity, at cost (fair value – $678,333 and $448,180) | Held-to-maturity, at cost (fair value – $678,333 and $448,180) | 683,240 | 438,249 | |||||||||||||||||||||||||
| Total debt securities | Total debt securities | 856,912 | 684,850 | Total debt securities | 968,617 | 684,850 | ||||||||||||||||||||||
Loans and leases (includes $7,003 and $6,681 measured at fair value) | 903,088 | 927,861 | ||||||||||||||||||||||||||
Loans and leases (includes $7,566 and $6,681 measured at fair value) | Loans and leases (includes $7,566 and $6,681 measured at fair value) | 927,736 | 927,861 | |||||||||||||||||||||||||
| Allowance for loan and lease losses | Allowance for loan and lease losses | (16,168) | (18,802) | Allowance for loan and lease losses | (13,155) | (18,802) | ||||||||||||||||||||||
| Loans and leases, net of allowance | Loans and leases, net of allowance | 886,920 | 909,059 | Loans and leases, net of allowance | 914,581 | 909,059 | ||||||||||||||||||||||
| Premises and equipment, net | Premises and equipment, net | 10,803 | 11,000 | Premises and equipment, net | 10,684 | 11,000 | ||||||||||||||||||||||
| Goodwill | Goodwill | 68,951 | 68,951 | Goodwill | 69,023 | 68,951 | ||||||||||||||||||||||
Loans held-for-sale (includes $1,680 and $1,585 measured at fair value) | 7,895 | 9,243 | ||||||||||||||||||||||||||
Loans held-for-sale (includes $3,982 and $1,585 measured at fair value) | Loans held-for-sale (includes $3,982 and $1,585 measured at fair value) | 9,415 | 9,243 | |||||||||||||||||||||||||
| Customer and other receivables | Customer and other receivables | 66,404 | 64,221 | Customer and other receivables | 74,998 | 64,221 | ||||||||||||||||||||||
Other assets (includes $17,212 and $15,718 measured at fair value) | 156,221 | 135,203 | ||||||||||||||||||||||||||
Other assets (includes $11,031 and $15,718 measured at fair value) | Other assets (includes $11,031 and $15,718 measured at fair value) | 160,427 | 135,203 | |||||||||||||||||||||||||
| Total assets | Total assets | $ | 2,969,992 | $ | 2,819,627 | Total assets | $ | 3,085,446 | $ | 2,819,627 | ||||||||||||||||||
| Liabilities | Liabilities | Liabilities | ||||||||||||||||||||||||||
| Deposits in U.S. offices: | Deposits in U.S. offices: | Deposits in U.S. offices: | ||||||||||||||||||||||||||
| Noninterest-bearing | Noninterest-bearing | $ | 703,822 | $ | 650,674 | Noninterest-bearing | $ | 753,107 | $ | 650,674 | ||||||||||||||||||
Interest-bearing (includes $504 and $481 measured at fair value) | 1,079,551 | 1,038,341 | ||||||||||||||||||||||||||
Interest-bearing (includes $542 and $481 measured at fair value) | Interest-bearing (includes $542 and $481 measured at fair value) | 1,108,490 | 1,038,341 | |||||||||||||||||||||||||
| Deposits in non-U.S. offices: | Deposits in non-U.S. offices: | Deposits in non-U.S. offices: | ||||||||||||||||||||||||||
| Noninterest-bearing | Noninterest-bearing | 22,423 | 17,698 | Noninterest-bearing | 25,336 | 17,698 | ||||||||||||||||||||||
| Interest-bearing | Interest-bearing | 79,142 | 88,767 | Interest-bearing | 77,871 | 88,767 | ||||||||||||||||||||||
| Total deposits | Total deposits | 1,884,938 | 1,795,480 | Total deposits | 1,964,804 | 1,795,480 | ||||||||||||||||||||||
Federal funds purchased and securities loaned or sold under agreements to repurchase (includes $154,865 and $135,391 measured at fair value) | 199,443 | 170,323 | ||||||||||||||||||||||||||
Federal funds purchased and securities loaned or sold under agreements to repurchase (includes $155,151 and $135,391 measured at fair value) | Federal funds purchased and securities loaned or sold under agreements to repurchase (includes $155,151 and $135,391 measured at fair value) | 207,428 | 170,323 | |||||||||||||||||||||||||
| Trading account liabilities | Trading account liabilities | 102,788 | 71,320 | Trading account liabilities | 112,217 | 71,320 | ||||||||||||||||||||||
| Derivative liabilities | Derivative liabilities | 42,325 | 45,526 | Derivative liabilities | 38,062 | 45,526 | ||||||||||||||||||||||
Short-term borrowings (includes $4,503 and $5,874 measured at fair value) | 21,724 | 19,321 | ||||||||||||||||||||||||||
Accrued expenses and other liabilities (includes $17,571 and $16,311 measured at fair value and $1,829 and $1,878 of reserve for unfunded lending commitments) | 193,563 | 181,799 | ||||||||||||||||||||||||||
Long-term debt (includes $30,514 and $32,200 measured at fair value) | 251,211 | 262,934 | ||||||||||||||||||||||||||
Short-term borrowings (includes $4,128 and $5,874 measured at fair value) | Short-term borrowings (includes $4,128 and $5,874 measured at fair value) | 20,278 | 19,321 | |||||||||||||||||||||||||
Accrued expenses and other liabilities (includes $10,261 and $16,311 measured at fair value and $1,538 and $1,878 of reserve for unfunded lending commitments) | Accrued expenses and other liabilities (includes $10,261 and $16,311 measured at fair value and $1,538 and $1,878 of reserve for unfunded lending commitments) | 191,572 | 181,799 | |||||||||||||||||||||||||
Long-term debt (includes $28,696 and $32,200 measured at fair value) | Long-term debt (includes $28,696 and $32,200 measured at fair value) | 278,621 | 262,934 | |||||||||||||||||||||||||
| Total liabilities | Total liabilities | 2,695,992 | 2,546,703 | Total liabilities | 2,812,982 | 2,546,703 | ||||||||||||||||||||||
Commitments and contingencies (Note 6 – Securitizations and Other Variable Interest Entities and Note 10 – Commitments and Contingencies) | Commitments and contingencies (Note 6 – Securitizations and Other Variable Interest Entities and Note 10 – Commitments and Contingencies) | 0 | 0 | Commitments and contingencies (Note 6 – Securitizations and Other Variable Interest Entities and Note 10 – Commitments and Contingencies) | 0 | 0 | ||||||||||||||||||||||
| Shareholders’ equity | Shareholders’ equity | Shareholders’ equity | ||||||||||||||||||||||||||
Preferred stock, $0.01 par value; authorized – 100,000,000 shares; issued and outstanding – 3,923,686 and 3,931,440 shares | 24,319 | 24,510 | ||||||||||||||||||||||||||
Common stock and additional paid-in capital, $0.01 par value; authorized – 12,800,000,000 shares; issued and outstanding – 8,589,731,470 and 8,650,814,105 shares | 83,071 | 85,982 | ||||||||||||||||||||||||||
Preferred stock, $0.01 par value; authorized – 100,000,000 shares; issued and outstanding – 3,887,686 and 3,931,440 shares | Preferred stock, $0.01 par value; authorized – 100,000,000 shares; issued and outstanding – 3,887,686 and 3,931,440 shares | 23,441 | 24,510 | |||||||||||||||||||||||||
Common stock and additional paid-in capital, $0.01 par value; authorized – 12,800,000,000 shares; issued and outstanding – 8,241,243,911 and 8,650,814,105 shares | Common stock and additional paid-in capital, $0.01 par value; authorized – 12,800,000,000 shares; issued and outstanding – 8,241,243,911 and 8,650,814,105 shares | 69,612 | 85,982 | |||||||||||||||||||||||||
| Retained earnings | Retained earnings | 170,082 | 164,088 | Retained earnings | 183,007 | 164,088 | ||||||||||||||||||||||
| Accumulated other comprehensive income (loss) | Accumulated other comprehensive income (loss) | (3,472) | (1,656) | Accumulated other comprehensive income (loss) | (3,596) | (1,656) | ||||||||||||||||||||||
| Total shareholders’ equity | Total shareholders’ equity | 274,000 | 272,924 | Total shareholders’ equity | 272,464 | 272,924 | ||||||||||||||||||||||
| Total liabilities and shareholders’ equity | Total liabilities and shareholders’ equity | $ | 2,969,992 | $ | 2,819,627 | Total liabilities and shareholders’ equity | $ | 3,085,446 | $ | 2,819,627 | ||||||||||||||||||
| Assets of consolidated variable interest entities included in total assets above (isolated to settle the liabilities of the variable interest entities) | Assets of consolidated variable interest entities included in total assets above (isolated to settle the liabilities of the variable interest entities) | |||||||||||||||||||||||||||
| Trading account assets | $ | 4,530 | $ | 5,225 | Trading account assets | $ | 4,432 | $ | 5,225 | |||||||||||||||||||
| Loans and leases | 19,346 | 23,636 | Loans and leases | 16,857 | 23,636 | |||||||||||||||||||||||
| Allowance for loan and lease losses | (1,261) | (1,693) | Allowance for loan and lease losses | (994) | (1,693) | |||||||||||||||||||||||
| Loans and leases, net of allowance | 18,085 | 21,943 | Loans and leases, net of allowance | 15,863 | 21,943 | |||||||||||||||||||||||
| All other assets | 1,387 | 1,387 | All other assets | 136 | 1,387 | |||||||||||||||||||||||
| Total assets of consolidated variable interest entities | $ | 24,002 | $ | 28,555 | Total assets of consolidated variable interest entities | $ | 20,431 | $ | 28,555 | |||||||||||||||||||
| Liabilities of consolidated variable interest entities included in total liabilities above | Liabilities of consolidated variable interest entities included in total liabilities above | |||||||||||||||||||||||||||
Short-term borrowings (includes $37 and $22 of non-recourse short-term borrowings) | $ | 338 | $ | 454 | Short-term borrowings (includes $50 and $22 of non-recourse short-term borrowings) | $ | 330 | $ | 454 | |||||||||||||||||||
Long-term debt (includes $5,286 and $7,053 of non-recourse debt) | 5,286 | 7,053 | Long-term debt (includes $3,830 and $7,053 of non-recourse debt) | 3,830 | 7,053 | |||||||||||||||||||||||
All other liabilities (includes $11 and $16 of non-recourse liabilities) | 11 | 16 | All other liabilities (includes $10 and $16 of non-recourse liabilities) | 10 | 16 | |||||||||||||||||||||||
| Total liabilities of consolidated variable interest entities | $ | 5,635 | $ | 7,523 | Total liabilities of consolidated variable interest entities | $ | 4,170 | $ | 7,523 | |||||||||||||||||||
Bank of America50 | ||||||||
| Consolidated Statement of Changes in Shareholders’ Equity | Consolidated Statement of Changes in Shareholders’ Equity | Consolidated Statement of Changes in Shareholders’ Equity | ||||||||||||||||||||||||||||||||||||||||||||||||||||||||||||||||||||||||||||||||
| Preferred Stock | Common Stock and Additional Paid-in Capital | Retained Earnings | Accumulated Other Comprehensive Income (Loss) | Total Shareholders’ Equity | Preferred Stock | Common Stock and Additional Paid-in Capital | Retained Earnings | Accumulated Other Comprehensive Income (Loss) | Total Shareholders’ Equity | |||||||||||||||||||||||||||||||||||||||||||||||||||||||||||||||||||||||||
| (In millions) | (In millions) | Shares | Amount | Total Shareholders’ Equity | Preferred Stock | Shares | Amount | Retained Earnings | Accumulated Other Comprehensive Income (Loss) | Total Shareholders’ Equity | ||||||||||||||||||||||||||||||||||||||||||||||||||||||||||||||||||||||||
| Balance, June 30, 2021 | $ | 23,441 | 8,487.2 | $ | 79,242 | $ | 177,499 | $ | (3,063) | $ | 277,119 | |||||||||||||||||||||||||||||||||||||||||||||||||||||||||||||||||||||||
| Net income | Net income | 7,691 | 7,691 | |||||||||||||||||||||||||||||||||||||||||||||||||||||||||||||||||||||||||||||||
| Net change in debt securities | Net change in debt securities | (153) | (153) | |||||||||||||||||||||||||||||||||||||||||||||||||||||||||||||||||||||||||||||||
| Net change in debit valuation adjustments | Net change in debit valuation adjustments | 27 | 27 | |||||||||||||||||||||||||||||||||||||||||||||||||||||||||||||||||||||||||||||||
| Net change in derivatives | Net change in derivatives | (431) | (431) | |||||||||||||||||||||||||||||||||||||||||||||||||||||||||||||||||||||||||||||||
| Employee benefit plan adjustments | Employee benefit plan adjustments | 50 | 50 | |||||||||||||||||||||||||||||||||||||||||||||||||||||||||||||||||||||||||||||||
| Net change in foreign currency translation adjustments | Net change in foreign currency translation adjustments | (26) | (26) | |||||||||||||||||||||||||||||||||||||||||||||||||||||||||||||||||||||||||||||||
| Dividends declared: | Dividends declared: | |||||||||||||||||||||||||||||||||||||||||||||||||||||||||||||||||||||||||||||||||
| Common | Common | (1,749) | (1,749) | |||||||||||||||||||||||||||||||||||||||||||||||||||||||||||||||||||||||||||||||
| Preferred | Preferred | (431) | (431) | |||||||||||||||||||||||||||||||||||||||||||||||||||||||||||||||||||||||||||||||
| Common stock issued under employee plans, net, and other | Common stock issued under employee plans, net, and other | 2.0 | 284 | (3) | 281 | |||||||||||||||||||||||||||||||||||||||||||||||||||||||||||||||||||||||||||||
| Common stock repurchased | Common stock repurchased | (248.0) | (9,914) | (9,914) | ||||||||||||||||||||||||||||||||||||||||||||||||||||||||||||||||||||||||||||||
| Balance, September 30, 2021 | Balance, September 30, 2021 | $ | 23,441 | 8,241.2 | $ | 69,612 | $ | 183,007 | $ | (3,596) | $ | 272,464 | ||||||||||||||||||||||||||||||||||||||||||||||||||||||||||||||||||||||
| Balance, December 31, 2020 | Balance, December 31, 2020 | $ | 24,510 | 8,650.8 | $ | 85,982 | $ | 164,088 | $ | (1,656) | $ | 272,924 | ||||||||||||||||||||||||||||||||||||||||||||||||||||||||||||||||||||||
| Net income | Net income | 24,965 | 24,965 | |||||||||||||||||||||||||||||||||||||||||||||||||||||||||||||||||||||||||||||||
| Net change in debt securities | Net change in debt securities | (1,243) | (1,243) | |||||||||||||||||||||||||||||||||||||||||||||||||||||||||||||||||||||||||||||||
| Net change in debit valuation adjustments | Net change in debit valuation adjustments | 292 | 292 | |||||||||||||||||||||||||||||||||||||||||||||||||||||||||||||||||||||||||||||||
| Net change in derivatives | Net change in derivatives | (1,130) | (1,130) | |||||||||||||||||||||||||||||||||||||||||||||||||||||||||||||||||||||||||||||||
| Employee benefit plan adjustments | Employee benefit plan adjustments | 170 | 170 | |||||||||||||||||||||||||||||||||||||||||||||||||||||||||||||||||||||||||||||||
| Net change in foreign currency translation adjustments | Net change in foreign currency translation adjustments | (29) | (29) | |||||||||||||||||||||||||||||||||||||||||||||||||||||||||||||||||||||||||||||||
| Dividends declared: | Dividends declared: | |||||||||||||||||||||||||||||||||||||||||||||||||||||||||||||||||||||||||||||||||
| Common | Common | (4,859) | (4,859) | |||||||||||||||||||||||||||||||||||||||||||||||||||||||||||||||||||||||||||||||
| Preferred | Preferred | (1,181) | (1,181) | |||||||||||||||||||||||||||||||||||||||||||||||||||||||||||||||||||||||||||||||
| Issuance of preferred stock | Issuance of preferred stock | 902 | 902 | |||||||||||||||||||||||||||||||||||||||||||||||||||||||||||||||||||||||||||||||
| Redemption of preferred stock | Redemption of preferred stock | (1,971) | (1,971) | |||||||||||||||||||||||||||||||||||||||||||||||||||||||||||||||||||||||||||||||
| Common stock issued under employee plans, net, and other | Common stock issued under employee plans, net, and other | 42.2 | 1,223 | (6) | 1,217 | |||||||||||||||||||||||||||||||||||||||||||||||||||||||||||||||||||||||||||||
| Common stock repurchased | Common stock repurchased | (451.8) | (17,593) | (17,593) | ||||||||||||||||||||||||||||||||||||||||||||||||||||||||||||||||||||||||||||||
| Balance, September 30, 2021 | Balance, September 30, 2021 | $ | 23,441 | 8,241.2 | $ | 69,612 | $ | 183,007 | $ | (3,596) | $ | 272,464 | ||||||||||||||||||||||||||||||||||||||||||||||||||||||||||||||||||||||
| Balance, June 30, 2020 | Balance, June 30, 2020 | $ | 23,427 | 8,664.1 | $ | 85,794 | $ | 157,578 | $ | (1,162) | $ | 265,637 | ||||||||||||||||||||||||||||||||||||||||||||||||||||||||||||||||||||||
| Net income | Net income | 4,881 | 4,881 | |||||||||||||||||||||||||||||||||||||||||||||||||||||||||||||||||||||||||||||||
| Net change in debt securities | Net change in debt securities | 101 | 101 | |||||||||||||||||||||||||||||||||||||||||||||||||||||||||||||||||||||||||||||||
| Net change in debit valuation adjustments | Net change in debit valuation adjustments | (58) | (58) | |||||||||||||||||||||||||||||||||||||||||||||||||||||||||||||||||||||||||||||||
| Net change in derivatives | Net change in derivatives | 76 | 76 | |||||||||||||||||||||||||||||||||||||||||||||||||||||||||||||||||||||||||||||||
| Employee benefit plan adjustments | Employee benefit plan adjustments | 44 | 44 | |||||||||||||||||||||||||||||||||||||||||||||||||||||||||||||||||||||||||||||||
| Net change in foreign currency translation adjustments | Net change in foreign currency translation adjustments | 21 | 21 | |||||||||||||||||||||||||||||||||||||||||||||||||||||||||||||||||||||||||||||||
| Dividends declared: | Dividends declared: | |||||||||||||||||||||||||||||||||||||||||||||||||||||||||||||||||||||||||||||||||
| Common | Common | (1,571) | (1,571) | |||||||||||||||||||||||||||||||||||||||||||||||||||||||||||||||||||||||||||||||
| Preferred | Preferred | (441) | (441) | |||||||||||||||||||||||||||||||||||||||||||||||||||||||||||||||||||||||||||||||
| Common stock issued under employee plans, net, and other | Common stock issued under employee plans, net, and other | 1.8 | 274 | 274 | ||||||||||||||||||||||||||||||||||||||||||||||||||||||||||||||||||||||||||||||
| Common stock repurchased | Common stock repurchased | (4.4) | (114) | (114) | ||||||||||||||||||||||||||||||||||||||||||||||||||||||||||||||||||||||||||||||
| Balance, September 30, 2020 | Balance, September 30, 2020 | $ | 23,427 | 8,661.5 | $ | 85,954 | $ | 160,447 | $ | (978) | $ | 268,850 | ||||||||||||||||||||||||||||||||||||||||||||||||||||||||||||||||||||||
| Balance, December 31, 2019 | Balance, December 31, 2019 | $ | 23,401 | 8,836.1 | $ | 91,723 | $ | 156,319 | $ | (6,633) | $ | 264,810 | Balance, December 31, 2019 | $ | 23,401 | 8,836.1 | $ | 91,723 | $ | 156,319 | $ | (6,633) | $ | 264,810 | ||||||||||||||||||||||||||||||||||||||||||||||||||||||||||
| Cumulative adjustment for adoption of credit loss accounting standard | Cumulative adjustment for adoption of credit loss accounting standard | (2,406) | (2,406) | Cumulative adjustment for adoption of credit loss accounting standard | (2,406) | (2,406) | ||||||||||||||||||||||||||||||||||||||||||||||||||||||||||||||||||||||||||||
| Net income | Net income | 4,010 | 4,010 | Net income | 12,424 | 12,424 | ||||||||||||||||||||||||||||||||||||||||||||||||||||||||||||||||||||||||||||
| Net change in debt securities | Net change in debt securities | 4,795 | 4,795 | Net change in debt securities | 4,794 | 4,794 | ||||||||||||||||||||||||||||||||||||||||||||||||||||||||||||||||||||||||||||
| Net change in debit valuation adjustments | Net change in debit valuation adjustments | 1,346 | 1,346 | Net change in debit valuation adjustments | (5) | (5) | ||||||||||||||||||||||||||||||||||||||||||||||||||||||||||||||||||||||||||||
| Net change in derivatives | Net change in derivatives | 417 | 417 | Net change in derivatives | 808 | 808 | ||||||||||||||||||||||||||||||||||||||||||||||||||||||||||||||||||||||||||||
| Employee benefit plan adjustments | Employee benefit plan adjustments | 43 | 43 | Employee benefit plan adjustments | 144 | 144 | ||||||||||||||||||||||||||||||||||||||||||||||||||||||||||||||||||||||||||||
| Net change in foreign currency translation adjustments | Net change in foreign currency translation adjustments | (88) | (88) | Net change in foreign currency translation adjustments | (86) | (86) | ||||||||||||||||||||||||||||||||||||||||||||||||||||||||||||||||||||||||||||
| Dividends declared: | Dividends declared: | Dividends declared: | ||||||||||||||||||||||||||||||||||||||||||||||||||||||||||||||||||||||||||||||||
| Common | Common | (1,579) | (1,579) | Common | (4,722) | (4,722) | ||||||||||||||||||||||||||||||||||||||||||||||||||||||||||||||||||||||||||||
| Preferred | Preferred | (469) | (469) | Preferred | (1,159) | (1,159) | ||||||||||||||||||||||||||||||||||||||||||||||||||||||||||||||||||||||||||||
| Issuance of preferred stock | Issuance of preferred stock | 1,098 | 1,098 | Issuance of preferred stock | 1,098 | 1,098 | ||||||||||||||||||||||||||||||||||||||||||||||||||||||||||||||||||||||||||||
| Redemption of preferred stock | Redemption of preferred stock | (1,072) | (1,072) | Redemption of preferred stock | (1,072) | (1,072) | ||||||||||||||||||||||||||||||||||||||||||||||||||||||||||||||||||||||||||||
| Common stock issued under employee plans, net, and other | Common stock issued under employee plans, net, and other | 39.7 | 384 | (9) | 375 | Common stock issued under employee plans, net, and other | 41.6 | 993 | (9) | 984 | ||||||||||||||||||||||||||||||||||||||||||||||||||||||||||||||||||||||||
| Common stock repurchased | Common stock repurchased | (200.3) | (6,362) | (6,362) | Common stock repurchased | (216.2) | (6,762) | (6,762) | ||||||||||||||||||||||||||||||||||||||||||||||||||||||||||||||||||||||||||
| Balance, March 31, 2020 | $ | 23,427 | 8,675.5 | $ | 85,745 | $ | 155,866 | $ | (120) | $ | 264,918 | |||||||||||||||||||||||||||||||||||||||||||||||||||||||||||||||||||||||
| Balance, December 31, 2020 | $ | 24,510 | 8,650.8 | $ | 85,982 | $ | 164,088 | $ | (1,656) | $ | 272,924 | |||||||||||||||||||||||||||||||||||||||||||||||||||||||||||||||||||||||
| Net income | 8,050 | 8,050 | ||||||||||||||||||||||||||||||||||||||||||||||||||||||||||||||||||||||||||||||||
| Net change in debt securities | (840) | (840) | ||||||||||||||||||||||||||||||||||||||||||||||||||||||||||||||||||||||||||||||||
| Net change in debit valuation adjustments | 116 | 116 | ||||||||||||||||||||||||||||||||||||||||||||||||||||||||||||||||||||||||||||||||
| Net change in derivatives | (1,114) | (1,114) | ||||||||||||||||||||||||||||||||||||||||||||||||||||||||||||||||||||||||||||||||
| Employee benefit plan adjustments | 51 | 51 | ||||||||||||||||||||||||||||||||||||||||||||||||||||||||||||||||||||||||||||||||
| Net change in foreign currency translation adjustments | (29) | (29) | ||||||||||||||||||||||||||||||||||||||||||||||||||||||||||||||||||||||||||||||||
| Dividends declared: | ||||||||||||||||||||||||||||||||||||||||||||||||||||||||||||||||||||||||||||||||||
| Common | (1,563) | (1,563) | ||||||||||||||||||||||||||||||||||||||||||||||||||||||||||||||||||||||||||||||||
| Preferred | (490) | (490) | ||||||||||||||||||||||||||||||||||||||||||||||||||||||||||||||||||||||||||||||||
| Issuance of preferred stock | 902 | 902 | ||||||||||||||||||||||||||||||||||||||||||||||||||||||||||||||||||||||||||||||||
| Redemption of preferred stock | (1,093) | (1,093) | ||||||||||||||||||||||||||||||||||||||||||||||||||||||||||||||||||||||||||||||||
| Common stock issued under employee plans, net, and other | 40.0 | 559 | (3) | 556 | ||||||||||||||||||||||||||||||||||||||||||||||||||||||||||||||||||||||||||||||
| Common stock repurchased | (101.1) | (3,470) | (3,470) | |||||||||||||||||||||||||||||||||||||||||||||||||||||||||||||||||||||||||||||||
| Balance, March 31, 2021 | $ | 24,319 | 8,589.7 | $ | 83,071 | $ | 170,082 | $ | (3,472) | $ | 274,000 | |||||||||||||||||||||||||||||||||||||||||||||||||||||||||||||||||||||||
| Balance, September 30, 2020 | Balance, September 30, 2020 | $ | 23,427 | 8,661.5 | $ | 85,954 | $ | 160,447 | $ | (978) | $ | 268,850 | ||||||||||||||||||||||||||||||||||||||||||||||||||||||||||||||||||||||
51Bank of America | ||||||||
| Consolidated Statement of Cash Flows | |||||||||||||||||||||||||||||
| Nine Months Ended September 30 | |||||||||||||||||||||||||||||
| (Dollars in millions) | 2021 | 2020 | |||||||||||||||||||||||||||
| Operating activities | |||||||||||||||||||||||||||||
| Net income | $ | 24,965 | $ | 12,424 | |||||||||||||||||||||||||
| Adjustments to reconcile net income to net cash provided by operating activities: | |||||||||||||||||||||||||||||
| Provision for credit losses | (4,105) | 11,267 | |||||||||||||||||||||||||||
| Gains on sales of debt securities | (4) | (379) | |||||||||||||||||||||||||||
| Depreciation and amortization | 1,403 | 1,356 | |||||||||||||||||||||||||||
| Net amortization of premium/discount on debt securities | 4,534 | 2,636 | |||||||||||||||||||||||||||
| Deferred income taxes | (1,151) | (1,994) | |||||||||||||||||||||||||||
| Stock-based compensation | 2,031 | 1,597 | |||||||||||||||||||||||||||
| Loans held-for-sale: | |||||||||||||||||||||||||||||
| Originations and purchases | (27,003) | (11,093) | |||||||||||||||||||||||||||
Proceeds from sales and paydowns of loans originally classified as held for sale and instruments from related securitization activities | 24,852 | 15,654 | |||||||||||||||||||||||||||
| Net change in: | |||||||||||||||||||||||||||||
| Trading and derivative assets/liabilities | (55,310) | (25,503) | |||||||||||||||||||||||||||
| Other assets | (34,337) | (15,078) | |||||||||||||||||||||||||||
| Accrued expenses and other liabilities | 8,713 | (9,495) | |||||||||||||||||||||||||||
| Other operating activities, net | 3,568 | 2,007 | |||||||||||||||||||||||||||
| Net cash used in operating activities | (51,844) | (16,601) | |||||||||||||||||||||||||||
| Investing activities | |||||||||||||||||||||||||||||
| Net change in: | |||||||||||||||||||||||||||||
| Time deposits placed and other short-term investments | 28 | 2,019 | |||||||||||||||||||||||||||
| Federal funds sold and securities borrowed or purchased under agreements to resell | 42,124 | (52,148) | |||||||||||||||||||||||||||
| Debt securities carried at fair value: | |||||||||||||||||||||||||||||
| Proceeds from sales | 3,732 | 61,485 | |||||||||||||||||||||||||||
| Proceeds from paydowns and maturities | 124,149 | 61,973 | |||||||||||||||||||||||||||
| Purchases | (174,517) | (148,905) | |||||||||||||||||||||||||||
| Held-to-maturity debt securities: | |||||||||||||||||||||||||||||
| Proceeds from paydowns and maturities | 94,437 | 63,097 | |||||||||||||||||||||||||||
| Purchases | (340,425) | (126,710) | |||||||||||||||||||||||||||
| Loans and leases: | |||||||||||||||||||||||||||||
Proceeds from sales of loans originally classified as held for investment and instruments from related securitization activities | 7,767 | 10,041 | |||||||||||||||||||||||||||
| Purchases | (3,363) | (3,972) | |||||||||||||||||||||||||||
| Other changes in loans and leases, net | (5,866) | 11,810 | |||||||||||||||||||||||||||
| Other investing activities, net | (2,450) | (2,473) | |||||||||||||||||||||||||||
| Net cash used in investing activities | (254,384) | (123,783) | |||||||||||||||||||||||||||
| Financing activities | |||||||||||||||||||||||||||||
| Net change in: | |||||||||||||||||||||||||||||
| Deposits | 169,324 | 268,077 | |||||||||||||||||||||||||||
| Federal funds purchased and securities loaned or sold under agreements to repurchase | 37,105 | 25,660 | |||||||||||||||||||||||||||
| Short-term borrowings | 957 | (6,353) | |||||||||||||||||||||||||||
| Long-term debt: | |||||||||||||||||||||||||||||
| Proceeds from issuance | 65,459 | 40,858 | |||||||||||||||||||||||||||
| Retirement | (38,787) | (37,123) | |||||||||||||||||||||||||||
| Preferred stock: | |||||||||||||||||||||||||||||
| Proceeds from issuance | 902 | 1,098 | |||||||||||||||||||||||||||
| Redemption | (1,971) | (1,072) | |||||||||||||||||||||||||||
| Common stock repurchased | (17,593) | (6,762) | |||||||||||||||||||||||||||
| Cash dividends paid | (6,090) | (5,899) | |||||||||||||||||||||||||||
| Other financing activities, net | (696) | (603) | |||||||||||||||||||||||||||
| Net cash provided by financing activities | 208,610 | 277,881 | |||||||||||||||||||||||||||
| Effect of exchange rate changes on cash and cash equivalents | (2,991) | 1,949 | |||||||||||||||||||||||||||
| Net increase (decrease) in cash and cash equivalents | (100,609) | 139,446 | |||||||||||||||||||||||||||
| Cash and cash equivalents at January 1 | 380,463 | 161,560 | |||||||||||||||||||||||||||
| Cash and cash equivalents at September 30 | $ | 279,854 | $ | 301,006 | |||||||||||||||||||||||||
Bank of America | ||||||||
| Consolidated Statement of Cash Flows | |||||||||||||||||||||||||||||
| Three Months Ended March 31 | |||||||||||||||||||||||||||||
| (Dollars in millions) | 2021 | 2020 | |||||||||||||||||||||||||||
| Operating activities | |||||||||||||||||||||||||||||
| Net income | $ | 8,050 | $ | 4,010 | |||||||||||||||||||||||||
| Adjustments to reconcile net income to net cash provided by operating activities: | |||||||||||||||||||||||||||||
| Provision for credit losses | (1,860) | 4,761 | |||||||||||||||||||||||||||
| Gains on sales of debt securities | 0 | (315) | |||||||||||||||||||||||||||
| Depreciation and amortization | 461 | 432 | |||||||||||||||||||||||||||
| Net amortization of premium/discount on debt securities | 1,530 | 482 | |||||||||||||||||||||||||||
| Deferred income taxes | 566 | (229) | |||||||||||||||||||||||||||
| Stock-based compensation | 853 | 543 | |||||||||||||||||||||||||||
| Loans held-for-sale: | |||||||||||||||||||||||||||||
| Originations and purchases | (8,253) | (6,078) | |||||||||||||||||||||||||||
Proceeds from sales and paydowns of loans originally classified as held for sale and instruments from related securitization activities | 9,383 | 7,397 | |||||||||||||||||||||||||||
| Net change in: | |||||||||||||||||||||||||||||
| Trading and derivative assets/liabilities | (53,756) | 29,615 | |||||||||||||||||||||||||||
| Other assets | (23,477) | (21,022) | |||||||||||||||||||||||||||
| Accrued expenses and other liabilities | 12,186 | (588) | |||||||||||||||||||||||||||
| Other operating activities, net | 1,989 | 35 | |||||||||||||||||||||||||||
| Net cash provided by (used in) operating activities | (52,328) | 19,043 | |||||||||||||||||||||||||||
| Investing activities | |||||||||||||||||||||||||||||
| Net change in: | |||||||||||||||||||||||||||||
| Time deposits placed and other short-term investments | (1,313) | (5,176) | |||||||||||||||||||||||||||
| Federal funds sold and securities borrowed or purchased under agreements to resell | 44,911 | (27,372) | |||||||||||||||||||||||||||
| Debt securities carried at fair value: | |||||||||||||||||||||||||||||
| Proceeds from sales | 491 | 9,977 | |||||||||||||||||||||||||||
| Proceeds from paydowns and maturities | 37,105 | 16,708 | |||||||||||||||||||||||||||
| Purchases | (79,075) | (18,131) | |||||||||||||||||||||||||||
| Held-to-maturity debt securities: | |||||||||||||||||||||||||||||
| Proceeds from paydowns and maturities | 31,703 | 11,933 | |||||||||||||||||||||||||||
| Purchases | (169,930) | (7,132) | |||||||||||||||||||||||||||
| Loans and leases: | |||||||||||||||||||||||||||||
Proceeds from sales of loans originally classified as held for investment and instruments from related securitization activities | 2,263 | 2,050 | |||||||||||||||||||||||||||
| Purchases | (1,053) | (1,982) | |||||||||||||||||||||||||||
| Other changes in loans and leases, net | 22,585 | (69,667) | |||||||||||||||||||||||||||
| Other investing activities, net | (767) | (1,619) | |||||||||||||||||||||||||||
| Net cash used in investing activities | (113,080) | (90,411) | |||||||||||||||||||||||||||
| Financing activities | |||||||||||||||||||||||||||||
| Net change in: | |||||||||||||||||||||||||||||
| Deposits | 89,458 | 148,522 | |||||||||||||||||||||||||||
| Federal funds purchased and securities loaned or sold under agreements to repurchase | 29,120 | 4,934 | |||||||||||||||||||||||||||
| Short-term borrowings | 2,403 | 5,904 | |||||||||||||||||||||||||||
| Long-term debt: | |||||||||||||||||||||||||||||
| Proceeds from issuance | 13,132 | 18,728 | |||||||||||||||||||||||||||
| Retirement | (13,991) | (7,843) | |||||||||||||||||||||||||||
| Preferred stock: | |||||||||||||||||||||||||||||
| Proceeds from issuance | 902 | 1,098 | |||||||||||||||||||||||||||
| Redemption | (1,093) | (1,072) | |||||||||||||||||||||||||||
| Common stock repurchased | (3,470) | (6,362) | |||||||||||||||||||||||||||
| Cash dividends paid | (2,114) | (2,083) | |||||||||||||||||||||||||||
| Other financing activities, net | (720) | (679) | |||||||||||||||||||||||||||
| Net cash provided by financing activities | 113,627 | 161,147 | |||||||||||||||||||||||||||
| Effect of exchange rate changes on cash and cash equivalents | (2,581) | (949) | |||||||||||||||||||||||||||
| Net increase (decrease) in cash and cash equivalents | (54,362) | 88,830 | |||||||||||||||||||||||||||
| Cash and cash equivalents at January 1 | 380,463 | 161,560 | |||||||||||||||||||||||||||
| Cash and cash equivalents at March 31 | $ | 326,101 | $ | 250,390 | |||||||||||||||||||||||||
| Three Months Ended March 31 | ||||||||||||||||||||||||||||||||||||||||||||||||||
| (Dollars in millions) | 2021 | 2020 | ||||||||||||||||||||||||||||||||||||||||||||||||
| Net interest income | ||||||||||||||||||||||||||||||||||||||||||||||||||
| Interest income | ||||||||||||||||||||||||||||||||||||||||||||||||||
| Loans and leases | $ | 7,234 | $ | 9,963 | ||||||||||||||||||||||||||||||||||||||||||||||
| Debt securities | 2,730 | 2,843 | ||||||||||||||||||||||||||||||||||||||||||||||||
| Federal funds sold and securities borrowed or purchased under agreements to resell | (7) | 819 | ||||||||||||||||||||||||||||||||||||||||||||||||
| Trading account assets | 872 | 1,247 | ||||||||||||||||||||||||||||||||||||||||||||||||
| Other interest income | 566 | 1,226 | ||||||||||||||||||||||||||||||||||||||||||||||||
| Total interest income | 11,395 | 16,098 | ||||||||||||||||||||||||||||||||||||||||||||||||
| Interest expense | ||||||||||||||||||||||||||||||||||||||||||||||||||
| Deposits | 133 | 1,184 | ||||||||||||||||||||||||||||||||||||||||||||||||
| Short-term borrowings | (79) | 1,120 | ||||||||||||||||||||||||||||||||||||||||||||||||
| Trading account liabilities | 246 | 329 | ||||||||||||||||||||||||||||||||||||||||||||||||
| Long-term debt | 898 | 1,335 | ||||||||||||||||||||||||||||||||||||||||||||||||
| Total interest expense | 1,198 | 3,968 | ||||||||||||||||||||||||||||||||||||||||||||||||
| Net interest income | $ | 10,197 | $ | 12,130 | ||||||||||||||||||||||||||||||||||||||||||||||
| Noninterest income | ||||||||||||||||||||||||||||||||||||||||||||||||||
| Fees and commissions | ||||||||||||||||||||||||||||||||||||||||||||||||||
| Card income | ||||||||||||||||||||||||||||||||||||||||||||||||||
Interchange fees (1) | $ | 1,067 | $ | 792 | ||||||||||||||||||||||||||||||||||||||||||||||
| Other card income | 368 | 480 | ||||||||||||||||||||||||||||||||||||||||||||||||
| Total card income | 1,435 | 1,272 | ||||||||||||||||||||||||||||||||||||||||||||||||
| Service charges | ||||||||||||||||||||||||||||||||||||||||||||||||||
| Deposit-related fees | 1,495 | 1,627 | ||||||||||||||||||||||||||||||||||||||||||||||||
| Lending-related fees | 297 | 276 | ||||||||||||||||||||||||||||||||||||||||||||||||
| Total service charges | 1,792 | 1,903 | ||||||||||||||||||||||||||||||||||||||||||||||||
| Investment and brokerage services | ||||||||||||||||||||||||||||||||||||||||||||||||||
| Asset management fees | 3,002 | 2,682 | ||||||||||||||||||||||||||||||||||||||||||||||||
| Brokerage fees | 1,061 | 1,076 | ||||||||||||||||||||||||||||||||||||||||||||||||
| Total investment and brokerage services | 4,063 | 3,758 | ||||||||||||||||||||||||||||||||||||||||||||||||
| Investment banking fees | ||||||||||||||||||||||||||||||||||||||||||||||||||
| Underwriting income | 1,546 | 848 | ||||||||||||||||||||||||||||||||||||||||||||||||
| Syndication fees | 300 | 271 | ||||||||||||||||||||||||||||||||||||||||||||||||
| Financial advisory services | 400 | 269 | ||||||||||||||||||||||||||||||||||||||||||||||||
| Total investment banking fees | 2,246 | 1,388 | ||||||||||||||||||||||||||||||||||||||||||||||||
| Total fees and commissions | 9,536 | 8,321 | ||||||||||||||||||||||||||||||||||||||||||||||||
| Market making and similar activities | 3,529 | 2,807 | ||||||||||||||||||||||||||||||||||||||||||||||||
| Other income (loss) | (441) | (491) | ||||||||||||||||||||||||||||||||||||||||||||||||
| Total noninterest income | $ | 12,624 | $ | 10,637 | ||||||||||||||||||||||||||||||||||||||||||||||
53Bank of America | ||||||||
| Three Months Ended September 30 | Nine Months Ended September 30 | |||||||||||||||||||||||||||||||||||||||||||||||||
| (Dollars in millions) | 2021 | 2020 | 2021 | 2020 | ||||||||||||||||||||||||||||||||||||||||||||||
| Net interest income | ||||||||||||||||||||||||||||||||||||||||||||||||||
| Interest income | ||||||||||||||||||||||||||||||||||||||||||||||||||
| Loans and leases | $ | 7,502 | $ | 7,894 | $ | 21,859 | $ | 26,426 | ||||||||||||||||||||||||||||||||||||||||||
| Debt securities | 3,282 | 2,130 | 8,832 | 7,413 | ||||||||||||||||||||||||||||||||||||||||||||||
| Federal funds sold and securities borrowed or purchased under agreements to resell | 6 | 55 | (43) | 900 | ||||||||||||||||||||||||||||||||||||||||||||||
| Trading account assets | 967 | 948 | 2,793 | 3,203 | ||||||||||||||||||||||||||||||||||||||||||||||
| Other interest income | 579 | 459 | 1,677 | 2,182 | ||||||||||||||||||||||||||||||||||||||||||||||
| Total interest income | 12,336 | 11,486 | 35,118 | 40,124 | ||||||||||||||||||||||||||||||||||||||||||||||
| Interest expense | ||||||||||||||||||||||||||||||||||||||||||||||||||
| Deposits | 133 | 227 | 394 | 1,784 | ||||||||||||||||||||||||||||||||||||||||||||||
| Short-term borrowings | (41) | (24) | (205) | 1,024 | ||||||||||||||||||||||||||||||||||||||||||||||
| Trading account liabilities | 285 | 212 | 824 | 764 | ||||||||||||||||||||||||||||||||||||||||||||||
| Long-term debt | 865 | 942 | 2,581 | 3,445 | ||||||||||||||||||||||||||||||||||||||||||||||
| Total interest expense | 1,242 | 1,357 | 3,594 | 7,017 | ||||||||||||||||||||||||||||||||||||||||||||||
| Net interest income | $ | 11,094 | $ | 10,129 | $ | 31,524 | $ | 33,107 | ||||||||||||||||||||||||||||||||||||||||||
| Noninterest income | ||||||||||||||||||||||||||||||||||||||||||||||||||
| Fees and commissions | ||||||||||||||||||||||||||||||||||||||||||||||||||
| Card income | ||||||||||||||||||||||||||||||||||||||||||||||||||
Interchange fees (1) | $ | 1,154 | $ | 1,172 | $ | 3,431 | $ | 2,794 | ||||||||||||||||||||||||||||||||||||||||||
| Other card income | 429 | 396 | 1,173 | 1,295 | ||||||||||||||||||||||||||||||||||||||||||||||
| Total card income | 1,583 | 1,568 | 4,604 | 4,089 | ||||||||||||||||||||||||||||||||||||||||||||||
| Service charges | ||||||||||||||||||||||||||||||||||||||||||||||||||
| Deposit-related fees | 1,619 | 1,515 | 4,671 | 4,441 | ||||||||||||||||||||||||||||||||||||||||||||||
| Lending-related fees | 309 | 302 | 923 | 841 | ||||||||||||||||||||||||||||||||||||||||||||||
| Total service charges | 1,928 | 1,817 | 5,594 | 5,282 | ||||||||||||||||||||||||||||||||||||||||||||||
| Investment and brokerage services | ||||||||||||||||||||||||||||||||||||||||||||||||||
| Asset management fees | 3,276 | 2,740 | 9,434 | 7,905 | ||||||||||||||||||||||||||||||||||||||||||||||
| Brokerage fees | 960 | 883 | 2,988 | 2,898 | ||||||||||||||||||||||||||||||||||||||||||||||
| Total investment and brokerage services | 4,236 | 3,623 | 12,422 | 10,803 | ||||||||||||||||||||||||||||||||||||||||||||||
| Investment banking fees | ||||||||||||||||||||||||||||||||||||||||||||||||||
| Underwriting income | 1,168 | 1,239 | 4,028 | 3,610 | ||||||||||||||||||||||||||||||||||||||||||||||
| Syndication fees | 346 | 133 | 1,047 | 634 | ||||||||||||||||||||||||||||||||||||||||||||||
| Financial advisory services | 654 | 397 | 1,461 | 1,072 | ||||||||||||||||||||||||||||||||||||||||||||||
| Total investment banking fees | 2,168 | 1,769 | 6,536 | 5,316 | ||||||||||||||||||||||||||||||||||||||||||||||
| Total fees and commissions | 9,915 | 8,777 | 29,156 | 25,490 | ||||||||||||||||||||||||||||||||||||||||||||||
| Market making and similar activities | 2,005 | 1,689 | 7,360 | 6,983 | ||||||||||||||||||||||||||||||||||||||||||||||
| Other income (loss) | (248) | (259) | (987) | (151) | ||||||||||||||||||||||||||||||||||||||||||||||
| Total noninterest income | $ | 11,672 | $ | 10,207 | $ | 35,529 | $ | 32,322 | ||||||||||||||||||||||||||||||||||||||||||
Bank of America | ||||||||
| March 31, 2021 | September 30, 2021 | |||||||||||||||||||||||||||||||||||||||||||||||||||||||||||||||||||||||||||||||||
| Gross Derivative Assets | Gross Derivative Liabilities | Gross Derivative Assets | Gross Derivative Liabilities | |||||||||||||||||||||||||||||||||||||||||||||||||||||||||||||||||||||||||||||||
| (Dollars in billions) | (Dollars in billions) | Contract/ Notional (1) | Trading and Other Risk Management Derivatives | Qualifying Accounting Hedges | Total | Trading and Other Risk Management Derivatives | Qualifying Accounting Hedges | Total | (Dollars in billions) | Contract/ Notional (1) | Trading and Other Risk Management Derivatives | Qualifying Accounting Hedges | Total | Trading and Other Risk Management Derivatives | Qualifying Accounting Hedges | Total | ||||||||||||||||||||||||||||||||||||||||||||||||||||||||||||||||||
| Interest rate contracts | Interest rate contracts | Interest rate contracts | ||||||||||||||||||||||||||||||||||||||||||||||||||||||||||||||||||||||||||||||||
| Swaps | Swaps | $ | 17,024.6 | $ | 153.6 | $ | 11.0 | $ | 164.6 | $ | 159.1 | $ | 4.1 | $ | 163.2 | Swaps | $ | 19,675.2 | $ | 141.9 | $ | 9.4 | $ | 151.3 | $ | 148.6 | $ | 2.4 | $ | 151.0 | ||||||||||||||||||||||||||||||||||||||||||||||||||||
| Futures and forwards | Futures and forwards | 5,241.6 | 4.9 | 0 | 4.9 | 4.8 | 0 | 4.8 | Futures and forwards | 4,142.2 | 2.8 | — | 2.8 | 2.7 | — | 2.7 | ||||||||||||||||||||||||||||||||||||||||||||||||||||||||||||||||||
| Written options | Written options | 1,690.7 | 0 | 0 | 0 | 34.4 | 0 | 34.4 | Written options | 1,746.8 | — | — | — | 29.5 | — | 29.5 | ||||||||||||||||||||||||||||||||||||||||||||||||||||||||||||||||||
| Purchased options | Purchased options | 1,728.2 | 37.5 | 0 | 37.5 | 0 | 0 | 0 | Purchased options | 1,637.3 | 33.4 | — | 33.4 | — | — | — | ||||||||||||||||||||||||||||||||||||||||||||||||||||||||||||||||||
| Foreign exchange contracts | Foreign exchange contracts | Foreign exchange contracts | ||||||||||||||||||||||||||||||||||||||||||||||||||||||||||||||||||||||||||||||||
| Swaps | Swaps | 1,457.9 | 33.6 | 0.5 | 34.1 | 35.0 | 0.6 | 35.6 | Swaps | 1,433.9 | 27.6 | 0.4 | 28.0 | 30.7 | 0.3 | 31.0 | ||||||||||||||||||||||||||||||||||||||||||||||||||||||||||||||||||
| Spot, futures and forwards | Spot, futures and forwards | 4,861.4 | 45.5 | 0.5 | 46.0 | 44.9 | 0.1 | 45.0 | Spot, futures and forwards | 4,628.5 | 37.1 | 0.5 | 37.6 | 35.1 | 0.1 | 35.2 | ||||||||||||||||||||||||||||||||||||||||||||||||||||||||||||||||||
| Written options | Written options | 335.0 | 0 | 0 | 0 | 4.2 | 0 | 4.2 | Written options | 338.1 | — | — | — | 3.9 | — | 3.9 | ||||||||||||||||||||||||||||||||||||||||||||||||||||||||||||||||||
| Purchased options | Purchased options | 326.1 | 4.4 | 0 | 4.4 | 0 | 0 | 0 | Purchased options | 310.6 | 3.9 | — | 3.9 | — | — | — | ||||||||||||||||||||||||||||||||||||||||||||||||||||||||||||||||||
| Equity contracts | Equity contracts | Equity contracts | ||||||||||||||||||||||||||||||||||||||||||||||||||||||||||||||||||||||||||||||||
| Swaps | Swaps | 339.4 | 13.0 | 0 | 13.0 | 13.7 | 0 | 13.7 | Swaps | 431.7 | 13.6 | — | 13.6 | 16.0 | — | 16.0 | ||||||||||||||||||||||||||||||||||||||||||||||||||||||||||||||||||
| Futures and forwards | Futures and forwards | 136.3 | 0.2 | 0 | 0.2 | 1.8 | 0 | 1.8 | Futures and forwards | 131.0 | 0.4 | — | 0.4 | 1.6 | — | 1.6 | ||||||||||||||||||||||||||||||||||||||||||||||||||||||||||||||||||
| Written options | Written options | 620.2 | 0 | 0 | 0 | 52.2 | 0 | 52.2 | Written options | 738.8 | — | — | — | 60.3 | — | 60.3 | ||||||||||||||||||||||||||||||||||||||||||||||||||||||||||||||||||
| Purchased options | Purchased options | 550.1 | 55.8 | 0 | 55.8 | 0 | 0 | 0 | Purchased options | 654.4 | 60.6 | — | 60.6 | — | — | — | ||||||||||||||||||||||||||||||||||||||||||||||||||||||||||||||||||
| Commodity contracts | Commodity contracts | Commodity contracts | ||||||||||||||||||||||||||||||||||||||||||||||||||||||||||||||||||||||||||||||||
| Swaps | Swaps | 40.3 | 2.0 | 0 | 2.0 | 4.1 | 0 | 4.1 | Swaps | 50.2 | 4.5 | — | 4.5 | 7.7 | — | 7.7 | ||||||||||||||||||||||||||||||||||||||||||||||||||||||||||||||||||
| Futures and forwards | Futures and forwards | 68.8 | 2.0 | 0 | 2.0 | 1.0 | 0.1 | 1.1 | Futures and forwards | 91.7 | 2.3 | 0.3 | 2.6 | 1.1 | 0.6 | 1.7 | ||||||||||||||||||||||||||||||||||||||||||||||||||||||||||||||||||
| Written options | Written options | 33.9 | 0 | 0 | 0 | 1.7 | 0 | 1.7 | Written options | 41.9 | — | — | — | 4.0 | — | 4.0 | ||||||||||||||||||||||||||||||||||||||||||||||||||||||||||||||||||
| Purchased options | Purchased options | 29.5 | 1.8 | 0 | 1.8 | 0 | 0 | 0 | Purchased options | 34.0 | 4.6 | — | 4.6 | — | — | — | ||||||||||||||||||||||||||||||||||||||||||||||||||||||||||||||||||
Credit derivatives (2) | Credit derivatives (2) | Credit derivatives (2) | ||||||||||||||||||||||||||||||||||||||||||||||||||||||||||||||||||||||||||||||||
| Purchased credit derivatives: | Purchased credit derivatives: | Purchased credit derivatives: | ||||||||||||||||||||||||||||||||||||||||||||||||||||||||||||||||||||||||||||||||
| Credit default swaps | Credit default swaps | 362.2 | 2.1 | 0 | 2.1 | 5.4 | 0 | 5.4 | Credit default swaps | 375.2 | 1.8 | — | 1.8 | 5.0 | — | 5.0 | ||||||||||||||||||||||||||||||||||||||||||||||||||||||||||||||||||
| Total return swaps/options | Total return swaps/options | 79.2 | 0.4 | 0 | 0.4 | 1.3 | 0 | 1.3 | Total return swaps/options | 52.6 | 0.3 | — | 0.3 | 1.4 | — | 1.4 | ||||||||||||||||||||||||||||||||||||||||||||||||||||||||||||||||||
| Written credit derivatives: | Written credit derivatives: | Written credit derivatives: | ||||||||||||||||||||||||||||||||||||||||||||||||||||||||||||||||||||||||||||||||
| Credit default swaps | Credit default swaps | 340.6 | 5.3 | 0 | 5.3 | 1.9 | 0 | 1.9 | Credit default swaps | 358.3 | 5.0 | — | 5.0 | 1.5 | — | 1.5 | ||||||||||||||||||||||||||||||||||||||||||||||||||||||||||||||||||
| Total return swaps/options | Total return swaps/options | 79.5 | 1.6 | 0 | 1.6 | 0.4 | 0 | 0.4 | Total return swaps/options | 59.3 | 1.3 | — | 1.3 | 0.5 | — | 0.5 | ||||||||||||||||||||||||||||||||||||||||||||||||||||||||||||||||||
| Gross derivative assets/liabilities | Gross derivative assets/liabilities | $ | 363.7 | $ | 12.0 | $ | 375.7 | $ | 365.9 | $ | 4.9 | $ | 370.8 | Gross derivative assets/liabilities | $ | 341.1 | $ | 10.6 | $ | 351.7 | $ | 349.6 | $ | 3.4 | $ | 353.0 | ||||||||||||||||||||||||||||||||||||||||||||||||||||||||
| Less: Legally enforceable master netting agreements | Less: Legally enforceable master netting agreements | (294.5) | (294.5) | Less: Legally enforceable master netting agreements | (279.7) | (279.7) | ||||||||||||||||||||||||||||||||||||||||||||||||||||||||||||||||||||||||||||
| Less: Cash collateral received/paid | Less: Cash collateral received/paid | (35.3) | (34.0) | Less: Cash collateral received/paid | (31.2) | (35.2) | ||||||||||||||||||||||||||||||||||||||||||||||||||||||||||||||||||||||||||||
| Total derivative assets/liabilities | Total derivative assets/liabilities | $ | 45.9 | $ | 42.3 | Total derivative assets/liabilities | $ | 40.8 | $ | 38.1 | ||||||||||||||||||||||||||||||||||||||||||||||||||||||||||||||||||||||||
| December 31, 2020 | December 31, 2020 | |||||||||||||||||||||||||||||||||||||||||||||||||||||||||||||||||||||||||||||||||
| Gross Derivative Assets | Gross Derivative Liabilities | Gross Derivative Assets | Gross Derivative Liabilities | |||||||||||||||||||||||||||||||||||||||||||||||||||||||||||||||||||||||||||||||
| (Dollars in billions) | (Dollars in billions) | Contract/ Notional (1) | Trading and Other Risk Management Derivatives | Qualifying Accounting Hedges | Total | Trading and Other Risk Management Derivatives | Qualifying Accounting Hedges | Total | (Dollars in billions) | Contract/ Notional (1) | Trading and Other Risk Management Derivatives | Qualifying Accounting Hedges | Total | Trading and Other Risk Management Derivatives | Qualifying Accounting Hedges | Total | ||||||||||||||||||||||||||||||||||||||||||||||||||||||||||||||||||
| Interest rate contracts | Interest rate contracts | Interest rate contracts | ||||||||||||||||||||||||||||||||||||||||||||||||||||||||||||||||||||||||||||||||
| Swaps | Swaps | $ | 13,242.8 | $ | 199.9 | $ | 10.9 | $ | 210.8 | $ | 209.3 | $ | 1.3 | $ | 210.6 | Swaps | $ | 13,242.8 | $ | 199.9 | $ | 10.9 | $ | 210.8 | $ | 209.3 | $ | 1.3 | $ | 210.6 | ||||||||||||||||||||||||||||||||||||||||||||||||||||
| Futures and forwards | Futures and forwards | 3,222.2 | 3.5 | 0.1 | 3.6 | 3.6 | 0 | 3.6 | Futures and forwards | 3,222.2 | 3.5 | 0.1 | 3.6 | 3.6 | — | 3.6 | ||||||||||||||||||||||||||||||||||||||||||||||||||||||||||||||||||
| Written options | Written options | 1,530.5 | 0 | 0 | 0 | 40.5 | 0 | 40.5 | Written options | 1,530.5 | — | — | — | 40.5 | — | 40.5 | ||||||||||||||||||||||||||||||||||||||||||||||||||||||||||||||||||
| Purchased options | Purchased options | 1,545.8 | 45.3 | 0 | 45.3 | 0 | 0 | 0 | Purchased options | 1,545.8 | 45.3 | — | 45.3 | — | — | — | ||||||||||||||||||||||||||||||||||||||||||||||||||||||||||||||||||
| Foreign exchange contracts | Foreign exchange contracts | Foreign exchange contracts | ||||||||||||||||||||||||||||||||||||||||||||||||||||||||||||||||||||||||||||||||
| Swaps | Swaps | 1,475.8 | 37.1 | 0.3 | 37.4 | 39.7 | 0.6 | 40.3 | Swaps | 1,475.8 | 37.1 | 0.3 | 37.4 | 39.7 | 0.6 | 40.3 | ||||||||||||||||||||||||||||||||||||||||||||||||||||||||||||||||||
| Spot, futures and forwards | Spot, futures and forwards | 3,710.7 | 53.4 | 0 | 53.4 | 54.5 | 0.5 | 55.0 | Spot, futures and forwards | 3,710.7 | 53.4 | — | 53.4 | 54.5 | 0.5 | 55.0 | ||||||||||||||||||||||||||||||||||||||||||||||||||||||||||||||||||
| Written options | Written options | 289.6 | 0 | 0 | 0 | 4.8 | 0 | 4.8 | Written options | 289.6 | — | — | — | 4.8 | — | 4.8 | ||||||||||||||||||||||||||||||||||||||||||||||||||||||||||||||||||
| Purchased options | Purchased options | 279.3 | 5.0 | 0 | 5.0 | 0 | 0 | 0 | Purchased options | 279.3 | 5.0 | — | 5.0 | — | — | — | ||||||||||||||||||||||||||||||||||||||||||||||||||||||||||||||||||
| Equity contracts | Equity contracts | Equity contracts | ||||||||||||||||||||||||||||||||||||||||||||||||||||||||||||||||||||||||||||||||
| Swaps | Swaps | 320.2 | 13.3 | 0 | 13.3 | 14.5 | 0 | 14.5 | Swaps | 320.2 | 13.3 | — | 13.3 | 14.5 | — | 14.5 | ||||||||||||||||||||||||||||||||||||||||||||||||||||||||||||||||||
| Futures and forwards | Futures and forwards | 106.2 | 0.3 | 0 | 0.3 | 1.4 | 0 | 1.4 | Futures and forwards | 106.2 | 0.3 | — | 0.3 | 1.4 | — | 1.4 | ||||||||||||||||||||||||||||||||||||||||||||||||||||||||||||||||||
| Written options | Written options | 599.1 | 0 | 0 | 0 | 48.8 | 0 | 48.8 | Written options | 599.1 | — | — | — | 48.8 | — | 48.8 | ||||||||||||||||||||||||||||||||||||||||||||||||||||||||||||||||||
| Purchased options | Purchased options | 541.2 | 52.6 | 0 | 52.6 | 0 | 0 | 0 | Purchased options | 541.2 | 52.6 | — | 52.6 | — | — | — | ||||||||||||||||||||||||||||||||||||||||||||||||||||||||||||||||||
| Commodity contracts | Commodity contracts | Commodity contracts | ||||||||||||||||||||||||||||||||||||||||||||||||||||||||||||||||||||||||||||||||
| Swaps | Swaps | 36.4 | 1.9 | 0 | 1.9 | 4.4 | 0 | 4.4 | Swaps | 36.4 | 1.9 | — | 1.9 | 4.4 | — | 4.4 | ||||||||||||||||||||||||||||||||||||||||||||||||||||||||||||||||||
| Futures and forwards | Futures and forwards | 63.6 | 2.0 | 0 | 2.0 | 1.0 | 0 | 1.0 | Futures and forwards | 63.6 | 2.0 | — | 2.0 | 1.0 | — | 1.0 | ||||||||||||||||||||||||||||||||||||||||||||||||||||||||||||||||||
| Written options | Written options | 24.6 | 0 | 0 | 0 | 1.4 | 0 | 1.4 | Written options | 24.6 | — | — | — | 1.4 | — | 1.4 | ||||||||||||||||||||||||||||||||||||||||||||||||||||||||||||||||||
| Purchased options | Purchased options | 24.7 | 1.5 | 0 | 1.5 | 0 | 0 | 0 | Purchased options | 24.7 | 1.5 | — | 1.5 | — | — | — | ||||||||||||||||||||||||||||||||||||||||||||||||||||||||||||||||||
Credit derivatives (2) | Credit derivatives (2) | Credit derivatives (2) | ||||||||||||||||||||||||||||||||||||||||||||||||||||||||||||||||||||||||||||||||
| Purchased credit derivatives: | Purchased credit derivatives: | Purchased credit derivatives: | ||||||||||||||||||||||||||||||||||||||||||||||||||||||||||||||||||||||||||||||||
| Credit default swaps | Credit default swaps | 322.7 | 2.3 | 0 | 2.3 | 4.4 | 0 | 4.4 | Credit default swaps | 322.7 | 2.3 | — | 2.3 | 4.4 | — | 4.4 | ||||||||||||||||||||||||||||||||||||||||||||||||||||||||||||||||||
| Total return swaps/options | Total return swaps/options | 63.6 | 0.2 | 0 | 0.2 | 1.0 | 0 | 1.0 | Total return swaps/options | 63.6 | 0.2 | — | 0.2 | 1.0 | — | 1.0 | ||||||||||||||||||||||||||||||||||||||||||||||||||||||||||||||||||
| Written credit derivatives: | Written credit derivatives: | Written credit derivatives: | ||||||||||||||||||||||||||||||||||||||||||||||||||||||||||||||||||||||||||||||||
| Credit default swaps | Credit default swaps | 301.5 | 4.4 | 0 | 4.4 | 1.9 | 0 | 1.9 | Credit default swaps | 301.5 | 4.4 | — | 4.4 | 1.9 | — | 1.9 | ||||||||||||||||||||||||||||||||||||||||||||||||||||||||||||||||||
| Total return swaps/options | Total return swaps/options | 68.6 | 0.6 | 0 | 0.6 | 0.4 | 0 | 0.4 | Total return swaps/options | 68.6 | 0.6 | — | 0.6 | 0.4 | — | 0.4 | ||||||||||||||||||||||||||||||||||||||||||||||||||||||||||||||||||
| Gross derivative assets/liabilities | Gross derivative assets/liabilities | $ | 423.3 | $ | 11.3 | $ | 434.6 | $ | 431.6 | $ | 2.4 | $ | 434.0 | Gross derivative assets/liabilities | $ | 423.3 | $ | 11.3 | $ | 434.6 | $ | 431.6 | $ | 2.4 | $ | 434.0 | ||||||||||||||||||||||||||||||||||||||||||||||||||||||||
| Less: Legally enforceable master netting agreements | Less: Legally enforceable master netting agreements | (344.9) | (344.9) | Less: Legally enforceable master netting agreements | (344.9) | (344.9) | ||||||||||||||||||||||||||||||||||||||||||||||||||||||||||||||||||||||||||||
| Less: Cash collateral received/paid | Less: Cash collateral received/paid | (42.5) | (43.6) | Less: Cash collateral received/paid | (42.5) | (43.6) | ||||||||||||||||||||||||||||||||||||||||||||||||||||||||||||||||||||||||||||
| Total derivative assets/liabilities | Total derivative assets/liabilities | $ | 47.2 | $ | 45.5 | Total derivative assets/liabilities | $ | 47.2 | $ | 45.5 | ||||||||||||||||||||||||||||||||||||||||||||||||||||||||||||||||||||||||
Bank of America | ||||||||
Offsetting of Derivatives (1) | Offsetting of Derivatives (1) | Offsetting of Derivatives (1) | ||||||||||||||||||||||||||||||||||||||||||||
| Derivative Assets | Derivative Liabilities | Derivative Assets | Derivative Liabilities | Derivative Assets | Derivative Liabilities | Derivative Assets | Derivative Liabilities | |||||||||||||||||||||||||||||||||||||||
| (Dollars in billions) | (Dollars in billions) | March 31, 2021 | December 31, 2020 | (Dollars in billions) | September 30, 2021 | December 31, 2020 | ||||||||||||||||||||||||||||||||||||||||
| Interest rate contracts | Interest rate contracts | Interest rate contracts | ||||||||||||||||||||||||||||||||||||||||||||
| Over-the-counter | Over-the-counter | $ | 196.7 | $ | 190.4 | $ | 247.7 | $ | 243.5 | Over-the-counter | $ | 177.6 | $ | 171.7 | $ | 247.7 | $ | 243.5 | ||||||||||||||||||||||||||||
| Exchange-traded | Exchange-traded | 0.1 | 0.1 | 0 | 0 | Exchange-traded | 0.1 | — | — | — | ||||||||||||||||||||||||||||||||||||
| Over-the-counter cleared | Over-the-counter cleared | 9.1 | 9.8 | 10.2 | 9.1 | Over-the-counter cleared | 9.6 | 9.8 | 10.2 | 9.1 | ||||||||||||||||||||||||||||||||||||
| Foreign exchange contracts | Foreign exchange contracts | Foreign exchange contracts | ||||||||||||||||||||||||||||||||||||||||||||
| Over-the-counter | Over-the-counter | 80.7 | 81.7 | 92.2 | 96.5 | Over-the-counter | 67.2 | 68.3 | 92.2 | 96.5 | ||||||||||||||||||||||||||||||||||||
| Over-the-counter cleared | Over-the-counter cleared | 1.2 | 1.2 | 1.4 | 1.3 | Over-the-counter cleared | 0.8 | 0.8 | 1.4 | 1.3 | ||||||||||||||||||||||||||||||||||||
| Equity contracts | Equity contracts | Equity contracts | ||||||||||||||||||||||||||||||||||||||||||||
| Over-the-counter | Over-the-counter | 33.1 | 29.4 | 31.3 | 28.3 | Over-the-counter | 30.7 | 32.5 | 31.3 | 28.3 | ||||||||||||||||||||||||||||||||||||
| Exchange-traded | Exchange-traded | 33.2 | 32.2 | 32.3 | 31.0 | Exchange-traded | 42.9 | 42.1 | 32.3 | 31.0 | ||||||||||||||||||||||||||||||||||||
| Commodity contracts | Commodity contracts | Commodity contracts | ||||||||||||||||||||||||||||||||||||||||||||
| Over-the-counter | Over-the-counter | 3.9 | 4.9 | 3.5 | 5.0 | Over-the-counter | 8.4 | 9.5 | 3.5 | 5.0 | ||||||||||||||||||||||||||||||||||||
| Exchange-traded | Exchange-traded | 0.8 | 1.0 | 0.7 | 0.7 | Exchange-traded | 1.9 | 2.4 | 0.7 | 0.7 | ||||||||||||||||||||||||||||||||||||
| Over-the-counter cleared | Over-the-counter cleared | 0.1 | 0.1 | 0 | 0 | Over-the-counter cleared | 0.1 | 0.1 | — | — | ||||||||||||||||||||||||||||||||||||
| Credit derivatives | Credit derivatives | Credit derivatives | ||||||||||||||||||||||||||||||||||||||||||||
| Over-the-counter | Over-the-counter | 6.4 | 6.0 | 5.2 | 5.6 | Over-the-counter | 5.8 | 5.5 | 5.2 | 5.6 | ||||||||||||||||||||||||||||||||||||
| Over-the-counter cleared | Over-the-counter cleared | 2.8 | 2.7 | 2.2 | 1.9 | Over-the-counter cleared | 2.4 | 2.5 | 2.2 | 1.9 | ||||||||||||||||||||||||||||||||||||
| Total gross derivative assets/liabilities, before netting | Total gross derivative assets/liabilities, before netting | Total gross derivative assets/liabilities, before netting | ||||||||||||||||||||||||||||||||||||||||||||
| Over-the-counter | Over-the-counter | 320.8 | 312.4 | 379.9 | 378.9 | Over-the-counter | 289.7 | 287.5 | 379.9 | 378.9 | ||||||||||||||||||||||||||||||||||||
| Exchange-traded | Exchange-traded | 34.1 | 33.3 | 33.0 | 31.7 | Exchange-traded | 44.9 | 44.5 | 33.0 | 31.7 | ||||||||||||||||||||||||||||||||||||
| Over-the-counter cleared | Over-the-counter cleared | 13.2 | 13.8 | 13.8 | 12.3 | Over-the-counter cleared | 12.9 | 13.2 | 13.8 | 12.3 | ||||||||||||||||||||||||||||||||||||
| Less: Legally enforceable master netting agreements and cash collateral received/paid | Less: Legally enforceable master netting agreements and cash collateral received/paid | Less: Legally enforceable master netting agreements and cash collateral received/paid | ||||||||||||||||||||||||||||||||||||||||||||
| Over-the-counter | Over-the-counter | (285.9) | (284.6) | (345.7) | (347.2) | Over-the-counter | (255.5) | (259.4) | (345.7) | (347.2) | ||||||||||||||||||||||||||||||||||||
| Exchange-traded | Exchange-traded | (32.1) | (32.1) | (29.5) | (29.5) | Exchange-traded | (42.9) | (42.9) | (29.5) | (29.5) | ||||||||||||||||||||||||||||||||||||
| Over-the-counter cleared | Over-the-counter cleared | (11.8) | (11.8) | (12.2) | (11.8) | Over-the-counter cleared | (12.5) | (12.6) | (12.2) | (11.8) | ||||||||||||||||||||||||||||||||||||
| Derivative assets/liabilities, after netting | Derivative assets/liabilities, after netting | 38.3 | 31.0 | 39.3 | 34.4 | Derivative assets/liabilities, after netting | 36.6 | 30.3 | 39.3 | 34.4 | ||||||||||||||||||||||||||||||||||||
Other gross derivative assets/liabilities (2) | Other gross derivative assets/liabilities (2) | 7.6 | 11.3 | 7.9 | 11.1 | Other gross derivative assets/liabilities (2) | 4.2 | 7.8 | 7.9 | 11.1 | ||||||||||||||||||||||||||||||||||||
| Total derivative assets/liabilities | Total derivative assets/liabilities | 45.9 | 42.3 | 47.2 | 45.5 | Total derivative assets/liabilities | 40.8 | 38.1 | 47.2 | 45.5 | ||||||||||||||||||||||||||||||||||||
Less: Financial instruments collateral (3) | Less: Financial instruments collateral (3) | (17.0) | (14.5) | (16.1) | (16.6) | Less: Financial instruments collateral (3) | (13.1) | (11.4) | (16.1) | (16.6) | ||||||||||||||||||||||||||||||||||||
| Total net derivative assets/liabilities | Total net derivative assets/liabilities | $ | 28.9 | $ | 27.8 | $ | 31.1 | $ | 28.9 | Total net derivative assets/liabilities | $ | 27.7 | $ | 26.7 | $ | 31.1 | $ | 28.9 | ||||||||||||||||||||||||||||
| Gains and Losses on Derivatives Designated as Fair Value Hedges | Gains and Losses on Derivatives Designated as Fair Value Hedges | Gains and Losses on Derivatives Designated as Fair Value Hedges | ||||||||||||||||||||||||||||||||||||||||||||||||||||||||||||||||||||||||||||||||||||||||||||||||||||||||||||||||||||||||||||||||
| Three Months Ended March 31 | ||||||||||||||||||||||||||||||||||||||||||||||||||||||||||||||||||||||||||||||||||||||||||||||||||||||||||||||||||||||||||||||||||
| 2021 | 2020 | Three Months Ended September 30, 2021 | Three Months Ended September 30, 2020 | |||||||||||||||||||||||||||||||||||||||||||||||||||||||||||||||||||||||||||||||||||||||||||||||||||||||||||||||||||||||||||||||
| (Dollars in millions) | (Dollars in millions) | Derivative | Hedged Item | Derivative | Hedged Item | (Dollars in millions) | Derivative | Hedged Item | Derivative | Hedged Item | ||||||||||||||||||||||||||||||||||||||||||||||||||||||||||||||||||||||||||||||||||||||||||||||||||||||||||||||||||||||||
Interest rate risk on long-term debt (1) | Interest rate risk on long-term debt (1) | $ | (8,063) | $ | 8,002 | $ | 10,334 | $ | (10,276) | Interest rate risk on long-term debt (1) | $ | (1,658) | $ | 1,660 | $ | (1,523) | $ | 1,473 | ||||||||||||||||||||||||||||||||||||||||||||||||||||||||||||||||||||||||||||||||||||||||||||||||||||||||||||||||
Interest rate and foreign currency risk on long-term debt (2) | Interest rate and foreign currency risk on long-term debt (2) | (28) | 26 | 505 | (491) | Interest rate and foreign currency risk on long-term debt (2) | (49) | 46 | 79 | (87) | ||||||||||||||||||||||||||||||||||||||||||||||||||||||||||||||||||||||||||||||||||||||||||||||||||||||||||||||||||||||||
Interest rate risk on available-for-sale securities (3) | Interest rate risk on available-for-sale securities (3) | 5,241 | (5,150) | (350) | 342 | Interest rate risk on available-for-sale securities (3) | 867 | (859) | 139 | (139) | ||||||||||||||||||||||||||||||||||||||||||||||||||||||||||||||||||||||||||||||||||||||||||||||||||||||||||||||||||||||||
| Total | Total | $ | (2,850) | $ | 2,878 | $ | 10,489 | $ | (10,425) | Total | $ | (840) | $ | 847 | $ | (1,305) | $ | 1,247 | ||||||||||||||||||||||||||||||||||||||||||||||||||||||||||||||||||||||||||||||||||||||||||||||||||||||||||||||||
| ` | ` | Nine Months Ended September 30, 2021 | Nine Months Ended September 30, 2020 | |||||||||||||||||||||||||||||||||||||||||||||||||||||||||||||||||||||||||||||||||||||||||||||||||||||||||||||||||||||||||||||||
| Derivative | Hedged Item | Derivative | Hedged Item | |||||||||||||||||||||||||||||||||||||||||||||||||||||||||||||||||||||||||||||||||||||||||||||||||||||||||||||||||||||||||||||||
Interest rate risk on long-term debt (1) | Interest rate risk on long-term debt (1) | $ | (6,237) | $ | 6,208 | $ | 9,286 | $ | (9,403) | |||||||||||||||||||||||||||||||||||||||||||||||||||||||||||||||||||||||||||||||||||||||||||||||||||||||||||||||||||||||||
Interest rate and foreign currency risk on long-term debt (2) | Interest rate and foreign currency risk on long-term debt (2) | (72) | 67 | 644 | (638) | |||||||||||||||||||||||||||||||||||||||||||||||||||||||||||||||||||||||||||||||||||||||||||||||||||||||||||||||||||||||||||||
Interest rate risk on available-for-sale securities (3) | Interest rate risk on available-for-sale securities (3) | 4,245 | (4,184) | (572) | 559 | |||||||||||||||||||||||||||||||||||||||||||||||||||||||||||||||||||||||||||||||||||||||||||||||||||||||||||||||||||||||||||||
| Total | Total | $ | (2,064) | $ | 2,091 | $ | 9,358 | $ | (9,482) | |||||||||||||||||||||||||||||||||||||||||||||||||||||||||||||||||||||||||||||||||||||||||||||||||||||||||||||||||||||||||
| Designated Fair Value Hedged Assets and Liabilities | Designated Fair Value Hedged Assets and Liabilities | Designated Fair Value Hedged Assets and Liabilities | ||||||||||||||||||||||||||||||||||||||||||||||||||||||||||||||||||||||||||
| March 31, 2021 | December 31, 2020 | September 30, 2021 | December 31, 2020 | |||||||||||||||||||||||||||||||||||||||||||||||||||||||||||||||||||||||||
| (Dollars in millions) | (Dollars in millions) | Carrying Value | Cumulative Fair Value Adjustments (1) | Carrying Value | Cumulative Fair Value Adjustments (1) | (Dollars in millions) | Carrying Value | Cumulative Fair Value Adjustments (1) | Carrying Value | Cumulative Fair Value Adjustments (1) | ||||||||||||||||||||||||||||||||||||||||||||||||||||||||||||||||||
Long-term debt (2) | Long-term debt (2) | $ | 143,897 | $ | 2,304 | $ | 150,556 | $ | 8,910 | Long-term debt (2) | $ | 177,111 | $ | 4,933 | $ | 150,556 | $ | 8,910 | ||||||||||||||||||||||||||||||||||||||||||||||||||||||||||
Available-for-sale debt securities (2, 3, 4) | Available-for-sale debt securities (2, 3, 4) | 152,388 | (4,881) | 116,252 | 114 | Available-for-sale debt securities (2, 3, 4) | 178,130 | (2,120) | 116,252 | 114 | ||||||||||||||||||||||||||||||||||||||||||||||||||||||||||||||||||
Trading account assets (5) | Trading account assets (5) | 660 | 0 | 427 | 15 | Trading account assets (5) | 590 | — | 427 | 15 | ||||||||||||||||||||||||||||||||||||||||||||||||||||||||||||||||||
| Gains and Losses on Derivatives Designated as Cash Flow and Net Investment Hedges | Gains and Losses on Derivatives Designated as Cash Flow and Net Investment Hedges | Gains and Losses on Derivatives Designated as Cash Flow and Net Investment Hedges | ||||||||||||||||||||||||||||||||||||||||||||||||||||||||||||||||||||||||||||||||||||||||||||||||||||||||||||||||||||||||||
| Three Months Ended March 31 | ||||||||||||||||||||||||||||||||||||||||||||||||||||||||||||||||||||||||||||||||||||||||||||||||||||||||||||||||||||||||||||
| 2021 | 2020 | |||||||||||||||||||||||||||||||||||||||||||||||||||||||||||||||||||||||||||||||||||||||||||||||||||||||||||||||||||||||||||
| Gains (Losses) Recognized in Accumulated OCI on Derivatives | Gains (Losses) in Income Reclassified from Accumulated OCI | Gains (Losses) Recognized in Accumulated OCI on Derivatives | Gains (Losses) in Income Reclassified from Accumulated OCI | |||||||||||||||||||||||||||||||||||||||||||||||||||||||||||||||||||||||||||||||||||||||||||||||||||||||||||||||||||||||||
| (Dollars in millions, amounts pretax) | (Dollars in millions, amounts pretax) | Gains (Losses) Recognized in Accumulated OCI on Derivatives | Gains (Losses) in Income Reclassified from Accumulated OCI | Gains (Losses) Recognized in Accumulated OCI on Derivatives | Gains (Losses) in Income Reclassified from Accumulated OCI | (Dollars in millions, amounts pretax) | Three Months Ended September 30, 2021 | Nine Months Ended September 30, 2021 | ||||||||||||||||||||||||||||||||||||||||||||||||||||||||||||||||||||||||||||||||||||||||||||||||||||||||||||||||||||
| Cash flow hedges | Cash flow hedges | Cash flow hedges | ||||||||||||||||||||||||||||||||||||||||||||||||||||||||||||||||||||||||||||||||||||||||||||||||||||||||||||||||||||||||||
Interest rate risk on variable-rate assets (1) | Interest rate risk on variable-rate assets (1) | $ | (1,057) | $ | 37 | $ | 591 | $ | (26) | Interest rate risk on variable-rate assets (1) | $ | (539) | $ | 38 | $ | (1,115) | $ | 111 | ||||||||||||||||||||||||||||||||||||||||||||||||||||||||||||||||||||||||||||||||||||||||||||||||||||||||||
Price risk on forecasted MBS purchases (1) | Price risk on forecasted MBS purchases (1) | (393) | 9 | 0 | 0 | Price risk on forecasted MBS purchases (1) | 29 | 5 | (272) | 20 | ||||||||||||||||||||||||||||||||||||||||||||||||||||||||||||||||||||||||||||||||||||||||||||||||||||||||||||||||||
Price risk on certain compensation plans (2) | Price risk on certain compensation plans (2) | 24 | 12 | (82) | 0 | Price risk on certain compensation plans (2) | (2) | 14 | 57 | 40 | ||||||||||||||||||||||||||||||||||||||||||||||||||||||||||||||||||||||||||||||||||||||||||||||||||||||||||||||||||
| Total | Total | $ | (1,426) | $ | 58 | $ | 509 | $ | (26) | Total | $ | (512) | $ | 57 | $ | (1,330) | $ | 171 | ||||||||||||||||||||||||||||||||||||||||||||||||||||||||||||||||||||||||||||||||||||||||||||||||||||||||||
| Net investment hedges | Net investment hedges | Net investment hedges | ||||||||||||||||||||||||||||||||||||||||||||||||||||||||||||||||||||||||||||||||||||||||||||||||||||||||||||||||||||||||||
Foreign exchange risk (3) | Foreign exchange risk (3) | $ | 727 | $ | 0 | $ | 1,368 | $ | 0 | Foreign exchange risk (3) | $ | 642 | $ | — | $ | 1,145 | $ | — | ||||||||||||||||||||||||||||||||||||||||||||||||||||||||||||||||||||||||||||||||||||||||||||||||||||||||||
| Three Months Ended September 30, 2020 | Nine Months Ended September 30, 2020 | |||||||||||||||||||||||||||||||||||||||||||||||||||||||||||||||||||||||||||||||||||||||||||||||||||||||||||||||||||||||||||
| Cash flow hedges | Cash flow hedges | |||||||||||||||||||||||||||||||||||||||||||||||||||||||||||||||||||||||||||||||||||||||||||||||||||||||||||||||||||||||||||
Interest rate risk on variable-rate assets (1) | Interest rate risk on variable-rate assets (1) | $ | (101) | $ | 5 | $ | 810 | $ | (44) | |||||||||||||||||||||||||||||||||||||||||||||||||||||||||||||||||||||||||||||||||||||||||||||||||||||||||||||||||||
Price risk on forecasted MBS purchases (1) | Price risk on forecasted MBS purchases (1) | 184 | 3 | 184 | 3 | |||||||||||||||||||||||||||||||||||||||||||||||||||||||||||||||||||||||||||||||||||||||||||||||||||||||||||||||||||||||
Price risk on certain compensation plans (2) | Price risk on certain compensation plans (2) | 32 | 5 | 23 | 5 | |||||||||||||||||||||||||||||||||||||||||||||||||||||||||||||||||||||||||||||||||||||||||||||||||||||||||||||||||||||||
| Total | Total | $ | 115 | $ | 13 | $ | 1,017 | $ | (36) | |||||||||||||||||||||||||||||||||||||||||||||||||||||||||||||||||||||||||||||||||||||||||||||||||||||||||||||||||||
| Net investment hedges | Net investment hedges | |||||||||||||||||||||||||||||||||||||||||||||||||||||||||||||||||||||||||||||||||||||||||||||||||||||||||||||||||||||||||||
Foreign exchange risk (3) | Foreign exchange risk (3) | $ | (703) | $ | — | $ | 265 | $ | 1 | |||||||||||||||||||||||||||||||||||||||||||||||||||||||||||||||||||||||||||||||||||||||||||||||||||||||||||||||||||
Bank of America | ||||||||
| Gains and Losses on Other Risk Management Derivatives | Gains and Losses on Other Risk Management Derivatives | Gains and Losses on Other Risk Management Derivatives | ||||||||||||||||||||||||||||||||||||||||||||||||||||||||
| Three Months Ended March 31 | Three Months Ended September 30 | Nine Months Ended September 30 | ||||||||||||||||||||||||||||||||||||||||||||||||||||||||
| (Dollars in millions) | (Dollars in millions) | 2021 | 2020 | (Dollars in millions) | 2021 | 2020 | 2021 | 2020 | ||||||||||||||||||||||||||||||||||||||||||||||||||
Interest rate risk on mortgage activities (1, 2) | Interest rate risk on mortgage activities (1, 2) | $ | (190) | $ | 379 | Interest rate risk on mortgage activities (1, 2) | $ | 10 | $ | 73 | $ | (49) | $ | 601 | ||||||||||||||||||||||||||||||||||||||||||||
Credit risk on loans (2) | Credit risk on loans (2) | (17) | 88 | Credit risk on loans (2) | (9) | (28) | (40) | (6) | ||||||||||||||||||||||||||||||||||||||||||||||||||
Interest rate and foreign currency risk on asset and liability management activities (3) | Interest rate and foreign currency risk on asset and liability management activities (3) | 1,261 | 1,528 | Interest rate and foreign currency risk on asset and liability management activities (3) | 552 | (2,571) | 1,495 | (2,060) | ||||||||||||||||||||||||||||||||||||||||||||||||||
Price risk on certain compensation plans (4) | Price risk on certain compensation plans (4) | 280 | (757) | Price risk on certain compensation plans (4) | (23) | 263 | 575 | 109 | ||||||||||||||||||||||||||||||||||||||||||||||||||
| Sales and Trading Revenue | Sales and Trading Revenue | Sales and Trading Revenue | ||||||||||||||||||||||||||||||||||||||||||||||||||||||||||||||||||||||||||||||||||||||||||||
| Market making and similar activities | Net Interest Income | Other (1) | Total | Market making and similar activities | Net Interest Income | Other (1) | Total | Market making and similar activities | Net Interest Income | Other (1) | Total | |||||||||||||||||||||||||||||||||||||||||||||||||||||||||||||||||||||||||||||||||||
| (Dollars in millions) | (Dollars in millions) | Three Months Ended March 31, 2021 | (Dollars in millions) | Three Months Ended September 30, 2021 | Nine Months Ended September 30, 2021 | |||||||||||||||||||||||||||||||||||||||||||||||||||||||||||||||||||||||||||||||||||||||||
| Interest rate risk | Interest rate risk | $ | 372 | $ | 463 | $ | 57 | $ | 892 | Interest rate risk | $ | 180 | $ | 442 | $ | 43 | $ | 665 | $ | 590 | $ | 1,350 | $ | 141 | $ | 2,081 | ||||||||||||||||||||||||||||||||||||||||||||||||||||||||||||||||||||
| Foreign exchange risk | Foreign exchange risk | 407 | (18) | 2 | 391 | Foreign exchange risk | 345 | (22) | 2 | 325 | 1,082 | (62) | 7 | 1,027 | ||||||||||||||||||||||||||||||||||||||||||||||||||||||||||||||||||||||||||||||||
| Equity risk | Equity risk | 1,282 | 36 | 516 | 1,834 | Equity risk | 1,196 | (28) | 433 | 1,601 | 3,657 | 7 | 1,389 | 5,053 | ||||||||||||||||||||||||||||||||||||||||||||||||||||||||||||||||||||||||||||||||
| Credit risk | Credit risk | 802 | 363 | 114 | 1,279 | Credit risk | 248 | 458 | 158 | 864 | 1,491 | 1,263 | 446 | 3,200 | ||||||||||||||||||||||||||||||||||||||||||||||||||||||||||||||||||||||||||||||||
Other risk (2) | Other risk (2) | 607 | (18) | 20 | 609 | Other risk (2) | 45 | (30) | 45 | 60 | 627 | (58) | 91 | 660 | ||||||||||||||||||||||||||||||||||||||||||||||||||||||||||||||||||||||||||||||||
| Total sales and trading revenue | Total sales and trading revenue | $ | 3,470 | $ | 826 | $ | 709 | $ | 5,005 | Total sales and trading revenue | $ | 2,014 | $ | 820 | $ | 681 | $ | 3,515 | $ | 7,447 | $ | 2,500 | $ | 2,074 | $ | 12,021 | ||||||||||||||||||||||||||||||||||||||||||||||||||||||||||||||||||||
| Three Months Ended March 31, 2020 | Three Months Ended September 30, 2020 | Nine Months Ended September 30, 2020 | ||||||||||||||||||||||||||||||||||||||||||||||||||||||||||||||||||||||||||||||||||||||||||||
| Interest rate risk | Interest rate risk | $ | 1,495 | $ | 617 | $ | 73 | $ | 2,185 | Interest rate risk | $ | 85 | $ | 545 | $ | 57 | $ | 687 | $ | 2,249 | $ | 1,754 | $ | 175 | $ | 4,178 | ||||||||||||||||||||||||||||||||||||||||||||||||||||||||||||||||||||
| Foreign exchange risk | Foreign exchange risk | 465 | 5 | 5 | 475 | Foreign exchange risk | 338 | (10) | 4 | 332 | 1,153 | (8) | (2) | 1,143 | ||||||||||||||||||||||||||||||||||||||||||||||||||||||||||||||||||||||||||||||||
| Equity risk | Equity risk | 1,259 | (123) | 519 | 1,655 | Equity risk | 816 | (7) | 391 | 1,200 | 2,805 | (99) | 1,361 | 4,067 | ||||||||||||||||||||||||||||||||||||||||||||||||||||||||||||||||||||||||||||||||
| Credit risk | Credit risk | (379) | 443 | 34 | 98 | Credit risk | 413 | 401 | 73 | 887 | 570 | 1,336 | 253 | 2,159 | ||||||||||||||||||||||||||||||||||||||||||||||||||||||||||||||||||||||||||||||||
Other risk (2) | Other risk (2) | 133 | 21 | 6 | 160 | Other risk (2) | 73 | (7) | 14 | 80 | 280 | 21 | 24 | 325 | ||||||||||||||||||||||||||||||||||||||||||||||||||||||||||||||||||||||||||||||||
| Total sales and trading revenue | Total sales and trading revenue | $ | 2,973 | $ | 963 | $ | 637 | $ | 4,573 | Total sales and trading revenue | $ | 1,725 | $ | 922 | $ | 539 | $ | 3,186 | $ | 7,057 | $ | 3,004 | $ | 1,811 | $ | 11,872 | ||||||||||||||||||||||||||||||||||||||||||||||||||||||||||||||||||||
59Bank of America | ||||||||
| Credit Derivative Instruments | Credit Derivative Instruments | Credit Derivative Instruments | ||||||||||||||||||||||||||||||||||||||||||||||||||||||||
| Less than One Year | One to Three Years | Three to Five Years | Over Five Years | Total | Less than One Year | One to Three Years | Three to Five Years | Over Five Years | Total | |||||||||||||||||||||||||||||||||||||||||||||||||
| March 31, 2021 | September 30, 2021 | |||||||||||||||||||||||||||||||||||||||||||||||||||||||||
| (Dollars in millions) | (Dollars in millions) | Carrying Value | (Dollars in millions) | Carrying Value | ||||||||||||||||||||||||||||||||||||||||||||||||||||||
| Credit default swaps: | Credit default swaps: | Credit default swaps: | ||||||||||||||||||||||||||||||||||||||||||||||||||||||||
| Investment grade | Investment grade | $ | 0 | $ | 3 | $ | 52 | $ | 47 | $ | 102 | Investment grade | $ | — | $ | 1 | $ | 40 | $ | 73 | $ | 114 | ||||||||||||||||||||||||||||||||||||
| Non-investment grade | Non-investment grade | 43 | 153 | 474 | 1,084 | 1,754 | Non-investment grade | 8 | 119 | 426 | 859 | 1,412 | ||||||||||||||||||||||||||||||||||||||||||||||
| Total | Total | 43 | 156 | 526 | 1,131 | 1,856 | Total | 8 | 120 | 466 | 932 | 1,526 | ||||||||||||||||||||||||||||||||||||||||||||||
| Total return swaps/options: | Total return swaps/options: | Total return swaps/options: | ||||||||||||||||||||||||||||||||||||||||||||||||||||||||
| Investment grade | Investment grade | 32 | 0 | 0 | 0 | 32 | Investment grade | 18 | — | — | — | 18 | ||||||||||||||||||||||||||||||||||||||||||||||
| Non-investment grade | Non-investment grade | 129 | 266 | 0 | 0 | 395 | Non-investment grade | 88 | 353 | 5 | — | 446 | ||||||||||||||||||||||||||||||||||||||||||||||
| Total | Total | 161 | 266 | 0 | 0 | 427 | Total | 106 | 353 | 5 | — | 464 | ||||||||||||||||||||||||||||||||||||||||||||||
| Total credit derivatives | Total credit derivatives | $ | 204 | $ | 422 | $ | 526 | $ | 1,131 | $ | 2,283 | Total credit derivatives | $ | 114 | $ | 473 | $ | 471 | $ | 932 | $ | 1,990 | ||||||||||||||||||||||||||||||||||||
| Credit-related notes: | Credit-related notes: | Credit-related notes: | ||||||||||||||||||||||||||||||||||||||||||||||||||||||||
| Investment grade | Investment grade | $ | 0 | $ | 0 | $ | 0 | $ | 341 | $ | 341 | Investment grade | $ | — | $ | — | $ | 42 | $ | 274 | $ | 316 | ||||||||||||||||||||||||||||||||||||
| Non-investment grade | Non-investment grade | 7 | 1 | 10 | 1,329 | 1,347 | Non-investment grade | 5 | — | 14 | 1,328 | 1,347 | ||||||||||||||||||||||||||||||||||||||||||||||
| Total credit-related notes | Total credit-related notes | $ | 7 | $ | 1 | $ | 10 | $ | 1,670 | $ | 1,688 | Total credit-related notes | $ | 5 | $ | — | $ | 56 | $ | 1,602 | $ | 1,663 | ||||||||||||||||||||||||||||||||||||
| Maximum Payout/Notional | Maximum Payout/Notional | |||||||||||||||||||||||||||||||||||||||||||||||||||||||||
| Credit default swaps: | Credit default swaps: | Credit default swaps: | ||||||||||||||||||||||||||||||||||||||||||||||||||||||||
| Investment grade | Investment grade | $ | 33,138 | $ | 74,361 | $ | 99,302 | $ | 27,974 | $ | 234,775 | Investment grade | $ | 33,007 | $ | 74,896 | $ | 110,525 | $ | 37,271 | $ | 255,699 | ||||||||||||||||||||||||||||||||||||
| Non-investment grade | Non-investment grade | 13,206 | 29,761 | 47,496 | 15,366 | 105,829 | Non-investment grade | 11,254 | 30,197 | 45,994 | 15,197 | 102,642 | ||||||||||||||||||||||||||||||||||||||||||||||
| Total | Total | 46,344 | 104,122 | 146,798 | 43,340 | 340,604 | Total | 44,261 | 105,093 | 156,519 | 52,468 | 358,341 | ||||||||||||||||||||||||||||||||||||||||||||||
| Total return swaps/options: | Total return swaps/options: | Total return swaps/options: | ||||||||||||||||||||||||||||||||||||||||||||||||||||||||
| Investment grade | Investment grade | 48,002 | 64 | 128 | 0 | 48,194 | Investment grade | 26,711 | 64 | 78 | — | 26,853 | ||||||||||||||||||||||||||||||||||||||||||||||
| Non-investment grade | Non-investment grade | 16,047 | 15,217 | 28 | 5 | 31,297 | Non-investment grade | 18,900 | 13,015 | 536 | 16 | 32,467 | ||||||||||||||||||||||||||||||||||||||||||||||
| Total | Total | 64,049 | 15,281 | 156 | 5 | 79,491 | Total | 45,611 | 13,079 | 614 | 16 | 59,320 | ||||||||||||||||||||||||||||||||||||||||||||||
| Total credit derivatives | Total credit derivatives | $ | 110,393 | $ | 119,403 | $ | 146,954 | $ | 43,345 | $ | 420,095 | Total credit derivatives | $ | 89,872 | $ | 118,172 | $ | 157,133 | $ | 52,484 | $ | 417,661 | ||||||||||||||||||||||||||||||||||||
| December 31, 2020 | December 31, 2020 | |||||||||||||||||||||||||||||||||||||||||||||||||||||||||
| Carrying Value | Carrying Value | |||||||||||||||||||||||||||||||||||||||||||||||||||||||||
| Credit default swaps: | Credit default swaps: | Credit default swaps: | ||||||||||||||||||||||||||||||||||||||||||||||||||||||||
| Investment grade | Investment grade | $ | 0 | $ | 1 | $ | 35 | $ | 94 | $ | 130 | Investment grade | $ | — | $ | 1 | $ | 35 | $ | 94 | $ | 130 | ||||||||||||||||||||||||||||||||||||
| Non-investment grade | Non-investment grade | 26 | 233 | 364 | 1,163 | 1,786 | Non-investment grade | 26 | 233 | 364 | 1,163 | 1,786 | ||||||||||||||||||||||||||||||||||||||||||||||
| Total | Total | 26 | 234 | 399 | 1,257 | 1,916 | Total | 26 | 234 | 399 | 1,257 | 1,916 | ||||||||||||||||||||||||||||||||||||||||||||||
| Total return swaps/options: | Total return swaps/options: | Total return swaps/options: | ||||||||||||||||||||||||||||||||||||||||||||||||||||||||
| Investment grade | Investment grade | 21 | 4 | 0 | 0 | 25 | Investment grade | 21 | 4 | — | — | 25 | ||||||||||||||||||||||||||||||||||||||||||||||
| Non-investment grade | Non-investment grade | 345 | 0 | 0 | 0 | 345 | Non-investment grade | 345 | — | — | — | 345 | ||||||||||||||||||||||||||||||||||||||||||||||
| Total | Total | 366 | 4 | 0 | 0 | 370 | Total | 366 | 4 | — | — | 370 | ||||||||||||||||||||||||||||||||||||||||||||||
| Total credit derivatives | Total credit derivatives | $ | 392 | $ | 238 | $ | 399 | $ | 1,257 | $ | 2,286 | Total credit derivatives | $ | 392 | $ | 238 | $ | 399 | $ | 1,257 | $ | 2,286 | ||||||||||||||||||||||||||||||||||||
| Credit-related notes: | Credit-related notes: | Credit-related notes: | ||||||||||||||||||||||||||||||||||||||||||||||||||||||||
| Investment grade | Investment grade | $ | 0 | $ | 0 | $ | 0 | $ | 572 | $ | 572 | Investment grade | $ | — | $ | — | $ | — | $ | 572 | $ | 572 | ||||||||||||||||||||||||||||||||||||
| Non-investment grade | Non-investment grade | 64 | 2 | 10 | 947 | 1,023 | Non-investment grade | 64 | 2 | 10 | 947 | 1,023 | ||||||||||||||||||||||||||||||||||||||||||||||
| Total credit-related notes | Total credit-related notes | $ | 64 | $ | 2 | $ | 10 | $ | 1,519 | $ | 1,595 | Total credit-related notes | $ | 64 | $ | 2 | $ | 10 | $ | 1,519 | $ | 1,595 | ||||||||||||||||||||||||||||||||||||
| Maximum Payout/Notional | Maximum Payout/Notional | |||||||||||||||||||||||||||||||||||||||||||||||||||||||||
| Credit default swaps: | Credit default swaps: | Credit default swaps: | ||||||||||||||||||||||||||||||||||||||||||||||||||||||||
| Investment grade | Investment grade | $ | 33,474 | $ | 75,731 | $ | 87,218 | $ | 16,822 | $ | 213,245 | Investment grade | $ | 33,474 | $ | 75,731 | $ | 87,218 | $ | 16,822 | $ | 213,245 | ||||||||||||||||||||||||||||||||||||
| Non-investment grade | Non-investment grade | 13,664 | 28,770 | 35,978 | 9,852 | 88,264 | Non-investment grade | 13,664 | 28,770 | 35,978 | 9,852 | 88,264 | ||||||||||||||||||||||||||||||||||||||||||||||
| Total | Total | 47,138 | 104,501 | 123,196 | 26,674 | 301,509 | Total | 47,138 | 104,501 | 123,196 | 26,674 | 301,509 | ||||||||||||||||||||||||||||||||||||||||||||||
| Total return swaps/options: | Total return swaps/options: | Total return swaps/options: | ||||||||||||||||||||||||||||||||||||||||||||||||||||||||
| Investment grade | Investment grade | 30,961 | 1,061 | 77 | 0 | 32,099 | Investment grade | 30,961 | 1,061 | 77 | — | 32,099 | ||||||||||||||||||||||||||||||||||||||||||||||
| Non-investment grade | Non-investment grade | 36,128 | 364 | 27 | 5 | 36,524 | Non-investment grade | 36,128 | 364 | 27 | 5 | 36,524 | ||||||||||||||||||||||||||||||||||||||||||||||
| Total | Total | 67,089 | 1,425 | 104 | 5 | 68,623 | Total | 67,089 | 1,425 | 104 | 5 | 68,623 | ||||||||||||||||||||||||||||||||||||||||||||||
| Total credit derivatives | Total credit derivatives | $ | 114,227 | $ | 105,926 | $ | 123,300 | $ | 26,679 | $ | 370,132 | Total credit derivatives | $ | 114,227 | $ | 105,926 | $ | 123,300 | $ | 26,679 | $ | 370,132 | ||||||||||||||||||||||||||||||||||||
Bank of America60 | ||||||||
| Additional Collateral Required to be Posted Upon Downgrade at March 31, 2021 | ||||||||||||||||||||||
| Additional Collateral Required to be Posted and Derivative Liabilities Subject to Unilateral Termination Upon Downgrade at September 30, 2021 | Additional Collateral Required to be Posted and Derivative Liabilities Subject to Unilateral Termination Upon Downgrade at September 30, 2021 | |||||||||||||||||||||
| (Dollars in millions) | (Dollars in millions) | One incremental notch | Second incremental notch | (Dollars in millions) | One incremental notch | Second incremental notch | ||||||||||||||||
| Additional collateral required to be posted upon downgrade | Additional collateral required to be posted upon downgrade | |||||||||||||||||||||
| Bank of America Corporation | Bank of America Corporation | $ | 241 | $ | 724 | Bank of America Corporation | $ | 342 | $ | 802 | ||||||||||||
Bank of America, N.A. and subsidiaries (1) | Bank of America, N.A. and subsidiaries (1) | 66 | 584 | Bank of America, N.A. and subsidiaries (1) | 69 | 610 | ||||||||||||||||
| Derivative liabilities subject to unilateral termination upon downgrade | Derivative liabilities subject to unilateral termination upon downgrade | |||||||||||||||||||||
| Derivative liabilities | Derivative liabilities | $ | 22 | $ | 764 | |||||||||||||||||
| Collateral posted | Collateral posted | 9 | 559 | |||||||||||||||||||
| Derivative Liabilities Subject to Unilateral Termination Upon Downgrade at March 31, 2021 | |||||||||||
| (Dollars in millions) | One incremental notch | Second incremental notch | |||||||||
| Derivative liabilities | $ | 32 | $ | 585 | |||||||
| Collateral posted | 19 | 339 | |||||||||
Valuation Adjustments Gains (Losses) on Derivatives (1) | Valuation Adjustments Gains (Losses) on Derivatives (1) | Valuation Adjustments Gains (Losses) on Derivatives (1) | ||||||||||||||||||||||||||||||||
| Three Months Ended March 31 | Three Months Ended September 30 | |||||||||||||||||||||||||||||||||
| (Dollars in millions) | (Dollars in millions) | 2021 | 2020 | (Dollars in millions) | 2021 | 2020 | ||||||||||||||||||||||||||||
| Derivative assets (CVA) | Derivative assets (CVA) | $ | 155 | $ | (784) | Derivative assets (CVA) | $ | 54 | $ | 174 | ||||||||||||||||||||||||
| Derivative assets/liabilities (FVA) | Derivative assets/liabilities (FVA) | 48 | (156) | Derivative assets/liabilities (FVA) | 19 | 27 | ||||||||||||||||||||||||||||
| Derivative liabilities (DVA) | Derivative liabilities (DVA) | 23 | 414 | Derivative liabilities (DVA) | (5) | (105) | ||||||||||||||||||||||||||||
| Nine Months Ended September 30 | ||||||||||||||||||||||||||||||||||
| (Dollars in millions) | (Dollars in millions) | 2021 | 2020 | |||||||||||||||||||||||||||||||
| Derivative assets (CVA) | Derivative assets (CVA) | $ | 212 | $ | (334) | |||||||||||||||||||||||||||||
| Derivative assets/liabilities (FVA) | Derivative assets/liabilities (FVA) | 34 | (60) | |||||||||||||||||||||||||||||||
| Derivative liabilities (DVA) | Derivative liabilities (DVA) | (13) | 53 | |||||||||||||||||||||||||||||||
| Debt Securities | Debt Securities | Debt Securities | ||||||||||||||||||||||||||||||||||||||||||||||||||||||||||||||||||||
| Amortized Cost | Gross Unrealized Gains | Gross Unrealized Losses | Fair Value | Amortized Cost | Gross Unrealized Gains | Gross Unrealized Losses | Fair Value | Amortized Cost | Gross Unrealized Gains | Gross Unrealized Losses | Fair Value | |||||||||||||||||||||||||||||||||||||||||||||||||||||||||||
| (Dollars in millions) | (Dollars in millions) | March 31, 2021 | (Dollars in millions) | September 30, 2021 | December 31, 2020 | |||||||||||||||||||||||||||||||||||||||||||||||||||||||||||||||||
| Available-for-sale debt securities | Available-for-sale debt securities | Available-for-sale debt securities | ||||||||||||||||||||||||||||||||||||||||||||||||||||||||||||||||||||
| Mortgage-backed securities: | Mortgage-backed securities: | Mortgage-backed securities: | ||||||||||||||||||||||||||||||||||||||||||||||||||||||||||||||||||||
| Agency | Agency | $ | 52,395 | $ | 2,169 | $ | (30) | $ | 54,534 | Agency | $ | 50,756 | $ | 1,631 | $ | (90) | $ | 52,297 | $ | 59,518 | $ | 2,370 | $ | (39) | $ | 61,849 | ||||||||||||||||||||||||||||||||||||||||||||
| Agency-collateralized mortgage obligations | Agency-collateralized mortgage obligations | 4,618 | 132 | (17) | 4,733 | Agency-collateralized mortgage obligations | 3,684 | 103 | (11) | 3,776 | 5,112 | 161 | (13) | 5,260 | ||||||||||||||||||||||||||||||||||||||||||||||||||||||||
| Commercial | Commercial | 16,013 | 840 | (53) | 16,800 | Commercial | 18,091 | 778 | (50) | 18,819 | 15,470 | 1,025 | (4) | 16,491 | ||||||||||||||||||||||||||||||||||||||||||||||||||||||||
Non-agency residential (1) | Non-agency residential (1) | 871 | 30 | (43) | 858 | Non-agency residential (1) | 799 | 39 | (35) | 803 | 899 | 127 | (17) | 1,009 | ||||||||||||||||||||||||||||||||||||||||||||||||||||||||
| Total mortgage-backed securities | Total mortgage-backed securities | 73,897 | 3,171 | (143) | 76,925 | Total mortgage-backed securities | 73,330 | 2,551 | (186) | 75,695 | 80,999 | 3,683 | (73) | 84,609 | ||||||||||||||||||||||||||||||||||||||||||||||||||||||||
| U.S. Treasury and agency securities | 158,352 | 2,161 | (492) | 160,021 | ||||||||||||||||||||||||||||||||||||||||||||||||||||||||||||||||||
| U.S. Treasury and government agencies | U.S. Treasury and government agencies | 167,419 | 1,869 | (163) | 169,125 | 114,157 | 2,236 | (13) | 116,380 | |||||||||||||||||||||||||||||||||||||||||||||||||||||||||||||
| Non-U.S. securities | Non-U.S. securities | 14,767 | 7 | (6) | 14,768 | Non-U.S. securities | 12,289 | 4 | — | 12,293 | 14,009 | 15 | (7) | 14,017 | ||||||||||||||||||||||||||||||||||||||||||||||||||||||||
| Other taxable securities, substantially all asset-backed securities | 2,519 | 43 | (4) | 2,558 | ||||||||||||||||||||||||||||||||||||||||||||||||||||||||||||||||||
| Total taxable securities | 249,535 | 5,382 | (645) | 254,272 | ||||||||||||||||||||||||||||||||||||||||||||||||||||||||||||||||||
| Other taxable securities | Other taxable securities | 2,589 | 45 | (1) | 2,633 | 2,656 | 61 | (6) | 2,711 | |||||||||||||||||||||||||||||||||||||||||||||||||||||||||||||
| Tax-exempt securities | Tax-exempt securities | 16,023 | 328 | (10) | 16,341 | Tax-exempt securities | 15,312 | 321 | (21) | 15,612 | 16,417 | 389 | (32) | 16,774 | ||||||||||||||||||||||||||||||||||||||||||||||||||||||||
| Total available-for-sale debt securities | Total available-for-sale debt securities | 265,558 | 5,710 | (655) | 270,613 | Total available-for-sale debt securities | 270,939 | 4,790 | (371) | 275,358 | 228,238 | 6,384 | (131) | 234,491 | ||||||||||||||||||||||||||||||||||||||||||||||||||||||||
Other debt securities carried at fair value (2) | Other debt securities carried at fair value (2) | 10,322 | 143 | (166) | 10,299 | Other debt securities carried at fair value (2) | 10,076 | 101 | (158) | 10,019 | 11,720 | 429 | (39) | 12,110 | ||||||||||||||||||||||||||||||||||||||||||||||||||||||||
| Total debt securities carried at fair value | Total debt securities carried at fair value | 275,880 | 5,853 | (821) | 280,912 | Total debt securities carried at fair value | 281,015 | 4,891 | (529) | 285,377 | 239,958 | 6,813 | (170) | 246,601 | ||||||||||||||||||||||||||||||||||||||||||||||||||||||||
| Held-to-maturity debt securities, substantially all U.S. agency mortgage-backed securities | 576,031 | 6,895 | (13,668) | 569,258 | ||||||||||||||||||||||||||||||||||||||||||||||||||||||||||||||||||
| Held-to-maturity debt securities | Held-to-maturity debt securities | |||||||||||||||||||||||||||||||||||||||||||||||||||||||||||||||||||||
| Agency mortgage-backed securities | Agency mortgage-backed securities | 562,124 | 5,497 | (8,031) | 559,590 | 414,289 | 9,768 | (36) | 424,021 | |||||||||||||||||||||||||||||||||||||||||||||||||||||||||||||
| U.S. Treasury and government agencies | U.S. Treasury and government agencies | 111,855 | 167 | (2,614) | 109,408 | 16,084 | — | (71) | 16,013 | |||||||||||||||||||||||||||||||||||||||||||||||||||||||||||||
| Other taxable securities | Other taxable securities | 9,295 | 197 | (157) | 9,335 | 7,906 | 327 | (87) | 8,146 | |||||||||||||||||||||||||||||||||||||||||||||||||||||||||||||
| Total held-to-maturity debt securities | Total held-to-maturity debt securities | 683,274 | 5,861 | (10,802) | 678,333 | 438,279 | 10,095 | (194) | 448,180 | |||||||||||||||||||||||||||||||||||||||||||||||||||||||||||||
Total debt securities (3,4) | Total debt securities (3,4) | $ | 851,911 | $ | 12,748 | $ | (14,489) | $ | 850,170 | Total debt securities (3,4) | $ | 964,289 | $ | 10,752 | $ | (11,331) | $ | 963,710 | $ | 678,237 | $ | 16,908 | $ | (364) | $ | 694,781 | ||||||||||||||||||||||||||||||||||||||||||||
| December 31, 2020 | ||||||||||||||||||||||||||||||||||||||||||||||||||||||||||||||||||||||
| Available-for-sale debt securities | ||||||||||||||||||||||||||||||||||||||||||||||||||||||||||||||||||||||
| Mortgage-backed securities: | ||||||||||||||||||||||||||||||||||||||||||||||||||||||||||||||||||||||
| Agency | $ | 59,518 | $ | 2,370 | $ | (39) | $ | 61,849 | ||||||||||||||||||||||||||||||||||||||||||||||||||||||||||||||
| Agency-collateralized mortgage obligations | 5,112 | 161 | (13) | 5,260 | ||||||||||||||||||||||||||||||||||||||||||||||||||||||||||||||||||
| Commercial | 15,470 | 1,025 | (4) | 16,491 | ||||||||||||||||||||||||||||||||||||||||||||||||||||||||||||||||||
Non-agency residential (1) | 899 | 127 | (17) | 1,009 | ||||||||||||||||||||||||||||||||||||||||||||||||||||||||||||||||||
| Total mortgage-backed securities | 80,999 | 3,683 | (73) | 84,609 | ||||||||||||||||||||||||||||||||||||||||||||||||||||||||||||||||||
| U.S. Treasury and agency securities | 114,157 | 2,236 | (13) | 116,380 | ||||||||||||||||||||||||||||||||||||||||||||||||||||||||||||||||||
| Non-U.S. securities | 14,009 | 15 | (7) | 14,017 | ||||||||||||||||||||||||||||||||||||||||||||||||||||||||||||||||||
| Other taxable securities, substantially all asset-backed securities | 2,656 | 61 | (6) | 2,711 | ||||||||||||||||||||||||||||||||||||||||||||||||||||||||||||||||||
| Total taxable securities | 211,821 | 5,995 | (99) | 217,717 | ||||||||||||||||||||||||||||||||||||||||||||||||||||||||||||||||||
| Tax-exempt securities | 16,417 | 389 | (32) | 16,774 | ||||||||||||||||||||||||||||||||||||||||||||||||||||||||||||||||||
| Total available-for-sale debt securities | 228,238 | 6,384 | (131) | 234,491 | ||||||||||||||||||||||||||||||||||||||||||||||||||||||||||||||||||
Other debt securities carried at fair value (2) | 11,720 | 429 | (39) | 12,110 | ||||||||||||||||||||||||||||||||||||||||||||||||||||||||||||||||||
| Total debt securities carried at fair value | 239,958 | 6,813 | (170) | 246,601 | ||||||||||||||||||||||||||||||||||||||||||||||||||||||||||||||||||
| Held-to-maturity debt securities, substantially all U.S. agency mortgage-backed securities | 438,279 | 10,095 | (194) | 448,180 | ||||||||||||||||||||||||||||||||||||||||||||||||||||||||||||||||||
Total debt securities (3, 4) | $ | 678,237 | $ | 16,908 | $ | (364) | $ | 694,781 | ||||||||||||||||||||||||||||||||||||||||||||||||||||||||||||||
Bank of America | ||||||||
| Total AFS Debt Securities in a Continuous Unrealized Loss Position | Total AFS Debt Securities in a Continuous Unrealized Loss Position | Total AFS Debt Securities in a Continuous Unrealized Loss Position | ||||||||||||||||||||||||||||||||||||||||||||||||||||||||||||||||||||
| Less than Twelve Months | Twelve Months or Longer | Total | Less than Twelve Months | Twelve Months or Longer | Total | |||||||||||||||||||||||||||||||||||||||||||||||||||||||||||||||||
| Fair Value | Gross Unrealized Losses | Fair Value | Gross Unrealized Losses | Fair Value | Gross Unrealized Losses | Fair Value | Gross Unrealized Losses | Fair Value | Gross Unrealized Losses | Fair Value | Gross Unrealized Losses | |||||||||||||||||||||||||||||||||||||||||||||||||||||||||||
| (Dollars in millions) | (Dollars in millions) | March 31, 2021 | (Dollars in millions) | September 30, 2021 | ||||||||||||||||||||||||||||||||||||||||||||||||||||||||||||||||||
| Continuously unrealized loss-positioned AFS debt securities | Continuously unrealized loss-positioned AFS debt securities | Continuously unrealized loss-positioned AFS debt securities | ||||||||||||||||||||||||||||||||||||||||||||||||||||||||||||||||||||
| Mortgage-backed securities: | Mortgage-backed securities: | Mortgage-backed securities: | ||||||||||||||||||||||||||||||||||||||||||||||||||||||||||||||||||||
| Agency | Agency | $ | 2,111 | $ | (30) | $ | 0 | $ | 0 | $ | 2,111 | $ | (30) | Agency | $ | 10,421 | $ | (72) | $ | 1,037 | $ | (18) | $ | 11,458 | $ | (90) | ||||||||||||||||||||||||||||||||||||||||||||
| Agency-collateralized mortgage obligations | Agency-collateralized mortgage obligations | 1,864 | (10) | 316 | (7) | 2,180 | (17) | Agency-collateralized mortgage obligations | 1,528 | (6) | 192 | (5) | 1,720 | (11) | ||||||||||||||||||||||||||||||||||||||||||||||||||||||||
| Commercial | Commercial | 1,177 | (53) | 2 | 0 | 1,179 | (53) | Commercial | 2,517 | (35) | 322 | (15) | 2,839 | (50) | ||||||||||||||||||||||||||||||||||||||||||||||||||||||||
| Non-agency residential | Non-agency residential | 540 | (28) | 175 | (15) | 715 | (43) | Non-agency residential | 479 | (25) | 113 | (10) | 592 | (35) | ||||||||||||||||||||||||||||||||||||||||||||||||||||||||
| Total mortgage-backed securities | Total mortgage-backed securities | 5,692 | (121) | 493 | (22) | 6,185 | (143) | Total mortgage-backed securities | 14,945 | (138) | 1,664 | (48) | 16,609 | (186) | ||||||||||||||||||||||||||||||||||||||||||||||||||||||||
| U.S. Treasury and agency securities | 39,989 | (488) | 689 | (4) | 40,678 | (492) | ||||||||||||||||||||||||||||||||||||||||||||||||||||||||||||||||
| Non-U.S. securities | 66 | (1) | 625 | (5) | 691 | (6) | ||||||||||||||||||||||||||||||||||||||||||||||||||||||||||||||||
| U.S. Treasury and government agencies | U.S. Treasury and government agencies | 45,297 | (151) | 944 | (12) | 46,241 | (163) | |||||||||||||||||||||||||||||||||||||||||||||||||||||||||||||||
| Other taxable securities, substantially all asset-backed securities | 253 | (2) | 203 | (2) | 456 | (4) | ||||||||||||||||||||||||||||||||||||||||||||||||||||||||||||||||
| Total taxable securities | 46,000 | (612) | 2,010 | (33) | 48,010 | (645) | ||||||||||||||||||||||||||||||||||||||||||||||||||||||||||||||||
| Other taxable securities | Other taxable securities | 336 | (1) | — | — | 336 | (1) | |||||||||||||||||||||||||||||||||||||||||||||||||||||||||||||||
| Tax-exempt securities | Tax-exempt securities | 0 | 0 | 208 | (10) | 208 | (10) | Tax-exempt securities | 373 | (9) | 422 | (12) | 795 | (21) | ||||||||||||||||||||||||||||||||||||||||||||||||||||||||
| Total AFS debt securities in a continuous unrealized loss position | Total AFS debt securities in a continuous unrealized loss position | $ | 46,000 | $ | (612) | $ | 2,218 | $ | (43) | $ | 48,218 | $ | (655) | Total AFS debt securities in a continuous unrealized loss position | $ | 60,951 | $ | (299) | $ | 3,030 | $ | (72) | $ | 63,981 | $ | (371) | ||||||||||||||||||||||||||||||||||||||||||||
| December 31, 2020 | December 31, 2020 | |||||||||||||||||||||||||||||||||||||||||||||||||||||||||||||||||||||
| Continuously unrealized loss-positioned AFS debt securities | Continuously unrealized loss-positioned AFS debt securities | Continuously unrealized loss-positioned AFS debt securities | ||||||||||||||||||||||||||||||||||||||||||||||||||||||||||||||||||||
| Mortgage-backed securities: | Mortgage-backed securities: | Mortgage-backed securities: | ||||||||||||||||||||||||||||||||||||||||||||||||||||||||||||||||||||
| Agency | Agency | $ | 2,841 | $ | (39) | $ | 2 | $ | 0 | $ | 2,843 | $ | (39) | Agency | $ | 2,841 | $ | (39) | $ | 2 | $ | — | $ | 2,843 | $ | (39) | ||||||||||||||||||||||||||||||||||||||||||||
| Agency-collateralized mortgage obligations | Agency-collateralized mortgage obligations | 187 | (2) | 364 | (11) | 551 | (13) | Agency-collateralized mortgage obligations | 187 | (2) | 364 | (11) | 551 | (13) | ||||||||||||||||||||||||||||||||||||||||||||||||||||||||
| Commercial | Commercial | 566 | (4) | 9 | 0 | 575 | (4) | Commercial | 566 | (4) | 9 | — | 575 | (4) | ||||||||||||||||||||||||||||||||||||||||||||||||||||||||
| Non-agency residential | Non-agency residential | 342 | (9) | 56 | (8) | 398 | (17) | Non-agency residential | 342 | (9) | 56 | (8) | 398 | (17) | ||||||||||||||||||||||||||||||||||||||||||||||||||||||||
| Total mortgage-backed securities | Total mortgage-backed securities | 3,936 | (54) | 431 | (19) | 4,367 | (73) | Total mortgage-backed securities | 3,936 | (54) | 431 | (19) | 4,367 | (73) | ||||||||||||||||||||||||||||||||||||||||||||||||||||||||
| U.S. Treasury and agency securities | 8,282 | (9) | 498 | (4) | 8,780 | (13) | ||||||||||||||||||||||||||||||||||||||||||||||||||||||||||||||||
| U.S. Treasury and government agencies | U.S. Treasury and government agencies | 8,282 | (9) | 498 | (4) | 8,780 | (13) | |||||||||||||||||||||||||||||||||||||||||||||||||||||||||||||||
| Non-U.S. securities | Non-U.S. securities | 1,861 | (6) | 135 | (1) | 1,996 | (7) | Non-U.S. securities | 1,861 | (6) | 135 | (1) | 1,996 | (7) | ||||||||||||||||||||||||||||||||||||||||||||||||||||||||
| Other taxable securities, substantially all asset-backed securities | 576 | (2) | 396 | (4) | 972 | (6) | ||||||||||||||||||||||||||||||||||||||||||||||||||||||||||||||||
| Total taxable securities | 14,655 | (71) | 1,460 | (28) | 16,115 | (99) | ||||||||||||||||||||||||||||||||||||||||||||||||||||||||||||||||
| Other taxable securities | Other taxable securities | 576 | (2) | 396 | (4) | 972 | (6) | |||||||||||||||||||||||||||||||||||||||||||||||||||||||||||||||
| Tax-exempt securities | Tax-exempt securities | 4,108 | (29) | 617 | (3) | 4,725 | (32) | Tax-exempt securities | 4,108 | (29) | 617 | (3) | 4,725 | (32) | ||||||||||||||||||||||||||||||||||||||||||||||||||||||||
| Total AFS debt securities in a continuous unrealized loss position | Total AFS debt securities in a continuous unrealized loss position | $ | 18,763 | $ | (100) | $ | 2,077 | $ | (31) | $ | 20,840 | $ | (131) | Total AFS debt securities in a continuous unrealized loss position | $ | 18,763 | $ | (100) | $ | 2,077 | $ | (31) | $ | 20,840 | $ | (131) | ||||||||||||||||||||||||||||||||||||||||||||
| Maturities of Debt Securities Carried at Fair Value and Held-to-maturity Debt Securities | Maturities of Debt Securities Carried at Fair Value and Held-to-maturity Debt Securities | Maturities of Debt Securities Carried at Fair Value and Held-to-maturity Debt Securities | ||||||||||||||||||||||||||||||||||||||||||||||||||||||||||||||||||||||||||||||||||||||||||||||||||||||||||||||||||||
| Due in One Year or Less | Due after One Year through Five Years | Due after Five Years through Ten Years | Due after Ten Years | Total | Due in One Year or Less | Due after One Year through Five Years | Due after Five Years through Ten Years | Due after Ten Years | Total | |||||||||||||||||||||||||||||||||||||||||||||||||||||||||||||||||||||||||||||||||||||||||||||||||||||||||||||
| (Dollars in millions) | (Dollars in millions) | Amount | Yield (1) | Amount | Yield (1) | Amount | Yield (1) | Amount | Yield (1) | Amount | Yield (1) | (Dollars in millions) | Amount | Yield (1) | Amount | Yield (1) | Amount | Yield (1) | Amount | Yield (1) | Amount | Yield (1) | ||||||||||||||||||||||||||||||||||||||||||||||||||||||||||||||||||||||||||||||||||||||||||||||||
| Amortized cost of debt securities carried at fair value | Amortized cost of debt securities carried at fair value | Amortized cost of debt securities carried at fair value | ||||||||||||||||||||||||||||||||||||||||||||||||||||||||||||||||||||||||||||||||||||||||||||||||||||||||||||||||||||
| Mortgage-backed securities: | Mortgage-backed securities: | Mortgage-backed securities: | ||||||||||||||||||||||||||||||||||||||||||||||||||||||||||||||||||||||||||||||||||||||||||||||||||||||||||||||||||||
| Agency | Agency | $ | 0 | 0 | % | $ | 6 | 5.14 | % | $ | 54 | 4.46 | % | $ | 52,335 | 3.36 | % | $ | 52,395 | 3.36 | % | Agency | $ | — | — | % | $ | 5 | 4.73 | % | $ | 53 | 4.51 | % | $ | 50,698 | 3.12 | % | $ | 50,756 | 3.12 | % | ||||||||||||||||||||||||||||||||||||||||||||||||||||||||||||||||||||||||||||
| Agency-collateralized mortgage obligations | Agency-collateralized mortgage obligations | 0 | 0 | 0 | 0 | 23 | 2.48 | 4,595 | 2.93 | 4,618 | 2.93 | Agency-collateralized mortgage obligations | — | — | — | — | 21 | 2.52 | 3,663 | 2.91 | 3,684 | 2.91 | ||||||||||||||||||||||||||||||||||||||||||||||||||||||||||||||||||||||||||||||||||||||||||||||||
| Commercial | Commercial | 26 | 3.12 | 7,859 | 2.51 | 6,984 | 2.18 | 1,157 | 2.53 | 16,026 | 2.37 | Commercial | 354 | 2.32 | 10,257 | 2.48 | 5,857 | 1.75 | 1,636 | 2.18 | 18,104 | 2.21 | ||||||||||||||||||||||||||||||||||||||||||||||||||||||||||||||||||||||||||||||||||||||||||||||||
| Non-agency residential | Non-agency residential | 0 | 0 | 0 | 0 | 0 | 0 | 1,573 | 6.55 | 1,573 | 6.55 | Non-agency residential | — | — | — | — | — | — | 1,442 | 6.59 | 1,442 | 6.59 | ||||||||||||||||||||||||||||||||||||||||||||||||||||||||||||||||||||||||||||||||||||||||||||||||
| Total mortgage-backed securities | Total mortgage-backed securities | 26 | 3.12 | 7,865 | 2.51 | 7,061 | 2.20 | 59,660 | 3.39 | 74,612 | 3.18 | Total mortgage-backed securities | 354 | 2.32 | 10,262 | 2.48 | 5,931 | 1.78 | 57,439 | 3.17 | 73,986 | 2.96 | ||||||||||||||||||||||||||||||||||||||||||||||||||||||||||||||||||||||||||||||||||||||||||||||||
| U.S. Treasury and agency securities | 6,886 | 1.19 | 28,191 | 1.88 | 123,796 | 0.79 | 32 | 2.54 | 158,905 | 1.00 | ||||||||||||||||||||||||||||||||||||||||||||||||||||||||||||||||||||||||||||||||||||||||||||||||||||||||||||
| U.S. Treasury and government agencies | U.S. Treasury and government agencies | 4,988 | 1.25 | 33,785 | 1.65 | 128,893 | 1.07 | 29 | 2.57 | 167,695 | 1.20 | |||||||||||||||||||||||||||||||||||||||||||||||||||||||||||||||||||||||||||||||||||||||||||||||||||||||||||
| Non-U.S. securities | Non-U.S. securities | 22,288 | 0.34 | 1,365 | 1.51 | 1 | 3.56 | 167 | 5.29 | 23,821 | 0.44 | Non-U.S. securities | 20,658 | 0.30 | 370 | 3.01 | 344 | 1.03 | 61 | 51.33 | 21,433 | 0.51 | ||||||||||||||||||||||||||||||||||||||||||||||||||||||||||||||||||||||||||||||||||||||||||||||||
| Other taxable securities, substantially all asset-backed securities | 990 | 1.19 | 903 | 2.98 | 370 | 2.20 | 256 | 1.66 | 2,519 | 2.03 | ||||||||||||||||||||||||||||||||||||||||||||||||||||||||||||||||||||||||||||||||||||||||||||||||||||||||||||
| Total taxable securities | 30,190 | 0.56 | 38,324 | 2.03 | 131,228 | 0.87 | 60,115 | 3.39 | 259,857 | 1.60 | ||||||||||||||||||||||||||||||||||||||||||||||||||||||||||||||||||||||||||||||||||||||||||||||||||||||||||||
| Other taxable securities | Other taxable securities | 666 | 1.53 | 1,336 | 2.27 | 341 | 2.44 | 246 | 1.63 | 2,589 | 2.04 | |||||||||||||||||||||||||||||||||||||||||||||||||||||||||||||||||||||||||||||||||||||||||||||||||||||||||||
| Tax-exempt securities | Tax-exempt securities | 1,302 | 0.92 | 8,131 | 1.28 | 4,038 | 1.73 | 2,552 | 1.32 | 16,023 | 1.37 | Tax-exempt securities | 1,542 | 1.07 | 7,539 | 1.35 | 3,445 | 1.65 | 2,786 | 1.40 | 15,312 | 1.40 | ||||||||||||||||||||||||||||||||||||||||||||||||||||||||||||||||||||||||||||||||||||||||||||||||
| Total amortized cost of debt securities carried at fair value | Total amortized cost of debt securities carried at fair value | $ | 31,492 | 0.57 | $ | 46,455 | 1.89 | $ | 135,266 | 0.90 | $ | 62,667 | 3.31 | $ | 275,880 | 1.57 | Total amortized cost of debt securities carried at fair value | $ | 28,208 | 0.57 | $ | 53,292 | 1.79 | $ | 138,954 | 1.12 | $ | 60,561 | 3.13 | $ | 281,015 | 1.62 | ||||||||||||||||||||||||||||||||||||||||||||||||||||||||||||||||||||||||||||||||||||||
Amortized cost of HTM debt securities | Amortized cost of HTM debt securities | $ | 49 | 2.02 | $ | 625 | 2.42 | $ | 61,566 | 1.27 | $ | 513,791 | 2.23 | $ | 576,031 | 2.13 | Amortized cost of HTM debt securities | |||||||||||||||||||||||||||||||||||||||||||||||||||||||||||||||||||||||||||||||||||||||||||||||||||||
| Agency mortgage-backed securities | Agency mortgage-backed securities | $ | — | — | % | $ | — | — | % | $ | 4 | 2.33 | % | $ | 562,120 | 2.15 | % | $ | 562,124 | 2.15 | % | |||||||||||||||||||||||||||||||||||||||||||||||||||||||||||||||||||||||||||||||||||||||||||||||||
| U.S. Treasury and government agencies | U.S. Treasury and government agencies | — | — | — | — | 111,855 | 1.35 | — | — | 111,855 | 1.35 | |||||||||||||||||||||||||||||||||||||||||||||||||||||||||||||||||||||||||||||||||||||||||||||||||||||||||||
| Other taxable securities | Other taxable securities | 234 | 6.51 | 824 | 2.36 | 314 | 3.05 | 7,923 | 2.52 | 9,295 | 2.63 | |||||||||||||||||||||||||||||||||||||||||||||||||||||||||||||||||||||||||||||||||||||||||||||||||||||||||||
| Total amortized cost of HTM debt securities | Total amortized cost of HTM debt securities | $ | 234 | 6.51 | $ | 824 | 2.36 | $ | 112,173 | 1.35 | $ | 570,043 | 2.16 | $ | 683,274 | 2.03 | ||||||||||||||||||||||||||||||||||||||||||||||||||||||||||||||||||||||||||||||||||||||||||||||||||||||
| Debt securities carried at fair value | Debt securities carried at fair value | Debt securities carried at fair value | ||||||||||||||||||||||||||||||||||||||||||||||||||||||||||||||||||||||||||||||||||||||||||||||||||||||||||||||||||||
| Mortgage-backed securities: | Mortgage-backed securities: | Mortgage-backed securities: | ||||||||||||||||||||||||||||||||||||||||||||||||||||||||||||||||||||||||||||||||||||||||||||||||||||||||||||||||||||
| Agency | Agency | $ | 0 | $ | 6 | $ | 58 | $ | 54,470 | $ | 54,534 | Agency | $ | — | $ | 5 | $ | 57 | $ | 52,235 | $ | 52,297 | ||||||||||||||||||||||||||||||||||||||||||||||||||||||||||||||||||||||||||||||||||||||||||||||||
| Agency-collateralized mortgage obligations | Agency-collateralized mortgage obligations | 0 | 0 | 24 | 4,709 | 4,733 | Agency-collateralized mortgage obligations | — | — | 21 | 3,755 | 3,776 | ||||||||||||||||||||||||||||||||||||||||||||||||||||||||||||||||||||||||||||||||||||||||||||||||||||||||||
| Commercial | Commercial | 27 | 8,294 | 7,300 | 1,192 | 16,813 | Commercial | 358 | 10,798 | 5,998 | 1,678 | 18,832 | ||||||||||||||||||||||||||||||||||||||||||||||||||||||||||||||||||||||||||||||||||||||||||||||||||||||||||
| Non-agency residential | Non-agency residential | 0 | 0 | 6 | 1,605 | 1,611 | Non-agency residential | — | — | 4 | 1,506 | 1,510 | ||||||||||||||||||||||||||||||||||||||||||||||||||||||||||||||||||||||||||||||||||||||||||||||||||||||||||
| Total mortgage-backed securities | Total mortgage-backed securities | 27 | 8,300 | 7,388 | 61,976 | 77,691 | Total mortgage-backed securities | 358 | 10,803 | 6,080 | 59,174 | 76,415 | ||||||||||||||||||||||||||||||||||||||||||||||||||||||||||||||||||||||||||||||||||||||||||||||||||||||||||
| U.S. Treasury and agency securities | 6,918 | 29,464 | 124,159 | 33 | 160,574 | |||||||||||||||||||||||||||||||||||||||||||||||||||||||||||||||||||||||||||||||||||||||||||||||||||||||||||||||||
| U.S. Treasury and government agencies | U.S. Treasury and government agencies | 5,024 | 34,884 | 129,463 | 30 | 169,401 | ||||||||||||||||||||||||||||||||||||||||||||||||||||||||||||||||||||||||||||||||||||||||||||||||||||||||||||||||
| Non-U.S. securities | Non-U.S. securities | 22,209 | 1,373 | 1 | 162 | 23,745 | Non-U.S. securities | 20,534 | 373 | 347 | 59 | 21,313 | ||||||||||||||||||||||||||||||||||||||||||||||||||||||||||||||||||||||||||||||||||||||||||||||||||||||||||
| Other taxable securities, substantially all asset-backed securities | 992 | 937 | 375 | 257 | 2,561 | |||||||||||||||||||||||||||||||||||||||||||||||||||||||||||||||||||||||||||||||||||||||||||||||||||||||||||||||||
| Total taxable securities | 30,146 | 40,074 | 131,923 | 62,428 | 264,571 | |||||||||||||||||||||||||||||||||||||||||||||||||||||||||||||||||||||||||||||||||||||||||||||||||||||||||||||||||
| Other taxable securities | Other taxable securities | 671 | 1,368 | 346 | 251 | 2,636 | ||||||||||||||||||||||||||||||||||||||||||||||||||||||||||||||||||||||||||||||||||||||||||||||||||||||||||||||||
| Tax-exempt securities | Tax-exempt securities | 1,306 | 8,252 | 4,191 | 2,592 | 16,341 | Tax-exempt securities | 1,544 | 7,681 | 3,577 | 2,810 | 15,612 | ||||||||||||||||||||||||||||||||||||||||||||||||||||||||||||||||||||||||||||||||||||||||||||||||||||||||||
| Total debt securities carried at fair value | Total debt securities carried at fair value | $ | 31,452 | $ | 48,326 | $ | 136,114 | $ | 65,020 | $ | 280,912 | Total debt securities carried at fair value | $ | 28,131 | $ | 55,109 | $ | 139,813 | $ | 62,324 | $ | 285,377 | ||||||||||||||||||||||||||||||||||||||||||||||||||||||||||||||||||||||||||||||||||||||||||||||||
Fair value of HTM debt securities (2) | $ | 49 | $ | 656 | $ | 58,043 | $ | 510,510 | $ | 569,258 | ||||||||||||||||||||||||||||||||||||||||||||||||||||||||||||||||||||||||||||||||||||||||||||||||||||||||||||
| Fair value of HTM debt securities | Fair value of HTM debt securities | |||||||||||||||||||||||||||||||||||||||||||||||||||||||||||||||||||||||||||||||||||||||||||||||||||||||||||||||||||||
| Agency mortgage-backed securities | Agency mortgage-backed securities | $ | — | $ | — | $ | 4 | $ | 559,586 | $ | 559,590 | |||||||||||||||||||||||||||||||||||||||||||||||||||||||||||||||||||||||||||||||||||||||||||||||||||||||||||
| U.S. Treasury and government agencies | U.S. Treasury and government agencies | — | — | 109,408 | — | 109,408 | ||||||||||||||||||||||||||||||||||||||||||||||||||||||||||||||||||||||||||||||||||||||||||||||||||||||||||||||||
| Other taxable securities | Other taxable securities | 234 | 863 | 326 | 7,912 | 9,335 | ||||||||||||||||||||||||||||||||||||||||||||||||||||||||||||||||||||||||||||||||||||||||||||||||||||||||||||||||
| Total fair value of HTM debt securities | Total fair value of HTM debt securities | $ | 234 | $ | 863 | $ | 109,738 | $ | 567,498 | $ | 678,333 | |||||||||||||||||||||||||||||||||||||||||||||||||||||||||||||||||||||||||||||||||||||||||||||||||||||||||||
Bank of America | ||||||||
30-59 Days Past Due (1) | 60-89 Days Past Due (1) | 90 Days or More Past Due (1) | Total Past Due 30 Days or More | Total Current or Less Than 30 Days Past Due (1) | Loans Accounted for Under the Fair Value Option | Total Outstandings | 30-59 Days Past Due (1) | 60-89 Days Past Due (1) | 90 Days or More Past Due (1) | Total Past Due 30 Days or More | Total Current or Less Than 30 Days Past Due (1) | Loans Accounted for Under the Fair Value Option | Total Outstandings | |||||||||||||||||||||||||||||||||||||||||||||||||||||||||||||||||||||||||||||||||
| (Dollars in millions) | (Dollars in millions) | March 31, 2021 | (Dollars in millions) | September 30, 2021 | ||||||||||||||||||||||||||||||||||||||||||||||||||||||||||||||||||||||||||||||||||||||||||
| Consumer real estate | Consumer real estate | Consumer real estate | ||||||||||||||||||||||||||||||||||||||||||||||||||||||||||||||||||||||||||||||||||||||||||||
| Residential mortgage | Residential mortgage | $ | 1,230 | $ | 414 | $ | 1,635 | $ | 3,279 | $ | 211,500 | $ | 214,779 | Residential mortgage | $ | 1,010 | $ | 276 | $ | 1,504 | $ | 2,790 | $ | 214,150 | $ | 216,940 | ||||||||||||||||||||||||||||||||||||||||||||||||||||||||||||||||||||
| Home equity | Home equity | 139 | 75 | 362 | 576 | 31,502 | 32,078 | Home equity | 132 | 69 | 366 | 567 | 28,433 | 29,000 | ||||||||||||||||||||||||||||||||||||||||||||||||||||||||||||||||||||||||||||||||
| Credit card and other consumer | Credit card and other consumer | Credit card and other consumer | ||||||||||||||||||||||||||||||||||||||||||||||||||||||||||||||||||||||||||||||||||||||||||||
| Credit card | Credit card | 316 | 246 | 755 | 1,317 | 71,469 | 72,786 | Credit card | 286 | 198 | 450 | 934 | 75,935 | 76,869 | ||||||||||||||||||||||||||||||||||||||||||||||||||||||||||||||||||||||||||||||||
Direct/Indirect consumer (2) | Direct/Indirect consumer (2) | 143 | 44 | 27 | 214 | 91,523 | 91,737 | Direct/Indirect consumer (2) | 119 | 31 | 16 | 166 | 99,679 | 99,845 | ||||||||||||||||||||||||||||||||||||||||||||||||||||||||||||||||||||||||||||||||
| Other consumer | Other consumer | 0 | 0 | 0 | 0 | 132 | 132 | Other consumer | — | — | — | — | 202 | 202 | ||||||||||||||||||||||||||||||||||||||||||||||||||||||||||||||||||||||||||||||||
| Total consumer | Total consumer | 1,828 | 779 | 2,779 | 5,386 | 406,126 | 411,512 | Total consumer | 1,547 | 574 | 2,336 | 4,457 | 418,399 | 422,856 | ||||||||||||||||||||||||||||||||||||||||||||||||||||||||||||||||||||||||||||||||
Consumer loans accounted for under the fair value option (3) | Consumer loans accounted for under the fair value option (3) | $ | 693 | 693 | Consumer loans accounted for under the fair value option (3) | $ | 616 | 616 | ||||||||||||||||||||||||||||||||||||||||||||||||||||||||||||||||||||||||||||||||||||||
| Total consumer loans and leases | Total consumer loans and leases | 1,828 | 779 | 2,779 | 5,386 | 406,126 | 693 | 412,205 | Total consumer loans and leases | 1,547 | 574 | 2,336 | 4,457 | 418,399 | 616 | 423,472 | ||||||||||||||||||||||||||||||||||||||||||||||||||||||||||||||||||||||||||||||
| Commercial | Commercial | Commercial | ||||||||||||||||||||||||||||||||||||||||||||||||||||||||||||||||||||||||||||||||||||||||||||
| U.S. commercial | U.S. commercial | 1,201 | 220 | 349 | 1,770 | 281,459 | 283,229 | U.S. commercial | 640 | 234 | 238 | 1,112 | 294,815 | 295,927 | ||||||||||||||||||||||||||||||||||||||||||||||||||||||||||||||||||||||||||||||||
| Non-U.S. commercial | Non-U.S. commercial | 112 | 26 | 105 | 243 | 91,092 | 91,335 | Non-U.S. commercial | 77 | 48 | 130 | 255 | 102,595 | 102,850 | ||||||||||||||||||||||||||||||||||||||||||||||||||||||||||||||||||||||||||||||||
Commercial real estate (4) | Commercial real estate (4) | 44 | 141 | 230 | 415 | 58,349 | 58,764 | Commercial real estate (4) | 138 | — | 208 | 346 | 60,377 | 60,723 | ||||||||||||||||||||||||||||||||||||||||||||||||||||||||||||||||||||||||||||||||
| Commercial lease financing | Commercial lease financing | 138 | 25 | 48 | 211 | 16,148 | 16,359 | Commercial lease financing | 32 | 33 | 15 | 80 | 14,964 | 15,044 | ||||||||||||||||||||||||||||||||||||||||||||||||||||||||||||||||||||||||||||||||
U.S. small business commercial (5) | U.S. small business commercial (5) | 65 | 41 | 107 | 213 | 34,673 | 34,886 | U.S. small business commercial (5) | 70 | 43 | 66 | 179 | 22,591 | 22,770 | ||||||||||||||||||||||||||||||||||||||||||||||||||||||||||||||||||||||||||||||||
| Total commercial | Total commercial | 1,560 | 453 | 839 | 2,852 | 481,721 | 484,573 | Total commercial | 957 | 358 | 657 | 1,972 | 495,342 | 497,314 | ||||||||||||||||||||||||||||||||||||||||||||||||||||||||||||||||||||||||||||||||
Commercial loans accounted for under the fair value option (3) | Commercial loans accounted for under the fair value option (3) | 6,310 | 6,310 | Commercial loans accounted for under the fair value option (3) | 6,950 | 6,950 | ||||||||||||||||||||||||||||||||||||||||||||||||||||||||||||||||||||||||||||||||||||||||
| Total commercial loans and leases | Total commercial loans and leases | 1,560 | 453 | 839 | 2,852 | 481,721 | 6,310 | 490,883 | Total commercial loans and leases | 957 | 358 | 657 | 1,972 | 495,342 | 6,950 | 504,264 | ||||||||||||||||||||||||||||||||||||||||||||||||||||||||||||||||||||||||||||||
Total loans and leases (6) | Total loans and leases (6) | $ | 3,388 | $ | 1,232 | $ | 3,618 | $ | 8,238 | $ | 887,847 | $ | 7,003 | $ | 903,088 | Total loans and leases (6) | $ | 2,504 | $ | 932 | $ | 2,993 | $ | 6,429 | $ | 913,741 | $ | 7,566 | $ | 927,736 | ||||||||||||||||||||||||||||||||||||||||||||||||||||||||||||||||
| Percentage of outstandings | Percentage of outstandings | 0.37 | % | 0.14 | % | 0.40 | % | 0.91 | % | 98.31 | % | 0.78 | % | 100.00 | % | Percentage of outstandings | 0.27 | % | 0.10 | % | 0.32 | % | 0.69 | % | 98.49 | % | 0.82 | % | 100.00 | % | ||||||||||||||||||||||||||||||||||||||||||||||||||||||||||||||||
30-59 Days Past Due (1) | 60-89 Days Past Due (1) | 90 Days or More Past Due (1) | Total Past Due 30 Days or More | Total Current or Less Than 30 Days Past Due (1) | Loans Accounted for Under the Fair Value Option | Total Outstandings | 30-59 Days Past Due (1) | 60-89 Days Past Due (1) | 90 Days or More Past Due (1) | Total Past Due 30 Days or More | Total Current or Less Than 30 Days Past Due (1) | Loans Accounted for Under the Fair Value Option | Total Outstandings | |||||||||||||||||||||||||||||||||||||||||||||||||||||||||||||||||||||||||||||||||
| (Dollars in millions) | (Dollars in millions) | December 31, 2020 | (Dollars in millions) | December 31, 2020 | ||||||||||||||||||||||||||||||||||||||||||||||||||||||||||||||||||||||||||||||||||||||||||
| Consumer real estate | Consumer real estate | Consumer real estate | ||||||||||||||||||||||||||||||||||||||||||||||||||||||||||||||||||||||||||||||||||||||||||||
| Residential mortgage | Residential mortgage | $ | 1,430 | $ | 297 | $ | 1,699 | $ | 3,426 | $ | 220,129 | $ | 223,555 | Residential mortgage | $ | 1,430 | $ | 297 | $ | 1,699 | $ | 3,426 | $ | 220,129 | $ | 223,555 | ||||||||||||||||||||||||||||||||||||||||||||||||||||||||||||||||||||
| Home equity | Home equity | 154 | 78 | 345 | 577 | 33,734 | 34,311 | Home equity | 154 | 78 | 345 | 577 | 33,734 | 34,311 | ||||||||||||||||||||||||||||||||||||||||||||||||||||||||||||||||||||||||||||||||
| Credit card and other consumer | Credit card and other consumer | Credit card and other consumer | ||||||||||||||||||||||||||||||||||||||||||||||||||||||||||||||||||||||||||||||||||||||||||||
| Credit card | Credit card | 445 | 341 | 903 | 1,689 | 77,019 | 78,708 | Credit card | 445 | 341 | 903 | 1,689 | 77,019 | 78,708 | ||||||||||||||||||||||||||||||||||||||||||||||||||||||||||||||||||||||||||||||||
Direct/Indirect consumer (2) | Direct/Indirect consumer (2) | 209 | 67 | 37 | 313 | 91,050 | 91,363 | Direct/Indirect consumer (2) | 209 | 67 | 37 | 313 | 91,050 | 91,363 | ||||||||||||||||||||||||||||||||||||||||||||||||||||||||||||||||||||||||||||||||
| Other consumer | Other consumer | 0 | 0 | 0 | 0 | 124 | 124 | Other consumer | — | — | — | — | 124 | 124 | ||||||||||||||||||||||||||||||||||||||||||||||||||||||||||||||||||||||||||||||||
| Total consumer | Total consumer | 2,238 | 783 | 2,984 | 6,005 | 422,056 | 428,061 | Total consumer | 2,238 | 783 | 2,984 | 6,005 | 422,056 | 428,061 | ||||||||||||||||||||||||||||||||||||||||||||||||||||||||||||||||||||||||||||||||
Consumer loans accounted for under the fair value option (3) | Consumer loans accounted for under the fair value option (3) | $ | 735 | 735 | Consumer loans accounted for under the fair value option (3) | $ | 735 | 735 | ||||||||||||||||||||||||||||||||||||||||||||||||||||||||||||||||||||||||||||||||||||||
| Total consumer loans and leases | Total consumer loans and leases | 2,238 | 783 | 2,984 | 6,005 | 422,056 | 735 | 428,796 | Total consumer loans and leases | 2,238 | 783 | 2,984 | 6,005 | 422,056 | 735 | 428,796 | ||||||||||||||||||||||||||||||||||||||||||||||||||||||||||||||||||||||||||||||
| Commercial | Commercial | Commercial | ||||||||||||||||||||||||||||||||||||||||||||||||||||||||||||||||||||||||||||||||||||||||||||
| U.S. commercial | U.S. commercial | 561 | 214 | 512 | 1,287 | 287,441 | 288,728 | U.S. commercial | 561 | 214 | 512 | 1,287 | 287,441 | 288,728 | ||||||||||||||||||||||||||||||||||||||||||||||||||||||||||||||||||||||||||||||||
| Non-U.S. commercial | Non-U.S. commercial | 61 | 44 | 11 | 116 | 90,344 | 90,460 | Non-U.S. commercial | 61 | 44 | 11 | 116 | 90,344 | 90,460 | ||||||||||||||||||||||||||||||||||||||||||||||||||||||||||||||||||||||||||||||||
Commercial real estate (4) | Commercial real estate (4) | 128 | 113 | 226 | 467 | 59,897 | 60,364 | Commercial real estate (4) | 128 | 113 | 226 | 467 | 59,897 | 60,364 | ||||||||||||||||||||||||||||||||||||||||||||||||||||||||||||||||||||||||||||||||
| Commercial lease financing | Commercial lease financing | 86 | 20 | 57 | 163 | 16,935 | 17,098 | Commercial lease financing | 86 | 20 | 57 | 163 | 16,935 | 17,098 | ||||||||||||||||||||||||||||||||||||||||||||||||||||||||||||||||||||||||||||||||
U.S. small business commercial (5) | U.S. small business commercial (5) | 84 | 56 | 123 | 263 | 36,206 | 36,469 | U.S. small business commercial (5) | 84 | 56 | 123 | 263 | 36,206 | 36,469 | ||||||||||||||||||||||||||||||||||||||||||||||||||||||||||||||||||||||||||||||||
| Total commercial | Total commercial | 920 | 447 | 929 | 2,296 | 490,823 | 493,119 | Total commercial | 920 | 447 | 929 | 2,296 | 490,823 | 493,119 | ||||||||||||||||||||||||||||||||||||||||||||||||||||||||||||||||||||||||||||||||
Commercial loans accounted for under the fair value option (3) | Commercial loans accounted for under the fair value option (3) | 5,946 | 5,946 | Commercial loans accounted for under the fair value option (3) | 5,946 | 5,946 | ||||||||||||||||||||||||||||||||||||||||||||||||||||||||||||||||||||||||||||||||||||||||
| Total commercial loans and leases | Total commercial loans and leases | 920 | 447 | 929 | 2,296 | 490,823 | 5,946 | 499,065 | Total commercial loans and leases | 920 | 447 | 929 | 2,296 | 490,823 | 5,946 | 499,065 | ||||||||||||||||||||||||||||||||||||||||||||||||||||||||||||||||||||||||||||||
Total loans and leases (6) | Total loans and leases (6) | $ | 3,158 | $ | 1,230 | $ | 3,913 | $ | 8,301 | $ | 912,879 | $ | 6,681 | $ | 927,861 | Total loans and leases (6) | $ | 3,158 | $ | 1,230 | $ | 3,913 | $ | 8,301 | $ | 912,879 | $ | 6,681 | $ | 927,861 | ||||||||||||||||||||||||||||||||||||||||||||||||||||||||||||||||
| Percentage of outstandings | Percentage of outstandings | 0.34 | % | 0.13 | % | 0.42 | % | 0.89 | % | 98.39 | % | 0.72 | % | 100.00 | % | Percentage of outstandings | 0.34 | % | 0.13 | % | 0.42 | % | 0.89 | % | 98.39 | % | 0.72 | % | 100.00 | % | ||||||||||||||||||||||||||||||||||||||||||||||||||||||||||||||||
Bank of America | ||||||||
| Credit Quality | Credit Quality | Credit Quality | ||||||||||||||||||||||||||||||||||||||||||||
| Nonperforming Loans and Leases | Accruing Past Due 90 Days or More (1) | Nonperforming Loans and Leases | Accruing Past Due 90 Days or More (1) | |||||||||||||||||||||||||||||||||||||||||||
| (Dollars in millions) | (Dollars in millions) | March 31 2021 | December 31 2020 | March 31 2021 | December 31 2020 | (Dollars in millions) | September 30 2021 | December 31 2020 | September 30 2021 | December 31 2020 | ||||||||||||||||||||||||||||||||||||
Residential mortgage (2) | Residential mortgage (2) | $ | 2,366 | $ | 2,005 | $ | 728 | $ | 762 | Residential mortgage (2) | $ | 2,296 | $ | 2,005 | $ | 648 | $ | 762 | ||||||||||||||||||||||||||||
With no related allowance (3) | With no related allowance (3) | 1,413 | 1,378 | 0 | 0 | With no related allowance (3) | 1,984 | 1,378 | — | — | ||||||||||||||||||||||||||||||||||||
Home equity (2) | Home equity (2) | 669 | 649 | 0 | 0 | Home equity (2) | 676 | 649 | — | — | ||||||||||||||||||||||||||||||||||||
With no related allowance (3) | With no related allowance (3) | 326 | 347 | 0 | 0 | With no related allowance (3) | 419 | 347 | — | — | ||||||||||||||||||||||||||||||||||||
| Credit Card | Credit Card | n/a | n/a | 755 | 903 | Credit Card | n/a | n/a | 450 | 903 | ||||||||||||||||||||||||||||||||||||
| Direct/indirect consumer | Direct/indirect consumer | 56 | 71 | 25 | 33 | Direct/indirect consumer | 45 | 71 | 8 | 33 | ||||||||||||||||||||||||||||||||||||
| Total consumer | Total consumer | 3,091 | 2,725 | 1,508 | 1,698 | Total consumer | 3,017 | 2,725 | 1,106 | 1,698 | ||||||||||||||||||||||||||||||||||||
| U.S. commercial | U.S. commercial | 1,228 | 1,243 | 99 | 228 | U.S. commercial | 909 | 1,243 | 84 | 228 | ||||||||||||||||||||||||||||||||||||
| Non-U.S. commercial | Non-U.S. commercial | 342 | 418 | 4 | 10 | Non-U.S. commercial | 272 | 418 | 60 | 10 | ||||||||||||||||||||||||||||||||||||
| Commercial real estate | Commercial real estate | 354 | 404 | 63 | 6 | Commercial real estate | 414 | 404 | 5 | 6 | ||||||||||||||||||||||||||||||||||||
| Commercial lease financing | Commercial lease financing | 80 | 87 | 20 | 25 | Commercial lease financing | 70 | 87 | 11 | 25 | ||||||||||||||||||||||||||||||||||||
| U.S. small business commercial | U.S. small business commercial | 67 | 75 | 98 | 115 | U.S. small business commercial | 32 | 75 | 64 | 115 | ||||||||||||||||||||||||||||||||||||
| Total commercial | Total commercial | 2,071 | 2,227 | 284 | 384 | Total commercial | 1,697 | 2,227 | 224 | 384 | ||||||||||||||||||||||||||||||||||||
| Total nonperforming loans | Total nonperforming loans | $ | 5,162 | $ | 4,952 | $ | 1,792 | $ | 2,082 | Total nonperforming loans | $ | 4,714 | $ | 4,952 | $ | 1,330 | $ | 2,082 | ||||||||||||||||||||||||||||
| Percentage of outstanding loans and leases | Percentage of outstanding loans and leases | 0.58 | % | 0.54 | % | 0.20 | % | 0.23 | % | Percentage of outstanding loans and leases | 0.51 % | 0.54 | % | 0.14 % | 0.23 | % | ||||||||||||||||||||||||||||||
| Residential Mortgage – Credit Quality Indicators By Vintage | ||||||||||||||||||||||||||||||||||||||||||||||||||||||||||||||||||||||||||||||||||||||||||||||||||||||||||||||||||||||||||||||||||
| Term Loans by Origination Year | Term Loans by Origination Year | |||||||||||||||||||||||||||||||||||||||||||||||||||||||||||||||||||||||||||||||||||||||||||||||||||||||||||||||||||||||||||||||||
| (Dollars in millions) | (Dollars in millions) | Total as of March 31, 2021 | 2021 | 2020 | 2019 | 2018 | 2017 | Prior | (Dollars in millions) | Total as of September 30, 2021 | 2021 | 2020 | 2019 | 2018 | 2017 | Prior | ||||||||||||||||||||||||||||||||||||||||||||||||||||||||||||||||||||||||||||||||||||||||||||||||||||||||||||||||||
| Total Residential Mortgage | Total Residential Mortgage | Total Residential Mortgage | ||||||||||||||||||||||||||||||||||||||||||||||||||||||||||||||||||||||||||||||||||||||||||||||||||||||||||||||||||||||||||||||||
Refreshed LTV | Refreshed LTV | Refreshed LTV | ||||||||||||||||||||||||||||||||||||||||||||||||||||||||||||||||||||||||||||||||||||||||||||||||||||||||||||||||||||||||||||||||
| Less than or equal to 90 percent | Less than or equal to 90 percent | $ | 198,785 | $ | 24,600 | $ | 61,767 | $ | 34,753 | $ | 11,133 | $ | 16,831 | $ | 49,701 | Less than or equal to 90 percent | $ | 201,127 | $ | 66,702 | $ | 48,549 | $ | 26,414 | $ | 8,448 | $ | 12,487 | $ | 38,527 | ||||||||||||||||||||||||||||||||||||||||||||||||||||||||||||||||||||||||||||||||||||||||||||||||||||
| Greater than 90 percent but less than or equal to 100 percent | Greater than 90 percent but less than or equal to 100 percent | 2,966 | 544 | 1,576 | 497 | 75 | 48 | 226 | Greater than 90 percent but less than or equal to 100 percent | 2,388 | 1,327 | 704 | 169 | 31 | 24 | 133 | ||||||||||||||||||||||||||||||||||||||||||||||||||||||||||||||||||||||||||||||||||||||||||||||||||||||||||||||||||
| Greater than 100 percent | Greater than 100 percent | 1,061 | 265 | 416 | 127 | 34 | 25 | 194 | Greater than 100 percent | 801 | 451 | 155 | 57 | 16 | 14 | 108 | ||||||||||||||||||||||||||||||||||||||||||||||||||||||||||||||||||||||||||||||||||||||||||||||||||||||||||||||||||
| Fully-insured loans | Fully-insured loans | 11,967 | 722 | 4,122 | 1,693 | 316 | 302 | 4,812 | Fully-insured loans | 12,624 | 2,945 | 3,698 | 1,370 | 253 | 259 | 4,099 | ||||||||||||||||||||||||||||||||||||||||||||||||||||||||||||||||||||||||||||||||||||||||||||||||||||||||||||||||||
| Total Residential Mortgage | Total Residential Mortgage | $ | 214,779 | $ | 26,131 | $ | 67,881 | $ | 37,070 | $ | 11,558 | $ | 17,206 | $ | 54,933 | Total Residential Mortgage | $ | 216,940 | $ | 71,425 | $ | 53,106 | $ | 28,010 | $ | 8,748 | $ | 12,784 | $ | 42,867 | ||||||||||||||||||||||||||||||||||||||||||||||||||||||||||||||||||||||||||||||||||||||||||||||||||||
| Total Residential Mortgage | Total Residential Mortgage | Total Residential Mortgage | ||||||||||||||||||||||||||||||||||||||||||||||||||||||||||||||||||||||||||||||||||||||||||||||||||||||||||||||||||||||||||||||||
| Refreshed FICO score | Refreshed FICO score | Refreshed FICO score | ||||||||||||||||||||||||||||||||||||||||||||||||||||||||||||||||||||||||||||||||||||||||||||||||||||||||||||||||||||||||||||||||
| Less than 620 | Less than 620 | $ | 2,601 | $ | 316 | $ | 550 | $ | 162 | $ | 131 | $ | 139 | $ | 1,303 | Less than 620 | $ | 2,499 | $ | 517 | $ | 480 | $ | 151 | $ | 123 | $ | 124 | $ | 1,104 | ||||||||||||||||||||||||||||||||||||||||||||||||||||||||||||||||||||||||||||||||||||||||||||||||||||
| Greater than or equal to 620 and less than 680 | Greater than or equal to 620 and less than 680 | 5,167 | 522 | 1,374 | 640 | 405 | 352 | 1,874 | Greater than or equal to 620 and less than 680 | 4,932 | 1,057 | 1,162 | 525 | 318 | 310 | 1,560 | ||||||||||||||||||||||||||||||||||||||||||||||||||||||||||||||||||||||||||||||||||||||||||||||||||||||||||||||||||
| Greater than or equal to 680 and less than 740 | Greater than or equal to 680 and less than 740 | 23,267 | 2,345 | 6,998 | 3,670 | 1,570 | 1,993 | 6,691 | Greater than or equal to 680 and less than 740 | 23,689 | 6,536 | 5,973 | 2,935 | 1,225 | 1,563 | 5,457 | ||||||||||||||||||||||||||||||||||||||||||||||||||||||||||||||||||||||||||||||||||||||||||||||||||||||||||||||||||
| Greater than or equal to 740 | Greater than or equal to 740 | 171,777 | 22,226 | 54,837 | 30,905 | 9,136 | 14,420 | 40,253 | Greater than or equal to 740 | 173,196 | 60,370 | 41,793 | 23,029 | 6,829 | 10,528 | 30,647 | ||||||||||||||||||||||||||||||||||||||||||||||||||||||||||||||||||||||||||||||||||||||||||||||||||||||||||||||||||
| Fully-insured loans | Fully-insured loans | 11,967 | 722 | 4,122 | 1,693 | 316 | 302 | 4,812 | Fully-insured loans | 12,624 | 2,945 | 3,698 | 1,370 | 253 | 259 | 4,099 | ||||||||||||||||||||||||||||||||||||||||||||||||||||||||||||||||||||||||||||||||||||||||||||||||||||||||||||||||||
| Total Residential Mortgage | Total Residential Mortgage | $ | 214,779 | $ | 26,131 | $ | 67,881 | $ | 37,070 | $ | 11,558 | $ | 17,206 | $ | 54,933 | Total Residential Mortgage | $ | 216,940 | $ | 71,425 | $ | 53,106 | $ | 28,010 | $ | 8,748 | $ | 12,784 | $ | 42,867 | ||||||||||||||||||||||||||||||||||||||||||||||||||||||||||||||||||||||||||||||||||||||||||||||||||||
| Home Equity - Credit Quality Indicators | Home Equity - Credit Quality Indicators | Home Equity - Credit Quality Indicators | ||||||||||||||||||||||||||||||||||||||||||||||||||||||||||||||||||||||||||||||||||||||||||||||||||||||||||||||||||||||||||
| Total | Home Equity Loans and Reverse Mortgages (1) | Revolving Loans | Revolving Loans Converted to Term Loans | Total | Home Equity Loans and Reverse Mortgages (1) | Revolving Loans | Revolving Loans Converted to Term Loans | |||||||||||||||||||||||||||||||||||||||||||||||||||||||||||||||||||||||||||||||||||||||||||||||||||||||||||||||||||||
| (Dollars in millions) | (Dollars in millions) | March 31, 2021 | (Dollars in millions) | September 30, 2021 | ||||||||||||||||||||||||||||||||||||||||||||||||||||||||||||||||||||||||||||||||||||||||||||||||||||||||||||||||||||||||
| Total Home Equity | Total Home Equity | Total Home Equity | ||||||||||||||||||||||||||||||||||||||||||||||||||||||||||||||||||||||||||||||||||||||||||||||||||||||||||||||||||||||||||
Refreshed LTV | Refreshed LTV | Refreshed LTV | ||||||||||||||||||||||||||||||||||||||||||||||||||||||||||||||||||||||||||||||||||||||||||||||||||||||||||||||||||||||||||
| Less than or equal to 90 percent | Less than or equal to 90 percent | $ | 31,330 | $ | 1,885 | $ | 21,131 | $ | 8,314 | Less than or equal to 90 percent | $ | 28,529 | $ | 1,789 | $ | 19,526 | $ | 7,214 | ||||||||||||||||||||||||||||||||||||||||||||||||||||||||||||||||||||||||||||||||||||||||||||||||||||||||||
| Greater than 90 percent but less than or equal to 100 percent | Greater than 90 percent but less than or equal to 100 percent | 307 | 116 | 82 | 109 | Greater than 90 percent but less than or equal to 100 percent | 192 | 83 | 47 | 62 | ||||||||||||||||||||||||||||||||||||||||||||||||||||||||||||||||||||||||||||||||||||||||||||||||||||||||||||||||||
| Greater than 100 percent | Greater than 100 percent | 441 | 156 | 104 | 181 | Greater than 100 percent | 279 | 105 | 70 | 104 | ||||||||||||||||||||||||||||||||||||||||||||||||||||||||||||||||||||||||||||||||||||||||||||||||||||||||||||||||||
| Total Home Equity | Total Home Equity | $ | 32,078 | $ | 2,157 | $ | 21,317 | $ | 8,604 | Total Home Equity | $ | 29,000 | $ | 1,977 | $ | 19,643 | $ | 7,380 | ||||||||||||||||||||||||||||||||||||||||||||||||||||||||||||||||||||||||||||||||||||||||||||||||||||||||||
| Total Home Equity | Total Home Equity | Total Home Equity | ||||||||||||||||||||||||||||||||||||||||||||||||||||||||||||||||||||||||||||||||||||||||||||||||||||||||||||||||||||||||||
| Refreshed FICO score | Refreshed FICO score | Refreshed FICO score | ||||||||||||||||||||||||||||||||||||||||||||||||||||||||||||||||||||||||||||||||||||||||||||||||||||||||||||||||||||||||||
| Less than 620 | Less than 620 | $ | 1,046 | $ | 251 | $ | 237 | $ | 558 | Less than 620 | $ | 930 | $ | 240 | $ | 214 | $ | 476 | ||||||||||||||||||||||||||||||||||||||||||||||||||||||||||||||||||||||||||||||||||||||||||||||||||||||||||
| Greater than or equal to 620 and less than 680 | Greater than or equal to 620 and less than 680 | 1,686 | 247 | 541 | 898 | Greater than or equal to 620 and less than 680 | 1,483 | 230 | 497 | 756 | ||||||||||||||||||||||||||||||||||||||||||||||||||||||||||||||||||||||||||||||||||||||||||||||||||||||||||||||||||
| Greater than or equal to 680 and less than 740 | Greater than or equal to 680 and less than 740 | 5,308 | 540 | 2,649 | 2,119 | Greater than or equal to 680 and less than 740 | 4,807 | 487 | 2,509 | 1,811 | ||||||||||||||||||||||||||||||||||||||||||||||||||||||||||||||||||||||||||||||||||||||||||||||||||||||||||||||||||
| Greater than or equal to 740 | Greater than or equal to 740 | 24,038 | 1,119 | 17,890 | 5,029 | Greater than or equal to 740 | 21,780 | 1,020 | 16,423 | 4,337 | ||||||||||||||||||||||||||||||||||||||||||||||||||||||||||||||||||||||||||||||||||||||||||||||||||||||||||||||||||
| Total Home Equity | Total Home Equity | $ | 32,078 | $ | 2,157 | $ | 21,317 | $ | 8,604 | Total Home Equity | $ | 29,000 | $ | 1,977 | $ | 19,643 | $ | 7,380 | ||||||||||||||||||||||||||||||||||||||||||||||||||||||||||||||||||||||||||||||||||||||||||||||||||||||||||
| Credit Card and Direct/Indirect Consumer – Credit Quality Indicators By Vintage | Credit Card and Direct/Indirect Consumer – Credit Quality Indicators By Vintage | Credit Card and Direct/Indirect Consumer – Credit Quality Indicators By Vintage | ||||||||||||||||||||||||||||||||||||||||||||||||||||||||||||||||||||||||||||||||||||||||||||||||||||||||||||||||||||||||||||||||
| Direct/Indirect | Direct/Indirect | |||||||||||||||||||||||||||||||||||||||||||||||||||||||||||||||||||||||||||||||||||||||||||||||||||||||||||||||||||||||||||||||||
| Term Loans by Origination Year | Credit Card | Term Loans by Origination Year | Credit Card | |||||||||||||||||||||||||||||||||||||||||||||||||||||||||||||||||||||||||||||||||||||||||||||||||||||||||||||||||||||||||||||||
| (Dollars in millions) | (Dollars in millions) | Total Direct/Indirect as of March 31, 2021 | Revolving Loans | 2021 | 2020 | 2019 | 2018 | 2017 | Prior | Total Credit Card as of March 31, 2021 | Revolving Loans | Revolving Loans Converted to Term Loans (3) | (Dollars in millions) | Total Direct/ Indirect as of September 30, 2021 | Revolving Loans | 2021 | 2020 | 2019 | 2018 | 2017 | Prior | Total Credit Card as of September 30, 2021 | Revolving Loans | Revolving Loans Converted to Term Loans (1) | ||||||||||||||||||||||||||||||||||||||||||||||||||||||||||||||||||||||||||||||||||||||||||||||||||||||||||
| Refreshed FICO score | Refreshed FICO score | Refreshed FICO score | ||||||||||||||||||||||||||||||||||||||||||||||||||||||||||||||||||||||||||||||||||||||||||||||||||||||||||||||||||||||||||||||||
| Less than 620 | Less than 620 | $ | 830 | $ | 17 | $ | 16 | $ | 120 | $ | 185 | $ | 146 | $ | 192 | $ | 154 | $ | 3,416 | $ | 3,235 | $ | 181 | Less than 620 | $ | 677 | $ | 14 | $ | 117 | $ | 110 | $ | 139 | $ | 95 | $ | 122 | $ | 80 | $ | 2,846 | $ | 2,686 | $ | 160 | ||||||||||||||||||||||||||||||||||||||||||||||||||||||||||||||||||||||||||||||||||||
| Greater than or equal to 620 and less than 680 | Greater than or equal to 620 and less than 680 | 2,003 | 18 | 191 | 585 | 476 | 273 | 243 | 217 | 8,482 | 8,267 | 215 | Greater than or equal to 620 and less than 680 | 2,194 | 15 | 890 | 464 | 355 | 173 | 165 | 132 | 8,665 | 8,460 | 205 | ||||||||||||||||||||||||||||||||||||||||||||||||||||||||||||||||||||||||||||||||||||||||||||||||||||||||||
| Greater than or equal to 680 and less than 740 | Greater than or equal to 680 and less than 740 | 7,230 | 71 | 958 | 2,462 | 1,722 | 853 | 597 | 567 | 25,592 | 25,392 | 200 | Greater than or equal to 680 and less than 740 | 8,083 | 63 | 3,544 | 1,869 | 1,290 | 565 | 390 | 362 | 26,939 | 26,740 | 199 | ||||||||||||||||||||||||||||||||||||||||||||||||||||||||||||||||||||||||||||||||||||||||||||||||||||||||||
| Greater than or equal to 740 | Greater than or equal to 740 | 35,592 | 106 | 3,750 | 11,521 | 9,507 | 4,982 | 2,885 | 2,841 | 35,296 | 35,249 | 47 | Greater than or equal to 740 | 36,456 | 97 | 12,248 | 9,572 | 7,425 | 3,284 | 1,940 | 1,890 | 38,419 | 38,370 | 49 | ||||||||||||||||||||||||||||||||||||||||||||||||||||||||||||||||||||||||||||||||||||||||||||||||||||||||||
Other internal credit metrics (1, 2) | 46,082 | 45,490 | 46 | 79 | 119 | 87 | 65 | 196 | 0 | 0 | 0 | |||||||||||||||||||||||||||||||||||||||||||||||||||||||||||||||||||||||||||||||||||||||||||||||||||||||||||||||||||||||
Other internal credit metrics (2,3) | Other internal credit metrics (2,3) | 52,435 | 51,699 | 283 | 67 | 91 | 84 | 61 | 150 | — | — | — | ||||||||||||||||||||||||||||||||||||||||||||||||||||||||||||||||||||||||||||||||||||||||||||||||||||||||||||||||||||||
| Total credit card and other consumer | Total credit card and other consumer | $ | 91,737 | $ | 45,702 | $ | 4,961 | $ | 14,767 | $ | 12,009 | $ | 6,341 | $ | 3,982 | $ | 3,975 | $ | 72,786 | $ | 72,143 | $ | 643 | Total credit card and other consumer | $ | 99,845 | $ | 51,888 | $ | 17,082 | $ | 12,082 | $ | 9,300 | $ | 4,201 | $ | 2,678 | $ | 2,614 | $ | 76,869 | $ | 76,256 | $ | 613 | ||||||||||||||||||||||||||||||||||||||||||||||||||||||||||||||||||||||||||||||||||||
Bank of America | ||||||||
Commercial – Credit Quality Indicators By Vintage (1, 2) | Commercial – Credit Quality Indicators By Vintage (1, 2) | Commercial – Credit Quality Indicators By Vintage (1, 2) | ||||||||||||||||||||||||||||||||||||||||||||||||||||||||||||||||||||||||||||||||||||||||||||
| Term Loans | Term Loans | |||||||||||||||||||||||||||||||||||||||||||||||||||||||||||||||||||||||||||||||||||||||||||||
| Amortized Cost Basis by Origination Year | Amortized Cost Basis by Origination Year | |||||||||||||||||||||||||||||||||||||||||||||||||||||||||||||||||||||||||||||||||||||||||||||
| (Dollars in millions) | (Dollars in millions) | Total as of March 31, 2021 | 2021 | 2020 | 2019 | 2018 | 2017 | Prior | Revolving Loans | (Dollars in millions) | Total as of September 30, 2021 | 2021 | 2020 | 2019 | 2018 | 2017 | Prior | Revolving Loans | ||||||||||||||||||||||||||||||||||||||||||||||||||||||||||||||||||||||||||||
| U.S. Commercial | U.S. Commercial | U.S. Commercial | ||||||||||||||||||||||||||||||||||||||||||||||||||||||||||||||||||||||||||||||||||||||||||||
| Risk ratings | Risk ratings | Risk ratings | ||||||||||||||||||||||||||||||||||||||||||||||||||||||||||||||||||||||||||||||||||||||||||||
| Pass rated | Pass rated | $ | 266,387 | $ | 9,884 | $ | 29,264 | $ | 31,405 | $ | 15,382 | $ | 13,010 | $ | 28,776 | $ | 138,666 | Pass rated | $ | 284,704 | $ | 39,184 | $ | 24,933 | $ | 25,500 | $ | 11,900 | $ | 11,207 | $ | 23,764 | $ | 148,216 | ||||||||||||||||||||||||||||||||||||||||||||||||||||||||||||
| Reservable criticized | Reservable criticized | 16,842 | 72 | 1,512 | 2,339 | 2,594 | 793 | 1,844 | 7,688 | Reservable criticized | 11,223 | 461 | 1,082 | 1,491 | 1,730 | 583 | 1,191 | 4,685 | ||||||||||||||||||||||||||||||||||||||||||||||||||||||||||||||||||||||||||||
| Total U.S. Commercial | Total U.S. Commercial | $ | 283,229 | $ | 9,956 | $ | 30,776 | $ | 33,744 | $ | 17,976 | $ | 13,803 | $ | 30,620 | $ | 146,354 | Total U.S. Commercial | $ | 295,927 | $ | 39,645 | $ | 26,015 | $ | 26,991 | $ | 13,630 | $ | 11,790 | $ | 24,955 | $ | 152,901 | ||||||||||||||||||||||||||||||||||||||||||||||||||||||||||||
| Non-U.S. Commercial | Non-U.S. Commercial | Non-U.S. Commercial | ||||||||||||||||||||||||||||||||||||||||||||||||||||||||||||||||||||||||||||||||||||||||||||
| Risk ratings | Risk ratings | Risk ratings | ||||||||||||||||||||||||||||||||||||||||||||||||||||||||||||||||||||||||||||||||||||||||||||
| Pass rated | Pass rated | $ | 87,089 | $ | 4,618 | $ | 13,801 | $ | 9,692 | $ | 6,189 | $ | 3,595 | $ | 3,165 | $ | 46,029 | Pass rated | $ | 100,057 | $ | 17,768 | $ | 10,213 | $ | 7,795 | $ | 4,775 | $ | 3,633 | $ | 3,000 | $ | 52,873 | ||||||||||||||||||||||||||||||||||||||||||||||||||||||||||||
| Reservable criticized | Reservable criticized | 4,246 | 272 | 809 | 736 | 498 | 395 | 397 | 1,139 | Reservable criticized | 2,793 | 188 | 341 | 616 | 378 | 200 | 285 | 785 | ||||||||||||||||||||||||||||||||||||||||||||||||||||||||||||||||||||||||||||
| Total Non-U.S. Commercial | Total Non-U.S. Commercial | $ | 91,335 | $ | 4,890 | $ | 14,610 | $ | 10,428 | $ | 6,687 | $ | 3,990 | $ | 3,562 | $ | 47,168 | Total Non-U.S. Commercial | $ | 102,850 | $ | 17,956 | $ | 10,554 | $ | 8,411 | $ | 5,153 | $ | 3,833 | $ | 3,285 | $ | 53,658 | ||||||||||||||||||||||||||||||||||||||||||||||||||||||||||||
| Commercial Real Estate | Commercial Real Estate | Commercial Real Estate | ||||||||||||||||||||||||||||||||||||||||||||||||||||||||||||||||||||||||||||||||||||||||||||
| Risk ratings | Risk ratings | Risk ratings | ||||||||||||||||||||||||||||||||||||||||||||||||||||||||||||||||||||||||||||||||||||||||||||
| Pass rated | Pass rated | $ | 49,019 | $ | 1,535 | $ | 8,053 | $ | 13,295 | $ | 7,503 | $ | 4,590 | $ | 9,241 | $ | 4,802 | Pass rated | $ | 52,861 | $ | 8,993 | $ | 7,653 | $ | 12,445 | $ | 7,021 | $ | 3,742 | $ | 7,669 | $ | 5,338 | ||||||||||||||||||||||||||||||||||||||||||||||||||||||||||||
| Reservable criticized | Reservable criticized | 9,745 | 143 | 794 | 2,688 | 2,225 | 1,356 | 1,910 | 629 | Reservable criticized | 7,862 | 209 | 993 | 1,972 | 1,856 | 996 | 1,339 | 497 | ||||||||||||||||||||||||||||||||||||||||||||||||||||||||||||||||||||||||||||
| Total Commercial Real Estate | Total Commercial Real Estate | $ | 58,764 | $ | 1,678 | $ | 8,847 | $ | 15,983 | $ | 9,728 | $ | 5,946 | $ | 11,151 | $ | 5,431 | Total Commercial Real Estate | $ | 60,723 | $ | 9,202 | $ | 8,646 | $ | 14,417 | $ | 8,877 | $ | 4,738 | $ | 9,008 | $ | 5,835 | ||||||||||||||||||||||||||||||||||||||||||||||||||||||||||||
| Commercial Lease Financing | Commercial Lease Financing | Commercial Lease Financing | ||||||||||||||||||||||||||||||||||||||||||||||||||||||||||||||||||||||||||||||||||||||||||||
| Risk ratings | Risk ratings | Risk ratings | ||||||||||||||||||||||||||||||||||||||||||||||||||||||||||||||||||||||||||||||||||||||||||||
| Pass rated | Pass rated | $ | 15,666 | $ | 437 | $ | 2,938 | $ | 3,123 | $ | 2,597 | $ | 2,331 | $ | 4,240 | $ | 0 | Pass rated | $ | 14,640 | $ | 1,515 | $ | 2,641 | $ | 2,921 | $ | 2,203 | $ | 2,020 | $ | 3,340 | $ | — | ||||||||||||||||||||||||||||||||||||||||||||||||||||||||||||
| Reservable criticized | Reservable criticized | 693 | 28 | 110 | 148 | 112 | 70 | 225 | 0 | Reservable criticized | 404 | 27 | 11 | 96 | 71 | 52 | 147 | — | ||||||||||||||||||||||||||||||||||||||||||||||||||||||||||||||||||||||||||||
| Total Commercial Lease Financing | Total Commercial Lease Financing | $ | 16,359 | $ | 465 | $ | 3,048 | $ | 3,271 | $ | 2,709 | $ | 2,401 | $ | 4,465 | $ | 0 | Total Commercial Lease Financing | $ | 15,044 | $ | 1,542 | $ | 2,652 | $ | 3,017 | $ | 2,274 | $ | 2,072 | $ | 3,487 | $ | — | ||||||||||||||||||||||||||||||||||||||||||||||||||||||||||||
U.S. Small Business Commercial (3) | U.S. Small Business Commercial (3) | U.S. Small Business Commercial (3) | ||||||||||||||||||||||||||||||||||||||||||||||||||||||||||||||||||||||||||||||||||||||||||||
| Risk ratings | Risk ratings | Risk ratings | ||||||||||||||||||||||||||||||||||||||||||||||||||||||||||||||||||||||||||||||||||||||||||||
| Pass rated | Pass rated | $ | 27,410 | $ | 8,323 | $ | 15,411 | $ | 1,118 | $ | 829 | $ | 729 | $ | 838 | $ | 162 | Pass rated | $ | 15,149 | $ | 6,414 | $ | 4,524 | $ | 1,101 | $ | 800 | $ | 665 | $ | 1,504 | $ | 141 | ||||||||||||||||||||||||||||||||||||||||||||||||||||||||||||
| Reservable criticized | Reservable criticized | 911 | 2 | 60 | 201 | 173 | 131 | 335 | 9 | Reservable criticized | 546 | 7 | 32 | 111 | 99 | 78 | 216 | 3 | ||||||||||||||||||||||||||||||||||||||||||||||||||||||||||||||||||||||||||||
| Total U.S. Small Business Commercial | Total U.S. Small Business Commercial | $ | 28,321 | $ | 8,325 | $ | 15,471 | $ | 1,319 | $ | 1,002 | $ | 860 | $ | 1,173 | $ | 171 | Total U.S. Small Business Commercial | $ | 15,695 | $ | 6,421 | $ | 4,556 | $ | 1,212 | $ | 899 | $ | 743 | $ | 1,720 | $ | 144 | ||||||||||||||||||||||||||||||||||||||||||||||||||||||||||||
| Total | Total | $ | 478,008 | $ | 25,314 | $ | 72,752 | $ | 64,745 | $ | 38,102 | $ | 27,000 | $ | 50,971 | $ | 199,124 | Total | $ | 490,239 | $ | 74,766 | $ | 52,423 | $ | 54,048 | $ | 30,833 | $ | 23,176 | $ | 42,455 | $ | 212,538 | ||||||||||||||||||||||||||||||||||||||||||||||||||||||||||||
| Residential Mortgage – Credit Quality Indicators By Vintage | ||||||||||||||||||||||||||||||||||||||||||||||||||||||||||||||||||||||||||||||||||||||||||||||||||||||||||||||||||||||||||||||||||
| Term Loans by Origination Year | Term Loans by Origination Year | |||||||||||||||||||||||||||||||||||||||||||||||||||||||||||||||||||||||||||||||||||||||||||||||||||||||||||||||||||||||||||||||||
| (Dollars in millions) | (Dollars in millions) | Total as of December 31, 2020 | 2020 | 2019 | 2018 | 2017 | 2016 | Prior | (Dollars in millions) | Total as of December 31, 2020 | 2020 | 2019 | 2018 | 2017 | 2016 | Prior | ||||||||||||||||||||||||||||||||||||||||||||||||||||||||||||||||||||||||||||||||||||||||||||||||||||||||||||||||||
| Total Residential Mortgage | Total Residential Mortgage | Total Residential Mortgage | ||||||||||||||||||||||||||||||||||||||||||||||||||||||||||||||||||||||||||||||||||||||||||||||||||||||||||||||||||||||||||||||||
Refreshed LTV | Refreshed LTV | Refreshed LTV | ||||||||||||||||||||||||||||||||||||||||||||||||||||||||||||||||||||||||||||||||||||||||||||||||||||||||||||||||||||||||||||||||
| Less than or equal to 90 percent | Less than or equal to 90 percent | $ | 207,389 | $ | 68,907 | $ | 43,771 | $ | 14,658 | $ | 21,589 | $ | 22,967 | $ | 35,497 | Less than or equal to 90 percent | $ | 207,389 | $ | 68,907 | $ | 43,771 | $ | 14,658 | $ | 21,589 | $ | 22,967 | $ | 35,497 | ||||||||||||||||||||||||||||||||||||||||||||||||||||||||||||||||||||||||||||||||||||||||||||||||||||
| Greater than 90 percent but less than or equal to 100 percent | Greater than 90 percent but less than or equal to 100 percent | 3,138 | 1,970 | 684 | 128 | 70 | 96 | 190 | Greater than 90 percent but less than or equal to 100 percent | 3,138 | 1,970 | 684 | 128 | 70 | 96 | 190 | ||||||||||||||||||||||||||||||||||||||||||||||||||||||||||||||||||||||||||||||||||||||||||||||||||||||||||||||||||
| Greater than 100 percent | Greater than 100 percent | 1,210 | 702 | 174 | 47 | 39 | 37 | 211 | Greater than 100 percent | 1,210 | 702 | 174 | 47 | 39 | 37 | 211 | ||||||||||||||||||||||||||||||||||||||||||||||||||||||||||||||||||||||||||||||||||||||||||||||||||||||||||||||||||
| Fully-insured loans | Fully-insured loans | 11,818 | 3,826 | 2,014 | 370 | 342 | 1,970 | 3,296 | Fully-insured loans | 11,818 | 3,826 | 2,014 | 370 | 342 | 1,970 | 3,296 | ||||||||||||||||||||||||||||||||||||||||||||||||||||||||||||||||||||||||||||||||||||||||||||||||||||||||||||||||||
| Total Residential Mortgage | Total Residential Mortgage | $ | 223,555 | $ | 75,405 | $ | 46,643 | $ | 15,203 | $ | 22,040 | $ | 25,070 | $ | 39,194 | Total Residential Mortgage | $ | 223,555 | $ | 75,405 | $ | 46,643 | $ | 15,203 | $ | 22,040 | $ | 25,070 | $ | 39,194 | ||||||||||||||||||||||||||||||||||||||||||||||||||||||||||||||||||||||||||||||||||||||||||||||||||||
| Total Residential Mortgage | Total Residential Mortgage | Total Residential Mortgage | ||||||||||||||||||||||||||||||||||||||||||||||||||||||||||||||||||||||||||||||||||||||||||||||||||||||||||||||||||||||||||||||||
| Refreshed FICO score | Refreshed FICO score | Refreshed FICO score | ||||||||||||||||||||||||||||||||||||||||||||||||||||||||||||||||||||||||||||||||||||||||||||||||||||||||||||||||||||||||||||||||
| Less than 620 | Less than 620 | $ | 2,717 | $ | 823 | $ | 177 | $ | 139 | $ | 170 | $ | 150 | $ | 1,258 | Less than 620 | $ | 2,717 | $ | 823 | $ | 177 | $ | 139 | $ | 170 | $ | 150 | $ | 1,258 | ||||||||||||||||||||||||||||||||||||||||||||||||||||||||||||||||||||||||||||||||||||||||||||||||||||
| Greater than or equal to 620 and less than 680 | Greater than or equal to 620 and less than 680 | 5,462 | 1,804 | 666 | 468 | 385 | 368 | 1,771 | Greater than or equal to 620 and less than 680 | 5,462 | 1,804 | 666 | 468 | 385 | 368 | 1,771 | ||||||||||||||||||||||||||||||||||||||||||||||||||||||||||||||||||||||||||||||||||||||||||||||||||||||||||||||||||
| Greater than or equal to 680 and less than 740 | Greater than or equal to 680 and less than 740 | 25,349 | 8,533 | 4,679 | 1,972 | 2,427 | 2,307 | 5,431 | Greater than or equal to 680 and less than 740 | 25,349 | 8,533 | 4,679 | 1,972 | 2,427 | 2,307 | 5,431 | ||||||||||||||||||||||||||||||||||||||||||||||||||||||||||||||||||||||||||||||||||||||||||||||||||||||||||||||||||
| Greater than or equal to 740 | Greater than or equal to 740 | 178,209 | 60,419 | 39,107 | 12,254 | 18,716 | 20,275 | 27,438 | Greater than or equal to 740 | 178,209 | 60,419 | 39,107 | 12,254 | 18,716 | 20,275 | 27,438 | ||||||||||||||||||||||||||||||||||||||||||||||||||||||||||||||||||||||||||||||||||||||||||||||||||||||||||||||||||
| Fully-insured loans | Fully-insured loans | 11,818 | 3,826 | 2,014 | 370 | 342 | 1,970 | 3,296 | Fully-insured loans | 11,818 | 3,826 | 2,014 | 370 | 342 | 1,970 | 3,296 | ||||||||||||||||||||||||||||||||||||||||||||||||||||||||||||||||||||||||||||||||||||||||||||||||||||||||||||||||||
| Total Residential Mortgage | Total Residential Mortgage | $ | 223,555 | $ | 75,405 | $ | 46,643 | $ | 15,203 | $ | 22,040 | $ | 25,070 | $ | 39,194 | Total Residential Mortgage | $ | 223,555 | $ | 75,405 | $ | 46,643 | $ | 15,203 | $ | 22,040 | $ | 25,070 | $ | 39,194 | ||||||||||||||||||||||||||||||||||||||||||||||||||||||||||||||||||||||||||||||||||||||||||||||||||||
| Home Equity - Credit Quality Indicators | ||||||||||||||||||||||||||||||||||||||||||||||||||||||||||||||
| Total | Home Equity Loans and Reverse Mortgages (1) | Revolving Loans | Revolving Loans Converted to Term Loans | |||||||||||||||||||||||||||||||||||||||||||||||||||||||||||
| (Dollars in millions) | December 31, 2020 | |||||||||||||||||||||||||||||||||||||||||||||||||||||||||||||
| Total Home Equity | ||||||||||||||||||||||||||||||||||||||||||||||||||||||||||||||
Refreshed LTV | ||||||||||||||||||||||||||||||||||||||||||||||||||||||||||||||
| Less than or equal to 90 percent | $ | 33,447 | $ | 1,919 | $ | 22,639 | $ | 8,889 | ||||||||||||||||||||||||||||||||||||||||||||||||||||||
| Greater than 90 percent but less than or equal to 100 percent | 351 | 126 | 94 | 131 | ||||||||||||||||||||||||||||||||||||||||||||||||||||||||||
| Greater than 100 percent | 513 | 172 | 118 | 223 | ||||||||||||||||||||||||||||||||||||||||||||||||||||||||||
| Total Home Equity | $ | 34,311 | $ | 2,217 | $ | 22,851 | $ | 9,243 | ||||||||||||||||||||||||||||||||||||||||||||||||||||||
| Total Home Equity | ||||||||||||||||||||||||||||||||||||||||||||||||||||||||||||||
| Refreshed FICO score | ||||||||||||||||||||||||||||||||||||||||||||||||||||||||||||||
| Less than 620 | $ | 1,082 | $ | 250 | $ | 244 | $ | 588 | ||||||||||||||||||||||||||||||||||||||||||||||||||||||
| Greater than or equal to 620 and less than 680 | 1,798 | 263 | 568 | 967 | ||||||||||||||||||||||||||||||||||||||||||||||||||||||||||
| Greater than or equal to 680 and less than 740 | 5,762 | 556 | 2,905 | 2,301 | ||||||||||||||||||||||||||||||||||||||||||||||||||||||||||
| Greater than or equal to 740 | 25,669 | 1,148 | 19,134 | 5,387 | ||||||||||||||||||||||||||||||||||||||||||||||||||||||||||
| Total Home Equity | $ | 34,311 | $ | 2,217 | $ | 22,851 | $ | 9,243 | ||||||||||||||||||||||||||||||||||||||||||||||||||||||
Bank of America | ||||||||
| Credit Card and Direct/Indirect Consumer – Credit Quality Indicators By Vintage | Credit Card and Direct/Indirect Consumer – Credit Quality Indicators By Vintage | Credit Card and Direct/Indirect Consumer – Credit Quality Indicators By Vintage | ||||||||||||||||||||||||||||||||||||||||||||||||||||||||||||||||||||||||||||||||||||||||||||||||||||||||||||||||||||||||||||||||
| Direct/Indirect | Direct/Indirect | |||||||||||||||||||||||||||||||||||||||||||||||||||||||||||||||||||||||||||||||||||||||||||||||||||||||||||||||||||||||||||||||||
| Term Loans by Origination Year | Credit Card | Term Loans by Origination Year | Credit Card | |||||||||||||||||||||||||||||||||||||||||||||||||||||||||||||||||||||||||||||||||||||||||||||||||||||||||||||||||||||||||||||||
| (Dollars in millions) | (Dollars in millions) | Total Direct/Indirect as of December 31, 2020 | Revolving Loans | 2020 | 2019 | 2018 | 2017 | 2016 | Prior | Total Credit Card as of December 31, 2020 | Revolving Loans | Revolving Loans Converted to Term Loans (3) | (Dollars in millions) | Total Direct/Indirect as of December 31, 2020 | Revolving Loans | 2020 | 2019 | 2018 | 2017 | 2016 | Prior | Total Credit Card as of December 31, 2020 | Revolving Loans | Revolving Loans Converted to Term Loans (1) | ||||||||||||||||||||||||||||||||||||||||||||||||||||||||||||||||||||||||||||||||||||||||||||||||||||||||||
| Refreshed FICO score | Refreshed FICO score | Refreshed FICO score | ||||||||||||||||||||||||||||||||||||||||||||||||||||||||||||||||||||||||||||||||||||||||||||||||||||||||||||||||||||||||||||||||
| Less than 620 | Less than 620 | $ | 959 | $ | 19 | $ | 111 | $ | 200 | $ | 175 | $ | 243 | $ | 148 | $ | 63 | $ | 4,018 | $ | 3,832 | $ | 186 | Less than 620 | $ | 959 | $ | 19 | $ | 111 | $ | 200 | $ | 175 | $ | 243 | $ | 148 | $ | 63 | $ | 4,018 | $ | 3,832 | $ | 186 | ||||||||||||||||||||||||||||||||||||||||||||||||||||||||||||||||||||||||||||||||||||
| Greater than or equal to 620 and less than 680 | Greater than or equal to 620 and less than 680 | 2,143 | 20 | 653 | 559 | 329 | 301 | 176 | 105 | 9,419 | 9,201 | 218 | Greater than or equal to 620 and less than 680 | 2,143 | 20 | 653 | 559 | 329 | 301 | 176 | 105 | 9,419 | 9,201 | 218 | ||||||||||||||||||||||||||||||||||||||||||||||||||||||||||||||||||||||||||||||||||||||||||||||||||||||||||
| Greater than or equal to 680 and less than 740 | Greater than or equal to 680 and less than 740 | 7,431 | 80 | 2,848 | 2,015 | 1,033 | 739 | 400 | 316 | 27,585 | 27,392 | 193 | Greater than or equal to 680 and less than 740 | 7,431 | 80 | 2,848 | 2,015 | 1,033 | 739 | 400 | 316 | 27,585 | 27,392 | 193 | ||||||||||||||||||||||||||||||||||||||||||||||||||||||||||||||||||||||||||||||||||||||||||||||||||||||||||
| Greater than or equal to 740 | Greater than or equal to 740 | 36,064 | 120 | 12,540 | 10,588 | 5,869 | 3,495 | 1,781 | 1,671 | 37,686 | 37,642 | 44 | Greater than or equal to 740 | 36,064 | 120 | 12,540 | 10,588 | 5,869 | 3,495 | 1,781 | 1,671 | 37,686 | 37,642 | 44 | ||||||||||||||||||||||||||||||||||||||||||||||||||||||||||||||||||||||||||||||||||||||||||||||||||||||||||
Other internal credit metrics (1, 2) | 44,766 | 44,098 | 74 | 115 | 84 | 67 | 52 | 276 | 0 | 0 | 0 | |||||||||||||||||||||||||||||||||||||||||||||||||||||||||||||||||||||||||||||||||||||||||||||||||||||||||||||||||||||||
Other internal credit metrics (2, 3) | Other internal credit metrics (2, 3) | 44,766 | 44,098 | 74 | 115 | 84 | 67 | 52 | 276 | — | — | — | ||||||||||||||||||||||||||||||||||||||||||||||||||||||||||||||||||||||||||||||||||||||||||||||||||||||||||||||||||||||
| Total credit card and other consumer | Total credit card and other consumer | $ | 91,363 | $ | 44,337 | $ | 16,226 | $ | 13,477 | $ | 7,490 | $ | 4,845 | $ | 2,557 | $ | 2,431 | $ | 78,708 | $ | 78,067 | $ | 641 | Total credit card and other consumer | $ | 91,363 | $ | 44,337 | $ | 16,226 | $ | 13,477 | $ | 7,490 | $ | 4,845 | $ | 2,557 | $ | 2,431 | $ | 78,708 | $ | 78,067 | $ | 641 | ||||||||||||||||||||||||||||||||||||||||||||||||||||||||||||||||||||||||||||||||||||
Commercial – Credit Quality Indicators By Vintage (1, 2) | Commercial – Credit Quality Indicators By Vintage (1, 2) | Commercial – Credit Quality Indicators By Vintage (1, 2) | ||||||||||||||||||||||||||||||||||||||||||||||||||||||||||||||||||||||||||||||||||||||||||||||||||||||||
| Term Loans | Term Loans | |||||||||||||||||||||||||||||||||||||||||||||||||||||||||||||||||||||||||||||||||||||||||||||||||||||||||
| Amortized Cost Basis by Origination Year | Amortized Cost Basis by Origination Year | |||||||||||||||||||||||||||||||||||||||||||||||||||||||||||||||||||||||||||||||||||||||||||||||||||||||||
| (Dollars in millions) | (Dollars in millions) | Total as of December 31, 2020 | 2020 | 2019 | 2018 | 2017 | 2016 | Prior | Revolving Loans | (Dollars in millions) | Total as of December 31, 2020 | 2020 | 2019 | 2018 | 2017 | 2016 | Prior | Revolving Loans | ||||||||||||||||||||||||||||||||||||||||||||||||||||||||||||||||||||||||||||||||||||||||
| U.S. Commercial | U.S. Commercial | U.S. Commercial | ||||||||||||||||||||||||||||||||||||||||||||||||||||||||||||||||||||||||||||||||||||||||||||||||||||||||
| Risk ratings | Risk ratings | Risk ratings | ||||||||||||||||||||||||||||||||||||||||||||||||||||||||||||||||||||||||||||||||||||||||||||||||||||||||
| Pass rated | Pass rated | $ | 268,812 | $ | 33,456 | $ | 33,305 | $ | 17,363 | $ | 14,102 | $ | 7,420 | $ | 21,784 | $ | 141,382 | Pass rated | $ | 268,812 | $ | 33,456 | $ | 33,305 | $ | 17,363 | $ | 14,102 | $ | 7,420 | $ | 21,784 | $ | 141,382 | ||||||||||||||||||||||||||||||||||||||||||||||||||||||||||||||||||||||||
| Reservable criticized | Reservable criticized | 19,916 | 2,524 | 2,542 | 2,689 | 854 | 698 | 1,402 | 9,207 | Reservable criticized | 19,916 | 2,524 | 2,542 | 2,689 | 854 | 698 | 1,402 | 9,207 | ||||||||||||||||||||||||||||||||||||||||||||||||||||||||||||||||||||||||||||||||||||||||
| Total U.S. Commercial | Total U.S. Commercial | $ | 288,728 | $ | 35,980 | $ | 35,847 | $ | 20,052 | $ | 14,956 | $ | 8,118 | $ | 23,186 | $ | 150,589 | Total U.S. Commercial | $ | 288,728 | $ | 35,980 | $ | 35,847 | $ | 20,052 | $ | 14,956 | $ | 8,118 | $ | 23,186 | $ | 150,589 | ||||||||||||||||||||||||||||||||||||||||||||||||||||||||||||||||||||||||
| Non-U.S. Commercial | Non-U.S. Commercial | Non-U.S. Commercial | ||||||||||||||||||||||||||||||||||||||||||||||||||||||||||||||||||||||||||||||||||||||||||||||||||||||||
| Risk ratings | Risk ratings | Risk ratings | ||||||||||||||||||||||||||||||||||||||||||||||||||||||||||||||||||||||||||||||||||||||||||||||||||||||||
| Pass rated | Pass rated | $ | 85,914 | $ | 16,301 | $ | 11,396 | $ | 7,451 | $ | 5,037 | $ | 1,674 | $ | 2,194 | $ | 41,861 | Pass rated | $ | 85,914 | $ | 16,301 | $ | 11,396 | $ | 7,451 | $ | 5,037 | $ | 1,674 | $ | 2,194 | $ | 41,861 | ||||||||||||||||||||||||||||||||||||||||||||||||||||||||||||||||||||||||
| Reservable criticized | Reservable criticized | 4,546 | 914 | 572 | 492 | 436 | 138 | 259 | 1,735 | Reservable criticized | 4,546 | 914 | 572 | 492 | 436 | 138 | 259 | 1,735 | ||||||||||||||||||||||||||||||||||||||||||||||||||||||||||||||||||||||||||||||||||||||||
| Total Non-U.S. Commercial | Total Non-U.S. Commercial | $ | 90,460 | $ | 17,215 | $ | 11,968 | $ | 7,943 | $ | 5,473 | $ | 1,812 | $ | 2,453 | $ | 43,596 | Total Non-U.S. Commercial | $ | 90,460 | $ | 17,215 | $ | 11,968 | $ | 7,943 | $ | 5,473 | $ | 1,812 | $ | 2,453 | $ | 43,596 | ||||||||||||||||||||||||||||||||||||||||||||||||||||||||||||||||||||||||
| Commercial Real Estate | Commercial Real Estate | Commercial Real Estate | ||||||||||||||||||||||||||||||||||||||||||||||||||||||||||||||||||||||||||||||||||||||||||||||||||||||||
| Risk ratings | Risk ratings | Risk ratings | ||||||||||||||||||||||||||||||||||||||||||||||||||||||||||||||||||||||||||||||||||||||||||||||||||||||||
| Pass rated | Pass rated | $ | 50,260 | $ | 8,429 | $ | 14,126 | $ | 8,228 | $ | 4,599 | $ | 3,299 | $ | 6,542 | $ | 5,037 | Pass rated | $ | 50,260 | $ | 8,429 | $ | 14,126 | $ | 8,228 | $ | 4,599 | $ | 3,299 | $ | 6,542 | $ | 5,037 | ||||||||||||||||||||||||||||||||||||||||||||||||||||||||||||||||||||||||
| Reservable criticized | Reservable criticized | 10,104 | 933 | 2,558 | 2,115 | 1,582 | 606 | 1,436 | 874 | Reservable criticized | 10,104 | 933 | 2,558 | 2,115 | 1,582 | 606 | 1,436 | 874 | ||||||||||||||||||||||||||||||||||||||||||||||||||||||||||||||||||||||||||||||||||||||||
| Total Commercial Real Estate | Total Commercial Real Estate | $ | 60,364 | $ | 9,362 | $ | 16,684 | $ | 10,343 | $ | 6,181 | $ | 3,905 | $ | 7,978 | $ | 5,911 | Total Commercial Real Estate | $ | 60,364 | $ | 9,362 | $ | 16,684 | $ | 10,343 | $ | 6,181 | $ | 3,905 | $ | 7,978 | $ | 5,911 | ||||||||||||||||||||||||||||||||||||||||||||||||||||||||||||||||||||||||
| Commercial Lease Financing | Commercial Lease Financing | Commercial Lease Financing | ||||||||||||||||||||||||||||||||||||||||||||||||||||||||||||||||||||||||||||||||||||||||||||||||||||||||
| Risk ratings | Risk ratings | Risk ratings | ||||||||||||||||||||||||||||||||||||||||||||||||||||||||||||||||||||||||||||||||||||||||||||||||||||||||
| Pass rated | Pass rated | $ | 16,384 | $ | 3,083 | $ | 3,242 | $ | 2,956 | $ | 2,532 | $ | 1,703 | $ | 2,868 | $ | 0 | Pass rated | $ | 16,384 | $ | 3,083 | $ | 3,242 | $ | 2,956 | $ | 2,532 | $ | 1,703 | $ | 2,868 | $ | — | ||||||||||||||||||||||||||||||||||||||||||||||||||||||||||||||||||||||||
| Reservable criticized | Reservable criticized | 714 | 117 | 117 | 132 | 81 | 88 | 179 | 0 | Reservable criticized | 714 | 117 | 117 | 132 | 81 | 88 | 179 | — | ||||||||||||||||||||||||||||||||||||||||||||||||||||||||||||||||||||||||||||||||||||||||
| Total Commercial Lease Financing | Total Commercial Lease Financing | $ | 17,098 | $ | 3,200 | $ | 3,359 | $ | 3,088 | $ | 2,613 | $ | 1,791 | $ | 3,047 | $ | 0 | Total Commercial Lease Financing | $ | 17,098 | $ | 3,200 | $ | 3,359 | $ | 3,088 | $ | 2,613 | $ | 1,791 | $ | 3,047 | $ | — | ||||||||||||||||||||||||||||||||||||||||||||||||||||||||||||||||||||||||
U.S. Small Business Commercial (3) | U.S. Small Business Commercial (3) | U.S. Small Business Commercial (3) | ||||||||||||||||||||||||||||||||||||||||||||||||||||||||||||||||||||||||||||||||||||||||||||||||||||||||
| Risk ratings | Risk ratings | Risk ratings | ||||||||||||||||||||||||||||||||||||||||||||||||||||||||||||||||||||||||||||||||||||||||||||||||||||||||
| Pass rated | Pass rated | $ | 28,786 | $ | 24,539 | $ | 1,121 | $ | 837 | $ | 735 | $ | 527 | $ | 855 | $ | 172 | Pass rated | $ | 28,786 | $ | 24,539 | $ | 1,121 | $ | 837 | $ | 735 | $ | 527 | $ | 855 | $ | 172 | ||||||||||||||||||||||||||||||||||||||||||||||||||||||||||||||||||||||||
| Reservable criticized | Reservable criticized | 1,148 | 76 | 239 | 210 | 175 | 113 | 322 | 13 | Reservable criticized | 1,148 | 76 | 239 | 210 | 175 | 113 | 322 | 13 | ||||||||||||||||||||||||||||||||||||||||||||||||||||||||||||||||||||||||||||||||||||||||
| Total U.S. Small Business Commercial | Total U.S. Small Business Commercial | $ | 29,934 | $ | 24,615 | $ | 1,360 | $ | 1,047 | $ | 910 | $ | 640 | $ | 1,177 | $ | 185 | Total U.S. Small Business Commercial | $ | 29,934 | $ | 24,615 | $ | 1,360 | $ | 1,047 | $ | 910 | $ | 640 | $ | 1,177 | $ | 185 | ||||||||||||||||||||||||||||||||||||||||||||||||||||||||||||||||||||||||
| Total | Total | $ | 486,584 | $ | 90,372 | $ | 69,218 | $ | 42,473 | $ | 30,133 | $ | 16,266 | $ | 37,841 | $ | 200,281 | Total | $ | 486,584 | $ | 90,372 | $ | 69,218 | $ | 42,473 | $ | 30,133 | $ | 16,266 | $ | 37,841 | $ | 200,281 | ||||||||||||||||||||||||||||||||||||||||||||||||||||||||||||||||||||||||
71Bank of America | ||||||||
Consumer Real Estate – TDRs Entered into During the Three Months Ended March 31, 2021 and 2020 (1) | ||||||||||||||||||||||||||||||||||||||||||||||||||||||||||||||||||||||||||||||||||||||||||||||
| Consumer Real Estate – TDRs Entered into During the Three and Nine Months Ended September 30, 2021 and 2020 | Consumer Real Estate – TDRs Entered into During the Three and Nine Months Ended September 30, 2021 and 2020 | |||||||||||||||||||||||||||||||||||||||||||||||||||||||||||||||||||||||||||||||||||||||||||||
| Unpaid Principal Balance | Carrying Value | Pre-Modification Interest Rate | Post-Modification Interest Rate (2) | Unpaid Principal Balance | Carrying Value | Pre-Modification Interest Rate | Post-Modification Interest Rate (1) | Unpaid Principal Balance | Carrying Value | Pre-Modification Interest Rate | Post-Modification Interest Rate (1) | |||||||||||||||||||||||||||||||||||||||||||||||||||||||||||||||||||||||||||||||||||
| (Dollars in millions) | (Dollars in millions) | March 31, 2021 | (Dollars in millions) | Three Months Ended September 30, 2021 | Nine Months Ended September 30, 2021 | |||||||||||||||||||||||||||||||||||||||||||||||||||||||||||||||||||||||||||||||||||||||||
| Residential mortgage | Residential mortgage | $ | 519 | $ | 464 | 3.50 | % | 3.48 | % | Residential mortgage | $ | 451 | $ | 399 | 3.52 | % | 3.49 | % | $ | 832 | $ | 742 | 3.49 | % | 3.44 | % | ||||||||||||||||||||||||||||||||||||||||||||||||||||||||||||||||||||
| Home equity | Home equity | 62 | 49 | 3.43 | 3.44 | Home equity | 61 | 45 | 3.51 | 3.51 | 97 | 73 | 3.56 | 3.58 | ||||||||||||||||||||||||||||||||||||||||||||||||||||||||||||||||||||||||||||||||
| Total | Total | $ | 581 | $ | 513 | 3.49 | 3.48 | Total | $ | 512 | $ | 444 | 3.52 | 3.49 | $ | 929 | $ | 815 | 3.50 | 3.46 | ||||||||||||||||||||||||||||||||||||||||||||||||||||||||||||||||||||||||||
| Three Months Ended September 30, 2020 | Nine Months Ended September 30, 2020 | |||||||||||||||||||||||||||||||||||||||||||||||||||||||||||||||||||||||||||||||||||||||||||||
| March 31, 2020 | ||||||||||||||||||||||||||||||||||||||||||||||||||||||||||||||||||||||||||||||||||||||||||||||
| Residential mortgage | Residential mortgage | $ | 122 | $ | 103 | 4.04 | % | 3.94 | % | Residential mortgage | $ | 103 | $ | 88 | 4.06 | % | 3.99 | % | $ | 294 | $ | 244 | 4.07 | % | 3.90 | % | ||||||||||||||||||||||||||||||||||||||||||||||||||||||||||||||||||||
| Home equity | Home equity | 23 | 20 | 4.69 | 4.68 | Home equity | 12 | 10 | 4.25 | 4.08 | 56 | 45 | 3.85 | 3.73 | ||||||||||||||||||||||||||||||||||||||||||||||||||||||||||||||||||||||||||||||||
| Total | Total | $ | 145 | $ | 123 | 4.15 | 4.06 | Total | $ | 115 | $ | 98 | 4.08 | 4.00 | $ | 350 | $ | 289 | 4.03 | 3.87 | ||||||||||||||||||||||||||||||||||||||||||||||||||||||||||||||||||||||||||
Bank of America | ||||||||
Consumer Real Estate – Modification Programs (1) | |||||||||||||||||||||||||||||||||||
| TDRs Entered into During the Three Months Ended March 31 | |||||||||||||||||||||||||||||||||||
| (Dollars in millions) | 2021 | 2020 | |||||||||||||||||||||||||||||||||
| Modifications under government programs | $ | 1 | $ | 1 | |||||||||||||||||||||||||||||||
| Modifications under proprietary programs | 472 | 28 | |||||||||||||||||||||||||||||||||
Loans discharged in Chapter 7 bankruptcy (2) | 11 | 15 | |||||||||||||||||||||||||||||||||
| Trial modifications | 29 | 79 | |||||||||||||||||||||||||||||||||
| Total modifications | $ | 513 | $ | 123 | |||||||||||||||||||||||||||||||
| Consumer Real Estate – Modification Programs | |||||||||||||||||||||||||||||||||||
| TDRs Entered into During the | |||||||||||||||||||||||||||||||||||
| Three Months Ended September 30 | Nine Months Ended September 30 | ||||||||||||||||||||||||||||||||||
| (Dollars in millions) | 2021 | 2020 | 2021 | 2020 | |||||||||||||||||||||||||||||||
| Modifications under government programs | $ | — | $ | — | $ | 4 | $ | 8 | |||||||||||||||||||||||||||
| Modifications under proprietary programs | 417 | 50 | 740 | 136 | |||||||||||||||||||||||||||||||
Loans discharged in Chapter 7 bankruptcy (1) | 9 | 15 | 29 | 44 | |||||||||||||||||||||||||||||||
| Trial modifications | 18 | 33 | 42 | 101 | |||||||||||||||||||||||||||||||
| Total modifications | $ | 444 | $ | 98 | $ | 815 | $ | 289 | |||||||||||||||||||||||||||
Consumer Real Estate – TDRs Entering Payment Default that were Modified During the Preceding 12 Months | Consumer Real Estate – TDRs Entering Payment Default that were Modified During the Preceding 12 Months | Consumer Real Estate – TDRs Entering Payment Default that were Modified During the Preceding 12 Months | ||||||||||||||||||||||||||||||||||||||||||||||||||||||||||||||||||||||||||||||||||||||||||||||||||||||||||||||||||||
| Three Months Ended March 31 | Three Months Ended September 30 | Nine Months Ended September 30 | ||||||||||||||||||||||||||||||||||||||||||||||||||||||||||||||||||||||||||||||||||||||||||||||||||||||||||||||||||||
| (Dollars in millions) | (Dollars in millions) | 2021 | 2020 | (Dollars in millions) | 2021 | 2020 | 2021 | 2020 | ||||||||||||||||||||||||||||||||||||||||||||||||||||||||||||||||||||||||||||||||||||||||||||||||||||||||||||||
| Modifications under government programs | Modifications under government programs | $ | 1 | $ | 6 | Modifications under government programs | $ | 1 | $ | 6 | $ | 3 | $ | 14 | ||||||||||||||||||||||||||||||||||||||||||||||||||||||||||||||||||||||||||||||||||||||||||||||||||||||||
| Modifications under proprietary programs | Modifications under proprietary programs | 12 | 14 | Modifications under proprietary programs | 35 | 8 | 80 | 27 | ||||||||||||||||||||||||||||||||||||||||||||||||||||||||||||||||||||||||||||||||||||||||||||||||||||||||||||||
Loans discharged in Chapter 7 bankruptcy | Loans discharged in Chapter 7 bankruptcy | 3 | 7 | Loans discharged in Chapter 7 bankruptcy | 1 | 4 | 6 | 15 | ||||||||||||||||||||||||||||||||||||||||||||||||||||||||||||||||||||||||||||||||||||||||||||||||||||||||||||||
Trial modifications | Trial modifications | 6 | 18 | Trial modifications | 3 | 15 | 15 | 45 | ||||||||||||||||||||||||||||||||||||||||||||||||||||||||||||||||||||||||||||||||||||||||||||||||||||||||||||||
| Total modifications | Total modifications | $ | 22 | $ | 45 | Total modifications | $ | 40 | $ | 33 | $ | 104 | $ | 101 | ||||||||||||||||||||||||||||||||||||||||||||||||||||||||||||||||||||||||||||||||||||||||||||||||||||||||
Credit Card and Other Consumer – TDRs Entered into During the Three Months Ended March 31, 2021 and 2020 (1) | ||||||||||||||||||||||||||||||||||||||||||||||||||||||||||||||||||||||||||||||||||||||||||||||||||||||||||||||||||||||||||||
| Credit Card and Other Consumer – TDRs Entered into During the Three and Nine Months Ended September 30, 2021 and 2020 | Credit Card and Other Consumer – TDRs Entered into During the Three and Nine Months Ended September 30, 2021 and 2020 | |||||||||||||||||||||||||||||||||||||||||||||||||||||||||||||||||||||||||||||||||||||||||||||||||||||||||||||||||||||||||||
| Unpaid Principal Balance | Carrying Value (2) | Pre-Modification Interest Rate | Post-Modification Interest Rate | |||||||||||||||||||||||||||||||||||||||||||||||||||||||||||||||||||||||||||||||||||||||||||||||||||||||||||||||||||||||||
| Unpaid Principal Balance | Carrying Value (1) | Pre-Modification Interest Rate | Post-Modification Interest Rate | Unpaid Principal Balance | Carrying Value (1) | Pre-Modification Interest Rate | Post-Modification Interest Rate | |||||||||||||||||||||||||||||||||||||||||||||||||||||||||||||||||||||||||||||||||||||||||||||||||||||||||||||||||||||
| (Dollars in millions) | (Dollars in millions) | March 31, 2021 | (Dollars in millions) | Three Months Ended September 30, 2021 | Nine Months Ended September 30, 2021 | |||||||||||||||||||||||||||||||||||||||||||||||||||||||||||||||||||||||||||||||||||||||||||||||||||||||||||||||||||||||
| Credit card | Credit card | $ | 82 | $ | 90 | 18.55 | % | 4.97 | % | Credit card | $ | 66 | $ | 71 | 18.48 | % | 3.71 | % | $ | 189 | $ | 200 | 18.47 | % | 4.26 % | |||||||||||||||||||||||||||||||||||||||||||||||||||||||||||||||||||||||||||||||||||||||||||||||||||
| Direct/Indirect consumer | Direct/Indirect consumer | 8 | 5 | 5.64 | 5.64 | Direct/Indirect consumer | 4 | 2 | 5.20 | 5.20 | 13 | 8 | 5.53 | 5.53 | ||||||||||||||||||||||||||||||||||||||||||||||||||||||||||||||||||||||||||||||||||||||||||||||||||||||||||||||
| Total | Total | $ | 90 | $ | 95 | 17.85 | 5.01 | Total | $ | 70 | $ | 73 | 18.06 | 3.76 | $ | 202 | $ | 208 | 17.99 | 4.31 | ||||||||||||||||||||||||||||||||||||||||||||||||||||||||||||||||||||||||||||||||||||||||||||||||||||||||
| March 31, 2020 | Three Months Ended September 30, 2020 | Nine Months Ended September 30, 2020 | ||||||||||||||||||||||||||||||||||||||||||||||||||||||||||||||||||||||||||||||||||||||||||||||||||||||||||||||||||||||||||
| Credit card | Credit card | $ | 94 | $ | 101 | 18.52 | % | 5.30 | % | Credit card | $ | 71 | $ | 77 | 18.19 | % | 6.86 | % | $ | 203 | $ | 214 | 18.06 | % | 5.82 | % | ||||||||||||||||||||||||||||||||||||||||||||||||||||||||||||||||||||||||||||||||||||||||||||||||||
| Direct/Indirect consumer | Direct/Indirect consumer | 17 | 9 | 5.34 | 5.34 | Direct/Indirect consumer | 35 | 29 | 6.02 | 6.02 | 50 | 37 | 5.87 | 5.87 | ||||||||||||||||||||||||||||||||||||||||||||||||||||||||||||||||||||||||||||||||||||||||||||||||||||||||||||||
| Total | Total | $ | 111 | $ | 110 | 17.40 | 5.30 | Total | $ | 106 | $ | 106 | 14.85 | 6.63 | $ | 253 | $ | 251 | 16.29 | 5.83 | ||||||||||||||||||||||||||||||||||||||||||||||||||||||||||||||||||||||||||||||||||||||||||||||||||||||||
73Bank of America | ||||||||
Credit Card and Other Consumer – TDRs by Program Type (1) | |||||||||||||||||||||||||||||||||||||||||||||||||||||||||||||||||||||||||||||
| TDRs Entered into During the Three Months Ended March 31 | |||||||||||||||||||||||||||||||||||||||||||||||||||||||||||||||||||||||||||||
| (Dollars in millions) | 2021 | 2020 | |||||||||||||||||||||||||||||||||||||||||||||||||||||||||||||||||||||||||||
| Internal programs | $ | 74 | $ | 74 | |||||||||||||||||||||||||||||||||||||||||||||||||||||||||||||||||||||||||
| External programs | 17 | 27 | |||||||||||||||||||||||||||||||||||||||||||||||||||||||||||||||||||||||||||
| Other | 4 | 9 | |||||||||||||||||||||||||||||||||||||||||||||||||||||||||||||||||||||||||||
| Total | $ | 95 | $ | 110 | |||||||||||||||||||||||||||||||||||||||||||||||||||||||||||||||||||||||||
| Credit Card and Other Consumer – TDRs by Program Type | |||||||||||||||||||||||||||||||||||||||||||||||||||||||||||||||||||||||||||||
| TDRs Entered into During the Three Months Ended September 30 | TDRs Entered into During the Nine Months Ended September 30 | ||||||||||||||||||||||||||||||||||||||||||||||||||||||||||||||||||||||||||||
| (Dollars in millions) | 2021 | 2020 | 2021 | 2020 | |||||||||||||||||||||||||||||||||||||||||||||||||||||||||||||||||||||||||
| Internal programs | $ | 60 | $ | 80 | $ | 166 | $ | 178 | |||||||||||||||||||||||||||||||||||||||||||||||||||||||||||||||||||||
| External programs | 11 | 19 | 37 | 59 | |||||||||||||||||||||||||||||||||||||||||||||||||||||||||||||||||||||||||
| Other | 2 | 7 | 5 | 14 | |||||||||||||||||||||||||||||||||||||||||||||||||||||||||||||||||||||||||
| Total | $ | 73 | $ | 106 | $ | 208 | $ | 251 | |||||||||||||||||||||||||||||||||||||||||||||||||||||||||||||||||||||
Bank of America74 | ||||||||
| Consumer Real Estate | Credit Card and Other Consumer | Commercial | Total | ||||||||||||||||||||
| (Dollars in millions) | Three Months Ended March 31, 2021 | ||||||||||||||||||||||
| Allowance for loan and lease losses, January 1 | $ | 858 | $ | 9,213 | $ | 8,731 | $ | 18,802 | |||||||||||||||
| Loans and leases charged off | (15) | (977) | (194) | (1,186) | |||||||||||||||||||
| Recoveries of loans and leases previously charged off | 54 | 245 | 64 | 363 | |||||||||||||||||||
| Net charge-offs | 39 | (732) | (130) | (823) | |||||||||||||||||||
| Provision for loan and lease losses | (207) | (536) | (1,068) | (1,811) | |||||||||||||||||||
| Other | (1) | 1 | 0 | 0 | |||||||||||||||||||
| Allowance for loan and lease losses, March 31 | 689 | 7,946 | 7,533 | 16,168 | |||||||||||||||||||
| Reserve for unfunded lending commitments, January 1 | 137 | 0 | 1,741 | 1,878 | |||||||||||||||||||
| Provision for unfunded lending commitments | (13) | 0 | (36) | (49) | |||||||||||||||||||
| Reserve for unfunded lending commitments, March 31 | 124 | 0 | 1,705 | 1,829 | |||||||||||||||||||
| Allowance for credit losses, March 31 | $ | 813 | $ | 7,946 | $ | 9,238 | $ | 17,997 | |||||||||||||||
| Three Months Ended March 31, 2020 | |||||||||||||||||||||||
| Allowance for loan and lease losses, January 1 | $ | 440 | $ | 7,430 | $ | 4,488 | $ | 12,358 | |||||||||||||||
| Loans and leases charged off | (35) | (1,121) | (282) | (1,438) | |||||||||||||||||||
| Recoveries of loans and leases previously charged off | 47 | 237 | 32 | 316 | |||||||||||||||||||
| Net charge-offs | 12 | (884) | (250) | (1,122) | |||||||||||||||||||
| Provision for loan and lease losses | 351 | 1,712 | 2,462 | 4,525 | |||||||||||||||||||
| Other | 5 | 0 | 0 | 5 | |||||||||||||||||||
| Allowance for loan and lease losses, March 31 | 808 | 8,258 | 6,700 | 15,766 | |||||||||||||||||||
| Reserve for unfunded lending commitments, January 1 | 119 | 0 | 1,004 | 1,123 | |||||||||||||||||||
| Provision for unfunded lending commitments | 30 | 0 | 206 | 236 | |||||||||||||||||||
| Other | 0 | 0 | 1 | 1 | |||||||||||||||||||
| Reserve for unfunded lending commitments, March 31 | 149 | 0 | 1,211 | 1,360 | |||||||||||||||||||
| Allowance for credit losses, March 31 | $ | 957 | $ | 8,258 | $ | 7,911 | $ | 17,126 | |||||||||||||||
75Bank of America | ||||||||
| Consumer Real Estate | Credit Card and Other Consumer | Commercial | Total | ||||||||||||||||||||
| (Dollars in millions) | Three Months Ended September 30, 2021 | ||||||||||||||||||||||
| Allowance for loan and lease losses, July 1 | $ | 597 | $ | 6,835 | $ | 6,663 | $ | 14,095 | |||||||||||||||
| Loans and leases charged off | (15) | (626) | (165) | (806) | |||||||||||||||||||
| Recoveries of loans and leases previously charged off | 56 | 256 | 31 | 343 | |||||||||||||||||||
| Net charge-offs | 41 | (370) | (134) | (463) | |||||||||||||||||||
| Provision for loan and lease losses | (85) | 175 | (565) | (475) | |||||||||||||||||||
| Other | 2 | (1) | (3) | (2) | |||||||||||||||||||
| Allowance for loan and lease losses, September 30 | 555 | 6,639 | 5,961 | 13,155 | |||||||||||||||||||
| Reserve for unfunded lending commitments, July 1 | 107 | — | 1,580 | 1,687 | |||||||||||||||||||
| Provision for unfunded lending commitments | (9) | — | (140) | (149) | |||||||||||||||||||
| Reserve for unfunded lending commitments, September 30 | 98 | — | 1,440 | 1,538 | |||||||||||||||||||
| Allowance for credit losses, September 30 | $ | 653 | $ | 6,639 | $ | 7,401 | $ | 14,693 | |||||||||||||||
| Three Months Ended September 30, 2020 | |||||||||||||||||||||||
| Allowance for loan and lease losses, July 1 | $ | 833 | $ | 10,122 | $ | 8,434 | $ | 19,389 | |||||||||||||||
| Loans and leases charged off | (13) | (810) | (470) | (1,293) | |||||||||||||||||||
| Recoveries of loans and leases previously charged off | 39 | 220 | 62 | 321 | |||||||||||||||||||
| Net charge-offs | 26 | (590) | (408) | (972) | |||||||||||||||||||
| Provision for loan and lease losses | (6) | 304 | 882 | 1,180 | |||||||||||||||||||
| Other | 2 | — | (3) | (1) | |||||||||||||||||||
| Allowance for loan and lease losses, September 30 | 855 | 9,836 | 8,905 | 19,596 | |||||||||||||||||||
| Reserve for unfunded lending commitments, July 1 | 141 | — | 1,561 | 1,702 | |||||||||||||||||||
| Provision for unfunded lending commitments | (3) | — | 212 | 209 | |||||||||||||||||||
| Other | — | — | (1) | (1) | |||||||||||||||||||
| Reserve for unfunded lending commitments, September 30 | 138 | — | 1,772 | 1,910 | |||||||||||||||||||
| Allowance for credit losses, September 30 | $ | 993 | $ | 9,836 | $ | 10,677 | $ | 21,506 | |||||||||||||||
| (Dollars in millions) | Nine Months Ended September 30, 2021 | ||||||||||||||||||||||
| Allowance for loan and lease losses, January 1 | $ | 858 | $ | 9,213 | $ | 8,731 | $ | 18,802 | |||||||||||||||
| Loans and leases charged off | (60) | (2,402) | (591) | (3,053) | |||||||||||||||||||
| Recoveries of loans and leases previously charged off | 170 | 757 | 245 | 1,172 | |||||||||||||||||||
| Net charge-offs | 110 | (1,645) | (346) | (1,881) | |||||||||||||||||||
| Provision for loan and lease losses | (414) | (929) | (2,423) | (3,766) | |||||||||||||||||||
| Other | 1 | — | (1) | — | |||||||||||||||||||
| Allowance for loan and lease losses, September 30 | 555 | 6,639 | 5,961 | 13,155 | |||||||||||||||||||
| Reserve for unfunded lending commitments, January 1 | 137 | — | 1,741 | 1,878 | |||||||||||||||||||
| Provision for unfunded lending commitments | (39) | — | (300) | (339) | |||||||||||||||||||
| Other | — | — | (1) | (1) | |||||||||||||||||||
| Reserve for unfunded lending commitments, September 30 | 98 | — | 1,440 | 1,538 | |||||||||||||||||||
| Allowance for credit losses, September 30 | $ | 653 | $ | 6,639 | $ | 7,401 | $ | 14,693 | |||||||||||||||
| Nine Months Ended September 30, 2020 | |||||||||||||||||||||||
| Allowance for loan and lease losses, January 1 | $ | 440 | $ | 7,430 | $ | 4,488 | $ | 12,358 | |||||||||||||||
| Loans and leases charged off | (75) | (2,916) | (1,199) | (4,190) | |||||||||||||||||||
| Recoveries of loans and leases previously charged off | 147 | 674 | 129 | 950 | |||||||||||||||||||
| Net charge-offs | 72 | (2,242) | (1,070) | (3,240) | |||||||||||||||||||
| Provision for loan and lease losses | 336 | 4,648 | 5,496 | 10,480 | |||||||||||||||||||
| Other | 7 | — | (9) | (2) | |||||||||||||||||||
| Allowance for loan and lease losses, September 30 | 855 | 9,836 | 8,905 | 19,596 | |||||||||||||||||||
| Reserve for unfunded lending commitments, January 1 | 119 | — | 1,004 | 1,123 | |||||||||||||||||||
| Provision for unfunded lending commitments | 19 | — | 768 | 787 | |||||||||||||||||||
| Reserve for unfunded lending commitments, September 30 | 138 | — | 1,772 | 1,910 | |||||||||||||||||||
| Allowance for credit losses, September 30 | $ | 993 | $ | 9,836 | $ | 10,677 | $ | 21,506 | |||||||||||||||
Bank of America76 | ||||||||
| First-lien Mortgage Securitizations | First-lien Mortgage Securitizations | First-lien Mortgage Securitizations | ||||||||||||||||||||||||||||||||||||||||||||||||||||||||||||||||||||||||||||||||||||||||||||||||||||||||||||||||||||
| Residential Mortgage - Agency | Commercial Mortgage | Residential Mortgage - Agency | Commercial Mortgage | |||||||||||||||||||||||||||||||||||||||||||||||||||||||||||||||||||||||||||||||||||||||||||||||||||||||||||||||||||
| Three Months Ended March 31 | Three Months Ended September 30 | Nine Months Ended September 30 | Three Months Ended September 30 | Nine Months Ended September 30 | ||||||||||||||||||||||||||||||||||||||||||||||||||||||||||||||||||||||||||||||||||||||||||||||||||||||||||||||||||
| (Dollars in millions) | (Dollars in millions) | 2021 | 2020 | 2021 | 2020 | (Dollars in millions) | 2021 | 2020 | 2021 | 2020 | 2021 | 2020 | 2021 | 2020 | ||||||||||||||||||||||||||||||||||||||||||||||||||||||||||||||||||||||||||||||||||||||||||||||||||||||||
Proceeds from loan sales (1) | Proceeds from loan sales (1) | $ | 1,243 | $ | 1,552 | $ | 665 | $ | 2,072 | Proceeds from loan sales (1) | $ | 2,153 | $ | 1,698 | $ | 5,047 | $ | 14,625 | $ | 3,122 | $ | 945 | $ | 5,961 | $ | 3,237 | ||||||||||||||||||||||||||||||||||||||||||||||||||||||||||||||||||||||||||||||||||||||||||||
Gains on securitizations (2) | Gains on securitizations (2) | 2 | 6 | 33 | 41 | Gains on securitizations (2) | 3 | 3 | 8 | 724 | 41 | 17 | 105 | 57 | ||||||||||||||||||||||||||||||||||||||||||||||||||||||||||||||||||||||||||||||||||||||||||||||||||||||||
Repurchases from securitization trusts (3) | Repurchases from securitization trusts (3) | 80 | 128 | 0 | 0 | Repurchases from securitization trusts (3) | 156 | 68 | 512 | 363 | — | — | — | — | ||||||||||||||||||||||||||||||||||||||||||||||||||||||||||||||||||||||||||||||||||||||||||||||||||||||||
| First-lien Mortgage VIEs | ||||||||||||||||||||||||||||||||||||||||||||
| Residential Mortgage | ||||||||||||||||||||||||||||||||||||||||||||
| Non-agency | ||||||||||||||||||||||||||||||||||||||||||||
| Agency | Prime | Subprime | Alt-A | Commercial Mortgage | ||||||||||||||||||||||||||||||||||||||||
| (Dollars in millions) | March 31 2021 | December 31 2020 | March 31 2021 | December 31 2020 | March 31 2021 | December 31 2020 | March 31 2021 | December 31 2020 | March 31 2021 | December 31 2020 | ||||||||||||||||||||||||||||||||||
| Unconsolidated VIEs | ||||||||||||||||||||||||||||||||||||||||||||
Maximum loss exposure (1) | $ | 12,823 | $ | 13,477 | $ | 230 | $ | 250 | $ | 1,021 | $ | 1,031 | $ | 54 | $ | 46 | $ | 1,210 | $ | 1,169 | ||||||||||||||||||||||||
| On-balance sheet assets | ||||||||||||||||||||||||||||||||||||||||||||
| Senior securities: | ||||||||||||||||||||||||||||||||||||||||||||
| Trading account assets | $ | 193 | $ | 152 | $ | 2 | $ | 2 | $ | 20 | $ | 8 | $ | 21 | $ | 12 | $ | 6 | $ | 60 | ||||||||||||||||||||||||
| Debt securities carried at fair value | 6,925 | 7,588 | 95 | 103 | 658 | 676 | 32 | 33 | 0 | 0 | ||||||||||||||||||||||||||||||||||
| Held-to-maturity securities | 5,705 | 5,737 | 0 | 0 | 0 | 0 | 0 | 0 | 981 | 925 | ||||||||||||||||||||||||||||||||||
| All other assets | 0 | 0 | 6 | 6 | 27 | 26 | 1 | 1 | 77 | 50 | ||||||||||||||||||||||||||||||||||
| Total retained positions | $ | 12,823 | $ | 13,477 | $ | 103 | $ | 111 | $ | 705 | $ | 710 | $ | 54 | $ | 46 | $ | 1,064 | $ | 1,035 | ||||||||||||||||||||||||
Principal balance outstanding (2) | $ | 123,941 | $ | 133,497 | $ | 5,723 | $ | 6,081 | $ | 6,369 | $ | 6,691 | $ | 15,884 | $ | 16,554 | $ | 71,605 | $ | 59,268 | ||||||||||||||||||||||||
| Consolidated VIEs | ||||||||||||||||||||||||||||||||||||||||||||
Maximum loss exposure (1) | $ | 1,018 | $ | 1,328 | $ | 6 | $ | 66 | $ | 53 | $ | 53 | $ | 0 | $ | 0 | $ | 0 | $ | 0 | ||||||||||||||||||||||||
| On-balance sheet assets | ||||||||||||||||||||||||||||||||||||||||||||
| Trading account assets | $ | 1,018 | $ | 1,328 | $ | 88 | $ | 350 | $ | 253 | $ | 260 | $ | 0 | $ | 0 | $ | 0 | $ | 0 | ||||||||||||||||||||||||
| All other assets | 0 | 0 | 0 | 0 | 1 | 0 | 0 | 0 | 0 | 0 | ||||||||||||||||||||||||||||||||||
| Total assets | $ | 1,018 | $ | 1,328 | $ | 88 | $ | 350 | $ | 254 | $ | 260 | $ | 0 | $ | 0 | $ | 0 | $ | 0 | ||||||||||||||||||||||||
| Total liabilities | $ | 0 | $ | 0 | $ | 82 | $ | 284 | $ | 201 | $ | 207 | $ | 0 | $ | 0 | $ | 0 | $ | 0 | ||||||||||||||||||||||||
77Bank of America | ||||||||
| First-lien Mortgage VIEs | ||||||||||||||||||||||||||||||||||||||||||||
| Residential Mortgage | ||||||||||||||||||||||||||||||||||||||||||||
| Non-agency | ||||||||||||||||||||||||||||||||||||||||||||
| Agency | Prime | Subprime | Alt-A | Commercial Mortgage | ||||||||||||||||||||||||||||||||||||||||
| (Dollars in millions) | Sep 30 2021 | December 31 2020 | Sep 30 2021 | December 31 2020 | Sep 30 2021 | December 31 2020 | Sep 30 2021 | December 31 2020 | Sep 30 2021 | December 31 2020 | ||||||||||||||||||||||||||||||||||
| Unconsolidated VIEs | ||||||||||||||||||||||||||||||||||||||||||||
Maximum loss exposure (1) | $ | 12,308 | $ | 13,477 | $ | 219 | $ | 250 | $ | 992 | $ | 1,031 | $ | 51 | $ | 46 | $ | 1,343 | $ | 1,169 | ||||||||||||||||||||||||
| On-balance sheet assets | ||||||||||||||||||||||||||||||||||||||||||||
| Senior securities: | ||||||||||||||||||||||||||||||||||||||||||||
| Trading account assets | $ | 230 | $ | 152 | $ | 18 | $ | 2 | $ | 26 | $ | 8 | $ | 20 | $ | 12 | $ | 53 | $ | 60 | ||||||||||||||||||||||||
| Debt securities carried at fair value | 5,738 | 7,588 | 80 | 103 | 638 | 676 | 30 | 33 | — | — | ||||||||||||||||||||||||||||||||||
| Held-to-maturity securities | 6,340 | 5,737 | — | — | — | — | — | — | 1,047 | 925 | ||||||||||||||||||||||||||||||||||
| All other assets | — | — | 6 | 6 | 26 | 26 | 1 | 1 | 68 | 50 | ||||||||||||||||||||||||||||||||||
| Total retained positions | $ | 12,308 | $ | 13,477 | $ | 104 | $ | 111 | $ | 690 | $ | 710 | $ | 51 | $ | 46 | $ | 1,168 | $ | 1,035 | ||||||||||||||||||||||||
Principal balance outstanding (2) | $ | 106,969 | $ | 133,497 | $ | 5,059 | $ | 6,081 | $ | 5,995 | $ | 6,691 | $ | 14,404 | $ | 16,554 | $ | 70,864 | $ | 59,268 | ||||||||||||||||||||||||
| Consolidated VIEs | ||||||||||||||||||||||||||||||||||||||||||||
Maximum loss exposure (1) | $ | 1,174 | $ | 1,328 | $ | 10 | $ | 66 | $ | 23 | $ | 53 | $ | — | $ | — | $ | — | $ | — | ||||||||||||||||||||||||
| On-balance sheet assets | ||||||||||||||||||||||||||||||||||||||||||||
| Trading account assets | $ | 1,174 | $ | 1,328 | $ | 38 | $ | 350 | $ | 217 | $ | 260 | $ | — | $ | — | $ | — | $ | — | ||||||||||||||||||||||||
| Total assets | $ | 1,174 | $ | 1,328 | $ | 38 | $ | 350 | $ | 217 | $ | 260 | $ | — | $ | — | $ | — | $ | — | ||||||||||||||||||||||||
| Total liabilities | $ | — | $ | — | $ | 28 | $ | 284 | $ | 194 | $ | 207 | $ | — | $ | — | $ | — | $ | — | ||||||||||||||||||||||||
| Home Equity Loan, Credit Card and Other Asset-backed VIEs | Home Equity Loan, Credit Card and Other Asset-backed VIEs | Home Equity Loan, Credit Card and Other Asset-backed VIEs | ||||||||||||||||||||||||||||||||||||||||||||||||||||||||||||||||||||||||||||||||||||||
Home Equity (1) | Credit Card (2) | Resecuritization Trusts | Municipal Bond Trusts | Home Equity (1) | Credit Card (2) | Resecuritization Trusts | Municipal Bond Trusts | |||||||||||||||||||||||||||||||||||||||||||||||||||||||||||||||||||||||||||||||||
| (Dollars in millions) | (Dollars in millions) | March 31 2021 | December 31 2020 | March 31 2021 | December 31 2020 | March 31 2021 | December 31 2020 | March 31 2021 | December 31 2020 | (Dollars in millions) | Sep 30 2021 | December 31 2020 | Sep 30 2021 | December 31 2020 | Sep 30 2021 | December 31 2020 | Sep 30 2021 | December 31 2020 | ||||||||||||||||||||||||||||||||||||||||||||||||||||||||||||||||||||||
| Unconsolidated VIEs | Unconsolidated VIEs | Unconsolidated VIEs | ||||||||||||||||||||||||||||||||||||||||||||||||||||||||||||||||||||||||||||||||||||||
| Maximum loss exposure | Maximum loss exposure | $ | 193 | $ | 206 | $ | 0 | $ | 0 | $ | 7,532 | $ | 8,543 | $ | 3,569 | $ | 3,507 | Maximum loss exposure | $ | 167 | $ | 206 | $ | — | $ | — | $ | 6,896 | $ | 8,543 | $ | 3,862 | $ | 3,507 | ||||||||||||||||||||||||||||||||||||||||||||||||||||||
| On-balance sheet assets | On-balance sheet assets | On-balance sheet assets | ||||||||||||||||||||||||||||||||||||||||||||||||||||||||||||||||||||||||||||||||||||||
Securities (3): | Securities (3): | Securities (3): | ||||||||||||||||||||||||||||||||||||||||||||||||||||||||||||||||||||||||||||||||||||||
| Trading account assets | Trading account assets | $ | 0 | $ | 0 | $ | 0 | $ | 0 | $ | 638 | $ | 948 | $ | 0 | $ | 0 | Trading account assets | $ | — | $ | — | $ | — | $ | — | $ | 1,306 | $ | 948 | $ | — | $ | — | ||||||||||||||||||||||||||||||||||||||||||||||||||||||
| Debt securities carried at fair value | Debt securities carried at fair value | 2 | 2 | 0 | 0 | 2,500 | 2,727 | 0 | 0 | Debt securities carried at fair value | 1 | 2 | — | — | 2,087 | 2,727 | — | — | ||||||||||||||||||||||||||||||||||||||||||||||||||||||||||||||||||||||
| Held-to-maturity securities | Held-to-maturity securities | 0 | 0 | 0 | 0 | 4,394 | 4,868 | 0 | 0 | Held-to-maturity securities | — | — | — | — | 3,503 | 4,868 | — | — | ||||||||||||||||||||||||||||||||||||||||||||||||||||||||||||||||||||||
| Total retained positions | Total retained positions | $ | 2 | $ | 2 | $ | 0 | $ | 0 | $ | 7,532 | $ | 8,543 | $ | 0 | $ | 0 | Total retained positions | $ | 1 | $ | 2 | $ | — | $ | — | $ | 6,896 | $ | 8,543 | $ | — | $ | — | ||||||||||||||||||||||||||||||||||||||||||||||||||||||
| Total assets of VIEs | Total assets of VIEs | $ | 557 | $ | 609 | $ | 0 | $ | 0 | $ | 16,056 | $ | 17,250 | $ | 4,115 | $ | 4,042 | Total assets of VIEs | $ | 455 | $ | 609 | $ | — | $ | — | $ | 16,665 | $ | 17,250 | $ | 4,417 | $ | 4,042 | ||||||||||||||||||||||||||||||||||||||||||||||||||||||
| Consolidated VIEs | Consolidated VIEs | Consolidated VIEs | ||||||||||||||||||||||||||||||||||||||||||||||||||||||||||||||||||||||||||||||||||||||
| Maximum loss exposure | Maximum loss exposure | $ | 55 | $ | 58 | $ | 12,111 | $ | 14,606 | $ | 377 | $ | 217 | $ | 565 | $ | 1,030 | Maximum loss exposure | $ | 48 | $ | 58 | $ | 9,944 | $ | 14,606 | $ | 211 | $ | 217 | $ | 301 | $ | 1,030 | ||||||||||||||||||||||||||||||||||||||||||||||||||||||
| On-balance sheet assets | On-balance sheet assets | On-balance sheet assets | ||||||||||||||||||||||||||||||||||||||||||||||||||||||||||||||||||||||||||||||||||||||
| Trading account assets | Trading account assets | $ | 0 | $ | 0 | $ | 0 | $ | 0 | $ | 381 | $ | 217 | $ | 525 | $ | 990 | Trading account assets | $ | — | $ | — | $ | — | $ | — | $ | 219 | $ | 217 | $ | 261 | $ | 990 | ||||||||||||||||||||||||||||||||||||||||||||||||||||||
| Loans and leases | Loans and leases | 201 | 218 | 16,798 | 21,310 | 0 | 0 | 0 | 0 | Loans and leases | 168 | 218 | 14,139 | 21,310 | — | — | — | — | ||||||||||||||||||||||||||||||||||||||||||||||||||||||||||||||||||||||
| Allowance for loan and lease losses | Allowance for loan and lease losses | 15 | 14 | (1,273) | (1,704) | 0 | 0 | 0 | 0 | Allowance for loan and lease losses | 14 | 14 | (1,005) | (1,704) | — | — | — | — | ||||||||||||||||||||||||||||||||||||||||||||||||||||||||||||||||||||||
| All other assets | All other assets | 4 | 4 | 1,295 | 1,289 | 0 | 0 | 40 | 40 | All other assets | 3 | 4 | 67 | 1,289 | — | — | 40 | 40 | ||||||||||||||||||||||||||||||||||||||||||||||||||||||||||||||||||||||
| Total assets | Total assets | $ | 220 | $ | 236 | $ | 16,820 | $ | 20,895 | $ | 381 | $ | 217 | $ | 565 | $ | 1,030 | Total assets | $ | 185 | $ | 236 | $ | 13,201 | $ | 20,895 | $ | 219 | $ | 217 | $ | 301 | $ | 1,030 | ||||||||||||||||||||||||||||||||||||||||||||||||||||||
| On-balance sheet liabilities | On-balance sheet liabilities | On-balance sheet liabilities | ||||||||||||||||||||||||||||||||||||||||||||||||||||||||||||||||||||||||||||||||||||||
| Short-term borrowings | Short-term borrowings | $ | 0 | $ | 0 | $ | 0 | $ | 0 | $ | 0 | $ | 0 | $ | 301 | $ | 432 | Short-term borrowings | $ | — | $ | — | $ | — | $ | — | $ | — | $ | — | $ | 280 | $ | 432 | ||||||||||||||||||||||||||||||||||||||||||||||||||||||
| Long-term debt | Long-term debt | 165 | 178 | 4,698 | 6,273 | 4 | 0 | 0 | 0 | Long-term debt | 138 | 178 | 3,247 | 6,273 | 8 | — | — | — | ||||||||||||||||||||||||||||||||||||||||||||||||||||||||||||||||||||||
| All other liabilities | All other liabilities | 0 | 0 | 11 | 16 | 0 | 0 | 0 | 0 | All other liabilities | — | — | 10 | 16 | — | — | — | — | ||||||||||||||||||||||||||||||||||||||||||||||||||||||||||||||||||||||
| Total liabilities | Total liabilities | $ | 165 | $ | 178 | $ | 4,709 | $ | 6,289 | $ | 4 | $ | 0 | $ | 301 | $ | 432 | Total liabilities | $ | 138 | $ | 178 | $ | 3,257 | $ | 6,289 | $ | 8 | $ | — | $ | 280 | $ | 432 | ||||||||||||||||||||||||||||||||||||||||||||||||||||||
Bank of America78 | ||||||||
| Other VIEs | |||||||||||||||||||||||||||||||||||
| Consolidated | Unconsolidated | Total | Consolidated | Unconsolidated | Total | ||||||||||||||||||||||||||||||
| (Dollars in millions) | March 31, 2021 | December 31, 2020 | |||||||||||||||||||||||||||||||||
| Maximum loss exposure | $ | 4,483 | $ | 24,276 | $ | 28,759 | $ | 4,106 | $ | 23,870 | $ | 27,976 | |||||||||||||||||||||||
| On-balance sheet assets | |||||||||||||||||||||||||||||||||||
| Trading account assets | $ | 2,265 | $ | 611 | $ | 2,876 | $ | 2,080 | $ | 623 | $ | 2,703 | |||||||||||||||||||||||
| Debt securities carried at fair value | 0 | 9 | 9 | 0 | 9 | 9 | |||||||||||||||||||||||||||||
| Loans and leases | 2,347 | 225 | 2,572 | 2,108 | 184 | 2,292 | |||||||||||||||||||||||||||||
| Allowance for loan and lease losses | (3) | (10) | (13) | (3) | (3) | (6) | |||||||||||||||||||||||||||||
| All other assets | 47 | 22,948 | 22,995 | 54 | 22,553 | 22,607 | |||||||||||||||||||||||||||||
| Total | $ | 4,656 | $ | 23,783 | $ | 28,439 | $ | 4,239 | $ | 23,366 | $ | 27,605 | |||||||||||||||||||||||
| On-balance sheet liabilities | |||||||||||||||||||||||||||||||||||
| Short-term borrowings | $ | 37 | $ | 0 | $ | 37 | $ | 22 | $ | 0 | $ | 22 | |||||||||||||||||||||||
| Long-term debt | 136 | 0 | 136 | 111 | 0 | 111 | |||||||||||||||||||||||||||||
| All other liabilities | 0 | 5,616 | 5,616 | 0 | 5,658 | 5,658 | |||||||||||||||||||||||||||||
| Total | $ | 173 | $ | 5,616 | $ | 5,789 | $ | 133 | $ | 5,658 | $ | 5,791 | |||||||||||||||||||||||
| Total assets of VIEs | $ | 4,656 | $ | 80,929 | $ | 85,585 | $ | 4,239 | $ | 77,984 | $ | 82,223 | |||||||||||||||||||||||
| Other VIEs | |||||||||||||||||||||||||||||||||||
| Consolidated | Unconsolidated | Total | Consolidated | Unconsolidated | Total | ||||||||||||||||||||||||||||||
| (Dollars in millions) | September 30, 2021 | December 31, 2020 | |||||||||||||||||||||||||||||||||
| Maximum loss exposure | $ | 4,831 | $ | 25,409 | $ | 30,240 | $ | 4,106 | $ | 23,870 | $ | 27,976 | |||||||||||||||||||||||
| On-balance sheet assets | |||||||||||||||||||||||||||||||||||
| Trading account assets | $ | 2,523 | $ | 577 | $ | 3,100 | $ | 2,080 | $ | 623 | $ | 2,703 | |||||||||||||||||||||||
| Debt securities carried at fair value | — | 7 | 7 | — | 9 | 9 | |||||||||||||||||||||||||||||
| Loans and leases | 2,550 | 39 | 2,589 | 2,108 | 184 | 2,292 | |||||||||||||||||||||||||||||
| Allowance for loan and lease losses | (3) | (5) | (8) | (3) | (3) | (6) | |||||||||||||||||||||||||||||
| All other assets | 26 | 24,302 | 24,328 | 54 | 22,553 | 22,607 | |||||||||||||||||||||||||||||
| Total | $ | 5,096 | $ | 24,920 | $ | 30,016 | $ | 4,239 | $ | 23,366 | $ | 27,605 | |||||||||||||||||||||||
| On-balance sheet liabilities | |||||||||||||||||||||||||||||||||||
| Short-term borrowings | $ | 50 | $ | — | $ | 50 | $ | 22 | $ | — | $ | 22 | |||||||||||||||||||||||
| Long-term debt | 215 | — | 215 | 111 | — | 111 | |||||||||||||||||||||||||||||
| All other liabilities | — | 6,109 | 6,109 | — | 5,658 | 5,658 | |||||||||||||||||||||||||||||
| Total | $ | 265 | $ | 6,109 | $ | 6,374 | $ | 133 | $ | 5,658 | $ | 5,791 | |||||||||||||||||||||||
| Total assets of VIEs | $ | 5,096 | $ | 86,035 | $ | 91,131 | $ | 4,239 | $ | 77,984 | $ | 82,223 | |||||||||||||||||||||||
79Bank of America | ||||||||
| Goodwill | Goodwill | Goodwill | ||||||||||||||||||||
| March 31 | December 31 | September 30 | December 31 | |||||||||||||||||||
| (Dollars in millions) | (Dollars in millions) | March 31 2021 | December 31 2020 | (Dollars in millions) | 2021 | 2020 | ||||||||||||||||
| Consumer Banking | Consumer Banking | $ | 30,123 | $ | 30,123 | Consumer Banking | $ | 30,137 | $ | 30,123 | ||||||||||||
| Global Wealth & Investment Management | Global Wealth & Investment Management | 9,677 | 9,677 | Global Wealth & Investment Management | 9,677 | 9,677 | ||||||||||||||||
| Global Banking | Global Banking | 23,923 | 23,923 | Global Banking | 24,027 | 23,969 | ||||||||||||||||
| Global Markets | Global Markets | 5,182 | 5,182 | Global Markets | 5,182 | 5,182 | ||||||||||||||||
| All Other | 46 | 46 | ||||||||||||||||||||
| Total goodwill | Total goodwill | $ | 68,951 | $ | 68,951 | Total goodwill | $ | 69,023 | $ | 68,951 | ||||||||||||
Bank of America80 | ||||||||
Net Investment (1) | Net Investment (1) | Net Investment (1) | ||||||||||||||||||||||||||||||||||||||||||||||||||||||||
| March 31 | December 31 | September 30 | December 31 | |||||||||||||||||||||||||||||||||||||||||||||||||||||||
| (Dollars in millions) | (Dollars in millions) | 2021 | 2020 | (Dollars in millions) | 2021 | 2020 | ||||||||||||||||||||||||||||||||||||||||||||||||||||
| Lease receivables | Lease receivables | $ | 17,158 | $ | 17,627 | Lease receivables | $ | 16,458 | $ | 17,627 | ||||||||||||||||||||||||||||||||||||||||||||||||
| Unguaranteed residuals | Unguaranteed residuals | 2,243 | 2,303 | Unguaranteed residuals | 2,137 | 2,303 | ||||||||||||||||||||||||||||||||||||||||||||||||||||
| Total net investment in sales-type and direct financing leases | Total net investment in sales-type and direct financing leases | $ | 19,401 | $ | 19,930 | Total net investment in sales-type and direct financing leases | $ | 18,595 | $ | 19,930 | ||||||||||||||||||||||||||||||||||||||||||||||||
| Lease Income | Lease Income | Lease Income | ||||||||||||||||||||||||||||||||||||||||||||||||||
| Three Months Ended March 31 | ||||||||||||||||||||||||||||||||||||||||||||||||||||
| Three Months Ended September 30 | Nine Months Ended September 30 | |||||||||||||||||||||||||||||||||||||||||||||||||||
| (Dollars in millions) | (Dollars in millions) | 2021 | 2020 | (Dollars in millions) | 2021 | 2020 | 2021 | 2020 | ||||||||||||||||||||||||||||||||||||||||||||
| Sales-type and direct financing leases | Sales-type and direct financing leases | $ | 164 | $ | 197 | Sales-type and direct financing leases | $ | 152 | $ | 167 | $ | 468 | $ | 539 | ||||||||||||||||||||||||||||||||||||||
| Operating leases | Operating leases | 231 | 243 | Operating leases | 235 | 224 | 689 | 703 | ||||||||||||||||||||||||||||||||||||||||||||
| Total lease income | Total lease income | $ | 395 | $ | 440 | Total lease income | $ | 387 | $ | 391 | $ | 1,157 | $ | 1,242 | ||||||||||||||||||||||||||||||||||||||
| Lessee Arrangements | |||||||||||
| March 31 | December 31 | ||||||||||
| (Dollars in millions) | 2021 | 2020 | |||||||||
| Right-of-use asset | $ | 9,673 | $ | 10,000 | |||||||
| Lease liabilities | 10,275 | 10,474 | |||||||||
| Lessee Arrangements | |||||||||||
| September 30 | December 31 | ||||||||||
| (Dollars in millions) | 2021 | 2020 | |||||||||
| Right-of-use asset | $ | 10,091 | $ | 10,000 | |||||||
| Lease liabilities | 10,707 | 10,474 | |||||||||
| Amount | Rate | Amount | Rate | Amount | Rate | Amount | Rate | Amount | Rate | Amount | Rate | |||||||||||||||||||||||||||||||||||||||||||||||||||||||||||||||||||||||||||||||||||
| Three Months Ended March 31 | Three Months Ended September 30 | Nine Months Ended September 30 | ||||||||||||||||||||||||||||||||||||||||||||||||||||||||||||||||||||||||||||||||||||||||||||
| (Dollars in millions) | (Dollars in millions) | 2021 | 2020 | (Dollars in millions) | 2021 | 2020 | 2021 | 2020 | ||||||||||||||||||||||||||||||||||||||||||||||||||||||||||||||||||||||||||||||||||||||
| Federal funds sold and securities borrowed or purchased under agreements to resell | Federal funds sold and securities borrowed or purchased under agreements to resell | Federal funds sold and securities borrowed or purchased under agreements to resell | ||||||||||||||||||||||||||||||||||||||||||||||||||||||||||||||||||||||||||||||||||||||||||||
| Average during period | Average during period | $ | 249,985 | (0.01) | % | $ | 278,794 | 1.18 | % | Average during period | $ | 270,094 | 0.01 | % | $ | 384,221 | 0.06 | % | $ | 263,581 | (0.02) | % | $ | 325,356 | 0.37 | % | ||||||||||||||||||||||||||||||||||||||||||||||||||||||||||||||||||||
| Maximum month-end balance during period | Maximum month-end balance during period | 259,147 | n/a | 301,969 | n/a | Maximum month-end balance during period | 278,684 | n/a | 420,830 | n/a | 278,684 | n/a | 451,179 | n/a | ||||||||||||||||||||||||||||||||||||||||||||||||||||||||||||||||||||||||||||||||
| Federal funds purchased and securities loaned or sold under agreements to repurchase | Federal funds purchased and securities loaned or sold under agreements to repurchase | Federal funds purchased and securities loaned or sold under agreements to repurchase | ||||||||||||||||||||||||||||||||||||||||||||||||||||||||||||||||||||||||||||||||||||||||||||
| Average during period | Average during period | $ | 197,105 | 0.26 | % | $ | 199,539 | 1.60 | % | Average during period | $ | 220,741 | 0.29 | % | $ | 192,376 | 0.41 | % | $ | 212,214 | 0.26 | % | $ | 193,029 | 0.81 | % | ||||||||||||||||||||||||||||||||||||||||||||||||||||||||||||||||||||
| Maximum month-end balance during period | Maximum month-end balance during period | 199,443 | n/a | 206,493 | n/a | Maximum month-end balance during period | 217,825 | n/a | 195,028 | n/a | 218,628 | n/a | 206,493 | n/a | ||||||||||||||||||||||||||||||||||||||||||||||||||||||||||||||||||||||||||||||||
| Short-term borrowings | Short-term borrowings | Short-term borrowings | ||||||||||||||||||||||||||||||||||||||||||||||||||||||||||||||||||||||||||||||||||||||||||||
| Average during period | Average during period | 19,667 | (0.12) | 26,430 | 1.62 | Average during period | 20,862 | (0.19) | 17,770 | 0.08 | 20,714 | (0.14) | 23,347 | 0.68 | ||||||||||||||||||||||||||||||||||||||||||||||||||||||||||||||||||||||||||||||||
| Maximum month-end balance during period | Maximum month-end balance during period | 21,724 | n/a | 30,118 | n/a | Maximum month-end balance during period | 21,293 | n/a | 19,530 | n/a | 23,333 | n/a | 30,118 | n/a | ||||||||||||||||||||||||||||||||||||||||||||||||||||||||||||||||||||||||||||||||
| Securities Financing Agreements | |||||||||||||||||||||||||||||
Gross Assets/Liabilities (1) | Amounts Offset | Net Balance Sheet Amount | Financial Instruments (2) | Net Assets/Liabilities | |||||||||||||||||||||||||
| (Dollars in millions) | March 31, 2021 | ||||||||||||||||||||||||||||
Securities borrowed or purchased under agreements to resell (3) | $ | 464,227 | $ | (205,080) | $ | 259,147 | $ | (226,657) | $ | 32,490 | |||||||||||||||||||
| Securities loaned or sold under agreements to repurchase | $ | 404,523 | $ | (205,080) | $ | 199,443 | $ | (188,867) | $ | 10,576 | |||||||||||||||||||
Other (4) | 17,482 | 0 | 17,482 | (17,482) | 0 | ||||||||||||||||||||||||
| Total | $ | 422,005 | $ | (205,080) | $ | 216,925 | $ | (206,349) | $ | 10,576 | |||||||||||||||||||
| December 31, 2020 | |||||||||||||||||||||||||||||
Securities borrowed or purchased under agreements to resell (3) | $ | 492,387 | $ | (188,329) | $ | 304,058 | $ | (272,351) | $ | 31,707 | |||||||||||||||||||
| Securities loaned or sold under agreements to repurchase | $ | 358,652 | $ | (188,329) | $ | 170,323 | $ | (158,867) | $ | 11,456 | |||||||||||||||||||
Other (4) | 16,210 | 0 | 16,210 | (16,210) | 0 | ||||||||||||||||||||||||
| Total | $ | 374,862 | $ | (188,329) | $ | 186,533 | $ | (175,077) | $ | 11,456 | |||||||||||||||||||
81Bank of America | ||||||||
| Securities Financing Agreements | |||||||||||||||||||||||||||||
Gross Assets/Liabilities (1) | Amounts Offset | Net Balance Sheet Amount | Financial Instruments (2) | Net Assets/Liabilities | |||||||||||||||||||||||||
| (Dollars in millions) | September 30, 2021 | ||||||||||||||||||||||||||||
Securities borrowed or purchased under agreements to resell (3) | $ | 533,965 | $ | (272,031) | $ | 261,934 | $ | (240,436) | $ | 21,498 | |||||||||||||||||||
| Securities loaned or sold under agreements to repurchase | $ | 479,459 | $ | (272,031) | $ | 207,428 | $ | (195,260) | $ | 12,168 | |||||||||||||||||||
Other (4) | 10,167 | — | 10,167 | (10,167) | — | ||||||||||||||||||||||||
| Total | $ | 489,626 | $ | (272,031) | $ | 217,595 | $ | (205,427) | $ | 12,168 | |||||||||||||||||||
| December 31, 2020 | |||||||||||||||||||||||||||||
Securities borrowed or purchased under agreements to resell (3) | $ | 492,387 | $ | (188,329) | $ | 304,058 | $ | (272,351) | $ | 31,707 | |||||||||||||||||||
| Securities loaned or sold under agreements to repurchase | $ | 358,652 | $ | (188,329) | $ | 170,323 | $ | (158,867) | $ | 11,456 | |||||||||||||||||||
Other (4) | 16,210 | — | 16,210 | (16,210) | — | ||||||||||||||||||||||||
| Total | $ | 374,862 | $ | (188,329) | $ | 186,533 | $ | (175,077) | $ | 11,456 | |||||||||||||||||||
| Remaining Contractual Maturity | |||||||||||||||||||||||||||||
| Overnight and Continuous | 30 Days or Less | After 30 Days Through 90 Days | Greater than 90 Days (1) | Total | |||||||||||||||||||||||||
| (Dollars in millions) | September 30, 2021 | ||||||||||||||||||||||||||||
| Securities sold under agreements to repurchase | $ | 211,770 | $ | 142,591 | $ | 32,455 | $ | 42,678 | $ | 429,494 | |||||||||||||||||||
| Securities loaned | 43,780 | 87 | 428 | 5,670 | 49,965 | ||||||||||||||||||||||||
| Other | 10,167 | — | — | — | 10,167 | ||||||||||||||||||||||||
| Total | $ | 265,717 | $ | 142,678 | $ | 32,883 | $ | 48,348 | $ | 489,626 | |||||||||||||||||||
| December 31, 2020 | |||||||||||||||||||||||||||||
| Securities sold under agreements to repurchase | $ | 158,400 | $ | 122,448 | $ | 32,149 | $ | 22,684 | $ | 335,681 | |||||||||||||||||||
| Securities loaned | 19,140 | 271 | 1,029 | 2,531 | 22,971 | ||||||||||||||||||||||||
| Other | 16,210 | — | — | — | 16,210 | ||||||||||||||||||||||||
| Total | $ | 193,750 | $ | 122,719 | $ | 33,178 | $ | 25,215 | $ | 374,862 | |||||||||||||||||||
Bank of America | ||||||||
| Remaining Contractual Maturity | |||||||||||||||||||||||||||||
| Overnight and Continuous | 30 Days or Less | After 30 Days Through 90 Days | Greater than 90 Days (1) | Total | |||||||||||||||||||||||||
| (Dollars in millions) | March 31, 2021 | ||||||||||||||||||||||||||||
| Securities sold under agreements to repurchase | $ | 164,476 | $ | 139,397 | $ | 31,238 | $ | 39,523 | $ | 374,634 | |||||||||||||||||||
| Securities loaned | 24,836 | 323 | 913 | 3,817 | 29,889 | ||||||||||||||||||||||||
| Other | 17,482 | 0 | 0 | 0 | 17,482 | ||||||||||||||||||||||||
| Total | $ | 206,794 | $ | 139,720 | $ | 32,151 | $ | 43,340 | $ | 422,005 | |||||||||||||||||||
| December 31, 2020 | |||||||||||||||||||||||||||||
| Securities sold under agreements to repurchase | $ | 158,400 | $ | 122,448 | $ | 32,149 | $ | 22,684 | $ | 335,681 | |||||||||||||||||||
| Securities loaned | 19,140 | 271 | 1,029 | 2,531 | 22,971 | ||||||||||||||||||||||||
| Other | 16,210 | 0 | 0 | 0 | 16,210 | ||||||||||||||||||||||||
| Total | $ | 193,750 | $ | 122,719 | $ | 33,178 | $ | 25,215 | $ | 374,862 | |||||||||||||||||||
| Class of Collateral Pledged | Class of Collateral Pledged | Class of Collateral Pledged | ||||||||||||||||||||||||||||||||||||||||||||
| Securities Sold Under Agreements to Repurchase | Securities Loaned | Other | Total | Securities Sold Under Agreements to Repurchase | Securities Loaned | Other | Total | |||||||||||||||||||||||||||||||||||||||
| (Dollars in millions) | (Dollars in millions) | March 31, 2021 | (Dollars in millions) | September 30, 2021 | ||||||||||||||||||||||||||||||||||||||||||
| U.S. government and agency securities | U.S. government and agency securities | $ | 209,204 | $ | 0 | $ | 0 | $ | 209,204 | U.S. government and agency securities | $ | 223,197 | $ | — | $ | — | $ | 223,197 | ||||||||||||||||||||||||||||
| Corporate securities, trading loans and other | Corporate securities, trading loans and other | 14,280 | 1,523 | 951 | 16,754 | Corporate securities, trading loans and other | 13,003 | 2,809 | 1,053 | 16,865 | ||||||||||||||||||||||||||||||||||||
| Equity securities | Equity securities | 17,103 | 28,334 | 16,462 | 61,899 | Equity securities | 22,221 | 47,016 | 9,060 | 78,297 | ||||||||||||||||||||||||||||||||||||
| Non-U.S. sovereign debt | Non-U.S. sovereign debt | 132,000 | 32 | 69 | 132,101 | Non-U.S. sovereign debt | 166,678 | 140 | 54 | 166,872 | ||||||||||||||||||||||||||||||||||||
| Mortgage trading loans and ABS | Mortgage trading loans and ABS | 2,047 | 0 | 0 | 2,047 | Mortgage trading loans and ABS | 4,395 | — | — | 4,395 | ||||||||||||||||||||||||||||||||||||
| Total | Total | $ | 374,634 | $ | 29,889 | $ | 17,482 | $ | 422,005 | Total | $ | 429,494 | $ | 49,965 | $ | 10,167 | $ | 489,626 | ||||||||||||||||||||||||||||
| December 31, 2020 | December 31, 2020 | |||||||||||||||||||||||||||||||||||||||||||||
| U.S. government and agency securities | U.S. government and agency securities | $ | 195,167 | $ | 5 | $ | 0 | $ | 195,172 | U.S. government and agency securities | $ | 195,167 | $ | 5 | $ | — | $ | 195,172 | ||||||||||||||||||||||||||||
| Corporate securities, trading loans and other | Corporate securities, trading loans and other | 8,633 | 1,628 | 1,217 | 11,478 | Corporate securities, trading loans and other | 8,633 | 1,628 | 1,217 | 11,478 | ||||||||||||||||||||||||||||||||||||
| Equity securities | Equity securities | 14,752 | 21,125 | 14,931 | 50,808 | Equity securities | 14,752 | 21,125 | 14,931 | 50,808 | ||||||||||||||||||||||||||||||||||||
| Non-U.S. sovereign debt | Non-U.S. sovereign debt | 113,142 | 213 | 62 | 113,417 | Non-U.S. sovereign debt | 113,142 | 213 | 62 | 113,417 | ||||||||||||||||||||||||||||||||||||
| Mortgage trading loans and ABS | Mortgage trading loans and ABS | 3,987 | 0 | 0 | 3,987 | Mortgage trading loans and ABS | 3,987 | — | — | 3,987 | ||||||||||||||||||||||||||||||||||||
| Total | Total | $ | 335,681 | $ | 22,971 | $ | 16,210 | $ | 374,862 | Total | $ | 335,681 | $ | 22,971 | $ | 16,210 | $ | 374,862 | ||||||||||||||||||||||||||||
| Credit Extension Commitments | Credit Extension Commitments | Credit Extension Commitments | ||||||||||||||||||||||||||||||||||||||||||||||||||||||||
| Expire in One Year or Less | Expire After One Year Through Three Years | Expire After Three Years Through Five Years | Expire After Five Years | Total | Expire in One Year or Less | Expire After One Year Through Three Years | Expire After Three Years Through Five Years | Expire After Five Years | Total | |||||||||||||||||||||||||||||||||||||||||||||||||
| (Dollars in millions) | (Dollars in millions) | March 31, 2021 | (Dollars in millions) | September 30, 2021 | ||||||||||||||||||||||||||||||||||||||||||||||||||||||
| Notional amount of credit extension commitments | Notional amount of credit extension commitments | Notional amount of credit extension commitments | ||||||||||||||||||||||||||||||||||||||||||||||||||||||||
Loan commitments (1) | Loan commitments (1) | $ | 105,390 | $ | 193,141 | $ | 142,512 | $ | 21,027 | $ | 462,070 | Loan commitments (1) | $ | 105,772 | $ | 196,782 | $ | 162,919 | $ | 32,030 | $ | 497,503 | ||||||||||||||||||||||||||||||||||||
| Home equity lines of credit | Home equity lines of credit | 733 | 3,354 | 9,451 | 28,109 | 41,647 | Home equity lines of credit | 841 | 4,439 | 10,237 | 25,257 | 40,774 | ||||||||||||||||||||||||||||||||||||||||||||||
Standby letters of credit and financial guarantees (2) | Standby letters of credit and financial guarantees (2) | 21,989 | 9,960 | 2,097 | 1,268 | 35,314 | Standby letters of credit and financial guarantees (2) | 21,850 | 11,127 | 1,689 | 424 | 35,090 | ||||||||||||||||||||||||||||||||||||||||||||||
Letters of credit (3) | 1,097 | 176 | 32 | 22 | 1,327 | |||||||||||||||||||||||||||||||||||||||||||||||||||||
| Letters of credit | Letters of credit | 1,574 | 162 | 32 | 43 | 1,811 | ||||||||||||||||||||||||||||||||||||||||||||||||||||
| Legally binding commitments | Legally binding commitments | 129,209 | 206,631 | 154,092 | 50,426 | 540,358 | Legally binding commitments | 130,037 | 212,510 | 174,877 | 57,754 | 575,178 | ||||||||||||||||||||||||||||||||||||||||||||||
Credit card lines (4) | 388,922 | 0 | 0 | 0 | 388,922 | |||||||||||||||||||||||||||||||||||||||||||||||||||||
Credit card lines (3) | Credit card lines (3) | 402,382 | — | — | — | 402,382 | ||||||||||||||||||||||||||||||||||||||||||||||||||||
| Total credit extension commitments | Total credit extension commitments | $ | 518,131 | $ | 206,631 | $ | 154,092 | $ | 50,426 | $ | 929,280 | Total credit extension commitments | $ | 532,419 | $ | 212,510 | $ | 174,877 | $ | 57,754 | $ | 977,560 | ||||||||||||||||||||||||||||||||||||
| December 31, 2020 | December 31, 2020 | |||||||||||||||||||||||||||||||||||||||||||||||||||||||||
| Notional amount of credit extension commitments | Notional amount of credit extension commitments | Notional amount of credit extension commitments | ||||||||||||||||||||||||||||||||||||||||||||||||||||||||
Loan commitments (1) | Loan commitments (1) | $ | 109,406 | $ | 171,887 | $ | 139,508 | $ | 16,091 | $ | 436,892 | Loan commitments (1) | $ | 109,406 | $ | 171,887 | $ | 139,508 | $ | 16,091 | $ | 436,892 | ||||||||||||||||||||||||||||||||||||
| Home equity lines of credit | Home equity lines of credit | 710 | 2,992 | 8,738 | 29,892 | 42,332 | Home equity lines of credit | 710 | 2,992 | 8,738 | 29,892 | 42,332 | ||||||||||||||||||||||||||||||||||||||||||||||
Standby letters of credit and financial guarantees (2) | Standby letters of credit and financial guarantees (2) | 19,962 | 12,038 | 2,397 | 1,257 | 35,654 | Standby letters of credit and financial guarantees (2) | 19,962 | 12,038 | 2,397 | 1,257 | 35,654 | ||||||||||||||||||||||||||||||||||||||||||||||
Letters of credit (3) | 886 | 197 | 25 | 27 | 1,135 | |||||||||||||||||||||||||||||||||||||||||||||||||||||
| Letters of credit | Letters of credit | 886 | 197 | 25 | 27 | 1,135 | ||||||||||||||||||||||||||||||||||||||||||||||||||||
| Legally binding commitments | Legally binding commitments | 130,964 | 187,114 | 150,668 | 47,267 | 516,013 | Legally binding commitments | 130,964 | 187,114 | 150,668 | 47,267 | 516,013 | ||||||||||||||||||||||||||||||||||||||||||||||
Credit card lines (4) | 384,955 | 0 | 0 | 0 | 384,955 | |||||||||||||||||||||||||||||||||||||||||||||||||||||
Credit card lines (3) | Credit card lines (3) | 384,955 | — | — | — | 384,955 | ||||||||||||||||||||||||||||||||||||||||||||||||||||
| Total credit extension commitments | Total credit extension commitments | $ | 515,919 | $ | 187,114 | $ | 150,668 | $ | 47,267 | $ | 900,968 | Total credit extension commitments | $ | 515,919 | $ | 187,114 | $ | 150,668 | $ | 47,267 | $ | 900,968 | ||||||||||||||||||||||||||||||||||||
Bank of America | ||||||||
85Bank of America | ||||||||
Declared Quarterly Cash Dividends on Common Stock (1) | |||||||||||||||||||||
| Declaration Date | Record Date | Payment Date | Dividend Per Share | ||||||||||||||||||
| October 20, 2021 | December 3, 2021 | December 31, 2021 | $ | 0.21 | |||||||||||||||||
| July 21, 2021 | September 3, 2021 | September 24, 2021 | 0.21 | ||||||||||||||||||
| April 22, 2021 | June 4, 2021 | June 25, 2021 | 0.18 | ||||||||||||||||||
| January 19, 2021 | March 5, 2021 | March 26, 2021 | 0.18 | ||||||||||||||||||
| (Dollars in millions) | (Dollars in millions) | Debt Securities | Debit Valuation Adjustments | Derivatives | Employee Benefit Plans | Foreign Currency | Total | (Dollars in millions) | Debt Securities | Debit Valuation Adjustments | Derivatives | Employee Benefit Plans | Foreign Currency | Total | ||||||||||||||||||||||||||||||||||||||||||||||||||||||||
| Balance, December 31, 2019 | Balance, December 31, 2019 | $ | 323 | $ | (1,494) | $ | (400) | $ | (4,168) | $ | (894) | $ | (6,633) | Balance, December 31, 2019 | $ | 323 | $ | (1,494) | $ | (400) | $ | (4,168) | $ | (894) | $ | (6,633) | ||||||||||||||||||||||||||||||||||||||||||||
| Net change | Net change | 4,795 | 1,346 | 417 | 43 | (88) | 6,513 | Net change | 4,794 | (5) | 808 | 144 | (86) | 5,655 | ||||||||||||||||||||||||||||||||||||||||||||||||||||||||
| Balance, March 31, 2020 | $ | 5,118 | $ | (148) | $ | 17 | $ | (4,125) | $ | (982) | $ | (120) | ||||||||||||||||||||||||||||||||||||||||||||||||||||||||||
| Balance, September 30, 2020 | Balance, September 30, 2020 | $ | 5,117 | $ | (1,499) | $ | 408 | $ | (4,024) | $ | (980) | $ | (978) | |||||||||||||||||||||||||||||||||||||||||||||||||||||||||
| Balance, December 31, 2020 | Balance, December 31, 2020 | $ | 5,122 | $ | (1,992) | $ | 426 | $ | (4,266) | $ | (946) | $ | (1,656) | Balance, December 31, 2020 | $ | 5,122 | $ | (1,992) | $ | 426 | $ | (4,266) | $ | (946) | $ | (1,656) | ||||||||||||||||||||||||||||||||||||||||||||
| Net change | Net change | (840) | 116 | (1,114) | 51 | (29) | (1,816) | Net change | (1,243) | 292 | (1,130) | 170 | (29) | (1,940) | ||||||||||||||||||||||||||||||||||||||||||||||||||||||||
| Balance, March 31, 2021 | $ | 4,282 | $ | (1,876) | $ | (688) | $ | (4,215) | $ | (975) | $ | (3,472) | ||||||||||||||||||||||||||||||||||||||||||||||||||||||||||
| Balance, September 30, 2021 | Balance, September 30, 2021 | $ | 3,879 | $ | (1,700) | $ | (704) | $ | (4,096) | $ | (975) | $ | (3,596) | |||||||||||||||||||||||||||||||||||||||||||||||||||||||||
Bank of America | ||||||||
| Pretax | Tax effect | After- tax | Pretax | Tax effect | After- tax | Pretax | Tax effect | After- tax | Pretax | Tax effect | After- tax | |||||||||||||||||||||||||||||||||||||||||||||||||||||||||||||||||||||||||||||||||||||||||||||||
| Three Months Ended March 31 | Nine Months Ended September 30 | |||||||||||||||||||||||||||||||||||||||||||||||||||||||||||||||||||||||||||||||||||||||||||||||||||||||||
| (Dollars in millions) | (Dollars in millions) | 2021 | 2020 | (Dollars in millions) | 2021 | 2020 | ||||||||||||||||||||||||||||||||||||||||||||||||||||||||||||||||||||||||||||||||||||||||||||||||||||
| Debt securities: | Debt securities: | Debt securities: | ||||||||||||||||||||||||||||||||||||||||||||||||||||||||||||||||||||||||||||||||||||||||||||||||||||||||
| Net increase (decrease) in fair value | Net increase (decrease) in fair value | $ | (1,110) | $ | 270 | $ | (840) | $ | 6,701 | $ | (1,670) | $ | 5,031 | Net increase (decrease) in fair value | $ | (1,650) | $ | 410 | $ | (1,240) | $ | 6,763 | $ | (1,685) | $ | 5,078 | ||||||||||||||||||||||||||||||||||||||||||||||||||||||||||||||||||||||||||||||||
Net realized gains reclassified into earnings (1) | Net realized gains reclassified into earnings (1) | 0 | 0 | 0 | (315) | 79 | (236) | Net realized gains reclassified into earnings (1) | (4) | 1 | (3) | (379) | 95 | (284) | ||||||||||||||||||||||||||||||||||||||||||||||||||||||||||||||||||||||||||||||||||||||||||||
| Net change | Net change | (1,110) | 270 | (840) | 6,386 | (1,591) | 4,795 | Net change | (1,654) | 411 | (1,243) | 6,384 | (1,590) | 4,794 | ||||||||||||||||||||||||||||||||||||||||||||||||||||||||||||||||||||||||||||||||||||||||||||
| Debit valuation adjustments: | Debit valuation adjustments: | Debit valuation adjustments: | ||||||||||||||||||||||||||||||||||||||||||||||||||||||||||||||||||||||||||||||||||||||||||||||||||||||||
| Net increase in fair value | 140 | (29) | 111 | 1,751 | (408) | 1,343 | ||||||||||||||||||||||||||||||||||||||||||||||||||||||||||||||||||||||||||||||||||||||||||||||||||||
| Net increase (decrease) in fair value | Net increase (decrease) in fair value | 365 | (82) | 283 | (13) | 5 | (8) | |||||||||||||||||||||||||||||||||||||||||||||||||||||||||||||||||||||||||||||||||||||||||||||||||||
Net realized losses reclassified into earnings (1) | Net realized losses reclassified into earnings (1) | 6 | (1) | 5 | 4 | (1) | 3 | Net realized losses reclassified into earnings (1) | 12 | (3) | 9 | 4 | (1) | 3 | ||||||||||||||||||||||||||||||||||||||||||||||||||||||||||||||||||||||||||||||||||||||||||||
| Net change | Net change | 146 | (30) | 116 | 1,755 | (409) | 1,346 | Net change | 377 | (85) | 292 | (9) | 4 | (5) | ||||||||||||||||||||||||||||||||||||||||||||||||||||||||||||||||||||||||||||||||||||||||||||
| Derivatives: | Derivatives: | Derivatives: | ||||||||||||||||||||||||||||||||||||||||||||||||||||||||||||||||||||||||||||||||||||||||||||||||||||||||
| Net increase (decrease) in fair value | Net increase (decrease) in fair value | (1,429) | 356 | (1,073) | 520 | (125) | 395 | Net increase (decrease) in fair value | (1,339) | 334 | (1,005) | 977 | (238) | 739 | ||||||||||||||||||||||||||||||||||||||||||||||||||||||||||||||||||||||||||||||||||||||||||||
| Reclassifications into earnings: | Reclassifications into earnings: | Reclassifications into earnings: | ||||||||||||||||||||||||||||||||||||||||||||||||||||||||||||||||||||||||||||||||||||||||||||||||||||||||
| Net interest income | Net interest income | (42) | 10 | (32) | 29 | (7) | 22 | Net interest income | (125) | 30 | (95) | 96 | (23) | 73 | ||||||||||||||||||||||||||||||||||||||||||||||||||||||||||||||||||||||||||||||||||||||||||||
| Compensation and benefits expense | Compensation and benefits expense | (12) | 3 | (9) | 0 | 0 | 0 | Compensation and benefits expense | (40) | 10 | (30) | (5) | 1 | (4) | ||||||||||||||||||||||||||||||||||||||||||||||||||||||||||||||||||||||||||||||||||||||||||||
| Net realized (gains) losses reclassified into earnings | Net realized (gains) losses reclassified into earnings | (54) | 13 | (41) | 29 | (7) | 22 | Net realized (gains) losses reclassified into earnings | (165) | 40 | (125) | 91 | (22) | 69 | ||||||||||||||||||||||||||||||||||||||||||||||||||||||||||||||||||||||||||||||||||||||||||||
| Net change | Net change | (1,483) | 369 | (1,114) | 549 | (132) | 417 | Net change | (1,504) | 374 | (1,130) | 1,068 | (260) | 808 | ||||||||||||||||||||||||||||||||||||||||||||||||||||||||||||||||||||||||||||||||||||||||||||
| Employee benefit plans: | Employee benefit plans: | Employee benefit plans: | ||||||||||||||||||||||||||||||||||||||||||||||||||||||||||||||||||||||||||||||||||||||||||||||||||||||||
Net actuarial losses and other reclassified into earnings (2) | Net actuarial losses and other reclassified into earnings (2) | 67 | (16) | 51 | 57 | (14) | 43 | Net actuarial losses and other reclassified into earnings (2) | 209 | (39) | 170 | 191 | (47) | 144 | ||||||||||||||||||||||||||||||||||||||||||||||||||||||||||||||||||||||||||||||||||||||||||||
| Net change | Net change | 67 | (16) | 51 | 57 | (14) | 43 | Net change | 209 | (39) | 170 | 191 | (47) | 144 | ||||||||||||||||||||||||||||||||||||||||||||||||||||||||||||||||||||||||||||||||||||||||||||
| Foreign currency: | Foreign currency: | Foreign currency: | ||||||||||||||||||||||||||||||||||||||||||||||||||||||||||||||||||||||||||||||||||||||||||||||||||||||||
| Net decrease in fair value | Net decrease in fair value | 144 | (173) | (29) | 228 | (316) | (88) | Net decrease in fair value | 240 | (269) | (29) | (29) | (57) | (86) | ||||||||||||||||||||||||||||||||||||||||||||||||||||||||||||||||||||||||||||||||||||||||||||
| Net change | Net change | 144 | (173) | (29) | 228 | (316) | (88) | Net change | 240 | (269) | (29) | (29) | (57) | (86) | ||||||||||||||||||||||||||||||||||||||||||||||||||||||||||||||||||||||||||||||||||||||||||||
| Total other comprehensive income (loss) | Total other comprehensive income (loss) | $ | (2,236) | $ | 420 | $ | (1,816) | $ | 8,975 | $ | (2,462) | $ | 6,513 | Total other comprehensive income (loss) | $ | (2,332) | $ | 392 | $ | (1,940) | $ | 7,605 | $ | (1,950) | $ | 5,655 | ||||||||||||||||||||||||||||||||||||||||||||||||||||||||||||||||||||||||||||||||
| Three Months Ended March 31 | Three Months Ended September 30 | Nine Months Ended September 30 | ||||||||||||||||||||||||||||||||||||||||||||||||||||||||||||||||||||
| (In millions, except per share information) | (In millions, except per share information) | 2021 | 2020 | (In millions, except per share information) | 2021 | 2020 | 2021 | 2020 | ||||||||||||||||||||||||||||||||||||||||||||||||||||||||||||||
| Earnings per common share | Earnings per common share | Earnings per common share | ||||||||||||||||||||||||||||||||||||||||||||||||||||||||||||||||||||
| Net income | Net income | $ | 8,050 | $ | 4,010 | Net income | $ | 7,691 | $ | 4,881 | $ | 24,965 | $ | 12,424 | ||||||||||||||||||||||||||||||||||||||||||||||||||||||||
| Preferred stock dividends | Preferred stock dividends | (490) | (469) | Preferred stock dividends | (431) | (441) | (1,181) | (1,159) | ||||||||||||||||||||||||||||||||||||||||||||||||||||||||||||||
| Net income applicable to common shareholders | Net income applicable to common shareholders | $ | 7,560 | $ | 3,541 | Net income applicable to common shareholders | $ | 7,260 | $ | 4,440 | $ | 23,784 | $ | 11,265 | ||||||||||||||||||||||||||||||||||||||||||||||||||||||||
| Average common shares issued and outstanding | Average common shares issued and outstanding | 8,700.1 | 8,815.6 | Average common shares issued and outstanding | 8,430.7 | 8,732.9 | 8,583.1 | 8,762.6 | ||||||||||||||||||||||||||||||||||||||||||||||||||||||||||||||
| Earnings per common share | Earnings per common share | $ | 0.87 | $ | 0.40 | Earnings per common share | $ | 0.86 | $ | 0.51 | $ | 2.77 | $ | 1.29 | ||||||||||||||||||||||||||||||||||||||||||||||||||||||||
| Diluted earnings per common share | Diluted earnings per common share | Diluted earnings per common share | ||||||||||||||||||||||||||||||||||||||||||||||||||||||||||||||||||||
| Net income applicable to common shareholders | Net income applicable to common shareholders | $ | 7,560 | $ | 3,541 | Net income applicable to common shareholders | $ | 7,260 | $ | 4,440 | $ | 23,784 | $ | 11,265 | ||||||||||||||||||||||||||||||||||||||||||||||||||||||||
| Add preferred stock dividends due to assumed conversions | Add preferred stock dividends due to assumed conversions | — | — | 168 | — | |||||||||||||||||||||||||||||||||||||||||||||||||||||||||||||||||
| Net income allocated to common shareholders | Net income allocated to common shareholders | $ | 7,260 | $ | 4,440 | $ | 23,952 | $ | 11,265 | |||||||||||||||||||||||||||||||||||||||||||||||||||||||||||||
| Average common shares issued and outstanding | Average common shares issued and outstanding | 8,700.1 | 8,815.6 | Average common shares issued and outstanding | 8,430.7 | 8,732.9 | 8,583.1 | 8,762.6 | ||||||||||||||||||||||||||||||||||||||||||||||||||||||||||||||
Dilutive potential common shares (1) | Dilutive potential common shares (1) | 55.5 | 47.1 | Dilutive potential common shares (1) | 62.1 | 44.6 | 119.1 | 37.9 | ||||||||||||||||||||||||||||||||||||||||||||||||||||||||||||||
| Total diluted average common shares issued and outstanding | Total diluted average common shares issued and outstanding | 8,755.6 | 8,862.7 | Total diluted average common shares issued and outstanding | 8,492.8 | 8,777.5 | 8,702.2 | 8,800.5 | ||||||||||||||||||||||||||||||||||||||||||||||||||||||||||||||
| Diluted earnings per common share | Diluted earnings per common share | $ | 0.86 | $ | 0.40 | Diluted earnings per common share | $ | 0.85 | $ | 0.51 | $ | 2.75 | $ | 1.28 | ||||||||||||||||||||||||||||||||||||||||||||||||||||||||
| March 31, 2021 | September 30, 2021 | |||||||||||||||||||||||||||||||||||||||||||||||||||||||||
| Fair Value Measurements | Fair Value Measurements | |||||||||||||||||||||||||||||||||||||||||||||||||||||||||
| (Dollars in millions) | (Dollars in millions) | Level 1 | Level 2 | Level 3 | Netting Adjustments (1) | Assets/Liabilities at Fair Value | (Dollars in millions) | Level 1 | Level 2 | Level 3 | Netting Adjustments (1) | Assets/Liabilities at Fair Value | ||||||||||||||||||||||||||||||||||||||||||||||
| Assets | Assets | Assets | ||||||||||||||||||||||||||||||||||||||||||||||||||||||||
| Time deposits placed and other short-term investments | Time deposits placed and other short-term investments | $ | 1,613 | $ | 0 | $ | 0 | $ | — | $ | 1,613 | Time deposits placed and other short-term investments | $ | 336 | $ | — | $ | — | $ | — | $ | 336 | ||||||||||||||||||||||||||||||||||||
| Federal funds sold and securities borrowed or purchased under agreements to resell | Federal funds sold and securities borrowed or purchased under agreements to resell | 0 | 153,387 | 0 | — | 153,387 | Federal funds sold and securities borrowed or purchased under agreements to resell | — | 154,137 | — | — | 154,137 | ||||||||||||||||||||||||||||||||||||||||||||||
| Trading account assets: | Trading account assets: | Trading account assets: | ||||||||||||||||||||||||||||||||||||||||||||||||||||||||
U.S. Treasury and agency securities (2) | 32,709 | 2,653 | 0 | — | 35,362 | |||||||||||||||||||||||||||||||||||||||||||||||||||||
| U.S. Treasury and government agencies | U.S. Treasury and government agencies | 46,195 | 668 | — | — | 46,863 | ||||||||||||||||||||||||||||||||||||||||||||||||||||
| Corporate securities, trading loans and other | Corporate securities, trading loans and other | 0 | 29,847 | 1,516 | — | 31,363 | Corporate securities, trading loans and other | — | 36,895 | 1,634 | — | 38,529 | ||||||||||||||||||||||||||||||||||||||||||||||
| Equity securities | Equity securities | 108,394 | 32,455 | 273 | — | 141,122 | Equity securities | 96,266 | 39,577 | 209 | — | 136,052 | ||||||||||||||||||||||||||||||||||||||||||||||
| Non-U.S. sovereign debt | Non-U.S. sovereign debt | 12,470 | 21,085 | 334 | — | 33,889 | Non-U.S. sovereign debt | 9,763 | 23,176 | 399 | — | 33,338 | ||||||||||||||||||||||||||||||||||||||||||||||
| Mortgage trading loans, MBS and ABS: | Mortgage trading loans, MBS and ABS: | Mortgage trading loans, MBS and ABS: | ||||||||||||||||||||||||||||||||||||||||||||||||||||||||
U.S. government-sponsored agency guaranteed | U.S. government-sponsored agency guaranteed | 0 | 25,375 | 62 | — | 25,437 | U.S. government-sponsored agency guaranteed | — | 21,825 | 84 | — | 21,909 | ||||||||||||||||||||||||||||||||||||||||||||||
| Mortgage trading loans, ABS and other MBS | Mortgage trading loans, ABS and other MBS | 0 | 8,209 | 1,499 | — | 9,708 | Mortgage trading loans, ABS and other MBS | — | 10,385 | 1,490 | — | 11,875 | ||||||||||||||||||||||||||||||||||||||||||||||
Total trading account assets | Total trading account assets | 153,573 | 119,624 | 3,684 | — | 276,881 | Total trading account assets | 152,224 | 132,526 | 3,816 | — | 288,566 | ||||||||||||||||||||||||||||||||||||||||||||||
| Derivative assets | Derivative assets | 15,044 | 357,851 | 2,805 | (329,802) | 45,898 | Derivative assets | 17,376 | 330,477 | 3,827 | (310,851) | 40,829 | ||||||||||||||||||||||||||||||||||||||||||||||
| AFS debt securities: | AFS debt securities: | AFS debt securities: | ||||||||||||||||||||||||||||||||||||||||||||||||||||||||
| U.S. Treasury and agency securities | 158,911 | 1,110 | 0 | — | 160,021 | |||||||||||||||||||||||||||||||||||||||||||||||||||||
| U.S. Treasury and government agencies | U.S. Treasury and government agencies | 168,030 | 1,095 | — | — | 169,125 | ||||||||||||||||||||||||||||||||||||||||||||||||||||
| Mortgage-backed securities: | Mortgage-backed securities: | Mortgage-backed securities: | ||||||||||||||||||||||||||||||||||||||||||||||||||||||||
| Agency | Agency | 0 | 54,534 | 0 | — | 54,534 | Agency | — | 52,297 | — | — | 52,297 | ||||||||||||||||||||||||||||||||||||||||||||||
| Agency-collateralized mortgage obligations | Agency-collateralized mortgage obligations | 0 | 4,733 | 0 | — | 4,733 | Agency-collateralized mortgage obligations | — | 3,776 | — | — | 3,776 | ||||||||||||||||||||||||||||||||||||||||||||||
| Non-agency residential | Non-agency residential | 0 | 574 | 284 | — | 858 | Non-agency residential | — | 405 | 398 | — | 803 | ||||||||||||||||||||||||||||||||||||||||||||||
| Commercial | Commercial | 0 | 16,800 | 0 | — | 16,800 | Commercial | — | 18,819 | — | — | 18,819 | ||||||||||||||||||||||||||||||||||||||||||||||
| Non-U.S. securities | Non-U.S. securities | 0 | 14,755 | 13 | — | 14,768 | Non-U.S. securities | — | 12,283 | 10 | — | 12,293 | ||||||||||||||||||||||||||||||||||||||||||||||
| Other taxable securities | Other taxable securities | 0 | 2,485 | 73 | — | 2,558 | Other taxable securities | — | 2,560 | 73 | — | 2,633 | ||||||||||||||||||||||||||||||||||||||||||||||
| Tax-exempt securities | Tax-exempt securities | 0 | 16,243 | 98 | — | 16,341 | Tax-exempt securities | — | 15,559 | 53 | — | 15,612 | ||||||||||||||||||||||||||||||||||||||||||||||
| Total AFS debt securities | Total AFS debt securities | 158,911 | 111,234 | 468 | — | 270,613 | Total AFS debt securities | 168,030 | 106,794 | 534 | — | 275,358 | ||||||||||||||||||||||||||||||||||||||||||||||
| Other debt securities carried at fair value: | Other debt securities carried at fair value: | Other debt securities carried at fair value: | ||||||||||||||||||||||||||||||||||||||||||||||||||||||||
| U.S. Treasury and agency securities | 553 | 0 | 0 | — | 553 | |||||||||||||||||||||||||||||||||||||||||||||||||||||
| U.S. Treasury and government agencies | U.S. Treasury and government agencies | 276 | — | — | — | 276 | ||||||||||||||||||||||||||||||||||||||||||||||||||||
| Non-agency residential MBS | Non-agency residential MBS | 0 | 492 | 260 | — | 752 | Non-agency residential MBS | — | 411 | 296 | — | 707 | ||||||||||||||||||||||||||||||||||||||||||||||
| Non-U.S. and other securities | Non-U.S. and other securities | 4,020 | 4,974 | 0 | — | 8,994 | Non-U.S. and other securities | 3,851 | 5,185 | — | — | 9,036 | ||||||||||||||||||||||||||||||||||||||||||||||
| Total other debt securities carried at fair value | Total other debt securities carried at fair value | 4,573 | 5,466 | 260 | — | 10,299 | Total other debt securities carried at fair value | 4,127 | 5,596 | 296 | — | 10,019 | ||||||||||||||||||||||||||||||||||||||||||||||
| Loans and leases | Loans and leases | 0 | 6,210 | 793 | — | 7,003 | Loans and leases | — | 6,848 | 718 | — | 7,566 | ||||||||||||||||||||||||||||||||||||||||||||||
| Loans held-for-sale | Loans held-for-sale | 0 | 1,460 | 220 | — | 1,680 | Loans held-for-sale | — | 3,642 | 340 | — | 3,982 | ||||||||||||||||||||||||||||||||||||||||||||||
Other assets | Other assets | 12,086 | 3,036 | 2,090 | — | 17,212 | Other assets | 6,659 | 2,628 | 1,744 | — | 11,031 | ||||||||||||||||||||||||||||||||||||||||||||||
Total assets | Total assets | $ | 345,800 | $ | 758,268 | $ | 10,320 | $ | (329,802) | $ | 784,586 | Total assets | $ | 348,752 | $ | 742,648 | $ | 11,275 | $ | (310,851) | $ | 791,824 | ||||||||||||||||||||||||||||||||||||
| Liabilities | Liabilities | Liabilities | ||||||||||||||||||||||||||||||||||||||||||||||||||||||||
| Interest-bearing deposits in U.S. offices | Interest-bearing deposits in U.S. offices | $ | 0 | $ | 504 | $ | 0 | $ | — | $ | 504 | Interest-bearing deposits in U.S. offices | $ | — | $ | 542 | $ | — | $ | — | $ | 542 | ||||||||||||||||||||||||||||||||||||
| Federal funds purchased and securities loaned or sold under agreements to repurchase | Federal funds purchased and securities loaned or sold under agreements to repurchase | 0 | 154,865 | 0 | — | 154,865 | Federal funds purchased and securities loaned or sold under agreements to repurchase | — | 155,151 | — | — | 155,151 | ||||||||||||||||||||||||||||||||||||||||||||||
| Trading account liabilities: | Trading account liabilities: | Trading account liabilities: | ||||||||||||||||||||||||||||||||||||||||||||||||||||||||
| U.S. Treasury and agency securities | 17,622 | 1,017 | 0 | — | 18,639 | |||||||||||||||||||||||||||||||||||||||||||||||||||||
| U.S. Treasury and government agencies | U.S. Treasury and government agencies | 20,967 | 1,105 | — | — | 22,072 | ||||||||||||||||||||||||||||||||||||||||||||||||||||
| Equity securities | Equity securities | 47,480 | 3,949 | 0 | — | 51,429 | Equity securities | 47,035 | 5,472 | — | — | 52,507 | ||||||||||||||||||||||||||||||||||||||||||||||
| Non-U.S. sovereign debt | Non-U.S. sovereign debt | 14,600 | 9,318 | 0 | — | 23,918 | Non-U.S. sovereign debt | 17,766 | 10,511 | — | — | 28,277 | ||||||||||||||||||||||||||||||||||||||||||||||
| Corporate securities and other | Corporate securities and other | 0 | 8,786 | 16 | — | 8,802 | Corporate securities and other | — | 9,350 | 11 | — | 9,361 | ||||||||||||||||||||||||||||||||||||||||||||||
| Total trading account liabilities | Total trading account liabilities | 79,702 | 23,070 | 16 | — | 102,788 | Total trading account liabilities | 85,768 | 26,438 | 11 | — | 112,217 | ||||||||||||||||||||||||||||||||||||||||||||||
| Derivative liabilities | Derivative liabilities | 14,647 | 350,213 | 6,011 | (328,546) | 42,325 | Derivative liabilities | 18,341 | 328,506 | 6,152 | (314,937) | 38,062 | ||||||||||||||||||||||||||||||||||||||||||||||
| Short-term borrowings | Short-term borrowings | 0 | 4,503 | 0 | — | 4,503 | Short-term borrowings | — | 4,128 | — | — | 4,128 | ||||||||||||||||||||||||||||||||||||||||||||||
| Accrued expenses and other liabilities | Accrued expenses and other liabilities | 14,367 | 3,204 | 0 | — | 17,571 | Accrued expenses and other liabilities | 7,471 | 2,790 | — | — | 10,261 | ||||||||||||||||||||||||||||||||||||||||||||||
| Long-term debt | Long-term debt | 0 | 29,486 | 1,028 | — | 30,514 | Long-term debt | — | 27,570 | 1,126 | — | 28,696 | ||||||||||||||||||||||||||||||||||||||||||||||
Total liabilities | Total liabilities | $ | 108,716 | $ | 565,845 | $ | 7,055 | $ | (328,546) | $ | 353,070 | Total liabilities | $ | 111,580 | $ | 545,125 | $ | 7,289 | $ | (314,937) | $ | 349,057 | ||||||||||||||||||||||||||||||||||||
Bank of America | ||||||||
| December 31, 2020 | December 31, 2020 | |||||||||||||||||||||||||||||||||||||||||||||||||||||||||
| Fair Value Measurements | Fair Value Measurements | |||||||||||||||||||||||||||||||||||||||||||||||||||||||||
| (Dollars in millions) | (Dollars in millions) | Level 1 | Level 2 | Level 3 | Netting Adjustments (1) | Assets/Liabilities at Fair Value | (Dollars in millions) | Level 1 | Level 2 | Level 3 | Netting Adjustments (1) | Assets/Liabilities at Fair Value | ||||||||||||||||||||||||||||||||||||||||||||||
| Assets | Assets | Assets | ||||||||||||||||||||||||||||||||||||||||||||||||||||||||
| Time deposits placed and other short-term investments | Time deposits placed and other short-term investments | $ | 1,649 | $ | 0 | $ | 0 | $ | — | $ | 1,649 | Time deposits placed and other short-term investments | $ | 1,649 | $ | — | $ | — | $ | — | $ | 1,649 | ||||||||||||||||||||||||||||||||||||
| Federal funds sold and securities borrowed or purchased under agreements to resell | Federal funds sold and securities borrowed or purchased under agreements to resell | 0 | 108,856 | 0 | — | 108,856 | Federal funds sold and securities borrowed or purchased under agreements to resell | — | 108,856 | — | — | 108,856 | ||||||||||||||||||||||||||||||||||||||||||||||
| Trading account assets: | Trading account assets: | Trading account assets: | ||||||||||||||||||||||||||||||||||||||||||||||||||||||||
U.S. Treasury and agency securities (2) | 45,219 | 3,051 | 0 | — | 48,270 | |||||||||||||||||||||||||||||||||||||||||||||||||||||
| U.S. Treasury and government agencies | U.S. Treasury and government agencies | 45,219 | 3,051 | — | — | 48,270 | ||||||||||||||||||||||||||||||||||||||||||||||||||||
| Corporate securities, trading loans and other | Corporate securities, trading loans and other | 0 | 22,817 | 1,359 | — | 24,176 | Corporate securities, trading loans and other | — | 22,817 | 1,359 | — | 24,176 | ||||||||||||||||||||||||||||||||||||||||||||||
| Equity securities | Equity securities | 36,372 | 31,372 | 227 | — | 67,971 | Equity securities | 36,372 | 31,372 | 227 | — | 67,971 | ||||||||||||||||||||||||||||||||||||||||||||||
| Non-U.S. sovereign debt | Non-U.S. sovereign debt | 5,753 | 20,884 | 354 | — | 26,991 | Non-U.S. sovereign debt | 5,753 | 20,884 | 354 | — | 26,991 | ||||||||||||||||||||||||||||||||||||||||||||||
| Mortgage trading loans, MBS and ABS: | Mortgage trading loans, MBS and ABS: | Mortgage trading loans, MBS and ABS: | ||||||||||||||||||||||||||||||||||||||||||||||||||||||||
U.S. government-sponsored agency guaranteed | U.S. government-sponsored agency guaranteed | 0 | 21,566 | 75 | — | 21,641 | U.S. government-sponsored agency guaranteed | — | 21,566 | 75 | — | 21,641 | ||||||||||||||||||||||||||||||||||||||||||||||
| Mortgage trading loans, ABS and other MBS | Mortgage trading loans, ABS and other MBS | 0 | 8,440 | 1,365 | — | 9,805 | Mortgage trading loans, ABS and other MBS | — | 8,440 | 1,365 | — | 9,805 | ||||||||||||||||||||||||||||||||||||||||||||||
Total trading account assets | Total trading account assets | 87,344 | 108,130 | 3,380 | — | 198,854 | Total trading account assets | 87,344 | 108,130 | 3,380 | — | 198,854 | ||||||||||||||||||||||||||||||||||||||||||||||
| Derivative assets | Derivative assets | 15,624 | 416,175 | 2,751 | (387,371) | 47,179 | Derivative assets | 15,624 | 416,175 | 2,751 | (387,371) | 47,179 | ||||||||||||||||||||||||||||||||||||||||||||||
| AFS debt securities: | AFS debt securities: | AFS debt securities: | ||||||||||||||||||||||||||||||||||||||||||||||||||||||||
| U.S. Treasury and agency securities | 115,266 | 1,114 | 0 | — | 116,380 | |||||||||||||||||||||||||||||||||||||||||||||||||||||
| U.S. Treasury and government agencies | U.S. Treasury and government agencies | 115,266 | 1,114 | — | — | 116,380 | ||||||||||||||||||||||||||||||||||||||||||||||||||||
| Mortgage-backed securities: | Mortgage-backed securities: | Mortgage-backed securities: | ||||||||||||||||||||||||||||||||||||||||||||||||||||||||
| Agency | Agency | 0 | 61,849 | 0 | — | 61,849 | Agency | — | 61,849 | — | — | 61,849 | ||||||||||||||||||||||||||||||||||||||||||||||
| Agency-collateralized mortgage obligations | Agency-collateralized mortgage obligations | 0 | 5,260 | 0 | — | 5,260 | Agency-collateralized mortgage obligations | — | 5,260 | — | — | 5,260 | ||||||||||||||||||||||||||||||||||||||||||||||
| Non-agency residential | Non-agency residential | 0 | 631 | 378 | — | 1,009 | Non-agency residential | — | 631 | 378 | — | 1,009 | ||||||||||||||||||||||||||||||||||||||||||||||
| Commercial | Commercial | 0 | 16,491 | 0 | — | 16,491 | Commercial | — | 16,491 | — | — | 16,491 | ||||||||||||||||||||||||||||||||||||||||||||||
| Non-U.S. securities | Non-U.S. securities | 0 | 13,999 | 18 | — | 14,017 | Non-U.S. securities | — | 13,999 | 18 | — | 14,017 | ||||||||||||||||||||||||||||||||||||||||||||||
| Other taxable securities | Other taxable securities | 0 | 2,640 | 71 | — | 2,711 | Other taxable securities | — | 2,640 | 71 | — | 2,711 | ||||||||||||||||||||||||||||||||||||||||||||||
| Tax-exempt securities | Tax-exempt securities | 0 | 16,598 | 176 | — | 16,774 | Tax-exempt securities | — | 16,598 | 176 | — | 16,774 | ||||||||||||||||||||||||||||||||||||||||||||||
| Total AFS debt securities | Total AFS debt securities | 115,266 | 118,582 | 643 | — | 234,491 | Total AFS debt securities | 115,266 | 118,582 | 643 | — | 234,491 | ||||||||||||||||||||||||||||||||||||||||||||||
| Other debt securities carried at fair value: | Other debt securities carried at fair value: | Other debt securities carried at fair value: | ||||||||||||||||||||||||||||||||||||||||||||||||||||||||
| U.S. Treasury and agency securities | 93 | 0 | 0 | — | 93 | |||||||||||||||||||||||||||||||||||||||||||||||||||||
| U.S. Treasury and government agencies | U.S. Treasury and government agencies | 93 | — | — | — | 93 | ||||||||||||||||||||||||||||||||||||||||||||||||||||
| Non-agency residential MBS | Non-agency residential MBS | 0 | 506 | 267 | — | 773 | Non-agency residential MBS | — | 506 | 267 | — | 773 | ||||||||||||||||||||||||||||||||||||||||||||||
| Non-U.S. and other securities | Non-U.S. and other securities | 2,619 | 8,625 | 0 | — | 11,244 | Non-U.S. and other securities | 2,619 | 8,625 | — | — | 11,244 | ||||||||||||||||||||||||||||||||||||||||||||||
| Total other debt securities carried at fair value | Total other debt securities carried at fair value | 2,712 | 9,131 | 267 | — | 12,110 | Total other debt securities carried at fair value | 2,712 | 9,131 | 267 | — | 12,110 | ||||||||||||||||||||||||||||||||||||||||||||||
| Loans and leases | Loans and leases | 0 | 5,964 | 717 | — | 6,681 | Loans and leases | — | 5,964 | 717 | — | 6,681 | ||||||||||||||||||||||||||||||||||||||||||||||
| Loans held-for-sale | Loans held-for-sale | 0 | 1,349 | 236 | — | 1,585 | Loans held-for-sale | — | 1,349 | 236 | — | 1,585 | ||||||||||||||||||||||||||||||||||||||||||||||
Other assets | Other assets | 9,898 | 3,850 | 1,970 | — | 15,718 | Other assets | 9,898 | 3,850 | 1,970 | — | 15,718 | ||||||||||||||||||||||||||||||||||||||||||||||
Total assets | Total assets | $ | 232,493 | $ | 772,037 | $ | 9,964 | $ | (387,371) | $ | 627,123 | Total assets | $ | 232,493 | $ | 772,037 | $ | 9,964 | $ | (387,371) | $ | 627,123 | ||||||||||||||||||||||||||||||||||||
| Liabilities | Liabilities | Liabilities | ||||||||||||||||||||||||||||||||||||||||||||||||||||||||
| Interest-bearing deposits in U.S. offices | Interest-bearing deposits in U.S. offices | $ | 0 | $ | 481 | $ | 0 | $ | — | $ | 481 | Interest-bearing deposits in U.S. offices | $ | — | $ | 481 | $ | — | $ | — | $ | 481 | ||||||||||||||||||||||||||||||||||||
| Federal funds purchased and securities loaned or sold under agreements to repurchase | Federal funds purchased and securities loaned or sold under agreements to repurchase | 0 | 135,391 | 0 | — | 135,391 | Federal funds purchased and securities loaned or sold under agreements to repurchase | — | 135,391 | — | — | 135,391 | ||||||||||||||||||||||||||||||||||||||||||||||
| Trading account liabilities: | Trading account liabilities: | Trading account liabilities: | ||||||||||||||||||||||||||||||||||||||||||||||||||||||||
| U.S. Treasury and agency securities | 9,425 | 139 | 0 | — | 9,564 | |||||||||||||||||||||||||||||||||||||||||||||||||||||
| U.S. Treasury and government agencies | U.S. Treasury and government agencies | 9,425 | 139 | — | — | 9,564 | ||||||||||||||||||||||||||||||||||||||||||||||||||||
| Equity securities | Equity securities | 38,189 | 4,235 | 0 | — | 42,424 | Equity securities | 38,189 | 4,235 | — | — | 42,424 | ||||||||||||||||||||||||||||||||||||||||||||||
| Non-U.S. sovereign debt | Non-U.S. sovereign debt | 5,853 | 8,043 | 0 | — | 13,896 | Non-U.S. sovereign debt | 5,853 | 8,043 | — | — | 13,896 | ||||||||||||||||||||||||||||||||||||||||||||||
| Corporate securities and other | Corporate securities and other | 0 | 5,420 | 16 | — | 5,436 | Corporate securities and other | — | 5,420 | 16 | — | 5,436 | ||||||||||||||||||||||||||||||||||||||||||||||
| Total trading account liabilities | Total trading account liabilities | 53,467 | 17,837 | 16 | — | 71,320 | Total trading account liabilities | 53,467 | 17,837 | 16 | — | 71,320 | ||||||||||||||||||||||||||||||||||||||||||||||
| Derivative liabilities | Derivative liabilities | 14,907 | 412,881 | 6,219 | (388,481) | 45,526 | Derivative liabilities | 14,907 | 412,881 | 6,219 | (388,481) | 45,526 | ||||||||||||||||||||||||||||||||||||||||||||||
| Short-term borrowings | Short-term borrowings | 0 | 5,874 | 0 | — | 5,874 | Short-term borrowings | — | 5,874 | — | — | 5,874 | ||||||||||||||||||||||||||||||||||||||||||||||
| Accrued expenses and other liabilities | Accrued expenses and other liabilities | 12,297 | 4,014 | 0 | — | 16,311 | Accrued expenses and other liabilities | 12,297 | 4,014 | — | — | 16,311 | ||||||||||||||||||||||||||||||||||||||||||||||
| Long-term debt | Long-term debt | 0 | 31,036 | 1,164 | — | 32,200 | Long-term debt | — | 31,036 | 1,164 | — | 32,200 | ||||||||||||||||||||||||||||||||||||||||||||||
Total liabilities (5) | Total liabilities (5) | $ | 80,671 | $ | 607,514 | $ | 7,399 | $ | (388,481) | $ | 307,103 | Total liabilities (5) | $ | 80,671 | $ | 607,514 | $ | 7,399 | $ | (388,481) | $ | 307,103 | ||||||||||||||||||||||||||||||||||||
Level 3 – Fair Value Measurements (1) | Level 3 – Fair Value Measurements (1) | Level 3 – Fair Value Measurements (1) | ||||||||||||||||||||||||||||||||||||||||||||||||||||||||||||||||||||||||||
| Balance January 1 | Total Realized/Unrealized Gains (Losses) in Net Income (2) | Gains (Losses) in OCI (3) | Gross | Gross Transfers into Level 3 | Gross Transfers out of Level 3 | Balance March 31 | Change in Unrealized Gains (Losses) in Net Income Related to Financial Instruments Still Held (2) | Balance July 1 | Total Realized/Unrealized Gains (Losses) in Net Income (2) | Gains (Losses) in OCI (3) | Gross | Gross Transfers into Level 3 | Gross Transfers out of Level 3 | Balance September 30 | Change in Unrealized Gains (Losses) in Net Income Related to Financial Instruments Still Held (2) | |||||||||||||||||||||||||||||||||||||||||||||||||||||||||||||
| (Dollars in millions) | (Dollars in millions) | Purchases | Sales | Issuances | Settlements | (Dollars in millions) | Purchases | Sales | Issuances | Settlements | ||||||||||||||||||||||||||||||||||||||||||||||||||||||||||||||||||
| Three Months Ended March 31, 2021 | ||||||||||||||||||||||||||||||||||||||||||||||||||||||||||||||||||||||||||||
| Three Months Ended September 30, 2021 | Three Months Ended September 30, 2021 | |||||||||||||||||||||||||||||||||||||||||||||||||||||||||||||||||||||||||||
| Trading account assets: | Trading account assets: | Trading account assets: | ||||||||||||||||||||||||||||||||||||||||||||||||||||||||||||||||||||||||||
| Corporate securities, trading loans and other | Corporate securities, trading loans and other | $ | 1,359 | $ | (13) | $ | 0 | $ | 241 | $ | (147) | $ | 0 | $ | (17) | $ | 152 | $ | (59) | $ | 1,516 | $ | (19) | Corporate securities, trading loans and other | $ | 1,764 | $ | (2) | $ | — | $ | 89 | $ | (43) | $ | — | $ | (118) | $ | 239 | $ | (295) | $ | 1,634 | $ | (20) | ||||||||||||||||||||||||||||||
| Equity securities | Equity securities | 227 | (10) | 0 | 45 | (23) | 0 | 0 | 52 | (18) | 273 | (10) | Equity securities | 260 | (2) | — | 18 | (11) | — | — | 20 | (76) | 209 | (2) | ||||||||||||||||||||||||||||||||||||||||||||||||||||
| Non-U.S. sovereign debt | Non-U.S. sovereign debt | 354 | 0 | (22) | 2 | 0 | 0 | 0 | 0 | 0 | 334 | 3 | Non-U.S. sovereign debt | 414 | 4 | (26) | 16 | — | — | (9) | — | — | 399 | 4 | ||||||||||||||||||||||||||||||||||||||||||||||||||||
| Mortgage trading loans, MBS and ABS | Mortgage trading loans, MBS and ABS | 1,440 | 49 | 0 | 128 | (221) | 1 | (36) | 256 | (56) | 1,561 | 32 | Mortgage trading loans, MBS and ABS | 1,498 | (43) | — | 97 | (89) | — | (61) | 180 | (8) | 1,574 | (41) | ||||||||||||||||||||||||||||||||||||||||||||||||||||
| Total trading account assets | Total trading account assets | 3,380 | 26 | (22) | 416 | (391) | 1 | (53) | 460 | (133) | 3,684 | 6 | Total trading account assets | 3,936 | (43) | (26) | 220 | (143) | — | (188) | 439 | (379) | 3,816 | (59) | ||||||||||||||||||||||||||||||||||||||||||||||||||||
Net derivative assets (liabilities) (4) | Net derivative assets (liabilities) (4) | (3,468) | 286 | 0 | 138 | (261) | 0 | 147 | (108) | 60 | (3,206) | 272 | Net derivative assets (liabilities) (4) | (2,884) | 564 | — | 124 | (168) | — | 23 | 173 | (157) | (2,325) | 512 | ||||||||||||||||||||||||||||||||||||||||||||||||||||
| AFS debt securities: | AFS debt securities: | AFS debt securities: | ||||||||||||||||||||||||||||||||||||||||||||||||||||||||||||||||||||||||||
| Non-agency residential MBS | Non-agency residential MBS | 378 | (16) | (97) | 0 | 0 | 0 | (17) | 36 | 0 | 284 | (16) | Non-agency residential MBS | 205 | (1) | (2) | — | — | — | (12) | 208 | — | 398 | (4) | ||||||||||||||||||||||||||||||||||||||||||||||||||||
| Non-U.S. securities | Non-U.S. securities | 18 | 0 | 0 | 0 | 0 | 0 | (5) | 0 | 0 | 13 | 0 | Non-U.S. securities | 11 | (3) | — | — | — | — | 2 | — | — | 10 | — | ||||||||||||||||||||||||||||||||||||||||||||||||||||
| Other taxable securities | Other taxable securities | 71 | 0 | (6) | 8 | 0 | 0 | 0 | 0 | 0 | 73 | 0 | Other taxable securities | 74 | — | (1) | — | — | — | — | — | — | 73 | — | ||||||||||||||||||||||||||||||||||||||||||||||||||||
| Tax-exempt securities | Tax-exempt securities | 176 | 14 | 0 | 0 | 0 | 0 | 0 | 0 | (92) | 98 | 13 | Tax-exempt securities | 51 | 2 | — | — | — | — | — | — | — | 53 | 2 | ||||||||||||||||||||||||||||||||||||||||||||||||||||
| Total AFS debt securities | Total AFS debt securities | 643 | (2) | (103) | 8 | 0 | 0 | (22) | 36 | (92) | 468 | (3) | Total AFS debt securities | 341 | (2) | (3) | — | — | — | (10) | 208 | — | 534 | (2) | ||||||||||||||||||||||||||||||||||||||||||||||||||||
| Other debt securities carried at fair value – Non-agency residential MBS | Other debt securities carried at fair value – Non-agency residential MBS | 267 | (1) | 0 | 0 | 0 | 0 | (6) | 0 | 0 | 260 | (1) | Other debt securities carried at fair value – Non-agency residential MBS | 281 | (2) | — | — | — | — | (9) | 26 | — | 296 | (2) | ||||||||||||||||||||||||||||||||||||||||||||||||||||
Loans and leases (5,6) | Loans and leases (5,6) | 717 | 70 | 0 | 0 | 0 | 10 | (34) | 30 | 0 | 793 | 71 | Loans and leases (5,6) | 857 | (59) | — | — | — | — | (67) | — | (13) | 718 | (59) | ||||||||||||||||||||||||||||||||||||||||||||||||||||
Loans held-for-sale (5,6) | Loans held-for-sale (5,6) | 236 | (6) | (8) | 0 | 0 | 0 | (17) | 19 | (4) | 220 | (9) | Loans held-for-sale (5,6) | 263 | 13 | (7) | 94 | (1) | — | (22) | — | — | 340 | 10 | ||||||||||||||||||||||||||||||||||||||||||||||||||||
Other assets (6,7) | Other assets (6,7) | 1,970 | 174 | 4 | 0 | (1) | 41 | (105) | 7 | 0 | 2,090 | 163 | Other assets (6,7) | 1,775 | 15 | (6) | 1 | 1 | 51 | (95) | 2 | — | 1,744 | 49 | ||||||||||||||||||||||||||||||||||||||||||||||||||||
Trading account liabilities – Corporate securities and other | Trading account liabilities – Corporate securities and other | (16) | 0 | 0 | 0 | 0 | 0 | 0 | 0 | 0 | (16) | 0 | Trading account liabilities – Corporate securities and other | (17) | 6 | — | — | — | — | — | — | — | (11) | (1) | ||||||||||||||||||||||||||||||||||||||||||||||||||||
Long-term debt (5) | Long-term debt (5) | (1,164) | 49 | (13) | 0 | 0 | 0 | 18 | (32) | 114 | (1,028) | 50 | Long-term debt (5) | (1,060) | (65) | 2 | — | — | (9) | 30 | (25) | 1 | (1,126) | (65) | ||||||||||||||||||||||||||||||||||||||||||||||||||||
| Three Months Ended March 31, 2020 | ||||||||||||||||||||||||||||||||||||||||||||||||||||||||||||||||||||||||||||
| Three Months Ended September 30, 2020 | Three Months Ended September 30, 2020 | |||||||||||||||||||||||||||||||||||||||||||||||||||||||||||||||||||||||||||
| Trading account assets: | Trading account assets: | Trading account assets: | ||||||||||||||||||||||||||||||||||||||||||||||||||||||||||||||||||||||||||
| Corporate securities, trading loans and other | Corporate securities, trading loans and other | $ | 1,507 | $ | (103) | $ | (1) | $ | 216 | $ | (90) | $ | 8 | $ | (32) | $ | 237 | $ | (102) | $ | 1,640 | $ | (108) | Corporate securities, trading loans and other | $ | 1,548 | $ | (20) | $ | — | $ | — | $ | (49) | $ | — | $ | (91) | $ | 136 | $ | (54) | $ | 1,470 | $ | (34) | ||||||||||||||||||||||||||||||
| Equity securities | Equity securities | 239 | (26) | 0 | 26 | (11) | 0 | 0 | 25 | (4) | 249 | (27) | Equity securities | 194 | 8 | — | 4 | (3) | — | — | 7 | (3) | 207 | 3 | ||||||||||||||||||||||||||||||||||||||||||||||||||||
| Non-U.S. sovereign debt | Non-U.S. sovereign debt | 482 | 2 | (53) | 73 | (48) | 0 | (10) | 17 | (213) | 250 | 3 | Non-U.S. sovereign debt | 248 | 7 | (6) | 1 | (2) | — | (1) | 83 | (40) | 290 | 6 | ||||||||||||||||||||||||||||||||||||||||||||||||||||
| Mortgage trading loans, MBS and ABS | Mortgage trading loans, MBS and ABS | 1,553 | (125) | (2) | 362 | (245) | 0 | (19) | 233 | (24) | 1,733 | (129) | Mortgage trading loans, MBS and ABS | 1,736 | 2 | — | 36 | (108) | 11 | (12) | 167 | (62) | 1,770 | 10 | ||||||||||||||||||||||||||||||||||||||||||||||||||||
| Total trading account assets | Total trading account assets | 3,781 | (252) | (56) | 677 | (394) | 8 | (61) | 512 | (343) | 3,872 | (261) | Total trading account assets | 3,726 | (3) | (6) | 41 | (162) | 11 | (104) | 393 | (159) | 3,737 | (15) | ||||||||||||||||||||||||||||||||||||||||||||||||||||
Net derivative assets (liabilities) (4) | Net derivative assets (liabilities) (4) | (2,538) | 346 | 0 | 40 | (148) | 0 | 12 | (528) | (93) | (2,909) | 279 | Net derivative assets (liabilities) (4) | (3,343) | 228 | — | 39 | (177) | — | (58) | 3 | (223) | (3,531) | 196 | ||||||||||||||||||||||||||||||||||||||||||||||||||||
| AFS debt securities: | AFS debt securities: | AFS debt securities: | ||||||||||||||||||||||||||||||||||||||||||||||||||||||||||||||||||||||||||
| Non-agency residential MBS | Non-agency residential MBS | 424 | (3) | (13) | 0 | 0 | 0 | (12) | 128 | 0 | 524 | 0 | Non-agency residential MBS | 462 | — | 5 | — | — | — | (10) | 25 | (42) | 440 | — | ||||||||||||||||||||||||||||||||||||||||||||||||||||
| Non-U.S. securities | Non-U.S. securities | 2 | 0 | 0 | 0 | (1) | 0 | 0 | 0 | 0 | 1 | 0 | Non-U.S. securities | 5 | — | — | — | — | — | (1) | 10 | — | 14 | — | ||||||||||||||||||||||||||||||||||||||||||||||||||||
| Other taxable securities | Other taxable securities | 65 | 0 | 0 | 3 | 0 | 0 | 0 | 0 | 0 | 68 | 0 | Other taxable securities | 65 | — | — | 3 | — | — | — | — | — | 68 | — | ||||||||||||||||||||||||||||||||||||||||||||||||||||
| Tax-exempt securities | Tax-exempt securities | 108 | (10) | 2 | 0 | 0 | 0 | 0 | 0 | 0 | 100 | 0 | Tax-exempt securities | 337 | 15 | — | — | — | — | (167) | — | (5) | 180 | 15 | ||||||||||||||||||||||||||||||||||||||||||||||||||||
| Total AFS debt securities | Total AFS debt securities | 599 | (13) | (11) | 3 | (1) | 0 | (12) | 128 | 0 | 693 | 0 | Total AFS debt securities | 869 | 15 | 5 | 3 | — | — | (178) | 35 | (47) | 702 | 15 | ||||||||||||||||||||||||||||||||||||||||||||||||||||
| Other debt securities carried at fair value – Non-agency residential MBS | Other debt securities carried at fair value – Non-agency residential MBS | 299 | (49) | 0 | 0 | 0 | 0 | (4) | 26 | (3) | 269 | (49) | Other debt securities carried at fair value – Non-agency residential MBS | 449 | 18 | — | — | — | — | (11) | 2 | — | 458 | 17 | ||||||||||||||||||||||||||||||||||||||||||||||||||||
Loans and leases (5,6) | Loans and leases (5,6) | 693 | (119) | 0 | 0 | 0 | 0 | (16) | 0 | 0 | 558 | (107) | Loans and leases (5,6) | 741 | (2) | — | — | (25) | — | (89) | — | — | 625 | (5) | ||||||||||||||||||||||||||||||||||||||||||||||||||||
Loans held-for-sale (5,6) | Loans held-for-sale (5,6) | 375 | (9) | (28) | 0 | 0 | 691 | (45) | 93 | 0 | 1,077 | (15) | Loans held-for-sale (5,6) | 970 | (7) | (2) | — | (25) | — | (14) | — | — | 922 | (10) | ||||||||||||||||||||||||||||||||||||||||||||||||||||
Other assets (6,7) | Other assets (6,7) | 2,360 | (251) | (30) | 0 | 1 | 20 | (142) | 2 | 0 | 1,960 | (287) | Other assets (6,7) | 1,911 | 25 | 6 | — | 1 | 53 | (121) | — | — | 1,875 | 4 | ||||||||||||||||||||||||||||||||||||||||||||||||||||
| Trading account liabilities – Equity securities | Trading account liabilities – Equity securities | (2) | 1 | 0 | 0 | 0 | 0 | 0 | 0 | 0 | (1) | 1 | Trading account liabilities – Equity securities | (1) | — | — | — | — | — | — | — | — | (1) | — | ||||||||||||||||||||||||||||||||||||||||||||||||||||
Trading account liabilities – Corporate securities and other | Trading account liabilities – Corporate securities and other | (15) | 1 | 0 | (6) | 0 | 0 | 0 | 0 | 0 | (20) | 1 | Trading account liabilities – Corporate securities and other | (16) | 2 | — | — | (2) | — | — | — | — | (16) | — | ||||||||||||||||||||||||||||||||||||||||||||||||||||
Long-term debt (5) | Long-term debt (5) | (1,149) | 127 | 187 | 8 | 0 | (13) | 141 | (23) | 1 | (721) | 126 | Long-term debt (5) | (956) | (50) | (10) | — | — | — | 46 | — | — | (970) | (50) | ||||||||||||||||||||||||||||||||||||||||||||||||||||
Bank of America | ||||||||
Level 3 – Fair Value Measurements (1) | ||||||||||||||||||||||||||||||||||||||
| Balance January 1 | Total Realized/Unrealized Gains (Losses) in Net Income (2) | Gains (Losses) in OCI (3) | Gross | Gross Transfers into Level 3 | Gross Transfers out of Level 3 | Balance September 30 | Change in Unrealized Gains (Losses) in Net Income Related to Financial Instruments Still Held (2) | |||||||||||||||||||||||||||||||
| (Dollars in millions) | Purchases | Sales | Issuances | Settlements | ||||||||||||||||||||||||||||||||||
| Nine Months Ended September 30, 2021 | ||||||||||||||||||||||||||||||||||||||
| Trading account assets: | ||||||||||||||||||||||||||||||||||||||
| Corporate securities, trading loans and other | $ | 1,359 | $ | 23 | $ | — | $ | 515 | $ | (300) | $ | — | $ | (251) | $ | 697 | $ | (409) | $ | 1,634 | $ | (42) | ||||||||||||||||
| Equity securities | 227 | 20 | — | 71 | (60) | — | — | 98 | (147) | 209 | (17) | |||||||||||||||||||||||||||
| Non-U.S. sovereign debt | 354 | 24 | (14) | 18 | — | — | (9) | 26 | — | 399 | 27 | |||||||||||||||||||||||||||
| Mortgage trading loans, ABS and other MBS | 1,440 | (4) | — | 344 | (584) | 1 | (125) | 624 | (122) | 1,574 | (65) | |||||||||||||||||||||||||||
| Total trading account assets | 3,380 | 63 | (14) | 948 | (944) | 1 | (385) | 1,445 | (678) | 3,816 | (97) | |||||||||||||||||||||||||||
Net derivative assets (liabilities) (4) | (3,468) | 855 | — | 473 | (517) | — | 206 | (18) | 144 | (2,325) | 579 | |||||||||||||||||||||||||||
| AFS debt securities: | ||||||||||||||||||||||||||||||||||||||
| Non-agency residential MBS | 378 | (16) | (96) | — | — | — | (37) | 244 | (75) | 398 | (7) | |||||||||||||||||||||||||||
| Non-U.S. securities | 18 | (4) | — | — | — | — | (4) | — | — | 10 | — | |||||||||||||||||||||||||||
| Other taxable securities | 71 | — | (6) | 8 | — | — | — | — | — | 73 | — | |||||||||||||||||||||||||||
| Tax-exempt securities | 176 | 19 | — | — | — | — | — | — | (142) | 53 | 18 | |||||||||||||||||||||||||||
| Total AFS debt securities | 643 | (1) | (102) | 8 | — | — | (41) | 244 | (217) | 534 | 11 | |||||||||||||||||||||||||||
| Other debt securities carried at fair value – Non-agency residential MBS | 267 | — | — | — | — | — | (29) | 58 | — | 296 | — | |||||||||||||||||||||||||||
Loans and leases (5,6) | 717 | 45 | — | — | — | 70 | (147) | 46 | (13) | 718 | 52 | |||||||||||||||||||||||||||
Loans held-for-sale (5,6) | 236 | 17 | (4) | 132 | (1) | — | (62) | 26 | (4) | 340 | 40 | |||||||||||||||||||||||||||
Other assets (6,7) | 1,970 | 36 | 2 | 56 | (144) | 115 | (300) | 9 | — | 1,744 | 92 | |||||||||||||||||||||||||||
Trading account liabilities – Corporate securities and other | (16) | 6 | — | — | — | (1) | — | — | — | (11) | — | |||||||||||||||||||||||||||
Long-term debt (5) | (1,164) | (83) | 4 | 2 | — | (11) | 67 | (57) | 116 | (1,126) | (54) | |||||||||||||||||||||||||||
| Nine Months Ended September 30, 2020 | ||||||||||||||||||||||||||||||||||||||
| Trading account assets: | ||||||||||||||||||||||||||||||||||||||
| Corporate securities, trading loans and other | $ | 1,507 | $ | (150) | $ | (1) | $ | 280 | $ | (181) | $ | 8 | $ | (165) | $ | 520 | $ | (348) | $ | 1,470 | $ | (128) | ||||||||||||||||
| Equity securities | 239 | (17) | — | 33 | (37) | — | — | 32 | (43) | 207 | (20) | |||||||||||||||||||||||||||
| Non-U.S. sovereign debt | 482 | 35 | (69) | 76 | (61) | — | (20) | 100 | (253) | 290 | 33 | |||||||||||||||||||||||||||
| Mortgage trading loans, ABS and other MBS | 1,553 | (145) | (3) | 502 | (582) | 11 | (52) | 659 | (173) | 1,770 | (135) | |||||||||||||||||||||||||||
| Total trading account assets | 3,781 | (277) | (73) | 891 | (861) | 19 | (237) | 1,311 | (817) | 3,737 | (250) | |||||||||||||||||||||||||||
Net derivative assets (liabilities) (4) | (2,538) | 111 | — | 216 | (558) | — | (224) | (273) | (265) | (3,531) | (356) | |||||||||||||||||||||||||||
| AFS debt securities: | ||||||||||||||||||||||||||||||||||||||
| Non-agency residential MBS | 424 | (5) | (4) | 23 | — | — | (32) | 158 | (124) | 440 | (5) | |||||||||||||||||||||||||||
| Non-U.S. securities | 2 | — | — | — | (1) | — | (1) | 14 | — | 14 | — | |||||||||||||||||||||||||||
| Other taxable securities | 65 | — | — | 6 | (4) | — | — | 1 | — | 68 | — | |||||||||||||||||||||||||||
| Tax-exempt securities | 108 | (19) | 3 | — | — | — | (167) | 265 | (10) | 180 | (18) | |||||||||||||||||||||||||||
| Total AFS debt securities | 599 | (24) | (1) | 29 | (5) | — | (200) | 438 | (134) | 702 | (23) | |||||||||||||||||||||||||||
| Other debt securities carried at fair value – Non-agency residential MBS | 299 | 12 | — | — | — | — | (19) | 178 | (12) | 458 | (12) | |||||||||||||||||||||||||||
Loans and leases (5,6) | 693 | (74) | — | 32 | (26) | 22 | (120) | 98 | — | 625 | (61) | |||||||||||||||||||||||||||
Loans held-for-sale (5,6) | 375 | (7) | (35) | — | (106) | 691 | (89) | 93 | — | 922 | (19) | |||||||||||||||||||||||||||
Other assets (6,7) | 2,360 | (294) | (11) | — | 2 | 206 | (391) | 5 | (2) | 1,875 | (373) | |||||||||||||||||||||||||||
| Trading account liabilities – Equity securities | (2) | 1 | — | — | — | — | — | — | — | (1) | 1 | |||||||||||||||||||||||||||
Trading account liabilities – Corporate securities and other | (15) | 7 | — | (7) | (2) | — | 1 | — | — | (16) | — | |||||||||||||||||||||||||||
Long-term debt (5) | (1,149) | 5 | 50 | 8 | — | (45) | 201 | (52) | 12 | (970) | (10) | |||||||||||||||||||||||||||
91Bank of America | ||||||||
| Quantitative Information about Level 3 Fair Value Measurements at March 31, 2021 | ||||||||||||||||||||||||||||||||||
| Quantitative Information about Level 3 Fair Value Measurements at September 30, 2021 | Quantitative Information about Level 3 Fair Value Measurements at September 30, 2021 | |||||||||||||||||||||||||||||||||
| (Dollars in millions) | (Dollars in millions) | Inputs | (Dollars in millions) | Inputs | ||||||||||||||||||||||||||||||
| Financial Instrument | Financial Instrument | Fair Value | Valuation Technique | Significant Unobservable Inputs | Ranges of Inputs | Weighted Average (1) | Financial Instrument | Fair Value | Valuation Technique | Significant Unobservable Inputs | Ranges of Inputs | Weighted Average (1) | ||||||||||||||||||||||
Loans and Securities (2) | Loans and Securities (2) | Loans and Securities (2) | ||||||||||||||||||||||||||||||||
| Instruments backed by residential real estate assets | Instruments backed by residential real estate assets | $ | 1,403 | Discounted cash flow, Market comparables | Yield | 0% to 25% | 7 | % | Instruments backed by residential real estate assets | $ | 1,359 | Discounted cash flow, Market comparables | Yield | 0% to 25% | 6 | % | ||||||||||||||||||
| Trading account assets – Mortgage trading loans, ABS and other MBS | Trading account assets – Mortgage trading loans, ABS and other MBS | 433 | Prepayment speed | 7% to 35% CPR | 16% CPR | Trading account assets – Mortgage trading loans, ABS and other MBS | 306 | Prepayment speed | 1% to 42% CPR | 19% CPR | ||||||||||||||||||||||||
| Loans and leases | Loans and leases | 426 | Default rate | 0% to 3% CDR | 1% CDR | Loans and leases | 359 | Default rate | 0% to 3% CDR | 1% CDR | ||||||||||||||||||||||||
| AFS debt securities – Non-agency residential | AFS debt securities – Non-agency residential | 284 | Price | $0 to td52 | $96 | AFS debt securities – Non-agency residential | 398 | Price | $0 to td60 | $91 | ||||||||||||||||||||||||
| Other debt securities carried at fair value – Non-agency residential | Other debt securities carried at fair value – Non-agency residential | 260 | Loss severity | 14% to 37% | 15 | % | Other debt securities carried at fair value – Non-agency residential | 296 | Loss severity | 0% to 44% | 14 | % | ||||||||||||||||||||||
| Instruments backed by commercial real estate assets | Instruments backed by commercial real estate assets | $ | 481 | Discounted cash flow | Yield | 0% to 25% | 4 | % | Instruments backed by commercial real estate assets | $ | 458 | Discounted cash flow | Yield | 0% to 25% | 4 | % | ||||||||||||||||||
| Trading account assets – Corporate securities, trading loans and other | Trading account assets – Corporate securities, trading loans and other | 326 | Price | $0 to td01 | $62 | Trading account assets – Corporate securities, trading loans and other | 286 | Price | $0 to td00 | $62 | ||||||||||||||||||||||||
| Trading account assets – Mortgage trading loans, ABS and other MBS | Trading account assets – Mortgage trading loans, ABS and other MBS | 61 | Trading account assets – Mortgage trading loans, ABS and other MBS | 81 | ||||||||||||||||||||||||||||||
| AFS debt securities, primarily other taxable securities | AFS debt securities, primarily other taxable securities | 86 | AFS debt securities, primarily other taxable securities | 83 | ||||||||||||||||||||||||||||||
| Loans held-for-sale | Loans held-for-sale | 8 | Loans held-for-sale | 8 | ||||||||||||||||||||||||||||||
| Commercial loans, debt securities and other | Commercial loans, debt securities and other | $ | 3,268 | Discounted cash flow, Market comparables | Yield | 0% to 25% | 9 | % | Commercial loans, debt securities and other | $ | 3,678 | Discounted cash flow, Market comparables | Yield | 0% to 20% | 10 | % | ||||||||||||||||||
| Trading account assets – Corporate securities, trading loans and other | Trading account assets – Corporate securities, trading loans and other | 1,190 | Prepayment speed | 10% to 20% | 13 | % | Trading account assets – Corporate securities, trading loans and other | 1,348 | Prepayment speed | 10% to 20% | 15 | % | ||||||||||||||||||||||
| Trading account assets – Non-U.S. sovereign debt | Trading account assets – Non-U.S. sovereign debt | 334 | Default rate | 3% to 4% | 4 | % | Trading account assets – Non-U.S. sovereign debt | 399 | Default rate | 3% to 4% | 4 | % | ||||||||||||||||||||||
| Trading account assets – Mortgage trading loans, ABS and other MBS | Trading account assets – Mortgage trading loans, ABS and other MBS | 1,067 | Loss severity | 35% to 40% | 38 | % | Trading account assets – Mortgage trading loans, ABS and other MBS | 1,187 | Loss severity | 35% to 40% | 38 | % | ||||||||||||||||||||||
| AFS debt securities – Tax-exempt securities | AFS debt securities – Tax-exempt securities | 98 | Price | $0 to td70 | $67 | AFS debt securities – Tax-exempt securities | 53 | Price | $0 to td86 | $67 | ||||||||||||||||||||||||
| Loans and leases | Loans and leases | 367 | Long-dated equity volatilities | 50% | n/a | Loans and leases | 359 | Long-dated equity volatilities | 45% | n/a | ||||||||||||||||||||||||
| Loans held-for-sale | Loans held-for-sale | 212 | Loans held-for-sale | 332 | ||||||||||||||||||||||||||||||
| Other assets, primarily auction rate securities | Other assets, primarily auction rate securities | $ | 936 | Discounted cash flow, Market comparables | Price | td0 to $97 | $94 | Other assets, primarily auction rate securities | $ | 804 | Discounted cash flow, Market comparables | Price | td0 to $96 | $92 | ||||||||||||||||||||
| Discount rate | 9 | % | n/a | Discount rate | 9 | % | n/a | |||||||||||||||||||||||||||
| MSRs | MSRs | $ | 1,154 | Discounted cash flow | Weighted-average life, fixed rate (5) | 0 to 14 years | 5 years | MSRs | $ | 940 | Discounted cash flow | Weighted-average life, fixed rate (5) | 0 to 14 years | 4 years | ||||||||||||||||||||
Weighted-average life, variable rate (5) | 0 to 10 years | 3 years | Weighted-average life, variable rate (5) | 0 to 11 years | 3 years | |||||||||||||||||||||||||||||
| Option-adjusted spread, fixed rate | 7% to 14% | 9 | % | Option-adjusted spread, fixed rate | 7% to 14% | 9 | % | |||||||||||||||||||||||||||
| Option-adjusted spread, variable rate | 9% to 15% | 12 | % | Option-adjusted spread, variable rate | 9% to 15% | 12 | % | |||||||||||||||||||||||||||
| Structured liabilities | Structured liabilities | Structured liabilities | ||||||||||||||||||||||||||||||||
| Long-term debt | Long-term debt | $ | (1,028) | Discounted cash flow, Market comparables, Industry standard derivative pricing (3) | Yield | 0% to 13% | 11 | % | Long-term debt | $ | (1,126) | Discounted cash flow, Market comparables, Industry standard derivative pricing (3) | Yield | 0% to 16% | 14 | % | ||||||||||||||||||
| Equity correlation | 2% to 99% | 72 | % | Equity correlation | 3% to 99% | 80 | % | |||||||||||||||||||||||||||
| Long-dated equity volatilities | 4% to 64% | 35 | % | Long-dated equity volatilities | 4% to 67% | 36 | % | |||||||||||||||||||||||||||
| Price | $0 to td20 | $84 | Price | $0 to td21 | $85 | |||||||||||||||||||||||||||||
| Natural gas forward price | td/MMBtu to $5/MMBtu | $3 /MMBtu | Natural gas forward price | td/MMBtu to td2/MMBtu | $4 /MMBtu | |||||||||||||||||||||||||||||
| Net derivative assets (liabilities) | Net derivative assets (liabilities) | Net derivative assets (liabilities) | ||||||||||||||||||||||||||||||||
| Credit derivatives | Credit derivatives | $ | (39) | Discounted cash flow, Stochastic recovery correlation model | Yield | 5% | n/a | Credit derivatives | $ | (109) | Discounted cash flow, Stochastic recovery correlation model | Credit spreads | 1 to 611 bps | 62 bps | ||||||||||||||||||||
| Credit spreads | 0 to 191 bps | 65 bps | ||||||||||||||||||||||||||||||||
| Upfront points | 16 to 100 points | 74 points | Upfront points | 16 to 100 points | 68 points | |||||||||||||||||||||||||||||
| Prepayment speed | 15% to 100% CPR | 17% | Prepayment speed | 15% CPR | n/a | |||||||||||||||||||||||||||||
| Default rate | 2% CDR | n/a | Default rate | 2% CDR | n/a | |||||||||||||||||||||||||||||
| Credit correlation | 20% to 22% | 21 | % | Credit correlation | 24% to 60% | 55 | % | |||||||||||||||||||||||||||
| Price | $0 to td22 | $62 | Discounted cash flow, Stochastic recovery correlation model | Price | $0 to td22 | $66 | ||||||||||||||||||||||||||||
| Equity derivatives | Equity derivatives | $ | (1,924) | Industry standard derivative pricing (3) | Equity correlation | 2% to 99% | 72 | % | Equity derivatives | $ | (1,442) | Equity correlation | 3% to 99% | 80 | % | |||||||||||||||||||
| Long-dated equity volatilities | 4% to 64% | 35 | % | Long-dated equity volatilities | 4% to 67% | 36 | % | |||||||||||||||||||||||||||
| Commodity derivatives | Commodity derivatives | $ | (1,278) | Discounted cash flow, Industry standard derivative pricing (3) | Natural gas forward price | td/MMBtu to $5/MMBtu | $3 /MMBtu | Commodity derivatives | $ | (942) | Natural gas forward price | td/MMBtu to td2/MMBtu | $4 /MMBtu | |||||||||||||||||||||
| Correlation | 39% to 79% | 69 | % | Correlation | 64% to 82% | 75 | % | |||||||||||||||||||||||||||
| Volatilities | 24% to 47% | 32 | % | Power forward price | td2 to $74 | td8 | ||||||||||||||||||||||||||||
| Volatilities | 41% to 113% | 80 | % | |||||||||||||||||||||||||||||||
| Interest rate derivatives | Interest rate derivatives | $ | 35 | Industry standard derivative pricing (4) | Correlation (IR/IR) | 15% to 90% | 44 | % | Interest rate derivatives | $ | 168 | Correlation (IR/IR) | (1)% to 90% | 53 | % | |||||||||||||||||||
| Correlation (FX/IR) | 0% to 46% | 4 | % | Industry standard derivative pricing (4) | Correlation (FX/IR) | 0% to 58% | 44 | % | ||||||||||||||||||||||||||
| Long-dated inflation rates | (3)% to 36% | 7 | % | Long-dated inflation rates | (7)% to 12% | 5 | % | |||||||||||||||||||||||||||
| Long-dated inflation volatilities | 0% to 1% | 1 | % | Long-dated inflation volatilities | 0% to 2% | 2 | % | |||||||||||||||||||||||||||
| Interest rate volatilities | 0% to 2% | 1 | % | Interest rate volatilities | 0% to 3% | 1 | % | |||||||||||||||||||||||||||
| Total net derivative assets (liabilities) | Total net derivative assets (liabilities) | $ | (3,206) | Total net derivative assets (liabilities) | $ | (2,325) | ||||||||||||||||||||||||||||
Bank of America92 | ||||||||
| Quantitative Information about Level 3 Fair Value Measurements at December 31, 2020 | |||||||||||||||||
| (Dollars in millions) | Inputs | ||||||||||||||||
| Financial Instrument | Fair Value | Valuation Technique | Significant Unobservable Inputs | Ranges of Inputs | Weighted Average (1) | ||||||||||||
Loans and Securities (2) | |||||||||||||||||
| Instruments backed by residential real estate assets | $ | 1,543 | Discounted cash flow, Market comparables | Yield | (3)% to 25% | 6 | % | ||||||||||
| Trading account assets – Mortgage trading loans, ABS and other MBS | 467 | Prepayment speed | 1% to 56% CPR | 20% CPR | |||||||||||||
| Loans and leases | 431 | Default rate | 0% to 3% CDR | 1% CDR | |||||||||||||
| AFS debt securities - Non-agency residential | 378 | Price | $0 to $168 | $110 | |||||||||||||
| Other debt securities carried at fair value - Non-agency residential | 267 | Loss severity | 0% to 47% | 18 | % | ||||||||||||
| Instruments backed by commercial real estate assets | $ | 407 | Discounted cash flow | Yield | 0% to 25% | 4 | % | ||||||||||
| Trading account assets – Corporate securities, trading loans and other | 262 | Price | $0 to $100 | $52 | |||||||||||||
| Trading account assets – Mortgage trading loans, ABS and other MBS | 43 | ||||||||||||||||
| AFS debt securities, primarily other taxable securities | 89 | ||||||||||||||||
| Loans held-for-sale | 13 | ||||||||||||||||
| Commercial loans, debt securities and other | $ | 3,066 | Discounted cash flow, Market comparables | Yield | 0% to 26% | 9 | % | ||||||||||
| Trading account assets – Corporate securities, trading loans and other | 1,097 | Prepayment speed | 10% to 20% | 14 | % | ||||||||||||
| Trading account assets – Non-U.S. sovereign debt | 354 | Default rate | 3% to 4% | 4 | % | ||||||||||||
| Trading account assets – Mortgage trading loans, ABS and other MBS | 930 | Loss severity | 35% to 40% | 38 | % | ||||||||||||
| AFS debt securities – Tax-exempt securities | 176 | Price | $0 to $142 | $66 | |||||||||||||
| Loans and leases | 286 | Long-dated equity volatilities | 77% | n/a | |||||||||||||
| Loans held-for-sale | 223 | ||||||||||||||||
| Other assets, primarily auction rate securities | $ | 937 | Discounted cash flow, Market comparables | Price | $10 to $97 | $91 | |||||||||||
| Discount rate | 8% | n/a | |||||||||||||||
| MSRs | $ | 1,033 | Discounted cash flow | Weighted-average life, fixed rate (5) | 0 to 13 years | 4 years | |||||||||||
Weighted-average life, variable rate (5) | 0 to 10 years | 3 years | |||||||||||||||
| Option-adjusted spread, fixed rate | 7% to 14% | 9 | % | ||||||||||||||
| Option-adjusted spread, variable rate | 9% to 15% | 12 | % | ||||||||||||||
| Structured liabilities | |||||||||||||||||
| Long-term debt | $ | (1,164) | Discounted cash flow, Market comparables, Industry standard derivative pricing (3) | Yield | 0% to 11% | 9 | % | ||||||||||
| Equity correlation | 2% to 100% | 64 | % | ||||||||||||||
| Long-dated equity volatilities | 7% to 64% | 32 | % | ||||||||||||||
| Price | $0 to $124 | $86 | |||||||||||||||
| Natural gas forward price | $1/MMBtu to $4/MMBtu | $3/MMBtu | |||||||||||||||
| Net derivative assets (liabilities) | |||||||||||||||||
| Credit derivatives | $ | (112) | Discounted cash flow, Stochastic recovery correlation model | Yield | 5% | n/a | |||||||||||
| Upfront points | 0 to 100 points | 75 points | |||||||||||||||
| Prepayment speed | 15% to 100% CPR | 22% CPR | |||||||||||||||
| Default rate | 2% CDR | n/a | |||||||||||||||
| Credit correlation | 21% to 64% | 57 | % | ||||||||||||||
| Price | $0 to $122 | $69 | |||||||||||||||
| Equity derivatives | $ | (1,904) | Industry standard derivative pricing (3) | Equity correlation | 2% to 100% | 64 | % | ||||||||||
| Long-dated equity volatilities | 7% to 64% | 32 | % | ||||||||||||||
| Commodity derivatives | $ | (1,426) | Discounted cash flow, Industry standard derivative pricing (3) | Natural gas forward price | $1/MMBtu to $4/MMBtu | $3/MMBtu | |||||||||||
| Correlation | 39% to 85% | 73 | % | ||||||||||||||
| Volatilities | 23% to 70% | 39 | % | ||||||||||||||
| Interest rate derivatives | $ | (26) | Industry standard derivative pricing (4) | Correlation (IR/IR) | 15% to 96% | 34 | % | ||||||||||
| Correlation (FX/IR) | 0% to 46% | 3 | % | ||||||||||||||
| Long-dated inflation rates | G(7)% to 84% | 14 | % | ||||||||||||||
| Long-dated inflation volatilities | 0% to 1% | 1 | % | ||||||||||||||
| Interest rates volatilities | 0% to 2% | 1 | % | ||||||||||||||
| Total net derivative assets (liabilities) | $ | (3,468) | |||||||||||||||
93Bank of America | ||||||||||||||
| Assets Measured at Fair Value on a Nonrecurring Basis | ||||||||||||||||||||||||||||||||||||||||||||||||||||||||||||||||
| March 31, 2021 | Three Months Ended March 31, 2021 | September 30, 2021 | Three Months Ended September 30, 2021 | Nine Months Ended September 30, 2021 | ||||||||||||||||||||||||||||||||||||||||||||||||||||||||||||
| (Dollars in millions) | (Dollars in millions) | Level 2 | Level 3 | Gains (Losses) | (Dollars in millions) | Level 2 | Level 3 | Gains (Losses) | ||||||||||||||||||||||||||||||||||||||||||||||||||||||||
| Assets | Assets | Assets | ||||||||||||||||||||||||||||||||||||||||||||||||||||||||||||||
| Loans held-for-sale | Loans held-for-sale | $ | 2,116 | $ | 66 | $ | 5 | Loans held-for-sale | $ | 124 | $ | 20 | $ | (2) | $ | 4 | ||||||||||||||||||||||||||||||||||||||||||||||||
Loans and leases (1) | Loans and leases (1) | 0 | 85 | (14) | Loans and leases (1) | — | 182 | (16) | (47) | |||||||||||||||||||||||||||||||||||||||||||||||||||||||
Foreclosed properties (2, 3) | Foreclosed properties (2, 3) | 0 | 3 | (1) | Foreclosed properties (2, 3) | — | 17 | (3) | (4) | |||||||||||||||||||||||||||||||||||||||||||||||||||||||
| Other assets | Other assets | 49 | 2,155 | (403) | Other assets | 354 | 2,101 | (35) | (494) | |||||||||||||||||||||||||||||||||||||||||||||||||||||||
| March 31, 2020 | Three Months Ended March 31, 2020 | September 30, 2020 | Three Months Ended September 30, 2020 | Nine Months Ended September 30, 2020 | ||||||||||||||||||||||||||||||||||||||||||||||||||||||||||||
| Assets | Assets | Assets | ||||||||||||||||||||||||||||||||||||||||||||||||||||||||||||||
| Loans held-for-sale | Loans held-for-sale | $ | 1,017 | $ | 628 | $ | (78) | Loans held-for-sale | $ | 630 | $ | 903 | $ | (14) | $ | (121) | ||||||||||||||||||||||||||||||||||||||||||||||||
Loans and leases (1) | Loans and leases (1) | 0 | 117 | (27) | Loans and leases (1) | — | 226 | (19) | (59) | |||||||||||||||||||||||||||||||||||||||||||||||||||||||
Foreclosed properties (2, 3) | Foreclosed properties (2, 3) | 0 | 15 | (6) | Foreclosed properties (2, 3) | — | 27 | (7) | (11) | |||||||||||||||||||||||||||||||||||||||||||||||||||||||
| Other assets | Other assets | 27 | 24 | (2) | Other assets | 209 | 576 | (32) | (58) | |||||||||||||||||||||||||||||||||||||||||||||||||||||||
| Quantitative Information about Nonrecurring Level 3 Fair Value Measurements | ||||||||||||||||||||||||||||||||||
| Inputs | Inputs | |||||||||||||||||||||||||||||||||
| Financial Instrument | Financial Instrument | Fair Value | Valuation Technique | Significant Unobservable Inputs | Ranges of Inputs | Weighted Average (1) | Financial Instrument | Fair Value | Valuation Technique | Significant Unobservable Inputs | Ranges of Inputs | Weighted Average (1) | ||||||||||||||||||||||
| (Dollars in millions) | (Dollars in millions) | Three Months Ended March 31, 2021 | (Dollars in millions) | Nine Months Ended September 30, 2021 | ||||||||||||||||||||||||||||||
| Loans held-for-sale | $ | 66 | Discounted cash flow | Price | $73 to $99 | $84 | ||||||||||||||||||||||||||||
Loans and leases (2) | Loans and leases (2) | 85 | Market comparables | OREO discount | 13% to 59% | 24 | % | Loans and leases (2) | $ | 182 | Market comparables | OREO discount | 13% to 59% | 24 | % | |||||||||||||||||||
| Costs to sell | 8% to 26% | 9 | % | Costs to sell | 8% to 26% | 9 | % | |||||||||||||||||||||||||||
Other assets (3) | Other assets (3) | 1,955 | Discounted cash flow | Discount rate | 7 | % | n/a | Other assets (3) | 1,926 | Discounted cash flow | Discount rate | 7 | % | n/a | ||||||||||||||||||||
| 194 | Market comparables | Estimated appraisal value | n/a | 170 | Market comparables | Estimated appraisal value | n/a | |||||||||||||||||||||||||||
| Year Ended December 31, 2020 | Year Ended December 31, 2020 | |||||||||||||||||||||||||||||||||
| Loans held-for-sale | Loans held-for-sale | $ | 792 | Discounted cash flow | Price | $8 to $99 | $95 | Loans held-for-sale | $ | 792 | Discounted cash flow | Price | $8 to $99 | $95 | ||||||||||||||||||||
Loans and leases (2) | Loans and leases (2) | 301 | Market comparables | OREO discount | 13% to 59% | 24 | % | Loans and leases (2) | 301 | Market comparables | OREO discount | 13% to 59% | 24 | % | ||||||||||||||||||||
| Costs to sell | 8% to 26% | 9 | % | Costs to sell | 8% to 26% | 9 | % | |||||||||||||||||||||||||||
Other assets (4) | Other assets (4) | 576 | Discounted cash flow | Revenue attrition | 2% to 19% | 7 | % | Other assets (4) | 576 | Discounted cash flow | Revenue attrition | 2% to 19% | 7 | % | ||||||||||||||||||||
| Discount rate | 11% to 14% | 12 | % | Discount rate | 11% to 14% | 12 | % | |||||||||||||||||||||||||||
Bank of America94 | ||||||||
| Fair Value Option Elections | ||||||||||||||||||||||||||||||||||||||||||||||||||||||||||||||||||||||
| March 31, 2021 | December 31, 2020 | September 30, 2021 | December 31, 2020 | |||||||||||||||||||||||||||||||||||||||||||||||||||||||||||||||||||
| (Dollars in millions) | (Dollars in millions) | Fair Value Carrying Amount | Contractual Principal Outstanding | Fair Value Carrying Amount Less Unpaid Principal | Fair Value Carrying Amount | Contractual Principal Outstanding | Fair Value Carrying Amount Less Unpaid Principal | (Dollars in millions) | Fair Value Carrying Amount | Contractual Principal Outstanding | Fair Value Carrying Amount Less Unpaid Principal | Fair Value Carrying Amount | Contractual Principal Outstanding | Fair Value Carrying Amount Less Unpaid Principal | ||||||||||||||||||||||||||||||||||||||||||||||||||||||||
| Federal funds sold and securities borrowed or purchased under agreements to resell | Federal funds sold and securities borrowed or purchased under agreements to resell | $ | 153,387 | $ | 153,358 | $ | 29 | $ | 108,856 | $ | 108,811 | $ | 45 | Federal funds sold and securities borrowed or purchased under agreements to resell | $ | 154,137 | $ | 154,135 | $ | 2 | $ | 108,856 | $ | 108,811 | $ | 45 | ||||||||||||||||||||||||||||||||||||||||||||
Loans reported as trading account assets (1) | Loans reported as trading account assets (1) | 8,213 | 16,630 | (8,417) | 7,967 | 17,372 | (9,405) | Loans reported as trading account assets (1) | 9,410 | 17,534 | (8,124) | 7,967 | 17,372 | (9,405) | ||||||||||||||||||||||||||||||||||||||||||||||||||||||||
| Trading inventory – other | Trading inventory – other | 21,710 | n/a | n/a | 22,790 | n/a | n/a | Trading inventory – other | 22,962 | n/a | n/a | 22,790 | n/a | n/a | ||||||||||||||||||||||||||||||||||||||||||||||||||||||||
| Consumer and commercial loans | Consumer and commercial loans | 7,003 | 7,059 | (56) | 6,681 | 6,778 | (97) | Consumer and commercial loans | 7,566 | 7,628 | (62) | 6,681 | 6,778 | (97) | ||||||||||||||||||||||||||||||||||||||||||||||||||||||||
Loans held-for-sale (1) | Loans held-for-sale (1) | 1,680 | 2,571 | (891) | 1,585 | 2,521 | (936) | Loans held-for-sale (1) | 3,982 | 4,884 | (902) | 1,585 | 2,521 | (936) | ||||||||||||||||||||||||||||||||||||||||||||||||||||||||
| Other assets | Other assets | 172 | n/a | n/a | 200 | n/a | n/a | Other assets | 194 | n/a | n/a | 200 | n/a | n/a | ||||||||||||||||||||||||||||||||||||||||||||||||||||||||
| Long-term deposits | Long-term deposits | 504 | 488 | 16 | 481 | 448 | 33 | Long-term deposits | 542 | 530 | 12 | 481 | 448 | 33 | ||||||||||||||||||||||||||||||||||||||||||||||||||||||||
| Federal funds purchased and securities loaned or sold under agreements to repurchase | Federal funds purchased and securities loaned or sold under agreements to repurchase | 154,865 | 154,873 | (8) | 135,391 | 135,390 | 1 | Federal funds purchased and securities loaned or sold under agreements to repurchase | 155,151 | 155,187 | (36) | 135,391 | 135,390 | 1 | ||||||||||||||||||||||||||||||||||||||||||||||||||||||||
| Short-term borrowings | Short-term borrowings | 4,503 | 4,286 | 217 | 5,874 | 5,178 | 696 | Short-term borrowings | 4,128 | 4,341 | (213) | 5,874 | 5,178 | 696 | ||||||||||||||||||||||||||||||||||||||||||||||||||||||||
| Unfunded loan commitments | Unfunded loan commitments | 91 | n/a | n/a | 99 | n/a | n/a | Unfunded loan commitments | 95 | n/a | n/a | 99 | n/a | n/a | ||||||||||||||||||||||||||||||||||||||||||||||||||||||||
| Long-term debt | Long-term debt | 30,514 | 31,683 | (1,169) | 32,200 | 33,470 | (1,270) | Long-term debt | 28,696 | 29,783 | (1,087) | 32,200 | 33,470 | (1,270) | ||||||||||||||||||||||||||||||||||||||||||||||||||||||||
| Gains (Losses) Relating to Assets and Liabilities Accounted for Under the Fair Value Option | ||||||||||||||||||||||||||||||||||||||||||||||||||||||||||||||||||||||
| Gains (Losses) Related to Assets and Liabilities Accounted for Under the Fair Value Option | Gains (Losses) Related to Assets and Liabilities Accounted for Under the Fair Value Option | |||||||||||||||||||||||||||||||||||||||||||||||||||||||||||||||||||||
| Three Months Ended March 31 | Three Months Ended September 30 | |||||||||||||||||||||||||||||||||||||||||||||||||||||||||||||||||||||
| 2021 | 2020 | 2021 | 2020 | |||||||||||||||||||||||||||||||||||||||||||||||||||||||||||||||||||
| (Dollars in millions) | (Dollars in millions) | Market making and similar activities | Other Income | Total | Market making and similar activities | Other Income | Total | (Dollars in millions) | Market making and similar activities | Other Income | Total | Market making and similar activities | Other Income | Total | ||||||||||||||||||||||||||||||||||||||||||||||||||||||||
| Loans reported as trading account assets | Loans reported as trading account assets | $ | 112 | $ | 0 | $ | 112 | $ | (387) | $ | 0 | $ | (387) | Loans reported as trading account assets | $ | 5 | $ | — | $ | 5 | $ | 58 | $ | — | $ | 58 | ||||||||||||||||||||||||||||||||||||||||||||
Trading inventory – other (1) | Trading inventory – other (1) | (730) | 0 | (730) | (2,793) | 0 | (2,793) | Trading inventory – other (1) | (1,155) | — | (1,155) | 709 | — | 709 | ||||||||||||||||||||||||||||||||||||||||||||||||||||||||
| Consumer and commercial loans | Consumer and commercial loans | 71 | 19 | 90 | (83) | (358) | (441) | Consumer and commercial loans | (56) | (11) | (67) | (2) | 102 | 100 | ||||||||||||||||||||||||||||||||||||||||||||||||||||||||
Loans held-for-sale (2) | Loans held-for-sale (2) | — | 53 | 53 | — | 22 | 22 | |||||||||||||||||||||||||||||||||||||||||||||||||||||||||||||||
| Short-term borrowings | Short-term borrowings | 413 | 0 | 413 | 517 | 0 | 517 | Short-term borrowings | 548 | — | 548 | (38) | — | (38) | ||||||||||||||||||||||||||||||||||||||||||||||||||||||||
| Unfunded loan commitments | Unfunded loan commitments | 0 | 5 | 5 | 0 | (116) | (116) | Unfunded loan commitments | — | 8 | 8 | — | (18) | (18) | ||||||||||||||||||||||||||||||||||||||||||||||||||||||||
Long-term debt (2) | 386 | (16) | 370 | 916 | (16) | 900 | ||||||||||||||||||||||||||||||||||||||||||||||||||||||||||||||||
Other (3) | 12 | 10 | 22 | 13 | (51) | (38) | ||||||||||||||||||||||||||||||||||||||||||||||||||||||||||||||||
Long-term debt (3) | Long-term debt (3) | 225 | (9) | 216 | (347) | (6) | (353) | |||||||||||||||||||||||||||||||||||||||||||||||||||||||||||||||
Other (4) | Other (4) | 7 | — | 7 | 19 | 7 | 26 | |||||||||||||||||||||||||||||||||||||||||||||||||||||||||||||||
| Total | Total | $ | (426) | $ | 41 | $ | (385) | $ | 399 | $ | 107 | $ | 506 | |||||||||||||||||||||||||||||||||||||||||||||||||||||||||
| Nine Months Ended September 30 | ||||||||||||||||||||||||||||||||||||||||||||||||||||||||||||||||||||||
| 2021 | 2020 | |||||||||||||||||||||||||||||||||||||||||||||||||||||||||||||||||||||
| Loans reported as trading account assets | Loans reported as trading account assets | $ | 288 | $ | — | $ | 288 | $ | (15) | $ | — | $ | (15) | |||||||||||||||||||||||||||||||||||||||||||||||||||||||||
Trading inventory – other (1) | Trading inventory – other (1) | 419 | — | 419 | 1,259 | — | 1,259 | |||||||||||||||||||||||||||||||||||||||||||||||||||||||||||||||
| Consumer and commercial loans | Consumer and commercial loans | 58 | 34 | 92 | (49) | (85) | (134) | |||||||||||||||||||||||||||||||||||||||||||||||||||||||||||||||
Loans held-for-sale (2) | Loans held-for-sale (2) | — | 64 | 64 | — | 67 | 67 | |||||||||||||||||||||||||||||||||||||||||||||||||||||||||||||||
| Short-term borrowings | Short-term borrowings | 1,022 | — | 1,022 | 196 | — | 196 | |||||||||||||||||||||||||||||||||||||||||||||||||||||||||||||||
| Unfunded loan commitments | Unfunded loan commitments | — | 2 | 2 | — | (88) | (88) | |||||||||||||||||||||||||||||||||||||||||||||||||||||||||||||||
Long-term debt (3) | Long-term debt (3) | (436) | (33) | (469) | (1,300) | (31) | (1,331) | |||||||||||||||||||||||||||||||||||||||||||||||||||||||||||||||
Other (4) | Other (4) | 18 | (24) | (6) | 28 | (31) | (3) | |||||||||||||||||||||||||||||||||||||||||||||||||||||||||||||||
| Total | Total | $ | 264 | $ | 18 | $ | 282 | $ | (1,817) | $ | (541) | $ | (2,358) | Total | $ | 1,369 | $ | 43 | $ | 1,412 | $ | 119 | $ | (168) | $ | (49) | ||||||||||||||||||||||||||||||||||||||||||||
| Gains (Losses) Related to Borrower-specific Credit Risk for Assets and Liabilities Accounted for Under the Fair Value Option | ||||||||||||||||||||||||||||||||||||||||||||||||||||||||||
| Three Months Ended March 31 | Three Months Ended September 30 | Nine Months Ended September 30 | ||||||||||||||||||||||||||||||||||||||||||||||||||||||||
| (Dollars in millions) | (Dollars in millions) | 2021 | 2020 | (Dollars in millions) | 2021 | 2020 | 2021 | 2020 | ||||||||||||||||||||||||||||||||||||||||||||||||||
| Loans reported as trading account assets | Loans reported as trading account assets | $ | 66 | $ | (389) | Loans reported as trading account assets | $ | (21) | $ | 11 | $ | 166 | $ | (225) | ||||||||||||||||||||||||||||||||||||||||||||
| Consumer and commercial loans | Consumer and commercial loans | 13 | (349) | Consumer and commercial loans | (22) | 100 | 10 | (96) | ||||||||||||||||||||||||||||||||||||||||||||||||||
| Loans held-for-sale | Loans held-for-sale | (6) | (74) | Loans held-for-sale | 37 | (24) | 35 | (117) | ||||||||||||||||||||||||||||||||||||||||||||||||||
| Unfunded loan commitments | Unfunded loan commitments | 5 | (116) | Unfunded loan commitments | 8 | (18) | 2 | (88) | ||||||||||||||||||||||||||||||||||||||||||||||||||
95Bank of America | ||||||||
| Fair Value of Financial Instruments | ||||||||||||||||||||||||||||||||||||||||||||||
| Fair Value | Fair Value | |||||||||||||||||||||||||||||||||||||||||||||
| Carrying Value | Level 2 | Level 3 | Total | Carrying Value | Level 2 | Level 3 | Total | |||||||||||||||||||||||||||||||||||||||
| (Dollars in millions) | (Dollars in millions) | March 31, 2021 | (Dollars in millions) | September 30, 2021 | ||||||||||||||||||||||||||||||||||||||||||
| Financial assets | Financial assets | Financial assets | ||||||||||||||||||||||||||||||||||||||||||||
| Loans | Loans | $ | 865,652 | $ | 48,960 | $ | 862,801 | $ | 911,761 | Loans | $ | 894,158 | $ | 52,330 | $ | 880,083 | $ | 932,413 | ||||||||||||||||||||||||||||
| Loans held-for-sale | Loans held-for-sale | 7,895 | 7,173 | 722 | 7,895 | Loans held-for-sale | 9,415 | 8,601 | 823 | 9,424 | ||||||||||||||||||||||||||||||||||||
| Financial liabilities | Financial liabilities | Financial liabilities | ||||||||||||||||||||||||||||||||||||||||||||
Deposits (1) | Deposits (1) | 1,884,938 | 1,884,934 | 0 | 1,884,934 | Deposits (1) | 1,964,804 | 1,964,794 | — | 1,964,794 | ||||||||||||||||||||||||||||||||||||
| Long-term debt | Long-term debt | 251,211 | 258,936 | 1,028 | 259,964 | Long-term debt | 278,621 | 286,414 | 1,293 | 287,707 | ||||||||||||||||||||||||||||||||||||
Commercial unfunded lending commitments (2) | Commercial unfunded lending commitments (2) | 1,920 | 91 | 5,234 | 5,325 | Commercial unfunded lending commitments (2) | 1,633 | 95 | 6,542 | 6,637 | ||||||||||||||||||||||||||||||||||||
| December 31, 2020 | December 31, 2020 | |||||||||||||||||||||||||||||||||||||||||||||
| Financial assets | Financial assets | Financial assets | ||||||||||||||||||||||||||||||||||||||||||||
| Loans | Loans | $ | 887,289 | $ | 49,372 | $ | 877,682 | $ | 927,054 | Loans | $ | 887,289 | $ | 49,372 | $ | 877,682 | $ | 927,054 | ||||||||||||||||||||||||||||
| Loans held-for-sale | Loans held-for-sale | 9,243 | 7,864 | 1,379 | 9,243 | Loans held-for-sale | 9,243 | 7,864 | 1,379 | 9,243 | ||||||||||||||||||||||||||||||||||||
| Financial liabilities | Financial liabilities | Financial liabilities | ||||||||||||||||||||||||||||||||||||||||||||
Deposits (1) | Deposits (1) | 1,795,480 | 1,795,545 | 0 | 1,795,545 | Deposits (1) | 1,795,480 | 1,795,545 | — | 1,795,545 | ||||||||||||||||||||||||||||||||||||
| Long-term debt | Long-term debt | 262,934 | 271,315 | 1,164 | 272,479 | Long-term debt | 262,934 | 271,315 | 1,164 | 272,479 | ||||||||||||||||||||||||||||||||||||
Commercial unfunded lending commitments (2) | Commercial unfunded lending commitments (2) | 1,977 | 99 | 5,159 | 5,258 | Commercial unfunded lending commitments (2) | 1,977 | 99 | 5,159 | 5,258 | ||||||||||||||||||||||||||||||||||||
Bank of America96 | ||||||||
| Results of Business Segments and All Other | |||||||||||||||||||||||||||||||||||||||||||||||||||||||||||
| At and for the three months ended September 30 | Total Corporation (1) | Consumer Banking | Global Wealth & Investment Management | ||||||||||||||||||||||||||||||||||||||||||||||||||||||||
| (Dollars in millions) | 2021 | 2020 | 2021 | 2020 | 2021 | 2020 | |||||||||||||||||||||||||||||||||||||||||||||||||||||
| Net interest income | $ | 11,195 | $ | 10,243 | $ | 6,493 | $ | 5,890 | $ | 1,451 | $ | 1,237 | |||||||||||||||||||||||||||||||||||||||||||||||
| Noninterest income | 11,672 | 10,207 | 2,345 | 2,149 | 3,859 | 3,309 | |||||||||||||||||||||||||||||||||||||||||||||||||||||
| Total revenue, net of interest expense | 22,867 | 20,450 | 8,838 | 8,039 | 5,310 | 4,546 | |||||||||||||||||||||||||||||||||||||||||||||||||||||
| Provision for credit losses | (624) | 1,389 | 247 | 479 | (58) | 24 | |||||||||||||||||||||||||||||||||||||||||||||||||||||
| Noninterest expense | 14,440 | 14,401 | 4,558 | 4,842 | 3,745 | 3,533 | |||||||||||||||||||||||||||||||||||||||||||||||||||||
| Income before income taxes | 9,051 | 4,660 | 4,033 | 2,718 | 1,623 | 989 | |||||||||||||||||||||||||||||||||||||||||||||||||||||
| Income tax expense | 1,360 | (221) | 988 | 666 | 398 | 242 | |||||||||||||||||||||||||||||||||||||||||||||||||||||
| Net income | $ | 7,691 | $ | 4,881 | $ | 3,045 | $ | 2,052 | $ | 1,225 | $ | 747 | |||||||||||||||||||||||||||||||||||||||||||||||
| Period-end total assets | $ | 3,085,446 | $ | 2,738,452 | $ | 1,091,431 | $ | 947,513 | $ | 393,708 | $ | 337,576 | |||||||||||||||||||||||||||||||||||||||||||||||
| Global Banking | Global Markets | All Other | |||||||||||||||||||||||||||||||||||||||||||||||||||||||||
| 2021 | 2020 | 2021 | 2020 | 2021 | 2020 | ||||||||||||||||||||||||||||||||||||||||||||||||||||||
| Net interest income | $ | 2,186 | $ | 2,028 | $ | 1,000 | $ | 1,108 | $ | 65 | $ | (20) | |||||||||||||||||||||||||||||||||||||||||||||||
| Noninterest income | 3,058 | 2,489 | 3,519 | 3,175 | (1,109) | (915) | |||||||||||||||||||||||||||||||||||||||||||||||||||||
| Total revenue, net of interest expense | 5,244 | 4,517 | 4,519 | 4,283 | (1,044) | (935) | |||||||||||||||||||||||||||||||||||||||||||||||||||||
| Provision for credit losses | (781) | 883 | 16 | 21 | (48) | (18) | |||||||||||||||||||||||||||||||||||||||||||||||||||||
| Noninterest expense | 2,534 | 2,365 | 3,252 | 3,102 | 351 | 559 | |||||||||||||||||||||||||||||||||||||||||||||||||||||
| Income before income taxes | 3,491 | 1,269 | 1,251 | 1,160 | (1,347) | (1,476) | |||||||||||||||||||||||||||||||||||||||||||||||||||||
| Income tax expense | 942 | 343 | 325 | 302 | (1,293) | (1,774) | |||||||||||||||||||||||||||||||||||||||||||||||||||||
| Net income | $ | 2,549 | $ | 926 | $ | 926 | $ | 858 | $ | (54) | $ | 298 | |||||||||||||||||||||||||||||||||||||||||||||||
| Period-end total assets | $ | 623,640 | $ | 553,776 | $ | 776,929 | $ | 676,242 | $ | 199,738 | $ | 223,345 | |||||||||||||||||||||||||||||||||||||||||||||||
| Results of Business Segments and All Other | |||||||||||||||||||||||||||||||||||||||||||||||||||||||||||
| At and for the nine months ended September 30 | Total Corporation (1) | Consumer Banking | Global Wealth & Investment Management | ||||||||||||||||||||||||||||||||||||||||||||||||||||||||
| (Dollars in millions) | 2021 | 2020 | 2021 | 2020 | 2021 | 2020 | |||||||||||||||||||||||||||||||||||||||||||||||||||||
| Net interest income | $ | 31,846 | $ | 33,493 | $ | 18,386 | $ | 18,743 | $ | 4,137 | $ | 4,186 | |||||||||||||||||||||||||||||||||||||||||||||||
| Noninterest income | 35,529 | 32,322 | 6,707 | 6,277 | 11,209 | 9,721 | |||||||||||||||||||||||||||||||||||||||||||||||||||||
| Total revenue, net of interest expense | 67,375 | 65,815 | 25,093 | 25,020 | 15,346 | 13,907 | |||||||||||||||||||||||||||||||||||||||||||||||||||||
| Provision for credit losses | (4,105) | 11,267 | (1,067) | 5,761 | (185) | 349 | |||||||||||||||||||||||||||||||||||||||||||||||||||||
| Noninterest expense | 45,000 | 41,286 | 14,548 | 14,074 | 11,425 | 10,596 | |||||||||||||||||||||||||||||||||||||||||||||||||||||
| Income before income taxes | 26,480 | 13,262 | 11,612 | 5,185 | 4,106 | 2,962 | |||||||||||||||||||||||||||||||||||||||||||||||||||||
| Income tax expense | 1,515 | 838 | 2,845 | 1,270 | 1,006 | 726 | |||||||||||||||||||||||||||||||||||||||||||||||||||||
| Net income | $ | 24,965 | $ | 12,424 | $ | 8,767 | $ | 3,915 | $ | 3,100 | $ | 2,236 | |||||||||||||||||||||||||||||||||||||||||||||||
| Period-end total assets | $ | 3,085,446 | $ | 2,738,452 | $ | 1,091,431 | $ | 947,513 | $ | 393,708 | $ | 337,576 | |||||||||||||||||||||||||||||||||||||||||||||||
| Global Banking | Global Markets | All Other | |||||||||||||||||||||||||||||||||||||||||||||||||||||||||
| 2021 | 2020 | 2021 | 2020 | 2021 | 2020 | ||||||||||||||||||||||||||||||||||||||||||||||||||||||
| Net interest income | $ | 6,150 | $ | 7,003 | $ | 2,980 | $ | 3,558 | $ | 193 | $ | 3 | |||||||||||||||||||||||||||||||||||||||||||||||
| Noninterest income | 8,817 | 7,205 | 12,457 | 11,301 | (3,661) | (2,182) | |||||||||||||||||||||||||||||||||||||||||||||||||||||
| Total revenue, net of interest expense | 14,967 | 14,208 | 15,437 | 14,859 | (3,468) | (2,179) | |||||||||||||||||||||||||||||||||||||||||||||||||||||
| Provision for credit losses | (2,738) | 4,849 | 33 | 233 | (148) | 75 | |||||||||||||||||||||||||||||||||||||||||||||||||||||
| Noninterest expense | 7,915 | 6,910 | 10,150 | 8,598 | 962 | 1,108 | |||||||||||||||||||||||||||||||||||||||||||||||||||||
| Income before income taxes | 9,790 | 2,449 | 5,254 | 6,028 | (4,282) | (3,362) | |||||||||||||||||||||||||||||||||||||||||||||||||||||
| Income tax expense | 2,643 | 661 | 1,366 | 1,567 | (6,345) | (3,386) | |||||||||||||||||||||||||||||||||||||||||||||||||||||
| Net income | $ | 7,147 | $ | 1,788 | $ | 3,888 | $ | 4,461 | $ | 2,063 | $ | 24 | |||||||||||||||||||||||||||||||||||||||||||||||
| Period-end total assets | $ | 623,640 | $ | 553,776 | $ | 776,929 | $ | 676,242 | $ | 199,738 | $ | 223,345 | |||||||||||||||||||||||||||||||||||||||||||||||
97Bank of America | ||||||||
| Noninterest Income by Business Segment and All Other | |||||||||||||||||||||||||||||||||||||||||||||||||||||
| Total Corporation | Consumer Banking | Global Wealth & Investment Management | |||||||||||||||||||||||||||||||||||||||||||||||||||
| Three Months Ended September 30 | |||||||||||||||||||||||||||||||||||||||||||||||||||||
| (Dollars in millions) | 2021 | 2020 | 2021 | 2020 | 2021 | 2020 | |||||||||||||||||||||||||||||||||||||||||||||||
| Fees and commissions: | |||||||||||||||||||||||||||||||||||||||||||||||||||||
| Card income | |||||||||||||||||||||||||||||||||||||||||||||||||||||
| Interchange fees | $ | 1,154 | $ | 1,172 | $ | 905 | $ | 840 | $ | 11 | $ | 10 | |||||||||||||||||||||||||||||||||||||||||
| Other card income | 429 | 396 | 412 | 380 | 11 | 11 | |||||||||||||||||||||||||||||||||||||||||||||||
| Total card income | 1,583 | 1,568 | 1,317 | 1,220 | 22 | 21 | |||||||||||||||||||||||||||||||||||||||||||||||
| Service charges | |||||||||||||||||||||||||||||||||||||||||||||||||||||
| Deposit-related fees | 1,619 | 1,515 | 935 | 837 | 18 | 17 | |||||||||||||||||||||||||||||||||||||||||||||||
| Lending-related fees | 309 | 302 | — | — | — | — | |||||||||||||||||||||||||||||||||||||||||||||||
| Total service charges | 1,928 | 1,817 | 935 | 837 | 18 | 17 | |||||||||||||||||||||||||||||||||||||||||||||||
| Investment and brokerage services | |||||||||||||||||||||||||||||||||||||||||||||||||||||
| Asset management fees | 3,276 | 2,740 | 49 | 36 | 3,228 | 2,706 | |||||||||||||||||||||||||||||||||||||||||||||||
| Brokerage fees | 960 | 883 | 32 | 32 | 455 | 399 | |||||||||||||||||||||||||||||||||||||||||||||||
| Total investment and brokerage services | 4,236 | 3,623 | 81 | 68 | 3,683 | 3,105 | |||||||||||||||||||||||||||||||||||||||||||||||
| Investment banking fees | |||||||||||||||||||||||||||||||||||||||||||||||||||||
| Underwriting income | 1,168 | 1,239 | — | — | 82 | 93 | |||||||||||||||||||||||||||||||||||||||||||||||
| Syndication fees | 346 | 133 | — | — | — | — | |||||||||||||||||||||||||||||||||||||||||||||||
| Financial advisory services | 654 | 397 | — | — | — | — | |||||||||||||||||||||||||||||||||||||||||||||||
| Total investment banking fees | 2,168 | 1,769 | — | — | 82 | 93 | |||||||||||||||||||||||||||||||||||||||||||||||
| Total fees and commissions | 9,915 | 8,777 | 2,333 | 2,125 | 3,805 | 3,236 | |||||||||||||||||||||||||||||||||||||||||||||||
| Market making and similar activities | 2,005 | 1,689 | 1 | — | 9 | 14 | |||||||||||||||||||||||||||||||||||||||||||||||
| Other income (loss) | (248) | (259) | 11 | 24 | 45 | 59 | |||||||||||||||||||||||||||||||||||||||||||||||
| Total noninterest income | $ | 11,672 | $ | 10,207 | $ | 2,345 | $ | 2,149 | $ | 3,859 | $ | 3,309 | |||||||||||||||||||||||||||||||||||||||||
| Global Banking | Global Markets | All Other (1) | |||||||||||||||||||||||||||||||||||||||||||||||||||
| Three Months Ended September 30 | |||||||||||||||||||||||||||||||||||||||||||||||||||||
| 2021 | 2020 | 2021 | 2020 | 2021 | 2020 | ||||||||||||||||||||||||||||||||||||||||||||||||
| Fees and commissions: | |||||||||||||||||||||||||||||||||||||||||||||||||||||
| Card income | |||||||||||||||||||||||||||||||||||||||||||||||||||||
| Interchange fees | $ | 180 | $ | 153 | $ | 59 | $ | 170 | $ | (1) | $ | (1) | |||||||||||||||||||||||||||||||||||||||||
| Other card income | 5 | 3 | — | — | 1 | 2 | |||||||||||||||||||||||||||||||||||||||||||||||
| Total card income | 185 | 156 | 59 | 170 | — | 1 | |||||||||||||||||||||||||||||||||||||||||||||||
| Service charges | |||||||||||||||||||||||||||||||||||||||||||||||||||||
| Deposit-related fees | 633 | 597 | 30 | 54 | 3 | 10 | |||||||||||||||||||||||||||||||||||||||||||||||
| Lending-related fees | 257 | 249 | 53 | 54 | (1) | (1) | |||||||||||||||||||||||||||||||||||||||||||||||
| Total service charges | 890 | 846 | 83 | 108 | 2 | 9 | |||||||||||||||||||||||||||||||||||||||||||||||
| Investment and brokerage services | |||||||||||||||||||||||||||||||||||||||||||||||||||||
| Asset management fees | — | — | — | — | (1) | (2) | |||||||||||||||||||||||||||||||||||||||||||||||
| Brokerage fees | 9 | 14 | 470 | 439 | (6) | (1) | |||||||||||||||||||||||||||||||||||||||||||||||
| Total investment and brokerage services | 9 | 14 | 470 | 439 | (7) | (3) | |||||||||||||||||||||||||||||||||||||||||||||||
| Investment banking fees | |||||||||||||||||||||||||||||||||||||||||||||||||||||
| Underwriting income | 512 | 536 | 629 | 643 | (55) | (33) | |||||||||||||||||||||||||||||||||||||||||||||||
| Syndication fees | 177 | 78 | 170 | 55 | (1) | — | |||||||||||||||||||||||||||||||||||||||||||||||
| Financial advisory services | 608 | 356 | 45 | 40 | 1 | 1 | |||||||||||||||||||||||||||||||||||||||||||||||
| Total investment banking fees | 1,297 | 970 | 844 | 738 | (55) | (32) | |||||||||||||||||||||||||||||||||||||||||||||||
| Total fees and commissions | 2,381 | 1,986 | 1,456 | 1,455 | (60) | (25) | |||||||||||||||||||||||||||||||||||||||||||||||
| Market making and similar activities | 40 | 16 | 2,014 | 1,725 | (59) | (66) | |||||||||||||||||||||||||||||||||||||||||||||||
| Other income (loss) | 637 | 487 | 49 | (5) | (990) | (824) | |||||||||||||||||||||||||||||||||||||||||||||||
| Total noninterest income | $ | 3,058 | $ | 2,489 | $ | 3,519 | $ | 3,175 | $ | (1,109) | $ | (915) | |||||||||||||||||||||||||||||||||||||||||
Bank of America98 | ||||||||
| Noninterest Income by Business Segment and All Other | |||||||||||||||||||||||||||||||||||||||||||||||||||||
| Total Corporation | Consumer Banking | Global Wealth & Investment Management | |||||||||||||||||||||||||||||||||||||||||||||||||||
| Nine Months Ended September 30 | |||||||||||||||||||||||||||||||||||||||||||||||||||||
| (Dollars in millions) | 2021 | 2020 | 2021 | 2020 | 2021 | 2020 | |||||||||||||||||||||||||||||||||||||||||||||||
| Fees and commissions: | |||||||||||||||||||||||||||||||||||||||||||||||||||||
| Card income | |||||||||||||||||||||||||||||||||||||||||||||||||||||
| Interchange fees | $ | 3,431 | $ | 2,794 | $ | 2,687 | $ | 2,129 | $ | 33 | $ | 26 | |||||||||||||||||||||||||||||||||||||||||
| Other card income | 1,173 | 1,295 | 1,131 | 1,255 | 29 | 30 | |||||||||||||||||||||||||||||||||||||||||||||||
| Total card income | 4,604 | 4,089 | 3,818 | 3,384 | 62 | 56 | |||||||||||||||||||||||||||||||||||||||||||||||
| Service charges | |||||||||||||||||||||||||||||||||||||||||||||||||||||
| Deposit-related fees | 4,671 | 4,441 | 2,617 | 2,538 | 54 | 49 | |||||||||||||||||||||||||||||||||||||||||||||||
| Lending-related fees | 923 | 841 | — | — | — | — | |||||||||||||||||||||||||||||||||||||||||||||||
| Total service charges | 5,594 | 5,282 | 2,617 | 2,538 | 54 | 49 | |||||||||||||||||||||||||||||||||||||||||||||||
| Investment and brokerage services | |||||||||||||||||||||||||||||||||||||||||||||||||||||
| Asset management fees | 9,434 | 7,905 | 136 | 108 | 9,298 | 7,811 | |||||||||||||||||||||||||||||||||||||||||||||||
| Brokerage fees | 2,988 | 2,898 | 100 | 96 | 1,312 | 1,270 | |||||||||||||||||||||||||||||||||||||||||||||||
| Total investment and brokerage services | 12,422 | 10,803 | 236 | 204 | 10,610 | 9,081 | |||||||||||||||||||||||||||||||||||||||||||||||
| Investment banking fees | |||||||||||||||||||||||||||||||||||||||||||||||||||||
| Underwriting income | 4,028 | 3,610 | — | — | 305 | 292 | |||||||||||||||||||||||||||||||||||||||||||||||
| Syndication fees | 1,047 | 634 | — | — | — | — | |||||||||||||||||||||||||||||||||||||||||||||||
| Financial advisory services | 1,461 | 1,072 | — | — | — | — | |||||||||||||||||||||||||||||||||||||||||||||||
| Total investment banking fees | 6,536 | 5,316 | — | — | 305 | 292 | |||||||||||||||||||||||||||||||||||||||||||||||
| Total fees and commissions | 29,156 | 25,490 | 6,671 | 6,126 | 11,031 | 9,478 | |||||||||||||||||||||||||||||||||||||||||||||||
| Market making and similar activities | 7,360 | 6,983 | 1 | 2 | 31 | 52 | |||||||||||||||||||||||||||||||||||||||||||||||
| Other income (loss) | (987) | (151) | 35 | 149 | 147 | 191 | |||||||||||||||||||||||||||||||||||||||||||||||
| Total noninterest income | $ | 35,529 | $ | 32,322 | $ | 6,707 | $ | 6,277 | $ | 11,209 | $ | 9,721 | |||||||||||||||||||||||||||||||||||||||||
| Global Banking | Global Markets | All Other (1) | |||||||||||||||||||||||||||||||||||||||||||||||||||
| Nine Months Ended September 30 | |||||||||||||||||||||||||||||||||||||||||||||||||||||
| 2021 | 2020 | 2021 | 2020 | 2021 | 2020 | ||||||||||||||||||||||||||||||||||||||||||||||||
| Fees and commissions: | |||||||||||||||||||||||||||||||||||||||||||||||||||||
| Card income | |||||||||||||||||||||||||||||||||||||||||||||||||||||
| Interchange fees | $ | 503 | $ | 337 | $ | 208 | $ | 301 | $ | — | $ | 1 | |||||||||||||||||||||||||||||||||||||||||
| Other card income | 12 | 10 | — | — | 1 | — | |||||||||||||||||||||||||||||||||||||||||||||||
| Total card income | 515 | 347 | 208 | 301 | 1 | 1 | |||||||||||||||||||||||||||||||||||||||||||||||
| Service charges | |||||||||||||||||||||||||||||||||||||||||||||||||||||
| Deposit-related fees | 1,877 | 1,693 | 117 | 134 | 6 | 27 | |||||||||||||||||||||||||||||||||||||||||||||||
| Lending-related fees | 760 | 686 | 163 | 156 | — | (1) | |||||||||||||||||||||||||||||||||||||||||||||||
| Total service charges | 2,637 | 2,379 | 280 | 290 | 6 | 26 | |||||||||||||||||||||||||||||||||||||||||||||||
| Investment and brokerage services | |||||||||||||||||||||||||||||||||||||||||||||||||||||
| Asset management fees | — | — | — | — | — | (14) | |||||||||||||||||||||||||||||||||||||||||||||||
| Brokerage fees | 90 | 45 | 1,504 | 1,487 | (18) | — | |||||||||||||||||||||||||||||||||||||||||||||||
| Total investment and brokerage services | 90 | 45 | 1,504 | 1,487 | (18) | (14) | |||||||||||||||||||||||||||||||||||||||||||||||
| Investment banking fees | |||||||||||||||||||||||||||||||||||||||||||||||||||||
| Underwriting income | 1,754 | 1,607 | 2,165 | 1,879 | (196) | (168) | |||||||||||||||||||||||||||||||||||||||||||||||
| Syndication fees | 547 | 357 | 500 | 278 | — | (1) | |||||||||||||||||||||||||||||||||||||||||||||||
| Financial advisory services | 1,341 | 948 | 119 | 123 | 1 | 1 | |||||||||||||||||||||||||||||||||||||||||||||||
| Total investment banking fees | 3,642 | 2,912 | 2,784 | 2,280 | (195) | (168) | |||||||||||||||||||||||||||||||||||||||||||||||
| Total fees and commissions | 6,884 | 5,683 | 4,776 | 4,358 | (206) | (155) | |||||||||||||||||||||||||||||||||||||||||||||||
| Market making and similar activities | 99 | 88 | 7,448 | 7,059 | (219) | (218) | |||||||||||||||||||||||||||||||||||||||||||||||
| Other income (loss) | 1,834 | 1,434 | 233 | (116) | (3,236) | (1,809) | |||||||||||||||||||||||||||||||||||||||||||||||
| Total noninterest income | $ | 8,817 | $ | 7,205 | $ | 12,457 | $ | 11,301 | $ | (3,661) | $ | (2,182) | |||||||||||||||||||||||||||||||||||||||||
99Bank of America | ||||||||
| Results of Business Segments and All Other | |||||||||||||||||||||||||||||||||||||||||||||||||||||||||||
| At and for the three months ended March 31 | Total Corporation (1) | Consumer Banking | Global Wealth & Investment Management | ||||||||||||||||||||||||||||||||||||||||||||||||||||||||
| (Dollars in millions) | 2021 | 2020 | 2021 | 2020 | 2021 | 2020 | |||||||||||||||||||||||||||||||||||||||||||||||||||||
| Net interest income | $ | 10,308 | $ | 12,274 | $ | 5,920 | $ | 6,862 | $ | 1,331 | $ | 1,571 | |||||||||||||||||||||||||||||||||||||||||||||||
| Noninterest income | 12,624 | 10,637 | 2,149 | 2,267 | 3,640 | 3,365 | |||||||||||||||||||||||||||||||||||||||||||||||||||||
| Total revenue, net of interest expense | 22,932 | 22,911 | 8,069 | 9,129 | 4,971 | 4,936 | |||||||||||||||||||||||||||||||||||||||||||||||||||||
| Provision for credit losses | (1,860) | 4,761 | (617) | 2,258 | (65) | 189 | |||||||||||||||||||||||||||||||||||||||||||||||||||||
| Noninterest expense | 15,515 | 13,475 | 5,131 | 4,496 | 3,869 | 3,606 | |||||||||||||||||||||||||||||||||||||||||||||||||||||
| Income before income taxes | 9,277 | 4,675 | 3,555 | 2,375 | 1,167 | 1,141 | |||||||||||||||||||||||||||||||||||||||||||||||||||||
| Income tax expense | 1,227 | 665 | 871 | 582 | 286 | 280 | |||||||||||||||||||||||||||||||||||||||||||||||||||||
| Net income | $ | 8,050 | $ | 4,010 | $ | 2,684 | $ | 1,793 | $ | 881 | $ | 861 | |||||||||||||||||||||||||||||||||||||||||||||||
| Period-end total assets | $ | 2,969,992 | $ | 2,619,954 | $ | 1,047,413 | $ | 837,522 | $ | 378,655 | $ | 323,867 | |||||||||||||||||||||||||||||||||||||||||||||||
| Global Banking | Global Markets | All Other | |||||||||||||||||||||||||||||||||||||||||||||||||||||||||
| 2021 | 2020 | 2021 | 2020 | 2021 | 2020 | ||||||||||||||||||||||||||||||||||||||||||||||||||||||
| Net interest income | $ | 1,980 | $ | 2,612 | $ | 990 | $ | 1,153 | $ | 87 | $ | 76 | |||||||||||||||||||||||||||||||||||||||||||||||
| Noninterest income | 2,653 | 1,988 | 5,208 | 4,073 | (1,026) | (1,056) | |||||||||||||||||||||||||||||||||||||||||||||||||||||
| Total revenue, net of interest expense | 4,633 | 4,600 | 6,198 | 5,226 | (939) | (980) | |||||||||||||||||||||||||||||||||||||||||||||||||||||
| Provision for credit losses | (1,126) | 2,093 | (5) | 107 | (47) | 114 | |||||||||||||||||||||||||||||||||||||||||||||||||||||
| Noninterest expense | 2,781 | 2,318 | 3,427 | 2,815 | 307 | 240 | |||||||||||||||||||||||||||||||||||||||||||||||||||||
| Income before income taxes | 2,978 | 189 | 2,776 | 2,304 | (1,199) | (1,334) | |||||||||||||||||||||||||||||||||||||||||||||||||||||
| Income tax expense | 804 | 51 | 722 | 599 | (1,456) | (847) | |||||||||||||||||||||||||||||||||||||||||||||||||||||
| Net income | $ | 2,174 | $ | 138 | $ | 2,054 | $ | 1,705 | $ | 257 | $ | (487) | |||||||||||||||||||||||||||||||||||||||||||||||
| Period-end total assets | $ | 594,235 | $ | 562,529 | $ | 745,681 | $ | 654,939 | $ | 204,008 | $ | 241,097 | |||||||||||||||||||||||||||||||||||||||||||||||
| Business Segment Reconciliations | ||||||||||||||||||||||||||||||||||||||||||||
| Three Months Ended September 30 | Nine Months Ended September 30 | |||||||||||||||||||||||||||||||||||||||||||
| (Dollars in millions) | 2021 | 2020 | 2021 | 2020 | ||||||||||||||||||||||||||||||||||||||||
| Segments’ total revenue, net of interest expense | $ | 23,911 | $ | 21,385 | $ | 70,843 | $ | 67,994 | ||||||||||||||||||||||||||||||||||||
Adjustments (1): | ||||||||||||||||||||||||||||||||||||||||||||
| Asset and liability management activities | 3 | (168) | (41) | 425 | ||||||||||||||||||||||||||||||||||||||||
| Liquidating businesses, eliminations and other | (1,047) | (767) | (3,427) | (2,604) | ||||||||||||||||||||||||||||||||||||||||
| FTE basis adjustment | (101) | (114) | (322) | (386) | ||||||||||||||||||||||||||||||||||||||||
| Consolidated revenue, net of interest expense | $ | 22,766 | $ | 20,336 | $ | 67,053 | $ | 65,429 | ||||||||||||||||||||||||||||||||||||
| Segments’ total net income | 7,745 | 4,583 | 22,902 | 12,400 | ||||||||||||||||||||||||||||||||||||||||
Adjustments, net-of-tax (1): | ||||||||||||||||||||||||||||||||||||||||||||
| Asset and liability management activities | 10 | (127) | (20) | 316 | ||||||||||||||||||||||||||||||||||||||||
| Liquidating businesses, eliminations and other | (64) | 425 | 2,083 | (292) | ||||||||||||||||||||||||||||||||||||||||
| Consolidated net income | $ | 7,691 | $ | 4,881 | $ | 24,965 | $ | 12,424 | ||||||||||||||||||||||||||||||||||||
| September 30 | ||||||||||||||||||||||||||||||||||||||||||||
| 2021 | 2020 | |||||||||||||||||||||||||||||||||||||||||||
| Segments’ total assets | $ | 2,885,708 | $ | 2,515,107 | ||||||||||||||||||||||||||||||||||||||||
Adjustments (1): | ||||||||||||||||||||||||||||||||||||||||||||
| Asset and liability management activities, including securities portfolio | 1,296,026 | 1,018,385 | ||||||||||||||||||||||||||||||||||||||||||
| Elimination of segment asset allocations to match liabilities | (1,162,175) | (857,788) | ||||||||||||||||||||||||||||||||||||||||||
| Other | 65,887 | 62,748 | ||||||||||||||||||||||||||||||||||||||||||
| Consolidated total assets | $ | 3,085,446 | $ | 2,738,452 | ||||||||||||||||||||||||||||||||||||||||
| Noninterest Income by Business Segment and All Other | |||||||||||||||||||||||||||||||||||||||||||||||||||||
| Total Corporation | Consumer Banking | Global Wealth & Investment Management | |||||||||||||||||||||||||||||||||||||||||||||||||||
| Three Months Ended March 31 | |||||||||||||||||||||||||||||||||||||||||||||||||||||
| (Dollars in millions) | 2021 | 2020 | 2021 | 2020 | 2021 | 2020 | |||||||||||||||||||||||||||||||||||||||||||||||
| Fees and commissions: | |||||||||||||||||||||||||||||||||||||||||||||||||||||
| Card income | |||||||||||||||||||||||||||||||||||||||||||||||||||||
| Interchange fees | $ | 1,067 | $ | 792 | $ | 835 | $ | 644 | $ | 10 | $ | 8 | |||||||||||||||||||||||||||||||||||||||||
| Other card income | 368 | 480 | 354 | 466 | 9 | 9 | |||||||||||||||||||||||||||||||||||||||||||||||
| Total card income | 1,435 | 1,272 | 1,189 | 1,110 | 19 | 17 | |||||||||||||||||||||||||||||||||||||||||||||||
| Service charges | |||||||||||||||||||||||||||||||||||||||||||||||||||||
| Deposit-related fees | 1,495 | 1,627 | 831 | 995 | 18 | 17 | |||||||||||||||||||||||||||||||||||||||||||||||
| Lending-related fees | 297 | 276 | 0 | 0 | 0 | 0 | |||||||||||||||||||||||||||||||||||||||||||||||
| Total service charges | 1,792 | 1,903 | 831 | 995 | 18 | 17 | |||||||||||||||||||||||||||||||||||||||||||||||
| Investment and brokerage services | |||||||||||||||||||||||||||||||||||||||||||||||||||||
| Asset management fees | 3,002 | 2,682 | 41 | 38 | 2,961 | 2,652 | |||||||||||||||||||||||||||||||||||||||||||||||
| Brokerage fees | 1,061 | 1,076 | 36 | 32 | 430 | 470 | |||||||||||||||||||||||||||||||||||||||||||||||
| Total investment and brokerage services | 4,063 | 3,758 | 77 | 70 | 3,391 | 3,122 | |||||||||||||||||||||||||||||||||||||||||||||||
| Investment banking fees | |||||||||||||||||||||||||||||||||||||||||||||||||||||
| Underwriting income | 1,546 | 848 | 0 | 0 | 135 | 115 | |||||||||||||||||||||||||||||||||||||||||||||||
| Syndication fees | 300 | 271 | 0 | 0 | 0 | 0 | |||||||||||||||||||||||||||||||||||||||||||||||
| Financial advisory services | 400 | 269 | 0 | 0 | 0 | 0 | |||||||||||||||||||||||||||||||||||||||||||||||
| Total investment banking fees | 2,246 | 1,388 | 0 | 0 | 135 | 115 | |||||||||||||||||||||||||||||||||||||||||||||||
| Total fees and commissions | 9,536 | 8,321 | 2,097 | 2,175 | 3,563 | 3,271 | |||||||||||||||||||||||||||||||||||||||||||||||
| Market making and similar activities | 3,529 | 2,807 | 0 | 1 | 11 | 21 | |||||||||||||||||||||||||||||||||||||||||||||||
| Other income (loss) | (441) | (491) | 52 | 91 | 66 | 73 | |||||||||||||||||||||||||||||||||||||||||||||||
| Total noninterest income | $ | 12,624 | $ | 10,637 | $ | 2,149 | $ | 2,267 | $ | 3,640 | $ | 3,365 | |||||||||||||||||||||||||||||||||||||||||
| Global Banking | Global Markets | All Other (1) | |||||||||||||||||||||||||||||||||||||||||||||||||||
| Three Months Ended March 31 | |||||||||||||||||||||||||||||||||||||||||||||||||||||
| 2021 | 2020 | 2021 | 2020 | 2021 | 2020 | ||||||||||||||||||||||||||||||||||||||||||||||||
| Fees and commissions: | |||||||||||||||||||||||||||||||||||||||||||||||||||||
| Card income | |||||||||||||||||||||||||||||||||||||||||||||||||||||
| Interchange fees | $ | 146 | $ | 119 | $ | 76 | $ | 21 | $ | 0 | $ | 0 | |||||||||||||||||||||||||||||||||||||||||
| Other card income | 4 | 4 | 0 | 0 | 1 | 1 | |||||||||||||||||||||||||||||||||||||||||||||||
| Total card income | 150 | 123 | 76 | 21 | 1 | 1 | |||||||||||||||||||||||||||||||||||||||||||||||
| Service charges | |||||||||||||||||||||||||||||||||||||||||||||||||||||
| Deposit-related fees | 602 | 572 | 42 | 35 | 2 | 8 | |||||||||||||||||||||||||||||||||||||||||||||||
| Lending-related fees | 245 | 224 | 52 | 52 | 0 | 0 | |||||||||||||||||||||||||||||||||||||||||||||||
| Total service charges | 847 | 796 | 94 | 87 | 2 | 8 | |||||||||||||||||||||||||||||||||||||||||||||||
| Investment and brokerage services | |||||||||||||||||||||||||||||||||||||||||||||||||||||
| Asset management fees | 0 | 0 | 0 | 0 | 0 | (8) | |||||||||||||||||||||||||||||||||||||||||||||||
| Brokerage fees | 41 | 7 | 560 | 567 | (6) | 0 | |||||||||||||||||||||||||||||||||||||||||||||||
| Total investment and brokerage services | 41 | 7 | 560 | 567 | (6) | (8) | |||||||||||||||||||||||||||||||||||||||||||||||
| Investment banking fees | |||||||||||||||||||||||||||||||||||||||||||||||||||||
| Underwriting income | 654 | 368 | 799 | 455 | (42) | (90) | |||||||||||||||||||||||||||||||||||||||||||||||
| Syndication fees | 161 | 146 | 139 | 125 | 0 | 0 | |||||||||||||||||||||||||||||||||||||||||||||||
| Financial advisory services | 357 | 247 | 43 | 22 | 0 | 0 | |||||||||||||||||||||||||||||||||||||||||||||||
| Total investment banking fees | 1,172 | 761 | 981 | 602 | (42) | (90) | |||||||||||||||||||||||||||||||||||||||||||||||
| Total fees and commissions | 2,210 | 1,687 | 1,711 | 1,277 | (45) | (89) | |||||||||||||||||||||||||||||||||||||||||||||||
| Market making and similar activities | 31 | 87 | 3,470 | 2,973 | 17 | (275) | |||||||||||||||||||||||||||||||||||||||||||||||
| Other income (loss) | 412 | 214 | 27 | (177) | (998) | (692) | |||||||||||||||||||||||||||||||||||||||||||||||
| Total noninterest income | $ | 2,653 | $ | 1,988 | $ | 5,208 | $ | 4,073 | $ | (1,026) | $ | (1,056) | |||||||||||||||||||||||||||||||||||||||||
Bank of America | ||||||||
| Business Segment Reconciliations | ||||||||||||||||||||||||||||||||||||||||||||
| Three Months Ended March 31 | ||||||||||||||||||||||||||||||||||||||||||||
| (Dollars in millions) | 2021 | 2020 | ||||||||||||||||||||||||||||||||||||||||||
| Segments’ total revenue, net of interest expense | $ | 23,871 | $ | 23,891 | ||||||||||||||||||||||||||||||||||||||||
Adjustments (1): | ||||||||||||||||||||||||||||||||||||||||||||
| Asset and liability management activities | 109 | (85) | ||||||||||||||||||||||||||||||||||||||||||
| Liquidating businesses, eliminations and other | (1,048) | (895) | ||||||||||||||||||||||||||||||||||||||||||
| FTE basis adjustment | (111) | (144) | ||||||||||||||||||||||||||||||||||||||||||
| Consolidated revenue, net of interest expense | $ | 22,821 | $ | 22,767 | ||||||||||||||||||||||||||||||||||||||||
| Segments’ total net income | 7,793 | 4,497 | ||||||||||||||||||||||||||||||||||||||||||
Adjustments, net-of-tax (1): | ||||||||||||||||||||||||||||||||||||||||||||
| Asset and liability management activities | 83 | (77) | ||||||||||||||||||||||||||||||||||||||||||
| Liquidating businesses, eliminations and other | 174 | (410) | ||||||||||||||||||||||||||||||||||||||||||
| Consolidated net income | $ | 8,050 | $ | 4,010 | ||||||||||||||||||||||||||||||||||||||||
| March 31 | ||||||||||||||||||||||||||||||||||||||||||||
| 2021 | 2020 | |||||||||||||||||||||||||||||||||||||||||||
| Segments’ total assets | $ | 2,765,984 | $ | 2,378,857 | ||||||||||||||||||||||||||||||||||||||||
Adjustments (1): | ||||||||||||||||||||||||||||||||||||||||||||
| Asset and liability management activities, including securities portfolio | 1,226,930 | 840,187 | ||||||||||||||||||||||||||||||||||||||||||
| Elimination of segment asset allocations to match liabilities | (1,086,268) | (665,802) | ||||||||||||||||||||||||||||||||||||||||||
| Other | 63,346 | 66,712 | ||||||||||||||||||||||||||||||||||||||||||
| Consolidated total assets | $ | 2,969,992 | $ | 2,619,954 | ||||||||||||||||||||||||||||||||||||||||
101Bank of America | ||||||||||||||
| ABS | Asset-backed securities | ||||
| AFS | Available-for-sale | ||||
| ALM | Asset and liability management | ||||
| ARR | Alternative reference rates | ||||
| AUM | Assets under management | ||||
| BANA | Bank of America, National Association | ||||
| BHC | Bank holding company | ||||
| BofAS | BofA Securities, Inc. | ||||
| BofASE | BofA Securities Europe SA | ||||
| bps | |||||
| CCAR | Comprehensive Capital Analysis and Review | ||||
| CDO | Collateralized debt obligation | ||||
| CECL | Current expected credit losses | ||||
| CET1 | Common equity tier 1 | ||||
| CFTC | Commodity Futures Trading Commission | ||||
| CLTV | Combined loan-to-value | ||||
| CVA | Credit valuation adjustment | ||||
| DVA | Debit valuation adjustment | ||||
| EPS | Earnings per common share | ||||
| ESG | Environmental, social and governance | ||||
| FCA | Financial Conduct Authority | ||||
| FHA | Federal Housing Administration | ||||
| FHLB | Federal Home Loan Bank | ||||
| FHLMC | Freddie Mac | ||||
| FICC | Fixed income, currencies and commodities | ||||
| FICO | Fair Isaac Corporation (credit score) | ||||
| FINRA | Financial Industry Regulatory Authority, Inc. | ||||
| FNMA | Fannie Mae | ||||
| FTE | Fully taxable-equivalent | ||||
| FVA | Funding valuation adjustment | ||||
| GAAP | Accounting principles generally accepted in the United States of America | ||||
| GLS | Global Liquidity Sources | ||||
| GNMA | Government National Mortgage Association | ||||
| GSE | Government-sponsored enterprise | ||||
| G-SIB | Global systemically important bank | ||||
| GWIM | Global Wealth & Investment Management | ||||
| HELOC | Home equity line of credit | ||||
| HQLA | High Quality Liquid Assets | ||||
| HTM | Held-to-maturity | ||||
| IBOR | Interbank Offered Rates | ||||
| IRLC | Interest rate lock commitment | ||||
| ISDA | International Swaps and Derivatives Association, Inc. | ||||
| LCR | Liquidity Coverage Ratio | ||||
| LHFS | Loans held-for-sale | ||||
| LIBOR | London Interbank Offered Rate | ||||
| LTV | Loan-to-value | ||||
| MBS | Mortgage-backed securities | ||||
| MD&A | Management’s Discussion and Analysis of Financial Condition and Results of Operations | ||||
| MLGWM | Merrill Lynch Global Wealth Management | ||||
| MLI | Merrill Lynch International | ||||
| MLPCC | Merrill Lynch Professional Clearing Corp | ||||
| MLPF&S | Merrill Lynch, Pierce, Fenner & Smith Incorporated | ||||
| MSA | Metropolitan Statistical Area | ||||
| MSR | Mortgage servicing right | ||||
| NSFR | Net Stable Funding Ratio | ||||
| OCI | Other comprehensive income | ||||
| OREO | Other real estate owned | ||||
| PCA | Prompt Corrective Action | ||||
| PPP | Paycheck Protection Program | ||||
| RWA | |||||
| SBLC | Standby letter of credit | ||||
| SCB | Stress capital buffer | ||||
| SEC | Securities and Exchange Commission | ||||
| SLR | Supplementary leverage ratio | ||||
| SOFR | Secured Overnight Financing Rate | ||||
| TDR | Troubled debt restructurings | ||||
| TLAC | Total loss-absorbing capacity | ||||
| VaR | Value-at-Risk | ||||
| VIE | Variable interest entity | ||||
Bank of America102 | ||||||||
| (Dollars in millions, except per share information; shares in thousands) | Total Common Shares Repurchased (1,2) | Weighted-Average Per Share Price | Total Shares Purchased as Part of Publicly Announced Programs | Remaining Buyback Authority Amounts (2,3) | |||||||||||||||||||
| January 1 - 31, 2021 | 14,254 | $ | 31.56 | 14,237 | $ | 3,021 | |||||||||||||||||
| February 1 - 28, 2021 | 68,348 | 32.69 | 45,777 | 1,531 | |||||||||||||||||||
| March 1 - 31, 2021 | 42,547 | 37.20 | 41,089 | — | |||||||||||||||||||
| Three months ended March 31, 2021 | 125,149 | 34.09 | 101,103 | ||||||||||||||||||||
| (Dollars in millions, except per share information; shares in thousands) | Total Common Shares Repurchased (1,2) | Weighted-Average Per Share Price | Total Shares Purchased as Part of Publicly Announced Programs (2) | Remaining Buyback Authority Amounts (3) | |||||||||||||||||||
| July 1 - 31, 2021 | 77,529 | $ | 38.66 | 77,529 | $ | 17,892 | |||||||||||||||||
| August 1 - 31, 2021 | 133,677 | 40.55 | 131,990 | 12,709 | |||||||||||||||||||
| September 1 - 30, 2021 | 38,045 | 41.18 | 38,043 | 11,191 | |||||||||||||||||||
| Three months ended September 30, 2021 | 249,251 | 40.06 | 247,562 | ||||||||||||||||||||
103Bank of America | ||||||||||||||
| Exhibit No. | Exhibit No. | Description | Notes | Form | Exhibit | Filing Date | File No. | Exhibit No. | Description | Notes | Form | Exhibit | Filing Date | File No. | ||||||||||||||||||||||||||||||||||||||||||||||||||||||||||||||||||||||||||||||||
| 3.1 | 3.1 | 10-K | 3.1 | 2/24/21 | 1-6523 | 3.1 | 1 | |||||||||||||||||||||||||||||||||||||||||||||||||||||||||||||||||||||||||||||||||||||||
| 3.2 | 3.2 | 10-Q | 3.2 | 10/30/20 | 1-6523 | 3.2 | 10-Q | 3.2 | 10/30/20 | 1-6523 | ||||||||||||||||||||||||||||||||||||||||||||||||||||||||||||||||||||||||||||||||||||
| 10.1 | 1,2 | |||||||||||||||||||||||||||||||||||||||||||||||||||||||||||||||||||||||||||||||||||||||||||||
| 10.2 | 1,2 | |||||||||||||||||||||||||||||||||||||||||||||||||||||||||||||||||||||||||||||||||||||||||||||
| 22 | 22 | 10-K | 22 | 2/24/21 | 1-6523 | 22 | 1 | |||||||||||||||||||||||||||||||||||||||||||||||||||||||||||||||||||||||||||||||||||||||
| 31.1 | 31.1 | 1 | 31.1 | 1 | ||||||||||||||||||||||||||||||||||||||||||||||||||||||||||||||||||||||||||||||||||||||||||
| 31.2 | 31.2 | 1 | 31.2 | 1 | ||||||||||||||||||||||||||||||||||||||||||||||||||||||||||||||||||||||||||||||||||||||||||
| 32.1 | 32.1 | 1 | 32.1 | 1 | ||||||||||||||||||||||||||||||||||||||||||||||||||||||||||||||||||||||||||||||||||||||||||
| 32.2 | 32.2 | 1 | 32.2 | 1 | ||||||||||||||||||||||||||||||||||||||||||||||||||||||||||||||||||||||||||||||||||||||||||
| 101.INS | 101.INS | Inline XBRL Instance Document | 3 | 101.INS | Inline XBRL Instance Document | 2 | ||||||||||||||||||||||||||||||||||||||||||||||||||||||||||||||||||||||||||||||||||||||||
| 101.SCH | 101.SCH | Inline XBRL Taxonomy Extension Schema Document | 1 | 101.SCH | Inline XBRL Taxonomy Extension Schema Document | 1 | ||||||||||||||||||||||||||||||||||||||||||||||||||||||||||||||||||||||||||||||||||||||||
| 101.CAL | 101.CAL | Inline XBRL Taxonomy Extension Calculation Linkbase Document | 1 | 101.CAL | Inline XBRL Taxonomy Extension Calculation Linkbase Document | 1 | ||||||||||||||||||||||||||||||||||||||||||||||||||||||||||||||||||||||||||||||||||||||||
| 101.LAB | 101.LAB | Inline XBRL Taxonomy Extension Label Linkbase Document | 1 | 101.LAB | Inline XBRL Taxonomy Extension Label Linkbase Document | 1 | ||||||||||||||||||||||||||||||||||||||||||||||||||||||||||||||||||||||||||||||||||||||||
| 101.PRE | 101.PRE | Inline XBRL Taxonomy Extension Presentation Linkbase Document | 1 | 101.PRE | Inline XBRL Taxonomy Extension Presentation Linkbase Document | 1 | ||||||||||||||||||||||||||||||||||||||||||||||||||||||||||||||||||||||||||||||||||||||||
| 101.DEF | 101.DEF | Inline XBRL Taxonomy Extension Definitions Linkbase Document | 1 | 101.DEF | Inline XBRL Taxonomy Extension Definitions Linkbase Document | 1 | ||||||||||||||||||||||||||||||||||||||||||||||||||||||||||||||||||||||||||||||||||||||||
| 104 | 104 | Cover Page Interactive Data File (formatted as Inline XBRL and contained in Exhibit 101) | 104 | Cover Page Interactive Data File (formatted as Inline XBRL and contained in Exhibit 101) | ||||||||||||||||||||||||||||||||||||||||||||||||||||||||||||||||||||||||||||||||||||||||||
Bank of America Corporation Registrant | |||||||||||||||||
| Date: | /s/ Rudolf A. Bless | ||||||||||||||||
| Rudolf A. Bless Chief Accounting Officer | |||||||||||||||||
Bank of America104 | ||||||||