UNITED STATES
SECURITIES AND EXCHANGE COMMISSION
Washington, D.C. 20549
FORM 10-Q
☒QUARTERLY REPORT PURSUANT TO SECTION 13 or 15(d)
OF THE SECURITIES EXCHANGE ACT OF 1934
For the quarterly period ended September 24, 2017June 27, 2021
☐TRANSITION REPORT PURSUANT TO SECTION 13 OR 15(d) OF THE SECURITIES EXCHANGE ACT OF 1934
For the transition period from ___ to ___
Commission file number 1-5837
THE NEW YORK TIMES COMPANY
(Exact name of registrant as specified in its charter)
|
| | | | | | | |
NEW YORKNew York | | 13-1102020 |
(State or other jurisdiction of
incorporation or organization)
| | (I.R.S. Employer
Identification No.)
|
620 EIGHTH AVENUE, NEW YORK, NEW YORKEighth Avenue, New York, New York 10018
(Address and zip code of principal executive offices)
10018
(Zip Code)
Registrant’s telephone number, including area code 212-556-1234
Securities registered pursuant to Section 12(b) of the Act:
| | | | | | | | | | | | | | |
| Title of each class | | Trading Symbol(s) | | Name of each exchange on which registered |
| Class A Common Stock | | NYT | | New York Stock Exchange |
Indicate by check mark whether the registrant (1) has filed all reports required to be filed by Section 13 or 15(d) of the Securities Exchange Act of 1934 during the preceding 12 months (or for such shorter period that the registrant was required to file such reports), and (2) has been subject to such filing requirements for the past 90 days. Yes x No o
Indicate by check mark whether the registrant has submitted electronically and posted on its corporate Web site, if any, every Interactive Data File required to be submitted and posted pursuant to Rule 405 of Regulation S-T (§232.405 of this chapter) during the preceding 12 months (or for such shorter period that the registrant was required to submit and post such files). Yes x No o
Indicate by check mark whether the registrant is a large accelerated filer, an accelerated filer, a non-accelerated filer, a smaller reporting company, or an emerging growth company. See definitions of “large accelerated filer,” “accelerated filer,” “smaller reporting company” and “emerging growth company” in Rule 12b-2 of the Exchange Act.
|
| | | | | | | | | | | | | | | | | | |
Large accelerated filerx | ☒ | Accelerated filero | ☐ | Non-accelerated filero | ☐ | | |
Smaller reporting companyo | ☐ | Emerging growth companyo | ☐ | | | | |
IfIf an emerging growth company, indicate by the check mark if the registrant has elected not to use the extended transition period for complying with any new or revised financial accounting standards provided pursuant to section 13(a) of the Exchange Act. o☐
Indicate by check mark whether the registrant is a shell company (as defined in Rule 12b-2 of the Exchange Act). Yes o☐ No x
Number of shares of each class of the registrant’s common stock outstanding as of October 27, 2017July 30, 2021 (exclusive of treasury shares):
|
| | | | | | | |
| Class A Common Stock | 161,394,059167,091,902 |
| shares |
| Class B Common Stock | 808,763781,724 |
| shares |
THE NEW YORK TIMES COMPANY
INDEX
| | | | | | | | | | | | | | | | | | | | |
| | | | | |
| PART I | | | | Financial Information | | |
| Item | 1 | | Financial Statements | | |
| | | Condensed Consolidated Balance Sheets as of June 27, 2021 (unaudited) and December 27, 2020 | | |
| | | Condensed Consolidated Statements of Operations (unaudited) for the quarters and six months ended June 27, 2021 and June 28, 2020 | | |
| | | Condensed Consolidated Statements of Comprehensive Income (unaudited) for the quarters and six months ended June 27, 2021 and June 28, 2020 | | |
| | | Condensed Consolidated Statements of Changes In Stockholders’ Equity (unaudited) for the quarters and six months ended June 27, 2021 and June 28, 2020 | | |
| | | Condensed Consolidated Statements of Cash Flows (unaudited) for the six months ended June 27, 2021 and June 28, 2020 | | |
| | | Notes to the Condensed Consolidated Financial Statements | | |
| Item | 2 | | Management’s Discussion and Analysis of Financial Condition and Results of Operations | | |
| Item | 3 | | Quantitative and Qualitative Disclosures about Market Risk | | |
| Item | 4 | | Controls and Procedures | | |
| |
| PART II | | | | Other Information | | |
| Item | 1 | | Legal Proceedings | | |
| Item | 1A | | Risk Factors | | |
| Item | 2 | | Unregistered Sales of Equity Securities and Use of Proceeds | | |
| Item | 6 | | Exhibits | | |
|
| | | | | | |
| | | ITEM NO. | | |
| PART I | | | | Financial Information | | |
| Item | 1 | | Financial Statements | | |
| | | | Condensed Consolidated Balance Sheets as September 24, 2017 (unaudited) and December 25, 2016 | | |
| | | | Condensed Consolidated Statements of Operations (unaudited) for the quarters and nine months ended September 24, 2017 and September 25, 2016 | | |
| | | | Condensed Consolidated Statements of Comprehensive Income (unaudited) for the quarters and nine months ended September 24, 2017 and September 25, 2016 | | |
| | | | Condensed Consolidated Statements of Cash Flows (unaudited) for the nine months ended September 24, 2017 and September 25, 2016 | | |
| | | | Notes to the Condensed Consolidated Financial Statements | | |
| Item | 2 | | Management’s Discussion and Analysis of Financial Condition and Results of Operations | | |
| Item | 3 | | Quantitative and Qualitative Disclosures about Market Risk | | |
| Item | 4 | | Controls and Procedures | | |
| | |
| PART II | | | | Other Information | | |
| Item | 1 | | Legal Proceedings | | |
| Item | 1A | | Risk Factors | | |
| Item | 2 | | Unregistered Sales of Equity Securities and Use of Proceeds | | |
| Item | 6 | | Exhibits | | |
PART I. FINANCIAL INFORMATION
Item 1. Financial Statements
THE NEW YORK TIMES COMPANY
CONDENSED CONSOLIDATED BALANCE SHEETS
(In thousands, except share and per share data)
| | | | | September 24, 2017 |
| December 25, 2016 | | June 27, 2021 | | December 27, 2020 |
| | | (Unaudited) | | | | (Unaudited) | | |
| Assets | | | | | Assets | |
| Current assets | | | | | Current assets | |
| Cash and cash equivalents | | $ | 244,667 |
| | $ | 100,692 |
| Cash and cash equivalents | | $ | 320,871 | | | $ | 286,079 | |
| Short-term marketable securities | | 336,442 |
| | 449,535 |
| Short-term marketable securities | | 338,455 | | | 309,080 | |
| Accounts receivable (net of allowances of $13,838 in 2017 and $16,815 in 2016) | | 142,323 |
| | 197,355 |
| |
| Accounts receivable (net of allowances of $12,269 in 2021 and $13,797 in 2020) | | Accounts receivable (net of allowances of $12,269 in 2021 and $13,797 in 2020) | | 153,540 | | | 183,692 | |
| Prepaid expenses | | 17,869 |
| | 15,948 |
| Prepaid expenses | | 36,262 | | | 29,487 | |
| Other current assets | | 26,462 |
| | 32,648 |
| Other current assets | | 32,110 | | | 27,497 | |
| Total current assets | | 767,763 |
| | 796,178 |
| Total current assets | | 881,238 | | | 835,835 | |
| Other assets | | | | | Other assets | | | | |
| Long-term marketable securities | | 241,782 |
| | 187,299 |
| Long-term marketable securities | | 287,265 | | | 286,831 | |
| Investments in joint ventures | | 20,472 |
| | 15,614 |
| |
| Property, plant and equipment (less accumulated depreciation and amortization of $945,416 in 2017 and $903,736 in 2016) | | 618,835 |
| | 596,743 |
| |
| Property, plant and equipment (less accumulated depreciation and amortization of $891,635 in 2021 and $886,149 in 2020) | | Property, plant and equipment (less accumulated depreciation and amortization of $891,635 in 2021 and $886,149 in 2020) | | 582,331 | | | 594,516 | |
| Goodwill | | 143,171 |
| | 134,517 |
| Goodwill | | 170,156 | | | 171,657 | |
| Deferred income taxes | | 290,473 |
| | 301,342 |
| Deferred income taxes | | 96,869 | | | 99,518 | |
| Miscellaneous assets | | 156,462 |
| | 153,702 |
| Miscellaneous assets | | 330,148 | | | 319,332 | |
| Total assets | | $ | 2,238,958 |
| | $ | 2,185,395 |
| Total assets | | $ | 2,348,007 | | | $ | 2,307,689 | |
See Notes to Condensed Consolidated Financial Statements.
THE NEW YORK TIMES COMPANY
CONDENSED CONSOLIDATED BALANCE SHEETS-(Continued)
(In thousands, except share and per share data) | | | | | September 24, 2017 | | December 25, 2016 | | June 27, 2021 | | December 27, 2020 |
| | | (Unaudited) | | | | (Unaudited) | | |
| Liabilities and stockholders’ equity | | | | | Liabilities and stockholders’ equity | |
| Current liabilities | | | | | Current liabilities | |
| Accounts payable | | $ | 116,724 |
| | $ | 104,463 |
| Accounts payable | | $ | 94,480 | | | $ | 123,157 | |
| Accrued payroll and other related liabilities | | 90,651 |
| | 96,463 |
| Accrued payroll and other related liabilities | | 101,637 | | | 121,159 | |
| Unexpired subscriptions | | 76,886 |
| | 66,686 |
| |
| Unexpired subscriptions revenue | | Unexpired subscriptions revenue | | 114,740 | | | 105,346 | |
| | Accrued expenses and other | | 134,411 |
| | 131,125 |
| Accrued expenses and other | | 135,660 | | | 137,086 | |
| Total current liabilities | | 418,672 |
| | 398,737 |
| Total current liabilities | | 446,517 | | | 486,748 | |
| Other liabilities | | | | | Other liabilities | | | | |
| Long-term debt and capital lease obligations | | 249,375 |
| | 246,978 |
| |
| | Pension benefits obligation | | 518,395 |
| | 558,790 |
| Pension benefits obligation | | 317,543 | | | 326,555 | |
| Postretirement benefits obligation | | 55,107 |
| | 57,999 |
| Postretirement benefits obligation | | 35,712 | | | 38,690 | |
| Other | | 78,735 |
| | 78,647 |
| Other | | 129,448 | | | 127,585 | |
| Total other liabilities | | 901,612 |
| | 942,414 |
| Total other liabilities | | 482,703 | | | 492,830 | |
| Stockholders’ equity | | | | | Stockholders’ equity | | | | |
| Common stock of $.10 par value: | | | | | Common stock of $.10 par value: | |
| Class A – authorized: 300,000,000 shares; issued: 2017 – 170,220,136; 2016 – 169,206,879 (including treasury shares: 2017 – 8,870,801; 2016 – 8,870,801) | | 17,022 |
| | 16,921 |
| |
Class B – convertible – authorized and issued shares: 2017 – 810,933; 2016 – 816,632 (including treasury shares: 2017 – none; 2016 – none) | | 81 |
| | 82 |
| |
| Class A – authorized: 300,000,000 shares; issued: 2021 – 175,962,272; 2020 – 175,308,672 (including treasury shares: 2021 – 8,870,801; 2020 – 8,870,801) | | Class A – authorized: 300,000,000 shares; issued: 2021 – 175,962,272; 2020 – 175,308,672 (including treasury shares: 2021 – 8,870,801; 2020 – 8,870,801) | | 17,596 | | | 17,531 | |
| Class B – convertible – authorized and issued shares: 2021 – 781,724; 2020 – 781,724 | | Class B – convertible – authorized and issued shares: 2021 – 781,724; 2020 – 781,724 | | 78 | | | 78 | |
| Additional paid-in capital | | 159,830 |
| | 149,928 |
| Additional paid-in capital | | 217,565 | | | 216,714 | |
| Retained earnings | | 1,373,478 |
| | 1,331,911 |
| Retained earnings | | 1,756,198 | | | 1,672,586 | |
| Common stock held in treasury, at cost | | (171,211 | ) | | (171,211 | ) | Common stock held in treasury, at cost | | (171,211) | | | (171,211) | |
| Accumulated other comprehensive loss, net of income taxes: | | | | | Accumulated other comprehensive loss, net of income taxes: | |
| Foreign currency translation adjustments | | 5,571 |
| | (1,822 | ) | Foreign currency translation adjustments | | 7,092 | | | 8,386 | |
| Funded status of benefit plans | | (465,440 | ) | | (477,994 | ) | Funded status of benefit plans | | (412,315) | | | (421,698) | |
| Net unrealized loss on available-for-sale securities | | (653 | ) | | — |
| |
| Net unrealized gain on available-for-sale securities | | Net unrealized gain on available-for-sale securities | | 1,779 | | | 3,131 | |
| Total accumulated other comprehensive loss, net of income taxes | | (460,522 | ) | | (479,816 | ) | Total accumulated other comprehensive loss, net of income taxes | | (403,444) | | | (410,181) | |
| Total New York Times Company stockholders’ equity | | 918,678 |
| | 847,815 |
| Total New York Times Company stockholders’ equity | | 1,416,782 | | | 1,325,517 | |
| Noncontrolling interest | | (4 | ) | | (3,571 | ) | Noncontrolling interest | | 2,005 | | | 2,594 | |
| Total stockholders’ equity | | 918,674 |
| | 844,244 |
| Total stockholders’ equity | | 1,418,787 | | | 1,328,111 | |
| Total liabilities and stockholders’ equity | | $ | 2,238,958 |
| | $ | 2,185,395 |
| Total liabilities and stockholders’ equity | | $ | 2,348,007 | | | $ | 2,307,689 | |
See Notes to Condensed Consolidated Financial Statements.
THE NEW YORK TIMES COMPANY
CONDENSED CONSOLIDATED STATEMENTS OF OPERATIONS
(Unaudited)
(In thousands, except per share data)
| | | | | | | | | | | | | | | | | | | | | | | | | | |
| | | For the Quarters Ended | | For the Six Months Ended |
| | June 27, 2021 | | June 28, 2020 | | June 27, 2021 | | June 28, 2020 |
| | (13 weeks) | | (26 weeks) |
| Revenues | | | | | | | | |
| Subscription | | $ | 339,217 | | | $ | 293,189 | | | $ | 668,301 | | | $ | 578,623 | |
| Advertising | | 112,774 | | | 67,760 | | | 209,890 | | | 173,897 | |
| Other | | 46,506 | | | 42,801 | | | 93,351 | | | 94,866 | |
| Total revenues | | 498,497 | | | 403,750 | | | 971,542 | | | 847,386 | |
| Operating costs | | | | | | | | |
| Cost of revenue (excluding depreciation and amortization) | | 251,358 | | | 229,913 | | | 502,355 | | | 473,397 | |
| Sales and marketing | | 53,555 | | | 39,605 | | | 113,708 | | | 113,389 | |
| Product development | | 39,699 | | | 30,983 | | | 78,642 | | | 61,985 | |
| General and administrative | | 62,283 | | | 58,812 | | | 118,860 | | | 111,673 | |
| Depreciation and amortization | | 14,486 | | | 15,631 | | | 29,203 | | | 30,816 | |
| Total operating costs | | 421,381 | | | 374,944 | | | 842,768 | | | 791,260 | |
| | | | | | | | |
| | | | | | | | |
| Lease termination charge | | 3,831 | | | 0 | | | 3,831 | | | 0 | |
| | | | | | | | |
| Operating profit | | 73,285 | | | 28,806 | | | 124,943 | | | 56,126 | |
| Other components of net periodic benefit costs | | 2,598 | | | 2,149 | | | 5,197 | | | 4,463 | |
| | | | | | | | |
| Interest income and other, net | | 1,873 | | | 2,786 | | | 3,384 | | | 16,640 | |
| Income from continuing operations before income taxes | | 72,560 | | | 29,443 | | | 123,130 | | | 68,303 | |
| Income tax expense | | 18,243 | | | 5,781 | | | 27,704 | | | 11,787 | |
| | | | | | | | |
| | | | | | | | |
| Net income | | 54,317 | | | 23,662 | | | 95,426 | | | 56,516 | |
| | | | | | | | |
| Net income attributable to The New York Times Company common stockholders | | $ | 54,317 | | | $ | 23,662 | | | $ | 95,426 | | | $ | 56,516 | |
| Average number of common shares outstanding: | | | | | | | | |
| Basic | | 168,012 | | | 166,869 | | | 167,828 | | | 166,725 | |
| Diluted | | 168,346 | | | 168,083 | | | 168,312 | | | 167,968 | |
| Basic earnings per share attributable to The New York Times Company common stockholders | | $ | 0.32 | | | $ | 0.14 | | | $ | 0.57 | | | $ | 0.34 | |
| Diluted earnings per share attributable to The New York Times Company common stockholders | | $ | 0.32 | | | $ | 0.14 | | | $ | 0.57 | | | $ | 0.34 | |
| Dividends declared per share | | $ | 0 | | | $ | 0 | | | $ | 0.07 | | | $ | 0.06 | |
|
| | | | | | | | | | | | | | | | |
| | | For the Quarters Ended | | For the Nine Months Ended |
| | | September 24, 2017 |
|
| September 25, 2016 |
| | September 24, 2017 |
| | September 25, 2016 |
|
| | | (13 weeks) | | (39 weeks) |
| Revenues | | | | | | | | |
| Subscription | | $ | 246,638 |
| | $ | 217,099 |
| | $ | 739,050 |
| | $ | 654,573 |
|
| Advertising | | 113,633 |
| | 124,898 |
| | 375,895 |
| | 395,733 |
|
| Other | | 25,364 |
| | 21,550 |
| | 76,568 |
| | 65,386 |
|
| Total revenues | | 385,635 |
| | 363,547 |
| | 1,191,513 |
| | 1,115,692 |
|
| Operating costs | | | | | | | | |
| Production costs: | | | | | | | | |
| Wages and benefits | | 89,866 |
| | 91,041 |
| | 269,209 |
| | 274,142 |
|
| Raw materials | | 15,718 |
| | 18,228 |
| | 48,461 |
| | 53,115 |
|
| Other | | 44,336 |
| | 47,347 |
| | 134,771 |
| | 139,938 |
|
| Total production costs | | 149,920 |
| | 156,616 |
| | 452,441 |
| | 467,195 |
|
| Selling, general and administrative costs | | 184,483 |
| | 184,596 |
| | 595,491 |
| | 534,911 |
|
| Depreciation and amortization | | 15,677 |
| | 15,384 |
| | 46,961 |
| | 46,003 |
|
| Total operating costs | | 350,080 |
| | 356,596 |
| | 1,094,893 |
| | 1,048,109 |
|
| Headquarters redesign and consolidation | | 2,542 |
| | — |
| | 6,929 |
| | — |
|
| Restructuring charge | | — |
| | 2,949 |
| | — |
| | 14,804 |
|
| Multiemployer pension plan withdrawal expense | | — |
| | (4,971 | ) | | — |
| | 6,730 |
|
| Operating profit | | 33,013 |
| | 8,973 |
| | 89,691 |
| | 46,049 |
|
| Gain/(loss) from joint ventures | | 31,557 |
| | 463 |
| | 31,464 |
| | (41,845 | ) |
| Interest expense, net | | 4,660 |
| | 9,032 |
| | 15,118 |
| | 26,955 |
|
| Income/(loss) from continuing operations before income taxes | | 59,910 |
| | 404 |
| | 106,037 |
| | (22,751 | ) |
| Income tax expense/(benefit) | | 23,420 |
| | 121 |
| | 40,873 |
| | (8,956 | ) |
| Income/(loss) from continuing operations | | 36,490 |
| | 283 |
| | 65,164 |
| | (13,795 | ) |
| Loss from discontinued operations, net of income taxes | | 488 |
| | — |
| | 488 |
| | — |
|
| Net income/(loss) | | 36,002 |
| | 283 |
| | 64,676 |
| | (13,795 | ) |
| Net (income)/loss attributable to the noncontrolling interest | | (3,673 | ) | | 123 |
| | (3,567 | ) | | 5,719 |
|
| Net income/(loss) attributable to The New York Times Company common stockholders | | $ | 32,329 |
| | $ | 406 |
| | $ | 61,109 |
| | $ | (8,076 | ) |
| Average number of common shares outstanding: | | | | | | | | |
| Basic | | 162,173 |
| | 161,185 |
| | 161,798 |
| | 161,092 |
|
| Diluted | | 164,405 |
| | 162,945 |
| | 164,005 |
| | 161,092 |
|
| Basic earnings/(loss) per share attributable to The New York Times Company common stockholders: | | | | | | | | |
| Income/(loss) from continuing operations | | $ | 0.20 |
| | $ | — |
| | $ | 0.38 |
| | $ | (0.05 | ) |
| Loss from discontinued operations, net of income taxes | | — |
| | — |
| | — |
| | — |
|
| Net income/(loss) | | $ | 0.20 |
| | $ | — |
| | $ | 0.38 |
| | $ | (0.05 | ) |
See Notes to Condensed Consolidated Financial Statements.
THE NEW YORK TIMES COMPANY
CONDENSED CONSOLIDATED STATEMENTS OF OPERATIONS
(Unaudited)
(In thousands, except per share data)
|
| | | | | | | | | | | | | | | | |
| | | For the Quarters Ended | | For the Nine Months Ended |
| | | September 24, 2017 |
| | September 25, 2016 |
| | September 24, 2017 |
| | September 25, 2016 |
|
| | | (13 weeks) | | (39 weeks) |
| Diluted earnings/(loss) per share attributable to The New York Times Company common stockholders: | | | | | | | | |
| Income/(loss) from continuing operations | | $ | 0.20 |
| | $ | — |
| | $ | 0.37 |
| | $ | (0.05 | ) |
| Loss from discontinued operations, net of income taxes | | — |
| | — |
| | — |
| | — |
|
| Net income/(loss) | | $ | 0.20 |
| | $ | — |
| | $ | 0.37 |
| | $ | (0.05 | ) |
| Dividends declared per share | | $ | 0.08 |
| | $ | 0.08 |
| | $ | 0.12 |
| | $ | 0.12 |
|
See Notes to Condensed Consolidated Financial Statements.
THE NEW YORK TIMES COMPANY
CONDENSED CONSOLIDATED STATEMENTS OF COMPREHENSIVE INCOME
(Unaudited)
(In thousands)
| | | | | | | | | | | | | For the Quarters Ended | | For the Six Months Ended |
| | | For the Quarters Ended | | For the Nine Months Ended | | June 27, 2021 | | June 28, 2020 | | June 27, 2021 | | June 28, 2020 |
| | | September 24, 2017 |
| | September 25, 2016 |
| | September 24, 2017 |
| | September 25, 2016 |
| | (13 weeks) | | (26 weeks) |
| | | (13 weeks) | | (39 weeks) | |
| Net income/(loss) | | $ | 36,002 |
| | $ | 283 |
| | $ | 64,676 |
| | $ | (13,795 | ) | |
| Net income | | Net income | | $ | 54,317 | | | $ | 23,662 | | | $ | 95,426 | | | $ | 56,516 | |
| Other comprehensive income, before tax: | | | | | | | | | Other comprehensive income, before tax: | |
| Income on foreign currency translation adjustments | | 6,099 |
| | 604 |
| | 11,170 |
| | 2,110 |
| |
| Gain/(loss) on foreign currency translation adjustments | | Gain/(loss) on foreign currency translation adjustments | | 935 | | | 619 | | | (1,767) | | | 365 | |
| Pension and postretirement benefits obligation | | 6,921 |
| | 6,552 |
| | 20,762 |
| | 19,655 |
| Pension and postretirement benefits obligation | | 6,409 | | | 6,231 | | | 12,815 | | | 12,628 | |
| Net unrealized loss on available-for-sale securities | | (1,081 | ) | | — |
| | (1,081 | ) | | — |
| |
| Net unrealized (loss)/gain on available-for-sale securities | | Net unrealized (loss)/gain on available-for-sale securities | | (779) | | | 4,075 | | | (1,846) | | | 4,790 | |
| Other comprehensive income, before tax | | 11,939 |
| | 7,156 |
| | 30,851 |
| | 21,765 |
| Other comprehensive income, before tax | | 6,565 | | | 10,925 | | | 9,202 | | | 17,783 | |
| Income tax expense | | 4,200 |
| | 2,912 |
| | 11,557 |
| | 8,492 |
| Income tax expense | | 1,756 | | | 2,848 | | | 2,465 | | | 4,763 | |
| Other comprehensive income, net of tax | | 7,739 |
| | 4,244 |
| | 19,294 |
| | 13,273 |
| Other comprehensive income, net of tax | | 4,809 | | | 8,077 | | | 6,737 | | | 13,020 | |
| Comprehensive income/(loss) | | 43,741 |
| | 4,527 |
| | 83,970 |
| | (522 | ) | |
| Comprehensive (income)/loss attributable to the noncontrolling interest | | (3,673 | ) | | 123 |
| | (3,567 | ) | | 5,719 |
| |
| | Comprehensive income attributable to The New York Times Company common stockholders | | $ | 40,068 |
| | $ | 4,650 |
| | $ | 80,403 |
| | $ | 5,197 |
| Comprehensive income attributable to The New York Times Company common stockholders | | $ | 59,126 | | | $ | 31,739 | | | $ | 102,163 | | | $ | 69,536 | |
See Notes to Condensed Consolidated Financial Statements.
THE NEW YORK TIMES COMPANY
CONDENSED CONSOLIDATED STATEMENTS OF CHANGES IN STOCKHOLDERS’ EQUITY
For the Quarters Ended June 27, 2021 and June 28, 2020
(Unaudited)
(In thousands, except share data)
| | | | | | | | | | | | | | | | | | | | | | | | | | |
| Capital Stock -
Class A
and
Class B Common | Additional
Paid-in
Capital | Retained
Earnings | Common
Stock
Held in
Treasury,
at Cost | Accumulated
Other
Comprehensive
Loss, Net of
Income
Taxes | Total
New York
Times
Company
Stockholders’
Equity | Non-
controlling
Interest | Total
Stock-
holders’
Equity |
|
| Balance, March 29, 2020 | $ | 17,552 | | $ | 199,933 | | $ | 1,635,473 | | $ | (171,211) | | $ | (490,033) | | $ | 1,191,714 | | $ | 1,860 | | $ | 1,193,574 | |
| | | | | | | | |
| Net income | — | | — | | 23,662 | | — | | — | | 23,662 | | — | | 23,662 | |
| Dividends | — | | — | | 23 | | — | | — | | 23 | | — | | 23 | |
| Other comprehensive income | — | | — | | — | | — | | 8,077 | | 8,077 | | — | | 8,077 | |
| Issuance of shares: | | | | | | | | |
| Stock options – 90,735 Class A shares | 9 | | 933 | | — | | — | | — | | 942 | | — | | 942 | |
| Restricted stock units vested – 6,516 Class A shares | 1 | | (275) | | — | | — | | — | | (274) | | — | | (274) | |
| | | | | | | | |
| Stock-based compensation | — | | 5,027 | | — | | — | | — | | 5,027 | | — | | 5,027 | |
| | | | | | | | |
| Balance, June 28, 2020 | $ | 17,562 | | $ | 205,618 | | $ | 1,659,158 | | $ | (171,211) | | $ | (481,956) | | $ | 1,229,171 | | $ | 1,860 | | $ | 1,231,031 | |
| | | | | | | | |
| Balance, March 28, 2021 | $ | 17,670 | | $ | 212,802 | | $ | 1,701,860 | | $ | (171,211) | | $ | (408,253) | | $ | 1,352,868 | | $ | 2,594 | | $ | 1,355,462 | |
| | | | | | | | |
| Net income | — | | — | | 54,317 | | — | | — | | 54,317 | | — | | 54,317 | |
| Dividends | — | | — | | 21 | | — | | — | | 21 | | — | | 21 | |
| Other comprehensive income | — | | — | | — | | — | | 4,809 | | 4,809 | | — | | 4,809 | |
| Issuance of shares: | | | | | | | | |
| | | | | | | | |
| Restricted stock units vested – 45,280 Class A shares | 4 | | (390) | | — | | — | | — | | (386) | | — | | (386) | |
| | | | | | | | |
| Stock-based compensation | — | | 5,153 | | — | | — | | — | | 5,153 | | — | | 5,153 | |
| Distributions | — | | — | | — | | — | | — | | — | | (589) | | (589) | |
| | | | | | | | |
| Balance, June 27, 2021 | $ | 17,674 | | $ | 217,565 | | $ | 1,756,198 | | $ | (171,211) | | $ | (403,444) | | $ | 1,416,782 | | $ | 2,005 | | $ | 1,418,787 | |
THE NEW YORK TIMES COMPANY
CONDENSED CONSOLIDATED STATEMENTS OF CHANGES IN STOCKHOLDERS’ EQUITY
For the Six Months Ended June 27, 2021 and June 28, 2020
(Unaudited)
(In thousands, except share data)
| | | | | | | | | | | | | | | | | | | | | | | | | | |
| Capital Stock -
Class A
and
Class B Common | Additional
Paid-in
Capital | Retained
Earnings | Common
Stock
Held in
Treasury,
at Cost | Accumulated
Other
Comprehensive
Loss, Net of
Income
Taxes | Total
New York
Times
Company
Stockholders’
Equity | Non-
controlling
Interest | Total
Stock-
holders’
Equity |
|
| Balance, December 29, 2019 | $ | 17,504 | | $ | 208,028 | | $ | 1,612,658 | | $ | (171,211) | | $ | (494,976) | | $ | 1,172,003 | | $ | 1,860 | | $ | 1,173,863 | |
| | | | | | | | |
| Net income | — | | — | | 56,516 | | — | | — | | 56,516 | | — | | 56,516 | |
| Dividends | — | | — | | (10,016) | | — | | — | | (10,016) | | — | | (10,016) | |
| Other comprehensive income | — | | — | | — | | — | | 13,020 | | 13,020 | | — | | 13,020 | |
| Issuance of shares: | | | | | | — | | | — | |
| Stock options – 179,510 Class A shares | 18 | | 1,855 | | — | | — | | — | | 1,873 | | — | | 1,873 | |
| Restricted stock units vested – 141,501 Class A shares | 14 | | (3,897) | | — | | — | | — | | (3,883) | | — | | (3,883) | |
| Performance-based awards – 257,098 Class A shares | 26 | | (7,850) | | — | | — | | — | | (7,824) | | — | | (7,824) | |
| Stock-based compensation | — | | 7,482 | | — | | — | | — | | 7,482 | | — | | 7,482 | |
| | | | | | | | |
| Balance, June 28, 2020 | $ | 17,562 | | $ | 205,618 | | $ | 1,659,158 | | $ | (171,211) | | $ | (481,956) | | $ | 1,229,171 | | $ | 1,860 | | $ | 1,231,031 | |
| | | | | | | | |
| Balance, December 27, 2020 | $ | 17,609 | | $ | 216,714 | | $ | 1,672,586 | | $ | (171,211) | | $ | (410,181) | | $ | 1,325,517 | | $ | 2,594 | | $ | 1,328,111 | |
| | | | | | | | |
| Net income | — | | — | | 95,426 | | — | | — | | 95,426 | | — | | 95,426 | |
| Dividends | — | | — | | (11,814) | | — | | — | | (11,814) | | — | | (11,814) | |
| Other comprehensive income | — | | — | | — | | — | | 6,737 | | 6,737 | | — | | 6,737 | |
| Issuance of shares: | | | | | | | | |
| Stock options – 323,360 Class A shares | 33 | | 2,414 | | — | | — | | — | | 2,447 | | — | | 2,447 | |
| Restricted stock units vested – 187,987 Class A shares | 18 | | (4,954) | | — | | — | | — | | (4,936) | | — | | (4,936) | |
| Performance-based awards – 142,253 Class A shares | 14 | | (5,947) | | — | | — | | — | | (5,933) | | — | | (5,933) | |
| Stock-based compensation | — | | 9,338 | | — | | — | | — | | 9,338 | | — | | 9,338 | |
| Distributions | — | | — | | — | | — | | — | | — | | (589) | | (589) | |
| | | | | | | | |
| Balance, June 27, 2021 | $ | 17,674 | | $ | 217,565 | | $ | 1,756,198 | | $ | (171,211) | | $ | (403,444) | | $ | 1,416,782 | | $ | 2,005 | | $ | 1,418,787 | |
THE NEW YORK TIMES COMPANY
CONDENSED CONSOLIDATED STATEMENTS OF CASH FLOWS
(Unaudited)
| | | | | For the Nine Months Ended | | For the Six Months Ended |
| | | September 24, 2017 |
| | September 25, 2016 |
| | June 27, 2021 | | June 28, 2020 |
| | | (39 weeks) | | (26 weeks) |
| Cash flows from operating activities | | | | | Cash flows from operating activities | |
| Net income/(loss) | | $ | 64,676 |
| | $ | (13,795 | ) | |
| Net income | | Net income | | $ | 95,426 | | | $ | 56,516 | |
| Adjustments to reconcile net income to net cash provided by operating activities: | | | | | Adjustments to reconcile net income to net cash provided by operating activities: | |
| Restructuring charge | | — |
| | 14,804 |
| |
| Multiemployer pension plan charges | | — |
| | 11,701 |
| |
| | Depreciation and amortization | | 46,961 |
| | 46,003 |
| Depreciation and amortization | | 29,203 | | | 30,816 | |
| Lease termination charge | | Lease termination charge | | 3,831 | | | 0 | |
| Amortization of right of use asset | | Amortization of right of use asset | | 4,442 | | | 4,645 | |
| Stock-based compensation expense | | 10,927 |
| | 8,561 |
| Stock-based compensation expense | | 9,338 | | | 7,482 | |
| Undistributed (gain)/loss of joint ventures | | (31,464 | ) | | 41,845 |
| |
| | Gain on non-marketable equity investment | | Gain on non-marketable equity investment | | 0 | | | (10,074) | |
| | Long-term retirement benefit obligations | | (21,897 | ) | | (22,366 | ) | Long-term retirement benefit obligations | | (8,866) | | | (8,524) | |
| Uncertain tax positions | | 139 |
| | 53 |
| |
| Other-net | | 2,609 |
| | 8,257 |
| |
| | Other – net | | Other – net | | (289) | | | 475 | |
| Changes in operating assets and liabilities: | | | | | Changes in operating assets and liabilities: | |
| Accounts receivable-net | | 55,032 |
| | 54,591 |
| |
| Accounts receivable – net | | Accounts receivable – net | | 30,152 | | | 91,310 | |
| Other assets | | (1,761 | ) | | (21,926 | ) | Other assets | | (8,027) | | | (1,292) | |
| Accounts payable, accrued payroll and other liabilities | | 12,473 |
| | (45,546 | ) | Accounts payable, accrued payroll and other liabilities | | (54,170) | | | (64,019) | |
| Unexpired subscriptions | | 10,200 |
| | 3,461 |
| Unexpired subscriptions | | 9,394 | | | 11,255 | |
| Net cash provided by operating activities | | 147,895 |
| | 85,643 |
| Net cash provided by operating activities | | 110,434 | | | 118,590 | |
| Cash flows from investing activities | | | | | Cash flows from investing activities | | | | |
| Purchases of marketable securities | | (398,246 | ) | | (514,809 | ) | Purchases of marketable securities | | (326,996) | | | (278,773) | |
| Maturities of marketable securities | | 454,022 |
| | 522,655 |
| Maturities of marketable securities | | 293,053 | | | 228,938 | |
| Cash distribution from corporate-owned life insurance | | — |
| | 38,000 |
| |
| | Business acquisitions | | — |
| | (15,410 | ) | Business acquisitions | | 0 | | | (8,055) | |
| Purchase of investments – net of proceeds | | (422 | ) | | (1,840 | ) | |
| Change in restricted cash | | 7,014 |
| | 3,816 |
| |
| Sales of investments – net | | Sales of investments – net | | 271 | | | 4,074 | |
| Capital expenditures | | (47,831 | ) | | (21,820 | ) | Capital expenditures | | (14,677) | | | (21,510) | |
| Other-net | | 1,070 |
| | (380 | ) | Other-net | | 2,017 | | | 2,388 | |
| Net cash provided by investing activities | | 15,607 |
| | 10,212 |
| |
| Net cash used in investing activities | | Net cash used in investing activities | | (46,332) | | | (72,938) | |
| Cash flows from financing activities | | | | | Cash flows from financing activities | | | | |
| Long-term obligations: | | | | | Long-term obligations: | |
| Repayment of debt and capital lease obligations | | (414 | ) | | (460 | ) | |
| | Dividends paid | | (19,483 | ) | | (19,416 | ) | Dividends paid | | (21,825) | | | (18,359) | |
| | Capital shares: | | | | | Capital shares: | |
| Stock issuances | | 4,142 |
| | 273 |
| |
| Repurchases | | — |
| | (15,684 | ) | |
| Proceeds from stock option exercises | | Proceeds from stock option exercises | | 2,441 | | | 1,873 | |
| | Share-based compensation tax withholding | | (3,984 | ) | | (9,572 | ) | Share-based compensation tax withholding | | (10,901) | | | (11,706) | |
| Net cash used in financing activities | | (19,739 | ) | | (44,859 | ) | Net cash used in financing activities | | (30,285) | | | (28,192) | |
| Net increase in cash and cash equivalents | | 143,763 |
| | 50,996 |
| |
| Net increase in cash, cash equivalents and restricted cash | | Net increase in cash, cash equivalents and restricted cash | | 33,817 | | | 17,460 | |
| Effect of exchange rate changes on cash | | 212 |
| | 166 |
| Effect of exchange rate changes on cash | | (280) | | | 162 | |
| Cash and cash equivalents at the beginning of the period | | 100,692 |
| | 105,776 |
| |
| Cash and cash equivalents at the end of the period | | $ | 244,667 |
| | $ | 156,938 |
| |
| Cash, cash equivalents and restricted cash at the beginning of the period | | Cash, cash equivalents and restricted cash at the beginning of the period | | 301,964 | | | 247,518 | |
| Cash, cash equivalents and restricted cash at the end of the period | | Cash, cash equivalents and restricted cash at the end of the period | | $ | 335,501 | | | $ | 265,140 | |
See Notes to Condensed Consolidated Financial Statements.
THE NEW YORK TIMES COMPANY
NOTES TO THE CONDENSED CONSOLIDATED FINANCIAL STATEMENTS
(Unaudited)
NOTE 1. BASIS OF PRESENTATION
In the opinion of management of The New York Times Company (the “Company”), the Condensed Consolidated Financial Statements present fairly the financial position of the Company as of September 24, 2017June 27, 2021, and December 25, 2016,27, 2020, and the results of operations, changes in stockholders’ equity and cash flows of the Company for the periods ended September 24, 2017June 27, 2021, and September 25, 2016.June 28, 2020. The Company and its consolidated subsidiaries are referred to collectively as “we,” “us” or “our.” All adjustments necessary for a fair presentation have been included and are of a normal and recurring nature. All significant intercompany accounts and transactions have been eliminated in consolidation. The financial statements were prepared in accordance with the requirements of the Securities and Exchange Commission (“SEC”) for interim reporting. As permitted under those rules, certain notes or other financial information that are normally required by accounting principles generally accepted in the United States of America (“GAAP”) have been condensed or omitted from these interim financial statements. These financial statements, therefore, should be read in conjunction with the Consolidated Financial Statements and related Notes included in our Annual Report on Form 10-K for the year ended December 25, 2016.27, 2020. Due to the seasonal nature of our business, operating results for the interim periods are not necessarily indicative of a full year’s operations. The fiscal periods included herein comprise 13 and 26 weeks for the third quarter.second quarter and six months, respectively.
The preparation of financial statements in conformity with GAAP requires management to make estimates and assumptions that affect the amounts reported in our Condensed Consolidated Financial Statements. Actual results could differ from these estimates.
Certain prior period amounts have been reclassified to conform with the current period presentation. NOTE 2. SUMMARY OF SIGNIFICANT ACCOUNTING POLICIES
Except as described herein, as of September 24, 2017,June 27, 2021, our significant accounting policies, which are detailed in our Annual Report on Form 10-K for the year ended December 25, 2016,27, 2020, have not changed:
Marketable Securities
We have investments in marketable debt securities. We determine the appropriate classification of our investments at the date of purchase and reevaluate the classifications at the balance sheet date. Marketable debt securities with maturities of 12 months or less are classified as short-term. Marketable debt securities with maturities greater than 12 months are classified as long-term. Historically, we have accounted for all marketable securities as held-to-maturity (“HTM”) and stated at amortized cost as we had the intent and ability to hold our marketable debt securities until maturity. However, on June 29, 2017, our Board of Directors approved a change to the Company’s cash reserve investment policy to allow the Company to sell marketable securities prior to maturity. Beginning in the third quarter of 2017, the Company reclassified all marketable securities from HTM to available-for-sale (“AFS”).
Securities that we might not hold until maturity are classified as AFS securities and reported at fair value. Unrealized gains and losses, after applicable income taxes, are reported in accumulated other comprehensive income/(loss).
We conduct an other-than-temporary impairment (“OTTI”) analysis on a quarterly basis or more often if a potential loss-triggering event occurs. We consider factors such as the duration, severity and the reason for the decline in value, the potential recovery period and whether we intend to sell. For AFS securities, we also consider whether (i) it is more likely than not that we will be required to sell the debt securities before recovery of their amortized cost basis and (ii) the amortized cost basis cannot be recovered as a result of credit losses.
Other
As of the second quarter of 2017, the Company has renamed “circulation revenues” as “subscription revenues.” Subscription revenues consist of revenues from subscriptions to our print and digital products (including our news product, as well as Crossword and Cooking products), as well as single-copy sales of our print products (which comprise approximately 10% of these revenues). These revenues are based on both the number of copies of the printed newspaper sold and digital-only subscriptions, and the rates charged to the respective customers.changed materially.
Recently Adopted Accounting Pronouncements
In March 2016, the Financial Accounting Standards Board (“FASB”) issued Accounting Standards Update (“ASU”) 2016-09, “Compensation-Stock Compensation,” which provides guidance on accounting for share-based payment transactions, including the income tax consequences, classification of awards as either equity or liabilities, and classification on the statement of cash flows. This guidance became effective for the Company for fiscal years beginning after December 25, 2016.
As a result of the adoption of ASU 2016-09 in the first quarter of 2017, we recognized excess tax windfalls in income tax expense rather than additional paid-in capital of $0.1 million and $0.2 million for the quarter and nine months ended
THE NEW YORK TIMES COMPANY
NOTES TO THE CONDENSED CONSOLIDATED FINANCIAL STATEMENTS
(Unaudited)
September 24, 2017, respectively. Excess tax shortfalls and/or windfalls for share-based payments are now included in net cash from operating activities rather than net cash from financing activities. The changes have been applied prospectively in accordance with the ASU and prior periods have not been adjusted. Additionally, the presentation of employee taxes paid to taxing authorities for share-based transactions are now included in net cash from financing activities rather than net cash from operating activities. This change was applied retrospectively and as a result, we reclassified $9.6 million for the nine months ended September 25, 2016 in our Condensed Statement of Cash Flows from operating activities to financing activities. No other material changes resulted from the adoption of this standard. | | | | | | | | | | | |
| Accounting Standard Update(s) | Topic | Effective Period | Summary |
| 2019-12 | Simplifying the Accounting for Income Taxes (Topic 740) | Fiscal years, and interim periods within those fiscal years, beginning after December 15, 2020. Early adoption is permitted. | Simplifies the accounting for income taxes by eliminating certain exceptions to the guidance in Accounting Standards Codification 740 related to the approach for intraperiod tax allocation, the methodology for calculating income taxes in an interim period and the recognition of deferred tax liabilities for outside basis differences. The standard also simplifies aspects of the accounting for franchise taxes and enacted changes in tax laws or rates and clarifies the accounting for transactions that result in a step-up in the tax basis of goodwill. The Company adopted this guidance on December 28, 2020. The adoption did not have a material impact on the Company’s consolidated financial statements. |
Recently Issued Accounting Pronouncements
In March 2017, the FASB issued ASU 2017-07, “Compensation - Retirement Benefits (Topic 715): Improving the Presentation of Net Periodic Pension Cost and Net Periodic Postretirement Benefit Cost.” The new guidance requires the service cost component to be presented separately from the other components of net benefit costs. Service cost will be presented with other employee compensation cost within operations. The other components of net benefit cost, such as interest cost, amortization of prior service cost and gains or losses are required to be presented outside of operations. The new guidance is effective for fiscal years beginning after December 15, 2017, and interim periods within those fiscal years. Early adoption is permitted. The guidance should be applied retrospectively for the presentation of the service cost component in the income statement and allows a practical expedient for the estimation basis for applying the retrospective presentation requirements.
Since the changes required in ASU 2017-07 only change the Condensed Consolidated Statements of Operations classification of the components of net periodic benefit cost, no changes are expected to net income. Upon adoption of the ASU during the first quarter of 2018, the Company will separately present the components of net periodic benefit cost or income, excluding the service cost component, in non-operating expenses on a retrospective basis. The historical components of net periodic benefit cost are disclosed in the Company’s previously filed Quarterly Reports on Form 10-Q and its 2016 Annual Report on Form 10-K.
In June 2016, FASB issued ASU 2016-13, “Financial Instruments - Credit Losses.” The new guidance introduces an approach based on expected losses to estimate credit losses on certain types of financial instruments. It also modifies the impairment model for available-for-sale (AFS) debt securities and provides for a simplified accounting model for purchased financial assets with credit deterioration since their origination. The new guidance is effective for fiscal years beginning after December 15, 2019, and interim periods within those fiscal years. Early adoption is permitted for fiscal years beginning after December 15, 2018, and interim periods within those fiscal years. We are currently in the process of evaluating the impact of this guidance on our consolidated financial statements.
In February 2016, the FASB issued ASU 2016-02, “Leases,” which provides guidance on accounting for leases and disclosure of key information about leasing arrangements. The guidance requires lessees to recognize the following for all operating and finance leases at the commencement date: (1) a lease liability, which is the obligation to make lease payments arising from a lease, measured on a discounted basis and (2) a right-of-use asset representing the lessee’s right to use, or control the use of, the underlying asset for the lease term. A lessee is permitted to make an accounting policy election not to recognize lease assets and lease liabilities for short-term leases with a term of 12 months or less. The guidance does not fundamentally change lessor accounting; however, some changes have been made to align that guidance with the lessee guidance and other areas within GAAP. This guidance becomes effective for the Company for fiscal years beginning after December 30, 2018. Early application is permitted. This guidance will be applied on a modified retrospective basis for leases existing at, or entered into after, the earliest period presented in the financial statements. We are currently in the process of evaluating the impact of the new leasing guidance and expect that most of our operating lease commitments will be subject to the new standard. The adoption of the standard will require us to add right-of-use assets and lease liabilities onto our balance sheet. Based upon our initial evaluation, we do not expect the adoption of the standard to have a material effect on our results of operations and liquidity.
In January 2016, the FASB issued ASU 2016-01, “Financial Instruments-Overall: Recognition and Measurement of Financial Assets and Financial Liabilities” which addresses certain aspects of recognition, measurement, presentation, and disclosure of financial instruments including requirements to measure most equity investments at fair value with changes in fair value recognized in net income, to perform a qualitative assessment of equity investments without readily determinable fair values, and to separately present financial assets and liabilities by measurement category and by type of financial asset on the balance sheet or the accompanying notes to the financial statements. The new guidance is effective for fiscal years beginning after December 15, 2017, and interim periods within those fiscal years. Early adoption is permitted. We are currently in the process of evaluating the impact of this guidance on our consolidated financial statements.
In May 2014, the FASB issued ASU 2014-09, “Revenue from Contracts with Customers,” which prescribes a single comprehensive model for entities to use in the accounting for revenue arising from contracts with customers. The new guidance
THE NEW YORK TIMES COMPANY
NOTES TO THE CONDENSED CONSOLIDATED FINANCIAL STATEMENTS
(Unaudited)
will supersede virtually all existing revenue guidance under GAAP and International Financial Reporting Standards and is effective for fiscal years beginning after December 31, 2017. There are two transition options available to entities: the full retrospective approach or the modified retrospective approach. Under the full retrospective approach, the Company would restate prior periods in compliance with Accounting Standards Codification 250, “Accounting Changes and Error Corrections.” Alternatively, the Company may elect the modified retrospective approach, which allows for the new revenue standard to be applied to existing contracts as of the effective date with a cumulative catch-up adjustment recorded to retained earnings. We currently anticipate adopting the new standard using the modified retrospective method beginning January 1, 2018.
Subsequently, in March 2016, the FASB issued ASU 2016-08, “Revenue from Contracts with Customers (Topic 606): Principal versus Agent Considerations (Reporting Revenue Gross versus Net),” which clarifies the implementation guidance on principal versus agent considerations in ASU 2014-09. In April 2016, the FASB also issued ASU 2016-10, “Revenue from Contracts with Customers (Topic 606): Identifying Performance Obligations and Licensing,” to reduce the cost and complexity of applying the guidance on identifying promised goods or services when identifying a performance obligation and improve the operability and understandability of the licensing implementation guidance. In May 2016, the FASB issued ASU 2016-12, “Revenue from Contracts with Customers (Topic 606): Narrow Scope Improvements and Practical Expedients,” to reduce the cost and complexity of applying the guidance to address certain issues on assessing collectability, presentation of sales taxes, noncash consideration, and completed contracts and contract modifications at transition. The amendments in ASU 2014-09, 2016-10, and 2016-12 do not change the core principle of ASU 2014-09.
Based upon our initial evaluation, we do not expect the adoption of ASU 2014-09 to have a material effect on our financial condition or results of operations. While we continue to evaluate the impact of the new revenue guidance, we currently believe that the most significant changes will be primarily related to how we account for certain licensing arrangements in the other revenue category.
The Company considers the applicability and impact of all recently issued accounting pronouncements. Recent accounting pronouncements not specifically identified in our disclosures are either not applicable to the Company or are not expected to have a material effect on our financial condition or results of operations.
NOTE 3. REVENUE
We generate revenues principally from subscriptions and advertising. Subscription revenues consist of revenues from subscriptions to our digital and print products (which include our news product, as well as our Games, Cooking and Audm products) and single-copy and bulk sales of our print products. Subscription revenues are based on both the number of copies of the printed newspaper sold and digital-only subscriptions, and the rates charged to the respective customers.
Advertising revenue is principally from advertisers (such as technology, financial and luxury goods companies) promoting products, services or brands on digital platforms in the form of display ads, audio and video, and in print, in the form of column-inch ads. Advertising revenue is primarily derived from offerings sold directly to marketers by our advertising sales teams. A smaller proportion of our total advertising revenues is generated through programmatic auctions run by third-party ad exchanges. Advertising revenue is primarily determined by the volume (e.g., impressions), rate and mix of advertisements. Digital advertising includes our core digital advertising business and other digital advertising. Our core digital advertising business includes direct-sold website, mobile application, podcast, email and video advertisements. Direct-sold display
THE NEW YORK TIMES COMPANY
NOTES TO THE CONDENSED CONSOLIDATED FINANCIAL STATEMENTS
(Unaudited)
advertising, a component of core digital advertising, includes offerings on websites and mobile applications sold directly to marketers by our advertising sales teams. Other digital advertising includes open-market programmatic advertising and creative services fees. Print advertising includes revenue from column-inch ads and classified advertising, including line-ads as well as preprinted advertising, also known as freestanding inserts.
Other revenues primarily consist of revenues from licensing, Wirecutter affiliate referrals, the leasing of floors in the New York headquarters building located at 620 Eighth Avenue, New York, New York (the “Company Headquarters”), commercial printing, retail commerce, television and film, our student subscription sponsorship program and our live events business.
Subscription, advertising and other revenues were as follows:
| | | | | | | | | | | | | | | | | | | | | | | | | | | | | | | | | | | | | | | | | | | | | | | | | | |
| | For the Quarters Ended | | For the Six Months Ended |
| (In thousands) | | June 27, 2021 | | As % of total | | June 28, 2020 | | As % of total | | June 27, 2021 | | As % of total | | June 28, 2020 | | As % of total |
| Subscription | | $ | 339,217 | | | 68.1 | % | | $ | 293,189 | | | 72.6 | % | | $ | 668,301 | | | 68.8 | % | | $ | 578,623 | | | 68.3 | % |
| Advertising | | 112,774 | | | 22.6 | % | | 67,760 | | | 16.8 | % | | 209,890 | | | 21.6 | % | | 173,897 | | | 20.5 | % |
Other (1) | | 46,506 | | | 9.3 | % | | 42,801 | | | 10.6 | % | | 93,351 | | | 9.6 | % | | 94,866 | | | 11.2 | % |
| Total | | $ | 498,497 | | | 100.0 | % | | $ | 403,750 | | | 100.0 | % | | $ | 971,542 | | | 100.0 | % | | $ | 847,386 | | | 100.0 | % |
(1) Other revenues include building rental revenue, which is not under the scope of Revenue from Contracts with Customers (Topic 606). Building rental revenue was approximately $7 million for the secondquarters of 2021 and 2020, respectively, and approximately $13 million and $15 million for the first six months of 2021 and 2020, respectively.
The following table summarizes digital and print subscription revenues, which are components of subscription revenues above, for the second quarters and first six months ended June 27, 2021, and June 28, 2020:
| | | | | | | | | | | | | | | | | | | | | | | | | | |
| | For the Quarters Ended | | For the Six Months Ended |
| (In thousands) | | June 27, 2021 | | June 28, 2020 | | June 27, 2021 | | June 28, 2020 |
| Digital-only subscription revenues: | | | | | | | | |
News product subscription revenues(1) | | $ | 170,893 | | | $ | 132,922 | | | $ | 332,181 | | | $ | 251,880 | |
Other product subscription revenues(2) | | 19,252 | | | 13,062 | | | 37,564 | | | 24,114 | |
| Subtotal digital-only subscriptions | | 190,145 | | | 145,984 | | | 369,745 | | | 275,994 | |
| Print subscription revenues: | | | | | | | | |
Domestic home delivery subscription revenues(3) | | 134,755 | | | 132,971 | | | 269,150 | | | 266,708 | |
Single-copy, NYT International and other subscription revenues(4) | | 14,317 | | | 14,234 | | | 29,406 | | | 35,921 | |
| Subtotal print subscription revenues | | 149,072 | | | 147,205 | | | 298,556 | | | 302,629 | |
| Total subscription revenues | | $ | 339,217 | | | $ | 293,189 | | | $ | 668,301 | | | $ | 578,623 | |
(1) Includes revenues from subscriptions to the Company’s news product. News product subscription packages that include access to the Company’s Games and Cooking products are also included in this category. |
(2) Includes revenues from standalone subscriptions to the Company’s Games, Cooking and Audm products. |
(3) Includes free access to some of the Company’s digital products. |
(4) NYT International is the international edition of our print newspaper. |
The following table summarizes digital and print advertising revenues for the second quarters and first six months ended June 27, 2021, and June 28, 2020:
| | | | | | | | | | | | | | | | | | | | | | | | | | |
| | For the Quarters Ended | | For the Six Months Ended |
| (In thousands) | | June 27, 2021 | | June 28, 2020 | | June 27, 2021 | | June 28, 2020 |
| Advertising revenues: | | | | | | | | |
| Digital | | $ | 70,995 | | | $ | 39,531 | | | $ | 130,491 | | | $ | 90,689 | |
| Print | | 41,779 | | | 28,229 | | | 79,399 | | | 83,208 | |
| Total advertising | | $ | 112,774 | | | $ | 67,760 | | | $ | 209,890 | | | $ | 173,897 | |
THE NEW YORK TIMES COMPANY
NOTES TO THE CONDENSED CONSOLIDATED FINANCIAL STATEMENTS
(Unaudited)
Performance Obligations
We have remaining performance obligations related to digital archive and other licensing and certain advertising contracts. As of June 27, 2021, the aggregate amount of the transaction price allocated to the remaining performance obligations for contracts with a duration greater than one year was approximately $104 million. The Company will recognize this revenue as performance obligations are satisfied. We expect that approximately $24 million, $36 million and $44 million will be recognized in the remainder of 2021, 2022 and thereafter, respectively.
Contract Assets
As of June 27, 2021, and December 27, 2020, the Company had $1.9 million and $1.8 million, respectively, in contract assets recorded in the Condensed Consolidated Balance Sheets related to digital archiving licensing revenue. The contract asset is reclassified to Accounts receivable when the customer is invoiced based on the contractual billing schedule.
NOTE 3.4. MARKETABLE SECURITIES
As noted in Note 2, theThe Company reclassified allaccounts for its marketable securities from HTM to AFS in the third quarteras available for sale (“AFS”). The Company recorded $2.4 million and $4.3 million of 2017, following a change to the Company’s cash reserve investment policy that allows the Company to sell marketable securities prior to maturity. This change resulted in the recording of a $1.1 million net unrealized lossgains inAccumulated other comprehensive income. The reclassificationincome (“AOCI”) as of the investment portfolio to AFS was made to provide increased flexibility in the use of our investments to support current operations.June 27, 2021, and December 27, 2020, respectively.
THE NEW YORK TIMES COMPANY
NOTES TO THE CONDENSED CONSOLIDATED FINANCIAL STATEMENTS
(Unaudited)
The following table presentstables present the amortized cost, gross unrealized gains and losses, and fair market value of our AFS securities as of September 24, 2017:June 27, 2021, and December 27, 2020:
| | | | | | | | | | | | | | | | | | | | | | | | | | |
| | June 27, 2021 |
| (In thousands) | | Amortized Cost | | Gross unrealized gains | | Gross unrealized losses | | Fair Value |
| | | | | | | | |
| Short-term AFS securities | | | | | | | | |
| Corporate debt securities | | $ | 110,415 | | | $ | 496 | | | $ | (12) | | | $ | 110,899 | |
| Certificates of deposit | | 105,954 | | | 0 | | | 0 | | | 105,954 | |
| U.S. Treasury securities | | 74,984 | | | 547 | | | (3) | | | 75,528 | |
| U.S. governmental agency securities | | 26,137 | | | 16 | | | 0 | | | 26,153 | |
| Commercial paper | | 19,921 | | | 0 | | | 0 | | | 19,921 | |
| Total short-term AFS securities | | $ | 337,411 | | | $ | 1,059 | | | $ | (15) | | | $ | 338,455 | |
| Long-term AFS securities | | | | | | | | |
| Corporate debt securities | | $ | 161,767 | | | $ | 725 | | | $ | (123) | | | $ | 162,369 | |
| U.S. Treasury securities | | 60,377 | | | 861 | | | (15) | | | 61,223 | |
| U.S. governmental agency securities | | 51,591 | | | 6 | | | (67) | | | 51,530 | |
| Municipal securities | | 12,142 | | | 7 | | | (6) | | | 12,143 | |
| Total long-term AFS securities | | $ | 285,877 | | | $ | 1,599 | | | $ | (211) | | | $ | 287,265 | |
| | | | | | | | | | | | | | | | | | | | | | | | | | |
| | December 27, 2020 |
| (In thousands) | | Amortized Cost | | Gross unrealized gains | | Gross unrealized losses | | Fair Value |
| | | | | | | | |
| Short-term AFS securities | | | | | | | | |
| Corporate debt securities | | $ | 129,805 | | | $ | 504 | | | $ | (8) | | | $ | 130,301 | |
| Certificates of deposit | | 36,525 | | | 0 | | | 0 | | | 36,525 | |
| U.S. Treasury securities | | 79,467 | | | 39 | | | (3) | | | 79,503 | |
| U.S. governmental agency securities | | 25,113 | | | 61 | | | (3) | | | 25,171 | |
| Commercial paper | | 37,580 | | | 0 | | | 0 | | | 37,580 | |
| | | | | | | | |
| Total short-term AFS securities | | $ | 308,490 | | | $ | 604 | | | $ | (14) | | | $ | 309,080 | |
| Long-term AFS securities | | | | | | | | |
| Corporate debt securities | | $ | 134,296 | | | $ | 1,643 | | | $ | (5) | | | $ | 135,934 | |
| U.S. Treasury securities | | 95,511 | | | 2,054 | | | 0 | | | 97,565 | |
| U.S. governmental agency securities | | 48,342 | | | 19 | | | (13) | | | 48,348 | |
| Municipal securities | | 4,994 | | | 0 | | | (10) | | | 4,984 | |
| Total long-term AFS securities | | $ | 283,143 | | | $ | 3,716 | | | $ | (28) | | | $ | 286,831 | |
|
| | | | | | | | | | | | | | | | |
| | | September 24, 2017 |
| (In thousands) | | Amortized Cost | | Gross unrealized gains | | Gross unrealized losses | | Fair Value |
| Short-term AFS securities | | | | | | | | |
| U.S Treasury securities | | $ | 73,220 |
| | $ | — |
| | $ | (45 | ) | | $ | 73,175 |
|
| Corporate debt securities | | 156,683 |
| | 35 |
| | (79 | ) | | 156,639 |
|
| U.S. governmental agency securities | | 53,842 |
| | 1 |
| | (89 | ) | | 53,754 |
|
| Certificates of deposit | | 20,403 |
| | — |
| | — |
| | 20,403 |
|
| Commercial paper | | 32,471 |
| | — |
| | — |
| | 32,471 |
|
| Total short-term AFS securities | | $ | 336,619 |
| | $ | 36 |
| | $ | (213 | ) | | $ | 336,442 |
|
| Long-term AFS securities | | | | | | | |
|
| U.S. governmental agency securities | | $ | 97,431 |
| | $ | 2 |
| | $ | (616 | ) | | 96,817 |
|
| Corporate debt securities | | 97,583 |
| | 21 |
| | (259 | ) | | 97,345 |
|
| U.S Treasury securities | | 47,672 |
| | — |
| | (52 | ) | | 47,620 |
|
| Total long-term AFS securities | | $ | 242,686 |
| | $ | 23 |
| | $ | (927 | ) | | $ | 241,782 |
|
THE NEW YORK TIMES COMPANY
NOTES TO THE CONDENSED CONSOLIDATED FINANCIAL STATEMENTS
(Unaudited)
The following table representstables represent the AFS securities as of September 24, 2017June 27, 2021, and December 27, 2020, that were in an unrealized loss position for which an allowance for credit losses has not been recorded, aggregated by investment category and the length of time that individual securities have been in a continuous unrealized loss position:
| | | | | | | | | | | | | | | | | | | | | | | | | | | | | | | | | | | | | | |
| | June 27, 2021 |
| | Less than 12 Months | | 12 Months or Greater | | Total |
| (In thousands) | | Fair Value | | Gross unrealized losses | | Fair Value | | Gross unrealized losses | | Fair Value | | Gross unrealized losses |
| | | | | | | | | | | | |
| Short-term AFS securities | | | | | | | | | | | | |
| Corporate debt securities | | $ | 28,033 | | | $ | (12) | | | $ | 0 | | | $ | 0 | | | $ | 28,033 | | | $ | (12) | |
| U.S. Treasury securities | | 22,670 | | | (3) | | | 0 | | | 0 | | | 22,670 | | | (3) | |
| | | | | | | | | | | | |
| | | | | | | | | | | | |
| Total short-term AFS securities | | $ | 50,703 | | | $ | (15) | | | $ | 0 | | | $ | 0 | | | $ | 50,703 | | | $ | (15) | |
| Long-term AFS securities | | | | | | | | | | | | |
| Corporate debt securities | | $ | 50,552 | | | $ | (123) | | | $ | 0 | | | $ | 0 | | | $ | 50,552 | | | $ | (123) | |
| U.S. Treasury securities | | 11,212 | | | (15) | | | 0 | | | 0 | | | 11,212 | | | (15) | |
| U.S. governmental agency securities | | 42,428 | | | (67) | | | 0 | | | 0 | | | 42,428 | | | (67) | |
| Municipal securities | | 5,141 | | | (6) | | | 0 | | | 0 | | | 5,141 | | | (6) | |
| Total long-term AFS securities | | $ | 109,333 | | | $ | (211) | | | $ | 0 | | | $ | 0 | | | $ | 109,333 | | | $ | (211) | |
| | | | | September 24, 2017 | | December 27, 2020 |
| | | Less than 12 Months | | 12 Months or Greater | | Total | | Less than 12 Months | | 12 Months or Greater | | Total |
(In thousands)
| | Fair Value | | Gross unrealized losses | | Fair Value | | Gross unrealized losses | | Fair Value | | Gross unrealized losses | (In thousands) | | Fair Value | | Gross unrealized losses | | Fair Value | | Gross unrealized losses | | Fair Value | | Gross unrealized losses |
| | Short-term AFS securities | | | | | | | | | | | | | Short-term AFS securities | | | | | | | | | | | | |
| U.S Treasury securities | | $ | 73,175 |
| | $ | (45 | ) | | $ | — |
| | $ | — |
| | $ | 73,175 |
| | $ | (45 | ) | |
| Corporate debt securities | | 101,648 |
| | (77 | ) | | 2,500 |
| | (2 | ) | | 104,148 |
| | (79 | ) | Corporate debt securities | | $ | 33,735 | | | $ | (8) | | | $ | 0 | | | $ | 0 | | | $ | 33,735 | | | $ | (8) | |
| U.S. Treasury securities | | U.S. Treasury securities | | 20,133 | | | (3) | | | 0 | | | 0 | | | 20,133 | | | (3) | |
| U.S. governmental agency securities | | 42,490 |
| | (53 | ) | | 8,964 |
| | (36 | ) | | 51,454 |
| | (89 | ) | U.S. governmental agency securities | | 4,999 | | | (2) | | | 8,749 | | | (1) | | | 13,748 | | | (3) | |
| | Total short-term AFS securities | | $ | 217,313 |
| | $ | (175 | ) | | $ | 11,464 |
| | $ | (38 | ) | | $ | 228,777 |
| | $ | (213 | ) | Total short-term AFS securities | | $ | 58,867 | | | $ | (13) | | | $ | 8,749 | | | $ | (1) | | | $ | 67,616 | | | $ | (14) | |
| Long-term AFS securities | | | | | | | | | | | | | Long-term AFS securities | | | | | | | | | | | | |
| Corporate debt securities | | Corporate debt securities | | $ | 6,717 | | | $ | (5) | | | $ | 0 | | | $ | 0 | | | $ | 6,717 | | | $ | (5) | |
| | U.S. governmental agency securities | | $ | 47,620 |
| | $ | (312 | ) | | $ | — |
| | (304 | ) | | $ | 47,620 |
| | $ | (616 | ) | U.S. governmental agency securities | | 26,236 | | | (13) | | | 0 | | | 0 | | | 26,236 | | | (13) | |
| Corporate debt securities | | 66,428 |
| | (196 | ) | | 8,918 |
| | (63 | ) | | 75,346 |
| | (259 | ) | |
| U.S Treasury securities | | 53,142 |
| | (52 | ) | | 39,697 |
| | — |
| | 92,839 |
| | (52 | ) | |
| Municipal securities | | Municipal securities | | 4,984 | | | (10) | | | 0 | | | 0 | | | 4,984 | | | (10) | |
| Total long-term AFS securities | | $ | 167,190 |
| | $ | (560 | ) | | $ | 48,615 |
| | $ | (367 | ) | | $ | 215,805 |
| | $ | (927 | ) | Total long-term AFS securities | | $ | 37,937 | | | $ | (28) | | | $ | 0 | | | $ | 0 | | | $ | 37,937 | | | $ | (28) | |
We periodically review ourassess AFS securities for OTTI. See Note 2 for factors we consider when assessing AFS securities for OTTI. on a quarterly basis or more often if a potential loss-triggering event occurs.
As of September 24, 2017,June 27, 2021, and December 27, 2020, we did not intend to sell and it was not likely that we would be required to sell these investments before recovery of their amortized cost basis, which may be at maturity. Unrealized losses related to these investments are primarily due to interest rate fluctuations as opposed to changes in credit quality. Therefore, as of September 24, 2017,June 27, 2021, and December 27, 2020, we have recognized no OTTI loss.
The following table presents the amortized cost of our HTM securities as of December 25, 2016: |
| | | | |
| | | December 25, 2016 |
(In thousands)
| | Amortized Cost |
Short-term HTM securities (1) | | |
| U.S Treasury securities | | $ | 150,623 |
|
| Corporate debt securities | | 150,599 |
|
| U.S. governmental agency securities | | 64,135 |
|
| Commercial paper | | 84,178 |
|
| Total short-term HTM securities | | $ | 449,535 |
|
Long-term HTM securities (1) | |
|
| U.S. governmental agency securities | | $ | 110,732 |
|
| Corporate debt securities | | 61,775 |
|
| U.S Treasury securities | | 14,792 |
|
| Total long-term HTM securities | | $ | 187,299 |
|
(1) All HTM securities were recorded at amortized cost and not adjusted0 losses or allowance for credit losses related to fair value in accordance with the HTM accounting treatment. As of December 25, 2016, the amortized cost approximated fair value because of the short-term maturity and highly liquid nature of these investments.AFS securities.
As of September 24, 2017,June 27, 2021, and December 27, 2020, our short-term and long-term marketable securities had remaining maturities of less than 1one month to 12 months and 13 months to 3436 months, respectively. See Note 8 for additionalmore information regarding the fair value of our marketable securities.
THE NEW YORK TIMES COMPANY
NOTES TO THE CONDENSED CONSOLIDATED FINANCIAL STATEMENTS
(Unaudited)
NOTE 4.5. GOODWILL AND INTANGIBLES
In 2016, the Company acquired two digital marketing agencies, HelloSociety, LLC and Fake Love, LLC for an aggregate of $15.4 million in separate all-cash transactions. Also in 2016, the Company acquired Submarine Leisure Club, Inc., which owned the product review and recommendation websites The Wirecutter and The Sweethome, in an all-cash transaction. We paid $25.0 million, including a payment made for a non-compete agreement, and also entered into a consulting agreement and retention agreements that will likely require payments over the three years following the acquisition.
The Company allocated the purchase prices for these acquisitions based on the final valuation of assets acquired and liabilities assumed, resulting in allocations to goodwill, intangibles, property, plant and equipment and other miscellaneous assets.
The aggregate carrying amount of intangible assets of $8.6 million related to these acquisitions has been included in “Miscellaneous Assets” in our Condensed Consolidated Balance Sheets. The estimated useful lives for these assets range from 3 to 7 years and are amortized on a straight-line basis.
The changes in the carrying amount of goodwill as of September 24, 2017,June 27, 2021, and since December 25, 2016,27, 2020, were as follows:
|
| | | | |
| (In thousands) | | Total Company |
| Balance as of December 25, 2016 | | $ | 134,517 |
|
Measurement period adjustment (1) | | (198 | ) |
| Foreign currency translation | | 8,852 |
|
| Balance as of September 24, 2017 | | $ | 143,171 |
|
(1)Includes measurement period adjustment in connection with the Submarine Leisure Club, Inc. acquisition. | | | | | | | | |
| (In thousands) | | Total Company |
| Balance as of December 27, 2020 | | $ | 171,657 | |
| Foreign currency translation | | (1,501) | |
| Balance as of June 27, 2021 | | $ | 170,156 | |
The foreign currency translation line item reflects changes in goodwill resulting from fluctuating exchange rates related to the consolidation of certain international subsidiaries.
The aggregate carrying amount of intangible assets of $15.2 million is included in Miscellaneous assets in our Condensed Consolidated Balance Sheets as of June 27, 2021. NOTE 5.6. INVESTMENTS
Non-Marketable Equity Method InvestmentsSecurities
Our non-marketable equity securities are investments in privately held companies/funds without readily determinable market values. Gains and losses on non-marketable securities sold or impaired are recognized in Interest income and other, net.
As of September 24, 2017,June 27, 2021, and December 27, 2020, non-marketable equity securities included in Miscellaneous assets in our investments in joint ventures totaled $20.5Condensed Consolidated Balance Sheets had a carrying value of $20.6 million and we had equity ownership interests in the following entities:
|
| | | |
Company | | Approximate %
Ownership
|
Donohue Malbaie Inc. | | 49 | % |
Madison Paper Industries | | 40 | % |
We have investments in Donohue Malbaie Inc. (“Malbaie”), a Canadian newsprint company, and Madison Paper Industries (“Madison”), a partnership that previously operated a supercalendered paper mill in Maine. In the third quarter of 2017, we sold our 30% ownership in Women in the World Media, LLC, a live event conference business, for a nominal amount.
The Company and UPM-Kymmene Corporation (“UPM”), a Finnish paper manufacturing company, are partners through subsidiary companies in Madison. The Company’s 40% ownership of Madison is through an 80%-owned consolidated subsidiary which owns 50% of Madison. UPM owns 60% of Madison, including a 10% interest through a 20% noncontrolling interest in the consolidated subsidiary of the Company. The paper mill was closed in May 2016.$20.9 million, respectively. During the first quartersix months of 2016,2020, we recognizedrecorded a $41.4$10.1 million loss from joint venturesgain related to a non-marketable equity investment transaction. The gain is comprised of $2.5 million realized gain due to the closure. The Company’s proportionate sharepartial sale of the loss was $20.1investment and a $7.6 million after tax and net of noncontrolling interest. As a resultunrealized gain due to the mark to market of the mill closure, we wroteremaining investment, and is included in Interest income and other, net in our investment down to zero.Condensed Consolidated Statements of Operations.
The Company’s joint venture
NOTE 7. OTHER
Capitalized Computer Software Costs
Amortization of capitalized computer software costs included in Madison is currently being liquidated. In the fourth quarterDepreciation and amortization in our Condensed Consolidated Statements of 2016, Madison sold certain assets at the mill siteOperations were $2.4 million and we recognized a gain of $3.9 million in the second quarters of 2021 and 2020, respectively, and $5.0 million and $7.7 million in the first six months of 2021 and 2020, respectively.
Interest income and other, net
Interest income and other, net, as shown in the accompanying Condensed Consolidated Statements of Operations was as follows:
| | | | | | | | | | | | | | | | | | | | | | | | | | |
| | For the Quarters Ended | | For the Six Months Ended |
| (In thousands) | | June 27, 2021 | | June 28, 2020 | | June 27, 2021 | | June 28, 2020 |
Interest income and other expense, net (1) | | $ | 2,053 | | | $ | 2,965 | | | $ | 3,743 | | | $ | 17,004 | |
| Interest expense | | (180) | | | (179) | | | (359) | | | (364) | |
| | | | | | | | |
| | | | | | | | |
| Total interest income and other, net | | $ | 1,873 | | | $ | 2,786 | | | $ | 3,384 | | | $ | 16,640 | |
(1) The six months ended June 28, 2020 includes a $10.1 million gain related to the sale. In the third quarter of 2017, Madison sold the remaining assets at the mill site (which primarily consisted of hydro power assets), and the Company recognized a gain of $30.1 million related to this sale. The Company’s proportionate share of the gain was $16.1 million after tax and net of noncontrolling interest.
non-marketable equity investment transaction.
THE NEW YORK TIMES COMPANY
NOTES TO THE CONDENSED CONSOLIDATED FINANCIAL STATEMENTS
(Unaudited)
Restricted Cash
The following table presents summarized income statement information for Madison, which follows a calendar year:
|
| | | | | | | | | | | | | | | | |
| | | For the Quarters Ended | | For the Nine Months Ended |
| (In thousands) | | September 30, 2017 |
| | September 30, 2016 |
| | September 30, 2017 |
| | September 30, 2016 |
|
| Revenues | | $ | — |
| | $ | — |
| | $ | — |
| | $ | 40,523 |
|
| Expenses: | | | | | | | | |
| Cost of sales | | (105 | ) | | (1,450 | ) | | (1,277 | ) | | (68,039 | ) |
| General and administrative income/(expense) and other | | 60,216 |
| | (566 | ) | | 59,662 |
| | (66,056 | ) |
| Total costs and expenses | | 60,111 |
| | (2,016 | ) | | 58,385 |
| | (134,095 | ) |
| Operating income/(loss) | | 60,111 |
| | (2,016 | ) | | 58,385 |
| | (93,572 | ) |
| Other (expense)/income | | (1 | ) | | 2 |
| | (7 | ) | | 4 |
|
| Net income/(loss) | | $ | 60,110 |
| | $ | (2,014 | ) | | $ | 58,378 |
| | $ | (93,568 | ) |
We received no distributionsA reconciliation of cash, cash equivalents and restricted cash as of June 27, 2021, and December 27, 2020, from our equity method investments during the quarters and nine months ended September 24, 2017 and September 25, 2016.
We purchase newsprint from Malbaie, and previously purchased supercalendered paper from Madison, at competitive prices. These purchases totaled $2.3 million and $3.7 million for the third quarters ended September 24, 2017, and September 25, 2016, respectively, and $7.7 million and $10.3 million for the nine-month periods ended September 24, 2017, and September 25, 2016, respectively.
Cost Method Investments
The aggregate carrying amounts of cost method investments included in “Miscellaneous assets’’ in our Condensed Consolidated Balance Sheets were $14.0 million and $13.6 million for September 24, 2017 and December 25, 2016, respectively.
NOTE 6. DEBT OBLIGATIONS
Our indebtedness consisted ofto the repurchase option related to a sale-leaseback of a portion of our New York headquarters. Our total debt and capital lease obligations consisted of the following:
|
| | | | | | | | |
| (In thousands) | | September 24, 2017 |
| | December 25, 2016 |
|
| Option to repurchase ownership interest in headquarters building in 2019: | | | | |
| Principal amount | | $ | 250,000 |
| | $ | 250,000 |
|
| Less unamortized discount based on imputed interest rate of 13.0% | | 7,423 |
| | 9,801 |
|
| Total option to repurchase ownership interest in headquarters building in 2019 | | 242,577 |
| | 240,199 |
|
| Capital lease obligations | | 6,798 |
| | 6,779 |
|
| Total long-term debt and capital lease obligations | | $ | 249,375 |
| | $ | 246,978 |
|
See Note 8 for additional information regarding the fair value of our long-term debt.
“Interest expense, net,” as shown in the accompanying Condensed Consolidated Statements of Operations wasCash Flows is as follows:
| | | | | | | | | | | | | | |
| (In thousands) | | June 27, 2021 | | December 27, 2020 |
| Reconciliation of cash, cash equivalents and restricted cash | | | | |
| Cash and cash equivalents | | $ | 320,871 | | | $ | 286,079 | |
| Restricted cash included within other current assets | | 299 | | | 686 | |
| Restricted cash included within miscellaneous assets | | 14,331 | | | 15,199 | |
| Total cash, cash equivalents and restricted cash shown in the Condensed Consolidated Statements of Cash Flows | | $ | 335,501 | | | $ | 301,964 | |
|
| | | | | | | | | | | | | | | | |
| | | For the Quarters Ended | | For the Nine Months Ended |
| (In thousands) | | September 24, 2017 |
| | September 25, 2016 |
| | September 24, 2017 |
| | September 25, 2016 |
|
| Interest expense | | $ | 6,956 |
| | $ | 10,022 |
| | $ | 20,775 |
| | $ | 29,964 |
|
| Amortization of debt costs and discount on debt | | 801 |
| | 1,226 |
| | 2,379 |
| | 3,670 |
|
| Capitalized interest | | (345 | ) | | (131 | ) | | (852 | ) | | (412 | ) |
| Interest income | | (2,752 | ) | | (2,085 | ) | | (7,184 | ) | | (6,267 | ) |
| Total interest expense, net | | $ | 4,660 |
| | $ | 9,032 |
| | $ | 15,118 |
| | $ | 26,955 |
|
Revolving Credit Facility
12In September 2019, the Company entered into a $250.0 million five-year unsecured revolving credit facility (the “Credit Facility”). Certain of the Company’s domestic subsidiaries have guaranteed the Company’s obligations under the Credit Facility. Borrowings under the Credit Facility bear interest at specified rates based on our utilization and consolidated leverage ratio. The Credit Facility contains various customary affirmative and negative covenants. In addition, the Company is obligated to pay a quarterly unused commitment fee of 0.20%.
As of June 27, 2021, there were 0 outstanding borrowings under the Credit Facility and the Company was in compliance with the financial covenants contained in the documents governing the Credit Facility. THE NEW YORK TIMES COMPANYSeverance Costs
NOTES TO THE CONDENSED CONSOLIDATED FINANCIAL STATEMENTS
(Unaudited)
NOTE 7. OTHER
Advertising Expenses
Advertising expenses incurred to promote our brand, subscription productsWe recognized 0 severance costs in the second quarter of 2021 and marketing services were $26.6$6.3 million in severance costs in the second quarter of 2020, and $0.4 million and $22.3 million in the third quarters of 2017 and 2016, respectively, and $86.0 million and $63.6$6.7 million in the first ninesix months of 20172021 and 2016,2020, respectively.
Capitalized Computer Software Costs
Amortization of capitalized computer software These costs includedare recorded in “DepreciationGeneral and amortization”administrative costs in our Condensed Consolidated Statements of Operations were $4.0 million and $2.8 million in the third quarters of 2017 and 2016, respectively, and $9.7 million and $8.5 million in the first nine months of 2017 and 2016, respectively.Operations.
Headquarters Redesign and Consolidation
In December 2016, we announced plans to redesign our headquarters building, consolidate our space within a smaller number of floors and lease the additional floors to third parties. These changes are expected to generate additional rental income and result in a more collaborative workspace. We incurred $2.5 million and $6.9 million of total costs related to these measures in the third quarter and first nine months of 2017, respectively. The capital expenditures related to these measures were approximately $26 million and $37 million in the third quarter and the first nine months of 2017, respectively.
Severance Costs
On May 31, 2017, we announced certain measures in our newsroom designed to streamline our editing process and allow us to make further investments in the newsroom. These measures resulted in a workforce reduction primarily affecting our newsroom. We recognized severance costs of $2.1 million in the third quarter of 2017 and $23.0 million in the first nine months of 2017, substantially all of which were related to this workforce reduction. We recognized severance costs of $13.0 million in the third quarter of 2016 and $18.3 million in the first nine months of 2016. These costs are recorded in “Selling, general and administrative costs” in our Condensed Consolidated Statements of Operations.
Additionally, during the second quarter of 2016, we announced certain measures to streamline our international print operations and support future growth efforts. These measures included a redesign of our international print newspaper and the relocation of certain editing and production operations conducted in Paris to our locations in Hong Kong and New York. During the third and second quarters of 2016, we incurred $2.9 million and $11.9 million, respectively, of total costs related to the measures, primarily related to relocation and severance charges. These costs were recorded in “Restructuring charge” in our Condensed Consolidated Statements of Operations.
We had a severance liability of $25.2$2.4 million and $23.2$5.0 million included in “AccruedAccrued expenses and other”other in our Condensed Consolidated Balance Sheets as of September 24, 2017,June 27, 2021, and December 25, 2016,27, 2020, respectively. We anticipate most of the expenditures will be recognized within the next twelve months.
NOTE 8. FAIR VALUE MEASUREMENTS
Fair value is the price that would be received upon the sale of an asset or paid upon transfer of a liability in an orderly transaction between market participants at the measurement date. The transaction would be in the principal or most advantageous market for the asset or liability, based on assumptions that a market participant would use in pricing the asset or liability. The fair value hierarchy consists of three levels:
Level 1–quoted prices in active markets for identical assets or liabilities that the reporting entity has the ability to access at the measurement date;
Level 2–inputs other than quoted prices included within Level 1 that are observable for the asset or liability, either directly or indirectly; and
Level 3–unobservable inputs for the asset or liability.
THE NEW YORK TIMES COMPANY
NOTES TO THE CONDENSED CONSOLIDATED FINANCIAL STATEMENTS
(Unaudited)
Assets/Liabilities Measured and Recorded at Fair Value on a Recurring Basis
The following table summarizes our financial assets and liabilities measured at fair value on a recurring basis as of September 24, 2017,June 27, 2021, and December 25, 2016:27, 2020:
| | | | | | | | | | | | | | | | | | | | | | | | | | | | | | | | | | | | | | | | | | | | | | | | | | |
| (In thousands) | | June 27, 2021 | | December 27, 2020 |
| Total | | Level 1 | | Level 2 | | Level 3 | | Total | | Level 1 | | Level 2 | | Level 3 |
| Assets: | | | | | | | | | | | | | | | | |
Short-term AFS securities (1) | | | | | | | | | | | | | | | | |
| Corporate debt securities | | $ | 110,899 | | | $ | 0 | | | $ | 110,899 | | | $ | 0 | | | $ | 130,301 | | | $ | 0 | | | $ | 130,301 | | | $ | 0 | |
| Certificates of deposit | | 105,954 | | | 0 | | | 105,954 | | | 0 | | | 36,525 | | | 0 | | | 36,525 | | | 0 | |
| U.S. Treasury securities | | 75,528 | | | 0 | | | 75,528 | | | 0 | | | 79,503 | | | 0 | | | 79,503 | | | 0 | |
| U.S. governmental agency securities | | 26,153 | | | 0 | | | 26,153 | | | 0 | | | 25,171 | | | 0 | | | 25,171 | | | 0 | |
| Commercial paper | | 19,921 | | | 0 | | | 19,921 | | | 0 | | | 37,580 | | | 0 | | | 37,580 | | | 0 | |
| Total short-term AFS securities | | $ | 338,455 | | | $ | 0 | | | $ | 338,455 | | | $ | 0 | | | $ | 309,080 | | | $ | 0 | | | $ | 309,080 | | | $ | 0 | |
Long-term AFS securities (1) | | | | | | | | | | | | | | | | |
| Corporate debt securities | | $ | 162,369 | | | $ | 0 | | | $ | 162,369 | | | $ | 0 | | | $ | 135,934 | | | $ | 0 | | | $ | 135,934 | | | $ | 0 | |
| U.S. Treasury securities | | 61,223 | | | 0 | | | 61,223 | | | 0 | | | 97,565 | | | 0 | | | 97,565 | | | 0 | |
| U.S. governmental agency securities | | 51,530 | | | 0 | | | 51,530 | | | 0 | | | 48,348 | | | 0 | | | 48,348 | | | 0 | |
| Municipal securities | | 12,143 | | | 0 | | | 12,143 | | | 0 | | | 4,984 | | | 0 | | | 4,984 | | | 0 | |
| Total long-term AFS securities | | $ | 287,265 | | | $ | 0 | | | $ | 287,265 | | | $ | 0 | | | $ | 286,831 | | | $ | 0 | | | $ | 286,831 | | | $ | 0 | |
| Liabilities: | | | | | | | | | | | | | | | | |
Deferred compensation (2)(3) | | $ | 19,754 | | | $ | 19,754 | | | $ | 0 | | | $ | 0 | | | $ | 22,245 | | | $ | 22,245 | | | $ | 0 | | | $ | 0 | |
| Contingent consideration | | $ | 7,450 | | | $ | 0 | | | $ | 0 | | | $ | 7,450 | | | $ | 8,431 | | | $ | 0 | | | $ | 0 | | | $ | 8,431 | |
|
| | | | | | | | | | | | | | | | | | | | | | | | | | | | | | | | |
| (In thousands) | | September 24, 2017 | | December 25, 2016 (3) |
| | Total | | Level 1 | | Level 2 | | Level 3 | | Total | | Level 1 | | Level 2 | | Level 3 |
| Assets: | | | | | | | | | | | | | | | | |
Short-term AFS securities (1) | | | | | | | | | | | | | | | | |
| U.S Treasury securities | | $ | 73,175 |
| | $ | — |
| | $ | 73,175 |
| | $ | — |
| | $ | — |
| | $ | — |
| | $ | — |
| | $ | — |
|
| Corporate debt securities | | 156,639 |
| | — |
| | 156,639 |
| | — |
| | — |
| | — |
| | — |
| | — |
|
| U.S. governmental agency securities | | 53,754 |
| | — |
| | 53,754 |
| | — |
| | — |
| | — |
| | — |
| | — |
|
| Certificates of deposit | | 20,403 |
| | — |
| | 20,403 |
| | — |
| | — |
| | — |
| | — |
| | — |
|
| Commercial paper | | 32,471 |
| | — |
| | 32,471 |
| | — |
| | — |
| | — |
| | — |
| | — |
|
| Total short-term AFS securities | | $ | 336,442 |
| | $ | — |
| | $ | 336,442 |
| | $ | — |
| | $ | — |
| | $ | — |
| | $ | — |
| | $ | — |
|
Long-term AFS securities (1) | |
| |
| |
| |
| |
| |
| |
| |
|
| U.S. governmental agency securities | | $ | 96,817 |
| | $ | — |
| | $ | 96,817 |
| | $ | — |
| | $ | — |
| | $ | — |
| | $ | — |
| | $ | — |
|
| Corporate debt securities | | 97,345 |
| | — |
| | 97,345 |
| | — |
| | — |
| | — |
| | — |
| | — |
|
| U.S Treasury securities | | 47,620 |
| | — |
| | 47,620 |
| | — |
| | — |
| | — |
| | — |
| | — |
|
| Total long-term AFS securities | | $ | 241,782 |
| | $ | — |
| | $ | 241,782 |
| | $ | — |
| | $ | — |
| | $ | — |
| | $ | — |
| | $ | — |
|
| Liabilities: | | | | | | | | | | | | | | | | |
Deferred compensation (2) | | $ | 28,354 |
| | $ | 28,354 |
| | $ | — |
| | $ | — |
| | $ | 31,006 |
| | $ | 31,006 |
| | $ | — |
| | $ | — |
|
(1)Our marketable securities, which include U.S. Treasury securities, corporate debt securities, U.S. government agency securities, municipal securities, certificates of deposit and commercial paper, are recorded at fair value (see Note 3). We classified these investments as Level 2 since the fair value is based on market observable inputs for investments with similar terms and maturities.
(2)The deferred compensation liability, included in “OtherOther liabilities—Other”other in our Condensed Consolidated Balance Sheets, consists of deferrals under The New York Times Company Deferred Executive Compensation Plan (the “DEC”), which enablespreviously enabled certain eligible executives to elect to defer a portion of their compensation on a pre-tax basis. The deferred amounts are invested at the executives’ option in various mutual funds. The fair value of deferred compensation is based on the mutual fund investments elected by the executives and on quoted prices in active markets for identical assets. Participation in the DEC was frozen effective December 31, 2015.
(3)The Company invests the assets associated with the deferred compensation liability in life insurance products. Our investments in life insurance products are included in Miscellaneous assets in our Condensed Consolidated Balance Sheets, and were $51.1 million as of June 27, 2021, and $49.2 million as of December 27, 2020. The fair value of these assets is measured using the net asset value per share (or its equivalent) and has not been classified in the fair value hierarchy.
THE NEW YORK TIMES COMPANY
NOTES TO THE CONDENSED CONSOLIDATED FINANCIAL STATEMENTS
(Unaudited)
Level 3 Liabilities
The contingent consideration liability is related to the 2020 acquisition of substantially all the assets and certain liabilities of Serial Productions, LLC (the “Serial acquisition”) and represents contingent payments based on the achievement of certain operational targets, as defined in the acquisition agreement, over the 5 years following the acquisition. The Company estimated the fair value using a probability-weighted discounted cash flow model. The estimate of the fair value of contingent consideration requires subjective assumptions to be made regarding probabilities assigned to operational targets and the discount rate. As notedthe fair value is based on significant unobservable inputs, this is a Level 3 liability.
The following table presents changes in Note 2, inthe contingent consideration balances for the quarter and six months ended June 27, 2021:
| | | | | | | | | | | | | | |
| | Quarter ended | | Six months ended |
| (In thousands) | | June 27, 2021 | | June 27, 2021 |
Balance at the beginning of the period (1) | | $ | 7,728 | | | $ | 8,431 | |
| | | | |
| Payments | | (862) | | | (862) | |
Fair value adjustments (2) | | 584 | | | (119) | |
| Contingent consideration at the end of the period | | $ | 7,450 | | | $ | 7,450 | |
(1) There were no transactions involving contingent consideration during the quarter and six months ended June 28, 2020. The contingent consideration reflected above relates to the Serial acquisition, which was completed during the third quarter of 2017, we reclassified2020.
(2) Fair value adjustments are included in General and administrative expenses in our marketable securities from HTM to AFS. Prior to being classified as AFS, the securities were recorded at amortized cost and not adjusted to fair value in accordance with the HTM accounting treatment.Condensed Consolidated Statements of Operations.
Financial Instruments Disclosed, But Not Reported, at Fair Value
The carrying value of our long-term debt was approximately $243 millionremaining contingent consideration balances as of September 24, 2017June 27, 2021, and approximately $240 million asDecember 27, 2020, of December 25, 2016. The fair value of our long-term debt was approximately $281$7.5 million and $298$8.4 million, asrespectively, are included in Accrued expenses and other, for the current portion of September 24, 2017the liability, and December 25, 2016, respectively. We estimateOther non-current liabilities, for the fair valuelong-term portion of the liability, in our debt utilizing market quotations for debt that have quoted prices in active markets. Since our debt does not trade on a daily basis in an active market, the fair value estimates are based on market observable inputs based on borrowing rates currently available for debt with similar terms and average maturities (Level 2).Condensed Consolidated Balance Sheets.
NOTE 9. PENSION AND OTHER POSTRETIREMENT BENEFITS
Pension
Single-Employer Plans
We sponsor severalmaintain The New York Times Companies Pension Plan (the “Pension Plan”), a frozen single-employer defined benefit pension plans,plan. The Company also jointly sponsors a defined benefit plan with The NewsGuild of New York known as the majority of which have been frozen. Guild-Times Adjustable Pension Plan (the “APP”) that continues to accrue active benefits.
We also participate in two joint Company and Guild-sponsored definedhave a foreign-based pension plan for certain employees (the “foreign plan”). The information for the foreign plan is combined with the information for U.S. non-qualified plans. The benefit obligation of the foreign plan is immaterial to our total benefit obligation.
The components of net periodic pension plans covering employees who are members ofcost were as follows:
| | | | | | | | | | | | | | | | | | | | | | | | | | | | | | | | | | | | | | |
| | For the Quarters Ended |
| | | June 27, 2021 | | June 28, 2020 |
| (In thousands) | | Qualified
Plans | | Non-
Qualified
Plans | | All
Plans | | Qualified
Plans | | Non-
Qualified
Plans | | All
Plans |
| Service cost | | $ | 2,276 | | | $ | 0 | | | $ | 2,276 | | | $ | 2,607 | | | $ | 0 | | | $ | 2,607 | |
| Interest cost | | 7,629 | | | 1,088 | | | 8,717 | | | 11,742 | | | 1,649 | | | 13,391 | |
| Expected return on plan assets | | (12,678) | | | 0 | | | (12,678) | | | (17,745) | | | 0 | | | (17,745) | |
| Amortization of actuarial loss | | 5,057 | | | 1,822 | | | 6,879 | | | 5,655 | | | 1,522 | | | 7,177 | |
| Amortization of prior service credit | | (486) | | | 0 | | | (486) | | | (486) | | | 0 | | | (486) | |
| | | | | | | | | | | | |
Net periodic pension cost (1) | | $ | 1,798 | | | $ | 2,910 | | | $ | 4,708 | | | $ | 1,773 | | | $ | 3,171 | | | $ | 4,944 | |
THE NEW YORK TIMES COMPANY
NOTES TO THE CONDENSED CONSOLIDATED FINANCIAL STATEMENTS
(Unaudited)
| | | | | | | | | | | | | | | | | | | | | | | | | | | | | | | | | | | | | | |
| | For the Six Months Ended |
| | | June 27, 2021 | | June 28, 2020 |
| (In thousands) | | Qualified
Plans | | Non-
Qualified
Plans | | All
Plans | | Qualified
Plans | | Non-
Qualified
Plans | | All
Plans |
| Service cost | | $ | 4,552 | | | $ | 0 | | | $ | 4,552 | | | $ | 5,214 | | | $ | 0 | | | $ | 5,214 | |
| Interest cost | | 15,258 | | | 2,176 | | | 17,434 | | | 23,484 | | | 3,297 | | | 26,781 | |
| Expected return on plan assets | | (25,355) | | | 0 | | | (25,355) | | | (35,481) | | | 0 | | | (35,481) | |
| Amortization of actuarial loss | | 10,113 | | | 3,642 | | | 13,755 | | | 11,310 | | | 3,043 | | | 14,353 | |
| Amortization of prior service credit | | (972) | | | 0 | | | (972) | | | (972) | | | 0 | | | (972) | |
| | | | | | | | | | | | |
Net periodic pension cost (1) | | $ | 3,596 | | | $ | 5,818 | | | $ | 9,414 | | | $ | 3,555 | | | $ | 6,340 | | | $ | 9,895 | |
(1) The NewsGuild of New York, including The Newspaper Guild of New York - The New York Times Pension Fund, which was frozen in 2012 and replaced by a successor plan, The Guild-Times Adjustable Pension Plan.
The componentsservice cost component of net periodic pension cost were as follows: |
| | | | | | | | | | | | | | | | | | | | | | | | |
| | | For the Quarters Ended |
| | | September 24, 2017 | | September 25, 2016 |
| (In thousands) | | Qualified
Plans | | Non-
Qualified
Plans | | All
Plans | | Qualified
Plans | | Non-
Qualified
Plans | | All
Plans |
| Service cost | | $ | 2,423 |
| | $ | — |
| | $ | 2,423 |
| | $ | 2,248 |
| | $ | — |
| | $ | 2,248 |
|
| Interest cost | | 15,596 |
| | 1,956 |
| | 17,552 |
| | 16,573 |
| | 2,034 |
| | 18,607 |
|
| Expected return on plan assets | | (26,136 | ) | | — |
| | (26,136 | ) | | (27,790 | ) | | — |
| | (27,790 | ) |
| Amortization of actuarial loss | | 7,351 |
| | 1,088 |
| | 8,439 |
| | 7,069 |
| | 1,054 |
| | 8,123 |
|
| Amortization of prior service credit | | (486 | ) | | — |
| | (486 | ) | | (487 | ) | | — |
| | (487 | ) |
| Net periodic pension (income)/cost | | $ | (1,252 | ) | | $ | 3,044 |
| | $ | 1,792 |
| | $ | (2,387 | ) | | $ | 3,088 |
| | $ | 701 |
|
|
| | | | | | | | | | | | | | | | | | | | | | | | |
| | | For the Nine Months Ended |
| | | September 24, 2017 | | September 25, 2016 |
| (In thousands) | | Qualified
Plans | | Non-
Qualified
Plans | | All
Plans | | Qualified
Plans | | Non-
Qualified
Plans | | All
Plans |
| Service cost | | $ | 7,269 |
| | $ | — |
| | $ | 7,269 |
| | $ | 6,743 |
| | $ | — |
| | $ | 6,743 |
|
| Interest cost | | 46,784 |
| | 5,868 |
| | 52,652 |
| | 49,720 |
| | 6,102 |
| | 55,822 |
|
| Expected return on plan assets | | (78,408 | ) | | — |
| | (78,408 | ) | | (83,369 | ) | | — |
| | (83,369 | ) |
| Amortization of actuarial loss | | 22,057 |
| | 3,264 |
| | 25,321 |
| | 21,206 |
| | 3,160 |
| | 24,366 |
|
| Amortization of prior service credit | | (1,458 | ) | | — |
| | (1,458 | ) | | (1,459 | ) | | — |
| | (1,459 | ) |
| Net periodic pension (income)/cost | | $ | (3,756 | ) | | $ | 9,132 |
| | $ | 5,376 |
| | $ | (7,159 | ) | | $ | 9,262 |
| | $ | 2,103 |
|
During the first ninesix months of 20172021 and 2016,2020, we made pension contributions of $5.9$4.2 million and $6.0$4.6 million, respectively, to certain qualified pension plans.the APP. We expect contributions in 2021 to total approximately $9 million to satisfy minimum funding requirements.
As part of our continued effort to reduce the size and volatility of our pension obligations, in October 2017, the Company entered into agreements with an insurance company to transfer future benefit obligations and annuity administration for certain retirees (or their beneficiaries) in two of the Company’s qualified pension plans. Additionally, as part of our management of the funded status of our qualified pension plans, in October 2017, the Company made a $100 million aggregate contribution to these pension plans, which was funded by cash on hand. See Note 15 for additional information.
Multiemployer Plans
During the third quarter of 2016, we received $5.0 million in connection with an arbitration matter related to a multiemployer pension plan. In the second quarter of 2016, we recorded a charge of $11.7 million related to partial withdrawal obligation under a multiemployer pension plan in connection with the same arbitration matter. See Note 14 for additional information with respect to the arbitration.
THE NEW YORK TIMES COMPANY
NOTES TO THE CONDENSED CONSOLIDATED FINANCIAL STATEMENTS
(Unaudited)
Other Postretirement Benefits
The components of net periodic postretirement benefit incomecost/(income) were as follows:
| | | | | | | | | | | | | | | | | | | | | | | | | | |
| | For the Quarters Ended | | For the Six Months Ended |
| (In thousands) | | June 27, 2021 | | June 28, 2020 | | June 27, 2021 | | June 28, 2020 |
| Service cost | | $ | 13 | | | $ | 7 | | | $ | 26 | | | $ | 14 | |
| Interest cost | | 141 | | | 257 | | | 282 | | | 513 | |
| Amortization of actuarial loss | | 852 | | | 763 | | | 1,704 | | | 1,526 | |
| Amortization of prior service credit | | (836) | | | (1,223) | | | (1,672) | | | (2,279) | |
Net periodic postretirement benefit cost/(income) (1) | | $ | 170 | | | $ | (196) | | | $ | 340 | | | $ | (226) | |
|
| | | | | | | | | | | | | | | | |
| | | For the Quarters Ended | | For the Nine Months Ended |
| (In thousands) | | September 24, 2017 |
| | September 25, 2016 |
| | September 24, 2017 |
| | September 25, 2016 |
|
| Service cost | | $ | 92 |
| | $ | 104 |
| | $ | 276 |
| | $ | 313 |
|
| Interest cost | | 470 |
| | 495 |
| | 1,410 |
| | 1,485 |
|
| Amortization of actuarial loss | | 905 |
| | 1,026 |
| | 2,715 |
| | 3,078 |
|
| Amortization of prior service credit | | (1,939 | ) | | (2,110 | ) | | (5,816 | ) | | (6,330 | ) |
| Net periodic postretirement benefit income | | $ | (472 | ) | | $ | (485 | ) | | $ | (1,415 | ) | | $ | (1,454 | ) |
NOTE 10. INCOME TAXES
The Company had income tax expense of $23.4$18.2 million and $40.9$27.7 million in the thirdsecond quarter and first ninesix months of 2017,2021, respectively. The Company had income tax expense of $0.1$5.8 million and $11.8 million in the third quarter of 2016 and an income tax benefit of $9.0 million in the first nine months of 2016. The increase in income tax expense was primarily due to higher income from continuing operations in the thirdsecond quarter and first ninesix months of 2017.
The Company’s effective tax rates from continuing operations were 39.1% and 38.5% for the third quarter and first nine months of 2017,2020, respectively. The Company’s effective tax rates from continuing operations were 30.0%25.1% and 39.4%22.5% for the thirdsecond quarter and first ninesix months of 2016,2021, respectively. The higherCompany’s effective tax raterates from continuing operations were 19.6% and 17.3% for the second quarter and first six months of 2020, respectively. The increase in income tax expense in the thirdsecond quarter and first six months of 2017 was2021 is primarily due to higher income from continuing operations compared within those periods. The Company received a tax benefit in the same period prior year.second quarter of 2020 from a reduction in the Company’s reserve for uncertain tax positions, and in the first quarter of both 2021 and 2020 from stock price appreciation on stock-based awards that settled in the quarter, which in the case of 2020, resulted in lower than statutory tax rates in the second quarter and first six months of 2020.
NOTE 11. EARNINGS/(LOSS)EARNINGS PER SHARE
We compute earnings/(loss)earnings per share using a two-class method, which is an earnings allocation method used when a company’s capital structure includes either two or more classes of common stock or common stock and participating securities. This method determines earnings/(loss)earnings per share based on dividends declared on common stock and participating securities (i.e., distributed earnings), as well as participation rights of participating securities in any undistributed earnings.
Earnings/(loss)Earnings per share is computed using both basic shares and diluted shares. The difference between basic and diluted shares is that diluted shares include the dilutive effect of the assumed exercise of outstanding securities. Our stock options,
THE NEW YORK TIMES COMPANY
NOTES TO THE CONDENSED CONSOLIDATED FINANCIAL STATEMENTS
(Unaudited)
stock-settled long-term performance awards and restricted stock units could have a significant impact on diluted shares. The difference between basic and diluted shares of approximately 0.3 million and 0.5 million in the second quarter and first six months of 2021, respectively, and 1.2 million in each of the second quarter and first six months of 2020, resulted primarily from the dilutive effect of certain stock options, performance awards and restricted stock units.
Securities that could potentially be dilutive are excluded from the computation of diluted earnings per share when a loss from continuing operations exists or when the exercise price exceeds the market value of our Class A Common Stock, because their inclusion would result in an anti-dilutive effect on per share amounts.
The number of stock options excluded from the computation of diluted earnings per share because they were anti-dilutive was approximately 2 million in the third quarter and first nine months of 2017, respectively, and approximately 5 million and 6 million in the third quarter and first nine months of 2016, respectively.
There were no anti-dilutive stock-settled long-term performance awards andapproximately 0.2 million restricted stock units excluded from the computation of diluted earnings per share in the third quarter of 2017 or first ninesix months of 20172021 and 2016. The number of2020, respectively, because they were anti-dilutive, and 0 anti-dilutive stock options or stock-settled long-term performance awards andexcluded in the same periods. There were approximately 0.3 million restricted stock units excluded from the computation of diluted earnings per share in the second quarter of 2021, because they were anti-dilutive, was approximately 2 millionand 0 anti-dilutive stock options or stock-settled long-term performance awards excluded in the third quarter of 2016.same period.
THE NEW YORK TIMES COMPANY
NOTES TO THE CONDENSED CONSOLIDATED FINANCIAL STATEMENTS
(Unaudited)
NOTE 12. SUPPLEMENTAL STOCKHOLDERS’ EQUITY INFORMATION
Stockholders’ equity is summarized as follows:
|
| | | | | | | | | | | | |
| (In thousands) | | Total New York Times Company Stockholders’ Equity | | Noncontrolling Interest | | Total Stockholders’ Equity |
| Balance as of December 25, 2016 | | $ | 847,815 |
| | $ | (3,571 | ) | | $ | 844,244 |
|
| Net income | | 61,109 |
| | 3,567 |
| | 64,676 |
|
| Other comprehensive income, net of tax | | 19,294 |
| | — |
| | 19,294 |
|
| Effect of issuance of shares | | 158 |
| | — |
| | 158 |
|
| Dividends declared | | (19,543 | ) | | — |
| | (19,543 | ) |
| Stock-based compensation | | 9,845 |
| | — |
| | 9,845 |
|
| Balance as of September 24, 2017 | | $ | 918,678 |
| | $ | (4 | ) | | $ | 918,674 |
|
|
| | | | | | | | | | | | |
| (In thousands) | | Total New York Times Company Stockholders’ Equity | | Noncontrolling Interest | | Total Stockholders’ Equity |
| Balance as of December 27, 2015 | | $ | 826,751 |
| | $ | 1,704 |
| | $ | 828,455 |
|
| Net loss | | (8,076 | ) | | (5,719 | ) | | (13,795 | ) |
| Other comprehensive income, net of tax | | 13,273 |
| | — |
| | 13,273 |
|
| Effect of issuance of shares | | (9,298 | ) | | — |
| | (9,298 | ) |
| Share repurchases | | (15,056 | ) | | — |
| | (15,056 | ) |
| Dividends declared | | (19,414 | ) | | — |
| | (19,414 | ) |
| Stock-based compensation | | 9,006 |
| | — |
| | 9,006 |
|
| Balance as of September 25, 2016 | | $ | 797,186 |
| | $ | (4,015 | ) | | $ | 793,171 |
|
On January 14,In 2015, the Board of Directors approved an authorization ofauthorized up to $101.1 million to repurchaseof repurchases of shares of the Company’s Class A Common Stock. The Company did not repurchase any shares during the third quarter of 2017. As of September 24, 2017, the Company had repurchased 6,690,905 Class A sharesJune 27, 2021, repurchases under this authorization for a cost oftotaled $84.9 million (excluding commissions) and $16.2 million remained. All purchases were made pursuant to our publicly announced share repurchase program. Our Board of Directors has authorized us to purchase shares under this authorization from time to time, subject to market conditions and other factors. There is no expiration date with respect to this authorization. There have been no purchases under this authorization since 2016.
The following table summarizes the changes in accumulated other comprehensive income (“AOCI”)AOCI by component as of September 24, 2017:June 27, 2021:
| | | | | | | | | | | | | | | | | | | | | | | | | | |
| (In thousands) | | Foreign Currency Translation Adjustments | | Funded Status of Benefit Plans | | Net Unrealized Gain on Available-For-Sale Securities | | Total Accumulated Other Comprehensive Loss |
| Balance as of December 27, 2020 | | $ | 8,386 | | | $ | (421,698) | | | $ | 3,131 | | | $ | (410,181) | |
| Other comprehensive income before reclassifications, before tax | | (1,767) | | | 0 | | | (1,846) | | | (3,613) | |
| Amounts reclassified from accumulated other comprehensive loss, before tax | | 0 | | | 12,815 | | | 0 | | | 12,815 | |
| Income tax (benefit)/expense | | (473) | | | 3,432 | | | (494) | | | 2,465 | |
| Net current-period other comprehensive (loss)/ income, net of tax | | (1,294) | | | 9,383 | | | (1,352) | | | 6,737 | |
| | | | | | | | |
| Balance as of June 27, 2021 | | $ | 7,092 | | | $ | (412,315) | | | $ | 1,779 | | | $ | (403,444) | |
|
| | | | | | | | | | | | | | | |
| (In thousands) | | Foreign Currency Translation Adjustments | | Funded Status of Benefit Plans | | Net unrealized Loss on available-for-sale Securities | | Total Accumulated Other Comprehensive Loss |
| Balance as of December 25, 2016 | | $ | (1,822 | ) | | $ | (477,994 | ) | | — |
| | $ | (479,816 | ) |
Other comprehensive income (loss) before reclassifications, before tax(1) | | 11,170 |
| | — |
| | (1,081 | ) | | 10,089 |
|
Amounts reclassified from accumulated other comprehensive loss, before tax(1) | | — |
| | 20,762 |
| | — |
| | 20,762 |
|
Income tax expense (benefit) (1) | | 3,777 |
| | 8,208 |
| | (428 | ) | | 11,557 |
|
| Net current-period other comprehensive income, net of tax | | 7,393 |
| | 12,554 |
| | (653 | ) | | 19,294 |
|
| Balance as of September 24, 2017 | | $ | 5,571 |
| | $ | (465,440 | ) | | (653 | ) | | $ | (460,522 | ) |
| | | | | | | | | | | | | | |
(1) | All amounts are shown | | | |
(In thousands)
Detail about accumulated other comprehensive loss components | | Amounts reclassified from accumulated other comprehensive loss | | Affects line item in the statement where net income is presented |
| Funded status of benefit plans: | | | | |
Amortization of prior service credit(1) | | $ | (2,644) | | | Other components of net periodic benefit costs |
Amortization of actuarial loss(1) | | 15,459 | | | Other components of net periodic benefit costs |
| | | | |
Total reclassification, before tax(2) | | 12,815 | | | |
| Income tax expense | | 3,432 | | | Income tax expense |
Total reclassification, net of noncontrolling interest.tax | | $ | 9,383 | | | |
(1) These AOCI components are included in the computation of net periodic benefit cost for pension and other postretirement benefits. See Note 9 for more information.
(2) There were no reclassifications relating to noncontrolling interest for thesix monthsended June 27, 2021.
THE NEW YORK TIMES COMPANY
NOTES TO THE CONDENSED CONSOLIDATED FINANCIAL STATEMENTS
(Unaudited)
The following table summarizes the reclassifications from AOCI for the nine months ended September 24, 2017:
|
| | | | | | |
| (In thousands) | | | | |
| Detail about accumulated other comprehensive loss components | | Amounts reclassified from accumulated other comprehensive loss | | Affects line item in the statement where net income is presented |
| Funded status of benefit plans: | | | | |
Amortization of prior service credit(1) | | $ | (7,274 | ) | | Selling, general & administrative costs |
Amortization of actuarial loss(1) | | 28,036 |
| | Selling, general & administrative costs |
Total reclassification, before tax(2) | | 20,762 |
| | |
| Income tax expense | | 8,208 |
| | Income tax expense |
| Total reclassification, net of tax | | $ | 12,554 |
| | |
| |
(1) | These accumulated other comprehensive income components are included in the computation of net periodic benefit cost for pension and other retirement benefits. See Note 9 for additional information. |
| |
(2) | There were no reclassifications relating to noncontrolling interest for the nine months ended September 24, 2017. |
NOTE 13. SEGMENT INFORMATION
We have oneThe Company identifies a business as an operating segment if: (i) it engages in business activities from which it may earn revenues and incur expenses; (ii) its operating results are regularly reviewed by the Chief Operating Decision Maker (who is the Company’s President and Chief Executive Officer) to make decisions about resources to be allocated to the segment and assess its performance; and (iii) it has available discrete financial information. The Company has determined that it has 1 reportable segment that includes The New York Times, NYTimes.com and related businesses.segment. Therefore, all required segment information can be found in the Condensed Consolidated Financial Statements.
Our operating segment generated revenues principally from subscriptions and advertising. Other revenues consist primarily of revenues from news services/syndication, digital archives, building rental income, NYT Live (our live events business), e-commerce and affiliate referrals.
NOTE 14. CONTINGENT LIABILITIES
Restricted Cash
We were required to maintain $17.9 million and $24.9 million of restricted cash as of September 24, 2017 and December 25, 2016, respectively, the majority of which is set aside to collateralize workers’ compensation obligations. The decrease reflects the settlement of certain litigation described below.
Newspaper and Mail Deliverers–Publishers’ Pension Fund
In September 2013, the Newspaper and Mail Deliverers-Publishers’ Pension Fund (the “NMDU Fund”) assessed a partial withdrawal liability against the Company in the amount of approximately $26 million for the plan years ending May 31, 2012 and 2013 (the “Initial Assessment”), an amount that was increased to approximately $34 million in December 2014, when the NMDU Fund issued a revised partial withdrawal liability assessment for the plan year ending May 31, 2013 (the “Revised Assessment”). The NMDU Fund claimed that when City & Suburban Delivery Systems, Inc., a retail and newsstand distribution subsidiary of the Company and the largest contributor to the NMDU Fund, ceased operations in 2009, it triggered a decline of more than 70% in contribution base units in each of these two plan years.
The Company disagreed with both the NMDU Fund’s determination that a partial withdrawal occurred and the methodology by which it calculated the withdrawal liability, and the parties engaged in arbitration proceedings to resolve the matter. In June 2016, the arbitrator issued an interim award and opinion that supported the NMDU Fund’s determination that a partial withdrawal had occurred, and concluded that the methodology used to calculate the Initial Assessment was correct. However, the arbitrator also concluded that the NMDU Fund’s calculation of the Revised Assessment was incorrect. In July 2017, the arbitrator issued a final award and opinion reflecting the same conclusions, which the Company has appealed.
Due to requirements of the Employee Retirement Income Security Act of 1974 that sponsors make payments demanded by plans during arbitration and any resultant appeals, the Company had been making payments to the NMDU fund since September 2013 relating to the Initial Assessment and February 2015 relating to the Revised Assessment based on the NMDU Fund’s demand. As a result, as of September 24, 2017, we have paid $14.4 million relating to the Initial Assessment since the receipt of the initial demand letter. We also paid $5.0 million related to the Revised Assessment, which was refunded in July 2016 based on the arbitrator’s ruling. The Company recognized $0.1 million and $0.3 million of expense for the third quarter and nine months ended September 24, 2017, respectively. The Company recognized $4.5 million income (inclusive of a special item of $5.0 million) and $10.6 million of expense (inclusive of a special item of $6.7 million) for the third quarter and nine months ended September 25, 2016, respectively.
THE NEW YORK TIMES COMPANY
NOTES TO THE CONDENSED CONSOLIDATED FINANCIAL STATEMENTS
(Unaudited)
The Company had a liability of $7.3 million as of September 24, 2017, related to this matter. Management believes it is reasonably possible that the total loss in this matter could exceed the liability established by a range of zero to approximately $10 million.
NEMG T&G, Inc.
The Company was involved in class action litigation brought on behalf of individuals who, from 2006 to 2011, delivered newspapers at NEMG T&G, Inc., a subsidiary of the Company (“T&G”). T&G was a part of the New England Media Group, which the Company sold in 2013. The plaintiffs asserted several claims against T&G, including a challenge to their classification as independent contractors, and sought unspecified damages. In December 2016, the Company reached a settlement with respect to the claims, which was approved by the court in May 2017. As a result of the settlement, the Company recorded charges of $3.7 million ($2.3 million after tax) in the fourth quarter of 2016 and $0.8 million ($0.5 million after tax) in the third quarter of 2017 within discontinued operations.
OtherLegal Proceedings
We are involved in various legal actions incidental to our business that are now pending against us. These actions are generally for amountshave damage claims that are greatly in excess of the payments, if any, that maywe would be required to be made.pay if we lost or settled the cases. Although the Company cannot predict the outcome of these matters, it is possible that an unfavorable outcome in one or more matters could be material to the Company’s consolidated results of operations or cash flows for an individual reporting period. However, based on currently available information, management does not believe that the ultimate resolution of these matters, individually or in the aggregate, is likely to have a material effect on the Company’s financial position.
NOTE 15. SUBSEQUENT EVENTS
TransferOn June 30, 2021, our Board of Certain Pension Obligations
On October 18, 2017, the Company entered into agreements with Massachusetts Mutual Life Insurance Company (“MassMutual”) relatingDirectors approved a quarterly dividend of $0.07 per share on our Class A and Class B common stock that was paid on July 22, 2021, to The New York Times Companies Pension Plan and The Retirement Annuity Plan for Craft Employeesall stockholders of The New York Times Company (collectively, the “Pension Plans”). Under the agreements, the Company will purchase from MassMutual group annuity contracts with respect to the Pension Plans and transfer to MassMutual the future benefit obligations and annuity administration for approximately 3,800 retirees (or their beneficiaries). The pension benefit obligations and annuity administration for these transferredparticipants will be transferred to MassMutual and MassMutual will irrevocably guarantee the pension benefits for these participants.
This arrangement is partrecord as of the Company’s continued effort to reduce the overall size and volatilityclose of our pension plan obligations, as well as the premiums and other administrative costs related thereto. By transferring these obligations to MassMutual, the Company expects to reduce its qualified pension plan obligations by approximately $225 million. The purchase of the group annuity contracts is being funded through existing assets of the Pension Plans’ respective trusts. As a result of this arrangement, the Company expects to recognize a pension settlement charge of approximately $95 millionbefore tax in the fourth quarter of 2017. This charge represents the acceleration of deferred charges currently accrued in AOCI.business on July 12, 2021.
Discretionary Pension Contribution
On October 20, 2017, the Company made a $100 million aggregate discretionary contribution to the Pension Plans as part of the Company’s management of the funded status of these plans.
Item 2. Management’s Discussion and Analysis of Financial Condition and Results of Operations
EXECUTIVE OVERVIEW
We are a global media organization that includes printdigital and digitalprint products and investments.related businesses. We have one reportable segment with businesses that include our newspaper, websites, mobile applicationscore news product and other interest-specific products, and related businesses.content and services.
We generate revenues principally from subscriptions and advertising. OtherIn addition, we generate other revenues primarily consistconsisting of revenues from news services/syndication, digital archives,licensing, Wirecutter affiliate referrals, the leasing of floors in our New York headquarters building rental income, NYT Live (ourlocated at 620 Eighth Avenue, New York, New York (the “Company Headquarters”), commercial printing, retail commerce, television and film, our student subscription sponsorship program and our live events business), e-commerce and affiliate referrals. business.
Our main operating costs are employee-related costs.
In the accompanying analysis of financial information, we present certain information derived from consolidated financial information but not presented in our financial statements prepared in accordance with generally accepted accounting principles in the United States of America (“GAAP”). TheseWe are presenting in this report supplemental non-GAAP financial performance measures that exclude depreciation, amortization, severance, non-operating retirement costs or multiemployer pension plan withdrawal costs, and certain identified special items, as applicable. These non-GAAP financial measures should not be considered in isolation from or as a substitute for the related GAAP measures, and should be read in conjunction with financial information presented on a GAAP basis. For further information and reconciliations of these non-GAAP measures to the most directly comparable GAAP measures, see “—Results of Operations—“Non-Operating Items—Non-GAAP Financial Measures.Measurements.”
Financial Highlights
For the third quarter of 2017, diluted•Diluted earnings per share from continuing operations were $0.20, compared with $0.00$0.32 and $0.14 for the third quartersecond quarters of 2016.2021 and 2020, respectively. Diluted earnings per share from continuing operations excluding severance, non-operating retirement costs and special items discussed below (or “adjusted diluted earnings per share,” a non-GAAP measure) were $0.13$0.36 and $0.06$0.18 for the thirdsecond quarters of 20172021 and 2016,2020, respectively.
•The Company had an operating profit of $33.0$73.3 million in the thirdsecond quarter of 2017,2021, compared with $9.0$28.8 million in the thirdsecond quarter of 2016. The increase was largely due to higher digital subscription revenues and lower severance costs, which more than offset lower print advertising revenues.2020. Operating profit before depreciation, amortization, severance, non-operating retirementmultiemployer pension plan withdrawal costs and special items discussed below (or “adjusted operating profit,” a non-GAAP measure) was $56.5increased to $92.9 million and $39.2in the second quarter of 2021 from $52.1 million forin the third quarterssecond quarter of 2017 and 2016, respectively.2020.
•Total revenues increased 6.1%23.5% to $385.6$498.5 million in the thirdsecond quarter of 20172021 from $363.5$403.8 million in the thirdsecond quarter of 2016, primarily driven by increases in digital and print subscription revenue, as well as digital advertising revenue, partially offset by a decrease in print advertising revenue.2020.
•Subscription revenues increased 13.6%15.7% in the thirdsecond quarter of 20172021 compared with the third quarter of 2016, primarily due to significant growth in recent quarters in the number of subscriptions to the Company’s digital subscription products, as well as the 2017 increase in home-delivery prices for The New York Times newspaper, which more than offset a decline in print copies sold. Revenue from our digital-only subscription products (which include our news product, as well as our Crossword and Cooking products) increased 46.3% in the third quarter of 2017 compared with the third quarter of 2016. Our Cooking product first launched as a paid digital product earlier in the third quarter of 2017.
same prior-year period. Paid digital-only subscriptions totaled approximately 2,487,0007,133,000 at the end of the thirdsecond quarter of 2017,2021, a 59.1%net increase of 142,000 subscriptions compared with the end of the thirdfirst quarter of 2016. News2021. Of the 142,000 total net additions, 77,000 came from the Company’s digital news product, subscriptions totaled approximately 2,132,000 atwhile 65,000 came from the endCompany’s Cooking, Games and Audm products. We expect total net subscription additions in 2021 to be in the range of the thirdnumber of total net subscription additions in 2019, though it remains difficult to predict with precision.
•Total advertising revenues increased 66.4% in the second quarter of 2017, a 59.3% increase2021 compared with the endsame prior-year period, due to an increase of the third quarter of 2016. Other product subscriptions totaled approximately 355,000 at the end of the third quarter of 2017, a 57.8% increase compared with the end of the third quarter of 2016.
Total advertising revenues decreased 9.0% in the third quarter of 2017 compared with the third quarter of 2016, reflecting a 20.1% decrease in print advertising revenues, partially offset by an 11.0% increase in digital advertising revenues. The decrease in print advertising revenues resulted from a decline in display advertising, primarily in the luxury, travel, real estate, media, technology, and telecommunications categories. The increase79.6% in digital advertising revenues primarily reflected increasesand an increase of 48.0% in revenue from our smartphone platform, programmatic channels and branded content, partially offset by a continued decrease in traditional website display advertising. We expectprint advertising revenuesrevenues.
•Operating costs increased 12.4% to remain under pressure$421.4 million in the fourthsecond quarter of 2017, with digital advertising revenues expected to be flat or slightly lower2021 from $374.9 million compared with the same prior year period.
Other revenues increased 17.7% in the thirdsecond quarter of 2017 compared with the third quarter of 2016, largely due to affiliate referral revenue associated with the product review and recommendation websites, The Wirecutter and The Sweethome, which the Company acquired in October 2016. The two websites were subsequently combined and re-branded as “Wirecutter.”
Operating costs decreased in the third quarter of 2017 to $350.1 million from $356.6 million in the third quarter of 2016, largely due to lower severance, print production and distribution costs, and savings in international operations, which were partially offset by higher costs following the acquisitions of Wirecutter and digital marketing agency, Fake Love, and higher marketing costs.2020. Operating costs before depreciation, amortization, severance and non-operating retirementmultiemployer pension plan withdrawal costs (or “adjusted operating costs,” a non-GAAP measure) increased 15.4% in the thirdsecond quarter of 20172021 to $329.2$405.6 million from $324.4$351.6 million in the thirdsecond quarter of 2016.2020.
Non-operating retirement costs decreasedImpact of Covid-19 Pandemic
Given the impact of the Covid-19 pandemic on our business in 2020, we believe that certain comparisons of our operating results in 2021 to $3.1 million during2019 provide useful context for our 2021 results. We have included supplemental tables comparing the thirdoperating results in 2021 to 2020 and to 2019 (see “Supplemental Financial Information”), as well as discussion comparing the second quarter and first six months in 2021 to 2020 and 2019.
The Covid-19 pandemic impacted our business in various ways, including impacts on both our operating revenues and operating expenses. Beginning in the first quarter of 2017 from $3.8 million2020, we experienced significant growth in the third quarternumber of 2016 primarilysubscriptions to our digital news and other products, which we believe was attributable in part to an increase in traffic given the news
environment and as a result of the pandemic. More recently, we have seen these pandemic-related trends subside and we expect total net subscription additions in 2021 to be in the range of the number of total net subscription additions in 2019, though it remains difficult to predict with precision. Revenues from the single-copy and bulk sales of our print newspaper (which include our international edition and collectively represent less than 5% of our total subscription revenues) were adversely affected as a result of widespread business closures, increased remote working and reductions in travel. The worldwide economic slowdown caused by the pandemic also led to a significant decline in our advertising revenues in 2020 as advertisers reduced their spending. More recently, we experienced increasing demand for advertising with the recovery of the broader market. Our live events business was and continues to be adversely affected by the impacts of the Covid-19 pandemic.
In 2020 we incurred less media expense as we decreased marketing spend due to a heightened news cycle, lower multiemployer pension plan withdrawal expense.print production and distribution costs due to less demand for print copies of the newspaper, lower costs related to our advertising business as a result of lower variable expenses in connection with lower advertising revenues and lower travel and entertainment costs as a result of the Covid-19 pandemic. More recently we have begun increasing some of our spending in these areas. We also incurred some additional expenses in response to the pandemic, including certain enhanced employee benefits; however these expenses have not yet been significant. We expect to incur additional costs as we prepare for our employees to return to our headquarters building and other offices, and may incur significant additional costs as circumstances evolve, including in connection with potential operational changes.
At this time, the full impact that the Covid-19 pandemic will have on our business, operations and financial results is uncertain. The extent to which the pandemic will continue to impact us will depend on numerous evolving factors and future developments, including the scope and duration of the pandemic (including the extent of a resurgence); the effect of ongoing vaccination and mitigation efforts; the impact of the pandemic on economic conditions and the companies with which we do business; governmental, business and other actions; the status of travel restrictions; and changes in consumer behavior in response to the pandemic, among many other factors. We will continue to actively monitor the situation and may take further actions that alter our business operations as may be required by federal, state, local or foreign authorities, or that we determine are appropriate. Please see “Item 1A — Risk Factors” in our Annual Report on Form 10-K for the year ended December 27, 2020, for more information.
RESULTS OF OPERATIONS
The following table presents our consolidated financial results:
| | | | | | | | | | | | | | | | | | | | | | | | | | | | | | | | | | | | | | |
| | | For the Quarters Ended | | | | For the Six Months Ended | | |
| (In thousands) | | June 27, 2021 | | June 28, 2020 | | % Change | | June 27, 2021 | | June 28, 2020 | | % Change |
| Revenues | | | | | | | | | | | | |
| Subscription | | $ | 339,217 | | | $ | 293,189 | | | 15.7 | % | | $ | 668,301 | | | $ | 578,623 | | | 15.5 | % |
| Advertising | | 112,774 | | | 67,760 | | | 66.4 | % | | 209,890 | | | 173,897 | | | 20.7 | % |
| Other | | 46,506 | | | 42,801 | | | 8.7 | % | | 93,351 | | | 94,866 | | | (1.6) | % |
| Total revenues | | 498,497 | | | 403,750 | | | 23.5 | % | | 971,542 | | | 847,386 | | | 14.7 | % |
| Operating costs | | | | | | | | | | | | |
| Cost of revenue (excluding depreciation and amortization) | | 251,358 | | | 229,913 | | | 9.3 | % | | 502,355 | | | 473,397 | | | 6.1 | % |
| Sales and marketing | | 53,555 | | | 39,605 | | 35.2 | % | | 113,708 | | 113,389 | | | 0.3 | % |
| Product development | | 39,699 | | | 30,983 | | | 28.1 | % | | 78,642 | | | 61,985 | | | 26.9 | % |
| General and administrative | | 62,283 | | | 58,812 | | | 5.9 | % | | 118,860 | | | 111,673 | | | 6.4 | % |
| Depreciation and amortization | | 14,486 | | | 15,631 | | | (7.3) | % | | 29,203 | | | 30,816 | | | (5.2) | % |
| Total operating costs | | 421,381 | | | 374,944 | | | 12.4 | % | | 842,768 | | | 791,260 | | | 6.5 | % |
| | | | | | | | | | | | |
| | | | | | | | | | | | |
| | | | | | | | | | | | |
| Lease termination charge | | 3,831 | | | — | | | * | | 3,831 | | | — | | | * |
| Operating profit | | 73,285 | | | 28,806 | | | * | | 124,943 | | | 56,126 | | | * |
| Other components of net periodic benefit costs | | 2,598 | | | 2,149 | | | 20.9 | % | | 5,197 | | | 4,463 | | | 16.4 | % |
| | | | | | | | | | | | |
| Interest income and other, net | | 1,873 | | | 2,786 | | | (32.8) | % | | 3,384 | | | 16,640 | | | (79.7) | % |
| Income from continuing operations before income taxes | | 72,560 | | | 29,443 | | | * | | 123,130 | | | 68,303 | | | 80.3 | % |
| Income tax expense | | 18,243 | | | 5,781 | | | * | | 27,704 | | | 11,787 | | | * |
| | | | | | | | | | | | |
| | | | | | | | | | | | |
| Net income | | 54,317 | | | 23,662 | | | * | | 95,426 | | | 56,516 | | | 68.8 | % |
| | | | | | | | | | | | |
| Net income attributable to The New York Times Company common stockholders | | $ | 54,317 | | | $ | 23,662 | | | * | | $ | 95,426 | | | $ | 56,516 | | | 68.8 | % |
* Represents a change equal to or in excess of 100% or not meaningful.
|
| | | | | | | | | | | | | | | | | | | | | | |
| | | For the Quarters Ended | | | | For the Nine Months Ended | | |
| (In thousands) | | September 24, 2017 |
| | September 25, 2016 |
| | % Change |
| | September 24, 2017 |
| | September 25, 2016 |
| | % Change |
|
| Revenues | | | | | |
| | | | | | |
| Subscription | | $ | 246,638 |
| | $ | 217,099 |
| | 13.6 | % | | $ | 739,050 |
| | $ | 654,573 |
| | 12.9 | % |
| Advertising | | 113,633 |
| | 124,898 |
| | (9.0 | )% | | 375,895 |
| | 395,733 |
| | (5.0 | )% |
| Other | | 25,364 |
| | 21,550 |
| | 17.7 | % | | 76,568 |
| | 65,386 |
| | 17.1 | % |
| Total revenues | | 385,635 |
| | 363,547 |
| | 6.1 | % | | 1,191,513 |
| | 1,115,692 |
| | 6.8 | % |
| Operating costs | | | | | | | | | | | | |
| Production costs: | | | | | |
| | | | | | |
| Wages and benefits | | 89,866 |
| | 91,041 |
| | (1.3 | )% | | 269,209 |
| | 274,142 |
| | (1.8 | )% |
| Raw materials | | 15,718 |
| | 18,228 |
| | (13.8 | )% | | 48,461 |
| | 53,115 |
| | (8.8 | )% |
| Other | | 44,336 |
| | 47,347 |
| | (6.4 | )% | | 134,771 |
| | 139,938 |
| | (3.7 | )% |
| Total production costs | | 149,920 |
| | 156,616 |
| | (4.3 | )% | | 452,441 |
| | 467,195 |
| | (3.2 | )% |
| Selling, general and administrative costs | | 184,483 |
| | 184,596 |
| | (0.1 | )% | | 595,491 |
| | 534,911 |
| | 11.3 | % |
| Depreciation and amortization | | 15,677 |
| | 15,384 |
| | 1.9 | % | | 46,961 |
| | 46,003 |
| | 2.1 | % |
| Total operating costs | | 350,080 |
| | 356,596 |
| | (1.8 | )% | | 1,094,893 |
| | 1,048,109 |
| | 4.5 | % |
| Headquarters redesign and consolidation | | 2,542 |
| | — |
| | * |
| | 6,929 |
| | — |
| | * |
|
| Restructuring charge | | — |
| | 2,949 |
| | * |
| | — |
| | 14,804 |
| | * |
|
| Multiemployer pension plan withdrawal expense | | — |
| | (4,971 | ) | | * |
| | — |
| | 6,730 |
| | * |
|
| Operating profit | | 33,013 |
| | 8,973 |
| | * |
| | 89,691 |
| | 46,049 |
| | 94.8 | % |
| Gain/(loss) from joint ventures | | 31,557 |
| | 463 |
| | * |
| | 31,464 |
| | (41,845 | ) | | * |
|
| Interest expense, net | | 4,660 |
| | 9,032 |
| | (48.4 | )% | | 15,118 |
| | 26,955 |
| | (43.9 | )% |
| Income/(loss) from continuing operations before income taxes | | 59,910 |
| | 404 |
| | * |
| | 106,037 |
| | (22,751 | ) | | * |
|
| Income tax expense/(benefit) | | 23,420 |
| | 121 |
| | * |
| | 40,873 |
| | (8,956 | ) | | * |
|
| Income/(loss) from continuing operations | | 36,490 |
| | 283 |
| | * |
| | 65,164 |
| | (13,795 | ) | | * |
|
| Loss from discontinued operations, net of income taxes | | 488 |
| | — |
| | * |
| | 488 |
| | — |
| | * |
|
| Net income/(loss) | | 36,002 |
| | 283 |
| | * |
| | 64,676 |
| | (13,795 | ) | | * |
|
| Net (income)/loss attributable to the noncontrolling interest | | (3,673 | ) | | 123 |
| | * |
| | (3,567 | ) | | 5,719 |
| | * |
|
| Net income/(loss) attributable to The New York Times Company common stockholders | | $ | 32,329 |
| | $ | 406 |
| | * |
| | $ | 61,109 |
| | $ | (8,076 | ) | | * |
|
| |
* | Represents a change equal to or in excess of 100% or not meaningful. |
| | | | | | | | | | | | | | | | | | | | | | | | | | | | | | | | |
| | Second Quarter |
| | 2021 | | 2020 | | 2021 vs 2020 % Change | | 2019 | | 2021 vs 2019 % Change |
| | | | | | | | | | |
| Revenues | | | | | | | | | | |
| Digital | | $ | 190,145 | | | $ | 145,984 | | | 30.3 | % | | $ | 112,635 | | | 68.8 | % |
| Print | | 149,072 | | | 147,205 | | | 1.3 | % | | 157,821 | | | (5.5) | % |
| Subscription revenues | | 339,217 | | | 293,189 | | | 15.7 | % | | 270,456 | | | 25.4 | % |
| Digital | | 70,995 | | | 39,531 | | | 79.6 | % | | 58,026 | | | 22.4 | % |
| Print | | 41,779 | | | 28,229 | | | 48.0 | % | | 62,735 | | | (33.4) | % |
| Advertising revenues | | 112,774 | | | 67,760 | | | 66.4 | % | | 120,761 | | | (6.6) | % |
| Other revenues | | 46,506 | | | 42,801 | | | 8.7 | % | | 45,041 | | | 3.3 | % |
| Total revenues | | 498,497 | | | 403,750 | | | 23.5 | % | | 436,258 | | | 14.3 | % |
| Operating costs | | | | | | | | | | |
| Cost of revenue (excluding depreciation and amortization) | | 251,358 | | | 229,913 | | | 9.3 | % | | 244,939 | | | 2.6 | % |
Sales and marketing | | 53,555 | | | 39,605 | | | 35.2 | % | | 62,280 | | | (14.0) | % |
| Product development | | 39,699 | | | 30,983 | | | 28.1 | % | | 25,526 | | | 55.5 | % |
| General and administrative | | 62,283 | | | 58,812 | | | 5.9 | % | | 50,400 | | | 23.6 | % |
| Depreciation and amortization | | 14,486 | | | 15,631 | | | (7.3) | % | | 15,180 | | | (4.6) | % |
| Total operating costs | | 421,381 | | | 374,944 | | | 12.4 | % | | 398,325 | | | 5.8 | % |
| Lease termination charge | | 3,831 | | | — | | | * | | — | | | * |
| Operating profit | | $ | 73,285 | | | $ | 28,806 | | | * | | $ | 37,933 | | | 93.2 | % |
| | | | | | | | | | |
| * Represents a change equal to or in excess of 100% or not meaningful. |
| | | | | | | | | | | | | | | | | | | | | | | | | | | | | | | | |
| | Six Months |
| | 2021 | | 2020 | | 2021 vs 2020 % Change | | 2019 | | 2021 vs 2019 % Change |
| Revenues | | | | | | | | | | |
| Digital | | $ | 369,745 | | | $ | 275,994 | | | 34.0 | % | | $ | 222,494 | | | 66.2 | % |
| Print | | 298,556 | | | 302,629 | | | (1.3) | % | | 318,772 | | | (6.3) | % |
| Subscription revenues | | 668,301 | | | 578,623 | | | 15.5 | % | | 541,266 | | | 23.5 | % |
| Digital | | 130,491 | | | 90,689 | | | 43.9 | % | | 113,569 | | | 14.9 | % |
| Print | | 79,399 | | | 83,208 | | | (4.6) | % | | 132,280 | | | (40.0) | % |
| Advertising revenues | | 209,890 | | | 173,897 | | | 20.7 | % | | 245,849 | | | (14.6) | % |
| Other revenues | | 93,351 | | | 94,866 | | | (1.6) | % | | 88,205 | | | 5.8 | % |
| Total revenues | | 971,542 | | | 847,386 | | | 14.7 | % | | 875,320 | | | 11.0 | % |
| Operating costs | | | | | | | | | | |
| Cost of revenue (excluding depreciation and amortization) | | 502,355 | | | 473,397 | | | 6.1 | % | | 484,125 | | | 3.8 | % |
Sales and marketing | | 113,708 | | | 113,389 | | | 0.3 | % | | 137,094 | | | (17.1) | % |
| Product development | | 78,642 | | | 61,985 | | | 26.9 | % | | 49,433 | | | 59.1 | % |
| General and administrative | | 118,860 | | | 111,673 | | | 6.4 | % | | 102,039 | | | 16.5 | % |
| Depreciation and amortization | | 29,203 | | | 30,816 | | | (5.2) | % | | 30,098 | | | (3.0) | % |
| Total operating costs | | 842,768 | | | 791,260 | | | 6.5 | % | | 802,789 | | | 5.0 | % |
| Lease termination charge | | 3,831 | | | — | | | * | | — | | | * |
| Operating profit | | $ | 124,943 | | | $ | 56,126 | | | * | | $ | 72,531 | | | 72.3 | % |
| | | | | | | | | | |
| * Represents a change equal to or in excess of 100% or not meaningful. |
Revenues
Subscription Revenues
As of the second quarter of 2017, the Company has renamed “circulation revenues” as “subscription revenues.” Subscription revenues consist of revenues from subscriptions to our printdigital and digitalprint products (which include our news product, as well as our CrosswordGames, Cooking and CookingAudm products), as well asand single-copy and bulk sales of our print products (which comprise approximately 10%represent less than 5% of these revenues). Our Cooking product first launched as a paid digital product earlier in the third quarter of 2017. TheseSubscription revenues are based on both the number of copies of the printed newspaper sold and digital-only subscriptions, and the rates charged to the respective customers.
2021 Compared with 2020
Subscription revenues increased 13.6%15.7% in the thirdsecond quarter and 12.9%increased 15.5% in the first ninesix months of 20172021 compared with the same prior-year periods,periods. The increase in the second quarter and first six months was primarily due to significantyear-over-year growth in recent quartersof 25.8% in the number of subscriptions to the Company’s digital subscriptiondigital-only products as well as the 2017subscriptions graduating to higher prices from introductory promotional pricing. Subscription revenues also benefited from an increase in home-deliveryrevenue from our domestic home delivery print subscription products during both periods, primarily due to an increase in home delivery prices.However, for the first six months of 2021 compared with the same prior-year period, the increase attributable to higher home delivery subscription prices for The New York Times newspaper, whichwas more than offset by a declinedecrease in print copies sold. Revenuesrevenue from single-copy and bulk sales as a result of business closures, increased levels of remote working and reductions in travel due to the Covid-19 pandemic as well as ongoing secular trends.
Paid digital-only subscriptions totaled approximately 7,133,000 at the end of the second quarter of 2021, a net increase of 142,000 subscriptions compared with the end of the first quarter of 2021 and a net increase of 1,463,000 compared with the end of the second quarter of 2020. We experienced significant growth in the number of subscriptions to our digital-only news subscriptions (including e-readersproducts in 2020, and replica editions)we do not expect the 2020 growth rate to be sustainable or indicative of results for future periods. Net subscription additions for our digital-only products were $82.1 millionmodest in the thirdsecond quarter of 20172021, especially in comparison to the significant growth in the number of subscriptions we saw in the second quarter of 2020 at the beginning of the Covid-19 pandemic. In the second quarter, which is traditionally our slowest quarter of the year for net digital subscription additions, we saw improvement in net additions each month during the quarter since a low in March. We expect total net subscription additions in 2021 to be in the range of the number of total net subscription additions in 2019, although it remains difficult to predict with precision.
Digital-only news product subscriptions totaled approximately 5,334,000 at the end of the second quarter of 2021, a 77,000 net increase compared with the end of the first quarter of 2021 and $234.2 milliona 944,000 increase compared with the end of the second quarter of 2020. Other product subscriptions (which include our Games, Cooking and Audm products) totaled approximately 1,799,000 at the end of the second quarter of 2021, an increase of 65,000 subscriptions compared with the end of the first quarter of 2021 and an increase of 519,000 subscriptions compared with the end of the second quarter of 2020.
Print domestic home delivery subscriptions totaled approximately 803,000 at the end of the second quarter of 2021, a net decrease of 22,000 compared with the end of the first quarter of 2021 and a net decrease of 37,000 compared with the end of the second quarter of 2020.
2021 Compared with 2019
Subscription revenues increased 25.4% in the second quarter and increased 23.5% in the first ninesix months of 2017, an2021 compared with the same prior-year periods in 2019. The increase of 46.2% and 44.3% fromin the thirdsecond quarter and first ninesix months of 2016,2021 was primarily due to year-over-year growth of 88.7% in the number of subscriptions to the Company’s digital-only products. These increases were partially offset by a decrease in print subscription revenue from single-copy and bulk sales as a result of business closures, increased levels of remote working and reductions in travel due to the Covid-19 pandemic as well as secular trends. Single-copy and bulk sales decreased 38.9% and 38.8% in the second quarter and the first six months, respectively.
The following table summarizes digital-onlydigital and print subscription revenues for the thirdsecond quarters and first ninesix months of 20172021 and 2016:2020:
| | | | | | | | | | | | | | | | | | | | | | | | | | | | | | | | | | | | | | |
| | For the Quarters Ended | | | | For the Six Months Ended | | |
| (In thousands) | | June 27, 2021 | | June 28, 2020 | | % Change | | June 27, 2021 | | June 28, 2020 | | % Change |
| Digital-only subscription revenues: | | | | | | | | | | | | |
News product subscription revenues(1) | | $ | 170,893 | | | $ | 132,922 | | | 28.6 | % | | $ | 332,181 | | | $ | 251,880 | | | 31.9 | % |
Other product subscription revenues(2) | | 19,252 | | | 13,062 | | | 47.4 | % | | 37,564 | | | 24,114 | | | 55.8 | % |
| Subtotal digital-only subscription revenues | | 190,145 | | | 145,984 | | | 30.3 | % | | 369,745 | | | 275,994 | | | 34.0 | % |
| Print subscription revenues: | | | | | | | | | | | | |
Domestic home delivery subscription revenues(3) | | 134,755 | | | 132,971 | | | 1.3 | % | | 269,150 | | | 266,708 | | | 0.9 | % |
Single-copy, NYT International and other subscription revenues(4) | | 14,317 | | | 14,234 | | | 0.6 | % | | 29,406 | | | 35,921 | | | (18.1) | % |
| Subtotal print subscription revenues | | 149,072 | | | 147,205 | | | 1.3 | % | | 298,556 | | | 302,629 | | | (1.3) | % |
| Total subscription revenues | | $ | 339,217 | | | $ | 293,189 | | | 15.7 | % | | $ | 668,301 | | | $ | 578,623 | | | 15.5 | % |
(1) Includes revenues from subscriptions to the Company’s news product. News product subscription packages that include access to the Company’s Games and Cooking products are also included in this category. |
(2) Includes revenues from standalone subscriptions to the Company’s Games, Cooking and Audm products. |
(3) Includes free access to some of the Company’s digital products. |
(4) NYT International is the international edition of our print newspaper. |
|
| | | | | | | | | | | | | | | | | | | | | | |
| | | For the Quarters Ended | | | | For the Nine Months Ended | | |
| (In thousands) | | September 24, 2017 |
| | September 25, 2016 |
| | % Change | | September 24, 2017 |
| | September 25, 2016 |
| | % Change |
| Digital-only subscription revenues: | | | | | | | | | | | | |
News product subscription revenues(1) | | $ | 82,073 |
| | $ | 56,144 |
| | 46.2 | % | | $ | 234,234 |
| | $ | 162,344 |
| | 44.3 | % |
Other product subscription revenues(2) | | 3,610 |
| | 2,408 |
| | 49.9 | % | | 9,810 |
| | 6,778 |
| | 44.7 | % |
| Total digital-only subscription revenues | | $ | 85,683 |
| | $ | 58,552 |
| | 46.3 | % | | $ | 244,044 |
| | $ | 169,122 |
| | 44.3 | % |
(1) Includes revenues from subscriptions to the Company’s news product. News product subscription packages that include access to the Company’s Crossword and Cooking products are also included in this category. |
(2) Includes revenues from standalone subscriptions to the Company’s Crossword and Cooking products. |
The following table summarizes digital-onlydigital and print subscriptions as of the end of the thirdsecond quarters of 20172021 and 2016: 2020:
| | | | | | | | | | | | | | | | | | | | |
| | Quarters Ended | | |
| (In thousands) | | June 27, 2021 | | June 28, 2020 | | % Change |
| Digital-only subscriptions: | | | | | | |
News product subscriptions(1) | | 5,334 | | | 4,390 | | | 21.5 | % |
Other product subscriptions(2) | | 1,799 | | | 1,280 | | | 40.5 | % |
| Subtotal digital-only subscriptions | | 7,133 | | | 5,670 | | | 25.8 | % |
| Print subscriptions | | 803 | | | 840 | | | (4.4) | % |
| Total subscriptions | | 7,936 | | | 6,510 | | | 21.9 | % |
(1) Includes subscriptions to the Company’s news product. News product subscription packages that include access to the Company’s Games and Cooking products are also included in this category. |
(2) Includes standalone subscriptions to the Company’s Games, Cooking and Audm products. |
|
| | | | | | | | | |
| | | For the Quarters Ended | | |
| (In thousands) | | September 24, 2017 |
| | September 25, 2016 |
| | % Change |
Digital-only subscriptions(1): | | | | | | |
News product subscriptions(2) | | 2,132 |
| | 1,338 |
| | 59.3 | % |
Other product subscriptions(3) | | 355 |
| | 225 |
| | 57.8 | % |
| Total digital-only subscriptions | | 2,487 |
| | 1,563 |
| | 59.1 | % |
(1) Reflects certain immaterial prior-period corrections. | | | | | | |
(2) Includes subscriptions to the Company’s news product. News product subscription packages that include access to the Company’s Crossword and Cooking products are also included in this category. |
(3) Includes standalone subscriptions to the Company’s Crossword and Cooking products. |
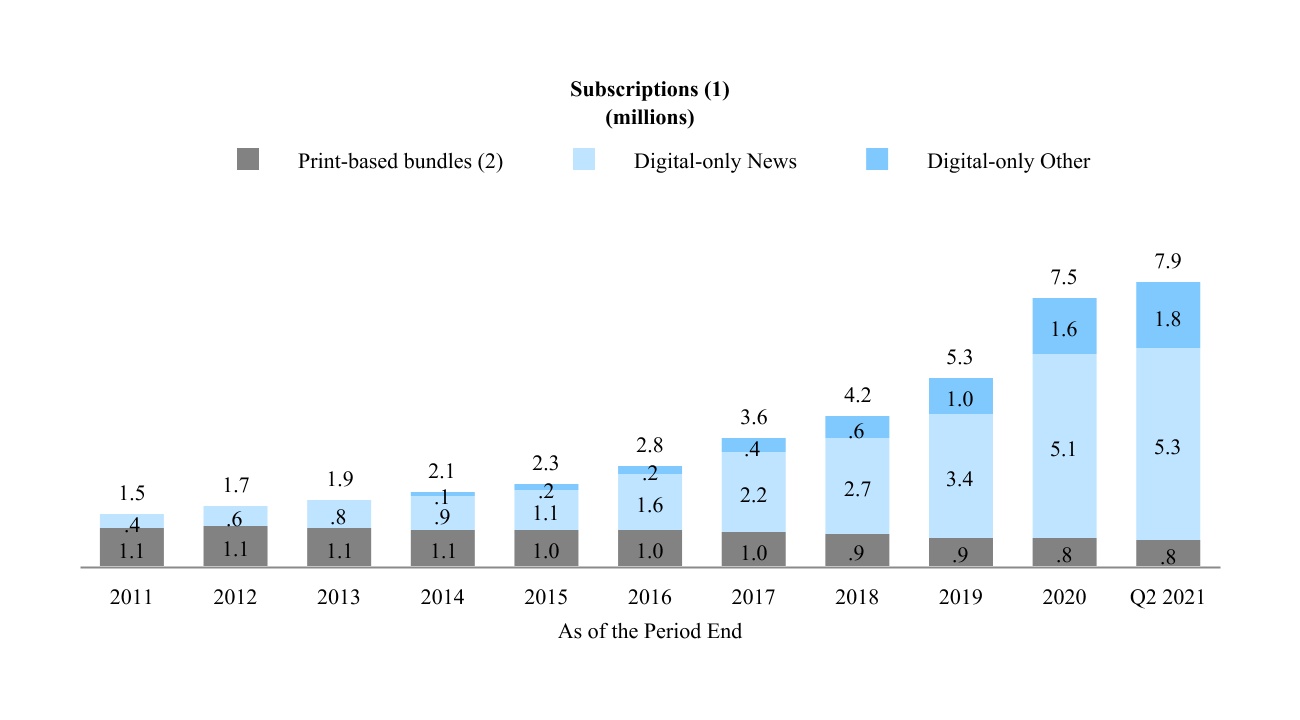
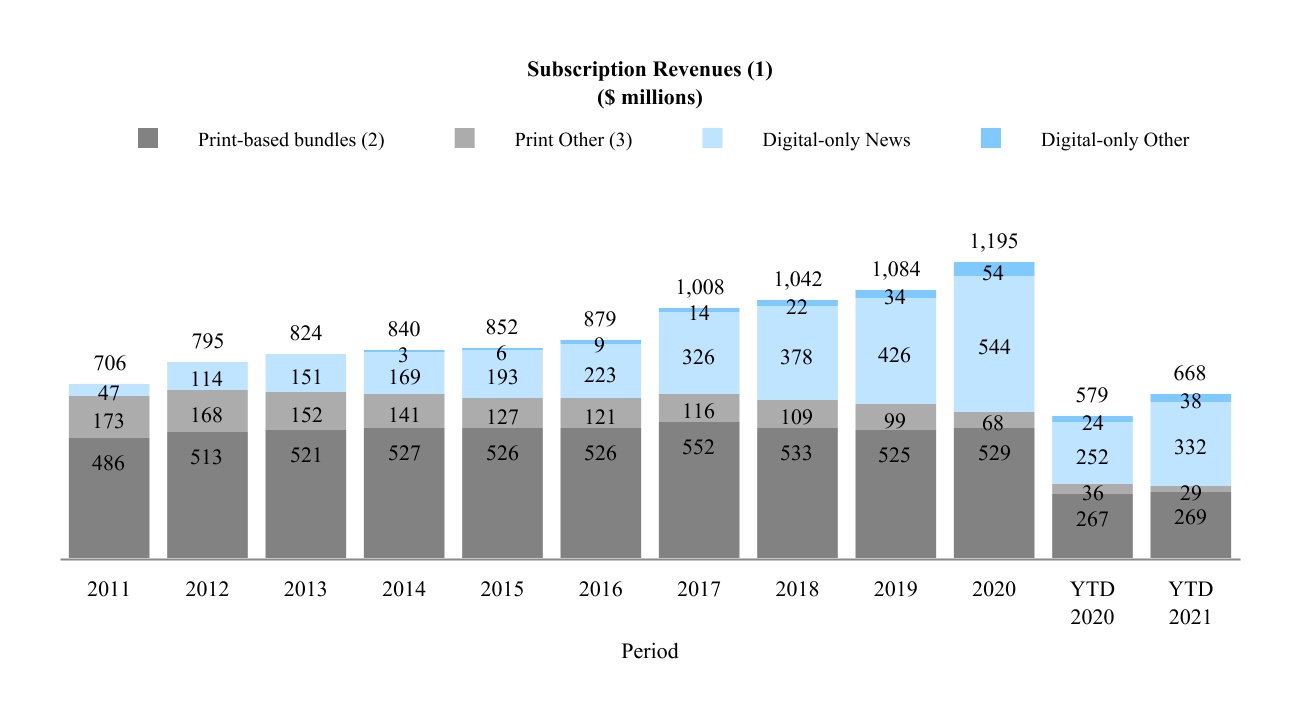
(1) Amounts may not add due to rounding.
(2) Print domestic home delivery subscriptions include free access to some of our digital products.
(3) Print Other includes single-copy, NYT International and other subscription revenues.
Note: Revenues for 2012 and 2017 include the impact of an additional week.
Advertising Revenues
Advertising revenues are derived from the sale of our advertising products and services on our print, web and mobile platforms. These revenues are primarily determined by the volume, rate and mix of advertisements. Display advertising revenue is principally from advertisers (such as technology, financial and luxury goods companies) promoting products, services or brands on digital platforms in the form of display ads, audio and video, and in print, in the form of column-inch ads. Advertising revenue is primarily derived from offerings sold directly to marketers by our advertising sales teams. A smaller proportion of our total advertising revenues is generated through programmatic auctions run by third-party ad exchanges. Advertising revenue is primarily determined by the volume (e.g., impressions), rate and mix of advertisements. Digital advertising includes our core digital advertising business and other digital advertising. Our core digital advertising business includes direct-sold website, mobile application, podcast, email and video advertisements. Direct-sold display advertising, a component of core digital advertising, includes offerings on websites and mobile applications sold directly to marketers by our advertising sales teams. Other digital advertising includes open-market programmatic advertising and creative services fees. Print advertising includes revenue from column-inch ads and on our web and mobile platforms in the form of banners, video, rich media and other interactive ads. Displayclassified advertising, also includes branded content on The Times’s platforms. Classified advertising revenue includesincluding line-ads sold in the major categories of real estate, help wanted, automotive and other. Other advertising revenue primarily includes creative services fees associated with, among other things, our branded content studio; revenue fromas well as preprinted advertising, also known as free-standing inserts;freestanding inserts.
The following table summarizes digital and print advertising revenues for the second quarters and first six months of 2021 and 2020:
| | | | | | | | | | | | | | | | | | | | | | | | | | | | | | | | | | | | | | |
| | For the Quarters Ended | | For the Six Months Ended |
| (In thousands) | | June 27, 2021 | | June 28, 2020 | | % Change | | June 27, 2021 | | June 28, 2020 | | % Change |
| Advertising revenues: | | | | | | | | | | |
| Digital | | $ | 70,995 | | | $ | 39,531 | | | 79.6 | % | | $ | 130,491 | | | $ | 90,689 | | | 43.9 | % |
| Print | | 41,779 | | | 28,229 | | | 48.0 | % | | 79,399 | | | 83,208 | | | (4.6) | % |
| Total advertising | | $ | 112,774 | | | $ | 67,760 | | | 66.4 | % | | $ | 209,890 | | | $ | 173,897 | | | 20.7 | % |
2021 Compared with 2020
Digital advertising revenues, which represented 63.0% of total advertising revenues in the second quarter of 2021, increased $31.5 million, or 79.6%, to $71.0 million compared with $39.5 million in the same prior-year period. The increase was primarily driven by higher direct-sold advertising, including traditional display and podcasts, as well as the impact of the comparison to weak digital advertising revenues in the prior year period caused by reduced advertiser spending during the start of the Covid-19 pandemic. Core digital advertising revenue generated from branded bagsincreased $27.6 million due to growth in direct-sold display advertising and podcast advertising revenues. Direct-sold display impressions increased 77%, while the average rate grew 24%. Other digital advertising revenue increased $3.9 million, primarily due to a 78% increase in creative services fees, as well as a 12.3% increase in open-market programmatic advertising revenue. Programmatic impressions decreased by 47%, while the average rate increased 107%.
Digital advertising revenues, which our newspapers are delivered.
Advertisingrepresented 62.2% of total advertising revenues (printin the first six months of 2021, increased $39.8 million, or 43.9%, to $130.5 million compared with $90.7 million in the same prior-year period. The increase was primarily driven by higher direct-sold advertising, including traditional display and digital)podcasts, as well as the impact of the comparison to weak digital advertising revenues in the prior year period caused by category werereduced advertiser spending during the start of the Covid-19 pandemic. Core digital advertising revenue increased $37.1 million due to growth in direct-sold display advertising revenue and podcast advertising revenues. Direct-sold display impressions increased 16%, while the average rate grew 31%. Other digital advertising revenue increased $2.7 million, primarily due to a 31% increase in creative services fees. Open-market programmatic advertising revenue was flat to prior year as follows:
|
| | | | | | | | | | | | | | | | | | | | | | | | | | | | | | | | | |
| | | For the Quarters Ended | | | | | | |
| | | September 24, 2017 | | September 25, 2016 | | % Change |
| (In thousands) | | Print | | Digital | | Total | | Print | | Digital | | Total | | Print | | Digital | | Total |
| Display | | $ | 56,710 |
| | $ | 41,547 |
| | $ | 98,257 |
| | $ | 72,442 |
| | $ | 38,447 |
| | $ | 110,889 |
| | (21.7 | )% | | 8.1 | % | | (11.4 | )% |
| Classified and Other | | 7,679 |
| | 7,697 |
| | 15,376 |
| | 8,102 |
| | 5,907 |
| | 14,009 |
| | (5.2 | )% | | 30.3 | % | | 9.8 | % |
| Total advertising | | $ | 64,389 |
| | $ | 49,244 |
| | $ | 113,633 |
| | $ | 80,544 |
| | $ | 44,354 |
| | $ | 124,898 |
| | (20.1 | )% | | 11.0 | % | | (9.0 | )% |
|
| | | | | | | | | | | | | | | | | | | | | | | | | | | | | | | | | |
| | | For the Nine Months Ended | | | | | | |
| | | September 24, 2017 | | September 25, 2016 | | % Change |
| (In thousands) | | Print | | Digital | | Total | | Print | | Digital | | Total | | Print | | Digital | | Total |
| Display | | $ | 196,836 |
| | $ | 129,008 |
| | $ | 325,844 |
| | $ | 238,399 |
| | $ | 114,957 |
| | $ | 353,356 |
| | (17.4 | )% | | 12.2 | % | | (7.8 | )% |
| Classified and Other | | 24,966 |
| | 25,085 |
| | 50,051 |
| | 26,156 |
| | 16,221 |
| | 42,377 |
| | (4.5 | )% | | 54.6 | % | | 18.1 | % |
| Total advertising | | $ | 221,802 |
| | $ | 154,093 |
| | $ | 375,895 |
| | $ | 264,555 |
| | $ | 131,178 |
| | $ | 395,733 |
| | (16.2 | )% | | 17.5 | % | | (5.0 | )% |
Print advertising revenues, which represented 56.7%37.0% of total advertising revenues in the second quarter of 2021, increased $13.6 million, or 48.0%, to $41.8 million compared with $28.2 million in the same prior-year period. Print advertising revenues, which represented 37.8% of total advertising revenues in the first six months of 2021, declined $3.8 million, or 4.6%, to $79.4 million compared with $83.2 million in the same prior-year period. The increase in the second quarter of 2021 was primarily in the luxury, media and technology categories, largely due to the impact of the comparison to weak print advertising revenues in the second quarter of 2020 caused by reduced advertiser spending by businesses negatively impacted by the start of the Covid-19 pandemic. The increase in the second quarter of 2021 was partially offset by secular trends. The decline in the first six months of 2021 reflected reduced spending in the first quarter of 2021 on print advertising by businesses negatively impacted by the Covid-19 pandemic and secular trends, partially offset by higher print advertising revenues in the second quarter of 2021 due to the impact of the comparison to weak print advertising revenues in the second quarter of 2020. Decreases, primarily in the entertainment, travel and real estate categories were partially offset by an increase in the media category. We expect reduced advertising spending by these businesses, along with secular trends, to continue to adversely affect our print advertising revenues. Some of our print advertising revenues may not return to pre-pandemic levels once economic conditions improve.
2021 Compared with 2019
Digital advertising revenues for the thirdsecond quarter of 20172021 increased $13.0 million, or 22.4%, to $71.0 million compared with $58.0 million in the second quarter of 2019. The increase was primarily driven by higher direct-sold advertising, including traditional display and 59.0%podcasts. Core digital advertising revenue increased $18.5 million due to growth in podcast advertising revenues and direct-sold display advertising revenues. Direct-sold display impressions increased 13%, while the average rate grew 24%. Other digital advertising revenue decreased $5.5 million, primarily due to the closure of totalour HelloSociety and Fake Love digital marketing agencies, partially offset by a 4.0% increase in open-market programmatic advertising revenue. Programmatic impressions decreased by 24%, while the average rate increased 31%.
Digital advertising revenues for the first ninesix months of 2017, declined 20.1%2021 increased $16.9 million, or 14.9%, to $64.4$130.5 million in the third quarter of 2017 and 16.2% to $221.8compared with $113.6 million in the first ninesix months of 2017, compared with $80.5 million and $264.6 million, respectively, in the same prior-year periods.2019. The decrease in both periodsincrease was primarily driven by a declinehigher direct-sold advertising, including traditional display and podcasts. Core digital advertising revenue increased $26.5 million due to growth in podcast advertising revenues and direct-sold display advertising revenue. Direct-sold display impressions decreased 4%, while the average rate grew 25%. Other digital advertising revenue decreased $9.6 million, primarily due to the closure of our HelloSociety and Fake Love digital marketing agencies, partially offset by a 7.2% increase in open-market programmatic advertising revenue. Programmatic impressions decreased by 3%, while the luxury, travel, real estate, media, technology and telecommunications categories.average rate increased 10%.
Digital advertising revenues, which represented 43.3% of totalPrint advertising revenues for the thirdsecond quarter of 2017 and 41.0%2021 declined $20.9 million, or 33.4%, to $41.8 million compared with $62.7 million in the same period of total2019. Print advertising revenues for the first ninesix months of 2017, increased 11.0%2021 declined $52.9 million, or 40.0%, to $49.2$79.4 million compared with $132.3 million in the third quartersame period of 2017 and 17.5% to $154.1 million in the first nine months of 2017, respectively, compared with $44.4 million and $131.2 million, respectively, in the same prior-year periods.2019. The increasedeclines in both periods primarily reflected increases in revenue from our smartphone platform, programmatic channels and branded content, partially offsetreduced spending on print advertising by abusinesses negatively impacted by the Covid-19 pandemic as well as continued decrease in traditional website display advertising.
Classified and Other advertising revenues increased 9.8% in the third quarter of 2017 and 18.1% in the first nine months of 2017, compared with the same prior-year periods, due to an increase in digital creative services fees.secular trends.
Other Revenues
Other revenues primarily consist of revenues from news services/syndication, digital archives, building rental income,licensing, Wirecutter affiliate referrals, the leasing of floors in the Company Headquarters, commercial printing, retail commerce, television and film, our NYT Live business, e-commercestudent subscription sponsorship program and affiliate referrals.our live events business.
2021 Compared with 2020
Other revenues increased 17.7%8.7% in the thirdsecond quarter of 20172021 and 17.1%decreased 1.6% in the first ninesix months of 2017,2021, compared with the same prior-year periods, largely due toperiods. The increase in the second quarter of 2021 was primarily a result of higher Wirecutter affiliate referral revenues. The decrease in the first six months of 2021 was primarily a result of fewer television episodes as well as lower building rental revenue, associated withlive events revenue and commercial printing revenue, partially offset by higher Wirecutter whichaffiliate referral revenues.
Building rental revenue from the leasing of floors in the Company acquiredHeadquarters totaled $6.6 million and $7.3 million in October 2016.the second quarters of 2021 and 2020, respectively, and $12.8 millionand $15.2 million in the first six months of 2021 and 2020, respectively.
2021 Compared with 2019
Other revenues increased 3.3% in the second quarter of 2021 and increased 5.8% in the first six months, compared with the same periods in 2019. The increase in the second quarter of 2021 was primarily a result of higher Wirecutter affiliate referral revenues and licensing revenue related to Facebook News, partially offset by fewer television episodes and lower live events and commercial printing revenue. The increase in the first six months of 2021 was primarily a result of higher Wirecutter affiliate referral revenues and licensing revenue related to Facebook News, partially offset by lower live events revenue, lower commercial printing revenue and fewer television episodes.
Operating Costs
Operating costs were as follows: |
| | | | | | | | | | | | | | | | | | | | | | |
| | | For the Quarters Ended | | | | For the Nine Months Ended | | |
| (In thousands) | | September 24, 2017 |
| | September 25, 2016 |
| | % Change |
| | September 24, 2017 |
| | September 25, 2016 |
| | % Change |
|
| Production costs: | | | | | | | | | | | | |
| Wages and benefits | | $ | 89,866 |
| | $ | 91,041 |
| | (1.3 | )% | | $ | 269,209 |
| | $ | 274,142 |
| | (1.8 | )% |
| Raw materials | | 15,718 |
| | 18,228 |
| | (13.8 | )% | | 48,461 |
| | 53,115 |
| | (8.8 | )% |
| Other | | 44,336 |
| | 47,347 |
| | (6.4 | )% | | 134,771 |
| | 139,938 |
| | (3.7 | )% |
| Total production costs | | 149,920 |
| | 156,616 |
| | (4.3 | )% | | 452,441 |
| | 467,195 |
| | (3.2 | )% |
| Selling, general and administrative costs | | 184,483 |
| | 184,596 |
| | (0.1 | )% | | 595,491 |
| | 534,911 |
| | 11.3 | % |
| Depreciation and amortization | | 15,677 |
| | 15,384 |
| | 1.9 | % | | 46,961 |
| | 46,003 |
| | 2.1 | % |
| Total operating costs | | $ | 350,080 |
| | $ | 356,596 |
| | (1.8 | )% | | $ | 1,094,893 |
| | $ | 1,048,109 |
| | 4.5 | % |
| | | | | | | | | | | | | | | | | | | | | | | | | | | | | | | | | | | | | | |
| | For the Quarters Ended | | | | For the Six Months Ended | | |
| (In thousands) | | June 27, 2021 | | June 28, 2020 | | % Change | | June 27, 2021 | | June 28, 2020 | | % Change |
| Operating costs: | | | | | | | | | | | | |
| Cost of revenue (excluding depreciation and amortization) | | $ | 251,358 | | | $ | 229,913 | | | 9.3 | % | | $ | 502,355 | | | $ | 473,397 | | | 6.1 | % |
| Sales and marketing | | 53,555 | | | 39,605 | | | 35.2 | % | | 113,708 | | | 113,389 | | | 0.3 | % |
| Product development | | 39,699 | | | 30,983 | | | 28.1 | % | | 78,642 | | | 61,985 | | | 26.9 | % |
| General and administrative | | 62,283 | | | 58,812 | | | 5.9 | % | | 118,860 | | | 111,673 | | | 6.4 | % |
| Depreciation and amortization | | 14,486 | | | 15,631 | | | (7.3) | % | | 29,203 | | | 30,816 | | | (5.2) | % |
| Total operating costs | | $ | 421,381 | | | $ | 374,944 | | | 12.4 | % | | $ | 842,768 | | | $ | 791,260 | | | 6.5 | % |
Production CostsCost of Revenue (excluding depreciation and amortization)
ProductionCost of revenue includes all costs include items such as labor costs, raw materials, and machinery and equipment expenses related to news-gatheringcontent creation, subscriber and advertiser servicing, and print production activity,and distribution as well as infrastructure costs related to producing branded content.delivering digital content, which include all cloud and cloud-related costs as well as compensation for employees that enhance and maintain our platforms.
Production costs decreased2021 Compared with 2020
Cost of revenue increased in the thirdsecond quarter of 20172021 by $21.4 million, or 9.3%, compared with the thirdsecond quarter of 2016,2020, largely due to higher journalism costs of $17.9 million, higher subscriber servicing costs of $2.9 million, and higher advertising servicing costs of $2.8 million. The increases were partially offset by lower print production and distribution costs of $2.5 million. The increase in journalism costs was largely driven by growth in the number of employees in the newsroom, Games, Cooking and audio, costs in connection with the production of audio content and a higher incentive compensation accrual. The increase in subscriber servicing costs was primarily due to higher credit card processing fees and third-party commissions due to increased subscriptions. Advertising servicing costs increased primarily due to higher incentive compensation and higher outside services costs. The decrease in other expenses ($3.0 million)print production and distribution costs was largely due to lower outside printing and distribution costs.
Cost of revenue increased in the first six months of 2021 by $29.0 million, or 6.1%, raw materials ($2.5 million)compared with the first six months of 2020, largely due to higher journalism costs of $27.1 million, higher subscriber servicing costs of $7.6 million, and wagehigher digital content delivery costs of $4.2 million. The increases were partially offset by lower print production and benefits ($1.2 million). Other expensesdistribution costs of $11.7 million. The increase in journalism costs was largely driven by growth in the number of employees in the newsroom, Games, Cooking and audio, costs in connection with the production of audio content and a higher incentive compensation accrual. This cost growth was partially offset by lower content creation costs as a result of fewer television episodes. The increase in subscriber servicing costs was primarily due to higher credit card processing fees and third-party commissions due to increased subscriptions. Digital content delivery costs increased due to a higher incentive compensation accrual and higher cloud storage costs. The decrease in print production and distribution costs was largely due to lower newsprint consumption and pricing, as well as lower outside printing and distribution costs.
2021 Compared with 2019
Cost of revenue increased in the second quarter of 2021 by $6.4 million, or 2.6%, compared with the second quarter of 2019, largely due to higher journalism costs of $19.8 million, higher subscriber servicing costs of $5.7 million, and higher digital content delivery costs of $5.3 million. The increases were partially offset by lower print production and distribution costs of $20.0 million and lower advertising servicing costs of $4.4 million. The increase in journalism costs was largely driven by growth in the number of employees in the newsroom, Games, Cooking and audio, costs in connection with the production of audio content and a higher incentive compensation accrual. The increase in subscriber servicing costs was primarily due to higher credit card processing fees and third-party commissions due to increased subscriptions. Digital content delivery costs increased due to an increase in the number of employees and higher cloud-related costs. The decrease in print production and distribution costs was largely due to lower distribution costs, lower newsprint consumption and pricing, and lower outside printing costs. Advertising servicing costs decreased primarily as a result of lower outside printing expenses and costs related to coverage of the 2016 presidential election that did not recur in 2017. Raw materials expense decreased due to lower newsprint and magazine consumption. Wage and benefits expense decreased due to the streamliningclosure of our international operations in 2016.HelloSociety and Fake Love digital marketing agencies, as well as lower volume of creative services campaigns and live events.
Production costs decreasedCost of revenue increased in the first ninesix months of 20172021 by $18.2 million, or 3.8%, compared with the first ninesix months of 2016,2019, largely due to higher journalism costs of $42.8 million, higher subscriber servicing costs of $11.8 million, and higher digital content delivery costs of $11.5 million. The increases were partially offset by lower print production and distribution costs of $40.0 million and lower advertising costs of $7.8 million. The increase in journalism costs was largely driven by growth in the number of employees in the newsroom, Games, Cooking and audio, costs in connection with the production of audio content and a higher incentive compensation accrual. The increase in subscriber servicing costs was primarily due to higher credit card processing fees and third-party commissions due to increased subscriptions. Digital content delivery costs increased due to growth in the number of employees and higher cloud storage costs. The decrease in other expenses ($5.2 million), wageprint production and benefits ($4.9 million),distribution costs was largely due to fewer print copies produced and raw materials ($4.7 million). Other expenseslower newsprint pricing, as well as lower distribution costs and outside printing costs. Advertising servicing costs decreased primarily as a result of lower outside printing expenses. Wagethe closure of our HelloSociety and benefits expense decreasedFake Love digital marketing agencies as well as fewer live events.
Sales and Marketing
Sales and marketing includes costs related to the Company’s marketing efforts as well as advertising sales costs.
2021 Compared with 2020
Sales and marketing costs in the second quarter of 2021 increased by $14.0 million, or 35.2%, compared with the second quarter of 2020, primarily due to higher subscription-related media spending, which the streamliningCompany had reduced during the start of our international operationsthe Covid-19 pandemic.
Sales and marketing costs in 2016. Raw materials expense decreased due to lower newsprint and magazine paper consumption,the first six months of 2021 remained relatively flat compared with the first six months of 2020. The increase in marketing costs resulting from higher subscription-related media expenses was partially offset by lower advertising sales costs.
Media expenses, a component of sales and marketing costs that represents the cost to promote our subscription business, increased to $29.0 million in the second quarter of 2021 from $16.5 million in the second quarter of 2020 and increased to $64.9 million in the first six months of 2021 from $61.9 million in the first six months of 2020 as the Company increased its marketing spend.
2021 Compared with 2019
Sales and marketing costs in the second quarter of 2021 decreased by $8.7 million, or 14.0%, compared with the second quarter of 2019, primarily as a result of the closure of our HelloSociety and Fake Love digital marketing agencies and lower media expenses.
Sales and marketing costs in the first six months of 2021 decreased by $23.4 million, or 17.1%, compared with the first six months of 2019. The decrease in sales and marketing costs are primarily a result of the factors identified above.
Media expenses decreased to $29.0 million in the second quarter of 2021 from $33.9 million in the second quarter of 2019 and decreased to $64.9 million in the first six months of 2021 from $78.7 million in the first six months of 2019 as the Company reduced its marketing spend during the Covid-19 pandemic.
Product Development
Product development includes costs associated with the Company’s investment into developing and enhancing new and existing product technology, including engineering, product development and data insights.
2021 Compared with 2020
Product development costs in the second quarter of 2021 increased by $8.7 million, or 28.1%, compared with the second quarter of 2020, largely due to growth in the number of digital product development employees in connection with digital subscription strategic initiatives as well as a higher newsprint pricing.incentive compensation accrual.
Selling, Product development costs in the first six months of 2021 increased by $16.7 million, or 26.9%, compared with the first six months of 2020, largely due to the factors identified above.
2021 Compared with 2019
Product development costs in the second quarter of 2021 increased by $14.2 million, or 55.5%, compared with the second quarter of 2019, largely due to growth in the number of digital product development employees to support our digital subscription strategic initiatives as well as a higher incentive compensation accrual.
Product development costs in the first six months of 2021 increased by $29.2 million, or 59.1%, compared with the first six months of 2019, largely due to the factors identified above.
General and Administrative Costs
Selling, generalGeneral and administrative costs include general management, corporate enterprise technology, building operations, unallocated overhead costs, associatedseverance and multiemployer pension plan withdrawal costs.
2021 Compared with the selling, marketing and distribution of products as well as administrative expenses.2020
Selling, generalGeneral and administrative costs in the thirdsecond quarter of 2017 were flat2021 increased by $3.5 million, or 5.9%, compared with the thirdsecond quarter of 2016 as lower severance costs ($10.9 million) were primarily offset by an increase in compensation costs ($4.8 million), promotion and marketing costs ($3.4 million) and other operating costs ($3.4 million).
Selling, general and administrative costs increased in the first nine months of 2017 compared with the first nine months of 2016,2020, primarily due to an increasegrowth in the number of employees, higher outside services and a higher incentive compensation costs ($25.6 million), promotion and marketing costs ($22.2 million) andaccrual, partially offset by severance costs ($4.7 million). Compensation costs increased primarily as a result of an increase in variable compensation expenses and increased hiring to support digital growth initiatives. Promotion and marketing costs increased due to increased spending to promote our brand and subscription business. Severance costs increased due to a workforce reduction announcedexpense in the second quarter of 20172020 compared with no expense in the second quarter of 2021.
General and administrative costs in the first six months of 2021 increased by $7.2 million, or 6.4%, compared with the first six months of 2020, primarily affecting our newsroom.due to a higher incentive compensation accrual, higher outside services and growth in the number of employees, partially offset by a severance charge in the second quarter of 2020, a favorable fair market value adjustment in 2021, and lower building operations and maintenance costs in 2021.
2021 Compared with 2019
General and administrative costs in the second quarter of 2021 increased by $11.9 million, or 23.6%, compared with the second quarter of 2019, primarily due to growth in the number of employees, mainly in the enterprise technology and human resources departments in support of employee growth in other areas, higher outside services and a higher incentive compensation accrual.
General and administrative costs in the first six months of 2021 increased by $16.8 million, or 16.5%, compared with the first six months of 2019, largely due to the factors identified above, partially offset by a favorable fair market value adjustment.
Depreciation and Amortization
2021 Compared with 2020
Depreciation and amortization costs increased in the thirdsecond quarter and the first ninesix months of 20172021 decreased $1.1 million, or 7.3%, and $1.6 million, or 5.2%, respectively, compared with the same prior-year period, primarilyperiod. The decrease in both periods is due to lower depreciation of software assets.
2021 Compared with 2019
Depreciation and amortization costs in the Company’s acquisitionsecond quarter and first six months of The Wirecutter.
Other Items2021 compared with the same periods in 2019 were flat.
See Note 7 of the Notes to the Condensed Consolidated Financial Statements for additional information regarding other items, including costs related to the redesign of our headquarters building.items.
NON-OPERATING ITEMS
Joint VenturesOther Components of Net Periodic Benefit Costs
See Note 59 of the Notes to the Condensed Consolidated Financial Statements for information regarding our joint venture investments.other components of net periodic benefit costs.
Interest Expense, NetIncome and other, net
See Note 67 of the Notes to the Condensed Consolidated Financial Statements for information regarding interest expense.income/(expense) and other, net.
Income Taxes
See Note 10 of the Notes to the Condensed Consolidated Financial Statements for information regarding income taxes.
Non-GAAP Financial Measures
We have included in this report certain supplemental financial information derived from consolidated financial information but not presented in our financial statements prepared in accordance with GAAP. Specifically, we have referred to the following non-GAAP financial measures in this report:
•diluted earnings per share from continuing operations excluding severance, non-operating retirement costs and the impact of special items (or adjusted diluted earnings per share from continuing operations);
•operating profit before depreciation, amortization, severance, non-operating retirementmultiemployer pension plan withdrawal costs and special items (or adjusted operating profit); and
•operating costs before depreciation, amortization, severance and non-operating retirementmultiemployer pension plan withdrawal costs (or adjusted operating costs).
The special itemsitem in 20172021 consisted of:
•a $30.1$3.8 million charge ($2.8 million or $0.02 per share after tax) in the second quarter resulting from the termination of a tenant’s lease in our headquarters building.
The special item in 2020 consisted of:
•a $10.1 million gain ($16.1 million after tax and net of noncontrolling interest or $.10 per share) from the sale of the remaining assets at a paper mill previously operated by Madison Paper Industries (“Madison”), in which the Company has an investment through a subsidiary, in the third quarter; and
expenses of $2.5 million ($1.57.4 million after tax or $.01$0.04 per share), $2.0 million ($1.2 million after tax or $.01 per share) and $2.4 million ($1.4 million after tax or $.01 per share) related to the ongoing redesign and consolidation of space in our headquarters building in the third, second and first quarters, respectively.
The special items in 2016 consisted of:
charges of $2.9 million ($1.8 million after tax or $.01 per share) and $11.9 million ($7.1 million after tax or $.04 per share) in connection with the streamlining of the Company’s international print operations (primarily consisting of severance costs) in the third and second quarters, respectively;
an $11.7 million charge ($7.0 million after tax or $.04 per share) for a partial withdrawal obligation under a multiemployer pension plan following an unfavorable arbitration decision in the second quarter, $5.0 million ($3.0 million after tax or $.02 per share) of which was reimbursed to the Company in the third quarter; and
a $41.4 million loss ($20.1 million after tax and net of the noncontrolling interest or $0.13 per share) from joint ventures in the first quarter related to a non-marketable equity investment transaction. The gain is comprised of $2.5 million realized gain due to the announced closurepartial sale of the investment and a paper mill operated by Madison.$7.6 million unrealized gain due to the mark to market of the remaining investment, and is included in Interest income and other, net in our Condensed Consolidated Statements of Operations.
There were no special items in 2019.
We have included these non-GAAP financial measures because management reviews them on a regular basis and uses them to evaluate and manage the performance of our operations. We believe that, for the reasons outlined below, these non-GAAP financial measures provide useful information to investors as a supplement to reported diluted earnings/(loss) per share from continuing operations, operating profit/(loss) and operating costs. However, these measures should be evaluated only in conjunction with the comparable GAAP financial measures and should not be viewed as alternative or superior measures of GAAP results.
Adjusted diluted earnings per share provides useful information in evaluating ourthe Company’s period-to-period performance because it eliminates items that we dothe Company does not consider to be indicative of earnings from ongoing operating activities. Adjusted operating profit is useful in evaluating the ongoing performance of ourthe Company’s businesses as it excludes the significant non-cash impact of depreciation and amortization as well as items not indicative of ongoing operating activities. Total operating costs include depreciation, amortization, severance and non-operating retirementmultiemployer pension plan withdrawal costs. AdjustedTotal operating costs, which excludeexcluding these items, provide investors with helpful supplemental information on ourthe Company’s underlying operating costs that is used by management in its financial and operational decision-making.
Management considers special items, which may include impairment charges, pension settlement charges and other items that arise from time to time, to be outside the ordinary course of our operations. Management believes that excluding these items provides a better understanding of the underlying trends in the Company’s operating performance and allows more accurate comparisons of the Company’s operating results to historical performance. In addition, management excludes severance costs, which may fluctuate significantly from quarter to quarter, because it believes these costs do not necessarily reflect expected future operating costs and do not contribute to a meaningful comparison of the Company’s operating results to historical performance.
Non-operatingIncluded in our non-GAAP financial measures are non-operating retirement costs include:
interest cost, expected return on plan assets and amortization of actuarial gain and loss components of pension expense;
interest cost and amortization of actuarial gain and loss components of retiree medical expense; and
all expenses associated with multiemployer pension plan withdrawal obligations, not otherwise included as special items.
These non-operating retirement costswhich are primarily tied to financial market performance and changes in market interest rates and investment performance. Non-operating retirement costs do not include service costs and amortization of prior service costs for pension and retiree medical benefits, which we believe reflect the ongoing operating costs of providing pension and retiree medical benefits to our employees. We considerManagement considers non-operating retirement costs to be outside the performance of our ongoing corethe business operations and believebelieves that presenting operating resultsadjusted diluted earnings per share from continuing operations excluding non-operating retirement costs and presenting adjusted operating results excluding multiemployer pension plan withdrawal costs, in addition to ourthe Company’s GAAP diluted earnings per share from continuing
operations and GAAP operating results, providesprovide increased transparency and a better understanding of the underlying trends in ourthe Company’s operating business performance.
Reconciliations of these non-GAAP financial measures to the most directly comparable GAAP measures are set out in the tables below.
|
| | | | | | | | | | | | | | | | | | | | | | |
| Reconciliation of diluted earnings per share from continuing operations excluding severance, non-operating retirement costs and special items (or adjusted diluted earnings per share from continuing operations) |
| | | For the Quarters Ended | | | | For the Nine Months Ended | | |
| | | September 24, 2017 |
| | September 25, 2016 |
| | % Change | | September 24, 2017 |
| | September 25, 2016 |
| | % Change |
| Diluted earnings/(loss) per share from continuing operations | | $ | 0.20 |
| | $ | — |
| | * |
| | $ | 0.37 |
| | $ | (0.05 | ) | | * |
|
| Add: | | | | | | | | | | | | |
| Severance | | 0.01 |
| | 0.08 |
| | (87.5 | )% | | 0.14 |
| | 0.11 |
| | 27.3 | % |
| Non-operating retirement costs | | 0.02 |
| | 0.02 |
| | * |
| | 0.06 |
| | 0.08 |
| | (25.0 | )% |
| Special items: | | | | | | | | | | | | |
| Headquarters redesign and consolidation | | 0.02 |
| | — |
| | * |
| | 0.04 |
| | — |
| | * |
|
| Restructuring charge | | — |
| | 0.02 |
| | * |
| | — |
| | 0.09 |
| | * |
|
| Multiemployer pension plan withdrawal (income)/expense | | — |
| | (0.03 | ) | | * |
| | — |
| | 0.04 |
| | * |
|
| (Gain)/loss from joint ventures, net of noncontrolling interest | | (0.16 | ) | | — |
| | * |
| | (0.16 | ) | | 0.21 |
| | * |
|
| Income tax expense/(benefit) of adjustments | | 0.04 |
| | (0.04 | ) | | * |
| | (0.03 | ) | | (0.21 | ) | | (85.7 | )% |
Adjusted diluted earnings per share from continuing operations (1) | | $ | 0.13 |
| | $ | 0.06 |
| | * |
| | $ | 0.42 |
| | $ | 0.27 |
| | 55.6 | % |
| | | | | | | | | | | | | | | | | | | | | | | | | | | | | | | | | | | | | | |
| Reconciliation of diluted earnings per share from continuing operations excluding severance, non-operating retirement costs and special items (or adjusted diluted earnings per share from continuing operations) |
| | For the Quarters Ended | | | | For the Six Months Ended | | |
| | June 27, 2021 | | June 28, 2020 | | % Change | | June 27, 2021 | | June 28, 2020 | | % Change |
| Diluted earnings per share from continuing operations | | $ | 0.32 | | | $ | 0.14 | | | * | | $ | 0.57 | | | $ | 0.34 | | | 67.6 | % |
| Add: | | | | | | | | | | | | |
| Severance | | — | | | 0.04 | | | * | | — | | | 0.04 | | | * |
| Non-operating retirement costs: | | | | | | | | | | | | |
| Multiemployer pension plan withdrawal costs | | 0.01 | | | 0.01 | | | — | | | 0.02 | | | 0.02 | | | — | |
| Other components of net periodic benefit costs | | 0.02 | | | 0.01 | | | * | | 0.03 | | | 0.03 | | | — | |
| Special items: | | | | | | | | | | | | |
| | | | | | | | | | | | |
| | | | | | | | | | | | |
| | | | | | | | | | | | |
| | | | | | | | | | | | |
| Gain from non-marketable equity security | | — | | | — | | | * | | — | | | (0.06) | | | * |
| Lease termination charge | | 0.02 | | | — | | | * | | 0.02 | | | — | | | * |
| Income tax expense of adjustments | | (0.01) | | | (0.02) | | | (50.0) | % | | (0.02) | | | (0.01) | | | * |
Adjusted diluted earnings per share from continuing operations(1) | | $ | 0.36 | | | $ | 0.18 | | | * | | $ | 0.62 | | | $ | 0.35 | | | 77.1 | % |
(1)Amounts may not add due to rounding.
| |
* | Represents a change equal to or in excess of 100% or not meaningful |
* Represents a change equal to or in excess of 100% or not meaningful.
| | | | | | | | | | | | | | | | | | | | | | | | | | | | | | | | |
| Reconciliation of operating profit before depreciation and amortization, severance, multiemployer pension plan withdrawal costs and special items (or adjusted operating profit) |
| | | | | | | | | | |
| | For the Quarters Ended |
| | 2021 | | 2020 | | 2021 vs 2020 % Change | | 2019 | | 2021 vs 2019 % Change |
| Operating profit | | $ | 73,285 | | | $ | 28,806 | | | * | | $ | 37,933 | | | 93.2 | % |
| Add: | | | | | | | | | | |
| Depreciation and amortization | | 14,486 | | | 15,631 | | | (7.3) | % | | 15,180 | | | (4.6) | % |
| Severance | | — | | | 6,305 | | | * | | 672 | | | * |
| Multiemployer pension plan withdrawal costs | | 1,301 | | | 1,400 | | | (7.1) | % | | 1,801 | | | (27.8) | % |
| Special items: | | | | | | | | | | |
| Lease termination charge | | 3,831 | | | — | | | * | | — | | | * |
| Adjusted operating profit | | $ | 92,903 | | | $ | 52,142 | | | 78.2 | % | | $ | 55,586 | | | 67.1 | % |
| | | | | | | | | | |
| * Represents a change equal to or in excess of 100% or not meaningful. |
|
| | | | | | | | | | | | | | | | | | | | | | |
| Reconciliation of operating profit before depreciation & amortization, severance, non-operating retirement costs and special items (or adjusted operating profit) |
| | | For the Quarters Ended | | | | For the Nine Months Ended | | |
| (In thousands) | | September 24, 2017 |
| | September 25, 2016 |
| | % Change |
| | September 24, 2017 |
| | September 25, 2016 |
| | % Change |
|
| Operating profit | | $ | 33,013 |
| | $ | 8,973 |
| | * |
| | $ | 89,691 |
| | $ | 46,049 |
| | 94.8 | % |
| Add: | | | | | | | | | | | | |
| Depreciation & amortization | | 15,677 |
| | 15,384 |
| | 1.9 | % | | 46,961 |
| | 46,003 |
| | 2.1 | % |
| Severance | | 2,123 |
| | 13,006 |
| | (83.7 | )% | | 22,977 |
| | 18,262 |
| | 25.8 | % |
| Non-operating retirement costs | | 3,100 |
| | 3,845 |
| | (19.4 | )% | | 9,642 |
| | 13,349 |
| | (27.8 | )% |
| Special items: | | | | | | | | | | | | |
| Headquarters redesign and consolidation | | 2,542 |
| | — |
| | * |
| | 6,929 |
| | — |
| | * |
|
| Restructuring charge | | — |
| | 2,949 |
| | * |
| | — |
| | 14,804 |
| | * |
|
| Multiemployer pension plan withdrawal (income)/expense | | — |
| | (4,971 | ) | | * |
| | — |
| | 6,730 |
| | * |
|
| Adjusted operating profit | | $ | 56,455 |
| | $ | 39,186 |
| | 44.1 | % | | $ | 176,200 |
| | $ | 145,197 |
| | 21.4 | % |
| | | | | | | | | | | | | | | | | | | | | | | | | | | | | | | | |
| Reconciliation of operating costs before depreciation and amortization, severance and multiemployer pension plan withdrawal costs (or adjusted operating costs) |
| | | | | | | | | | |
| | For the Quarters Ended |
| | 2021 | | 2020 | | 2021 vs 2020 % Change | | 2019 | | 2021 vs 2019 % Change |
| Operating costs | | $ | 421,381 | | | $ | 374,944 | | | 12.4 | % | | $ | 398,325 | | | 5.8 | % |
| Less: | | | | | | | | | | |
| Depreciation & amortization | | 14,486 | | | 15,631 | | | (7.3) | % | | 15,180 | | | (4.6) | % |
| Severance | | — | | | 6,305 | | | * | | 672 | | | * |
| Multiemployer pension plan withdrawal costs | | 1,301 | | | 1,400 | | | (7.1) | % | | 1,801 | | | (27.8) | % |
| Adjusted operating costs | | $ | 405,594 | | | $ | 351,608 | | | 15.4 | % | | $ | 380,672 | | | 6.5 | % |
| | | | | | | | | | |
| * Represents a change equal to or in excess of 100% or not meaningful. |
| |
* | Represents a change equal to or in excess of 100% or not meaningful |
| | | | | | | | | | | | | | | | | | | | | | | | | | | | | | | | |
| Reconciliation of operating profit before depreciation and amortization, severance, multiemployer pension plan withdrawal costs and special items (or adjusted operating profit) |
| | | | | | | | | | |
| | For the Six Months Ended |
| | 2021 | | 2020 | | 2021 vs 2020 % Change | | 2019 | | 2021 vs 2019 % Change |
| Operating profit | | $ | 124,943 | | | $ | 56,126 | | | * | | $ | 72,531 | | | 72.3 | % |
| Add: | | | | | | | | | | |
| Depreciation and amortization | | 29,203 | | | 30,816 | | | (5.2) | % | | 30,098 | | | (3.0) | % |
| Severance | | 406 | | | 6,675 | | | (93.9) | % | | 2,075 | | | (80.4) | % |
| Multiemployer pension plan withdrawal costs | | 2,627 | | | 2,823 | | | (6.9) | % | | 3,250 | | | (19.2) | % |
| Special items: | | | | | | | | | | |
| Lease termination charge | | 3,831 | | | — | | | * | | — | | | * |
| Adjusted operating profit | | $ | 161,010 | | | $ | 96,440 | | | 67.0 | % | | $ | 107,954 | | | 49.1 | % |
| | | | | | | | | | |
| * Represents a change equal to or in excess of 100% or not meaningful. |
| | | | | | | | | | | | | | | | | | | | | | | | | | | | | | | | |
| Reconciliation of operating costs before depreciation and amortization, severance and multiemployer pension plan withdrawal costs (or adjusted operating costs) |
| | | | | | | | | | |
| | For the Six Months Ended |
| | 2021 | | 2020 | | 2021 vs 2020 % Change | | 2019 | | 2021 vs 2019 % Change |
| Operating costs | | $ | 842,768 | | | $ | 791,260 | | | 6.5 | % | | $ | 802,789 | | | 5.0 | % |
| Less: | | | | | | | | | | |
| Depreciation & amortization | | 29,203 | | | 30,816 | | | (5.2) | % | | 30,098 | | | (3.0) | % |
| Severance | | 406 | | | 6,675 | | | (93.9) | % | | 2,075 | | | (80.4) | % |
| Multiemployer pension plan withdrawal costs | | 2,627 | | | 2,823 | | | (6.9) | % | | 3,250 | | | (19.2) | % |
| Adjusted operating costs | | $ | 810,532 | | | $ | 750,946 | | | 7.9 | % | | $ | 767,366 | | | 5.6 | % |
| | | | | | | | | | |
| * Represents a change equal to or in excess of 100% or not meaningful. |
|
| | | | | | | | | | | | | | | | | | | | | | |
| Reconciliation of operating costs before depreciation & amortization, severance and non-operating retirement costs (or adjusted operating costs) |
| | | For the Quarters Ended | | | | For the Nine Months Ended | | |
| (In thousands) | | September 24, 2017 |
| | September 25, 2016 |
| | % Change |
| | September 24, 2017 |
| | September 25, 2016 |
| | % Change |
|
| Operating costs | | $ | 350,080 |
| | $ | 356,596 |
| | (1.8 | )% | | $ | 1,094,893 |
| | $ | 1,048,109 |
| | 4.5 | % |
| Less: | | | | | | | | | | | | |
| Depreciation & amortization | | 15,677 |
| | 15,384 |
| | 1.9 | % | | 46,961 |
| | 46,003 |
| | 2.1 | % |
| Severance | | 2,123 |
| | 13,006 |
| | (83.7 | )% | | 22,977 |
| | 18,262 |
| | 25.8 | % |
| Non-operating retirement costs | | 3,100 |
| | 3,845 |
| | (19.4 | )% | | 9,642 |
| | 13,349 |
| | (27.8 | )% |
| Adjusted operating costs | | $ | 329,180 |
| | $ | 324,361 |
| | 1.5 | % | | $ | 1,015,313 |
| | $ | 970,495 |
| | 4.6 | % |
| |
* | Represents a change equal to or in excess of 100% or not meaningful |
LIQUIDITY AND CAPITAL RESOURCES
We believe our cash balance and cash provided by operations, in combination with other sources of cash, will be sufficient to meet our financing needs over the next twelve months. Although there is uncertainty related to the anticipated continued effect of the Covid-19 pandemic on our business (as referenced above and in “Item 1A — Risk Factors” in our Annual Report on Form 10-K for the year ended December 27, 2020), given the strength of our balance sheet and based on the information currently available to us, we do not expect the impact of the pandemic to have a material impact on our liquidity position. As of September 24, 2017,June 27, 2021, we had cash, cash equivalents and short- and long-term marketable securities of $822.9 million and total debt and capital lease obligations of $249.4 million. Accordingly, our cash, cash equivalents and marketable securities exceeded total debt and capital lease obligations by $573.5$946.6 million. Our cash and investmentmarketable securities balances have increased sincebetween the end of 2016,2020 and June 27, 2021, increased, primarily due to higher cash proceeds from operating activities, partially offset by cashdividend payments, capital expenditures of $47.8 million.and share-based compensation tax withholding.
We have paid quarterly dividends on the Class A and Class B Common Stock each quarter since late 2013. In February 2021, the Board of $.04Directors approved an increase in the quarterly dividend to $0.07 per share, which was paid in April 2021. On June 30, 2021, the Board of Directors declared a quarterly dividend of $0.07 per share on the Class A and Class B Common Stock, since late 2013.which was paid in July 2021. We currently expect to continue to pay comparable cash dividends in the future, although changes in our dividend programdividends will be considered by our Board of Directors in light of our earnings, capital requirements, financial condition and other factors considered relevant.
The Company and UPM-Kymmene Corporation (“UPM”), a Finnish paper manufacturing company, are partners through subsidiary companies in Madison, which previously operated a supercalendered paper mill in Maine. The Company’s 40% ownership of Madison is through an 80%-owned consolidated subsidiary that owns 50% of Madison. UPM owns 60% of Madison, including a 10% interest through a 20% noncontrolling interest in the consolidated subsidiary of the Company. The paper mill was closed in May 2016. The Company’s joint venture in Madison is currently being liquidated. In the fourth quarter of 2016, Madison sold certain assets at the mill site and we recognized a gain of $3.9 million related to the sale. During the third quarter of 2017, the Company recognized a $30.1 million gain related to the sale of the remaining assets (which primarily consisted of hydro power assets). The Company’s proportionate share of the gain was $16.1 million after tax and net of noncontrolling interest. See Note 5 of the Notes to the Condensed Consolidated Financial Statements for more information on the Company’s investment in Madison.
As part of our continued effort to reduce the size and volatility of our pension obligations, in October 2017, the Company entered into agreements with an insurance company to transfer future benefit obligations and annuity administration of certain retirees in two of the Company’s qualified pension plans. Additionally, as part of our management of the funded status of our qualified pension plans, in October 2017, the Company made a $100 million aggregate contribution to these pension plans, which was funded by cash on hand. See Note 15 of the Notes to the Condensed Consolidated Financial Statements for additional information.
Capital Resources
Sources and Uses of Cash
Cash flows provided by/(used in) by category were as follows:
|
| | | | | | | | | | | |
| | | For the Nine Months Ended | | |
| (In thousands) | | September 24, 2017 |
| | September 25, 2016 |
| | % Change |
|
| Operating activities | | $ | 147,895 |
| | $ | 85,643 |
| | 72.7 | % |
| Investing activities | | $ | 15,607 |
| | $ | 10,212 |
| | 52.8 | % |
| Financing activities | | $ | (19,739 | ) | | $ | (44,859 | ) | | (56.0 | )% |
* Represents a change equal to or in excess of 100% or not meaningful | | | | | | | | | | | | | | | | | | | | |
| | For the Six Months Ended | | |
| (In thousands) | | June 27, 2021 | | June 28, 2020 | | % Change |
| Operating activities | | $ | 110,434 | | | $ | 118,590 | | | (6.9) | % |
| Investing activities | | $ | (46,332) | | | $ | (72,938) | | | (36.5) | % |
| Financing activities | | $ | (30,285) | | | $ | (28,192) | | | 7.4 | % |
Operating Activities
Cash from operating activities is generated by cash receipts from subscriptions, advertising sales and other revenue transactions.revenue. Operating cash outflows include payments for employee compensation, pension and other benefits, raw materials, interestmarketing expenses and income taxes.
Net cash provided by operating activities increaseddecreased in the first ninesix months of 20172021 compared with the same prior-year period primarily due to lower cash collections from accounts receivable, an increase in other assets and lower cash payments received from prepaid subscriptions, partially offset by higher subscription revenue,net income adjusted for non-cash items and lower income taxcash payments highermade to settle accounts payable, accrued payroll and a higher balance of unexpired subscriptions (or subscription revenue that has not yet been recognized).other liabilities.
Investing Activities
Cash from investing activities generally includes proceeds from marketable securities that have matured and the sale of assets, investments or a business. Cash used in investing activities generally includes purchases of marketable securities, payments for capital projects restricted cash,and acquisitions of new businesses and investments.
Net cash provided byused in investing activities in the first ninesix months of 20172021 was primarily related to maturities of marketable securities, partially offset by$33.9 million in net purchases of marketable securities and $14.7 million in capital expenditures.expenditures payments.
Financing Activities
Cash from financing activities generally includes borrowings under third-party financing arrangements, the issuance of long-term debt and funds from stock option exercises. Cash used in financing activities generally includes the repayment of amounts outstanding under third-party financing arrangements, the payment of dividends, the payment of long-term debt and capitalfinance lease obligations and share-based compensation tax withholding.
Net cash used in financing activities in the first ninesix months of 20172021 was primarily related to dividend payments of $19.5$21.8 million and share-based compensation tax withholding payments of $10.9 million.
Restricted Cash
We were required to maintain $17.9$14.6 million of restricted cash as of September 24, 2017June 27, 2021, and $24.9$15.9 million as of December 25, 2016, the majority27, 2020, substantially all of which is set aside to collateralize workers’ compensation obligations.
Capital Expenditures
Capital expenditures totaled approximately $67$15 million and $17 million in the first ninesix months of 20172021 and 2016,2020, respectively. The decrease in capital expenditures was primarily driven by lower expenditures related to improvements at our College Point, N.Y., printing and distribution facility and lower investments in technology, partially offset by improvements at our newsroom bureaus and Company Headquarters. The cash payments related to the capital expenditures totaled approximately $48$15 million and $22 million in the first ninesix months of 20172021 and 2016,2020, respectively. The increase in both periods was primarily driven by the ongoing redesign and consolidation of space in our headquarters building and certain improvements at our printing and distribution facility in College Point, New York.
Third-Party Financing
In September 2019, we entered into a $250 million five-year unsecured credit facility (the “Credit Facility”). Certain of our domestic subsidiaries have guaranteed our obligations under the Credit Facility. As of September 24, 2017, our current indebtedness consisted ofJune 27, 2021, there were no outstanding borrowings under the repurchase option related to a sale-leaseback of a portion of our New York headquarters. See Note 6 ofCredit Facility and the Notes toCompany was in compliance with the Condensed Consolidated Financial Statements for information regarding our total debt and capital lease obligations. See Note 8 offinancial covenants contained in the Notes to the Condensed Consolidated Financial Statements for information regarding the fair value of our long-term debt.Credit Facility.
CRITICAL ACCOUNTING POLICIES
Our critical accounting policies are detailed in our Annual Report on Form 10-K for the year ended December 25, 2016.27, 2020. Other than as described in Note 2 of the Notes to the Condensed Consolidated Financial Statements, as of September 24, 2017,June 27, 2021, our critical accounting policies have not changed from December 25, 2016.27, 2020.
CONTRACTUAL OBLIGATIONS & OFF-BALANCE SHEET ARRANGEMENTS
Our contractual obligations and off-balance sheet arrangements are detailed in our Annual Report on Form 10-K for the year ended December 25, 2016.27, 2020. As of September 24, 2017,June 27, 2021, our contractual obligations and off-balance sheet arrangements have not changed materially from December 25, 2016.27, 2020.
FORWARD-LOOKING STATEMENTS
This Quarterly Report on Form 10-Q, including the section titled “Management’s Discussion and Analysis of Financial Condition and Results of Operations,” contains forward-looking statements that relatewithin the meaning of Section 27A of the Securities Act of 1933, as amended, and Section 21E of the Securities Exchange Act of 1934, as amended. Terms such as “aim,” “anticipate,” “believe,” “confidence,” “contemplate,” “continue,” “conviction,” “could,” “drive,” “estimate,” “expect,” “forecast,” “future,” “goal,” “guidance,” “intend,” “likely,” “may,” “might,” “objective,” “opportunity,” “optimistic,” “outlook,” “plan,” “position,” “potential,” “predict,” “project,” “seek,” “should,” “strategy,” “target,” “will,” “would” or similar statements or variations of such words and other similar expressions are intended to future events or our future financial performance. We may also make written and oralidentify forward-looking statements, in our Securities and Exchange Commission (“SEC”) filings and otherwise. We have tried, where possible, to identify such statements by using words such as “believe,” “expect,” “intend,” “estimate,” “anticipate,” “will,” “could,” “project,” “plan” and similar expressions in connection with any discussion of future operating or financial performance. Anyalthough not all forward-looking statements contain such terms. Forward-looking statements are and will be based upon our then-currentcurrent expectations, estimates and assumptions and involve risks and uncertainties that change over time; actual results could differ materially from those predicted by such forward-looking statements. These risks and uncertainties include, but are not limited to: the impact of the Covid-19 pandemic; significant competition in all aspects of our business; our ability to improve and scale our technical infrastructure and respond and adapt to changes in technology and consumer behavior; our ability to continue to retain and grow our subscriber base; numerous factors that affect our advertising revenues, including economic conditions, market dynamics, audience fragmentation, evolving digital advertising trends and the evolution of our strategy; damage to our brand or reputation; economic, geopolitical and other risks associated with the international scope of our business and foreign operations; our ability to attract and maintain a highly skilled and diverse workforce; adverse results from litigation or governmental investigations; the risks and challenges associated with investments we make in new and existing products and services; risks associated with acquisitions, divestitures, investments and other transactions; the effects of the fixed cost nature of significant portions of our expenses; the effects of the size and volatility of our pension plan obligations; liabilities that may result from our participation in multiemployer pension plans; the impact of labor negotiations and agreements; increases in the price of newsprint or significant disruptions in our newsprint supply chain or newspaper printing and distribution channels; security breaches and other network and information systems disruptions; our ability to comply with laws and regulations, including with respect to privacy, data protection and consumer marketing practices; payment processing risk; defects, delays or interruptions in the cloud-based hosting services we utilize; our ability to protect our intellectual property; claims of intellectual property infringement that we have been, and may be in the future, be subject to; the effects of restrictions on our operations as a result of the terms of our credit facility; our future access to capital markets and other financing options; and the concentration of control of our company due to our dual-class capital structure.
More information regarding future eventsthese risks and uncertainties and other important factors that could cause actual results to differ materially from those in the forward-looking statements is set forth in “Item 1A — Risk Factors” in our Annual Report
on Form 10-K for the year ended December 27, 2020, and “Item 2. Management’s Discussion and Analysis of Financial Condition and Results of Operations” of this Form 10-Q. Investors are applicablecautioned not to place undue reliance on any such forward-looking statements, which speak only as of the dates of such statements. We undertakedate they are made. The Company undertakes no obligation to publicly update or revise any forward-looking statements,statement, whether as a result of new information, future events or otherwise.
By their nature, forward-looking statements are subject to risks and uncertainties that could cause actual results to differ materially from those anticipated in any such statements. You should bear this in mind as you consider forward-looking statements. Factors that we think could, individually or in the aggregate, cause our actual results to differ materially from expected and historical results include those described in our Annual Report on Form 10-K for the year ended December 25, 2016, as well as other risks and factors identified from time to time in our SEC filings.
Item 3. Quantitative and Qualitative Disclosures About Market Risk
Our Annual Report on Form 10-K for the year ended December 25, 2016,27, 2020, details our disclosures about market risk. As of September 24, 2017,June 27, 2021, there were no material changes in our market risks from December 25, 2016.
27, 2020.
Item 4. Controls and Procedures
EVALUATION OF DISCLOSURE CONTROLS AND PROCEDURES
Our management, with the participation of our principal executive officer and our principal financial officer, evaluated the effectiveness of our disclosure controls and procedures (as defined in Rules 13a-15(e) and 15d-15(e) of the Securities Exchange Act of 1934) as of September 24, 2017.June 27, 2021. Based upon such evaluation, our principal executive officer and principal financial officer concluded that our disclosure controls and procedures were effective to ensure that the information required to be disclosed by us in the reports that we file or submit under the Securities Exchange Act of 1934 is recorded, processed, summarized and reported within the time periods specified in the SEC’s rules and forms, and is accumulated and communicated to our management, including our principal executive officer and principal financial officer, as appropriate to allow timely decisions regarding required disclosure.
CHANGES IN INTERNAL CONTROL OVER FINANCIAL REPORTING
During the second quarter of 2021, we completed the implementation of (i) a new cloud-based procure-to-pay system relating to our procurement suppliers, and (ii) a new cloud-based system for digital advertising billing. In connection with these systems implementations, we updated our internal control over financial reporting to accommodate the resulting changes to our existing controls, systems and procedures.
There were no other changes in our internal control over financial reporting during the quarter ended September 24, 2017,June 27, 2021, that have materially affected, or are reasonably likely to materially affect, our internal control over financial reporting.
PART II. OTHER INFORMATION
Item 1. Legal Proceedings
We are involved in various legal actions incidental to our business that are now pending against us. These actions are generally for amountshave damage claims that are greatly in excess of the payments, if any, that maywe would be required to be made. See Note 14 ofpay if we lost or settled the Notes to the Consolidated Financial Statements for a description of certain matters, which is incorporated herein by reference.cases. Although the Company cannot predict the outcome of these matters, it is possible that an unfavorable outcome in one or more matters could be material to the Company’s consolidated results of operations or cash flows for an individual reporting period. However, based on currently available information, management does not believe that the ultimate resolution of these matters, individually or in the aggregate, is likely to have a material effect on the Company’s financial position.
Item 1A. Risk Factors
There have been no material changes to our risk factors as set forth in “Item 1A—Risk Factors” in our Annual Report on Form 10-K for the year ended December 25, 2016.27, 2020.
Item 2. Unregistered Sales of Equity Securities and Use of Proceeds
(a) Unregistered Sales of Equity Securities
On July 28, 2017, we issued 24 shares of Class A Common Stock to holders of Class B Common Stock upon the conversion of such Class B shares into Class A shares. The conversion, which was in accordance with our Certificate of Incorporation, did not involve a public offering and was exempt from registration pursuant to Section 3(a)(9) of the Securities Act of 1933, as amended.
(c) Issuer Purchases of Equity Securities
On January 14,In 2015, the Board of Directors approved an authorization ofauthorized up to $101.1 million to repurchaseof repurchases of shares of the Company’s Class A Common Stock. The Company did not repurchase any shares during the third quarter of 2017. As of September 24, 2017, the Company had repurchased 6,690,905 Class A sharesJune 27, 2021, repurchases under this authorization for a cost oftotaled $84.9 million (excluding commissions) and $16.2 million remained under this authorization. All purchases were made pursuant to our publicly announced share repurchase program.remained. Our Board of Directors has authorized us to purchase shares from time to time, subject to market conditions and other factors. There is no expiration date with respect to this authorization.
There have been no purchases under this authorization since 2016.
Item 6. Exhibits
| | | | | | | | |
| Exhibit No. | |
|
| | |
Exhibit No.31.1 | | |
| | |
10.1 | | |
| | |
12 | | |
| | |
31.1 | | |
| | |
| 31.2 | | |
| | |
| 32.1 | | |
| | |
| 32.2 | | |
| | |
32.2101.INS | | instance document does not appear in the Interactive Data File because its XBRL tags are embedded within the Inline XBRL document. |
| | |
101.INS101.SCH | | XBRL Instance Document. |
| | |
101.SCH | | Inline XBRL Taxonomy Extension Schema Document. |
| | |
| 101.CAL | | Inline XBRL Taxonomy Extension Calculation Linkbase Document. |
| | |
| 101.DEF | | Inline XBRL Taxonomy Extension Definition Linkbase Document. |
| | |
| 101.LAB | | Inline XBRL Taxonomy Extension Label Linkbase Document. |
| | |
| 101.PRE | | Inline XBRL Taxonomy Extension Presentation Linkbase Document. |
| | |
| 104 | | Cover Page Interactive Data File (formatted as Inline XBRL and contained in Exhibit 101). |
SIGNATURES
Pursuant to the requirements of the Securities Exchange Act of 1934, the registrant has duly caused this report to be signed on its behalf by the undersigned thereunto duly authorized.
| | | | | | | | |
| | THE NEW YORK TIMES COMPANY |
| | (Registrant) |
| | |
| Date: | August 4, 2021 | THE NEW YORK TIMES COMPANY/s/ Roland A. Caputo |
| | (Registrant) |
| | |
Date: | November 1, 2017 | /s/ JAMES M. FOLLO |
| | James M. Follo
Roland A. Caputo
Executive Vice President and
Chief Financial Officer
(Principal Financial Officer)
|