6
THE NEW YORK TIMES COMPANY
NOTES TO THE CONDENSED CONSOLIDATED FINANCIAL STATEMENTS
(Unaudited)
NOTE 1. BASIS OF PRESENTATION
In the opinion of management of The New York Times Company (the “Company”), the Condensed Consolidated Financial Statements present fairly the financial position of the Company as of September 24, 2017March 27, 2022, and December 25, 2016,26, 2021, and the results of operations, changes in stockholders’ equity and cash flows of the Company for the periods ended September 24, 2017March 27, 2022, and September 25, 2016.March 28, 2021. The Company and its consolidated subsidiaries are referred to collectively as “we,” “us” or “our.” All adjustments necessary for a fair presentation have been included and are of a normal and recurring nature. All significant intercompany accounts and transactions have been eliminated in consolidation. The financial statements were prepared in accordance with the requirements of the Securities and Exchange Commission (“SEC”) for interim reporting. As permitted under those rules, certain notes or other financial information that are normally required by accounting principles generally accepted in the United States of America (“GAAP”) have been condensed or omitted from these interim financial statements. These financial statements, therefore, should be read in conjunction with the Consolidated Financial Statements and related Notes included in our Annual Report on Form 10-K for the year ended December 25, 2016.26, 2021. Due to the seasonal nature of our business, operating results for the interim periods are not necessarily indicative of a full year’s operations. The fiscal periods included herein comprise 13 weeks for the thirdfirst quarter.
In December 2021, the Board of Directors approved a resolution to change the Company’s fiscal year from a 52/53 week fiscal year ending the last Sunday of December to a calendar year. Accordingly, the Company’s 2022 fiscal year, which commenced December 27, 2021, will be extended from December 25, 2022, to December 31,2022, and subsequent fiscal years will begin on January 1 and end on December 31 of each year.
On February 1, 2022, we acquired The Athletic Media Company (“The Athletic”), a global digital subscription-based sports media business that provides national and local coverage of more than 200 clubs and teams in the U.S. and around the world. For the first quarter of 2022, the results of The Athletic have been included in our Condensed Consolidated Financial Statements beginning February 1, 2022. The Athletic is a separate reportable segment of the Company. As a result, beginning in the first quarter of 2022, we have two reportable segments: The New York Times Group and The Athletic. Management, including the Company’s President and Chief Executive Officer (who is the Company’s Chief Operating Decision Maker), uses adjusted operating profit by segment (as defined below) in assessing performance and allocating resources. The Company includes in its presentation revenues and adjusted operating costs (as defined below) to arrive at adjusted operating profit by segment.
The preparation of financial statements in conformity with GAAP requires management to make estimates and assumptions that affect the amounts reported in our Condensed Consolidated Financial Statements. Actual results could differ from these estimates.
NOTE 2. SUMMARY OF SIGNIFICANT ACCOUNTING POLICIES
Except as described herein, as of September 24, 2017,March 27, 2022, our significant accounting policies, which are detailed in our Annual Report on Form 10-K for the year ended December 25, 2016,26, 2021, have not changed:
Recently Adopted Accounting Pronouncements
| Accounting Standard Update(s) | Topic | Effective Period | Summary | ||||||||
| 2021-08 | Business Combinations (Topic 805): Accounting for Contract Assets and Contract Liabilities from Contracts with Customers | Fiscal years, and interim periods within those fiscal years, beginning after December 15, 2022. Early adoption is permitted. | Requires entities to recognize and measure contract assets and contract liabilities acquired in a business combination in accordance with ASC 2014-09, Revenue from Contracts with Customers (Topic 606). The update will generally result in an entity recognizing contract assets and contract liabilities at amounts consistent with those recorded by the acquiree immediately before the acquisition date rather than at fair value. The Company adopted this guidance on December 27, 2021. As a result of The Athletic acquisition, the Company assumed unexpired subscriptions revenue of $28.1 million. | ||||||||
Recently Issued Accounting Pronouncements
The Company considers the applicability and impact of all recently issued accounting pronouncements. Recent accounting pronouncements not specifically identified in our disclosures are either not applicable to the Company or are not expected to have a material effect on our financial condition or results of operations.
THE NEW YORK TIMES COMPANY
NOTES TO THE CONDENSED CONSOLIDATED FINANCIAL STATEMENTS
(Unaudited)
NOTE 3. REVENUE
We generate revenues principally from subscriptions and advertising. Subscription revenues consist of revenues from subscriptions to our digital and print products (which include our news product, as well as The Athletic and our Games, Cooking, Audm and Wirecutter products), and single-copy and bulk sales of our print products. Subscription revenues are based on both the number of copies of the printed newspaper sold and digital-only subscriptions, and the rates charged to the respective customers.
Advertising revenue is principally from advertisers (such as technology, financial and luxury goods companies) promoting products, services or brands on digital platforms in the form of display ads, audio and video, and in print in the form of column-inch ads. Advertising revenue is primarily derived from offerings sold directly to marketers by our advertising sales teams. A smaller proportion of our total advertising revenues is generated through programmatic auctions run by third-party ad exchanges. Advertising revenue is primarily determined by the volume (e.g., impressions), rate and mix of advertisements. Digital advertising includes our core digital advertising business and other digital advertising. Our core digital advertising business includes direct-sold website, mobile application, podcast, email and video advertisements. Advertising revenue from The Athletic is primarily podcast revenue and therefore is reflected in this category. Direct-sold display advertising, a component of core digital advertising, includes offerings on websites and mobile applications sold directly to marketers by our advertising sales teams. Other digital advertising includes open-market programmatic advertising and creative services fees. Print advertising includes revenue from column-inch ads and classified advertising as well as preprinted advertising, also known as freestanding inserts.
Other revenues primarily consist of revenues from licensing, Wirecutter affiliate referrals, commercial printing, the leasing of floors in the New York headquarters building located at 620 Eighth Avenue, New York, New York (the “Company Headquarters”), retail commerce, our student subscription sponsorship program, our live events business and television and film.
Subscription, advertising and other revenues were as follows:
| For the Quarters Ended | ||||||||||||||||||||||||||||||||||||||||||||||||||
| (In thousands) | March 27, 2022 | As % of total | March 28, 2021 | As % of total | ||||||||||||||||||||||||||||||||||||||||||||||
| Subscription | $ | 371,979 | 69.2 | % | $ | 329,084 | 69.6 | % | ||||||||||||||||||||||||||||||||||||||||||
| Advertising | 116,270 | 21.5 | % | 97,116 | 20.5 | % | ||||||||||||||||||||||||||||||||||||||||||||
Other (1) | 49,176 | 9.3 | % | 46,845 | 9.9 | % | ||||||||||||||||||||||||||||||||||||||||||||
| Total | $ | 537,425 | 100.0 | % | $ | 473,045 | 100.0 | % | ||||||||||||||||||||||||||||||||||||||||||
(1) Other revenues include building rental revenue, which is not under the scope of Revenue from Contracts with Customers (Topic 606). Building rental revenue was approximately $7 million and $6 million for the firstquarters of 2022 and 2021, respectively.
The following table summarizes digital and print subscription revenues, which are components of subscription revenues above, for the quarters ended March 27, 2022, and March 28, 2021:
| For the Quarters Ended | ||||||||||||||||||||||||||||||||||||||||||||||||||
| (In thousands) | March 27, 2022 | As % of total | March 28, 2021 | As % of total | ||||||||||||||||||||||||||||||||||||||||||||||
Digital-only subscription revenues (1) | $ | 226,763 | 61.0 | % | $ | 179,599 | 54.6 | % | ||||||||||||||||||||||||||||||||||||||||||
| Print subscription revenues: | ||||||||||||||||||||||||||||||||||||||||||||||||||
Domestic home delivery subscription revenues (2) | 131,391 | 35.3 | % | 134,395 | 40.8 | % | ||||||||||||||||||||||||||||||||||||||||||||
Single-copy, NYT International and Other subscription revenues (3) | 13,825 | 3.7 | % | 15,090 | 4.6 | % | ||||||||||||||||||||||||||||||||||||||||||||
| Subtotal print subscription revenues | 145,216 | 39.0 | % | 149,485 | 45.4 | % | ||||||||||||||||||||||||||||||||||||||||||||
| Total subscription revenues | $ | 371,979 | 100.0 | % | $ | 329,084 | 100.0 | % | ||||||||||||||||||||||||||||||||||||||||||
(1) Includes revenue from digital-only bundled and standalone subscriptions to the Company’s news product, as well as The Athletic and our Games, Cooking, Audm and Wirecutter products. | ||||||||||||||||||||||||||||||||||||||||||||||||||
(2) Domestic home delivery subscriptions include access to digital news, Games, Cooking and Wirecutter products. | ||||||||||||||||||||||||||||||||||||||||||||||||||
(3) NYT International is the international edition of our print newspaper. | ||||||||||||||||||||||||||||||||||||||||||||||||||
8
THE NEW YORK TIMES COMPANY
NOTES TO THE CONDENSED CONSOLIDATED FINANCIAL STATEMENTS
(Unaudited)
The following table summarizes digital and print advertising revenues, which are components of advertising revenues above, for the quarters ended March 27, 2022, and March 28, 2021:
| For the Quarters Ended | ||||||||||||||||||||||||||||||||||||||||||||||||||
| (In thousands) | March 27, 2022 | As % of total | March 28, 2021 | As % of total | ||||||||||||||||||||||||||||||||||||||||||||||
| Advertising revenues: | ||||||||||||||||||||||||||||||||||||||||||||||||||
| Digital | $ | 67,014 | 57.6 | % | $ | 59,496 | 61.3 | % | ||||||||||||||||||||||||||||||||||||||||||
| 49,256 | 42.4 | % | 37,620 | 38.7 | % | |||||||||||||||||||||||||||||||||||||||||||||
| Total advertising | $ | 116,270 | 100.0 | % | $ | 97,116 | 100.0 | % | ||||||||||||||||||||||||||||||||||||||||||
Performance Obligations
We have remaining performance obligations related to digital archive and other licensing and certain advertising contracts. As of March 27, 2022, the aggregate amount of the transaction price allocated to the remaining performance obligations for contracts with a duration greater than one year was approximately $128 million. The Company will recognize this revenue as performance obligations are satisfied. We expect that approximately $35 million, $25 million and $68 million will be recognized in the remainder of 2022, 2023 and thereafter through 2028, respectively.
Contract Assets
As of March 27, 2022, and December 26, 2021, the Company had $3.6 million and $3.4 million, respectively, in contract assets recorded in the Condensed Consolidated Balance Sheets related to digital archiving licensing revenue. The contract asset is reclassified to Accounts receivable when the customer is invoiced based on the contractual billing schedule.
NOTE 3.4. MARKETABLE SECURITIES
9
THE NEW YORK TIMES COMPANY
NOTES TO THE CONDENSED CONSOLIDATED FINANCIAL STATEMENTS
(Unaudited)
The following table presentstables present the amortized cost, gross unrealized gains and losses, and fair market value of our AFS securities as of September 24, 2017:March 27, 2022, and December 26, 2021:
| March 27, 2022 | ||||||||||||||||||||||||||
| (In thousands) | Amortized Cost | Gross Unrealized Gains | Gross Unrealized Losses | Fair Value | ||||||||||||||||||||||
| Short-term AFS securities | ||||||||||||||||||||||||||
| U.S. Treasury securities | $ | 28,481 | $ | 4 | $ | (217) | $ | 28,268 | ||||||||||||||||||
| Corporate debt securities | 22,681 | 12 | (157) | 22,536 | ||||||||||||||||||||||
| Municipal securities | 2,000 | — | (16) | 1,984 | ||||||||||||||||||||||
| Total short-term AFS securities | $ | 53,162 | $ | 16 | $ | (390) | $ | 52,788 | ||||||||||||||||||
| Long-term AFS securities | ||||||||||||||||||||||||||
| Corporate debt securities | $ | 167,793 | $ | — | $ | (6,365) | $ | 161,428 | ||||||||||||||||||
| U.S. Treasury securities | 56,576 | — | (1,892) | 54,684 | ||||||||||||||||||||||
| U.S. governmental agency securities | 28,804 | — | (850) | 27,954 | ||||||||||||||||||||||
| Municipal securities | 8,932 | — | (183) | 8,749 | ||||||||||||||||||||||
| Total long-term AFS securities | $ | 262,105 | $ | — | $ | (9,290) | $ | 252,815 | ||||||||||||||||||
| December 26, 2021 | ||||||||||||||||||||||||||
| (In thousands) | Amortized Cost | Gross Unrealized Gains | Gross Unrealized Losses | Fair Value | ||||||||||||||||||||||
| Short-term AFS securities | ||||||||||||||||||||||||||
| U.S. Treasury securities | $ | 148,899 | $ | 692 | $ | (43) | $ | 149,548 | ||||||||||||||||||
| Corporate debt securities | 107,158 | 245 | (69) | 107,334 | ||||||||||||||||||||||
| Certificates of deposit | 55,551 | — | — | 55,551 | ||||||||||||||||||||||
| Commercial paper | 21,145 | — | — | 21,145 | ||||||||||||||||||||||
| Municipal securities | 3,999 | — | (2) | 3,997 | ||||||||||||||||||||||
| U.S. governmental agency securities | 3,500 | — | — | 3,500 | ||||||||||||||||||||||
| Total short-term AFS securities | $ | 340,252 | $ | 937 | $ | (114) | $ | 341,075 | ||||||||||||||||||
| Long-term AFS securities | ||||||||||||||||||||||||||
| Corporate debt securities | $ | 242,764 | $ | 149 | $ | (1,858) | $ | 241,055 | ||||||||||||||||||
| U.S. Treasury securities | 119,695 | — | (549) | 119,146 | ||||||||||||||||||||||
| U.S. governmental agency securities | 39,498 | — | (252) | 39,246 | ||||||||||||||||||||||
| Municipal securities | 13,994 | — | (61) | 13,933 | ||||||||||||||||||||||
| Total long-term AFS securities | $ | 415,951 | $ | 149 | $ | (2,720) | $ | 413,380 | ||||||||||||||||||
10
| September 24, 2017 | ||||||||||||||||
| (In thousands) | Amortized Cost | Gross unrealized gains | Gross unrealized losses | Fair Value | ||||||||||||
| Short-term AFS securities | ||||||||||||||||
| U.S Treasury securities | $ | 73,220 | $ | — | $ | (45 | ) | $ | 73,175 | |||||||
| Corporate debt securities | 156,683 | 35 | (79 | ) | 156,639 | |||||||||||
| U.S. governmental agency securities | 53,842 | 1 | (89 | ) | 53,754 | |||||||||||
| Certificates of deposit | 20,403 | — | — | 20,403 | ||||||||||||
| Commercial paper | 32,471 | — | — | 32,471 | ||||||||||||
| Total short-term AFS securities | $ | 336,619 | $ | 36 | $ | (213 | ) | $ | 336,442 | |||||||
| Long-term AFS securities | ||||||||||||||||
| U.S. governmental agency securities | $ | 97,431 | $ | 2 | $ | (616 | ) | 96,817 | ||||||||
| Corporate debt securities | 97,583 | 21 | (259 | ) | 97,345 | |||||||||||
| U.S Treasury securities | 47,672 | — | (52 | ) | 47,620 | |||||||||||
| Total long-term AFS securities | $ | 242,686 | $ | 23 | $ | (927 | ) | $ | 241,782 | |||||||
THE NEW YORK TIMES COMPANY
NOTES TO THE CONDENSED CONSOLIDATED FINANCIAL STATEMENTS
(Unaudited)
The following table representstables represent the AFS securities as of September 24, 2017March 27, 2022, and December 26, 2021, that were in an unrealized loss position for which an allowance for credit losses has not been recorded, aggregated by investment category and the length of time that individual securities have been in a continuous unrealized loss position:
| March 27, 2022 | ||||||||||||||||||||||||||||||||||||||
| Less than 12 Months | 12 Months or Greater | Total | ||||||||||||||||||||||||||||||||||||
| (In thousands) | Fair Value | Gross Unrealized Losses | Fair Value | Gross Unrealized Losses | Fair Value | Gross Unrealized Losses | ||||||||||||||||||||||||||||||||
| Short-term AFS securities | ||||||||||||||||||||||||||||||||||||||
| U.S. Treasury securities | $ | 24,589 | $ | (217) | $ | — | $ | — | $ | 24,589 | $ | (217) | ||||||||||||||||||||||||||
| Corporate debt securities | 13,887 | (157) | — | — | 13,887 | (157) | ||||||||||||||||||||||||||||||||
| Municipal securities | 1,984 | (16) | — | — | 1,984 | (16) | ||||||||||||||||||||||||||||||||
| Total short-term AFS securities | $ | 40,460 | $ | (390) | $ | — | $ | — | $ | 40,460 | $ | (390) | ||||||||||||||||||||||||||
| Long-term AFS securities | ||||||||||||||||||||||||||||||||||||||
| Corporate debt securities | $ | 154,995 | $ | (6,253) | $ | 6,433 | $ | (112) | $ | 161,428 | $ | (6,365) | ||||||||||||||||||||||||||
| U.S. Treasury securities | 51,923 | (1,805) | 2,761 | (87) | 54,684 | (1,892) | ||||||||||||||||||||||||||||||||
| U.S. governmental agency securities | 27,954 | (850) | — | — | 27,954 | (850) | ||||||||||||||||||||||||||||||||
| Municipal securities | 8,749 | (183) | — | — | 8,749 | (183) | ||||||||||||||||||||||||||||||||
| Total long-term AFS securities | $ | 243,621 | $ | (9,091) | $ | 9,194 | $ | (199) | $ | 252,815 | $ | (9,290) | ||||||||||||||||||||||||||
| September 24, 2017 | December 26, 2021 | |||||||||||||||||||||||||||||||||||||||||||||||||||||||||||||
| Less than 12 Months | 12 Months or Greater | Total | Less than 12 Months | 12 Months or Greater | Total | |||||||||||||||||||||||||||||||||||||||||||||||||||||||||
(In thousands) | Fair Value | Gross unrealized losses | Fair Value | Gross unrealized losses | Fair Value | Gross unrealized losses | (In thousands) | Fair Value | Gross Unrealized Losses | Fair Value | Gross Unrealized Losses | Fair Value | Gross Unrealized Losses | |||||||||||||||||||||||||||||||||||||||||||||||||
| Short-term AFS securities | Short-term AFS securities | |||||||||||||||||||||||||||||||||||||||||||||||||||||||||||||
| U.S Treasury securities | $ | 73,175 | $ | (45 | ) | $ | — | $ | — | $ | 73,175 | $ | (45 | ) | ||||||||||||||||||||||||||||||||||||||||||||||||
| U.S. Treasury securities | U.S. Treasury securities | $ | 61,018 | $ | (43) | $ | — | $ | — | $ | 61,018 | $ | (43) | |||||||||||||||||||||||||||||||||||||||||||||||||
| Corporate debt securities | 101,648 | (77 | ) | 2,500 | (2 | ) | 104,148 | (79 | ) | Corporate debt securities | 53,148 | (69) | — | — | 53,148 | (69) | ||||||||||||||||||||||||||||||||||||||||||||||
| U.S. governmental agency securities | 42,490 | (53 | ) | 8,964 | (36 | ) | 51,454 | (89 | ) | |||||||||||||||||||||||||||||||||||||||||||||||||||||
| Municipal securities | Municipal securities | 1,998 | (2) | — | — | 1,998 | (2) | |||||||||||||||||||||||||||||||||||||||||||||||||||||||
| Total short-term AFS securities | $ | 217,313 | $ | (175 | ) | $ | 11,464 | $ | (38 | ) | $ | 228,777 | $ | (213 | ) | Total short-term AFS securities | $ | 116,164 | $ | (114) | $ | — | $ | — | $ | 116,164 | $ | (114) | ||||||||||||||||||||||||||||||||||
| Long-term AFS securities | Long-term AFS securities | |||||||||||||||||||||||||||||||||||||||||||||||||||||||||||||
| Corporate debt securities | Corporate debt securities | $ | 224,022 | $ | (1,858) | $ | — | $ | — | $ | 224,022 | $ | (1,858) | |||||||||||||||||||||||||||||||||||||||||||||||||
| U.S. Treasury securities | U.S. Treasury securities | 119,146 | (549) | — | — | 119,146 | (549) | |||||||||||||||||||||||||||||||||||||||||||||||||||||||
| U.S. governmental agency securities | $ | 47,620 | $ | (312 | ) | $ | — | (304 | ) | $ | 47,620 | $ | (616 | ) | U.S. governmental agency securities | 39,246 | (252) | — | — | 39,246 | (252) | |||||||||||||||||||||||||||||||||||||||||
| Corporate debt securities | 66,428 | (196 | ) | 8,918 | (63 | ) | 75,346 | (259 | ) | |||||||||||||||||||||||||||||||||||||||||||||||||||||
| U.S Treasury securities | 53,142 | (52 | ) | 39,697 | — | 92,839 | (52 | ) | ||||||||||||||||||||||||||||||||||||||||||||||||||||||
| Municipal securities | Municipal securities | 13,933 | (61) | — | — | 13,933 | (61) | |||||||||||||||||||||||||||||||||||||||||||||||||||||||
| Total long-term AFS securities | $ | 167,190 | $ | (560 | ) | $ | 48,615 | $ | (367 | ) | $ | 215,805 | $ | (927 | ) | Total long-term AFS securities | $ | 396,347 | $ | (2,720) | $ | — | $ | — | $ | 396,347 | $ | (2,720) | ||||||||||||||||||||||||||||||||||
We periodically review ourassess AFS securities for OTTI. See Note 2 for factors we consider when assessing AFS securities for OTTI. on a quarterly basis or more often if a potential loss-triggering event occurs.
As of September 24, 2017,March 27, 2022, and December 26, 2021, we did not intend to sell and it was not likely that we would be required to sell these investments before recovery of their amortized cost basis, which may be at maturity. Unrealized losses related to these investments are primarily due to interest rate fluctuations as opposed to changes in credit quality. Therefore, as of September 24, 2017,March 27, 2022, and December 26, 2021, we have recognized no OTTI loss.
| December 25, 2016 | ||||
(In thousands) | Amortized Cost | |||
Short-term HTM securities (1) | ||||
| U.S Treasury securities | $ | 150,623 | ||
| Corporate debt securities | 150,599 | |||
| U.S. governmental agency securities | 64,135 | |||
| Commercial paper | 84,178 | |||
| Total short-term HTM securities | $ | 449,535 | ||
Long-term HTM securities (1) | ||||
| U.S. governmental agency securities | $ | 110,732 | ||
| Corporate debt securities | 61,775 | |||
| U.S Treasury securities | 14,792 | |||
| Total long-term HTM securities | $ | 187,299 | ||
11
THE NEW YORK TIMES COMPANY
NOTES TO THE CONDENSED CONSOLIDATED FINANCIAL STATEMENTS
(Unaudited)
As of March 27, 2022, our short-term and long-term marketable securities had remaining maturities of less than one month to 12 months and 13 months to 32 months, respectively. See Note 8 for more information regarding the fair value of our marketable securities.
NOTE 4. GOODWILL AND INTANGIBLES5. BUSINESS COMBINATION
The Company accounts for business combinations using the acquisition method of accounting. The purchase price is allocated to the purchase prices for these acquisitions based on the final valuation of assets acquired and liabilities assumed resultingusing the fair values determined by management as of the acquisition date. The excess of the purchase price over the estimated fair value of the net assets acquired is recorded as goodwill. The results of businesses acquired in allocationsa business combination are included in the Company’s consolidated financial statements from the date of acquisition.
On February 1, 2022, the Company acquired The Athletic in an all-cash transaction. The consideration paid of approximately $550 million was funded from cash on hand and included $523.5 million which we determined to goodwill, intangibles, property, plantbe the purchase price for assets acquired and equipmentliabilities assumed, and other miscellaneous assets.$26.7 million paid in connection with the acceleration of The Athletic stock options. The stock options acceleration is included in Acquisition-related costs in our Condensed Consolidated Statements of Operations as of March 27, 2022.
The aggregate carrying amount of intangible assets of $8.6 million related to these acquisitionspurchase price allocation has been includedprepared on a preliminary basis. As additional information becomes available, the Company may revise the allocation to certain assets and liabilities, including tax estimates. The Company will finalize the acquisition accounting within the required measurement period of one year.
The following table summarizes the preliminary allocation of the purchase price (at fair value) to the assets acquired and liabilities assumed of The Athletic as of February 1, 2022 (the date of acquisition):
| (In thousands) | Preliminary Purchase Price Allocation | Estimated Useful Life (in years) | ||||||||||||
| Total current assets | $ | 18,495 | ||||||||||||
| Property, plant and equipment | 281 | 3- 5 | ||||||||||||
Right of use asset (1) | 2,612 | |||||||||||||
Trademark (2) | 160,000 | 20 | ||||||||||||
Existing subscriber base (2) | 135,000 | 12 | ||||||||||||
Developed technology (2) | 35,000 | 5 | ||||||||||||
Content archive (2) | 2,000 | 2 | ||||||||||||
| Goodwill | 249,792 | Indefinite | ||||||||||||
Total current liabilities (3) | (41,107) | |||||||||||||
Other liabilities — Other | (3,491) | |||||||||||||
Deferred tax liability, net (4) | (35,116) | |||||||||||||
| Total purchase price | $ | 523,466 | ||||||||||||
(1) Included in “Miscellaneous Assets”Miscellaneous assets in our Condensed Consolidated Balance Sheets.
(2) Included in Intangible assets, net in our Condensed Consolidated Balance Sheets.
(3) Includes Unexpired subscriptions revenue of $28.1 million.
(4) Included in Deferred income taxes in our Condensed Consolidated Balance Sheets.
Goodwill is primarily attributable to future subscribers expected to be acquired both organically and through synergies from adding The Athletic to the Company’s products as well as the acquired assembled workforce. Goodwill is not expected to be deductible for tax purposes. The fair value of trademarks is estimated useful livesusing a relief from royalty valuation method, the fair
12
THE NEW YORK TIMES COMPANY
NOTES TO THE CONDENSED CONSOLIDATED FINANCIAL STATEMENTS
(Unaudited)
value of subscriber relationships is estimated using a multi-period excess earnings valuation method, and the fair value of developed technology and content archive is estimated using a replacement cost method.
The following unaudited pro forma summary presents consolidated information of the Company, including The Athletic, as if the business combination had occurred on December 27, 2021, the earliest period presented herein:
| For the Quarters Ended | ||||||||||||||
| (In thousands) | March 27, 2022 | March 28, 2021 | ||||||||||||
| Revenue | $ | 544,572 | $ | 487,167 | ||||||||||
| Net income/(loss) | 28,045 | (8,215) | ||||||||||||
The pro forma adjustments include (1) transaction costs and other one-time non-recurring costs which reduced expenses by $47.8 million for thesethe quarter ended March 27, 2022 and increased expenses by $47.8 million for the quarter ended March 28, 2021, (2) recognition of additional amortization related to the intangible assets rangeacquired (3) alignment of accounting policies (4) recognition of the estimated income tax impact of the pro forma adjustments. The pro forma does not reflect cost savings or operating synergies expected to result from 3 to 7 yearsthe acquisition. These pro forma results are illustrative only and not indicative of the actual results of operations that would have been achieved nor are amortized on a straight-line basis.they indicative of future results of operations.
Goodwill and Intangibles
The changes in the carrying amount of goodwill as of September 24, 2017,March 27, 2022, and since December 25, 2016,26, 2021, were as follows:
| (In thousands) | Total Company | |||
| Balance as of December 25, 2016 | $ | 134,517 | ||
Measurement period adjustment (1) | (198 | ) | ||
| Foreign currency translation | 8,852 | |||
| Balance as of September 24, 2017 | $ | 143,171 | ||
| (In thousands) | The New York Times Group | The Athletic | Total | |||||||||||||||||
| Balance as of December 27, 2020 | $ | 171,657 | $ | — | $ | 171,657 | ||||||||||||||
| Foreign currency translation | (5,297) | 0 | (5,297) | |||||||||||||||||
| Balance as of December 26, 2021 | 166,360 | — | 166,360 | |||||||||||||||||
| Foreign currency translation | (1,952) | — | (1,952) | |||||||||||||||||
| Acquisition of The Athletic | — | 249,792 | 249,792 | |||||||||||||||||
| Balance as of March 27, 2022 | $ | 164,408 | $ | 249,792 | $ | 414,200 | ||||||||||||||
The foreign currency translation line item reflects changes in goodwill resulting from fluctuating exchange rates related to the consolidation of certain international subsidiaries.
As of September 24, 2017, our investments in joint ventures totaled $20.5 millionMarch 27, 2022, the gross book value and we had equity ownership interests inaccumulated amortization of acquired intangible assets from the following entities:acquisition of The Athletic were as follows:
| (In thousands) | Gross book value | Accumulated amortization | Net book value | |||||||||||||||||
| Trademark | $ | 160,000 | $ | (1,333) | $ | 158,667 | ||||||||||||||
| Existing subscriber base | 135,000 | (1,875) | 133,125 | |||||||||||||||||
| Developed technology | 35,000 | (1,167) | 33,833 | |||||||||||||||||
| Content archive | 2,000 | (167) | 1,833 | |||||||||||||||||
| Total | $ | 332,000 | $ | (4,542) | $ | 327,458 | ||||||||||||||
13
THE NEW YORK TIMES COMPANY
NOTES TO THE CONDENSED CONSOLIDATED FINANCIAL STATEMENTS
(Unaudited)
Amortization expense for intangible assets from the acquisition of The following table presents summarized income statement information for Madison, which follows a calendar year:
| For the Quarters Ended | For the Nine Months Ended | |||||||||||||||
| (In thousands) | September 30, 2017 | September 30, 2016 | September 30, 2017 | September 30, 2016 | ||||||||||||
| Revenues | $ | — | $ | — | $ | — | $ | 40,523 | ||||||||
| Expenses: | ||||||||||||||||
| Cost of sales | (105 | ) | (1,450 | ) | (1,277 | ) | (68,039 | ) | ||||||||
| General and administrative income/(expense) and other | 60,216 | (566 | ) | 59,662 | (66,056 | ) | ||||||||||
| Total costs and expenses | 60,111 | (2,016 | ) | 58,385 | (134,095 | ) | ||||||||||
| Operating income/(loss) | 60,111 | (2,016 | ) | 58,385 | (93,572 | ) | ||||||||||
| Other (expense)/income | (1 | ) | 2 | (7 | ) | 4 | ||||||||||
| Net income/(loss) | $ | 60,110 | $ | (2,014 | ) | $ | 58,378 | $ | (93,568 | ) | ||||||
| (In thousands) | ||||||||
| Remainder of 2022 | $ | 20,438 | ||||||
| 2023 | 27,500 | |||||||
| 2024 | 27,500 | |||||||
| 2025 | 27,500 | |||||||
| 2026 | 27,500 | |||||||
| Thereafter | 197,020 | |||||||
| Total amortization expense | $ | 327,458 | ||||||
The aggregate carrying amountsamount of cost method investmentsintangible assets of $343.4 million, which includes an indefinite-lived intangible of $9.0 million, is included in “Miscellaneous assets’’Intangible assets, net in our Condensed Consolidated Balance Sheets were $14.0 million and $13.6 million for September 24, 2017 and December 25, 2016, respectively.as of March 27, 2022.
NOTE 6. DEBT OBLIGATIONSINVESTMENTS
Non-Marketable Equity Securities
Our indebtedness consistednon-marketable equity securities are investments in privately held companies/funds without readily determinable market values. Gains and losses on non-marketable securities revalued, sold or impaired are recognized in Interest income and other, net in our Condensed Consolidated Statements of the repurchase option related toOperations.
As of March 27, 2022, and December 26, 2021, non-marketable equity securities included in Miscellaneous assets in our Condensed Consolidated Balance Sheets had a sale-leaseback of a portion of our New York headquarters. Our total debt and capital lease obligations consisted of the following:
| (In thousands) | September 24, 2017 | December 25, 2016 | ||||||
| Option to repurchase ownership interest in headquarters building in 2019: | ||||||||
| Principal amount | $ | 250,000 | $ | 250,000 | ||||
| Less unamortized discount based on imputed interest rate of 13.0% | 7,423 | 9,801 | ||||||
| Total option to repurchase ownership interest in headquarters building in 2019 | 242,577 | 240,199 | ||||||
| Capital lease obligations | 6,798 | 6,779 | ||||||
| Total long-term debt and capital lease obligations | $ | 249,375 | $ | 246,978 | ||||
NOTE 7. OTHER
Capitalized Computer Software Costs
Amortization of capitalized computer software costs included in Depreciation and amortization in our long-term debt.Condensed Consolidated Statements of Operations was $1.9 million and $2.6 million in the first quarters of 2022 and 2021, respectively.
Interest income and other, net, as shown in the accompanying Condensed Consolidated Statements of Operations, was as follows:
| For the Quarters Ended | ||||||||||||||||||||||||||
| (In thousands) | March 27, 2022 | March 28, 2021 | ||||||||||||||||||||||||
| Interest income and other expense, net | $ | 1,222 | $ | 1,689 | ||||||||||||||||||||||
| Interest expense | (147) | (178) | ||||||||||||||||||||||||
| Total interest income and other, net | $ | 1,075 | $ | 1,511 | ||||||||||||||||||||||
14
| For the Quarters Ended | For the Nine Months Ended | |||||||||||||||
| (In thousands) | September 24, 2017 | September 25, 2016 | September 24, 2017 | September 25, 2016 | ||||||||||||
| Interest expense | $ | 6,956 | $ | 10,022 | $ | 20,775 | $ | 29,964 | ||||||||
| Amortization of debt costs and discount on debt | 801 | 1,226 | 2,379 | 3,670 | ||||||||||||
| Capitalized interest | (345 | ) | (131 | ) | (852 | ) | (412 | ) | ||||||||
| Interest income | (2,752 | ) | (2,085 | ) | (7,184 | ) | (6,267 | ) | ||||||||
| Total interest expense, net | $ | 4,660 | $ | 9,032 | $ | 15,118 | $ | 26,955 | ||||||||
THE NEW YORK TIMES COMPANY
NOTES TO THE CONDENSED CONSOLIDATED FINANCIAL STATEMENTS
(Unaudited)
Restricted Cash
| (In thousands) | March 27, 2022 | December 26, 2021 | ||||||||||||
| Reconciliation of cash, cash equivalents and restricted cash | ||||||||||||||
| Cash and cash equivalents | $ | 169,171 | $ | 319,973 | ||||||||||
| Restricted cash included within miscellaneous assets | 14,381 | 14,333 | ||||||||||||
| Total cash, cash equivalents and restricted cash shown in the Condensed Consolidated Statements of Cash Flows | $ | 183,552 | $ | 334,306 | ||||||||||
Revolving Credit Facility
In September 2019, the Company entered into a $250.0 million five-year unsecured revolving credit facility (the “Credit Facility”). Certain of the Company’s domestic subsidiaries have guaranteed the Company’s obligations under the Credit Facility. Borrowings under the Credit Facility bear interest at specified rates based on our brand, subscription productsutilization and marketing servicesconsolidated leverage ratio. The Credit Facility contains various customary affirmative and negative covenants. In addition, the Company is obligated to pay a quarterly unused commitment fee at an annual rate of 0.20%.
As of March 27, 2022, there were $26.6 millionno outstanding borrowings under the Credit Facility and $22.3 millionthe Company was in compliance with the financial covenants contained in the third quarters of 2017 and 2016, respectively, and $86.0 million and $63.6 milliondocuments governing the Credit Facility.
Severance Costs
We recognized no severance costs in the first nine monthsquarter of 20172022 and 2016,$0.4 severance costs in the first quarter of 2021, respectively.
We had a severance liability of $25.2$1.9 million and $23.2$2.1 million included in “AccruedAccrued expenses and other”other in our Condensed Consolidated Balance Sheets as of September 24, 2017,March 27, 2022, and December 25, 2016,26, 2021, respectively. We anticipate most
Acquisition-Related Costs
The Company incurred $34.7 million of acquisition-related costs during the expenditures will be recognized withinquarter ended March 27, 2022. Acquisition-related costs primarily include expenses paid in connection with the next twelve months.acceleration of The Athletic stock options, and legal, accounting, financial advisory and integration planning expenses.
NOTE 8. FAIR VALUE MEASUREMENTS
Fair value is the price that would be received upon the sale of an asset or paid upon transfer of a liability in an orderly transaction between market participants at the measurement date. The transaction would be in the principal or most advantageous market for the asset or liability, based on assumptions that a market participant would use in pricing the asset or liability. The fair value hierarchy consists of three levels:
Level 1–quoted prices in active markets for identical assets or liabilities that the reporting entity has the ability to access at the measurement date;
Level 2–inputs other than quoted prices included within Level 1 that are observable for the asset or liability, either directly or indirectly; and
Level 3–unobservable inputs for the asset or liability.
THE NEW YORK TIMES COMPANY
NOTES TO THE CONDENSED CONSOLIDATED FINANCIAL STATEMENTS
(Unaudited)
Assets/Liabilities Measured and Recorded at Fair Value on a Recurring Basis
The following table summarizes our financial assets and liabilities measured at fair value on a recurring basis as of September 24, 2017,March 27, 2022, and December 25, 2016:26, 2021:
| (In thousands) | March 27, 2022 | December 26, 2021 | ||||||||||||||||||||||||||||||||||||||||||||||||
| Total | Level 1 | Level 2 | Level 3 | Total | Level 1 | Level 2 | Level 3 | |||||||||||||||||||||||||||||||||||||||||||
| Assets: | ||||||||||||||||||||||||||||||||||||||||||||||||||
Short-term AFS securities (1) | ||||||||||||||||||||||||||||||||||||||||||||||||||
| U.S. Treasury securities | $ | 28,268 | $ | — | $ | 28,268 | $ | — | $ | 149,548 | $ | — | $ | 149,548 | $ | — | ||||||||||||||||||||||||||||||||||
| Corporate debt securities | 22,536 | — | 22,536 | — | 107,334 | — | 107,334 | — | ||||||||||||||||||||||||||||||||||||||||||
| Certificates of deposit | — | — | — | — | 55,551 | — | 55,551 | — | ||||||||||||||||||||||||||||||||||||||||||
| Municipal securities | 1,984 | — | 1,984 | — | 3,997 | — | 3,997 | — | ||||||||||||||||||||||||||||||||||||||||||
| U.S. governmental agency securities | — | — | — | — | 3,500 | — | 3,500 | — | ||||||||||||||||||||||||||||||||||||||||||
| Commercial paper | — | — | — | — | 21,145 | — | 21,145 | — | ||||||||||||||||||||||||||||||||||||||||||
| Total short-term AFS securities | $ | 52,788 | $ | — | $ | 52,788 | $ | — | $ | 341,075 | $ | — | $ | 341,075 | $ | — | ||||||||||||||||||||||||||||||||||
Long-term AFS securities (1) | ||||||||||||||||||||||||||||||||||||||||||||||||||
| Corporate debt securities | $ | 161,428 | $ | — | $ | 161,428 | $ | — | $ | 241,055 | $ | — | $ | 241,055 | $ | — | ||||||||||||||||||||||||||||||||||
| U.S. Treasury securities | 54,684 | — | 54,684 | — | 119,146 | — | 119,146 | — | ||||||||||||||||||||||||||||||||||||||||||
| U.S. governmental agency securities | 27,954 | — | 27,954 | — | 39,246 | — | 39,246 | — | ||||||||||||||||||||||||||||||||||||||||||
| Municipal securities | 8,749 | — | 8,749 | — | 13,933 | — | 13,933 | — | ||||||||||||||||||||||||||||||||||||||||||
| Total long-term AFS securities | $ | 252,815 | $ | — | $ | 252,815 | $ | — | $ | 413,380 | $ | — | $ | 413,380 | $ | — | ||||||||||||||||||||||||||||||||||
| Liabilities: | ||||||||||||||||||||||||||||||||||||||||||||||||||
Deferred compensation (2)(3) | $ | 16,467 | $ | 16,467 | $ | — | $ | — | $ | 21,101 | $ | 21,101 | $ | — | $ | — | ||||||||||||||||||||||||||||||||||
| Contingent consideration | $ | 5,858 | $ | — | $ | — | $ | 5,858 | $ | 7,450 | $ | — | $ | — | $ | 7,450 | ||||||||||||||||||||||||||||||||||
| (In thousands) | September 24, 2017 | December 25, 2016 (3) | ||||||||||||||||||||||||||||||
| Total | Level 1 | Level 2 | Level 3 | Total | Level 1 | Level 2 | Level 3 | |||||||||||||||||||||||||
| Assets: | ||||||||||||||||||||||||||||||||
Short-term AFS securities (1) | ||||||||||||||||||||||||||||||||
| U.S Treasury securities | $ | 73,175 | $ | — | $ | 73,175 | $ | — | $ | — | $ | — | $ | — | $ | — | ||||||||||||||||
| Corporate debt securities | 156,639 | — | 156,639 | — | — | — | — | — | ||||||||||||||||||||||||
| U.S. governmental agency securities | 53,754 | — | 53,754 | — | — | — | — | — | ||||||||||||||||||||||||
| Certificates of deposit | 20,403 | — | 20,403 | — | — | — | — | — | ||||||||||||||||||||||||
| Commercial paper | 32,471 | — | 32,471 | — | — | — | — | — | ||||||||||||||||||||||||
| Total short-term AFS securities | $ | 336,442 | $ | — | $ | 336,442 | $ | — | $ | — | $ | — | $ | — | $ | — | ||||||||||||||||
Long-term AFS securities (1) | ||||||||||||||||||||||||||||||||
| U.S. governmental agency securities | $ | 96,817 | $ | — | $ | 96,817 | $ | — | $ | — | $ | — | $ | — | $ | — | ||||||||||||||||
| Corporate debt securities | 97,345 | — | 97,345 | — | — | — | — | — | ||||||||||||||||||||||||
| U.S Treasury securities | 47,620 | — | 47,620 | — | — | — | — | — | ||||||||||||||||||||||||
| Total long-term AFS securities | $ | 241,782 | $ | — | $ | 241,782 | $ | — | $ | — | $ | — | $ | — | $ | — | ||||||||||||||||
| Liabilities: | ||||||||||||||||||||||||||||||||
Deferred compensation (2) | $ | 28,354 | $ | 28,354 | $ | — | $ | — | $ | 31,006 | $ | 31,006 | $ | — | $ | — | ||||||||||||||||
(1)Our marketable securities, which include U.S. Treasury securities, corporate debt securities, U.S. government agency securities, municipal securities, certificates of deposit and commercial paper, are recorded at fair value (see Note 3). We classified these investments as Level 2 since the fair value is based on market observable inputs for investments with similar terms and maturities.
(2)The deferred compensation liability, included in “OtherOther liabilities—Other”other in our Condensed Consolidated Balance Sheets, consists of deferrals under The New York Times Company Deferred Executive Compensation Plan (the “DEC”), which enablespreviously enabled certain eligible executives to elect to defer a portion of their compensation on a pre-tax basis. The deferred amounts are invested at the executives’ option in various mutual funds. The fair value of deferred compensation is based on the mutual fund investments elected by the executives and on quoted prices in active markets for identical assets. Participation in the DEC was frozen effective December 31, 2015.
(3)As noted in Note 2, inThe Company invests the third quarter of 2017, we reclassified our marketable securities from HTM to AFS. Prior to being classified as AFS, the securities were recorded at amortized cost and not adjusted to fair value in accordanceassets associated with the HTM accounting treatment.
16
THE NEW YORK TIMES COMPANY
NOTES TO THE CONDENSED CONSOLIDATED FINANCIAL STATEMENTS
(Unaudited)
Level 3 Liabilities
The contingent consideration liability is related to the 2020 acquisition of substantially all the assets and certain liabilities of Serial Productions, LLC (the “Serial acquisition”) and represents contingent payments based on the achievement of certain operational targets, as defined in the acquisition agreement, over the five years following the acquisition. The Company estimated the fair value using a probability-weighted discounted cash flow model. The estimate of September 24, 2017 and December 25, 2016, respectively. We estimate the fair value of our debt utilizing market quotations for debt that have quoted prices in active markets. Since our debt does not trade on a daily basis in an active market,contingent consideration requires subjective assumptions to be made regarding probabilities assigned to operational targets and the discount rate. As the fair value estimates areis based on market observablesignificant unobservable inputs, based on borrowing rates currently availablethis is a Level 3 liability.
The following table presents changes in the contingent consideration balances for debt with similar termsthe quarters ended March 27, 2022 and average maturities (Level 2).March 28, 2021:
| For the Quarters Ended | ||||||||||||||||||||||||||
| (In thousands) | March 27, 2022 | March 28, 2021 | ||||||||||||||||||||||||
| Balance at the beginning of the period | $ | 7,450 | $ | 8,431 | ||||||||||||||||||||||
| Payments | (1,724) | — | ||||||||||||||||||||||||
Fair value adjustments (1) | 132 | (703) | ||||||||||||||||||||||||
| Contingent consideration at the end of the period | $ | 5,858 | $ | 7,728 | ||||||||||||||||||||||
(1) Fair value adjustments are included in General and administrative expenses in our Condensed Consolidated Statements of Operations.
The remaining contingent consideration balances as of March 27, 2022, and December 26, 2021, of $5.9 million and $7.5 million, respectively, are included in Accrued expenses and other, for the current portion of the liability, and Other non-current liabilities, for the long-term portion of the liability, in our Condensed Consolidated Balance Sheets.
NOTE 9. PENSION AND OTHER POSTRETIREMENT BENEFITS
Pension
Single-Employer Plans
We sponsor severalmaintain The New York Times Companies Pension Plan, a frozen single-employer defined benefit pension plans,plan. The Company also jointly sponsors a defined benefit plan with The NewsGuild of New York known as the majority of which have been frozen. Guild-Times Adjustable Pension Plan (the “APP”) that continues to accrue active benefits.
We also participatehave a foreign-based pension plan for certain employees (the “foreign plan”). The information for the foreign plan is combined with the information for U.S. non-qualified plans. The benefit obligation of the foreign plan is immaterial to our total benefit obligation.
The components of net periodic pension cost were as follows:
| For the Quarters Ended | ||||||||||||||||||||||||||||||||||||||
| March 27, 2022 | March 28, 2021 | |||||||||||||||||||||||||||||||||||||
| (In thousands) | Qualified Plans | Non- Qualified Plans | All Plans | Qualified Plans | Non- Qualified Plans | All Plans | ||||||||||||||||||||||||||||||||
| Service cost | $ | 2,882 | $ | — | $ | 2,882 | $ | 2,276 | $ | — | $ | 2,276 | ||||||||||||||||||||||||||
| Interest cost | 8,837 | 1,284 | 10,121 | 7,629 | 1,088 | 8,717 | ||||||||||||||||||||||||||||||||
| Expected return on plan assets | (13,807) | — | (13,807) | (12,677) | — | (12,677) | ||||||||||||||||||||||||||||||||
| Amortization of actuarial loss | 3,266 | 1,643 | 4,909 | 5,055 | 1,821 | 6,876 | ||||||||||||||||||||||||||||||||
| Amortization of prior service credit | (486) | — | (486) | (486) | — | (486) | ||||||||||||||||||||||||||||||||
Net periodic pension cost (1) | $ | 692 | $ | 2,927 | $ | 3,619 | $ | 1,797 | $ | 2,909 | $ | 4,706 | ||||||||||||||||||||||||||
(1) The service cost component of net periodic pension cost is recognized in two joint CompanyTotal operating costs, while the other components are included in Other components of net periodic benefit costs in our Condensed Consolidated Statements of Operations, below Operating profit.
During the first quarters of 2022 and Guild-sponsored defined benefit2021, we made pension plans covering employees who are memberscontributions of
$2.3 million and $1.5 million, respectively, to the APP. We expect to make contractual contributions in 2022 of approximately $10 million, which more than satisfy minimum funding requirements.
17
THE NEW YORK TIMES COMPANY
NOTES TO THE CONDENSED CONSOLIDATED FINANCIAL STATEMENTS
(Unaudited)
| For the Quarters Ended | ||||||||||||||||||||||||
| September 24, 2017 | September 25, 2016 | |||||||||||||||||||||||
| (In thousands) | Qualified Plans | Non- Qualified Plans | All Plans | Qualified Plans | Non- Qualified Plans | All Plans | ||||||||||||||||||
| Service cost | $ | 2,423 | $ | — | $ | 2,423 | $ | 2,248 | $ | — | $ | 2,248 | ||||||||||||
| Interest cost | 15,596 | 1,956 | 17,552 | 16,573 | 2,034 | 18,607 | ||||||||||||||||||
| Expected return on plan assets | (26,136 | ) | — | (26,136 | ) | (27,790 | ) | — | (27,790 | ) | ||||||||||||||
| Amortization of actuarial loss | 7,351 | 1,088 | 8,439 | 7,069 | 1,054 | 8,123 | ||||||||||||||||||
| Amortization of prior service credit | (486 | ) | — | (486 | ) | (487 | ) | — | (487 | ) | ||||||||||||||
| Net periodic pension (income)/cost | $ | (1,252 | ) | $ | 3,044 | $ | 1,792 | $ | (2,387 | ) | $ | 3,088 | $ | 701 | ||||||||||
| For the Nine Months Ended | ||||||||||||||||||||||||
| September 24, 2017 | September 25, 2016 | |||||||||||||||||||||||
| (In thousands) | Qualified Plans | Non- Qualified Plans | All Plans | Qualified Plans | Non- Qualified Plans | All Plans | ||||||||||||||||||
| Service cost | $ | 7,269 | $ | — | $ | 7,269 | $ | 6,743 | $ | — | $ | 6,743 | ||||||||||||
| Interest cost | 46,784 | 5,868 | 52,652 | 49,720 | 6,102 | 55,822 | ||||||||||||||||||
| Expected return on plan assets | (78,408 | ) | — | (78,408 | ) | (83,369 | ) | — | (83,369 | ) | ||||||||||||||
| Amortization of actuarial loss | 22,057 | 3,264 | 25,321 | 21,206 | 3,160 | 24,366 | ||||||||||||||||||
| Amortization of prior service credit | (1,458 | ) | — | (1,458 | ) | (1,459 | ) | — | (1,459 | ) | ||||||||||||||
| Net periodic pension (income)/cost | $ | (3,756 | ) | $ | 9,132 | $ | 5,376 | $ | (7,159 | ) | $ | 9,262 | $ | 2,103 | ||||||||||
Other Postretirement Benefits
The components of net periodic postretirement benefit incomecost/(income) were as follows:
| For the Quarters Ended | ||||||||||||||||||||||||||
| (In thousands) | March 27, 2022 | March 28, 2021 | ||||||||||||||||||||||||
| Service cost | $ | 12 | $ | 13 | ||||||||||||||||||||||
| Interest cost | 183 | 141 | ||||||||||||||||||||||||
| Amortization of actuarial loss | 823 | 852 | ||||||||||||||||||||||||
| Amortization of prior service credit | (236) | (836) | ||||||||||||||||||||||||
Net periodic postretirement benefit cost (1) | $ | 782 | $ | 170 | ||||||||||||||||||||||
| For the Quarters Ended | For the Nine Months Ended | |||||||||||||||
| (In thousands) | September 24, 2017 | September 25, 2016 | September 24, 2017 | September 25, 2016 | ||||||||||||
| Service cost | $ | 92 | $ | 104 | $ | 276 | $ | 313 | ||||||||
| Interest cost | 470 | 495 | 1,410 | 1,485 | ||||||||||||
| Amortization of actuarial loss | 905 | 1,026 | 2,715 | 3,078 | ||||||||||||
| Amortization of prior service credit | (1,939 | ) | (2,110 | ) | (5,816 | ) | (6,330 | ) | ||||||||
| Net periodic postretirement benefit income | $ | (472 | ) | $ | (485 | ) | $ | (1,415 | ) | $ | (1,454 | ) | ||||
NOTE 10. INCOME TAXES
The Company had income tax expense of $23.4$1.1 million and $40.9 million in the third quarter and first nine months of 2017, respectively. The Company had income tax expense of $0.1 million in the third quarter of 2016 and an income tax benefit of $9.0$9.5 million in the first nine monthsquarters of 2016. The increase in income tax expense was primarily due to higher income from continuing operations in the third quarter2022 and first nine months of 2017.
Beginning in 2022, the Tax Cuts and Jobs Act of 2017 eliminates the option to deduct research and development expenditures immediately in the year incurred and instead requires taxpayers to capitalize and amortize such expenditures over five years. If Congress does not repeal or defer the effective date of this provision, we expect our 2022 cash tax payments will increase significantly as compared with the same period prior year.to 2021. We would also expect significant increases to our deferred tax assets as we begin to capitalize our research and development expenditures.
NOTE 11. EARNINGS/(LOSS)EARNINGS PER SHARE
We compute earnings/(loss)earnings per share using abased upon the lower of the two-class method or the treasury stock method. The two-class method is an earnings allocation method used when a company’s capital structure includes either two or more classes of common stock or common stock and participating securities. This method determines earnings/(loss)earnings per share based on dividends declared on common stock and participating securities (i.e., distributed earnings), as well as participation rights of participating securities in any undistributed earnings.
Securities that could potentially be dilutive are excluded from the computation of diluted earnings per share when a loss from continuing operations exists or when the exercise price exceeds the market value of our Class A Common Stock because their inclusion would result in an anti-dilutive effect on per share amounts.
NOTE 12. SUPPLEMENTAL STOCKHOLDERS’ EQUITY INFORMATION
| (In thousands) | Total New York Times Company Stockholders’ Equity | Noncontrolling Interest | Total Stockholders’ Equity | |||||||||
| Balance as of December 25, 2016 | $ | 847,815 | $ | (3,571 | ) | $ | 844,244 | |||||
| Net income | 61,109 | 3,567 | 64,676 | |||||||||
| Other comprehensive income, net of tax | 19,294 | — | 19,294 | |||||||||
| Effect of issuance of shares | 158 | — | 158 | |||||||||
| Dividends declared | (19,543 | ) | — | (19,543 | ) | |||||||
| Stock-based compensation | 9,845 | — | 9,845 | |||||||||
| Balance as of September 24, 2017 | $ | 918,678 | $ | (4 | ) | $ | 918,674 | |||||
| (In thousands) | Total New York Times Company Stockholders’ Equity | Noncontrolling Interest | Total Stockholders’ Equity | |||||||||
| Balance as of December 27, 2015 | $ | 826,751 | $ | 1,704 | $ | 828,455 | ||||||
| Net loss | (8,076 | ) | (5,719 | ) | (13,795 | ) | ||||||
| Other comprehensive income, net of tax | 13,273 | — | 13,273 | |||||||||
| Effect of issuance of shares | (9,298 | ) | — | (9,298 | ) | |||||||
| Share repurchases | (15,056 | ) | — | (15,056 | ) | |||||||
| Dividends declared | (19,414 | ) | — | (19,414 | ) | |||||||
| Stock-based compensation | 9,006 | — | 9,006 | |||||||||
| Balance as of September 25, 2016 | $ | 797,186 | $ | (4,015 | ) | $ | 793,171 | |||||
18
| (In thousands) | Foreign Currency Translation Adjustments | Funded Status of Benefit Plans | Net unrealized Loss on available-for-sale Securities | Total Accumulated Other Comprehensive Loss | |||||||||||
| Balance as of December 25, 2016 | $ | (1,822 | ) | $ | (477,994 | ) | — | $ | (479,816 | ) | |||||
Other comprehensive income (loss) before reclassifications, before tax(1) | 11,170 | — | (1,081 | ) | 10,089 | ||||||||||
Amounts reclassified from accumulated other comprehensive loss, before tax(1) | — | 20,762 | — | 20,762 | |||||||||||
Income tax expense (benefit) (1) | 3,777 | 8,208 | (428 | ) | 11,557 | ||||||||||
| Net current-period other comprehensive income, net of tax | 7,393 | 12,554 | (653 | ) | 19,294 | ||||||||||
| Balance as of September 24, 2017 | $ | 5,571 | $ | (465,440 | ) | (653 | ) | $ | (460,522 | ) | |||||
THE NEW YORK TIMES COMPANY
NOTES TO THE CONDENSED CONSOLIDATED FINANCIAL STATEMENTS
(Unaudited)
privately negotiated transactions or other means, including Rule 10b5-1 trading plans. There is no expiration date with respect to this authorization.
As of March 27, 2022, repurchases under this authorization totaled approximately $29.0 million (excluding commissions) and approximately $121.0 million remained.
The following table summarizes the changes in AOCI by component as of March 27, 2022:
| (In thousands) | Foreign Currency Translation Adjustments | Funded Status of Benefit Plans | Net Unrealized Loss on Available-For-Sale Securities | Total Accumulated Other Comprehensive Loss | ||||||||||||||||||||||
| Balance as of December 26, 2021 | $ | 3,754 | $ | (385,680) | $ | (1,276) | $ | (383,202) | ||||||||||||||||||
| Other comprehensive loss before reclassifications, before tax | (2,209) | — | (7,916) | (10,125) | ||||||||||||||||||||||
| Amounts reclassified from accumulated other comprehensive loss, before tax | — | 5,010 | — | 5,010 | ||||||||||||||||||||||
| Income tax (benefit)/expense | (601) | 1,344 | (2,123) | (1,380) | ||||||||||||||||||||||
| Net current-period other comprehensive (loss)/ income, net of tax | (1,608) | 3,666 | (5,793) | (3,735) | ||||||||||||||||||||||
| Balance as of March 27, 2022 | $ | 2,146 | $ | (382,014) | $ | (7,069) | $ | (386,937) | ||||||||||||||||||
The following table summarizes the reclassifications from AOCI for the nine monthsquarter ended September 24, 2017:March 27, 2022:
| (In thousands) | ||||||
| Detail about accumulated other comprehensive loss components | Amounts reclassified from accumulated other comprehensive loss | Affects line item in the statement where net income is presented | ||||
| Funded status of benefit plans: | ||||||
Amortization of prior service credit(1) | $ | (7,274 | ) | Selling, general & administrative costs | ||
Amortization of actuarial loss(1) | 28,036 | Selling, general & administrative costs | ||||
Total reclassification, before tax(2) | 20,762 | |||||
| Income tax expense | 8,208 | Income tax expense | ||||
| Total reclassification, net of tax | $ | 12,554 | ||||
(In thousands) Detail about accumulated other comprehensive | Amounts reclassified from accumulated other comprehensive loss | Affects line item in the | ||||||||||||
| Funded status of benefit plans: | ||||||||||||||
Amortization of prior service credit(1) | $ | (722) | Other components of net periodic benefit | |||||||||||
Amortization of actuarial loss(1) | 5,732 | Other components of net periodic benefit costs | ||||||||||||
Total reclassification, before tax(2) | 5,010 | |||||||||||||
| Income tax expense | 1,344 | Income tax expense | ||||||||||||
| Total reclassification, net of tax | $ | 3,666 | ||||||||||||
(1) These AOCI components are included in the computation of net periodic benefit cost for pension and other postretirement benefits. See Note 9 for more information.
(2) There were no reclassifications relating to noncontrolling interest for thequarterended March 27, 2022.
Total stock-based compensation expense included in the Condensed Consolidated Statements of Operations is as follows:
| For the Quarters Ended | ||||||||||||||
| (In thousands) | March 27, 2022 | March 28, 2021 | ||||||||||||
| Cost of revenue | $ | 1,589 | $ | 1,129 | ||||||||||
| Sales and marketing | 365 | 347 | ||||||||||||
| Product development | 1,751 | 677 | ||||||||||||
| General and administrative | 3,349 | 2,032 | ||||||||||||
| Total stock-based compensation expense | $ | 7,054 | $ | 4,185 | ||||||||||
19
THE NEW YORK TIMES COMPANY
NOTES TO THE CONDENSED CONSOLIDATED FINANCIAL STATEMENTS
(Unaudited)
NOTE 13. SEGMENT INFORMATION
On February 1, 2022, the Company acquired The Athletic (see Note 5). For the first quarter of 2022, the results of The Athletic have onebeen included in the Company's Condensed Consolidated Financial Statements beginning February 1, 2022. The Athletic is a separate reportable segment that includesof the Company. As a result, beginning in the first quarter of 2022, we have 2 reportable segments: The New York Times NYTimes.comGroup and related businesses. Therefore, all requiredThe Athletic. These segments are evaluated regularly by the Company’s Chief Operating Decision Maker in assessing performance and allocating resources. Management uses adjusted operating profit by segment information can be found in the Condensed Consolidated Financial Statements.assessing performance and allocating resources. The Company includes in its presentation revenues and adjusted operating costs to arrive at adjusted operating profit by segment. Adjusted operating costs are defined as operating costs before depreciation and amortization, severance and multiemployer pension plan withdrawal costs. Adjusted operating profit is defined as operating profit before depreciation and amortization, severance, multiemployer pension plan withdrawal costs and special items.
The following tables present segment generated revenues principally from subscriptions and advertising. Other revenues consist primarily of revenues from news services/syndication, digital archives, building rental income, NYT Live (our live events business), e-commerce and affiliate referrals.information:
| For the Quarters Ended | ||||||||||||||||||||
| (In thousands) | March 27, 2022 | March 28, 2021 | % Change | |||||||||||||||||
| Revenues | ||||||||||||||||||||
| The New York Times Group | $ | 525,268 | $ | 473,045 | 11.0 | % | ||||||||||||||
| The Athletic | 12,157 | — | * | |||||||||||||||||
| Total revenues | $ | 537,425 | $ | 473,045 | 13.6 | % | ||||||||||||||
| Adjusted operating costs | ||||||||||||||||||||
| The New York Times Group | $ | 457,543 | $ | 404,938 | 13.0 | % | ||||||||||||||
| The Athletic | 18,979 | — | * | |||||||||||||||||
| Total adjusted operating costs | $ | 476,522 | $ | 404,938 | 17.7 | % | ||||||||||||||
| Adjusted operating profit | ||||||||||||||||||||
| The New York Times Group | $ | 67,725 | $ | 68,107 | (0.6) | % | ||||||||||||||
| The Athletic | (6,822) | — | * | |||||||||||||||||
| Total adjusted operating profit | $ | 60,903 | $ | 68,107 | (10.6) | % | ||||||||||||||
| * Represents a change equal to or in excess of 100% or not meaningful. | ||||||||||||||||||||
20
THE NEW YORK TIMES COMPANY
NOTES TO THE CONDENSED CONSOLIDATED FINANCIAL STATEMENTS
(Unaudited)
| Revenues detail by segment | ||||||||||||||||||||
| For the Quarters Ended | ||||||||||||||||||||
| (In thousands) | March 27, 2022 | March 28, 2021 | % Change | |||||||||||||||||
| The New York Times Group | ||||||||||||||||||||
| Subscription | $ | 361,602 | $ | 329,084 | 9.9 | % | ||||||||||||||
| Advertising | 114,490 | 97,116 | 17.9 | % | ||||||||||||||||
| Other | 49,176 | 46,845 | 5.0 | % | ||||||||||||||||
| Total | $ | 525,268 | $ | 473,045 | 11.0 | % | ||||||||||||||
| The Athletic | ||||||||||||||||||||
| Subscription | $ | 10,377 | $ | — | * | |||||||||||||||
| Advertising | 1,780 | — | * | |||||||||||||||||
| Total | $ | 12,157 | $ | — | * | |||||||||||||||
| The New York Times Company | ||||||||||||||||||||
| Subscription | $ | 371,979 | $ | 329,084 | 13.0 | % | ||||||||||||||
| Advertising | 116,270 | 97,116 | 19.7 | % | ||||||||||||||||
| Other | 49,176 | 46,845 | 5.0 | % | ||||||||||||||||
| Total | $ | 537,425 | $ | 473,045 | 13.6 | % | ||||||||||||||
| * Represents a change equal to or in excess of 100% or not meaningful. | ||||||||||||||||||||
| Adjusted operating costs (operating costs before depreciation and amortization, severance and multiemployer pension plan withdrawal costs) detail by segment | ||||||||||||||||||||
| For the Quarters Ended | ||||||||||||||||||||
| (In thousands) | March 27, 2022 | March 28, 2021 | % Change | |||||||||||||||||
| The New York Times Group | ||||||||||||||||||||
| Cost of revenue (excluding depreciation and amortization) | $ | 269,476 | $ | 250,997 | 7.4 | % | ||||||||||||||
| Sales and marketing | 74,460 | 60,153 | 23.8 | % | ||||||||||||||||
| Product development | 45,179 | 38,943 | 16.0 | % | ||||||||||||||||
Adjusted general and administrative (1) | 68,428 | 54,845 | 24.8 | % | ||||||||||||||||
| Total | $ | 457,543 | $ | 404,938 | 13.0 | % | ||||||||||||||
| The Athletic | ||||||||||||||||||||
| Cost of revenue (excluding depreciation and amortization) | $ | 11,889 | $ | — | * | |||||||||||||||
| Sales and marketing | 3,128 | — | * | |||||||||||||||||
| Product development | 2,254 | — | * | |||||||||||||||||
Adjusted general and administrative | 1,708 | — | * | |||||||||||||||||
| Total | $ | 18,979 | $ | — | * | |||||||||||||||
| The New York Times Company | ||||||||||||||||||||
| Cost of revenue (excluding depreciation and amortization) | $ | 281,365 | $ | 250,997 | 12.1 | % | ||||||||||||||
| Sales and marketing | 77,588 | 60,153 | 29.0 | % | ||||||||||||||||
| Product development | 47,433 | 38,943 | 21.8 | % | ||||||||||||||||
Adjusted general and administrative (1) | 70,136 | 54,845 | 27.9 | % | ||||||||||||||||
| Total | $ | 476,522 | $ | 404,938 | 17.7 | % | ||||||||||||||
(1) Excludes multiemployer pension withdrawal costs of $1.2 million for the quarter ended March 27, 2022 and severance and multiemployer pension withdrawal costs of $0.4 million and $1.3 million, respectively, for the quarter ended March 28,2021. | ||||||||||||||||||||
| * Represents a change equal to or in excess of 100% or not meaningful. | ||||||||||||||||||||
21
THE NEW YORK TIMES COMPANY
NOTES TO THE CONDENSED CONSOLIDATED FINANCIAL STATEMENTS
(Unaudited)
| Reconciliation of operating costs before depreciation and amortization, severance and multiemployer pension plan withdrawal costs (or adjusted operating costs) | ||||||||||||||||||||||||||||||||
| For the Quarters Ended | ||||||||||||||||||||||||||||||||
| (In thousands) | March 27, 2022 | March 28, 2021 | % Change | |||||||||||||||||||||||||||||
| Operating costs | $ | 496,429 | $ | 421,387 | 17.8 | % | ||||||||||||||||||||||||||
| Less: | ||||||||||||||||||||||||||||||||
| Depreciation and amortization | 18,686 | 14,717 | 27.0 | % | ||||||||||||||||||||||||||||
| Severance | — | 406 | * | |||||||||||||||||||||||||||||
| Multiemployer pension plan withdrawal costs | 1,221 | 1,326 | (7.9) | % | ||||||||||||||||||||||||||||
| Adjusted operating costs | $ | 476,522 | $ | 404,938 | 17.7 | % | ||||||||||||||||||||||||||
| * Represents a change equal to or in excess of 100% or not meaningful. | ||||||||||||||||||||||||||||||||
| Reconciliation of operating profit before depreciation and amortization, severance, multiemployer pension plan withdrawal costs and special items (or adjusted operating profit) | ||||||||||||||||||||||||||||||||
| For the Quarters Ended | ||||||||||||||||||||||||||||||||
| (In thousands) | March 27, 2022 | March 28, 2021 | % Change | |||||||||||||||||||||||||||||
| Operating profit | $ | 6,284 | $ | 51,658 | (87.8) | % | ||||||||||||||||||||||||||
| Add: | ||||||||||||||||||||||||||||||||
| Depreciation and amortization | 18,686 | 14,717 | 27.0 | % | ||||||||||||||||||||||||||||
| Severance | — | 406 | * | |||||||||||||||||||||||||||||
| Multiemployer pension plan withdrawal costs | 1,221 | 1,326 | (7.9) | % | ||||||||||||||||||||||||||||
| Special items: | ||||||||||||||||||||||||||||||||
| Acquisition-related costs | 34,712 | — | * | |||||||||||||||||||||||||||||
| Adjusted operating profit | $ | 60,903 | $ | 68,107 | (10.6) | % | ||||||||||||||||||||||||||
| * Represents a change equal to or in excess of 100% or not meaningful. | ||||||||||||||||||||||||||||||||
NOTE 14. CONTINGENT LIABILITIES
We are involved in various legal actions incidental to our business that are now pending against us. These actions are generally for amountshave damage claims that are greatly in excess of the payments, if any, that maywe would be required to be made.pay if we lost or settled the cases. Although the Company cannot predict the outcome of these matters, it is possible that an unfavorable outcome in one or more matters could be material to the Company’s consolidated results of operations or cash flows for an individual reporting period. However, based on currently available information, management does not believe that the ultimate resolution of these matters, individually or in the aggregate, is likely to have a material effect on the Company’s financial position.
NOTE 15. SUBSEQUENT EVENTS
On October 18, 2017, the CompanyDecember 9, 2020, we entered into agreements with Massachusetts Mutual Life Insurance Company (“MassMutual”) relatingan agreement to lease and subsequently sell approximately 4 acres of land at our printing and distribution facility in College Point, N.Y., subject to certain conditions. The New York Times Companies Pension Plan and The Retirement Annuity Plan for Craft Employeeslease commenced on April 11, 2022. At the time of The New York Times Company (collectively, the “Pension Plans”). Underlease expiration in February 2025, we will sell the agreements, the Company will purchase from MassMutual group annuity contracts with respectparcel to the Pension Plans and transfer to MassMutual the future benefit obligations and annuity administrationlessee for approximately 3,800 retirees (or their beneficiaries). The pension benefit obligations and annuity administration for these transferredparticipants will be transferred to MassMutual and MassMutual will irrevocably guarantee the pension benefits for these participants.
lease commencement.
22
Item 2. Management’s Discussion and Analysis of Financial Condition and Results of Operations
EXECUTIVE OVERVIEW
We are a global media organization that includes printdigital and digitalprint products and investments. Werelated businesses. On February 1, 2022, we acquired The Athletic Media Company (“The Athletic”), a global digital subscription-based sports media business that provides national and local coverage of more than 200 clubs and teams in the U.S. and around the world. For the first quarter of 2022, the results of The Athletic have onebeen included in our Condensed Consolidated Financial Statements beginning February 1, 2022. The Athletic is a separate reportable segment with businesses that include our newspaper, websites, mobile applicationsof the Company. As a result, beginning in the first quarter of 2022, we have two reportable segments: The New York Times Group and related businesses.The Athletic.
We generate revenues principally from subscriptions and advertising. OtherIn addition, we generate other revenues primarily consistconsisting of revenues from news services/syndication, digital archives, building rental income, NYT Live (ourlicensing, Wirecutter affiliate referrals, commercial printing, the leasing of floors in our headquarters (the “Company Headquarters”), retail commerce, our student subscription sponsorship program, our live events business), e-commercebusiness, and affiliate referrals. television and film.
Our main operating costs are employee-related costs.
In the accompanying analysis of financial information, we present certain information derived from consolidated financial information but not presented in our financial statements prepared in accordance with generally accepted accounting principles in the United States of America (“GAAP”). TheseWe are presenting in this report supplemental non-GAAP financial performance measures that exclude depreciation, amortization, severance, non-operating retirement costs or multiemployer pension plan withdrawal costs, and certain identified special items, as applicable. These non-GAAP financial measures should not be considered in isolation from or as a substitute for the related GAAP measures, and should be read in conjunction with financial information presented on a GAAP basis. For further information and reconciliations of these non-GAAP measures to the most directly comparable GAAP measures, see “—Results of Operations—Non-GAAP“Non-GAAP Financial Measures.”
23
Financial Highlights
•Diluted earnings per share from continuing operations were $0.20, compared with $0.00$0.03 and $0.24 for the third quarterfirst quarters of 2016.2022 and 2021, respectively. Diluted earnings per share from continuing operations excluding severance, non-operating retirement costs and special items discussed below under “ Non-GAAP Financial Measures” (or “adjusted diluted earnings per share,” a non-GAAP measure) were $0.13$0.19 and $0.06$0.26 for the thirdfirst quarters of 20172022 and 2016,2021, respectively.
•Total revenues increased 6.1%13.6% to $385.6$537.4 million in the thirdfirst quarter of 20172022 from $363.5$473.0 million in the thirdfirst quarter of 2016, primarily driven by increases in digital and print2021.
•Total subscription revenue, as well as digital advertising revenue, partially offset by a decrease in print advertising revenue.
2021. Paid digital-only subscriptionssubscribers totaled approximately 2,487,0008,328,000 with 9,620,000 paid digital-only subscriptions at the end of the thirdfirst quarter of 2017,2022, a 59.1%net increase of 387,000 digital-only subscribers and 382,000 digital-only subscriptions compared with the end of the thirdfourth quarter of 2016. News product2021 and a net increase of 1,354,000 digital-only subscriptions totaled approximately 2,132,000 at the end of the third quarter of 2017, a 59.3% increase compared with the end of the thirdfirst quarter of 2016. Other product subscriptions totaled approximately 355,000 at the end of the third quarter of 2017, a 57.8% increase compared with the end of the third quarter of 2016.2021.
•Total advertising revenues decreased 9.0%increased 19.7% to $116.3 in the thirdfirst quarter of 2017 compared with2022 from $97.1 in the thirdfirst quarter of 2016, reflecting a 20.1% decrease in print advertising revenues, partially offset by2021, due to an 11.0% increase in digital advertising revenues. The decrease in print advertising revenues resulted from a decline in display advertising, primarily in the luxury, travel, real estate, media, technology, and telecommunications categories. The increaseof 12.6% in digital advertising revenues primarily reflected increasesand an increase of 30.9% in revenue from our smartphone platform, programmatic channels and branded content, partially offset by a continued decrease in traditional website display advertising. We expectprint advertising revenues to remain under pressure in the fourth quarter of 2017, with digital advertising revenues expected to be flat or slightly lower compared with the same prior year period.revenues.
•Operating costs decreased in the third quarter of 2017increased 17.8% to $350.1 million from $356.6$496.4 million in the thirdfirst quarter of 2016, largely due to lower severance, print production and distribution costs, and savings2022 from $421.4 million in international operations, which were partially offset by higher costs following the acquisitionsfirst quarter of Wirecutter and digital marketing agency, Fake Love, and higher marketing costs.2021. Operating costs before depreciation, amortization, severance and non-operating retirementmultiemployer pension plan withdrawal costs (or “adjusted operating costs,” a non-GAAP measure) increased 17.7% in the thirdfirst quarter of 20172022 to $329.2$476.5 million from $324.4$404.9 million in the thirdfirst quarter of 2016.2021.
Impact of Covid-19 Pandemic
The global Covid-19 pandemic, efforts to lower multiemployer pension plan withdrawal expense.contain it and the resulting disruptions continue to have widespread, rapidly evolving, and unpredictable impacts on global society, economies, financial markets and business practices. See “Item 1A — Risk Factors” in our Annual Report on Form 10-K for the year ended December 26, 2021, for more information. The full impact that the pandemic will have on our business, operations and financial results is uncertain and will depend on numerous evolving factors and future developments, including the extent of variants and resurgences; the effect of ongoing vaccination and mitigation efforts; the impact of the pandemic on economic conditions and the companies with which we do business, including our advertisers; the status of travel restrictions; and changes in consumer behavior in response to the pandemic, among many other factors. We will continue to actively monitor the situation and may take further actions that alter our business operations as may be required by federal, state, local or foreign authorities, or that we determine are appropriate.
As a result of the global Covid-19 pandemic, the vast majority of our employees have worked remotely since March 2020. As we transition to hybrid work with employees working both from the office and remotely, we have invested and expect to continue to invest in our Company Headquarters and other offices as well as in technological improvements.
24
RESULTS OF OPERATIONS
The following table presents our consolidated financial results:
| For the Quarters Ended | ||||||||||||||||||||||||||||||||||||||
| (In thousands) | March 27, 2022 | March 28, 2021 | % Change | |||||||||||||||||||||||||||||||||||
| Revenues | ||||||||||||||||||||||||||||||||||||||
| Subscription | $ | 371,979 | $ | 329,084 | 13.0 | % | ||||||||||||||||||||||||||||||||
| Advertising | 116,270 | 97,116 | 19.7 | % | ||||||||||||||||||||||||||||||||||
| Other | 49,176 | 46,845 | 5.0 | % | ||||||||||||||||||||||||||||||||||
| Total revenues | 537,425 | 473,045 | 13.6 | % | ||||||||||||||||||||||||||||||||||
| Operating costs | ||||||||||||||||||||||||||||||||||||||
| Cost of revenue (excluding depreciation and amortization) | 281,365 | 250,997 | 12.1 | % | ||||||||||||||||||||||||||||||||||
| Sales and marketing | 77,588 | 60,153 | 29.0 | % | ||||||||||||||||||||||||||||||||||
| Product development | 47,433 | 38,943 | 21.8 | % | ||||||||||||||||||||||||||||||||||
| General and administrative | 71,357 | 56,577 | 26.1 | % | ||||||||||||||||||||||||||||||||||
| Depreciation and amortization | 18,686 | 14,717 | 27.0 | % | ||||||||||||||||||||||||||||||||||
| Total operating costs | 496,429 | 421,387 | 17.8 | % | ||||||||||||||||||||||||||||||||||
| Acquisition-related costs | 34,712 | — | * | |||||||||||||||||||||||||||||||||||
| Operating profit | 6,284 | 51,658 | (87.8) | % | ||||||||||||||||||||||||||||||||||
| Other components of net periodic benefit costs | 1,522 | 2,599 | (41.4) | % | ||||||||||||||||||||||||||||||||||
| Interest income and other, net | 1,075 | 1,511 | (28.9) | % | ||||||||||||||||||||||||||||||||||
| Income from continuing operations before income taxes | 5,837 | 50,570 | (88.5) | % | ||||||||||||||||||||||||||||||||||
| Income tax expense | 1,112 | 9,461 | (88.2) | % | ||||||||||||||||||||||||||||||||||
| Net income | 4,725 | 41,109 | (88.5) | % | ||||||||||||||||||||||||||||||||||
| Net income attributable to The New York Times Company common stockholders | $ | 4,725 | $ | 41,109 | (88.5) | % | ||||||||||||||||||||||||||||||||
| For the Quarters Ended | For the Nine Months Ended | |||||||||||||||||||||
| (In thousands) | September 24, 2017 | September 25, 2016 | % Change | September 24, 2017 | September 25, 2016 | % Change | ||||||||||||||||
| Revenues | ||||||||||||||||||||||
| Subscription | $ | 246,638 | $ | 217,099 | 13.6 | % | $ | 739,050 | $ | 654,573 | 12.9 | % | ||||||||||
| Advertising | 113,633 | 124,898 | (9.0 | )% | 375,895 | 395,733 | (5.0 | )% | ||||||||||||||
| Other | 25,364 | 21,550 | 17.7 | % | 76,568 | 65,386 | 17.1 | % | ||||||||||||||
| Total revenues | 385,635 | 363,547 | 6.1 | % | 1,191,513 | 1,115,692 | 6.8 | % | ||||||||||||||
| Operating costs | ||||||||||||||||||||||
| Production costs: | ||||||||||||||||||||||
| Wages and benefits | 89,866 | 91,041 | (1.3 | )% | 269,209 | 274,142 | (1.8 | )% | ||||||||||||||
| Raw materials | 15,718 | 18,228 | (13.8 | )% | 48,461 | 53,115 | (8.8 | )% | ||||||||||||||
| Other | 44,336 | 47,347 | (6.4 | )% | 134,771 | 139,938 | (3.7 | )% | ||||||||||||||
| Total production costs | 149,920 | 156,616 | (4.3 | )% | 452,441 | 467,195 | (3.2 | )% | ||||||||||||||
| Selling, general and administrative costs | 184,483 | 184,596 | (0.1 | )% | 595,491 | 534,911 | 11.3 | % | ||||||||||||||
| Depreciation and amortization | 15,677 | 15,384 | 1.9 | % | 46,961 | 46,003 | 2.1 | % | ||||||||||||||
| Total operating costs | 350,080 | 356,596 | (1.8 | )% | 1,094,893 | 1,048,109 | 4.5 | % | ||||||||||||||
| Headquarters redesign and consolidation | 2,542 | — | * | 6,929 | — | * | ||||||||||||||||
| Restructuring charge | — | 2,949 | * | — | 14,804 | * | ||||||||||||||||
| Multiemployer pension plan withdrawal expense | — | (4,971 | ) | * | — | 6,730 | * | |||||||||||||||
| Operating profit | 33,013 | 8,973 | * | 89,691 | 46,049 | 94.8 | % | |||||||||||||||
| Gain/(loss) from joint ventures | 31,557 | 463 | * | 31,464 | (41,845 | ) | * | |||||||||||||||
| Interest expense, net | 4,660 | 9,032 | (48.4 | )% | 15,118 | 26,955 | (43.9 | )% | ||||||||||||||
| Income/(loss) from continuing operations before income taxes | 59,910 | 404 | * | 106,037 | (22,751 | ) | * | |||||||||||||||
| Income tax expense/(benefit) | 23,420 | 121 | * | 40,873 | (8,956 | ) | * | |||||||||||||||
| Income/(loss) from continuing operations | 36,490 | 283 | * | 65,164 | (13,795 | ) | * | |||||||||||||||
| Loss from discontinued operations, net of income taxes | 488 | — | * | 488 | — | * | ||||||||||||||||
| Net income/(loss) | 36,002 | 283 | * | 64,676 | (13,795 | ) | * | |||||||||||||||
| Net (income)/loss attributable to the noncontrolling interest | (3,673 | ) | 123 | * | (3,567 | ) | 5,719 | * | ||||||||||||||
| Net income/(loss) attributable to The New York Times Company common stockholders | $ | 32,329 | $ | 406 | * | $ | 61,109 | $ | (8,076 | ) | * | |||||||||||
25
Revenues
Subscription Revenues
2022 Compared with 2021
Subscription revenues increased 13.6% in the third quarter and 12.9%13.0% in the first nine monthsquarter of 20172022 compared with the same prior-year periods,period, primarily due to significant growth in recent quarters in the number of subscriptionssubscribers to the Company’s digital subscriptiondigital-only products and a benefit from subscriptions graduating to higher prices from introductory promotional pricing, as well as the 2017 increaseinclusion of subscription revenue from The Athletic. The increases in home-delivery prices for The New York Times newspaper, which more thansubscription revenue were slightly offset by a declinedecrease in print copies sold. Revenuessubscription revenue primarily attributable to lower domestic home delivery revenue, which declined 2.2%, as well as lower single-copy revenue. There is no print subscription revenue generated from ourThe Athletic.
The Company ended the first quarter of 2022 with approximately 9,108,000 paid subscribers with approximately 10,390,000 paid subscriptions across its print and digital products. Of the 9,108,000 subscribers, 8,328,000 were paid digital-only newssubscribers with 9,620,000 paid digital-only subscriptions. As a result of the acquisition of The Athletic during the quarter, the Company added The Athletic’s approximately 1,101,000 subscribers and 1,233,000 subscriptions (including e-readersas of the date of acquisition.
There was a net increase of 387,000 digital-only subscribers and replica editions) were $82.1 million382,000 digital-only subscriptions compared with the end of the fourth quarter of 2021 and a net increase of 1,354,000 digital-only subscriptions compared with the end of the first quarter of 2021. These net increases included approximately 16,000 net subscriber and 24,000 net subscription additions to The Athletic since the acquisition. In addition, during the quarter, the Company expanded the terms of domestic home delivery print subscriptions to include access to its Games product and canceled approximately 67,000 standalone Games subscriptions held by home delivery subscribers. This change reduced digital-only subscriptions by 67,000 in the thirdquarter, but had no impact on subscriber numbers.
Print domestic home delivery subscribers totaled approximately 780,000 with 770,000 print subscriptions at the end of the first quarter of 20172022, a net decrease of 15,000 subscribers and $234.2 million in14,000 subscriptions compared with the end of the fourth quarter of 2021 and a net decrease of 57,000 subscribers and 55,000 subscriptions compared with the end of the first nine monthsquarter of 2017, an increase of 46.2% and 44.3% from the third quarter and first nine months of 2016, respectively.2021.
The following table summarizes digital-onlydigital and print subscription revenues for the thirdfirst quarters of 2022 and first nine months of 2017 and 2016:2021:
| For the Quarters Ended | ||||||||||||||||||||||||||||||||||||||
| (In thousands) | March 27, 2022 | March 28, 2021 | % Change | |||||||||||||||||||||||||||||||||||
Digital-only subscription revenues (1) | $ | 226,763 | $ | 179,599 | 26.3 | % | ||||||||||||||||||||||||||||||||
| Print subscription revenues: | ||||||||||||||||||||||||||||||||||||||
Domestic home delivery subscription revenues (2) | 131,391 | 134,395 | (2.2) | % | ||||||||||||||||||||||||||||||||||
Single-copy, NYT International and Other subscription revenues (3) | 13,825 | 15,090 | (8.4) | % | ||||||||||||||||||||||||||||||||||
| Subtotal print subscription revenues | 145,216 | 149,485 | (2.9) | % | ||||||||||||||||||||||||||||||||||
| Total subscription revenues | $ | 371,979 | $ | 329,084 | 13.0 | % | ||||||||||||||||||||||||||||||||
(1) Includes revenue from digital-only bundled and standalone subscriptions to the Company’s news product, as well as The Athletic and our Games, Cooking, Audm and Wirecutter products. | ||||||||||||||||||||||||||||||||||||||
(2) Domestic home delivery subscriptions include access to digital news, Games, Cooking and Wirecutter products. | ||||||||||||||||||||||||||||||||||||||
(3) NYT International is the international edition of our print newspaper. | ||||||||||||||||||||||||||||||||||||||
26
| For the Quarters Ended | For the Nine Months Ended | |||||||||||||||||||||
| (In thousands) | September 24, 2017 | September 25, 2016 | % Change | September 24, 2017 | September 25, 2016 | % Change | ||||||||||||||||
| Digital-only subscription revenues: | ||||||||||||||||||||||
News product subscription revenues(1) | $ | 82,073 | $ | 56,144 | 46.2 | % | $ | 234,234 | $ | 162,344 | 44.3 | % | ||||||||||
Other product subscription revenues(2) | 3,610 | 2,408 | 49.9 | % | 9,810 | 6,778 | 44.7 | % | ||||||||||||||
| Total digital-only subscription revenues | $ | 85,683 | $ | 58,552 | 46.3 | % | $ | 244,044 | $ | 169,122 | 44.3 | % | ||||||||||
(1) Includes revenues from subscriptions to the Company’s news product. News product subscription packages that include access to the Company’s Crossword and Cooking products are also included in this category. | ||||||||||||||||||||||
(2) Includes revenues from standalone subscriptions to the Company’s Crossword and Cooking products. | ||||||||||||||||||||||
The following table summarizes digital-only subscriptionsdigital and print subscribers as of the end of the thirdfirst quarters of 20172022 and 2016: 2021, and fourth quarter of 2021:
| For the Quarters Ended | |||||||||
| (In thousands) | September 24, 2017 | September 25, 2016 | % Change | ||||||
Digital-only subscriptions(1): | |||||||||
News product subscriptions(2) | 2,132 | 1,338 | 59.3 | % | |||||
Other product subscriptions(3) | 355 | 225 | 57.8 | % | |||||
| Total digital-only subscriptions | 2,487 | 1,563 | 59.1 | % | |||||
(1) Reflects certain immaterial prior-period corrections. | |||||||||
(2) Includes subscriptions to the Company’s news product. News product subscription packages that include access to the Company’s Crossword and Cooking products are also included in this category. | |||||||||
(3) Includes standalone subscriptions to the Company’s Crossword and Cooking products. | |||||||||
| For the Quarters Ended | ||||||||||||||||||||||||||||||||
| March 27, 2022 | March 28, 2021 | % Change | December 26, 2021 | % Change | ||||||||||||||||||||||||||||
Digital-only subscribers(1) | 8,328 | 6,101 | 36.5 | % | 6,840 | 21.8 | % | |||||||||||||||||||||||||
Print subscribers(2) | 780 | 837 | (6.8) | % | 795 | (1.9) | % | |||||||||||||||||||||||||
| Total subscribers | 9,108 | 6,938 | 31.3 | % | 7,635 | 19.3 | % | |||||||||||||||||||||||||
(1) Subscribers with paid digital-only subscriptions to one or more of the Company’s news, The Athletic, Games, Cooking and Wirecutter products. Subscribers with a paid domestic home-delivery print subscription to The New York Times are excluded. The number of paid digital-only subscribers from group education and group corporate subscriptions (which collectively represented approximately 5% of paid digital-only subscribers as of December 26, 2021) is derived using the value of the relevant contract and a discounted subscription rate. | ||||||||||||||||||||||||||||||||
(2) Subscribers with a paid domestic home delivery or mail print subscription to The New York Times, which also includes access to digital news, Games, Cooking and Wirecutter products, or a paid print subscription to our Book Review or Large Type Weekly products. Book Review, Mail and Large Type Weekly subscribers are included in the count of subscribers but not subscriptions. | ||||||||||||||||||||||||||||||||
The following table summarizes digital and print subscriptions(1) as of the end of the first quarters of 2022 and 2021, and the fourth quarter of 2021:
| For the Quarters Ended | ||||||||||||||||||||||||||||||||
| (In thousands) | March 27, 2022 | March 28, 2021 | % Change | December 26, 2021 | % Change | |||||||||||||||||||||||||||
Digital-only subscriptions (2)(3) | 9,620 | 7,033 | 36.8 | % | 8,005 | 20.2 | % | |||||||||||||||||||||||||
Print subscriptions (4) | 770 | 825 | (6.7) | % | 784 | (1.8) | % | |||||||||||||||||||||||||
| Total subscriptions | 10,390 | 7,858 | 32.2 | % | 8,789 | 18.2 | % | |||||||||||||||||||||||||
(1) While the Company is moving toward an emphasis on individual subscriber growth rather than growth of total subscriptions, we expect to continue to report on the number of subscriptions at least through the fourth quarter of 2022. | ||||||||||||||||||||||||||||||||
(2) Paid digital-only subscriptions to the Company’s news, The Athletic, Games, Cooking, Audm and Wirecutter products. Standalone subscriptions to these products are counted separately and bundle subscriptions are counted as one subscription. | ||||||||||||||||||||||||||||||||
(3) The number of paid digital-only subscriptions includes estimated group corporate and group education subscriptions (which collectively represent approximately 5% of paid digital-only subscriptions as of December 26, 2021). We calculate this estimate using the value of the relevant contract and a discounted subscription rate. The actual number of users who have access to our products through group subscriptions is substantially higher. In the fourth quarter of 2021, we updated the discounted subscription rate used as part of this calculation in order to bring it in line with our current digital subscription pricing model. For comparison purposes, we recast digital-only subscriptions in prior periods using the updated methodology, and this resulted in approximately 42,000 additional group corporate and group education subscriptions in the first quarter of 2021. There is no impact to subscription revenue as a result of this change. | ||||||||||||||||||||||||||||||||
(4) Paid domestic home-delivery print subscriptions to The New York Times, which also include access to digital news, Games, Cooking and Wirecutter products. Excludes subscriptions to our Book Review or Large Type Weekly products and subscriptions to The New York Times that are delivered by mail. | ||||||||||||||||||||||||||||||||
27
The following table summarizes supplementary subscriber metrics as of the end of the first quarters of 2022 and 2021, and fourth quarter of 2021:
| For the Quarters Ended | ||||||||||||||||||||||||||||||||
| (In thousands except for ARPU) | March 27, 2022 | March 28, 2021 | % Change | December 26, 2021 | % Change | |||||||||||||||||||||||||||
Digital-only subscriber ARPU(1) | $ | 9.04 | $ | 9.15 | (1.2) | % | $ | 9.55 | (5.3) | % | ||||||||||||||||||||||
Total multiproduct subscribers(2) | 2,569 | 2,100 | 22.3 | % | 2,351 | 9.3 | % | |||||||||||||||||||||||||
Digital-only subscribers with News(3) | 6,150 | 5,290 | 16.3 | % | 5,880 | 4.6 | % | |||||||||||||||||||||||||
Subscribers with The Athletic(4) | 1,257 | N/A | N/A | N/A | N/A | |||||||||||||||||||||||||||
(1) “Digital-only subscriber Average Revenue per User” or “Digital-only subscriber ARPU” is calculated by dividing the average monthly digital subscription revenue (calculated by dividing digital subscription revenue in the quarter by 3.25 to reflect a 28-day billing cycle) in the measurement period by the average number of digital subscribers during the period. | ||||||||||||||||||||||||||||||||
(2) Subscribers with paid subscriptions that include access to two or more of the Company’s products, including through separate standalone subscriptions; a digital bundle; or a print home-delivery subscription (which includes access to our digital news, Games, Cooking and Wirecutter products). | ||||||||||||||||||||||||||||||||
(3) Subscribers with a paid digital-only subscription that includes access to the Company’s digital news product. | ||||||||||||||||||||||||||||||||
(4) Subscribers with a paid subscription that includes access to The Athletic. | ||||||||||||||||||||||||||||||||
28
We believe that the significant growth over the last several years in subscriptions to our products demonstrates the success of our “subscription-first” strategy and the willingness of our readers to pay for high-quality journalism. The Company is increasing its emphasis on subscriber growth rather than growth of total subscriptions. The following charts illustrate the growth in net digital-only subscribers and corresponding subscription revenues as well as the relative stability of our print domestic home delivery subscription products.
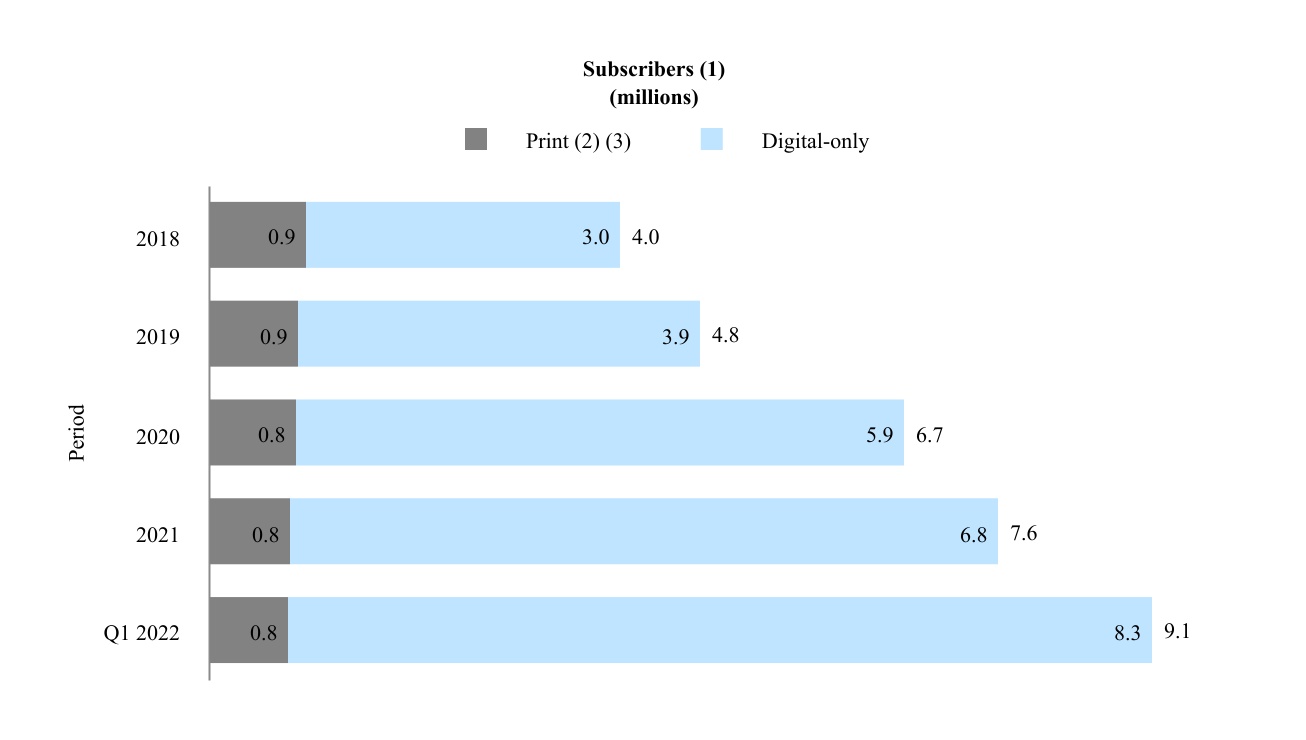
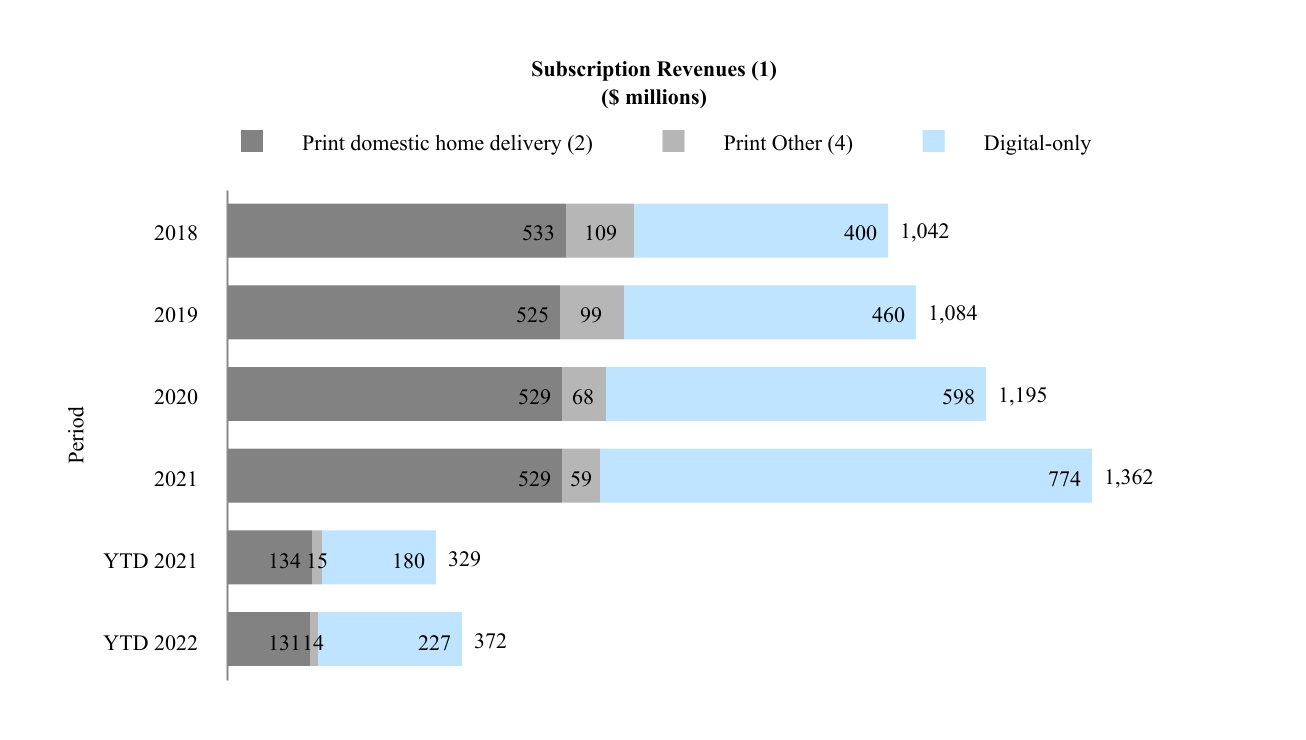
(1) Amounts may not add due to rounding.
(2) Includes access to some of our digital products.
(3) Includes Book Review, Mail and Large Type Weekly subscribers.
(4) Print Other includes single-copy, NYT International and other subscription revenues
29
Advertising Revenues
Advertising revenues are derived from the sale of our advertising products and services on our print, web and mobile platforms. These revenues are primarily determined by the volume, rate and mix of advertisements. Display advertising revenue is principally from advertisers (such as technology, financial and luxury goods companies) promoting products, services or brands on digital platforms in the form of display ads, audio and video, and in print, in the form of column-inch ads. Advertising revenue is primarily derived from offerings sold directly to marketers by our advertising sales teams. A smaller proportion of our total advertising revenues is generated through programmatic auctions run by third-party ad exchanges. Advertising revenue is primarily determined by the volume (e.g., impressions or column inches), rate and mix of advertisements. Digital advertising includes our core digital advertising business and other digital advertising. Our core digital advertising business includes direct-sold website, mobile application, podcast, email and video advertisements. Advertising revenue from The Athletic is primarily podcast revenue and therefore is reflected in this category. Direct-sold display advertising, a component of core digital advertising, includes offerings on websites and mobile applications sold directly to marketers by our advertising sales teams. Other digital advertising includes open-market programmatic advertising and creative services fees. Print advertising includes revenue from column-inch ads and on our web and mobile platforms in the form of banners, video, rich media and other interactive ads. Displayclassified advertising, also includes branded content on The Times’s platforms. Classified advertising revenue includes line-ads sold in the major categories of real estate, help wanted, automotive and other. Other advertising revenue primarily includes creative services fees associated with, among other things, our branded content studio; revenue fromas well as preprinted advertising, also known as free-standing inserts;freestanding inserts.
The following table summarizes digital and print advertising revenues for the first quarters of 2022 and 2021:
| For the Quarters Ended | ||||||||||||||||||||||||||||||||||||||
| (In thousands) | March 27, 2022 | March 28, 2021 | % Change | |||||||||||||||||||||||||||||||||||
| Advertising revenues: | ||||||||||||||||||||||||||||||||||||||
| Digital | $ | 67,014 | $ | 59,496 | 12.6 | % | ||||||||||||||||||||||||||||||||
| 49,256 | 37,620 | 30.9 | % | |||||||||||||||||||||||||||||||||||
| Total advertising | $ | 116,270 | $ | 97,116 | 19.7 | % | ||||||||||||||||||||||||||||||||
2022 Compared with 2021
Digital advertising revenues, which represented 57.6% of total advertising revenues in the first quarter of 2022, increased $7.5 million, or 12.6%, to $67.0 million compared with $59.5 million in the same prior-year period, of which $1.8 million, or 23.7%, was contributed by The Athletic following the acquisition. The increase was primarily driven by higher direct-sold advertising, including traditional display and podcasts. Core digital advertising revenue generatedincreased $10.3 million, which includes $1.8 million from branded bagsThe Athletic, due to growth in which our newspapers are delivered.
| For the Quarters Ended | |||||||||||||||||||||||||||||||||
| September 24, 2017 | September 25, 2016 | % Change | |||||||||||||||||||||||||||||||
| (In thousands) | Digital | Total | Digital | Total | Digital | Total | |||||||||||||||||||||||||||
| Display | $ | 56,710 | $ | 41,547 | $ | 98,257 | $ | 72,442 | $ | 38,447 | $ | 110,889 | (21.7 | )% | 8.1 | % | (11.4 | )% | |||||||||||||||
| Classified and Other | 7,679 | 7,697 | 15,376 | 8,102 | 5,907 | 14,009 | (5.2 | )% | 30.3 | % | 9.8 | % | |||||||||||||||||||||
| Total advertising | $ | 64,389 | $ | 49,244 | $ | 113,633 | $ | 80,544 | $ | 44,354 | $ | 124,898 | (20.1 | )% | 11.0 | % | (9.0 | )% | |||||||||||||||
| For the Nine Months Ended | |||||||||||||||||||||||||||||||||
| September 24, 2017 | September 25, 2016 | % Change | |||||||||||||||||||||||||||||||
| (In thousands) | Digital | Total | Digital | Total | Digital | Total | |||||||||||||||||||||||||||
| Display | $ | 196,836 | $ | 129,008 | $ | 325,844 | $ | 238,399 | $ | 114,957 | $ | 353,356 | (17.4 | )% | 12.2 | % | (7.8 | )% | |||||||||||||||
| Classified and Other | 24,966 | 25,085 | 50,051 | 26,156 | 16,221 | 42,377 | (4.5 | )% | 54.6 | % | 18.1 | % | |||||||||||||||||||||
| Total advertising | $ | 221,802 | $ | 154,093 | $ | 375,895 | $ | 264,555 | $ | 131,178 | $ | 395,733 | (16.2 | )% | 17.5 | % | (5.0 | )% | |||||||||||||||
Print advertising revenues, which represented 56.7%42.4% of total advertising revenues for the third quarter of 2017 and 59.0% of total advertising revenues for the first nine months of 2017, declined 20.1% to $64.4 million in the third quarter of 2017 and 16.2% to $221.8 million in the first nine monthsquarter of 2017,2022, increased $11.6 million, or 30.9%, to $49.3 million compared with $80.5$37.6 million and $264.6 million, respectively, in the same prior-year periods.period. There is no print advertising revenue generated from The decreaseAthletic. The increase in both periodsthe first quarter of 2022 was driven by a decline in display advertising, primarily in the entertainment and luxury travel, real estate, media, technology and telecommunications categories.
Other Revenues
Other revenues primarily consist of revenues from news services/syndication, digital archives, building rental income,licensing, Wirecutter affiliate referrals, commercial printing, the leasing of floors in the Company Headquarters, retail commerce, our NYT Livestudent subscription sponsorship program, our live events business, e-commerce and affiliate referrals.television and film.
2022 Compared with 2021
Other revenues increased 17.7% in the third quarter of 2017 and 17.1%5.0% in the first nine months of 2017, compared with the same prior-year periods, largely due to affiliate referral revenue associated with Wirecutter, which the Company acquired in October 2016.
| For the Quarters Ended | For the Nine Months Ended | |||||||||||||||||||||
| (In thousands) | September 24, 2017 | September 25, 2016 | % Change | September 24, 2017 | September 25, 2016 | % Change | ||||||||||||||||
| Production costs: | ||||||||||||||||||||||
| Wages and benefits | $ | 89,866 | $ | 91,041 | (1.3 | )% | $ | 269,209 | $ | 274,142 | (1.8 | )% | ||||||||||
| Raw materials | 15,718 | 18,228 | (13.8 | )% | 48,461 | 53,115 | (8.8 | )% | ||||||||||||||
| Other | 44,336 | 47,347 | (6.4 | )% | 134,771 | 139,938 | (3.7 | )% | ||||||||||||||
| Total production costs | 149,920 | 156,616 | (4.3 | )% | 452,441 | 467,195 | (3.2 | )% | ||||||||||||||
| Selling, general and administrative costs | 184,483 | 184,596 | (0.1 | )% | 595,491 | 534,911 | 11.3 | % | ||||||||||||||
| Depreciation and amortization | 15,677 | 15,384 | 1.9 | % | 46,961 | 46,003 | 2.1 | % | ||||||||||||||
| Total operating costs | $ | 350,080 | $ | 356,596 | (1.8 | )% | $ | 1,094,893 | $ | 1,048,109 | 4.5 | % | ||||||||||
Building rental revenue from the leasing of floors in the Company Headquarters totaled $7.1 million and $6.2 million in the first quarters of 2022 and 2021, respectively.
30
Operating Costs
Operating costs were as follows:
| For the Quarters Ended | ||||||||||||||||||||||||||||||||||||||
| (In thousands) | March 27, 2022 | March 28, 2021 | % Change | |||||||||||||||||||||||||||||||||||
| Operating costs: | ||||||||||||||||||||||||||||||||||||||
Cost of revenue (excluding depreciation and amortization) (1) | $ | 281,365 | $ | 250,997 | 12.1 | % | ||||||||||||||||||||||||||||||||
| Sales and marketing | 77,588 | 60,153 | 29.0 | % | ||||||||||||||||||||||||||||||||||
Product development (1) | 47,433 | 38,943 | 21.8 | % | ||||||||||||||||||||||||||||||||||
General and administrative (1) | 71,357 | 56,577 | 26.1 | % | ||||||||||||||||||||||||||||||||||
| Depreciation and amortization | 18,686 | 14,717 | 27.0 | % | ||||||||||||||||||||||||||||||||||
| Total operating costs | $ | 496,429 | $ | 421,387 | 17.8 | % | ||||||||||||||||||||||||||||||||
(1)Technology costs, which include product development costs and certain components of cost of revenue and general and administrative costs as described below, increased 22.0% to $87.9 million compared with $72.1 million the first quarter of 2021. | ||||||||||||||||||||||||||||||||||||||
Cost of Revenue (excluding depreciation and amortization)
Cost of revenue includes all costs related to content creation, subscriber and advertiser servicing, and print production and distribution as well as infrastructure costs related to delivering digital content, which include all cloud and cloud-related costs as well as compensation for employees that enhance and maintain that infrastructure.
2022 Compared with 2021
Cost of revenue increased in the first quarter of 2022 by $30.4 million, or 12.1%, compared with the first quarter of 2021. The increase is largely due to higher journalism costs of $22.1 million, higher subscriber servicing costs of $5.0 million, and higher print production and distribution costs of $2.5 million. The increase in journalism costs was largely driven by growth in the number of employees who work in the newsroom and on our Games, Cooking, Audm and Wirecutter products, as well as the inclusion of $10.8 million in journalism costs from The Athletic. The increase in subscriber servicing costs was primarily due to higher credit card processing fees and third-party commissions due to increased subscriptions. The increase in print production and distribution costs was largely due to an increase in newsprint pricing and higher compensation and benefits. Technology costs in Cost of revenue, which include costs related to content delivery and subscriber technology, increased 12.3%to $24.5 million compared with $21.8 million in the first quarter of 2021.
Sales and Marketing
Sales and marketing includes costs related to the Company’s marketing efforts as well as advertising sales costs. Media expenses is a component of sales and marketing costs that represents the cost to promote our subscription business.
2022 Compared with 2021
Sales and marketing costs in the first quarter of 2022 increased by $17.4 million, or 29.0%, compared with the first quarter of 2021. The increase is primarily due to higher media expenses and the inclusion of $3.1 million in sales and marketing costs from The Athletic.
Media expenses increased to $46.3 million in the first quarter of 2022 from $35.9 million in the first quarter of 2021 largely as a result of higher brand marketing expenses.
Product Development
Product development includes costs associated with the Company’s investment in developing and enhancing new and existing product technology, including engineering, product development and data insights.
2022 Compared with 2021
Product development costs in the first quarter of 2022 increased by $8.5 million, or 21.8%, compared with the first quarter of 2021. The increase was largely due to growth in the number of digital product development employees in connection with digital subscription strategic initiatives as well as the inclusion of $2.3 million in product development costs from The Athletic. All product development costs are technology costs.
General and Administrative Costs
General and administrative costs include general management, corporate enterprise technology, building operations, unallocated overhead costs, severance and multiemployer pension plan withdrawal costs.
31
2022 Compared with 2021
General and administrative costs in the first quarter of 2022 increased by $14.8 million, or 26.1%, compared with the first quarter of 2021. The increase is primarily due to growth in the number of employees as well as the inclusion of $1.7 million in general and administrative costs from The Athletic. Technology costs in General and administrative, which include costs related to enterprise technology and information security, increased 41.0% million to $16.0 million compared with $11.3 million in the first quarter of 2021.
Depreciation and Amortization
2022 Compared with 2021
Depreciation and amortization costs in the first quarter of 2022 increased $4.0 million, or 27.0%, compared to the first quarter of 2021. The increase is due to the Company’s acquisition of The Wirecutter.
See Note 7 of the Notes to the Condensed Consolidated Financial Statements for additional information regarding other items,items.
Segment Information
On February 1, 2022, we acquired The Athletic. For the first quarter of 2022, the results of The Athletic have been included in our Condensed Consolidated Financial Statements beginning February 1, 2022. Beginning in the first quarter of 2022, we have two reportable segments: The New York Times Group and The Athletic. Management, including our President and Chief Executive Officer (who is our Chief Operating Decision Maker), uses adjusted operating profit by segment (as defined below) in assessing performance and allocating resources. We include in our presentation revenues and adjusted operating costs (as defined below) to arrive at adjusted operating profit by segment. See “Non-GAAP Financial Measures” below for more information on adjusted operating costs and adjusted operating profit.
| For the Quarters Ended | ||||||||||||||||||||
| (In thousands) | March 27, 2022 | March 28, 2021 | % Change | |||||||||||||||||
| Revenues | ||||||||||||||||||||
| The New York Times Group | $ | 525,268 | $ | 473,045 | 11.0 | % | ||||||||||||||
| The Athletic | 12,157 | — | * | |||||||||||||||||
| Total revenues | $ | 537,425 | $ | 473,045 | 13.6 | % | ||||||||||||||
| Adjusted operating costs | ||||||||||||||||||||
| The New York Times Group | $ | 457,543 | $ | 404,938 | 13.0 | % | ||||||||||||||
| The Athletic | 18,979 | — | * | |||||||||||||||||
| Total adjusted operating costs | $ | 476,522 | $ | 404,938 | 17.7 | % | ||||||||||||||
| Adjusted operating profit | ||||||||||||||||||||
| The New York Times Group | $ | 67,725 | $ | 68,107 | (0.6) | % | ||||||||||||||
| The Athletic | (6,822) | — | * | |||||||||||||||||
| Total adjusted operating profit | $ | 60,903 | $ | 68,107 | (10.6) | % | ||||||||||||||
| * Represents a change equal to or in excess of 100% or not meaningful. | ||||||||||||||||||||
32
| Revenues detail by segment | ||||||||||||||||||||
| For the Quarters Ended | ||||||||||||||||||||
| (In thousands) | March 27, 2022 | March 28, 2021 | % Change | |||||||||||||||||
| The New York Times Group | ||||||||||||||||||||
| Subscription | $ | 361,602 | $ | 329,084 | 9.9 | % | ||||||||||||||
| Advertising | 114,490 | 97,116 | 17.9 | % | ||||||||||||||||
| Other | 49,176 | 46,845 | 5.0 | % | ||||||||||||||||
| Total | $ | 525,268 | $ | 473,045 | 11.0 | % | ||||||||||||||
| The Athletic | ||||||||||||||||||||
| Subscription | $ | 10,377 | $ | — | * | |||||||||||||||
| Advertising | 1,780 | — | * | |||||||||||||||||
| Total | $ | 12,157 | $ | — | * | |||||||||||||||
| The New York Times Company | ||||||||||||||||||||
| Subscription | $ | 371,979 | $ | 329,084 | 13.0 | % | ||||||||||||||
| Advertising | 116,270 | 97,116 | 19.7 | % | ||||||||||||||||
| Other | 49,176 | 46,845 | 5.0 | % | ||||||||||||||||
| Total | $ | 537,425 | $ | 473,045 | 13.6 | % | ||||||||||||||
| * Represents a change equal to or in excess of 100% or not meaningful. | ||||||||||||||||||||
| Adjusted operating costs (operating costs before depreciation and amortization, severance and multiemployer pension plan withdrawal costs) details by segment | ||||||||||||||||||||
| For the Quarters Ended | ||||||||||||||||||||
| (In thousands) | March 27, 2022 | March 28, 2021 | % Change | |||||||||||||||||
| The New York Times Group | ||||||||||||||||||||
| Cost of revenue (excluding depreciation and amortization) | $ | 269,476 | $ | 250,997 | 7.4 | % | ||||||||||||||
| Sales and marketing | 74,460 | 60,153 | 23.8 | % | ||||||||||||||||
| Product development | 45,179 | 38,943 | 16.0 | % | ||||||||||||||||
Adjusted general and administrative (1) | 68,428 | 54,845 | 24.8 | % | ||||||||||||||||
| Total | $ | 457,543 | $ | 404,938 | 13.0 | % | ||||||||||||||
| The Athletic | ||||||||||||||||||||
| Cost of revenue (excluding depreciation and amortization) | $ | 11,889 | $ | — | * | |||||||||||||||
| Sales and marketing | 3,128 | — | * | |||||||||||||||||
| Product development | 2,254 | — | * | |||||||||||||||||
| Adjusted general and administrative | 1,708 | — | * | |||||||||||||||||
| Total | $ | 18,979 | $ | — | * | |||||||||||||||
| The New York Times Company | ||||||||||||||||||||
| Cost of revenue (excluding depreciation and amortization) | $ | 281,365 | $ | 250,997 | 12.1 | % | ||||||||||||||
| Sales and marketing | 77,588 | 60,153 | 29.0 | % | ||||||||||||||||
| Product development | 47,433 | 38,943 | 21.8 | % | ||||||||||||||||
Adjusted general and administrative (1) | 70,136 | 54,845 | 27.9 | % | ||||||||||||||||
| Total | $ | 476,522 | $ | 404,938 | 17.7 | % | ||||||||||||||
(1) Excludes multiemployer pension withdrawal costs of $1.2 million for the quarter ended March 27, 2022 and severance and multiemployer pension withdrawal costs of $0.4 million and $1.3 million, respectively, for the quarter ended March 28,2021. | ||||||||||||||||||||
| * Represents a change equal to or in excess of 100% or not meaningful. | ||||||||||||||||||||
33
The New York Times Group
New York Times Group revenues grew 11.0% in the first quarter of 2022 to $525.3 million from $473.0 million in the first quarter of 2021. Subscription revenues increased 9.9% to $361.6 million from $329.1 million in the first quarter of 2021, primarily due to growth in subscription revenues from digital-only products. Advertising revenues increased 17.9% to $114.5 million from $97.1 million in the first quarter of 2021 due to growth in print and digital advertising revenues.
New York Times Group operating costs grew 13.0% in the first quarter of 2022 to $457.5 million from $404.9 million in the first quarter of 2021. The increase in costs were primarily related to growth in the redesignnumber of our headquarters building.employees and higher media expenses.
Adjusted operating profit decreased 0.6% to $67.7 million from $68.1 million in the prior year as higher revenues were more than offset by higher costs.
For the approximately two months in the first quarter of 2022 that the Company owned The Athletic, revenues totaled $12.2 million, primarily from subscription revenues.
The Athletic adjusted operating costs totaled $19.0 million for the period of the first quarter from February 1, 2022, largely from cost of revenue, which was primarily related to journalism costs.
The Athletic adjusted operating loss totaled $6.8 million for the period of the first quarter from February 1, 2022.
NON-OPERATING ITEMS
See Note 59 of the Notes to the Condensed Consolidated Financial Statements for information regarding our joint venture investments.other components of net periodic benefit costs.
Interest Expense, NetIncome and other, net
See Note 67 of the Notes to the Condensed Consolidated Financial Statements for information regarding interest expense.income and other, net.
Income Taxes
See Note 10 of the Notes to the Condensed Consolidated Financial Statements for information regarding income taxes.
We have included in this report certain supplemental financial information derived from consolidated financial information but not presented in our financial statements prepared in accordance with GAAP. Specifically, we have referred to the following non-GAAP financial measures in this report:
•diluted earnings per share from continuing operations excluding severance, non-operating retirement costs and the impact of special items (or adjusted diluted earnings per share from continuing operations);
•operating profit before depreciation, amortization, severance, non-operating retirementmultiemployer pension plan withdrawal costs and special items (or adjusted operating profit);, and expressed as a percentage of revenues, adjusted operating profit margin; and
•operating costs before depreciation, amortization, severance and non-operating retirementmultiemployer pension plan withdrawal costs (or adjusted operating costs).
The special itemsitem in 2017the first quarter of 2022 consisted of:
•a $30.1$34.7 million gainof pre-tax costs ($16.125.4 million or $0.15 per share after tax and net of noncontrolling interest or $.10 per share) from the sale of the remaining assets at a paper mill previously operated by Madison Paper Industries (“Madison”), in which the Company has an investment through a subsidiary, in the third quarter; and
The special items in 2016 consisted of:
We have included these non-GAAP financial measures because management reviews them on a regular basis and uses them to evaluate and manage the performance of our operations. We believe that, for the reasons outlined below, these non-GAAP financial measures provide useful information to investors as a supplement to reported diluted earnings/(loss) per share from continuing operations, operating profit/(loss) and operating costs. However, these measures should be evaluated only in
34
conjunction with the comparable GAAP financial measures and should not be viewed as alternative or superior measures of GAAP results.
Adjusted diluted earnings per share provides useful information in evaluating ourthe Company’s period-to-period performance because it eliminates items that we dothe Company does not consider to be indicative of earnings from ongoing operating activities. Adjusted operating profit (and adjusted operating profit margin) is useful in evaluating the ongoing performance of ourthe Company’s businesses as it excludes the significant non-cash impact of depreciation and amortization as well as items not indicative of ongoing operating activities. Total operating costs include depreciation, amortization, severance and non-operating retirementmultiemployer pension plan withdrawal costs. AdjustedTotal operating costs, which excludeexcluding these items, provide investors with helpful supplemental information on ourthe Company’s underlying operating costs that is used by management in its financial and operational decision-making.
Management considers special items, which may include impairment charges, pension settlement charges, acquisition-related costs and other items that arise from time to time, to be outside the ordinary course of our operations. Management believes that excluding these items provides a better understanding of the underlying trends in the Company’s operating performance and allows more accurate comparisons of the Company’s operating results to historical performance. In addition, management excludes severance costs, which may fluctuate significantly from quarter to quarter, because it believes these costs do not necessarily reflect expected future operating costs and do not contribute to a meaningful comparison of the Company’s operating results to historical performance.
Reconciliations of these non-GAAP financial measures to the most directly comparable GAAP measures are set out in the tables below.
| Reconciliation of diluted earnings per share from continuing operations excluding severance, non-operating retirement costs and special items (or adjusted diluted earnings per share from continuing operations) | ||||||||||||||||||||||
| For the Quarters Ended | For the Nine Months Ended | |||||||||||||||||||||
| September 24, 2017 | September 25, 2016 | % Change | September 24, 2017 | September 25, 2016 | % Change | |||||||||||||||||
| Diluted earnings/(loss) per share from continuing operations | $ | 0.20 | $ | — | * | $ | 0.37 | $ | (0.05 | ) | * | |||||||||||
| Add: | ||||||||||||||||||||||
| Severance | 0.01 | 0.08 | (87.5 | )% | 0.14 | 0.11 | 27.3 | % | ||||||||||||||
| Non-operating retirement costs | 0.02 | 0.02 | * | 0.06 | 0.08 | (25.0 | )% | |||||||||||||||
| Special items: | ||||||||||||||||||||||
| Headquarters redesign and consolidation | 0.02 | — | * | 0.04 | — | * | ||||||||||||||||
| Restructuring charge | — | 0.02 | * | — | 0.09 | * | ||||||||||||||||
| Multiemployer pension plan withdrawal (income)/expense | — | (0.03 | ) | * | — | 0.04 | * | |||||||||||||||
| (Gain)/loss from joint ventures, net of noncontrolling interest | (0.16 | ) | — | * | (0.16 | ) | 0.21 | * | ||||||||||||||
| Income tax expense/(benefit) of adjustments | 0.04 | (0.04 | ) | * | (0.03 | ) | (0.21 | ) | (85.7 | )% | ||||||||||||
Adjusted diluted earnings per share from continuing operations (1) | $ | 0.13 | $ | 0.06 | * | $ | 0.42 | $ | 0.27 | 55.6 | % | |||||||||||
| Reconciliation of diluted earnings per share from continuing operations excluding severance, non-operating retirement costs and special items (or adjusted diluted earnings per share from continuing operations) | ||||||||||||||||||||||||||||||||||||||
| For the Quarters Ended | ||||||||||||||||||||||||||||||||||||||
| March 27, 2022 | March 28, 2021 | % Change | ||||||||||||||||||||||||||||||||||||
| Diluted earnings per share from continuing operations | $ | 0.03 | $ | 0.24 | (87.5) | % | ||||||||||||||||||||||||||||||||
| Add: | ||||||||||||||||||||||||||||||||||||||
| Non-operating retirement costs: | ||||||||||||||||||||||||||||||||||||||
| Multiemployer pension plan withdrawal costs | 0.01 | 0.01 | — | |||||||||||||||||||||||||||||||||||
| Other components of net periodic benefit costs | 0.01 | 0.02 | (50.0) | % | ||||||||||||||||||||||||||||||||||
| Special items: | ||||||||||||||||||||||||||||||||||||||
| Acquisition-related costs | 0.21 | — | * | |||||||||||||||||||||||||||||||||||
| Income tax expense of adjustments | (0.06) | (0.01) | * | |||||||||||||||||||||||||||||||||||
Adjusted diluted earnings per share from continuing operations(1) | $ | 0.19 | $ | 0.26 | (26.9) | % | ||||||||||||||||||||||||||||||||
(1)Amounts may not add due to rounding.
* Represents a change equal to or in excess of 100% or not meaningful.
35
| Reconciliation of operating profit before depreciation and amortization, severance, multiemployer pension plan withdrawal costs and special items (or adjusted operating profit) | ||||||||||||||||||||||||||||||||
| For the Quarters Ended | ||||||||||||||||||||||||||||||||
| March 27, 2022 | March 28, 2021 | % Change | ||||||||||||||||||||||||||||||
| Operating profit | $ | 6,284 | $ | 51,658 | (87.8) | % | ||||||||||||||||||||||||||
| Add: | ||||||||||||||||||||||||||||||||
| Depreciation and amortization | 18,686 | 14,717 | 27.0 | % | ||||||||||||||||||||||||||||
| Severance | — | 406 | * | |||||||||||||||||||||||||||||
| Multiemployer pension plan withdrawal costs | 1,221 | 1,326 | (7.9) | % | ||||||||||||||||||||||||||||
| Special items: | ||||||||||||||||||||||||||||||||
| Acquisition-related costs | 34,712 | — | * | |||||||||||||||||||||||||||||
| Adjusted operating profit | $ | 60,903 | $ | 68,107 | (10.6) | % | ||||||||||||||||||||||||||
| Divided by: | ||||||||||||||||||||||||||||||||
| Revenue | 537,425 | 473,045 | 13.6 | % | ||||||||||||||||||||||||||||
| Adjusted operating profit margin | 11.3 | % | 14.4 | % | (310) bps | |||||||||||||||||||||||||||
| * Represents a change equal to or in excess of 100% or not meaningful. | ||||||||||||||||||||||||||||||||
| Reconciliation of operating costs before depreciation and amortization, severance and multiemployer pension plan withdrawal costs (or adjusted operating costs) | ||||||||||||||||||||||||||||||||
| For the Quarters Ended | ||||||||||||||||||||||||||||||||
| March 27, 2022 | March 28, 2021 | % Change | ||||||||||||||||||||||||||||||
| Operating costs | $ | 496,429 | $ | 421,387 | 17.8 | % | ||||||||||||||||||||||||||
| Less: | ||||||||||||||||||||||||||||||||
| Depreciation and amortization | 18,686 | 14,717 | 27.0 | % | ||||||||||||||||||||||||||||
| Severance | — | 406 | * | |||||||||||||||||||||||||||||
| Multiemployer pension plan withdrawal costs | 1,221 | 1,326 | (7.9) | % | ||||||||||||||||||||||||||||
| Adjusted operating costs | $ | 476,522 | $ | 404,938 | 17.7 | % | ||||||||||||||||||||||||||
| * Represents a change equal to or in excess of 100% or not meaningful. | ||||||||||||||||||||||||||||||||
36
| Reconciliation of operating profit before depreciation & amortization, severance, non-operating retirement costs and special items (or adjusted operating profit) | ||||||||||||||||||||||
| For the Quarters Ended | For the Nine Months Ended | |||||||||||||||||||||
| (In thousands) | September 24, 2017 | September 25, 2016 | % Change | September 24, 2017 | September 25, 2016 | % Change | ||||||||||||||||
| Operating profit | $ | 33,013 | $ | 8,973 | * | $ | 89,691 | $ | 46,049 | 94.8 | % | |||||||||||
| Add: | ||||||||||||||||||||||
| Depreciation & amortization | 15,677 | 15,384 | 1.9 | % | 46,961 | 46,003 | 2.1 | % | ||||||||||||||
| Severance | 2,123 | 13,006 | (83.7 | )% | 22,977 | 18,262 | 25.8 | % | ||||||||||||||
| Non-operating retirement costs | 3,100 | 3,845 | (19.4 | )% | 9,642 | 13,349 | (27.8 | )% | ||||||||||||||
| Special items: | ||||||||||||||||||||||
| Headquarters redesign and consolidation | 2,542 | — | * | 6,929 | — | * | ||||||||||||||||
| Restructuring charge | — | 2,949 | * | — | 14,804 | * | ||||||||||||||||
| Multiemployer pension plan withdrawal (income)/expense | — | (4,971 | ) | * | — | 6,730 | * | |||||||||||||||
| Adjusted operating profit | $ | 56,455 | $ | 39,186 | 44.1 | % | $ | 176,200 | $ | 145,197 | 21.4 | % | ||||||||||
| Reconciliation of operating costs before depreciation & amortization, severance and non-operating retirement costs (or adjusted operating costs) | ||||||||||||||||||||||
| For the Quarters Ended | For the Nine Months Ended | |||||||||||||||||||||
| (In thousands) | September 24, 2017 | September 25, 2016 | % Change | September 24, 2017 | September 25, 2016 | % Change | ||||||||||||||||
| Operating costs | $ | 350,080 | $ | 356,596 | (1.8 | )% | $ | 1,094,893 | $ | 1,048,109 | 4.5 | % | ||||||||||
| Less: | ||||||||||||||||||||||
| Depreciation & amortization | 15,677 | 15,384 | 1.9 | % | 46,961 | 46,003 | 2.1 | % | ||||||||||||||
| Severance | 2,123 | 13,006 | (83.7 | )% | 22,977 | 18,262 | 25.8 | % | ||||||||||||||
| Non-operating retirement costs | 3,100 | 3,845 | (19.4 | )% | 9,642 | 13,349 | (27.8 | )% | ||||||||||||||
| Adjusted operating costs | $ | 329,180 | $ | 324,361 | 1.5 | % | $ | 1,015,313 | $ | 970,495 | 4.6 | % | ||||||||||
LIQUIDITY AND CAPITAL RESOURCES
We believe our cash balance and cash provided by operations, in combination with other sources of cash, will be sufficient to meet our financing needs over the next twelve months. As of September 24, 2017,March 27, 2022, we had cash, cash equivalents and short- and long-term marketable securities of $822.9 million and total debt and capital lease obligations of $249.4 million. Accordingly, our cash, cash equivalents and marketable securities exceeded total debt and capital lease obligations by $573.5$474.8 million. Our cash and investmentmarketable securities balances have increased since the end of 2016,between December 26, 2021, and March 27, 2022, decreased primarily due to higher cash from operating activities partially offset by cash capital expendituresconsideration paid for the acquisition of $47.8 million.The Athletic and the annual incentive compensation payments.
We have paid quarterly dividends of $.04 per share on the Class A and Class B Common Stock each quarter since late 2013. In February 2022, the Board of Directors approved an increase in the quarterly dividend to $0.09 per share, which was paid in April 2022. We currently expect to continue to pay comparable cash dividends in the future, although changes in our dividend programdividends will be considered by our Board of Directors in light of our earnings, capital requirements, financial condition and other factors considered relevant.
In February 2022, the Board of Directors approved a $150.0 million Class A stock repurchase program. The Companyauthorization provides that Class A shares may be purchased from time to time as market conditions warrant, through open market purchases, privately negotiated transactions or other means, including Rule 10b5-1 trading plans. We expect to repurchase shares primarily to offset the impact of dilution from our equity compensation program, but subject to market conditions and UPM-Kymmene Corporation (“UPM”), a Finnish paper manufacturing company, are partners through subsidiary companies in Madison, which previously operated a supercalendered paper mill in Maine. The Company’s 40% ownership of Madison is through an 80%-owned consolidated subsidiary that owns 50% of Madison. UPM owns 60% of Madison, including a 10% interest through a 20% noncontrolling interest in the consolidated subsidiary of the Company. The paper mill was closed in May 2016. The Company’s joint venture in Madison is currently being liquidated. In the fourth quarter of 2016, Madison sold certain assets at the mill site andother factors, we recognized a gain of $3.9 million related to the sale. During the third quarter of 2017, the Company recognized a $30.1 million gain related to the sale of the remaining assets (which primarily consisted of hydro power assets). The Company’s proportionate share of the gain was $16.1 million after tax and net of noncontrolling interest. See Note 5 of the Notes to the Condensed Consolidated Financial Statements for more information on the Company’s investment in Madison.
Capital Resources
Sources and Uses of Cash
Cash flows (used in)/provided by/(used in) by category were as follows:
| For the Nine Months Ended | |||||||||||
| (In thousands) | September 24, 2017 | September 25, 2016 | % Change | ||||||||
| Operating activities | $ | 147,895 | $ | 85,643 | 72.7 | % | |||||
| Investing activities | $ | 15,607 | $ | 10,212 | 52.8 | % | |||||
| Financing activities | $ | (19,739 | ) | $ | (44,859 | ) | (56.0 | )% | |||
| For the Quarters Ended | ||||||||||||||||||||
| (In thousands) | March 27, 2022 | March 28, 2021 | % Change | |||||||||||||||||
| Operating activities | $ | (14,659) | $ | 32,929 | (144.5) | % | ||||||||||||||
| Investing activities | $ | (84,009) | $ | (26,208) | 220.5 | % | ||||||||||||||
| Financing activities | $ | (51,922) | $ | (18,108) | 186.7 | % | ||||||||||||||
Operating Activities
Cash from operating activities is generated by cash receipts from subscriptions, advertising sales and other revenue transactions.revenue. Operating cash outflows include payments for employee compensation, pension and other benefits, raw materials, interestmarketing expenses and income taxes.
Net cash provided by operating activities increaseddecreased in the first nine monthsquarter of 20172022 compared with the same prior-year period primarily due to lower net income, higher subscription revenue, lower income taxcash payments highermade to settle accounts payable, accrued payroll and aother liabilities, an increase in other assets and lower cash payments received from prepaid subscriptions, partially offset by higher balance of unexpired subscriptions (or subscription revenue that has not yet been recognized).cash collections from accounts receivable.
Investing Activities
Cash from investing activities generally includes proceeds from marketable securities that have matured and the sale of assets, investments or a business. Cash used in investing activities generally includes purchases of marketable securities, payments for capital projects restricted cash,and acquisitions of new businesses and investments.
Net cash provided byused in investing activities in the first nine monthsquarter of 20172022 was primarily related to $515.3 million in consideration paid for acquisitions, net of cash acquired, and $8.6 million in capital expenditures payments, partially offset by $440.4 million net maturities of marketable securities, partially offset by purchases of marketable securities and capital expenditures.securities.
Financing Activities
Cash from financing activities generally includes borrowings under third-party financing arrangements, the issuance of long-term debt and funds from stock option exercises. Cash used in financing activities generally includes the repayment of amounts outstanding under third-party financing arrangements, the payment of dividends, the payment of long-term debt and capitalfinance lease obligations and share-based compensation tax withholding.
Net cash used in financing activities in the first nine monthsquarter of 20172022 was primarily related to share repurchases of $29.0 million, dividend payments of $19.5$11.8 million and share-based compensation tax withholding payments of $9.3 million.
37
Restricted Cash
We were required to maintain $17.9$14.4 million of restricted cash as of September 24, 2017March 27, 2022, and $24.9$14.3 million as of December 25, 2016, the majority26, 2021, substantially all of which is set aside to collateralize workers’ compensation obligations.
Capital Expenditures
Capital expenditures totaled approximately $67$10 million and $17$7 million in the first nine monthsquarter of 20172022 and 2016,2021, respectively. The increase in capital expenditures in 2022 was primarily driven by improvements in the Company Headquarters which are intended to address growth in the number of employees and to enhance technologies that support our transition to hybrid work with employees working both from the office and remotely. The cash payments related to the capital expenditures totaled approximately $48$9 million and $22$6 million in the first nine monthsquarters of 20172022 and 2016,2021, respectively. The increase in both periods was primarily driven by the ongoing redesign and consolidation of space in our headquarters building and certain improvements at our printing and distribution facility in College Point, New York.
Third-Party Financing
In September 2019, we entered into a $250 million five-year unsecured credit facility (the “Credit Facility”). Certain of our domestic subsidiaries have guaranteed our obligations under the Credit Facility. As of September 24, 2017, our current indebtedness consisted ofMarch 27, 2022, there were no outstanding borrowings under the repurchase option related to a sale-leaseback of a portion of our New York headquarters. See Note 6 ofCredit Facility and the Notes toCompany was in compliance with the Condensed Consolidated Financial Statements for information regarding our total debt and capital lease obligations. See Note 8 offinancial covenants contained in the Notes to the Condensed Consolidated Financial Statements for information regarding the fair value of our long-term debt.Credit Facility.
CRITICAL ACCOUNTING ESTIMATES AND POLICIES
Our critical accounting policies are detailed in our Annual Report on Form 10-K for the year ended December 25, 2016.26, 2021. Other than as described in Note 2 of the Notes to the Condensed Consolidated Financial Statements, as of September 24, 2017,March 27, 2022, our critical accounting policies have not changed from December 25, 2016.26, 2021.
FORWARD-LOOKING STATEMENTS
This Quarterly Report on Form 10-Q, including the section titled “Management’s Discussion and Analysis of Financial Condition and Results of Operations,” contains forward-looking statements that relatewithin the meaning of Section 27A of the Securities Act of 1933, as amended, and Section 21E of the Securities Exchange Act of 1934, as amended. Terms such as “aim,” “anticipate,” “believe,” “confidence,” “contemplate,” “continue,” “conviction,” “could,” “drive,” “estimate,” “expect,” “forecast,” “future,” “goal,” “guidance,” “intend,” “likely,” “may,” “might,” “objective,” “opportunity,” “optimistic,” “outlook,” “plan,” “position,” “potential,” “predict,” “project,” “seek,” “should,” “strategy,” “target,” “will,” “would” or similar statements or variations of such words and other similar expressions are intended to future events or our future financial performance. We may also make written and oralidentify forward-looking statements, in our Securities and Exchange Commission (“SEC”) filings and otherwise. We have tried, where possible, to identify such statements by using words such as “believe,” “expect,” “intend,” “estimate,” “anticipate,” “will,” “could,” “project,” “plan” and similar expressions in connection with any discussion of future operating or financial performance. Anyalthough not all forward-looking statements contain such terms. Forward-looking statements are and will be based upon our then-currentcurrent expectations, estimates and assumptions regarding future events and involve risks and uncertainties that change over time; actual results could differ materially from those predicted by such forward-looking statements. These risks and uncertainties include, but are applicable only asnot limited to: significant competition in all aspects of our business; our ability to grow the size and profitability of our subscriber base; our dependence on metrics that are subject to inherent challenges in measurement; our ability to improve and scale our technical and data infrastructure and respond and adapt to changes in technology and consumer behavior; numerous factors that affect our advertising revenues, including economic conditions, market dynamics, evolving digital advertising trends and the evolution of our strategy; damage to our brand or reputation; the impact of the datesCovid-19 pandemic; economic, geopolitical and other risks associated with the international scope of such statements. We undertake no obligationour business and foreign operations; our ability to updateattract and maintain a talented and diverse workforce; the impact of labor negotiations and agreements; adverse results from litigation or revise any forward-looking statements, whethergovernmental investigations; risks associated with the recent acquisition of The Athletic, including, among others, those related to our ability to realize the anticipated benefits of the acquisition, our ability to meet our publicly announced guidance about the impact of the acquisition, and the risks associated with its business and operations; the risks and challenges associated with investments we make in new and existing products and services, including The Athletic; risks associated with other acquisitions, divestitures, investments and other transactions; potential effects on our operating flexibility as a result of newthe nature of significant portions of our expenses; the effects of the size and volatility of our pension plan obligations; liabilities that may result from our participation in multiemployer pension plans; significant disruptions in our newsprint supply chain or newspaper printing and distribution channels or a significant increase in the costs to print and distribute our newspaper; security breaches and other network and information systems disruptions; our ability to comply with laws and regulations, including with respect to privacy, data protection and consumer marketing practices; payment processing risk; defects, delays or interruptions in the cloud-based hosting services we utilize; our ability to protect our intellectual property; claims of intellectual property infringement that we have been, and may be in the future, events or otherwise.be subject to; the effects of restrictions on our operations as a result of the terms of our credit facility; our future access to capital markets and other financing options; and the concentration of control of our company due to our dual-class capital structure.
38
Condition and Results of Operations” of this Form 10-Q. Investors are cautioned not to place undue reliance on any such forward-looking statements, which speak only as wellof the date they are made. The Company undertakes no obligation to publicly update or revise any forward-looking statement, whether as other risks and factors identified from time to time in our SEC filings.a result of new information, future events or otherwise.
Item 3. Quantitative and Qualitative Disclosures About Market Risk
Our Annual Report on Form 10-K for the year ended December 25, 2016,26, 2021, details our disclosures about market risk. As of September 24, 2017,March 27, 2022, there were no material changes in our market risks from December 25, 2016.
26, 2021.
39
Item 4. Controls and Procedures
EVALUATION OF DISCLOSURE CONTROLS AND PROCEDURES
Our management, with the participation of our principal executive officer and our principal financial officer, evaluated the effectiveness of our disclosure controls and procedures (as defined in Rules 13a-15(e) and 15d-15(e) of the Securities Exchange Act of 1934) as of September 24, 2017.March 27, 2022. Based upon such evaluation, our principal executive officer and principal financial officer concluded that our disclosure controls and procedures were effective to ensure that the information required to be disclosed by us in the reports that we file or submit under the Securities Exchange Act of 1934 is recorded, processed, summarized and reported within the time periods specified in the SEC’s rules and forms, and is accumulated and communicated to our management, including our principal executive officer and principal financial officer, as appropriate to allow timely decisions regarding required disclosure.
CHANGES IN INTERNAL CONTROL OVER FINANCIAL REPORTING
There were no changes in our internal control over financial reporting during the quarter ended September 24, 2017,March 27, 2022, other than as described in following paragraph, that have materially affected, or are reasonably likely to materially affect, our internal control over financial reporting.
On February 1, 2022, we acquired The Athletic. We are currently planning the integration of The Athletic into our operations and internal control processes and, pursuant to the SEC’s guidance that an assessment of a recently acquired business may be omitted from the scope of an assessment in the year of acquisition, the scope of our assessment of the effectiveness of our internal controls over financial reporting at December 31, 2022, will not include The Athletic.
40
PART II. OTHER INFORMATION
Item 1. Legal Proceedings
We are involved in various legal actions incidental to our business that are now pending against us. These actions are generally for amountshave damage claims that are greatly in excess of the payments, if any, that maywe would be required to be made. See Note 14 ofpay if we lost or settled the Notes to the Consolidated Financial Statements for a description of certain matters, which is incorporated herein by reference.cases. Although the Company cannot predict the outcome of these matters, it is possible that an unfavorable outcome in one or more matters could be material to the Company’s consolidated results of operations or cash flows for an individual reporting period. However, based on currently available information, management does not believe that the ultimate resolution of these matters, individually or in the aggregate, is likely to have a material effect on the Company’s financial position.
Item 1A. Risk Factors
There have been no material changes to our risk factors as set forth in “Item 1A—Risk Factors” in our Annual Report on Form 10-K for the year ended December 25, 2016.26, 2021.
Item 2. Unregistered Sales of Equity Securities and Use of Proceeds
(c) Issuer Purchases of Equity Securities
| Period | Total numbers of shares of Class A Common Stock purchased | Average price paid per share of Class A Common Stock | Total number of shares of Class A Common Stock purchased as part of publicly announced plans or programs | Maximum number (or approximate dollar value) of shares of Class A Common Stock that may yet be purchased under the plans or programs | ||||||||||||||||||||||
January 31, 2022 - February 27, 2022 (1) | 600,000 | $ | 41.77 | 600,000 | $ | 124,938,000 | ||||||||||||||||||||
| February 28, 2022 - March 27, 2022 | 92,800 | $ | 42.70 | 92,800 | $ | 120,979,000 | ||||||||||||||||||||
| Total for the first quarter of 2022 | 692,800 | $ | 41.89 | 692,800 | $ | 120,979,000 | ||||||||||||||||||||
(1) Reflects repurchases under the authorization approved on February 1, 2022. | ||||||||||||||||||||||||||
41
Item 6. Exhibits
| Exhibit No. | ||||||||
| 31.2 | ||||||||
| 32.1 | ||||||||
| 32.2 | ||||||||
| instance document does not appear in the Interactive Data File because its XBRL tags are embedded within the Inline XBRL document. | ||||||||
| Inline XBRL Taxonomy Extension Schema Document. | ||||||||
| 101.CAL | Inline XBRL Taxonomy Extension Calculation Linkbase Document. | |||||||
| 101.DEF | Inline XBRL Taxonomy Extension Definition Linkbase Document. | |||||||
| 101.LAB | Inline XBRL Taxonomy Extension Label Linkbase Document. | |||||||
| 101.PRE | Inline XBRL Taxonomy Extension Presentation Linkbase Document. | |||||||
| 104 | Cover Page Interactive Data File (formatted as Inline XBRL and contained in Exhibit 101). | |||||||
| *Certain identified information has been excluded from this exhibit (indicated by an asterisk above) because it is both (i) not material and (ii) is the type of information that the registrant treats as private or confidential. Information that was omitted has been noted in the exhibit with a placeholder identified by the mark “[***]”. | ||||||||
42
SIGNATURES
Pursuant to the requirements of the Securities Exchange Act of 1934, the registrant has duly caused this report to be signed on its behalf by the undersigned thereunto duly authorized.
| THE NEW YORK TIMES COMPANY | ||||||||
| (Registrant) | ||||||||
| Date: | May 4, 2022 | |||||||
Roland A. Caputo Executive Vice President and Chief Financial Officer (Principal Financial Officer) | ||||||||
43