UNITED STATES
SECURITIES AND EXCHANGE COMMISSION
Washington, D.C. 20549
FORM 10-Q
☒ QUARTERLY REPORT PURSUANT TO SECTION 13 OR 15(d) OF THE SECURITIES EXCHANGE ACT OF 1934
For the quarterly period ended March 31, 20222023
or
☐ TRANSITION REPORT PURSUANT TO SECTION 13 OR 15(d) OF THE SECURITIES EXCHANGE ACT OF 1934
For the transition period from __________ to __________
Commission File Number: 001-02960
Newpark Resources, Inc.
(Exact name of registrant as specified in its charter) | | | | | | | | |
| Delaware | 72-1123385 |
| (State or other jurisdiction of incorporation or organization) | (I.R.S. Employer Identification No.) |
| | |
| 9320 Lakeside Boulevard, | Suite 100 | |
| The Woodlands, | Texas | 77381 |
| (Address of principal executive offices) | (Zip Code) |
(281) 362-6800
(Registrant’s telephone number, including area code)
(Former name, former address and former fiscal year, if changed since last report)
Securities registered pursuant to Section 12(b) of the Act:
| | | | | | | | |
| Title of each class | Trading Symbol(s) | Name of each exchange on which registered |
| Common Stock, $0.01 par value | NR | New York Stock Exchange |
Indicate by check mark whether the registrant (1) has filed all reports required to be filed by Section 13 or 15(d) of the Securities Exchange Act of 1934 during the preceding 12 months (or for such shorter period that the registrant was required to file such reports), and (2) has been subject to such filing requirements for the past 90 days.
Yes ☑ No ☐
Indicate by check mark whether the registrant has submitted electronically every Interactive Data File required to be submitted pursuant to Rule 405 of Regulation S-T (§232.405 of this chapter) during the preceding 12 months (or for such shorter period that the registrant was required to submit such files).
Yes ☑ No ☐
Indicate by check mark whether the registrant is a large accelerated filer, an accelerated filer, a non-accelerated filer, a smaller reporting company, or an emerging growth company. See the definitions of “large accelerated filer,” “accelerated filer,” “smaller reporting company,” and “emerging growth company” in Rule 12b-2 of the Exchange Act.
| | | | | | | | | | | | | | |
| Large accelerated filer | ☐ | | Accelerated filer | ☑ |
| Non-accelerated filer | ☐ | | Smaller reporting company | ☐ |
| | | Emerging growth company | ☐ |
If an emerging growth company, indicate by check mark if the registrant has elected not to use the extended transition period for complying with any new or revised financial accounting standards provided pursuant to Section 13(a) of the Exchange Act. ☐
Indicate by check mark whether the registrant is a shell company (as defined in Rule 12b-2 of the Exchange Act).
Yes ☐ No ☑
As of May 2, 2022,1, 2023, a total of 92,353,10485,083,920 shares of common stock, $0.01 par value per share, were outstanding.
NEWPARK RESOURCES, INC.
INDEX TO QUARTERLY REPORT ON FORM 10-Q
FOR THE THREE MONTHS ENDED
MARCH 31, 20222023
CAUTIONARY STATEMENT CONCERNING FORWARD-LOOKING STATEMENTS
This Quarterly Report on Form 10-Q contains “forward-looking statements” within the meaning of Section 27A of the Securities Act of 1933, as amended, Section 21E of the Securities Exchange Act of 1934, as amended, and the Private Securities Litigation Reform Act of 1995, as amended. We also may provide oral or written forward-looking statements in other materials we release to the public. Words such as “will,” “may,” “could,” “would,” “should,” “anticipates,” “believes,” “estimates,” “expects,” “plans,” “intends,” and similar expressions are intended to identify these forward-looking statements but are not the exclusive means of identifying them. These forward-looking statements reflect the current views of our management as of the filing date of this Quarterly Report on Form 10-Q; however, various risks, uncertainties, contingencies, and other factors, some of which are beyond our control, are difficult to predict and could cause our actual results, performance, or achievements to differ materially from those expressed in, or implied by, these statements.
We assume no obligation to update, amend, or clarify publicly any forward-looking statements, whether as a result of new information, future events, or otherwise, except as required by securities laws. In light of these risks, uncertainties, and assumptions, the forward-looking events discussed in this Quarterly Report on Form 10-Q might not occur.
For further information regarding these and other factors, risks, and uncertainties that could cause actual results to differ, we refer you to the risk factors set forth in Item 1A “Risk Factors” in this Quarterly Report on Form 10-Q and our Annual Report on Form 10-K for the year ended December 31, 2021.2022.
PART I FINANCIAL INFORMATION
ITEM 1. Financial Statements
Newpark Resources, Inc.
Condensed Consolidated Balance Sheets
(Unaudited)
| | (In thousands, except share data) | (In thousands, except share data) | March 31, 2022 | | December 31, 2021 | (In thousands, except share data) | March 31, 2023 | | December 31, 2022 |
| ASSETS | ASSETS | | | | ASSETS | | | |
| Cash and cash equivalents | Cash and cash equivalents | $ | 21,307 | | | $ | 24,088 | | Cash and cash equivalents | $ | 23,618 | | | $ | 23,182 | |
| Receivables, net | 187,609 | | | 194,296 | | |
| Receivables, net of allowance of $5,000 and $4,817, respectively | | Receivables, net of allowance of $5,000 and $4,817, respectively | 212,694 | | | 242,247 | |
| Inventories | Inventories | 169,968 | | | 155,341 | | Inventories | 149,989 | | | 149,571 | |
| Prepaid expenses and other current assets | Prepaid expenses and other current assets | 14,305 | | | 14,787 | | Prepaid expenses and other current assets | 9,962 | | | 10,966 | |
| Total current assets | Total current assets | 393,189 | | | 388,512 | | Total current assets | 396,263 | | | 425,966 | |
| | Property, plant and equipment, net | Property, plant and equipment, net | 257,980 | | | 260,256 | | Property, plant and equipment, net | 194,626 | | | 193,099 | |
| Operating lease assets | Operating lease assets | 26,305 | | | 27,569 | | Operating lease assets | 22,605 | | | 23,769 | |
| Goodwill | Goodwill | 47,411 | | | 47,283 | | Goodwill | 47,174 | | | 47,110 | |
| Other intangible assets, net | Other intangible assets, net | 23,407 | | | 24,959 | | Other intangible assets, net | 19,471 | | | 20,215 | |
| Deferred tax assets | Deferred tax assets | 2,260 | | | 2,316 | | Deferred tax assets | 2,402 | | | 2,275 | |
| Other assets | Other assets | 1,834 | | | 1,991 | | Other assets | 2,330 | | | 2,441 | |
| Total assets | Total assets | $ | 752,386 | | | $ | 752,886 | | Total assets | $ | 684,871 | | | $ | 714,875 | |
| | LIABILITIES AND STOCKHOLDERS’ EQUITY | LIABILITIES AND STOCKHOLDERS’ EQUITY | | | | LIABILITIES AND STOCKHOLDERS’ EQUITY | | | |
| Current debt | Current debt | $ | 20,767 | | | $ | 19,210 | | Current debt | $ | 23,158 | | | $ | 22,438 | |
| Accounts payable | Accounts payable | 95,309 | | | 84,585 | | Accounts payable | 92,600 | | | 93,633 | |
| Accrued liabilities | Accrued liabilities | 37,302 | | | 46,597 | | Accrued liabilities | 37,763 | | | 46,871 | |
| Total current liabilities | Total current liabilities | 153,378 | | | 150,392 | | Total current liabilities | 153,521 | | | 162,942 | |
| | Long-term debt, less current portion | Long-term debt, less current portion | 95,475 | | | 95,593 | | Long-term debt, less current portion | 78,041 | | | 91,677 | |
| Noncurrent operating lease liabilities | Noncurrent operating lease liabilities | 21,431 | | | 22,352 | | Noncurrent operating lease liabilities | 18,859 | | | 19,816 | |
| Deferred tax liabilities | Deferred tax liabilities | 6,370 | | | 11,819 | | Deferred tax liabilities | 7,692 | | | 8,121 | |
| Other noncurrent liabilities | Other noncurrent liabilities | 10,589 | | | 10,344 | | Other noncurrent liabilities | 9,529 | | | 9,291 | |
| Total liabilities | Total liabilities | 287,243 | | | 290,500 | | Total liabilities | 267,642 | | | 291,847 | |
| | Commitments and contingencies (Note 8) | Commitments and contingencies (Note 8) | 0 | | 0 | Commitments and contingencies (Note 8) | |
| | Common stock, $0.01 par value (200,000,000 shares authorized and 109,335,733 and 109,330,733 shares issued, respectively) | 1,093 | | | 1,093 | | |
| Common stock, $0.01 par value (200,000,000 shares authorized and 111,456,999 and 111,451,999 shares issued, respectively) | | Common stock, $0.01 par value (200,000,000 shares authorized and 111,456,999 and 111,451,999 shares issued, respectively) | 1,115 | | | 1,115 | |
| Paid-in capital | Paid-in capital | 636,397 | | | 634,929 | | Paid-in capital | 643,004 | | | 641,266 | |
| Accumulated other comprehensive loss | Accumulated other comprehensive loss | (62,708) | | | (61,480) | | Accumulated other comprehensive loss | (65,187) | | | (67,186) | |
| Retained earnings | Retained earnings | 26,866 | | | 24,345 | | Retained earnings | 8,109 | | | 2,489 | |
| Treasury stock, at cost (16,982,629 and 16,981,147 shares, respectively) | (136,505) | | | (136,501) | | |
| Treasury stock, at cost (25,129,909 and 21,751,232 shares, respectively) | | Treasury stock, at cost (25,129,909 and 21,751,232 shares, respectively) | (169,812) | | | (154,656) | |
| Total stockholders’ equity | Total stockholders’ equity | 465,143 | | | 462,386 | | Total stockholders’ equity | 417,229 | | | 423,028 | |
| Total liabilities and stockholders’ equity | Total liabilities and stockholders’ equity | $ | 752,386 | | | $ | 752,886 | | Total liabilities and stockholders’ equity | $ | 684,871 | | | $ | 714,875 | |
See Accompanying Notes to Unaudited Condensed Consolidated Financial Statements
Newpark Resources, Inc.
Condensed Consolidated Statements of Operations
(Unaudited)
| | | | | Three Months Ended
March 31, | | | Three Months Ended
March 31, |
| (In thousands, except per share data) | (In thousands, except per share data) | | 2022 | | 2021 | (In thousands, except per share data) | | 2023 | | 2022 |
| Revenues | Revenues | | $ | 176,438 | | | $ | 141,172 | | Revenues | | $ | 200,030 | | | $ | 176,438 | |
| Cost of revenues | Cost of revenues | | 150,988 | | | 119,991 | | Cost of revenues | | 164,738 | | | 150,988 | |
| Selling, general and administrative expenses | Selling, general and administrative expenses | | 24,433 | | | 20,911 | | Selling, general and administrative expenses | | 25,410 | | | 24,433 | |
| Other operating (income) loss, net | Other operating (income) loss, net | | 50 | | | (274) | | Other operating (income) loss, net | | (261) | | | 50 | |
| Operating income | Operating income | | 967 | | | 544 | | Operating income | | 10,143 | | | 967 | |
| | Foreign currency exchange (gain) loss | | 64 | | | (332) | | |
| Foreign currency exchange loss | | Foreign currency exchange loss | | 319 | | | 64 | |
| Interest expense, net | Interest expense, net | | 1,206 | | | 2,408 | | Interest expense, net | | 2,089 | | | 1,206 | |
| Loss on extinguishment of debt | | — | | | 790 | | |
| Loss before income taxes | | (303) | | | (2,322) | | |
| Income (loss) before income taxes | | Income (loss) before income taxes | | 7,735 | | | (303) | |
| | Provision (benefit) for income taxes | Provision (benefit) for income taxes | | (2,824) | | | 3,040 | | Provision (benefit) for income taxes | | 2,115 | | | (2,824) | |
| Net income (loss) | | $ | 2,521 | | | $ | (5,362) | | |
| Net income | | Net income | | $ | 5,620 | | | $ | 2,521 | |
| | Net income (loss) per common share - basic: | | $ | 0.03 | | | $ | (0.06) | | |
| Net income (loss) per common share - diluted: | | $ | 0.03 | | | $ | (0.06) | | |
| Net income per common share - basic: | | Net income per common share - basic: | | $ | 0.06 | | | $ | 0.03 | |
| Net income per common share - diluted: | | Net income per common share - diluted: | | $ | 0.06 | | | $ | 0.03 | |
See Accompanying Notes to Unaudited Condensed Consolidated Financial Statements
Newpark Resources, Inc.
Condensed Consolidated Statements of Comprehensive Income (Loss)
(Unaudited)
| | | | | | | | | | | | | | | |
| | | | Three Months Ended
March 31, |
| (In thousands) | | | | | 2022 | | 2021 |
| | | | | | | |
| Net income (loss) | | | | | $ | 2,521 | | | $ | (5,362) | |
| | | | | | | |
| Foreign currency translation adjustments (net of tax benefit of $99 and $276) | | | | | (1,228) | | | (3,284) | |
| | | | | | | |
| Comprehensive income (loss) | | | | | $ | 1,293 | | | $ | (8,646) | |
| | | | | | | | | | | | | | | |
| | | | Three Months Ended
March 31, |
| (In thousands) | | | | | 2023 | | 2022 |
| | | | | | | |
| Net income | | | | | $ | 5,620 | | | $ | 2,521 | |
| Foreign currency translation adjustments (net of tax benefit of $10 and $99) | | | | | 1,999 | | | (1,228) | |
| Comprehensive income | | | | | $ | 7,619 | | | $ | 1,293 | |
See Accompanying Notes to Unaudited Condensed Consolidated Financial Statements
Newpark Resources, Inc.
Condensed Consolidated Statements of Stockholders’ Equity
(Unaudited)
| | (In thousands) | (In thousands) | Common Stock | | Paid-In Capital | | Accumulated Other Comprehensive Loss | | Retained Earnings | | Treasury Stock | | Total | (In thousands) | Common Stock | | Paid-In Capital | | Accumulated Other Comprehensive Loss | | Retained Earnings | | Treasury Stock | | Total |
| Balance at December 31, 2020 | $ | 1,076 | | | $ | 627,031 | | | $ | (54,172) | | | $ | 50,937 | | | $ | (136,840) | | | $ | 488,032 | | |
| Net loss | — | | | — | | | — | | | (5,362) | | | — | | | (5,362) | | |
| Employee stock options, restricted stock and employee stock purchase plan | 1 | | | 242 | | | — | | | (21) | | | 35 | | | 257 | | |
| Stock-based compensation expense | — | | | 1,279 | | | — | | | — | | | — | | | 1,279 | | |
| Foreign currency translation, net of tax | — | | | — | | | (3,284) | | | — | | | — | | | (3,284) | | |
| Balance at March 31, 2021 | $ | 1,077 | | | $ | 628,552 | | | $ | (57,456) | | | $ | 45,554 | | | $ | (136,805) | | | $ | 480,922 | | |
| | Balance at December 31, 2021 | Balance at December 31, 2021 | $ | 1,093 | | | $ | 634,929 | | | $ | (61,480) | | | $ | 24,345 | | | $ | (136,501) | | | $ | 462,386 | | Balance at December 31, 2021 | $ | 1,093 | | | $ | 634,929 | | | $ | (61,480) | | | $ | 24,345 | | | $ | (136,501) | | | $ | 462,386 | |
| Net income | Net income | — | | | — | | | — | | | 2,521 | | | — | | | 2,521 | | Net income | — | | | — | | | — | | | 2,521 | | | — | | | 2,521 | |
| Employee stock options, restricted stock and employee stock purchase plan | Employee stock options, restricted stock and employee stock purchase plan | — | | | — | | | — | | | — | | | (4) | | | (4) | | Employee stock options, restricted stock and employee stock purchase plan | — | | | — | | | — | | | — | | | (4) | | | (4) | |
| Stock-based compensation expense | Stock-based compensation expense | — | | | 1,468 | | | — | | | — | | | — | | | 1,468 | | Stock-based compensation expense | — | | | 1,468 | | | — | | | — | | | — | | | 1,468 | |
| Foreign currency translation, net of tax | Foreign currency translation, net of tax | — | | | — | | | (1,228) | | | — | | | — | | | (1,228) | | Foreign currency translation, net of tax | — | | | — | | | (1,228) | | | — | | | — | | | (1,228) | |
| Balance at March 31, 2022 | Balance at March 31, 2022 | $ | 1,093 | | | $ | 636,397 | | | $ | (62,708) | | | $ | 26,866 | | | $ | (136,505) | | | $ | 465,143 | | Balance at March 31, 2022 | $ | 1,093 | | | $ | 636,397 | | | $ | (62,708) | | | $ | 26,866 | | | $ | (136,505) | | | $ | 465,143 | |
| | Balance at December 31, 2022 | | Balance at December 31, 2022 | $ | 1,115 | | | $ | 641,266 | | | $ | (67,186) | | | $ | 2,489 | | | $ | (154,656) | | | $ | 423,028 | |
| Net income | | Net income | — | | | — | | | — | | | 5,620 | | | — | | | 5,620 | |
| Employee stock options, restricted stock and employee stock purchase plan | | Employee stock options, restricted stock and employee stock purchase plan | — | | | — | | | — | | | — | | | (7) | | | (7) | |
| Stock-based compensation expense | | Stock-based compensation expense | — | | | 1,738 | | | — | | | — | | | — | | | 1,738 | |
| Treasury shares purchased at cost | | Treasury shares purchased at cost | — | | | — | | | — | | | — | | | (15,149) | | | (15,149) | |
| Foreign currency translation, net of tax | | Foreign currency translation, net of tax | — | | | — | | | 1,999 | | | — | | | — | | | 1,999 | |
| Balance at March 31, 2023 | | Balance at March 31, 2023 | $ | 1,115 | | | $ | 643,004 | | | $ | (65,187) | | | $ | 8,109 | | | $ | (169,812) | | | $ | 417,229 | |
See Accompanying Notes to Unaudited Condensed Consolidated Financial Statements
Newpark Resources, Inc.
Condensed Consolidated Statements of Cash Flows
(Unaudited)
| | | | Three Months Ended March 31, | | Three Months Ended March 31, |
| (In thousands) | (In thousands) | 2022 | | 2021 | (In thousands) | 2023 | | 2022 |
| Cash flows from operating activities: | Cash flows from operating activities: | | | | Cash flows from operating activities: | | | |
| Net income (loss) | $ | 2,521 | | | $ | (5,362) | | |
| Adjustments to reconcile net income (loss) to net cash provided by operations: | | | | |
| Net income | | Net income | $ | 5,620 | | | $ | 2,521 | |
| Adjustments to reconcile net income to net cash provided by operations: | | Adjustments to reconcile net income to net cash provided by operations: | | | |
| Depreciation and amortization | Depreciation and amortization | 10,452 | | | 10,830 | | Depreciation and amortization | 7,895 | | | 10,452 | |
| Stock-based compensation expense | Stock-based compensation expense | 1,468 | | | 1,279 | | Stock-based compensation expense | 1,738 | | | 1,468 | |
| Provision for deferred income taxes | Provision for deferred income taxes | (5,202) | | | 1,569 | | Provision for deferred income taxes | (726) | | | (5,202) | |
| Credit loss expense | Credit loss expense | 185 | | | 50 | | Credit loss expense | 272 | | | 185 | |
| Gain on sale of assets | Gain on sale of assets | (1,606) | | | (3,283) | | Gain on sale of assets | (554) | | | (1,606) | |
| Loss on extinguishment of debt | — | | | 790 | | |
| Amortization of original issue discount and debt issuance costs | Amortization of original issue discount and debt issuance costs | 178 | | | 1,082 | | Amortization of original issue discount and debt issuance costs | 138 | | | 178 | |
| Change in assets and liabilities: | Change in assets and liabilities: | | | Change in assets and liabilities: | | |
| Decrease in receivables | Decrease in receivables | 5,795 | | | 2,414 | | Decrease in receivables | 27,287 | | | 5,795 | |
| (Increase) decrease in inventories | (14,812) | | | 6,694 | | |
| Increase in inventories | | Increase in inventories | (3,870) | | | (14,812) | |
| Decrease in other assets | Decrease in other assets | 17 | | | 1,275 | | Decrease in other assets | 1,098 | | | 17 | |
| Increase in accounts payable | 11,246 | | | 11,437 | | |
| Increase (decrease) in accounts payable | | Increase (decrease) in accounts payable | (1,233) | | | 11,246 | |
| Decrease in accrued liabilities and other | Decrease in accrued liabilities and other | (7,452) | | | (1,002) | | Decrease in accrued liabilities and other | (8,221) | | | (7,452) | |
| Net cash provided by operating activities | Net cash provided by operating activities | 2,790 | | | 27,773 | | Net cash provided by operating activities | 29,444 | | | 2,790 | |
| | Cash flows from investing activities: | Cash flows from investing activities: | | | | Cash flows from investing activities: | | | |
| Capital expenditures | Capital expenditures | (7,621) | | | (8,649) | | Capital expenditures | (6,972) | | | (7,621) | |
| Proceeds from divestitures | | Proceeds from divestitures | 7,153 | | | — | |
| Proceeds from sale of property, plant and equipment | Proceeds from sale of property, plant and equipment | 575 | | | 8,027 | | Proceeds from sale of property, plant and equipment | 740 | | | 575 | |
| Net cash used in investing activities | (7,046) | | | (622) | | |
| Net cash provided by (used in) investing activities | | Net cash provided by (used in) investing activities | 921 | | | (7,046) | |
| | Cash flows from financing activities: | Cash flows from financing activities: | | | | Cash flows from financing activities: | | | |
| Borrowings on lines of credit | Borrowings on lines of credit | 69,188 | | | 51,922 | | Borrowings on lines of credit | 76,447 | | | 69,188 | |
| Payments on lines of credit | Payments on lines of credit | (65,202) | | | (56,922) | | Payments on lines of credit | (90,212) | | | (65,202) | |
| Purchases of Convertible Notes | — | | | (18,107) | | |
| Proceeds from term loan | — | | | 8,258 | | |
| Debt issuance costs | — | | | (196) | | |
| Purchases of treasury stock | Purchases of treasury stock | (4) | | | (6) | | Purchases of treasury stock | (15,006) | | | (4) | |
| Other financing activities | Other financing activities | (2,711) | | | (1,561) | | Other financing activities | (1,499) | | | (2,711) | |
| Net cash provided by (used in) financing activities | Net cash provided by (used in) financing activities | 1,271 | | | (16,612) | | Net cash provided by (used in) financing activities | (30,270) | | | 1,271 | |
| | Effect of exchange rate changes on cash | Effect of exchange rate changes on cash | (376) | | | (882) | | Effect of exchange rate changes on cash | 375 | | | (376) | |
| | Net increase (decrease) in cash, cash equivalents, and restricted cash | Net increase (decrease) in cash, cash equivalents, and restricted cash | (3,361) | | | 9,657 | | Net increase (decrease) in cash, cash equivalents, and restricted cash | 470 | | | (3,361) | |
| Cash, cash equivalents, and restricted cash at beginning of period | Cash, cash equivalents, and restricted cash at beginning of period | 29,489 | | | 30,348 | | Cash, cash equivalents, and restricted cash at beginning of period | 25,061 | | | 29,489 | |
| Cash, cash equivalents, and restricted cash at end of period | Cash, cash equivalents, and restricted cash at end of period | $ | 26,128 | | | $ | 40,005 | | Cash, cash equivalents, and restricted cash at end of period | $ | 25,531 | | | $ | 26,128 | |
See Accompanying Notes to Unaudited Condensed Consolidated Financial Statements
NEWPARK RESOURCES, INC.
NOTES TO UNAUDITED CONDENSED CONSOLIDATED FINANCIAL STATEMENTS
Note 1 – Basis of Presentation and Significant Accounting Policies
Newpark Resources, Inc. is a geographically diversified supplier providing environmentally-sensitive products, as well as rentals and services to customers across multiple industries. The accompanying unaudited condensed consolidated financial statements of Newpark Resources, Inc. and our wholly-owned subsidiaries, which we collectively refer to as the “Company,” “we,” “our,” or “us,” have been prepared in accordance with Rule 10-01 of Regulation S-X for interim financial statements required to be filed with the Securities and Exchange Commission, (“SEC”), and do not include all information and footnotes required by the accounting principles generally accepted in the United States (“U.S. GAAP”) for complete financial statements. These unaudited condensed consolidated financial statements should be read in conjunction with the consolidated financial statements and notes thereto included in our Annual Report on Form 10-K for the year ended December 31, 2021.2022. Our fiscal year end is December 31 and our first quarter represents the three-month period ended March 31. The results of operations for the first quarter of 20222023 are not necessarily indicative of the results to be expected for the entire year. Unless otherwise noted, all currency amounts are stated in U.S. dollars.
In the opinion of management, the accompanying unaudited condensed consolidated financial statements reflect all adjustments necessary to present fairly our financial position as of March 31, 20222023 and our results of operations and cash flows for the first quarter of 20222023 and 2021.2022. All adjustments are of a normal recurring nature. Our balance sheet at December 31, 20212022 is derived from the audited consolidated financial statements at that date.
The preparation of financial statements in conformity with U.S. GAAP requires management to make estimates and assumptions that affect the reported amounts of assets and liabilities, the disclosure of contingent assets and liabilities at the date of the financial statements, and the reported amounts of revenues and expenses during the reporting period. Actual results could differ from those estimates. For further information, see Note 1 in our Annual Report on Form 10-K for the year ended December 31, 2021.2022.
We currently operate our business through 2two reportable segments: Fluids Systems and Industrial Solutions. In addition, we had a third reportable segment, Industrial Blending, which was exited in 2022. We have reflected these three reportable segments for all periods presented in this Quarterly Report on Form 10-Q.
•Our Fluids Systems segment provides customized drilling completion, and stimulationcompletion fluids products and related technical services to oil and natural gas exploration and production (“E&P”) customers primarily in North America and Europe, the Middle East and Africa (“EMEA”), as well as certain countries in Asia Pacific and Latin America. We also have industrial
In the fourth quarter of 2022, we exited two of our Fluids Systems business units, including our U.S.-based mineral grinding business as well as our Gulf of Mexico fluids operations (see Note 10 for barite, a critical raw material in drilling fluids systems, which serve to support our activities in certain regions within the U.S. drilling fluids market and also sell the products to third party users, including other drilling fluids companies. In addition, we sell a variety of other minerals, principally to third-party industrial (non-oil and natural gas) markets. additional information).
•Our Industrial Solutions segment includes our Site and Access Solutions business, along with our Industrial Blending operations. Site and Access Solutions provides temporary worksite access solutions, including the rental of our manufactured recyclable composite matting systems, along with related site construction and services to customers in various markets including power transmission, E&P, pipeline, renewable energy, petrochemical, construction and other industries, primarily in the United States and Europe. We also manufacture and sell our manufactured recyclable composite mats to customers around the world, with power transmission being the primary end-market.
In February 2022, our management recommended, and our Board of Directors approved a plan to exit our•Our Industrial Blending segment began operations in 2020 and explore strategic options for our U.S. mineral grinding business. See Note 10 for further information.supported industrial end-markets, including the production of disinfectants and industrial cleaning products. We completed the wind down of the Industrial Blending business in the first quarter of 2022, and we completed the sale of the industrial blending assets in the fourth quarter of 2022.
Note 2 – Earnings Per Share
The following table presents the reconciliation of the numerator and denominator for calculating net income (loss) per share:
| | | | | First Quarter | | | First Quarter |
| (In thousands, except per share data) | (In thousands, except per share data) | | 2022 | | 2021 | (In thousands, except per share data) | | 2023 | | 2022 |
| Numerator | Numerator | | | | | Numerator | | | | |
| Net income (loss) - basic and diluted | | $ | 2,521 | | | $ | (5,362) | | |
| Net income - basic and diluted | | Net income - basic and diluted | | $ | 5,620 | | | $ | 2,521 | |
| | Denominator | Denominator | | | Denominator | | |
| Weighted average common shares outstanding - basic | Weighted average common shares outstanding - basic | | 92,118 | | | 90,701 | | Weighted average common shares outstanding - basic | | 88,573 | | | 92,118 | |
| Dilutive effect of stock options and restricted stock awards | Dilutive effect of stock options and restricted stock awards | | 1,821 | | | — | | Dilutive effect of stock options and restricted stock awards | | 1,997 | | | 1,821 | |
| Weighted average common shares outstanding - diluted | Weighted average common shares outstanding - diluted | | 93,939 | | | 90,701 | | Weighted average common shares outstanding - diluted | | 90,570 | | | 93,939 | |
| | Net income (loss) per common share | | | |
| Net income per common share | | Net income per common share | | |
| Basic | Basic | | $ | 0.03 | | | $ | (0.06) | | Basic | | $ | 0.06 | | | $ | 0.03 | |
| Diluted | Diluted | | $ | 0.03 | | | $ | (0.06) | | Diluted | | $ | 0.06 | | | $ | 0.03 | |
We excluded the following weighted average potential shares from the calculations of diluted net income (loss) per share during the applicable periods because their inclusion would have been anti-dilutive:
| | | | | | | | | | | | | | | |
| | | | First Quarter |
| (In thousands) | | | | | 2022 | | 2021 |
| Stock options and restricted stock awards | | | | | 1,867 | | | 5,299 | |
For the first quarter of 2021, we excluded all potentially dilutive stock options and restricted stock awards in calculating diluted earnings per share as the effect was anti-dilutive due to the net loss incurred for this period. | | | | | | | | | | | | | | | |
| | | | First Quarter |
| (In thousands) | | | | | 2023 | | 2022 |
| Stock options and restricted stock awards | | | | | 737 | | | 1,867 | |
Note 3 – Repurchase Program
In February 2023, our Board of Directors approved certain changes to our repurchase program and increased the total authorization available to $50.0 million. Our repurchase program remains available for repurchasesauthorizes us to purchase outstanding shares of our common stock.stock in the open market or as otherwise determined by management, subject to certain limitations under the Amended ABL Facility (as defined in Note 6) and other factors. The repurchase program has no specific term. Repurchases are expected to be funded from operating cash flows, available cash on hand, and borrowings under our Amended ABL Facility, (as defined in Note 6).operating cash flows, and available cash on hand. As part of the share repurchase program, our management has been authorized to establish trading plans under Rule 10b5-1 of the Securities Exchange Act of 1934. As of March 31, 2022,2023, we had $23.8$35.1 million remaining under the program.
During the first quarter of 2023, we repurchased an aggregate of 3.4 million shares of our common stock under the repurchase program for a total cost of $15.1 million, inclusive of commissions and excise taxes. There were no shares of common stock repurchased under the repurchase program during the first quarter of 2022 or 2021. During the first quarter of 2021,2022.
In April 2023, we repurchased $18.3an additional 1.2 million shares of our Convertible Notes in the open marketcommon stock under the repurchase program for a total cost of $18.1$5.0 million. As of May 2, 2023, we had $30.1 million remaining under the program.
Note 4 – Receivables
Receivables consisted of the following:
| | (In thousands) | (In thousands) | March 31, 2022 | | December 31, 2021 | (In thousands) | March 31, 2023 | | December 31, 2022 |
| Trade receivables: | Trade receivables: | | | | Trade receivables: | | | |
| Gross trade receivables | Gross trade receivables | $ | 179,016 | | | $ | 185,065 | | Gross trade receivables | $ | 202,107 | | | $ | 227,762 | |
| Allowance for credit losses | Allowance for credit losses | (4,456) | | | (4,587) | | Allowance for credit losses | (5,000) | | | (4,817) | |
| Net trade receivables | Net trade receivables | 174,560 | | | 180,478 | | Net trade receivables | 197,107 | | | 222,945 | |
| Income tax receivables | Income tax receivables | 3,322 | | | 4,167 | | Income tax receivables | 2,231 | | | 2,697 | |
| Other receivables | Other receivables | 9,727 | | | 9,651 | | Other receivables | 13,356 | | | 16,605 | |
| Total receivables, net | Total receivables, net | $ | 187,609 | | | $ | 194,296 | | Total receivables, net | $ | 212,694 | | | $ | 242,247 | |
Other receivables included $6.0$8.0 million and $5.7$10.8 million related to our divestitures (as described in Note 10) as of March 31, 2023 and December 31, 2022, respectively. Other receivables also included $3.9 million and $3.5 million for value added, goods and service taxes related to foreign jurisdictions as of March 31, 20222023 and December 31, 2021,2022, respectively. In addition, other receivables included an insurance receivable balance resulting from a property insurance claim caused by Hurricane Ida in August 2021 of $2.9 million and $1.9 million as of March 31, 2022 and December 31, 2021, respectively. As of March 31, 2022, the claims related to the hurricane under our property and business interruption insurance programs have not been finalized.
Changes in our allowance for credit losses were as follows:
| | | First Quarter | | First Quarter |
| (In thousands) | (In thousands) | 2022 | | 2021 | (In thousands) | 2023 | | 2022 |
| Balance at beginning of period | Balance at beginning of period | $ | 4,587 | | | $ | 5,024 | | Balance at beginning of period | $ | 4,817 | | | $ | 4,587 | |
| Credit loss expense | Credit loss expense | 185 | | | 50 | | Credit loss expense | 272 | | | 185 | |
| Write-offs, net of recoveries | Write-offs, net of recoveries | (316) | | | (356) | | Write-offs, net of recoveries | (89) | | | (316) | |
| Balance at end of period | Balance at end of period | $ | 4,456 | | | $ | 4,718 | | Balance at end of period | $ | 5,000 | | | $ | 4,456 | |
Note 5 – Inventories
Inventories consisted of the following:
| | (In thousands) | (In thousands) | March 31, 2022 | | December 31, 2021 | (In thousands) | March 31, 2023 | | December 31, 2022 |
| Raw materials: | Raw materials: | | | | Raw materials: | | | |
| Fluids Systems | Fluids Systems | $ | 128,267 | | | $ | 119,242 | | Fluids Systems | $ | 114,122 | | | $ | 110,623 | |
| Industrial Solutions | Industrial Solutions | 4,757 | | | 4,939 | | Industrial Solutions | 4,678 | | | 3,966 | |
| Total raw materials | Total raw materials | 133,024 | | | 124,181 | | Total raw materials | 118,800 | | | 114,589 | |
| Blended fluids systems components | Blended fluids systems components | 29,894 | | | 27,793 | | Blended fluids systems components | 24,962 | | | 29,244 | |
| Finished goods - mats | Finished goods - mats | 7,050 | | | 3,367 | | Finished goods - mats | 6,227 | | | 5,738 | |
| Total inventories | Total inventories | $ | 169,968 | | | $ | 155,341 | | Total inventories | $ | 149,989 | | | $ | 149,571 | |
Raw materials for the Fluids Systems segment consist primarily of barite, chemicals and other additives that are consumed in the production of our fluids systems. Raw materials for the Industrial Solutions segment consist primarily of resins, chemicals, and other materials used to manufacture composite mats, as well as materials that are consumed in providing spill containmentground protection and other services to our customers. Our blended fluids systems components consist of base fluids systems that have been either mixed internally at our blending facilities or purchased from third-party vendors. These base fluids systems require raw materials to be added, as needed to meet specified customer requirements.
The increase in inventories in the first quarter of 2022 was primarily attributable to a combination of activity-driven increases, purchases supporting the start-up of new international contracts in the Fluids Systems segment, the production of mats in the Industrial Solutions segment for anticipated sales in the second quarter of 2022, as well as raw material cost inflation.
Note 6 – Financing Arrangements and Fair Value of Financial Instruments
Financing arrangements consisted of the following:
| | | | | | | | | | | | | | | | | | | | | | | | | | | | | | | | | | | |
| March 31, 2022 | | December 31, 2021 |
| (In thousands) | Principal Amount | | Unamortized Discount and Debt Issuance Costs | | Total Debt | | Principal Amount | | Unamortized Discount and Debt Issuance Costs | | Total Debt |
| ABL Facility | $ | 87,900 | | | $ | — | | | $ | 87,900 | | | $ | 86,500 | | | $ | — | | | $ | 86,500 | |
| Term loan | 5,443 | | | (89) | | | 5,354 | | | 6,094 | | | (110) | | | 5,984 | |
| Financing obligations | 5,838 | | | (66) | | | 5,772 | | | 6,688 | | | (78) | | | 6,610 | |
| Other debt | 17,216 | | | — | | | 17,216 | | | 15,709 | | | — | | | 15,709 | |
| Total debt | 116,397 | | | (155) | | | 116,242 | | | 114,991 | | | (188) | | | 114,803 | |
| Less: Current portion | (20,767) | | | — | | | (20,767) | | | (19,210) | | | — | | | (19,210) | |
| Long-term debt | $ | 95,630 | | | $ | (155) | | | $ | 95,475 | | | $ | 95,781 | | | $ | (188) | | | $ | 95,593 | |
Convertible Notes. In December 2016, we issued $100.0 million of unsecured convertible senior notes (“Convertible Notes”) which bore interest at a rate of 4.0% per year and matured in December 2021. A total of $38.6 million of our Convertible Notes were repaid at maturity. During the first quarter of 2021, we repurchased $18.3 million of our Convertible Notes in the open market for a total cost of $18.1 million, and recognized a net loss of $0.8 million reflecting the difference in the amount paid and the net carrying value of the extinguished debt, including original issue discount and debt issuance costs. | | | | | | | | | | | | | | | | | | | | | | | | | | | | | | | | | | | |
| March 31, 2023 | | December 31, 2022 |
| (In thousands) | Principal Amount | | Unamortized Discount and Debt Issuance Costs | | Total Debt | | Principal Amount | | Unamortized Discount and Debt Issuance Costs | | Total Debt |
| Amended ABL Facility | $ | 65,400 | | | $ | — | | | $ | 65,400 | | | $ | 80,300 | | | $ | — | | | $ | 80,300 | |
| U.K. term loan | 6,908 | | | (86) | | | 6,822 | | | 7,201 | | | (99) | | | 7,102 | |
| Financing obligation | 2,764 | | | (27) | | | 2,737 | | | 3,437 | | | (35) | | | 3,402 | |
| Other debt | 26,240 | | | — | | | 26,240 | | | 23,311 | | | — | | | 23,311 | |
| Total debt | 101,312 | | | (113) | | | 101,199 | | | 114,249 | | | (134) | | | 114,115 | |
| Less: current portion | (23,158) | | | — | | | (23,158) | | | (22,438) | | | — | | | (22,438) | |
| Long-term debt | $ | 78,154 | | | $ | (113) | | | $ | 78,041 | | | $ | 91,811 | | | $ | (134) | | | $ | 91,677 | |
Asset-Based Loan Facility. In October 2017, we entered into ana U.S. asset-based revolving credit agreement, which was amended in March 2019 (the “ABL Facility”). As of March 31, 2022, the ABL Facility provided financing of up to $200.0 million available for borrowings (inclusive of letters of credit) and could be increased up to a maximum capacity of $275.0 million, subject to certain conditions. The ABL Facility was scheduled to terminate in March 2024. As of March 31, 2022, our total availability under the ABL Facility was $116.0 million, of which $87.9 million was drawn and $1.1 million was used for outstanding letters of credit, resulting in remaining availability of $27.0 million. As of March 31, 2022, the weighted average interest rate for the ABL Facility was 1.9% and the applicable commitment fee on the unused portion of the ABL Facility was 0.375% per annum.
In May 2022, we amended and restated the ABL Facilityin May 2022 (the “Amended ABL Facility”). The Amended ABL Facility provides financing of up to $175.0 million available for borrowings (inclusive of letters of credit), which can be increased up to $250.0 million, subject to certain conditions. The Amended ABL Facility has a five-year term expiring May 2027, expands available borrowing capacity associated with the Industrial Solutions rental mat fleet, replaces the LIBOR-based pricing grid withis based on a BSBY-basedBloomberg Short-Term Bank Yield Index (“BSBY”) pricing grid, and includes a mechanism to incorporate a sustainability-linked pricing framework with the consent of the required lenders (as defined in the Amended ABL Facility).
As of May 2, 2022, after giving effect to the Amended ABL Facility,March 31, 2023, our total borrowing availability under the Amended ABL Facility was $133.5$154.3 million, of which $94.1$65.4 million was drawn and $1.1$3.3 million was used for outstanding letters of credit, resulting in remaining availability of $38.4$85.6 million.
Borrowing availability under the Amended ABL Facility is calculated based on eligible U.S. accounts receivable, inventory and composite mats included in the rental fleet, net of reserves and subject to limits on certain of the assets included in the borrowing base calculation. To the extent pledged by the borrowers, the borrowing base calculation also includes the amount of eligible pledged cash. The administrative agent may establish reserves in accordance with the Amended ABL Facility, in part based on appraisals of the asset base, and other limits in its discretion, which could reduce the amounts otherwise available under the Amended ABL Facility.
Under the terms of the Amended ABL Facility, we may elect to borrow at a variable interest rate based on either, (1) the Bloomberg Short-Term Bank Yield Index (“BSBY”)BSBY rate (subject to a floor of zero) or (2) the base rate (subject to a floor of zero), equal to the highest of (a) the federal funds rate plus 0.50%, (b) the prime rate of Bank of America, N.A., and (c) BSBY for a one-month interest period plus 1.00%, plus, in each case, an applicable margin per annum. The applicable margin ranges from 1.50% to 2.00% per annum for BSBY borrowings, and 0.50% to 1.00% per annum for base rate borrowings, based on the consolidated leverage ratio (as defined in the Amended ABL Facility) as of the last day of the most recent fiscal quarter. The Company isWe are also required to pay a commitment fee equal to (i) 0.375% per annum at any time the average daily unused portion of the commitments is lessgreater than 50% and (ii) 0.25% per annum at any time the average daily unused portion of the commitments is greaterless than 50%.
As of March 31, 2023, the applicable margin for borrowings under the Amended ABL Facility was 1.50% with respect to BSBY borrowings and 0.50% with respect to base rate borrowings. As of March 31, 2023, the weighted average interest rate for the Amended ABL Facility was 6.2% and the applicable commitment fee on the unused portion of the Amended ABL Facility was 0.375% per annum.
The Amended ABL Facility is a senior secured obligation of the Company and certain of our U.S. subsidiaries constituting borrowers thereunder, secured by a first priority lien on substantially all of the personal property and certain real
property of the borrowers, including a first priority lien on certain equity interests of direct or indirect domestic subsidiaries of the borrowers and certain equity interests issued by certain foreign subsidiaries of the borrowers.
The Amended ABL Facility contains customary representations, warranties and covenants that, among other things, and subject to certain specified circumstances and exceptions, restrict or limit the ability of the borrowers and certain of their subsidiaries to incur indebtedness (including guarantees), grant liens, make investments, pay dividends or distributions with respect to capital stock and make other restricted payments, make prepayments on certain indebtedness, engage in mergers or other fundamental changes, dispose of property, and change the nature of their business.
The Amended ABL Facility requires compliance with the following financial covenants: (i) a minimum fixed charge coverage ratio of 1.00 to 1.00 for the most recently completed four fiscal quarters and (ii) while a leverage covenant trigger
period (as defined in the Amended ABL Facility) is in effect, a maximum consolidated leverage ratio of 4.00 to 1.00 as of the last day of the most recently completed fiscal quarter.
The Amended ABL Facility includes customary events of default including non-payment of principal, interest or fees, violation of covenants, inaccuracy of representations or warranties, cross-default to other material indebtedness, bankruptcy and insolvency events, invalidity or impairment of security interests or invalidity of loan documents, certain ERISA events, unsatisfied or unstayed judgments and change of control.
Other Debt. In April 2022, a U.K. subsidiary entered a £7.0 million term loan and a £2.0 million revolving credit facility. Both the term loan and revolving credit facility mature in April 2025 and bear interest at a rate of Sterling Overnight Index Average plus a margin of 3.25% per year. As of March 31, 2023, the interest rate for the U.K. facilities was 7.4%. The term loan is payable in quarterly installments of £350,000 plus interest beginning June 2022 and a £2.8 million payment due at maturity. We had $8.9 million outstanding under these arrangements at March 31, 2023.
In August 2021, we completed sale-leaseback transactions related to certain vehicles and other equipment for net proceeds of approximately $7.9 million. The transactions have been accounted for as financing arrangements as they did not qualify for sale accounting. As a result, the vehicles and other equipment continue to be reflected on our balance sheet in property, plant and equipment, net. The financing arrangements have a weighted average annual interest rate of 5.4% and are payable in monthly installments with varying maturities through October 2025. We had $5.8$2.8 million in financing obligations outstanding under these arrangements at March 31, 2022.
In February 2021, a U.K. subsidiary entered a £6.0 million (approximately $8.3 million) term loan facility that was scheduled to mature in February 2024. Effective January 1, 2022, the term loan had an interest at a rate of SONIA plus a margin of 3.5% per year. The term loan was payable in quarterly installments of £375,000 plus interest beginning March 2021 and a £1.5 million payment due at maturity. We had $5.4 million outstanding under this arrangement at March 31, 2022. In April 2022, this facility was amended to increase the term loan to £7.0 million (approximately $9.1 million) and add a £2.0 million (approximately $2.6 million) revolving credit facility. Both the amended term loan and revolving credit facility mature in April 2025 and bear interest at a rate of SONIA plus a margin of 3.25% per year. The term loan is payable in quarterly installments of £350,000 plus interest beginning June 2022 and a £2.8 million payment due at maturity. We had $11.2 million outstanding under these arrangements at May 2, 2022.2023.
Certain of our foreign subsidiaries maintain local credit arrangements consisting primarily of lines of credit or overdraft facilities which are generally renewed on an annual basis. We utilize local financing arrangements in our foreign operations in order to provide short-term local liquidity needs. We had $14.5$16.7 million and $11.8$14.3 million outstanding under these arrangements at March 31, 20222023 and December 31, 2021,2022, respectively.
In addition, at March 31, 2022,2023, we had $47.0$41.3 million in outstanding letters of credit, performance bonds, and other guarantees for which certain of the letters of credit are collateralized by $4.8$1.9 million in restricted cash.
Our financial instruments include cash and cash equivalents, receivables, payables, and debt. We believe the carrying values of these instruments approximated their fair values at March 31, 20222023 and December 31, 2021.2022.
Note 7 – Income Taxes
The provision for income taxes was $2.1 million for the first quarter of 2023, reflecting an effective tax rate of 27%. The 2023 provision for income taxes was favorably impacted by the benefit associated with a partial valuation allowance release to recognize a portion of previously unbenefited net operating losses. The benefit for income taxes was $2.8 million for the first quarter of 2022, which includes an income tax benefit of $3.1 million related to the restructuring of certain subsidiary legal entities within Europe, as the undistributed earnings for an international subsidiary are no longer subject to certain taxes upon future distribution. The provision for income taxes was $3.0 million for the first quarter of 2021, despite reporting a pretax loss for the period, primarily reflecting the impact of the geographic composition of our pretax loss. The tax expense in 2021 primarily related to earnings from our international operations since we were unable to recognize the tax benefit from our U.S. losses as they may not be realized.
Note 8 – Commitments and Contingencies
In the ordinary course of conducting our business, we become involved in litigation and other claims from private party actions, as well as judicial and administrative proceedings involving governmental authorities at the federal, state, and local levels. While the outcome of litigation or other proceedings against us cannot be predicted with certainty, management does not expect that any loss resulting from such litigation or other proceedings, in excess of any amounts accrued or covered by insurance, will have a material adverse impact on our consolidated financial statements.
Note 9 – Supplemental Disclosures to the Statements of Cash Flows
Supplemental disclosures to the consolidated statements of cash flows are presented below:
| | | First Quarter | | First Quarter |
| (In thousands) | (In thousands) | 2022 | | 2021 | (In thousands) | 2023 | | 2022 |
| Cash paid for: | Cash paid for: | | | | Cash paid for: | | | |
| Income taxes (net of refunds) | Income taxes (net of refunds) | $ | 3,268 | | | $ | 1,810 | | Income taxes (net of refunds) | $ | 2,261 | | | $ | 3,268 | |
| Interest | Interest | $ | 998 | | | $ | 889 | | Interest | $ | 1,998 | | | $ | 998 | |
Cash, cash equivalents, and restricted cash in the consolidated statements of cash flows consisted of the following:
| | (In thousands) | (In thousands) | March 31, 2022 | | December 31, 2021 | (In thousands) | March 31, 2023 | | December 31, 2022 |
| Cash and cash equivalents | Cash and cash equivalents | $ | 21,307 | | | $ | 24,088 | | Cash and cash equivalents | $ | 23,618 | | | $ | 23,182 | |
| Restricted cash (included in prepaid expenses and other current assets) | Restricted cash (included in prepaid expenses and other current assets) | 4,821 | | | 5,401 | | Restricted cash (included in prepaid expenses and other current assets) | 1,913 | | | 1,879 | |
| Cash, cash equivalents, and restricted cash | Cash, cash equivalents, and restricted cash | $ | 26,128 | | | $ | 29,489 | | Cash, cash equivalents, and restricted cash | $ | 25,531 | | | $ | 25,061 | |
Note 10 – Segment Data
Summarized operating results for our reportable segments are shown in the following table (net of inter-segment transfers):
| | | | | First Quarter | | First Quarter |
| (In thousands) | (In thousands) | | 2022 | | 2021 | (In thousands) | 2023 | | 2022 |
| Revenues | Revenues | | | | | Revenues | | | |
| Fluids Systems | Fluids Systems | | $ | 141,014 | | | $ | 87,849 | | Fluids Systems | $ | 144,174 | | | $ | 141,014 | |
| Industrial Solutions | Industrial Solutions | | 35,424 | | | 53,323 | | Industrial Solutions | 55,856 | | | 35,424 | |
| Industrial Blending | | Industrial Blending | — | | | — | |
| Total revenues | Total revenues | | $ | 176,438 | | | $ | 141,172 | | Total revenues | $ | 200,030 | | | $ | 176,438 | |
| | Operating income (loss) | Operating income (loss) | | | Operating income (loss) | |
| Fluids Systems | Fluids Systems | | $ | 3,374 | | | $ | (6,767) | | Fluids Systems | $ | 3,466 | | | $ | 3,374 | |
| Industrial Solutions | Industrial Solutions | | 5,472 | | | 13,130 | | Industrial Solutions | 14,483 | | | 6,358 | |
| Industrial Blending | | Industrial Blending | — | | | (886) | |
| Corporate office | Corporate office | | (7,879) | | | (5,819) | | Corporate office | (7,806) | | | (7,879) | |
| Total operating income | Total operating income | | $ | 967 | | | $ | 544 | | Total operating income | $ | 10,143 | | | $ | 967 | |
The following table presents further disaggregated revenues for the Fluids Systems segment:
| | | | | | | | | | | |
| First Quarter |
| (In thousands) | 2022 | | 2021 |
| United States | $ | 70,843 | | | $ | 47,670 | |
| Canada | 22,235 | | | 12,663 | |
| Total North America | 93,078 | | | 60,333 | |
| | | |
| EMEA | 44,175 | | | 25,459 | |
| Other | 3,761 | | | 2,057 | |
| Total International | 47,936 | | | 27,516 | |
| | | |
| Total Fluids Systems revenues | $ | 141,014 | | | $ | 87,849 | |
The following table presents further disaggregated revenues for the Industrial Solutions segment:
| | | | | | | | | | | |
| First Quarter |
| (In thousands) | 2022 | | 2021 |
| Product sales revenues | $ | 4,423 | | | $ | 20,037 | |
| Rental revenues | 17,615 | | | 17,079 | |
| Service revenues | 13,386 | | | 11,654 | |
| Industrial blending revenues | — | | | 4,553 | |
| Total Industrial Solutions revenues | $ | 35,424 | | | $ | 53,323 | |
With ongoing support from outside financial and other advisors, we have continuously reviewedWe regularly review our global portfolio during the oil and natural gas cycle of the last couple of years.business activities. These reviews have focusedfocus on evaluating changes in the outlook for our served markets and customer priorities, while identifying opportunities for value-creating options in our portfolio, and placing investment emphasis in markets where we generate strong returns and where we see greater long-term viability and stability. As part of our ongoingthis review, we completed certain actions in 2022, including the sale of our portfolio, our management recommended, and our BoardExcalibar U.S. mineral grinding business (“Excalibar”), the exit of Directors approved two actions in February 2022 intended to enhance liquidity available for investment in higher returning businesses.
First, in consideration of broader strategic priorities and the timeline and efforts required to further develop the industrial blending business, our Board of Directors approved a plan in February 2022 to exit our Industrial Blending operations. As part ofoperations, and the exit plan,of our Gulf of Mexico fluids operations.
Summarized operating results of our now exited Excalibar business and Gulf of Mexico operations, both included in the Fluids Systems segment historical results, are shown in the following table:
| | | | | | | | | | | |
| | First Quarter |
| (In thousands) | 2023 | | 2022 |
| Revenues | | | |
| Excalibar | $ | — | | | $ | 14,346 | |
| Gulf of Mexico | — | | | 2,694 | |
| Total revenues | $ | — | | | $ | 17,040 | |
| | | |
| Operating income (loss) | | | |
| Excalibar | $ | (77) | | | $ | 833 | |
| Gulf of Mexico | (2,311) | | | (2,617) | |
| Total operating income (loss) | $ | (2,388) | | | $ | (1,784) | |
Summarized net assets remaining from the business units exited in 2022 are shown in the following table:
| | | | | | | | | | | |
| (In thousands) | March 31, 2023 | | December 31, 2022 |
| Receivables, net | $ | 9,391 | | | $ | 27,798 | |
| Inventories | 1,409 | | | 5,805 | |
| Accounts payable | (575) | | | (2,060) | |
| Accrued liabilities | — | | | (311) | |
| Total net assets | $ | 10,225 | | | $ | 31,232 | |
The net assets remaining as of March 31, 2023 primarily reflect remaining Gulf of Mexico working capital, the majority of which we expect to realize in the second quarter of 2023.
In the first quarter of 2023, we completed our customer contract in Chile and are currently in the windprocess of winding down our in-country operations. At March 31, 2023, we had $3 million of net assets and $0.5 million of accumulated translation losses related to our subsidiary in Chile. As we monetize these assets in 2023, we will reclassify the Industrial Blending businesstranslation losses and recognize a charge to income at such time when we have substantially liquidated our subsidiary in Chile. In addition, we made the decision in the first quarter of 2022 and are currently pursuing2023 to exit the salestimulation chemicals product line reported in our Fluids Systems segment. We anticipate liquidating the related inventory of approximately $3 million during 2023.
In addition, the industrial blending and warehouse facility and related equipment located in Conroe, Texas. The Industrial Blending business had no significant revenues and incurred an operating loss of $0.9 millionresults for the Fluids Systems segment includes $1.0 million and $0.1 million in severance costs for the first quarter of 2023 and 2022, respectively.
quarter of 2022, and contributed $5 million ofThe following table presents further disaggregated revenues with approximately break-even operating income for the first quarter of 2021. As of March 31, 2022, the carrying value of the long-lived assets associated withFluids Systems segment:
| | | | | | | | | | | |
| First Quarter |
| (In thousands) | 2023 | | 2022 |
| United States | $ | 68,898 | | | $ | 70,843 | |
| Canada | 19,365 | | | 22,235 | |
| Total North America | 88,263 | | | 93,078 | |
| | | |
| EMEA | 52,577 | | | 44,175 | |
| Other | 3,334 | | | 3,761 | |
| Total International | 55,911 | | | 47,936 | |
| | | |
| Total Fluids Systems revenues | $ | 144,174 | | | $ | 141,014 | |
The following table presents further disaggregated revenues for the Industrial Blending business was $19 million.Solutions segment:
As a result of the plan to exit and dispose of the assets used in the Industrial Blending business, we estimated in February 2022 and disclosed in our Annual Report on Form 10-K for the year ended December 31, 2021 that we may incur pre-tax charges in the range of approximately $4 million to $8 million primarily related to the non-cash impairment of long-lived assets related to the Industrial Blending business, which we anticipated recognizing in the first quarter of 2022. In March 2022, we shut down the Industrial Blending business and initiated a sales process to market the industrial blending and warehouse facility and related equipment. As a result of the ongoing sales process and revised estimates for the expected net proceeds from the ultimate disposition, we now anticipate recovering the $19 million carrying value of the long-lived assets associated with the Industrial Blending business. Accordingly, 0 impairment has been recognized for these assets in the first quarter of 2022, though it remains possible that we may incur a future impairment or loss related to the ongoing sales process. | | | | | | | | | | | |
| First Quarter |
| (In thousands) | 2023 | | 2022 |
| Product sales revenues | $ | 19,496 | | | $ | 4,423 | |
| Rental revenues | 21,131 | | | 17,615 | |
| Service revenues | 15,229 | | | 13,386 | |
| Total Industrial Solutions revenues | $ | 55,856 | | | $ | 35,424 | |
Second, our Board of Directors also approved management’s plan to explore strategic options, including the potential sale, for our U.S. mineral grinding business. The U.S. mineral grinding business contributed third-party revenues of $14 million for the first quarter of 2022 and $7 million for the first quarter of 2021. As of March 31, 2022, the U.S. mineral grinding business had approximately $50 million of net capital employed, including approximately $28 million of net working capital.
ITEM 2. Management’s Discussion and Analysis of Financial Condition and Results of Operations
The following discussion of our financial condition, results of operations, liquidity, and capital resources should be read in conjunction with the unaudited condensed consolidated financial statements and notes thereto included in this report as well as our Annual Report on Form 10-K for the year ended December 31, 2021.2022. Our first quarter represents the three-month period ended March 31. Unless otherwise noted, all currency amounts are stated in U.S. dollars. The reference to a “Note” herein refers to the accompanying Notes to Unaudited Condensed Consolidated Financial Statements contained in Item 1 “Financial Statements.”
Business Overview
Newpark Resources, Inc. (the “Company,” “we,” “our,” or “us”) is a geographically diversified supplier providing environmentally-sensitive products, as well as rentals and services to customers across multiple industries. We currently operate our business through two reportable segments: Industrial Solutions which serves various markets including power transmission, oil and natural gas exploration and production (“E&P”), pipeline, renewable energy, petrochemical, construction and other industries, and Fluids Systems, as described further below. In addition, we had a third reportable segment, Industrial Blending, which primarily serves E&P customers.was exited in 2022.
Our long-term strategy includes key foundational elements that are intended to enhance long-term shareholder value creation:
•End-market diversification – To help reduce our dependency on customers inWhile the volatile E&P industry, improveFluids Systems segment has historically been the stability in cash flow generation and returns on invested capital, and provide growth opportunities into new markets, we have focused our efforts over the past several years on diversifying our presence outside of our historical E&P customer base. These efforts have been primarily focused within our Site and Access Solutions business, where we have prioritized growth in power transmission, pipeline, renewable energy, and construction markets. The continued expansionprimary driver of revenues, in industrial markets, and particularly end-markets that are likely to benefit from ongoing energy transition efforts around the world, such as power transmission, renewable energy, and geothermal, remains a strategic priority going forward, and we anticipate that our capital investments will primarily focus on supporting this objective.
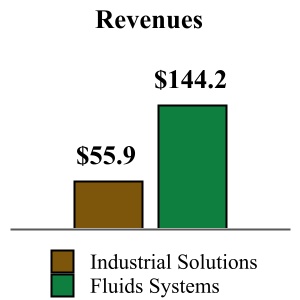
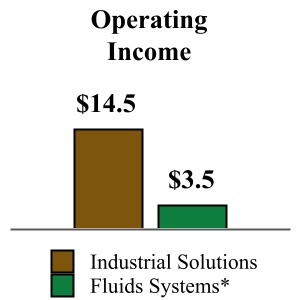
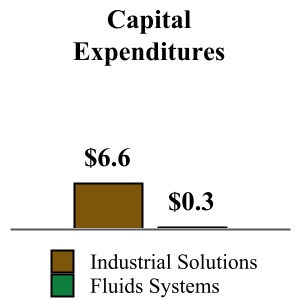
•Provide products that enhance environmental sustainability – The Company has a long history of providing environmentally-sensitive technologies to our customers. In the Industrial Solutions segment we believehas for several years been the lightweight designprimary driver of operating income, cash flows, and financial returns. Industrial Solutions also represents our fully recyclable DURA-BASE® matting system provides a distinct environmental advantageprimary focus for our customerscapital investments. The relative revenues, operating income, and capital expenditures for the Industrial Solutions and Fluids Systems segments for the first quarter of 2023 are as compared to alternative wood mat productsfollows (amounts in the market, by eliminating deforestation required to produce wood mat products while also reducing CO2 emissions associated with product transportation. In ourmillions):
* Fluids Systems segment operating income for the first quarter of 2023 includes $3.2 million in charges primarily related to facility exit and severance costs.
2023 Priorities
Following the completion of several divestiture transactions in the fourth quarter of 2022 (as described further below), the following priorities have been established for 2023:
•Accelerate Industrial Solutions Growth – We plan to continue to prioritize investment capital in the growth of our familyIndustrial Solutions business, where, over the past three years, we have seen the strong market adoption of high-performance water-basedour specialty rental products and differentiated service offering. For the first quarter of 2023, Industrial Solutions revenues were $55.9 million, reflecting a 58% increase from the first quarter of 2022. Substantially all of the increase in revenues is attributable to our continued expansion in the power transmission sector.
•Drive Operational Efficiency – We plan to increase our focus on efficiency improvements and operating cost optimization across every aspect of our global footprint. With our simplified business model and enhanced focus on balance sheet optimization, we seek to improve returns and consistency in cash flow generation. During the first quarter of 2023, we generated $29.4 million of operating cash flow, which was partially driven by the effects of the 2022 divestitures in Fluids Systems as described further below. In the first quarter of 2023, we made the decision to exit our stimulation fluids systems,product line and are in the process of winding down our Fluids operations in Chile. We also recently announced several organizational changes, which we market as Evolution®are expected to provide annualized recurring cost savings of approximately $6 million, with the benefits beginning to be realized over the next few quarters. We will continue to evaluate other under-performing areas within our business and DeepDrill® systems, are designedanticipate additional actions may be necessary to enhance drilling performance while also providing a variety of environmental benefits relative to traditional oil-based fluids. More recently,optimize our operational footprint and invested capital within the Fluids Systems segment has also developedto transform this business for the TerraThermTM water-based fluids system designed specifically for clean-energy geothermal drilling, as well as the TransitionTM family of brine-tolerant stimulation chemicals,evolving market conditions and outlook. As a result, we may incur future charges related to these efforts or potential asset impairments, which reduce the freshwater required for well stimulation applications. The continued advancement of technology that providesmay negatively impact our customers with economic benefits, while also enhancing their environmental and safety programs, remains a priority for our research and development efforts.future results.
our repurchase program. In April 2023, we repurchased an additional 1.2 million shares of our common stock (1%) for a total cost of $5.0 million.
Segment Overview
Industrial Solutions -– Our Industrial Solutions segment which generated $35.4 million of revenues and $5.5 million of operating income for the first quarter of 2022, provides temporary worksite access solutions, including the rental of our manufactured recyclable composite matting systems, along with related site construction and services to customers in various markets including power transmission, E&P, pipeline, renewable energy, petrochemical, construction and other industries, primarily in the United States and Europe. We also sell our manufactured recyclable composite mats to customers around the world, with power transmission being the primary end-market.
Our Industrial Solutions segment has been athe primary source of operating income and cash generation for us in recent years, as illustrated above, and has also been the primary focus for growth investments. The expansiongrowth of our Industrial Solutions segment intothe business in the power transmission and other industrial markets remains a strategic priority for us due to such markets’ relative stability compared to E&P, as well as the magnitude of growth opportunity in these markets, including the potential positive impact from the energy transition.transition and future legislation and regulations related to greenhouse gas emissions and climate change. We expect customer activity, particularly in the power transmission sector, will remain robust in the coming years, driven in part by the impacts of the energy transition and the increasing investment in grid reliance initiatives.
In 2020, we began leveraging our chemical blending capacity and technical expertise into industrial blending operations, and in response to the increasing market demand for cleaning products resulting from the COVID-19 pandemic, began producing disinfectants and industrial cleaning products in 2020. Despite our initial success, a key blue-chip customer experienced a significant decline in product demand and cancelled all orders of disinfectants and cleaning products in the third quarter of 2021. In February 2022, in consideration of broader strategic priorities and the timeline and efforts required to further develop the Industrial Blending business, our management recommended, and our Board of Directors approved a plan to exit our Industrial Blending operations. As part of the exit plan, we completed the wind down of the Industrial Blending business in the first quarter of 2022 and are currently pursuing the sale of the industrial blending and warehouse facility and related equipment located in Conroe, Texas. Although we currently anticipate recovering the $19 million carrying value of the long-lived assets associated with the Industrial Blending business with expected net proceeds from the ultimate disposition, it is possible that we may incur a future impairment or loss related to the ongoing sales process. The Industrial Blending business had no significant revenues and incurred an operating loss of $0.9 million for the first quarter of 2022, and contributed $5 million of revenues with approximately break-even operating income for the first quarter of 2021.
Fluids Systems -– Our Fluids Systems segment which generated $141.0 million of revenues and $3.4 million of operating income for the first quarter of 2022, provides drilling completion, and stimulationcompletion fluids products and related technical services to customers for oil, natural gas, and geothermal projects primarily in North America and Europe, the Middle East and Africa (“EMEA”), as well as certain countries in Asia Pacific and Latin America. Over the past few years, our primary focus within Fluids Systems has been the transformation into a more agile and simplified business focused on key markets, while monetizing assets in underperforming or sub-scale markets and reducing our invested capital.
Our Fluids Systems operating results remain dependent on oil and natural gas drilling activity levels in the markets we serve and the nature of the drilling operations, (including the depth and whether the wells are drilled vertically or horizontally), which governs the revenue potential of each well. Drilling activity levels in turn, depend on a variety of factors, including oil and natural gas commodity pricing, inventory levels, product demand, and regulatory restrictions. Rig count data remains the most widely accepted indicator of drilling activity. Average North American rig count data for the first quarter of 2023 and 2022 is as follows:
| | | | | | | | | | | | | | | | | | | | | | | |
| | First Quarter | | 2023 vs 2022 |
| | 2023 | | 2022 | | Count | | % |
| U.S. Rig Count | 760 | | | 633 | | | 127 | | | 20 | % |
| Canada Rig Count | 221 | | | 198 | | | 23 | | | 12 | % |
| North America Rig Count | 981 | | | 831 | | | 150 | | | 18 | % |
Source: Baker Hughes Company
Oil and natural gas prices and activity are cyclical and volatile, and this market volatility has a significant impact on our operating results.
While our Fluids Systems revenue potential is driven by a number of factors including those described above, rig count data remains the most widely accepted indicator of drilling activity. Average North American rig count data for the first quarter of 2022 as compared to the first quarter of 2021 is as follows:
| | | | | | | | | | | | | | | | | | | | | | | |
| | First Quarter | | 2022 vs 2021 |
| | 2022 | | 2021 | | Count | | % |
| U.S. Rig Count | 633 | | | 390 | | | 243 | | | 62 | % |
| Canada Rig Count | 198 | | | 138 | | | 60 | | | 43 | % |
| North America Rig Count | 831 | | | 528 | | | 303 | | | 57 | % |
Source: Baker Hughes Company
During March 2020, oil prices collapsed due to geopolitical events along with the worldwide effects of the COVID-19 pandemic. As a result, U.S. rig count declined significantly beginning in March 2020 before reaching a low of 244 in August 2020. During 2021, oil prices rebounded, and the average U.S. rig count gradually increased, ending 2021 at 586 rigs. During the first quarter of 2022, oil prices significantly increased due to geopolitical events, and the average U.S. rig count has continued to gradually increase. We anticipate that market activity in the U.S. will continue to improveremain fairly stable in 2022, although U.S. activity is expected to remain below 2019 levelsthe near-term, as many of our customers maintain strongerstrong capital discipline and prioritize cash flow generation over growth. Further, in the wake of COVID-19, an uncertain economic environment, including widespread supply chain disruptions, as well as enacted and proposed legislative changes in the U.S. impacting the oil and natural gas industry, make the timing and pace of recovery difficult to predict. The Canada rig count was 95 as of April 29, 2022, largely reflecting
thereflects normal seasonality for this market, with the highest rig count levels generally observed in the first quarter of each year, prior to Spring break-up.
Outside of North America, land markets, drilling activity is generally more stable as this drilling activity is based on longer-term economic projections and multi-year drilling programs, which typically reduces the impact of short-term changes in commodity prices on overall drilling activity. However, operations
Further, the combination of geopolitical events and elevated oil prices are causing several markets to increase drilling activity levels, to help ensure reliable energy supply in the coming years, while reducing their dependency on Russia-sourced oil and natural gas. Consequently, the outlook for several countries inmarkets within the EMEA region experiencedcontinues to strengthen, with growth in activity disruptions and project delays beginningexpected over the next few years.
Industrial Blending – Our Industrial Blending segment began operations in early 2020 and continuing through 2021, driven by government-imposed restrictions on movementssupported industrial end-markets, including the production of personnel, quarantines of staffing,disinfectants and logistical limitations as a result of the COVID-19 pandemic. Revenues and profitability from our international Fluids Systems business gradually recovered in 2021, with revenues forindustrial cleaning products. In the first quarter of 2022, near pre-COVID levels. However,we completed the impactswind down of global supply chain disruptions have caused significant cost inflation to many hydrocarbon-based products and chemicals used in our fluids systems,the Industrial Blending business, and in many cases,November 2022 we are unable to adjust our customer pricing due tocompleted the long-term contractssale of the industrial blending assets.
2022 Strategic Actions
The following strategic actions were taken in place. Consequently, the inflationary impacts are negatively impacting the profitability2022.
Exit of our international operations,Industrial Blending Segment and we expect this trend to continue throughout 2022, though the impactSale of cost inflation is very difficult to predict.Conroe, Texas Blending Facility
In response to the 2020 market changes and reduced demand forfirst quarter of 2022, we exited our products and services as a resultIndustrial Blending operations. In November 2022, we completed the sale of the decline in oil pricesindustrial blending assets and the COVID-19 pandemic, we took a numberreceived cash proceeds of actions during 2020 and continuing into 2021 aimed at conserving cash and protecting our liquidity, which included the implementationapproximately $14 million.
Sale of cost reduction programs, including workforce reductions, employee furloughs, the suspension of the Company’s matching contributions to itsExcalibar U.S. defined contribution plan, and temporary salary reductions effective April 1, 2020 for a significant portion of U.S. employees. Beginning inMineral Grinding Business
In the second quarter of 2021,2022, we restored salariesinitiated a formal sale process for our Excalibar U.S. mineral grinding business (“Excalibar”), which was reported within our Fluids Systems segment. In November 2022, we completed the sale of substantially all the long-lived assets, inventory, and operations of Excalibar to pre-reduction levelsCimbar Resources, INC. (“Cimbar”), and received cash proceeds (after purchase price adjustments) of approximately $51 million. The Company retained certain assets and liabilities, including accounts receivable and accounts payable, the wind down of which was substantially completed in the first quarter of 2023. Such working capital provided approximately $10 million of cash generation in the fourth quarter of 2022 and approximately $6 million of additional cash generation in the first quarter of 2023. In connection with the sale, the Company and Cimbar have entered into a long-term barite supply agreement for a portioncertain regions of our non-executive U.S. employees and reinstituteddrilling fluids business, with an initial term of four years following the Company matching contribution for our U.S. defined contribution plan, with the remainderclosing of the temporary salary reductions restored bytransaction.
Exit of Gulf of Mexico Operations
In the third quarter of 2021.
With ongoing support from outside financial and other advisors, we have continuously reviewed our portfolio during the oil and natural gas cycle of the last couple of years. These reviews have focused on evaluating changes in the outlook for our served markets and customer priorities, while identifying opportunities for value-creating options in our portfolio, placing investment emphasis in markets where we generate strong returns and where we see greater long-term viability and stability. While we have taken certain actions to reduce our workforce and cost structure, our business contains high levels of fixed costs, including significant facility and personnel expense. In February 2022, our Board of Directors approved management’s plan to explore strategic options,exit our Fluids Systems Gulf of Mexico operations, including the potential sale forof related assets. In December 2022, we completed the sale of substantially all assets associated with our U.S. mineral grinding business. The U.S. mineral grinding business contributed third-party revenuesGulf of $14Mexico completion fluids operations. Separately, we entered into a seven-year arrangement to sublease our Fourchon, LA drilling fluids shorebase and blending facility to a leading global energy services provider. As part of this arrangement, substantially all of our Gulf of Mexico drilling fluids inventory will be sold as consumed by the lessee or no later than nine months from the closing of the transaction. These transactions provided cash generation of approximately $6 million in the fourth quarter of 2022, approximately $15 million in the first quarter of 2023, and is expected to provide additional cash generation of approximately $10 million, primarily in the second quarter of 2023. In addition, we expect to receive approximately $4 million in the second quarter of 2023 from the sale of certain long-lived assets previously used to support these operations. Fluids Systems segment operating income for the first quarter of 2022 and $72023 includes $2.3 million forin charges related to the firstexit of Gulf of Mexico operations, which is expected to be substantially completed during the second quarter of 2021.2023.
Summarized operating results of the business units exited in 2022 are shown in the following table:
| | | | | | | | | | | |
| | First Quarter |
| (In thousands) | 2023 | | 2022 |
| Revenues | | | |
| Industrial Blending | $ | — | | | $ | — | |
| Excalibar | — | | | 14,346 | |
| Gulf of Mexico | — | | | 2,694 | |
| Total revenues | $ | — | | | $ | 17,040 | |
| | | |
| Operating income (loss) | | | |
| Industrial Blending | $ | — | | | $ | (886) | |
| Excalibar | (77) | | | 833 | |
| Gulf of Mexico | (2,311) | | | (2,617) | |
| Total operating income (loss) | $ | (2,388) | | | $ | (2,670) | |
Summarized net assets remaining from the business units exited in 2022 are shown in the following table:
| | | | | | | | | | | |
| (In thousands) | March 31, 2023 | | December 31, 2022 |
| Receivables, net | $ | 9,391 | | | $ | 27,798 | |
| Inventories | 1,409 | | | 5,805 | |
| Accounts payable | (575) | | | (2,060) | |
| Accrued liabilities | — | | | (311) | |
| Total net assets | $ | 10,225 | | | $ | 31,232 | |
The net assets remaining as of March 31, 2023 primarily reflect remaining Gulf of Mexico working capital, the majority of which we expect to realize in the second quarter of 2023.
We also continue to evaluate other under-performing areas ofstrategic alternatives for our business, particularly within the U.S. and Gulf of Mexico oil and natural gas markets,portfolio, which necessitates consideration of broader structural changes to transform this business for the new market realities. In the absence ofmay result in additional divestitures. As a longer-term increase in activity levels,result, we may incur future charges related to these efforts or potential asset impairments, which may negatively impact our future results.
First Quarter of 20222023 Compared to First Quarter of 20212022
Consolidated Results of Operations
Summarized results of operations for the first quarter of 20222023 compared to the first quarter of 20212022 are as follows:
| | | | First Quarter | | 2022 vs 2021 | | First Quarter | | 2023 vs 2022 |
| (In thousands) | (In thousands) | 2022 | | 2021 | | $ | | % | (In thousands) | 2023 | | 2022 | | $ | | % |
| Revenues | Revenues | $ | 176,438 | | | $ | 141,172 | | | $ | 35,266 | | | 25 | % | Revenues | $ | 200,030 | | | $ | 176,438 | | | $ | 23,592 | | | 13 | % |
| Cost of revenues | Cost of revenues | 150,988 | | | 119,991 | | | 30,997 | | | 26 | % | Cost of revenues | 164,738 | | | 150,988 | | | 13,750 | | | 9 | % |
| Selling, general and administrative expenses | Selling, general and administrative expenses | 24,433 | | | 20,911 | | | 3,522 | | | 17 | % | Selling, general and administrative expenses | 25,410 | | | 24,433 | | | 977 | | | 4 | % |
| Other operating (income) loss, net | Other operating (income) loss, net | 50 | | | (274) | | | 324 | | | NM | Other operating (income) loss, net | (261) | | | 50 | | | (311) | | | NM |
| Operating income | Operating income | 967 | | | 544 | | | 423 | | | 78 | % | Operating income | 10,143 | | | 967 | | | 9,176 | | | NM |
| | Foreign currency exchange (gain) loss | 64 | | | (332) | | | 396 | | | NM | |
| Foreign currency exchange loss | | Foreign currency exchange loss | 319 | | | 64 | | | 255 | | | NM |
| Interest expense, net | Interest expense, net | 1,206 | | | 2,408 | | | (1,202) | | | (50) | % | Interest expense, net | 2,089 | | | 1,206 | | | 883 | | | 73 | % |
| Loss on extinguishment of debt | — | | | 790 | | | (790) | | | NM | |
| Loss before income taxes | (303) | | | (2,322) | | | 2,019 | | | 87 | % | |
| Income (loss) before income taxes | | Income (loss) before income taxes | 7,735 | | | (303) | | | 8,038 | | | NM |
| | Provision (benefit) for income taxes | Provision (benefit) for income taxes | (2,824) | | | 3,040 | | | (5,864) | | | NM | Provision (benefit) for income taxes | 2,115 | | | (2,824) | | | 4,939 | | | NM |
| Net income (loss) | $ | 2,521 | | | $ | (5,362) | | | $ | 7,883 | | | NM | |
| Net income | | Net income | $ | 5,620 | | | $ | 2,521 | | | $ | 3,099 | | | NM |
Revenues
Revenues increased 25%13% to $200.0 million for the first quarter of 2023, compared to $176.4 million for the first quarter of 2022 compared to $141.2which included $17.0 million for the first quarter of 2021. This $35.3revenues from divested Fluids Systems business units. The $23.6 million increase in revenues includes a $17.4$15.5 million (16%(12%) increase in revenues in North America, comprised of a $32.7$20.3 million increase in the Fluids SystemsIndustrial Solutions segment partially offset by a $15.3$4.8 million decrease in the Fluids Systems segment. In our Industrial Solutions segment. Revenuessegment, revenues from our North America operations increased primarily due an increase in product sales to support power transmission projects. In our Fluids Systems segment, revenues from our North America operations decreased primarily due to the impact of the divested business units, as well as lower market share, partially offset by the benefit of an improvement in North America rig count, which favorably impacted our Fluids Systems segment, partially offset by a decline in revenues from product sales in our Industrial Solutions segment, which typically fluctuate based on the timing of mat orders from customers and were favorably impacted in the first quarter of 2021 by pent-up demand following the peak of the COVID-19 pandemic.count. Revenues from our international operations increased by $17.9$8.1 million (53%(16%), as the prior year continued to be unfavorably impacteddriven by higher activity disruptionsin Europe and project delays resulting from the COVID-19 pandemic.Africa. Additional information regarding the change in revenues is provided within the operating segment results below.
Cost of revenues
Cost of revenues increased 26%9% to $164.7 million for the first quarter of 2023, compared to $151.0 million for the first quarter of 2022 which included $18.3 million of cost of revenues from divested business units. The $13.8 million increase in cost of revenues was primarily driven by the 13% increase in revenues described above, partially offset by the impact of segment mix, with Industrial Solutions representing a higher proportion of revenues for the first quarter of 2023, as compared to $120.0the prior year.
Selling, general and administrative expenses
Selling, general and administrative expenses increased $1.0 million to $25.4 million for the first quarter of 2021. This $31.0 million increase was primarily driven by the 25% increase in revenues described above, along with inflationary cost pressures impacting materials, transportation, and labor.
Selling, general and administrative expenses
Selling, general and administrative expenses increased $3.5 million2023, compared to $24.4 million for the first quarter of 2022, compared to $20.9 million for the first quarter of 2021.2022. This increase was primarily driven by higher performance-based incentivefirst quarter 2023 project spending related to strategic planning activities and stock-based compensation expense, and the restoration of U.S. salary and retirement benefits, as well as higher legal and professional expenses.an organizational design project. Selling, general and administrative expenses as a percentage of revenues was 12.7% for the first quarter of 2023 compared to 13.8% for the first quarter of 2022 compared2022. Consolidated selling, general and administrative expenses included $0.5 million of costs related to 14.8%divested business units for the first quarter of 2021.2022.
Foreign currency exchange
Foreign currency exchange was a $0.3 million loss for the first quarter of 2023 compared to a $0.1 million loss for the first quarter of 2022, compared to a $0.3 million gain for the first quarter of 2021, and reflects the impact of currency translation on assets and liabilities (including intercompany balances) that are denominated in currencies other than functional currencies.
Interest expense, net
Interest expense net
Interest expense was $2.1 million for the first quarter of 2023 compared to $1.2 million for the first quarter of 2022 compared to $2.4 million for the first quarter of 2021. Interest expense for the first quarter of 2022 and 2021 includes $0.2 million and $1.1 million, respectively, in non-cash amortization of original issue discount and debt issuance costs.2022. The decreaseincrease in interest expense is primarily due to the 2021 repayment of our Convertible Notes with borrowings under the ABL Facility.
Loss on extinguishment ofan increase in benchmark borrowing rates partially offset by a decrease in average debt
In the first quarter of 2021, we repurchased $18.3 million of our Convertible Notes in the open market for $18.1 million. The $0.8 million loss for the first quarter of 2021 reflects the difference in the amount paid and the net carrying value of the extinguished debt, including original issue discount and debt issuance costs. outstanding.
Provision (benefit) for income taxes
The provision for income taxes was $2.1 million for the first quarter of 2023, reflecting an effective tax rate of 27%. The 2023 provision for income taxes was favorably impacted by the benefit associated with a partial valuation allowance release to recognize a portion of previously unbenefited net operating losses. The benefit for income taxes was $2.8 million for the first quarter of 2022, which includes an income tax benefit of $3.1 million related to the restructuring of certain subsidiary legal entities within Europe, as the undistributed earnings for an international subsidiary are no longer subject to certain taxes upon future distribution. The provision for income taxes was $3.0 million for the first quarter of 2021, despite reporting a pretax loss for the period, primarily reflecting the impact of the geographic composition of our pretax loss. The tax expense in 2021 primarily related to earnings from our international operations since we were unable to recognize the tax benefit from our U.S. losses as they may not be realized.
Operating Segment Results
Summarized financial information for our reportable segments is shown in the following table (net of inter-segment transfers):
| | | First Quarter | | 2022 vs 2021 | | First Quarter | | 2023 vs 2022 |
| (In thousands) | (In thousands) | 2022 | | 2021 | | $ | | % | (In thousands) | 2023 | | 2022 | | $ | | % |
| Revenues | Revenues | | | | | | | | Revenues | | | | | | | |
| Fluids Systems | Fluids Systems | $ | 141,014 | | | $ | 87,849 | | | $ | 53,165 | | | 61 | % | Fluids Systems | $ | 144,174 | | | $ | 141,014 | | | $ | 3,160 | | | 2 | % |
| Industrial Solutions | Industrial Solutions | 35,424 | | | 53,323 | | | (17,899) | | | (34) | % | Industrial Solutions | 55,856 | | | 35,424 | | | 20,432 | | | 58 | % |
| Industrial Blending | | Industrial Blending | — | | | — | | | — | | | NM |
| Total revenues | Total revenues | $ | 176,438 | | | $ | 141,172 | | | $ | 35,266 | | | 25 | % | Total revenues | $ | 200,030 | | | $ | 176,438 | | | $ | 23,592 | | | 13 | % |
| | Operating income (loss) | Operating income (loss) | | | | | Operating income (loss) | | | | |
| Fluids Systems | Fluids Systems | $ | 3,374 | | | $ | (6,767) | | | $ | 10,141 | | | Fluids Systems | $ | 3,466 | | | $ | 3,374 | | | $ | 92 | | |
| Industrial Solutions | Industrial Solutions | 5,472 | | | 13,130 | | | (7,658) | | | Industrial Solutions | 14,483 | | | 6,358 | | | 8,125 | | |
| Industrial Blending | | Industrial Blending | — | | | (886) | | | 886 | | |
| Corporate office | Corporate office | (7,879) | | | (5,819) | | | (2,060) | | | Corporate office | (7,806) | | | (7,879) | | | 73 | | |
| Total operating income | Total operating income | $ | 967 | | | $ | 544 | | | $ | 423 | | | Total operating income | $ | 10,143 | | | $ | 967 | | | $ | 9,176 | | |
| | Segment operating margin | Segment operating margin | | Segment operating margin | |
| Fluids Systems | Fluids Systems | 2.4 | % | | (7.7) | % | | Fluids Systems | 2.4 | % | | 2.4 | % | |
| Industrial Solutions | Industrial Solutions | 15.4 | % | | 24.6 | % | | Industrial Solutions | 25.9 | % | | 17.9 | % | |
| Industrial Blending | | Industrial Blending | NM | | NM | |
Fluids Systems
Revenues
Total revenues for this segment consisted of the following:
| | | | First Quarter | | 2022 vs 2021 | | First Quarter | | 2023 vs 2022 |
| (In thousands) | (In thousands) | 2022 | | 2021 | | $ | | % | (In thousands) | 2023 | | 2022 | | $ | | % |
| United States | United States | $ | 70,843 | | | $ | 47,670 | | | $ | 23,173 | | | 49 | % | United States | $ | 68,898 | | | $ | 70,843 | | | $ | (1,945) | | | (3) | % |
| Canada | Canada | 22,235 | | | 12,663 | | | 9,572 | | | 76 | % | Canada | 19,365 | | | 22,235 | | | (2,870) | | | (13) | % |
| Total North America | Total North America | 93,078 | | | 60,333 | | | 32,745 | | | 54 | % | Total North America | 88,263 | | | 93,078 | | | (4,815) | | | (5) | % |
| | EMEA | EMEA | 44,175 | | | 25,459 | | | 18,716 | | | 74 | % | EMEA | 52,577 | | | 44,175 | | | 8,402 | | | 19 | % |
| Other | Other | 3,761 | | | 2,057 | | | 1,704 | | | 83 | % | Other | 3,334 | | | 3,761 | | | (427) | | | (11) | % |
| Total International | Total International | 47,936 | | | 27,516 | | | 20,420 | | | 74 | % | Total International | 55,911 | | | 47,936 | | | 7,975 | | | 17 | % |
| | Total Fluids Systems revenues | Total Fluids Systems revenues | $ | 141,014 | | | $ | 87,849 | | | $ | 53,165 | | | 61 | % | Total Fluids Systems revenues | $ | 144,174 | | | $ | 141,014 | | | $ | 3,160 | | | 2 | % |
North America revenues increased 54%decreased 5% to $88.3 million for the first quarter of 2023, compared to $93.1 million for the first quarter of 2022, comparedprimarily related to $60.3 million for the first quarter of 2021. This increase included a $28.6 million increase from U.S. land markets driven primarily by the 62% increase in U.S. rig count, partially offset by a $5.4 million decrease from offshore Gulf of Mexico driven primarily by changes in customer drilling and completion activity levels. In addition, Canada increased $9.6 million driven primarily by the 43% increase in Canada rig count along with an increase in market share.divested business units. For the first quarter of 2022, U.S. revenues included $68.1 million from land markets, including $14.3 million from the U.S. mineral grinding business and $2.7 million from offshore Gulf of Mexico. Revenues from U.S. land markets increased $0.7 million as the benefit of the 20% increase in U.S. rig count was substantially offset by the $14.3 million of revenue in the prior year from the divested U.S. mineral grinding business and lower market share. In addition, Canada decreased $2.9 million driven primarily by a decline in market share, which typically fluctuates based on customer mix and timing of projects.
Internationally, revenues increased 74%17% to $55.9 million for the first quarter of 2023, compared to $47.9 million for the first quarter of 2022, compared to $27.5 million for the first quarter of 2021.2022. The increase was primarily driven by higher activity in Europe Africa, and the Asia Pacific region following a significant impact in 2021 from the COVID-19 pandemic, as described above.Africa.
Operating income (loss)
The Fluids Systems segment generated operating income of $3.5 million for the first quarter of 2023 compared to $3.4 million for the first quarter of 2022, reflecting a $10.1 million improvement from the $6.8 million operating loss incurred in the first quarter of 2021.2022. The improvement in operating loss includes a $6.5 million benefit from North America operations and a $3.6 million benefit from international operations,income primarily reflectingreflects the impact of the revenue improvementchanges described above partially offset by supply chainabove. The first quarter of 2023 includes $3.2 million in charges primarily related cost pressures.to facility exit costs in the Gulf of Mexico and severance costs while the first quarter of 2022 included operating losses of $1.8 million related to the divested business units.
Industrial Solutions
Revenues
Total revenues for this segment consisted of the following:
| | | | First Quarter | | 2022 vs 2021 | | First Quarter | | 2023 vs 2022 |
| (In thousands) | (In thousands) | 2022 | | 2021 | | $ | | % | (In thousands) | 2023 | | 2022 | | $ | | % |
| Product sales revenues | Product sales revenues | $ | 4,423 | | | $ | 20,037 | | | $ | (15,614) | | | (78) | % | Product sales revenues | $ | 19,496 | | | $ | 4,423 | | | $ | 15,073 | | | 341 | % |
| Rental and service revenues | Rental and service revenues | 31,001 | | | 28,733 | | | 2,268 | | | 8 | % | Rental and service revenues | 36,360 | | | 31,001 | | | 5,359 | | | 17 | % |
| Industrial blending revenues | — | | | 4,553 | | | (4,553) | | | NM | |
| Total Industrial Solutions revenues | Total Industrial Solutions revenues | $ | 35,424 | | | $ | 53,323 | | | $ | (17,899) | | | (34) | % | Total Industrial Solutions revenues | $ | 55,856 | | | $ | 35,424 | | | $ | 20,432 | | | 58 | % |
Revenues from product sales, which typically fluctuate based on the timing of matcustomer projects and orders, from customers, decreasedincreased by $15.6$15.1 million from the first quarter of 2021, as2022, reflective of robust demand from the first quarter of 2021 was favorably impacted by pent-up demand following the peak of the COVID-19 pandemic.utilities sector. Rental and service revenues increased by $2.3 million17% from the first quarter of 2021, including a $2.1 million increase from power transmission and other industrial markets. The increase from industrial customers reflects our2022, driven by the continued expansion into these markets, both in the U.S. and U.K., including an approximately 28% increase in revenues frommarket penetration of the power transmission sector partially attributable to our December 2021 acquisition.in the U.S., along with improved pricing.
Operating income
The Industrial Solutions segment generated operating income of $5.5$14.5 million for the first quarter of 2023 compared to $6.4 million for the first quarter of 2022, compared to $13.1 million for the first quarter of 2021, the decreaseincrease being primarily attributable to the change in revenues as described above, along with lower average pricing associated with large scale rental projects and the loss attributable to the wind down of the Industrial Blending operations in the first quarter of 2022.above.
Corporate Office
Corporate office expenses increased $2.1decreased $0.1 million to $7.8 million for the first quarter of 2023, compared to $7.9 million for the first quarter of 2022, compared to $5.8 million for the2022. The first quarter of 2021. This increase was primarily driven by higher legal costs, including2023 includes approximately $1.0 million of project spending related to strategic planning activities and an organizational design project. The first quarter of 2022 included $0.7 million associated with shareholder matters and acquisition and divestiture efforts, along with higher personnel expense, including performance-based incentive and stock-based compensation expense, as well as the restoration of U.S. salary and retirement benefits.efforts.
Liquidity and Capital Resources
Net cash provided by operating activities was $29.4 million for the first quarter of 2023 compared to $2.8 million for the first quarter of 2022 compared to $27.8 million for the first quarter of 2021.2022. During the first quarter of 2022,2023, net income adjusted for non-cash items provided cash of $8.0$14.4 million whileand changes in working capital usedprovided cash of $5.2 million.$15.1 million, which is primarily related to the wind down of working capital associated with the fourth quarter 2022 divestiture transactions.
Net cash used inprovided by investing activities was $7.0$0.9 million for the first quarter of 2023, including $7.2 million in proceeds received related to our fourth quarter of 2022 including capital expenditures of $7.6 million, partially offset by $0.6divestitures, as well as $0.7 million in proceeds from the sale of assets. The majority of the proceeds fromassets, which includes the sale of assets reflect used mats from our Industrial Solutions rental fleet, which are part of the commercial offering of our Site and Access Solutions business. Nearly all of ourfleet. These proceeds were partially offset by capital expenditures duringof $7.0 million in the first quarter of 2022 were2023, nearly all of which was directed to supporting our Industrial Solutions segment including $6.1 million of investments in the mat rental fleet, supporting our strategic growth in the power transmission sector and replacing mats sold from the fleet.sector.
Net cash provided byused in financing activities was $1.3$30.3 million for the first quarter of 2022,2023, which primarily representsincludes $15.3 million in net borrowings of $1.4 millionrepayments on our Amended ABL Facility.Facility and other financing arrangements, as well as $15.0 million in share purchases under our repurchase program.
Substantially all our $21.3$23.6 million of cash on hand at March 31, 20222023 resides in our international subsidiaries. Subject to maintaining sufficient cash requirements to support the strategic objectives of these international subsidiaries and complying with applicable exchange or cash controls, we expect to continue to repatriate available cash from these international subsidiaries. We anticipate that future working capital requirements forprimarily manage our operations will generally fluctuate directionally with revenues. We expect capital expenditures will remain heavily focused on industrial end-market opportunities, primarily reflecting expansion of our mat rental fleet to further support our growth in the utilities market.
Availabilityliquidity utilizing availability under our Amended ABL Facility also provides additional liquidity as discussed further below. Totaland other existing financing arrangements. Under our Amended ABL Facility, we manage daily cash requirements by utilizing borrowings or repayments under this revolving credit facility, while maintaining minimal cash on hand in the U.S.
We expect total availability under the Amended ABL Facility willto fluctuate directionally based on the level of eligible U.S. accounts receivable, inventory, and composite mats included in the rental fleet. We expect our available cash on-hand, cash generated by operations, and the expectedprojected availability under our Amended ABL Facility and other existing financing arrangements, cash generated by operations, and available cash on-hand in our international subsidiaries to be adequate to fund our current operations during the next 12 months.
In February 2022, we initiated a planWe anticipate that future working capital requirements for our operations will generally fluctuate directionally with revenues, though the second quarter of 2023 is expected to benefit approximately $14 million from the wind down our Industrial Blending operationsof remaining working capital and pursue the sale of assets associated with the industrial blending and warehouse facility and related equipment, and also madefourth quarter 2022 divestiture transactions. We expect capital expenditures in 2023 will remain fairly in line with 2022 levels, with spending heavily focused on the decision to explore strategic options, including the potential sale, for our U.S. mineral grinding business. Although the timing of any such transactions is not determinable, we expect to use any proceeds for general corporate purposes in supportexpansion of our strategic initiatives. We also continuemat rental fleet to evaluatefurther support the utilities market penetration. In April 2023, we used $5 million in cash for additional sources of liquidity to supportshare purchases under our longer-term needs.
Our capitalization is as follows:
| | | | | | | | | | | |
| (In thousands) | March 31, 2022 | | December 31, 2021 |
| ABL Facility | 87,900 | | | 86,500 | |
| Other debt | 28,497 | | | 28,491 | |
| Unamortized discount and debt issuance costs | (155) | | | (188) | |
| Total debt | $ | 116,242 | | | $ | 114,803 | |
| | | |
| Stockholder's equity | 465,143 | | | 462,386 | |
| Total capitalization | $ | 581,385 | | | $ | 577,189 | |
| | | |
| Total debt to capitalization | 20.0 | % | | 19.9 | % |
Asset-Based Loan Facility. In October 2017, we entered into an asset-based revolving credit agreement, which was amended in March 2019 (the “ABL Facility”).repurchase program. As of March 31, 2022,May 2, 2023, our total borrowing availability under the ABL Facility provided financing up to $200.0 million available for borrowings (inclusive of letters of credit) and could be increased up to a maximum capacity of $275.0 million, subject to certain conditions. TheAmended ABL Facility was scheduled to terminate in March 2024. As of March 31, 2022, our total availability under the ABL Facility was $116.0$152.9 million, of which $87.9$63.7 million was drawn and $1.1$3.3 million was used for outstanding letters of credit, resulting in remaining availability of $27.0$85.8 million. As of
Our capitalization is as follows:
| | | | | | | | | | | |
| (In thousands) | March 31, 2023 | | December 31, 2022 |
| Amended ABL Facility | 65,400 | | | 80,300 | |
| Other debt | 35,912 | | | 33,949 | |
| Unamortized discount and debt issuance costs | (113) | | | (134) | |
| Total debt | $ | 101,199 | | | $ | 114,115 | |
| | | |
| Stockholders’ equity | 417,229 | | | 423,028 | |
| Total capitalization | $ | 518,428 | | | $ | 537,143 | |
| | | |
| Total debt to capitalization | 19.5 | % | | 21.2 | % |
Asset-Based Loan Facility. In October 2017, we entered into a U.S. asset-based revolving credit agreement, which was amended in March 31, 2022, the weighted average interest rate for the ABL Facility was 1.9%2019 and the applicable commitment fee on the unused portion of the ABL Facility was 0.375% per annum.
In May 2022, we amended and restated the ABL Facilityin May 2022 (the “Amended ABL Facility”). The Amended ABL Facility provides financing of up to $175.0 million available for borrowings (inclusive of letters of credit), which can be increased up to $250.0 million, subject to certain conditions. The Amended ABL Facility has a five-year term expiring May 2027, expands available borrowing capacity associated with the Industrial Solutions rental mat fleet, replaces the LIBOR-based pricing grid withis based on a BSBY-basedBloomberg Short-Term Bank Yield Index (“BSBY”) pricing grid, and includes a mechanism to incorporate a sustainability-linked pricing framework with the consent of the required lenders (as defined in the Amended ABL Facility).
As of May 2, 2022, after giving effect to the Amended ABL Facility,March 31, 2023, our total borrowing availability under the Amended ABL Facility was $133.5$154.3 million, of which $94.1$65.4 million was drawn and $1.1$3.3 million was used for outstanding letters of credit, resulting in remaining availability of $38.4$85.6 million.
Borrowing availability under the Amended ABL Facility is calculated based on eligible U.S. accounts receivable, inventory and composite mats included in the rental fleet, net of reserves and subject to limits on certain of the assets included
in the borrowing base calculation. To the extent pledged by the borrowers, the borrowing base calculation also includes the amount of eligible pledged cash. The administrative agent may establish reserves in accordance with the Amended ABL Facility, in part based on appraisals of the asset base, and other limits in its discretion, which could reduce the amounts otherwise available under the Amended ABL Facility.
Under the terms of the Amended ABL Facility, we may elect to borrow at a variable interest rate based on either, (1) the Bloomberg Short-Term Bank Yield Index (“BSBY”)BSBY rate (subject to a floor of zero) or (2) the base rate (subject to a floor of zero), equal to the highest of (a) the federal funds rate plus 0.50%, (b) the prime rate of Bank of America, N.A., and (c) BSBY for a one-month interest period plus 1.00%, plus, in each case, an applicable margin per annum. The applicable margin ranges from 1.50% to 2.00% per annum for BSBY borrowings, and 0.50% to 1.00% per annum for base rate borrowings, based on the consolidated leverage ratio (as defined in the Amended ABL Facility) as of the last day of the most recent fiscal quarter. The Company isWe are also required to pay a commitment fee equal to (i) 0.375% per annum at any time the average daily unused portion of the commitments is lessgreater than 50% and (ii) 0.25% per annum at any time the average daily unused portion of the commitments is greaterless than 50%.
As of March 31, 2023, the applicable margin for borrowings under the Amended ABL Facility was 1.50% with respect to BSBY borrowings and 0.50% with respect to base rate borrowings. As of March 31, 2023, the weighted average interest rate for the Amended ABL Facility was 6.2% and the applicable commitment fee on the unused portion of the Amended ABL Facility was 0.375% per annum.
The Amended ABL Facility is a senior secured obligation of the Company and certain of our U.S. subsidiaries constituting borrowers thereunder, secured by a first priority lien on substantially all of the personal property and certain real property of the borrowers, including a first priority lien on certain equity interests of direct or indirect domestic subsidiaries of the borrowers and certain equity interests issued by certain foreign subsidiaries of the borrowers.
The Amended ABL Facility contains customary representations, warranties and covenants that, among other things, and subject to certain specified circumstances and exceptions, restrict or limit the ability of the borrowers and certain of their subsidiaries to incur indebtedness (including guarantees), grant liens, make investments, pay dividends or distributions with respect to capital stock and make other restricted payments, make prepayments on certain indebtedness, engage in mergers or other fundamental changes, dispose of property, and change the nature of their business.
The Amended ABL Facility requires compliance with the following financial covenants: (i) a minimum fixed charge coverage ratio of 1.00 to 1.00 for the most recently completed four fiscal quarters and (ii) while a leverage covenant trigger period (as defined in the Amended ABL Facility) is in effect, a maximum consolidated leverage ratio of 4.00 to 1.00 as of the last day of the most recently completed fiscal quarter.
The Amended ABL Facility includes customary events of default including non-payment of principal, interest or fees, violation of covenants, inaccuracy of representations or warranties, cross-default to other material indebtedness, bankruptcy and insolvency events, invalidity or impairment of security interests or invalidity of loan documents, certain ERISA events, unsatisfied or unstayed judgments and change of control.
Other Debt. In April 2022, a U.K. subsidiary entered a £7.0 million term loan and a £2.0 million revolving credit facility. Both the term loan and revolving credit facility mature in April 2025 and bear interest at a rate of Sterling Overnight Index Average plus a margin of 3.25% per year. As of March 31, 2023, the interest rate for the U.K. facilities was 7.4%. The term loan is payable in quarterly installments of £350,000 plus interest beginning June 2022 and a £2.8 million payment due at maturity. We had $8.9 million outstanding under these arrangements at March 31, 2023.
In August 2021, we completed sale-leaseback transactions related to certain vehicles and other equipment for net proceeds of approximately $7.9 million. The transactions have been accounted for as financing arrangements as they did not qualify for sale accounting. As a result, the vehicles and other equipment continue to be reflected on our balance sheet in property, plant and equipment, net. The financing arrangements have a weighted average annual interest rate of 5.4% and are payable in monthly installments with varying maturities through October 2025. We had $5.8$2.8 million in financing obligations outstanding under these arrangements at March 31, 2022.
In February 2021, a U.K. subsidiary entered a £6.0 million (approximately $8.3 million) term loan facility that was scheduled to mature in February 2024. Effective January 1, 2022, the term loan had an interest at a rate of SONIA plus a margin of 3.5% per year. The term loan was payable in quarterly installments of £375,000 plus interest beginning March 2021 and a £1.5 million payment due at maturity. We had $5.4 million outstanding under this arrangement at March 31, 2022. In April 2022, this facility was amended to increase the term loan to £7.0 million (approximately $9.1 million) and add a £2.0 million (approximately $2.6 million) revolving credit facility. Both the amended term loan and revolving credit facility mature in April 2025 and bear interest at a rate of SONIA plus a margin of 3.25% per year. The term loan is payable in quarterly installments of £350,000 plus interest beginning June 2022 and a £2.8 million payment due at maturity. We had $11.2 million outstanding under these arrangements at May 2, 2022.2023.
Certain of our foreign subsidiaries maintain local credit arrangements consisting primarily of lines of credit or overdraft facilities which are generally renewed on an annual basis. We utilize local financing arrangements in our foreign operations in order to provide short-term local liquidity needs. We had $14.5$16.7 million and $11.8$14.3 million outstanding under these arrangements at March 31, 20222023 and December 31, 2021,2022, respectively.
In addition, at March 31, 2022,2023, we had $47.0$41.3 million in outstanding letters of credit, performance bonds, and other guarantees for which certain of the letters of credit are collateralized by $4.8$1.9 million in restricted cash.
Critical Accounting Estimates and Policies
Our consolidated financial statements are prepared in accordance with accounting principles generally accepted in the United States (“U.S. GAAP”), which requires management to make estimates and assumptions that affect the reported amounts
and disclosures. Significant estimates used in preparing our consolidated financial statements include estimated cash flows and fair values used for impairments of long-lived assets, including goodwill and other intangibles, and valuation allowances for deferred tax assets. Our estimates are based on historical experience and on our future expectations that we believe to be reasonable. The combination of these factors forms the basis for making judgments about the carrying values of assets and liabilities that are not readily apparent from other sources. Actual results may differ from our current estimates and those differences may be material.
For additional discussion of our critical accounting estimates and policies, see “Management's“Management’s Discussion and Analysis of Financial Condition and Results of Operations” included in our Annual Report on Form 10-K for the year ended December 31, 2021. Except for the following, our2022. Our critical accounting estimates and policies have not materially changed since December 31, 2021.2022.
In February 2022, in consideration of broader strategic priorities and the timeline and efforts required to further develop the industrial blending business, our management recommended, and our Board of Directors approved a plan to exit our Industrial Blending operations. As a result of the plan to exit and dispose of the assets used in the Industrial Blending business, we estimated in February 2022 and disclosed in our Annual Report on Form 10-K for the year ended December 31, 2021 that we may incur pre-tax charges in the range of approximately $4 million to $8 million primarily related to the non-cash impairment of long-lived assets related to the Industrial Blending business, which we anticipated recognizing in the first quarter of 2022. In March 2022, we shut down the Industrial Blending business and initiated a sales process to market the industrial blending and warehouse facility and related equipment. As a result of the ongoing sales process and revised estimates for the expected net proceeds from the ultimate disposition, we now anticipate recovering the $19 million carrying value of the long-lived assets associated with the Industrial Blending business. Accordingly, no impairment has been recognized for these assets in the first quarter of 2022, though it remains possible that we may incur a future impairment or loss related to the ongoing sales process.
ITEM 3. Quantitative and Qualitative Disclosures About Market Risk
We are exposed to market risk from changes in interest rates and changes in foreign currency exchange rates. A discussion of our primary market risk exposure in financial instruments is presented below.
Interest Rate Risk
At March 31, 2022,2023, we had total principal amounts outstanding under financing arrangements of $116.4$101.3 million, including $87.9$65.4 million of borrowings under our Amended ABL Facility, and $5.4$8.9 million of borrowings under a U.K. term loan and credit facility, and $10.2 million under certain other international credit facilities, which are subject to variable interest rates as determined by the respective debt agreements. The weighted average interest raterates at March 31, 20222023 for the Amended ABL Facility, U.K. debt, and the U.K. term loanother international credit facilities was 1.9%6.2%, 7.4%, and 3.4%,8.8% respectively. Based on the balance of variable rate debt at March 31, 2022,2023, a 100 basis-point increase in short-term interest rates would have increased annual pre-tax interest expense by $0.9$0.8 million.
Foreign Currency Risk
Our principal foreign operations are conducted in certain areas of EMEA, Canada, Asia Pacific, and Latin America. We have foreign currency exchange risks associated with these operations, which are conducted principally in the foreign currency of the jurisdictions in which we operate including European euros, Canadian dollars, Kuwaiti dinar, Algerian dinar, Romanian new leu, British pounds, and Australian dollars. Historically, we have not used off-balance sheet financial hedging instruments to manage foreign currency risks when we enter into a transaction denominated in a currency other than our local currencies.
ITEM 4. Controls and Procedures
Evaluation of Disclosure Controls and Procedures
Our management, with the participation of our Chief Executive Officer and Chief Financial Officer, has evaluated the effectiveness of our disclosure controls and procedures (as defined in Rules 13a-15(e) and 15d-15(e) under the Securities Exchange Act of 1934) as of the end of the period covered by this quarterly report. Based on such evaluation, our Chief Executive Officer and Chief Financial Officer concluded that our disclosure controls and procedures were effective as of March 31, 2022,2023, the end of the period covered by this quarterly report.
Changes in Internal Control Over Financial Reporting
There were no changes in internal control over financial reporting during the quarter ended March 31, 20222023 that materially affected, or are reasonably likely to materially affect, our internal control over financial reporting.
PART II OTHER INFORMATION
ITEM 1. Legal Proceedings
In the ordinary course of conducting our business, we become involved in litigation and other claims from private party actions, as well as judicial and administrative proceedings involving governmental authorities at the federal, state, and local levels. While the outcome of litigation or other proceedings against us cannot be predicted with certainty, management does not expect that any loss resulting from such litigation or other proceedings, in excess of any amounts accrued or covered by insurance, will have a material adverse impact on our consolidated financial statements.
ITEM 1A. Risk Factors
Except as set forth below, thereThere have been no material changes during the period ended March 31, 2022 in2023 to our “Risk Factors” as discussed in Item 1A of our Annual Report on Form 10-K for the year ended December 31, 2021.2022.
Risks Related to the Ongoing Conflict Between Russia and Ukraine
Given the nature of our business and our global operations, the current conflict between Russia and Ukraine may adversely affect our business and results of operations. Although we do not have any operations in Russia or Ukraine, the broader consequences of this conflict, which may include embargoes, supply chain disruptions, regional instability, and geopolitical shifts, and the extent of the conflict’s effect on our business and results of operations as well as the global economy, cannot be predicted.
The current conflict between Russia and Ukraine may also have the effect of heightening many other risks disclosed in our public filings, any of which could materially and adversely affect our business and results of operations. Such risks include, but are not limited to, the volatility of oil and natural gas prices that can adversely affect demand for our products and services; our customers’ activity levels, spending for our products and services, and ability to pay amounts owed us that could be impacted by the ability of our customers to access equity or credit markets; the price and availability of raw materials; the cost and continued availability of borrowed funds; and cybersecurity breaches or business system disruptions.
ITEM 2. Unregistered Sales of Equity Securities and Use of Proceeds
a)Not applicable
b)Not applicable
c)The following table details our repurchases of shares of our common stock for the three months ended March 31, 2022:2023:
| | | | | | | | | | | | | | | | | | | | | | | |
| Period | Total Number of Shares Purchased | | Average Price Paid Per Share | | Total Number of Shares Purchased as Part of Publicly Announced Plans or Programs | | Maximum Approximate Dollar Value of Shares that May Yet be Purchased Under Plans or Programs ($ in Millions) |
| January 2022 | — | | | $ | — | | | — | | | $ | 23.8 | |
| February 2022 | — | | | $ | — | | | — | | | $ | 23.8 | |
| March 2022 | 1,482 | | | $ | 3.15 | | | — | | | $ | 23.8 | |
| Total | 1,482 | | | | | — | | | |
| | | | | | | | | | | | | | | | | | | | | | | |
| Period | Total Number of Shares Purchased | | Average Price Paid Per Share | | Total Number of Shares Purchased as Part of Publicly Announced Plans or Programs | | Maximum Approximate Dollar Value of Shares that May Yet be Purchased Under Plans or Programs ($ in Millions) |
| January 2023 | — | | | $ | — | | | — | | | $ | 6.2 | |
| February 2023 | — | | | $ | — | | | — | | | $ | 50.0 | |
| March 2023 | 3,378,677 | | | $ | 4.42 | | | 3,377,195 | | | $ | 35.1 | |
| Total | 3,378,677 | | | | | 3,377,195 | | | |
During the three months ended March 31, 2022, we purchased an aggregate of 1,482 shares surrendered in lieu of taxes under vesting of restricted shares.
In November 2018, ourOur Board of Directors authorized changes to oura $100.0 million securities repurchase program. These changes increased the authorized amount under the repurchase program to $100.0 million,in November 2018, available for repurchases of any combination of our common stock and our Convertible Notes thatunsecured convertible senior notes, which matured in December 2021. In February 2023, our Board of Directors approved certain changes to this program and increased the total authorization available to $50.0 million.
Our repurchase program remainsis available to purchase outstanding shares of our common stock in the open market or as otherwise determined by management, subject to certain limitations under the Amended ABL Facility and other factors. The repurchase program has no specific term. Repurchases are expected to be funded from operating cash flows, available cash on hand, and borrowings under our Amended ABL Facility. As part of the share repurchase program, our management has been authorized to establish trading plans under Rule 10b5-1 of the Securities Exchange Act of 1934. As of March 31, 2022,2023, we had $23.8$35.1 million remaining under the program.
There were no3.4 million shares of common stock repurchased under the repurchase program during the three months ended March 31, 2022.2023 for a cost of $14.9 million. In April 2023, we repurchased an additional 1.2 million shares of our common stock under the repurchase program for a cost of $5.0 million. As of May 2, 2023, we had $30.1 million remaining under the program.
During the three months ended March 31, 2023, we purchased an aggregate of 1,482 shares surrendered in lieu of taxes under vesting of restricted shares.
ITEM 3. Defaults Upon Senior Securities
None.
ITEM 4. Mine Safety Disclosures
The information concerning mine safety violations and other regulatory matters required by section 1503(a) of the Dodd-Frank Wall Street Reform and Consumer Protection Act and Item 104 of Regulation S-K is included in Exhibit 95.1 of this Quarterly Report on Form 10-Q, which is incorporated by reference.Not applicable.
ITEM 5. Other Information
On May 2, 2022, the Company and certain of its U.S. subsidiaries, as borrowers, entered into a Second Amended and Restated Credit Agreement (the “Credit Agreement”) with Bank of America, N.A., as administrative agent, swing line lender and a letter of credit issuer, and a group of lenders. The Credit Agreement amends and restates the Company’s prior credit agreement dated as of October 17, 2017, as amended, and provides for a senior secured revolving credit facility of up to $175 million (the “Amended ABL Facility”), subject to a borrowing base. The borrowers will have the ability to request the issuance of letters of credit in an aggregate amount of up to $15.0 million and borrow swing line loans in an aggregate principal amount of up to $17.5 million. Amounts borrowed under the Credit Agreement are required to be repaid no later than May 2, 2027.
Borrowing availability under the Amended ABL Facility is subject to a borrowing base, which is calculated based on eligible U.S. accounts receivable, inventory and composite mats included in the rental fleet, net of reserves and subject to limits on certain of the assets included in the borrowing base calculation. To the extent pledged by us, the borrowing base calculation also includes the amount of eligible pledged cash. The administrative agent may establish reserves, in part based on appraisals of the asset base, and other limits in its discretion, which could reduce the amounts otherwise available under the ABL Facility.
Proceeds of loans under the Amended ABL Facility may be used for the refinancing of existing indebtedness, for working capital and for other general corporate purposes. Subject to customary conditions, the aggregate commitments under the Amended ABL Facility may be increased from time to time at the Company’s request and with the consent of the participating lenders, so long as the aggregate amount of the commitments does not exceed $250 million. The borrowers’ obligations under the Amended ABL Facility are secured by a first priority lien on substantially all of the personal property and certain real property of the borrowers, including a first priority lien on certain equity interests of direct or indirect domestic subsidiaries of the borrowers and certain equity interests issued by certain foreign subsidiaries of the borrowers.
Amounts borrowed under the Amended ABL Facility bear interest, at the Company’s option, at either (1) the Bloomberg Short-Term Bank Yield Index (“BSBY”) rate (subject to a floor of zero) or (2) the base rate (subject to a floor of zero), equal to the highest of (a) the federal funds rate plus 0.50%, (b) the prime rate of Bank of America, N.A., and (c) BSBY for a one-month interest period plus 1.00%, plus, in each case, an applicable margin per annum. The applicable margin ranges from 1.50% to 2.00% per annum for BSBY borrowings, and 0.50% to 1.00% per annum for base rate borrowings, based on the consolidated leverage ratio (as defined in the Credit Agreement) as set forth in the most recent quarterly compliance certificate.
The Company is also required to pay a commitment fee equal to (i) 0.375% per annum at any time the average daily unused portion of the commitments is less than 50% and (ii) 0.25% per annum at any time the average daily unused portion of the commitments is greater than 50%.
The Credit Agreement contains customary representations, warranties and covenants that, among other things, and subject to certain specified circumstances and exceptions, restrict or limit the ability of the borrowers and certain of their subsidiaries to incur indebtedness (including guarantees), grant liens, make investments, pay dividends or distributions with respect to capital stock and make other restricted payments, make prepayments on certain indebtedness, engage in mergers or other fundamental changes, dispose of property, and change the nature of their business. In addition, the Credit Agreement contains certain affirmative covenants, including reporting requirements such as delivery of financial statements, borrowing base compliance and other certificates and notices of certain events, maintaining insurance, and providing additional guarantees and collateral in certain circumstances.
The Amended ABL Facility requires compliance with the following financial covenants: (i) a minimum fixed charge coverage ratio of 1.00 to 1.00 for the most recently completed four fiscal quarters and (ii) while a leverage covenant trigger period (as defined in the Amended ABL Facility) is in effect, a maximum consolidated leverage ratio of 4.00 to 1.00 as of the last day of the most recently completed fiscal quarter.
The Credit Agreement includes provisions permitting the Company to amend the Credit Agreement to establish specific metrics and performance targets with respect to certain environmental, social and governance targets of the Company and its subsidiaries and upon the effectiveness of any such amendment, those specific metrics and performance targets will be used, together with the pricing grid, to determine pricing under the Credit Agreement.
The Credit Agreement includes customary events of default including non-payment of principal, interest or fees, violation of covenants, inaccuracy of representations or warranties, cross-default to other material indebtedness, bankruptcy and insolvency events, invalidity or impairment of security interests or invalidity of loan documents, certain ERISA events, unsatisfied or unstayed judgments and change of control.
The foregoing summary of the Credit Agreement does not purport to be complete and is qualified in its entirety by reference to the complete text of the Credit Agreement, a copy of which is attached as Exhibit 10.3 to this quarterly report and incorporated herein by reference.
ITEM 6. Exhibits
The exhibits listed are filed as part of, or incorporated by reference into, this Quarterly Report on Form 10-Q.
| | | | | |
10.1 | |
10.2 | |
*10.3 | Second Amended and Restated Credit Agreement dated as of May 2, 2022 by and among Newpark Resources, Inc., Newpark Drilling Fluids LLC, Newpark Mats & Integrated Services LLC, ExcalibarMinerals LLC, Newpark Industrial Blending Solutions LLC, and Dura-Base Nevada, Inc., as borrowers, Bank of America, N.A., as the Administrative Agent, Swing Line Lender and an L/C Issuer, and the other Lenders party hereto |
| *31.1 | |
| *31.2 | |
| **32.1 | |
| **32.2 | |
*95.1 | |
| *101.INS | XBRL Instance Document - the instance document does not appear in the Interactive Data File because its XBRL tags are embedded within the Inline XBRL document |
| *101.SCH | Inline XBRL Schema Document |
| *101.CAL | Inline XBRL Calculation Linkbase Document |
| *101.DEF | Inline XBRL Definition Linkbase Document |
| *101.LAB | Inline XBRL Label Linkbase Document |
| *101.PRE | Inline XBRL Presentation Linkbase Document |
| *104 | Cover Page Interactive Data File (formatted as Inline XBRL and contained in Exhibit 101) |
* Filed herewith.
** Furnished herewith.
SIGNATURES
Pursuant to the requirements of the Securities Exchange Act of 1934, the registrant has duly caused this report to be signed on its behalf by the undersigned thereunto duly authorized.
Date: May 4, 20223, 2023
| | | | | |
| NEWPARK RESOURCES, INC. |
| (Registrant) |
| | |
| By: | /s/ Matthew S. Lanigan |
| | Matthew S. Lanigan
President and Chief Executive Officer
(Principal Executive Officer) |
| |
| | | | | |
| By: | /s/ Gregg S. Piontek |
| | Gregg S. Piontek
Senior Vice President and Chief Financial Officer
(Principal Financial Officer) |
| |
| | | | | |
| By: | /s/ Douglas L. White |
| | Douglas L. White
Vice President, Chief Accounting Officer and Treasurer
(Principal Accounting Officer) |