0000078003 pfe:InnovativeHealthBusinessMember pfe:RareDiseaseMember pfe:ReFactoAfXynthaMember pfe:InnovativeHealthSegmentMember 2016-01-01 2016-07-03
UNITED STATES
SECURITIES AND EXCHANGE COMMISSION
WASHINGTON, D.C. 20549
FORM 10-Q
X QUARTERLY REPORT PURSUANT TO SECTION 13 OR 15(d)
OF THE SECURITIES EXCHANGE ACT OF 1934
For the quarterly period ended July 3, 20162, 2017
OR
TRANSITION REPORT PURSUANT TO SECTION 13
OR 15(d) OF THE SECURITIES EXCHANGE ACT OF 1934
For the transition period from _______ to _______
COMMISSION FILE NUMBER 1-3619
----
PFIZER INC.INC.
(Exact name of registrant as specified in its charter)
|
| |
DELAWARE (State of Incorporation) | 13-5315170 (I.R.S. Employer Identification No.) |
235 East 42nd Street, New York, New York 10017
(Address of principal executive offices) (zip code)
(212) 733-2323
(Registrant’s telephone number)
Indicate by check mark whether the registrant (1) has filed all reports required to be filed by Section 13 or 15(d) of the Securities Exchange Act of 1934 during the preceding 12 months (or for such shorter period that the registrant was required to file such reports) and (2) has been subject to such filing requirements for the past 90 days.
Indicate by check mark whether the registrant has submitted electronically and posted on its corporate Web site, if any, every Interactive Data File required to be submitted and posted pursuant to Rule 405 of Regulation S-T (§232.405 of this chapter) during the preceding 12 months (or for such shorter period that the registrant was required to submit and post such files).
Indicate by check mark whether the registrant is a large accelerated filer, an accelerated filer, a non-accelerated filer, or a smaller reporting company, or an emerging growth company. See the definitions of “large accelerated filer,” “accelerated filer”filer,” “smaller reporting company,” and “smaller reporting“emerging growth company” in Rule 12b-2 of the Exchange Act (check one):
Large Accelerated filer X Accelerated filer ___ Non-accelerated filer ___ Smaller reporting company ___ Emerging growth company ___
If an emerging growth company, indicate by check mark if the registrant has elected not to use the extended transition period for complying with any new or revised financial accounting standards provided pursuant to Section 13(a) of the Exchange Act. ___
Indicate by check mark whether the registrant is a shell company (as defined in Rule 12b-2 of the Exchange Act).
At August 8, 2016, 6,065,652,4247, 2017, 5,947,349,054 shares of the issuer’s voting common stock were outstanding.
|
| |
| Page |
| | |
| |
| |
| | |
Condensed Consolidated Statements of Income for the three and six months ended July 2, 2017 and July 3, 2016 and June 28, 2015 | |
| | |
Condensed Consolidated Statements of Comprehensive Income for the three and six months ended July 2, 2017 and July 3, 2016 and June 28, 2015 | |
| | |
Condensed Consolidated Balance Sheets as of July 3, 20162, 2017 and December 31, 20152016 | |
| | |
Condensed Consolidated Statements of Cash Flows for the six months ended July 2, 2017 and July 3, 2016 and June 28, 2015 | |
| | |
| |
| | |
| |
| | |
| |
| |
| | |
| |
| |
| |
| |
| |
| |
| |
| |
| |
| |
| |
| |
| |
| |
| |
| |
| | |
| |
| |
| | |
| |
| |
| | |
| |
| |
| |
| |
| |
| | |
| |
| |
| |
| |
| |
| |
| |
| |
| |
| |
| |
| |
| |
| |
| |
| |
| |
| |
| |
GLOSSARY OF DEFINED TERMS
Unless the context requires otherwise, references to “Pfizer,” “the Company,” “we,” “us” or “our” in this Quarterly Report on Form 10-Q (defined below) refer to Pfizer Inc. and its subsidiaries. We also have used several other terms in this Quarterly Report on Form 10-Q, most of which are explained or defined below:
|
| |
20152016 Financial Report | Financial Report for the fiscal year ended December 31, 2015,2016, which was filed as Exhibit 13 to the Annual Report on Form 10-K for the fiscal year ended December 31, 20152016 |
20152016 Form 10-K | Annual Report on Form 10-K for the fiscal year ended December 31, 20152016 |
| AAV | Adeno-Associated Virus |
| ACA (Also referred to as U.S. Healthcare Legislation) | U.S. Patient Protection and Affordable Care Act, as amended by the Health Care and Education Reconciliation Act |
| ACIP | Advisory Committee on Immunization Practices |
| ALK | anaplastic lymphoma kinase |
| Allergan | Allergan plc |
| Alliance revenues | revenuesRevenues from alliance agreements under which we co-promote products discovered or developed by other companies |
AM-Pharma | AM-Pharma B.V. or us |
| Anacor | Anacor Pharmaceuticals, Inc. |
| Astellas | Astellas Pharma U.S., Inc. |
| ASU | Accounting Standards Update |
BaxterATM-AVI | Baxter Internationalaztreonam-avibactam |
| Bamboo | Bamboo Therapeutics, Inc. |
| BMS | Bristol-Myers Squibb Company |
| CDC | U.S. Centers for Disease Control and Prevention |
| Cellectis | Cellectis SA |
| Citibank | Citibank N.A. |
| Developed Markets | U.S., Western Europe, Japan, Canada, Australia, Scandinavia, South Korea, Scandinavian countries, Finland and New Zealand |
DOJ | U.S. Department of Justice |
DVT | deep vein thrombosis |
| EEA | European Economic Area |
| EH | Essential Health |
| EMA | European Medicines Agency |
| Emerging Markets | Includes, but is not limited to, the following markets: Asia (excluding Japan and South Korea), Latin America, Africa, Eastern Europe, Central Europe, the Middle East and Turkey |
EPA | U.S. Environmental Protection Agency |
| EPS | earnings per share |
| EU | European Union |
| EURIBOR | Euro Interbank Offered Rate |
| Exchange Act | Securities Exchange Act of 1934, as amended |
| FASB | Financial Accounting Standards Board |
| FDA | U.S. Food and Drug Administration |
| GAAP | Generally Accepted Accounting Principles |
GHD | growth hormone deficiency |
| GIST | gastrointestinal stromal tumors |
GEP | Global Established Pharmaceutical segment |
GIP | Global Innovative Pharmaceutical segment |
| GPD | Global Product Development organization |
GS&Co. | Goldman, Sachs & Co. |
| HER2- | human epidermal growth factor receptor 2-negative |
hGH-CTPHIS | human growth hormoneHospira Infusion Systems |
| Hisun | Zhejiang Hisun Pharmaceuticals Co., Ltd. |
| Hisun Pfizer | Hisun Pfizer Pharmaceuticals Company Limited |
| Hospira | Hospira, Inc. |
| HR+ | hormone receptor-positive |
| ICU Medical | ICU Medical, Inc. |
| IH | Innovative Health |
| IPR&D | in-process research and development |
IRC | Internal Revenue Code |
| IRS | U.S. Internal Revenue Service |
| IV | intravenous |
| Janssen | Janssen Biotech Inc. |
| King | King Pharmaceuticals, Inc. |
| LDL | low density lipoprotein |
| LIBOR | London Interbank Offered Rate |
| Lilly | Eli Lilly & Company |
| LOE | loss of exclusivity |
|
| |
| MCO | managed care organizationManaged Care Organization |
| MD&A | Management’s Discussion and Analysis of Financial Condition and Results of Operations |
MDVMedivation | multi-dose vialMedivation, Inc. |
| Merck | Merck & Co., Inc. |
| Meridian | Meridian Medical Technologies, Inc. |
| Moody’s | Moody’s Investors Service |
mRCC | metastatic renal cell carcinoma |
| NDA | new drug application |
NOAC | Novel Oral Anticoagulant |
| NovaQuest | NovaQuest Co-Investment Fund II, L.P. or NovaQuest Co-Investment Fund V, L.P., as applicable |
| NSCLC | non-small cell lung cancer |
| NYSE | New York Stock Exchange |
| OPKO | OPKO Health, Inc. |
| OTC | over-the-counter |
| PBM | Pharmacy Benefit Manager |
PDUFA | Prescription Drug User Fee Act |
PE | pulmonary embolism |
PGS | Pfizer Global Supply |
| Pharmacia | Pharmacia Corporation |
| PP&E | Property, plant & equipment |
| Quarterly Report on Form 10-Q | Quarterly Report on Form 10-Q for the quarterly period ended July 3, 2016 |
RAR | Revenue Agent’s Report2, 2017 |
| RCC | renal cell carcinoma |
recAP | recombinant human Alkaline Phosphatase |
| R&D | research and development |
| RPI | RPI Finance Trust |
| Sandoz | Sandoz, Inc., a division of Novartis AG |
| Sangamo | Sangamo Therapeutics, Inc. |
| SEC | U.S. Securities and Exchange Commission |
SGASFJ | small for gestational ageSFJ Pharmaceuticals Group |
| S&P | Standard and Poor’s |
| Teuto | Laboratório Teuto Brasileiro S.A. |
| U.K. | United Kingdom |
| U.S. | United States |
VATViiV | value added tax |
VOC | Global Vaccines, Oncology and ConsumerViiV Healthcare segmentLimited |
| WRD | Worldwide Research and Development |
| Zoetis | Zoetis Inc. |
PART I - FINANCIAL INFORMATION
Item 1. Financial Statements
PFIZER INC. AND SUBSIDIARY COMPANIES
CONDENSED CONSOLIDATED STATEMENTS OF INCOME
(UNAUDITED)
| | | | | Three Months Ended | | Six Months Ended | | Three Months Ended | | Six Months Ended |
| (MILLIONS, EXCEPT PER COMMON SHARE DATA) | | July 3,
2016 |
| | June 28,
2015 |
| | July 3,
2016 |
| | June 28,
2015 |
| | July 2,
2017 |
| | July 3,
2016 |
| | July 2,
2017 |
| | July 3,
2016 |
|
| Revenues | | $ | 13,147 |
| | $ | 11,853 |
| | $ | 26,152 |
| | $ | 22,717 |
| | $ | 12,896 |
| | $ | 13,147 |
| | $ | 25,675 |
| | $ | 26,152 |
|
| Costs and expenses: | | | | | | | | | | | | | | | | |
Cost of sales(a) | | 3,174 |
| | 2,180 |
| | 6,026 |
| | 4,018 |
| | 2,663 |
| | 3,174 |
| | 5,134 |
| | 6,026 |
|
Selling, informational and administrative expenses(a) | | 3,471 |
| | 3,386 |
| | 6,856 |
| | 6,491 |
| | 3,425 |
| | 3,471 |
| | 6,733 |
| | 6,856 |
|
Research and development expenses(a) | | 1,748 |
| | 1,734 |
| | 3,478 |
| | 3,620 |
| | 1,780 |
| | 1,748 |
| | 3,487 |
| | 3,478 |
|
| Amortization of intangible assets | | 961 |
| | 872 |
| | 1,966 |
| | 1,811 |
| | 1,208 |
| | 961 |
| | 2,394 |
| | 1,966 |
|
| Restructuring charges and certain acquisition-related costs | | 316 |
| | 86 |
| | 457 |
| | 146 |
| | 70 |
| | 316 |
| | 228 |
| | 457 |
|
| Other (income)/deductions––net | | 1,068 |
| | 55 |
| | 1,398 |
| | 9 |
| | (66 | ) | | 1,068 |
| | (68 | ) | | 1,398 |
|
| Income from continuing operations before provision for taxes on income | | 2,410 |
| | 3,539 |
| | 5,971 |
| | 6,621 |
| | 3,815 |
| | 2,410 |
| | 7,767 |
| | 5,971 |
|
Provision for taxes on income | | 375 |
| | 905 |
| | 910 |
| | 1,610 |
| | 739 |
| | 347 |
| | 1,560 |
| | 861 |
|
Income from continuing operations | | 2,035 |
| | 2,635 |
| | 5,060 |
| | 5,011 |
| | 3,077 |
| | 2,062 |
| | 6,207 |
| | 5,110 |
|
| Discontinued operations––net of tax | | 1 |
| | 1 |
| | 1 |
| | 6 |
| | 2 |
| | 1 |
| | 1 |
| | 1 |
|
Net income before allocation to noncontrolling interests | | 2,035 |
| | 2,635 |
| | 5,061 |
| | 5,017 |
| | 3,078 |
| | 2,063 |
| | 6,208 |
| | 5,111 |
|
| Less: Net income attributable to noncontrolling interests | | 16 |
| | 9 |
| | 25 |
| | 14 |
| | 5 |
| | 16 |
| | 14 |
| | 25 |
|
Net income attributable to Pfizer Inc. | | $ | 2,019 |
| | $ | 2,626 |
| | $ | 5,036 |
| | $ | 5,002 |
| | $ | 3,073 |
| | $ | 2,047 |
| | $ | 6,194 |
| | $ | 5,085 |
|
| | | | | | | | | | | | | | | | | |
Earnings per common share––basic: | | |
| | |
| | |
| | |
| |
Earnings per common share––basic(b): | | | |
| | |
| | |
| | |
|
| Income from continuing operations attributable to Pfizer Inc. common shareholders | | $ | 0.33 |
| | $ | 0.43 |
| | $ | 0.82 |
| | $ | 0.81 |
| | $ | 0.52 |
| | $ | 0.34 |
| | $ | 1.04 |
| | $ | 0.83 |
|
| Discontinued operations––net of tax | | — |
| | — |
| | — |
| | — |
| | — |
| | — |
| | — |
| | — |
|
| Net income attributable to Pfizer Inc. common shareholders | | $ | 0.33 |
| | $ | 0.43 |
| | $ | 0.82 |
| | $ | 0.81 |
| | $ | 0.52 |
| | $ | 0.34 |
| | $ | 1.04 |
| | $ | 0.83 |
|
| | | | | | | | | | | | | | | | | |
Earnings per common share––diluted: | | |
| | |
| | |
| | |
| |
Earnings per common share––diluted(b): | | | |
| | |
| | |
| | |
|
| Income from continuing operations attributable to Pfizer Inc. common shareholders | | $ | 0.33 |
| | $ | 0.42 |
| | $ | 0.82 |
| | $ | 0.80 |
| | $ | 0.51 |
| | $ | 0.33 |
| | $ | 1.02 |
| | $ | 0.82 |
|
| Discontinued operations––net of tax | | — |
| | — |
| | — |
| | — |
| | — |
| | — |
| | — |
| | — |
|
| Net income attributable to Pfizer Inc. common shareholders | | $ | 0.33 |
| | $ | 0.42 |
| | $ | 0.82 |
| | $ | 0.80 |
| | $ | 0.51 |
| | $ | 0.33 |
| | $ | 1.02 |
| | $ | 0.82 |
|
| | | | | | | | | | | | | | | | | |
| Weighted-average shares––basic | | 6,068 |
| | 6,159 |
| | 6,110 |
| | 6,181 |
| | 5,958 |
| | 6,068 |
| | 5,982 |
| | 6,110 |
|
| Weighted-average shares––diluted | | 6,137 |
| | 6,243 |
| | 6,176 |
| | 6,267 |
| | 6,037 |
| | 6,149 |
| | 6,065 |
| | 6,188 |
|
| Cash dividends paid per common share | | $ | 0.30 |
| | $ | 0.28 |
| | $ | 0.60 |
| | $ | 0.56 |
| | $ | 0.32 |
| | $ | 0.30 |
| | $ | 0.64 |
| | $ | 0.60 |
|
| |
(a) | Excludes amortization of intangible assets, except as disclosed in Note 9A. Identifiable Intangible Assets and Goodwill:Identifiable Intangible Assets. |
| |
(b) | Amounts for the three and six months ended July 3, 2016 have been revised from previously reported amounts to reflect the adoption of a new accounting standard in the fourth quarter of 2016, as of January 1, 2016. For additional information, see Note 1B. Basis of Presentation and Significant Accounting Policies––Adoption of New Accounting Standards. |
Amounts may not add due to rounding.
See Notes to Condensed Consolidated Financial Statements.
PFIZER INC. AND SUBSIDIARY COMPANIES
CONDENSED CONSOLIDATED STATEMENTS OF COMPREHENSIVE INCOME
(UNAUDITED)
|
| | | | | | | | | | | | | | | | |
| | | Three Months Ended | | Six Months Ended |
| (MILLIONS OF DOLLARS) | | July 2,
2017 |
| | July 3,
2016 |
| | July 2,
2017 |
| | July 3,
2016 |
|
| Net income before allocation to noncontrolling interests | | $ | 3,078 |
| | $ | 2,063 |
| | $ | 6,208 |
| | $ | 5,111 |
|
| | | | | | | |
| | |
|
| Foreign currency translation adjustments, net | | 247 |
| | 515 |
| | 474 |
| | 581 |
|
Reclassification adjustments(a) | | 111 |
| | — |
| | 112 |
| | — |
|
| | | 358 |
| | 515 |
| | 586 |
| | 581 |
|
| Unrealized holding losses on derivative financial instruments, net | | (90 | ) | | (571 | ) | | (99 | ) | | (845 | ) |
Reclassification adjustments for realized (gains)/losses(b) | | (208 | ) | | 469 |
| | (449 | ) | | 130 |
|
| | | (297 | ) | | (102 | ) | | (548 | ) | | (714 | ) |
| Unrealized holding gains on available-for-sale securities, net | | 164 |
| | 350 |
| | 314 |
| | 479 |
|
Reclassification adjustments for realized (gains)/losses(b) | | (40 | ) | | (226 | ) | | 97 |
| | (16 | ) |
| | | 124 |
| | 124 |
| | 412 |
| | 463 |
|
| Benefit plans: actuarial gains/(losses), net | | 61 |
| | (19 | ) | | 62 |
| | (19 | ) |
Reclassification adjustments related to amortization(c) | | 145 |
| | 139 |
| | 308 |
| | 278 |
|
Reclassification adjustments related to settlements, net(c) | | (1 | ) | | 22 |
| | 51 |
| | 48 |
|
| Other | | (80 | ) | | (57 | ) | | (35 | ) | | (18 | ) |
| | | 124 |
| | 85 |
| | 385 |
| | 288 |
|
| Benefit plans: prior service (costs)/credits and other, net | | (2 | ) | | 87 |
| | (2 | ) | | 87 |
|
Reclassification adjustments related to amortization(c) | | (46 | ) | | (41 | ) | | (91 | ) | | (81 | ) |
Reclassification adjustments related to curtailments, net(c) | | (4 | ) | | — |
| | (11 | ) | | (6 | ) |
| Other | | — |
| | 1 |
| | 1 |
| | 6 |
|
| | | (52 | ) | | 48 |
| | (104 | ) | | 6 |
|
| Other comprehensive income, before tax | | 258 |
| | 669 |
| | 732 |
| | 624 |
|
Tax provision/(benefit) on other comprehensive income(d) | | (163 | ) | | 36 |
| | (138 | ) | | (5 | ) |
| Other comprehensive income before allocation to noncontrolling interests | | $ | 421 |
| | $ | 633 |
| | $ | 870 |
| | $ | 629 |
|
| | | | | | | | | |
| Comprehensive income before allocation to noncontrolling interests | | $ | 3,499 |
| | $ | 2,696 |
| | $ | 7,078 |
| | $ | 5,740 |
|
| Less: Comprehensive income attributable to noncontrolling interests | | 13 |
| | 21 |
| | 29 |
| | 24 |
|
| Comprehensive income attributable to Pfizer Inc. | | $ | 3,486 |
| | $ | 2,676 |
| | $ | 7,049 |
| | $ | 5,715 |
|
|
| | | | | | | | | | | | | | | | |
| | | Three Months Ended | | Six Months Ended |
| (MILLIONS OF DOLLARS) | | July 3,
2016 |
| | June 28,
2015 |
| | July 3,
2016 |
| | June 28,
2015 |
|
| Net income before allocation to noncontrolling interests | | $ | 2,035 |
| | $ | 2,635 |
| | $ | 5,061 |
| | $ | 5,017 |
|
| | | | | | | |
| | |
|
| Foreign currency translation adjustments, net | | 514 |
| | (327 | ) | | 581 |
| | (1,635 | ) |
| | | 514 |
| | (327 | ) | | 581 |
| | (1,635 | ) |
| Unrealized holding gains/(losses) on derivative financial instruments, net | | (571 | ) | | 452 |
| | (845 | ) | | 137 |
|
Reclassification adjustments for realized (gains)/losses(a) | | 469 |
| | (743 | ) | | 130 |
| | (510 | ) |
| | | (102 | ) | | (291 | ) | | (714 | ) | | (373 | ) |
| Unrealized holding gains/(losses) on available-for-sale securities, net | | 350 |
| | (200 | ) | | 479 |
| | (527 | ) |
Reclassification adjustments for realized (gains)/losses(a) | | (226 | ) | | 498 |
| | (16 | ) | | 745 |
|
| | | 124 |
| | 299 |
| | 463 |
| | 218 |
|
| Benefit plans: actuarial gains/(losses), net | | (19 | ) | | (9 | ) | | (19 | ) | | 22 |
|
Reclassification adjustments related to amortization(b) | | 139 |
| | 134 |
| | 278 |
| | 269 |
|
Reclassification adjustments related to settlements, net(b) | | 22 |
| | 22 |
| | 48 |
| | 62 |
|
| Other | | (57 | ) | | (29 | ) | | (18 | ) | | 130 |
|
| | | 85 |
| | 118 |
| | 288 |
| | 483 |
|
| Benefit plans: prior service credits and other, net | | 87 |
| | 507 |
| | 87 |
| | 506 |
|
Reclassification adjustments related to amortization(b) | | (41 | ) | | (34 | ) | | (81 | ) | | (69 | ) |
Reclassification adjustments related to curtailments, net(b) | | — |
| | (7 | ) | | (6 | ) | | (17 | ) |
| Other | | 1 |
| | (2 | ) | | 6 |
| | (2 | ) |
| | | 48 |
| | 464 |
| | 6 |
| | 418 |
|
| Other comprehensive income/(loss), before tax | | 669 |
| | 263 |
| | 624 |
| | (890 | ) |
Tax provision/(benefit) on other comprehensive income/(loss)(c) | | 36 |
| | 228 |
| | (5 | ) | | 332 |
|
| Other comprehensive income/(loss) before allocation to noncontrolling interests | | $ | 633 |
| | $ | 35 |
| | $ | 629 |
| | $ | (1,222 | ) |
| | | | | | | | | |
| Comprehensive income before allocation to noncontrolling interests | | $ | 2,668 |
| | $ | 2,670 |
| | $ | 5,690 |
| | $ | 3,795 |
|
| Less: Comprehensive income/(loss) attributable to noncontrolling interests | | 21 |
| | 8 |
| | 24 |
| | (3 | ) |
| Comprehensive income attributable to Pfizer Inc. | | $ | 2,647 |
| | $ | 2,663 |
| | $ | 5,666 |
| | $ | 3,797 |
|
| |
(a) | ReclassifiedThe foreign currency translation adjustments reclassified into Other (income)/deductions—net in the condensed consolidated statements of income.income primarily result from the agreement to sell our 40% ownership investment in Teuto. See Note 2D. Acquisitions, Sale of Hospira Infusion Systems Net Assets, Collaborative Arrangement and Equity-Method Investments: Equity-Method Investments.
|
| |
(b) | Reclassified into Other (income)/deductions—net and Cost of sales in the condensed consolidated statements of income. |
| |
(c) | Generally reclassified, as part of net periodic pension cost, into Cost of sales, Selling, informational and administrative expenses, and/or Research and development expenses, as appropriate, in the condensed consolidated statements of income. For additional information, see Note 10. Pension and Postretirement Benefit Plans. |
| |
(c)(d)
| See Note 5C. Tax Matters: Tax Provision/(Benefit) on Other Comprehensive Income/(Loss).Income. |
Amounts may not add due to rounding.
See Notes to Condensed Consolidated Financial Statements.
PFIZER INC. AND SUBSIDIARY COMPANIES
CONDENSED CONSOLIDATED BALANCE SHEETS
| | | (MILLIONS OF DOLLARS) | | July 3,
2016 |
| | December 31,
2015 |
| | July 2,
2017 |
| | December 31,
2016 |
|
| | | (Unaudited) | | | | (Unaudited) | | |
| Assets | | | | | | | | |
| Cash and cash equivalents | | $ | 3,411 |
| | $ | 3,641 |
| | $ | 2,585 |
| | $ | 2,595 |
|
| Short-term investments | | 17,531 |
| | 19,649 |
| | 11,748 |
| | 15,255 |
|
| Trade accounts receivable, less allowance for doubtful accounts: 2016—$670; 2015—$384 | | 9,138 |
| | 8,176 |
| |
| Trade accounts receivable, less allowance for doubtful accounts: 2017—$579; 2016—$609 | | | 9,476 |
| | 8,225 |
|
| Inventories | | 7,614 |
| | 7,513 |
| | 7,584 |
| | 6,783 |
|
| Current tax assets | | 3,127 |
| | 2,662 |
| | 3,113 |
| | 3,041 |
|
| Other current assets | | 3,023 |
| | 2,163 |
| | 1,877 |
| | 2,249 |
|
| Assets held for sale | | | 3 |
| | 801 |
|
| Total current assets | | 43,845 |
| | 43,804 |
| | 36,385 |
| | 38,949 |
|
| Long-term investments | | 13,124 |
| | 15,999 |
| | 7,008 |
| | 7,116 |
|
| Property, plant and equipment, less accumulated depreciation: 2016—$14,637; 2015—$13,502 | | 13,609 |
| | 13,766 |
| |
| Property, plant and equipment, less accumulated depreciation: 2017—$15,506; 2016—$14,807 | | | 13,386 |
| | 13,318 |
|
| Identifiable intangible assets, less accumulated amortization | | 43,056 |
| | 40,356 |
| | 51,348 |
| | 52,648 |
|
| Goodwill | | 50,600 |
| | 48,242 |
| | 55,014 |
| | 54,449 |
|
| Noncurrent deferred tax assets and other noncurrent tax assets | | 1,805 |
| | 1,794 |
| | 1,952 |
| | 1,812 |
|
| Other noncurrent assets | | 4,618 |
| | 3,420 |
| | 3,466 |
| | 3,323 |
|
| Total assets | | $ | 170,658 |
| | $ | 167,381 |
| | $ | 168,558 |
| | $ | 171,615 |
|
| | | | | | | | | |
| Liabilities and Equity | | |
| | |
| | |
| | |
|
| Short-term borrowings, including current portion of long-term debt | | $ | 13,724 |
| | $ | 10,159 |
| |
| Short-term borrowings, including current portion of long-term debt: 2017—$3,072; 2016—$4,225 | | | $ | 9,514 |
| | $ | 10,688 |
|
| Trade accounts payable | | 3,261 |
| | 3,620 |
| | 3,439 |
| | 4,536 |
|
| Dividends payable | | 1,820 |
| | 1,852 |
| | 1,904 |
| | 1,944 |
|
| Income taxes payable | | 647 |
| | 418 |
| | 552 |
| | 437 |
|
| Accrued compensation and related items | | 1,594 |
| | 2,359 |
| | 1,625 |
| | 2,487 |
|
| Other current liabilities | | 11,053 |
| | 10,990 |
| | 10,148 |
| | 11,023 |
|
| Total current liabilities | | 32,099 |
| | 29,399 |
| | 27,182 |
| | 31,115 |
|
| | | | | | | | | |
| Long-term debt | | 30,457 |
| | 28,740 |
| | 34,191 |
| | 31,398 |
|
| Pension benefit obligations, net | | 5,224 |
| | 6,310 |
| | 5,371 |
| | 6,406 |
|
| Postretirement benefit obligations, net | | 1,877 |
| | 1,809 |
| | 1,705 |
| | 1,766 |
|
| Noncurrent deferred tax liabilities | | 28,300 |
| | 26,877 |
| | 30,879 |
| | 30,753 |
|
| Other taxes payable | | 4,116 |
| | 3,992 |
| | 4,096 |
| | 4,000 |
|
| Other noncurrent liabilities | | 5,518 |
| | 5,257 |
| | 6,440 |
| | 6,337 |
|
| Total liabilities | | 107,592 |
| | 102,384 |
| | 109,863 |
| | 111,776 |
|
| | | | | | | | | |
| Commitments and Contingencies | |
|
| |
|
| |
|
| |
|
|
| | | | | | | | | |
| Preferred stock | | 25 |
| | 26 |
| | 23 |
| | 24 |
|
| Common stock | | 461 |
| | 459 |
| | 463 |
| | 461 |
|
| Additional paid-in capital | | 82,138 |
| | 81,016 |
| | 83,373 |
| | 82,685 |
|
| Treasury stock | | (84,313 | ) | | (79,252 | ) | | (89,416 | ) | | (84,364 | ) |
| Retained earnings | | 73,350 |
| | 71,993 |
| | 74,107 |
| | 71,774 |
|
| Accumulated other comprehensive loss | | (8,891 | ) | | (9,522 | ) | | (10,181 | ) | | (11,036 | ) |
| Total Pfizer Inc. shareholders’ equity | | 62,769 |
| | 64,720 |
| | 58,368 |
| | 59,544 |
|
| Equity attributable to noncontrolling interests | | 297 |
| | 278 |
| | 326 |
| | 296 |
|
| Total equity | | 63,066 |
| | 64,998 |
| | 58,694 |
| | 59,840 |
|
| Total liabilities and equity | | $ | 170,658 |
| | $ | 167,381 |
| | $ | 168,558 |
| | $ | 171,615 |
|
Amounts may not add due to rounding.
See Notes to Condensed Consolidated Financial Statements.
PFIZER INC. AND SUBSIDIARY COMPANIES
CONDENSED CONSOLIDATED STATEMENTS OF CASH FLOWS
(UNAUDITED) |
| | | | | | | | |
| | | Six Months Ended |
| (MILLIONS OF DOLLARS) | | July 2,
2017 |
| | July 3,
2016 |
|
| Operating Activities | | | | |
| Net income before allocation to noncontrolling interests | | $ | 6,208 |
| | $ | 5,111 |
|
| Adjustments to reconcile net income before allocation to noncontrolling interests to net cash provided by operating activities: | | |
| | |
|
| Depreciation and amortization | | 3,129 |
| | 2,812 |
|
| Asset write-offs and impairments | | 97 |
| | 983 |
|
| Loss on sale of HIS net assets | | 64 |
| | — |
|
| Deferred taxes from continuing operations | | 320 |
| | (10 | ) |
| Share-based compensation expense | | 388 |
| | 387 |
|
| Benefit plan contributions in excess of expense | | (1,079 | ) | | (857 | ) |
| Other adjustments, net | | (433 | ) | | 170 |
|
Other changes in assets and liabilities, net of acquisitions and divestitures(a) | | (3,853 | ) | | (3,182 | ) |
| Net cash provided by operating activities | | 4,841 |
| | 5,414 |
|
| | | | | |
| Investing Activities | | |
| | |
|
| Purchases of property, plant and equipment | | (806 | ) | | (702 | ) |
| Purchases of short-term investments | | (2,394 | ) | | (8,744 | ) |
| Proceeds from redemptions/sales of short-term investments | | 3,520 |
| | 14,757 |
|
| Net (purchases of)/proceeds from redemptions/sales of short-term investments with original maturities of three months or less | | 3,424 |
| | (249 | ) |
| Purchases of long-term investments | | (1,663 | ) | | (3,126 | ) |
| Proceeds from redemptions/sales of long-term investments | | 1,539 |
| | 2,427 |
|
| Acquisitions of businesses, net of cash acquired | | (1,000 | ) | | (4,616 | ) |
| Acquisitions of intangible assets | | (41 | ) | | (96 | ) |
| Other investing activities, net | | 455 |
| | 26 |
|
| Net cash provided by/(used in) investing activities | | 3,034 |
| | (323 | ) |
| | | | | |
| Financing Activities | | |
| | |
|
| Proceeds from short-term borrowings | | 4,799 |
| | 2,307 |
|
| Principal payments on short-term borrowings | | (5,110 | ) | | (2,291 | ) |
| Net proceeds from short-term borrowings with original maturities of three months or less | | 261 |
| | 2,182 |
|
| Proceeds from issuance of long-term debt | | 5,273 |
| | 5,031 |
|
| Principal payments on long-term debt | | (4,473 | ) | | (4,317 | ) |
| Purchases of common stock | | (5,000 | ) | | (5,000 | ) |
| Cash dividends paid | | (3,855 | ) | | (3,675 | ) |
| Proceeds from exercise of stock options | | 411 |
| | 696 |
|
Other financing activities, net(a) | | (228 | ) | | (186 | ) |
| Net cash used in financing activities | | (7,922 | ) | | (5,253 | ) |
| Effect of exchange-rate changes on cash and cash equivalents | | 37 |
| | (68 | ) |
| Net decrease in cash and cash equivalents | | (10 | ) | | (230 | ) |
| Cash and cash equivalents, beginning | | 2,595 |
| | 3,641 |
|
| Cash and cash equivalents, end | | $ | 2,585 |
| | $ | 3,411 |
|
| | | |
| | |
|
| Supplemental Cash Flow Information | | | | |
| Non-cash transactions: | | | | |
Receipt of ICU Medical common stock(b) | | $ | 428 |
| | $ | — |
|
Promissory note from ICU Medical(b) | | 75 |
| | — |
|
| Cash paid (received) during the period for: | | |
| | |
|
| Income taxes | | $ | 1,121 |
| | $ | 1,111 |
|
| Interest | | 881 |
| | 903 |
|
| Interest rate hedges | | (226 | ) | | (306 | ) |
| |
(a) | Amounts for the three and six months ended July 3, 2016 have been revised from previously reported amounts to reflect the adoption of a new accounting standard in the fourth quarter of 2016, as of January 1, 2016. For additional information, see Note 1B. Basis of Presentation and Significant Accounting Policies: Adoption of New Accounting Standards. |
| |
(b) | In connection with the sale of HIS net assets to ICU Medical, on February 3, 2017, Pfizer received 3.2 million newly issued shares of ICU Medical common stock valued at $428 million and a promissory note in the amount of $75 million. For additional information, see Note 2B. Acquisitions, Sale of Hospira Infusion Systems Net Assets, Collaborative Arrangement and Equity-Method Investments: Sale of Hospira Infusion Systems Net Assets. |
|
| | | | | | | | |
| | | Six Months Ended |
| (MILLIONS OF DOLLARS) | | July 3,
2016 |
| | June 28,
2015 |
|
| Operating Activities | | | | |
| Net income before allocation to noncontrolling interests | | $ | 5,061 |
| | $ | 5,017 |
|
| Adjustments to reconcile net income before allocation to noncontrolling interests to net cash provided by operating activities: | | |
| | |
|
| Depreciation and amortization | | 2,812 |
| | 2,461 |
|
| Asset write-offs and impairments | | 983 |
| | 42 |
|
| Deferred taxes from continuing operations | | (10 | ) | | (183 | ) |
| Share-based compensation expense | | 387 |
| | 347 |
|
| Benefit plan contributions in excess of expense | | (857 | ) | | (842 | ) |
| Other adjustments, net | | 170 |
| | (194 | ) |
| Other changes in assets and liabilities, net of acquisitions and divestitures | | (3,316 | ) | | (1,879 | ) |
| Net cash provided by operating activities | | 5,230 |
| | 4,770 |
|
| | | | | |
| Investing Activities | | |
| | |
|
| Purchases of property, plant and equipment | | (702 | ) | | (497 | ) |
| Purchases of short-term investments | | (8,744 | ) | | (16,029 | ) |
| Proceeds from redemptions/sales of short-term investments | | 14,757 |
| | 20,483 |
|
| Net (purchases of)/proceeds from redemptions/sales of short-term investments with original maturities of three months or less | | (249 | ) | | 3,020 |
|
| Purchases of long-term investments | | (3,126 | ) | | (5,422 | ) |
| Proceeds from redemptions/sales of long-term investments | | 2,427 |
| | 3,291 |
|
| Acquisitions of businesses, net of cash acquired | | (4,616 | ) | | (679 | ) |
| Acquisitions of intangible assets | | (96 | ) | | (12 | ) |
| Other investing activities, net | | 26 |
| | 333 |
|
| Net cash (used in)/provided by investing activities | | (323 | ) | | 4,487 |
|
| | | | | |
| Financing Activities | | |
| | |
|
| Proceeds from short-term borrowings | | 2,307 |
| | 2,022 |
|
| Principal payments on short-term borrowings | | (2,291 | ) | | (11 | ) |
| Net proceeds from short-term borrowings with original maturities of three months or less | | 2,182 |
| | 481 |
|
| Proceeds from issuance of long-term debt | | 5,031 |
| | — |
|
| Principal payments on long-term debt | | (4,317 | ) | | (2,995 | ) |
| Purchases of common stock | | (5,000 | ) | | (6,000 | ) |
| Cash dividends paid | | (3,675 | ) | | (3,483 | ) |
| Proceeds from exercise of stock options | | 696 |
| | 981 |
|
| Other financing activities, net | | (2 | ) | | 154 |
|
| Net cash used in financing activities | | (5,069 | ) | | (8,852 | ) |
| Effect of exchange-rate changes on cash and cash equivalents | | (68 | ) | | (78 | ) |
| Net increase/(decrease) in cash and cash equivalents | | (230 | ) | | 327 |
|
| Cash and cash equivalents, beginning | | 3,641 |
| | 3,343 |
|
| Cash and cash equivalents, end | | $ | 3,411 |
| | $ | 3,670 |
|
| | | |
| | |
|
| Supplemental Cash Flow Information | | | | |
| Cash paid during the period for: | | |
| | |
|
| Income taxes | | $ | 1,111 |
| | $ | 1,124 |
|
| Interest | | 903 |
| | 914 |
|
Amounts may not add due to rounding.
See Notes to Condensed Consolidated Financial Statements.
PFIZER INC. AND SUBSIDIARY COMPANIES
NOTES TO CONDENSED CONSOLIDATED FINANCIAL STATEMENTS
(UNAUDITED)
Note 1. Basis of Presentation and Significant Accounting Policies
A. Basis of Presentation
See the Glossary of Defined Terms at the beginning of this Quarterly Report on Form 10-Q for terms used throughout the condensed consolidated financial statements and related notes of this Quarterly Report on Form 10-Q.
We prepared the condensed consolidated financial statements following the requirements of the SEC for interim reporting. As permitted under those rules, certain footnotes or other financial information that are normally required by U.S. GAAP can be condensed or omitted.
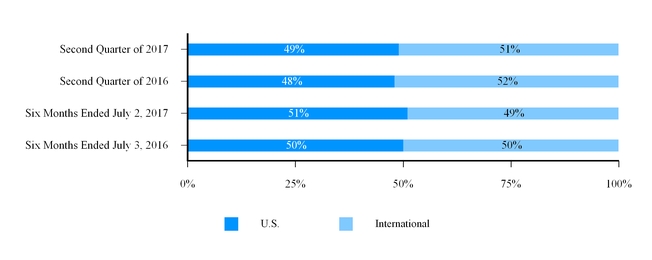
The financial information included in our condensed consolidated financial statements for subsidiaries operating outside the U.S. is as of and for the three and six months ended May 29, 201628, 2017 and May 24, 2015.29, 2016. The financial information included in our condensed consolidated financial statements for U.S. subsidiaries is as of and for the three and six months ended July 2, 2017 and July 3, 2016 and June 28, 2015..
Revenues, expenses, assets and liabilities can vary during each quarter of the year. Therefore, the results and trends in these interim financial statements may not be representative of those for the full year.
We are responsible for the unaudited financial statements included in this Quarterly Report on Form 10-Q. The interim financial statements include all normal and recurring adjustments that are considered necessary for the fair presentationstatement of our condensed consolidated balance sheets and condensed consolidated statements of income. The information included in this Quarterly Report on Form 10-Q should be read in conjunction with the consolidated financial statements and accompanying notes included in our 20152016 Form 10-K.
UnlessWe manage our commercial operations through two distinct business segments: Pfizer Innovative Health (IH) and Pfizer Essential Health (EH). Beginning in the context requires otherwise, referencessecond quarter of 2016, we reorganized our operating segments to “Pfizer,” “the Company,” “we,” “us” or “our” reflect that we manage our innovative pharmaceutical and consumer healthcare operations as one business segment, IH. For additional information, see Note 13 and Notes to Consolidated Financial Statements––Note 18. Segment, Geographic and Other Revenue Information in this Quarterly Report on Form 10-Q refer to Pfizer Inc. and its subsidiaries.Pfizer’s 2016 Financial Report.
Certain amounts in the condensed consolidated financial statements and associated notes may not add due to rounding. All percentages have been calculated using unrounded amounts.
Effective in the second quarter of 2016, our segments were reorganized to reflect that we now manage our innovative pharmaceutical and consumer healthcare operations as oneOur recent significant business segment, Pfizer Innovative Health (IH) (previously these businesses were managed as two segments: the GIP segment and the VOC segment). Also, in the second quarter of 2016, we changed the name of our Established Products business to Pfizer Essential Health (EH). We have revised prior-period segment information to reflect the reorganization. For additional information, see Note 13.development activities include:
In the condensed consolidated balance sheet as of December 31, 2015, we performed certain reclassifications to conform to the current period presentation of Other current assets, Other noncurrent assets, Short-term borrowings, including current portion of long-term debt and Long-term debt, and in the condensed consolidated statement of cash flows for the six months ended June 28, 2015, we performed certain reclassifications to conform to the current presentation of Proceeds from short-term borrowings for debt issuance costs in accordance with the adoption of a new accounting standard (for additional information, see Note 1B).
On June 24, 2016 (the acquisition date), we completed our acquisition of Anacor for $99.25 per share. The total fair value of consideration transferred for Anacor was approximately $4.9 billion in cash ($4.5 billion, net of cash acquired), plus $698 million debt assumed. Commencing from the acquisition date, our financial statements reflect the assets, liabilities and cash flows of Anacor. The operating results for Anacor for five days from June 24, 2016 to July 3, 2016 were immaterial. See Note 2A for additional information.
On April 6, 2016, we announced that the merger agreement between Pfizer and Allergan entered into on November 22, 2015 was terminated by mutual agreement of the companies. The decision was driven by the actions announced by the U.S. Department of Treasury on April 4, 2016, which the companies concluded qualified as an “Adverse Tax Law Change” under the merger agreement. In connection with the termination of the merger agreement, on April 8, 2016 (which falls into Pfizer’s second fiscal quarter), Pfizer paid Allergan $150 million (pre-tax) for reimbursement of Allergan’s expenses associated with the terminated transaction (see Note 4). Pfizer and Allergan also released each other from any and all claims in connection with the merger agreement.
| |
| • | On February 3, 2017, we completed the sale of our global infusion therapy net assets, HIS, to ICU Medical. The operating results of HIS are included in the condensed consolidated statement of income and EH’s operating results through February 2, 2017 and, therefore, our financial results, and EH’s operating results, for the second quarter of 2017 do not reflect any contribution from HIS global operations, while our financial results, and EH’s operating results, for the second quarter of 2016 reflect three months of HIS global operations. Our financial results, and EH’s operating results, for the first six months of 2017 reflect approximately one month of HIS domestic operations and approximately two months of HIS international operations, while our financial results, and EH’s operating results, for the first six months of2016 reflect six months of HIS global operations. Assets and liabilities associated with HIS are presented as held for sale in the condensed consolidated balance sheet as of December 31, 2016. The HIS assets held for sale are reported in Assets held for sale and HIS liabilities held for sale are reported in Other current liabilities. |
| |
| • | On December 22, 2016, which falls in the first fiscal quarter of 2017 for our international operations, we acquired the development and commercialization rights to AstraZeneca’s small molecule anti-infectives business, primarily outside the U.S. Commencing from the acquisition date, our financial statements reflect the assets, liabilities, operating results and cash flows of this business, and, in accordance with our international reporting period, our financial results, and EH’s operating results, for the second quarter and first six months of 2017 reflect approximately three months and five months, respectively, of the small molecule anti-infectives business acquired from AstraZeneca. |
| |
| • | On September 28, 2016, we acquired Medivation for $81.50 per share. Commencing from the acquisition date, our financial statements reflect the assets, liabilities, operating results and cash flows of Medivation. Therefore, Medivation operations are reflected in our financial results, IH’s operating results, and cash flows for the second quarter and first six months of 2017, but not for the second quarter and first six months of 2016. |
PFIZER INC. AND SUBSIDIARY COMPANIES
NOTES TO CONDENSED CONSOLIDATED FINANCIAL STATEMENTS
(UNAUDITED)
| |
| • | On June 24, 2016, we acquired Anacor for $99.25 per share. Commencing from the acquisition date, our financial statements reflect the assets, liabilities, operating results and cash flows of Anacor. Therefore, Anacor operations are reflected in our financial results, IH’s operating results, and cash flows for the second quarter and first six months of 2017, but for only five days in the second quarter and first six months of 2016. |
On September 3, 2015, we completed our acquisitionFor additional information, see Note 2 and Notes to Consolidated Financial Statements––Note 2. Acquisitions, Sale of Hospira Infusion Systems Net Assets, Collaborative Arrangement and commencing from the acquisition date, our financial statements reflect the assets, liabilities, operating results and cash flows of Hospira. As a result, legacy Hospira operations are reflected Equity-Method Investments in our results of operations, EH’s operating results, and cash flows for the second quarter and first six months of Pfizer’s 2016 but not for the second quarter and first six months of 2015. Legacy Hospira assets and liabilities are reflected in our balance sheets as of July 3, 2016 and December 31, 2015.
Financial Report.
B. Adoption of New Accounting Standards
WeIn the fourth quarter of 2016, we adopted a new accounting standard for certain elements of the accounting for share-based payments as of January 1, 2016 that changed2016. Specifically, the presentationnew standard requires excess tax benefits or deficiencies (including tax benefits of debt issuance costs relateddividend equivalents) of share-based compensation to abe recognized debt liability as a direct deductioncomponent of the Provision for taxes on income, whereas excess tax benefits or deficiencies previously were recognized in Additional paid-in capital. The net tax benefit for the Company was $28 million for the second quarter of 2016 and $50 million for the first six months of 2016. Also, in the diluted net earnings per share calculation, when applying the treasury stock method for shares that could be repurchased, the assumed proceeds no longer include the amount of excess tax benefit.
Another element of the new accounting standard requires that we now present excess tax benefits as operating activities in our consolidated statements of cash flow. We elected to adopt this presentation on a prospective basis as of January 1, 2016. Additionally, cash paid by us when directly withholding shares for tax-withholding purposes is now a cash outflow from financing activities. This reclassification was required to be adopted retrospectively. As a result, $51 million of cash outflows for the carrying valuefirst six months of that associated debt, consistent with2016 was reclassified from operating activities to financing activities in the presentation of a debt discount. The update does not impact the measurement or recognition of debt issuance costs. As of July 3, 2016, debt issuance costs were $93 million and are presented as contra-liabilities to Short-term borrowings, including current portion of long-term debt ($2 million) and Long-termdebt ($91 million). In the December 31, 2015 condensed consolidated balance sheet, we have reclassified debt issuance costsstatement of $79 million ($1 million from Other current assets and $79 million from Other noncurrent assets) and have presented them as contra-liabilities to Short-term borrowings, including current portion of long-term debt ($1 million) and Long-termdebt ($79 million) to conform to the current period presentation.cash flows. For additional information, see Notes to Consolidated Financial Statements––Note 7A.1B. Basis of Presentation and SignificantAccounting Policies:Adoption of New Accounting Standards included in our 2016 Financial Report.
We adopted a new standard as of January 1, 2016 that requires an acquirer to recognize adjustments made in the measurement period to provisional amounts of assets acquired and liabilities assumed in a business combination in the reporting period in which the adjustment amounts are determined. There was no material impact to our condensed consolidated financial statements in the second quarter and first six months of 2016 from adopting this standard. For additional information, see Note 2A.
We adopted a new standard as of January 1, 20162017 that amended guidance on the assessment of whether an entity is the primary beneficiary of a variable interest entity. Under this new guidance, when evaluating whether an entity is the primary beneficiary, a single decision maker must consider its indirect interest held through related to the accounting for hybrid financial instruments issued or held as investments and thereparties under common control proportionately. There was no material impact to our condensed consolidated financial statements from adopting this standard.
C. Fair Value
Our fairWe adopted a new standard as of January 1, 2017 related to inventory. The new guidance requires that inventory be measured at the lower of cost or net realizable value, methodologies depend onwhich is defined as the following typesestimated selling prices in the ordinary course of inputs:
Quoted prices for identical assets or liabilities in active markets (Level 1 inputs).
Quoted prices for similar assets or liabilities in active markets or quoted prices for identical or similar assets or liabilities in markets that are not active, or inputs other than quoted prices that are directly or indirectly observable, or inputs that are derived principallybusiness, less reasonably predictable costs of completion, disposal, and transportation. There was no material impact to our condensed consolidated financial statements from or corroborated by, observable market data by correlation or other means (Level 2 inputs).
Unobservable inputs that reflect estimates and assumptions (Level 3 inputs).
A single estimate of fair value can result from a complex series of judgments about future events and uncertainties and can rely heavily on estimates and assumptions.adopting this standard.
Note 2. Acquisitions, ResearchSale of Hospira Infusion Systems Net Assets, Collaborative Arrangement and Development and Collaborative Arrangements, Equity-Method Investments and Cost-Method Investment
A. Acquisitions
AstraZeneca’s Small Molecule Anti-Infectives Business (EH)
On December 22, 2016, which falls in the first fiscal quarter of 2017 for our international operations, we acquired the development and commercialization rights to AstraZeneca’s small molecule anti-infectives business, primarily outside the U.S., including the commercialization and development rights to the newly approved EU drug Zavicefta™ (ceftazidime-avibactam), the marketed agents Merrem™/Meronem™ (meropenem) and Zinforo™ (ceftaroline fosamil), and the clinical development assets ATM-AVI and CXL (ceftaroline fosamil-AVI). Under the terms of the agreement, we made an upfront payment of approximately $552 million to AstraZeneca upon the close of the transaction and an additional $3 million payment for a contractual purchase price adjustment in the second quarter of 2017. We also made a $50 million milestone payment to AstraZeneca in the second quarter of 2017 and will make a deferred payment of $175 million in January 2019. In addition, AstraZeneca is eligible to receive up to $200 million in additional milestone payments, and up to $600 million if sales of Zavicefta™ exceed certain thresholds during the next nine years, as well as tiered royalties on sales of Zavicefta™ and ATM-AVI in certain markets for a period ending on the later of ten years or the loss of patent protection or loss of regulatory exclusivity. The total royalty payments are unlimited during the royalty term and the undiscounted payments are expected to be in the range of approximately $250 million to $425 million. The total fair value of consideration transferred for AstraZeneca’s small molecule anti-infectives business was approximately $1,045 million, which includes $555 million in cash, plus the fair value of contingent consideration of $490 million (which is composed of the deferred payment, the $50 million milestone
PFIZER INC. AND SUBSIDIARY COMPANIES
NOTES TO CONDENSED CONSOLIDATED FINANCIAL STATEMENTS
(UNAUDITED)
payment made in the second quarter of 2017 and the future expected milestone and royalty payments). In connection with this acquisition, we provisionally recorded $902 million in Identifiable intangible assets, primarily consisting of $683 million in Developed technology rights and $219 million in IPR&D. We also recorded $96 million in Other current assets related to the economic value of inventory which was retained by AstraZeneca for sale on our behalf, $68 million in Goodwill and $20 million of net deferred tax liabilities. The allocation of the consideration transferred to the assets and the liabilities assumed has not yet been finalized.
Medivation, Inc. (IH)
On September 28, 2016, we acquired Medivation for $81.50 per share. The total fair value of consideration transferred for Medivation was approximately $14.3 billion in cash ($13.9 billion, net of cash acquired). Of this consideration, approximately $365 million was not paid as of December 31, 2016, and was recorded in Other current liabilities. Substantially all of the remaining consideration was paid as of July 2, 2017. Medivation is now a wholly-owned subsidiary of Pfizer. Medivation is a biopharmaceutical company focused on developing and commercializing small molecules for oncology. Medivation’s portfolio includes Xtandi (enzalutamide), an androgen receptor inhibitor that blocks multiple steps in the androgen receptor signaling pathway within tumor cells. Xtandi is being developed and commercialized through a collaboration with Astellas. Astellas has exclusive commercialization rights for Xtandi outside the U.S. In addition, Medivation has a development-stage oncology asset in its pipeline, talazoparib, which is currently in a Phase 3 study for the treatment of BRCA-mutated breast cancer. In connection with this acquisition, we provisionally recorded $13.0 billion in Identifiable intangible assets, primarily consisting of $8.7 billion of Developed technology rights with an average useful life of approximately 12 years and $4.3 billion of IPR&D, and provisionally recorded $5.6 billion of Goodwill, $4.3 billion of net income tax liabilities, and $259 million of assumed contingent consideration. The allocation of the consideration transferred to the assets acquired and the liabilities assumed has not yet been finalized.
Bamboo Therapeutics, Inc. (R&D)
On August 1, 2016, we acquired all the remaining equity in Bamboo, a privately-held biotechnology company focused on developing gene therapies for the potential treatment of patients with certain rare diseases relating to neuromuscular conditions and those affecting the central nervous system, for $150 million, plus potential milestone payments of up to $495 million contingent upon the progression of key assets through development, regulatory approval and commercialization. The total fair value of the consideration transferred for Bamboo was approximately $331 million, including cash of $130 million ($101 million, net of cash acquired), contingent consideration of $157 million, consisting of milestone payments, and the fair value of Pfizer’s previously held equity interest in Bamboo of $44 million. We previously purchased a minority stake in Bamboo in the first quarter of 2016 for a payment of approximately $43 million. Upon acquiring the remaining interest in Bamboo, in the third quarter of 2016, we recognized a gain of $1 million on our existing investment in Other (income)/deductions––net. This acquisition provides us with several clinical and pre-clinical assets that complement our rare disease portfolio, an advanced recombinant AAV vector design and production technology, and a fully functional Phase I/II gene therapy manufacturing facility. Bamboo is now a wholly-owned subsidiary of Pfizer. In connection with this acquisition, we provisionally recorded $325 million of Identifiable intangible assets, consisting entirely of IPR&D. We also provisionally recorded $133 million of Goodwill and $93 million of net deferred tax liabilities. The allocation of the consideration transferred to the assets acquired and the liabilities assumed has not yet been finalized.
Anacor Pharmaceuticals, Inc. (IH)
On June 24, 2016, (the acquisition date), we completed our acquisition ofacquired Anacor for $99.25 per share. The total fair value of consideration transferred for Anacor was approximately $4.9 billion in cash ($4.5 billion net of cash acquired), plus $698 million debt assumed. Anacor is now a wholly-owned subsidiary of Pfizer. Anacor is a biopharmaceutical company focused on novel small-molecule therapeutics derived from its boron chemistry platform. Included within Anacor’s pipeline iscrisaborole, a non-steroidal topical PDE-4 inhibitor with anti-inflammatory properties.properties, was approved by the FDA on December 14, 2016 under the trade name Eucrisa. In connection with this acquisition, we recorded $698 million as the fair value of notes payable in cash, and provisionally recorded $5.0$4.9 billion in Identifiable intangible assets, primarily consisting of $4.8 billion of In-process research and developmentIPR&D, and provisionally recorded $1.8 billion$646 million of Goodwill and $1.6 billion$346 million of net deferredincome tax liabilities. The allocation of the consideration transferred to the assets acquired and the liabilities assumed has not been finalized.
PFIZER INC. AND SUBSIDIARY COMPANIES
NOTES TO CONDENSED CONSOLIDATED FINANCIAL STATEMENTS
(UNAUDITED)
Hospira, Inc.
On September 3, 2015 (the acquisition date), we acquired Hospira, a leading provider of sterile injectable drugs and infusion technologies as well as a provider of biosimilars, for $90 per share in cash. The total fair value of consideration transferred for Hospira was approximately $16.1 billion in cash ($15.7 billion, net of cash acquired). Hospira is now a subsidiary of Pfizer. The combination of local Pfizer and Hospira entities may be pending in various jurisdictions and integration is subject to completion of various local legal and regulatory steps.
The following table summarizes the provisional amounts recognized for assets acquired and liabilities assumed as of the acquisition date, as well as adjustments made in the first six months of 2016 to the provisional amounts initially recorded in 2015 (measurement period adjustments) with a corresponding change to goodwill. Certain estimated values are not yet finalized (see below) and are subject to change. We will finalize the amounts recognized as we obtain the information necessary to complete the analyses, but no later than one year from the acquisition date.
|
| | | | | | | | | | | | |
| (MILLIONS OF DOLLARS) | | Amounts Recognized as of Acquisition Date (as previously reported as of December 31, 2015) |
| | Measurement Period Adjustments(a) |
| | Amounts Recognized as of Acquisition Date (as adjusted) |
|
| Working capital, excluding inventories | | $ | 274 |
| | $ | (16 | ) | | $ | 257 |
|
| Inventories | | 1,924 |
| | (23 | ) | | 1,901 |
|
| PP&E | | 2,410 |
| | (57 | ) | | 2,352 |
|
| Identifiable intangible assets, excluding IPR&D | | 8,270 |
| | 20 |
| | 8,290 |
|
| IPR&D | | 995 |
| | 35 |
| | 1,030 |
|
| Other noncurrent assets | | 408 |
| | (46 | ) | | 362 |
|
| Long-term debt | | (1,928 | ) | | — |
| | (1,928 | ) |
| Benefit obligations | | (117 | ) | | — |
| | (117 | ) |
| Net income tax accounts | | (3,394 | ) | | 84 |
| | (3,310 | ) |
| Other noncurrent liabilities | | (39 | ) | | — |
| | (39 | ) |
| Total identifiable net assets | | 8,803 |
| | (4 | ) | | 8,799 |
|
| Goodwill | | 7,284 |
| | 4 |
| | 7,288 |
|
| Net assets acquired/total consideration transferred | | $ | 16,087 |
| | $ | — |
| | $ | 16,087 |
|
| |
(a)
| The changes in the estimated fair values are primarily to better reflect market participant assumptions about facts and circumstances existing as of the acquisition date. The measurement period adjustments did not result from intervening events subsequent to the acquisition date. |
The change in the provisional amounts did not have a material impact on our results of operations.
The following items are subject to change:
Amounts for certain legal and environmental contingencies, pending receipt of certain information that could affect provisional amounts recorded.
Amounts for intangibles and PP&E, pending finalization of valuation efforts.
Amounts for income tax assets, receivables and liabilities, pending the filing of Hospira pre-acquisition tax returns and the receipt of information including but not limited to that from taxing authorities, which may change certain estimates and assumptions used.
|
| | | | | | | | |
| The following table provides supplemental pro forma information as if the acquisition of Hospira had occurred on January 1, 2014: |
| | | Unaudited Supplemental Pro Forma Consolidated Results |
| | | Three Months Ended | | Six Months Ended |
| (MILLIONS OF DOLLARS, EXCEPT PER SHARE DATA) | | June 28,
2015 |
| | June 28,
2015 |
|
| Revenues | | $ | 13,037 |
| | $ | 25,075 |
|
| Net income attributable to Pfizer Inc. common shareholders | | 2,703 |
| | 5,079 |
|
| Diluted EPS attributable to Pfizer Inc. common shareholders | | 0.43 |
| | 0.81 |
|
PFIZER INC. AND SUBSIDIARY COMPANIES
NOTES TO CONDENSED CONSOLIDATED FINANCIAL STATEMENTS
(UNAUDITED)
The unaudited supplemental pro forma consolidated results do not purport to reflect what the combined company’s results of operations would have been had the acquisition occurred on January 1, 2014, nor do they project the future results of operations of the combined company or reflect the expected realization of any cost savings associated with the acquisition. The actual results of operations of the combined company may differ significantly from the pro forma adjustments reflected here due to many factors. The unaudited supplemental pro forma financial information includes various assumptions, including those related to the preliminary purchase price allocation of the assets acquired and the liabilities assumed from Hospira.
The unaudited supplemental pro forma consolidated results reflect the historical financial information of Pfizer and Hospira, adjusted to give effect to the acquisition of Hospira as if it had occurred on January 1, 2014, primarily for the following pre-tax adjustments:
Elimination of Hospira’s historical intangible asset amortization expense (approximately $12 million in the second quarter of 2015 and $24 million in the first six months of 2015).
Additional amortization expense (approximately $124 million in the second quarter of 2015 and $251 million in the first six months of 2015) related to the preliminary estimate of the fair value of identifiable intangible assets acquired.
Additional depreciation expense (approximately $21 million in the second quarter of 2015 and $43 million in the first six months of 2015) related to the preliminary estimate of the fair value adjustment to PP&E acquired.
Adjustment related to the preliminary estimate of the non-recurring fair value adjustment to acquisition-date inventory estimated to have been sold (the addition of $5 million of charges in the second quarter of 2015 and $9 million of charges in the first six months of 2015).
Adjustment to decrease interest expense (approximately $10 million in the second quarter of 2015 and $20 million in the first six months of 2015) related to the fair value adjustment of Hospira debt.
Adjustment for non-recurring acquisition-related costs directly attributable to the acquisition (the elimination of $30 million of charges in the second quarter of 2015 and $44 million of charges in the first six months of 2015), reflecting non-recurring charges incurred by both Hospira and Pfizer, which would have been recorded in 2014 under the pro forma assumption that the Hospira acquisition was completed on January 1, 2014.
The above adjustments were adjusted for the applicable tax impact. The taxes associated with the adjustments related to the preliminary estimate of the fair value adjustment for acquired intangible assets, PP&E, inventory and debt reflect the statutory tax rates in the various jurisdictions where the adjustments are expected to be incurred. The taxes associated with the elimination of Hospira’s historical intangible asset amortization expense and the adjustment for the acquisition-related costs directly attributable to the acquisition were based on the tax rate in the jurisdiction in which the related deductible costs were incurred.
Marketed Vaccines Business of Baxter International Inc.
On December 1, 2014 (which falls in the first fiscal quarter of 2015 for our international operations), we acquired Baxter’s portfolio of marketed vaccines for a final purchase price of $648 million. The portfolio that was acquired consists of NeisVac-C and FSME-IMMUN/TicoVac. NeisVac-C is a vaccine that helps protect against meningitis caused by group C meningococcal meningitis and FSME-IMMUN/TicoVac is a vaccine that helps protect against tick-borne encephalitis. In connection with this acquisition, we recorded $376 million in Identifiable intangible assets, primarily consisting of $371 million in Developed technology rights. We also recorded $194 million of Inventories and $12 million in Goodwill. The final allocation of the consideration transferred to the assets acquired and the liabilities assumed has been completed.
B. Sale of Hospira Infusion Systems Net Assets to ICU Medical, Inc. (EH)
On October 6, 2016, we announced that we entered into a definitive agreement under which ICU Medical would acquire all of our global infusion therapy net assets, HIS, for approximately $1 billion in cash and ICU Medical common stock. HIS includes IV pumps, solutions, and devices.As a result of the performance of HIS relative to ICU Medical’s expectations, on January 5, 2017, we entered into a revised agreement with ICU Medical under which ICU Medical would acquire HIS for up to
PFIZER INC. AND SUBSIDIARY COMPANIES
NOTES TO CONDENSED CONSOLIDATED FINANCIAL STATEMENTS
(UNAUDITED)
B. Researchapproximately $900 million, composed of cash and Developmentcontingent cash consideration, ICU Medical common stock and Collaborative Arrangementsseller financing.
ResearchThe revised transaction closed on February 3, 2017. At closing, under the terms of the revised agreement, we received 3.2 million newly issued shares of ICU Medical common stock (as originally agreed), which we valued at approximately $428 million (based upon the closing price of ICU Medical common stock on the closing date less a discount for lack of marketability) and Development Arrangement with NovaQuest Co-Investment Fund II, L.P.
which are reported in Long-term investments on the condensed consolidated balance sheet as of July 2, 2017, a promissory note in the amount of $75 million, which is reported in Other noncurrent assets on the condensed consolidated balance sheet as of July 2, 2017, and net cash of approximately $200 million before customary adjustments for net working capital, which is reported in Other investing activities, net on the condensed consolidated statement of cash flows for the six months ended July 2, 2017. In May 2016, our agreement with NovaQuest became effective, under which NovaQuest will fund up to $250 million in development costs related to certain Phase III clinical trials of Pfizer’s bococizumab compound and Pfizer will use commercially reasonable efforts to develop and obtain regulatory approvals for such compound. Following potential regulatory approval, NovaQuest will be eligibleaddition, we are entitled to receive a combination of fixed milestone paymentscontingent amount of up to $195an additional $225 million in totalcash based on ICU Medical’s achievement of first commercial sale and certain levels of cumulative net sales as well as royalties on bococizumab net sales over approximately nine years. NovaQuest’s development funding is expected to cover up to 40%performance targets for the combined company through December 31, 2019. After receipt of the development costs and will be received over five quarters during 2016 and 2017. As there is a substantive and genuineICU Medical shares, we own approximately 16% of ICU Medical. We have agreed to certain restrictions on transfer of risk to NovaQuest,our ICU Medical shares for 18 months after the development funding is recognized by us as an obligation to perform contractual servicesclosing date. The promissory note from ICU Medical has a term of three years and therefore is a reduction of Researchbears interest at LIBOR plus 2.25% for the first year and development expenses as incurred. The reduction to ResearchLIBOR plus 2.50% for the second and development expenses forthird years. In the second quarter and first six months of 2016 totaled $69.3 million. Fixed sales-based milestone payments will be2017, we recognized pre-tax losses of approximately $28 million and $64 million, respectively, in Other (income)/deductions––net, (see Note 4), representing incremental charges to amounts previously recorded as intangibleto write down the HIS net assets and amortized to Amortization of intangible assets overfair value less costs to sell.
While we have received the estimated commercial lifefull purchase price excluding the contingent amount as of the bococizumab productFebruary 3, 2017 closing, the sale of the HIS net assets was not completed in certain non-U.S. jurisdictions due to temporary regulatory or operational constraints. In these jurisdictions, which represent a relatively small portion of the HIS net assets, we continue to operate the net assets for the net economic benefit of ICU Medical, and royalties onwe are indemnified by ICU Medical against risks associated with such operations during the interim period, subject to our obligations under the definitive transaction agreements. We expect the sale of the HIS net sales willassets in these jurisdictions to be recordedcompleted by the first quarter of 2018. As such, and as Costwe have already received all of sales when incurred.the non-contingent proceeds from the sale and ICU Medical is contractually obligated to complete the transaction, we have treated these jurisdictions as sold for accounting purposes.
Research and Development ArrangementIn connection with NovaQuest Co-Investment Fund V, L.P.
In April 2016, Pfizerthe sale transaction, we entered into an agreement with NovaQuest undercertain transitional agreements designed to facilitate the orderly transition of the HIS net assets to ICU Medical. These agreements primarily relate to administrative services, which NovaQuest will fund upare generally to $200 million in development costs related to certain Phase III clinical trials of Pfizer’s rivipansel compound and Pfizer will use commercially reasonable efforts to develop and obtain regulatory approvalsbe provided for such compound. Following potential regulatory approval, NovaQuest will be eligible to receive a combination of fixed milestone paymentsperiod of up to approximately $267 million in total based on achievement24 months after the closing date. We will also manufacture and supply certain HIS products for ICU Medical and ICU Medical will manufacture and supply certain retained Pfizer products for us after closing, generally for a term of first commercial salefive years. These agreements are not material to Pfizer and certain levelsnone confers upon us the ability to influence the operating and/or financial policies of cumulative net sales as well as royalties on rivipansel net sales over approximately eight years. NovaQuest’s development funding is expectedICU Medical subsequent to cover up to 100% of the development costs and will be received over approximately twelve quarters from 2016 to 2019. As there is a substantive and genuine transfer of risk to NovaQuest, the development funding is recognized by us as an obligation to perform contractual services and therefore is a reduction of Research and development expenses as incurred. The reduction to Research and development expenses for the second quarter and first six months of 2016 totaled $15.0 million. Fixed sales-based milestone payments will be recorded as intangible assets and amortized to Amortization of intangible assets over the estimated commercial life of the rivipansel product and royalties on net sales will be recorded as Cost of sales when incurred.sale.
C. Collaboration Arrangement
Research and Development Arrangement with RPI Finance Trust
In January 2016, Pfizer entered into an agreement with RPI, a subsidiary of Royalty Pharma, under which RPI will fund up to $300 million in development costs related to certain Phase III clinical trials of Pfizer’s Ibrance (palbociclib) product primarily for adjuvant treatment of hormone receptor positive early breast cancer (the Indication). If successful and upon approval of Ibrance in the U.S. or certain major markets in the EU for the Indication based on the applicable clinical trials, RPI will be eligible to receive a combination of approval-based fixed milestone payments of up to $250 million dependent upon results of the clinical trials and royalties on certain Ibrance sales over approximately seven years. RPI’s development funding is expected to cover up to 100% of the costs primarily for the applicable clinical trials through 2021. As there is a substantive and genuine transfer of risk to RPI, the development funding is recognized by us as an obligation to perform contractual services and therefore is a reduction of Research and development expenses as incurred. The reduction to Research and development expenses for the second quarter of 2016 totaled $12.9 million and for the first six months of 2016 totaled $21.7 million. Fixed milestone payments due upon approval will be recorded as intangible assets and amortized to Amortization of intangible assets over the estimated commercial life of the Ibrance product and sales-based royalties will be recorded as Cost of sales when incurred.
Collaboration with Eli LillyMerck & CompanyCo., Inc.
In October 2013, we entered into a worldwide, except for Japan, collaboration agreement with Lilly to jointly developMerck for the development and globally commercialize Pfizer’s tanezumab,commercialization of ertugliflozin (PF-04971729), our investigational oral sodium glucose cotransporter (SGLT2) inhibitor currently in Phase 3 development for the treatment of type 2 diabetes. Under the agreement, we are collaborating with Merck on the clinical development of ertugliflozin, and ertugliflozin-containing fixed-dose combinations with metformin and Januvia (sitagliptin) tablets.
In the first quarter of 2017, we received a $90 million milestone payment from Merck upon the FDA’s acceptance for review of the NDAs for ertugliflozin and two fixed-dose combinations (ertugliflozin plus Januvia (sitagliptin) and ertugliflozin plus metformin), which provides that Pfizerhas been deferred and Lilly will equallyprimarily reported in Other noncurrent liabilities and is being recognized in Other (income)/deductions––net over a multi-year period. We are eligible for additional payments associated with the achievement of future clinical, regulatory and commercial milestones. We share product-development expenses as well as potential revenues and certain product-related costs. Followingcosts with Merck on a 60%/40% basis, with Pfizer having the decision by the FDA in March 2015 to lift the partial clinical hold on the tanezumab development program, we received a $200 million upfront payment from Lilly in accordance with the collaboration agreement between Pfizer and Lilly, which is recorded as deferred income in our condensed consolidated balance sheet and is being recognized into Other (income)/deductions––net over a multi-year period beginning in the second quarter of 2015. Pfizer and Lilly resumed the Phase 3 chronic pain program for tanezumab in July 2015, which will consist of six studies in approximately 7,000 patients across osteoarthritis, chronic low back pain and cancer pain. Under the collaboration agreement40% share.
PFIZER INC. AND SUBSIDIARY COMPANIES
NOTES TO CONDENSED CONSOLIDATED FINANCIAL STATEMENTS
(UNAUDITED)
with Lilly, we are eligible to receive additional payments from Lilly upon the achievement of specified regulatory and commercial milestones.
Collaboration with OPKO Health, Inc.
We entered into a collaborative agreement with OPKO, which closed in January 2015, to develop and commercialize OPKO’s long-acting hGH-CTP for the treatment of GHD in adults and children, as well as for the treatment of growth failure in children born SGA who fail to show catch-up growth by two years of age. hGH-CTP has the potential to reduce the required dosing frequency of human growth hormone to a single weekly injection from the current standard of one injection per day. We have received the exclusive license to commercialize hGH-CTP worldwide. OPKO will lead the clinical activities and will be responsible for funding the development programs for the key indications, which include Adult and Pediatric GHD and Pediatric SGA. We will be responsible for all development costs for additional indications, all postmarketing studies, manufacturing and commercialization activities for all indications, and we will lead the manufacturing activities related to product development. In February 2015, we made an upfront payment of $295 million to OPKO, which was recorded in Research and development expenses, and OPKO is eligible to receive up to an additional $275 million upon the achievement of certain regulatory milestones. OPKO is also eligible to receive royalty payments associated with the commercialization of hGH-CTP for Adult GHD, which is subject to regulatory approval. Upon the launch of hGH-CTP for Pediatric GHD, which is subject to regulatory approval, the royalties will transition to tiered gross profit sharing for both hGH-CTP and our product, Genotropin.
C.D. Equity-Method Investments
Investment in Hisun Pfizer Pharmaceuticals Company Limited
In the first quarterand second quarters of 2016 and in the second quarter of 2016, ,we determined that we had other-than-temporary declines in the value of Hisun Pfizer, our 49%-owned equity-method investment in China, and, therefore, we recognized a losslosses of $81 million in the first quarter of 2016 and a loss of $130 million, respectively, in the second quarter of 2016 in Other (income)/deductions––net (see Note 4). The declines in value resulted from lower expectations as to the future cash flows to be generated by Hisun Pfizer, primarily as a result of an increase in risk due to the continued slowdown in the Chinese economy and changes in the expected timing and number of new product introductions by Hisun Pfizer. As of
PFIZER INC. AND SUBSIDIARY COMPANIES
NOTES TO CONDENSED CONSOLIDATED FINANCIAL STATEMENTS
(UNAUDITED)
July 3, 2016,2, 2017, the carrying value of our investment in Hisun Pfizer is $530$270 million, which is included in Long-term investments. We are continuing to evaluate strategic alternatives with Hisun. These strategic alternatives could impact the value of our investment in Hisun Pfizer in future periods.
In valuing our investment in Hisun Pfizer, we used discounted cash flow techniques, utilizing a 13.0% discount rate, reflecting our best estimate of the various risks inherent in the projected cash flows, and a nominal terminal year growth factor. Some of the more significant estimates and assumptions inherent in this approach include: the amount and timing of the projected net cash flows, which include the expected impact of competitive, legal, economic and/or regulatory forces on the products; the long-term growth rate, which seeks to project the sustainable growth rate over the long-term; and the discount rate, which seeks to reflect the various risks inherent in the projected cash flows, including country risk. Changes in economic conditions or other factors underlying these assumptions could negatively impact the value of our investment in Hisun Pfizer in future periods.
Investment in Laboratório Teuto Brasileiro S.A.
In the first quarter of 2016, we determined that we had an other-than-temporary decline in the value of Teuto, a 40%-owned generics company in Brazil, and, therefore, we recognized a loss of $50 million in Other (income)/deductions––net (see Note 4) related to our equity-method investment. The decline in value resulted from lower expectations as to the future cash flows to be generated by Teuto, primarily due to a slowdown in Brazilian economic conditions, which have been impacted by political risk, higher inflation, and the depreciation of the Brazilian Real.
In valuing our investment in Teuto, we used discounted cash flow techniques, utilizing a 17.5% discount rate, reflecting our best estimate of the various risks inherent in the projected cash flows, and a nominal terminal year growth factor. Some of the more significant estimates and assumptions inherent in this approach include: the amount and timing of the projected net cash flows, which include the expected impact of competitive, legal, economic and/or regulatory forces on the products; the long-term growth rate, which seeks to project the sustainable growth rate over the long-term; and the discount rate, which seeks to reflect the various risks inherent in the projected cash flows, including country risk.
Investment in Laboratório Teuto Brasileiro S.A.
PFIZER INC. AND SUBSIDIARY COMPANIES
NOTES TO CONDENSED CONSOLIDATED FINANCIAL STATEMENTS
(UNAUDITED)
We entered into an agreement on June 30, 2017 to exit our investment in Teuto, a 40%-owned generics company in Brazil, and sell our 40% interest in Teuto to the majority shareholders. As part of the agreement, we have anwaived our option to acquire the remaining 60% of Teuto, and Teuto’s other shareholders have anwaived their option to sell their 60% stake in the company to us. UnderThe transaction is expected to close in the termsthird quarter of 2017. As a result, in the second quarter of 2017, we recognized a net loss of approximately $30 million in Other (income)/deductions––net (see Note 4), which included the impairment of our agreement with Teuto’s other shareholders, 2016 is the final year in which the call and put options may be exercised. Ourequity-method investment in Teuto, is accounted for under the equity methodreversal of a contingent liability associated with the majority shareholders’ option to sell their 60% stake in the company to us, and the recognition in earnings of the currency translation adjustment associated with the Teuto investment.
In the first quarter of 2016, we determined that we had an other-than-temporary decline in the value of Teuto, and, therefore, we recognized a loss of $50 million in Other (income)/deductions––net (see Note 4) related to our equity-method investment. The decline in value resulted from lower expectations as to the future cash flows to be generated by Teuto, primarily due to a slowdown in Brazilian economic conditions, which have been impacted by political risk, higher inflation, and the depreciation of the Brazilian real.
In valuing our investment in Teuto, we used discounted cash flow techniques, reflecting our best estimate of the various risks inherent in the projected cash flows, and a nominal terminal year growth factor. Some of the more significant influence we haveestimates and assumptions inherent in this approach include: the amount and timing of the projected net cash flows, which include the expected impact of competitive, legal, economic and/or regulatory forces on the products; the long-term growth rate, which seeks to project the sustainable growth rate over the operations of Teuto through our board representation, minority veto rightslong-term; and 40% voting interest.
D. Cost-Method Investment
AM-Pharma B.V.
In April 2015, we acquired a minority equity interest in AM-Pharma, a privately-held Dutch biopharmaceutical company focused on the development of recAP for inflammatory diseases, and secured an exclusive optiondiscount rate, which seeks to acquirereflect the remaining equityvarious risks inherent in the company. The option becomes exercisable upon delivery of the clinical trial report after completion of a Phase II trial of recAP in the treatment of Acute Kidney Injury related to sepsis, which is expected to read out in 2017. Under the terms of the agreement, we paid $87.5 million for both the exclusive option and the minority equity interest, which was recorded as a cost-method investment in Long-term investments, and we may make additional payments of up to $512.5 million upon exercise of the option and potential launch of any product that may result from this investment.projected cash flows, including country risk.
Note 3. Restructuring Charges and Other Costs Associated with Acquisitions and Cost-Reduction/Productivity Initiatives
We incur significant costs in connection with acquiring, integrating and restructuring businesses and in connection with our global cost-reduction/productivity initiatives. For example:
In connection with acquisition activity, we typically incur costs associated with executing the transactions, integrating the acquired operations (which may include expenditures for consulting and the integration of systems and processes), and restructuring the combined company (which may include charges related to employees, assets and activities that will not continue in the combined company); and
In connection with our cost-reduction/productivity initiatives, we typically incur costs and charges associated with site closings and other facility rationalization actions, workforce reductions and the expansion of shared services, including the development of global systems.
All of our businesses and functions may be impacted by these actions, including sales and marketing, manufacturing and R&D, as well as groups such as information technology, shared services and corporate operations.
In connection with our acquisition of Hospira, we are focusing our efforts on achieving an appropriate cost structure for the combined company. For up to a three-year period post-acquisition, we expect to incur costs of approximately $1 billion(not including costs of $215 million infor full-year 2015 associated with the return of acquired in-process research and developmentIPR&D rights as described in the Current-Period Key Activities section of Notes to Consolidated Financial Statements––Note 3. Restructuring Charges and Other Costs Associated with Acquisitions and Cost-Reduction/Productivity Initiatives in our 20152016 Financial Report) associated with the integration of Hospira.
In early 2014, we announced that we would be incurring costs in 2014-2016 related to new programs: our new global commercial structure reorganization and additional cost-reduction/productivity initiatives. We have the following initiatives underway associated with these programs:
Manufacturing plant network rationalization and optimization, where execution timelines are necessarily long. Our plant network strategy is expected to result in the exit of six sites over the next several years. In connection with these activities, during 2014-2016, we expect to incur costs of approximately $400 million associated with prior acquisition activity and costs of approximately $1.0 billion associated with new non-acquisition-related cost-reduction initiatives. Through July 3, 2016, we incurred approximately $364 million and $685 million, respectively, associated with these initiatives.
The 2014 global commercial structure reorganization, which primarily includes the streamlining of certain functions, the realignment of regional locations and colleagues to support the businesses, as well as implementing the necessary system changes to support different reporting requirements. Through July 3, 2016, we incurred costs of approximately $219 million and have completed this initiative.
Other new cost-reduction/productivity initiatives, primarily related to commercial property rationalization and consolidation. In connection with these cost-reduction activities, during 2014-2016, we expect to incur costs of approximately $800 million. Through July 3, 2016, we incurred approximately $657 million associated with these initiatives.
PFIZER INC. AND SUBSIDIARY COMPANIES
NOTES TO CONDENSED CONSOLIDATED FINANCIAL STATEMENTS
(UNAUDITED)
In 2016, we substantially completed previously disclosed cost-reduction initiatives begun in 2014 associated with our global commercial structure reorganization, manufacturing plant network rationalization and optimization initiatives, and additional cost-reduction/productivity initiatives across the enterprise.
As a result of the evaluation performed in connection with our decision in September 2016 to not pursue, at that time, splitting IH and EH into two separate publicly-traded companies, we identified new opportunities to potentially achieve greater optimization and efficiency to become more competitive in our business. Therefore, in early 2017, we initiated new enterprise-wide cost reduction/productivity initiatives, which we expect to substantially complete by the end of 2019. These initiatives will encompass all areas of our cost base and will include:
Optimization of our manufacturing plant network to support IH and EH products and pipelines. During 2017-2019, we expect to incur costs of approximately $750 million related to this initiative. Through July 2, 2017, we incurred approximately $91 million associated with this initiative.
Activities in non-manufacturing related areas, which include further centralization of our corporate and platform functions, as well as other activities where opportunities are identified. During 2017-2019, we expect to incur costs of approximately $150 million related to this initiative. Through July 2, 2017, we incurred approximately $73 million associated with this initiative.
The costs expected to be incurred during 2014-2016,2017-2019, of approximately $2.4 billion in total$900 million for the above-mentioned programs (but not including expected costs associated with the Hospira integration), include restructuring charges, implementation costs and additional depreciation––asset restructuring. Of this amount, we expect that about a quarter of the charges will be non-cash.
Current-Period Key Activities
InFor the first six months of 2016,2017, we incurred approximately $625costs of $163 million in cost-reduction and acquisition-related costs (excluding transaction costs) primarily in connectionassociated with the 2017-2019 program, $107 million associated with the integration of Hospira and the aforementioned manufacturing plant network rationalization and optimization program.$85 million associated with all other acquisition-related initiatives.
|
| | | | | | | | | | | | | | | | |
| The following table provides the components of costs associated with acquisitions and cost-reduction/productivity initiatives: |
| | | Three Months Ended | | Six Months Ended |
| (MILLIONS OF DOLLARS) | | July 2,
2017 |
| | July 3,
2016 |
| | July 2,
2017 |
| | July 3,
2016 |
|
Restructuring charges(a): | | |
| | |
| | |
| | |
|
| Employee terminations | | $ | 10 |
| | $ | 93 |
| | $ | 29 |
| | $ | 117 |
|
| Asset impairments | | — |
| | 16 |
| | 24 |
| | 18 |
|
| Exit costs | | 4 |
| | 31 |
| | 6 |
| | 35 |
|
| Total restructuring charges | | 14 |
| | 141 |
| | 59 |
| | 170 |
|
Transaction costs(b) | | 6 |
| | 36 |
| | 18 |
| | 60 |
|
Integration costs(c) | | 50 |
| | 139 |
| | 151 |
| | 227 |
|
| Restructuring charges and certain acquisition-related costs | | 70 |
| | 316 |
| | 228 |
| | 457 |
|
Additional depreciation––asset restructuring recorded in our condensed consolidated statements of income as follows(d): | | |
| | |
| | |
| | |
|
| Cost of sales | | 21 |
| | 52 |
| | 35 |
| | 99 |
|
| Research and development expenses | | — |
| | 1 |
| | — |
| | 5 |
|
| Total additional depreciation––asset restructuring | | 21 |
| | 53 |
| | 35 |
| | 104 |
|
Implementation costs recorded in our condensed consolidated statements of income as follows(e): | | |
| | |
| | |
| | |
|
| Cost of sales | | 36 |
| | 38 |
| | 51 |
| | 81 |
|
| Selling, informational and administrative expenses | | 15 |
| | 20 |
| | 24 |
| | 33 |
|
| Research and development expenses | | 11 |
| | 5 |
| | 17 |
| | 9 |
|
| Other (income)/deductions––net | | — |
| | 1 |
| | — |
| | 1 |
|
| Total implementation costs | | 62 |
| | 64 |
| | 93 |
| | 124 |
|
| Total costs associated with acquisitions and cost-reduction/productivity initiatives | | $ | 153 |
| | $ | 433 |
| | $ | 356 |
| | $ | 685 |
|
|
| | | | | | | | | | | | | | | | |
| The following table provides the components of costs associated with acquisitions and cost-reduction/productivity initiatives: |
| | | Three Months Ended | | Six Months Ended |
| (MILLIONS OF DOLLARS) | | July 3,
2016 |
| | June 28,
2015 |
| | July 3,
2016 |
| | June 28,
2015 |
|
Restructuring charges(a): | | |
| | |
| | |
| | |
|
| Employee terminations | | $ | 93 |
| | $ | 34 |
| | $ | 117 |
| | $ | 65 |
|
| Asset impairments | | 16 |
| | 5 |
| | 18 |
| | 11 |
|
| Exit costs | | 31 |
| | 4 |
| | 35 |
| | 10 |
|
| Total restructuring charges | | 141 |
| | 43 |
| | 170 |
| | 85 |
|
Transaction costs(b) | | 36 |
| | 1 |
| | 60 |
| | 6 |
|
Integration costs(c) | | 139 |
| | 42 |
| | 227 |
| | 54 |
|
| Restructuring charges and certain acquisition-related costs | | 316 |
| | 86 |
| | 457 |
| | 146 |
|
Additional depreciation––asset restructuring recorded in our condensed consolidated statements of income as follows(d): | | |
| | |
| | |
| | |
|
| Cost of sales | | 52 |
| | 28 |
| | 99 |
| | 45 |
|
| Research and development expenses | | 1 |
| | 1 |
| | 5 |
| | 2 |
|
| Total additional depreciation––asset restructuring | | 53 |
| | 28 |
| | 104 |
| | 47 |
|
Implementation costs recorded in our condensed consolidated statements of income as follows(e): | | |
| | |
| | |
| | |
|
| Cost of sales | | 38 |
| | 28 |
| | 81 |
| | 41 |
|
| Selling, informational and administrative expenses | | 20 |
| | 13 |
| | 33 |
| | 39 |
|
| Research and development expenses | | 5 |
| | 3 |
| | 9 |
| | 12 |
|
| Other (income)/deductions––net | | 1 |
| | 1 |
| | 1 |
| | 1 |
|
| Total implementation costs | | 64 |
| | 45 |
| | 124 |
| | 93 |
|
| Total costs associated with acquisitions and cost-reduction/productivity initiatives | | $ | 433 |
| | $ | 159 |
| | $ | 685 |
| | $ | 286 |
|
| |
(a) | In the second quarter and first six months of 2017, restructuring charges are largely associated with cost-reduction and productivity initiatives not associated with acquisitions, as well as our acquisitions of mainly Anacor for the second quarter of 2017 and mainly Anacor and Medivation for the first six months of 2017. In the second quarter and first six months of 2016, restructuring charges are largely associated with cost-reduction and productivity initiatives not associated with acquisitions. In the six months ended July 3, 2016, 2, 2017, Employee terminations represent the expected reduction of the workforce by approximately 600employees, mainly in manufacturing, sales and research. Employee termination costs are generally recorded when the actions are probable and estimable and primarily include accrued severance benefits, pension and postretirement benefits, manybenefit costs, partially offset by revisions of which may be paid out during periods after termination.our estimates of severance benefits. |
PFIZER INC. AND SUBSIDIARY COMPANIES
NOTES TO CONDENSED CONSOLIDATED FINANCIAL STATEMENTS
(UNAUDITED)
Employee termination costs are generally recorded when the actions are probable and estimable and include accrued severance benefits, pension and postretirement benefits, many of which may be paid out during periods after termination.
The restructuring chargesactivities for 20162017 are associated with the following:
| |
| • | For the second quarter of 2017, IH ($3 million income); EH ($8 million); WRD/GPD ($3 million); manufacturing operations ($1 million income); and Corporate ($7 million). |
| |
| • | For the first six months of 2017, IH ($6 million); EH ($10 million income); WRD/GPD ($13 million); manufacturing operations ($24 million); and Corporate ($26 million). |
For the second quarter of 2016, the IH segment ($5 million); the EH segment ($11 million income); WRD, GPD and Medical (M) (WRD/GPD/M) ($49 million); manufacturing operations ($59 million); and Corporate ($39 million).
For the first six months of 2016, IH ($14 million); EH ($8 million income); WRD/GPD/M ($52 million); manufacturing operations ($73 million); and Corporate ($40 million).
The restructuring chargesactivities for 20152016 are associated with the following:
For the second quarter of 2015, IH ($21 million); EH ($2 million income); WRD/GPD/M ($4 million); manufacturing operations ($14 million); and Corporate ($6 million).
For the first six monthsof 2015, IH ($46 million); EH ($8 million); WRD/GPD/M ($16 million); manufacturing operations ($8 million income); and Corporate ($24 million).
| |
| • | For the second quarter of 2016, IH ($5 million); EH ($11 million income); WRD/GPD ($49 million); manufacturing operations ($59 million); and Corporate ($39 million). |
| |
| • | For the first six months of 2016, IH ($14 million); EH ($8 million income); WRD/GPD ($52 million); manufacturing operations ($73 million); and Corporate ($40 million). |
| |
(b) | Transaction costs represent external costs for banking, legal, accounting and other similar services, mostvirtually all of which in the second quarter and first six months of 20162017 are directly related to theour acquisition of Medivation. Transaction costs in the second quarter of 2016 were mostly related to the Anacor acquisition and most of which in the first six months of 2016 includes costs, were mostly related to the Anacor acquisition as well as costs associated withand our terminated transaction with Allergan. |
| |
(c) | Integration costs represent external, incremental costs directly related to integrating acquired businesses, and primarily include expenditures for consulting and the integration of systems and processes. In the second quarter and first six months of 2017, integration costs were primarily related to our acquisitions of Hospira and Medivation, including a net gain of $12 million related to the settlement of the Hospira U.S. qualified defined benefit pension plan (see Note 10). In the second quarter and first six months of 2016, integration costs were primarily related to our acquisition of Hospira and the terminated transaction with Allergan. |
PFIZER INC. AND SUBSIDIARY COMPANIES
NOTES TO CONDENSED CONSOLIDATED FINANCIAL STATEMENTS
(UNAUDITED)
costs primarily relate to our acquisition of Hospira and the terminated transaction with Allergan. Integration costs in 2015 represent external incremental costs directly related to our acquisition with Hospira.
| |
(d) | Additional depreciation––asset restructuring represents the impact of changes in the estimated useful lives of assets involved in restructuring actions. |
| |
(e) | Implementation costs represent external, incremental costs directly related to implementing our non-acquisition-related cost-reduction/productivity initiatives. |
|
| | | | | | | | | | | | | | | | |
| The following table provides the components of and changes in our restructuring accruals: |
| (MILLIONS OF DOLLARS) | | Employee Termination Costs |
| | Asset Impairment Charges |
| | Exit Costs |
| | Accrual |
|
Balance, December 31, 2016(a) | | $ | 1,547 |
| | $ | — |
| | $ | 36 |
| | $ | 1,583 |
|
| Provision | | 29 |
| | 24 |
| | 6 |
| | 59 |
|
Utilization and other(b) | | (293 | ) | | (24 | ) | | (6 | ) | | (323 | ) |
Balance, July 2, 2017(c) | | $ | 1,282 |
| | $ | — |
| | $ | 36 |
| | $ | 1,319 |
|
|
| | | | | | | | | | | | | | | | |
| The following table provides the components of and changes in our restructuring accruals: |
| (MILLIONS OF DOLLARS) | | Employee Termination Costs |
| | Asset Impairment Charges |
| | Exit Costs |
| | Accrual |
|
Balance, December 31, 2015(a) | | $ | 1,109 |
| | $ | — |
| | $ | 48 |
| | $ | 1,157 |
|
| Provision | | 117 |
| | 18 |
| | 35 |
| | 170 |
|
Utilization and other(b) | | (248 | ) | | (18 | ) | | (43 | ) | | (309 | ) |
Balance, July 3, 2016(c) | | $ | 978 |
| | $ | — |
| | $ | 40 |
| | $ | 1,018 |
|
| |
(a) | Included in Other current liabilities ($776863 million) and Other noncurrent liabilities ($381720 million). |
| |
(b) | Includes adjustments for foreign currency translation. |
| |
(c) | Included in Other current liabilities ($541602 million) and Other noncurrent liabilities ($477717 million). |
Note 4. Other (Income)/Deductions—Net
| | The following table provides components of Other (income)/deductions––net: | The following table provides components of Other (income)/deductions––net: | The following table provides components of Other (income)/deductions––net: |
| | | Three Months Ended | | Six Months Ended | | Three Months Ended | | Six Months Ended |
| (MILLIONS OF DOLLARS) | | July 3,
2016 |
| | June 28,
2015 |
| | July 3,
2016 |
| | June 28,
2015 |
| | July 2,
2017 |
| | July 3,
2016 |
| | July 2,
2017 |
| | July 3,
2016 |
|
Interest income(a) | | $ | (122 | ) | | $ | (119 | ) | | $ | (234 | ) | | $ | (211 | ) | | $ | (94 | ) | | $ | (122 | ) | | $ | (175 | ) | | $ | (234 | ) |
Interest expense(a) | | 292 |
| | 278 |
| | 598 |
| | 587 |
| | 312 |
| | 292 |
| | 621 |
| | 598 |
|
| Net interest expense | | 170 |
| | 159 |
| | 363 |
| | 375 |
| | 218 |
| | 170 |
| | 446 |
| | 363 |
|
Royalty-related income | | (274 | ) | | (257 | ) | | (461 | ) | | (479 | ) | | (105 | ) | | (274 | ) | | (191 | ) | | (461 | ) |
Certain legal matters, net(b)(c) | | 261 |
| | 99 |
| | 534 |
| | 99 |
| | 3 |
| | 261 |
| | 11 |
| | 534 |
|
Net gains on asset disposals(c)(d) | | (31 | ) | | (19 | ) | | (39 | ) | | (195 | ) | | (62 | ) | | (31 | ) | | (194 | ) | | (39 | ) |
Certain asset impairments(d) | | 816 |
| | 25 |
| | 947 |
| | 25 |
| |
Business and legal entity alignment costs(e) | | 60 |
| | 63 |
| | 111 |
| | 164 |
| |
Other, net(f) | | 66 |
| | (15 | ) | | (57 | ) | | 20 |
| |
Loss on sale of HIS net assets(e) | | | 28 |
| | — |
| | 64 |
| | — |
|
Certain asset impairments(f) | | | — |
| | 816 |
| | 13 |
| | 947 |
|
Business and legal entity alignment costs(g) | | | 17 |
| | 60 |
| | 38 |
| | 111 |
|
Other, net(h) | | | (164 | ) | | 66 |
| | (254 | ) | | (57 | ) |
| Other (income)/deductions––net | | $ | 1,068 |
| | $ | 55 |
| | $ | 1,398 |
| | $ | 9 |
| | $ | (66 | ) | | $ | 1,068 |
| | $ | (68 | ) | | $ | 1,398 |
|
PFIZER INC. AND SUBSIDIARY COMPANIES
NOTES TO CONDENSED CONSOLIDATED FINANCIAL STATEMENTS
(UNAUDITED)
| |
(a) | Interest income increaseddecreased in the second quarter and first six months of 2016,2017, primarily due to higherlower investment returns.returns driven by a lower investment balance. Interest expense increased in the second quarter and first six months of 2016,2017, primarily due toas a result of higher short-term interest on legacy Hospirarates, offset, in part, by the retirement of high-coupon debt acquired in September 2015 and the additionissuance of new fixed rate debt in the second quarter of 2016, partially offset by the maturity of other fixed ratelow-coupon debt. |
| |
(b) | Royalty-related income decreased in the second quarter and first six months of 2017, primarily due to lower royalty income for Enbrel of $157 million and $275 million, respectively, resulting from the expiration on October 31, 2016 of the 36-month royalty period under the collaboration agreement for Enbrel in the U.S. and Canada (the collaboration period under the agreement expired on October 31, 2013), partially offset by the addition of Xtandi royalty-related income of $51 million and $87 million, respectively. |
| |
(c) | In the second quarter and first six months of 2016, primarily includes amounts to resolve a Multi-District Litigation relating to Celebrex and Bextra that was pending against the Company in New York federal court for $486 million, which is subject to the negotiation of a final settlement agreement and court approval, a portion of which was accrued for during the first quarter of 2016 and the full amount of which was accrued for during the first six months of 2016, partially offset by the reversal of a legal accrual where a loss iswas no longer deemed probable. In addition, the first six months of 2016 includes a settlement related to a patent matter. See Note 12A2 for additional information. |
| |
(c)(d)
| In the second quarter of 2017, primarily includes gains on sales and redemptions of investments in equity and debt securities (approximately $64 million) and gains on sales/out-licensing of product and compound rights (approximately $27 million), partially offset by a net loss related to the sale of our 40% ownership investment in Teuto, including the extinguishment of a put option for the remaining 60% ownership interest (approximately $30 million). In the first six months of 2017, primarily includes gains on sales and redemptions of investments in equity and debt securities (approximately $118 million), gains on sales/out-licensing of product and compound rights (approximately $69 million) and a gain on sale of property (approximately $50 million), partially offset by the net loss related to the sale of our investment in Teuto discussed above. In the first six months of 2016, primarily includes gains on sales/out-licensing of product and compound rights (approximately $31 million). In the first six months of 2015, primarily includes gains on sales/out-licensing of product and compound rights (approximately $69 million) and gains on sales of investments in equity securities (approximately $125 million). |
| |
(d)(e)
| In the second quarter and first six months of 2017, represents incremental charges to amounts previously recorded to write down the HIS net assets to fair value less costs to sell related to the sale of HIS net assets to ICU Medical. |
| |
(f) | In the second quarter and first six months of 2016, primarily includes intangible asset impairment charges of $641 million, reflecting (i) $331 million related to developed technology rights for a generic injectable antibiotic product for the treatment of bacterial infections; (ii) $265$265 million related to an IPR&D compound for the treatment of anemia; and (iii) $45 million of other IPR&D assets, all acquired in connection with our acquisition of Hospira and associated with the EH segment. In addition, 2016 includes an impairment loss of $130 million in the second quarter and $211 million in the first six months related to Pfizer’s 49%-owned equity-method investment with Zhejiang Hisun Pharmaceuticals Co., Ltd. in China, Hisun Pfizer, and the first six months of 2016 includes an impairment loss of $50 million related to Pfizer'sPfizer’s 40%-owned equity-method investment in Teuto. For additional information concerning Hisun Pfizer and Teuto, see Note 2C.2D. |
The intangible asset impairment charge for the IPR&D compound for the treatment of anemia reflects, among other things, the impact of regulatory delays, including delays resulting from a recent court ruling, requiring a 180-day waiting period after approval before a biosimilar product can be launched. The intangible asset impairment charges for 2016 for developed technology rights and other IPR&D
PFIZER INC. AND SUBSIDIARY COMPANIES
NOTES TO CONDENSED CONSOLIDATED FINANCIAL STATEMENTS
(UNAUDITED)
assets reflect, among other things, the impact of new scientific findings, updated commercial forecasts, changes in pricing, and an increased competitive environment.
| |
(e)(g)
| In the second quarter and first six months of 20162017 and 2015,2016, represents expenses for changes to our infrastructure to align our commercial operations, including costs to internally separate our businesses into distinct legal entities, as well as to streamline our intercompany supply operations to better support each business. |
| |
(f)(h)
| In the second quarter and first six months of 2017, primarily includes, among other things, dividend income of $114 million and $157 million, respectively, from our investment in ViiV. In the second quarter and first six months of 2016, primarily includes, among other things, $150 million paid to Allergan for reimbursement of Allergan’s expenses associated with the terminated transaction (see Note 1A).transaction. The first six months of 2016 also includes income of $116 million from resolution of a contract disagreement. |
PFIZER INC. AND SUBSIDIARY COMPANIES
NOTES TO CONDENSED CONSOLIDATED FINANCIAL STATEMENTS
(UNAUDITED)
|
| | | | | | | | | | | | | | | | | | | | |
The following table provides additional information about the intangible assets that were impaired during 2016 in Other (income)/deductions––net: |
| | | Fair Value(a) | | Six Months Ended July 3, 2016 |
| (MILLIONS OF DOLLARS) | | Amount | | Level 1 | | Level 2 | | Level 3 | | Impairment |
Intangible assets––IPR&D(b) | | $ | 35 |
| | $ | — |
| | $ | — |
| | $ | 35 |
| | $ | 310 |
|
Intangible assets––Developed technology rights (b) | | 66 |
| | — |
| | — |
| | 66 |
| | 331 |
|
| Total | | $ | 101 |
| | $ | — |
| | $ | — |
| | $ | 101 |
| | $ | 641 |
|
| |
(a)
| The fair value amount is presented as of the date of impairment, as these assets are not measured at fair value on a recurring basis. See also Note 1C.
|
| |
(b)
| Reflects intangible assets written down to fair value in the first six months of 2016. Fair value was determined using the income approach, specifically the multi-period excess earnings method, also known as the discounted cash flow method. We started with a forecast of all the expected net cash flows associated with the asset and then applied an asset-specific discount rate to arrive at a net present value amount. Some of the more significant estimates and assumptions inherent in this approach include: the amount and timing of the projected net cash flows, which includes the expected impact of competitive, legal and/or regulatory forces on the product and the impact of technological risk associated with IPR&D assets; the discount rate, which seeks to reflect the various risks inherent in the projected cash flows; and the tax rate, which seeks to incorporate the geographic diversity of the projected cash flows. |
Note 5. Tax Matters
A. Taxes on Income from Continuing Operations
Our effective tax rate for continuing operations was 15.6%19.4% for the second quarter of 2016,2017, compared to 25.6%14.4% for the second quarter of 20152016 and was 15.2%20.1% for the first six months of 2016,2017, compared to 24.3%14.4% for the first six months of 2015.2016.
The lowerhigher effective tax rate for the second quarter of 20162017 in comparison with the same period in 20152016 was primarily due to:
a favorableto an unfavorable change in the jurisdictional mix of earnings as a result of operating fluctuations in the normal course of business; as well asbusiness.
an increase in benefits associated with the U.S. R&D tax credit, which was not in effect in the prior year quarter but was permanently extended on December 18, 2015.
The lowerhigher effective tax rate for the first six months of 20162017 in comparison with the same period in 20152016 was primarily due to:
the non-recurrence of benefits related to the final resolution of an agreement in principle reached in February 2016 and finalized in April 2016 to resolve certain claims related to Protonix, which resulted in the receipt of information that raised our initial assessment in 2015 of the likelihood of prevailing on the technical merits of our tax position;
a favorable change in the jurisdictional mixnon-recurrence of earnings as a result of operating fluctuations in the normal course of business;
benefits associated with our Venezuela operations;
an increase in benefits associated with the U.S. R&D tax credit, which was not in effect in the first six months of the prior year but was permanently extended on December 18, 2015; as well as
an increasea decrease in tax benefits associated with the resolution of certain tax positions pertaining to prior years primarily with various foreign tax authorities, and the expiration of certain statutes of limitations.limitations,
partially offset by:
PFIZER INC. AND SUBSIDIARY COMPANIES
NOTES TO CONDENSED CONSOLIDATED FINANCIAL STATEMENTS
(UNAUDITED)
the change in the jurisdictional mix of earnings as a result of operating fluctuations in the normal course of business.
B. Tax Contingencies
We are subject to income tax in many jurisdictions, and a certain degree of estimation is required in recording the assets and liabilities related to income taxes. All of our tax positions are subject to audit by the local taxing authorities in each tax jurisdiction. These tax audits can involve complex issues, interpretations and judgments and the resolution of matters may span multiple years, particularly if subject to negotiation or litigation. Our assessments are based on estimates and assumptions that have been deemed reasonable by management, but our estimates of unrecognized tax benefits and potential tax benefits may not be representative of actual outcomes, and variation from such estimates could materially affect our financial statements in the period of settlement or when the statutes of limitations expire, as we treat these events as discrete items in the period of resolution.
The U.S. is one of our major tax jurisdictions, and we are regularly audited by the IRS:
With respect to Pfizer, the IRS has issued a RARRevenue Agent’s Report (RAR) for tax years 2009-2010. We are not in agreement with the RAR and are currently appealing certain disputed issues. Tax years 2011-2013 are currently under audit. Tax years 2014-20162014-2017 are open, but not under audit. All other tax years are closed.
With respect to Hospira, the federal income tax audit of tax years 2010-2011 was effectively settled in the second quarter of 2016. The IRS is currently auditing tax years 2012-2013. Tax years 2014-2015 (through date of acquisition) are open but not under audit.2012-2013 and 2014 through short-year 2015. All other tax years are closed. The open tax years and auditsunder audit for Hospira are not considered material to Pfizer.
With respect to Anacor and Medivation, the open tax years are not considered material to Pfizer.
In addition to the open audit years in the U.S., we have open audit years in other major tax jurisdictions, such as Canada (2010-2016)(2010-2017), Japan (2015-2016)(2015-2017), Europe (2007-2016,(2011-2017, primarily reflecting Ireland, the United Kingdom, France, Italy, Spain and Germany), Latin America (1998-2016,(1998-2017, primarily reflecting Brazil) and Puerto Rico (2010-2016)(2010-2017).
PFIZER INC. AND SUBSIDIARY COMPANIES
NOTES TO CONDENSED CONSOLIDATED FINANCIAL STATEMENTS
(UNAUDITED)
C. Tax Provision/(Benefit) on Other Comprehensive Income/(Loss)Income
|
| | | | | | | | | | | | | | | | |
The following table provides the components of Tax provision/(benefit) on other comprehensive income: |
| | | Three Months Ended | | Six Months Ended |
| (MILLIONS OF DOLLARS) | | July 2,
2017 |
| | July 3,
2016 |
| | July 2,
2017 |
| | July 3,
2016 |
|
Foreign currency translation adjustments, net(a) | | $ | (109 | ) | | $ | (1 | ) | | $ | (130 | ) | | $ | (15 | ) |
| Unrealized holding losses on derivative financial instruments, net | | (1 | ) | | (157 | ) | | 2 |
| | (193 | ) |
| Reclassification adjustments for realized (gains)/losses | | (88 | ) | | 122 |
| | (140 | ) | | 49 |
|
| | | (89 | ) | | (35 | ) | | (138 | ) | | (144 | ) |
| Unrealized holding gains on available-for-sale securities, net | | 18 |
| | 49 |
| | 55 |
| | 65 |
|
| Reclassification adjustments for realized (gains)/losses | | (7 | ) | | (28 | ) | | 4 |
| | (2 | ) |
| | | 11 |
| | 21 |
| | 59 |
| | 63 |
|
| Benefit plans: actuarial gains/(losses), net | | 22 |
| | (8 | ) | | 22 |
| | (8 | ) |
| Reclassification adjustments related to amortization | | 43 |
| | 47 |
| | 92 |
| | 93 |
|
| Reclassification adjustments related to settlements, net | | (4 | ) | | 8 |
| | 8 |
| | 17 |
|
| Other | | (17 | ) | | (9 | ) | | (13 | ) | | (9 | ) |
| | | 43 |
| | 38 |
| | 110 |
| | 93 |
|
| Benefit plans: prior service (costs)/credits and other, net | | — |
| | 31 |
| | — |
| | 31 |
|
| Reclassification adjustments related to amortization | | (17 | ) | | (15 | ) | | (33 | ) | | (30 | ) |
| Reclassification adjustments related to curtailments, net | | (1 | ) | | — |
| | (4 | ) | | (2 | ) |
| Other | | — |
| | (2 | ) | | — |
| | (1 | ) |
| | | (19 | ) | | 14 |
| | (38 | ) | | (3 | ) |
| Tax provision/(benefit) on other comprehensive income | | $ | (163 | ) | | $ | 36 |
| | $ | (138 | ) | | $ | (5 | ) |
|
| | | | | | | | | | | | | | | | |
The following table provides the components of Tax provision/(benefit) on other comprehensive income/(loss): |
| | | Three Months Ended | | Six Months Ended |
| (MILLIONS OF DOLLARS) | | July 3,
2016 |
| | June 28,
2015 |
| | July 3,
2016 |
| | June 28,
2015 |
|
Foreign currency translation adjustments, net(a) | | $ | (1 | ) | | $ | 12 |
| | $ | (15 | ) | | $ | 97 |
|
Unrealized holding gains/(losses) on derivative financial instruments, net | | (157 | ) | | 120 |
| | (193 | ) | | (103 | ) |
| Reclassification adjustments for realized (gains)/losses | | 122 |
| | (155 | ) | | 49 |
| | 28 |
|
| | | (35 | ) | | (34 | ) | | (144 | ) | | (75 | ) |
| Unrealized holding gains/(losses) on available-for-sale securities, net | | 49 |
| | (37 | ) | | 65 |
| | (69 | ) |
| Reclassification adjustments for realized (gains)/losses | | (28 | ) | | 63 |
| | (2 | ) | | 62 |
|
| | | 21 |
| | 25 |
| | 63 |
| | (7 | ) |
| Benefit plans: actuarial gains/(losses), net | | (8 | ) | | (4 | ) | | (8 | ) | | 8 |
|
| Reclassification adjustments related to amortization | | 47 |
| | 45 |
| | 93 |
| | 90 |
|
| Reclassification adjustments related to settlements, net | | 8 |
| | 8 |
| | 17 |
| | 23 |
|
| Other | | (9 | ) | | 1 |
| | (9 | ) | | 38 |
|
| | | 38 |
| | 49 |
| | 93 |
| | 159 |
|
| Benefit plans: prior service credits and other, net | | 31 |
| | 192 |
| | 31 |
| | 191 |
|
| Reclassification adjustments related to amortization | | (15 | ) | | 7 |
| | (30 | ) | | (6 | ) |
| Reclassification adjustments related to curtailments, net | | — |
| | (22 | ) | | (2 | ) | | (26 | ) |
| Other | | (2 | ) | | (1 | ) | | (1 | ) | | (1 | ) |
| | | 14 |
| | 176 |
| | (3 | ) | | 159 |
|
| Tax provision/(benefit) on other comprehensive income/(loss) | | $ | 36 |
| | $ | 228 |
| | $ | (5 | ) | | $ | 332 |
|
| |
(a) | Taxes are not provided for foreign currency translation adjustments relating to investments in international subsidiaries that will be held indefinitely. |
Note 6. Accumulated Other Comprehensive Loss, Excluding Noncontrolling Interests
|
| | | | | | | | | | | | | | | | | | | | | | | | |
The following table provides the changes, net of tax, in Accumulated other comprehensive loss: |
| | | Net Unrealized Gains/(Losses) | | Benefit Plans | | |
| (MILLIONS OF DOLLARS) | | Foreign Currency Translation Adjustments |
| | Derivative Financial Instruments |
| | Available-For-Sale Securities |
| | Actuarial Gains/(Losses) |
| | Prior Service (Costs)/Credits and Other |
| | Accumulated Other Comprehensive Income/(Loss) |
|
| Balance, December 31, 2016 | | $ | (6,659 | ) | | $ | 348 |
| | $ | (131 | ) | | $ | (5,473 | ) | | $ | 879 |
| | $ | (11,036 | ) |
Other comprehensive income/(loss)(a) | | 702 |
| | (410 | ) | | 352 |
| | 276 |
| | (66 | ) | | 855 |
|
| Balance, July 2, 2017 | | $ | (5,957 | ) | | $ | (62 | ) | | $ | 221 |
| | $ | (5,198 | ) | | $ | 814 |
| | $ | (10,181 | ) |
| |
(a) | Amounts do not include foreign currency translation adjustments attributable to noncontrolling interests of $15 million income for the first six months of 2017. |
As of July 2, 2017, with respect to derivative financial instruments, the amount of unrealized pre-tax net losses on derivative financial instruments estimated to be reclassified into income within the next 12 months is approximately $100 million, which is expected to be offset primarily by gains related to available-for-sale securities and gains resulting from reclassification adjustments related to foreign currency exchange-denominated forecasted intercompany inventory sales.
PFIZER INC. AND SUBSIDIARY COMPANIES
NOTES TO CONDENSED CONSOLIDATED FINANCIAL STATEMENTS
(UNAUDITED)
Note 6. Accumulated Other Comprehensive Loss, Excluding Noncontrolling Interests
|
| | | | | | | | | | | | | | | | | | | | | | | | |
The following table provides the changes, net of tax, in Accumulated other comprehensive loss: |
| | | Net Unrealized Gains/(Losses) | | Benefit Plans | | |
| (MILLIONS OF DOLLARS) | | Foreign Currency Translation Adjustments |
| | Derivative Financial Instruments |
| | Available-For-Sale Securities |
| | Actuarial Gains/(Losses) |
| | Prior Service (Costs)/Credits and Other |
| | Accumulated Other Comprehensive Loss |
|
| Balance, December 31, 2015 | | $ | (5,863 | ) | | $ | 421 |
| | $ | (227 | ) | | $ | (4,733 | ) | | $ | 880 |
| | $ | (9,522 | ) |
Other comprehensive income/(loss)(a) | | 598 |
| | (571 | ) | | 399 |
| | 196 |
| | 9 |
| | 630 |
|
| Balance, July 3, 2016 | | $ | (5,265 | ) | | $ | (150 | ) | | $ | 172 |
| | $ | (4,538 | ) | | $ | 889 |
| | $ | (8,891 | ) |
| |
(a)
| Amounts do not include foreign currency translation adjustments attributable to noncontrolling interests of $1 million loss for the first six months of 2016.
|
As of July 3, 2016, with respect to derivative financial instruments, the amount of unrealized pre-tax losses estimated to be reclassified into income within the next 12 months is $79 million (which is expected to be offset primarily by gains resulting from reclassification adjustments related to foreign currency exchange-denominated intercompany sales).
PFIZER INC. AND SUBSIDIARY COMPANIES
NOTES TO CONDENSED CONSOLIDATED FINANCIAL STATEMENTS
(UNAUDITED)
Note 7. Financial Instruments
A. Selected Financial Assets and Liabilities
| | The following table provides additional information about certain of our financial assets and liabilities: | | (MILLIONS OF DOLLARS) | | July 3,
2016 |
| | December 31,
2015 |
| | July 2,
2017 |
| | December 31,
2016 |
|
Selected financial assets measured at fair value on a recurring basis(a) | | | | | | | | |
Trading funds(b) | | $ | 240 |
| | $ | 287 |
| |
Trading funds and securities(b) | | | $ | 323 |
| | $ | 325 |
|
Available-for-sale debt securities(c) | | 27,374 |
| | 32,078 |
| | 14,995 |
| | 18,632 |
|
| Money market funds | | 1,113 |
| | 934 |
| | 1,021 |
| | 1,445 |
|
Available-for-sale equity securities(c) | | 584 |
| | 603 |
| | 488 |
| | 540 |
|
Derivative financial instruments in a receivable position(d): | | |
| | |
| | |
| | |
|
| Interest rate swaps | | 1,978 |
| | 837 |
| | 640 |
| | 625 |
|
| Foreign currency swaps | | 92 |
| | 135 |
| | 34 |
| | 79 |
|
| Foreign currency forward-exchange contracts | | 188 |
| | 559 |
| | 144 |
| | 551 |
|
| | | 31,569 |
| | 35,433 |
| | 17,645 |
| | 22,198 |
|
| Other selected financial assets | | |
| | |
| | |
| | |
|
Held-to-maturity debt securities, carried at amortized cost(c), (e) | | 1,166 |
| | 1,388 |
| | 1,554 |
| | 1,242 |
|
Private equity securities, carried at equity-method or at cost(e), (f) | | 1,027 |
| | 1,336 |
| |
Restricted stock and private equity securities, carried at cost or at equity-method(e), (f) | | | 1,125 |
| | 735 |
|
| | | 2,193 |
| | 2,724 |
| | 2,678 |
| | 1,977 |
|
| Total selected financial assets | | $ | 33,762 |
| | $ | 38,157 |
| | $ | 20,323 |
| | $ | 24,175 |
|
Selected financial liabilities measured at fair value on a recurring basis(a) | | |
| | |
| | |
| | |
|
Derivative financial instruments in a liability position(g): | | |
| | |
| | |
| | |
|
| Interest rate swaps | | $ | 4 |
| | $ | 139 |
| | $ | 166 |
| | $ | 148 |
|
| Foreign currency swaps | | 1,432 |
| | 1,489 |
| | 939 |
| | 1,374 |
|
| Foreign currency forward-exchange contracts | | 366 |
| | 81 |
| | 254 |
| | 143 |
|
| | | 1,802 |
| | 1,709 |
| | 1,359 |
| | 1,665 |
|
| Other selected financial liabilities | | |
| | |
| | |
| | |
|
| Short-term borrowings: | | | | | | | | |
| Principal amount | | 13,442 |
| | 10,160 |
| | 9,523 |
| | 10,674 |
|
| Net fair value adjustments related to hedging and purchase accounting | | 290 |
| | 2 |
| | 4 |
| | 24 |
|
Net unamortized discounts, premiums and debt issuance costs(h) | | (8 | ) | | (3 | ) | |
| Net unamortized discounts, premiums and debt issuance costs | | | (14 | ) | | (11 | ) |
Total short-term borrowings, carried at historical proceeds, as adjusted(e) | | 13,724 |
| | 10,159 |
| | 9,514 |
| | 10,688 |
|
| Long-term debt: | | | | | | | | |
| Principal amount | | 28,113 |
| | 27,573 |
| | 33,357 |
| | 30,529 |
|
| Net fair value adjustments related to hedging and purchase accounting | | 2,432 |
| | 1,294 |
| | 986 |
| | 998 |
|
Net unamortized discounts, premiums and debt issuance costs(h) | | (87 | ) | | (127 | ) | |
| Net unamortized discounts, premiums and debt issuance costs | | | (151 | ) | | (130 | ) |
Total long-term debt, carried at historical proceeds, as adjusted(i)(h) | | 30,457 |
| | 28,740 |
| | 34,191 |
| | 31,398 |
|
| | | 44,181 |
| | 38,899 |
| | 43,705 |
| | 42,085 |
|
| Total selected financial liabilities | | $ | 45,983 |
| | $ | 40,608 |
| | $ | 45,064 |
| | $ | 43,750 |
|
| |
(a) | We use a market approach in valuing financial instruments on a recurring basis. For additional information, see Note 1C. All of our financial assets and liabilities measured at fair value on a recurring basis use Level 2 inputs in the calculation of fair value, except less than 1%4% that use Level 1 inputs and money market funds that are measured at net asset value. |
| |
(b) | As of July 3, 2016,2, 2017, trading funds and securities are composed of $184$244 million of trading equity funds and $57$78 million of trading debt funds. As of December 31, 2015,2016, trading funds and securities are composed of $185$236 million of trading equity funds and $102$89 million of trading debt funds. As of July 3, 20162, 2017 and December 31, 2015,2016, trading equity funds of $66$55 million and $85$71 million, respectively, are held in trust for benefits attributable to the former Pharmacia Savings Plus Plan. |
| |
(c) | Gross unrealized gains and losses are not significant. |
| |
(d) | Designated as hedging instruments, except for certain contracts used as offsets; namely, foreign currency forward-exchange contracts with fair values of $77$60 million as of July 3, 2016;2, 2017; and foreign currency forward-exchange contracts with fair values of $136$162 million as of December 31, 2015.2016. |
| |
(e) | The differences between the estimated fair values and carrying values of held-to-maturity debt securities, private equity securities at cost and short-term borrowings not measured at fair value on a recurring basis were not significant as of July 3, 20162, 2017 or December 31, 2015.2016. The fair value measurements of our held-to-maturity debt securities and our short-term borrowings are based on Level 2 inputs, using a market approach. The fair value measurements of our private equity securities carried at cost are based on Level 3 inputs. Short-term borrowings include foreign currency short-term borrowings with fair values of $547 million as of December 31, 2015, which are used as hedging instruments. |
PFIZER INC. AND SUBSIDIARY COMPANIES
NOTES TO CONDENSED CONSOLIDATED FINANCIAL STATEMENTS
(UNAUDITED)
| |
(f) | Restricted stock as of July 2, 2017 is primarily composed of $428 million representing the value of 3.2 million shares of ICU Medical common stock received on February 3, 2017, with a fair value of $544 million as of July 2, 2017 based on the closing price of ICU Medical common stock less a discount for lack of marketability. See Note 2B for additional information. Our privateprivate equity securities represent investments in the life sciences sector. |
| |
(g) | Designated as hedging instruments, except for certain contracts used as offsets; namely, foreign currency forward-exchange contracts with fair values of $72 million as of July 2, 2017; and foreign currency swaps with fair values of $213$269 million and foreign currency forward-exchange contracts with fair values of $116$113 million as of July 3, 2016; and foreign currency swaps with fair values of $234 million and foreign currency forward-exchange contracts with fair values of $59 million as of December 31, 2015. |
| |
(h)
| We adopted a new standard as of January 1, 2016 that changed the presentation of debt issuance costs related to a recognized debt liability as a direct deduction from the carrying value of that associated debt, consistent with the presentation of a debt discount. See Note 1B for additional information..
|
| |
(i)(h)
| The fair value of our long-term debt (not including the current portion of long-term debt) was $34.6$38.5 billion as of July 3, 20162, 2017 and $32.7$34.9 billion as of December 31, 2015.2016. The fair value measurements for our long-term debt are based on Level 2 inputs, using a market approach. Generally, the difference between theLong-term debt includes foreign currency long-term borrowings with fair valuevalues of our long-term debt and the amount reported on the condensed consolidated balance sheet is due to a decline in relative market interest rates since the debt issuance.$4.5 billion as of July 2, 2017, which are used as hedging instruments. |
|
| | | | | | | | |
| The following table provides the classification of these selected financial assets and liabilities in our condensed consolidated balance sheets: |
| (MILLIONS OF DOLLARS) | | July 2,
2017 |
| | December 31,
2016 |
|
| Assets | | | | |
| Cash and cash equivalents | | $ | 749 |
| | $ | 547 |
|
| Short-term investments | | 11,748 |
| | 15,255 |
|
Other current assets(a) | | 251 |
| | 567 |
|
| Long-term investments | | 7,008 |
| | 7,116 |
|
Other noncurrent assets(b) | | 568 |
| | 689 |
|
| | | $ | 20,323 |
| | $ | 24,175 |
|
| Liabilities | | |
| | |
|
| Short-term borrowings, including current portion of long-term debt | | $ | 9,514 |
| | $ | 10,688 |
|
Other current liabilities(c) | | 234 |
| | 443 |
|
| Long-term debt | | 34,191 |
| | 31,398 |
|
Other noncurrent liabilities(d) | | 1,125 |
| | 1,222 |
|
| | | $ | 45,064 |
| | $ | 43,750 |
|
|
| | | | | | | | |
| The following table provides the classification of these selected financial assets and liabilities in our condensed consolidated balance sheets: |
| (MILLIONS OF DOLLARS) | | July 3,
2016 |
| | December 31,
2015 |
|
| Assets | | | | |
| Cash and cash equivalents | | $ | 848 |
| | $ | 978 |
|
| Short-term investments | | 17,531 |
| | 19,649 |
|
| Long-term investments | | 13,124 |
| | 15,999 |
|
Other current assets(a) | | 304 |
| | 587 |
|
Other noncurrent assets(b) | | 1,954 |
| | 944 |
|
| | | $ | 33,762 |
| | $ | 38,157 |
|
| Liabilities | | |
| | |
|
Short-term borrowings, including current portion of long-term debt(c) | | $ | 13,724 |
| | $ | 10,159 |
|
Other current liabilities(d) | | 606 |
| | 645 |
|
Long-term debt(c) | | 30,457 |
| | 28,740 |
|
Other noncurrent liabilities(e) | | 1,196 |
| | 1,064 |
|
| | | $ | 45,983 |
| | $ | 40,608 |
|
| |
(a) | As of July 3, 2016,2, 2017, derivative instruments at fair value include interest rate swaps ($58106 million), foreign currency swaps ($718 million) and foreign currency forward-exchange contracts ($175137 million) and, as of December 31, 2015,2016, include interest rate swaps ($226 million), foreign currency swaps ($4643 million) and foreign currency forward-exchange contracts ($538497 million). |
| |
(b) | As of July 3, 2016,2, 2017, derivative instruments at fair value include interest rate swaps ($1.9 billion)534 million), foreign currency swaps ($2127 million) and foreign currency forward-exchange contracts ($147 million) and, as of December 31, 2015,2016, include interest rate swaps ($835599 million), foreign currency swaps ($8936 million) and foreign currency forward-exchange contracts ($2054 million). |
| |
(c)
| We adopted a new standard as of January 1, 2016 that changed the presentation of debt issuance costs related to a recognized debt liability as a direct deduction from the carrying value of that associated debt, consistent with the presentation of a debt discount. See Note 1B for additional information.
|
| |
(d)(c)
| As of July 3, 2016,2, 2017, derivative instruments at fair value include interest rate swaps ($3 million), foreign currency swaps ($2655 million) and foreign currency forward-exchange contracts ($338229 million) and, as of December 31, 2015, include interest rate swaps ($5 million)2016, foreign currency swaps ($560 million) and foreign currency forward-exchange contracts ($80 million). |
| |
(e)
| As of July 3, 2016, derivative instruments at fair value include interest rate swaps ($1 million), foreign currency swaps ($1.2 billion) and foreign currency forward-exchange contracts ($28 million) and, as of December 31, 2015, include interest rate swaps ($134 million), foreign currency swaps ($928300 million) and foreign currency forward-exchange contracts ($1143 million). |
| |
(d) | As of July 2, 2017, derivative instruments at fair value include interest rate swaps ($166 million), foreign currency swaps ($933 million) and foreign currency forward-exchange contracts ($26 million) and, as of December 31, 2016, include interest rate swaps ($147 million) and foreign currency swaps ($1.1 billion). |
There were no significant impairments of financial assets recognized in any period presented.
PFIZER INC. AND SUBSIDIARY COMPANIES
NOTES TO CONDENSED CONSOLIDATED FINANCIAL STATEMENTS
(UNAUDITED)
B. Investments in Debt Securities
| | The following table provides the contractual maturities, or as necessary, the estimated maturities, of the available-for-sale and held-to-maturity debt securities: | | | | Years | | July 3,
2016 |
| | Years | | July 2,
2017 |
|
| (MILLIONS OF DOLLARS) | | Within 1 |
| | Over 1 to 5 |
| | Over 5 to 10 |
| | Over 10 |
| | Total |
| | Within 1 |
| | Over 1 to 5 |
| | Over 5 to 10 |
| | Over 10 |
| | Total |
|
| Available-for-sale debt securities | | | | | | | | | | | | | | | | | | | | |
Corporate debt(a) | | $ | 4,136 |
| | $ | 4,623 |
| | $ | 1,707 |
| | $ | 33 |
| | $ | 10,499 |
| | $ | 2,561 |
| | $ | 2,613 |
| | $ | 1,579 |
| | $ | 16 |
| | $ | 6,770 |
|
Western European, Asian, Scandinavian and other government debt(b) | | 7,063 |
| | 666 |
| | 8 |
| | — |
| | 7,738 |
| |
| Federal Home Loan Mortgage Corporation and Federal National Mortgage Association asset-backed securities | | 78 |
| | 2,196 |
| | 58 |
| | — |
| | 2,332 |
| |
Western European, Asian, and other government debt(b) | | | 4,863 |
| | 377 |
| | — |
| | — |
| | 5,240 |
|
Western European, Scandinavian and other government agency debt(b) | | | 1,120 |
| | 46 |
| | 6 |
| | — |
| | 1,172 |
|
| Government National Mortgage Association and other U.S. government guaranteed asset-backed securities | | | 404 |
| | 84 |
| | — |
| | — |
| | 488 |
|
Other asset-backed debt(c) | | | 302 |
| | 102 |
| | 4 |
| | — |
| | 408 |
|
| U.S. government debt | | 1,302 |
| | 508 |
| | 210 |
| | — |
| | 2,020 |
| | 328 |
| | 35 |
| | 9 |
| | — |
| | 371 |
|
Western European, Scandinavian and other government agency debt(b) | | 1,700 |
| | 162 |
| | — |
| | — |
| | 1,862 |
| |
Supranational debt(b) | | 804 |
| | 375 |
| | — |
| | — |
| | 1,179 |
| | 351 |
| | 194 |
| | — |
| | — |
| | 546 |
|
Other asset-backed debt(c) | | 411 |
| | 592 |
| | 31 |
| | 3 |
| | 1,037 |
| |
| Government National Mortgage Association and other U.S. government guaranteed asset-backed securities | | 620 |
| | 69 |
| | 17 |
| | — |
| | 706 |
| |
| Held-to-maturity debt securities | | | | | | |
| | | | |
| | | | | | |
| | | | |
|
| Time deposits and other | | 1,149 |
| | 1 |
| | — |
| | — |
| | 1,151 |
| | 1,275 |
| | — |
| | 3 |
| | — |
| | 1,279 |
|
Western European government debt(b) | | 15 |
| | — |
| | — |
| | — |
| | 15 |
| | 275 |
| | — |
| | — |
| | — |
| | 275 |
|
| Total debt securities | | $ | 17,279 |
| | $ | 9,193 |
| | $ | 2,031 |
| | $ | 36 |
| | $ | 28,539 |
| | $ | 11,479 |
| | $ | 3,452 |
| | $ | 1,601 |
| | $ | 16 |
| | $ | 16,548 |
|
| |
(a) | Issued by a diverse group of corporations, largely consisting of financial institutions, virtuallywith a significant concentration in the technology and energy sectors, all of which are investment-grade. |
| |
(b) | Issued by governments, government agencies or supranational entities, as applicable, all of which are investment-grade.high quality. |
| |
(c) | Includes receivable-backed, loan-backed, receivable-backed, and mortgage-backed securities, all of which are investment-gradehigh quality and in senior positions in the capital structure of the security. Loan-backedReceivable-backed securities are collateralized by credit cards receivables, loan-backed securities are collateralized by senior secured obligations of a diverse pool of companies or student loans, and receivable-backed securities are collateralized by credit cards receivables. Mortgage-backedmortgage-backed securities are collateralized by diversified pools of residential and commercial mortgages. These securities are valued by third party models that use significant inputs derived from observable market data like prepayment rates, default rates, and recovery rates. |
C. Short-Term Borrowings
Short-term borrowings include amounts for commercial paper of $8.0$6.1 billion as of July 3, 20162, 2017 and $4.9$5.8 billion as of December 31, 2015.2016.
Our short-term debt increased due to the addition of legacy Anacor debt, recorded at the June 24, 2016 acquisition date fair value of $698 million. This debt is redeemable into cash at that amount by August 12, 2016, and otherwise redeemable through the maturity date by the note holders in accordance with the terms of the relevant indenture. As of July 3, 2016, $239 million of the debt has been redeemed.
|
| | | | |
| The following table provides the components of unsecured short-term debt assumed from Anacor: |
| (MILLIONS OF DOLLARS) | | As of July 3, 2016 |
|
| 2.00% Notes (Maturity Date 2021) | | $ | 184 |
|
| 2.00% Notes (Maturity Date 2023) | | 275 |
|
| Total short-term debt assumed from Anacor | | $ | 459 |
|
D. Long-Term Debt
On June 3, 2016, we completed a public offering of $5.0 billion aggregate principal amount of senior unsecured notes. The notes are redeemable, in whole or in part, at any time at our option, at a redemption price equal to the greater of 100% of the principal amount of the notes or the sum of the present value of the remaining scheduled payments of principal and interest |
| | | | | | | | | | |
| The following table provides the amounts of senior unsecured long-term debt issued in the first quarter of 2017: |
| | | | | Principal |
| | | | | As of July 2, 2017 |
| (MILLIONS) | | Maturity Date | | Euro |
| | U.S. Dollar |
|
| 3-month EURIBOR + 0.20% floating rate notes (0% floor) | | March 6, 2019 | | € | 1,250 |
| | $ | 1,427 |
|
0.00% euro notes(a) | | March 6, 2020 | | 1,000 |
| | 1,141 |
|
0.25% euro notes(a) | | March 6, 2022 | | 1,000 |
| | 1,141 |
|
1.00% euro notes(a) | | March 6, 2027 | | 750 |
| | 856 |
|
Total euro long-term debt issued in the first quarter of 2017(b) | | | | € | 4,000 |
| | $ | 4,566 |
|
4.20% notes(c) | | March 17, 2047 | | | | 1,065 |
|
Total long-term debt issued in the first quarter of 2017(d) | | | | | | $ | 5,631 |
|
| |
(a) | Redeemable at any time, in whole, or in part, at our option prior to 30 to 90 days of maturity date at the comparable German government bond rate, plus 0.15%; plus, in each case, accrued and unpaid interest. The fixed rate euro notes are also redeemable at our option, in whole, or in part, within 30 to 90 days of maturity date. |
| |
(b) | The weighted-average effective interest rate for the euro notes at issuance was 0.23%. |
| |
(c) | The notes, issued in U.S. dollars in Taiwan, are redeemable, at our option, in whole but not in part, on each March 17 on or after March 17, 2020. |
PFIZER INC. AND SUBSIDIARY COMPANIES
NOTES TO CONDENSED CONSOLIDATED FINANCIAL STATEMENTS
(UNAUDITED)
| |
(d) | The aggregate amount at issuance date was $5,279 million. The increase in the amount since the date of issuance is due to foreign currency exchange. |
|
| | | | | | | | | | | | | | | | | | | | | | | | |
The following table provides the maturity schedule of our Long-term debt outstanding as of July 2, 2017: |
| (MILLIONS OF DOLLARS) | | 2018 | | 2019 | | 2020 | | 2021 | | After 2021 | | Total |
| Maturities | | $ | 484 |
| | $ | 4,774 |
| | $ | 1,494 |
| | $ | 4,418 |
| | $ | 23,021 |
| | $ | 34,191 |
|
discounted at the U.S. Treasury rate, plus an incremental spread ranging between 0.5% and 0.15%, depending on the maturity; plus, in each case, accrued and unpaid interest. Interest is payable semi-annually.
|
| | | | | | |
| The following table provides the principal amounts and components of unsecured long-term debt issued in the second quarter of 2016: |
| (MILLIONS OF DOLLARS) | | Maturity Date | | As of July 3, 2016 |
|
| 1.20% Notes (2018 Notes) | | June 1, 2018 | | $ | 1,250 |
|
| 1.45% Notes (2019 Notes) | | June 3, 2019 | | 850 |
|
| 1.95% Notes (2021 Notes) | | June 3, 2021 | | 1,150 |
|
| 2.75% Notes (2026 Notes) | | June 3, 2026 | | 1,250 |
|
| 4.40% Notes (2044 Notes) | | May 15, 2044 | | 500 |
|
| Total long-term debt issued in the second quarter of 2016 | | | | $ | 5,000 |
|
|
| | | | | | | | | | | | | | | | | | | | | | | | |
The following table provides the maturity schedule of our Long-term debt outstanding as of July 3, 2016: |
| (MILLIONS OF DOLLARS) | | 2017 | | 2018 | | 2019 | | 2020 | | After 2020 | | Total |
| Maturities | | $ | — |
| | $ | 3,628 |
| | $ | 5,710 |
| | $ | 385 |
| | $ | 20,735 |
| | $ | 30,457 |
|
E. Other Noncurrent Liabilities
In June 2017, the EU approved Besponsa (inotuzumab ozogamicin) as monotherapy for the treatment of adults with relapsed or refractory CD22-positive B-cell precursor acute lymphoblastic leukemia. In connection with this approval, we incurred an obligation to make guaranteed fixed annual payments over a nine year period aggregating $148 million related to a research and development arrangement. As a result, we recorded the estimated net present value of $118 million as an intangible asset in Developed technology rights, and $115 million in Other noncurrent liabilities and$3 million in Other current liabilities in the second quarter of 2017.
F. Derivative Financial Instruments and Hedging Activities
Foreign Exchange Risk
As of July 3, 2016,2, 2017, the aggregate notional amount of foreign exchange derivative financial instruments hedging or offsetting foreign currency exposures was $31.5$26.4 billion. The derivative financial instruments primarily hedge or offset exposures in the euro Japanese yen and U.K. pound. The maximum length of time over which we are hedging future foreign exchange cash flow relates to our 2.0$1.9 billion U.K. pound debt maturing in 2038.
We designate foreign currency forward-exchange contracts as cash flow hedges of a portion of our forecasted euro, Japanese yen, U.K. pound, Canadian dollar, and Australian dollar-denominated intercompany inventory sales expected to occur no more than two years from the date of each hedge. As of July 2, 2017, the notional amount of outstanding foreign currency forward-exchange contracts hedging our intercompany forecasted sales was $3.5 billion, with a pre-tax loss of $23 million deferred in Accumulated other comprehensive loss. Based on quarter-end foreign exchange rates that are subject to change, we expect to reclassify a pre-tax loss of $2 million within the next 12 months into Cost of sales. We recognized a $26 million gain in the second quarter of 2017 and a $71 million gain in the first six months of 2017 as an offset to Cost of sales.
Interest Rate Risk
As of July 3, 2016,2, 2017, the aggregate notional amount of interest rate derivative financial instruments designated as fair value hedges was $19.7$12.4 billion. The derivative financial instruments primarily hedge U.S. dollar and euro fixed-rate debt.
PFIZER INC. AND SUBSIDIARY COMPANIES
NOTES TO CONDENSED CONSOLIDATED FINANCIAL STATEMENTS
(UNAUDITED)
| | The following table provides information about the gains/(losses) incurred to hedge or offset operational foreign exchange or interest rate risk: | | | | Three Months Ended | | Three Months Ended |
| | | Amount of Gains/(Losses) Recognized in OID(a), (b), (c) | | Amount of Gains/(Losses) Recognized in OCI (Effective Portion)(a), (d) | | Amount of Gains/(Losses) Reclassified from OCI into OID (Effective Portion)(a), (d) | | Amount of Gains/(Losses) Recognized in OID(a), (b), (c) | | Amount of Gains/(Losses) Recognized in OCI (Effective Portion)(a), (d) | | Amount of Gains/(Losses) Reclassified from OCI into OID and COS (Effective Portion)(a), (d) |
| (MILLIONS OF DOLLARS) | | July 3,
2016 |
| | June 28,
2015 |
| | July 3,
2016 |
| | June 28,
2015 |
| | July 3,
2016 |
| | June 28,
2015 |
| | July 2,
2017 |
| | July 3,
2016 |
| | July 2,
2017 |
| | July 3,
2016 |
| | July 2,
2017 |
| | July 3,
2016 |
|
| Derivative Financial Instruments in Cash Flow Hedge Relationships: | | | | | | | | | | | | | | | | | | | | | | | | |
| Foreign currency swaps | | $ | — |
| | $ | — |
| | $ | (345 | ) | | $ | 234 |
| | $ | (243 | ) | | $ | 240 |
| | $ | — |
| | $ | — |
| | $ | 149 |
| | $ | (345 | ) | | $ | 225 |
| | $ | (243 | ) |
| Foreign currency forward-exchange contracts | | (2 | ) | | — |
| | (227 | ) | | 204 |
| | (226 | ) | | 502 |
| | (4 | ) | | (2 | ) | | (239 | ) | | (227 | ) | | (17 | ) | | (226 | ) |
| Derivative Financial Instruments in Net Investment Hedge Relationships: | | |
| | |
| | |
| | |
| | |
| | |
| | |
| | |
| | |
| | |
| | |
| | |
|
| Foreign currency forward-exchange contracts | | 3 |
| | — |
| | (3 | ) | | 10 |
| | — |
| | — |
| | — |
| | 3 |
| | — |
| | (3 | ) | | — |
| | — |
|
| | | | | | | | | | | | | | | | | | | | | | | | | |
| Derivative Financial Instruments Not Designated as Hedges: | | |
| | |
| | |
| | |
| | |
| | |
| | |
| | |
| | |
| | |
| | |
| | |
|
| Foreign currency forward-exchange contracts | | (46 | ) | | (73 | ) | | — |
| | — |
| | — |
| | — |
| | (3 | ) | | (46 | ) | | — |
| | — |
| | — |
| | — |
|
| Foreign currency swaps | | (3 | ) | | (2 | ) | | — |
| | — |
| | — |
| | — |
| | (2 | ) | | (3 | ) | | — |
| | — |
| | — |
| | — |
|
| | | | | | | | | | | | | | | | | | | | | | | | | |
| Non-Derivative Financial Instruments in Net Investment Hedge Relationships: | | |
| | |
| | |
| | |
| | |
| | |
| | |
| | |
| | |
| | |
| | |
| | |
|
| Foreign currency short-term borrowings | | — |
| | — |
| | — |
| | 21 |
| | — |
| | — |
| |
| All other net | | — |
| | — |
| | — |
| | 14 |
| | — |
| | — |
| |
| Foreign currency long-term debt | | | — |
| | — |
| | (295 | ) | | — |
| | — |
| | — |
|
| | | $ | (48 | ) | | $ | (75 | ) | | $ | (575 | ) | | $ | 483 |
| | $ | (470 | ) | | $ | 743 |
| | $ | (9 | ) | | $ | (48 | ) | | $ | (384 | ) | | $ | (575 | ) | | $ | 208 |
| | $ | (470 | ) |
| | | | | | | | | | | | | | | | | | | | | | | | | |
| | | Six Months Ended | | Six Months Ended |
| | | Amount of Gains/(Losses) Recognized in OID(a), (b), (c) | | Amount of Gains/(Losses) Recognized in OCI (Effective Portion)(a), (d) | | Amount of Gains/(Losses) Reclassified from OCI into OID (Effective Portion)(a), (d) | | Amount of Gains/(Losses) Recognized in OID(a), (b), (c) | | Amount of Gains/(Losses) Recognized in OCI (Effective Portion)(a), (d) | | Amount of Gains/(Losses) Reclassified from OCI into OID and COS (Effective Portion)(a), (d) |
| (MILLIONS OF DOLLARS) | | July 3,
2016 |
| | June 28,
2015 |
| | July 3,
2016 |
| | June 28,
2015 |
| | July 3,
2016 |
| | June 28,
2015 |
| | July 2,
2017 |
| | July 3,
2016 |
| | July 2,
2017 |
| | July 3,
2016 |
| | July 2,
2017 |
| | July 3,
2016 |
|
| Derivative Financial Instruments in Cash Flow Hedge Relationships: | | | | | | | | | | | | | | | | | | | | | | | | |
| Foreign currency swaps | | $ | — |
| | $ | — |
| | $ | (290 | ) | | $ | (498 | ) | | $ | (126 | ) | | $ | (365 | ) | | $ | — |
| | $ | — |
| | $ | 237 |
| | $ | (290 | ) | | $ | 271 |
| | $ | (126 | ) |
| Foreign currency forward-exchange contracts | | (1 | ) | | — |
| | (558 | ) | | 621 |
| | (8 | ) | | 875 |
| | (6 | ) | | (1 | ) | | (335 | ) | | (558 | ) | | 178 |
| | (8 | ) |
| Derivative Financial Instruments in Net Investment Hedge Relationships: | | |
| | |
| | |
| | |
| | |
| | |
| | |
| | |
| | |
| | |
| | |
| | |
|
| Foreign currency forward-exchange contracts | | 1 |
| | 2 |
| | (15 | ) | | 259 |
| | — |
| | — |
| | — |
| | 1 |
| | — |
| | (15 | ) | | — |
| | — |
|
| | | | | | | | | | | | | | | | | | | | | | | | | |
| Derivative Financial Instruments Not Designated as Hedges: | | |
| | |
| | |
| | |
| | |
| | |
| | |
| | |
| | |
| | |
| | |
| | |
|
| Foreign currency forward-exchange contracts | | (69 | ) | | (113 | ) | | — |
| | — |
| | — |
| | — |
| | (144 | ) | | (69 | ) | | — |
| | — |
| | — |
| | — |
|
| Foreign currency swaps | | (4 | ) | | (2 | ) | | — |
| | — |
| | — |
| | — |
| | (1 | ) | | (4 | ) | | — |
| | — |
| | — |
| | — |
|
| | | | | | | | | | | | | | | | | | | | | | | | | |
| Non-Derivative Financial Instruments in Net Investment Hedge Relationships: | | |
| | |
| | |
| | |
| | |
| | |
| | |
| | |
| | |
| | |
| | |
| | |
|
| Foreign currency short-term borrowings | | — |
| | — |
| | (26 | ) | | 19 |
| | — |
| | — |
| | — |
| | — |
| | — |
| | (26 | ) | | — |
| | — |
|
| All other net | | — |
| | — |
| | — |
| | 14 |
| | — |
| | — |
| |
| Foreign currency long-term debt | | | — |
| | — |
| | (352 | ) | | — |
| | — |
| | — |
|
| | | $ | (73 | ) | | $ | (113 | ) | | $ | (889 | ) | | $ | 416 |
| | $ | (134 | ) | | $ | 510 |
| | $ | (151 | ) | | $ | (73 | ) | | $ | (450 | ) | | $ | (889 | ) | | $ | 450 |
| | $ | (134 | ) |
| |
(a) | OID = Other (income)/deductions—net, included in Other (income)/deductions—net in the condensed consolidated statements of income. OCIincome. COS = Other comprehensive income/(loss),Cost of sales, included in Cost of sales in thecondensed consolidated statements of comprehensive income.income. |
OCI = Other comprehensive income/(loss), included in thecondensed consolidated statements of comprehensive income.
| |
(b) | Also, includesIncludes gains and losses attributable to derivative instruments designated and qualifying as fair value hedges (primarily interest rate swaps), as well as the offsetting gains and losses attributable to the hedged items in such hedging relationships. |
| |
(c) | There was no significant ineffectiveness for any period presented. |
PFIZER INC. AND SUBSIDIARY COMPANIES
NOTES TO CONDENSED CONSOLIDATED FINANCIAL STATEMENTS
(UNAUDITED)
| |
(d) | For derivative financial instruments in cash flow hedge relationships, the effective portion is included in Other comprehensive income/(loss)––Unrealized holding losses on derivative financial instruments, net. For derivative financial instruments in net investment hedge relationships and for foreign currency debt designated as hedging instruments, the effective portion is included in Other comprehensive income/(loss)––Foreign currency translation adjustments, net. |
For information about the fair value of our derivative financial instruments, and the impact on our condensed consolidated balance sheets, see Note 7A above. Certain of our derivative instruments are covered by associated credit-support agreements that have credit-risk-related contingent features designed to reduce our counterparties’ exposure to our risk of defaulting on amounts owed. As of July 3, 2016,2, 2017, the aggregate fair value of these derivative instruments that are in a net liability position was $805$409 million, for which we have posted collateral of $806$400 million in the normal course of business. If there had been a ratings downgrade, to below an A rating by S&P or the equivalent rating by Moody’s, on July 3, 2016, we would not have been required to post an additional $4 million ofany collateral to our counterparties. The collateral advanced receivables are reported in Short-term investments.counterparties.
F.G. Credit Risk
On an ongoing basis, we review the creditworthiness of counterparties to our foreign exchange and interest rate agreements and do not expect to incur a significant loss from failure of any counterparties to perform under the agreements. There are no significant concentrations of credit risk related to our financial instruments with any individual counterparty.counterparty, except for certain significant customers. As of July 3, 2016,2, 2017, we had $2.1 billionamounts due from a well-diversified, highly ratedhigh quality group (S&P ratings of mostly A or better) of bank counterparties($959 million), technology ($941 million) and energy sector ($806 million) companies around the world. For details about our investments, see Note 7B above.
In general, there is no requirement for collateral from customers. However, derivative financial instruments are executed under credit-support agreements that provide for the ability to request collateral payments depending on levels of exposure.exposure, our credit rating and the credit rating of the counterparty. As of July 3, 2016,2, 2017, we received cash collateral of $859$279 million from various counterparties. The collateral primarily supports the approximate fair value of our derivative contracts. With respect to the collateral received, the obligations are reported in Short-term borrowings, including current portion of long-term debt.
Note 8. Inventories
|
| | | | | | | | |
The following table provides the components of Inventories: |
| (MILLIONS OF DOLLARS) | | July 2,
2017 |
| | December 31,
2016 |
|
| Finished goods | | $ | 2,911 |
| | $ | 2,293 |
|
| Work-in-process | | 3,860 |
| | 3,696 |
|
| Raw materials and supplies | | 813 |
| | 793 |
|
Inventories(a) | | $ | 7,584 |
| | $ | 6,783 |
|
Noncurrent inventories not included above(b) | | $ | 754 |
| | $ | 683 |
|
|
| | | | | | | | |
The following table provides the components of Inventories: |
| (MILLIONS OF DOLLARS) | | July 3,
2016 |
| | December 31,
2015 |
|
| Finished goods | | $ | 2,734 |
| | $ | 2,714 |
|
| Work-in-process | | 3,931 |
| | 3,932 |
|
| Raw materials and supplies | | 950 |
| | 867 |
|
| Inventories | | $ | 7,614 |
| | $ | 7,513 |
|
Noncurrent inventories not included above(a) | | $ | 594 |
| | $ | 594 |
|
| |
(a) | The change from December 31, 2016 primarily reflects the build of inventory primarily for and in advance of new product launches and to meet targeted levels for certain products, partially offset by inventory reductions in the normal course of business. |
| |
(b) | Included in Other noncurrent assets. There are no recoverability issues associated with these amounts. |
PFIZER INC. AND SUBSIDIARY COMPANIES
NOTES TO CONDENSED CONSOLIDATED FINANCIAL STATEMENTS
(UNAUDITED)
Note 9. Identifiable Intangible Assets and Goodwill
A. Identifiable Intangible Assets
Balance Sheet Information
|
| | | | | | | | | | | | | | | | | | | | | | | | |
The following table provides the components of Identifiable intangible assets: |
| | | July 2, 2017 | | December 31, 2016 |
| (MILLIONS OF DOLLARS) | | Gross Carrying Amount |
| | Accumulated Amortization |
| | Identifiable Intangible Assets, less Accumulated Amortization |
| | Gross Carrying Amount |
| | Accumulated Amortization |
| | Identifiable Intangible Assets, less Accumulated Amortization |
|
| Finite-lived intangible assets | | | | | | | | | | | | |
Developed technology rights(a) | | $ | 89,531 |
| | $ | (52,341 | ) | | $ | 37,191 |
| | $ | 83,390 |
| | $ | (49,650 | ) | | $ | 33,740 |
|
| Brands | | 2,113 |
| | (1,088 | ) | | 1,025 |
| | 2,092 |
| | (1,032 | ) | | 1,060 |
|
| Licensing agreements and other | | 1,876 |
| | (1,058 | ) | | 818 |
| | 1,869 |
| | (1,005 | ) | | 864 |
|
| | | 93,520 |
| | (54,487 | ) | | 39,033 |
| | 87,351 |
| | (51,687 | ) | | 35,664 |
|
| Indefinite-lived intangible assets | | | | | | | | | | | | |
| Brands and other | | 6,902 |
| |
|
| | 6,902 |
| | 6,883 |
| |
|
| | 6,883 |
|
IPR&D(a) | | 5,413 |
| |
|
| | 5,413 |
| | 10,101 |
| |
|
| | 10,101 |
|
| | | 12,315 |
| |
|
| | 12,315 |
| | 16,984 |
| |
|
| | 16,984 |
|
Identifiable intangible assets(b) | | $ | 105,835 |
| | $ | (54,487 | ) | | $ | 51,348 |
| | $ | 104,335 |
| | $ | (51,687 | ) | | $ | 52,648 |
|
|
| | | | | | | | | | | | | | | | | | | | | | | | |
The following table provides the components of Identifiable intangible assets: |
| | | July 3, 2016 | | December 31, 2015 |
| (MILLIONS OF DOLLARS) | | Gross Carrying Amount |
| | Accumulated Amortization |
| | Identifiable Intangible Assets, less Accumulated Amortization |
| | Gross Carrying Amount |
| | Accumulated Amortization |
| | Identifiable Intangible Assets, less Accumulated Amortization |
|
| Finite-lived intangible assets | | | | | | | | | | | | |
| Developed technology rights | | $ | 77,444 |
| | $ | (48,875 | ) | | $ | 28,569 |
| | $ | 77,613 |
| | $ | (47,193 | ) | | $ | 30,419 |
|
| Brands | | 1,997 |
| | (980 | ) | | 1,016 |
| | 1,973 |
| | (928 | ) | | 1,044 |
|
| Licensing agreements and other | | 1,801 |
| | (962 | ) | | 839 |
| | 1,619 |
| | (918 | ) | | 701 |
|
| | | 81,242 |
| | (50,817 | ) | | 30,425 |
| | 81,205 |
| | (49,040 | ) | | 32,165 |
|
| Indefinite-lived intangible assets | | | | | | | | | | | | |
| Brands and other | | 7,025 |
| |
|
| | 7,025 |
| | 7,021 |
| |
|
| | 7,021 |
|
| In-process research and development | | 5,606 |
| |
|
| | 5,606 |
| | 1,171 |
| |
|
| | 1,171 |
|
| | | 12,631 |
| |
|
| | 12,631 |
| | 8,192 |
| |
|
| | 8,192 |
|
Identifiable intangible assets(a) | | $ | 93,874 |
| | $ | (50,817 | ) | | $ | 43,056 |
| | $ | 89,396 |
| | $ | (49,040 | ) | | $ | 40,356 |
|
| |
(a) | The increasechanges in the gross carrying amount of Developed technology rights and IPR&D primarily reflect the transfer of $4.8 billion from IPR&D to Developed technology rights to reflect the approval of Eucrisa, the Developed technology rights and IPR&D acquired as part of the acquisition of AstraZeneca’s small molecule anti-infectives business (see Note 2A), the Developed technology rights of $118 million recorded in connection with the EU approval of Besponsa (see Note 7E), as well as measurement period adjustments related to Medivation (see Note 2A). |
| |
(b) | The decrease in Identifiable intangible assets, less accumulated amortization, is primarily relateddue to amortization, partially offset by assets acquired as part of the acquisition of AnacorAstraZeneca’s small molecule anti-infectives business (see Note 2A), the impact of foreign exchange and the impact of measurement period adjustments related to our acquisition of Hospira (see Note 2A), partially offset by amortization and impairments. For information about impairments, see Note 4. |
|
| | | | | | | | | |
| Our identifiable intangible assets are associated with the following, as a percentage of total identifiable intangible assets, less accumulated amortization: |
| | | July 2, 2017 |
| | | IH | | EH | | WRD |
| Developed technology rights | | 68 | % | | 32 | % | | — | % |
| Brands, finite-lived | | 74 | % | | 26 | % | | — | % |
| Brands, indefinite-lived | | 71 | % | | 29 | % | | — | % |
| IPR&D | | 81 | % | | 13 | % | | 7 | % |
|
| | | | | | | | | |
| Our identifiable intangible assets are associated with the following, as a percentage of total identifiable intangible assets, less accumulated amortization: |
| | | July 3, 2016 |
| | | IH | | EH | | WRD |
| Developed technology rights | | 51 | % | | 49 | % | | — | % |
| Brands, finite-lived | | 81 | % | | 19 | % | | — | % |
| Brands, indefinite-lived | | 70 | % | | 30 | % | | — | % |
| In-process research and development | | 88 | % | | 11 | % | | 1 | % |
Amortization
Amortization expense related to finite-lived acquired intangible assets that contribute to our ability to sell, manufacture, research, market and distribute products, compounds and intellectual property is included in Amortization of intangible assets, as these intangible assets benefit multiple business functions. Amortization expense related to intangible assets that are associated with a single function is included in Cost of sales, Selling, informational and administrative expenses and/or Research and development expenses, as appropriate. Total amortization expense for finite-lived intangible assets was $1.2 billion for the second quarter of 2017 and $977 million for the second quarter of 2016, and $884 million$2.4 billion for the second quarterfirst six months of 2015,2017 and $2.0 billion for the first six months of 2016 and $1.8 billion for the first six months of 2015..
In-Process Research and Development
For IPR&D assets, the risk of failure is significant and there can be no certainty that these assets ultimately will yield successful products. The nature of the biopharmaceutical business is high-risk and, as such, we expect that many of these IPR&D assets will become impaired and be written off at some time in the future.
B. Goodwill
|
| | | | | | | | | | | | |
The following table provides the components of and changes in the carrying amount of Goodwill: |
| (MILLIONS OF DOLLARS) | | IH | | EH | | Total |
| Balance, December 31, 2016 | | $ | 30,134 |
| | $ | 24,315 |
| | $ | 54,449 |
|
Additions(a) | | 89 |
| | 68 |
| | 157 |
|
Other(b) | | 207 |
| | 201 |
| | 407 |
|
| Balance, July 2, 2017 | | $ | 30,430 |
| | $ | 24,584 |
| | $ | 55,014 |
|
| |
(a) | IH additions primarily relate to our Medivation acquisition and EH additions relate to our acquisition of AstraZeneca’s small molecule anti-infectives business and both are subject to change until we complete the valuation of assets acquired and liabilities assumed (see Note 2A). |
| |
(b) | Primarily reflects the impact of foreign exchange and an adjustment of our estimate of goodwill associated with the HIS net assets sold. |
PFIZER INC. AND SUBSIDIARY COMPANIES
NOTES TO CONDENSED CONSOLIDATED FINANCIAL STATEMENTS
(UNAUDITED)
B. Goodwill
|
| | | | | | | | | | | | |
The following table provides the components of and changes in the carrying amount of Goodwill: |
| (MILLIONS OF DOLLARS) | | IH | | EH | | Total |
| Balance, December 31, 2015 | | $ | 23,809 |
| | $ | 24,433 |
| | $ | 48,242 |
|
Additions(a) | | 1,822 |
| | 4 |
| | 1,826 |
|
Other(b) | | 305 |
| | 227 |
| | 532 |
|
| Balance, July 3, 2016 | | $ | 25,936 |
| | $ | 24,664 |
| | $ | 50,600 |
|
| |
(a)
| IH additions relate to our acquisition of Anacor and are subject to change until we complete the valuation of assets acquired and liabilities assumed from Anacor (see Note 2A).
|
| |
(b)
| Primarily reflects the impact of foreign exchange. |
Effective in the second quarter of 2016, our segments were reorganized to reflect that we now manage our innovative pharmaceutical and consumer healthcare operations as one business segment, IH (previously these businesses were managed as two segments: the GIP segment and the VOC segment). As IH leadership assesses how to most efficiently manage the IH segment operations, we will assess the impact, if any, that any such changes may have on our reporting units.
PFIZER INC. AND SUBSIDIARY COMPANIES
NOTES TO CONDENSED CONSOLIDATED FINANCIAL STATEMENTS
(UNAUDITED)
Note 10. Pension and Postretirement Benefit Plans
|
| | | | | | | | | | | | | | | | | | | | | | | | | | | | | | | | |
| The following table provides the components of net periodic benefit cost/(income): |
| | | Three Months Ended |
| | | Pension Plans | | |
| | | U.S. Qualified(a) | | U.S. Supplemental (Non-Qualified) | | International | | Postretirement Plans |
| (MILLIONS OF DOLLARS) | | July 2, 2017 |
| | July 3, 2016 |
| | July 2, 2017 |
| | July 3, 2016 |
| | July 2, 2017 |
| | July 3, 2016 |
| | July 2, 2017 |
| | July 3, 2016 |
|
| Net periodic benefit cost/(credit): | | | | | | | | | | | | | | | | |
| Service cost | | $ | 67 |
| | $ | 62 |
| | $ | 6 |
| | $ | 5 |
| | $ | 42 |
| | $ | 43 |
| | $ | 11 |
| | $ | 10 |
|
| Interest cost | | 159 |
| | 134 |
| | 13 |
| | 11 |
| | 50 |
| | 60 |
| | 23 |
| | 22 |
|
| Expected return on plan assets | | (252 | ) | | (240 | ) | | — |
| | — |
| | (85 | ) | | (98 | ) | | (9 | ) | | (8 | ) |
| Amortization of: | | |
| | |
| | |
| | |
| | | | |
| | |
| | |
|
| Actuarial losses | | 97 |
| | 99 |
| | 12 |
| | 9 |
| | 28 |
| | 24 |
| | 8 |
| | 7 |
|
| Prior service costs (credits) | | 1 |
| | 1 |
| | — |
| | — |
| | (1 | ) | | (1 | ) | | (46 | ) | | (41 | ) |
| Curtailments | | 4 |
| | 1 |
| | — |
| | — |
| | — |
| | (1 | ) | | (5 | ) | | (1 | ) |
| Settlements | | (7 | ) | | 16 |
| | 4 |
| | 6 |
| | 2 |
| | — |
| | — |
| | — |
|
| | | $ | 69 |
| | $ | 73 |
| | $ | 35 |
| | $ | 31 |
| | $ | 37 |
| | $ | 27 |
| | $ | (19 | ) | | $ | (11 | ) |
| | | | | | | | | | | | | | | | | |
| | | Six Months Ended |
| | | Pension Plans | | |
| | | U.S. Qualified(a) | | U.S. Supplemental (Non-Qualified) | | International | | Postretirement Plans |
| (MILLIONS OF DOLLARS) | | July 2, 2017 |
| | July 3, 2016 |
| | July 2, 2017 |
| | July 3, 2016 |
| | July 2, 2017 |
| | July 3, 2016 |
| | July 2, 2017 |
| | July 3, 2016 |
|
| Net periodic benefit cost/(credit): | | | | | | | | | | | | | | | | |
| Service cost | | $ | 135 |
| | $ | 125 |
| | $ | 12 |
| | $ | 9 |
| | $ | 83 |
| | $ | 85 |
| | $ | 21 |
| | $ | 20 |
|
| Interest cost | | 321 |
| | 268 |
| | 28 |
| | 23 |
| | 100 |
| | 119 |
| | 45 |
| | 44 |
|
| Expected return on plan assets | | (511 | ) | | (481 | ) | | — |
| | — |
| | (169 | ) | | (196 | ) | | (18 | ) | | (17 | ) |
| Amortization of: | | | | | | | | | | | | | | | | |
| Actuarial losses | | 212 |
| | 199 |
| | 25 |
| | 18 |
| | 56 |
| | 46 |
| | 15 |
| | 15 |
|
| Prior service costs (credits) | | 3 |
| | 2 |
| | — |
| | (1 | ) | | (2 | ) | | (1 | ) | | (92 | ) | | (82 | ) |
| Curtailments | | 9 |
| | 3 |
| | — |
| | — |
| | — |
| | (1 | ) | | (12 | ) | | (6 | ) |
| Settlements | | 24 |
| | 31 |
| | 24 |
| | 16 |
| | 3 |
| | 1 |
| | — |
| | — |
|
| | | $ | 193 |
| | $ | 146 |
| | $ | 88 |
| | $ | 66 |
| | $ | 71 |
| | $ | 53 |
| | $ | (40 | ) | | $ | (27 | ) |
|
| | | | | | | | | | | | | | | | | | | | | | | | | | | | | | | | |
| The following table provides the components of net periodic benefit cost: |
| | | Three Months Ended |
| | | Pension Plans | | |
| | | U.S. Qualified(a) | | U.S. Supplemental (Non-Qualified)(b) | | International(c) | | Postretirement Plans(d) |
| (MILLIONS OF DOLLARS) | | July 3, 2016 |
| | June 28, 2015 |
| | July 3, 2016 |
| | June 28, 2015 |
| | July 3, 2016 |
| | June 28, 2015 |
| | July 3, 2016 |
| | June 28, 2015 |
|
| Net periodic benefit cost/(credit): | | | | | | | | | | | | | | | | |
Service cost(e) | | $ | 62 |
| | $ | 72 |
| | $ | 5 |
| | $ | 6 |
| | $ | 43 |
| | $ | 46 |
| | $ | 10 |
| | $ | 14 |
|
Interest cost(e) | | 134 |
| | 168 |
| | 11 |
| | 13 |
| | 60 |
| | 76 |
| | 22 |
| | 32 |
|
| Expected return on plan assets | | (240 | ) | | (270 | ) | | — |
| | — |
| | (98 | ) | | (103 | ) | | (8 | ) | | (13 | ) |
| Amortization of: | | |
| | |
| | |
| | |
| | | | |
| | |
| | |
|
| Actuarial losses | | 99 |
| | 82 |
| | 9 |
| | 11 |
| | 24 |
| | 31 |
| | 7 |
| | 9 |
|
| Prior service costs (credits) | | 1 |
| | (2 | ) | | — |
| | — |
| | (1 | ) | | (2 | ) | | (41 | ) | | (31 | ) |
| Curtailments | | 1 |
| | — |
| | — |
| | — |
| | (1 | ) | | — |
| | (1 | ) | | (7 | ) |
| Settlements | | 16 |
| | 19 |
| | 6 |
| | 2 |
| | — |
| | 1 |
| | — |
| | — |
|
| | | $ | 73 |
| | $ | 69 |
| | $ | 31 |
| | $ | 32 |
| | $ | 27 |
| | $ | 50 |
| | $ | (11 | ) | | $ | 5 |
|
| | | | | | | | | | | | | | | | | |
| | | Six Months Ended |
| | | Pension Plans | | |
| | | U.S. Qualified(a) | | U.S. Supplemental (Non-Qualified)(b) | | International(c) | | Postretirement Plans(d) |
| (MILLIONS OF DOLLARS) | | July 3, 2016 |
| | June 28, 2015 |
| | July 3, 2016 |
| | June 28, 2015 |
| | July 3, 2016 |
| | June 28, 2015 |
| | July 3, 2016 |
| | June 28, 2015 |
|
| Net periodic benefit cost/(credit): | | | | | | | | | | | | | | | | |
Service cost(e) | | $ | 125 |
| | $ | 144 |
| | $ | 9 |
| | $ | 11 |
| | $ | 85 |
| | $ | 94 |
| | $ | 20 |
| | $ | 27 |
|
Interest cost(e) | | 268 |
| | 337 |
| | 23 |
| | 27 |
| | 119 |
| | 155 |
| | 44 |
| | 64 |
|
| Expected return on plan assets | | (481 | ) | | (542 | ) | | — |
| | — |
| | (196 | ) | | (209 | ) | | (17 | ) | | (26 | ) |
| Amortization of: | | | | | | | | | | | | | | | | |
| Actuarial losses | | 199 |
| | 165 |
| | 18 |
| | 23 |
| | 46 |
| | 63 |
| | 15 |
| | 18 |
|
| Prior service costs (credits) | | 2 |
| | (3 | ) | | (1 | ) | | (1 | ) | | (1 | ) | | (3 | ) | | (82 | ) | | (62 | ) |
| Curtailments | | 3 |
| | 1 |
| | — |
| | — |
| | (1 | ) | | — |
| | (6 | ) | | (17 | ) |
| Settlements | | 31 |
| | 45 |
| | 16 |
| | 17 |
| | 1 |
| | 1 |
| | — |
| | — |
|
| | | $ | 146 |
| | $ | 147 |
| | $ | 66 |
| | $ | 77 |
| | $ | 53 |
| | $ | 101 |
| | $ | (27 | ) | | $ | 6 |
|
| |
(a) | The increase inIn April 2017, we settled the remaining obligation associated with the Hospira U.S. qualified defined benefit pension plan. We purchased a group annuity contract on behalf of the remaining plan participants with a third-party insurance provider. As a result, we were relieved of the $156 million net periodicpension benefit costs for the three months ended July 3, 2016, compared to the three months ended June 28, 2015, is due primarily to (i)obligation and recorded a lower expected return on plan assets resulting from a lower expected ratepretax settlement gain of return as well as a net decrease of approximately $1.1 billion in the asset base due in part to lump-sum payments made in 2015 to certain terminated vested colleagues to settle Pfizer’s pension obligation,$41 million, partially offset by a voluntary contributionthe recognition of $1.0 billion made at the beginning of January 2016, and (ii) an increase in the amounts amortized for actuarial losses as a result of the addition of Hospira qualified plans. The aforementioned increases were partially offset by (i) lowerand prior service and interest costs resulting from a change in our approach for measuring service and interest costs (see (e) below) and (ii) lowerupon plan settlement activity. The slight decrease in net periodic benefit costs for the six months ended July 3, 2016, compared to the six months ended June 28, 2015, for our U.S. qualified pension plans was primarily driven by (i) lower service and interest costs, resulting from a change in our approach for measuring service and interest costs (see (e) below) and (ii) lower settlement activity. The aforementioned decreases were largely offset by (i) a lower expected return on plan assets resulting from a lower expected rate of return as well as a net decrease of approximately $1.1 billion$30 million in the asset base due in part to lump-sum payments made in 2015 to certain terminated vested colleagues to settle Pfizer’s pension obligation, partially offset by a voluntary contribution of $1.0 billion made at the beginning of January 2016, and (ii) an increase in the amounts amortized for actuarial losses as a result of the addition of Hospira qualified plans. |
| |
(b)
| The decrease in net periodic benefit costs for the three and six months ended July 3, 2016, compared to the three and six months ended June 28, 2015, for our U.S. non-qualified pension plans was primarily driven by (i) a decrease in the amounts amortized for actuarial losses resulting from the increase, in 2015, in the discount rate used to determine the benefit obligation and (ii) lower service and interest costs resulting from a change in our approach for measuring service and interest costs (see (e) below). For the three months ended July 3, 2016, compared to the three months ended June 28, 2015, the aforementioned decreases were largely offset by an increase in settlement activity |
PFIZER INC. AND SUBSIDIARY COMPANIES
NOTES TO CONDENSED CONSOLIDATED FINANCIAL STATEMENTS
(UNAUDITED)
due to timing of settlement payments made; for the six months ended July 3, 2016, compared to the six months ended June 28, 2015, settlement activity was consistent with the prior year.
| |
(c)
| The decrease in net periodic benefit costs for the three and six months ended July 3, 2016, compared to the three and six months ended June 28, 2015, for our international pension plans was primarily driven by (i) lower service and interest costs, resulting from favorable foreign exchange rate changes and a change in our approach for measuring service and interest costs (see (e) below), and (ii) a decrease in the amounts amortized for actuarial losses resulting from large gains in 2015, which decreased the plan net loss position, partially offset by a decrease in the expected return on plan assets due to a lower expected rate of return on plan assets, and favorable foreign exchange rates changes. |
| |
(d)
| The change from net periodic benefit costs to net periodic benefit credits for the three and six months ended July 3, 2016, compared to the three and six months ended June 28, 2015, for our postretirement plans was primarily driven by (i) lower service and interest costs, resulting from a change in our approach for measuring service and interest costs (see (e) below) and (ii) an increase in prior service credits due to the postretirement medical plan cap changes during 2015. The aforementioned changes were partially offset by (i) a decrease in expected return on plan assets, primarily resulting from a decrease in plan assets reflecting payments by the plan for IRC 401(h) reimbursements to Pfizer for eligible 2014 and 2015 prescription drug expenses for certain retirees, and (ii) lower curtailment gains. |
| |
(e)
| Effective January 1, 2016, the Company changed the approach used to measure service and interest costs for U.S. Restructuring charges and certain international pension and other postretirement benefits. For fiscal 2015,acquisition-related costs during the Company measured service and interest costs utilizing a single weighted-average discount rate derived from the bond model or yield curve used to measure the respective plan obligations. For fiscal 2016, we elected to measure service and interest costs by applying the spot rates along the yield curve for certain international plans, or a yield curve implied from our specific detailed bond model for U.S. plans, to the plans' liability cash flows. The Company believes the new approach provides a more precise measurement of service and interest costs by aligning the timing of the plans’ liability cash flows to the corresponding spot rates on the yield curve.This change does not affect the measurement of our plan obligations. We have accounted for this change as a change in accounting estimate and, accordingly, have accounted for it on a prospective basis. The expected reduction in expense for 2016 associated with this change in estimate is $191 million, including $42 million from international plans, which is expected to be recognized evenly over eachsecond quarter of the year.2017 (see Note 3).
|
As of and for the six months ended July 3, 2016,2, 2017, we contributed and expect to contribute from our general assets as follows: |
| | | | | | | | | | | | | | | | |
| | | Pension Plans | | |
| (MILLIONS OF DOLLARS) | | U.S. Qualified | | U.S. Supplemental (Non-Qualified) | | International | | Postretirement Plans |
Contributions from/(reimbursements of) our general assets for the six months ended July 3, 2016(a) | | $ | 1,000 |
| | $ | 100 |
| | $ | 95 |
| | $ | (100 | ) |
Expected contributions from our general assets during 2016(b) | | $ | 1,000 |
| | $ | 149 |
| | $ | 181 |
| | $ | (4 | ) |
|
| | | | | | | | | | | | | | | | |
| | | Pension Plans | | |
| (MILLIONS OF DOLLARS) | | U.S. Qualified | | U.S. Supplemental (Non-Qualified) | | International | | Postretirement Plans |
| Contributions from our general assets for the six months ended July 2, 2017 | | $ | 1,095 |
| | $ | 95 |
| | $ | 92 |
| | $ | 109 |
|
Expected contributions from our general assets during 2017(a) | | $ | 1,095 |
| | $ | 141 |
| | $ | 167 |
| | $ | 199 |
|
| |
(a) | Contributions to the postretirement plans reflect IRC 401(h) reimbursements totaling $198 million received for eligible 2014 and 2015 prescription drug expenses for certain retirees. |
| |
(b)
| Contributions expected to be made for 20162017 are inclusive of amounts contributed during the six months ended July 3, 2016,2, 2017, including the $1.0 billion voluntary contribution that was made in January 20162017 for the U.S. qualified plans, which was considered pre-funding for future anticipated mandatory contributions and is also expected to reduce Pension Benefit Guaranty Corporation variable rate premiums. The U.S. supplemental (non-qualified) pension plan, international pension plan and the postretirement plan contributions from our general assets include direct employer benefit payments. |
PFIZER INC. AND SUBSIDIARY COMPANIES
NOTES TO CONDENSED CONSOLIDATED FINANCIAL STATEMENTS
(UNAUDITED)
Note 11. Earnings Per Common Share Attributable to Common Shareholders
| | The following table provides the detailed calculation of Earnings per common share (EPS): | The following table provides the detailed calculation of Earnings per common share (EPS): | The following table provides the detailed calculation of Earnings per common share (EPS): |
| | | Three Months Ended | | Six Months Ended | | Three Months Ended | | Six Months Ended |
| (IN MILLIONS) | | July 3,
2016 |
| | June 28,
2015 |
| | July 3,
2016 |
| | June 28,
2015 |
| | July 2,
2017 |
| | July 3,
2016 |
| | July 2,
2017 |
| | July 3,
2016 |
|
| EPS Numerator––Basic | | | | | | | | | | | | | | | | |
| Income from continuing operations | | $ | 2,035 |
| | $ | 2,635 |
| | $ | 5,060 |
| | $ | 5,011 |
| | $ | 3,077 |
| | $ | 2,062 |
| | $ | 6,207 |
| | $ | 5,110 |
|
| Less: Net income attributable to noncontrolling interests | | 16 |
| | 9 |
| | 25 |
| | 14 |
| | 5 |
| | 16 |
| | 14 |
| | 25 |
|
| Income from continuing operations attributable to Pfizer Inc. | | 2,019 |
| | 2,626 |
| | 5,035 |
| | 4,996 |
| | 3,071 |
| | 2,046 |
| | 6,193 |
| | 5,085 |
|
| Less: Preferred stock dividends––net of tax | | — |
| | — |
| | 1 |
| | 1 |
| | — |
| | — |
| | — |
| | 1 |
|
| Income from continuing operations attributable to Pfizer Inc. common shareholders | | 2,018 |
| | 2,625 |
| | 5,034 |
| | 4,996 |
| | 3,071 |
| | 2,046 |
| | 6,192 |
| | 5,084 |
|
| Discontinued operations––net of tax | | 1 |
| | 1 |
| | 1 |
| | 6 |
| | 2 |
| | 1 |
| | 1 |
| | 1 |
|
| Less: Discontinued operations––net of tax, attributable to noncontrolling interests | | — |
| | — |
| | — |
| | — |
| |
| Discontinued operations––net of tax, attributable to Pfizer Inc. common shareholders | | 1 |
| | 1 |
| | 1 |
| | 6 |
| |
| Net income attributable to Pfizer Inc. common shareholders | | $ | 2,019 |
| | $ | 2,626 |
| | $ | 5,035 |
| | $ | 5,002 |
| | $ | 3,073 |
| | $ | 2,047 |
| | $ | 6,194 |
| | $ | 5,085 |
|
| EPS Numerator––Diluted | | |
| | |
| | |
| | |
| | |
| | |
| | |
| | |
|
| Income from continuing operations attributable to Pfizer Inc. common shareholders and assumed conversions | | $ | 2,018 |
| | $ | 2,626 |
| | $ | 5,035 |
| | $ | 4,996 |
| | $ | 3,071 |
| | $ | 2,046 |
| | $ | 6,193 |
| | $ | 5,084 |
|
| Discontinued operations––net of tax, attributable to Pfizer Inc. common shareholders and assumed conversions | | 1 |
| | 1 |
| | 1 |
| | 6 |
| | 2 |
| | 1 |
| | 1 |
| | 1 |
|
| Net income attributable to Pfizer Inc. common shareholders and assumed conversions | | $ | 2,019 |
| | $ | 2,626 |
| | $ | 5,035 |
| | $ | 5,002 |
| | $ | 3,073 |
| | $ | 2,047 |
| | $ | 6,194 |
| | $ | 5,085 |
|
| EPS Denominator | | |
| | |
| | |
| | |
| | |
| | |
| | |
| | |
|
| Weighted-average number of common shares outstanding––Basic | | 6,068 |
| | 6,159 |
| | 6,110 |
| | 6,181 |
| | 5,958 |
| | 6,068 |
| | 5,982 |
| | 6,110 |
|
| Common-share equivalents: stock options, stock issuable under employee compensation plans, convertible preferred stock and accelerated share repurchase agreements | | 69 |
| | 83 |
| | 67 |
| | 86 |
| |
| Weighted-average number of common shares outstanding––Diluted | | 6,137 |
| | 6,243 |
| | 6,176 |
| | 6,267 |
| |
Stock options that had exercise prices greater than the average market price of our common stock issuable under employee compensation plans(a) | | 45 |
| | 56 |
| | 65 |
| | 45 |
| |
Common-share equivalents: stock options, stock issuable under employee compensation plans, convertible preferred stock and accelerated share repurchase agreements(a) | | | 80 |
| | 81 |
| | 83 |
| | 78 |
|
Weighted-average number of common shares outstanding––Diluted(a) | | | 6,037 |
| | 6,149 |
| | 6,065 |
| | 6,188 |
|
Stock options that had exercise prices greater than the average market price of our common stock issuable under employee compensation plans(a), (b) | | | 47 |
| | 51 |
| | 47 |
| | 71 |
|
| |
(a) | Amounts for the second quarter and first six months ended July 3, 2016 have been revised from previously reported amounts to reflect the adoption of a new accounting standard in the fourth quarter of 2016, as of January 1, 2016, that requires, when applying the treasury stock method for shares that could be repurchased, that the assumed proceeds no longer include the amount of excess tax benefit (see Note 1B). |
| |
(b) | These common stock equivalents were outstanding for the six months ended July 3, 2016 and June 28, 2015,periods presented, but were not included in the computation of diluted EPS for those periods because their inclusion would have had an anti-dilutive effect. |
PFIZER INC. AND SUBSIDIARY COMPANIES
NOTES TO CONDENSED CONSOLIDATED FINANCIAL STATEMENTS
(UNAUDITED)
Note 12. Commitments and Contingencies
We and certain of our subsidiaries are subject to numerous contingencies arising in the ordinary course of business. For a discussion of our tax contingencies, see Note 5B.
On March 8, 2016,February 2, 2017, we entered into an accelerated share repurchase agreement with Goldman, Sachs & Co. (GS&Co.)Citibank to repurchase $5 billion of our common stock. Pursuant to the terms of the agreement, on March 10, 2016,February 6, 2017, we paid $5 billion to GS&Co.Citibank and received an initial delivery of approximately 136126 million shares of our common stock from GS&Co. based onCitibank at a price of $29.36$31.73 per share, which represented, based on the closing share price of our common stock on the NYSE on March 8, 2016,February 2, 2017, approximately 80% of the notional amount of the accelerated share repurchase agreement. On June 20, 2016,May 16, 2017, the accelerated share repurchase agreement with GS&Co.Citibank was completed, which, per the terms of the agreement, resulted in GS&Co.Citibank owing us a certain number of shares of Pfizer common stock. Pursuant to the agreement’s settlement terms, we received an additional 1824 million shares of our common stock from GS&Co.Citibank on June 20, 2016.May 19, 2017. The average price paid for all of the shares delivered under the accelerated share repurchase agreement was $32.38$33.31 per share. The common stock received is included in Treasury stockStock. This agreement was entered into pursuant to our previously announced share repurchase authorization. After giving effect to the accelerated share repurchase agreement,At July 2, 2017, our remaining share-purchase authorization iswas approximately $11.4 billion at July 3, 2016.$6.4 billion.
A. Legal Proceedings
Our non-tax contingencies include, but are not limited to, the following:
Patent litigation, which typically involves challenges to the coverage and/or validity of our patents on various products, processes or dosage forms. We are the plaintiff in the vast majority of these actions. An adverse outcome in actions in which we are the plaintiff could result in a loss of patent protection for thea drug, at issue, a significant loss of revenues from that drug and impairmentsor impairment of anythe value of associated assets.
Product liability and other product-related litigation, which can include personal injury, consumer, off-label promotion, securities, antitrust and breach of contract claims, among others, often involves highly complex issues relating to medical causation, label warnings and reliance on those warnings, scientific evidence and findings, actual, provable injury and other matters.
Commercial and other matters, which can include merger-related and product-pricing claims and environmental claims and proceedings, can involve complexities that will vary from matter to matter.
Government investigations, which often are related to the extensive regulation of pharmaceutical companies by national, state and local government agencies in the U.S. and in other countries.
Certain of these contingencies could result in losses, including damages, fines and/or civil penalties, and/or criminal charges, which could be substantial.
We believe that our claims and defenses in these matters are substantial, but litigation is inherently unpredictable and excessive verdicts do occur. We do not believe that any of these matters will have a material adverse effect on our financial position. However, we could incur judgments, enter into settlements or revise our expectations regarding the outcome of certain matters, and such developments could have a material adverse effect on our results of operations in the period in which the amounts are accrued and/or our cash flows in the period in which the amounts are paid.
We have accrued for losses that are both probable and reasonably estimable. Substantially all of our contingencies are subject to significant uncertainties and, therefore, determining the likelihood of a loss and/or the measurement of any loss can be complex. Consequently, we are unable to estimate the range of reasonably possible loss in excess of amounts accrued. Our assessments are based on estimates and assumptions that have been deemed reasonable by management, but the assessment process relies heavily on estimates and assumptions that may prove to be incomplete or inaccurate, and unanticipated events and circumstances may occur that might cause us to change those estimates and assumptions.
Amounts recorded for legal and environmental contingencies can result from a complex series of judgments about future events and uncertainties and can rely heavily on estimates and assumptions.
The principal pending matters to which we are a party are discussed below. In determining whether a pending matter is a principal matter, we consider both quantitative and qualitative factors in order to assess materiality, such as, among other things, the amount of damages and the nature of any other relief sought in the proceeding, if such damages and other relief are specified; our view of the merits of the claims and of the strength of our defenses; whether the action purports to be, or is, a class
PFIZER INC. AND SUBSIDIARY COMPANIES
NOTES TO CONDENSED CONSOLIDATED FINANCIAL STATEMENTS
(UNAUDITED)
action and, if not certified, our view of the likelihood that a class will be certified by the court; the jurisdiction in which the proceeding is pending; any experience that we or, to our knowledge, other companies have had in similar proceedings;
PFIZER INC. AND SUBSIDIARY COMPANIES
NOTES TO CONDENSED CONSOLIDATED FINANCIAL STATEMENTS
(UNAUDITED)
whether disclosure of the action would be important to a reader of our financial statements, including whether disclosure might change a reader’s judgment about our financial statements in light of all of the information about the Company that is available to the reader; the potential impact of the proceeding on our reputation; and the extent of public interest in the matter. In addition, with respect to patent matters in which we are the plaintiff, we consider, among other things, the financial significance of the product protected by the patent. As a result of considering qualitative factors in our determination of principal matters, there are some matters discussed below with respect to which management believes that the likelihood of possible loss in excess of amounts accrued is remote.
A1. Legal Proceedings––Patent Litigation
Like other pharmaceutical companies, we are involved in numerous suits relating to our patents, including but not limited to, those discussed below. Most of the suits involve claims by generic drug manufacturers that patents covering our products, processes or dosage forms are invalid and/or do not cover the product of the generic drug manufacturer. Also, counterclaims, as well as various independent actions, have been filed alleging that our assertions of, or attempts to enforce, our patent rights with respect to certain products constitute unfair competition and/or violations of antitrust laws. In addition to the challenges to the U.S. patents on a number of our products that are discussed below, we note that the patent rights to certain of our products are being challenged in various other countries. We are also party to other patent damages suits in various jurisdictions pursuant to which generic drug manufacturers, payers, governments or other parties are seeking damages from us for alleged delay of generic entry related to patent enforcement litigation.entry. Additionally, our licensing and collaboration partners face challenges by generic drug manufacturers to patents covering several of their products that may impact our licenses or co-promotion rights to such products. We also are often involved in other proceedings, such as inter partes review, post-grant review, re-examination or opposition proceedings, before the U.S. Patent and Trademark Office, the European Patent Office, or other foreign counterparts relating to our intellectual property or the intellectual property rights of others. Also, if one of our patents is found to be invalid by such proceedings, generic or competitive products could be introduced into the market resulting in the erosion of sales of our existing products. For example, several of the patents in our pneumococcal vaccine portfolio have been challenged in inter partes review and post-grant review proceedings in the United States. The invalidation of these patents could potentially allow a competitor pneumococcal vaccine into the marketplace. We are also subject to patent litigation pursuant to which one or more third parties is seekingseeks damages and/or injunctive relief to compensate for the alleged infringement of its patents due toby our commercial or other activities. For example, our subsidiary, Hospira, is involved in patent and patent-related disputes over its attempts to bring generic pharmaceutical and biosimilar products to market. If theone of our marketed productproducts is ultimately found to infringe the valid patent rights of a third party, such third party may be awarded significant damages, or we may be prevented from further sales of suchthat product. Such damages may be enhanced as much as three-fold in the event that we or one of our subsidiaries, like Hospira, is found to have willfully infringed the valid patent rights of a third party.
Actions In Which We Are The Plaintiff
Bosulif (bosutinib)
In December 2016, Wyeth LLC, Wyeth Pharmaceuticals Inc., and PF Prism C.V. (collectively, Wyeth) brought a patent-infringement action against Alembic Pharmaceuticals, Ltd, Alembic Pharmaceuticals, Inc. (collectively, Alembic), Sun Pharmaceutical Industries, Inc., and Sun Pharmaceutical Industries Limited (collectively, Sun), in the U.S. District Court for the District of Delaware in connection with abbreviated new drug applications respectively filed with the FDA by Alembic and Sun, each seeking approval to market generic versions of bosutinib. Both Alembic and Sun are challenging patents, which expire in 2026, covering polymorphic forms of bosutinib and methods of treating chronic myelogenous leukemia. In March 2017, Wyeth brought a patent-infringement action against MSN Laboratories Private Limited and MSN Pharmaceuticals, Inc. (collectively, MSN), in the U.S. District Court for the District of Delaware in connection with an abbreviated new drug application filed with the FDA by MSN, seeking approval to market a generic version of bosutinib, and challenging a patent expiring in 2026 covering polymorphic forms of bosutinib.
EpiPen
In July 2010, King, Pharmaceuticals, Inc. (King), which we acquired in 2011 and is a wholly ownedwholly-owned subsidiary, brought a patent-infringement action against Sandoz Inc., a division of Novartis AG (Sandoz), in the U.S. District Court for the District of New Jersey in connection with Sandoz’s abbreviated new drug application filed with the FDA seeking approval to market an epinephrine injectable product. Sandoz is challenging patents, which expire in 2025, covering the next-generation autoinjector for use with epinephrine that is sold under the EpiPen brand name.
Toviaz (fesoterodine)
We have an exclusive, worldwide license to market Toviaz from UCB Pharma GmbH (UCB), which owns the patents relating to Toviaz.
Beginning in May 2013, several generic drug manufacturers notified us that they had filed abbreviated new drug applications with the FDA seeking approval to market generic versions of Toviaz and asserting the invalidity, unenforceability and/or non-infringement of all of our patents for Toviaz that are listed in the FDA’s list of Approved Drug Products with Therapeutic Equivalence Evaluations, commonly referred to as the “Orange Book”. Beginning in June 2013, we filed actions against all of those generic drug manufacturers in the U.S. District Court for the District of Delaware, asserting the infringement of five of the patents for Toviaz: three composition-of-matter patents and a method-of-use patent that expire in 2019, and a patent covering salts of fesoterodine that expires in 2022. In June and July 2015, we settled with four of the eight generic defendants. The trial relating to the remaining defendants occurred in July 2015. In April 2016, the District Court held that the patents that were the subject of the lawsuit were valid and infringed. The defendants’ deadline to appeal this decision expired in June 2016.
In December 2014, Mylan Pharmaceuticals, Inc. (Mylan Pharmaceuticals) notified us that it had filed anabbreviated new drug application with the FDA seeking approval to market a generic version of Toviaz and asserting the invalidity, unenforceability and/or non-infringement of all of our patents for Toviaz that are listed in the Orange Book. In January 2015, we filed action against Mylan Pharmaceuticals in the U.S. District Court for the District of Delaware, asserting the infringement of five of the patents for Toviaz: three composition-of-matter patents and a method-of-use patent that expire in 2019, and a patent covering salts of fesoterodine that expires in 2022.
PFIZER INC. AND SUBSIDIARY COMPANIES
NOTES TO CONDENSED CONSOLIDATED FINANCIAL STATEMENTS
(UNAUDITED)
Tygacil (tigecycline)Flector Patch (diclofenac)
In October 2013, we received notice2015, the owners (Teikoku Seiyaku Co., Ltd. and Altergon SA) of a Section 505(b)(2) new drug application filed by Fresenius Kabi USA LLC (Fresenius) forpatent covering Pfizer’s Flector Patch product, along with the New Drug Application holder (IBSA Institut Biochemique SA), brought a tigecycline injectable product. Fresenius asserts the invalidity and non-infringement of the basic patent for Tygacil that expired in April 2016, the formulation patent for Tygacil that expires in 2029 and the polymorph patent for Tygacil that expires in 2030. In November 2013, we filed suitpatent-infringement action against FreseniusActavis Laboratories UT, Inc. in the U.S. District Court for the District of Delaware asserting the validity and infringementof the patents that are the subject of the lawsuit. In November 2015, we settled our claims against Fresenius on terms that permit Fresenius to launch a tigecycline injectable product in the U.S. prior to the expiration of certain of the patents that were the subject of the challenge.
In November 2014, Mylan Laboratories Limited (formerly Agila Specialties Private Limited) (Mylan Laboratories)notified us that it had filedconnection with an abbreviated new drug application filed by Actavis Laboratories UT, Inc. with the FDA seekingrequesting approval to marketlaunch a generic version of Tygacil. Mylan LaboratoriesassertsFlector Patch prior to the invalidity and non-infringement2019 expiration of the polymorph patent for Tygacil and the formulation patent for Tygacil. Mylan Laboratories has not challenged the basic patent. In January 2015, we filed suit against MylanLaboratories inAugust 2016, Pfizer subsidiary Alpharma Pharmaceuticals LLC was added as a plaintiff to the U.S. District Court for the District of Delaware, asserting the validity and infringement of the polymorph patent and the formulation patent for Tygacil.
In addition, in September 2015 and December 2015, we received notices of Section 505(b)(2) new drug applications filed by each of Mylan Laboratories and Accord Healthcare Inc. (Accord) for tigecycline injectable products. Mylan Laboratories and Accord assert the invalidity and non-infringement of the polymorph patent for Tygacil, and two formulation patents for Tygacil that expire in 2028 and 2029, respectively. In October 2015, we filed suit against Mylan Laboratories in the U.S. District Court for the District of Delaware and in the U.S. District Court for the District of West Virginia asserting the validity and infringementof the patents that are the subject of the lawsuit. In February 2016, we filed suit against Accord in the U.S. District Court for the District of Delaware and in the U.S. District Court for the Middle District of North Carolina asserting the validity and infringementof the patents that are the subject of the lawsuit.
Precedex Premix
In June 2014,Ben Venue Laboratories, Inc. (Ben Venue)notified our subsidiary, Hospira, that it had filed an abbreviated new drug application with the FDA seeking approval to market a generic version of Hospira’s premix version of Precedex and containing allegations that a patent relating to the use of Precedex in an intensive care unit setting, which expires in March 2019, was invalid or not infringed. In August 2014, Hospira and Orion Corporation (co-owner of the patent that is the subject of the lawsuit) filed suit against Ben Venue, Hikma Pharmaceuticals PLC (Hikma), and West-Ward Pharmaceutical Corp. in the U.S. District Court for the District of Delaware asserting the validity and infringement of the patent that is the subject of the lawsuit. In October 2014, Eurohealth International Sarl was substituted for Ben Venue and Hikma. In June 2016, this case was settled on terms not material to Pfizer.
In June 2015, Amneal Pharmaceuticals LLC (Amneal) notified Hospira that it had filed an abbreviated new drug application with the FDA seeking approval to market a generic version of Hospira’s premix version of Precedex and containing allegations that four patents relating to the Precedex premix formulations and their use, all of which expire in 2032, were invalid or not infringed. In August 2015, Hospira filed suit against Amneal in the U.S. District Court for the District of Delaware asserting the validity and infringement of the patents that are the subject of the lawsuit.
In December 2015, Fresenius Kabi USA LLC (Fresenius) notified Hospira that it had filed an abbreviated new drug application with the FDA seeking approval to market a generic version of Hospira’s premix version of Precedex and containing allegations that four patents relating to the Precedex premix formulations and their use, all of which expire in 2032, were invalid or not infringed. In January 2016, Hospira filed suit against Fresenius in the U.S. District Court for the Northern District of Illinois asserting the validity and infringement of the patents that are the subject of the lawsuit.
In August 2016, Par Sterile Products, LLC (Par) notified Hospira that it had filed an abbreviated new drug application with the FDA seeking approval to market a generic version of Hospira’s premix version of Precedex and containing allegations that four patents relating to the Precedex premix formulations and their use, all of which expire in 2032, were invalid or not infringed. In September 2016, Hospira filed suit against Par in the U.S. District Court for the District of Delaware asserting the validity and infringement of the patents that are the subject of the lawsuit. In December 2016, the case was stayed pending the outcome of Hospira’s suit against Amneal (including all appeals).
Toviaz (fesoterodine)
We have an exclusive, worldwide license to market Toviaz from UCB Pharma GmbH (UCB), which owns the patents relating to Toviaz.
Beginning in May 2013, several generic drug manufacturers notified us that they had filed abbreviated new drug applications with the FDA seeking approval to market generic versions of Toviaz and asserting the invalidity, unenforceability and/or non-infringement of all of our patents for Toviaz that are listed in the FDA’s list of Approved Drug Products with Therapeutic Equivalence Evaluations, commonly referred to as the “Orange Book”. Beginning in June 2013, we filed actions against all of those generic drug manufacturers in the U.S. District Court for the District of Delaware, asserting the infringement of five of the patents for Toviaz: three composition-of-matter patents and a method-of-use patent that expire in 2019 and a patent covering salts of fesoterodine that expires in 2022. In June and July 2015, we settled with four of the generic defendants. The trial relating to the four remaining defendants occurred in July 2015. In April 2016, the District Court held that the patents that were the subject of the lawsuit were valid and infringed. The defendants’ deadline to appeal this decision expired in June 2016.
In December 2014, Mylan Pharmaceuticals, Inc. (Mylan Pharmaceuticals) notified us that it had filed anabbreviated new drug application with the FDA seeking approval to market a generic version of Toviaz and asserting the invalidity, unenforceability and/or non-infringement of all of our patents for Toviaz that are listed in the Orange Book. In January 2015, we filed an action against Mylan Pharmaceuticals in the U.S. District Court for the District of Delaware, asserting the infringement of five of the patents for Toviaz: three composition-of-matter patents and a method-of-use patent that expire in 2019 and a patent covering salts of fesoterodine that expires in 2022. In January 2017, the District Court issued a verdict finding that the five patents that are the subject of the lawsuit are valid and infringed. In August 2017, the District Court issued a written decision consistent with the verdict, finding the five patents valid and infringed.
PFIZER INC. AND SUBSIDIARY COMPANIES
NOTES TO CONDENSED CONSOLIDATED FINANCIAL STATEMENTS
(UNAUDITED)
In December 2016, Torrent Pharmaceuticals, Ltd. (Torrent) notified us that it had filed anabbreviated new drug application with the FDA seeking approval to market a generic version of Toviaz and asserting the invalidity, unenforceability and/or non-infringement of all of our patents for Toviaz that are listed in the Orange Book. In February 2017, we filed an action against Torrent in the U.S. District Court for the District of Delaware, asserting the infringement of the same five patents that are the subject of the action against Mylan Pharmaceuticals.
Xeljanz (tofacitinib)
In February 2017, we brought a patent-infringement action against MicroLabs USA Inc. and MicroLabs Ltd. (collectively, MicroLabs) in the U.S. District Court for the District of Delaware asserting the infringement and validity of three patents challenged by MicroLabs in its abbreviated new drug application seeking approval to market a generic version of tofacitinib 5 mg tablets. Of the three patents that are the subject of the lawsuit, one covers the active ingredient and expires in December 2020, the second covers an enantiomer of tofacitinib and expires in 2022, and the third covers a polymorphic form of tofacitinib and expires in 2023. Three other patents for Xeljanz expiring in December 2020 have not been challenged by MicroLabs.
Separately, also in February 2017, we brought a patent-infringement action against Sun Pharmaceutical Industries Ltd. in the U.S. District Court for the District of Delaware asserting the infringement and validity of our patent covering a polymorphic form of tofacitinib, expiring in 2023, that was challenged by Sun Pharmaceutical Industries Ltd. in its abbreviated new drug application seeking approval to market a generic version of tofacitinib 11 mg extended release tablets.
In March 2017, we brought a patent-infringement action against Zydus Pharmaceuticals (USA) Inc. and Cadila Healthcare Ltd. (collectively, Zydus) in the U.S. District Court for the District of Delaware asserting the infringement and validity of the same three patents that are the subject of the action against MicroLabs, which Zydus challenged in its abbreviated new drug application seeking approval to market a generic version of tofacitinib 5 mg tablets.
Also in March 2017, we brought separate actions in the U.S. District Court for the District of Delaware against Prinston Pharmaceutical Inc., Zhejiang Huahai Pharmaceutical Co., Ltd., Huahai US Inc. and Solco Healthcare US, LLC (collectively Prinston) and against Breckenridge Pharmaceutical Inc., Pensa Pharma S.A. and Laboratorios Del Dr. Esteve, S.A. (collectively Breckenridge) on the two patents expiring in 2022 and 2023, respectively, that were challenged by Prinston and Breckenridge in their respective abbreviated new drug applications seeking approval to market generic versions of tofacitinib 5 mg tablets.
Xtandi (enzalutamide)
In December 2016, Medivation and Medivation Prostate Therapeutics, Inc. (collectively, the Medivation Group); Astellas Pharma Inc., Astellas US LLC and Astellas Pharma US, Inc. (collectively, Astellas); and The Regents of the University of California filed patent-infringement suits in the U.S. District Court for the District of Delaware against Actavis Laboratories FL, Inc. and Actavis LLC (collectively, Actavis); Zydus; and Apotex Inc. and Apotex Corp. (collectively, Apotex) in connection with those companies’ respective abbreviated new drug applications filed with the FDA for approval to market generic versions of enzalutamide. The generic manufacturers are challenging patents, which expire as early as 2026, covering enzalutamide and treatments for prostate cancer. In May 2017, the Medivation Group filed a patent-infringement suit against Roxane Laboratories Inc. (Roxane) in the same court in connection with Roxane’s abbreviated new drug application with the FDA for approval to market a generic version of enzalutamide.
Matters Involving Our Collaboration/Licensing Partners
Nexium 24HR (esomeprazole)
We have an exclusive license from AstraZeneca PLC (AstraZeneca) to market in the U.S. the over-the-counter (OTC)OTC version of Nexium (Nexium 24HR). Beginning in October 2014, Actavis Laboratories FL, Inc., and subsequently Andrx Labs, LLC (Andrx), Perrigo Company plc (Perrigo), Lupin Limited and, in October 2015, Dr. Reddy’s Laboratories, Inc. & Ltd. (Dr. Reddy’s) notified us that they had filed abbreviated new drug applications with the FDA seeking approval to market generic versions of Nexium 24HR prior to the expiration of one or more of AstraZeneca’s patents listed in the Orange Book for Nexium 24HR. From November 2014 through November 2015, AstraZeneca filed actions against each of Actavis Laboratories FL, Inc., Andrx, Perrigo, Lupin Limited and Dr. Reddy’s in the U.S. District Court for the District of New Jersey asserting the infringement of the challenged patents. In March and June 2017, the cases against Actavis/ Andrx and Perrigo, respectively, were settled on terms not material to Pfizer. We are not a party to AstraZeneca’s patent-infringement actions.
PFIZER INC. AND SUBSIDIARY COMPANIES
NOTES TO CONDENSED CONSOLIDATED FINANCIAL STATEMENTS
(UNAUDITED)
Toviaz (fesoterodine) - ––Inter-Partes Reviews
In January 2016, Mylan Pharmaceuticals and Mylan Laboratories filed petitions with the U.S. Patent &and Trademark Office requesting Inter Partes Reviewsinter partes reviews of five of the patents covering fesoterodine, the active ingredient in Toviaz: three composition-of-matter patents and a method-of-use patent that expire in 2019 and a patent covering salts of fesoterodine that expires in 2022. The patents are owned by UCB, and we have an exclusive, worldwide license to market Toviaz from UCB. In July 2016, the Patent Trial and Appeal Board agreed to institute Inter Partes Reviewsinter partes reviews of all five patents. Amerigen Pharmaceuticals Limited,
Action
PFIZER INC. AND SUBSIDIARY COMPANIES
NOTES TO CONDENSED CONSOLIDATED FINANCIAL STATEMENTS
(UNAUDITED)
Alembic Pharmaceuticals Limited and Torrent Pharmaceuticals Limited have joined the inter partes reviews. In July 2017, the U.S. Patent and Trademark Office issued decisions upholding all five patents.
Eliquis
In February, March, and April 2017, twenty-five generic companies sent BMS Paragraph-IV certification letters informing BMS that they had filed abbreviated new drug applications seeking approval of generic versions of Eliquis, challenging the validity and infringement of one or more of the three patents listed in the Orange Book for Eliquis. The patents currently are set to expire in 2019, 2023, and 2031. Eliquis has been jointly developed and is being commercialized by BMS and Pfizer. In April 2017, BMS and Pfizer filed patent-infringement actions against all generic filers in the U.S. District Court for the District of Delaware and the U.S. District Court for the District of West Virginia, asserting that each of the generic companies’ proposed products would infringe each of the patent(s) that each generic filer challenged. Some generic filers challenged only the 2031 patent, some challenged both the 2031 and 2023 patent, and one generic company challenged all three patents.
Bavencio (avelumab)
In July 2017, BMS, E.R. Squibb & Sons LLC, Ono Pharmaceutical Co. Ltd., and Tasuku Honjo brought a patent-infringement action in the U.S. District Court for the District of Delaware against Pfizer, Merck KGaA, and EMD Serono, alleging that Bavencio (avelumab) infringes one patent relating to methods for treating tumors with anti-PD-L1 antibodies, which expires in 2023.
Actions In Which We Are The Defendant
Effexor XR (venlafaxine HCl)Inflectra (infliximab-dyyb)
In 2006, WyethMarch 2015, Janssen and Wyeth Canada Limited (the Wyeth companies) filed anNew York University, together, brought a patent-infringement action in the FederalU.S. District Court for the District of Massachusetts against Hospira, Celltrion Healthcare Co. Ltd. and Celltrion Inc. alleging that infliximab-dyyb, to be marketed by Hospira in Canada against Ratiopharm Inc. (Ratiopharm) seekingthe U.S. under the brand name Inflectra, would infringe six patents relating to prevent Ratiopharm from obtaining approval in Canada forinfliximab, its generic version of Effexor XR priormanufacture and use. Claims with respect to the expiration of onefour of the Wyeth companies’ patents. Aspatents have since been dismissed by the plaintiffs, leaving two patents at issue in the ongoing action: the infliximab antibody patent and a resultpatent relating to cell culture media. In August 2016, the U.S. District Court for the District of that action, Ratiopharm was enjoined from obtaining regulatory approval for its generic product. However, in August 2007, the Federal Court of Appeal in CanadaMassachusetts ruled that the antibody patent at issue could not be asserted against Ratiopharm underwas invalid, and Janssen has appealed that ruling to the applicable Canadian regulations governing approvals, and it dismissed the Wyeth companies’ action.
Following the dismissal, in 2007, Ratiopharm filed an action inCourt of Appeals for the Federal Court in Canada seeking damages from the Wyeth companies for preventing Ratiopharm from marketing its generic version of Effexor XR in Canada from January 2006 through August 2007. The Federal Court dismissed Ratiopharm’s action in 2011, but the Federal Court of Appeal reinstated it in 2012. In 2011 and 2012, Pfizer made payments to Teva Canada Limited, which had acquired Ratiopharm, totaling Canadian dollars 52.5 million in partial settlement of this action.
The trial in this action was held in January 2014, and the Federal Court issued various findings in March 2014. On June 30, 2014, the Federal Court issued a judgment based on those findings, awarding Teva Canada Limited damages of approximately Canadian dollars 125 million, consisting of compensatory damages, pre-judgment interest and legal costs. This judgment was satisfied by Pfizer Canada Inc., as successor to the Wyeth companies, in July 2014. In September 2014, Pfizer Canada Inc. appealed the judgment and, in May 2016, the Federal Court of Appeal vacated the lower court’s decision and remanded the case to the lower court for further proceedings.
Circuit.
A2. Legal Proceedings––Product Litigation
Like other pharmaceutical companies, we are defendants in numerous cases, including but not limited to those discussed below, related to our pharmaceutical and other products. Plaintiffs in these cases seek damages and other relief on various grounds for alleged personal injury and economic loss.
Asbestos
Between 1967 and 1982, Warner-Lambert owned American Optical Corporation, which manufactured and sold respiratory protective devices and asbestos safety clothing. In connection with the sale of American Optical in 1982, Warner-Lambert agreed to indemnify the purchaser for certain liabilities, including certain asbestos-related and other claims. As of July 3, 2016,2, 2017, approximately 55,62056,400 claims naming American Optical and numerous other defendants were pending in various federal and state courts seeking damages for alleged personal injury from exposure to asbestos and other allegedly hazardous materials. Warner-Lambert was acquired by Pfizer in 2000 and is now a wholly ownedwholly-owned subsidiary of Pfizer. Warner-Lambert is actively engaged in the defense of, and will continue to explore various means of resolving, these claims.
Numerous lawsuits are pending against Pfizer in various federal and state courts seeking damages for alleged personal injury from exposure to products allegedly containing asbestos and other allegedly hazardous materials sold by Gibsonburg Lime Products Company (Gibsonburg). Gibsonburg was acquired by Pfizer in the 1960s and sold products containing small amountscertain of asbestos until the early 1970s.its previously owned subsidiaries.
There also are a small number of lawsuits pending in various federal and state courts seeking damages for alleged exposure to asbestos in facilities owned or formerly owned by Pfizer or its subsidiaries.
Celebrex and Bextra
Beginning in late 2004, several purported class actions were filed in federal and state courts alleging that Pfizer and certain of our current and former officers violated federal securities laws by misrepresenting the safety of Celebrex and Bextra. In June 2005, the federal actions were transferred for consolidated pre-trial proceedings to a Multi-District Litigation (In re Pfizer Inc. Securities, Derivative and “ERISA” Litigation MDL-1688) in the U.S. District Court for the Southern District of New York. In March 2012, the court in the Multi-District Litigation certified a class consisting of all persons who purchased or acquired Pfizer stock between October 31, 2000 and October 19, 2005. In May 2014, the court in the Multi-District Litigation granted Pfizer’s motion to exclude the testimony of the plaintiffs’ loss causation and damages expert. We subsequently filed a motion
PFIZER INC. AND SUBSIDIARY COMPANIES
NOTES TO CONDENSED CONSOLIDATED FINANCIAL STATEMENTS
(UNAUDITED)
for summary judgment seeking dismissal of the litigation, and the plaintiffs filed a motion for leave to submit an amended report by their expert. In July 2014, the court denied the plaintiffs’ motion for leave to submit an amended report, and granted our motion for summary judgment, dismissing the plaintiffs’ claims in their entirety. In August 2014, the plaintiffs appealed the District Court’s decision to the U.S. Court of Appeals for the Second Circuit. In April 2016, the U.S. Court of Appeals for the Second Circuit reversed the District Court’s decision and remanded the case to the District Court for further proceedings. In July 2016, the parties reached an agreement in principle to resolve this matter for all defendants for $486 million, a portion of which was recorded in Other (income)/deductions––net for the three months ended July 3, 2016, and the full amount of which was recorded in Other (income)/deductions––net for the six months ended July 3, 2016. The agreement in principle is subject to the negotiation of a final settlement agreement and court approval, and the payment will be made in accordance with the terms of the settlement agreement.
Effexor
Personal Injury Actions
A number of individual lawsuits and multi-plaintiff lawsuits have been filed against us and/or our subsidiaries in various federal and state courts alleging personal injury as a result of the purported ingestion of Effexor. Among other types of actions, the Effexor personal injury litigation includes actions alleging a variety of birth defects as a result of the purported ingestion of Effexor by women during pregnancy. Plaintiffs in these birth-defect actions seek compensatory and punitive damages. In August 2013, the federal birth-defect cases were transferred for consolidated pre-trial proceedings to a Multi-District Litigation (In re Effexor (Venlafaxine Hydrochloride) Products Liability Litigation MDL-2458) in the U.S. District Court for the Eastern District of Pennsylvania. Almost all plaintiffs have voluntarily dismissed their actions. The Multi-District Litigation, as well as the coordinated state court proceedings in California, have been administratively stayed.
Antitrust Actions
Beginning in May 2011, actions, including purported class actions, were filed in various federal courts against Wyeth and, in certain of the actions, affiliates of Wyeth and certain other defendants relating to Effexor XR, which is the extended-release formulation of Effexor. The plaintiffs in each of the class actions seek to represent a class consisting of all persons in the U.S. and its territories who directly purchased, indirectly purchased or reimbursed patients for the purchase of Effexor XR or generic Effexor XR from any of the defendants from June 14, 2008 until the time the defendants’ allegedly unlawful conduct ceased. The plaintiffs in all of the actions allege delay in the launch of generic Effexor XR in the U.S. and its territories, in violation of federal antitrust laws and, in certain of the actions, the antitrust, consumer protection and various other laws of certain states, as the result of Wyeth fraudulently obtaining and improperly listing certain patents for Effexor XR in the Orange Book, enforcing certain patents for Effexor XR and entering into a litigation settlement agreement with a generic drug manufacturer with respect to Effexor XR. Each of the plaintiffs seeks treble damages (for itself in the individual actions or on behalf of the putative class in the purported class actions) for alleged price overcharges for Effexor XR or generic Effexor XR in the U.S. and its territories since June 14, 2008. All of these actions have been consolidated in the U.S. District Court for the District of New Jersey.
In October 2014, the District Court dismissed the direct purchaser plaintiffs’ claims based on the litigation settlement agreement, but declined to dismiss the other direct purchaser plaintiff claims. In January 2015, the District Court entered partial final judgments as to all settlement agreement claims, including those asserted by direct purchasers and end-payer plaintiffs, which plaintiffs have appealed to the U.S. Court of Appeals for the Third Circuit. Motions to dismiss remain pending as to the end-payer plaintiffs’ remaining claims.
Zoloft
A number of individual lawsuits and multi-plaintiff lawsuits have been filed against us and/or our subsidiaries in various federal and state courts alleging personal injury as a result of the purported ingestion of Zoloft. Among other types of actions, the Zoloft personal injury litigation includes actions alleging a variety of birth defects as a result of the purported ingestion of Zoloft by women during pregnancy. Plaintiffs in these birth-defect actions seek compensatory and punitive damages and the disgorgement of profits resulting from the sale of Zoloft. In April 2012, the federal birth-defect cases were transferred for consolidated pre-trial proceedings to a Multi-District Litigation (In re Zoloft Products Liability Litigation MDL-2342) in the U.S. District Court for the Eastern District of Pennsylvania. A number of plaintiffs have voluntarily dismissed their actions. In April 2016, the District Court granted our motion for summary judgment, dismissing the claims of almost all of the remaining plaintiffs. In May 2016, the plaintiffs appealed the District Court’s decision to the U.S. Court of Appeals for the Third Circuit.
Lipitor
Whistleblower Action
In 2004, a former employee filed a “whistleblower” action against us in the U.S. District Court for the Eastern District of New York. The complaint remained under seal until September 2007, at which time the U.S. Attorney for the Eastern District of New York declined to intervene in the case. We were served with the complaint in December 2007. Plaintiff alleges off-label
PFIZER INC. AND SUBSIDIARY COMPANIES
NOTES TO CONDENSED CONSOLIDATED FINANCIAL STATEMENTS
(UNAUDITED)
promotion of Lipitor in violation of the Federal Civil False Claims Act and the false claims acts of certain states, and he seeks treble damages and civil penalties on behalf of the federal government and the specified states as the result of their purchase, or reimbursement of patients for the purchase, of Lipitor allegedly for such off-label uses. Plaintiff also seeks compensation as a whistleblower under those federal and state statutes. In addition, plaintiff alleges that he was wrongfully terminated, in violation of the anti-retaliation provisions of applicable federal and New York law, and he seeks damages and the reinstatement of his employment. In 2009, the District Court dismissed without prejudice the off-label promotion claims and, in 2010, plaintiff filed an amended complaint containing off-label promotion allegations that are substantially similar to the allegations in the original complaint. In November 2012, the District Court dismissed the amended complaint. In December 2012, plaintiff appealed the District Court’s decision to the U.S. Court of Appeals for the Second Circuit. In August 2014, the U.S. Court of Appeals for the Second Circuit dismissed the appeal for lack of jurisdiction and sent the case back to the District Court for clarification of its ruling regarding the plaintiff’s employment claims. In November 2014, the District Court granted plaintiff’s motion for a partial final judgment certifying the dismissal of the false claims counts, and plaintiff appealed the order dismissing those claims to the U.S. Court of Appeals for the Second Circuit. In May 2016, the U.S. Court of Appeals for the Second Circuit affirmed the District Court’s dismissal of the false claims counts.
Antitrust Actions
Beginning in November 2011, purported class actions relating to Lipitor were filed in various federal courts against, among others, Pfizer, certain affiliates of Pfizer, and, in most of the actions, Ranbaxy, Inc. (Ranbaxy) and certain affiliates of Ranbaxy. The plaintiffs in these various actions seek to represent nationwide, multi-state or statewide classes consisting of persons or entities who directly purchased, indirectly purchased or reimbursed patients for the purchase of Lipitor (or, in certain of the actions, generic Lipitor) from any of the defendants from March 2010 until the cessation of the defendants’ allegedly unlawful conduct (the Class Period). The plaintiffs allege delay in the launch of generic Lipitor, in violation of federal antitrust laws and/or state antitrust, consumer protection and various other laws, resulting from (i) the 2008 agreement pursuant to which Pfizer and Ranbaxy settled certain patent litigation involving Lipitor, and Pfizer granted Ranbaxy a license to sell a generic version of Lipitor in various markets beginning on varying dates, and (ii) in certain of the actions, the procurement and/or enforcement of certain patents for Lipitor. Each of the actions seeks, among other things, treble damages on behalf of the putative class for alleged price overcharges for Lipitor (or, in certain of the actions, generic Lipitor) during the Class Period. In addition, individual actions have been filed against Pfizer, Ranbaxy and certain of their affiliates, among others, that assert claims and seek relief for the plaintiffs that are substantially similar to the claims asserted and the relief sought in the purported class actions described above. These various actions have been consolidated for pre-trial proceedings in a Multi-District Litigation (MDL) (In re Lipitor Antitrust Litigation MDL-2332) in the U.S. DistrictCourt for the District of New Jersey.
In September 2013 and 2014, the District Court dismissed with prejudice the claims by direct purchasers. In October and November 2014, the District Court dismissed with prejudice the claims of all other MDL plaintiffs. All plaintiffs have appealed the District Court’s orders dismissing their claims with prejudice to the United States Court of Appeals for the Third Circuit. In addition, the direct purchaser class plaintiffs appealed the order denying their motion to amend the judgment and for leave to amend their complaint to the U.S. Court of Appeals for the Third Circuit.
Also, in January 2013, the State of West Virginia filed an action in West Virginia state court against Pfizer and Ranbaxy, among others, that asserts claims and seeks relief on behalf of the State of West Virginia and residents of that state that are substantially similar to the claims asserted and the relief sought in the purported class actions described above.
Personal Injury Actions
A number of individual lawsuits and multi-plaintiff lawsuits have been filed against us and/or our subsidiaries in various federal and state courts alleging personal injury as a result of the purported ingestion of Effexor. Among other types of actions, the Effexor personal injury litigation includes actions alleging a variety of birth defects as a result of the purported ingestion of Effexor by women during pregnancy. Plaintiffs in these birth-defect actions seek compensatory and punitive damages. In August 2013, the federal birth-defect cases were transferred for consolidated pre-trial proceedings to a Multi-District Litigation (In re Effexor (Venlafaxine Hydrochloride) Products Liability Litigation MDL-2458) in the U.S. District Court for the Eastern
PFIZER INC. AND SUBSIDIARY COMPANIES
NOTES TO CONDENSED CONSOLIDATED FINANCIAL STATEMENTS
(UNAUDITED)
District of Pennsylvania. Almost all plaintiffs have voluntarily dismissed their actions. The Multi-District Litigation, as well as the coordinated state court proceedings in California, has been administratively stayed.
Antitrust Actions
Beginning in May 2011, actions, including purported class actions, were filed in various federal courts against Wyeth and, in certain of the actions, affiliates of Wyeth and certain other defendants relating to Effexor XR, which is the extended-release formulation of Effexor. The plaintiffs in each of the class actions seek to represent a class consisting of all persons in the U.S. and its territories who directly purchased, indirectly purchased or reimbursed patients for the purchase of Effexor XR or generic Effexor XR from any of the defendants from June 14, 2008 until the time the defendants’ allegedly unlawful conduct ceased. The plaintiffs in all of the actions allege delay in the launch of generic Effexor XR in the U.S. and its territories, in violation of federal antitrust laws and, in certain of the actions, the antitrust, consumer protection and various other laws of certain states, as the result of Wyeth fraudulently obtaining and improperly listing certain patents for Effexor XR in the Orange Book, enforcing certain patents for Effexor XR and entering into a litigation settlement agreement with a generic drug manufacturer with respect to Effexor XR. Each of the plaintiffs seeks treble damages (for itself in the individual actions or on behalf of the putative class in the purported class actions) for alleged price overcharges for Effexor XR or generic Effexor XR in the U.S. and its territories since June 14, 2008. All of these actions have been consolidated in the U.S. District Court for the District of New Jersey.
In October 2014, the District Court dismissed the direct purchaser plaintiffs’ claims based on the litigation settlement agreement but declined to dismiss the other direct purchaser plaintiff claims. In January 2015, the District Court entered partial final judgments as to all settlement agreement claims, including those asserted by direct purchasers and end-payer plaintiffs, which plaintiffs have appealed to the U.S. Court of Appeals for the Third Circuit. Motions to dismiss remain pending as to the end-payer plaintiffs’ remaining claims.
Zoloft
A number of individual lawsuits and multi-plaintiff lawsuits have been filed against us and/or our subsidiaries in various federal and state courts alleging personal injury as a result of the purported ingestion of Zoloft. Among other types of actions, the Zoloft personal injury litigation includes actions alleging a variety of birth defects as a result of the purported ingestion of Zoloft by women during pregnancy. Plaintiffs in these birth-defect actions seek compensatory and punitive damages and the disgorgement of profits resulting from the sale of Zoloft. In April 2012, the federal birth-defect cases were transferred for consolidated pre-trial proceedings to a Multi-District Litigation (In re Zoloft Products Liability Litigation MDL-2342) in the U.S. District Court for the Eastern District of Pennsylvania. A number of plaintiffs have voluntarily dismissed their actions. In April 2016, the District Court granted our motion for summary judgment, dismissing the claims of almost all of the remaining plaintiffs. In May 2016, the plaintiffs appealed the District Court’s decision to the U.S. Court of Appeals for the Third Circuit. In June 2017, the U.S. Court of Appeals for the Third Circuit affirmed the District Court’s decision.
Lipitor
Antitrust Actions
Beginning in November 2011, purported class actions relating to Lipitor were filed in various federal courts against, among others, Pfizer, certain affiliates of Pfizer, and, in most of the actions, Ranbaxy, Inc. (Ranbaxy) and certain affiliates of Ranbaxy. The plaintiffs in these various actions seek to represent nationwide, multi-state or statewide classes consisting of persons or entities who directly purchased, indirectly purchased or reimbursed patients for the purchase of Lipitor (or, in certain of the actions, generic Lipitor) from any of the defendants from March 2010 until the cessation of the defendants’ allegedly unlawful conduct (the Class Period). The plaintiffs allege delay in the launch of generic Lipitor, in violation of federal antitrust laws and/or state antitrust, consumer protection and various other laws, resulting from (i) the 2008 agreement pursuant to which Pfizer and Ranbaxy settled certain patent litigation involving Lipitor, and Pfizer granted Ranbaxy a license to sell a generic version of Lipitor in various markets beginning on varying dates, and (ii) in certain of the actions, the procurement and/or enforcement of certain patents for Lipitor. Each of the actions seeks, among other things, treble damages on behalf of the putative class for alleged price overcharges for Lipitor (or, in certain of the actions, generic Lipitor) during the Class Period. In addition, individual actions have been filed against Pfizer, Ranbaxy and certain of their affiliates, among others, that assert claims and seek relief for the plaintiffs that are substantially similar to the claims asserted and the relief sought in the purported class actions described above. These various actions have been consolidated for pre-trial proceedings in a Multi-District Litigation (In re Lipitor Antitrust Litigation MDL-2332) in the U.S. DistrictCourt for the District of New Jersey.
In September 2013 and 2014, the District Court dismissed with prejudice the claims by direct purchasers. In October and November 2014, the District Court dismissed with prejudice the claims of all other Multi-District Litigation plaintiffs. All plaintiffs have appealed the District Court’s orders dismissing their claims with prejudice to the U.S. Court of Appeals for the Third Circuit. In addition, the direct purchaser class plaintiffs appealed the order denying their motion to amend the judgment and for leave to amend their complaint to the U.S. Court of Appeals for the Third Circuit.
PFIZER INC. AND SUBSIDIARY COMPANIES
NOTES TO CONDENSED CONSOLIDATED FINANCIAL STATEMENTS
(UNAUDITED)
Also, in January 2013, the State of West Virginia filed an action in West Virginia state court against Pfizer and Ranbaxy, among others, that asserts claims and seeks relief on behalf of the State of West Virginia and residents of that state that are substantially similar to the claims asserted and the relief sought in the purported class actions described above.
Personal Injury Actions
A number of individual and multi-plaintiff lawsuits have been filed against us in various federal and state courts alleging that the plaintiffs developed type 2 diabetes as a result of the purported ingestion of Lipitor. Plaintiffs seek compensatory and punitive damages.
In February 2014, the federal actions were transferred for consolidated pre-trial proceedings to a Multi-District Litigation (In re Lipitor (Atorvastatin Calcium) Marketing, Sales Practices and Products Liability Litigation (No. II) MDL-2502) in the U.S. District Court for the District of South Carolina. In 2016, certain cases in the Multi-District Litigation were remanded to federal courts in California and certain state courts. In January 2017, the District Court granted our motion for summary judgment, dismissing substantially all of the remaining cases pending in the Multi-District Litigation. In January 2017, the plaintiffs appealed the District Court’s decision to the U.S. Court of Appeals for the Fourth Circuit.
Viagra
A number of individual and multi-plaintiff lawsuits have been filed against us in various federal and state courts alleging that the plaintiffs developed melanoma and/or the exacerbation of melanoma as a result of the purported ingestion of Viagra. Plaintiffs seek compensatory and punitive damages.
In April 2016, the federal actions were transferred for coordinated pre-trial proceedings to a Multi-District Litigation (In Re: Viagra (Sildenafil Citrate) Products Liability Litigation, MDL-2691) in the U.S. District Court for the Northern District of California.
PFIZER INC. AND SUBSIDIARY COMPANIES
NOTES TO CONDENSED CONSOLIDATED FINANCIAL STATEMENTS
(UNAUDITED)
In December 2016, federal actions filed against Lilly and filed against both us and Lilly, were transferred for coordinated pre-trial proceedings to the Multi-District Litigation (In re: Viagra (Sildenafil Citrate) and Cialis (Tadalafil) Products Liability Litigation, MDL-2691).
Chantix/Champix
Beginning in December 2008, purported class actions were filed against us in the Ontario Superior Court of Justice (Toronto Region), the Superior Court of Quebec (District of Montreal), the Court of Queen’s Bench of Alberta, Judicial District of Calgary, and the Superior Court of British Columbia (Vancouver Registry) on behalf of all individuals and third-party payers in Canada who have purchased and ingested Champix or reimbursed patients for the purchase of Champix. Each of these actions asserts claims under Canadian product liability law, including with respect to the safety and efficacy of Champix and, on behalf of the putative class, seeks monetary relief, including punitive damages. In June 2012, the Ontario Superior Court of Justice certified the Ontario proceeding as a class action, defining the class as consisting of the following: (i) all persons in Canada who ingested Champix during the period from April 2, 2007 to May 31, 2010 and who experienced at least one of a number of specified neuropsychiatric adverse events; (ii) all persons who are entitled to assert claims in respect of Champix pursuant to Canadian legislation as the result of their relationship with a class member; and (iii) all health insurers who are entitled to assert claims in respect of Champix pursuant to Canadian legislation. The Ontario Superior Court of Justice certified the class against Pfizer Canada Inc. only and ruled that the action against Pfizer should be stayed until after the trial of the issues that are common to the class members. The actions in Quebec, Alberta and British Columbia have beenwere stayed in favor of the Ontario action, which iswas proceeding on a national basis. In April 2017, the Ontario Superior Court issued an order granting plaintiffs’ motion for voluntary discontinuance of the Ontario action, which became effective in June 2017. Also, in April 2017 and July 2017, respectively, the British Columbia and Quebec actions were discontinued on consent, effective immediately. We expect that the resolution of the remaining Alberta action will not be material to us.
Celebrex
Beginning in July 2014, purported class actions were filed in the U.S. District Court for the Eastern District of Virginia against Pfizer and certain subsidiaries of Pfizer relating to Celebrex. The plaintiffs seek to represent U.S. nationwide or multi-state classes consisting of persons or entities who directly purchased from the defendants, or indirectly purchased or reimbursed patients for some or all of the purchase price of, Celebrex or generic Celebrex from May 31, 2014 until the cessation of the defendants’ allegedly unlawful conduct. The plaintiffs allege delay in the launch of generic Celebrex in violation of federal antitrust laws or certain state antitrust, consumer protection and various other laws as a result of Pfizer fraudulently obtaining and improperly listing a patent on Celebrex, engaging in sham litigation and prolonging the impact of sham litigation through settlement activity that further delayed generic entry. Each of the actions seeks treble damages on behalf of the putative class for alleged price overcharges for Celebrex since May 31, 2014. In December 2014, the District Court granted the parties’ joint motions to consolidate the direct purchaser and end-payer cases, and all such cases were consolidated as of March 2015. In October 2014 and March 2015, we filed motions to dismiss the direct purchasers’ and end-payers’ amended complaints, respectively. In November 2015, the District Court denied in part and granted in part our motion to dismiss the direct
PFIZER INC. AND SUBSIDIARY COMPANIES
NOTES TO CONDENSED CONSOLIDATED FINANCIAL STATEMENTS
(UNAUDITED)
purchasers’ amended complaint. In February 2016, the District Court denied in part and granted in part our motion to dismiss the end-payers’ amended complaint.complaint, and in August 2016, the District Court dismissed substantially all of the end-payer’s remaining claims. In February 2017, the District Court dismissed with prejudice all of the end-payers’ claims. In March 2017, the end-payers appealed the District Court’s order dismissing their claims with prejudice to the U.S. Court of Appeals for the Fourth Circuit.
Intravenous Solutions
Beginning in November 2016, purported class actions were filed in the U.S. District Court for the Northern District of Illinois against Hospira, Hospira Worldwide, Inc. and certain other defendants relating to intravenous saline solution. Plaintiffs seek to represent classes consisting of all persons and entities in the U.S. who directly purchased intravenous saline solution sold by any of the defendants from January 1, 2013 until the time the defendants’ allegedly unlawful conduct ceases. Plaintiffs allege that the defendants’ conduct restricts output and artificially fixes, raises, maintains and/or stabilizes the prices of intravenous saline solution sold throughout the U.S. in violation of federal antitrust laws. Plaintiffs seek treble damages (for themselves and on behalf of the putative classes) and an injunction against defendants for alleged price overcharges for intravenous saline solution in the U.S. since January 1, 2013. On February 3, 2017, we completed the sale of our global infusion therapy net assets, HIS, which includes intravenous saline solution, to ICU Medical. The litigation is the subject of cross-claims for indemnification by both Pfizer and ICU Medical under the purchase agreement.
Separately, in April 2017, Pfizer, Hospira and two employees of Pfizer received grand jury subpoenas issued by the United States District Court for the Eastern District of Pennsylvania, in connection with an investigation by the U.S. Department of Justice, Antitrust Division. The subpoenas seek documents related to the sale, manufacture, pricing and shortages of intravenous solutions, including saline, as well as communications among market participants regarding these issues. The Department of Justice investigation is also the subject of cross-claims for indemnification by both Pfizer and ICU Medical under the purchase agreement. In addition, in August 2015, the New York Attorney General issued a subpoena to Hospira for similar information. Hospira has produced records to the New York Attorney General and will coordinate with ICU Medical to produce records to the New York Attorney General as appropriate going forward, and Hospira and Pfizer will coordinate with ICU Medical to produce records to the Department of Justice.
Hormone Therapy Consumer Class Action
A certified consumer class action is pending against Wyeth in the U.S. District Court for the Southern District of California based on the alleged off-label marketing of its hormone therapy products. The case was originally filed in December 2003. The class consists of California consumers who purchased Wyeth’s hormone-replacement products between January 1995 and January 2003 and who do not seek personal injury damages therefrom. The class seeks compensatory and punitive damages, including a full refund of the purchase price.
Eliquis
A number of individual and multi-plaintiff lawsuits have been filed against us and Bristol-Myers Squibb Company in various federal and state courts pursuant to which plaintiffs seek to recover for personal injuries, including wrongful death, due to bleeding as a result of the alleged ingestion of Eliquis. Plaintiffs seek compensatory and punitive damages.
In February 2017, the federal actions were transferred for coordinated pre-trial proceedings to a Multi-District Litigation (In Re: Eliquis (Apixaban) Products Liability Litigation MDL-2754) in the U.S. District Court for the Southern District of New York.
EpiPen
Beginning in February 2017, purported class actions were filed in various federal courts by direct and indirect purchasers of EpiPen against Pfizer, and/or its affiliates King and Meridian, and/or various entities affiliated with Mylan N.V., and Mylan N.V. Chief Executive Officer, Heather Bresch. The plaintiffs in these actions seek to represent U.S. nationwide classes comprising persons or entities who directly purchased or paid for any portion of the end-user purchase price of an EpiPen between 2009 until the cessation of the defendants’ allegedly unlawful conduct. Against Pfizer and/or its affiliates, plaintiffs generally allege that Pfizer’s and/or its affiliates’ settlement of patent litigation regarding EpiPen delayed market entry of generic EpiPen in violation of federal antitrust laws and various state antitrust or consumer protection laws. At least one lawsuit also alleges that Pfizer and/or Mylan N.V. violated the federal Racketeer Influenced and Corrupt Organizations Act. Plaintiffs also filed various consumer protection and unjust enrichment claims against, and relating to conduct attributable solely to, Mylan Pharmaceuticals regarding EpiPen. Plaintiffs seek treble damages for alleged overcharges for EpiPen since 2009 on behalf of the putative indirect purchaser class and since 2013 on behalf of the putative direct purchaser class. In August 2017, the actions were consolidated for coordinated pre-trial proceedings in a Multi-District Litigation (In re: EpiPen (Epinephrine Injection, USP) Marketing, Sales Practices and Antitrust Litigation, MDL-2785) in the U.S. District Court for the District of Kansas with other EpiPen-related actions against Mylan N.V. and/or its affiliates to which Pfizer, King and Meridian are not parties.
PFIZER INC. AND SUBSIDIARY COMPANIES
NOTES TO CONDENSED CONSOLIDATED FINANCIAL STATEMENTS
(UNAUDITED)
Nexium 24HR and Protonix
A number of individual and multi-plaintiff lawsuits have been filed against Pfizer, certain of its subsidiaries and/or other pharmaceutical manufacturers in various federal and state courts alleging that the plaintiffs developed kidney-related injuries as a result of the purported ingestion of certain proton pump inhibitors. The cases against us involve Nexium 24HR and/or Protonix and seek compensatory and punitive damages and, in some cases, treble damages, restitution or disgorgement. In August 2017, the federal actions were ordered transferred for coordinated pre-trial proceedings to a Multi-District Litigation (In re: Proton-Pump Inhibitor Products Liability Litigation (No. II)) in the U.S. District Court for the District of New Jersey.
A3. Legal Proceedings––Commercial and Other Matters
Average Wholesale Price Litigation
Pfizer, certain of its subsidiaries and other pharmaceutical manufacturers were sued in various state courts by a number of states alleging that the defendants provided average wholesale price (AWP) information for certain of their products that was higher than the actual average prices at which those products were sold. The AWP is used to determine reimbursement levels under Medicare Part B and Medicaid and in many private-sector insurance policies and medical plans. All but one of those actions have been resolved through settlement, dismissal or final judgment. The plaintiff state, Illinois,in the one remaining action claims that the alleged spread between the AWPs at which purchasers were reimbursed and the actual sale prices was promoted by the defendants as an incentive to purchase certain of their products. The actionalleges, among other things, fraudand violation of the state’s unfair trade practices andconsumer protection statutes and seeks monetary and other relief, including civil penalties and treble damages.
Monsanto-Related Matters
In 1997, Monsanto Company (Former Monsanto) contributed certain chemical manufacturing operations and facilities to a newly formed corporation, Solutia Inc. (Solutia), and spun off the shares of Solutia. In 2000, Former Monsanto merged with Pharmacia & Upjohn Company to form Pharmacia Corporation (Pharmacia).Pharmacia. Pharmacia then transferred its agricultural operations to a newly created subsidiary, named Monsanto Company (New Monsanto), which it spun off in a two-stage process that was completed in 2002. Pharmacia was acquired by Pfizer in 2003 and is a wholly ownedwholly-owned subsidiary of Pfizer.
In connection with its spin-off that was completed in 2002, New Monsanto assumed, and agreed to indemnify Pharmacia for, any liabilities related to Pharmacia’s former agricultural business. New Monsanto has defended and indemnified, and/or is defending and indemnifying Pharmacia in connection with various claims and litigation arising out of, or related to, the agricultural business.
In connection with its spin-off in 1997, Solutia assumed, and agreed to indemnify Pharmacia for, liabilities related to Former Monsanto’s chemical businesses. As the result of its reorganization under Chapter 11 of the U.S. Bankruptcy Code, Solutia’s indemnification obligations relating to Former Monsanto’s chemical businesses are primarily limited to sites that Solutia has owned or
PFIZER INC. AND SUBSIDIARY COMPANIES
NOTES TO CONDENSED CONSOLIDATED FINANCIAL STATEMENTS
(UNAUDITED)
operated. In addition, in connection with its spinoff that was completed in 2002, New Monsanto assumed, and agreed to indemnify Pharmacia for, any liabilities primarily related to Former Monsanto’s chemical businesses, including, but not limited to, any such liabilities that Solutia assumed. Solutia’s and New Monsanto’s assumption of, and agreement to, indemnify Pharmacia for these liabilities apply to pending actions and any future actions related to Former Monsanto’s chemical businesses in which Pharmacia is named as a defendant, including, without limitation, actions asserting environmental claims, including alleged exposure to polychlorinated biphenyls. Solutia andand/or New Monsanto are defending and indemnifying Pharmacia in connection with various claims and litigation arising out of, or related to, Former Monsanto’s chemical businesses.
Environmental Matters
In 2009, we submitted to the U.S. Environmental Protection Agency (EPA) a corrective measures study report with regard to Pharmacia’s discontinued industrial chemical facility in North Haven, Connecticut and a revised site-wide feasibility study with regard to Wyeth Holdings Corporation’s discontinued industrial chemical facility in Bound Brook, New Jersey. In September 2010, our corrective measures study report with regard to the North Haven facility was approved by the EPA, and we commenced construction of the site remedy in late 2011 under an Updated Administrative Order on Consent with the EPA. In July 2011, Wyeth Holdings Corporation finalized an Administrative Settlement Agreement and Order on Consent for Removal Action (the 2011 Administrative Settlement Agreement) with the EPA with regard to the Bound Brook facility. In May 2012, we completed construction of an interim remedy to address the discharge of impacted groundwater from that facility to the Raritan River. In September 2012, the EPA issued a final remediation plan for the Bound Brook facility’s main plant area, which is generally in accordance with one of the remedies evaluated in our revised site-wide feasibility study. In March 2013, Wyeth Holdings Corporation (now Wyeth Holdings LLC) entered into an Administrative Settlement Agreement and Order on Consent with the EPA to allow us to undertake detailed engineering design of the remedy for the main plant area and to perform a focused feasibility study for two adjacent lagoons. In September 2015, the U.S., on behalf of the EPA, lodged a complaint and
PFIZER INC. AND SUBSIDIARY COMPANIES
NOTES TO CONDENSED CONSOLIDATED FINANCIAL STATEMENTS
(UNAUDITED)
consent decree with the federal District Court for the District of New Jersey that will allow Wyeth Holdings LLC to complete the design and to implement the remedy for the main plant area. In December 2015, the consent decree (which supersedes the 2011 Administrative Settlement Agreement) was entered by the District Court. TheWe have accrued for the estimated costs of the site remedy for the North Haven facility and the site remediation for the Bound Brook facility are covered by accruals previously taken by us.facility.
In August 2016, Pfizer Pharmaceuticals LLC (PPLLC) and the EPA began negotiations to resolve alleged past deviations from certain administrative provisions of the federal Clean Air Act at our Barceloneta, Puerto Rico manufacturing facility. PPLLC is cooperating with the EPA to resolve this matter and the civil penalties, if any, resulting from the resolution of this matter will not have a material impact to Pfizer.
We are a party to a number of other proceedings brought under the Comprehensive Environmental Response, Compensation, and Liability Act of 1980, as amended, and other state, local or foreign laws in which the primary relief sought is the cost of past and/or future remediation.
A4. Legal Proceedings––Government Investigations
Like other pharmaceutical companies, we are subject to investigations and extensive regulation by government agencies in the U.S., other developed markets and multiple emerging markets in which we operate. As a result, we have interactions with government agencies on an ongoing basis. Criminal charges, and substantial fines and/or civil penalties, as well as limitations on our ability to conduct business in applicable jurisdictions, could result from government investigations. Among the investigations by government agencies isare the mattermatters discussed below.
Phenytoin Sodium Capsules
In 2012, Pfizer sold the U.K. Marketing Authorisation for phenytoin sodium capsules to a third party, but retained the right to supply the finished product to that third party. In May 2013, the U.K. Competition & Markets Authority (CMA) informed us that it had launched an investigation into the supply of phenytoin sodium capsules in the U.K. market. In August 2015, the CMA issued a Statement of Objections alleging that Pfizer and Pfizer Limited, a U.K. subsidiary, engaged in conduct that violates U.K. and EU antitrust laws. In December 2016, the CMA imposed a £84.2 million fine on Pfizer and Pfizer Limited. Pfizer appealed the CMA Decision to The Competition Appeal Tribunal in February 2017.
Civil Investigative Demand relating to Pharmacy Benefit Managers
In March 2016, Pfizer received a Civil Investigative Demand from the U.S. Attorney’s Office for the Southern District of New York related to Pfizer’s contractual relationships with pharmacy benefit managers with respect to certain pharmaceutical products over the period from January 1, 2006 to the present. We have provided information to the government in response to this Civil Investigative Demand.
Subpoenas relating to Copayment Assistance Organizations
In December 2015 and July 2016, Pfizer received subpoenas from the U.S. Attorney’s Office for the District of Massachusetts requesting documents related to the Patient Access Network Foundation and other 501(c)(3) organizations that provide financial assistance to Medicare patients. We have been providing information to the government in response to these subpoenas.
U.S. Department of Justice Investigation relating to Greenstone
As of July 2017, the U.S. Department of Justice’s Antitrust Division is investigating our Greenstone generics business. We believe this is related to an ongoing antitrust investigation of the generic pharmaceutical industry. The government has been obtaining information from Greenstone.
Intravenous Solutions
See Note 12A2. Legal Proceedings––Product Litigation––Intravenous Solutions above for information regarding government investigations related to sales of intravenous solution products.
A5. Legal Proceedings––Matters Resolved During the First Six Months of 2016
2017
During the first six months of 2016,2017, certain matters, including the mattersmatter discussed below, were resolved or were the subject of definitive settlement agreements or settlement agreements-in-principle.
Sutent (sunitinib malate)Xtandi
In May 2010, Mylan Pharmaceuticals notified us that it had filed an abbreviated new drug application with the FDA seeking approval to market a generic version of Sutent and challenging on various grounds the Sutent basic patent, which expires in
PFIZER INC. AND SUBSIDIARY COMPANIES
NOTES TO CONDENSED CONSOLIDATED FINANCIAL STATEMENTS
(UNAUDITED)
2021, and two other patents that expire in 2020 and 2021, respectively. In June 2010, we filed suit against Mylan Pharmaceuticals in the U.S. District Court for the District of Delaware asserting the infringement of those three patents. The patent expiring in 2020 was dismissed from the case prior to trial. In OctoberApril 2014, the court held that the two patents expiring in 2021 were valid and infringed. In October 2014, Mylan Pharmaceuticals appealed the decision to the U.S. Court of Appeals for the Federal Circuit. In January 2016, the U.S. Court of Appeals for the Federal Circuit affirmed the District Court’s decision upholding the validity and infringementRegents of the two patents expiring in 2021.
Protonix
In 2009, the U.S. DepartmentUniversity of Justice (DOJ) filed a civil complaint in intervention in two qui tam actions that had been filed under seal in the U.S. District Court for the District of Massachusetts. The complaint alleges that Wyeth’s practices relating to the pricing for Protonix for Medicaid rebate purposes between 2001 and 2006, prior to Wyeth’s acquisition by Pfizer, violated the Federal Civil False Claims Act and federal common law. The two qui tam actions have been unsealed and the complaints include substantially similar allegations. In addition, in 2009, several states and the District of ColumbiaCalifornia (the Regents) filed a complaint against the Medivation Group in California Superior Court in San Francisco. Medivation was acquired by Pfizer in September 2016 and is now a wholly-owned subsidiary of Pfizer. The Regents’ complaint sought a 10% share, under a license agreement between the Medivation Group and the Regents, of certain payments the Medivation Group receives with respect to Xtandi under the same docket numberMedivation Group’s sub-licensing and collaboration agreement with Astellas. Trial was scheduled to commence in May 2017. In July 2017, the U.S. District Court forparties resolved the District of Massachusetts asserting violations of various state laws basedmatter through a settlement on allegations substantially similarterms not material to those set forth in the civil complaint filed by the DOJ. On February 12, 2016, Wyeth and the DOJ reached an agreement in principle to resolve the actions pending in the U.S. District Court for the District of Massachusetts for $784.6 million,Pfizer, which was recorded in Other (income)/deductions––net for the year ended December 31, 2015 and paid on April 29, 2016.In April 2016,second quarter of 2017 as a measurement period adjustment related to the agreement was finalized. The final agreement does not include an admission of liability by Wyeth.
Medivation acquisition.
B. Guarantees and Indemnifications
In the ordinary course of business and in connection with the sale of assets and businesses, we often indemnify our counterparties against certain liabilities that may arise in connection with the transaction or related to activities prior to the
PFIZER INC. AND SUBSIDIARY COMPANIES
NOTES TO CONDENSED CONSOLIDATED FINANCIAL STATEMENTS
(UNAUDITED)
transaction. These indemnifications typically pertain to environmental, tax, employee and/or product-related matters and patent-infringement claims. If the indemnified party were to make a successful claim pursuant to the terms of the indemnification, we would be required to reimburse the loss. These indemnifications are generally subject to threshold amounts, specified claim periods and other restrictions and limitations. Historically, we have not paid significant amounts under these provisions and, as of July 3, 2016,2, 2017, recorded amounts for the estimated fair value of these indemnifications were not significant.
Pfizer Inc. has also guaranteed the long-term debt of certain companies that it acquired and that now are subsidiaries of Pfizer.
Note 13. Segment, Geographic and Other Revenue Information
A. Segment Information
We manage our commercial operations through two distinct business segments: Pfizer Innovative Health (IH) and Pfizer Essential Health (EH). Effective in the second quarter of 2016, our segments were reorganized to reflect that we now manage our innovative pharmaceutical and consumer healthcare operations as one business segment, IH (previously these businesses were managed as two segments: the GIP segment and the VOC segment). We have revised prior-period information (Revenues and Earnings, as defined by management) to reflect the reorganization. Also, in the second quarter of 2016, we changed the name of our Established Products business to Pfizer Essential Health. The IH and EH segments are each led by a single manager. Each operating segment has responsibility for its commercial activities and for certain IPR&D projects for new investigational products and additional indications for in-line products that generally have achieved proof-of-concept. Each business has a geographic footprint across developed and emerging markets. Our chief operating decision maker uses the revenues and earnings of the two operating segments, among other factors, for performance evaluation and resource allocation.
We regularly review our segments and the approach used by management to evaluatefor performance evaluation and allocate resources.resource allocation.
As described in Note 1A, acquisitions and divestitures have impacted our results of operations in 2017 and 2016.
PFIZER INC. AND SUBSIDIARY COMPANIES
NOTES TO CONDENSED CONSOLIDATED FINANCIAL STATEMENTS
(UNAUDITED)
Operating Segments
|
| | |
| Some additional information about our business segments follows: |
| IH Segment | | EH Segment |
IH focuses on developing and commercializing novel, value-creating medicines and vaccines that significantly improve patients’ lives, as well as products for consumer healthcare.
Key therapeutic areas include internal medicine, vaccines, oncology, inflammation/inflammation & immunology, cardiovascular/metabolic, neuroscience/pain, rare diseases and consumer healthcare and include leading brands, such as Prevnar/Prevenar 13, Xeljanz, Eliquis, Lyrica (U.S., Japan and certain other markets), Enbrel (outside the U.S. and Canada) and Viagra (U.S. and Canada), as well as several well-known, OTC consumer products.healthcare. | | EH includes legacy brands that have lost or will soon lose market exclusivity in both developed and emerging markets, branded generics, generic sterile injectable products, biosimilars, select branded products including anti-infectives and, infusion systems.through February 2, 2017, HIS. EH also includes a new EH research and developmentan R&D organization, as well as our contract manufacturing business. |
Leading brands include: - Prevnar 13/Prevenar 13 - Xeljanz - Eliquis - Lyrica (U.S., Japan and certain other markets) - Enbrel (outside the U.S. and Canada) - Viagra (U.S. and Canada) - Ibrance - Xtandi - Several OTC consumer healthcare products (e.g., Advil and Centrum) | | Leading brands include: - Lipitor - Premarin family - Norvasc - Lyrica (Europe, Russia, Turkey, Israel and Central Asia countries) - Celebrex - Inflectra/Remsima - Several sterile injectable products
|
Effective as of the beginning of 2016, the following changes impact EH:
Our entire contract manufacturing business, Pfizer CentreOne, is part of EH. Pfizer CentreOne (previously known as Pfizer CentreSource or PCS) consists of (i) the revenues and expenses of legacy Pfizer's contract manufacturing and active pharmaceutical ingredient sales operation, including the revenues and expenses related to our manufacturing and supply agreements with Zoetis; and (ii) the revenues and expenses of legacy Hospira's One-2-One sterile injectables contract manufacturing operation, which has been included in EH since we acquired Hospira on September 3, 2015. Prior to 2016, PCS was managed outside our operating segments as part of PGS and reported as "Other Business Activities". We have reclassified prior period PCS operating results ($133 million of PCS revenues and $30 million of PCS earnings in the second quarter of 2015, and $244 million of PCS revenues and $52 million of PCS earnings in the first six months of 2015) to conform to the current period presentation as part of EH.
In connection with the formation of a new EH R&D organization, certain functions transferred from Pfizer’s WRD organization to the new EH R&D organization. The new R&D organization within EH expects to develop potential new sterile injectable drugs and therapeutic solutions, as well as biosimilars. We have reclassified approximately $67 million of costs in the second quarter of 2015 and $134 million of costs in the first six months of 2015 from WRD to EH to conform to the current period presentation as part of EH.
Effective as of the beginning of the second quarter of 2016, the following changes impact IH:
In connection with the formation of the GPD organization, a new unified center for late-stage development for our innovative products, which is generally responsible for the clinical development of assets that are in clinical trials for our WRD and Innovative portfolios, certain development-related functions transferred from IH to GPD. We have reclassified approximately $76 million of costs in the first quarter of 2016, approximately $73 million of costs in the second quarter of 2015 and approximately $147 million of costs in the first six months of 2015 from IH to GPD to conform to the current period presentation as part of GPD.
Our chief operating decision maker uses the revenues and earnings of the two operating segments, among other factors, for performance evaluation and resource allocation.
PFIZER INC. AND SUBSIDIARY COMPANIES
NOTES TO CONDENSED CONSOLIDATED FINANCIAL STATEMENTS
(UNAUDITED)
Other Costs and Business Activities
Certain pre-tax costs are not allocated to our operating segment results, such as costs associated with the following:
WRD, which is generally responsible for research projects for our IH business until proof-of-concept is achieved and then for transitioning those projects to the IH segment via the newly formed GPD organization for possible clinical and commercial development. R&D spending may include upfront and milestone payments for intellectual property rights. The WRD organization also has responsibility for certain science-based and other platform-services organizations, which provide technical expertise and other services to the various R&D projects, including EH R&D projects. WRD is also responsible for facilitating all regulatory submissions and interactions with regulatory agencies, including all safety-event activities.
GPD, which is generally responsible for the clinical development of assets that are in clinical trials for our WRD and Innovative portfolios. GPD also provides technical support and other services to Pfizer R&D projects. In connection with the formation of the GPD organization, certain development-related functions transferred from WRD and IH to GPD.
| |
| • | Corporate, representing platform functions (such as worldwide technology, global real estate operations, legal, finance, human resources, worldwide public affairs, compliance and worldwide procurement) and certain compensation and other corporate costs, such as interest income and expense, and gains and losses on investments. Effective in the first quarter of 2017, Corporate also includes the costs associated with our Pfizer Medical organization (Medical), previously reported as part of Other Business Activities. Medical is responsible for the provision of medical information to healthcare providers, |
Pfizer Medical, which is responsible for the provision of medical information to healthcare providers, PFIZER INC. AND SUBSIDIARY COMPANIES
NOTES TO CONDENSED CONSOLIDATED FINANCIAL STATEMENTS
(UNAUDITED)
patients and other parties, transparency and disclosure activities, clinical trial results publication, grants for healthcare quality improvement and medical education, and partnerships with global public health and medical associations.
Corporate, representing platform functions (such as worldwide technology, global real estate operations, legal, finance, human resources, worldwide public affairs, compliance and worldwide procurement) and certain compensation and other corporate costs, such as interest income and expense, and gains and losses on investments.
Other unallocated costs, representing overhead expenses associated with our manufacturing and commercial operations that are not directly attributableassessed to an operating segment.segment, as business unit (segment) management does not manage these costs (which include manufacturing variances associated with production).
Certain transactions and events such as (i) purchase accounting adjustments, where we incur expenses associated with the amortization of fair value adjustments to inventory, intangible assets and PP&E; (ii) acquisition-related costs, where we incur costs for executing the transaction, integrating the acquired operations and restructuring the combined company; and (iii) certain significant items, which arerepresenting substantive and/or unusual, and in some cases recurring, items (such as restructuring or unusual itemslegal charges) that are evaluated on an individual basis by management and whichthat, either as a result of their nature or size, would not be expected to occur as part of our normal business on a regular basis. Such items can include, but are not limited to, non-acquisition-related restructuring costs, as well as costs incurred for legal settlements, asset impairments and disposals of assets or businesses, including, as applicable, any associated transition activities.
Segment Assets
We manage our assets on a total company basis, not by operating segment, as many of our operating assets are shared (such as our plant network assets) or commingled (such as accounts receivable, as many of our customers are served by multipleboth operating segments). Therefore, our chief operating decision maker does not regularly review any asset information by operating segment and, accordingly, we do not report asset information by operating segment. Total assets were approximately $171$169 billion as of July 3, 20162, 2017 and approximately $167$172 billion as of December 31, 2015.2016.
Selected Income Statement Information
|
| | | | | | | | | | | | | | | | |
| The following table provides selected income statement information by reportable segment: |
| | | Three Months Ended |
| | | Revenues | | Earnings(a) |
| (MILLIONS OF DOLLARS) | | July 2,
2017 |
| | July 3,
2016 |
| | July 2,
2017 |
| | July 3,
2016 |
|
| Reportable Segments: | | | | | | | | |
| IH | | $ | 7,671 |
| | $ | 7,105 |
| | $ | 4,666 |
| | $ | 4,179 |
|
| EH | | 5,226 |
| | 6,042 |
| | 2,787 |
| | 3,198 |
|
| Total reportable segments | | 12,896 |
| | 13,147 |
| | 7,453 |
| | 7,377 |
|
Other business activities(b), (c) | | — |
| | — |
| | (758 | ) | | (674 | ) |
| Reconciling Items: | | | | | | |
| | |
|
Corporate(c) | | — |
| | — |
| | (1,222 | ) | | (1,289 | ) |
Purchase accounting adjustments(c) | | — |
| | — |
| | (1,201 | ) | | (984 | ) |
Acquisition-related costs(c) | | — |
| | — |
| | (68 | ) | | (202 | ) |
Certain significant items(d) | | — |
| | — |
| | (191 | ) | | (1,506 | ) |
| Other unallocated | | — |
| | — |
| | (199 | ) | | (312 | ) |
| | | $ | 12,896 |
| | $ | 13,147 |
|
| $ | 3,815 |
| | $ | 2,410 |
|
| |
| | | Six Months Ended |
| | | Revenues | | Earnings(a) |
| (MILLIONS OF DOLLARS) | | July 2,
2017 |
| | July 3,
2016 |
| | July 2,
2017 |
| | July 3,
2016 |
|
| Reportable Segments: | | | | | | | | |
| IH | | $ | 15,086 |
| | $ | 14,139 |
| | $ | 9,316 |
| | $ | 8,282 |
|
| EH | | 10,590 |
| | 12,013 |
| | 5,793 |
| | 6,857 |
|
| Total reportable segments | | 25,675 |
| | 26,152 |
| | 15,109 |
| | 15,139 |
|
Other business activities(b), (c) | | — |
| | — |
| | (1,445 | ) | | (1,343 | ) |
| Reconciling Items: | | | | | | | | |
Corporate(c) | | — |
| | — |
| | (2,566 | ) | | (2,680 | ) |
Purchase accounting adjustments(c) | | — |
| | — |
| | (2,373 | ) | | (2,137 | ) |
Acquisition-related costs(c) | | ��� |
| | — |
| | (192 | ) | | (317 | ) |
Certain significant items(d) | | — |
| | — |
| | (348 | ) | | (2,144 | ) |
| Other unallocated | | — |
| | — |
| | (418 | ) | | (548 | ) |
| | | $ | 25,675 |
| | $ | 26,152 |
| | $ | 7,767 |
| | $ | 5,971 |
|
PFIZER INC. AND SUBSIDIARY COMPANIES
NOTES TO CONDENSED CONSOLIDATED FINANCIAL STATEMENTS
(UNAUDITED)
Selected Income Statement Information
|
| | | | | | | | | | | | | | | | |
| The following table provides selected income statement information by reportable segment: |
| | | Three Months Ended |
| | | Revenues | | Earnings(a) |
| (MILLIONS OF DOLLARS) | | July 3,
2016 |
| | June 28,
2015 |
| | July 3,
2016 |
| | June 28,
2015 |
|
| Reportable Segments: | | | | | | | | |
IH(b) | | $ | 7,105 |
| | $ | 6,630 |
| | $ | 4,179 |
| | $ | 3,764 |
|
EH(c) | | 6,042 |
| | 5,223 |
| | 3,198 |
| | 3,144 |
|
| Total reportable segments | | 13,147 |
| | 11,853 |
| | 7,377 |
| | 6,908 |
|
Other business activities(d) | | — |
| | — |
| | (708 | ) | | (715 | ) |
| Reconciling Items: | | | | | | |
| | |
|
Corporate(e) | | — |
| | — |
| | (1,256 | ) | | (1,286 | ) |
Purchase accounting adjustments(e) | | — |
| | — |
| | (984 | ) | | (835 | ) |
Acquisition-related costs(e) | | — |
| | — |
| | (202 | ) | | (68 | ) |
Certain significant items(f) | | — |
| | — |
| | (1,506 | ) | | (305 | ) |
| Other unallocated | | — |
| | — |
| | (312 | ) | | (160 | ) |
| | | $ | 13,147 |
| | $ | 11,853 |
|
| $ | 2,410 |
| | $ | 3,539 |
|
| | | | | | | | | |
| | | Six Months Ended |
| | | Revenues | | Earnings(a) |
| (MILLIONS OF DOLLARS) | | July 3,
2016 |
| | June 28,
2015 |
| | July 3,
2016 |
| | June 28,
2015 |
|
| Reportable Segments: | | | | | | | | |
IH(b) | | $ | 14,139 |
| | $ | 12,368 |
| | $ | 8,282 |
| | $ | 6,813 |
|
EH(c) | | 12,013 |
| | 10,348 |
| | 6,857 |
| | 6,359 |
|
| Total reportable segments | | 26,152 |
| | 22,717 |
| | 15,139 |
| | 13,172 |
|
Other business activities(d) | | — |
| | — |
| | (1,404 | ) | | (1,412 | ) |
| Reconciling Items: | | | | | | | | |
Corporate(e) | | — |
| | — |
| | (2,619 | ) | | (2,573 | ) |
Purchase accounting adjustments(e) | | — |
| | — |
| | (2,137 | ) | | (1,738 | ) |
Acquisition-related costs(e) | | — |
| | — |
| | (317 | ) | | (91 | ) |
Certain significant items(f) | | — |
| | — |
| | (2,144 | ) | | (532 | ) |
| Other unallocated | | — |
| | — |
| | (548 | ) | | (205 | ) |
| | | $ | 26,152 |
| | $ | 22,717 |
| | $ | 5,971 |
| | $ | 6,621 |
|
| |
(a) | Income from continuing operations before provision for taxes on income. |
| |
(b)
| Effective as of the beginning of the second quarter of 2016, IH’s earnings in connection with the formation of the GPD organization, certain development-related functions transferred from IH to GPD. We have reclassified approximately $76 million of costs in the first quarter of 2016, approximately $73 million of costs in the second quarter of 2015 and approximately $147 million of costs in the first six months of 2015 from IH to GPD to conform to the current period presentation as part of GPD. |
| |
(c)
| On September 3, 2015, we acquired Hospira. Commencing from the acquisition date, our condensed consolidated statement of income includes the operating results of Hospira. As a result, legacy Hospira commercial operations, including the legacy Hospira One-2-One contract manufacturing business, are included in EH’s operating results in our condensed consolidated statements of income for the second quarter and first six months of 2016, but not for the second quarter2017 include dividend income of $114 million and first six months of 2015. See $157 million, respectively, from our investment in ViiV. For additional information, see Note 2A for additional information. Effective as of the beginning of 2016, our entire contract manufacturing business, Pfizer CentreOne, is part of EH. Pfizer CentreOne (previously known as Pfizer CentreSource or PCS) consists of (i) the revenues and expenses of legacy Pfizer's contract manufacturing and active pharmaceutical ingredient sales operation, including the revenues and expenses related to our manufacturing and supply agreements with Zoetis; and (ii) the revenues and expenses of legacy Hospira's One-2-One sterile injectables contract manufacturing operation, which has been included in EH since we acquired Hospira on September 3, 2015. Prior to 2016, PCS was managed outside our operating segments as part of PGS and reported as "Other Business Activities". We have reclassified prior period PCS operating results ($133 million of PCS revenues and $30 million of PCS earnings in the second quarter of 2015, and $244 million of PCS revenues and $52 million of PCS earnings in the first six months of 2015) to conform to the current period presentation as part of EH. As noted above, also effective as of the beginning of 2016, in connection with the formation of a new EH R&D organization, certain functions transferred from Pfizer’s WRD organization to the new EH R&D organization. We have reclassified approximately $67 million of costs in the second quarter of 2015 and $134 million of costs in the first six months of 2015 from WRD to EH to conform to the current period presentation as part of EH.4.
|
| |
(d)(b)
| Other business activities includes the costs managed by our WRD and GPD organizations. Effective in the first quarter of 2017, Medical, previously reported as part of Other Business Activities, was reclassified to Corporate. We have reclassified approximately $34 million and Pfizer Medical organizations.$61 million of costs from Other Business Activities to Corporate in the second quarter and first six months of 2016, respectively, to conform to the current period presentation. |
| |
(e)(c)
| For a description, see the “Other Costs and Business Activities” section above. |
| |
(f)(d)
| Certain significant items are substantive and/or unusual, and in some cases recurring, items (such as restructuring or legal charges), or unusual items that, either as a result of their nature or size, would not be expected to occur as part of our normal business on a regular basis. |
For Earnings in the second quarter of 2017, certain significant items includes: (i) restructuring charges and implementation costs associated with our cost-reduction initiatives that are not associated with an acquisition of $85 million, (ii) an incremental charge to amounts previously recorded to write down the HIS net assets to fair value less costs to sell of $28 million, (iii) charges for business and legal entity alignment of $17 million and (iv) other charges of $61 million. For additional information, see Note 2B, Note 3 and Note 4.
For Earnings in the second quarter of 2016, certain significant items includes: (i) restructuring charges and implementation costs associated with our cost-reduction initiatives that are not associated with an acquisition of $231 million, (ii) charges for certain legal matters of $261 million, (iii) certain asset impairment charges of $816 million, (iv) charges for business and legal entity alignment of $60 million and (v) other charges of $138 million. For additional information, see Note 3andNote 4.4.
For Earnings in the second quarterfirst six months of 2015,2017, certain significant items includes: (i) restructuring charges and implementation costs associated with our cost-reduction initiatives that are not associated with an acquisition of $91$163 million, (ii) charges for certain legal matters of $92$8 million, (iii) incremental charges to amounts previously recorded to write down the HIS net assets to fair value less costs to sell of $64 million, (iv) charges for business and legal entity alignment of $63$38 million and (iv)(v) other charges of $58$74 million. For additional information, see Note 2B, Note 3and Note 4.4.
PFIZER INC. AND SUBSIDIARY COMPANIES
NOTES TO CONDENSED CONSOLIDATED FINANCIAL STATEMENTS
(UNAUDITED)
For Earnings in the first six months of 2016, certain significant items includes: (i) restructuring charges and implementation costs associated with our cost-reduction initiatives that are not associated with an acquisition of $368 million, (ii) charges for certain legal matters of $546 million, (iii) certain asset impairment charges of $947 million, (iv) charges for business and legal entity alignment of $111 million and (v) other charges of $172 million. For additional information, see Note 3 and Note 4.
For Earnings in the first six months of 2015, certain significant items includes: (i) restructuring charges and implementation costs associated with our cost-reduction initiatives that are not associated with an acquisition of $195 million, (ii) charges for business and legal entity alignment of $164 million, (iii) charges for certain legal matters of $92 million, and (iv) other charges of $81 million. For additional information, see Note 3 and Note 4.4.
Equity in the net income of investees accounted for by the equity method is not significant for any of our operating segments.
The operating segment information does not purport to represent the revenues, costs and income from continuing operations before provision for taxes on income that each of our operating segments would have recorded had each segment operated as a standalone company during the periods presented.
B. Geographic Information
As described in Note 1A, acquisitions and divestitures have impacted our results of operations in 2017 and 2016.
| | The following table provides revenues by geographic area(a): | |
| The following table provides revenues by geographic area: | | The following table provides revenues by geographic area: |
| | | Three Months Ended | | Six Months Ended | | Three Months Ended | | Six Months Ended |
| (MILLIONS OF DOLLARS) | | July 3,
2016 |
| | June 28,
2015 |
| | % Change |
| | July 3,
2016 |
| | June 28,
2015 |
| | % Change |
| | July 2,
2017 |
| | July 3,
2016 |
| | % Change |
| | July 2,
2017 |
| | July 3,
2016 |
| | % Change |
|
| United States | | $ | 6,335 |
| | $ | 4,994 |
| | 27 |
| | $ | 12,960 |
| | $ | 9,428 |
| | 37 |
| |
| U.S. | | | $ | 6,345 |
| | $ | 6,370 |
| | — |
| | $ | 12,982 |
| | $ | 13,031 |
| | — |
|
Developed Europe(b)(a) | | 2,440 |
| | 2,380 |
| | 3 |
| | 4,810 |
| | 4,691 |
| | 3 |
| | 2,124 |
| | 2,418 |
| | (12 | ) | | 4,145 |
| | 4,764 |
| | (13 | ) |
Developed Rest of World(c)(b) | | 1,718 |
| | 1,558 |
| | 10 |
| | 3,238 |
| | 3,050 |
| | 6 |
| | 1,611 |
| | 1,713 |
| | (6 | ) | | 3,165 |
| | 3,229 |
| | (2 | ) |
Emerging Markets(d)(c) | | 2,655 |
| | 2,921 |
| | (9 | ) | | 5,143 |
| | 5,548 |
| | (7 | ) | | 2,815 |
| | 2,646 |
| | 6 |
| | 5,382 |
| | 5,128 |
| | 5 |
|
| Revenues | | $ | 13,147 |
| | $ | 11,853 |
| | 11 |
| | $ | 26,152 |
| | $ | 22,717 |
| | 15 |
| | $ | 12,896 |
| | $ | 13,147 |
| | (2 | ) | | $ | 25,675 |
| | $ | 26,152 |
| | (2 | ) |
| |
(a) | On September 3, 2015, we acquired Hospira. Commencing from the acquisition date, our condensed consolidated statement of income includes the operating results of Hospira. As a result, legacy Hospira operations are included in our condensed consolidated statements of income for the second quarter and first six months of 2016, but not for the second quarter and first six months of 2015. See Note 2A for additional information.
|
| |
(b)
| Developed Europe region includes the following markets: Western Europe, FinlandScandinavian countries and the Scandinavian countries.Finland. Revenues denominated in euros were $1.9$1.7 billion and $1.8 billion in the second quarter of 20162017 and 2015,2016, respectively, and $3.7$3.3 billion and $3.6 billion in the first six months of 20162017 and 2015,2016, respectively. |
| |
(c)(b)
| Developed Rest of World region includes the following markets: Japan, Canada, Australia, Canada, Japan,South Korea and New Zealand and South Korea.Zealand. |
| |
(d)(c)
| Emerging Markets region includes, but is not limited to, the following markets: Asia (excluding Japan and South Korea), Latin America, Africa, Eastern Europe, Central Europe, the Middle East and Turkey. |
PFIZER INC. AND SUBSIDIARY COMPANIES
NOTES TO CONDENSED CONSOLIDATED FINANCIAL STATEMENTS
(UNAUDITED)
C. Other Revenue Information
Significant Product Revenues |
| | | | | | | | | | | | | | | | |
| The following table provides detailed revenue information: |
| | | Three Months Ended | | Six Months Ended |
| (MILLIONS OF DOLLARS) | | July 3,
2016 |
| | June 28,
2015 |
| | July 3,
2016 |
| | June 28,
2015 |
|
PFIZER INNOVATIVE HEALTH (IH)(a) | | $ | 7,105 |
| | $ | 6,630 |
| | $ | 14,139 |
| | $ | 12,368 |
|
| Internal Medicine | | $ | 2,190 |
| | $ | 1,895 |
| | $ | 4,314 |
| | $ | 3,546 |
|
Lyrica IH(b) | | 1,048 |
| | 907 |
| | 2,059 |
| | 1,753 |
|
Viagra IH(c) | | 300 |
| | 334 |
| | 600 |
| | 622 |
|
| Chantix/Champix | | 213 |
| | 173 |
| | 434 |
| | 332 |
|
| Toviaz | | 67 |
| | 71 |
| | 131 |
| | 134 |
|
| BMP2 | | 61 |
| | 75 |
| | 112 |
| | 113 |
|
Alliance revenues(d) | | 371 |
| | 291 |
| | 722 |
| | 498 |
|
| All other Internal Medicine | | 130 |
| | 44 |
| | 257 |
| | 94 |
|
| Vaccines | | $ | 1,365 |
| | $ | 1,580 |
| | $ | 2,935 |
| | $ | 2,908 |
|
| Prevnar/Prevenar 13 | | 1,258 |
| | 1,503 |
| | 2,766 |
| | 2,808 |
|
| FSME/IMMUN-TicoVac | | 42 |
| | 56 |
| | 69 |
| | 65 |
|
| All other Vaccines | | 65 |
| | 21 |
| | 100 |
| | 34 |
|
| Oncology | | $ | 1,101 |
| | $ | 713 |
| | $ | 2,102 |
| | $ | 1,240 |
|
| Ibrance | | 514 |
| | 140 |
| | 942 |
| | 178 |
|
| Sutent | | 285 |
| | 294 |
| | 563 |
| | 536 |
|
| Xalkori | | 137 |
| | 119 |
| | 275 |
| | 230 |
|
| Inlyta | | 108 |
| | 111 |
| | 209 |
| | 206 |
|
| All other Oncology | | 57 |
| | 49 |
| | 112 |
| | 90 |
|
| Inflammation & Immunology (I&I) | | $ | 999 |
| | $ | 966 |
| | $ | 1,947 |
| | $ | 1,829 |
|
| Enbrel (Outside the U.S. and Canada) | | 766 |
| | 822 |
| | 1,500 |
| | 1,581 |
|
| Xeljanz | | 217 |
| | 128 |
| | 414 |
| | 224 |
|
| All other I&I | | 16 |
| | 16 |
| | 33 |
| | 24 |
|
| Rare Disease | | $ | 614 |
| | $ | 636 |
| | $ | 1,182 |
| | $ | 1,198 |
|
| BeneFIX | | 183 |
| | 193 |
| | 367 |
| | 366 |
|
| Genotropin | | 152 |
| | 167 |
| | 277 |
| | 306 |
|
| Refacto AF/Xyntha | | 139 |
| | 142 |
| | 268 |
| | 262 |
|
| Somavert | | 59 |
| | 55 |
| | 114 |
| | 104 |
|
| Rapamune | | 47 |
| | 53 |
| | 93 |
| | 106 |
|
| All other Rare Disease | | 33 |
| | 26 |
| | 63 |
| | 53 |
|
| Consumer Healthcare | | $ | 837 |
| | $ | 840 |
| | $ | 1,659 |
| | $ | 1,648 |
|
PFIZER ESSENTIAL HEALTH (EH)(e) | | $ | 6,042 |
| | $ | 5,223 |
| | $ | 12,013 |
| | $ | 10,348 |
|
Legacy Established Products (LEP)(f) | | $ | 2,864 |
| | $ | 2,934 |
| | $ | 5,664 |
| | $ | 5,782 |
|
| Lipitor | | 461 |
| | 509 |
| | 872 |
| | 950 |
|
| Premarin family | | 251 |
| | 259 |
| | 507 |
| | 491 |
|
| Norvasc | | 240 |
| | 251 |
| | 476 |
| | 503 |
|
| EpiPen | | 93 |
| | 85 |
| | 190 |
| | 161 |
|
| Xalatan/Xalacom | | 94 |
| | 99 |
| | 182 |
| | 201 |
|
| Relpax | | 87 |
| | 82 |
| | 165 |
| | 162 |
|
| Zoloft | | 77 |
| | 93 |
| | 156 |
| | 179 |
|
Zithromax/Zmax(g) | | 67 |
| | 61 |
| | 147 |
| | 140 |
|
| Effexor | | 67 |
| | 74 |
| | 137 |
| | 147 |
|
| Tikosyn | | 55 |
| | 42 |
| | 116 |
| | 79 |
|
| Xanax/Xanax XR | | 55 |
| | 54 |
| | 108 |
| | 109 |
|
| Cardura | | 48 |
| | 55 |
| | 94 |
| | 106 |
|
| Neurontin | | 47 |
| | 48 |
| | 91 |
| | 103 |
|
| Depo-Provera | | 34 |
| | 51 |
| | 68 |
| | 88 |
|
| All other LEP | | 1,187 |
| | 1,172 |
| | 2,355 |
| | 2,364 |
|
Sterile Injectable Pharmaceuticals (SIP)(h) | | $ | 1,497 |
| | $ | 751 |
| | $ | 3,021 |
| | $ | 1,479 |
|
Medrol(g) | | 115 |
| | 99 |
| | 228 |
| | 186 |
|
| Sulperazon | | 105 |
| | 80 |
| | 201 |
| | 179 |
|
| Fragmin | | 82 |
| | 88 |
| | 160 |
| | 162 |
|
| Tygacil | | 59 |
| | 77 |
| | 134 |
| | 150 |
|
| All other SIP | | 1,136 |
| | 407 |
| | 2,297 |
| | 803 |
|
PFIZER INC. AND SUBSIDIARY COMPANIES
NOTES TO CONDENSED CONSOLIDATED FINANCIAL STATEMENTS
(UNAUDITED)
|
| | | | | | | | | | | | | | | | |
| The following table provides detailed revenue information: |
| | | Three Months Ended | | Six Months Ended |
| (MILLIONS OF DOLLARS) | | July 2,
2017 |
| | July 3,
2016 |
| | July 2,
2017 |
| | July 3,
2016 |
|
PFIZER INNOVATIVE HEALTH (IH)(a) | | $ | 7,671 |
| | $ | 7,105 |
| | $ | 15,086 |
| | $ | 14,139 |
|
| Internal Medicine | | $ | 2,412 |
| | $ | 2,190 |
| | $ | 4,789 |
| | $ | 4,314 |
|
Lyrica IH(b) | | 1,101 |
| | 1,048 |
| | 2,231 |
| | 2,059 |
|
| Eliquis alliance revenues and direct sales | | 605 |
| | 404 |
| | 1,169 |
| | 776 |
|
Viagra IH(c) | | 255 |
| | 300 |
| | 505 |
| | 600 |
|
| Chantix/Champix | | 248 |
| | 213 |
| | 487 |
| | 434 |
|
| Toviaz | | 62 |
| | 67 |
| | 125 |
| | 131 |
|
| BMP2 | | 57 |
| | 61 |
| | 119 |
| | 112 |
|
| All other Internal Medicine | | 84 |
| | 97 |
| | 153 |
| | 203 |
|
| Vaccines | | $ | 1,270 |
| | $ | 1,365 |
| | $ | 2,735 |
| | $ | 2,935 |
|
| Prevnar 13/Prevenar 13 | | 1,154 |
| | 1,258 |
| | 2,547 |
| | 2,766 |
|
| FSME/IMMUN-TicoVac | | 50 |
| | 42 |
| | 76 |
| | 69 |
|
| All other Vaccines | | 66 |
| | 65 |
| | 112 |
| | 100 |
|
| Oncology | | $ | 1,589 |
| | $ | 1,101 |
| | $ | 2,935 |
| | $ | 2,102 |
|
| Ibrance | | 853 |
| | 514 |
| | 1,532 |
| | 942 |
|
| Sutent | | 279 |
| | 285 |
| | 529 |
| | 563 |
|
| Xalkori | | 155 |
| | 137 |
| | 296 |
| | 275 |
|
| Xtandi alliance revenues | | 141 |
| | — |
| | 272 |
| | — |
|
| Inlyta | | 88 |
| | 108 |
| | 172 |
| | 209 |
|
| Bosulif | | 59 |
| | 41 |
| | 106 |
| | 78 |
|
| All other Oncology | | 14 |
| | 16 |
| | 28 |
| | 34 |
|
| Inflammation & Immunology (I&I) | | $ | 992 |
| | $ | 999 |
| | $ | 1,863 |
| | $ | 1,947 |
|
| Enbrel (Outside the U.S. and Canada) | | 617 |
| | 766 |
| | 1,205 |
| | 1,500 |
|
| Xeljanz | | 336 |
| | 217 |
| | 587 |
| | 414 |
|
| Eucrisa |
| 9 |
|
| — |
|
| 17 |
|
| — |
|
| All other I&I | | 31 |
| | 16 |
| | 54 |
| | 33 |
|
| Rare Disease | | $ | 562 |
| | $ | 614 |
| | $ | 1,069 |
| | $ | 1,182 |
|
| BeneFIX | | 153 |
| | 183 |
| | 302 |
| | 367 |
|
| Refacto AF/Xyntha | | 139 |
| | 139 |
| | 269 |
| | 268 |
|
| Genotropin | | 135 |
| | 152 |
| | 238 |
| | 277 |
|
| Somavert | | 61 |
| | 59 |
| | 117 |
| | 114 |
|
| All other Rare Disease | | 74 |
| | 81 |
| | 141 |
| | 156 |
|
| Consumer Healthcare | | $ | 846 |
| | $ | 837 |
| | $ | 1,694 |
| | $ | 1,659 |
|
PFIZER ESSENTIAL HEALTH (EH)(d) | | $ | 5,226 |
| | $ | 6,042 |
| | $ | 10,590 |
| | $ | 12,013 |
|
Legacy Established Products (LEP)(e) | | $ | 2,707 |
| | $ | 2,864 |
| | $ | 5,313 |
| | $ | 5,664 |
|
| Lipitor | | 445 |
| | 461 |
| | 849 |
| | 872 |
|
| Premarin family | | 245 |
| | 251 |
| | 473 |
| | 507 |
|
| Norvasc | | 231 |
| | 240 |
| | 458 |
| | 476 |
|
| EpiPen | | 90 |
| | 93 |
| | 171 |
| | 190 |
|
| Xalatan/Xalacom | | 81 |
| | 94 |
| | 158 |
| | 182 |
|
| Relpax | | 60 |
| | 87 |
| | 143 |
| | 165 |
|
| Zithromax | | 62 |
| | 67 |
| | 140 |
| | 147 |
|
| Effexor | | 73 |
| | 67 |
| | 139 |
| | 137 |
|
| Zoloft | | 69 |
| | 77 |
| | 137 |
| | 156 |
|
| Xanax | | 52 |
| | 55 |
| | 107 |
| | 108 |
|
| All other LEP | | 1,300 |
| | 1,371 |
| | 2,538 |
| | 2,723 |
|
Sterile Injectable Pharmaceuticals (SIP)(f) | | $ | 1,444 |
| | $ | 1,497 |
| | $ | 2,996 |
| | $ | 3,021 |
|
| Medrol | | 123 |
| | 115 |
| | 243 |
| | 228 |
|
| Sulperazon | | 110 |
| | 105 |
| | 232 |
| | 201 |
|
| Fragmin | | 71 |
| | 82 |
| | 142 |
| | 160 |
|
| Precedex | | 67 |
| | 66 |
| | 132 |
| | 135 |
|
| Tygacil | | 57 |
| | 59 |
| | 131 |
| | 134 |
|
| All other SIP | | 1,016 |
| | 1,070 |
| | 2,116 |
| | 2,162 |
|
| | Peri-LOE Products(i) | | $ | 1,111 |
| | $ | 1,406 |
| | $ | 2,201 |
| | $ | 2,843 |
| |
| | | | Three Months Ended | | Six Months Ended |
| (MILLIONS OF DOLLARS) | | | July 2,
2017 |
| | July 3,
2016 |
| | July 2,
2017 |
| | July 3,
2016 |
|
Peri-LOE Products(g) | | | $ | 782 |
| | $ | 1,111 |
| | $ | 1,604 |
| | $ | 2,201 |
|
| Celebrex | | | 178 |
| | 183 |
| | 353 |
| | 355 |
|
Lyrica EH(b) | | 214 |
| | 312 |
| | 431 |
| | 652 |
| | 154 |
| | 214 |
| | 294 |
| | 431 |
|
| Vfend | | | 101 |
| | 162 |
| | 208 |
| | 319 |
|
Viagra EH(c) | | | 93 |
| | 101 |
| | 183 |
| | 197 |
|
| Pristiq | | 194 |
| | 177 |
| | 372 |
| | 338 |
| | 46 |
| | 194 |
| | 161 |
| | 372 |
|
| Celebrex | | 183 |
| | 224 |
| | 355 |
| | 428 |
| |
| Vfend | | 162 |
| | 162 |
| | 319 |
| | 345 |
| |
| Zyvox | | 114 |
| | 259 |
| | 240 |
| | 530 |
| | 75 |
| | 114 |
| | 152 |
| | 240 |
|
Viagra EH(c) | | 101 |
| | 113 |
| | 197 |
| | 221 |
| |
| Revatio | | 74 |
| | 65 |
| | 140 |
| | 128 |
| | 67 |
| | 74 |
| | 131 |
| | 140 |
|
| All Other Peri-LOE Products | | 69 |
| | 94 |
| | 146 |
| | 201 |
| |
Infusion Systems(j) | | $ | 295 |
| | $ | — |
| | $ | 599 |
| | $ | — |
| |
Biosimilars(k) | | $ | 78 |
| | $ | — |
| | $ | 145 |
| | $ | — |
| |
Pfizer CentreOne(l) | | $ | 196 |
| | $ | 133 |
| | $ | 384 |
| | $ | 244 |
| |
| All other Peri-LOE Products | | | 68 |
| | 69 |
| | 121 |
| | 146 |
|
Biosimilars(h) | | | $ | 121 |
| | $ | 78 |
| | $ | 226 |
| | $ | 145 |
|
| Inflectra/Remsima | | | 94 |
| | 45 |
| | 172 |
| | 81 |
|
| All other Biosimilars | | | 27 |
| | 33 |
| | 54 |
| | 64 |
|
Pfizer CentreOne(i) | | | $ | 171 |
| | $ | 196 |
| | $ | 353 |
| | $ | 384 |
|
Hospira Infusion Systems (HIS)(j) | | | $ | — |
| | $ | 295 |
| | $ | 97 |
| | $ | 599 |
|
| Revenues | | $ | 13,147 |
| | $ | 11,853 |
| | $ | 26,152 |
| | $ | 22,717 |
| | $ | 12,896 |
| | $ | 13,147 |
| | $ | 25,675 |
| | $ | 26,152 |
|
| | | | | | | | | | | | | | | | | |
Total Lyrica(b) | | $ | 1,261 |
| | $ | 1,219 |
| | $ | 2,490 |
| | $ | 2,406 |
| | $ | 1,254 |
| | $ | 1,261 |
| | $ | 2,526 |
| | $ | 2,490 |
|
Total Viagra(c) | | $ | 401 |
| | $ | 448 |
| | $ | 796 |
| | $ | 843 |
| | $ | 349 |
| | $ | 401 |
| | $ | 687 |
| | $ | 796 |
|
| Total Alliance revenues | | $ | 376 |
| | $ | 311 |
| | $ | 736 |
| | $ | 533 |
| | $ | 715 |
| | $ | 376 |
| | $ | 1,370 |
| | $ | 736 |
|
| |
(a) | The IH business, previously known as the Innovative Products business encompasses Internal Medicine, Vaccines, Oncology, Inflammation & Immunology, Rare Disease and Consumer Healthcare. Through December 31, 2016, includes Duavive/Duavee and Viviant (recorded in All other Internal Medicine in 2016), which were transferred from Innovative Health to Essential Health effective January 1, 2017 (recorded in All other LEP (EH) beginning January 1, 2017), in order to align these products with our management of the women’s health portfolio within EH. |
| |
(b) | Lyrica revenues from all of Europe, Russia, Turkey, Israel and Central Asia countries are included in Lyrica EH. All other Lyrica revenues are included in Lyrica IH. Total Lyrica revenues represent the aggregate of worldwide revenues from Lyrica IH and Lyrica EH. |
| |
(c) | Viagra revenues from the U.S. and Canada are included in Viagra IH. All other Viagra revenues are included in Viagra EH. Total Viagra revenues represent the aggregate of worldwide revenues from Viagra IH and Viagra EH. |
| |
(d) | Includes Eliquis (2016 and 2015) and Rebif (2015 only). |
| |
(e)
| The EH business, previously known as the Established Products business encompasses Legacy Established Products, Sterile Injectable Pharmaceuticals, Peri-LOE Products, Infusion Systems,HIS (through February 2, 2017), Biosimilars and Pfizer CentreOne and includes all legacy Hospira commercial operations. Hospira's commercial operations, including the legacy Hospira One-2-One sterile injectables contract manufacturing business, are included in EH’s operating results in our condensed consolidated statements of income, commencing from the acquisition date of September 3, 2015. As a result, EH's revenues for the second quarter and first six months of 2015 do not include Hospira's revenues. Also, effective as of the beginning of 2016, our entire contract manufacturing business, Pfizer CentreOne, is part of EH. Pfizer CentreOne (previously known as Pfizer CentreSource or PCS) consists of (i) legacy Pfizer's contract manufacturing and active pharmaceutical ingredient sales operation, including our manufacturing and supply agreements with Zoetis; and (ii) legacy Hospira's One-2-One sterile injectables contract manufacturing operation. Prior to 2016, PCS was managed outside our operating segments and its revenues were reported as other business activities. We have reclassified prior period PCS revenues ($133 million in the second quarter of 2015 and $244 million in the first six months of 2015) to conform to the current period presentation as part of EH. |
| |
(f)(e)
| Legacy Established Products primarily include products that have lost patent protection (excluding Sterile Injectable Pharmaceuticals and Peri-LOE Products). Effective January 1, 2017, All other LEP includes Duavive/Duavee and Viviant, which were transferred from Innovative Health (recorded in All other Internal Medicine (IH) in 2016), in order to align these products with our management of the women’s health portfolio within EH.See note (a) above. |
| |
(g)(f)
| Prior period revenues for Medrol and Zithromax/Zmax may not agree to previously-disclosed revenues because revenues for those products are now split between the Legacy Established Products and the Sterile Injectable Pharmaceuticals categories. |
| |
(h)
| Sterile Injectable Pharmaceuticals include generic injectables and proprietary specialty injectables (excluding Peri-LOE Products). |
| |
(i)(g)
| Peri-LOE Products include products that have recently lost or are anticipated to soon lose patent protection. These products primarily includeinclude: Lyrica in certain developed Europe, markets, Pristiq globally, Celebrex, ZyvoxRussia, Turkey, Israel and Revatio in most developed markets, Vfend andCentral Asia; Viagra in certain developed Europe marketsall countries (excluding the U.S. and Japan,Canada); and Inspra in the EU.worldwide revenues for Celebrex, Pristiq, Zyvox, Vfend, Revatio and Inspra. |
| |
(h) | Biosimilars include Inflectra/Remsima (biosimilar infliximab) in the U.S. and certain international markets, Nivestim (biosimilar filgrastim) in certain European, Asian and Africa/Middle Eastern markets and Retacrit (biosimilar epoetin zeta) in certain European and Africa/Middle Eastern markets. |
| |
(i) | Pfizer CentreOne includes revenues from our contract manufacturing and active pharmaceutical ingredient sales operation, including sterile injectables contract manufacturing, and revenues related to our manufacturing and supply agreements, including with Zoetis. |
| |
(j) | Infusion Systems includeHIS (through February 2, 2017) includes Medication Management Systems products composed of infusion pumps and related software and services, as well as I.V.IV Infusion Products, including large volume I.V.IV solutions and their associated administration sets. |
| |
(k)
| Biosimilars include Inflectra (biosimilar infliximab) in certain European markets, Nivestim (biosimilar filgrastim) in certain Asian markets and Retacrit (biosimilar epoetin zeta) in certain international markets. |
| |
(l)
| Pfizer CentreOne (previously known as Pfizer CentreSource or PCS) includes (i) revenues from legacy Pfizer's contract manufacturing and active pharmaceutical ingredient sales operation, including revenues related to our manufacturing and supply agreements with Zoetis; and (ii) revenues from legacy Hospira’s One-2-One sterile injectables contract manufacturing operation. |
REVIEW REPORT OF INDEPENDENT REGISTERED PUBLIC ACCOUNTING FIRM
To the Board of Directors and Shareholders of Pfizer Inc.:
We have reviewed the condensed consolidated balance sheet of Pfizer Inc. and Subsidiary Companies as of July 2, 2017, the related condensed consolidated statements of income and comprehensive income for the three-month and six-month periods ended July 2, 2017 and July 3, 2016, and the related condensed consolidated statements of income, comprehensive income and cash flows for the three-month and six-month periods ended July 2, 2017 and July 3, 2016 and June 28, 2015.2016. These condensed consolidated financial statements are the responsibility of the Company’s management.
We conducted our reviews in accordance with the standards of the Public Company Accounting Oversight Board (United States). A review of interim financial information consists principally of applying analytical procedures and making inquiries of persons responsible for financial and accounting matters. It is substantially less in scope than an audit conducted in accordance with the standards of the Public Company Accounting Oversight Board (United States), the objective of which is the expression of an opinion regarding the financial statements taken as a whole. Accordingly, we do not express such an opinion.
Based on our reviews, we are not aware of any material modifications that should be made to the condensed consolidated financial statements referred to above for them to be in conformity with U.S. generally accepted accounting principles.
We have previously audited, in accordance with standards of the Public Company Accounting Oversight Board (United States), the consolidated balance sheet of Pfizer Inc. and Subsidiary Companies as of December 31, 2015,2016, and the related consolidated statements of income, comprehensive income, equity, and cash flows for the year then ended (not presented herein); and in our report dated February 29, 2016,23, 2017, we expressed an unqualified opinion on those consolidated financial statements. In our opinion, the information set forth in the accompanying condensed consolidated balance sheet as of December 31, 2015,2016, is fairly stated, in all material respects, in relation to the consolidated balance sheet from which it has been derived.
/s/ KPMG LLP
New York, New York
August 11, 201610, 2017
Item 2. Management’s Discussion and Analysis of Financial Condition and Results of Operations
Introduction
See the Glossary of Defined Terms at the beginning of this Quarterly Report on Form 10-Q for terms used throughout this MD&A. Our MD&A is provided in addition to the accompanying condensed consolidated financial statements and footnotes to assist readers in understanding Pfizer’s results of operations, financial condition and cash flows. The MD&A is organized as follows:
|
| | | | | |
| ● | | |
| | This section provides information about the following: Our Business; our performance during the second quarter and first six months of 20162017 and 2015;2016; Our Operating Environment; Thethe Global Economic Environment; Our Strategy; Our Business Development Initiatives, such as acquisitions, dispositions, licensing and collaborations; and ourOur Financial Guidance for 2016.2017. | |
| ● | | |
| | This section includes a Revenues Overview section as well as the following sub-sections: | |
| | | |
| | This sub-section provides revenue information for several of our major biopharmaceutical products. | |
| | | |
| | This sub-section provides an overview of several of our biopharmaceutical products. | |
| | | |
| | This sub-section provides an overview of important biopharmaceutical product developments. | |
| | | |
| | This sub-section provides a discussion about our costs and expenses. | |
| | | |
| | This sub-section provides a discussion of items impacting our tax provisions. | |
| | | |
| | This sub-section provides a discussion of an alternative view of performance used by management. | |
| ● | | |
| | This section provides a discussion of the performance of each of our operating segments. | |
| ● | | |
| | This section provides a discussion of changes in certain components of other comprehensive income. | |
| ● | | |
| | This section provides a discussion of changes in certain balance sheet accounts. | |
| ● | | |
| | This section provides an analysis of our cash flows for the first six months of 20162017 and 2015.2016. | |
| ● | | |
| | This section provides an analysis of selected measures of our liquidity and of our capital resources as of July 3, 20162, 2017 and December 31, 2015,2016, as well as a discussion of our outstanding debt and other commitments that existed as of July 3, 20162, 2017 and December 31, 2015.2016. Included in the discussion of outstanding debt is a discussion of the amount of financial capacity available to help fund Pfizer’s future activities. | |
| ● | | |
| | This section discusses accounting standards that we have recently adopted, as well as those that recently have been issued, but not yet adopted. | |
| ● | | |
| | This section provides a description of the risks and uncertainties that could cause actual results to differ materially from those discussed in forward-looking statements presented in this MD&A, relating to, among other things, our anticipated future operating and financial performance, business plans and prospects, in-line products and product candidates, including anticipated regulatory submissions, approvals, performance and potential benefits of Pfizer’s products and product candidates, strategic reviews, capital allocation, business-development plans and plans relating to share repurchases and dividends. Such forward-looking statements are based on management’s plans and assumptions, which are inherently susceptible to uncertainty and changes in circumstances. Also included in this section is a discussion of legal proceedings and contingencies. | |
Certain amounts in our MD&A may not add due to rounding. All percentages have been calculated using unrounded amounts.
| | The following table provides the components of the condensed consolidated statements of income: | | | | Three Months Ended | | Six Months Ended | | Three Months Ended | | Six Months Ended |
| (MILLIONS OF DOLLARS, EXCEPT PER COMMON SHARE DATA) | | July 3,
2016 |
| | June 28,
2015 |
| | % Change |
| | July 3,
2016 |
| | June 28,
2015 |
| | % Change |
| | July 2,
2017 |
| | July 3,
2016 |
| | % Change |
| | July 2,
2017 |
| | July 3,
2016 |
| | % Change |
|
| Revenues | | $ | 13,147 |
| | $ | 11,853 |
| | 11 |
| | $ | 26,152 |
| | $ | 22,717 |
| | 15 |
| | $ | 12,896 |
| | $ | 13,147 |
| | (2 | ) | | $ | 25,675 |
| | $ | 26,152 |
| | (2 | ) |
| | | | | | | | | | | | | | | | | | | | | | | | | |
| Cost of sales | | 3,174 |
| | 2,180 |
| | 46 |
| | 6,026 |
| | 4,018 |
| | 50 |
| | 2,663 |
| | 3,174 |
| | (16 | ) | | 5,134 |
| | 6,026 |
| | (15 | ) |
| % of revenues | | 24.1 | % | | 18.4 | % | | |
| | 23.0 | % | | 17.7 | % | | |
| | 20.7 | % | | 24.1 | % | | |
| | 20.0 | % | | 23.0 | % | | |
|
| | | | | | | | | | | | | | | | | | | | | | | | | |
| Selling, informational and administrative expenses | | 3,471 |
| | 3,386 |
| | 2 |
| | 6,856 |
| | 6,491 |
| | 6 |
| | 3,425 |
| | 3,471 |
| | (1 | ) | | 6,733 |
| | 6,856 |
| | (2 | ) |
| % of revenues | | 26.4 | % | | 28.6 | % | | |
| | 26.2 | % | | 28.6 | % | | |
| | 26.6 | % | | 26.4 | % | | |
| | 26.2 | % | | 26.2 | % | | |
|
| | | | | | | | | | | | | | | | | | | | | | | | | |
| Research and development expenses | | 1,748 |
| | 1,734 |
| | 1 |
| | 3,478 |
| | 3,620 |
| | (4 | ) | | 1,780 |
| | 1,748 |
| | 2 |
| | 3,487 |
| | 3,478 |
| | — |
|
| % of revenues | | 13.3 | % | | 14.6 | % | | |
| | 13.3 | % | | 15.9 | % | | |
| | 13.8 | % | | 13.3 | % | | |
| | 13.6 | % | | 13.3 | % | | |
|
| | | | | | | | | | | | | | | | | | | | | | | | | |
| Amortization of intangible assets | | 961 |
| | 872 |
| | 10 |
| | 1,966 |
| | 1,811 |
| | 9 |
| | 1,208 |
| | 961 |
| | 26 |
| | 2,394 |
| | 1,966 |
| | 22 |
|
| % of revenues | | 7.3 | % | | 7.4 | % | | |
| | 7.5 | % | | 8.0 | % | | |
| | 9.4 | % | | 7.3 | % | | |
| | 9.3 | % | | 7.5 | % | | |
|
| | | | | | | | | | | | | | | | | | | | | | | | | |
| Restructuring charges and certain acquisition-related costs | | 316 |
| | 86 |
| | * |
| | 457 |
| | 146 |
| | * |
| | 70 |
| | 316 |
| | (78 | ) | | 228 |
| | 457 |
| | (50 | ) |
| % of revenues | | 2.4 | % | | 0.7 | % | | |
| | 1.7 | % | | 0.6 | % | | |
| | 0.5 | % | | 2.4 | % | | |
| | 0.9 | % | | 1.7 | % | | |
|
| | | | | | | | | | | | | | | | | | | | | | | | | |
| Other (income)/deductions––net | | 1,068 |
| | 55 |
| | * |
| | 1,398 |
| | 9 |
| | * |
| | (66 | ) | | 1,068 |
| | * |
| | (68 | ) | | 1,398 |
| | * |
|
| Income from continuing operations before provision for taxes on income | | 2,410 |
| | 3,539 |
| | (32 | ) | | 5,971 |
| | 6,621 |
| | (10 | ) | | 3,815 |
| | 2,410 |
| | 58 |
| | 7,767 |
| | 5,971 |
| | 30 |
|
| % of revenues | | 18.3 | % | | 29.9 | % | | |
| | 22.8 | % | | 29.1 | % | | |
| | 29.6 | % | | 18.3 | % | | |
| | 30.2 | % | | 22.8 | % | | |
|
| | | | | | | | | | | | | | | | | | | | | | | | | |
| Provision for taxes on income | | 375 |
| | 905 |
| | (59 | ) | | 910 |
| | 1,610 |
| | (43 | ) | | 739 |
| | 347 |
| | * |
| | 1,560 |
| | 861 |
| | 81 |
|
| Effective tax rate | | 15.6 | % | | 25.6 | % | | |
| | 15.2 | % | | 24.3 | % | | |
| | 19.4 | % | | 14.4 | % | | |
| | 20.1 | % | | 14.4 | % | | |
|
| | | | | | | | | | | | | | | | | | | | | | | | | |
| Income from continuing operations | | 2,035 |
| | 2,635 |
| | (23 | ) | | 5,060 |
| | 5,011 |
| | 1 |
| | 3,077 |
| | 2,062 |
| | 49 |
| | 6,207 |
| | 5,110 |
| | 21 |
|
| % of revenues | | 15.5 | % | | 22.2 | % | | |
| | 19.4 | % | | 22.1 | % | | |
| | 23.9 | % | | 15.7 | % | | |
| | 24.2 | % | | 19.5 | % | | |
|
| | | | | | | | | | | | | | | | | | | | | | | | | |
| Discontinued operations––net of tax | | 1 |
| | 1 |
| | (14 | ) | | 1 |
| | 6 |
| | (89 | ) | | 2 |
| | 1 |
| | * |
| | 1 |
| | 1 |
| | * |
|
| | | | | | | | | | | | | | | | | | | | | | | | | |
| Net income before allocation to noncontrolling interests | | 2,035 |
| | 2,635 |
| | (23 | ) | | 5,061 |
| | 5,017 |
| | 1 |
| | 3,078 |
| | 2,063 |
| | 49 |
| | 6,208 |
| | 5,111 |
| | 21 |
|
| % of revenues | | 15.5 | % | | 22.2 | % | | |
| | 19.4 | % | | 22.1 | % | | |
| | 23.9 | % | | 15.7 | % | | |
| | 24.2 | % | | 19.5 | % | | |
|
| | | | | | | | | | | | | | | | | | | | | | | | | |
| Less: Net income attributable to noncontrolling interests | | 16 |
| | 9 |
| | 82 |
| | 25 |
| | 14 |
| | 77 |
| | 5 |
| | 16 |
| | (66 | ) | | 14 |
| | 25 |
| | (45 | ) |
| Net income attributable to Pfizer Inc. | | $ | 2,019 |
| | $ | 2,626 |
| | (23 | ) | | $ | 5,036 |
| | $ | 5,002 |
| | 1 |
| | $ | 3,073 |
| | $ | 2,047 |
| | 50 |
| | $ | 6,194 |
| | $ | 5,085 |
| | 22 |
|
| % of revenues | | 15.4 | % | | 22.2 | % | | |
| | 19.3 | % | | 22.0 | % | | |
| | 23.8 | % | | 15.6 | % | | |
| | 24.1 | % | | 19.4 | % | | |
|
| | | | | | | | | | | | | | | | | | | | | | | | | |
Earnings per common share––basic: | | |
| | |
| | |
| | |
| | |
| | |
| | |
| | |
| | |
| | |
| | |
| | |
|
| Income from continuing operations attributable to Pfizer Inc. common shareholders | | $ | 0.33 |
| | $ | 0.43 |
| | (23 | ) | | $ | 0.82 |
| | $ | 0.81 |
| | 1 |
| | $ | 0.52 |
| | $ | 0.34 |
| | 53 |
| | $ | 1.04 |
| | $ | 0.83 |
| | 24 |
|
| Discontinued operations––net of tax | | — |
| | — |
| | — |
| | — |
| | — |
| | — |
| |
| Net income attributable to Pfizer Inc. common shareholders | | $ | 0.33 |
| | $ | 0.43 |
| | (23 | ) | | $ | 0.82 |
| | $ | 0.81 |
| | 1 |
| | $ | 0.52 |
| | $ | 0.34 |
| | 53 |
| | $ | 1.04 |
| | $ | 0.83 |
| | 24 |
|
| | | | | | | | | | | | | | | | | | | | | | | | | |
Earnings per common share––diluted: | | | | | | |
| | |
| | |
| | |
| | | | | | |
| | |
| | |
| | |
|
| Income from continuing operations attributable to Pfizer Inc. common shareholders | | $ | 0.33 |
| | $ | 0.42 |
| | (21 | ) | | $ | 0.82 |
| | $ | 0.80 |
| | 3 |
| | $ | 0.51 |
| | $ | 0.33 |
| | 53 |
| | $ | 1.02 |
| | $ | 0.82 |
| | 24 |
|
| Discontinued operations––net of tax | | — |
| | — |
| | — |
| | — |
| | — |
| | — |
| |
| Net income attributable to Pfizer Inc. common shareholders | | $ | 0.33 |
| | $ | 0.42 |
| | (21 | ) | | $ | 0.82 |
| | $ | 0.80 |
| | 3 |
| | $ | 0.51 |
| | $ | 0.33 |
| | 53 |
| | $ | 1.02 |
| | $ | 0.82 |
| | 24 |
|
| | | | | | | | | | | | | | | | | | | | | | | | | |
| Cash dividends paid per common share | | $ | 0.30 |
| | $ | 0.28 |
| | 7 |
| | $ | 0.60 |
| | $ | 0.56 |
| | 7 |
| | $ | 0.32 |
| | $ | 0.30 |
| | 7 |
| | $ | 0.64 |
| | $ | 0.60 |
| | 7 |
|
* Calculation not meaningful.
OVERVIEW OF OUR PERFORMANCE, OPERATING ENVIRONMENT, STRATEGY AND OUTLOOK
Our Business
We apply science and our global resources to bring therapies to people that extend and significantly improve their lives through the discovery, development and manufacture of healthcare products. Our global portfolio includes medicines vaccines and medical devices,vaccines, as well as many of the world’s best-known consumer healthcare products. We work across developed and emerging markets to advance wellness, prevention, treatments and cures that challenge the most feared diseases of our time. We collaborate with healthcare providers, governments and local communities to support and expand access to reliable, affordable healthcare around the world. Our revenues are derived from the sale of our products and, to a much lesser extent, from alliance agreements, under which we co-promote products discovered or developed by other companies or us (Alliance revenues).
We manage our commercial operations through two distinct business segments: Pfizer Innovative Health (IH) and Pfizer Essential Health (EH). Each operating segment has responsibility for its commercial activities and for certain IPR&D projects for new investigational products and additional indications for in-line products that generally have achieved proof-of-concept. For additional information, see the discussion in the “Our Strategy––Commercial Operations” section of this MD&A and see Notes to Condensed Consolidated Financial Statements––Note 13A. Segment, Geographic and Other Revenue Information: Segment Information and the “Our Strategy”Strategy––Commercial Operations” section of this MD&A below.
The majority of our revenues come from the manufacture and sale of biopharmaceutical products. As explained more fully in our 20152016 Form 10-K, the biopharmaceutical industry is highly competitive and highly regulated. As a result, we face a number of industry-specific factors and challenges, which can significantly impact our results. These factors include, among others: the loss or expiration of intellectual property rights and the expiration of co-promotion and licensing rights, the ability to replenish innovative biopharmaceutical products, healthcare legislation, pipeline productivity, the regulatory environment, pricing and access pressures and competition. We also face challenges as a result of the global economic environment. For additional information about these factors and challenges, see the “Our Operating Environment” and “The Global Economic Environment” sections of this MD&A and of our 20152016 Financial Report and Part I, Item 1A, “Risk Factors” of our 20152016 Form 10-K.
The financial information included in our condensed consolidated financial statements for our subsidiaries operating outside the U.S. is as of and for the three and six months ended May 29, 201628, 2017 and May 24, 2015.29, 2016. The financial information included in our condensed consolidated financial statements for U.S. subsidiaries is as of and for the three and six months ended July 2, 2017 and July 3, 2016 and June 28, 2015..
|
| | |
| References to developed and emerging markets in this MD&A include: |
| Developed markets | | U.S., Western Europe, Japan, Canada, Australia, South Korea, Scandinavian countries, Finland and New Zealand |
| | |
| Emerging markets (includes, but is not limited to) | | Asia (excluding Japan and South Korea), Latin America, Africa, Eastern Europe, Central Europe, the Middle East and Turkey |
References to operational variances in this MD&A pertain to period-over-period growth rates that exclude the impact of foreign exchange as well as the negative currency impact related to Venezuela.exchange. The operational variances are determined by multiplying or dividing, as appropriate, our current yearperiod U.S. dollar results by the current yearperiod average foreign exchange rates and then multiplying or dividing, as appropriate, those amounts by the prior-year period average foreign exchange rates. WeAlthough exchange rate changes are part of our business, they are not within our control. Exchange rate changes, however, can mask positive or negative trends in the business; therefore, we believe presenting these operational variances provides useful information in evaluating the results of our business.
Our significant business because exchange rate changes,development activities include:
| |
| • | On February 3, 2017, we completed the sale of Pfizer’s global infusion therapy net assets, HIS, to ICU Medical for up to approximately $900 million, composed of cash and contingent cash consideration, ICU Medical common stock and seller financing.At closing, we received 3.2 million newly issued shares of ICU Medical common stock, which we valued at approximately $428 million, a promissory note in the amount of $75 million and net cash of approximately $200 million before customary adjustments for net working capital. In addition, we are entitled to receive a contingent amount of up to an additional $225 million in cash based on ICU Medical’s achievement of certain cumulative performance targets for the combined company through December 31, 2019. The operating results of HIS are included in the condensed consolidated statement of income and EH’s operating results through February 2, 2017 and, therefore, our financial results, and EH’s operating results, for the second quarter of 2017 do not reflect any contribution from HIS global operations, while our financial results, and EH’s operating results, for the second quarter of 2016 reflect three months of HIS global operations. Our financial results, and EH’s operating results, for the first six months of 2017 reflect approximately one month of HIS |
domestic operations and approximately two months of HIS international operations, while partour financial results, and EH’s operating results, for the first six months of our ongoing business, can mask positive or negative trends2016 reflect six months of HIS global operations. Assets and liabilities associated with HIS are presented as held for sale in the condensed consolidated balance sheet as of December 31, 2016. The HIS assets held for sale are reported in Assets held for sale and HIS liabilities held for sale are reported in Other current liabilities.
On December 22, 2016, which falls in the first fiscal quarter of 2017 for our international operations, we acquired the development and commercialization rights to AstraZeneca’s small molecule anti-infectives business, primarily outside the U.S., including the commercialization and are not within our control.
On June 24, 2016 (the acquisition date)development rights to the newly approved EU drug Zavicefta™ (ceftazidime-avibactam), we completed our acquisition of Anacor for $99.25 per share.the marketed agents Merrem™/Meronem™ (meropenem) and Zinforo™ (ceftaroline fosamil), and the clinical development assets ATM-AVI and CXL (ceftaroline fosamil-AVI). The total fair value of the consideration transferred for Anacorthis business was approximately $4.9 billion$555 million in cash ($4.5 billion, netplus contingent consideration of cash acquired), plus $698 million debt assumed.$490 million. Commencing from the acquisition date, our financial statements reflect the assets, liabilities and cash flows of Anacor. The operating results for Anacor for five days from June 24, 2016 to July 3, 2016 were immaterial.See Notes to Condensed Consolidated Financial Statements––Note 2A. Acquisitions, Research and Development and Collaborative Arrangements, Equity-Method Investments and Cost-Method Investment: Acquisitions for additional information.
On April 6, 2016, we announced that the merger agreement between Pfizer and Allergan entered into on November 22, 2015 was terminated by mutual agreement of the companies. The decision was driven by the actions announced by the U.S. Department of Treasury on April 4, 2016, which the companies concluded qualified as an “Adverse Tax Law Change” under the merger agreement. In connection with the termination of the merger agreement, on April 8, 2016 (which falls into Pfizer’s second fiscal quarter), Pfizer paid Allergan $150 million (pre-tax) for reimbursement of Allergan’s expenses associated with the terminated transaction (see the Notes to Condensed Consolidated Financial Statements––Note 4. Other (Income)/Deductions––Net). Pfizer and Allergan also released each other from any and all claims in connection with the merger agreement.
On September 3, 2015, we completed our acquisition of Hospira and, commencing from the acquisition date, our financial statements reflect the assets, liabilities, operating results and cash flows of Hospira. As a result, legacy Hospira operations are reflectedthis business, and, in accordance with our results of operations,international reporting period, our condensed consolidated financial statements, EH’s operating results, and cash flows for the second quarter and first six months of 2017 reflect approximately three months and five months, respectively, of the small molecule anti-infectives business acquired from AstraZeneca.
| |
| • | On September 28, 2016, we acquired Medivation for $81.50 per share. The total fair value of consideration transferred for Medivation was approximately $14.3 billion in cash ($13.9 billion, net of cash acquired). Of this consideration, approximately $365 million was not paid as of December 31, 2016, and was recorded in Other current liabilities. Substantially all of the remaining consideration was paid as of July 2, 2017. Commencing from the acquisition date, our financial statements reflect the assets, liabilities, operating results and cash flows of Medivation. Therefore, Medivation operations are reflected in our results of operations, IH’s operating results, and cash flows for the second quarter and first six months of 2017, but not for the second quarter and first six months of 2016. |
| |
| • | On June 24, 2016, we acquired Anacor for $99.25 per share. The total fair value of consideration transferred for Anacor was approximately $4.9 billion in cash ($4.5 billion, net of cash acquired), plus $698 million debt assumed. Commencing from the acquisition date, our financial statements reflect the assets, liabilities, operating results and cash flows of Anacor. Therefore, Anacor operations are reflected in our results of operations, IH’s operating results, and cash flows for the second quarter and first six months of 2017, but for only five days in the second quarter and first six months of 2016. |
For additional information, see Notes to Condensed Consolidated Financial Statements––Note 2. Acquisitions, Sale of Hospira Infusion Systems Net Assets, Collaborative Arrangement and Equity-Method Investments and the “Our Strategy” and “Our Business Development Initiatives” sections of this MD&A below.
Our 2017 Performance
Revenues
Revenues in the second quarter of 2017 decreased 2% compared to the same period in 2016, which reflects an operational decrease of $48 million and an unfavorable impact of foreign exchange of 2%. Revenues in the first six months of 2017 decreased 2% compared to the same period in 2016, which reflects an operational decrease of $159 million and an unfavorable impact of foreign exchange of 1%.
The following provides an analysis of the decreases in revenues for the second quarter and first six months of 2015. Legacy Hospira assets and liabilities are reflected in our balance sheets as of July 3, 2016 and December 31, 2015. See the “Our Business Development Initiatives” and the “Costs and Expenses––Restructuring Charges and Other Costs Associated with Acquisitions and Cost-Reduction/Productivity Initiatives”
sections of thisMD&A and Notes to Condensed Consolidated Financial Statements––Note 2A. Acquisitions, Research and Development and Collaborative Arrangements, Equity-Method Investments and Cost-Method Investment2017: Acquisitions for additional information.
Our 2016 Performance
Revenues––Second Quarter 2016
Revenues in the second quarter of 2016 were $13.1 billion, an increase of 11% compared to the same period in 2015. This reflects an operational increase of $1.6 billion, or 13%, partially offset by the unfavorable impact of foreign exchange of $302 million, or 3%.
Revenues––First Six Months 2016
Revenues in the first six months of 2016 were $26.2 billion, an increase of 15% compared to the same period in 2015. This reflects an operational increase of $4.5 billion, or 20%, partially offset by the unfavorable impact of foreign exchange of $1.0 billion, or 5%.
Compared with the first six months of 2015, revenues in the first six months of 2016 were favorably impacted by approximately $800 million as a result of the first six months of 2016 having four additional selling days in the U.S. and four additional selling days in international markets. This imbalance in selling days will be offset in the fourth quarter of 2016 resulting in essentially the same number of selling days in 2016 as 2015.
|
| | | | | | | | |
| The following provides an analysis of the second quarter and the first six months of 2016 operational revenue growth for Pfizer standalone revenues (excluding Hospira): |
| | | Three Months Ended | | Six Months Ended |
| (BILLIONS OF DOLLARS) | | July 3, 2016 | | July 3, 2016 |
| Operational revenues––Pfizer-standalone increase: | | | | |
| Operational consolidated revenues increase | | $ | 1.6 |
| | $ | 4.5 |
|
| Less: Revenues from legacy Hospira | | (1.1 | ) | | (2.3 | ) |
| Operational revenues––Pfizer-standalone increase | | $ | 0.5 |
| | $ | 2.1 |
|
| | | | | |
| Components of operational revenues––Pfizer-standalone increase: | | | | |
| Operational revenue growth from certain key products––net | | $ | 0.9 |
| | $ | 2.9 |
|
| Operational revenue decrease due to product losses of exclusivity and the co-promotion expiration | | (0.4 | ) | | (0.8 | ) |
| Operational revenues––Pfizer-standalone increase | | $ | 0.5 |
| | $ | 2.1 |
|
|
| | | | | | | | |
| (MILLIONS OF DOLLARS) | | Three Months |
| | Six Months |
|
| | | | | |
Revenues, for the three months and six months ended July 3, 2016 | | $ | 13,147 |
| | $ | 26,152 |
|
| | | | | |
| Acquisition-related operational growth | | | | |
| Xtandi alliance revenues in the U.S. (September 2016 acquisition of Medivation) | | 141 |
| | 272 |
|
| | |
|
| | |
Disposition-related operational impact - February 2017 sale of HIS(a) | | (296 | ) | | (503 | ) |
| | |
|
| | |
| Other operational growth/(decline) | | | | |
Continued growth from key brands(b) and growth from Biosimilars | | 778 |
| | 1,439 |
|
| Declines from Peri-LOE Products, Enbrel (driven by declines in most developed Europe markets), the Legacy Established Products portfolio as well as Prevnar 13/Prevenar 13 (driven by declines in the U.S.) and for the first six months of 2017, also includes declines in Viagra (IH) (primarily in the U.S.) | | (621 | ) | | (1,368 | ) |
| Other operational factors, net | | (50 | ) | | 1 |
|
| Operational decline, net | | (48 | ) | | (159 | ) |
| | | | | |
| Operational revenues | | 13,099 |
| | 25,993 |
|
| Unfavorable impact of foreign exchange | | (202 | ) | | (318 | ) |
Revenues, for the three months and six months ended July 2, 2017 | | $ | 12,896 |
| | $ | 25,675 |
|
| |
(a) | In the second quarter of 2017, financial results do not reflect any contribution from HIS global operations, compared to the inclusion of three months of HIS global operations in the same period in 2016. In the first six months of 2017, financial results include approximately one month of HIS domestic operations and approximately two months of HIS international operations in the first six months of 2017, compared to six months of HIS global operations in the same period in 2016. |
| |
(b) | Key brands include Ibrance and Eliquis (globally) as well as Lyrica (IH) and Xeljanz (both primarily in the U.S.). |
See the “Analysis of the Condensed Consolidated Statements of Income––Revenues and Product Developments––Revenues––Overview” section below for more information, including a discussion of key drivers of our revenue performance.
Income from Continuing Operations Before Provision for Taxes on Income––Second Quarter 2016
Income from continuing operations before provision for taxes on income for the second quarter of 2016 was $2.4 billion, compared to $3.5 billion in the second quarter of 2015, primarily reflecting, among other items, in addition to the operational and foreign exchange impacts for Revenues described above:
higher cost of sales (up $994 million) (see also the “Costs and Expenses––Cost of Sales” section of this MD&A);
higher asset impairments (up $792 million) (see also the Notes to Condensed Consolidated Financial Statements––Note 4. Other (Income)/Deductions––Net);
higher restructuring charges and certain acquisition-related costs (up $230 million) (see also the Notes to Condensed Consolidated Financial Statements––Note 3. Restructuring Charges and Other Costs Associated with Acquisitions and Cost-Reduction/Productivity Initiatives);
higher charges for legal matters (up $161 million) (see also the Notes to Condensed Consolidated Financial Statements––Note 4. Other (Income)/Deductions––Net);
higher amortization of intangible assets (up $89 million) (see also the “Costs and Expenses––Amortization of Intangible Assets” section of this MD&A);
higher selling, informational and administrative expenses (up $84 million) (see also the “Costs and Expenses––Selling, Informational and Administrative Expenses (SI&A) Expenses” section of this MD&A); and
lower Other, net (down $80 million) (see also the Notes to Condensed Consolidated Financial Statements––Note 4. Other (Income)/Deductions––Net).
Income from Continuing Operations Before Provision for Taxes on Income––––First Six Months 2016Income
The following provides an analysis of the increases in Income from continuing operations before provision for taxes on income for the second quarter and first six monthsof 2016 was $6.0 billion, compared to $6.6 billion in the first six monthsof 2015, primarily reflecting, among other items, in addition to the operational and foreign exchange impacts for Revenues described above:
2017:higher cost of sales (up $2.0 billion) (see also the “Costs and Expenses––Cost of Sales” section of this MD&A);
higher asset impairments (up $922 million) (see also the Notes to Condensed Consolidated Financial Statements––Note 4. Other (Income)/Deductions––Net);
|
| | | | | | | | |
| (MILLIONS OF DOLLARS) | | Three Months |
| | Six Months |
|
| | | | | |
Income from continuing operations before provision for taxes on income, for the three months and six months ended July 3, 2016 | | $ | 2,410 |
| | $ | 5,971 |
|
| | | | | |
| Unfavorable change in revenues | | (251 | ) | | (477 | ) |
| | | | | |
| Favorable changes: | | |
| |
Lower certain asset impairments(a) | | 816 |
|
| 935 |
|
Lower Cost of sales(b) | | 511 |
|
| 892 |
|
Lower certain legal matters, net(a) | | 257 |
|
| 523 |
|
Lower Restructuring charges and certain acquisition-related costs(c) | | 246 |
| | 230 |
|
Higher net gains on asset disposals(a) | | 32 |
|
| 155 |
|
Higher dividend income(a) | | 106 |
| | 150 |
|
Lower Selling, information and administrative expenses(d) | | 46 |
| | 122 |
|
Lower business and legal entity alignment costs(a) | | 43 |
| | 73 |
|
| | | | | |
| Unfavorable changes: | | |
| |
Higher Amortization of intangible assets(e) | | (248 | ) |
| (427 | ) |
Lower royalty-related income(a) | | (169 | ) |
| (271 | ) |
| | | | | |
| All other items, net | | 17 |
|
| (107 | ) |
Income from continuing operations before provision for taxes on income, for the three months and six months ended July 2, 2017 | | $ | 3,815 |
|
| $ | 7,767 |
|
| |
(a) | See the Notes to Condensed Consolidated Financial Statements––Note 4. Other (Income)/Deductions––Net. |
| |
(b) | See the “Costs and Expenses––Cost of Sales” section of this MD&A. |
| |
(c) | See the “Costs and Expenses––Restructuring Charges and Certain Acquisition-Related Costs and Cost-Reduction/Productivity Initiatives” section of this MD&A. |
| |
(d) | See the “Costs and Expenses––Selling, Informational and Administrative Expenses ” section of this MD&A. |
| |
(e) | See the “Costs and Expenses––Amortization of Intangible Assets” section of this MD&A. |
higher charges for legal matters (up $435 million) (see also the Notes to Condensed Consolidated Financial Statements––Note 4. Other (Income)/Deductions––Net);
higher selling, informational and administrative expenses (up $365 million) (see also the “Costs and Expenses––Selling, Informational and Administrative Expenses (SI&A) Expenses” section of this MD&A);
higher restructuring charges and certain acquisition-related costs (up $311 million) (see also the Notes to Condensed Consolidated Financial Statements––Note 3. Restructuring Charges and Other Costs Associated with Acquisitions and Cost-Reduction/Productivity Initiatives);
higher amortization of intangible assets (up $155 million) (see also the “Costs and Expenses––Amortization of Intangible Assets” section of this MD&A); and
lower net gains on asset disposals (down $155 million) (see also the Notes to Condensed Consolidated Financial Statements––Note 4. Other (Income)/Deductions––Net),
partially offset by:
lower research and development expenses (down $141 million) (see also the “Costs and Expenses––Research and Development (R&D) Expenses” section of this MD&A);
higher Other, net (up $76 million) (see also the Notes to Condensed Consolidated Financial Statements––Note 4. Other (Income)/Deductions––Net); and
lower charges for business and legal entity alignment costs (down $54 million) (see also the Notes to Condensed Consolidated Financial Statements––Note 4. Other (Income)/Deductions––Net).
For information on our tax provision and effective tax rate see the “Provision for Taxes on Income” section of this MD&A and Notes to Condensed Consolidated Financial Statements––Note 5. Tax Matters.
Our Operating Environment
Industry-Specific Challenges
Intellectual Property Rights and Collaboration/Licensing Rights
The loss, expiration or expirationinvalidation of intellectual property rights, patent litigation settlements with generic manufacturers and the expiration of co-promotion and licensing rights can have a significant adverse effect on our revenues. We have lost exclusivity for a number of our products in certain markets and we have lost collaboration rights with respect to a number of our alliance products in certain markets, and we expect certain products to face significantly increased generic competition over the next few years. Also, if one of our patents is found to be invalid by judicial, court or administrative proceedings, such as inter partesreview, post-grant review, re-examination or opposition proceedings, before the U.S. Patent and Trademark Office, the European Patent Office, or other foreign counterparts, generic or competitive products could be introduced into the market resulting in the erosion of sales of our existing products. For example, several of the patents in our pneumococcal vaccine portfolio have been challenged in inter partes review and post-grant review proceedings in the United States. The invalidation of these patents could potentially allow a competitor pneumococcal vaccine into the marketplace.
As a result of a patent litigation settlement with several generic manufacturers, generic versions of Pristiq launched in the U.S. in March 2017. See the “Intellectual Property Rights and Collaboration/Licensing Rights” section of our 20152016 Financial Report for additional information about (i) recent losses and expected losses of product exclusivity in the U.S., Europe or Japan impacting product revenues and (ii) recent losses and expected losses of collaboration rights impacting alliance revenues.
We expect to lose exclusivity for various other products in various markets over the next few years, including, among others, Pristiq in the U.S. in March 2017 and Viagra in the U.S. in late 2017. December 2017 and the expiration of the basic product patent for Lyrica in the U.S. in December 2018.
For additional information, see the “Patents and Other Intellectual Property Rights” section in Part I, Item 1, “Business” of our 20152016 Form 10-K.
We will continue to aggressively defend our patent rights whenever we deem appropriate. For more detailed information about our significant products, see the discussion in the “Revenues––Major Products” and “Revenues––Selected Product Descriptions”Discussion” sections of this MD&A. For a discussion of certain recent developments with respect to patent litigation, see Notes to Condensed Consolidated Financial Statements––Note 12A1. Commitments and Contingencies: Legal Proceedings––Patent Litigation.
Regulatory Environment/Pricing and Access––U.S. Healthcare Legislation
In March 2010, the ACA was enacted in the U.S. For additional information, see the “Government Regulation and Price Constraints” section in Part I, Item 1, “Business” of our 20152016 Form 10-K.
We recorded the following amounts as a result of the U.S. Healthcare Legislation:
| |
| • | $81 million in the second quarter of 2017 and $63 million in the second quarter of 2016, and $139 million in the first six months of 2017 and $159 million in the first six months of 2016, recorded as a reduction to Revenues related to the Medicare “coverage gap” discount provision; and |
| |
| • | $95 million in the second quarter of 2017 and $92 million in the second quarter of 2016, and $132 million in the first six months of 2017 and $124 million in the first six months of 2016, recorded in Selling, informational and administrative expenses, related to the fee payable to the federal government (which is not deductible for U.S. income tax purposes) based on our prior-calendar-year share relative to other companies of branded prescription drug sales to specified government programs. |
$63 million in the second quarter of 2016 and $68 million in the second quarter of 2015, and $159 million in the first six months of 2016 and $156 million in the first six months of 2015, recorded as a reduction to Revenues related to the Medicare “coverage gap” discount provision; and
$92 million in the second quarter of 2016 and $56 million in the second quarter of 2015, and $124 million in the first six months of 2016 and $89 million in the first six month of 2015, recorded in Selling, informational and administrative expenses, related to the fee payable to the federal government (which is not deductible for U.S. income tax purposes) based on our prior-calendar-year share relative to other companies of branded prescription drug sales to specified government programs.
Regulatory Environment/Pricing and Access––Government and Other Payer Group Pressures
Governments, MCOs and other payer groups continue to seek increasing discounts on our products through a variety of means, such as leveraging their purchasing power, implementing price controls, and demanding price cuts (directly or by rebate actions). In Europe, Japan, China, Canada, South Korea and some other international markets, governments provide healthcare at low direct cost to patients and regulate pharmaceutical prices or patient reimbursement levels to control costs for the government-sponsored healthcare system.system, particularly under recent global economic pressures. In the U.S., a primary government activity with implications for pharmaceutical pricing is deficit reduction. Any significant spending reductions affecting Medicare, Medicaid or other publicly funded or subsidized health programs that may be implemented, and/or any significant additional taxes or fees that may be imposed on us, as part of any broad deficit-reduction effort could have an adverse impact on our results of operations. Significant Medicare reductions could also result if Congress proceeds with certain proposals to convert the Medicare fee-for-service program into a premium support program, or if it chooses to implement the recommendations made annually by the Medicare Payment Advisory Commission, which are primarily intended to extend the fiscal solvency of the Medicare program. Similar reductions to Medicare spending could result if the threshold for action by the Independent Payment Advisory Board (IPAB) is reached, and the Secretary of the Department of Health and Human Services (to whom responsibility for developing savings proposals specified in the ACA is likely to default in the absence of a seated IPAB) is required to identify savings. Current projections by the Centers for Medicare and Medicaid Services Office of the Actuary indicate that the IPAB threshold will not be reached before 2021.
Consolidation among MCOs has increased the negotiating power of MCOs and other private insurers. Private third-party insurers, as well as governments, increasingly employ formularies to control costs by negotiating discounted prices in exchange for formulary inclusion. Failure to obtain or maintain timely or adequate pricing or formulary placement for our products or obtaining such pricing or placement at unfavorable pricing could adversely impact revenue.
Additionally, policy efforts designed specificallyby government officials or legislators to reduce patient out-of-pocket costsimplement measures to regulate prices or payment for medicinespharmaceutical products, including legislation on drug importation, could result in new mandatory rebatesadversely affect our business if implemented. There has recently been considerable public and discounts or othergovernment scrutiny of pharmaceutical pricing restrictions. The candidates forand proposals to address the 2016 U.S. presidential elections have introduced such policy proposals,perceived high cost of pharmaceuticals, and there are indications that there could be a November 2015 U.S. Department of Health and Human Services forum dedicated to drug pricing could lead to further proposals in the future.Presidential Executive Order that would focus on pharmaceuticals. We believe medicines are the most efficient and effective use of healthcare dollars based on the value they deliver to the overall healthcare system. We continue to work with stakeholders to ensure access to medicines within an efficient and affordable healthcare system.
The ACA, which expandedAdoption of other new legislation at the rolefederal or state level could further affect demand for, or pricing of, our products. In 2017, we face uncertainties due to federal legislative and administrative efforts to repeal, substantially modify or invalidate some or all of the U.S. government asprovisions of the ACA, though the likelihood of repeal of the ACA is now low given the recent failure of the Senate’s multiple attempts to repeal various combinations of ACA provisions. It is possible that the Presidential administration could withhold the cost-sharing subsidies paid to health insurance exchange plans serving low-income enrollees, although the
revenues generated for Pfizer by the health insurance exchanges under the ACA are minor. There is no assurance that any replacement for or modification or repeal of the ACA will not adversely affect our business and financial results, particularly if the legislation reduces incentives for employer-sponsored insurance coverage. There have also been recent state legislative efforts to address drug costs, which efforts have generally focused on increasing transparency about drug costs or limiting drug prices. Recent legislation enacted includes, for example, a 2017 Maryland law that prohibits pharmaceutical manufacturers from selling certain off-patent or generic drugs at prices that include “unconscionable” price increases. We cannot predict the success of current or future federal or state legislative efforts. We will continue to work with law makers and advocate for solutions that effectively improve patient health outcomes and lower costs to the healthcare payer, is accelerating changes in the U.S. healthcare marketplace, and thesystem.
The potential for additional pricing and access pressures in the commercial sector continues to be significant. Many of these developments may impact drug utilization, in particular branded drug utilization. Some employers, seeking to avoid the tax on high-cost health insurance in the ACA originally to be imposed in 2018 (now to be imposed in 2020, per the terms of the fiscal year 2016 omnibus appropriations legislation), are already scaling back healthcare benefits. Somebenefits and an increasing number are implementing high deductible benefit designs. This is a trend that is likely to continue, especially if proposals to limit the tax exclusion for employer sponsored health insurance ultimately become law. Private third-party payers, such as health plans, increasingly challenge pharmaceutical product pricing, which could result in lower prices, lower reimbursement rates and PBMsa reduction in demand for our products. Pricing pressures for our products may occur as a result of highly competitive insurance markets. Healthcare provider purchasers, directly or through group purchasing organizations, are seeking greater pricing predictability from pharmaceutical manufacturers in contractual negotiations. Other health plans and PBMs are increasing their focus on spending on specialty medicines byenhanced discounts or implementing co-insurance in place of a flat co-payment. Because co-insurance passes on a percentage of a drug’s cost to the patient, this shift has the potential to significantly increase patient out-of-pocket costs.
more rigorous bidding or purchasing review processes.
Overall, there is increasing pressure on U.S. providers to deliver healthcare at a lower cost and to ensure that those expenditures deliver demonstrated value in terms of health outcomes. Longer term, we are seeing a shift in focus away from fee-for-service payments towards outcomes-based payments and risk-sharing arrangements that reward providers for cost reductions. These new payment models can, at times, lead to lower prices for, and restricted access to, new medicines. At the same time, these models can also expand utilization by encouraging physicians to screen, diagnose and focus on outcomes.
Outside the U.S., governments, including the different EU Member States, may use a variety of cost-containment measures for our pharmaceutical products, including price cuts, mandatory rebates, value-based pricing, and international reference pricing (i.e., the practice of a country linking its regulated medicine prices to those of other countries). This international patchwork of price regulation and differing economic conditions and assessments of value across countries has led to different prices in different countries and some third-party trade in our products between countries.
In particular, international reference pricing adds to the regional impact of price cuts in individual countries and hinders patient access and innovation. Price variations, exacerbated by international reference pricing systems, also have resulted from exchange rate fluctuations. The downward pricing pressure resulting from this dynamic can be expected to continue as a result of reforms to international reference pricing policies and measures targeting pharmaceuticals in some European countries.
In addition, several important multilateral organizations, such as the United Nations (UN) and the Organization for Economic Cooperation and Development (OECD), are increasing policy pressures and scrutiny of international pharmaceutical pricing through issuing reports and policy recommendations (e.g., 2016 UN High Level Panel Report on Access to Medicines and 2017 OECD Report on New Health Technologies––Managing Access, Value and Sustainability). Government adoption of these recommendations may lead to additional pricing pressures.
In response to the evolving U.S. and global healthcare spending landscape, we are continuing to work with health authorities, health technology assessment and quality measurement bodies and major U.S. payers throughout the product-development process to better understand how these entities value our compounds and products. Further, we are seeking to develop stronger internal capabilities focused on demonstrating the value of the medicines that we discover or develop, register and manufacture, by recognizing patterns of usage of our medicines and competitor medicines along with patterns of healthcare costs.
For additional information, see the “Regulatory Environment––Pipeline Productivity” and “Competition” sections of our 20152016 Financial Report.
The Global Economic Environment
In addition to the industry-specific factors discussed above, we, like other businesses, are exposed to the economic cycle, which impacts our biopharmaceutical operations globally.
We believe thatGovernments, corporations, and insurance companies, which provide insurance benefits to patients, who are experiencinghave implemented increases in co-payscost-sharing and restrictions on access to medicines, as payers seekpotentially causing patients to control costs, sometimes switch to generic products, delay treatments, skip doses or use less effective treatments. We are exposedGovernment financing pressures can lead to negative pricing pressure in various markets around the world. The U.S. has highly competitive insurance markets, andwhere governments take an active role in setting prices, access criteria (e.g., through public or private health technology assessments), or other means of cost control. Examples include Europe, Japan, China, Canada, South Korea and a number of other international markets. The U.S. continues to maintain competitive insurance markets, have government-mandated reductions
but has also seen significant increases in pricespatient cost-sharing and access restrictions for certain biopharmaceutical products to control costs for the government-sponsored healthcare system, particularly under recent global economic pressures. Furthermore, somegrowing government agencies and third-party payers use health technology assessments in ways that, at times, lead to restricted access to and lower prices for new medicines.
Weinfluence as government programs continue to monitor developments regarding government and government agency receivables in several European markets, including Greece, where economic conditions remain challenging and uncertain. For further information about our Accounts Receivable, see the “Analysisgrow as a source of Financial Condition, Liquidity and Capital Resources” section of this MD&A.coverage.
| |
| • | We continue to monitor developments regarding government and government agency receivables in several European markets, including Greece, where economic conditions remain challenging and uncertain. For further information about our Accounts Receivable, see the “Analysis of Financial Condition, Liquidity and Capital Resources” section of this MD&A. |
Significant portions of our revenues and earnings, as well as our substantial international net assets, are exposed to changes in foreign exchange rates. We seek to manage our foreign exchange risk in part through operational means, including managing same-currency revenues in relation to same-currency costs and same-currency assets in relation to same-currency liabilities. Depending on market conditions, foreign exchange risk also is managed through the use of derivative financial instruments and foreign currency debt. As we operate in multiple foreign currencies, including the euro, the Japanese yen, the Chinese renminbi, the U.K. pound, the Canadian dollar and approximately 100 other currencies, changes in those currencies relative to the U.S. dollar will impact our revenues and expenses. If the U.S. dollar were to weaken against another currency, assuming all other variables remained constant, our revenues would increase, having a positive impact on earnings, and our overall expenses would increase, having a negative impact on earnings. Conversely, if the U.S. dollar were to strengthen against another currency, assuming all other variables remained constant, our revenues would decrease, having a negative impact on earnings, and our overall expenses would decrease, having a positive impact on earnings. Therefore, significant changes in foreign exchange rates, including those changes resulting from the volatility following the U.K. referendum in which voters approved the exit from the EU, can impact our results and our financial guidance.
The impact of possible currency devaluations in countries experiencing high inflation rates or significant exchange fluctuations, including Venezuela and more recently Egypt, can impact our results and financial guidance. For further information about our exposure to foreign currency risk, see the “Analysis of Financial Condition, Liquidity and Capital Resources” and the “Our Financial Guidance for 2016”2017” sections of this MD&A.
In June 2016, the U.K. electorate voted in a referendum to leave the EU. TheEU, which is commonly referred to as “Brexit”. In January 2017, the U.K. Prime Minister announced a 12-point plan of negotiating objectives and confirmed that the U.K. government haswill not seek continued membership in the EU single market. In March 2017, the U.K. government formally notified the European Council of theirits intention to leave the EU which wouldafter it triggered Article 50 of the Lisbon Treaty to begin athe two-year negotiation process establishing the terms of the exit and outlining the future relationship between the U.K. and the EU. This process is expected to be highly complex and if needed, may be bilaterally extended. Thethe end result of these negotiations may pose certain implications to our research, commercial and general business operations in the U.K. and the EU.
We generated approximately 2% of our worldwide revenues from the U.K. in the first six months of 2017. However, except for the foreign currency exchange impact from the weakening U.K. pound relative to the U.S. dollar to date, there are no other immediate-term impacts to our business as there has not yet been a formal change in the relationship between the U.K. and the EU. In addition, because of the significant uncertainties associated with the negotiation process, any potential long-term impacts are not currently determinable.
Despite the challenging financial markets, Pfizer maintains a strong financial position.position while operating in a complex global environment. Due to our significant operating cash flows, financial assets, access to capital markets and available lines of credit and revolving credit agreements, we continue to believe that we have, and will maintain, the ability to meet our liquidity needs for the foreseeable future. Our long-term debt is rated high quality by both S&P and Moody’s. As market conditions change, we continue to monitor our liquidity position. We have taken and will continue to take a conservative approach to our financial investments. Both short-term and long-term investments consist primarily of high-quality, highly liquid, well-diversified, available-for-sale debt securities. For further discussion of our financial condition and credit ratings, see the “Analysis of Financial Condition, Liquidity and Capital Resources” section of this MD&A.
These and other industry-wide factors that may affect our businesses should be considered along with information presented in the “Forward-Looking Information and Factors That May Affect Future Results” section of this MD&A and in Part I, Item 1A, “Risk Factors” of our 20152016 Form 10-K.
Our Strategy
We believe that our medicines provide significant value for both healthcare providers and patients, not only from the improved treatment of diseases but also from a reduction in other healthcare costs, such as emergency room or hospitalization costs, as well as improvements in health, wellness and productivity. We continue to actively engage in dialogues about the value of our productsmedicines and how we can best work with patients, physicians and payers to prevent and treat disease and improve outcomes. We continue to work within the current legal and pricing structures, as well as continue to review our pricing arrangements and contracting methods with payers, to maximize patient access to patients and minimize any adverse impact on our revenues. We remain
firmly committed to fulfilling our company’s purpose of innovating to bring therapies to patients that extend and significantly improve their lives. By doing so, we expect to create value for the patients we serve and for our shareholders.
Commercial Operations
We manage our commercial operations through two distinct business segments: Pfizer Innovative Health (IH) and Pfizer Essential Health (EH). Effective in the second quarter of 2016, our segments were reorganized to reflect that we now manage our innovative pharmaceutical and consumer healthcare operations as one business segment, Pfizer Innovative Health (previously these businesses were managed as two segments: the GIP segment and the VOC segment). We have revised prior-period information to reflect the reorganization. Also, in the second quarter of 2016, we changed the name of our Established Products business to Pfizer Essential Health. The IH and EH operating segments are each led by a single manager. Each operating segment has responsibility for its commercial activities and for certain IPR&D projects for new investigational products and additional indications for in-line products that generally have achieved proof-of-concept. Each business has a geographic footprint across developed and emerging markets. As IH leadership assesses how to most efficiently manage the IH segment operations, we will assess the impact, if any, that any such changes may have on our reporting units.
|
| | | | |
| Some additional information about our business segments follows: |
| IH Segment | | | EH Segment |
| ● | IH focuses on developing and commercializing novel, value-creating medicines and vaccines that significantly improve patients’ lives, as well as products for consumer healthcare. Key therapeutic areas include internal medicine, vaccines, oncology, inflammation/inflammation & immunology, cardiovascular/metabolic, neuroscience/pain, rare diseases and consumer healthcare and include leading brands, such as Prevnar/Prevenar 13, Xeljanz, Eliquis, Lyrica (U.S., Japan and certain other markets), Enbrel (outside the U.S. and Canada) and Viagra (U.S. and Canada), as well as several well-known, OTC consumer products.healthcare. | | ● | EH includes legacy brands that have lost or will soon lose market exclusivity in both developed and emerging markets, branded generics, generic sterile injectable products, biosimilars, select branded products including anti-infectives and, infusion systems.through February 2, 2017, HIS. EH also includes a new EH research and developmentan R&D organization, as well as our contract manufacturing business. |
| ● | We expect that the IH biopharmaceutical portfolio of innovative, largely patent-protected, in-line and newly launched products will be sustained by ongoing investments to develop promising assets and targeted business development in areas of focus to help ensure a pipeline of highly-differentiated product candidates in areas of unmet medical need. The assets managed by IH are science-driven, highly differentiated and generally require a high-level of engagement with healthcare providers and consumers. | | ● | EH is expected to generate strong consistent cash flow by providing patients around the world with access to effective, lower-cost, high-value treatments. EH leverages our biologic development, regulatory and manufacturing expertise to seek to advance its biosimilar development portfolio. Additionally, EH leverages capabilities in formulation development and manufacturing expertise to help advance its generic sterile injectables portfolio. EH may also engage in targeted business development to further enable its commercial strategies. |
| ● | IH will have continued focus on R&D productivity and pipeline strength while maximizing the value of our recently launched brands and in-line portfolio. Our acquisitions of Anacor and Medivation expanded our pipeline in the high priority therapeutic areas of inflammation and immunology and oncology. | | ● | For EH, we continue to invest in growth drivers and manage the portfolio to extract additional value while seeking opportunities for operating efficiencies. This strategy includes active management of our portfolio; maximizing growth of core product segments; acquisitions to strengthen core areas of our portfolio further, such as our recent acquisition of AstraZeneca’s small molecule anti-infectives business; and divestitures to increase focus on our core strengths. In line with this strategy, on February 3, 2017, we completed the sale of Pfizer’s global infusion therapy net assets, representing the infusion systems net assets that we acquired as part of the Hospira transaction, HIS, to ICU Medical. |
|
Leading brands include:
- Prevnar 13/Prevenar 13
- Xeljanz
- Eliquis
- Lyrica (U.S., Japan and certain other markets)
- Enbrel (outside the U.S. and Canada)
- Viagra (U.S. and Canada)
- Ibrance
- Xtandi
- Several OTC consumer healthcare products (e.g., Advil and
Centrum) | | |
Leading brands include:
- Lipitor
- Premarin family
- Norvasc
- Lyrica (Europe, Russia, Turkey, Israel and Central Asia
countries)
- Celebrex
- Inflectra/Remsima
- Several sterile injectable products |
We expect that the IH biopharmaceutical portfolio of innovative, largely patent-protected, in-line and newly launched products will be sustained by ongoing investments to develop promising assets and targeted business development in areas of focus to help ensure a pipeline of highly-differentiated product candidates in areas of unmet medical need. The assets managed by IH are science-driven, highly differentiated and generally require a high-level of engagement with healthcare providers and consumers.
EH is expected to generate strong consistent cash flow by providing patients around the world with access to effective, lower-cost, high-value treatments. EH leverages our biologic development, regulatory and manufacturing expertise to seek to advance its biosimilar development portfolio. Additionally, EH leverages capabilities in formulation development and manufacturing expertise to help advance its generic sterile injectables portfolio. In addition, EH may also engage in targeted business development to further enable its commercial strategies.
Effective as of the beginning of 2016, the following changes impact EH:
Our entire contract manufacturing business, Pfizer CentreOne (previously known as Pfizer CentreSource or PCS), is now part of EH. Pfizer CentreOne consists of (i) the revenues and expenses of legacy Pfizer's contract manufacturing and active pharmaceutical ingredient sales operation, including the revenues and expenses related to our manufacturing and supply agreements with Zoetis; and (ii) the revenues and expenses of legacy Hospira's One-2-One sterile injectables contract manufacturing operation, which has been included in EH since we acquired Hospira on September 3, 2015. Prior to 2016, PCS was managed outside our operating segments as part of PGS and reported as "Other Business Activities". We have reclassified prior period PCS operating results ($133 million of PCS revenues and $30 million of PCS earnings in the second quarter of 2015, and $244 million of PCS revenues and $52 million of PCS earnings in the first six months of 2015) to conform to the current period presentation as part of EH.
In connection with the formation of a new EH R&D organization, certain functions transferred from Pfizer’s WRD organization to the new EH R&D organization. The new R&D organization within EH expects to develop potential new sterile injectable drugs and therapeutic solutions, as well as biosimilars. We have reclassified approximately $67 million of costs in the second quarter of 2015 and $134 million of costs in the first six months of 2015 from WRD to EH to conform to the current period presentation as part of EH.
Effective as of the beginning of the second quarter of 2016, the following changes impact IH:
In connection with the formation of the GPD organization, a new unified center for late-stage development for our innovative products, which is generally responsible for the clinical development of assets that are in clinical trials for our WRD and Innovative portfolios, certain development-related functions transferred from IH to GPD. We have reclassified approximately $76 million of costs in the first quarter of 2016, approximately $73 million of costs in the second quarter of 2015 and approximately $147 million of costs in the first six months of 2015 from IH to GPD to conform to the current period presentation as part of GPD.
For additional information about our operating structure, see Notes to Condensed Consolidated Financial Statements––Note 13A. Segment, Geographic and Other Revenue Information: Segment Information.
For additional information about the 20162017 performance for each of our operating segments, see the “Analysis of Operating Segment Information” section of this MD&A.
Description of Research and Development Operations
Innovation is critical to the success of our company, and drug discovery and development is time-consuming, expensive and unpredictable. Our R&D priorities include delivering a pipeline of differentiated therapies and vaccines with the greatest medical and commercial promise, innovating new capabilities that can position Pfizer for long-term leadership and creating new models for biomedical collaboration that will expedite the pace of innovation and productivity. To that end, our research primarily focuses on:
Biosimilars;
Inflammation and Immunology;
Metabolic Disease and Cardiovascular Risks;
Neuroscience;
Oncology;
Rare Diseases; and
Vaccines.
We continue to strengthen our global R&D organization and pursue strategies intended to improve innovation and overall productivity in R&D to achieve a sustainable pipeline that will deliver value in the near term and over time. Our R&D priorities include deliveringspending is conducted through a pipelinenumber of differentiated therapies with the greatest scientific and commercial promise, innovating new capabilities that can position Pfizermatrix organizations:
Research Units within our WRD organization are generally responsible for long-term leadership and creating new modelsresearch assets for biomedical collaboration that will expedite the pace of innovation and productivity. To that end, our research primarily focuses on six high-priority areasIH business (assets that have not yet achieved proof-of-concept). Our Research Units are organized in a mixvariety of small moleculesways (by therapeutic area or combinations of therapeutic areas, by discipline, by location, etc.) to enhance flexibility, cohesiveness and focus. Because of our structure, we can rapidly redeploy resources within a Research Unit between various projects as necessary because the workforce shares similar skills, expertise and/or focus.
Our R&D organization within the EH business supports the large molecules––immunologybase of EH products and inflammation; cardiovascularis expected to develop potential new sterile injectable drugs and metabolic diseases; oncology; vaccines; neurosciencetherapeutic solutions, as well as biosimilars.
Our GPD organization is a unified center for late-stage development for our innovative products and pain;is generally responsible for the clinical development of assets that are in clinical trials for our WRD and rare diseases. AnotherInnovative portfolios. GPD is expected to enable more efficient and effective development and enhance our ability to accelerate and progress assets through our pipeline. GPD combines certain previously separate development-related functions from the IH business and the WRD organization to achieve a development capability that is expected to deliver high-quality, efficient, and well-executed clinical programs by enabling greater speed, greater cost efficiencies, and reduced complexity across our development portfolio. GPD also provides technical support and other services to Pfizer R&D projects.
Our science-based and other platform-services organizations, where a significant portion of our R&D spending occurs, provide technical expertise and other services to the various R&D projects, and are organized into science-based functions (which are part of our WRD organization), such as Pharmaceutical Sciences, Medicinal Chemistry, Regulatory and Drug Safety, and non-science-based functions, such as Facilities, Business Technology and Finance. As a result, within each of these functions, we are able to migrate resources among projects, candidates and/or targets in any therapeutic area and in most phases of focusdevelopment, allowing us to react quickly in response to evolving needs.
We manage R&D operations on a total-company basis through our matrix organizations described above. Specifically, a single committee with representation from the R&D groups and the IH commercial organization is biosimilars, which are being developed byaccountable for aligning resources among all of our newly formedWRD, GPD and IH R&D projects and for seeking to ensure optimal capital allocation across the Innovative R&D portfolio. We believe that this approach also serves to maximize accountability and flexibility. Our EH R&D organization.organization manages its resources separately from the WRD and GPD organizations.
Generally, we do not disaggregate total R&D expense by development phase or by therapeutic area since, as described above, we do not manage a significant portion of our R&D operations by development phase or by therapeutic area. Further, as we are able to adjust a significant portion of our spending quickly, as conditions change, we believe that any prior-period information about R&D expense by development phase or by therapeutic area would not necessarily be representative of future spending.
While a significant portion of R&D is done internally, we continue to seek out promising chemical and biological lead molecules and innovative technologies developed by third parties to enhanceincorporate into our pipeline of potential future productsdiscovery and development processes or projects, as well as our product lines, by entering into collaborations, alliancealliances and license agreements with other companies, as well as leveraging acquisitions and equity- or debt-based investments. These agreements enable us to co-develop, license or acquire promising compounds, technologies or capabilities. We also enter into agreements pursuant to which a third party agrees to fund a portion of the development costs of one of our pipeline products in exchange for rights to receive potential milestone payments, revenue sharing payments, profit sharing payments and/or royalties. Collaboration, alliance, license and
funding agreements and equity- or debt-based investments allow us to share risk and cost and to access external scientific and technological expertise, and enable us to advance our own products as well as in-licensed or acquired products.
In the first quarter of 2016, we announced the GPD organization, a new, unified center for late-stage development for our innovative products. GPD is expected to enable more efficient and effective development and enhance our ability to accelerate and progress assets through our pipeline. GPD combines certain previously separate development-related functions from the IH business and the WRD organization to achieve a development capability that is expected to deliver high-quality, efficient, and well-executed clinical programs by enabling greater speed, greater cost efficiencies, and reduced complexity across our development organizations.
For additional information about R&D by operating segment, see the “Analysis of Operating Segment Information” section of this MD&A. For additional information about our pending new drug applications and supplemental filings, see the “Analysis of the Condensed Consolidated Statements of Income––Product Developments––Biopharmaceutical” section of this MD&A. For additional information about recent transactions and strategic investments that we believe have the potential to advance our pipeline, and maximize the value of our in-line products, see the “Our Strategy––Our Business Development Initiatives” section of this MD&A.
Intellectual Property Rights
We continue to aggressively defend our patent rights against increasingly aggressive infringement whenever appropriate, and we will continue to support efforts that strengthen worldwide recognition of patent rights while taking necessary steps to ensure appropriate patient access. In addition, we will continue to employ innovative approaches designed to prevent counterfeit pharmaceuticals from entering the supply chain and to achieve greater control over the distribution of our products, and we will continue to participate in the generics market for our products, whenever appropriate, once they lose exclusivity. Also, the pursuit of valid business opportunities may require us to challenge intellectual property rights held by other companies that we believe were improperly granted. Such challenges may include negotiation and litigation, which may not be successful. For additional information about our current efforts to enforce our intellectual property rights and certain other patent proceedings, see Notes to Condensed Consolidated Financial Statements–Statements––Note 12A1. Commitments and Contingencies: Legal Proceedings––Patent Litigation. For information on risks
related to patent protection and intellectual property claims by third parties, see "Risks“Risks Related to Intellectual Property"Property” in Part I, Item 1A, “Risk Factors” of our 20152016 Form 10-K.
Capital Allocation and Expense Management
We seek to maintain a strong balance sheet and robust liquidity so that we continue to have the financial resources necessary to take advantage of prudent commercial, research and business development opportunities and to directly enhance shareholder value through share repurchases and dividends. For additional information about our financial condition, liquidity, capital resources, share repurchases (including accelerated share repurchases) and dividends, see the “Analysis of Financial Condition, Liquidity and Capital Resources” section of this MD&A.
On March 8, 2016, we entered into an accelerated share repurchase agreement with GS&Co. to repurchase $5 billion of our common stock. This agreement was entered into pursuant to our previously announced share repurchase authorization. In June 2016, we completed the agreement. For additional information about our recent business development activities, see the “Analysis of Financial Condition, Liquidity and Capital Resources–“Our Strategy––Share-Purchase Plans and Accelerated Share Repurchase Agreements”Our Business Development Initiatives” section of this MD&A, “Unregistered Sales of Equity Securities and Use of Proceeds––Issuer Purchases of Equity Securities" in Part II, Item 2 of this Quarterly Report on Form 10-Q and Notes to Condensed Consolidated Financial Statements––Note 12. Commitments and Contingencies.&A.
We remain focused on achieving an appropriate cost structure for the Company. For additional information about our cost-reduction and productivity initiatives, see the “Costs and Expenses––Restructuring Charges and Other Costs Associated with Acquisitions and Cost-Reduction/Productivity Initiatives” section of this MD&A and Notes to Condensed Consolidated Financial Statements––Note 3. Restructuring Charges and Other Costs Associated with Acquisitions and Cost-Reduction/Productivity Initiatives.
Our Business Development Initiatives
We are committed to capitalizing on growth opportunities by advancing our own pipeline and maximizing the value of our in-line products, as well as through various forms of business development, which can include alliances, licenses, joint ventures, collaborations, equity- or debt-based investments, dispositions, mergers and acquisitions. We view our business development activity as an enabler of our strategies, and we seek to generate earnings growth and enhance shareholder value by pursuing a disciplined, strategic and financial approach to evaluating business development opportunities. We are especially interested in opportunities in our six high-priority therapeutic areas––immunology and inflammation; cardiovascular and metabolic diseases; oncology; vaccines; neuroscience and pain; and rare diseases––and in emerging markets and essential health medicines, including biosimilars. We continue to evaluate business development transactions that have the potential to strengthen one or both of our businesses and their capabilities, such as our recent acquisitions of Hospira, Medivation, Anacor, and Anacor,AstraZeneca’s small molecule anti-infectives business, as well as collaborations, and alliance and license agreements with other companies, including our collaborations with Cellectis, SA, OPKO Health, Inc. and Merck KGaA. We assess our businesses, assets and scientific capabilities/portfolio as part of our regular, ongoing portfolio review process and also continue to consider business development activities that will advance our businesses. We are continuing to consider whether a further separation of our IH and EH businesses would be in the best interests of our stockholders. However, no decision has been made regarding any such potential separation; we anticipate making a decision regarding whether to pursue any such potential separation by no later than the end of 2016. For additional information on our business development activities, see Notes to Condensed Consolidated Financial Statements––Note 2.
Acquisitions, Research and Development and Collaborative Arrangements, Equity-Method Investments and Cost-Method InvestmentandNotes to Condensed Consolidated Financial Statements––Note 1. Basis of Presentation and Significant Accounting Policies.
AcquisitionSale of Hospira
Description of Transaction
On September 3, 2015 (the acquisition date), we acquired Hospira, a leading provider of sterile injectable drugs Infusion Systems Net Assets, Collaborative Arrangement and infusion technologies as well as a provider of biosimilars, for approximately $16.1 billion in cash ($15.7 billion, net of cash acquired). Hospira is now a subsidiary of Pfizer. The combination of local Pfizer and Hospira entities may be pending in various jurisdictions and integration is subject to completion of various local legal and regulatory steps.
Recording of Assets Acquired and Liabilities Assumed
In 2015, we recorded provisional amounts for the assets acquired and liabilities assumed, which were adjusted in the first six months of 2016 (measurement period adjustments).
Certain estimated values are not yet finalized and are subject to change (see below). We will finalize the amounts recognized as we obtain the information necessary to complete the analyses. We will finalize the amounts of assets acquired and liabilities assumed as soon as possible but no later than one year from the acquisition date. For the provisional amounts recognized for the Hospira assets acquired and liabilities assumed as of the acquisition date, see Notes to Condensed Consolidated Financial
Statements––Note 2A. Acquisitions, Research and Development and Collaborative Arrangements, Equity-Method Investments and Cost-Method Investment: Acquisitions.
Measurement Period Adjustments
In the first six months of 2016, we recorded measurement period adjustments that reduced, on a net basis, the preliminary estimate of the fair value of identifiable net assets acquired by $4 million with a corresponding increase to goodwill. The measurement period adjustments did not result from intervening events subsequent to the acquisition date. The change in the provisional amounts did not have a material impact on our results of operations. For the measurement period adjustments to the Hospira assets acquired and liabilities assumed as of the acquisition date that were recognized in the first six months of 2016, see Notes to Condensed Consolidated Financial Statements––Note 2A. Acquisitions, Research and Development and Collaborative Arrangements, Equity-Method Investments and Cost-Method Investment: Acquisitions.
Provisional Amounts Subject to ChangeInvestments.
The following items are subject to change:
Amounts for certain legal and environmental contingencies, pending receipt of certain information that could affect provisional amounts recorded.
Amounts for intangibles and PP&E, pending finalization of valuation efforts.
Amounts for income tax assets, receivables and liabilities, pending the filing of Hospira pre-acquisition tax returns and the receipt of information including but not limited to that from taxing authorities, which may change certain estimates and assumptions used.
Additional Recent Transactions and Events
Additionalmore significant recent transactions and events are described below:
| |
| • | Sale of Hospira Infusion Systems Net Assets to ICU Medical, Inc. (EH)––On February 3, 2017, we completed the sale of our global infusion therapy net assets, HIS, to ICU Medical. In connection with this transaction, in the second quarter and first six months of 2017, we recognized pre-tax losses of approximately $28 million and $64 million, respectively, in Other (income)/deductions––net, representing incremental charges to amounts previously recorded to write down the HIS net assets to fair value less costs to sell. We may record additional adjustments to the loss on the sale of HIS net assets in future periods, pending final working capital adjustments and local market closes, among other agreement provisions, which we do not expect to have a material impact on our consolidated financial statements. |
Acquisition of Bamboo Therapeutics, Inc. (Bamboo)––On August 1, 2016, we acquired all the remaining equity in Bamboo, a privately held biotechnology company, focused on developing gene therapies for the treatment of patients with certain rare diseases, for $150 million, plus potential milestone payments to Bamboo’s selling shareholders of up to $495 million contingent upon the progression of key assets through development, regulatory approval and commercialization. We previously purchased a minority stake in Bamboo in the first quarter of 2016 for a payment of approximately $43 million. This acquisition provides us with several clinical and pre-clinical assets that complement our rare disease portfolio, an advanced recombinant Adeno-Associated Virus vector design and production technology, and a fully functional Phase I/II gene therapy manufacturing facility. We do not expect this transaction to have any significant impact on our 2016 financial performance. Following the acquisition, Bamboo is now a wholly-owned subsidiary of Pfizer.
Acquisition of Anacor Pharmaceuticals, Inc.––On June 24, 2016 (the acquisition date), we completed the acquisition of Anacor. For additional information, see the “Our Business” section of this MD&A. Included within Anacor’s pipeline is crisaborole, which is currently under review by the FDA for the treatment of mild-to-moderate atopic dermatitis in children and adults, commonly referred to as a type of eczema. The PDUFA goal timing for the completion of the FDA’s review of the crisaborole NDA is early 2017. Anacor also holds the rights to Kerydin, a topical treatment for onychomycosis (toenail fungus) that is distributed and commercialized by Sandoz in the U.S.
Research and Development Arrangement with NovaQuest Co-Investment Fund II, L.P.––In May 2016, our agreement with NovaQuest became effective, under which NovaQuest will fund up to $250 million in development costs related to certain Phase III clinical trials of Pfizer’s bococizumab compound and Pfizer will use commercially reasonable efforts to develop and obtain regulatory approvals for such compound. Following potential regulatory approval, NovaQuest will be eligible to receive a combination of fixed milestone payments of up to $195 million in total based on achievement of first commercial sale and certain levels of cumulative net sales as well as royalties on bococizumab net sales over approximately nine years. NovaQuest’s development funding is expected to cover up to 40% of the development costs and will be received over five quarters during 2016 and 2017. As there is a substantive and genuine transfer of risk to NovaQuest, the development funding is recognized by us as an obligation to perform contractual services and therefore is a reduction of Research and development expenses as incurred. The reduction to Research and development expenses for the second quarter and first six months of 2016 totaled $69.3 million. Fixed sales-based milestone payments will be recorded as intangible assets and amortized to Amortization of intangible assets over the estimated commercial life of the bococizumab product and royalties on net sales will be recorded as Cost of sales when incurred.
Research and Development Arrangement with NovaQuest Co-Investment Fund V, L.P.––In April 2016, Pfizer entered into an agreement with NovaQuest under which NovaQuest will fund up to $200 million in development costs related to certain Phase III clinical trials of Pfizer’s rivipansel compound and Pfizer will use commercially reasonable efforts to develop and obtain regulatory approvals for such compound. Following potential regulatory approval, NovaQuest will be eligible to receive a combination of fixed milestone payments of up to approximately $267 million in total based on achievement of first
| |
| • | Acquisition of AstraZeneca’s Small Molecule Anti-Infectives Business (EH)––On December 22, 2016, which falls in the first fiscal quarter of 2017 for our international operations, we acquired the development and commercialization rights to AstraZeneca’s small molecule anti-infectives business, primarily outside the U.S., including the commercialization and development rights to the newly approved EU drug Zavicefta™ (ceftazidime-avibactam), the marketed agents Merrem™/Meronem™ (meropenem) and Zinforo™ (ceftaroline fosamil), and the clinical development assets ATM-AVI and CXL (ceftaroline fosamil-AVI). The total fair value of the consideration transferred for this business was approximately $555 million in cash plus the fair value of contingent consideration of $490 million. |
| |
| • | Acquisition of Medivation, Inc. (IH)––On September 28, 2016, we acquired Medivation for $81.50 per share. The total fair value of consideration transferred for Medivation was approximately $14.3 billion in cash ($13.9 billion, net of cash acquired). Medivation’s portfolio includes Xtandi (enzalutamide), an androgen receptor inhibitor that blocks multiple steps in the androgen receptor signaling pathway within tumor cells. Xtandi is being developed and commercialized through a collaboration with Astellas. Astellas has exclusive commercialization rights for Xtandi outside the U.S. In addition, Medivation has a development-stage oncology asset in its pipeline, talazoparib, which is currently in a Phase 3 study for the treatment of BRCA-mutated breast cancer. |
| |
| • | Acquisition of Bamboo Therapeutics, Inc. (R&D)––On August 1, 2016, we acquired all the remaining equity in Bamboo, a privately-held biotechnology company, focused on developing gene therapies for the potential treatment of patients with certain rare diseases relating to neuromuscular conditions and those affecting the central nervous system, for $150 million, plus potential milestone payments of up to $495 million contingent upon the progression of key assets through development, regulatory approval and commercialization. We previously purchased a minority stake in Bamboo in the first quarter of 2016 for a payment of approximately $43 million. This acquisition provides us with several clinical and pre-clinical assets that complement our rare disease portfolio, an advanced recombinant AAV vector design and production technology, and a fully functional Phase I/II gene therapy manufacturing facility. |
| |
| • | Acquisition of Anacor Pharmaceuticals, Inc. (IH)––On June 24, 2016, we acquired Anacor for $99.25 per share. The total fair value of consideration transferred for Anacor was approximately $4.9 billion in cash ($4.5 billion net of cash acquired) plus $698 million debt assumed. Anacor’s crisaborole, a non-steroidal topical PDE-4 inhibitor with anti-inflammatory properties, was approved by the FDA on December 14, 2016 under the trade name Eucrisa, for the treatment of mild-to-moderate atopic dermatitis in patients two years of age and older, commonly referred to as a type of eczema. Anacor also holds the rights to Kerydin, a topical treatment for onychomycosis (toenail fungus) that is distributed and commercialized by Sandoz in the U.S. |
| |
| • | Research and Development Arrangement with NovaQuest Co-Investment Fund V, L.P.––In April 2016, Pfizer entered into an agreement with NovaQuest under which NovaQuest will fund up to $200 million in development costs related to certain Phase III clinical trials of Pfizer’s rivipansel compound and Pfizer will use commercially reasonable efforts to develop and obtain regulatory approvals for such compound. NovaQuest’s development funding is expected to cover up to 100% of the development costs and will be received over approximately twelve quarters from 2016 to 2019. As there is a substantive and genuine transfer of risk to NovaQuest, the development funding is recognized by us as an obligation to perform contractual services and therefore is a reduction of Research and development expenses as incurred. The reduction to Research and development expenses for the second quarter of 2017totaled $14.8 million and for the first six months of 2017 totaled $32.0 million. The reduction to Research and development expenses for the second quarter and first six months of 2016 totaled $15.0 million. Following potential regulatory approval, NovaQuest will be eligible to receive a combination of fixed milestone payments of up to approximately $267 million in total, based on achievement of first commercial sale and certain levels of cumulative net sales as well as royalties on rivipansel net sales over approximately eight years. Fixed sales-based milestone payments will be recorded as intangible assets and amortized to Amortization of intangible assets over the estimated commercial life of the rivipansel product and royalties on net sales will be recorded as Cost of sales when incurred. |
| |
| • | Research and Development Arrangement with RPI Finance Trust––In January 2016, Pfizer entered into an agreement with RPI, a subsidiary of Royalty Pharma, under which RPI will fund up to $300 million in development costs related to certain Phase III clinical trials of Pfizer’s Ibrance (palbociclib) product primarily for adjuvant treatment of hormone receptor positive early breast cancer (the Indication). RPI’s development funding is expected to cover up to 100% of the costs primarily for the applicable clinical trials through 2021. As there is a substantive and genuine transfer of risk to RPI, the development funding is recognized by us as an obligation to perform contractual services and therefore is a reduction of Research and development expenses as incurred. The reduction to Research and development expenses for the second quarter of 2017 totaled $12.3 million and for the first six months of 2017 totaled $26.8 million. The reduction to Research and development expenses for the second quarter of 2016 totaled $12.9 million and for the first six months of 2016 totaled $21.7 million. If successful and upon approval of Ibrance in the U.S. or certain major markets in the EU for the Indication based on the applicable clinical trials, RPI will be eligible to receive a combination of approval-based fixed milestone payments of up to $250 million dependent upon results of the clinical trials and royalties on certain Ibrance sales over |
commercial sale and certain levels of cumulative net sales as well as royalties on rivipansel net sales over approximately eight years. NovaQuest’s development funding is expected to cover up to 100% of the development costs and will be received over approximately twelve quarters from 2016 to 2019. As there is a substantive and genuine transfer of risk to NovaQuest, the development funding is recognized by us as an obligation to perform contractual services and therefore is a reduction of Research and development expenses as incurred. The reduction to Research and development expenses for the second quarter and first six months of 2016 totaled $15.0 million. Fixed sales-based milestone payments will be recorded as intangible assets and amortized to Amortization of intangible assets over the estimated commercial life of the rivipansel product and royalties on net sales will be recorded as Cost of sales when incurred.
Terminated Agreement to Combine with Allergan plc––On April 6, 2016, we announced that the merger agreement between Pfizer and Allergan entered into on November 22, 2015 was terminated by mutual agreement of the companies. For additional information, see the “Our Business” section of this MD&A.
Research and Development Arrangement with RPI Finance Trust––In January 2016, Pfizer entered into an agreement with RPI, a subsidiary of Royalty Pharma, under which RPI will fund up to $300 million in development costs related to certain Phase III clinical trials of Pfizer’s Ibrance (palbociclib) product primarily for adjuvant treatment of hormone receptor positive early breast cancer (the Indication). If successful and upon approval of Ibrance in the U.S. or certain major markets in the EU for the Indication based on the applicable clinical trials, RPI will be eligible to receive a combination of approval-based fixed milestone payments of up to $250 million dependent upon results of the clinical trials and royalties on certain Ibrance sales over approximately seven years. RPI’s development funding is expected to cover up to 100% of the costs primarily for the applicable clinical trials through 2021. As there is a substantive and genuine transfer of risk to RPI, the development funding is recognized by us as an obligation to perform contractual services and therefore is a reduction of Research and development expenses as incurred. The reduction to Research and development expenses for the second quarter of 2016 totaled $12.9 million and for the first six months of 2016 totaled $21.7 million. Fixed milestone payments due upon approval will be recorded as intangible assets and amortized to Amortization of intangible assets over the estimated commercial life of the Ibrance product and sales-based royalties will be recorded as Cost of sales when incurred.
| |
| • | Approval of Besponsa––In June 2017, the European Union approved Besponsa (inotuzumab ozogamicin) as monotherapy for the treatment of adults with relapsed or refractory CD22-positive B-cell precursor acute lymphoblastic leukemia (ALL). In connection with this approval, we incurred an obligation to make guaranteed fixed annual payments over a nine year period aggregating $148 million related to a research and development arrangement. As a result, we recorded the estimated net present value of $118 million as Developed technology rights, and $115 million in Other noncurrent liabilities and $3 million in Other current liabilities in the second quarter of 2017. If Besponsa is approved in the United States for ALL, we will incur an obligation for additional fixed payments over a nine year period aggregating $296 million. |
| |
| • | Pending approval in the EU of Mylotarg––Mylotarg was developed, in part, through a research arrangement with a third party. If Mylotarg is approved in the EU in 2018 for the treatment of acute myeloid leukemia, we will incur an obligation for additional fixed payments over a 10 year period aggregating $310 million. |
Minority Interest in AM-Pharma B.V.––In April 2015, we acquired a minority equity interest in AM-Pharma, a privately-held Dutch biopharmaceutical company focused on the development of recAP for inflammatory diseases, and secured an exclusive option to acquire the remaining equity in the company. The option becomes exercisable upon delivery of the clinical trial report after completion of a Phase II trial of recAP in the treatment of Acute Kidney Injury related to sepsis, which is expected to read out in 2017. Under the terms of the agreement, we paid $87.5 million for both the exclusive option and the minority equity interest, which was recorded as a cost-method investment in Long-term investments, and we may make additional payments of up to $512.5 million upon exercise of the option and potential launch of any product that may result from this investment.
Collaboration with OPKO Health, Inc.––We entered into a collaborative agreement with OPKO, which closed in January 2015, to develop and commercialize OPKO’s long-acting hGH-CTP for the treatment of GHD in adults and children, as well as for the treatment of growth failure in children born SGA who fail to show catch-up growth by two years of age. hGH-CTP has the potential to reduce the required dosing frequency of human growth hormone to a single weekly injection from the current standard of one injection per day. We have received the exclusive license to commercialize hGH-CTP worldwide. OPKO will lead the clinical activities and will be responsible for funding the development programs for the key indications, which include Adult and Pediatric GHD and Pediatric SGA. We will be responsible for all development costs for additional indications, all postmarketing studies, manufacturing and commercialization activities for all indications, and we will lead the manufacturing activities related to product development. In February 2015, we made an upfront payment of $295 million to OPKO, which was recorded in Research and development expenses, and OPKO is eligible to receive up to an additional $275 million upon the achievement of certain regulatory milestones. OPKO is also eligible to receive royalty payments associated with the commercialization of hGH-CTP for Adult GHD, which is subject to regulatory approval. Upon the launch of hGH-CTP for Pediatric GHD, which is subject to regulatory approval, the royalties will transition to tiered gross profit sharing for both hGH-CTP and our product, Genotropin.
Acquisition of Marketed Vaccines Business of Baxter International Inc.––On December 1, 2014 (which falls in the first fiscal quarter of 2015 for our international operations), we acquired Baxter’s portfolio of marketed vaccines for a final purchase price of $648 million. The portfolio that was acquired consists of NeisVac-C and FSME-IMMUN/TicoVac. NeisVac-C is a vaccine that helps protect against meningitis caused by group C meningococcal meningitis and FSME-IMMUN/TicoVac is a vaccine that helps protect against tick-borne encephalitis.
For a description of the more significant recent transactions through February 29, 2016,23, 2017, the filing date of our 20152016 Form 10-K, see the “Our Business Development Initiatives” section of our 20152016 Financial Report.
Our Financial Guidance for 20162017
On August 2, 2016,1, 2017, we reaffirmedupdated our 20162017 financial guidance components set forth below(a), (b):previously issued on January 31, 2017 and reaffirmed on May 2, 2017. Specifically, we raised the midpoint of our Adjusted diluted EPS guidance range by $0.02 to a range of $2.54 to $2.60 to reflect a $300 million increase to the guidance for Adjusted other (income)/deductions due to lower-than-forecasted net interest expense as well as higher-than-forecasted royalty income from certain products and dividend income from ViiV.
Additionally, the updated financial guidance absorbs $75 million of Adjusted research and development expenses that were recorded in the second quarter of 2017 resulting from an agreement we entered into in May 2017 with Sangamo to develop and commercialize gene therapy programs for Hemophilia A, including SB-525, one of Sangamo’s four lead product candidates.
|
| |
Pfizer’s updated 2017 financial guidance is presented below(a),(b): |
| Revenues | $51.052.0 to $53.0$54.0 billion |
| Adjusted cost of sales as a percentage of revenues | 21.0%20.0% to 22.0%21.0% |
| Adjusted selling, informational and administrative expenses | $13.7 to $14.7 billion |
| Adjusted research and development expenses | $7.47.5 to $7.8$8.0 billion |
| Adjusted other (income)/deductions | Approximately ($500 million)$200 million of income |
| (previously approximately $100 million of deductions) |
| Effective tax rate on adjusted income | Approximately 24.0%23.0% |
| Adjusted diluted EPS | $2.382.54 to $2.48$2.60 |
| (previously $2.50 to $2.60) |
| |
(a) | The 2016The 2017 financial guidance reflects the following: |
| |
| • | Does not assume the completion of any business development transactions not completed as of July 2, 2017, including any one-time upfront payments associated with such transactions. |
Exchange rates assumed are a blend of the actual exchange rates in effect through June 2017 and mid-July 2017 exchange rates for the remainder of the year.
| |
| • | Reflects an anticipated negative revenue impact of $2.4 billion due to recent and expected generic and biosimilar competition for certain products that have recently lost or are anticipated to soon lose patent protection. |
| |
| • | Reflects the anticipated negative impact of $0.2 billion on revenues and $0.01 on adjusted diluted EPS as a result of unfavorable changes in foreign exchange rates relative to the U.S. dollar compared to foreign exchange rates from 2016. |
Guidance for adjusted diluted EPS assumes diluted weighted-average shares outstanding of between 6.0 and 6.1 billion shares, which reflects the impact of our $5.0 billion accelerated share repurchase agreement executed in February 2017 and completed in May 2017.
| |
(b) | For an understanding of Adjusted income and its components and Adjusted diluted EPS (all of which are non-GAAP financial measures), see the “Non-GAAP Financial Measure (Adjusted Income)” section of this MD&A. |
Pfizer does not provide guidance for GAAP Reported financial measures (other than Revenues) or a reconciliation of forward-looking non-GAAP financial measures to the most directly comparable GAAP Reported financial measures on a forward-looking basis because it is unable to predict with reasonable certainty the ultimate outcome of pending litigation, unusual gains and losses, acquisition-related expenses and potential future asset impairments without unreasonable effort. These items are uncertain, depend on various factors, and could have a material impact on GAAP Reported results for the guidance period.
Does not assume the completion of any business development transactions not completed as of July 3, 2016, including any one-time upfront payments associated with such transactions.
Exchange rates assumed are a blend of the actual exchange rates in effect through the second quarter of 2016 and the mid-July 2016 exchange rates for the remainder of the year.
Guidance for 2016 revenues reflects the anticipated negative impact of $2.3 billion due to recent and expected generic competition for certain products that have recently lost or are anticipated to soon lose patent protection.
Guidance for 2016 revenues also reflects the anticipated negative impact of $1.4 billion as a result of unfavorable changes in foreign exchange rates relative to the U.S. dollar compared to foreign exchange rates from 2015, including $0.8 billion due to the estimated significant negative currency impact related to Venezuela. The anticipated negative impact on adjusted diluted EPS resulting from unfavorable changes in foreign exchange rates compared to foreign exchange rates from 2015 is approximately $0.10, including $0.07 due to the estimated significant negative currency impact related to Venezuela.
Guidance for adjusted diluted EPS assumes diluted weighted-average shares outstanding of approximately 6.2 billion shares.
| |
(b)
| For an understanding of Adjusted income and its components and Adjusted diluted EPS (all of which are non-GAAP financial measures), see the “Non-GAAP Financial Measure (Adjusted Income)” section of this MD&A. |
For additional information about our actual costs and anticipated costs and cost savings associated with our three-year cost-reduction initiatives announcedinitiative entered into in 2014,the fourth quarter of 2016, the Hospira acquisition, our recent business development activities, and our global commercial structure, which was established in 2014, see the “Costs and Expenses––Restructuring Charges and Other Costs Associated with Acquisitions and Cost-Reduction/Productivity Initiatives” section of this MD&A and Notes to Condensed Consolidated
Financial Statements––Note 3. Restructuring Charges and Other Costs Associated with Acquisitions and Cost-Reduction/Productivity Initiatives.
Our 20162017 financial guidance is subject to a number of factors and uncertainties—uncertainties as described in the “Our Operating Environment”, “The Global Economic Environment”, “Our Strategy” and “Forward-Looking Information and Factors That May Affect Future Results” sections of this MD&A; the “Our Operating Environment”, “The Global Economic Environment” and “Our Strategy” sections of our 2015 Financial Report; and Part I, Item 1A, “Risk Factors” of our 20152016 Form 10-K.
SIGNIFICANT ACCOUNTING POLICIES AND APPLICATION OF CRITICAL ACCOUNTING ESTIMATES AND ASSUMPTIONS
For a description of our significant accounting policies, see Notes to Consolidated Financial Statements––Note 1. Basis of Presentation and Significant Accounting Policies in our 20152016 Form 10-K. Of these policies, the following are considered critical to an understanding of our consolidated financial statements as they require the application of the most subjective and the most complex judgments: (i) Acquisitions (Note 1D); (ii) Fair Value (Note 1E); (iii) Revenues (Note 1G); (iv) Asset Impairments (Note 1K); (v) Income Tax Contingencies (Note 1O); (vi) Pension and Postretirement Benefit Plans (Note 1P); and Legal and Environmental Contingencies (Note 1Q).
For a discussion about the critical accounting estimates and assumptions impacting our consolidated financial statements, see the “Significant Accounting Policies and Application of Critical Accounting Estimates and Assumptions” section of our 20152016 Financial Report. See also Notes to Consolidated Financial Statements––Note 1C. Basis of Presentation and Significant Accounting Policies: Estimates and Assumptions for a discussion about the risks associated with estimates and assumptions in our 20152016 Form 10-K.
For a discussion of recently adopted accounting standards, Seesee Notes to Condensed Consolidated Financial Statements––Note 1B. Basis of Presentation and Significant AccountingPolicies: Adoption of New Accounting Standards.
Benefit Plans
Effective January 1, 2016, the Company changed the approach used to measure service and interest costs for U.S. and certain international pension and other postretirement benefits. For fiscal 2015, the Company measured service and interest costs utilizing a single weighted-average discount rate derived from the bond model or yield curve used to measure the respective plan obligations. For 2016, we elected to measure service and interest costs by applying the spot rates along the yield curve for certain international plans, or a yield curve implied from our specific detailed bond model for U.S. plans, to the plans' liability cash flows. The Company believes the new approach provides a more precise measurement of service and interest costs by aligning the timing of the plans’ liability cash flows to the corresponding spot rates on the yield curve.This change does not affect the measurement of our plan obligations. We have accounted for this change as a change in accounting estimate and, accordingly, have accounted for it on a prospective basis. The expected reduction in expense for 2016 associated with this change in estimate is $191 million, including $42 million from international plans, which is expected to be recognized evenly over each quarter of the year.
ANALYSIS OF THE CONDENSED CONSOLIDATED STATEMENTS OF INCOME
REVENUES AND PRODUCT DEVELOPMENTS
Revenues––Overview
| | The following table provides worldwide revenues by operating segment and geographic area: | | | | Three Months Ended | | Three Months Ended |
| | | Worldwide | | U.S. | | International | | Worldwide | | U.S. | | International | | Worldwide | | U.S. | | International | | World-wide | | U.S. | | Inter-national |
| (MILLIONS OF DOLLARS) | | July 3, 2016 |
| | June 28, 2015 |
| | July 3, 2016 |
| | June 28, 2015 |
| | July 3, 2016 |
| | June 28, 2015 |
| | % Change in Revenues | | July 2,
2017 |
| | July 3, 2016 |
| | July 2, 2017 |
| | July 3, 2016 |
| | July 2, 2017 |
| | July 3, 2016 |
| | % Change in Revenues |
Operating Segments(a): | | | | | | | | | | | | | | | | | | | | | | | | | | | | | | | | | | | | |
| IH | | $ | 7,105 |
| | $ | 6,630 |
| | $ | 3,950 |
| | $ | 3,459 |
| | $ | 3,156 |
| | $ | 3,170 |
| | 7 | | 14 | | — |
| | $ | 7,671 |
| | $ | 7,105 |
| | $ | 4,437 |
| | $ | 3,950 |
| | $ | 3,233 |
| | $ | 3,156 |
| | 8 |
| | 12 |
| | 2 |
|
| EH | | 6,042 |
| | 5,223 |
| | 2,385 |
| | 1,535 |
| | 3,656 |
| | 3,688 |
| | 16 | | 55 | | (1 | ) | | 5,226 |
| | 6,042 |
| | 1,908 |
| | 2,420 |
| | 3,318 |
| | 3,621 |
| | (14 | ) | | (21 | ) | | (8 | ) |
| Total revenues | | $ | 13,147 |
| | $ | 11,853 |
| | $ | 6,335 |
| | $ | 4,994 |
| | $ | 6,812 |
| | $ | 6,859 |
| | 11 | | 27 | | (1 | ) | | $ | 12,896 |
| | $ | 13,147 |
| | $ | 6,345 |
| | $ | 6,370 |
| | $ | 6,551 |
| | $ | 6,777 |
| | (2 | ) | | — |
| | (3 | ) |
| | | | Six Months Ended | | Six Months Ended |
| | | Worldwide | | U.S. | | International | | Worldwide | | U.S. | | International | | Worldwide | | U.S. | | International | | World-wide | | U.S. | | Inter-national |
| (MILLIONS OF DOLLARS) | | July 3, 2016 |
| | June 28, 2015 |
| | July 3, 2016 |
| | June 28, 2015 |
| | July 3, 2016 |
| | June 28, 2015 |
| | % Change in Revenues | | July 2, 2017 |
| | July 3, 2016 |
| | July 2, 2017 |
| | July 3, 2016 |
| | July 2, 2017 |
| | July 3, 2016 |
| | % Change in Revenues |
Operating Segments(a): | | | | |
| | | | |
| | | | |
| | | | | | |
| | | | |
| | | | |
| | | | |
| | |
| | |
| | |
|
| IH | | $ | 14,139 |
| | $ | 12,368 |
| | $ | 8,064 |
| | $ | 6,431 |
| | $ | 6,075 |
| | $ | 5,937 |
| | 14 | | 25 | | 2 |
| | $ | 15,086 |
| | $ | 14,139 |
| | $ | 8,930 |
| | $ | 8,064 |
| | $ | 6,155 |
| | $ | 6,075 |
| | 7 |
| | 11 |
| | 1 |
|
| EH | | 12,013 |
| | 10,348 |
| | 4,897 |
| | 2,996 |
| | 7,116 |
| | 7,352 |
| | 16 | | 63 | | (3 | ) | | 10,590 |
| | 12,013 |
| | 4,052 |
| | 4,967 |
| | 6,537 |
| | 7,046 |
| | (12 | ) | | (18 | ) | | (7 | ) |
| Total revenues | | $ | 26,152 |
| | $ | 22,717 |
| | $ | 12,960 |
| | $ | 9,428 |
| | $ | 13,192 |
| | $ | 13,289 |
| | 15 | | 37 | | (1 | ) | | $ | 25,675 |
| | $ | 26,152 |
| | $ | 12,982 |
| | $ | 13,031 |
| | $ | 12,693 |
| | $ | 13,121 |
| | (2 | ) | | — |
| | (3 | ) |
| |
(a) | IH = the Innovative Health segment; and EH = the Essential Health segment. For additional information about each operating segment, see the “Our Strategy––Commercial Operations” sectionand “Analysis of Operating Segment Information” sections of this MD&A and Notes to Condensed Consolidated Financial Statements––Note 13A. Segment, Geographic and Other Revenue Information: Segment Information. |
The percentages of worldwide revenues by geographic area are as follows:
Revenues––Second Quarter of 2017 vs. Second Quarter of 2016
Revenues in the second quarter of 2016 were $13.1 billion, an increase of 11% compared to the same period in 2015, which reflects an operational increase of $1.6 billion, or 13%, partially offset by the unfavorable impact of foreign exchange of $302 |
| | | | | | | | | | | | |
| The following provides an analysis of the change in revenues by geographic areas in the second quarter of 2017: |
| (MILLIONS OF DOLLARS) | | Three Months Ended July 2, 2017 |
| | | Worldwide | | U.S. | | International |
| | | | | | | |
| Acquisition-related operational growth: | | | | | | |
| Xtandi alliance revenues in the U.S. (September 2016 acquisition of Medivation) | | $ | 141 |
| | $ | 141 |
| | $ | — |
|
| | |
| | | | |
| Disposition-related operational impact: | |
| | | | |
| Financial results in the second quarter of 2017 do not reflect any contribution from HIS global operations, compared to the inclusion of three months of HIS global operations in the same period in 2016 (February 2017 sale) | | (296 | ) | | (230 | ) | | (65 | ) |
| | |
| | | | |
| Other operational growth/(decline): | | | | | | |
| Continued growth from key brands including Ibrance and Eliquis globally, as well as Xeljanz and Lyrica (IH), both primarily in the U.S. | | 730 |
| | 498 |
| | 232 |
|
| Growth from Biosimilars, primarily driven by Inflectra in certain developed Europe markets and in the U.S. | | 47 |
| | 23 |
| | 24 |
|
| Decline from Peri-LOE Products, including declines in Pristiq in the U.S., which lost marketing exclusivity in the U.S. in March 2017, as well as Vfend and Lyrica (EH), both in developed Europe markets | | (305 | ) | | (159 | ) | | (146 | ) |
| Lower revenues for Enbrel driven by declines in most developed Europe markets, primarily due to continued biosimilar competition | | (133 | ) | | — |
| | (133 | ) |
| Decline in the Legacy Established Products portfolio | | (99 | ) | | (103 | ) | | 4 |
|
| Global decline in Prevnar 13/Prevenar 13 revenues. U.S. revenues decreased primarily due to the unfavorable timing of government purchases for the pediatric indication and the continued decline in revenues for the Adult indication due to a smaller remaining “catch up” opportunity compared to the prior-year quarter. International revenues increased primarily due to the favorable timing of government purchases in certain emerging markets for the pediatric indication. | | (84 | ) | | (123 | ) | | 39 |
|
| Other operational factors, net | | (50 | ) | | (72 | ) | | 22 |
|
| Operational decline, net | | (48 | ) | | (25 | ) | | (24 | ) |
| | |
|
| | | | |
| Unfavorable impact of foreign exchange | | (202 | ) | | — |
| | (202 | ) |
Revenues decrease | | $ | (251 | ) | | $ | (25 | ) | | $ | (226 | ) |
Emerging markets revenues increased $170 million, or 3%. The operational increasewas primarily the result of:
inclusion of revenues from legacy Hospira operations of $1.1 billion in the second quarter of 2016; and
the continued strong performance of several key products in developed markets, including Ibrance, Lyrica (IH) and Xeljanz, all primarily in the U.S., as well as Eliquis (collectively, up approximately $780 million in the second quarter of 2016),
partially offset by:
the Prevnar/Prevenar 13 franchise, primarily driven by the expected decline in revenues for Prevnar 13 for adults in the U.S. due to a high initial capture rate of the eligible population following its successful fourth-quarter 2014 launch, which resulted in a smaller remaining “catch up” opportunity compared to the prior-year quarter. International revenues for the pediatric indication for Prevenar 13 also decreased, primarily in emerging markets, reflecting timing of purchases from Gavi, the Vaccine Alliance, and certain other markets, compared to the prior-year quarter (down approximately $230 million in the second quarter of 2016);
the loss of exclusivity and associated generic competition for Zyvox, primarily in the U.S. and certain developed Europe markets, and Lyrica (EH), in certain developed Europe markets (collectively, down approximately $210 million in the second quarter of 2016); and
the expiration at the end of 2015 of the collaboration agreement to co-promote Rebif in the U.S. (down approximately $90 million in the second quarter of 2016).
Revenues––First Six Months 2016
Revenues in the first six months of 2016, were $26.2 billion, an increase of 15% compared to the same period in 2015, which reflects an operational increase of $4.5 billion, or 20%, partially offset by the unfavorable impact of foreign exchange of $1.0 billion, or 5%. Compared to the first six months of 2015, revenues in the first six months of 2016 were favorably impacted by approximately $800 million as a result of the first six months of 2016 having four additional selling days in the U.S. and international markets. This imbalance in selling days will be offset in the fourth quarter of 2016 resulting in essentially the same
number of selling days in 2016 as 2015. The operational increase,which includes the impact of the additional selling days in the first six months of 2016, was primarily the result of:
inclusion of revenues from legacy Hospira operations of $2.3 billion in the first six months of 2016;
the continued strong performance of several key products in developed markets, including Ibrance, Lyrica (IH), Xeljanz, Chantix/Champix and Consumer Healthcare, all primarily in the U.S., as well as Eliquis (collectively, up approximately $1.9 billion in the first six months of 2016); and
a 6% operational increase in revenues in emerging markets (excluding the contribution from legacy Hospira operations), reflecting continued strong performance primarily from Enbrel and Eliquis and continued strong volume growth from certain other products (collectively, up approximately $320 million in thefirst six months of 2016),
partially offset by:
the loss of exclusivity and associated generic competition for Zyvox, primarily in the U.S. and certain developed Europe markets, and Lyrica (EH) in certain developed Europe markets (collectively, down approximately $440 million in the first six months of 2016); and
the expiration at the end of 2015 of the collaboration agreement to co-promote Rebif in the U.S. (down approximately $140 million in the first six months of 2016).
Geographically,
in the U.S., revenues increased $1.3 billion, or 27%, in the second quarter of 2017 to $2.8 billion, reflecting an operational increase of $247 million, or 9%. Foreign exchange had an unfavorable impact of approximately 3% on emerging markets revenues. This operational growth in emerging markets was primarily driven by our IH segment as well as our Legacy Established Products portfolio.
Revenues––First Six Months of 2017 vs. First Six Months of 2016 and
|
| | | | | | | | | | | | |
| The following provides an analysis of the change in revenues by geographic areas in the first six months of 2017: |
| (MILLIONS OF DOLLARS) | | Six Months Ended July 2, 2017 |
| | | Worldwide | | U.S. | | International |
| | | | | | | |
| Acquisition-related operational growth: | | | | | | |
| Xtandi alliance revenues in the U.S. (September 2016 acquisition of Medivation) | | $ | 272 |
| | $ | 272 |
| | $ | — |
|
| | | | | | | |
| Disposition-related operational impact: | | | | | | |
| Approximately one month of HIS domestic operations and approximately two months of HIS international operations in the first six months of 2017, compared to six months of HIS global operations in the same period in 2016 (February 2017 sale) | | (503 | ) | | (406 | ) | | (97 | ) |
| | | | | | | |
| Other operational growth/(decline): | | | | | | |
| Continued growth from key brands including Ibrance and Eliquis globally, as well as Lyrica (IH) and Xeljanz, both primarily in the U.S. | | 1,351 |
| | 944 |
| | 407 |
|
| Growth from Biosimilars, primarily driven by Inflectra in certain developed Europe markets and in the U.S. | | 88 |
| | 40 |
| | 48 |
|
| Decline from Peri-LOE Products, including declines in Pristiq in the U.S., which lost marketing exclusivity in the U.S. in March 2017, as well as Lyrica (EH) and Vfend, both in developed Europe markets | | (559 | ) | | (239 | ) | | (320 | ) |
| Lower revenues for Enbrel driven by declines in most developed Europe markets, primarily due to continued biosimilar competition | | (265 | ) | | — |
| | (265 | ) |
| Decline in the Legacy Established Products portfolio | | (252 | ) | | (264 | ) | | 12 |
|
| Global decline in Prevnar 13/Prevenar 13 revenues. U.S. revenues decreased primarily due to the continued decline in revenues for the Adult indication due to a smaller remaining “catch up” opportunity compared to the prior-year period and the unfavorable timing of government purchases for the pediatric indication. International revenues increased primarily due to the favorable timing of government purchases in certain emerging markets for the pediatric indication. | | (197 | ) | | (216 | ) | | 19 |
|
| Decline in Viagra (IH) revenues primarily in the U.S. | | (95 | ) | | (95 | ) | | (1 | ) |
| Other operational factors, net | | 1 |
| | (85 | ) | | 86 |
|
| Operational decline, net | | (159 | ) | | (49 | ) | | (110 | ) |
| | | | | | | |
| Unfavorable impact of foreign exchange | | (318 | ) | | — |
| | (318 | ) |
| Revenues decrease | | $ | (477 | ) | | $ | (49 | ) | | $ | (428 | ) |
Emerging markets revenues increased $3.5 billion,$254 million, or 37%5%, in the first six months of 2016, compared2017 to the same periods in 2015,$5.4 billion, reflecting among other things:
| |
◦ | the inclusion of legacy Hospira U.S. operations of approximately $850 million in the second quarter of 2016 and $1.8 billion in the first six months of 2016; and |
| |
◦ | the continued strong performance of several key products including Ibrance, Lyrica (IH), Eliquis, Xeljanz and Chantix (collectively, up approximately $720 million in the second quarter of 2016 and $1.6 billion in the first six months of 2016), |
partially offset by:
| |
◦ | the expected decline in revenues for Prevnar 13 primarily driven by Prevnar 13 for adults in the U.S. due to a high initial capture rate of the eligible population following its successful fourth-quarter 2014 launch, which resulted in a smaller remaining “catch up” opportunity compared to the prior-year quarter (down approximately $110 million in the second quarter of 2016); |
| |
◦ | the expiration at the end of 2015 of the collaboration agreement to co-promote Rebif in the U.S. (down approximately $90 million in the second quarter of 2016 and $140 million in the first six months of 2016); and |
| |
◦ | the loss of exclusivity and associated generic competition for Zyvox (down approximately $70 million in the second quarter of 2016 and $170 million in the first six months of 2016). |
in our international markets, revenues decreased $47an operational increase of $404 million, or 1%, in the second quarter of 2016, and decreased $98 million, or 1%, in the first six months of 2016 compared to the same periods in 2015.8%. Foreign exchange unfavorably impacted international revenueshad an unfavorable impact of approximately 3% on emerging markets revenues. This operational growth in emerging markets was primarily driven by approximately $300 million, or 4%, in the second quarter of 2016 and unfavorably impacted international revenues by approximately $1.0 billion, or 8% in the first six months of 2016. Operationally, revenues increased $253 million, or 4%, in the second quarter of 2016 and increased $931 million, or 7% in the first six months of 2016, compared to the same periods in 2015, reflecting, among other things:
| |
◦ | the inclusion of legacy Hospira international operations of approximately $290 million in the second quarter of 2016 and $560 million in the first six months of 2016; |
| |
◦ | the continued strong performance of Eliquis (up approximately $90 million in the second quarter of 2016 and $180 million in the first six months of 2016); and |
| |
◦ | the continued strong volume growth from certain other products in emerging markets, excluding the contributions from legacy Hospira and Eliquis and lower revenues from Prevenar 13 pediatric (collectively, up approximately $130 million in the second quarter of 2016 and $360 million in the first six months of 2016), |
partially offset by:
| |
◦ | lower revenues in developed markets for Lyrica (EH) and Zyvox as a result of the loss of exclusivity (collectively, down approximately $150 million in the second quarter of 2016 and $280 million in the first six months of 2016); and |
| |
◦ | lower revenues for Prevenar 13 primarily for the pediatric indication mostly in emerging markets, reflecting timing of purchases from Gavi, the Vaccine Alliance, and certain other markets, compared to the prior-year period (down approximately $120 million for the second quarter of 2016 and $60 million in the first six months of 2016). |
During the second quarter of 2016, international revenues represented 52% of total revenues, compared to 58% in the second quarter of 2015. Excluding foreign exchange, international revenues in the second quarter of 2016 represented 53% of total revenues. During the first six months of 2016, international revenues represented 50% of total revenues compared to 58% in the first six months of 2015. Excluding foreign exchange, international revenues in the first six months of 2016 represented 52% of total revenues. The decline in the percentage of international revenues is primarily due to the inclusion of Hospira.
For additional information about operatingour IH segment revenues, see the “Analysis of Operating Segment Information” section of this MD&A.as well as our Sterile Injectable Pharmaceuticals portfolio.
Revenue Deductions
Our gross product revenues are subject to a variety of deductions that are generally estimated and recorded in the same period that the revenues are recognized, and primarily represent chargebacks, rebates chargebacks and sales allowances to wholesalers, and, to a lesser extent, distributors like MCOs, retailers and government agencies wholesalers/distributors and managed care organizations with respect to our pharmaceutical products. Those deductions represent estimates of rebates and discounts related to gross sales for the reporting period and, as such, knowledge and judgment of market conditions and practice are required when estimating the impact of these revenue deductions on gross sales for a reporting period.
Historically, our adjustments of estimates, to reflect actual results or updated expectations, have not been material to our overall business. On a quarterly basis, our adjustments of estimates to reflect actual results generally have been less than 1% of revenues, and have resulted in either a net increase or a net decrease in revenues. Product-specific rebates, however, can have a significant impact on year-over-year individual product growth trends.
| | | The following table provides information about deductions from revenues: | |
| The following table provides information about revenue deductions: | | The following table provides information about revenue deductions: |
| | | Three Months Ended | | Six Months Ended | | Three Months Ended | | Six Months Ended |
| (MILLIONS OF DOLLARS) | | July 3,
2016 |
| | June 28,
2015 |
| | July 3,
2016 |
| | June 28,
2015 |
| | July 2,
2017 |
| | July 3,
2016 |
| | July 2,
2017 |
| | July 3,
2016 |
|
Medicare rebates(a) | | $ | 216 |
| | $ | 228 |
| | $ | 492 |
| | $ | 449 |
| | $ | 316 |
| | $ | 216 |
| | $ | 575 |
| | $ | 492 |
|
Medicaid and related state program rebates(a) | | 364 |
| | 291 |
|
| 735 |
| | 571 |
| | 451 |
| | 364 |
|
| 896 |
| | 735 |
|
Performance-based contract rebates(a), (b) | | 636 |
| | 581 |
|
| 1,225 |
| | 1,046 |
| | 819 |
| | 636 |
|
| 1,547 |
| | 1,225 |
|
Chargebacks(c) | | 1,414 |
| | 1,208 |
|
| 2,853 |
| | 2,251 |
| | 1,480 |
| | 1,414 |
|
| 2,978 |
| | 2,853 |
|
Sales allowances(d) | | 1,115 |
| | 990 |
|
| 2,091 |
| | 1,894 |
| | 1,189 |
| | 1,115 |
|
| 2,300 |
| | 2,091 |
|
| Sales returns and cash discounts | | 324 |
| | 366 |
| | 688 |
| | 627 |
| | 372 |
| | 324 |
| | 697 |
| | 688 |
|
Total(e) | | $ | 4,067 |
| | $ | 3,665 |
| | $ | 8,083 |
| | $ | 6,839 |
| | $ | 4,626 |
| | $ | 4,067 |
| | $ | 8,993 |
| | $ | 8,083 |
|
| |
(a) | Rebates are product-specific and, therefore, for any given year are impacted by the mix of products sold. |
| |
(b) | Performance-based contract rebates include contract rebates with managed care customersMCOs within the U.S., including health maintenance organizations and PBMs, who receive rebates based on the achievement of contracted performance terms and claims under these contracts. Outside the U.S., performance-based contract rebates include rebates to wholesalers/distributors based on achievement of contracted performance for specific products or sales milestones. |
| |
(c) | Chargebacks primarily represent reimbursements to U.S. wholesalers for honoring contracted prices to third parties. |
| |
(d) | Sales allowances primarily represent price reductions that are contractual or legislatively mandated outside the U.S., discounts and distribution fees. |
| |
(e) | For the three months ended July 2, 2017, associated with the following segments: IH ($2.2 billion) and EH ($2.5 billion). For the three months ended July 3, 2016, associated with the following segments: IH ($1.6 billion); and EH ($2.4 billion). For the threesix months ended June 28, 2015,July 2, 2017, associated with the following segments: IH ($1.44.0 billion); and EH ($2.35.0 billion). For the six months ended July 3, 2016, associated with the following segments: IH ($3.3 billion) and EH ($4.8 billion). For the six months ended June 28, 2015, associated with the following segments: IH ($2.6 billion) and EH ($4.2 billion). |
Total revenue deductions from revenues for the second quarter of 20162017 increased 11%14% compared to the second quarter of 2015,2016, and total revenue deductions from revenues for the first six months of 20162017 increased 18%11% compared to the first six months of 2015,2016, primarily as a result of:
an increase in chargebacks from EH products, primarily due to the addition in 2016 of Hospira sterile injectables, and from certain IH products;
an increase in performance-based contract rebates primarily due to sales to managed care customers in the U.S. and, for the first six months of 2016,, as well as higher rebates in certain developed Europe markets due to competitive pressures post loss of exclusivity for certain products; andoutside the U.S.;
an increase in sales allowances primarily in markets outside the U.S.;
an increase in Medicaid and related state program rebates, primarily as a result of updated estimates of sales related to these programs.programs; and
an increase in chargebacks from certain IH products, partially offset by decreases across several EH products.
Our accruals for Medicare rebates, Medicaid and related state program rebates, performance-based contract rebates, chargebacks, sales allowances and sales returns and cash discounts totaled $4.1$4.4 billion as of July 3, 2016,2, 2017, of which approximately $2.7$2.9 billion is included in Other current liabilities, $332369 million is included in Other noncurrent liabilities and approximately $1.1 billion is included against Trade accounts receivable, less allowance for doubtful accounts, in our condensed consolidated balance sheet.Our accruals for Medicare rebates, Medicaid and related state program rebates, performance-based contract rebates, chargebacks, sales allowances and sales returns and cash discounts totaled$3.94.3 billion as of December 31, 2015,2016, of which approximately $2.6$2.8 billion is included in Other current liabilities, $272357 million is included in Other noncurrent liabilities and approximately $1.1$1.2 billion is included against Trade accounts receivable, less allowance for doubtful accounts, in our condensed consolidated balance sheet.
Revenues—Major Products
| | | The following table provides revenue information for several of our major products: | |
The following table provides revenue information for several of our major products. As described in Note 1A, acquisitions and divestitures have impacted our results of operations in 2017 and 2016. | | The following table provides revenue information for several of our major products. As described in Note 1A, acquisitions and divestitures have impacted our results of operations in 2017 and 2016. |
| | | | Three Months Ended | | Six Months Ended | | | Three Months Ended | | Six Months Ended |
| (MILLIONS OF DOLLARS) | (MILLIONS OF DOLLARS) | | July 3,
2016 |
| | % Change(a) | | July 3,
2016 |
| | % Change(a) | (MILLIONS OF DOLLARS) | | | | % Change(a) | | | | % Change(a) |
| PRODUCT | | PRIMARY INDICATIONS OR CLASS | | Total |
| | Oper. |
| Total |
| | Oper. |
| | PRIMARY INDICATIONS OR CLASS | | July 2,
2017 |
| Total |
| | Oper. |
| July 2,
2017 |
| Total |
| | Oper. |
|
| TOTAL REVENUES | | | | $ | 12,896 |
| | (2 | ) | | — |
| | $ | 25,675 |
| | (2 | ) | | (1 | ) |
PFIZER INNOVATIVE HEALTH (IH)(b) | PFIZER INNOVATIVE HEALTH (IH)(b) | | $ | 7,105 |
| | 7 |
| | 9 |
| | $ | 14,139 |
| | 14 |
| | 18 |
| PFIZER INNOVATIVE HEALTH (IH)(b) | | $ | 7,671 |
| | 8 |
| | 9 |
| | $ | 15,086 |
| | 7 |
| | 8 |
|
| Internal Medicine | Internal Medicine | | $ | 2,190 |
| | 16 |
| | 16 |
| | $ | 4,314 |
| | 22 |
| | 23 |
| Internal Medicine | | $ | 2,412 |
| | 10 |
| | 11 |
| | $ | 4,789 |
| | 11 |
| | 11 |
|
Lyrica IH(c) | | Epilepsy, post-herpetic neuralgia and diabetic peripheral neuropathy, fibromyalgia, neuropathic pain due to spinal cord injury | | 1,048 |
| | 15 |
| | 16 |
| | 2,059 |
| | 17 |
| | 19 |
| | Epilepsy, post-herpetic neuralgia and diabetic peripheral neuropathy, fibromyalgia, neuropathic pain due to spinal cord injury | | 1,101 |
| | 5 |
| | 5 |
| | 2,231 |
| | 8 |
| | 8 |
|
| Eliquis alliance revenues and direct sales | | | Atrial fibrillation, deep vein thrombosis, pulmonary embolism | | 605 |
| | 50 |
| | 52 |
| | 1,169 |
| | 51 |
| | 52 |
|
Viagra IH(d) | | Erectile dysfunction | | 300 |
| | (10 | ) | | (10 | ) | | 600 |
| | (4 | ) | | (3 | ) | | Erectile dysfunction | | 255 |
| | (15 | ) | | (15 | ) | | 505 |
| | (16 | ) | | (16 | ) |
| Chantix/Champix | | An aid to smoking cessation treatment | | 213 |
| | 23 |
| | 24 |
| | 434 |
| | 31 |
| | 33 |
| | An aid to smoking cessation treatment in adults 18 years of age or older | | 248 |
| | 16 |
| | 17 |
| | 487 |
| | 12 |
| | 13 |
|
| Toviaz | | Overactive bladder | | 67 |
| | (5 | ) | | (6 | ) | | 131 |
| | (2 | ) | | (1 | ) | | Overactive bladder | | 62 |
| | (8 | ) | | (6 | ) | | 125 |
| | (4 | ) | | (3 | ) |
| BMP2 | | Development of bone and cartilage | | 61 |
| | (19 | ) | | (19 | ) | | 112 |
| | (1 | ) | | (1 | ) | | Development of bone and cartilage | | 57 |
| | (6 | ) | | (6 | ) | | 119 |
| | 6 |
| | 6 |
|
Alliance revenues(e) | | Various | | 371 |
| | 28 |
| | 25 |
| | 722 |
| | 45 |
| | 45 |
| |
| All other Internal Medicine | | Various | | 130 |
| | * |
| | * |
| | 257 |
| | * |
| | * |
| | Various | | 84 |
| | (13 | ) | | (13 | ) | | 153 |
| | (25 | ) | | (24 | ) |
| Vaccines | Vaccines | | $ | 1,365 |
| | (14 | ) | | (13 | ) | | $ | 2,935 |
| | 1 |
| | 3 |
| Vaccines | | $ | 1,270 |
| | (7 | ) | | (5 | ) | | $ | 2,735 |
| | (7 | ) | | (6 | ) |
| Prevnar/Prevenar 13 | | Vaccines for prevention of pneumococcal disease | | 1,258 |
| | (16 | ) | | (15 | ) | | 2,766 |
| | (1 | ) | | — |
| |
| Prevnar 13/Prevenar 13 | | | Vaccines for prevention of pneumococcal disease | | 1,154 |
| | (8 | ) | | (7 | ) | | 2,547 |
| | (8 | ) | | (7 | ) |
| FSME/IMMUN-TicoVac | | Tick-borne encephalitis vaccine | | 42 |
| | (24 | ) | | (26 | ) | | 69 |
| | 6 |
| | 6 |
| | Tick-borne encephalitis vaccine | | 50 |
| | 18 |
| | 23 |
| | 76 |
| | 10 |
| | 15 |
|
| All other Vaccines | | Various | | 65 |
| | * |
| | * |
| | 100 |
| | * |
| | * |
| | Various | | 66 |
| | 1 |
| | 6 |
| | 112 |
| | 13 |
| | 17 |
|
| Oncology | Oncology | | $ | 1,101 |
| | 54 |
| | 56 |
| | $ | 2,102 |
| | 69 |
| | 72 |
| Oncology | | $ | 1,589 |
| | 44 |
| | 46 |
| | $ | 2,935 |
| | 40 |
| | 41 |
|
| Ibrance | | Advanced breast cancer | | 514 |
| | * |
| | * |
| | 942 |
| | * |
| | * |
| | Advanced breast cancer | | 853 |
| | 66 |
| | 67 |
| | 1,532 |
| | 63 |
| | 63 |
|
| Sutent | | Advanced and/or metastatic RCC, refractory GIST and advanced pancreatic neuroendocrine tumor | | 285 |
| | (3 | ) | | — |
| | 563 |
| | 5 |
| | 10 |
| | Advanced and/or metastatic RCC, refractory GIST (after disease progression on, or intolerance to, imatinib mesylate) and advanced pancreatic neuroendocrine tumor | | 279 |
| | (2 | ) | | — |
| | 529 |
| | (6 | ) | | (4 | ) |
| Xalkori | | ALK-positive NSCLC and ROS1-positive NSCLC | | 137 |
| | 15 |
| | 15 |
| | 275 |
| | 20 |
| | 22 |
| | ALK-positive and ROS1-positive advanced NSCLC | | 155 |
| | 13 |
| | 15 |
| | 296 |
| | 8 |
| | 10 |
|
| Xtandi alliance revenues | | | Advanced prostate cancer | | 141 |
| | * |
| | * |
| | 272 |
| | * |
| | * |
|
| Inlyta | | Advanced RCC | | 108 |
| | (2 | ) | | (3 | ) | | 209 |
| | 1 |
| | 3 |
| | Advanced RCC | | 88 |
| | (19 | ) | | (17 | ) | | 172 |
| | (18 | ) | | (16 | ) |
| Bosulif | | | Philadelphia chromosome–positive chronic myelogenous leukemia | | 59 |
|
| 44 |
|
| 45 |
| | 106 |
| | 35 |
| | 36 |
|
| All other Oncology | | Various | | 57 |
| | 16 |
| | 15 |
| | 112 |
| | 25 |
| | 26 |
| | Various | | 14 |
| | (11 | ) | | (11 | ) | | 28 |
| | (18 | ) | | (18 | ) |
| Inflammation & Immunology (I&I) | Inflammation & Immunology (I&I) | | $ | 999 |
| | 3 |
| | 7 |
| | $ | 1,947 |
| | 6 |
| | 14 |
| Inflammation & Immunology (I&I) | | $ | 992 |
| | (1 | ) | | 1 |
| | $ | 1,863 |
| | (4 | ) | | (3 | ) |
| Enbrel (Outside the U.S. and Canada) | | Rheumatoid, juvenile rheumatoid and psoriatic arthritis, plaque psoriasis and ankylosing spondylitis | | 766 |
| | (7 | ) | | (3 | ) | | 1,500 |
| | (5 | ) | | 3 |
| | Rheumatoid arthritis, juvenile idiopathic arthritis, psoriatic arthritis, plaque psoriasis, pediatric plaque psoriasis, ankylosing spondylitis and nonradiographic axial spondyloarthritis | | 617 |
| | (20 | ) | | (17 | ) | | 1,205 |
| | (20 | ) | | (18 | ) |
| Xeljanz | | Rheumatoid arthritis | | 217 |
| | 70 |
| | 72 |
| | 414 |
| | 85 |
| | 87 |
| | Rheumatoid arthritis | | 336 |
| | 55 |
| | 56 |
| | 587 |
| | 42 |
| | 42 |
|
| All Other I&I | | Various | | 16 |
| | 1 |
| | (7 | ) | | 33 |
| | 39 |
| | 33 |
| |
| Eucrisa | | | Mild to moderate atopic dermatitis (eczema) | | 9 |
| | * |
| | * |
| | 17 |
| | * |
| | * |
|
| All other I&I | | | Various | | 31 |
| | 90 |
| | 90 |
| | 54 |
| | 63 |
| | 62 |
|
| Rare Disease | Rare Disease | | $ | 614 |
| | (3 | ) | | (2 | ) | | $ | 1,182 |
| | (1 | ) | | 3 |
| Rare Disease | | $ | 562 |
| | (8 | ) | | (6 | ) | | $ | 1,069 |
| | (10 | ) | | (8 | ) |
| BeneFIX | | Hemophilia | | 183 |
| | (5 | ) | | (5 | ) | | 367 |
| | — |
| | 3 |
| | Hemophilia | | 153 |
| | (16 | ) | | (15 | ) | | 302 |
| | (18 | ) | | (16 | ) |
| Refacto AF/Xyntha | | | Hemophilia | | 139 |
| | — |
| | 4 |
| | 269 |
| | — |
| | 4 |
|
| Genotropin | | Replacement of human growth hormone | | 152 |
| | (9 | ) | | (6 | ) | | 277 |
| | (9 | ) | | (5 | ) | | Replacement of human growth hormone | | 135 |
| | (12 | ) | | (10 | ) | | 238 |
| | (14 | ) | | (13 | ) |
| Refacto AF/Xyntha | | Hemophilia | | 139 |
| | (2 | ) | | (1 | ) | | 268 |
| | 2 |
| | 6 |
| |
| Somavert | | Acromegaly | | 59 |
| | 8 |
| | 8 |
| | 114 |
| | 9 |
| | 12 |
| | Acromegaly | | 61 |
| | 3 |
| | 6 |
| | 117 |
| | 3 |
| | 5 |
|
| Rapamune | | Prevention of organ rejection in kidney transplantation | | 47 |
| | (11 | ) | | (4 | ) | | 93 |
| | (12 | ) | | (4 | ) | |
| All other Rare Disease | | Various | | 33 |
| | 27 |
| | 23 |
| | 63 |
| | 18 |
| | 19 |
| | Various | | 74 |
| | (8 | ) | | (6 | ) | | 141 |
| | (9 | ) | | (8 | ) |
| Consumer Healthcare | Consumer Healthcare | | $ | 837 |
| | — |
| | 5 |
| | $ | 1,659 |
| | 1 |
| | 7 |
| Consumer Healthcare | | $ | 846 |
| | 1 |
| | 2 |
| | $ | 1,694 |
| | 2 |
| | 3 |
|
PFIZER ESSENTIAL HEALTH (EH)(f) | | $ | 6,042 |
| | 16 |
| | 19 |
| | $ | 12,013 |
| | 16 |
| | 22 |
| |
Legacy Established Products (LEP)(g) | | $ | 2,864 |
| | (2 | ) | | 2 |
| | $ | 5,664 |
| | (2 | ) | | 5 |
| |
PFIZER ESSENTIAL HEALTH (EH)(e) | | PFIZER ESSENTIAL HEALTH (EH)(e) | | $ | 5,226 |
| | (14 | ) | | (12 | ) | | $ | 10,590 |
| | (12 | ) | | (10 | ) |
Legacy Established Products (LEP)(f) | | Legacy Established Products (LEP)(f) | | $ | 2,707 |
| | (5 | ) | | (3 | ) | | $ | 5,313 |
| | (6 | ) | | (4 | ) |
| Lipitor | | Reduction of LDL cholesterol | | 461 |
| | (9 | ) | | (2 | ) | | 872 |
| | (8 | ) | | — |
| | Reduction of LDL cholesterol | | 445 |
| | (3 | ) | | — |
| | 849 |
| | (3 | ) | | 1 |
|
| Premarin family | | Symptoms of menopause | | 251 |
| | (3 | ) | | (2 | ) | | 507 |
| | 3 |
| | 4 |
| | Symptoms of menopause | | 245 |
| | (2 | ) | | (2 | ) | | 473 |
| | (7 | ) | | (7 | ) |
| Norvasc | | Hypertension | | 240 |
| | (4 | ) | | (2 | ) | | 476 |
| | (5 | ) | | (1 | ) | | Hypertension | | 231 |
| | (4 | ) | | — |
| | 458 |
| | (4 | ) | | — |
|
| EpiPen | | Epinephrine injection used in treatment of life-threatening allergic reactions | | 93 |
| | 9 |
| | 10 |
| | 190 |
| | 18 |
| | 19 |
| | Epinephrine injection used in treatment of life-threatening allergic reactions | | 90 |
| | (4 | ) | | (3 | ) | | 171 |
| | (10 | ) | | (10 | ) |
| Xalatan/Xalacom | | Glaucoma and ocular hypertension | | 94 |
| | (5 | ) | | (4 | ) | | 182 |
| | (9 | ) | | (5 | ) | | Glaucoma and ocular hypertension | | 81 |
| | (13 | ) | | (12 | ) | | 158 |
| | (13 | ) | | (14 | ) |
| Relpax | | Treats the symptoms of migraine headache | | 87 |
| | 6 |
| | 5 |
| | 165 |
| | 2 |
| | 2 |
| | Symptoms of migraine headache | | 60 |
| | (31 | ) | | (30 | ) | | 143 |
| | (14 | ) | | (13 | ) |
| Zithromax | | | Bacterial infections | | 62 |
| | (9 | ) | | (4 | ) | | 140 |
| | (5 | ) | | — |
|
| Effexor | | | Depression and certain anxiety disorders | | 73 |
| | 8 |
| | 11 |
| | 139 |
| | 2 |
| | 3 |
|
| Zoloft | | Depression and certain anxiety disorders | | 77 |
| | (17 | ) | | (14 | ) | | 156 |
| | (13 | ) | | (5 | ) | | Depression and certain anxiety disorders | | 69 |
| | (11 | ) | | (8 | ) | | 137 |
| | (13 | ) | | (10 | ) |
Zithromax/Zmax(h) | | Bacterial infections | | 67 |
| | 10 |
| | 12 |
| | 147 |
| | 5 |
| | 10 |
| |
| Effexor | | Depression and certain anxiety disorders | | 67 |
| | (9 | ) | | (5 | ) | | 137 |
| | (7 | ) | | (1 | ) | |
| Tikosyn | | Maintenance of normal sinus rhythm, conversion of atrial fibrillation/flutter | | 55 |
| | 32 |
| | 32 |
| | 116 |
| | 48 |
| | 48 |
| |
| Xanax/Xanax XR | | Anxiety disorders | | 55 |
| | 2 |
| | 3 |
| | 108 |
| | (1 | ) | | 4 |
| |
| Cardura | | Hypertension/Benign prostatic hyperplasia | | 48 |
| | (11 | ) | | (10 | ) | | 94 |
| | (12 | ) | | (7 | ) | |
| Neurontin | | Seizures | | 47 |
| | (2 | ) | | 5 |
| | 91 |
| | (12 | ) | | 1 |
| |
| Depo-Provera | | Contraceptive | | 34 |
| | (33 | ) | | (31 | ) | | 68 |
| | (23 | ) | | (19 | ) | |
| Xanax | | | Anxiety disorders | | 52 |
| | (6 | ) | | (5 | ) | | 107 |
| | (1 | ) | | — |
|
| All other LEP | | Various | | 1,187 |
| | 1 |
| | 8 |
| | 2,355 |
| | — |
| | 9 |
| | Various | | 1,300 |
| | (5 | ) | | (3 | ) | | 2,538 |
| | (7 | ) | | (5 | ) |
Sterile Injectable Pharmaceuticals (SIP)(i) | | $ | 1,497 |
| | 99 |
| | * |
| | $ | 3,021 |
| | * |
| | * |
| |
Medrol(h) | | Adrenocortical steroid | | 115 |
| | 16 |
| | 21 |
| | 228 |
| | 23 |
| | 29 |
| |
Sterile Injectable Pharmaceuticals (SIP)(g) | | Sterile Injectable Pharmaceuticals (SIP)(g) | | $ | 1,444 |
| | (4 | ) | | (2 | ) | | $ | 2,996 |
| | (1 | ) | | — |
|
| Medrol | | | Steroid anti-inflammatory | | 123 |
| | 7 |
| | 8 |
| | 243 |
| | 7 |
| | 7 |
|
| Sulperazon | | Antibiotic | | 105 |
| | 31 |
| | 37 |
| | 201 |
| | 13 |
| | 18 |
| | Treatment of infections | | 110 |
| | 4 |
| | 10 |
| | 232 |
| | 15 |
| | 21 |
|
| Fragmin | | Anticoagulant | | 82 |
| | (7 | ) | | (4 | ) | | 160 |
| | (1 | ) | | 4 |
| | Slows blood clotting | | 71 |
| | (14 | ) | | (9 | ) | | 142 |
| | (11 | ) | | (8 | ) |
| Precedex | | | Sedation agent in surgery or intensive care | | 67 |
| | 2 |
| | 1 |
| | 132 |
| | (3 | ) | | (4 | ) |
| Tygacil | | Antibiotic | | 59 |
| | (23 | ) | | (17 | ) | | 134 |
| | (11 | ) | | (3 | ) | | Tetracycline class antibiotic | | 57 |
| | (3 | ) | | (2 | ) | | 131 |
| | (2 | ) | | (1 | ) |
| All other SIP | | Various | | 1,136 |
| | * |
| | * |
| | 2,297 |
| | * |
| | * |
| | Various | | 1,016 |
| | (5 | ) | | (4 | ) | | 2,116 |
| | (2 | ) | | (1 | ) |
| | Peri-LOE Products(j) | | $ | 1,111 |
| | (21 | ) | | (19 | ) | | $ | 2,201 |
| | (23 | ) | | (18 | ) | |
| | | | | Three Months Ended | | Six Months Ended |
| (MILLIONS OF DOLLARS) | | (MILLIONS OF DOLLARS) | | | | % Change(a) | | | | % Change(a) |
| PRODUCT | | | PRIMARY INDICATIONS OR CLASS | | July 2,
2017 |
| Total |
| | Oper. |
| July 2,
2017 |
| Total |
| | Oper. |
|
Peri-LOE Products(h) | | Peri-LOE Products(h) | | $ | 782 |
| | (30 | ) | | (27 | ) | | $ | 1,604 |
| | (27 | ) | | (25 | ) |
| Celebrex | | | Arthritis pain and inflammation, acute pain | | 178 |
| | (3 | ) | | — |
| | 353 |
| | (1 | ) | | 1 |
|
Lyrica EH(c) | | Epilepsy, neuropathic pain and generalized anxiety disorder | | 214 |
| | (31 | ) | | (31 | ) | | 431 |
| | (34 | ) | | (31 | ) | | Epilepsy, neuropathic pain and generalized anxiety disorder | | 154 |
| | (28 | ) | | (25 | ) | | 294 |
| | (32 | ) | | (29 | ) |
| Vfend | | | Fungal infections | | 101 |
| | (38 | ) | | (36 | ) | | 208 |
| | (35 | ) | | (33 | ) |
Viagra EH(d) | | | Erectile dysfunction | | 93 |
| | (7 | ) | | (3 | ) | | 183 |
| | (7 | ) | | (3 | ) |
| Pristiq | | Depression | | 194 |
| | 10 |
| | 11 |
| | 372 |
| | 10 |
| | 13 |
| | Depression | | 46 |
| | (76 | ) | | (76 | ) | | 161 |
| | (57 | ) | | (57 | ) |
| Celebrex | | Arthritis pain and inflammation, acute pain | | 183 |
| | (18 | ) | | (16 | ) | | 355 |
| | (17 | ) | | (12 | ) | |
| Vfend | | Fungal infections | | 162 |
| | — |
| | 2 |
| | 319 |
| | (8 | ) | | (3 | ) | |
| Zyvox | | Bacterial infections | | 114 |
| | (56 | ) | | (54 | ) | | 240 |
| | (55 | ) | | (50 | ) | | Bacterial infections | | 75 |
| | (34 | ) | | (32 | ) | | 152 |
| | (37 | ) | | (36 | ) |
Viagra EH(d) | | Erectile dysfunction | | 101 |
| | (11 | ) | | (6 | ) | | 197 |
| | (11 | ) | | (4 | ) | |
| Revatio | | Pulmonary arterial hypertension | | 74 |
| | 14 |
| | 13 |
| | 140 |
| | 10 |
| | 12 |
| | Pulmonary arterial hypertension | | 67 |
| | (10 | ) | | (9 | ) | | 131 |
| | (6 | ) | | (5 | ) |
| All Other Peri-LOE Products | | Various | | 69 |
| | (26 | ) | | (24 | ) | | 146 |
| | (27 | ) | | (22 | ) | |
Infusion Systems(k) | | Various | | $ | 295 |
| | * |
| | * |
| | $ | 599 |
| | * |
| | * |
| |
Biosimilars(l) | | Various | | $ | 78 |
| | * |
| | * |
| | $ | 145 |
| | * |
| | * |
| |
Pfizer CentreOne(m) | | $ | 196 |
| | 47 |
| | 48 |
| | $ | 384 |
| | 57 |
| | 60 |
| |
| All other Peri-LOE Products | | | Various | | 68 |
| | (2 | ) | | 2 |
| | 121 |
| | (17 | ) | | (14 | ) |
Biosimilars(i) | | | Various | | $ | 121 |
| | 55 |
| | 60 |
| | $ | 226 |
| | 56 |
| | 61 |
|
| Inflectra/Remsima | | | Inflammatory diseases | | 94 |
| | * |
| | * |
| | 172 |
| | * |
| | * |
|
| All other Biosimilars | | | Various | | 27 |
| | (18 | ) | | (15 | ) | | 54 |
| | (15 | ) | | (12 | ) |
Pfizer CentreOne(j) | | | | $ | 171 |
| | (13 | ) | | (12 | ) | | $ | 353 |
| | (8 | ) | | (8 | ) |
Hospira Infusion Systems (HIS)(k) | | | Various | | $ | — |
| | * |
| | * |
| | $ | 97 |
| | (84 | ) | | (84 | ) |
Total Lyrica(c) | | Epilepsy, post-herpetic neuralgia and diabetic peripheral neuropathy, fibromyalgia, neuropathic pain due to spinal cord injury | | $ | 1,261 |
| | 3 |
| | 4 |
| | $ | 2,490 |
| | 4 |
| | 6 |
| | Epilepsy, post-herpetic neuralgia and diabetic peripheral neuropathy, fibromyalgia, neuropathic pain due to spinal cord injury | | $ | 1,254 |
| | (1 | ) | | — |
| | $ | 2,526 |
| | 1 |
| | 2 |
|
Total Viagra(d) | | Erectile dysfunction | | $ | 401 |
| | (11 | ) | | (9 | ) | | $ | 796 |
| | (6 | ) | | (3 | ) | | Erectile dysfunction | | $ | 349 |
| | (13 | ) | | (12 | ) | | $ | 687 |
| | (14 | ) | | (13 | ) |
| Total Alliance revenues | | Various | | $ | 376 |
| | 21 |
| | 19 |
| | $ | 736 |
| | 38 |
| | 39 |
| | Various | | $ | 715 |
| | 90 |
| | 92 |
| | $ | 1,370 |
| | 86 |
| | 88 |
|
| |
(a) | As compared to the three and six months ended June 28, 2015.July 3, 2016. |
| |
(b) | The IH business, previously known as the Innovative Products business encompasses Internal Medicine, Vaccines, Oncology, Inflammation & Immunology, Rare Disease and Consumer Healthcare. Through December 31, 2016, includes Duavive/Duavee and Viviant (recorded in All other Internal Medicine in 2016), which were transferred from Innovative Health to Essential Health effective January 1, 2017 (recorded in All other LEP (EH) beginning January 1, 2017), in order to align these products with our management of the women’s health portfolio within EH. |
| |
(c) | Lyrica revenues from all of Europe, Russia, Turkey, Israel and Central Asia countries are included in Lyrica EH. All other Lyrica revenues are included in Lyrica IH. Total Lyrica revenues represent the aggregate of worldwide revenues from Lyrica IH and Lyrica EH. |
| |
(d) | Viagra revenues from the U.S. and Canada are included in Viagra IH. All other Viagra revenues are included in Viagra EH. Total Viagra revenues represent the aggregate of worldwide revenues from Viagra IH and Viagra EH. |
| |
(e) | Includes Eliquis (2016 and 2015) and Rebif (2015 only). |
| |
(f)
| The EH business, previously known as the Established Products business encompasses Legacy Established Products, Sterile Injectable Pharmaceuticals, Peri-LOE Products, Infusion Systems,HIS (through February 2, 2017), Biosimilars and Pfizer CentreOne and includes all legacy Hospira commercial operations. For additional information about changes impacting Essential Health, see Notes to Condensed Consolidated Financial Statements––Note 13A. Segment, Geographic and Other Revenue Information: Segment Information. |
| |
(g)(f)
| Legacy Established Products primarily include products that have lost patent protection (excluding Sterile Injectable Pharmaceuticals and Peri-LOE Products). Effective January 1, 2017, All other LEP includes Duavive/Duavee and Viviant, which were transferred from Innovative Health (recorded in All other Internal Medicine (IH) in 2016), in order to align these products with our management of the women’s health portfolio within EH. See note (b) above. |
| |
(h)(g)
| Prior period revenues for Medrol and Zithromax/Zmax may not agree to previously-disclosed revenues because revenues for those products are now split between the Legacy Established Products and the Sterile Injectable Pharmaceuticals categories. |
| |
(i)
| Sterile Injectable Pharmaceuticals include generic injectables and proprietary specialty injectables (excluding Peri-LOE Products). |
| |
(j)(h)
| Peri-LOE Products include products that have recently lost or are anticipated to soon lose patent protection. These products primarily includeinclude: Lyrica in certain developed Europe, markets, Pristiq globally, Celebrex, ZyvoxRussia, Turkey, Israel and Revatio in most developed markets, Vfend andCentral Asia; Viagra in certain developed Europe marketsall countries (excluding the U.S. and Japan,Canada); and Inspra in the EU.worldwide revenues for Celebrex, Pristiq, Zyvox, Vfend, Revatio and Inspra. |
| |
(i) | Biosimilars include Inflectra/Remsima (biosimilar infliximab) in the U.S. and certain international markets, Nivestim (biosimilar filgrastim) in certain European, Asian and Africa/Middle Eastern markets and Retacrit (biosimilar epoetin zeta) in certain European and Africa/Middle Eastern markets. |
| |
(j) | Pfizer CentreOne includes revenues from our contract manufacturing and active pharmaceutical ingredient sales operation, including sterile injectables contract manufacturing, and revenues related to our manufacturing and supply agreements, including with Zoetis. |
| |
(k) | Infusion Systems includeHIS (through February 2, 2017) includes Medication Management Systems products composed of infusion pumps and related software and services, as well as I.V.IV Infusion Products, including large volume I.V.IV solutions and their associated administration sets. |
| |
(l)
| Biosimilars include Inflectra (biosimilar infliximab) in certain European markets, Nivestim (biosimilar filgrastim) in certain Asian markets and Retacrit (biosimilar epoetin zeta) in certain international markets. |
| |
(m)
| Pfizer CentreOne (previously known as Pfizer CentreSource or PCS) includes (i) revenues from legacy Pfizer's contract manufacturing and active pharmaceutical ingredient sales operation, including revenues related to our manufacturing and supply agreements with Zoetis; and (ii) revenues from legacy Hospira’s One-2-One sterile injectables contract manufacturing operation. For additional information, see Notes to Condensed Consolidated Financial Statements––Note 13A. Segment, Geographic and Other Revenue Information: Segment Information.
|
| |
| * | CalculationIndicates calculation not meaningful.meaningful or greater than 100%. |
Amounts may not add due to rounding. All percentages have been calculated using unrounded amounts.
Revenues––Selected Product DescriptionsDiscussion
All products have been impacted to some extent byThe information included in “Revenues—Selected Product Discussion” below should be read in conjunction with the number of selling daysrevenue information included in the first six months of 2016 compared to the first six months of 2015; the first six months of 2016 had four additional selling days in the U.S. and international markets.“Revenues—Major Products” section.
| |
| • | Prevnar 13/Prevenar 13 (IH) worldwide revenues decreased operationally in the second quarter and first six months of 2017, compared to the same periods in 2016. Foreign exchange had an unfavorable impact on worldwide revenues in both the second quarter and first six months of 2017, compared to the same periods in 2016. |
Prevnar/Prevenar 13 (IH)isour pneumococcal conjugate vaccine for the prevention of pneumococcal disease. Overall, worldwide revenues for Prevnar/Prevenar 13 decreased 15% operationally in the second quarter of 2016, and were relatively flat operationally in the first six months of 2016, compared to the same periods in 2015. Foreign exchange had an unfavorable impact on worldwide revenues of 1% in the second quarter, and 2% in the first six months of 2016, compared to the same periods in 2015.
In the U.S., revenues for Prevnar 13 decreased 13%16% in the second quarter of 2016,2017, compared to the same period in 2015,2016, primarily due to the expectedunfavorable timing of government purchases for the pediatric indication and the continued decline in revenues for Prevenar 13 for adultsthe adult indication in the U.S. due to a high initial capture rate of the eligible population following its successful fourth-quarter 2014 launch, which resulted in a smaller remaining “catch up” opportunity compared to the prior-year quarter. Revenues in the U.S. increased 4% in the first six months of 2016, compared to the same period in 2015, primarily driven by the timing of government purchases for the pediatric indication and price increases in both the public and private markets partially offset by the aforementioned decline of the “catch up” opportunity compared to the same period in 2015. We believe the “catch-up” opportunity (i.e., the opportunity to reach adults agedage 65 and older who have not been previously vaccinated with Prevnar 13) in adultscompared to the prior-year quarter. Given the success since the launch of the adult indication, approximately 52% of the eligible patient pool 65 years and above in the U.S. will continue to be large given current demographics and aging trends. However,has already been vaccinated. While the remaining eligible population of adults aged 65 years and older will require additional effortis large, this cohort is much more difficult to capture. As a result,In the U.S., revenues for Prevnar 13 decreased 12% in the first six months of 2017, compared to the same period in 2016, primarily due to the aforementioned smaller remaining “catch up” opportunity will diminish over time as this “catch-up” opportunity becomes fully realized.for the adult indication compared to the same period in 2016, and the unfavorable timing of government purchases for the pediatric indication.
Internationally, revenues for Prevenar 13 decreased 19%increased 8% operationally in the second quarter of 2016,2017 and 5%2% operationally in the first six months of 2016,2017, compared to the same periods in 2015, driven by2016, primarily due to the favorable timing of orders from Gavi, the Vaccine Alliance, as well asgovernment purchases in certain emerging markets.markets for the pediatric indication. Foreign exchange had an unfavorable impact on international revenues of 2% in the second quarter of 2016, and 5% in the first six months of 2016,2017, compared to the same periods in 2015.2016.
In 2014, the ACIP voted to recommend Prevnar 13 for routine use to help protect adults aged 65 years and older against pneumococcal disease, which for adults includes pneumonia caused by the 13 pneumococcal serotypes included in the vaccine.
These ACIP recommendations were subsequently approved by the directors at the CDC and U.S. Department of Health and Human Services, and were published in the Morbidity and Mortality Weekly Report in September 2014 by the CDC. As with other vaccines, the CDC regularly monitors the impact of vaccination and reviews the recommendations; in this case, however, the CDC announced formally that it will conduct this review in 2018. A potential adverse change in the ACIP recommendation could negatively impact future Prevnar 13 revenues. Currently, we are working with a number of U.S. investigators to monitor the proportion of community-acquired pneumonia caused by the serotypes included in Prevnar 13 and continue to observe trends.
| |
| • | Lyrica (EH (revenues from all of Europe, Russia, Turkey, Israel and Central Asia)/IH (revenues from all other geographies)) worldwide revenues were relatively flat operationally in the second quarter of 2017 and increased operationally in the first six months of 2017, compared to the same periods in 2016. Foreign exchange had an unfavorable impact on worldwide revenues in the second quarter and first six months of 2017 compared to the same periods in 2016. |
In July 2016, the FDA approved an expanded age indication to include adults 18 through 49 yearsU.S., revenues increased 6% in the second quarter of age,2017 and 10% in additionthe first six months of 2017, compared to the already approved indications for adults 50 yearssame periods in 2016, driven by sustained demand and older, for active immunization for the prevention of pneumonia and invasive disease caused by 13 Streptococcus pneumoniae (S. pneumoniae) serotypes (1, 3, 4, 5, 6A, 6B, 7F, 9V, 14, 18C, 19A, 19F, and 23F), and for children 6 weeks through 17 years of age (prior to the 18th birthday) for the prevention of invasive disease caused by the 13 Streptococcus pneumoniae strains in the vaccine. Prevenar 13 is now approved in the U.S., the EU and 44 other countries for use in adults 18 to 49 years of age. Prevnar 13 is the only pneumococcal vaccine approved across the entire lifespan.positive price impact.
In April 2016, the EMA approved a new 4-dose, MDV presentation for Prevenar 13. In addition, in July 2016, we received the World Health Organization prequalification approval for the Prevenar 13 MDV presentation. This MDV presentation is expected to be introduced under the Advance Market Commitment program in early 2017, for shipment to countries covered by Gavi, the Vaccine Alliance. This new presentation will help to significantly reduce storage requirements and shipping costs in Gavi eligible countries.
Internationally, Lyrica (EH (revenues from all of Europe, Russia, Turkey, Israel and Central Asia)/IH (revenues from all other geographies)) is indicated in the U.S. for three neuropathic pain conditions, fibromyalgia and adjunctive therapy for adult patients with partial onset seizures. In certain markets outside the U.S., indications include neuropathic pain (peripheral and central), fibromyalgia, adjunctive treatment of epilepsy and generalized anxiety disorder. Worldwide revenues for Lyrica increased 4%decreased 9% operationally in the second quarter of 2016,2017 and 6%11% operationally in the first six months of 2016,2017, compared to the same periods in 2015. Foreign exchange had an unfavorable impact on worldwide revenues of 1% in the second quarter of 2016 and 2% in the first six months of 2016, compared to the same periods in 2015.
In the U.S., revenues increased 21% in the second quarter of 2016, and 23% in the first six months of 2016, compared to the same periods in 2015, driven by volume growth and price increases.
Internationally, Lyrica revenues decreased 16% operationally in the second quarter of 2016, and 15% operationally in the first six months of 2016 compared to the same periods in 2015,primarily due to losses of exclusivity in developed Europe markets, partially offset by operational growth in certain markets, primarily in Japan. Foreign exchange had an unfavorable impact on international revenues of 1% in the second quarter of 2016, and 4% in the first six months of 2016, compared to the same periods in 2015.
Lyrica revenues in our IH segment increased 16% operationally in the second quarter of 2016, and 19% operationally in the first six months of 2016, compared to the same periods in 2015, and in our EH segment, revenues from Lyrica decreased 31% operationally in the second quarter of 2016, and 31% operationally in the first six months of 2016, compared to the same periods in 2015.
Enbrel (IH, outside the U.S. and Canada), indicated for the treatment of moderate-to-severe rheumatoid arthritis, polyarticular juvenile rheumatoid arthritis, psoriatic arthritis, plaque psoriasis, ankylosing spondylitis and nonradiographic axial spondyloarthritis, recorded a 3% operational decrease in worldwide revenues, excluding the U.S. and Canada, in the second quarter of 2016, compared to the same period in 2015, primarily due to the impact of the entrance of the first etanercept biosimilar as well as mandated price reductions across certain markets in Europe. Worldwide revenues, excluding the U.S. and Canada, increased 3% operationally in the first six months of 2016, compared to the same period in 2015. Results for the first six months of 2016 were favorably impacted by stronger demand and price increases in emerging markets, specifically in Latin America. Foreign exchange had an unfavorable impact on revenues of 4% in the second quarter of 2016, and 8% in the first six months of 2016, compared to the same periods in 2015.
Ibrance (IH) has been approved and launched in the U.S., and certain international markets as a treatment for a certain form of advanced breast cancer. Ibrance recorded worldwide revenues of $514 million in the second quarter of 2016, and $942 million in the first six months of 2016, nearly all of which were recorded in the U.S.
Lipitor (EH) is indicated for the treatment of elevated LDL-cholesterol levels in the blood. Lipitor faces generic competition in all major developed markets. Branded Lipitor recorded worldwide revenues of $461 million, or a 2% operational decrease in the second quarter of 2016, and $872 million in the first six months of 2016, or relatively flat operationally, compared to the same periods in 2015. Foreign exchange had an unfavorable impact on worldwide revenues of 7% in the second quarter of 2016, and 8% in the first six months of 2016, compared to the same periods in 2015.
In the U.S., revenues increased 11% in the second quarter of 2016 and 8% in the first six months of 2016, compared to the same periods in 2015, due to favorable pricing and lower sales allowances.
In our international markets, revenues decreased 3% operationally in the second quarter of 2016, compared to the same period in 2015 driven by lower volume in certain emerging markets, primarily in the Middle East, and in developed international markets, and pricing pressures in China, partially offset by strong volume growth in China. Revenues in international markets were relatively flat operationally in the first six months of 2016, compared to the same period in 2015, primarily due to volume growth
in China offset by pricing pressures in international markets. Foreign exchange had an unfavorable impact on international revenues of 8% in the second quarter of 2016, and 9% in the first six months of 2016,2017, compared to the same periods in 2015.2016.
Viagra (Lyrica revenues in our IH (U.S. and Canada revenues)/EH (all other revenues excluding U.S. and Canada)) isindicated for the treatment of erectile dysfunction. Viagra worldwide revenues decreased 9%segment increased operationally in the second quarter of 2016, and 3% operationally in the first six months of 2016,2017, compared to the same periods in 2015,2016, primarily driven by sustained demand and positive price impact in the U.S. Foreign exchange had a de minimis impact on Lyrica IH revenues in the second quarter and first six months of 2017, compared to the same periods in 2016. In our EH segment, worldwide revenues from Lyrica decreased operationally in the second quarter and first six months of 2017, compared to the same periods in 2016, due to new access constraints and increased rebates.losses of exclusivity in developed Europe markets. Foreign exchange had an unfavorable impact on Lyrica EH worldwide revenues of 1% in the second quarter of 2016, and 2% in the first six months of 2016,2017, compared to the same periods in 2015. Revenues in the U.S. decreased 10%2016.
| |
| • | Ibrance (IH) worldwide revenues increased operationally in the second quarter and first six months of 2017, compared to the same periods in 2016, most of which were recorded in the U.S. The significant revenue growth reflects our scientific/clinical data, continued positive patient experience as well as Ibrance being the first (in the U.S.) and only (in major markets outside of the U.S.) registered product in this class of medicines. Foreign exchange had an unfavorable impact on worldwide revenues in the second quarter of 2017 and had a de minimis impact in the first six months of 2017, compared to the same periods in 2016. |
| |
| • | Enbrel (IH, outside the U.S. and Canada) worldwide revenues, excluding the U.S. and Canada, decreased operationally in the second quarter and first six months of 2017, compared to the same periods in 2016, primarily due to on-going biosimilar competition, which is expected to continue. Foreign exchange had an unfavorable impact on worldwide revenues in the second quarter and first six months of 2017, compared to the same periods in 2016. |
| |
| • | Lipitor (EH) worldwide revenues were flat operationally in the second quarter of 2017 and increased operationally in the first six months of 2017, compared to the same periods in 2016. Foreign exchange had an unfavorable impact on worldwide revenues in the second quarter and first six months of 2017, compared to the same periods in 2016. In the U.S., revenues decreased 21% in the second quarter of 2017 and 24% in the first six months of 2017, compared to the same periods in 2016, primarily due to lower volumes. |
In our international markets, revenues increased 2% operationally in the second quarter of 2016,2017 and 3%4% operationally in the first six months of 2016,2017, compared to the same periods in 2015, primarily reflecting new access constraints, lower patient2016, driven by strong demand and higher rebates,in China, partially offset by price increases, wholesaler buying patternslower volumes in Japan and increased pill quantity per prescription.certain Middle Eastern markets, as well as pricing pressures in China. Foreign exchange had an unfavorable impact on international revenues in the second quarter of 2017 and first six months of 2017, compared to the same periods in 2016.
| |
| • | Viagra (IH (U.S. and Canada revenues)/EH (all other revenues excluding U.S. and Canada)) worldwide revenues decreased operationally in the second quarter and first six months of 2017, compared to the same periods in 2016, primarily due to lower market demand. Foreign exchange had an unfavorable impact on worldwide revenues in the second quarter and first six months of 2017, compared to the same periods in 2016. |
Revenues in the U.S. decreased 15% in the second quarter of 2017 and 16% in the first six months of 2017, compared to the same periods in 2016, primarily due to lower market demand. International revenues decreased 5%3% operationally in the second quarter of 2017, compared to the same period in 2016 and, primarily from price reductions in China. International revenues decreased 4%3% operationally in the first six months of 2016,2017, compared to the same periodsperiod in 2015,2016, primarily from lower volumes and price reductions in China, andpartially offset by increased demand in developed internationalcertain Middle Eastern markets. Foreign exchange had an unfavorable impact on international revenues of 5% in the second quarter of 2016, and 7% in the first six months of 2016,2017, compared to the same periods in 2015.2016.
| |
| • | Xeljanz (IH) worldwide revenues increased operationally in the second quarter and first six months of 2017, compared to the same periods in 2016. In the U.S., Xeljanz revenues increased 53% in the second quarter of 2017 and 38% in the first six months of 2017, compared to the same periods in 2016, primarily driven by increased adoption among rheumatologists, growing awareness among patients and improvements in payer access. Foreign exchange had an unfavorable impact on worldwide revenues in the second quarter of 2017 and had a de minimis impact in the first six months of 2017, compared to the same periods in 2016. |
| |
| • | Sutent (IH) worldwide revenues were relatively flat operationally in the second quarter of 2017 and decreased operationally in the first six months of 2017, compared to the same periods in 2016. The decrease in the first six months of 2017 was primarily due to competitive pressure in the U.S. and Europe and cost containment measures in certain developed international markets. Foreign exchange had an unfavorable impact on worldwide revenues in the second quarter and first six months of 2017, compared to the same periods in 2016. |
| |
| • | Chantix/Champix (IH) worldwide revenues increased operationally in the second quarter and first six months of 2017, compared to the same periods in 2016. Foreign exchange had an unfavorable impact on worldwide revenues in the second quarter and first six months of 2017, compared to the same periods in 2016. |
ViagraIn the U.S., Chantix revenues increased 24% in our IH segmentthe second quarter of 2017 and 18% in the first six months of 2017, compared to the same periods in 2016 primarily due to increased promotional activities, educating health care providers on updates to the Chantix label, including removal of the boxed warning, the addition of EAGLES safety and efficacy data, improved patient access and positive price impact.
| |
| • | The Premarin family of products (EH) worldwide revenues decreased operationally in the second quarter and first six months of 2017, compared to the same periods in 2016. Revenues in the U.S. decreased 2% in the second quarter and 7% in the first six months of 2017, compared to the same periods in 2016, primarily driven by volume declines and lower market growth, mainly offset by a positive price impact. |
Internationally, Premarin revenues decreased 10%12% operationally in the second quarter of 2017, compared to the same period in 2016 and, primarily due to lower volume in Brazil. Internationally, Premarin revenues decreased 3%8% operationally in the first six months of 2017, compared to the same period in 2016, primarily due to lower volumes in Mexico and the U.K. Foreign exchange had a de minimis impact on international revenues in the second quarter of 2017 and had a favorable impact in the first six months of 2017, compared to the same periods in 2015,2016.
| |
| • | Norvasc (EH) worldwide revenues were relatively flat operationally in the second quarter and first six months of 2017, compared to the same periods in 2016. Results for the second quarter of 2017 were impacted by generic competition in Japan and pricing pressures in China, offset by strong demand in China and Middle Eastern markets. Results for the first six months of 2017 were impacted by generic competition in Japan and pricing pressures in China, offset by strong demand in China. Foreign exchange had an unfavorable impact on worldwide revenues in the second quarter and first six months of 2017, compared to the same periods in 2016. |
| |
| • | Celebrex (EH) worldwide revenues were relatively flat operationally in the second quarter of 2017 and increased operationally in the first six months of 2017, compared to the same periods in 2016. The increase in the first six months of 2017 was primarily driven by volume growth in emerging markets, primarily China and certain Middle Eastern markets, and favorable rebates in the U.S. This was partially offset by the loss of exclusivity and associated generic competition in the U.S. and most developed international markets. Foreign exchange had an unfavorable impact on worldwide revenues in the second quarter and first six months of 2017, compared to the same periods in 2016. |
| |
| • | BeneFIX and ReFacto AF/Xyntha (IH)––BeneFIX worldwide revenues decreased operationally in the second quarter and first six months of 2017, compared to the same periods in 2016, primarily as a result of erosion of market share in the U.S. and European countries due to increasing adoption of extended half-life treatment options as well as a price decrease in the U.K. Foreign exchange had an unfavorable impact on worldwide revenues in the second quarter and first six months of 2017, compared to the same periods in 2016. |
ReFacto AF/Xyntha worldwide revenues increased operationally in our EH segment, revenues from Viagra decreased 6% operationally inboth the second quarter of 2016, and decreased 4% operationally in the first six months of 2016,2017, compared to the same periods in 2015.
Sutent (IH) is indicated for the treatment of advanced renal cell carcinoma, including mRCC; GIST after disease progression on, or intolerance to, imatinib mesylate; and advanced pancreatic neuroendocrine tumor. Sutent worldwide revenues were relatively flat operationally in the second quarter of 2016 compared to the same period in 2015, primarily, largely due to price increases in the U.S., offset by competitive pressures and cost containment measures. Sutent worldwide revenues increased 10% operationally in the first six months of 2016, compared to the same period in 2015, primarily due to price increases in the U.S., as well as strongproduct demand primarily in emerging markets. Foreign exchange had an unfavorable impact on revenues of 2% in the second quarter of 2016, and 5% in the first six months of 2016, compared to the same periods in 2015.
Our Premarin family of products (EH) helps women address moderate-to-severe menopausal symptoms. Premarin worldwide revenues decreased 2% operationally in the second quarter of 2016, and increased 4% operationally in the first six months of 2016, compared to the same periods in 2015. Revenues in the U.S. decreased 2% in the second quarter of 2016compared to the same period in 2015, primarily driven by prescription volume declines and lower market growth, partially offset by favorable pricing. Revenues in the U.S. increased 5% in the first six months of 2016 compared to the same period in 2015, primarily driven by price increases, partially offset by prescription volume declines and lower market growth. Foreign exchange had an unfavorable impact on revenues of 1% in both the second quarter and the first six months of 2016, compared to the same periods in 2015.
Norvasc (EH) is indicated for the treatment of hypertension. Norvasc worldwide revenues decreased 2% operationally in the second quarter of 2016, and 1% operationally in the first six months of 2016, compared to the same periods in 2015. Results for the second quarter of 2016 were primarily impacted by generic erosion in Japan and declines in certain emerging markets, primarily in the Middle East, partially offset by strong demanddeclines in China. Results fordeveloped markets in Europe and the first six monthsU.S. primarily driven by increasing adoption of 2016 were primarily impacted by generic erosion in Japan, partially offset by strong demand in China. Foreign exchange had an unfavorable impact on revenues of 2% in the second quarter of 2016, and 4% in the first six months of 2016, compared to the same periods in 2015.
Chantix/Champix (IH) is approved as an aid to smoking-cessationextended half-life treatment in adults 18 years of age and older in multiple markets worldwide. Worldwide revenues increased 24% operationally in the second quarter of 2016, and 33% operationally in the first six months of 2016, compared to the same periods in 2015.options. Foreign exchange had an unfavorable impact on worldwide revenues of 1% in the second quarter of 2016, and 2% in the first six months of 2016,2017, compared to the same periods in 2015.2016.
| |
| • | Xalkori (IH) worldwide revenues increased operationally in the second quarter and first six months of 2017, compared to the same periods in 2016, as a result of a steady increase in diagnostic rates for the ALK gene mutation across key markets outside the U.S., which has led to more patients being treated. This increase was partially offset by volume declines in the U.S. and Japan due to competitive pressure, partially mitigated by the March 2016 FDA approval of the supplemental NDA to treat patients with metastatic NSCLC whose tumors are ROS1-positive. Foreign exchange had an unfavorable impact on worldwide revenues in the second quarter and first six months of 2017, compared to the same periods in 2016. |
| |
| • | Inlyta (IH) worldwide revenues decreased operationally in the second quarter and first six months of 2017, compared to the same periods in 2016, primarily due to increased competition in the U.S. and Europe, partially offset by performance in key emerging markets. Foreign exchange had an unfavorable impact on worldwide revenues in the second quarter and first six months of 2017, compared to the same periods in 2016. |
| |
| • | Inflectra/Remsima (EH) worldwide revenues increased operationally in the second quarter and first six months of 2017, compared to the same periods in 2016, due to continued uptake in developed markets in Europe, and the U.S. launch in the fourth quarter of 2016, partially offset by pricing pressures in Europe. Inflectra uptake in the U.S. is being driven by a number of factors including Inflectra’s clinical data package, patient support programs, price and the access/reimbursement environment. To date, reimbursement coverage has been mixed. While we achieved 100% Medicare coverage, we have experienced access challenges |
In the U.S., Chantix revenues increased 40% in the second quarter of 2016, and 51% in the first six months of 2016, comparedamong national commercial payers where our lower priced product has not received access at parity to the same periodsinnovator product and remains in 2015, primarily due to increased demand,a disadvantaged position despite recent price increases and wholesaler buying patterns.
Internationally, Champix revenues decreased 1% operationally in the second quarter of 2016, compared to the same period in 2015, primarily due to prescription market contraction due to electronic cigarette uptake in the U.K. and the timing of government purchases in Turkey, partially offset by demand in South Korea driven by reforms to the government sponsored smoking cessation subsidy program. Internationally, Champix revenues increased 5% operationally in the first six months of 2016, compared to the same period in 2015, primarily due to growth in South Korea (driven by reforms to the government sponsored smoking cessation subsidy program), Spain and the Netherlands. Foreign exchange had an unfavorable impact on international revenues of 3% in the second quarter of 2016, and 6% in the first six months of 2016, compared to the same periods in 2015.
Xeljanz (IH) is approved for use as a second-line therapy for the treatment of adult patients with moderate to severe active rheumatoid arthritis who have had an inadequate response or intolerance to methotrexate and is available in more than 45 markets including the U.S., Japan, Australia, Canada, Switzerland and Brazil. Xeljanz worldwide revenues increased 72% operationally in the second quarter of 2016, and 87% operationally in the first six months of 2016, compared to the same periods in 2015. In the U.S., Xeljanz revenues increased 63% in the second quarter of 2016, and 78% in the first six months of 2016, compared to the same periods in 2015, driven by increased adoption among rheumatologists and growing awareness among patients as well as price increases. Foreign exchange had a 2% unfavorable impact on revenues in both the second quarter and in the first six months of 2016, compared to the same periods in 2015.
Pristiq (EH) is indicated for the treatment of major depressive disorder in the U.S. and in various other countries. Pristiq has also been indicated for treatment of moderate-to-severe vasomotor symptoms associated with menopause in certain international markets. Worldwide revenues for Pristiq increased 11% operationally in the second quarter of 2016, and increased 13% operationally in the first six months of 2016, compared to the same periods in 2015, primarily due to growth in the U.S. driven by favorable pricing and increased demand. Foreign exchange had an unfavorable impact on revenues of 2% in the second quarter of 2016, and 3% in the first six months of 2016, compared to the same periods in 2015.
BeneFIX and ReFacto AF/Xyntha (IH) are recombinant hemophilia products that assist patients with their lifelong hemophilia bleeding disorders. BeneFIX worldwide revenues decreased 5% operationally in the second quarter of 2016, compared to the same period in 2015, primarily as a result of erosion of market share in the U.S. due to the launch of new extended half-life treatment options. BeneFIX worldwide revenues increased 3% operationally in the first six months of 2016, compared to the same period in 2015, primarily as a result of higher product demand in Europe. Foreign exchange had an unfavorable impact on revenues of 1% in the second quarter of 2016 and 3% in the first six months of 2016, compared to the same periods in 2015.
ReFacto AF/Xyntha recorded a 1% operational decrease in worldwide revenues in the second quarter of 2016, compared to the same period in 2015, due to launch of new extended half-life treatment options and changes in purchasing patterns in the U.S. ReFacto AF/Xyntha recorded a 6% operational increase in the first six months of 2016, compared to the same period in 2015, largely due to product demand across Europe and certain other international markets. Foreign exchange had an unfavorable impact on revenues of 1% in the second quarter of 2016, and 4% in the first six months of 2016, compared to the same periods in 2015.
Celebrex (EH) is indicated for the treatment of the signs and symptoms of osteoarthritis and rheumatoid arthritis worldwide and for the management of acute pain in adults in the U.S., Japan and certain other markets. Celebrex recorded a 16% operational decrease in worldwide revenues in the second quarter of 2016, and a 12% operational decrease in worldwide revenues in the first six months of 2016, compared to the same periods in 2015, primarily driventaken by the loss of exclusivity and associated generic competition in the U.S. and most developed international markets, partially offset by growth in China and other emerging markets. Foreign exchange had an unfavorable impact on worldwide revenues of 2% in the second quarter of 2016, and 5% in the first six months of 2016, comparedinnovator product. We will look at all relevant factors impacting reimbursement given our extensive experience working with commercial payers to the same periods in 2015.
Internationally, Celebrex revenues decreased 5% operationally in the second quarter of 2016, and 9% operationally in the first six months of 2016, compared to the same periods in 2015, driven by the loss of exclusivity and launch of multi-source generic competition in most developed markets partially offset by volume growth in China and other emerging markets. Foreign exchange had an unfavorable impact on international revenues of 2% in the second quarter of 2016, and 6% in the first six months of 2016, compared to the same periods in 2015.
Xalkori (IH) is indicated for the treatment of patients with locally advanced or metastatic NSCLC that is ALK-positive or ROS1-positive. Xalkori worldwide revenues increased 15% operationally in the second quarter of 2016, and 22% operationally in the first six months of 2016, compared to the same periods in 2015, as a result of a steady increase in diagnostic rates for the ALK gene mutation across key markets, which has led to more patients being treated, and price increase in the U.S. Foreign exchange had an unfavorable impact on revenues of 3% in the first six months of 2016, compared to the same period in 2015.
Zyvox (EH) is used to treat serious Gram-positive pathogens, including methicillin-resistant staphylococcus-aureus. Zyvox worldwide revenues decreased 54% operationally in the second quarter of 2016, and 50% operationally in the first six months of 2016, compared to the same periods in 2015, due to generic competition in the U.S. and developed international markets and corresponding pricing pressures, as well as lower volumes in emerging markets, primarily China and Latin America. Foreign exchange had an unfavorable impact on revenues of 2% in the second quarter of 2016, and 4% in the first six months of 2016, compared to the same periods in 2015.
Inlyta (IH) is indicated for the treatment of patients with advanced RCC after failure of a prior systemic treatment. Worldwide revenues decreased 3% operationally in the second quarter of 2016, compared to the same period in 2015, primarily due to increased competition due to new entrants in the second line market primarily in the U.S., offsetting the growth in other markets, particularly in Japan and Argentina as well as in China following the launch in the third quarter of 2015. Worldwide revenues increased 3% operationally in the first six months of 2016, compared to the same period in 2015, primarily due to increased demand across key international markets withenable greater access and reimbursement, particularly in Europe and emerging markets, mainly in Argentina as well as in China following the launch in the third quarter of 2015, partially offset by a decrease in the U.S. due to increased competition due to new entrants in the second line market. Foreign exchange had an unfavorable impact on revenues of 2% in the first six months of 2016, compared to the same period in 2015.for Inflectra.
Alliance revenues (IH/EH) increased 19% operationally in the second quarter of 2016, and 39% operationally in the first six months of 2016, compared to the same periods in 2015, mainly due to:
| |
| • | Pristiq (EH) worldwide revenues decreased operationally in the second quarter and first six months of 2017, compared to the same periods in 2016, primarily due to loss of exclusivity in the U.S. in March 2017 resulting in significant generic competition. Foreign exchange had a de minimis impact on worldwide revenues in the second quarter and first six months of 2017, compared to the same periods in 2016. |
| |
| • | Zyvox (EH) worldwide revenues decreased operationally in the second quarter and first six months of 2017, compared to the same periods in 2016, due to generic competition in developed international markets and the U.S. and corresponding pricing pressures, partially offset by strong volume growth in China. Foreign exchange had an unfavorable impact on worldwide revenues in the second quarter and first six months of 2017, compared to the same periods in 2016. |
| |
| • | Eucrisa (IH) is approved in the U.S. for the treatment of mild to moderate atopic dermatitis for patients two years of age and older. The FDA approved Eucrisa on December 14, 2016, and Eucrisa was launched in the U.S. late in the first quarter of 2017. Eucrisa is a novel non-steroidal topical ointment and is the first topical prescription treatment for atopic dermatitis approved in over 10 years. While there was solid uptake in the demand for Eucrisa and sequential prescription demand increased, net revenues have not followed the same pattern of growth. We expect this will normalize with net revenue sequential growth in the third quarter of 2017. |
| |
| • | Alliance revenues (IH/EH) increased operationally in the second quarter and first six months of 2017, compared to the same periods in 2016, mainly due to: |
| |
| ◦ | an increase in Eliquis alliance revenues due to higher demand resulting from increased market share, |
partially offset by:
| |
◦ | the expiration at the endpenetration of 2015 of the collaboration agreement to co-promote Rebif in the U.S., which resulted in a decrease of approximately $90 million in the second quarter of 2016,novel oral anticoagulants and approximately $140 million in the first six months of 2016, compared to the same periods in 2015.
|
Foreign exchange had a favorable impact on alliance revenues of 2% in the second quarter of 2016, and an unfavorable impact on alliance revenues of 1% in the first six months of 2016, compared to the same periods in 2015.
Eliquis (apixaban) (IH) is being jointly developed and commercialized by Pfizer and BMS. The two companies share commercialization expenses and profit/losses equally on a global basis. In April 2015, we signed an agreement with BMS to transfer full commercialization rights in certain smaller markets to us, beginning in the third quarter of 2015. BMS supplies the product to us at cost plus a percentage of the net sales to end-customers in these markets. Eliquis is part of the NOAC market; the agents in this class were developed as alternative treatment options to warfarin in appropriate patients. Eliquis (apixaban) is approved for multiple indications in major markets around the world:
| |
◦ | to reduce the risk of stroke and systemic embolism in patients with nonvalvular atrial fibrillation; |
| |
◦ | for the treatment of DVT and PE, and for the reduction in the risk of recurrent DVT and PE following initial therapy;market share gains; and |
| |
| ◦ | for the prophylaxisinclusion of DVT, which may lead to PE,Xtandi alliance revenues of $141 million in patients who have undergone hip or knee replacement surgery.the second quarter of 2017 and $272 million in the first six months of 2017 in the U.S. resulting from the September 2016 acquisition of Medivation. |
The NOAC class penetration continues to expand across key markets. Eliquis has become the most prescribed oral anticoagulant in new-to-brand prescriptions among cardiologistsForeign exchange had an unfavorable impact on alliance revenues in the U.S.second quarter and first six months of 2017, Japan, and several other key markets.compared to the same periods in 2016.
| |
| ◦ | Eliquis (IH) has been jointly developed and is commercialized by Pfizer and BMS. Pfizer funds between 50% and 60% of all development costs depending on the study. Profits and losses are shared equally on a global basis, except in certain countries where Pfizer commercializes Eliquis and pays BMS compensation based on a percentage of net sales. We have full commercialization rights in certain smaller markets, beginning in the third quarter of 2015. BMS supplies the product to us at cost plus a percentage of the net sales to end-customers in these markets. Eliquis is part of the Novel Oral Anticoagulant (NOAC) market; the agents in this class were developed as alternative treatment options to warfarin in appropriate patients. |
| |
| ◦ | Xtandi (IH) is being developed and commercialized through a collaboration with Astellas. The two companies share equally in the gross profits (losses) related to U.S. net sales of Xtandi. Subject to certain exceptions, Pfizer and Astellas also share equally all Xtandi commercialization costs attributable to the U.S. market. Pfizer and Astellas also share certain development and other collaboration expenses and Pfizer receives tiered royalties as a percentage of international Xtandi net sales (recorded in Other (income)/deductions—net). While there has been some displacement in Xtandi revenues relative to demand growth in the U.S., reflecting an increase in utilization of patient assistance programs which provide free medicines to patients, we expect patient assistance program utilization as a percentage of total demand to normalize as we move into next year. |
See the “Our Operating Environment—Intellectual Property Rights and Collaboration/Licensing Rights”“Analysis of the Consolidated Statements of Income—Revenues—Selected Product Descriptions” section of our 20152016 Financial Report for additional information regarding the expirationprimary indications or class of various contract rights relating to Enbrel and Rebif.the selected products discussed above.
See Notes to Condensed Consolidated Financial Statements—Note 12.Commitments and Contingencies for a discussion of recent developments concerning patent and product litigation relating to certain of the products discussed above.
Product Developments—Biopharmaceutical
We continue to invest in R&D to provide potential future sources of revenues through the development of new products, as well as through additional uses for in-line and alliance products. Notwithstanding our efforts, there are no assurances as to when, or if, we will receive regulatory approval for additional indications for existing products or any of our other products in development.
We continue to strengthen our global R&D organization and pursue strategies intended to improve innovation and overall productivity in R&D to achieve a sustainable pipeline that will deliver value in the near term and over time. Our R&D priorities include include:
delivering a pipeline of differentiated therapies with the greatest scientific and commercial promise, promise;
innovating new capabilities that can position Pfizer for long-term leadershipleadership; and
creating new models for biomedical collaboration that will expedite the pace of innovation and productivity. To that end, our research
Our R&D primarily focuses on six high-priority areas that have a mix of small moleculeson:
Biosimilars;
Inflammation and large molecules—immunologyImmunology;
Metabolic Disease and inflammation; cardiovascularCardiovascular Risks;
Neuroscience;
Oncology
Rare Diseases; and metabolic diseases; oncology; vaccines; neuroscience and pain; and rare diseases. Another area of focus is biosimilars, which are being developed by our newly formed EH R&D organization.
Vaccines.
For additional information about our R&D organization, including the new EH R&D organization, see the “Overview of Our Performance, Operating Environment, Strategy and Outlook—Our Strategy—CommercialDescription of Research and Development Operations” section of this MD&A.
A comprehensive update of Pfizer’s development pipeline was published on August 2, 20161, 2017 and is available at www.pfizer.com/pipeline.science/drug-product-pipeline. It includes an overview of our research and a list of compounds in development with targeted indication and phase of development, as well as mechanism of action for some candidates in Phase 1 and all candidates from Phase 2 through registration.
The following series of tables provides information about significant regulatory actions by, and filings pending with, the FDA and regulatory authorities in the EU and Japan, as well as additional indications and new drug candidates in late-stage development.
|
| | |
| RECENT FDA APPROVALS |
| PRODUCT | INDICATION | DATE APPROVED |
Xalkori (Crizotinib)Bavencio (avelumab) | Treatment for patients with locally advanced or metastatic urothelial carcinoma with disease progression on or after platinum-based therapy, which is being developed in collaboration with Merck KGaA, Germany | May 2017 |
| Bavencio (avelumab) | Treatment of adults and pediatric patients 12 years and older with ROS1-positive metastatic non-smallMerkel cell lung cancercarcinoma, which is being developed in collaboration with Merck KGaA, Germany | March 20162017 |
Xeljanz (Tofacitinib)Eucrisa (crisaborole) | Extended-release 11mg tabletsA non-steroidal topical anti-inflammatory PDE-4 inhibitor for the once-daily treatment of moderate to severe rheumatoid arthritis in patients who have had an inadequate response or intolerance to methotrexatemild-to-moderate atopic dermatitis | FebruaryDecember 2016 |
Ibrance (Palbociclib) | Treatment of HR+, HER2- advanced or metastatic breast cancer in combination with fulvestrant in women with disease progression following endocrine therapy | February 2016 |
|
| | |
| PENDING U.S. NDAs AND SUPPLEMENTAL FILINGS |
| PRODUCT | PROPOSED INDICATION | DATE FILED* |
Crisaborole (PF-06930164)Xeljanz (tofacitinib) | A non-steroidal topical anti-inflammatory PDE-4 inhibitor for theTreatment of adult patients with moderately to severely active ulcerative colitis | July 2017 |
| Sutent (sunitinib) | Adjuvant treatment in adult patients at high risk of mild-to-moderate atopic dermatitisrecurrent renal cell carcinoma following nephrectomy | March 2016May 2017 |
ALO-02 (oxycodone HCI/ naltrexone/HCI)Xeljanz (tofacitinib)(a)
| Treatment of adult patients with active psoriatic arthritis | May 2017 |
PF-06438179(b) | A Mu-type opioid receptor agonist for the managementpotential biosimilar to Remicade® (infliximab) | April 2017 |
| ertugliflozin | Treatment of pain severe enoughtype 2 diabetes, which is being developed in collaboration with Merck | March 2017 |
| inotuzumab ozogamicin | Treatment of acute lymphoblastic leukemia | February 2017 |
| Lyrica (pregabalin) | Controlled Release (once-a-day) dosing | February 2017 |
Mylotarg (gemtuzumab ozogamicin)(c) | Treatment of acute myeloid leukemia | January 2017 |
Retacrit(d) | A potential biosimilar to require daily, around-the-clock, long-term opioid treatmentEpogen® and for which alternative treatment options are inadequateProcrit® (epotein alfa) | February 2015 |
Retacrittafamidis meglumine(b)(e)
| A potential biosimilar to Epogen® and Procrit® (epotein alfa) | February 2015 |
Tafamidis meglumine(c)
| Treatment of transthyretin familial amyloid polyneuropathy | February 2012 |
| |
| * | The dates set forth in this column are the dates on which the FDA accepted our submissions. |
| |
(a) | In June 2016,August 2017, the FDA’s Anesthetic and Analgesic Drug Products Advisory Committee and Drug Safety and Risk ManagementArthritis Advisory Committee voted in favor often to one to recommend approval of ALO-02 for “managementthe proposed dose of pain severe enough to require daily, around-the-clock, long-term opioid treatment and for which alternative options are inadequate.” The Committees recommended the inclusion of abuse-deterrent labeling for intranasal and intravenous routes of abuse, but voted against inclusion of abuse-deterrent labelingtofacitinib for the oral route. The FDA will take the Committees’ recommendations into consideration before taking action on the ALO-02 NDA.treatment of adult patients with active psoriatic arthritis. |
| |
(b) | Epogen®Remicade® is a registered trademark of Janssen. In February 2016, we divested the rights for development and commercialization of PF-06438179, a potential biosimilar to Remicade® (infliximab) in the 28 countries that form the EEA to Sandoz, which was a condition to the European Commission’s approval of the Hospira transaction. We retain commercialization rights to PF-06438179 in all countries outside of the EEA. |
| |
(c) | In July 2017, the FDA’s Oncologic Drugs Advisory Committee (ODAC) voted six to one that Mylotarg in combination with chemotherapy has a favorable risk:benefit profile for patients with newly-diagnosed CD33-positive acute myeloid leukemia. |
| |
(d) | Epogen® is a registered U.S. trademark of Amgen Inc.; Procrit®Procrit® is a registered U.S. trademark of Johnson & Johnson. In October 2015, we received a “complete response” letter from the FDA with respect to our biologics license application (BLA) for Retacrit, our proposed biosimilar to epoetin alfa, which was submitted for all indications of the reference product. We are working diligently to addressIn December 2016, we completed the contentresubmission of the BLA to the FDA for Retacrit in response to the “complete response” letter. In May 2017, the FDA’s ODAC voted to recommend Retacrit for approval. In June 2017, we received a “complete response” letter from the FDA, relating to matters noted in a Warning Letter issued in February 2017 following a routine inspection of the company’s facility in McPherson, Kansas in 2016. This facility was listed as the potential manufacturing site in the BLA for the proposed epoetin alfa biosimilar. The issues noted in the Warning Letter do not relate specifically to the manufacture of epoetin alfa. No additional clinical data was requested at this time and we continue to work closely with the FDA on next steps. |
| |
(c)(e)
| In May 2012, the FDA’s Peripheral and Central Nervous System Drugs Advisory Committee voted that the tafamidis meglumine data provide substantial evidence of efficacy for a surrogate endpoint that is reasonably likely to predict a clinical benefit. In June 2012, the FDA issued a “complete response” letter with respect to the tafamidis NDA. The FDA has requested the completion of a second efficacy study, and also has asked for additional information on the data within the current tafamidis NDA. Pfizer initiated study B3461028 in December 2013, a global Phase 3 study to support a potential new indication in transthyretin cardiomypathy, which includes transthyretin familial amyloid cardiomyopathy (TTR-FAC) and wild-type cardiomyopathy (WT-CM). We anticipate results from this study in 2018, and continue to work with the FDA to identify next steps. |
In July 2016, we withdrew all pending regulatory applications of tofacitinib seeking approval for the treatment of adult patients with moderate to severe chronic plaque psoriasis, including the supplemental new drug application in the U.S. following the October 2015 Complete Response Letter from the FDA. The withdrawal of these filings will allow us more time to determine the path forward for tofacitinib in this indication.
|
| | | |
| REGULATORY APPROVALS AND FILINGS IN THE EU AND JAPAN |
| PRODUCT | DESCRIPTION OF EVENT | DATE APPROVED | DATE FILED* |
Inotuzumab ozogamicinPF-05280014(a)
| Application filed in the EU for a potential biosimilar to Herceptin® (trastuzumab) | — | July 2017 |
| Besponsa (inotuzumab ozogamicin) | Approval in the EU for the treatment of adult patients with relapsed or refractory B-cell precursor acute lymphoblastic leukemia | June 2017 | — | May 2016 |
Trumenba
| Application filedApproval in the EU for a prophylactic vaccine for active immunization to prevent invasive disease caused by Neisseria meningitidis meningtidisserogroup B in individuals 10 through 25 years of age and older
| May 2017 | — |
| Xalkori (crizotinib) | Approval in Japan for the treatment of ROS1-positive non-small cell lung cancer | May 2017 | — |
| Xeljanz (tofacitinib) | Application filed in Japan for the treatment of ulcerative colitis | — | May 20162017 |
| Sutent (sunitinib) | Application filed in the EU for the adjuvant treatment in adult patients at high risk of recurrent renal cell carcinoma following nephrectomy | — | April 2017 |
| inotuzumab ozogamicin | Application filed in Japan for the treatment of acute lymphoblastic leukemia | — | April 2017 |
Xeljanz (Tofacitinib)(tofacitinib) | Approval in the EU for Xeljanz in combination with methotrexate for the treatment of moderate to severe active rheumatoid arthritis in adult patients who have responded inadequately to, or who are intolerant to one or more disease-modifying antirheumatic drugs. Xeljanz can be given as monotherapy in case of intolerance to methotrexate or when treatment with methotrexate is inappropriate | March 2017 | — |
| ertugliflozin | Application filed in the EU for the treatment of patientstype 2 diabetes, which is being developed in collaboration with moderate to severe rheumatoid arthritis who have had an inadequate response or intolerance to methotrexateMerck | — | MarchFebruary 2017 |
| Mylotarg (gemtuzumab ozogamicin) | Application filed in the EU for the treatment of acute myeloid leukemia | — | December 2016 |
| Ibrance (palbociclib) | Approval in the EU for palbociclib in combination with endocrine therapy for the treatment of HR+, HER2- advanced or metastatic breast cancer, as well as for the treatment of recurrent advanced breast cancer | November 2016 | — |
| Ibrance (palbociclib) | Application filed in Japan for palbociclib in combination with endocrine therapy for the treatment of inoperable or recurrent breast cancer | — | October 2016 |
Xalkori (Crizotinib)Bavencio (avelumab)(a)(b)
| Application filed in the EU for the treatment of metastatic Merkel cell carcinoma, which is being developed in collaboration with Merck KGaA, Germany | — | October 2016 |
| Xalkori (crizotinib) | Approval in the EU for the treatment of ROS1-positive non-small cell lung cancer | — | FebruaryAugust 2016 |
Eliquis (Apixaban)(b)
| Approval in Japan for the treatment and prevention of recurrence of venous thromboembolism (DVT and PE) | December 2015 | — |
Xalkori (Crizotinib) | Approval in the EU for first line treatment of ALK-positive non-small cell lung cancer | November 2015 | — |
Effexor SR (Venlafaxine HCl) | Approval in Japan for treatment of depression/depressed state | September 2015 | — |
Ibrance (Palbociclib) | Application filed in the EU for palbociclib in combination with endocrine therapy for the treatment of HR+, HER2- advanced or metastatic breast cancer, as well as for the treatment of recurrent advanced breast cancer | — | August 2015 |
| |
| * | For applications in the EU, the dates set forth in this column are the dates on which the EMA validated our submissions. |
| |
(a) | Herceptin® is a registered trademark of Genentech, Inc. |
| |
(b) | In July 2016,2017, the EMA’s Committee for Medicinal Products for Human Use issued an opinion recommending that Xalkori be grantedrecommended the approval of avelumab as a monotherapy for the treatment of adultsadult patients with ROS1-positive advanced non-smallmetastatic Merkel cell lung cancer.carcinoma. |
| |
| This indication for Eliquis (apixaban) was developed and is being commercialized in collaboration with BMS. |
|
| |
LATE-STAGE CLINICAL PROGRAMS FOR ADDITIONAL USES AND DOSAGE FORMS FOR IN-LINE AND IN-REGISTRATION PRODUCTS |
| PRODUCT | PROPOSED INDICATION |
Bosulif (Bosutinib)Bavencio (avelumab) | First-line treatment for patients with chronic phase Philadelphia chromosome positive chronic myelogenous leukemia, which is being developed in collaboration with Avillion Group |
Inlyta (Axitinib) | Adjuvant treatment of renal cell carcinoma, which is being developed in collaboration with SFJ Pharmaceuticals Group |
Ibrance (Palbociclib) | Treatment of high-risk early breast cancer, in collaboration with the German Breast Group |
Ibrance (Palbociclib) | Treatment of HR+ early breast cancer, in collaboration with the Alliance Foundation Trials, LLC, and the Austrian Breast Colorectal Cancer Study Group |
Lyrica (Pregabalin) | CR (once-a-day) dosing |
Sutent (Sunitinib) | Adjuvant treatment of renal cell carcinoma |
Xeljanz (Tofacitinib) | Treatment of ulcerative colitis |
Xeljanz (Tofacitinib) | Treatment of psoriatic arthritis |
Vyndaqel (Tafamidis meglumine) | Adult symptomatic transthyretin cardiomyopathy |
|
| |
NEW DRUG CANDIDATES IN LATE-STAGE DEVELOPMENT |
CANDIDATE | PROPOSED INDICATION |
Avelumab (PF-06834635)
(MSB0010718C)
| A monoclonal antibody that inhibits PD-L1, in combination with Inlyta (axitinib), a tyrosine kinase inhibitor, for the first-line treatment of advanced renal cell carcinoma, which is being developed in collaboration with Merck KGaA, Germany |
Avelumab (PF-06834635)
(MSB0010718C)
Bavencio (avelumab) | A monoclonal antibody that inhibits PD-L1 for the first-line treatment of stage IIIb/IV non-small cell lung cancer, which is being developed in collaboration with Merck KGaA, Germany |
Avelumab (PF-06834635)
(MSB0010718C)
Bavencio (avelumab) | A monoclonal antibody that inhibits PD-L1 for treatment of stage IIIb/IV non-small cell lung cancer that has progressed after a platinum-containing doublet, which is being developed in collaboration with Merck KGaA, Germany |
Avelumab (PF-06834635)
(MSB0010718C)
Bavencio (avelumab) | A monoclonal antibody that inhibits PD-L1 for treatment of platinum-resistant/refractory ovarian cancer, which is being developed in collaboration with Merck KGaA, Germany |
Avelumab (PF-06834635)
(MSB0010718C)
Bavencio (avelumab) | A monoclonal antibody that inhibits PD-L1 for the first-line treatment of ovarian cancer, which is being developed in collaboration with Merck KGaA, Germany |
Avelumab (PF-06834635)
(MSB0010718C)
Bavencio (avelumab) | A monoclonal antibody that inhibits PD-L1 for maintenance treatment, in the first-line setting, for patients with urothelial cancer, which is being developed in collaboration with Merck KGaA, Germany |
Avelumab (PF-06834635)
(MSB0010718C)
Bavencio (avelumab) | A monoclonal antibody that inhibits PD-L1 for maintenance treatment of advanced or metastatic gastric/ gastro-esophageal junction cancers, which is being developed in collaboration with Merck KGaA, Germany |
Avelumab (PF-06834635)
(MSB0010718C)
Bavencio (avelumab) | A monoclonal antibody that inhibits PD-L1 for the third-line treatment of advanced or metastatic gastric/ gastro-esophageal junction cancers, which is being developed in collaboration with Merck KGaA, Germany |
BococizumabBavencio (avelumab) | A monoclonal antibody that inhibits PCSK9PD-L1 for the treatment of hyperlipidemialocally advanced squamous cell carcinoma of the head and prevention of cardiovascular eventsneck, which is being developed in collaboration with Merck KGaA, Germany |
DacomitinibBosulif (bosutinib) | First-line treatment for patients with chronic phase Philadelphia chromosome positive chronic myelogenous leukemia, which is being developed in collaboration with Avillion Group |
| Inlyta (axitinib) | Adjuvant treatment of renal cell carcinoma, which is being developed in collaboration with SFJ |
| Ibrance (palbociclib) | Treatment of HER2+ advanced breast cancer, in collaboration with the Alliance Foundation Trials, LLC |
| Ibrance (palbociclib) | Treatment of high-risk early breast cancer, in collaboration with the German Breast Group |
| Ibrance (palbociclib) | Treatment of HR+ early breast cancer, in collaboration with the Alliance Foundation Trials, LLC, and the Austrian Breast Colorectal Cancer Study Group |
| Xtandi (enzalutamide) | Treatment of non-metastatic castration resistant prostate cancer |
| Xtandi (enzalutamide) | Treatment of non-metastatic high risk hormone-sensitive prostate cancer |
| Xtandi (enzalutamide) | Treatment of metastatic hormone-sensitive prostate cancer |
| Xeljanz (tofacitinib) | Treatment of ulcerative colitis (ex-U.S.) |
| Xeljanz (tofacitinib) | Treatment of psoriatic arthritis (ex-U.S.) |
| Vyndaqel (tafamidis meglumine) | Adult symptomatic transthyretin cardiomyopathy |
In May 2017, we and our partner Astellas announced discontinuation of the planned ENDEAR trial (a phase III study comparing the efficacy and safety of Xtandi in combination with paclitaxel chemotherapy or as monotherapy versus placebo with paclitaxel in patients with advanced, diagnostic-positive, triple-negative breast cancer); no patients were ever enrolled in the trial.
|
| |
| NEW DRUG CANDIDATES IN LATE-STAGE DEVELOPMENT |
| CANDIDATE | PROPOSED INDICATION |
| dacomitinib | A pan-HERpan-human epidermal growth factor receptor (HER) tyrosine kinase inhibitor for the first-line treatment of patients with advanced non-small cell lung cancer with EGFRestimated glomerular filtration rate (eGFR) activating mutations, which is being developed in collaboration with SFJ Pharmaceuticals Group |
Ertugliflozinlorlatinib (PF-06463922) | An oral SGLT2A next generation ALK/ROS1 tyrosine kinase inhibitor for the treatment of type 2 diabetes, which is being developed in collaborationpatients with Merck & Co., Inc.ALK-positive metastatic non-small cell lung cancer, previously treated with one or more ALK inhibitors |
Inotuzumab ozogamicin | An antibody drug conjugate, consisting of an anti-CD22 monotherapy antibody linked to a cytotoxic agent, calicheamycin, for the treatment of acute lymphoblastic leukemia (ex-EU) |
PF-06836922PF-06425090 | A long-acting hGH-CTPprophylactic vaccine for the treatment of growth hormone deficiency in adults, which is being developed in collaboration with OPKO Health, Inc.active immunization to prevent clostridium difficile colitis |
PF-06438179PF-05280014(a)
| A potential biosimilar to Remicade® (infliximab)Herceptin® (trastuzumab) (ex-EU) |
PF-05280014PF-05280586(b)
| A potential biosimilar to Herceptin®Rituxan® (trastuzumab)(rituximab) |
PF-05280586PF-06439535(c)
| A potential biosimilar to Rituxan®Avastin®(rituximab) (bevacizumab) |
PF-06439535PF-06410293(d)
| A potential biosimilar to Avastin® (bevacizumab)Humira® (adalimumab) |
PF-06410293(e)
| A potential biosimilar to Humira® (adalimumab) |
Rivipanselrivipansel (GMI-1070) | A pan-selectin inhibitor for the treatment of vaso-occlusive crisis in hospitalized individuals with sickle cell disease, which was licensed from GlycoMimetics Inc. |
Tanezumabsomatrogon (PF-06836922) | A long-acting hGH-CTP for the treatment of growth hormone deficiency in children, which is being developed in collaboration with OPKO |
| somatrogon (PF-06836922) | A long-acting hGH-CTP for the treatment of growth hormone deficiency in adults, which is being developed in collaboration with OPKO |
| talazoparib (MDV3800) | An oral PARP inhibitor for the treatment of patients with germline breast cancer susceptibility gene BRCA mutated advanced breast cancer |
| tanezumab | An anti-nerve growth factor monoclonal antibody for the treatment of pain, which is being developed in collaboration with Lilly |
| |
(a) | Remicade®Herceptin® is a registered trademark of Janssen Biotech,Genentech, Inc. In February 2016, we divested the rights for development and commercialization of PF-06438179, a potential biosimilar to Remicade® (infliximab) in the 28 countries that form the EEA to Sandoz, which was a condition to the European Commission’s approval of the Hospira transaction. We retain commercialization and manufacturing rights to PF-06438179 in all countries outside of the EEA.
|
| |
(b) | Herceptin® is a registered trademark of Genentech, Inc. |
| |
Rituxan(c)® | Rituxan® is a registered trademark of Biogen MA Inc. |
| |
(d)(c)
| Avastin®Avastin® is a registered trademark of Genentech, Inc. |
| |
(e)(d)
| Humira®Humira® is a registered trademark of AbbVie Biotechnology Ltd. |
Inflectra™
In 2009, Hospira entered into an agreement to develop and market certain biosimilar molecules with Celltrion Inc. and Celltrion Healthcare, Co., Ltd. (collectively, Celltrion) including Inflectra™ (infliximab) for patients with autoimmune diseases. In Europe, Inflectra has now launched in 36 markets. Celltrion possesses the right to commercialize its infliximab product under the brand name Remsima™ in the same European markets as Hospira. We have exclusive commercialization rights from Celltrion to its infliximab product in the U.S., Canada and certain other territories. In April 2016, the FDA approved Inflectra (infliximab-dyyb) across all eligible indications of the reference product, Remicade® (infliximab).In December 2014, Hospira launched Inflectra in Canada. Inflectra has also been approved in certain markets, where we will market it under the brand name Remsima™.
Additional product-related programs are in various stages of discovery and development. Also, see the discussion in the “Our Strategy––Our Business Development Initiatives” section of this MD&A.
COSTS AND EXPENSES
The changes in expenses below reflect, among other things, the favorable impact of the February 2017 sale of HIS. The operating results of HIS are included in operating results through February 2, 2017 and, therefore, operating results for the second quarter of 2017 do not reflect HIS global operations, while operating results for the second quarter of 2016 reflect three months of HIS global operations. Operating results for the first six months of 2017 include approximately one month of HIS domestic operations and approximately two months of HIS international operations, while operating results for the first six months of 2016 reflect six months of HIS global operations.
Cost of Sales
| | | | | Three Months Ended | | Six Months Ended | | Three Months Ended | | Six Months Ended |
| (MILLIONS OF DOLLARS) | | July 3,
2016 |
| | June 28,
2015 |
| | % Change | | July 3,
2016 |
| | June 28,
2015 |
| | % Change | | July 2,
2017 |
| | July 3,
2016 |
| | % Change |
| | July 2,
2017 |
| | July 3,
2016 |
| | % Change |
|
| Cost of sales | | $ | 3,174 |
| | $ | 2,180 |
| | 46 | | $ | 6,026 |
| | $ | 4,018 |
| | 50 | | $ | 2,663 |
| | $ | 3,174 |
| | (16 | ) | | $ | 5,134 |
| | $ | 6,026 |
| | (15 | ) |
As a percentage of Revenues | | 24.1 | % | | 18.4 | % | | 23.0 | % | | 17.7 | % | | | 20.7 | % | | 24.1 | % | | | | 20.0 | % | | 23.0 | % | | |
Cost of sales increased 46% decreased 16% in the second quarter of 20162017, and 50%15% in the first six months of 2016,2017, compared to the same periods in 2015,2016, primarily due to:
| |
| • | the nonrecurring unfavorable impact of $30 million in the second quarter of 2016 and $212 million in the first six months of 2016 of acquired Hospira inventory, which is measured at fair value on the acquisition date and was amortized over the turn of the related inventory; |
an increaserecognition of synergies related to our cost-reduction/productivity initiatives;
| |
| • | the favorable impact of the sale of HIS global operations (which carried a higher cost of sales than other products) of $156 million in the second quarter of 2017, and $282 million in the first six months of 2017; and |
| |
| • | the favorable impact of foreign exchange of $192 million in the second quarter of 2017, and $220 million in the first six months of 2017. |
The decrease in sales volumes including legacy Hospira operations;
the sale of legacy Hospira inventory measured at fair value on the acquisition date and amortized over the turn of the related inventory; and
the unfavorable impact of foreign exchange.
The increase in Cost of sales as a percentage of revenues in the second quarter of 20162017 and the first six months of 2016,2017, compared to the same periods in 2015,2016, was primarily due to:
an unfavorable change in product mix due to (i) the inclusion of legacy Hospira operations with products that carry a higher cost, as well as the impact of acquired Hospira inventory which is measured at fair value on the acquisition date and amortized over the turnall of the related inventory; and (ii) the impact of losses of exclusivity on products which formerly had a higher gross margin; and
the unfavorable impact of foreign exchange,
partially offset by:
a favorable changefactors discussed above plus an increase in product mix related to legacy Pfizer products, including alliance revenues, (whichwhich have no associated cost of sales), excluding losses of exclusivity.sales.
Selling, Informational and Administrative (SI&A) Expenses
| | | | | Three Months Ended | | Six Months Ended | | Three Months Ended | | Six Months Ended |
| (MILLIONS OF DOLLARS) | | July 3,
2016 |
| | June 28,
2015 |
| | %
Change | | July 3,
2016 |
| | June 28,
2015 |
| | % Change | | July 2,
2017 |
| | July 3,
2016 |
| | %
Change |
| | July 2,
2017 |
| | July 3,
2016 |
| | %
Change |
|
| Selling, informational and administrative expenses | | $ | 3,471 |
| | $ | 3,386 |
| | 2 | | $ | 6,856 |
| | $ | 6,491 |
| | 6 | | $ | 3,425 |
| | $ | 3,471 |
| | (1 | ) | | $ | 6,733 |
| | $ | 6,856 |
| | (2 | ) |
As a percentage of Revenues | | 26.4 | % | | 28.6 | % | | 26.2 | % | | 28.6 | % | | | 26.6 | % | | 26.4 | % | | | | 26.2 | % | | 26.2 | % | | |
SI&A expenses increased 2%decreased 1% in the second quarter of 20162017, compared to the same period in 2015,2016, primarily due to:
the inclusion of legacy Hospira operations; and
increased investments to supportlower spending for certain recently launched products;
partially offset by:products, primarily Prevnar 13/Prevenar 13;
the favorable impact of foreign exchange of 2% in the second quarter of 2016;$44 million; and
lower field force, advertisingthe favorable impact of the sale of HIS global operations of $31 million,
partially offset by:
additional investment across several of our key products, primarily Eucrisa, Xeljanz, Xtandi and promotional expenses, reflectingIbrance; and
increased spending for biosimilars, primarily related to the benefitsU.S. launch of cost-reduction and productivity initiatives.Inflectra.
SI&A expenses increased 6%decreased 2% in the first six months of 20162017, compared to the same period in 2015,2016, primarily due to:
| |
| • | the non-recurrence of an allowance for doubtful trade accounts receivable of approximately $280 million, resulting from unfavorable developments with a distributor that was recorded in the first quarter of 2016; |
an increase in the allowancelower spending for doubtful trade accounts receivable, resulting from unfavorable developments with a distributor;
the inclusion of legacy Hospira operations; and
increased investments to support certain recently launched products, and other in-line biopharmaceutical products,
partially offset by:primarily Prevnar 13/Prevenar 13;
the favorable impact of foreign exchange of 3%$67 million; and
the favorable impact of the sale of HIS global operations of $55 million,
partially offset by:
additional investment across several of our key products, primarily Eucrisa, Xeljanz, Xtandi and Ibrance;
increased spending for biosimilars, primarily related to the U.S. launch of Inflectra; and
an increase in the first six months of 2016; and
lower field force, advertising and promotional expenses, reflecting the benefits of cost-reduction and productivity initiatives.
charitable contributions.
Research and Development (R&D) Expenses
| | | | | Three Months Ended | | Six Months Ended | | Three Months Ended | | Six Months Ended |
| (MILLIONS OF DOLLARS) | | July 3,
2016 |
| | June 28,
2015 |
| | %
Change | | July 3,
2016 |
| | June 28,
2015 |
| | %
Change |
| | July 2,
2017 |
| | July 3,
2016 |
| | %
Change | | July 2,
2017 |
| | July 3,
2016 |
| | %
Change |
| Research and development expenses | | $ | 1,748 |
| | $ | 1,734 |
| | 1 | | $ | 3,478 |
| | $ | 3,620 |
| | (4 | ) | | $ | 1,780 |
| | $ | 1,748 |
| | 2 | | $ | 3,487 |
| | $ | 3,478 |
| | — |
As a percentage of Revenues | | 13.3 | % | | 14.6 | % | | 13.3 | % | | 15.9 | % | |
|
| | 13.8 | % | | 13.3 | % | | 13.6 | % | | 13.3 | % | |
|
R&D expenses increased 1%2% in the second quarter of 2016,2017, compared to the same period in 2015,2016, primarily due to:
the inclusion of legacy Hospira operations and increased investment in legacy Pfizer biosimilar development programs; and | |
| • | increased costs associated with our C. difficile vaccine program, which initiated a Phase 3 clinical study in March 2017; |
increased costs associated with our avelumab allianceoncology programs, primarily clinical trial spend on Medivation assets;
lower development funding credits primarily related to the discontinuation of the global clinical development program for bococizumab in the fourth quarter of 2016; and
an expense of $75 million resulting from our May 2017 agreement with Merck KGaA,Sangamo to develop and commercialize gene therapy programs for Hemophilia A,
partially offset by:
lower expenses due to the discontinuation of the global clinical development fundingprogram for bococizumab in the fourth quarter of $97 million under which we have an obligation to perform contractual services related to2016;
the close-out of certain post-marketing clinical trialstrials; and
the favorable impact of bococizumab, Ibrance and rivipansel (see Notes to Condensed Consolidated Financial Statements––Note 2B. Acquisitions, Research and Development and Collaborative Arrangements, Equity-Method Investments and Cost-Method Investment: Research and Development and Collaborative Arrangements).
the sale of HIS global operations.R&D expenses decreased 4%were relatively flat in the first six months of 2016,2017, compared to the same period in 2015,2016, primarily due to:
the non-recurrence of the $295 million upfront payment to OPKO in the first quarter of 2015 associated with a worldwide development and commercialization agreement; and
development funding of $106 million under which we have an obligation to perform contractual services related to certain clinical trials of bococizumab, Ibrance and rivipansel (see Notes to Condensed Consolidated Financial Statements––Note 2B. Acquisitions, Research and Development and Collaborative Arrangements, Equity-Method Investments and Cost-Method Investment: Research and Development and Collaborative Arrangements),
partially offset by:
the inclusion of legacy Hospira operations and increased investment in legacy Pfizer biosimilar development programs;
increased costs associated with our oncology programs, primarily clinical trial spend on Medivation assets;
| |
| • | increased costs associated with our C. difficile vaccine program, which initiated a Phase 3 clinical study in March 2017; |
an expense of $75 million resulting from our avelumab allianceMay 2017 agreement with Merck KGaA;Sangamo to develop and commercialize gene therapy programs for Hemophilia A; and
increased investments in certain late-stage pipeline programs,lower development funding credits primarily bococizumab and tanezumab.
Description of Research and Development Operations
Innovation is criticalrelated to the successdiscontinuation of our company, and drug discovery and development is time-consuming, expensive and unpredictable. Our R&D spending is conducted through a number of matrix organizations, and in 2016, we announced changes to our research and development operations that we believe will create a stronger and more efficient research and development engine across our IH and EH businesses.
Research Units within our WRD organization continue to be generally responsible for research assets for our IH business (assets that have not yet achieved proof-of-concept). Our Research Units are organized in a variety of ways (by therapeutic area or combinations of therapeutic areas, by discipline, by location, etc.) to enhance flexibility, cohesiveness and focus. Because of our structure, we can rapidly redeploy resources within a Research Unit between various projects as necessary because the workforce shares similar skills, expertise and/or focus.
We created an R&D organization within the EH business, which supports the large base of EH products and is expected to develop potential new sterile injectable drugs and therapeutic solutions, as well as biosimilars.
We formed the GPD organization, which is generally responsible for theglobal clinical development program for bococizumab in the fourth quarter of assets that are in clinical trials for our WRD and Innovative portfolios. GPD also provides technical support and other services to Pfizer R&D projects.2016,
Our science-based and other platform-services organizations, where a significant portion of our R&D spending occurs, provide technical expertise and other serviceslargely offset by:
lower expenses due to the various R&D projects,discontinuation of the global clinical development program for bococizumab in the fourth quarter of 2016;
the close-out of certain post-marketing clinical trials; and are organized into science-based functions (which are part
the favorable impact of our WRD organization), such as Pharmaceutical Sciences, Medicinal Chemistry, Regulatory and Drug Safety, and non-science-based functions, such as Facilities, Business Technology and Finance. As a result, within eachthe sale of these functions, we are able to migrate resources among projects, candidates and/or targets in any therapeutic area and in most phases of development, allowing us to react quickly in response to evolving needs.
We manage R&D operations on a total-company basis through our matrix organizations described above. Specifically, a single committee with representation from the R&D groups and the IH commercial organization is accountable for aligning resources among all of our WRD, GPD and IH R&D projects and for seeking to ensure optimal capital allocation across the Innovative R&D portfolio. We believe that this approach also serves to maximize accountability and flexibility. Our EH R&D organization manages its resources separately from the WRD and GPD organizations.
Generally, we do not disaggregate total R&D expense by development phase or by therapeutic area since, as described above, we do not manage a significant portion of our R&D operations by development phase or by therapeutic area. Further, as we are able to adjust a significant portion of our spending quickly, as conditions change, we believe that any prior-period information about R&D expense by development phase or by therapeutic area would not necessarily be representative of future spending.HIS global operations.
For additional information on Cost of sales, SI&A and R&D expenses by operating segment, see the “Analysis of Operating Segment Information” section of this MD&A.
Amortization of Intangible Assets
| | | | | Three Months Ended | | Six Months Ended | | Three Months Ended | | Six Months Ended |
| (MILLIONS OF DOLLARS) | | July 3,
2016 |
| | June 28,
2015 |
| | %
Change | | July 3,
2016 |
| | June 28,
2015 |
| | %
Change | | July 2,
2017 |
| | July 3,
2016 |
| | %
Change | | July 2,
2017 |
| | July 3,
2016 |
| | %
Change |
| Amortization of intangible assets | | $ | 961 |
| | $ | 872 |
| | 10 | | $ | 1,966 |
| | $ | 1,811 |
| | 9 | | $ | 1,208 |
| | $ | 961 |
| | 26 | | $ | 2,394 |
| | $ | 1,966 |
| | 22 |
As a percentage of Revenues | | 7.3 | % | | 7.4 | % | | 7.5 | % | | 8.0 | % | | | 9.4 | % | | 7.3 | % | | 9.3 | % | | 7.5 | % | |
Amortization of intangible assets increased 10%26% in the second quarter of 20162017 and 9%22% in the first six months of 2016,2017, compared to the same periods in 2015,2016, primarily due to purchase accounting chargesthe inclusion of amortization expense of approximately $128$272 million pre-tax(pre-tax) in the second quarter of 20162017 and $257approximately $530 million pre-tax for(pre-tax) in the first six months of 20162017 related to the identifiable intangible assets acquired from Hospira,Medivation and Anacor, partially offset by assets that became fully amortized at the end of their estimated useful lives.
See also Notes to Condensed Consolidated Financial Statements—Note 9A. Identifiable Intangible Assets and Goodwill: Identifiable Intangible Assets.
Restructuring Charges and Other Costs Associated with Acquisitions and Cost-Reduction/Productivity Initiatives
| | | | | Three Months Ended | | Six Months Ended | | Three Months Ended | | Six Months Ended |
| (MILLIONS OF DOLLARS) | | July 3,
2016 |
| | June 28,
2015 |
| | %
Change | | July 3,
2016 |
| | June 28,
2015 |
| | %
Change | | July 2,
2017 |
| | July 3,
2016 |
| | %
Change |
| | Jul 2,
2017 |
| | Jul 3,
2016 |
| | %
Change |
|
| Restructuring charges and certain acquisition-related costs | | $ | 316 |
| | $ | 86 |
| | * | | $ | 457 |
| | $ | 146 |
| | * | | $ | 70 |
| | $ | 316 |
| | (78 | ) | | $ | 228 |
| | $ | 457 |
| | (50 | ) |
| Total additional depreciation—asset restructuring | | 53 |
| | 28 |
| | 88 | | 104 |
| | 47 |
| | * | | 21 |
| | 53 |
| | (60 | ) | | 35 |
| | 104 |
| | (66 | ) |
| Total implementation costs | | 64 |
| | 45 |
| | 41 | | 124 |
| | 93 |
| | 33 | | 62 |
| | 64 |
| | (3 | ) | | 93 |
| | 124 |
| | (25 | ) |
Costs associated with acquisitions and cost-reduction/productivity initiatives(a) | | $ | 433 |
| | $ | 159 |
| | * | | $ | 685 |
| | $ | 286 |
| | * | | $ | 153 |
| | $ | 433 |
| | (65 | ) | | $ | 356 |
| | $ | 685 |
| | (48 | ) |
| |
(a) | Comprises Restructuring charges and certain acquisition-related costs as well as costs associated with our cost-reduction/productivity initiatives included in Cost of sales, Research and development expenses and/or Selling, informational and administrative expenses, as appropriate. |
| |
* | Calculation not meaningful. |
Included in Restructuring charges and certain acquisition-related costs are (i) restructuring charges of $140$14 million in the second quarter of 2017 and $59 million for the first six months of 2017 for employee termination costs, exit costs and asset impairments, which are largely associated with cost-reduction and productivity initiatives not associated with acquisitions, as well as our acquisitions of mainly Anacor for the second quarter of 2017 and mainly Anacor and Medivation for the first six months of 2017; (ii) transaction costs, such as banking, legal, accounting and other similar services, of $6 million in the second quarter of 2017 and $18 million for the first six months of 2017, virtually all of which are directly related to our acquisition of Medivation; and (iii) integration costs, representing external, incremental costs directly related to integrating acquired businesses, and primarily include expenditures for consulting and the integration of systems and processes of $50 million in the second quarter of 2017 and $151 million for the first six months of 2017, primarily related to our acquisitions of Hospira and Medivation. For additional information, see Notes to Condensed Consolidated Financial Statements—Note 3. Restructuring Charges and Other Costs Associated with Acquisitions and Cost-Reduction/Productivity Initiatives.
Included in Restructuring charges and certain acquisition-related costs are (i) restructuring charges of $141 million in the second quarter of 2016 and $170 million for the first six months of 2016 for employee termination costs, exit costs and asset impairments, which are largely associated with cost-reduction and productivity initiatives not associated with acquisitions; (ii) transaction costs, such as banking, legal, accounting and other similar services, of $36 million in the second quarter of 2016, most of which are directly related to our acquisition of Anacor, in June 2016, and $60 million for the first six months of 2016, most of which include costs related to the Anacor acquisition, as well costs associated with ouras the terminated transaction with Allergan;
and (iii) integration costs, representing external, incremental costs directly related to integrating acquired businesses, and primarily include expenditures for consulting and the integration of systems and processes, of $139 million in the second quarter of 2016 and $227 million for the first six months of 2016, primarily related to our acquisition of Hospira and the terminated transaction with Allergan. For additional information, see Notes to Condensed Consolidated Financial Statements—Note 3. Restructuring Charges and Other Costs Associated with Acquisitions and Cost-Reduction/Productivity Initiatives.
In connection with our acquisition of Hospira, we are focusing our efforts on achieving an appropriate cost structure for the combined company. We expect to achieve $1 billion of annual cost savings by 2018 in connection with the Hospira acquisition, 25% more than our initial cost savings target of $800 million.million, and have achieved approximately $700 million of cost savings through July 2, 2017. The one-time costs to generate the savings are expected to be approximately $1 billion (not including costs of $215 million infor full-year 2015 associated with the return of acquired in-process research and developmentIPR&D rights), incurred for up to a three-year period post-acquisition.
In early2016, we substantially completed previously disclosed cost-reduction initiatives begun in 2014 we announced that we would be incurring costs in 2014-2016 related to new programs:associated with our new global commercial structure reorganization, and additional cost-reduction/productivity initiatives. We also have an ongoing manufacturing plant network rationalization and optimization initiative underway.initiatives, and additional cost-reduction/productivity initiatives across the enterprise. Through December 31, 2016, we incurred $3.1 billion (pre-tax) in total costs for the 2014-2016 program. The cumulative ongoing annual cost savings associated with the 2014-2016 program (but not including expected cost savings associated with the Hospira acquisition), are approximately $3.1 billion. These savings were recognized, for the most part, through the end of 2016. However, savings from costs incurred in the last half of 2016 are expected to largely occur in 2017 and are reflected in our 2017 financial guidance.
New Cost-Reduction/Productivity Initiatives—2017 through 2019 Activities
As a result of the evaluation performed in connection with our decision in September 2016 to not pursue, at that time, splitting IH and EH into two separate publicly-traded companies, we have identified new opportunities to potentially achieve greater optimization and efficiency to become more competitive in our business. Therefore, we have initiated new enterprise-wide cost-reduction/productivity initiatives, which we expect to complete by the end of 2019. These initiatives will encompass all areas of our cost base and will include further centralization of our corporate and platform functions and optimization of our manufacturing plant network to support IH and EH products and pipelines, as well as activities in other areas where opportunities are identified. The action plans related to these new initiatives are underway and, in order to achieve targeted savings of approximately $1.2 billion by 2020, we expect to incur total costs of approximately $900 million over the next three years. Of this amount, we expect about 80% to be manufacturing operations related and we expect about a quarter of the total charges will be non-cash. For additional information about these programs and expected and actual total costs, see Notes to Condensed Consolidated Financial Statements—Note 3. Restructuring Charges and Other Costs Associated with Acquisitions and Cost-Reduction/Productivity Initiatives.
The expected ongoing annual cost savings associated with the above-mentioned programs (but not including expected cost savings associated with the Hospira acquisition), in the aggregate, are estimated to be approximately $2.4 billion by the end of 2016.
The expected costs and cost savings in 20162017 associated with these activities as well as the Hospira acquisition, are reflected in our 2017financial guidance for 2016. See also the “Our Financial Guidance for 2016” section of this MD&A.guidance.
In addition to these major initiatives, we continuously monitor our operations for cost reduction and/or productivity opportunities, especially in light of the losses of exclusivity and the expiration of collaborative arrangements for various products.
Other (Income)/Deductions—Net | | | | | Three Months Ended | | Six Months Ended | | Three Months Ended | | Six Months Ended |
| (MILLIONS OF DOLLARS) | | July 3,
2016 |
| | June 28,
2015 |
| | %
Change | | July 3,
2016 |
| | June 28,
2015 |
| | %
Change | | July 2,
2017 |
| | July 3,
2016 |
| | %
Change | | July 2,
2017 |
| | July 3,
2016 |
| | %
Change |
| Other (income)/deductions––net | | $ | 1,068 |
| | $ | 55 |
| | * | | $ | 1,398 |
| | $ | 9 |
| | * | | $ | (66 | ) | | $ | 1,068 |
| | * | | $ | (68 | ) | | $ | 1,398 |
| | * |
| |
| * | Calculation not meaningful. |
For information about the components of Other (income)/deductions—net, see Notes to Condensed Consolidated Financial Statements—Note 4. Other (Income)/Deductions—Net.
See also the “Analysis of Operating Segment Information” section of this MD&A.
PROVISION FOR TAXES ON INCOME
| | | | | Three Months Ended | | Six Months Ended | | Three Months Ended | | Six Months Ended | |
| (MILLIONS OF DOLLARS) | | July 3,
2016 |
| | June 28,
2015 |
| | %
Change |
| | July 3,
2016 |
| | June 28,
2015 |
| | %
Change |
| | July 2,
2017 |
| | July 3,
2016 |
| | %
Change | | July 2,
2017 |
| | July 3,
2016 |
| | %
Change |
| Provision for taxes on income | | $ | 375 |
| | $ | 905 |
| | (59 | ) | | $ | 910 |
| | $ | 1,610 |
| | (43 | ) | | $ | 739 |
| | $ | 347 |
| | * | | $ | 1,560 |
| | $ | 861 |
| | 81 |
| Effective tax rate on continuing operations | | 15.6 | % | | 25.6 | % | | |
| | 15.2 | % | | 24.3 | % | | |
| | 19.4 | % | | 14.4 | % | | 20.1 | % | | 14.4 | % | | |
| |
| * | Calculation not meaningful. |
For information about our effective tax rate and the events and circumstances contributing to the changes between periods, see Notes to Condensed Consolidated Financial Statements—Note 5. Tax Matters.
NON-GAAP FINANCIAL MEASURE (ADJUSTED INCOME)
General Description of Non-GAAP Financial Measure (Adjusted Income)
Adjusted income is an alternative view of performance used by management. We measure the performance of the overall Company on this basis in conjunction with other performance metrics. Because Adjusted income is an important internal measurement for Pfizer, we believe that investors’ understanding of our performance is enhanced by disclosing this performance measure. We report Adjusted income, certain components of Adjusted income, and Adjusted diluted earnings per share in order to portray the results of our major operations––the discovery, development, manufacture, marketing and sale of prescription medicines, vaccines medical devices and consumer healthcare (OTC) products––prior to considering certain income statement elements. We have defined Adjusted income as Net income attributable to Pfizer Inc. before the impact of purchase accounting for acquisitions, acquisition-related costs, discontinued operations and certain significant items, which are described below. Also, see the “Adjusted Income–“Non-GAAP Financial Measure (Adjusted Income)––General Description of Adjusted Income Measure”Non-GAAP Financial Measure (Adjusted Income)” section of our 20152016 Financial Report for additional information. Similarly, we have defined the Adjusted income components as Cost of sales, Selling, informational and administrative expenses, Research and development expenses, Amortization of intangible assets and Other (income)/deductions––net, each before the impact of purchase accounting for acquisitions, acquisition-related costs and certain significant items. We have defined Adjusted diluted earnings per share as Earnings per common share attributable to Pfizer Inc.––dilutedbefore the impact of purchase accounting for acquisitions, acquisition-related costs, discontinued operations and certain significant items. The Adjusted income measure, the Adjusted income component measures and the Adjusted diluted earnings per share measure are not, and should not be viewed as, a substitutesubstitutes for U.S. GAAP net income, U.S. GAAP net income components or U.S. GAAP diluted earnings per share.
The following are examples of how the Adjusted income and Adjusted diluted earnings per share measures are utilized:
senior management receives a monthly analysis of our operating results that is prepared on an Adjusted income and Adjusted diluted earnings per share basis;
our annual budgets are prepared on an Adjusted income and Adjusted diluted earnings per share basis; and
senior management’s annual compensation is derived, in part, using Adjusted income and Adjusted diluted earnings per share measures. See the “Adjusted Income––General Description of Adjusted Income Measure” section of our 2015 Financial Report for additional information.
| |
| • | senior management’s annual compensation is derived, in part, using Adjusted income and Adjusted diluted earnings per share measures. See the “Non-GAAP Financial Measure (Adjusted Income)––General Description of Non-GAAP Financial Measure (Adjusted Income)” section of our 2016 Financial Report for additional information. |
Adjusted income and its components and Adjusted diluted earnings per share are non-GAAP financial measures that have no standardized meaning prescribed by U.S. GAAP and, therefore, are limited in their usefulness to investors. Because of their non-standardized definitions, Adjusted income and its components (unlike U.S. GAAP net income and its components) and Adjusted diluted earnings per share (unlike U.S. GAAP diluted earnings per share) may not be comparable to the calculation of similar measures of other companies. Adjusted income and its components and Adjusted diluted earnings per share are presented solely to permit investors to more fully understand how management assesses performance.
We also recognize that, as internal measures of performance, the Adjusted income and its components and Adjusted diluted earnings per share measures have limitations, and we do not restrict our performance-management process solely to these metrics. A limitation of these measures is that they provide a view of our operations without including all events during a period, such as the effects of an acquisition or amortization of purchased intangibles, and do not provide a comparable view of our performance to other companies in the biopharmaceutical industry. We also use other specifically tailored tools designed to achieve the highest levels of performance. For example, our R&D organization has productivity targets, upon which its effectiveness is measured. In addition, total shareholder return, both on an absolute basis and relative to a group of pharmaceutical industry peers (pre-2015) or a publicly tradedpublicly-traded pharmaceutical index, plays a significant role in determining payouts under certain of Pfizer’s long-term incentive compensation plans.
See the accompanying reconciliations of certain GAAP reported to non-GAAP adjusted information for the second quarter and first six months of 20162017 and 20152016 below.
Purchase Accounting Adjustments
Adjusted income is calculated prior to considering certain significant purchase accounting impacts resulting from business combinations and net asset acquisitions. These impacts, primarily associated with Pharmacia Corporation (acquired in 2003), Wyeth (acquired in 2009), King Pharmaceuticals, Inc. (acquired in 2011), Hospira (acquired in September 2015) and, Anacor (acquired in June 2016) and Medivation (acquired in September 2016), can include the incremental charge to cost of sales from the sale of acquired inventory that was written up to fair value, amortization related to the increase in fair value of the acquired finite-lived intangible assets, and to a much lesser extent, depreciation related to the increase/decrease in fair value of the acquired fixed assets (primarily manufacturing facilities), amortization related to the increase in fair value of acquired debt, and the fair value changes associated with contingent consideration. Therefore, the Adjusted income measure includes the revenues earned upon the sale of the acquired products without considering the acquisition cost of those products.
Acquisition-Related Costs
Adjusted income is calculated prior to considering transaction, integration, restructuring and additional depreciation costs associated with business combinations because these costs are unique and vary withto each transaction and represent costs that were incurred to restructure and integrate two businesses as a result of the acquisition decision. For additional clarity, only transaction costs, additional depreciation and restructuring and integration activities that are associated with a business combination or a net-asset acquisition are included in acquisition-related costs. We have made no adjustments for the resulting synergies.
Discontinued Operations
Adjusted income is calculated prior to considering the results of operations included in discontinued operations, as well as any related gains or losses on the disposal of such operations.
Certain Significant Items
Adjusted income is calculated prior to considering certain significant items. Certain significant items represent substantive and/or unusual items that are evaluated on an individual basis. Such evaluation considers both the quantitative and the qualitative aspects of their nature. Certain significant items may be highly variable and difficult to predict. Furthermore, in some cases it is reasonably possible that they could reoccur in future periods. For example, major non-acquisition-related cost-reduction programs stand on their own as they are specific to an event or goal with a defined term, but we may have subsequent programs based on reorganizations of the business, cost productivity or in response to loss of exclusivity or economic conditions. Legal charges to resolve litigation are also related to specific cases, which are facts and circumstances specific and, in some cases, may also be the result of previouslylitigation matters at acquired companies that were inestimable, andnot probable or unresolved matters at the date of acquisition. Unusual items may represent items that are not part of our ongoing business; items that, either as a result of their nature or size, we would not expect to occur as part of our normal business on a regular basis; items that would be non-recurring; or items that relate to products we no longer sell. While not all-inclusive, examples of items that could be included as certain significant items would be a major non-acquisition-related restructuring charge and associated implementation costs; amounts related to certain disposals of businesses, products or facilities that do not qualify as discontinued operations under U.S. GAAP; certain intangible asset impairments; adjustments related to the resolution of certain tax positions; the impact of adopting certain significant, event-driven tax legislation; or charges related to certain legal matters, such as certain of those discussed in Notes to Condensed Consolidated Financial Statements—Note 12A. Commitments and Contingencies: Legal Proceedings, included in Part I, Item 1 of this Quarterly Report on Form 10-Q. Normal, ongoing defense costs of the Company or settlements of and accruals for legal matters made in the normal course of our business would not be considered certain significant items.
ReconciliationReconciliations of GAAP Reported to Non-GAAP Adjusted Information––Certain Line Items
| | | | | Three Months Ended July 3, 2016 | | Three Months Ended July 2, 2017 |
| IN MILLIONS, EXCEPT PER COMMON SHARE DATA | | GAAP Reported |
| | Purchase Accounting Adjustments(a) |
| | Acquisition-Related Costs(a) |
| | Discontinued Operations(a) |
| | Certain Significant Items(a) |
| | Non-GAAP Adjusted |
| | GAAP Reported |
| | Purchase Accounting Adjustments(a) |
| | Acquisition-Related Costs(a) |
| | Discontinued Operations(a) |
| | Certain Significant Items(a) |
| | Non-GAAP Adjusted |
|
| Revenues | | $ | 13,147 |
| | $ | — |
| | $ | — |
| | $ | — |
| | $ | — |
| | $ | 13,147 |
| | $ | 12,896 |
| | $ | — |
| | $ | — |
| | $ | — |
| | $ | — |
| | $ | 12,896 |
|
| Cost of sales | | 3,174 |
| | (52 | ) | | — |
| | — |
| | (60 | ) | | 3,062 |
| | 2,663 |
| | (10 | ) | | (9 | ) | | — |
| | (50 | ) | | 2,595 |
|
| Selling, informational and administrative expenses | | 3,471 |
| | (7 | ) | | — |
| | — |
| | (21 | ) | | 3,443 |
| | 3,425 |
| | (10 | ) | | — |
| | — |
| | (30 | ) | | 3,385 |
|
| Research and development expenses | | 1,748 |
| | (1 | ) | | — |
| | — |
| | (6 | ) | | 1,740 |
| | 1,780 |
| | 1 |
| | — |
| | — |
| | (11 | ) | | 1,771 |
|
| Amortization of intangible assets | | 961 |
| | (930 | ) | | — |
| | — |
| | — |
| | 31 |
| | 1,208 |
| | (1,167 | ) | | — |
| | — |
| | — |
| | 41 |
|
| Restructuring charges and certain acquisition-related costs | | 316 |
| | — |
| | (202 | ) | | — |
| | (114 | ) | | — |
| | 70 |
| | — |
| | (59 | ) | | — |
| | (11 | ) | | — |
|
| Other (income)/deductions––net | | 1,068 |
| | 7 |
| | — |
| | — |
| | (1,305 | ) | | (230 | ) | | (66 | ) | | (15 | ) | | — |
| | — |
| | (89 | ) | | (170 | ) |
| Income from continuing operations before provision for taxes on income | | 2,410 |
| | 984 |
| | 202 |
| | — |
| | 1,506 |
| | 5,101 |
| | 3,815 |
| | 1,201 |
| | 68 |
| | — |
| | 191 |
| | 5,275 |
|
Provision for taxes on income(b) | | 375 |
| | 272 |
| | 73 |
| | — |
| | 463 |
| | 1,184 |
| | 739 |
| | 344 |
| | 22 |
| | — |
| | 103 |
| | 1,207 |
|
| Income from continuing operations | | 2,035 |
| | 712 |
| | 129 |
| | — |
| | 1,042 |
| | 3,917 |
| | 3,077 |
| | 857 |
| | 46 |
| | — |
| | 88 |
| | 4,068 |
|
| Discontinued operations––net of tax | | 1 |
| | — |
| | — |
| | (1 | ) | | — |
| | — |
| | 2 |
| | — |
| | — |
| | (2 | ) | | — |
| | — |
|
| Net income attributable to noncontrolling interests | | 16 |
| | — |
| | — |
| | — |
| | — |
| | 16 |
| | 5 |
| | — |
| | — |
| | — |
| | — |
| | 5 |
|
| Net income attributable to Pfizer Inc. | | 2,019 |
| | 712 |
| | 129 |
| | (1 | ) | | 1,042 |
| | 3,901 |
| | 3,073 |
| | 857 |
| | 46 |
| | (2 | ) | | 88 |
| | 4,063 |
|
| Earnings per common share attributable to Pfizer Inc.––diluted | | 0.33 |
| | 0.12 |
| | 0.02 |
| | — |
| | 0.17 |
| | 0.64 |
| | 0.51 |
| | 0.14 |
| | 0.01 |
| | — |
| | 0.01 |
| | 0.67 |
|
| | | | | Six Months Ended July 3, 2016 | | Six Months Ended July 2, 2017 |
| IN MILLIONS, EXCEPT PER COMMON SHARE DATA | | GAAP Reported | | Purchase Accounting Adjustments(a) |
| | Acquisition-Related Costs(a) |
| | Discontinued Operations(a) |
| | Certain Significant Items(a) |
| | Non-GAAP Adjusted |
| | GAAP Reported |
| | Purchase Accounting Adjustments(a) |
| | Acquisition-Related Costs(a) |
| | Discontinued Operations(a) |
| | Certain Significant Items(a) |
| | Non-GAAP Adjusted |
|
| Revenues | | $ | 26,152 |
| | $ | — |
| | $ | — |
| | $ | — |
| | $ | — |
| | $ | 26,152 |
| | $ | 25,675 |
| | $ | — |
| | $ | — |
| | $ | — |
| | $ | — |
| | $ | 25,675 |
|
| Cost of sales | | 6,026 |
| | (252 | ) | | — |
| | — |
| | (147 | ) | | 5,627 |
| | 5,134 |
| | (17 | ) | | (12 | ) | | — |
| | (76 | ) | | 5,029 |
|
| Selling, informational and administrative expenses | | 6,856 |
| | (8 | ) | | — |
| | — |
| | (36 | ) | | 6,811 |
| | 6,733 |
| | (16 | ) | | — |
| | — |
| | (44 | ) | | 6,673 |
|
| Research and development expenses | | 3,478 |
| | 1 |
| | — |
| | — |
| | (16 | ) | | 3,463 |
| | 3,487 |
| | 5 |
| | — |
| | — |
| | (17 | ) | | 3,476 |
|
| Amortization of intangible assets | | 1,966 |
| | (1,905 | ) | | — |
| | — |
| | — |
| | 61 |
| | 2,394 |
| | (2,318 | ) | | — |
| | — |
| | — |
| | 76 |
|
| Restructuring charges and certain acquisition-related costs | | 457 |
| | — |
| | (317 | ) | | — |
| | (140 | ) | | — |
| | 228 |
| | — |
| | (180 | ) | | — |
| | (47 | ) | | — |
|
| Other (income)/deductions––net | | 1,398 |
| | 27 |
| | — |
| | — |
| | (1,805 | ) | | (380 | ) | | (68 | ) | | (28 | ) | | — |
| | — |
| | (163 | ) | | (258 | ) |
| Income from continuing operations before provision for taxes on income | | 5,971 |
| | 2,137 |
| | 317 |
| | — |
| | 2,144 |
| | 10,569 |
| | 7,767 |
| | 2,373 |
| | 192 |
| | — |
| | 348 |
| | 10,679 |
|
Provision for taxes on income(b) | | 910 |
| | 596 |
| | (26 | ) | | — |
| | 1,007 |
| | 2,487 |
| | 1,560 |
| | 684 |
| | 64 |
| | — |
| | 102 |
| | 2,410 |
|
| Income from continuing operations | | 5,060 |
| | 1,541 |
| | 344 |
| | — |
| | 1,136 |
| | 8,081 |
| | 6,207 |
| | 1,689 |
| | 128 |
| | — |
| | 246 |
| | 8,269 |
|
| Discontinued operations––net of tax | | 1 |
| | — |
| | — |
| | (1 | ) | | — |
| | — |
| | 1 |
| | — |
| | — |
| | (1 | ) | | — |
| | — |
|
| Net income attributable to noncontrolling interests | | 25 |
| | — |
| | — |
| | — |
| | — |
| | 25 |
| | 14 |
| | — |
| | — |
| | — |
| | — |
| | 14 |
|
| Net income attributable to Pfizer Inc. | | 5,036 |
| | 1,541 |
| | 344 |
| | (1 | ) | | 1,136 |
| | 8,056 |
| | 6,194 |
| | 1,689 |
| | 128 |
| | (1 | ) | | 246 |
| | 8,255 |
|
| Earnings per common share attributable to Pfizer Inc.––diluted | | 0.82 |
| | 0.25 |
| | 0.06 |
| | — |
| | 0.18 |
| | 1.30 |
| | 1.02 |
| | 0.28 |
| | 0.02 |
| | — |
| | 0.04 |
| | 1.36 |
|
See end of tables for notes (a) and (b).
| | | | | Three Months Ended June 28, 2015 | | Three Months Ended July 3, 2016 |
| IN MILLIONS, EXCEPT PER COMMON SHARE DATA | | GAAP Reported |
| | Purchase Accounting Adjustments(a) |
| | Acquisition-Related Costs(a) |
| | Discontinued Operations(a) |
| | Certain Significant Items(a) |
| | Non-GAAP Adjusted |
| | GAAP Reported |
| | Purchase Accounting Adjustments(a) |
| | Acquisition-Related Costs(a) |
| | Discontinued Operations(a) |
| | Certain Significant Items(a) |
| | Non-GAAP Adjusted |
|
| Revenues | | $ | 11,853 |
| | $ | — |
| | $ | — |
| | $ | — |
| | $ | — |
| | $ | 11,853 |
| | $ | 13,147 |
| | $ | — |
| | $ | — |
| | $ | — |
| | $ | — |
| | $ | 13,147 |
|
| Cost of sales | | 2,180 |
| | (1 | ) | | (17 | ) | | — |
| | (39 | ) | | 2,123 |
| | 3,174 |
| | (52 | ) | | — |
| | — |
| | (60 | ) | | 3,062 |
|
| Selling, informational and administrative expenses | | 3,386 |
| | 1 |
| | — |
| | — |
| | (15 | ) | | 3,372 |
| | 3,471 |
| | (7 | ) | | — |
| | — |
| | (21 | ) | | 3,443 |
|
| Research and development expenses | | 1,734 |
| | 2 |
| | — |
| | — |
| | (4 | ) | | 1,732 |
| | 1,748 |
| | (1 | ) | | — |
| | — |
| | (6 | ) | | 1,740 |
|
| Amortization of intangible assets | | 872 |
| | (839 | ) | | — |
| | — |
| | — |
| | 33 |
| | 961 |
| | (930 | ) | | — |
| | — |
| | — |
| | 31 |
|
| Restructuring charges and certain acquisition-related costs | | 86 |
| | — |
| | (51 | ) | | — |
| | (35 | ) | | — |
| | 316 |
| | — |
| | (202 | ) | | — |
| | (114 | ) | | — |
|
| Other (income)/deductions––net | | 55 |
| | 3 |
| | — |
| | — |
| | (211 | ) | | (153 | ) | | 1,068 |
| | 7 |
| | — |
| | — |
| | (1,305 | ) | | (230 | ) |
| Income from continuing operations before provision for taxes on income | | 3,539 |
| | 835 |
| | 68 |
| | — |
| | 305 |
| | 4,747 |
| | 2,410 |
| | 984 |
| | 202 |
| | — |
| | 1,506 |
| | 5,101 |
|
Provision for taxes on income(b) | | 905 |
| | 238 |
| | 18 |
| | — |
| | 52 |
| | 1,213 |
| |
Provision for taxes on income(b), (c) | | | 347 |
| | 272 |
| | 73 |
| | — |
| | 463 |
| | 1,156 |
|
Income from continuing operations | | 2,635 |
| | 597 |
| | 50 |
| | — |
| | 252 |
| | 3,534 |
| | 2,062 |
| | 712 |
| | 129 |
| | — |
| | 1,042 |
| | 3,945 |
|
| Discontinued operations––net of tax | | 1 |
| | — |
| | — |
| | (1 | ) | | — |
| | — |
| | 1 |
| | — |
| | — |
| | (1 | ) | | — |
| | — |
|
| Net income attributable to noncontrolling interests | | 9 |
| | — |
| | — |
| | — |
| | — |
| | 9 |
| | 16 |
| | — |
| | — |
| | — |
| | — |
| | 16 |
|
Net income attributable to Pfizer Inc. | | 2,626 |
| | 597 |
| | 50 |
| | (1 | ) | | 252 |
| | 3,525 |
| | 2,047 |
| | 712 |
| | 129 |
| | (1 | ) | | 1,042 |
| | 3,929 |
|
Earnings per common share attributable to Pfizer Inc.––diluted | | 0.42 |
| | 0.10 |
| | 0.01 |
| | — |
| | 0.04 |
| | 0.56 |
| | 0.33 |
| | 0.12 |
| | 0.02 |
| | — |
| | 0.17 |
| | 0.64 |
|
| | | | | Six Months Ended June 28, 2015 | | Six Months Ended July 3, 2016 |
| IN MILLIONS, EXCEPT PER COMMON SHARE DATA | | GAAP Reported | | Purchase Accounting Adjustments(a) | | Acquisition-Related Costs(a) | | Discontinued Operations(a) | | Certain Significant Items(a) | | Non-GAAP Adjusted | | GAAP Reported |
| | Purchase Accounting Adjustments(a) |
| | Acquisition-Related Costs(a) | | Discontinued Operations(a) |
| | Certain Significant Items(a) |
| | Non-GAAP Adjusted |
|
| Revenues | | $ | 22,717 |
| | $ | — |
| | $ | — |
| | $ | — |
| | $ | — |
| | $ | 22,717 |
| | $ | 26,152 |
| | $ | — |
| | $ | — |
| | $ | — |
| | $ | — |
| | $ | 26,152 |
|
| Cost of sales | | 4,018 |
| | (3 | ) | | (26 | ) | | — |
| | (60 | ) | | 3,930 |
| | 6,026 |
| | (252 | ) | | — |
| | — |
| | (147 | ) | | 5,627 |
|
| Selling, informational and administrative expenses | | 6,491 |
| | 1 |
| | — |
| | — |
| | (43 | ) | | 6,449 |
| | 6,856 |
| | (8 | ) | | — |
| | — |
| | (36 | ) | | 6,811 |
|
| Research and development expenses | | 3,620 |
| | 3 |
| | — |
| | — |
| | (14 | ) | | 3,609 |
| | 3,478 |
| | 1 |
| | — |
| | — |
| | (16 | ) | | 3,463 |
|
| Amortization of intangible assets | | 1,811 |
| | (1,745 | ) | | — |
| | — |
| | — |
| | 67 |
| | 1,966 |
| | (1,905 | ) | | — |
| | — |
| | — |
| | 61 |
|
| Restructuring charges and certain acquisition-related costs | | 146 |
| | — |
| | (65 | ) | | — |
| | (81 | ) | | — |
| | 457 |
| | — |
| | (317 | ) | | — |
| | (140 | ) | | — |
|
| Other (income)/deductions––net | | 9 |
| | 5 |
| | — |
| | — |
| | (335 | ) | | (320 | ) | | 1,398 |
| | 27 |
| | — |
| | — |
| | (1,805 | ) | | (380 | ) |
| Income from continuing operations before provision for taxes on income | | 6,621 |
| | 1,738 |
| | 91 |
| | — |
| | 532 |
| | 8,982 |
| | 5,971 |
| | 2,137 |
| | 317 |
| | — |
| | 2,144 |
| | 10,569 |
|
Provision for taxes on income(b) | | 1,610 |
| | 499 |
| | 24 |
| | — |
| | 113 |
| | 2,247 |
| |
Provision for taxes on income(b) (c) | | | 861 |
| | 596 |
| | (26 | ) | | — |
| | 1,007 |
| | 2,438 |
|
Income from continuing operations | | 5,011 |
| | 1,239 |
| | 67 |
| | — |
| | 419 |
| | 6,736 |
| | 5,110 |
| | 1,541 |
| | 344 |
| | — |
| | 1,136 |
| | 8,131 |
|
| Discontinued operations––net of tax | | 6 |
| | — |
| | — |
| | (6 | ) | | — |
| | — |
| | 1 |
| | — |
| | — |
| | (1 | ) | | — |
| | — |
|
| Net income attributable to noncontrolling interests | | 14 |
| | — |
| | — |
| | — |
| | — |
| | 14 |
| | 25 |
| | — |
| | — |
| | — |
| | — |
| | 25 |
|
Net income attributable to Pfizer Inc. | | 5,002 |
| | 1,239 |
| | 67 |
| | (6 | ) | | 419 |
| | 6,721 |
| | 5,085 |
| | 1,541 |
| | 344 |
| | (1 | ) | | 1,136 |
| | 8,105 |
|
Earnings per common share attributable to Pfizer Inc.––diluted | | 0.80 |
| | 0.20 |
| | 0.01 |
| | — |
| | 0.07 |
| | 1.07 |
| | 0.82 |
| | 0.25 |
| | 0.06 |
| | — |
| | 0.18 |
| | 1.31 |
|
| |
(a) | For details of adjustments, see “Details of Income Statement Items Included in GAAP Reported but Excluded from Non-GAAP Adjusted Income” below. |
| |
(b) | The effective tax rate on Non-GAAP Adjusted income was 23.2%22.9% in the second quarter of 2016, compared with 25.6%2017, which was comparable to the effective tax rate of 22.7% in the second quarter of 2015.2016. The effective tax rate on Non-GAAP Adjusted income was 22.6% in the first six months of 2017, compared with 23.1% in the first six months of 2016. This decline was primarily due to a favorable change in the jurisdictional mix of earnings as well as an increase in tax benefits associated with the U.S. R&D tax credit, which was not in effecta result of operating fluctuations in the prior year quarter but was permanently extended on December 18, 2015. The effective tax rate on Non-GAAP Adjusted income was 23.5% in the first six monthsnormal course of 2016, compared with 25.0% in the first six months of 2015. This decline was primarily due tobusiness, partially offset by a favorable change in the jurisdictional mix of earnings, an increase in tax benefits associated with the U.S. R&D tax credit, which was not in effect in the first six months of the prior year but was permanently extended on December 18, 2015, as well as an increasedecrease in tax benefits associated with the resolution of certain tax positions pertaining to prior years primarily with various foreign tax authorities, and the expiration of certain statutes of limitations. |
| |
(c) | GAAP Reported and Non-GAAP Adjusted amounts for the three and six months ended July 3, 2016 have been revised from previously reported amounts to reflect the adoption of a new accounting standard in the fourth quarter of 2016, as of January 1, 2016, requiring: (i) excess tax benefits or deficiencies (including tax benefits of dividend equivalents) of share-based compensation to be recognized as a component of the Provision for taxes on income (the net tax benefit was $28 million in the first quarter of 2016 and $50 million in the first six months of 2016) and (ii) in the diluted net earnings per share calculation, when applying the treasury stock method for shares that could be repurchased, the assumed proceeds no longer include the amount of excess tax benefit. For additional information, see Notes to Consolidated Financial Statements––Note 1B. Adoption of New Accounting Standards in Pfizer’s 2016 Financial Report. |
Details of Income Statement Items Included in GAAP Reported but Excluded from Non-GAAP Adjusted Income | | | Adjusted income, as shown above, excludes the following items: | |
| | | Three Months Ended | | Six Months Ended | | Three Months Ended | | Six Months Ended |
| (MILLIONS OF DOLLARS) | | July 3,
2016 |
| | June 28,
2015 |
| | July 3,
2016 |
| | June 28,
2015 |
| | July 2,
2017 |
| | July 3,
2016 |
| | July 2,
2017 |
| | July 3,
2016 |
|
| Purchase accounting adjustments | | | | | | | | | | | | | | | | |
Amortization, depreciation and other(a) | | $ | 932 |
| | $ | 834 |
| | $ | 1,885 |
| | $ | 1,735 |
| | $ | 1,191 |
| | $ | 932 |
| | $ | 2,356 |
| | $ | 1,885 |
|
| Cost of sales | | 52 |
| | 1 |
| | 252 |
| | 3 |
| | 10 |
| | 52 |
| | 17 |
| | 252 |
|
| Total purchase accounting adjustments––pre-tax | | 984 |
| | 835 |
| | 2,137 |
| | 1,738 |
| | 1,201 |
| | 984 |
| | 2,373 |
| | 2,137 |
|
Income taxes(b) | | (272 | ) | | (238 | ) | | (596 | ) | | (499 | ) | | (344 | ) | | (272 | ) | | (684 | ) | | (596 | ) |
| Total purchase accounting adjustments––net of tax | | 712 |
| | 597 |
| | 1,541 |
| | 1,239 |
| | 857 |
| | 712 |
| | 1,689 |
| | 1,541 |
|
| Acquisition-related costs | | | | |
| | |
| | |
| | | | |
| | |
| | |
|
Restructuring charges(c) | | 26 |
| | 8 |
| | 30 |
| | 5 |
| | 3 |
| | 26 |
| | 12 |
| | 30 |
|
Transaction costs(c) | | 36 |
| | 1 |
| | 60 |
| | 6 |
| | 6 |
| | 36 |
| | 18 |
| | 60 |
|
Integration costs(c) | | 139 |
| | 42 |
| | 227 |
| | 54 |
| | 50 |
| | 139 |
| | 151 |
| | 227 |
|
Additional depreciation––asset restructuring(d) | | — |
| | 17 |
| | — |
| | 26 |
| | 9 |
| | — |
| | 12 |
| | — |
|
| Total acquisition-related costs––pre-tax | | 202 |
| | 68 |
| | 317 |
| | 91 |
| | 68 |
| | 202 |
| | 192 |
| | 317 |
|
Income taxes(e) | | (73 | ) | | (18 | ) | | 26 |
| | (24 | ) | | (22 | ) | | (73 | ) | | (64 | ) | | 26 |
|
| Total acquisition-related costs––net of tax | | 129 |
| | 50 |
| | 344 |
| | 67 |
| | 46 |
| | 129 |
| | 128 |
| | 344 |
|
| Discontinued operations | | | | |
| | |
| | |
| | | | |
| | |
| | |
|
Total discontinued operations––net of tax, attributable to Pfizer Inc.(f) | | (1 | ) | | (1 | ) | | (1 | ) | | (6 | ) | | (2 | ) | | (1 | ) | | (1 | ) | | (1 | ) |
| Certain significant items | | | | |
| | |
| | |
| | | | |
| | |
| | |
|
Restructuring charges(g) | | 114 |
| | 35 |
| | 140 |
| | 81 |
| | 11 |
| | 114 |
| | 47 |
| | 140 |
|
Implementation costs and additional depreciation––asset restructuring(h) | | 117 |
| | 56 |
| | 228 |
| | 114 |
| | 74 |
| | 117 |
| | 116 |
| | 228 |
|
Certain legal matters, net(i) | | 261 |
| | 92 |
| | 546 |
| | 92 |
| | — |
| | 261 |
| | 8 |
| | 546 |
|
Loss on sale of HIS net assets(i) | | | 28 |
| | — |
| | 64 |
| | — |
|
Certain asset impairments(i) | | 816 |
| | — |
| | 947 |
| | — |
| | — |
| | 816 |
| | — |
| | 947 |
|
Business and legal entity alignment costs(j)(i) | | 60 |
| | 63 |
| | 111 |
| | 164 |
| | 17 |
| | 60 |
| | 38 |
| | 111 |
|
Other(k)(j) | | 138 |
| | 58 |
| | 172 |
| | 81 |
| | 61 |
| | 138 |
| | 74 |
| | 172 |
|
| Total certain significant items––pre-tax | | 1,506 |
| | 305 |
| | 2,144 |
| | 532 |
| | 191 |
| | 1,506 |
| | 348 |
| | 2,144 |
|
Income taxes(l)(k) | | (463 | ) | | (52 | ) | | (1,007 | ) | | (113 | ) | | (103 | ) | | (463 | ) | | (102 | ) | | (1,007 | ) |
| Total certain significant items––net of tax | | 1,042 |
| | 252 |
| | 1,136 |
| | 419 |
| | 88 |
| | 1,042 |
| | 246 |
| | 1,136 |
|
| Total purchase accounting adjustments, acquisition-related costs, discontinued operations and certain significant items––net of tax, attributable to Pfizer Inc. | | $ | 1,882 |
| | $ | 899 |
| | $ | 3,020 |
| | $ | 1,719 |
| | $ | 990 |
| | $ | 1,882 |
| | $ | 2,061 |
| | $ | 3,020 |
|
| |
(a) | Included primarily in Amortization of intangible assets. |
| |
(b) | Included in Provision for taxes on income. Income taxes includes the tax effect of the associated pre-tax amounts, calculated by determining the jurisdictional location of the pre-tax amounts and applying that jurisdiction’s applicable tax rate. |
| |
(c) | Included in Restructuring charges and certain acquisition-related costs (see Notes to Condensed Consolidated Financial Statements—Note 3. Restructuring Charges and Other Costs Associated with Acquisitions and Cost-Reduction/Productivity Initiatives). Restructuring charges include employee termination costs, asset impairments and other exit costs associated with business combinations. Transaction costs primarily represent external costs for banking, legal, accounting and other similar services. Integration costs represent external, incremental costs directly related to integrating acquired businesses, and primarily include expenditures for consulting and the integration of systems and processes. For additional information, see Notes to Condensed Consolidated Financial Statements—Note 3. Restructuring Charges and Other Costs Associated with Acquisitions and Cost-Reduction/Productivity Initiatives. |
| |
(d) | Included in Cost of sales. Represents the impact of changes in estimated useful lives of assets involved in restructuring actions related to acquisitions. Included in Cost of sales for both the three and six months ended July 3, 2016 and June 28, 2015. |
| |
(e) | Included in Provision for taxes on income. Income taxes includes the tax effect of the associated pre-tax amounts, calculated by determining the jurisdictional location of the pre-tax amounts and applying that jurisdiction’s applicable tax rate. The six months ended July 3, 2016were unfavorably impacted by the remeasurement of certain deferred tax liabilities resulting from plant network restructuring activities. |
| |
(f) | Included in Discontinued operations––net of tax.For the three and six months ended June 28, 2015, represents post-close adjustments. |
| |
(g) | Amounts relate to our cost-reduction/productivity initiatives not related to acquisitions. Included in Restructuring charges and certain acquisition-related costs (see Notes to Condensed Consolidated Financial Statements—Note 3. Restructuring Charges and Other Costs Associated with Acquisitions and Cost-Reduction/Productivity Initiatives). |
| |
(h) | Amounts relate to our cost-reduction/productivity initiatives not related to acquisitions (see Notes to Condensed Consolidated Financial Statements—Note 3. Restructuring Charges and Other Costs Associated with Acquisitions and Cost-Reduction/Productivity Initiatives). For the three months ended July 2, 2017, included in Cost of sales ($48 million), Selling, informational and administrative expenses ($15 million) and Research and development expenses ($11 million). For the three months ended July 3, 2016, virtually all included in Cost of sales ($sales ($90 million)million), Selling, informational and administrative expenses ($ ($20 million)million) and Research and development expenses ($ ($6 million)million). For the threesix months ended June 28, 2015, virtually allJuly 2, 2017, included in Cost of sales ($3975 million), Selling, informational and administrative expenses ($13 million) and Research and development24 |
million) and Research and developmentexpenses ($417 million). For the six months ended July 3, 2016, virtually all included in Cost of sales ($ ($180 million), Selling, informational and administrativeexpenses ($33 million) and Research and developmentexpenses ($14 million). For the six months ended June 28, 2015, virtually all included in Cost of sales ($61 million), Selling, informational and administrative expenses ($39 million) and Research and development expenses ($14 million).
| |
(i) | Included in Other (income)/deductions—net (see the “Other (Income)/Deductions—Net” section of this MD&A and Notes to Condensed Consolidated Financial Statements—Note 4. Other (Income)/Deductions—Net). |
| |
(j) | IncludedFor the three months ended July 2, 2017, virtually all included in Other (income)/deductions––net ($45 million) and Selling, informational and administrative expenses ($15 million). For the six months ended July 2, 2017, virtually all included in Other (income)/deductions––net ($52 million) and Selling, informational and administrative expenses ($20 million). For the three and six months ended July 3, 2016, primarily all included in Other (income)/deductions––net. RepresentsFor the three and six months ended July 2, 2017, includes a net loss of $30 million related to the sale of our 40% ownership investment in Teuto, including the extinguishment of a put option for the remaining 60% ownership interest. For the three and six months ended July 3, 2016, primarily includes $150 million paid to Allergan for reimbursement of Allergan’s expenses for changes to our infrastructure to align our commercial operations, including costs to internally separate our businesses into distinct legal entities as well as to streamline our intercompany supply operations to better support each business.associated with the terminated transaction.
|
| |
(k) | Primarily all included in Other (income)/deductions––net (see the “Other (Income)/Deductions—Net” section of this MD&A and Notes to Condensed Consolidated Financial Statements—Note 4. Other (Income)/Deductions—Net).
|
| |
(l)
| Included in Provision for taxes on income. Income taxes includes the tax effect of the associated pre-tax amounts, calculated by determining the jurisdictional location of the pre-tax amounts and applying that jurisdiction’s applicable tax rate. The first six months of 2016 were favorably impacted by benefits related to the final resolution of an agreement in principle reached in February 2016 and finalized in April 2016 to resolve certain claims related to Protonix, which resulted in the receipt of information that raised our initial assessment in 2015 of the likelihood of prevailing on the technical merits of our tax position, as well as benefits associated with our Venezuela operations. |
ANALYSIS OF OPERATING SEGMENT INFORMATION
The following tables and associated notes provide additional information about the performance of our two operating segments—the IH segment and the EH segment. For additional information about each operating segment, see the “Our Strategy––Commercial Operations” section of this MD&A and Notes to Condensed Consolidated Financial Statements—Note 13. Segment, Geographic and Other Revenue Information, as well as the “Selected Balance Sheet Information by Operating Segment” section of the MD&A in our Form 10-Q for the quarter ended April 3, 2016, which presents selected balance sheet information for the businesses previously managed as the GIP segment2, 2017.
As described in Note 1A, acquisitions and the VOC segment, which are now managed as the IH segment,divestitures have impacted our results of operations in 2017 and for the Established Products business, which has been renamed Pfizer Essential Health.2016.
|
| | | | | | | | | | | | | | | | | | | | | | | | |
| The following tables provide revenue and cost information by reportable operating segment and a reconciliation of that information to our condensed consolidated statements of income: |
| | | Second Quarter of 2017 |
| (MILLIONS OF DOLLARS) | | Innovative Health (IH)(a) |
| | Essential Health (EH)(a) |
| | Other(b) |
| | Non-GAAP Adjusted(c) |
| | Reconciling Items(d) |
| | GAAP Reported |
|
| Revenues | | $ | 7,671 |
| | $ | 5,226 |
| | $ | — |
| | $ | 12,896 |
| | $ | — |
| | $ | 12,896 |
|
| Cost of sales | | 982 |
| | 1,421 |
| | 192 |
| | 2,595 |
| | 69 |
| | 2,663 |
|
| % of revenue | | 12.8 | % |
| 27.2 | % |
| * |
|
| 20.1 | % |
| * |
|
| 20.7 | % |
| Selling, informational and administrative expenses | | 1,664 |
| | 777 |
| | 944 |
| | 3,385 |
| | 40 |
| | 3,425 |
|
| Research and development expenses | | 548 |
| | 255 |
| | 968 |
| | 1,771 |
| | 9 |
| | 1,780 |
|
| Amortization of intangible assets | | 24 |
| | 17 |
| | — |
| | 41 |
| | 1,167 |
| | 1,208 |
|
| Restructuring charges and certain acquisition-related costs | | — |
| | — |
| | — |
| | — |
| | 70 |
| | 70 |
|
| Other (income)/deductions––net | | (212 | ) | | (32 | ) | | 74 |
| | (170 | ) | | 104 |
| | (66 | ) |
| Income/(loss) from continuing operations before provision for taxes on income | | $ | 4,666 |
| | $ | 2,787 |
| | $ | (2,179 | ) | | $ | 5,275 |
| | $ | (1,459 | ) | | $ | 3,815 |
|
Effective as of the beginning of 2016, the following changes impact EH: |
| | | | | | | | | | | | | | | | | | | | | | | | |
| | | Six Months Ended July 2, 2017 |
| (MILLIONS OF DOLLARS) | | Innovative Health (IH)(a) |
| | Essential Health (EH)(a) |
| | Other(b) |
| | Non-GAAP
Adjusted(c) |
| | Reconciling Items(d) |
| | GAAP Reported |
|
| Revenues | | $ | 15,086 |
| | $ | 10,590 |
| | $ | — |
| | $ | 25,675 |
| | $ | — |
| | $ | 25,675 |
|
| Cost of sales | | 1,830 |
| | 2,872 |
| | 327 |
| | 5,029 |
| | 104 |
| | 5,134 |
|
| % of revenue | | 12.1 | % | | 27.1 | % | | * |
| | 19.6 | % | | * |
| | 20.0 | % |
| Selling, informational and administrative expenses | | 3,178 |
| | 1,485 |
| | 2,010 |
| | 6,673 |
| | 60 |
| | 6,733 |
|
| Research and development expenses | | 1,071 |
| | 506 |
| | 1,899 |
| | 3,476 |
| | 12 |
| | 3,487 |
|
| Amortization of intangible assets | | 50 |
| | 26 |
| | — |
| | 76 |
| | 2,318 |
| | 2,394 |
|
| Restructuring charges and certain acquisition-related costs | | — |
| | — |
| | — |
| | — |
| | 228 |
| | 228 |
|
| Other (income)/deductions––net | | (359 | ) | | (93 | ) | | 193 |
| | (258 | ) | | 191 |
| | (68 | ) |
| Income/(loss) from continuing operations before provision for taxes on income | | $ | 9,316 |
| | $ | 5,793 |
| | $ | (4,430 | ) | | $ | 10,679 |
| | $ | (2,913 | ) | | $ | 7,767 |
|
Our entire contract manufacturing business, Pfizer CentreOne (previously known as Pfizer CentreSource or PCS), is part of EH. Pfizer CentreOne consists of (i) the revenues and expenses of legacy Pfizer's contract manufacturing and active pharmaceutical ingredient sales operation, including the revenues and expenses related to our manufacturing and supply agreements with Zoetis; and (ii) the revenues and expenses of legacy Hospira's One-2-One sterile injectables contract manufacturing operation, which has been included in EH since we acquired Hospira on September 3, 2015. Prior to 2016, PCS was managed outside our operating segments as part of PGS and reported as "Other Business Activities". We have reclassified prior period PCS operating results ($133 million of PCS revenues and $30 million of PCS earnings in the second quarter of 2015, and $244 million of PCS revenues and $52 million of PCS earnings in the first six months of 2015) to conform to the current period presentation as part of EH.
In connection with the formation of a new EH R&D organization, certain functions transferred from Pfizer’s WRD organization to the new EH R&D organization. The new R&D organization within EH expects to develop potential new sterile injectable drugs and therapeutic solutions, as well as biosimilars. We have reclassified approximately $67 million of costs in the second quarter of 2015 and $134 million of costs in the first six months of 2015 from WRD to EH to conform to the current period presentation as part of EH.
Effective as of the beginning of the second quarter of 2016, the following changes impact IH:
In connection with the formation of the GPD organization, a new unified center for late-stage development for our innovative products, which is generally responsible for the clinical development of assets that are in clinical trials for our WRD and Innovative portfolios, certain development-related functions transferred from IH to GPD. We have reclassified approximately $76 million of costs in the first quarter of 2016, approximately $73 million of costs in the second quarter of 2015 and approximately $147 million of costs in the first six months of 2015 from IH to GPD to conform to the current period presentation as part of GPD.
| | | The following tables provide revenue and cost information by reportable operating segment and a reconciliation of that information to our condensed consolidated statements of income: | |
| | | Second Quarter of 2016 | | Second Quarter of 2016 |
| (MILLIONS OF DOLLARS) | | Innovative Health (IH)(a) |
| | Essential Health (EH)(a) |
| | Other(b) |
| | Non-GAAP Adjusted(c) |
| | Reconciling Items(d) |
| | GAAP Reported |
| | Innovative Health (IH)(a) |
| | Essential Health (EH)(a) |
| | Other(b) |
| | Non-GAAP
Adjusted(c) |
| | Reconciling Items(d) |
| | GAAP Reported |
|
| Revenues | | $ | 7,105 |
| | $ | 6,042 |
| | $ | — |
| | $ | 13,147 |
| | $ | — |
| | $ | 13,147 |
| | $ | 7,105 |
| | $ | 6,042 |
| | $ | — |
| | $ | 13,147 |
| | $ | — |
| | $ | 13,147 |
|
| Cost of sales | | 997 |
| | 1,678 |
| | 388 |
| | 3,062 |
| | 112 |
| | 3,174 |
| | 997 |
| | 1,678 |
| | 388 |
| | 3,062 |
| | 112 |
| | 3,174 |
|
| % of revenue | | 14.0 | % | | 27.8 | % | | * |
| | 23.3 | % | | * |
| | 24.1 | % | | 14.0 | % |
| 27.8 | % |
| * |
|
| 23.3 | % |
| * |
|
| 24.1 | % |
| Selling, informational and administrative expenses | | 1,615 |
| | 885 |
| | 943 |
| | 3,443 |
| | 28 |
| | 3,471 |
| | 1,615 |
| | 885 |
| | 943 |
| | 3,443 |
| | 28 |
| | 3,471 |
|
| Research and development expenses | | 583 |
| | 308 |
| | 849 |
| | 1,740 |
| | 7 |
| | 1,748 |
| | 583 |
| | 308 |
| | 849 |
| | 1,740 |
| | 7 |
| | 1,748 |
|
| Amortization of intangible assets | | 24 |
| | 7 |
| | — |
| | 31 |
| | 930 |
| | 961 |
| | 24 |
| | 7 |
| | — |
| | 31 |
| | 930 |
| | 961 |
|
| Restructuring charges and certain acquisition-related costs | | — |
| | — |
| | — |
| | — |
| | 316 |
| | 316 |
| | — |
| | — |
| | — |
| | — |
| | 316 |
| | 316 |
|
| Other (income)/deductions––net | | (292 | ) | | (34 | ) | | 96 |
| | (230 | ) | | 1,298 |
| | 1,068 |
| | (292 | ) | | (34 | ) | | 96 |
| | (230 | ) | | 1,298 |
| | 1,068 |
|
| Income from continuing operations before provision for taxes on income | | $ | 4,179 |
| | $ | 3,198 |
| | $ | (2,276 | ) | | $ | 5,101 |
| | $ | (2,691 | ) | | $ | 2,410 |
| |
| Income/(loss) from continuing operations before provision for taxes on income | | | $ | 4,179 |
| | $ | 3,198 |
| | $ | (2,276 | ) | | $ | 5,101 |
| | $ | (2,691 | ) | | $ | 2,410 |
|
See end of tables for notes (a) through (d).
|
| | | | | | | | | | | | | | | | | | | | | | | | |
| | Six Months Ended July 3, 2016 |
| (MILLIONS OF DOLLARS) | | Innovative Health (IH)(a) |
| | Essential Health (EH)(a) |
| | Other(b) |
| | Non-GAAP
Adjusted(c) |
| | Reconciling Items(d) |
| | GAAP Reported |
|
| Revenues | | $ | 14,139 |
| | $ | 12,013 |
| | $ | — |
| | $ | 26,152 |
| | $ | — |
| | $ | 26,152 |
|
| Cost of sales | | 1,891 |
| | 3,131 |
| | 605 |
| | 5,627 |
| | 399 |
| | 6,026 |
|
| % of revenue | | 13.4 | % | | 26.1 | % | | * |
| | 21.5 | % | | * |
| | 23.0 | % |
| Selling, informational and administrative expenses | | 3,300 |
| | 1,622 |
| | 1,889 |
| | 6,811 |
| | 44 |
| | 6,856 |
|
| Research and development expenses | | 1,145 |
| | 584 |
| | 1,734 |
| | 3,463 |
| | 15 |
| | 3,478 |
|
| Amortization of intangible assets | | 48 |
| | 13 |
| | — |
| | 61 |
| | 1,905 |
| | 1,966 |
|
| Restructuring charges and certain acquisition-related costs | | — |
| | — |
| | — |
| | — |
| | 457 |
| | 457 |
|
| Other (income)/deductions––net | | (528 | ) | | (194 | ) | | 342 |
| | (380 | ) | | 1,778 |
| | 1,398 |
|
| Income from continuing operations before provision for taxes on income | | $ | 8,282 |
| | $ | 6,857 |
| | $ | (4,570 | ) | | $ | 10,569 |
| | $ | (4,598 | ) | | $ | 5,971 |
|
|
| | | | | | | | | | | | | | | | | | | | | | | | |
| | Second Quarter of 2015 |
| (MILLIONS OF DOLLARS) | | Innovative Health (IH)(a) |
| | Essential Health (EH)(a) |
| | Other(b) |
| | Non-GAAP
Adjusted(c) |
| | Reconciling Items(d) |
| | GAAP Reported |
|
| Revenues | | $ | 6,630 |
| | $ | 5,223 |
| | $ | — |
| | $ | 11,853 |
| | $ | — |
| | $ | 11,853 |
|
| Cost of sales | | 937 |
| | 1,042 |
| | 144 |
| | 2,123 |
| | 58 |
| | 2,180 |
|
| % of revenue | | 14.1 | % | | 19.9 | % | | * |
| | 17.9 | % | | * |
| | 18.4 | % |
| Selling, informational and administrative expenses | | 1,619 |
| | 840 |
| | 913 |
| | 3,372 |
| | 15 |
| | 3,386 |
|
| Research and development expenses | | 573 |
| | 219 |
| | 941 |
| | 1,732 |
| | 2 |
| | 1,734 |
|
| Amortization of intangible assets | | 23 |
| | 10 |
| | — |
| | 33 |
| | 839 |
| | 872 |
|
| Restructuring charges and certain acquisition-related costs | | — |
| | — |
| | — |
| | — |
| | 86 |
| | 86 |
|
| Other (income)/deductions––net | | (286 | ) | | (31 | ) | | 164 |
| | (153 | ) | | 209 |
| | 55 |
|
| Income from continuing operations before provision for taxes on income | | $ | 3,764 |
| | $ | 3,144 |
| | $ | (2,161 | ) | | $ | 4,747 |
| | $ | (1,208 | ) | | $ | 3,539 |
|
| | | | Six Months Ended June 28, 2015 | | Six Months Ended July 3, 2016 |
| (MILLIONS OF DOLLARS) | | Innovative Health (IH)(a) |
| | Essential Health (EH)(a) |
| | Other(b) |
| | Non-GAAP
Adjusted(c) |
| | Reconciling Items(d) |
| | GAAP Reported |
| | Innovative Health (IH)(a) |
| | Essential Health (EH)(a) |
| | Other(b) |
| | Non-GAAP
Adjusted(c) |
| | Reconciling Items(d) |
| | GAAP Reported |
|
| Revenues | | $ | 12,368 |
| | $ | 10,348 |
| | $ | — |
| | $ | 22,717 |
| | $ | — |
| | $ | 22,717 |
| | $ | 14,139 |
| | $ | 12,013 |
| | $ | — |
| | $ | 26,152 |
| | $ | — |
| | $ | 26,152 |
|
| Cost of sales | | 1,703 |
| | 2,044 |
| | 182 |
| | 3,930 |
| | 89 |
| | 4,018 |
| | 1,891 |
| | 3,131 |
| | 605 |
| | 5,627 |
| | 399 |
| | 6,026 |
|
| % of revenue | | 13.8 | % | | 19.8 | % | | * |
| | 17.3 | % | | * |
| | 17.7 | % | | 13.4 | % | | 26.1 | % | | * |
| | 21.5 | % | | * |
| | 23.0 | % |
| Selling, informational and administrative expenses | | 3,021 |
| | 1,544 |
| | 1,884 |
| | 6,449 |
| | 42 |
| | 6,491 |
| | 3,300 |
| | 1,622 |
| | 1,889 |
| | 6,811 |
| | 44 |
| | 6,856 |
|
| Research and development expenses | | 1,315 |
| | 419 |
| | 1,875 |
| | 3,609 |
| | 10 |
| | 3,620 |
| | 1,145 |
| | 584 |
| | 1,734 |
| | 3,463 |
| | 15 |
| | 3,478 |
|
| Amortization of intangible assets | | 47 |
| | 20 |
| | — |
| | 67 |
| | 1,745 |
| | 1,811 |
| | 48 |
| | 13 |
| | — |
| | 61 |
| | 1,905 |
| | 1,966 |
|
| Restructuring charges and certain acquisition-related costs | | — |
| | — |
| | — |
| | — |
| | 146 |
| | 146 |
| | — |
| | — |
| | — |
| | — |
| | 457 |
| | 457 |
|
| Other (income)/deductions––net | | (531 | ) | | (38 | ) | | 249 |
| | (320 | ) | | 329 |
| | 9 |
| | (528 | ) | | (194 | ) | | 342 |
| | (380 | ) | | 1,778 |
| | 1,398 |
|
| Income from continuing operations before provision for taxes on income | | $ | 6,813 |
| | $ | 6,359 |
| | $ | (4,190 | ) | | $ | 8,982 |
| | $ | (2,361 | ) | | $ | 6,621 |
| |
| Income/(loss) from continuing operations before provision for taxes on income | | | $ | 8,282 |
| | $ | 6,857 |
| | $ | (4,570 | ) | | $ | 10,569 |
| | $ | (4,598 | ) | | $ | 5,971 |
|
| |
(a) | Amounts represent the revenues and costs managed by each of our operating segments. The expenses generally include only those costs directly attributable to the operating segment.On September 3, 2015, we acquired Hospira. Commencing from the acquisition date, our condensed consolidated statement of income includes the operating results of Hospira. As a result, legacy Hospira commercial operations, including the legacy Hospira One-2-One contract manufacturing business, are included in EH’s operating results in our condensed consolidated statements of income for the second quarter and first six months of 2016, but not for the second quarter and first six months of 2015. See Notes to Condensed Consolidated Financial Statements––Note 2A. Acquisitions, Research and Development and Collaborative Arrangements, Equity-Method Investments and Cost-Method Investment: Acquisitions for additional information. |
| |
(b) | Other comprises the revenues and costs included in our Adjusted income components (see footnote (c) below) that are managed outside of our two operating segments and includes the following: |
|
| | | | | | | | | | | | | | | | | | | | |
| | | Second Quarter of 2017 |
| | | Other Business Activities | | | |
| (MILLIONS OF DOLLARS) | | WRD(i) |
| | GPD(ii) | | Corporate(iii) |
| | Other Unallocated(iv) | | Total |
|
| Revenues | | $ | — |
| | $ | — |
| | $ | — |
| | $ | — |
| | $ | — |
|
| Cost of sales | | — |
| | — |
| | (5 | ) | | 197 |
| | 192 |
|
| Selling, informational and administrative expenses | | — |
| | — |
| | 942 |
| | 3 |
| | 944 |
|
| Research and development expenses | | 580 |
| | 187 |
| | 202 |
| | (1 | ) | | 968 |
|
| Amortization of intangible assets | | — |
| | — |
| | — |
| | — |
| | — |
|
| Restructuring charges and certain acquisition-related costs | | — |
| | — |
| | — |
| | — |
| | — |
|
| Other (income)/deductions––net | | (9 | ) | | — |
| | 83 |
| | 1 |
| | 74 |
|
| Loss from continuing operations before provision for taxes on income | | $ | (571 | ) | | $ | (187 | ) | | $ | (1,222 | ) | | $ | (199 | ) | | $ | (2,179 | ) |
|
| | | | | | | | | | | | | | | | | | | | |
| | | Six Months Ended July 2, 2017 |
| | | Other Business Activities | | | | |
| (MILLIONS OF DOLLARS) | | WRD(i) |
| | GPD(ii) |
| | Corporate(iii) |
| | Other Unallocated(iv) | | Total |
|
| Revenues | | $ | — |
| | $ | — |
| | $ | — |
| | $ | — |
| | $ | — |
|
| Cost of sales | | — |
| | — |
| | (31 | ) | | 358 |
| | 327 |
|
| Selling, informational and administrative expenses | | — |
| | (1 | ) | | 2,003 |
| | 8 |
| | 2,010 |
|
| Research and development expenses | | 1,106 |
| | 367 |
| | 422 |
| | 4 |
| | 1,899 |
|
| Amortization of intangible assets | | — |
| | — |
| | — |
| | — |
| | — |
|
| Restructuring charges and certain acquisition-related costs | | — |
| | — |
| | — |
| | — |
| | — |
|
| Other (income)/deductions––net | | (28 | ) | | — |
| | 173 |
| | 48 |
| | 193 |
|
| Loss from continuing operations before provision for taxes on income | | $ | (1,079 | ) | | $ | (366 | ) | | $ | (2,566 | ) | | $ | (418 | ) | | $ | (4,430 | ) |
| | | | | Second Quarter of 2016 | | Second Quarter of 2016 |
| | | Other Business Activities | | | | | | Other Business Activities | | | | |
| (MILLIONS OF DOLLARS) | | WRD(i) |
| | GPD(ii) |
| | Medical(iii) |
| | Corporate(iv) |
| | Other Unallocated(v) | | Total |
| | WRD(i) |
| | GPD(ii) | | Corporate(iii) |
| | Other Unallocated(iv) | | Total |
|
| Revenues | | $ | — |
| | $ | — |
| | $ | — |
| | $ | — |
| | $ | — |
| | $ | — |
| | $ | — |
| | $ | — |
| | $ | — |
| | $ | — |
| | $ | — |
|
| Cost of sales | | — |
| | — |
| | — |
| | 51 |
| | 337 |
| | 388 |
| | — |
| | — |
| | 51 |
| | 337 |
| | 388 |
|
| Selling, informational and administrative expenses | | — |
| | — |
| | 34 |
| | 876 |
| | 33 |
| | 943 |
| | — |
| | — |
| | 909 |
| | 33 |
| | 943 |
|
| Research and development expenses | | 527 |
| | 161 |
| | — |
| | 156 |
| | 6 |
| | 849 |
| | 527 |
| | 161 |
| | 156 |
| | 6 |
| | 849 |
|
| Amortization of intangible assets | | — |
| | — |
| | — |
| | — |
| | — |
| | — |
| | — |
| | — |
| | — |
| | — |
| | — |
|
| Restructuring charges and certain acquisition-related costs | | — |
| | — |
| | — |
| | — |
| | — |
| | — |
| | — |
| | — |
| | — |
| | — |
| | — |
|
| Other (income)/deductions––net | | (13 | ) | | — |
| | — |
| | 173 |
| | (64 | ) | | 96 |
| | (13 | ) | | — |
| | 173 |
| | (64 | ) | | 96 |
|
| Loss from continuing operations before provision for taxes on income | | $ | (514 | ) | | $ | (161 | ) | | $ | (34 | ) | | $ | (1,256 | ) | | $ | (312 | ) | | $ | (2,276 | ) | | $ | (514 | ) | | $ | (161 | ) | | $ | (1,289 | ) | | $ | (312 | ) | | $ | (2,276 | ) |
|
| | | | | | | | | | | | | | | | | | | | | | | | |
| | | Six Months Ended July 3, 2016 |
| | | Other Business Activities | | | | |
| (MILLIONS OF DOLLARS) | | WRD(i) |
| | GPD(ii) |
| | Medical(iii) |
| | Corporate(iv) |
| | Other Unallocated(v) | | Total |
|
| Revenues | | $ | — |
| | $ | — |
| | $ | — |
| | $ | — |
| | $ | — |
| | $ | — |
|
| Cost of sales | | — |
| | — |
| | — |
| | 91 |
| | 514 |
| | 605 |
|
| Selling, informational and administrative expenses | | — |
| | — |
| | 61 |
| | 1,776 |
| | 52 |
| | 1,889 |
|
| Research and development expenses | | 1,054 |
| | 315 |
| | — |
| | 354 |
| | 11 |
| | 1,734 |
|
| Amortization of intangible assets | | — |
| | — |
| | — |
| | — |
| | — |
| | — |
|
| Restructuring charges and certain acquisition-related costs | | — |
| | — |
| | — |
| | — |
| | — |
| | — |
|
| Other (income)/deductions––net | | (27 | ) | | — |
| | — |
| | 399 |
| | (29 | ) | | 342 |
|
| Loss from continuing operations before provision for taxes on income | | $ | (1,028 | ) | | $ | (315 | ) | | $ | (61 | ) | | $ | (2,619 | ) | | $ | (548 | ) | | $ | (4,570 | ) |
|
| | | | | | | | | | | | | | | | | | | | | | | | |
| | | Second Quarter of 2015 |
| | | Other Business Activities | | | | |
| (MILLIONS OF DOLLARS) | | WRD(i) |
| | GPD(ii) | | Medical(iii) |
| | Corporate(iv) |
| | Other Unallocated(v) | | Total |
|
| Revenues | | $ | — |
| | $ | — |
| | $ | — |
| | $ | — |
| | $ | — |
| | $ | — |
|
| Cost of sales | | — |
| | — |
| | — |
| | 25 |
| | 118 |
| | 144 |
|
| Selling, informational and administrative expenses | | — |
| | — |
| | 28 |
| | 871 |
| | 14 |
| | 913 |
|
| Research and development expenses | | 544 |
| | 150 |
| | 7 |
| | 231 |
| | 9 |
| | 941 |
|
| Amortization of intangible assets | | — |
| | — |
| | — |
| | — |
| | — |
| | — |
|
| Restructuring charges and certain acquisition-related costs | | — |
| | — |
| | — |
| | — |
| | — |
| | — |
|
| Other (income)/deductions––net | | (15 | ) | | — |
| | — |
| | 159 |
| | 19 |
| | 164 |
|
| Loss from continuing operations before provision for taxes on income | | $ | (530 | ) | | $ | (150 | ) | | $ | (35 | ) | | $ | (1,286 | ) | | $ | (160 | ) | | $ | (2,161 | ) |
| | | | | Six Months Ended June 28, 2015 | | Six Months Ended July 3, 2016 |
| | | Other Business Activities | | | | | | Other Business Activities | | | | |
| (MILLIONS OF DOLLARS) | | WRD(i) | | GPD(ii) | | Medical(iii) | | Corporate(iv) | | Other Unallocated(v) | | Total | | WRD(i) | | GPD(ii) | | Corporate(iii) | | Other Unallocated(iv) | | Total |
| Revenues | | $ | — |
| | $ | — |
| | $ | — |
| | $ | — |
| | $ | — |
| | $ | — |
| | $ | — |
| | $ | — |
| | $ | — |
| | $ | — |
| | $ | — |
|
| Cost of sales | | — |
| | — |
| | — |
| | 48 |
| | 134 |
| | 182 |
| | — |
| | — |
| | 91 |
| | 514 |
| | 605 |
|
| Selling, informational and administrative expenses | | — |
| | — |
| | 54 |
| | 1,807 |
| | 23 |
| | 1,884 |
| | — |
| | — |
| | 1,837 |
| | 52 |
| | 1,889 |
|
| Research and development expenses | | 1,085 |
| | 304 |
| | 13 |
| | 460 |
| | 13 |
| | 1,875 |
| | 1,054 |
| | 315 |
| | 354 |
| | 11 |
| | 1,734 |
|
| Amortization of intangible assets | | — |
| | — |
| | — |
| | — |
| | — |
| | — |
| | — |
| | — |
| | — |
| | — |
| | — |
|
| Restructuring charges and certain acquisition-related costs | | — |
| | — |
| | — |
| | — |
| | — |
| | — |
| | — |
| | — |
| | — |
| | — |
| | — |
|
| Other (income)/deductions––net | | (44 | ) | | — |
| | — |
| | 257 |
| | 36 |
| | 249 |
| | (27 | ) | | — |
| | 399 |
| | (29 | ) | | 342 |
|
| Loss from continuing operations before provision for taxes on income | | $ | (1,042 | ) | | $ | (304 | ) | | $ | (66 | ) | | $ | (2,573 | ) | | $ | (205 | ) | | $ | (4,190 | ) | | $ | (1,028 | ) | | $ | (315 | ) | | $ | (2,680 | ) | | $ | (548 | ) | | $ | (4,570 | ) |
| |
(i) | WRD—the research and developmentR&D expenses managed by our WRD organization, which is generally responsible for research projects for our IH business until proof-of-concept is achieved and then for transitioning those projects to the IH segment via the newly formed GPD organization for possible clinical and commercial development. R&D spending may include upfront and milestone payments for intellectual property rights. The WRD organization also has responsibility for certain science-based and other platform-services organizations, which provide technical expertise and other services to the various R&D projects, including EH R&D projects. WRD is also responsible for facilitating all regulatory submissions and interactions with regulatory agencies, including all safety-event activities. |
activities. As noted above, in connection with the formation of the new EH R&D organization, certain functions transferred from WRD to the new EH R&D organization. We have reclassified approximately $67 million of costs in the second quarter of 2015 and $134 million of costs in the first six months of 2015 from WRD to EH to conform to the current period presentation as part of EH. Also, in connection with the formation of the new GPD organization, beginning in the second quarter of 2016, certain development-related functions transferred from WRD to GPD. See note (ii) below for additional information.
| |
(ii) | GPD––the costs associated with our newly formed GPD organization, which is generally responsible for the clinical development of assets that are in clinical trials for our WRD and Innovative portfolios. GPD also provides technical support and other services to Pfizer R&D projects. In connection with the formation of the GPD organization, certain development-related functions transferred from WRD and IH to GPD. We have reclassified costs of approximately $78 million from WRD and $76 million from IH in the first quarter of 2016, approximately $77 million from WRD and $73 million from IH in the second quarter of 2015 and approximately $157 million from WRD and $147 million from IH in the first six months of 2015 to GPD to conform to the current period presentation as part of GPD. |
| |
(iii) | Medical—the costs associated with our Medical organization, which is responsible for the provision of medical information to healthcare providers, patients and other parties, transparency and disclosure activities, clinical trial results publication, grants for healthcare quality improvement and medical education, and partnerships with global public health and medical associations. |
| |
(iv)
| Corporate—the costs associated with Corporate, representing platform functions (such as worldwide technology, global real estate operations, legal, finance, human resources, worldwide public affairs, compliance and worldwide procurement) and certain compensation and other corporate costs, such as interest income and expense, and gains and losses on investments. Effective in the first quarter of 2017, Corporate also includes the costs associated with our Pfizer Medical organization (Medical), previously reported as part of Other Business Activities. Medical is responsible for the provision of medical information to healthcare providers, patients and other parties, transparency and disclosure activities, clinical trial results publication, grants for healthcare quality improvement and medical education, and partnerships with global public health and medical associations. We have reclassified approximately $34 million and $61 million of Medical costs from Other Business Activities to Corporate in the second quarter and first six months of 2016, respectively, to conform to the current period presentation. We recognized a $26 million gain in the second quarter of 2017 and a $71 million gain in the first six months of 2017 as an offset to Cost of sales related to foreign currency forward-exchange contracts designated as cash flow hedges of a portion of our foreign exchange-denominated forecasted intercompany inventory sales. |
| |
(v)(iv)
| Other Unallocated—other unallocated costs, representing overhead expenses associated with our manufacturing and commercial operations that are not directly attributableassessed to an operating segment.segment, as business unit (segment) management does not manage these costs (which include manufacturing variances associated with production). |
Although we typically provide qualitative information about our Other costs on an annual basis, updated estimates are provided in the first six months of 2016, reflecting:(i) the reorganization of our IH business; (ii) the transfer of certain WRD functions to EH; and (iii) the transfer of certain development-related functions from WRD and IH to GPD. For information purposes only, for the first six monthsfollowing tables present reconciliations of 2016, we estimate thatour segment operating results to segment operating results including estimated Other costs generally associated with each segment. While we do not manage our segments or have performance goals under such an allocated manner, we believe that some investors may find this information useful in the aggregate and as described above, but excluding (i) net interest-related expense not attributable to an operating segment included in Corporate (approximately $415 million for the first six months of 2016 in their analyses.
The estimated Other (income)/deductions––net); and (ii) net income from investments not attributable to an operating segment and included in Corporate (approximately $49 million for the first six months of 2016 in Other (income)/deductions––net), arecosts generally associated with our operating segments as follows:
|
| | | | |
Six Months Ended July 3, 2016 |
(PERCENTAGES) | | IH | | EH |
WRD/GPD/Medical Costs | | | | |
Selling, informational and administrative expenses | | 67% - 69% | | 31% - 33% |
Research and development expenses | | 98% - 100% | | 0% - 2% |
Other (income)/deductions––net | | * | | * |
Total WRD/GPD/Medical Costs | | 96% - 98% | | 2% - 4% |
| | | | |
Corporate/Other Unallocated Costs | | | | |
Cost of sales | | 24% - 26% | | 74% - 76% |
Selling, informational and administrative expenses | | 49% - 51% | | 49% - 51% |
Research and development expenses | | 83% - 85% | | 15% - 17% |
Other (income)/deductions––net | | * | | * |
Total Corporate/Other Unallocated Costs | | 49% - 51% | | 49% - 51% |
| | | | |
Total WRD/GPD/Medical and Corporate/Other Unallocated Costs | | | | |
Cost of sales | | 24% - 26% | | 74% - 76% |
Selling, informational and administrative expenses | | 50% - 52% | | 48% - 50% |
Research and development expenses | | 95% - 97% | | 3% - 5% |
Other (income)/deductions––net | | * | | * |
Total WRD/GPD/Medical and Corporate/Other Unallocated Costs | | 65% - 67% | | 33% - 35% |
| |
* | Amounts not material. After excluding net interest expense included in Corporate and net income from investments not attributable to an operating segment and included in Corporate, Other (income)/deductions––net approximates $24 million of income for the first six months of 2016.
|
The percentages provided in the table above do not purport to reflect the additional amounts that each of our operating segments would have incurred had each segment operated as a standalone company during the period presented.
WRD/GPD/Medical––TheFor information provided inpurposes only, for the tablefirst six months of 2017, we estimate that Other costs, as described above, for combined WRD and GPD costs of $1.4 billion, and Medical was substantially all derived from our estimates of the costs incurred in connection with the R&D projects associated with each operating segment.
Corporate/Other Unallocated––The information provided in the table above for Corporate and Other Unallocated was derived mainly using proportional allocation methods based on global, regional or country revenues or global, regional or country headcount, as well as certain cost metrics, as appropriate, such as those derived from research and development and manufacturing costs, and, to a lesser extent, specific identification. Management believes that the allocations ofcombined Corporate and Other Unallocated costs of $2.6 billion after excluding (i) net interest-related expense not attributable to an operating segment included in Corporate (approximately $470 million for the first six months of 2017 in Other (income)/deductions––net); and (ii) net income from investments and other assets not attributable to an operating segment included in Corporate (approximately $96 million for the first six months of 2017 in Other(income)/deductions––net), are reasonable.generally associated with our operating segments, as follows:
|
| | | | | | | | | | | | | | | | |
| | | Six Months Ended July 2, 2017 |
| | | | | Estimated Other Costs Associated with IH(ii) | | |
| (MILLIONS OF DOLLARS) | | Innovative Health Non-GAAP Adjusted(i), (iii) |
| | Estimated WRD/GPD(ii) |
| | Estimated Corporate/Other Unallocated(ii) |
| | Innovative Health with Estimated Other Costs Associated with
Innovative Health
Non-GAAP Adjusted(ii), (iii) |
|
| Revenues | | $ | 15,086 |
| | $ | — |
| | $ | — |
| | $ | 15,086 |
|
| Cost of sales | | 1,830 |
| | — |
| | 26 |
| | 1,857 |
|
| Selling, informational and administrative expenses | | 3,178 |
| | (1 | ) | | 1,176 |
| | 4,353 |
|
| Research and development expenses | | 1,071 |
| | 1,461 |
| | 393 |
| | 2,924 |
|
| Amortization of intangible assets | | 50 |
| | — |
| | — |
| | 50 |
|
| Restructuring charges and certain acquisition-related costs | | — |
| | — |
| | — |
| | — |
|
| Other (income)/deductions––net | | (359 | ) | | (28 | ) | | (73 | ) | | (459 | ) |
| Income from continuing operations before provision for taxes on income | | 9,316 |
| | (1,432 | ) | | (1,521 | ) | | 6,362 |
|
|
| | | | | | | | | | | | | | | | |
| | | Six Months Ended July 2, 2017 |
| | | | | Estimated Other Costs Associated with EH(ii) | | |
| (MILLIONS OF DOLLARS) | | Essential Health
Non-GAAP Adjusted(i), (iii) |
| | Estimated WRD/GPD(ii) |
| | Estimated Corporate/Other Unallocated(ii) |
| | Essential Health with Estimated Other Costs Associated with
Essential Health
Non-GAAP Adjusted(ii), (iii) |
|
| Revenues | | $ | 10,590 |
| | $ | — |
| | $ | — |
| | $ | 10,590 |
|
| Cost of sales | | 2,872 |
| | — |
| | 301 |
| | 3,173 |
|
| Selling, informational and administrative expenses | | 1,485 |
| | — |
| | 835 |
| | 2,321 |
|
| Research and development expenses | | 506 |
| | 13 |
| | 33 |
| | 552 |
|
| Amortization of intangible assets | | 26 |
| | — |
| | — |
| | 26 |
|
| Restructuring charges and certain acquisition-related costs | | — |
| | — |
| | — |
| | — |
|
| Other (income)/deductions––net | | (93 | ) | | — |
| | (80 | ) | | (173 | ) |
| Income from continuing operations before provision for taxes on income | | 5,793 |
| | (13 | ) | | (1,089 | ) | | 4,691 |
|
| |
(i) | Amount represents the revenues and costs managed by each of our operating segments. The expenses generally include only those costs directly attributable to the operating segment. See note (a) above for more information. |
| |
(ii) | Represents costs not assessed to an operating segment, as business unit (segment) management does not manage these costs. For a description of these other costs and business activities, see note (b) above. |
| |
| • | WRD/GPD––The information provided for WRD and GPD was substantially all derived from our estimates of the costs incurred in connection with the R&D projects associated with each operating segment. |
| |
| • | Corporate/Other Unallocated––The information provided for Corporate and Other Unallocated was derived mainly using proportional allocation methods based on global, regional or country revenues or global, regional or country headcount, as well as certain cost metrics, as appropriate, such as those derived from research and development and manufacturing costs, and, to a lesser extent, specific identification and estimates. Management believes that the allocations of Corporate and Other Unallocated costs are reasonable. |
The estimated Other costs generally associated with our operating segments do not purport to reflect the additional amounts that each of our operating segments would have incurred had each segment operated as a standalone company during the period presented.
| |
(iii) | See note (c) below for an explanation of our Non-GAAP Adjusted financial measure. |
| |
(c) | See the “Non-GAAP Financial Measure (Adjusted Income)” section of this MD&A for a definition of these “Adjusted Income” components. |
| |
(d) | Includes costs associated with (i) purchase accounting adjustments; (ii) acquisition-related costs; and (iii) certain significant items, which are substantive and/or unusual, and in some cases recurring, items (such as restructuring or legal charges), or unusual items that are evaluated on an individual basis by management. For additional information about these reconciling items and/or our Non-GAAP Adjustedadjusted measure of performance, see the “Non-GAAP Financial Measure (Adjusted Income)” section of this MD&A. |
Second Quarter of 2017 vs. Second Quarter of 2016
Innovative Health Operating Segment
Revenues
IH Revenues increased 7%$565 million, or 8%, to $7.1$7.7 billion, reflecting a 9% operational increase. Foreign exchange had an unfavorable impact of 1% on IH Revenues.
The following provides an analysis of the increase in the second quarter of 2016, comparedIH Revenues: |
| | | | |
| (MILLIONS OF DOLLARS) | | |
IH Revenues, for the three months ended July 3, 2016 | | $ | 7,105 |
|
| | | |
| Acquisition-related operational growth: | | |
| Xtandi alliance revenues in the U.S. (September 2016 acquisition of Medivation) | | 141 |
|
| | | |
| Other operational growth/(decline): | | |
| Continued growth from key brands including Ibrance and Eliquis globally, as well as Xeljanz and Lyrica, both primarily in the U.S. | | 730 |
|
| Lower revenues for Enbrel driven by declines in most developed Europe markets, primarily due to continued biosimilar competition | | (133 | ) |
| Global decline in Prevnar 13/Prevenar 13 revenues. U.S. revenues decreased primarily due to the unfavorable timing of government purchases for the pediatric indication and the continued decline in revenues for the Adult indication due to a smaller remaining “catch up” opportunity compared to the prior-year quarter. International revenues increased primarily due to the favorable timing of government purchases in certain emerging markets for the pediatric indication. | | (84 | ) |
| Other operational factors, net | | 6 |
|
| Operational growth, net | | 660 |
|
| | | |
| Unfavorable impact of foreign exchange | | (95 | ) |
IH Revenues increase | | 565 |
|
IH Revenues, for the three months ended July 2, 2017 | | $ | 7,671 |
|
Total IH revenues from emerging markets increased $149 million, or 16%, to $6.6$1.1 billion, in the same period in 2015, and increased 14% to $14.1 billion in the first six months of 2016, compared to $12.4 billion in the same period in 2015.reflecting an 18% operational increase. Foreign exchange had an unfavorable impact of 2% on total IH revenues in the second quarter of 2016,from emerging markets.
Costs and 4% in the first six months of 2016, compared to the same periods in 2015. IH Revenues increased by 9% operationally in the second quarter of 2016 and 18% operationally in the first six months of 2016 compared to the same periods in 2015, primarily due to the following operational factors:
Expenses | |
◦• | continued strong momentum from IbranceCost of sales as a percentage of Revenues decreased 1.2 percentage points, primarily driven by a favorable change in the U.S.,product mix, including an increase in alliance revenue, which have no associated cost of sales, as well as strong operational growth from Eliquis globally and Lyrica, Xeljanz, Consumer Healthcare and Chantix, all primarilythe favorable impact of foreign exchange, partially offset by an increase in the U.S. (collectively, up approximately $900 million for the second quarter of 2016 and $2.0 billion for the first six months of 2016), |
partially offset by:royalty expense.
| |
◦ | the Prevnar/Prevenar 13 franchise, primarily driven by the expected decline in revenues for Prevnar 13 for adults in the U.S. due to a high initial capture rate of the eligible population following its successful fourth-quarter 2014 launch, which resulted in a smaller remaining “catch up” opportunity compared to the prior-year quarter. International revenues for the pediatric indication for Prevenar 13 also decreased, primarily in emerging markets, reflecting timing of purchases from Gavi, the Vaccine Alliance, and certain other markets, compared to the prior-year quarter (down approximately $230 million for the second quarter of 2016); and |
| |
◦• | The decrease in Cost of sales of 2% was primarily driven by the favorable impact of foreign exchange and favorable product mix, partially offset by an increase in royalty expense. |
| |
| • | The increase in Selling, informational and administrativeexpenses of 3% was primarily driven by additional investment across several of our key products, primarily Eucrisa, Xeljanz, Xtandi and Ibrance. The increase was partially offset by lower spending for certain other products, primarily Prevnar 13/Prevenar 13, and the favorable impact of foreign exchange. |
| |
• | The decrease in Research and developmentexpenses of 6% primarily reflects the discontinuation of the global clinical development program for bococizumab in the fourth quarter of 2016, partially offset by increased costs associated with our C. difficile vaccine program, which initiated a declinePhase 3 clinical study in Rebif revenuesMarch 2017, our oncology programs, primarily clinical trial spend on legacy Medivation assets, as well as an expense of approximately $28 million, representing IH’s portion of the $75 million expense resulting from our May 2017 agreement with Sangamo to develop and commercialize gene therapy programs for Hemophilia A. |
| |
| • | The unfavorable change in Other (income)/deductions––net primarily reflects (i) a net decrease in royalty income of approximately $165 million, primarily due to lower royalty income for Enbrel of $157 million, resulting from the expiration on October 31, 2016 of the 36-month royalty period under the collaboration agreement for Enbrel in the U.S. due toand Canada (the collaboration period under the expirationagreement expired on October 31, 2013), partially offset by the addition of the collaboration agreement to co-promote Rebif$51 million in the U.S., which expired at the endXtandi royalty income, and (ii) an increase of 2015 (down approximately $90$106 million for the second quarter of 2016 and $140 million for the first six months of 2016).in dividend income from our investment in ViiV. |
Total IH revenues from emerging markets were $932 million in the second quarter of 2016, compared to $1.1 billion in the second quarter of 2015, reflecting a 2% operational decrease in the second quarter of 2016 plus the unfavorable impact of foreign exchange. IH revenues from emerging markets were $1.8 billion in the first six months of 2016, compared to $2.0 billion in the first six months of 2015, reflecting 8% operational growth in the first six months of 2016, which was more than offset by the unfavorable impact of foreign exchange.
Cost of sales as a percentage of Revenues decreased 0.1 percentage point in the second quarter of 2016, and decreased 0.4 percentage points in the first six months of 2016, compared to the same periods in 2015, primarily driven by a favorable change in product mix, including an increase in alliance revenues, which have no associated cost of sales, partially offset by unfavorable foreign exchange. The increase in Cost of sales of 6% in the second quarter of 2016, compared to the same period in 2015, was primarily driven by unfavorable foreign exchange and an increase in royalty expense, partially offset by favorable product mix. The increase in Cost of sales of 11% in the first six months of 2016, compared to the same period in 2015, was primarily driven by unfavorable foreign exchange, an increase in sales volumes and an increase in royalty expense.
The slight decrease in Selling, informational and administrativeexpenses in the second quarter of 2016, compared to the same period in 2015, reflects favorable foreign exchange, offset by additional investment in Prevnar 13 and Eliquis. The increase in Selling, informational and administrativeexpenses of 9% in the first six months of 2016, compared to the same period in 2015, reflects an increase in the allowance for doubtful trade accounts receivable, resulting from unfavorable developments with a distributor, and additional investment in Eliquis and Prevnar 13, partially offset by favorable foreign exchange.
The increase in Research and developmentexpenses of 2% in the second quarter of 2016, compared to the same period in 2015, primarily reflects the increased costs associated with our avelumab alliance with Merck KGaA. The decrease in Research and developmentexpenses of 13% in the first six months of 2016, compared to the same period in 2015, primarily reflects the non-recurrence of the $295 million upfront payment made to OPKO in the first quarter of 2015, partially offset by increased costs associated with our oncology programs, primarily our avelumab alliance with Merck KGaA and increased investment in certain late-stage pipeline programs, primarily bococizumab and tanezumab.
Essential Health Operating Segment
Revenues
EH Revenues increased 16% decreased $816 million, or 14%, to $6.0 billion in the second quarter of 2016, compared to $5.2 billion, inreflecting a 12% operational decrease, of which 5% operationally was due to the same period in 2015, and increased 16% to $12.0 billion in the first six monthssale of 2016, compared to $10.3 billion in the same period in 2015.HIS. Foreign exchange had an unfavorable impact of 4%2% on EH Revenues.
The following provides an analysis of the decrease in EH Revenues: |
| | | | |
| (MILLIONS OF DOLLARS) | | |
EH Revenues, for the three months ended July 3, 2016 | | $ | 6,042 |
|
| | | |
| Disposition-related operational impact: | | |
| Financial results in the second quarter of 2017 do not reflect any contribution from HIS global operations, compared to the inclusion of three months of HIS global operations in the same period in 2016 (February 2017 sale) | | (296 | ) |
| | | |
| Other operational growth/(decline): | | |
| Decline from Peri-LOE Products, including declines in Pristiq in the U.S., which lost marketing exclusivity in the U.S. in March 2017, as well as Vfend and Lyrica, both in developed Europe markets | | (305 | ) |
| Decline in the Legacy Established Products portfolio | | (99 | ) |
| Growth from Biosimilars, primarily driven by Inflectra in certain developed Europe markets and in the U.S. | | 47 |
|
| Other operational factors, net | | (56 | ) |
| Operational decline, net | | (709 | ) |
| | | |
| Unfavorable impact of foreign exchange | | (107 | ) |
EH Revenues decrease | | (816 | ) |
EH Revenues, for the three months ended July 2, 2017 | | $ | 5,226 |
|
Total EH revenues in developed markets decreased $836 million, or 19%, to $3.5 billion, reflecting an 18% operational decline. The operational decline was driven primarily by operational declines from Peri-LOE Products, a 5% unfavorable impact of the second quartersale of 2016,HIS and 6%a decline in the first six months of 2016, compared to the same periods in 2015. Revenues increased by 19% operationally in the second quarter of 2016 and 22% operationally in the first six months of 2016, compared to the same periods in 2015, primarily due to the inclusion of legacy Hospira operations of $1.1 billion in the second quarter of 2016 and $2.3 billion in the first six months of 2016,Legacy Established Products portfolio, partially offset by the lossoperational growth from Biosimilars. Foreign exchange had an unfavorable impact of exclusivity and associated generic competition for certain Peri-LOE Products, primarily Zyvox1% on total EH revenues in the U.S. and certain developed Europe markets, as well as Lyrica in certain developed Europe markets. EH Revenues excluding the contribution from the legacy Hospira portfolio, decreased 3% operationally in the second quarter of 2016 and decreased 1% operationally in the first six months of 2016, compared to the same periods in 2015, primarily due to the following operational factors:
| |
◦ | the loss of exclusivity and associated generic competition for certain Peri-LOE Products, primarily Zyvox in the U.S. and certain developed Europe markets, as well as Lyrica in certain developed Europe markets (collectively, down by approximately $210 million in the second quarter of 2016 and $440 million in the first six months of 2016), |
partially offset by:
| |
◦ | growth in the legacy Pfizer Sterile Injectable Pharmaceuticals portfolio primarily in emerging markets and the U.S. (up by approximately $80 million in the second quarter of 2016 and $170 million in the first six months of 2016); and |
| |
◦ | growth in the Legacy Established Products portfolio primarily in the U.S. (up by approximately $60 million in the second quarter of 2016 and $270 million in the first six months of 2016). |
Total EH revenues from emerging markets wereincreased $20 million, or 1%, to $1.7 billion, in the second quarter of 2016, compared to $1.8 billion in the second quarter of 2015, reflecting 8%5% operational growth, in the second quarter of 2016,primarily driven by the inclusion of legacy Hospira operations and reflecting operational growth from the legacy PfizerLegacy Established Products portfolio and Sterile Injectable Pharmaceuticals portfolio, which was more thanlargely offset by the unfavorable impact of foreign exchange. exchange of 3%. Excluding HIS in both periods, EH revenues in emerging markets grew 6% operationally.
Costs and Expenses
The changes in EH expenses below reflect, among other things, the favorable impact of the February 2017 sale of HIS. The operating results of HIS are included in EH’s operating results through February 2, 2017 and, therefore, operating results for EH for the second quarter of 2017 do not reflect HIS global operations, while operating results for EH for the second quarter of 2016 reflect three months of HIS global operations.
| |
| • | Cost of sales as a percentage of Revenues decreased 0.6 percentage points primarily due to the favorable impact of the sale of HIS, which had a higher cost of sales than the other EH products, and the favorable impact of foreign exchange, partially offset by cost increases reflecting the shift to EH of certain legacy Hospira costs that were previously unallocated to EH as a result of harmonizing the Hospira cost policy, and the impact of product losses of exclusivity. |
| |
| • | The decrease in Cost of sales of 15% was primarily due to the favorable impact of the sale of HIS, which had a higher cost of sales than the other EH products, and the favorable impact of foreign exchange, partially offset by cost increases reflecting the shift to EH of certain legacy Hospira costs that were previously unallocated to EH as a result of harmonizing the Hospira cost policy. |
| |
| • | Selling, informational and administrativeexpenses decreased 12%, primarily due to lower advertising, promotional, field force and certain other expenses related to disputes in the ordinary course of business, as well as the favorable impact of the sale of HIS, partially offset by increased spending for biosimilars, primarily related to the U.S. launch of Inflectra. |
| |
| • | Research and developmentexpenses decreased 17%, primarily due to the close-out of certain post-marketing clinical trials and the favorable impact of the sale of HIS. |
First Six Months of 2017 vs. First Six Months of 2016
Innovative Health Operating Segment
Revenues
IH Revenues increased $947 million, or 7%, to $15.1 billion, reflecting an 8% operational increase. Foreign exchange had an unfavorable impact of 1% on IH Revenues.
The following provides an analysis of the increase in IH Revenues:
|
| | | | |
| (MILLIONS OF DOLLARS) | | |
IH Revenues, for the six months ended July 3, 2016 | | $ | 14,139 |
|
| | | |
| Acquisition-related operational growth: | | |
| Xtandi alliance revenues in the U.S. (September 2016 acquisition of Medivation) | | 272 |
|
| | | |
| Other operational growth/(decline): | | |
| Continued growth from key brands including Ibrance and Eliquis globally, as well as Lyrica and Xeljanz, both primarily in the U.S. | | 1,351 |
|
| Lower revenues for Enbrel driven by declines in most developed Europe markets, primarily due to continued biosimilar competition | | (265 | ) |
| Global decline in Prevnar 13/Prevenar 13 revenues. U.S. revenues decreased primarily due to the continued decline in revenues for the Adult indication due to a smaller remaining “catch up” opportunity compared to the prior-year period and the unfavorable timing of government purchases for the pediatric indication. International revenues increased primarily due to the favorable timing of government purchases in certain emerging markets for the pediatric indication. | | (197 | ) |
| Decline in Viagra revenues primarily in the U.S. | | (95 | ) |
| Other operational factors, net | | 18 |
|
| Operational growth, net | | 1,084 |
|
| | | |
| Unfavorable impact of foreign exchange | | (137 | ) |
IH Revenues increase | | 947 |
|
IH Revenues, for the six months ended July 2, 2017 | | $ | 15,086 |
|
Total IH revenues from emerging markets increased $210 million, or 12%, to $2.0 billion, reflecting a 13% operational increase. Foreign exchange had an unfavorable impact of 1% on Total IH revenues from emerging markets.
Costs and Expenses
| |
| • | Cost of sales as a percentage of Revenues decreased 1.2 percentage points driven by a favorable change in product mix, including an increase in alliance revenue, which have no associated cost of sales, as well as the favorable impact of foreign exchange, partially offset by an increase in royalty expense. |
| |
| • | The decrease in Cost of sales of 3% was primarily driven by favorable product mix and favorable foreign exchange, partially offset by an increase in royalty expense. |
| |
| • | The decrease in Selling, informational and administrativeexpenses of 4% was primarily driven by the non-recurrence of an allowance for doubtful trade accounts receivable, resulting from unfavorable developments with a distributor that was recorded in the first quarter of 2016, lower spending for certain products, primarily Prevnar 13/Prevenar 13, and favorable foreign exchange, partially offset by additional investment across several of our key products, primarily Eucrisa, Xeljanz, Xtandi and Ibrance. |
| |
| • | The decrease in Research and developmentexpenses of 6% primarily reflects the discontinuation of the global clinical development program for bococizumab in the fourth quarter of 2016, partially offset by increased costs associated with our oncology programs, including clinical trial spend on legacy Medivation assets, our C. difficile vaccine program, which initiated a Phase 3 clinical study in March 2017, as well as an expense of $28 million, representing IH’s portion of the $75 million expense resulting from our May 2017 agreement with Sangamo to develop and commercialize gene therapy programs for Hemophilia A. |
| |
| • | The unfavorable change in Other (income)/deductions––net primarily reflects (i) a net decrease in royalty income of approximately $259 million, primarily due to lower royalty income for Enbrel of $275 million, resulting from the expiration on October 31, 2016 of the 36-month royalty period under the collaboration agreement for Enbrel in the U.S. and Canada (the collaboration period under the agreement expired on October 31, 2013), partially offset by the addition of $87 million of Xtandi royalty income, and (ii) an increase of $150 million in dividend income from our investment in ViiV. |
Essential Health Operating Segment
Revenues
EH Revenues decreased $1.4 billion, or 12%, to $10.6 billion, reflecting a 10% operational decrease, of which 4% operationally was due to the sale of HIS. Foreign exchange had an unfavorable impact of 2% on EH Revenues.
The following provides an analysis of the decrease in EH Revenues: |
| | | | |
| (MILLIONS OF DOLLARS) | | |
EH Revenues, for the six months ended July 3, 2016 | | $ | 12,013 |
|
| | | |
| Disposition-related operational impact: | | |
| Approximately one month of HIS domestic operations and approximately two months of HIS international operations in the first six months of 2017, compared to six months of HIS global operations in the same period in 2016 (February 2017 sale) | | (503 | ) |
| | | |
| Other operational growth/(decline): | | |
| Decline from Peri-LOE Products, including declines in Pristiq in the U.S., which lost marketing exclusivity in the U.S. in March 2017, as well as Lyrica and Vfend, both in developed Europe markets | | (559 | ) |
| Decline in the Legacy Established Products portfolio | | (252 | ) |
| Growth from Biosimilars, primarily driven by Inflectra in certain developed Europe markets and in the U.S. | | 88 |
|
| Other operational factors, net | | (17 | ) |
| Operational decline, net | | (1,243 | ) |
| | | |
| Unfavorable impact of foreign exchange | | (181 | ) |
EH Revenues decrease | | (1,424 | ) |
EH Revenues, for the six months ended July 2, 2017 | | $ | 10,590 |
|
Total EH revenues in developed markets decreased $1.5 billion, or 17%, to $7.2 billion, reflecting a 16% operational decline. The operational decline was driven primarily by operational declines from Peri-LOE Products, a 5% unfavorable impact of the sale of HIS and a decline in the Legacy Established Products portfolio, partially offset by operational growth from Biosimilars. Foreign exchange had a 1% unfavorable impact on total EH revenues in developed markets.
Total EH revenues from emerging markets were $3.3increased $44 million, or 1%, to $3.4 billion, in the first six months of 2016, compared to $3.5 billion in the first six months of 2015, reflecting 9%5% operational growth, in the first six months of 2016,primarily driven by the inclusion of legacy Hospira operations and reflecting operational growth from the legacy Pfizer Sterile Injectable Pharmaceuticals portfolio and the Legacy Established Products portfolio, which was more thanlargely offset by the unfavorable impact of foreign exchange.exchange of 4%. Excluding HIS in both periods, EH revenues in emerging markets grew 6% operationally.
Costs and Expenses
CostThe changes in EH expenses below reflect, among other things, the favorable impact of sales as a percentagethe February 2017 sale of Revenues increased 7.8 percentage pointsHIS. The operating results of HIS are included in the second quarter of 2016,EH’s operating results through February 2, 2017 and, increased 6.3 percentage points intherefore, operating results for EH for the first six months of 2016, compared to the same periods in 2015, primarily due to the inclusion2017 include approximately one month of legacy HospiraHIS domestic operations unfavorable foreign exchange and the impactapproximately two months of losses of exclusivity resulting in an unfavorable change in product mix. The increase in Cost of sales of 61%in the second quarter of 2016 and 53% inHIS international operations, while operating results for EH for the first six months of 2016 compared to the same periods in 2015, was driven by the inclusion of legacy Hospira operations and the unfavorable impact from foreign exchange, partially offset by lower volumes as a result of products losing exclusivity.
Selling, informational and administrativeexpenses increased 5% in the second quarter of 2016, compared to the same period in 2015, primarily due to the inclusion of legacy Hospira operations, partially offset by lower advertising, promotional and field force expenses, reflecting the benefits of cost-reduction and productivity initiatives, and favorable foreign exchange. The increase in Selling, informational and administrativeexpenses of 5% in the first reflect six months of 2016, compared to the same period in 2015, was primarily due to the inclusion of legacy Hospira operations, partially offset by favorable foreign exchange and lower advertising, promotional and field force expenses, reflecting the benefits of cost-reduction and productivity initiatives.HIS global operations.
Research and developmentexpenses increased 41% in the second quarter of 2016, and increased39% in the first six months of 2016, compared to the same periods in 2015, reflecting the inclusion of legacy Hospira operations and increased investment in legacy Pfizer biosimilar development programs.
The favorable change in Other (income)/deductions––net in the first six months of 2016, compared to the same period in 2015, primarily reflects resolution of a contract disagreement and favorable foreign exchange.
|
| | | | | | | | | | |
| • | Cost of sales as a percentage of Revenues increased 1.1 percentage points, primarily due to cost increases reflecting the shift to EH of certain legacy Hospira costs that were previously unallocated to EH as a result of harmonizing the Hospira cost policy, and the impact of product losses of exclusivity, partially offset by the favorable impact of the sale of HIS, which had a higher cost of sales than the other EH products, and the favorable impact of foreign exchange. |
| |
| • | The decrease in Cost of sales of 8% primarily reflects the favorable impact of the sale of HIS, which had a higher cost of sales than the other EH products, and the favorable impact of foreign exchange, partially offset by cost increases reflecting the shift to EH of certain legacy Hospira costs that were previously unallocated to EH as a result of harmonizing the Hospira cost policy. |
| |
| • | Selling, informational and administrativeexpenses decreased 8%, primarily due to lower advertising, promotional, field force and certain other expenses related to disputes in the ordinary course of business, as well as the favorable impact of the sale of HIS and the favorable impact of foreign exchange, partially offset by increased spending for biosimilars, primarily related to the U.S. launch of Inflectra. |
| |
| • | Research and developmentexpenses decreased 13%, primarily due to the close-out of certain post-marketing clinical trials and the favorable impact of the sale of HIS. |
| |
| • | The unfavorable change in Other (income)/deductions––net primarily reflects the non-recurrence of a resolution of a contract disagreement in the first quarter of 2016, partially offset by a gain on the redemption of an acquired bond and the favorable impact of foreign exchange. |
ANALYSIS OF THE CONDENSED CONSOLIDATED STATEMENTS OF COMPREHENSIVE INCOME
Changes in the components of Accumulated other comprehensive loss for the second quarter and the first six months of 2016 reflect the following:
For Foreign currency translation adjustments, net, for the second quarter of 2016, primarily reflects the weakening of the U.S. dollar against the euro and Japanese yen; for the first six months of 2016, primarily reflects the strengthening of the U.S. dollar against the U.K. pound, partially offset by the weakening of the U.S. dollar against the euro and Japanese yen.
For Unrealized holding gains/(losses) on derivative financial instruments, net and Unrealized holding gains/(losses) on available-for-sale securities, net, reflects the impact of fair value remeasurements and the reclassification of realized amounts into income. For additional information, see Notes to Condensed Consolidated Financial Statements—Note 7. Financial Instruments.
For Benefit plans: actuarial gains/(losses), net, reflects the impact of the inclusion of Hospira’s pension and postretirement benefit plans in our results of operations, subsequent to its acquisition, partially offset by favorable foreign exchange, large gains in the international plans in 2015 and, to a lesser extent, settlement activity. For additional information, see Notes to Condensed Consolidated Financial Statements—Note 10. Pension and Postretirement Benefit Plans.
For Benefit plans: prior service credits and other, net, for the first six months of 2016, reflects an $82 million reduction in our U.S. Postretirement Plan obligation due to a plan change approved in June 2016 that introduced a cap on costs for certain groups within2017 reflect the plan, partially offset by the reclassification into income of amounts related to (i) amortization of changes in prior service costs and credits previously recognized in Other comprehensive income and (ii) curtailment activity. For additional information, see Notes to Condensed Consolidated Financial Statements—Note 10. Pension and Postretirement Benefit Plans.following:
| |
| • | For Foreign currency translation adjustments, net, for the second quarter of 2017, primarily reflects the weakening of the U.S. dollar against the euro and British pound, partially offset by the strengthening of the U.S. dollar against the Australian dollar; for the first six months of 2017, primarily reflects the weakening of the U.S. dollar against the euro, British pound and the Swedish krona. For the second quarter and first six months of 2017, also includes the reclassification of amounts related to the agreement to sell our 40% ownership investment in Teuto. For additional information, see Notes to Condensed Consolidated Financial Statements—Note 2D. Acquisitions, Sale of Hospira Infusion Systems Net Assets, Collaborative Arrangement and Equity-Method Investments: Equity-Method Investments. |
| |
| • | For Unrealized holding losses on derivative financial instruments, net and Unrealized holding gains on available-for-sale securities, net, reflect the impact of fair value remeasurements and the reclassification of realized amounts into income. For additional information, see Notes to Condensed Consolidated Financial Statements—Note 7. Financial Instruments. |
| |
| • | For Benefit plans: actuarial gains/(losses), net, for the second quarter and first six months of2017, primarily reflects (i) the remeasurement gain due to the settlement of the Hospira U.S. qualified defined benefit plan; (ii) the amortization of changes in the pension benefit obligation previously recognized in Other comprehensive income; and (iii) the unfavorable impact of foreign exchange. For additional information, see Notes to Condensed Consolidated Financial Statements—Note 10. Pension and Postretirement Benefit Plans. |
ANALYSIS OF THE CONDENSED CONSOLIDATED BALANCE SHEETS
For information about certain of our financial assets and liabilities, including Cash and cash equivalents, Short-term investments, Long-term investments, Short-term borrowings, including current portion of long-term debt, and Long-term debt, see the “Analysis of the Condensed Consolidated Statements of Cash Flows” section of this MD&A, the “Analysis of Financial Condition, Liquidity and Capital Resources: Selected Measures of Liquidity and Capital Resources” section of this MD&A and Notes to Condensed Consolidated Financial Statements—Note 7. Financial Instruments.
For information about certain balances in Trade accounts receivable, less allowance for doubtful accounts, see also the “Analysis of Financial Condition, Liquidity and Capital Resources: Selected Measures of Liquidity and Capital Resources: Accounts Receivable” section of this MD&A.
For information about events and circumstances impacting our tax-related accounts, see Notes to Condensed Consolidated Financial Statements—Note 5. Tax Matters.
For information related to changes in Accumulated other comprehensive loss, see the “Analysis of the Condensed Consolidated Statements of Comprehensive Income” section of this MD&A and Notes to Condensed Consolidated Financial Statements—Note 6. Accumulated Other Comprehensive Loss, Excluding Noncontrolling Interests.
The changes in our asset and liability accounts as of July 3, 2016,2, 2017, compared to December 31, 2015,2016, generally reflect, among other things, the impact of assets acquired and liabilities assumed as part of the acquisition of AstraZeneca’s small molecule anti-infectives business, measurement period adjustments related to the acquisitions of Medivation and Anacor and fluctuations in foreign currency exchange rates.The following explanations exclude the impact of foreign exchange.
For Trade accounts receivable, less allowance for doubtful accounts, the change reflects the timing of sales and collections in the normal course of business and an increase in the allowance for doubtful accounts, resulting from unfavorable developments with a distributor.
For Inventories, the change reflects planned inventory reductions, offset by inventory builds in the normal course of business.
For Other current assets, the change reflects an increase in VAT receivable balances due to a change in our supply chain, partially offset by a decrease in receivables associated with our derivative financial instruments.
For PP&E,the change reflects depreciation during the period, partially offset by capital additions in the normal course of business.
For Identifiable intangible assets, less accumulated amortization, the change reflects the acquisition of Anacor and the impact ofAstraZeneca’s small molecule anti-infectives business, measurement period adjustments related to our acquisitionthe acquisitions of HospiraMedivation and Anacor, as well as the sale of HIS to ICU Medical (see Notes to Condensed Consolidated Financial Statements—Statements––Note 2A. 2. Acquisitions, ResearchSale of Hospira Infusion Systems Net Assets, Collaborative Arrangement and Development and Collaborative Arrangements, Equity-Method Investments and Cost-Method Investment: Acquisitions and Note 9A.9. Identifiable Intangible Assets and Goodwill: Identifiable Intangible Assets Goodwill for additional information) and foreign exchange.
| |
| • | For Trade accounts receivable, less allowance for doubtful accounts, the change reflects the timing of sales and collections in the normal course of business. |
| |
| • | For Inventories, the change primarily reflects the build of inventory primarily for and in advance of new product launches and to meet targeted levels for certain products, partially offset by inventory reductions in the normal course of business. |
| |
| • | For Other current assets, the change reflects a decrease in receivables associated with our derivative financial instruments, a decrease in receivables from royalty agreements as a result of contract terminations, as well as the timing of receipts and payments in the normal course of business. |
| |
| • | For PP&E,the change reflects depreciation during the period, partially offset by capital additions in the normal course of business. |
| |
| • | For Identifiable intangible assets, less accumulated amortization, the change primarily reflects amortization for the period, partially offset by intangible assets recorded in connection with the EU approval of Besponsa.For additional information, see Notes to Condensed Consolidated Financial Statements—Note 7E. Financial Instruments: Other Noncurrent Liabilities. |
| |
| • | For Other noncurrent assets, the change reflects net increases in the normal course of business, partially offset by a decrease in receivables associated with our derivative financial instruments. |
| |
| • | For Trade accounts payable, the change reflects the timing of purchases and payments in the normal course of business, including the impact of efforts to improve working capital efficiencies. |
| |
| • | For Accrued compensation and related items, the decrease reflects normal bonus payments made to employees and a reduction related to the termination of a Hospira U.S. qualified defined benefit pension plan, partially offset by current year’s accruals. For additional information, see Notes to Condensed Consolidated Financial Statements—Note 10. Pension and Other Postretirement Benefit Plans. |
| |
| • | For Other current liabilities, the change reflects a decrease in liabilities associated with: |
| |
| ◦ | payment for consideration transferred for Medivation; |
| |
| ◦ | payments for restructuring activities, liabilities related to the closeout of bococizumab clinical studies and product liability claims; |
| |
| ◦ | a decrease in liabilities associated with our derivative financial instruments; and |
| |
| ◦ | the timing of payments for accrued interest, |
partially offset by amortization and impairments for the period.by:
| |
| ◦ | an accrual for net funds due to ICU Medical for net economic benefit payments (see Notes to Condensed Consolidated Financial Statements––Note 2B. Acquisitions, Sale of Hospira Infusion Systems Net Assets, Collaborative Arrangement and Equity-Method Investments: Sale of Hospira Infusion Systems Net Assets to ICU Medical, Inc. (EH)); and |
| |
| ◦ | the impact of timing of payments in the normal course of business. |
| |
| • | For Pension benefit obligations, net, the decrease primarily reflects the $1.0 billion voluntary pension contribution in January 2017 and payments to plan participants. |
| |
| • | For Other noncurrent liabilities, the change reflects a reduction from: |
| |
| ◦ | the reversal of a contingent liability as a result of exiting our investment in Teuto (see Notes to Condensed Consolidated Financial Statements––Note 2D. Acquisitions, Sale of Hospira Infusion Systems Net Assets, Collaborative Arrangement and Equity-Method Investments: Equity Method Investments); |
| |
| ◦ | a decrease in liabilities associated with our derivative financial instruments; and |
| |
| ◦ | an increase in reclassification of short-term liabilities and accruals in the normal course of business, |
For Goodwill, the change primarily reflects the acquisition of Anacor (see Notes to Condensed Consolidated Financial Statements—Note 2A. Acquisitions, Research and Development and Collaborative Arrangements, Equity-Method Investments and Cost-Method Investment: Acquisitions and Note 9A. Identifiable Intangible Assets and Goodwill: Identifiable Intangible Assets for additional information).
For Other noncurrent assets, the change reflects an increase in receivables associated with our derivative financial instruments and an increase in noncurrent VAT receivable balances due to a change in our supply chain.
For Trade accounts payable, the change reflects the timing of purchases and payments in the normal course of business.
For Dividends payable, the change reflects the difference between the first quarter 2016 dividends declared in 2015 and the third quarter dividends declared in June 2016.
For Accrued compensation and related items, the decrease reflects bonus payments made to employees during the first six months of 2016.
For Other current liabilities, the change reflects payments and accruals for certain legal matters and restructuring matters, and payments for interest, partially offset by an increase in VAT payable balances due to a change in our supply chain and the timing of other accruals and payments in the normal course of business.by:
For Pension benefit obligations, net and Postretirement benefit obligations, net, the change reflects a $1.0 billion voluntary pension contribution in January 2016, as well as the information provided in Notes to Condensed Consolidated Financial Statements—Note 10. Pension and Postretirement Benefit Plans.
For Other noncurrent liabilities, the change reflects an increase in the payables associated with our derivative financial instruments and deferred revenue from a co-development agreement, partially offset by distributions under certain of our deferred compensation programs and changes in accruals in the normal course of business.
For Treasury stock, the change reflects $5 billion paid to GS&Co. in March 2016 pursuant to the terms of an accelerated share repurchase agreement. See Notes to Condensed Consolidated Financial Statements—Note 12. Commitments and Contingencies for additional information.
| |
| ◦ | an increase to record an obligation in connection with the EU approval of Besponsa(see Notes to Condensed Consolidated Financial Statements—Note 7E. Financial Instruments: Other Noncurrent Liabilities); and |
| |
| ◦ | an increase in deferred revenue from a milestone payment received from Merck for the ertugliflozin collaboration agreement (see Notes to Condensed Consolidated Financial Statements––Note 2C. Acquisitions, Sale of Hospira Infusion Systems Net Assets, Collaborative Arrangement and Equity-Method Investments: Collaboration Arrangement). |
| |
| • | For Treasury stock, the change reflects $5 billion paid to Citibank in February 2017 pursuant to the terms of an accelerated share repurchase agreement. See Notes to Condensed Consolidated Financial Statements—Note 12. Commitments and Contingencies for additional information. |
ANALYSIS OF THE CONDENSED CONSOLIDATED STATEMENTS OF CASH FLOWS | | | | | Six Months Ended | | | | Six Months Ended | | |
| (MILLIONS OF DOLLARS) | | July 3,
2016 |
| | June 28,
2015 |
| | %
Change |
| | July 2,
2017 |
| | July 3,
2016 |
| | %
Change |
|
| Cash provided by/(used in): | | | | | | | | | | | | |
Operating activities | | $ | 5,230 |
| | $ | 4,770 |
| | 10 |
| | $ | 4,841 |
| | $ | 5,414 |
| | (11 | ) |
| Investing activities | | (323 | ) | | 4,487 |
| | * |
| | 3,034 |
| | (323 | ) | | * |
|
Financing activities | | (5,069 | ) | | (8,852 | ) | | (43 | ) | | (7,922 | ) | | (5,253 | ) | | 51 |
|
| Effect of exchange-rate changes on cash and cash equivalents | | (68 | ) | | (78 | ) | | (14 | ) | | 37 |
| | (68 | ) | | * |
|
Net increase/(decrease) in Cash and cash equivalents | | $ | (230 | ) | | $ | 327 |
| | * |
| |
Net decrease in Cash and cash equivalents | | | $ | (10 | ) | | $ | (230 | ) | | (96 | ) |
| |
| * | Calculation not meaningful. |
| |
(a) | Amounts for the six months ended July 3, 2016 have been revised from previously reported amounts to reflect the adoption of a new accounting standard in the fourth quarter of 2016, as of January 1, 2016, that requires that cash flows present (i) excess tax benefits as Other tax accounts, net as part of operating activities, rather than financing activities on a prospective basis beginning in the year of adoption, and (ii) cash paid by us when directly withholding shares for tax-withholding purposes as a cash outflow from financing activities, rather than operating activities and is reflected in the year of adoption. The year-to-date excess tax benefit was $51 million in the first six months of 2016. For cash paid by us for withholding purposes, $133 million for the first six months of 2016 is presented as financing activitiesin the condensed consolidated statement of cash flows (see Notes to Consolidated Financial Statements—Note 1B. Basis of Presentation and Significant Accounting Policies: Adoption of New Accounting Standards). |
In the condensed consolidated statements of cash flows, the line item Other changes in assets and liabilities, net of acquisitions and divestitures is presented excluding the effects of changes in foreign currency exchange rates, as these changes do not reflect actual cash inflows or outflows, and excluding any other significant non-cash movements. Accordingly, the amounts shown will not necessarily agree with the changes in the assets and liabilities that are presented in our condensed consolidated balance sheets.
Operating Activities
Our net cash provided by operating activities was $5.2$4.8 billion in the first six months of 2016,2017, compared to $4.8$5.4 billion in the same period of 2015.in 2016. The increasedecrease in net cash provided by operating activities reflects an increase in operating earnings, partially offset by the timing of receipts from customers and payments to vendors in the ordinary course of business, andas well as an increase in bonus payments made to employees.our net income after adjustments for the non-cash changes.
In the first six months of 2016 and 2015,2017, the line item Other adjustments, net primarily reflects, among other items, the decrease in the provision for bad debt expense, an increase in dividends from equity-method investments reclassified to investing activities in 2017 and an increase in net gains on sales of PP&E.
In the first six months of 2017 and 2016, the line item Other changes in assets and liabilities, net of acquisitions and divestitures, primarily reflects changes, in the normal course of business, in trade accounts receivable, inventories, other current assets, other noncurrent assets, trade accounts payable, accrued compensation and other current and non-currentnoncurrent liabilities. For the first six months of 2016 and 2015,, this line item also includes the adjustments necessary to reflect the payments of certain legal claims accrued in prior periods, including for the first six months of 2016, Protonix-related matters, and for the first six months of 2015, Neurontin-related matters, partially offset by the deferral of an upfront payment received from Lilly as part of a collaborative arrangement.matters. For additional information about accounts receivable, see also the “Selected Measures of Liquidity and Capital Resources: Accounts Receivable” section of this MD&A.
For additional information about changes in other assets and liabilities account balances, see also “Analysis of the Condensed Consolidated Balance Sheets” in this MD&A.
Investing Activities
Our net cash usedprovided by investing activities was $323 million$3.0 billion in the first six months of 2016,2017, compared to net cash provided byused in investing activities of $4.5 billion$323 million in the same period in 2015.2016. The decreasechange in net cash provided by investing activities was primarily attributable to:
cash paid of $4.5 billion, net of cash acquired, for the acquisition of Anacor in the first six months of 2016 compared to cash paid of $679 million, net of cash acquired, primarily for the acquisition of Baxter’s portfolio of marketed vaccines in the first six months of 2015. (see Notes to Condensed Consolidated Financial Statements—Note 2A. Acquisitions, Research and Development and Collaborative Arrangements, Equity-Method Investments and Cost-Method Investment: Acquisitions),
| |
| • | a decrease in cash used for acquisitions—cash paid of $1.0 billion, net of cash acquired, primarily for the acquisition of AstraZeneca’s small molecule anti-infectives business in 2017 and substantially all of the remaining consideration for the Medivation acquisition, compared to cash paid of $4.5 billion, net of cash acquired, for the acquisition of Anacor in 2016 (see Notes to Condensed Consolidated Financial Statements—Note 2A. Acquisitions, Sale of Hospira Infusion Systems Net Assets, Collaborative Arrangement and Equity-Method Investments: Acquisitions); and |
| |
| • | an increase in Other investing activities, net, including dividends received from equity-method investments, |
partially offset by:
net redemptions of investments of $5.1 billion in the first six months of 2016, compared to $5.3 billion in the first six months of 2015.
| |
| • | less net proceeds generated from the sale of investments of $638 million in 2017 for cash needs. |
Financing Activities
Our net cash used in financing activities was $5.1$7.9 billion in first six months of 2016,2017, compared to $8.9$5.3 billion in the same period in 2015.2016. The decreasechange in net cash used in financing activities was primarily attributable to:
net proceeds on short-term borrowings and long-term debt of $2.9 billion in the first six months of 2016, compared to net payments on borrowings of $504 million in the first six months of 2015; and
purchases of common stock of $5.0 billion in the first six months of 2016, compared to $6.0 billion in the first six months of 2015; | |
| • | $2.2 billion less proceeds raised from net short-term borrowings in the first six months of 2017, compared to the first six months of 2016, |
partially offset by:
| |
| • | the issuance of long-term debt of $5.3 billion in the first six months of 2017, compared to $5.0 billion in the same period in 2016 (see Notes to Condensed Consolidated Financial Statements––Note 7D. Financial Instruments: Long-Term Debt). |
proceeds from the exercise
Supplemental Schedule of stock optionsNon-Cash Investing and Financing Information
For further details on supplemental cash flow information, see Condensed Consolidated Statements of $696 million in the first six months of 2016, compared to $981 million in the first six months of 2015.Cash Flows.
ANALYSIS OF FINANCIAL CONDITION, LIQUIDITY AND CAPITAL RESOURCES
We rely largely on operating cash flows, short-term investments, short-term commercial paper borrowings and long-term debt to provide for our liquidity requirements. We continue our efforts to improve cash inflows through working capital efficiencies. We target specific areas of focus including accounts receivable, inventories, accounts payable, and other working capital, which allows us to optimize our operating cash flows. Due to our significant operating cash flows as well as our financial assets, access to capital markets and available lines of credit and revolving credit agreements, we believe that we have, and will maintain, the ability to meet our liquidity needs for the foreseeable future, which include:
the working capital requirements of our operations, including our research and developmentR&D activities;
investments in our business;
dividend payments and potential increases in the dividend rate;
share repurchases;
the cash requirements associated with our cost-reduction/productivity initiatives;
paying down outstanding debt;
contributions to our pension and postretirement plans; and
business-development activities.
Our long-term debt is rated high-quality by both S&P and Moody’s. See the “Credit Ratings” section below. As market conditions change, we continue to monitor our liquidity position. We have taken and will continue to take a conservative approach to our financial investments. Both short-term and long-term investments consist primarily of high-quality, highly liquid, well-diversified available-for-sale debt securities.
Selected Measures of Liquidity and Capital Resources | | The following table provides certain relevant measures of our liquidity and capital resources: | | (MILLIONS OF DOLLARS, EXCEPT RATIOS AND PER COMMON SHARE DATA) | | July 3,
2016 |
| | December 31,
2015 |
| | July 2,
2017 |
| | December 31,
2016 |
|
| Selected financial assets: | | | | | | | | |
Cash and cash equivalents(a) | | $ | 3,411 |
| | $ | 3,641 |
| | $ | 2,585 |
| | $ | 2,595 |
|
Short-term investments(a) | | 17,531 |
| | 19,649 |
| | 11,748 |
| | 15,255 |
|
Long-term investments(a) | | 13,124 |
| | 15,999 |
| | 7,008 |
| | 7,116 |
|
| | | 34,067 |
| | 39,290 |
| | 21,340 |
| | 24,967 |
|
| Debt: | | |
| | |
| | |
| | |
|
| Short-term borrowings, including current portion of long-term debt | | 13,724 |
| | 10,159 |
| | 9,514 |
| | 10,688 |
|
| Long-term debt | | 30,457 |
| | 28,740 |
| | 34,191 |
| | 31,398 |
|
| | | 44,181 |
| | 38,899 |
| | 43,705 |
| | 42,085 |
|
Selected net financial assets/(liabilities)(b) | | $ | (10,114 | ) | | $ | 391 |
| |
Selected net financial liabilities(b) | | | $ | (22,364 | ) | | $ | (17,118 | ) |
| | | | | | | | | |
Working capital(c) | | $ | 11,746 |
| | $ | 14,405 |
| | $ | 9,203 |
| | $ | 7,834 |
|
| Ratio of current assets to current liabilities | | 1.37:1 |
| | 1.49:1 |
| | 1.34:1 |
| | 1.25:1 |
|
Total Pfizer Inc. shareholders’ equity per common share(d) | | $ | 10.36 |
| | $ | 10.48 |
| | $ | 9.82 |
| | $ | 9.81 |
|
| |
(a) | See Notes to Condensed Consolidated Financial Statements––Note 7. Financial Instruments for a description of certain assets held and for a description of the credit risk related to our financial instruments held. |
| |
(b) | SelectedThe increase in selected net financial assets decreased due to anliabilities is primarily driven by (i) our decrease in short-term investments, the proceeds of which were used for various cash needs and (ii) the net increase in short-termlong-term debt. We retain a strong financial liquidity position as a result of our net cash provided by operating activities, our high-quality financial asset portfolio and long-termaccess to capital markets. Both Moody’s and S&P rating agencies maintained our strong investment-grade corporate debt rating subsequent to the acquisitionacquisitions of AnacorMedivation and payments on long-term debt.Anacor. For additional information, see the “Analysis of the Condensed Consolidated Statements of Cash Flows”“Credit Ratings” section of this MD&A. |
| |
(c) | The decreaseincrease in working capital is primarily due to an increase in short term borrowings, and the timing of accruals, cash receipts and payments in the ordinary course of business.business, an increase in inventory related to new products, and a decline in short-term borrowings, partially offset by a decline in short-term investments used for various cash needs. |
| |
(d) | Represents total Pfizer Inc. shareholders’ equity divided by the actual number of common shares outstanding (which excludes treasury stock). |
For additional information about the sources and uses of our funds, see the “Analysis of the Condensed Consolidated Balance Sheets” and the “Analysis of the Condensed Consolidated Statements of Cash Flows” sections of this MD&A.
On June 3, 2016,March 17, 2017, we completed a public offering of $5.0$1.065 billion aggregate principal amount of senior unsecured notes due 2047 with an interest rate of 4.20%, and on March 6, 2017, we completed a public offering of €4.0 billion principal amount of senior unsecured notes with a weighted-average effective interest rate of 0.23% (see Notes to Condensed Consolidated Financial Statements––Note 7D. Financial Instruments: Long-Term Debt).
Domestic and International Short-Term Funds
Many of our operations are conducted outside the U.S., and significant portions of our cash, cash equivalents and short-term investments are held internationally. We generally hold up to $10 billion of these short-term funds in U.S. tax jurisdictions. The amount of funds held in U.S. tax jurisdictions can fluctuate due to the timing of receipts and payments in the ordinary course of business and due to other reasons, such as business-development activities. As part of our ongoing liquidity assessments, we regularly monitor the mix of domestic and international cash flows (both inflows and outflows). Repatriation of overseas funds can result in additional U.S. federal, state and local income tax payments. We record U.S. deferred tax liabilities for certain unremitted earnings, but when amounts earned overseas are expected to be indefinitely reinvested outside the U.S., no accrual for U.S. taxes is provided.
Accounts Receivable
We continue to monitor developments regarding government and government agency receivables in several European markets where economic conditions remain challenging and uncertain. Historically, payments from a number of these European governments and government agencies extend beyond the contractual terms of sale. Specifically, we have received limiteddelayed payments in 2015 andfor 2016 revenues from the Greek government on outstanding receivables;government; the vast majority of suchGreece government receivables pertain to 2015 and 20162017 revenues. Also, the Greek government has restructured its debt to other third parties in the third quarter of 2015. Accordingly, we have adjusted2016. We determined our allowance for doubtful accounts to reflect these events, and have $55$29 million in net receivables from the Greek government as of July 3, 2016.2, 2017. Reported revenues from all customers in Greece for the six months ended July 3, 20162, 2017 were $127$121 million.
We believe that our allowance for doubtful accounts is appropriate. Our assessment is based on an analysis of the following: (i) payments received to date; (ii) the consistency of payments from customers; (iii) direct and observed interactions with the governments (including court petitions) and with market participants (for example, the factoring industry); and (iv) various third-party assessments of repayment risk (for example, rating agency publications and the movement of rates for credit default swap instruments).
As of July 3, 2016,2, 2017, we had about $752$506 million in aggregate gross accounts receivable from governments and/or government agencies in Italy, Spain, Greece and Portugal where economic conditions remain challenging and uncertain. Such receivables in excess of one year from the invoice date, totaling $97$65 million, were as follows: $65$45 million in Italy; $17$14 million in Portugal; $10$3 million in Greece; and $5$3 million in Spain.
Although certain European governments and government agencies sometimes delay payments beyond the contractual terms of sale, we seek to appropriately balance repayment risk with the desire to maintain good relationships with our customers and to ensure a humanitarian approach to local patient needs.
We will continue to closely monitor repayment risk and, when necessary, we will continue to adjust our allowance for doubtful accounts.
Our assessments about the recoverability of accounts receivables can result from a complex series of judgments about future events and uncertainties and can rely heavily on estimates and assumptions. For information about the risks associated with estimates and assumptions, see Notes to Consolidated Financial Statements––Note 1C. Basis of Presentation and Significant Accounting Policies:Estimates and Assumptions included in our 20152016 Financial Report.
Credit Ratings
Two major corporate debt-rating organizations, Moody’s and S&P, assign ratings to our short-term and long-term debt. A security rating is not a recommendation to buy, sell or hold securities and the rating is subject to revision or withdrawal at any time by the rating organization. Each rating should be evaluated independently of any other rating.
|
| | | | | | | | |
| The following table provides the current ratings assigned by these rating agencies to our commercial paper and senior unsecured long-term debt: |
| NAME OF RATING AGENCY | | Pfizer Commercial Paper | | Pfizer Long-Term Debt | | Date of Last Rating Change |
| | Rating | | Rating | | Outlook | |
Moody’s(a) | | P-1 | | A1 | | Negative Outlook | | May 2016October 2009 |
S&P(b) | | A-1+ | | AA | | Stable | | April 2016October 2009 |
| |
(a) | In September 2016, Moody’s updated their credit outlook from negative outlook to stable. |
| |
(b) | In April 2016, S&P updated their credit outlook from negative watch to stable. |
Debt Capacity
We have available lines of credit and revolving credit agreements with a group of banks and other financial intermediaries. We maintain cash and cash equivalent balances and short-term investments in excess of our commercial paper and other short-term borrowings. As of July 3, 2016,2, 2017, we had access to $7.9$7.7 billion of lines of credit, of which $867$665 million expire within one year. Of these lines of credit, $7.9$7.7 billion arewere unused, of which our lenders have committed to loan us $7.1$7.0 billion at our request. Also, $7.0 billion of our unused lines of credit, all of which expire in 2020,2021, may be used to support our commercial paper borrowings.
Global Economic Conditions––General
The global economic environment has not had, nor do we anticipate it will have, a material impact on our liquidity or capital resources. Due to our significant operating cash flows, financial assets, access to capital markets and available lines of credit and revolving credit agreements, we continue to believe that we have, and will maintain, the ability to meet our liquidity needs for the foreseeable future. As market conditions change, we continue toWe monitor our liquidity position.position continuously in the face of evolving economic conditions.
Global Economic Conditions––U.K.
In June 2016, the U.K. electorate voted in a referendum to leave the EU. TheEU, which is commonly referred to as “Brexit”. In January 2017, the U.K. Prime Minister announced a 12-point plan of negotiating objectives and confirmed that the U.K. government haswill not seek continued membership in the EU single market. In March 2017, the U.K. government formally notified the European Council of theirits intention to leave the EU which wouldafter it triggered Article 50 of the Lisbon Treaty to begin athe two-year negotiation process establishing the terms of the exit and outlining the future relationship between the U.K. and the EU. This process is expected to be highly complex and may, if needed, be bi-laterally extended. Thethe end result of these negotiations may pose certain implications to our research, commercial and general business operations in the U.K. and the EU.
We generated approximately 2% of our worldwide revenues from the U.K. in the first six months of 2017. However, except for the foreign currency exchange impact from the weakening U.K. pound relative to the U.S. dollar to date, there are no other immediate-term impacts to our business as there has not yet been a formal change in the relationship between the U.K. and the EU. In addition, because of the significant uncertainties associated with the negotiation process, any potential long-term impacts are not currently determinable.
Global Economic Conditions––Venezuela Operations
Our Venezuela operations continue to operate with the U.S. dollar as the functional currency due to the hyperinflationary status of the Venezuelan economy.
In the second quarter of 2015, the Venezuelan government identified three official rates of exchange. These are the CENCOEX rate of 6.3; the SICAD rate of 13.5 (as of August 2016)2017); and, after the international quarter end, there was a change in the Venezuelan government foreign exchange system resulting in the SIMADI rate of 6402,970 (as of August 2016)2017). Effective in March 2016, the CENCOEX rate was replaced by the DIPRO rate of 10 (as of August 2016)February 2017); the SICAD rate ceased to be offered; and the SIMADI rate was planned to be replaced by the DICOM rate, but the DICOM rate is not published. The Venezuelan government continues to publish the SIMADI rate, which is commonly referred to as the DICOM rate, and that rate has grown from 206 in March 2016 to about 6402,970 (as of August 2016)2017). Based on recent conditions in Venezuela, we resolved that our Venezuelan bolivar-denominated net monetary assets that are subject to revaluation are no longer expected to be substantially settled at the Venezuelan government CENCOEX official rate of 6.3 or the DIPRO official rate of 10, but at a rate of 500 at the end of the second quarter.quarter and third quarter of 2016, and 670 at the end of the fourth quarter of 2016 and at the end of the first and second quarter of 2017.
We cannot predict whether there will be further devaluations of the Venezuelan currency or whether our use of the SIMADI officialDICOM rate will continue to be supported by evolving facts and circumstances. Further, other potential actions by the Venezuelan government in response to economic uncertainties could impact the recoverability of our investment in Venezuela, which could result in an impairment charge and, under extreme circumstances, could impact our ability to continue to operate in the country in the same manner as we have historically.
On July 11, 2016, the Venezuelan government administration announced a new program under a State of Emergency decree that is intended to control the use of raw materials, production and distribution of products, specifically for medicines and foods. It is uncertain how this program will be applied to Pfizer in Venezuela. We continue to operate under adverse conditions in Venezuela and have $12$17 million of net monetary assets and $84$44 million of non-monetary assets, excluding inventory carried at lower of cost or market, in Venezuela.Venezuela at May 28, 2017, our international quarter-end.
Off-Balance Sheet Arrangements
In the ordinary course of business and in connection with the sale of assets and businesses, we often indemnify our counterparties against certain liabilities that may arise in connection with a transaction or that are related to activities prior to a transaction. These indemnifications typically pertain to environmental, tax, employee and/or product-related matters, and patent-infringement claims. If the indemnified party were to make a successful claim pursuant to the terms of the indemnification, we would be required to reimburse the loss. These indemnifications generally are subject to threshold amounts, specified claim periods and other restrictions and limitations. Historically, we have not paid significant amounts under these provisions and, as of July 3, 2016,2, 2017, recorded amounts for the estimated fair value of these indemnifications were not significant.
Certain of our co-promotion or license agreements give our licensors or partners the rights to negotiate for, or in some cases to obtain under certain financial conditions, co-promotion or other rights in specified countries with respect to certain of our products.
Share-Purchase Plans and Accelerated Share Repurchase Agreements
OnOur October 23, 2014 we announced that the Board of Directors had authorized an $11 billion share-purchase plan and share purchases commenced thereunderwas exhausted in January 2015.the first quarter of 2017. In December 2015, the Board of Directors authorized a newan $11 billion share repurchase program, to be utilized over time.and share repurchases commenced thereunder in the first quarter of 2017.
On March 8, 2016,February 2, 2017, we entered into an accelerated share repurchase agreement with GS&Co.Citibank to repurchase $5 billion of our common stock. PursuantFor additional information, see Notes to the termsCondensed Consolidated Financial Statements––Note 12. Commitments and Contingencies and “Unregistered Sales of the agreement,Equity Securities and Use of Proceeds––Issuer Purchases of Equity Securities” in Part II, Item 2 of this Quarterly Report on March 10, 2016, we paid $5 billion to GS&Co. and received an initial delivery of approximately 136 million shares of our common stock from GS&Co. based on a price of $29.36 per share, which represented, based on the closing share price of our common stock on the NYSE on March 8, 2016, approximately 80% of the notional amount of the accelerated share repurchase agreement. On June 20, 2016, the accelerated share repurchase agreement with GS&Co. was completed, which, per the terms of the agreement, resulted in GS&Co. owing us a certain number of shares of Pfizer common stock. Pursuant to the agreement’s settlement terms, we received an additional 18 million shares of our common stock from GS&Co. on June 20, 2016. The average price paid for all of the shares delivered under the accelerated share repurchase agreement was $32.38 per share. The common stock received is included in Treasury stock. This agreement was entered into pursuant to our previously announced share repurchase authorization.Form 10-Q.
| | | The following table provides the number of shares of our common stock purchased and the cost of purchases under our publicly announced share-purchase plans, including our accelerated share repurchase agreements: | |
| The following table provides the number of shares of our common stock purchased and the cost of purchases under our publicly announced accelerated share repurchase agreements: | | The following table provides the number of shares of our common stock purchased and the cost of purchases under our publicly announced accelerated share repurchase agreements: |
| | | Three Months Ended | | Six Months Ended | | Three Months Ended | | Six Months Ended |
| (SHARES IN MILLIONS, DOLLARS IN BILLIONS) | | July 3 2016(a) |
| | June 28, 2015 |
| | July 3, 2016(a) |
| | June 28, 2015(b) |
| | July 2,
2017(a) |
| | July 3,
2016(b) |
| | July 2,
2017(a) |
| | July 3,
2016(b) |
|
| Shares of common stock purchased | | 18 |
| | — |
| | 154 |
| | 182 |
| | 24 |
| | 18 |
| | 150 |
| | 154 |
|
| Cost of purchase | | $ | — |
| | $ | — |
| | $ | 5.0 |
| | 6.0 |
| | $ | — |
| | $ | — |
| | $ | 5.0 |
| | $ | 5.0 |
|
| |
(a) | Represents shares purchased pursuant to and received upon settlement of an accelerated share repurchase agreement.agreement with Citibank. For additional information, seeNotes to Condensed Consolidated Financial Statements––Note 12. Commitments and Contingencies and “Unregistered Sales of Equity Securities and Use of Proceeds––Issuer Purchases of Equity Securities"Securities” in Part II, Item 2 of this Quarterly Report on Form 10-Q. |
| |
(b) | Includes approximately 151 millionRepresents shares purchased for $5 billion pursuant to an accelerated share repurchase agreement.agreement entered into on March 8, 2016. For additional information, see Notes to Consolidated Financial Statements––Note 12. Equity in our 2015 Form 10-K.2016 Financial Report.
|
After giving effect to the accelerated share repurchase agreement,At July 2, 2017, our remaining share-purchase authorization iswas approximately $11.4 billion as of July 3, 2016.$6.4 billion.
Dividends on Common Stock
In June 2016,2017, our Board of Directors declared a dividend of $0.30$0.32 per share, payable on September 1, 2016,2017, to shareholders of record at the close of business on August 5, 2016.4, 2017.
NEW ACCOUNTING STANDARDS
Recently Adopted Accounting Standards
See Notes to Condensed Consolidated Financial Statements––Note 1B. Basis of Presentation and Significant AccountingPolicies: Adoption of New Accounting Standards.
Recently Issued Accounting Standards, Not Adopted as of July 3, 20162, 2017
|
| | | | |
The following table provides a brief description of recently issued accounting standards, not yet adopted: |
| Standard/Description | | Effective Date | | Effect on the Financial Statements or Other Significant Matters |
In July 2015, the FASB issued an update related to inventory. The new guidance requires that inventory be measured at the lower of cost or net realizable value.
| | January 1, 2017. Earlier application is permitted as of the beginning of an interim or annual reporting period. | | We do not expect the provisions of this new standard will have a material impact on our consolidated financial statements. |
In May 2014, the FASB issued amended guidance related to revenue from contracts with customers. The new guidance introduces a new principles-based framework for revenue recognition and disclosure. Since its issuance the FASB has issued fivesix ASUs, amending the guidance and effective date, and the SEC has rescinded certain related SEC guidance; the most recent of whichthese changes was issued in MayDecember 2016. | | January 1, 2018. Earlier application is permitted only as of annual reporting periods beginning after December 15, 2016, including interim reporting periods within that reporting period.
| | We have not yet completedmade substantial progress in completing our final review of the impact of this guidance although we currentlyacross our various business arrangements and revenue-related activities, and do not anticipateexpect the adoption of this standard to have a material impact on our financial statements and revenue recognition practices.practices, or our internal controls. We continue to review variable consideration, potential disclosures,expect that milestone payments received in our collaboration agreements, which are recorded in Other (income)/deductions––net, and our method of adoption to complete our evaluationcurrently amortized over the life of the impact onagreement, will, for many arrangements, be amortized over the development period. We are reviewing our consolidated financial statements. In addition, wedisclosures for revenue recognition and do not anticipate significant changes will be needed to conform with the disclosure requirements of the new guidance. We continue to monitor additional changes, modifications, clarifications or interpretations being undertaken by the FASB, which may impact our current conclusions. In addition, we continue to monitor other changes, such as changes in our business, new collaboration arrangements, business combinations, etc., which may impact our current conclusions prior to the adoption date. |
In January 2016, the FASB issued an update to its guidance on recognition and measurement of financial assets and liabilities.Among other things, the new guidance makes the following targeted changes to existing guidance: 1. Requires certain equity investments to be measured at fair value with changes in fair value recognized in net income. However, an entity may choose to measure equity investments that do not have readily determinable fair values at cost minus impairment, if any, plus or minus changes resulting from observable price changes in orderly transactions for the identical or similar investment of the same issuer. 2. Simplifies the impairmentRequires a qualitative assessment of equity investments without readily determinable fair values by requiring a qualitative assessment to identify impairment. 3. Requires separate presentation of financial assets and financial liabilities by measurement category and form of financial asset on the balance sheet or in the accompanying notes to the financial statements. | | January 1, 2018. | | We have substantially completed our review and will continue to assess events which may occur prior to adoption. As of July 2, 2017, we have $488 million in available-for-sale equity securities and approximately $694 million of restricted stock and private equity securities which will be subject to the new rules. Further, for the six months ended July 2, 2017, we recognized $170 million of unrealized holding gains on available-for-sale equity securities in Other comprehensive income, which would have been recorded to Other (income)/deductions––net under the new rules. We expect the adoption of this new accounting standard may increase the volatility of our income in future periods due to changes in the fair value of equity investments. The impact of adoption will be recorded as a cumulative effect adjustment to Retained earnings. |
In August 2016, the FASB issued new guidance on the classification of certain transactions in the Statement of Cash Flows. | | January 1, 2018. Earlier application is permittedpermitted. | | We have substantially completed our review and will continue to assess events which may occur prior to adoption. Upon adoption, we expect to reclassify approximately $362 million of cash outflows related to debt redemption in 2016 from operating activities to financing activities. We also expect to reclassify approximately $32 million of cash inflows from trust-owned life insurance contracts in 2016 from operating activities to investing activities. Cash outflows from trust-owned life insurance contracts represent benefit payments and are classified as operating activities. In addition, the new guidance may impact the classification of certain cash flows related to contingent consideration in a business acquisition, depending on the ultimate settlement amount of the beginning of an interim or annual reporting period.contingency. |
|
| | | | |
| Standard/Description | | Effective Date | | Effect on the Financial Statements or Other Significant Matters |
In October 2016, the FASB issued new guidance on the presentation of restricted cash in the Statement of Cash Flows. | | January 1, 2018. Earlier application is permitted. | | We are assessinghave not yet completed our review of the impact of the provisions of this new guidance on our consolidated financial statements. However, our restricted cash balances as of the end of 2016 were approximately $18.1 million of short-term restricted cash and $45.3 million of long-term restricted cash. Our restricted cash balances as of July 2, 2017 were approximately $0.4 million of short-term restricted cash and $51.5 million of long-term restricted cash. |
In October 2016, the FASB issued an update to its guidance on income tax accounting. The new guidance replaces the prohibition against recognizing current and deferred income taxes for an intra-entity asset transfer until the asset has been sold to an outside party with a requirement to do so, unless the asset transferred is inventory. | | January 1, 2018. | |
Our analysis of the standard indicates that our estimate of the impact to our consolidated financial statements, using current assumptions, is not material. However, while we currently do not have any specific plans, we cannot predict intercompany asset transfers other than inventory that may occur in the future, as they are dependent on economic and operational factors that may change over time. For example, an acquisition might cause us to realign legal entities and to transfer assets between entities as we integrate an acquired company into Pfizer. We anticipate that after adoption, our effective tax rate could be impacted by the immediate recognition of the tax consequences of intercompany asset transfers other than inventory. The impact of adoption will be recorded as a cumulative effect adjustment to Retained earnings.
|
In January 2017, the FASB issued new guidance to clarify the definition of a business. The new guidance provides a new framework for determining whether business development transactions should be accounted for as acquisitions (or disposals) of assets or businesses. If the fair value of the gross assets acquired is concentrated in a single identifiable asset, the transaction will not qualify for treatment as a business. The new guidance also requires that to be considered a business, a set of integrated activities and assets must include, at a minimum, an input and a substantive process that together significantly contribute to the ability to create outputs, without regard as to whether a market participant could replace missing elements. In addition, the new guidance narrows the definition of the term “output” to make it consistent with how outputs are described in the updated revenue recognition guidance. | | January 1, 2018. Earlier application is permitted. | | We have made substantial progress in completing our review of this guidance. The new accounting standard is applicable on a prospective basis upon adoption and therefore has no impact on completed transactions. We expect that subsequent to our anticipated adoption date of January 1, 2018, fewer transactions will be accounted for as business acquisitions (decreasing the amount of goodwill incurred and potentially increasing IPR&D expense) or disposals of a business. We will continue to monitor for changes in our business, and business combination or other transactions which might close after adoption and be impacted by these new standards. |
In February 2017, the FASB issued amended guidance related to the derecognition of nonfinancial assets. | | January 1, 2018. Earlier application is permitted. | | We have not yet completed our review of the impact of this new guidance on our consolidated financial statements. However, we are not expecting a material impact on existing transactions. |
In March 2017, the FASB issued guidance on the presentation of net periodic pension and postretirement benefit cost. Under the new rules, entities that sponsor defined benefit plans will present net benefit cost as follows: 1. Service cost will be included in the same income statement line items where other employee compensation costs are reported. 2. The other components of net benefit cost will be presented outside of income from operations, if such a subtotal is presented. 3. Only the service cost component will be capitalized, when applicable (for example, as a cost of inventory, internal-use software, or a self-constructed fixed asset). If a separate line item is used to present the other components of net benefit cost, it should have an appropriate description. If a separate line item or items is not used, the line item or items in the income statement where the other components of net benefit cost are included must be disclosed. | | January 1, 2018. | | We have not yet completed our review of the impact of this new guidance on our consolidated financial statements, although we anticipate that after adoption, the net benefit costs other than service costs will be reclassified to Other (income)/deductions—net from their current classification within Cost of sales, Selling, informational and administrative expenses, and Research and development expenses. Effective January 1, 2018, future accruals under the Pfizer Consolidated Pension Plan (our largest U.S. defined benefit plan), will freeze, and the Pfizer defined contribution savings plan will provide additional annual contributions to those previously accruing benefits under the Pfizer Consolidated Pension Plan. This change will result in elimination of future service costs for the plan. |
In May 2017, the FASB issued new guidance on the accounting for modifications of share-based payment awards. The new guidance clarifies that changes in the terms or conditions of a share-based payment award be accounted for as a modification unless all the following conditions are met: 1. The fair value of the modified award is the same as the fair value of the original award immediately before the original award is modified.2. The vesting conditions of the modified award are the same as the vesting conditions of the original award immediately before the original award is modified.3. The modification does not change the classification of the award as an equity instrument or a liability instrument. | | January 1, 2018. Early application is permitted, including in interim periods. | | We have not yet completed our review of the impact of this new guidance on our consolidated financial statements. However, any impact will be dependent upon whether we make any future modifications of share-based payment awards, and we have no plans to modify share-based payment awards at this time. |
|
| | | | |
| Standard/Description | | Effective Date | | Effect on the Financial Statements or Other Significant Matters |
In February 2016, the FASB issued an update to its guidance on leases. The new ASU provides guidance for both lessee and lessor accounting models. Among other things, the new guidance requires that a right of use asset and a lease liability be recognized for leases with a duration of greater than one year. | | January 1, 2019. Earlier application is permitted. | | We have not yet completed our review of the impact of this guidance. However, we anticipate recognition of at least $2 billion of additional assets and corresponding liabilities related toon our balance sheet. We are currently assessing the potential impact of embedded leases on our balance sheet. |
| consolidated financial statements, given our manufacturing outsourcing and other agreements. In connection with this guidance we will need to design new processes and technological solutions to provide the appropriate financial accounting and disclosure data. |
| | | | |
Standard/DescriptionIn March 2017, the FASB issued new guidance that shortens the amortization period for certain callable debt securities held at a premium. The new guidance requires the premium to be amortized to the earliest call date. | | Effective DateJanuary 1, 2019. Early application is permitted, including in interim periods, so long as any adjustments are reflected as of the beginning of the fiscal year that includes the interim period in which the guidance is applied. | | EffectWe are assessing the impact of the provisions of this new guidance on the Financial Statements or Other Significant Mattersour consolidated financial statements. |
In March 2016,July 2017, the FASB issued new guidance on accounting for employee share-based payments. The new guidance changes existing guidance as follows: 1. All excess tax benefitscertain financial instruments with characteristics of liabilities and tax deficiencies (including tax benefitsequity, and accounting for certain financial instruments with down round features (a feature in a financial instrument that reduces the strike price of dividends on share-based payment awards) should be recognized as income tax expensean issued financial instrument if the issuer sells shares of its stock for an amount less than the currently stated strike price of the issued financial instrument or benefit inissues an equity-linked financial instrument with a strike price below the income statement. The tax effectscurrently stated strike price of exercised or vested awards should be treated as discrete items in the reporting period in which they occur. Excess tax benefits will be recognized regardless of whether the benefit reduces taxes payable in the current period. Excess tax benefits should be classified along with other income tax cash flows as an operating activity.
2. The minimum statutory tax withholding requirement to qualify for equity classification has changed to permit withholding up to the maximum statutory tax rates in the applicable jurisdictions.
3. Cash paid by an employer when directly withholding shares for tax-withholding purposes will be classified as a financing activity in the statement of cash flows.
4. An entity-wide accounting policy election may be made to either estimate the number of awards that are expected to vest (current GAAP) or to account for forfeitures when they occur.issued financial instrument).
| | January 1, 2017, with earlier2019. Earlier application is permitted.
| | We have not yet completed our revieware assessing the impact of the impactprovisions of this new guidance on our consolidated financial statements. Although it is difficult to predict the impact as it is dependent on the timing of when employees exercise stock options and the fair value of our stock price at that time, we do not anticipate a material impact to our consolidated financial statements upon adoption.
|
In June 2016, the FASB issued new guidance on accounting for credit losses of financial instruments. The new guidance replaces the incurred losses methodology in current GAAP with a methodology that reflects expected credit losses using an allowance account. | | January 1, 2020. Earlier application is permitted as of fiscal years beginning after December 15, 2018, including interim periods within that fiscal year. | | We are assessing the impact of the provisions of this new guidance on our consolidated financial statements. |
In January 2017, the FASB issued new guidance for goodwill impairment testing. The new guidance eliminates the requirement to perform a hypothetical purchase price allocation to measure goodwill impairment. Under the new guidance the goodwill impairment test is performed by comparing the fair value of a reporting unit with its carrying amount, and recognizing an impairment charge for the amount by which the carrying amount of the reporting unit exceeds its fair value, although it cannot exceed the total amount of goodwill allocated to that reporting unit. | | January 1, 2020. Earlier application is permitted. | | We have not yet completed our review of the impact of this new guidance on our consolidated financial statements.
However, we do not expect this new guidance to have a material impact on our consolidated financial statements. |
FORWARD-LOOKING INFORMATION AND FACTORS THAT MAY AFFECT FUTURE RESULTS
This report and other written or oral statements that we make from time to time contain forward-looking statements that set forth anticipated results based on management’s plans and assumptions.statements. Such forward-looking statements involve substantial risks and uncertainties. We have tried, wherever possible, to identify such statements by using words such as “will,” “may,” “could,” “likely,” “ongoing,” “anticipate,” “estimate,” “expect,” “project,” “intend,” “plan,” “believe,” “target,” “forecast,” “goal,” “objective,” “aim” and other words and terms of similar meaning or by using future dates in connection with any discussion of, among other things, our anticipated future operating and financial performance, business plans and prospects, in-line products and product candidates, including anticipated regulatory submissions, approvals, performance and potential benefits of Pfizer’s products and product candidates,
strategic reviews, capital allocation, business-development plans and plans relating to share repurchases and dividends. In particular, these include statements relating to future actions, business plans and prospects, our acquisitions and other business development activities, the disposition of Hospira and Anacor,the HIS net assets, prospective products or product approvals, future performance or results of current and anticipated products, sales efforts, expenses, interest rates, foreign exchange rates, the outcome of contingencies, such as legal proceedings, plans relating to share repurchases and dividends, government regulation and financial results, including, in particular, the financial guidance set forth in the “Our Financial Guidance for 2016”2017” section of this MD&A, the anticipated costs and cost savings, including from our acquisition of Hospira and our cost-reduction/productivity initiatives set forth in the “Overview of Our Performance, Operating Environment, Strategy and Outlook” and “Costs and Expenses––Restructuring Charges and Other Costs Associated with Acquisitions and Cost-Reduction/Productivity Initiatives” sectionssection of this MD&A and in Notes to Condensed Consolidated Financial Statements––Note 3. Restructuring Charges and Other Costs Associated with Acquisitions and Cost-Reduction/Productivity Initiatives, the benefits including cost savings, expected from our acquisition of Hospira;business development transactions, the expected timing of a decision regarding a potential separation of our IH and EH businesses,anticipated product performance set forth in the “Overview of Our Performance, Operating Environment, Strategy“Revenues and Outlook” sectionProduct Developments—Revenues—Selected Product Discussion" of this MD&A;&A and the contributions that we expect to make from our general assets to our pension and postretirement plans during 20162017 set forth in Notes to Condensed Consolidated Financial Statements––Note 10. Pension and Postretirement Benefit Plans. Among the factors that could cause actual results to differ materially from past results and future plans and projected future results are the following:
the outcome of research and development activities including, without limitation, the ability to meet anticipated pre-clinical and clinical trial commencement and completion dates, regulatory submission and approval dates, and launch dates for product candidates, as well as the possibility of unfavorable pre-clinical and clinical trial results, including unfavorable new clinical data and additional analyses of existing clinical data;
decisions by regulatory authorities regarding whether and when to approve our drug applications, which will depend on the assessment by such regulatory authorities of the benefit-risk profile suggested by the totality of the
efficacy and safety information submitted; decisions by regulatory authorities regarding labeling, ingredients and other matters that could affect the availability or commercial potential of our products; and uncertainties regarding our ability to address the comments in complete response letters received by us with respect to certain of our drug applications to the satisfaction of the FDA;
the speed with which regulatory authorizations, pricing approvals and product launches may be achieved;
the outcome of post-approval clinical trials, which could result in the loss of marketing approval for a product or changes in the labeling for, and/or increased or new concerns about the safety or efficacy of, a product that could affect its availability or commercial potential;
risks associated with interim data, including the risk that final results of studies for which interim data have been provided and/or additional clinical trials may be different from (including less favorable than) the interim data results and may not support further clinical development of the applicable product candidate or indication;
the success of external business-development activities, including the ability to satisfy the conditions to closing of any announced transactions in the anticipated time frame or at all;all or to realize the anticipated benefits of such transactions;
competitive developments, including the impact on our competitive position of new product entrants, in-line branded products, generic products, private label products, biosimilars and product candidates that treat diseases and conditions similar to those treated by our in-line drugs and drug candidates;
the implementation by the FDA and regulatory authorities in certain other countries of an abbreviated legal pathway to approve biosimilar products, which could subject our biologic products to competition from biosimilar products, with attendant competitive pressures, after the expiration of any applicable exclusivity period and patent rights;
risks related to our ability to develop and launch biosimilars;biosimilars, including risks associated with “at risk” launches, defined as the marketing of a product by Pfizer before the final resolution of litigation (including any appeals) brought by a third party alleging that such marketing would infringe one or more patents owned or controlled by the third party;
the ability to meet competition from generic, branded and branded competitionbiosimilar products after the loss or expiration of patent protection for our products or competitor products;
the ability to successfully market both new and existing products domestically and internationally;
difficulties or delays in manufacturing;manufacturing, including possible legal or regulatory actions, such as warning letters, suspension of manufacturing, seizure of product, injunctions or voluntary recall of a product;
trade buying patterns;
the impact of existing and future legislation and regulatory provisions on product exclusivity;
trends toward managed care and healthcare cost containment, and our ability to obtain or maintain timely or adequate pricing or formulary placement for our products;
the impact of any significant spending reductions or cost controls affecting Medicare, Medicaid or other publicly funded or subsidized health programs or changes in the tax treatment of employer-sponsored health insurance that may be implemented, and/or any significant additional taxes or fees that may be imposed on the pharmaceutical industry as part of any broad deficit-reduction effort;
the impact of any U.S. healthcare reform or legislation, enacted in 2010—including any repeal, substantial modification or invalidation of any or all of the provisions of the U.S. Patient Protection and Affordable Care Act, as amended by the Health Care and Education Reconciliation Act––Act, and of any modification, repealthe passage or invalidation of anyfailure of the provisions thereof;American Health Care Act;
U.S. federal or state legislation or regulatory action and/or policy efforts affecting, among other things, pharmaceutical product pricing, reimbursement or access, including under Medicaid, Medicare and other publicly funded or subsidized health programs; patient out-of-pocket costs for medicines, manufacturer prices and/or price increases that could result in new mandatory rebates and discounts or other pricing restrictions; the importation of prescription drugs from outside the U.S. at prices that are regulated by governments of various foreign countries; restrictions on direct-to-consumer advertising; limitations on interactions with healthcare professionals; or the use of comparative effectiveness methodologies that could be implemented in a manner that focuses primarily on the cost differences and minimizes the therapeutic differences among pharmaceutical products and restricts access to innovative medicines; as well as pricing pressures for our products as a result of highly competitive insurance markets;
legislation or regulatory action in markets outside the U.S. affecting pharmaceutical product pricing, reimbursement or access, including, in particular, continued government-mandated reductions in prices and access restrictions for certain biopharmaceutical products to control costs in those markets;
the exposure of our operations outside the U.S. to possible capital and exchange controls, expropriation and other restrictive government actions, changes in intellectual property legal protections and remedies, as well as political unrest, unstable governments and legal systems and inter-governmental disputes;
contingencies related to actual or alleged environmental contamination;
claims and concerns that may arise regarding the safety or efficacy of in-line products and product candidates;
any significant breakdown, infiltration or interruption of our information technology systems and infrastructure;
legal defense costs, insurance expenses and settlement costs, costs;
the risk of an adverse decision or settlement and the adequacy of reserves related to legal proceedings, including patent litigation, product liability patent matters,and other product-related litigation, including personal injury, consumer, off-label promotion, securities, antitrust and breach of contract claims, commercial, environmental, government investigations, consumer, commercial, securities, antitrust, environmental, employment tax issues, ongoing efforts to exploreand other legal proceedings, including various means for resolving asbestos litigation, and other legal proceedings;as well as tax issues;
our ability to protect our patents and other intellectual property, both domestically and internationally;
interest rate and foreign currency exchange rate fluctuations, including the impact of possible currency devaluations in countries experiencing high inflation rates and the volatility following the U.K. referendum in which voters approved the exit from the EU;
governmental laws and regulations affecting domestic and foreign operations, including, without limitation, tax obligations and changes affecting the tax treatment by the U.S. of income earned outside the U.S. that may result from pending and possible future proposals;
any significant issues involving our largest wholesale distributors, which account for a substantial portion of our revenues;
the possible impact of the increased presence of counterfeit medicines in the pharmaceutical supply chain on our revenues and on patient confidence in the integrity of our medicines;
the end result of any negotiations between the U.K. government and the EU regarding the terms of the U.K.’s exit from the EU, which could have implications on our research, commercial and general business operations in the U.K. and the EU;
any significant issues involving our largest wholesaler customers, which account for a substantial portion of our revenues;
the possible impact of the increased presence of counterfeit medicines in the pharmaceutical supply chain on our revenues and on patient confidence in the integrity of our medicines;
any significant issues that may arise related to the outsourcing of certain operational and staff functions to third parties, including with regard to quality, timeliness and compliance with applicable legal requirements and industry standards;
any significant issues that may arise related to our joint ventures and other third-party business arrangements;
changes in U.S. generally accepted accounting principles;
changes in interpretations of existing laws and regulations, or changes in laws and regulations, in the U.S. and other countries;
uncertainties related to general economic, political, business, industry, regulatory and market conditions including, without limitation, uncertainties related to the impact on us, our customers, suppliers and lenders and counterparties to our foreign-exchange and interest-rate agreements of challenging global economic conditions and recent and possible future changes in global financial markets; and the related risk that our allowance for doubtful accounts may not be adequate;
any changes in business, political and economic conditions due to actual or threatened terrorist activity in the U.S. and other parts of the world, and related U.S. military action overseas;
growth in costs and expenses;
changes in our product, segment and geographic mix;
the impact of purchase accounting adjustments, acquisition-related costs, discontinued operations and certain significant items;
the impact of acquisitions, divestitures, restructurings, internal reorganizations, product recalls, withdrawals and other unusual items, including our ability to realize the projected benefits of our cost-reduction and productivity initiatives including those related to our research and development organization, and of the internal separation of our commercial operations into our current operating structure;
the risk of an impairment charge related to our intangible assets, goodwill or equity-method investments;
risks related to internal control over financial reporting; and
risks and uncertainties related to our recent acquisitions of Hospira, Anacor, Medivation and Anacor,AstraZeneca’s small molecule anti-infectives business, including, among other things, the ability to realize the anticipated benefits of thethose acquisitions, of Hospira and Anacor, including the possibility that expected cost savings related to the acquisition of Hospira and accretion related to the acquisitions of Hospira, Anacor and AnacorMedivation will not be realized or will not be realized within the expected time frame; the risk that the businesses will not be integrated successfully; disruption from the transactiontransactions making it more difficult to maintain business and operational relationships; risks related to our ability to grow revenues for Xtandi and expand Xtandi into the non-metastatic castration-resistant prostate cancer setting; significant transaction costs; and unknown liabilities.
We cannot guarantee that any forward-looking statement will be realized, although we believe we have been prudent in our plans and assumptions.realized. Achievement of anticipated results is subject to substantial risks, uncertainties and inaccurate assumptions. Should known or unknown risks or uncertainties materialize or should underlying assumptions prove inaccurate, actual results could vary materially from past results and those anticipated, estimated or
projected. Investors should bear this in mind as they consider forward-looking statements, and are cautioned not to put undue reliance on forward-looking statements.
We undertake no obligation to publicly update forward-looking statements, whether as a result of new information, future events or otherwise, except as required by law or by the rules and regulations of the SEC. You are advised, however, to consult any further disclosures we make on related subjects in our Form 10-Q, 8-K and 10-K reports and our other filings with the SEC.subjects.
Our 20152016 Form 10-K listed various important factors that could cause actual results to differ materially from past and projected future results. We note these factors for investors as permitted by the Private Securities Litigation Reform Act of 1995. Readers can find them in Part I, Item 1A, of that filing under the heading “Risk Factors.” We incorporate that section of that Form 10-K in this filing and investors should refer to it. You should understand that it is not possible to predict or identify all such factors. Consequently, you should not consider any such list to be a complete set of all potential risks or uncertainties.
The operating segment information provided in this report does not purport to represent the revenues, costs and income from continuing operations before provision for taxes on income that each of our operating segments would have recorded had each segment operated as a standalone company during the periods presented.
This report includes discussion of certain clinical studies relating to various in-line products and/or product candidates. These studies typically are part of a larger body of clinical data relating to such products or product candidates, and the discussion herein should be considered in the context of the larger body of data. In addition, clinical trial data are subject to differing interpretations, and, even when we view data as sufficient to support the safety and/or effectiveness of a product candidate or a new indication for an in-line product, regulatory authorities may not share our views and may require additional data or may deny approval altogether.
Legal Proceedings and Contingencies
Information with respect to legal proceedings and contingencies required by this Item is incorporated herein by reference to
Notes to Condensed Consolidated Financial Statements––Note 12A. Commitments and Contingencies: Legal Proceedings in
Part I, Item 1, of this Quarterly Report on Form 10-Q.
Item 3. Quantitative and Qualitative Disclosures About Market Risk
Information required by this item is incorporated by reference from the discussion under the heading Financial Risk Management in our 20152016 Financial Report.
Item 4. Controls and Procedures
As of the end of the period covered by this report, we carried out an evaluation, under the supervision and with the participation of our principal executive officer and principal financial officer, of the effectiveness of the design and operation of our disclosure controls and procedures (as such term is defined in Rules 13a-15(e) and 15d-15(e) under the Exchange Act). Based on this evaluation, our principal executive officer and principal financial officer concluded that our disclosure controls and procedures are effective in alerting them in a timely manner to material information required to be disclosed in our periodic reports filed with the SEC.
During our most recent fiscal quarter, there has not been any change in our internal control over financial reporting (as such term is defined in Rules 13a-15(f) and 15d-15(f) under the Exchange Act) that has materially affected, or is reasonably likely to materially affect, our internal control over financial reporting.
PART II - OTHER INFORMATION
Item 1. Legal Proceedings
The information required by this Item is incorporated herein by reference to Notes to Condensed Consolidated Financial Statements––Note 12A. Commitments and Contingencies: Legal Proceedings in Part I, Item 1, of this Quarterly Report on Form 10-Q.
Tax Matters
Additional information with respect to tax matters required by this Item is incorporated herein by reference to Notes to Condensed Consolidated Financial Statements––Note 5B. Tax Matters: Tax Contingencies in Part I, Item 1, of this Quarterly Report on Form 10-Q.
We account for income tax contingencies using a benefit recognition model. If our initial assessment fails to result in the recognition of a tax benefit, we regularly monitor our position and subsequently recognize the tax benefit: (i) if there are changes in tax law, analogous case law or there is new information that sufficiently raise the likelihood of prevailing on the technical merits of the position to “more likely than not”; (ii) if the statute of limitations expires; or (iii) if there is a completion of an audit resulting in a favorable settlement of that tax year with the appropriate agency. We regularly re-evaluate our tax positions based on the results of audits of federal, state and foreign income tax filings, statute of limitations expirations, changes in tax law or receipt of new information that would either increase or decrease the technical merits of a position relative to the “more-likely-than-not” standard.
Our assessments are based on estimates and assumptions that have been deemed reasonable by management, but our estimates of unrecognized tax benefits and potential tax benefits may not be representative of actual outcomes, and variation from such estimates could materially affect our financial statements in the period of settlement or when the statutes of limitations expire, as we treat these events as discrete items in the period of resolution. Finalizing audits with the relevant taxing authorities can include formal administrative and legal proceedings, and, as a result, it is difficult to estimate the timing and range of possible changes related to our uncertain tax positions, and such changes could be significant.
Item 1A. Risk Factors
The “Our Operating Environment” and “Forward-Looking Information and Factors That May Affect Future Results” sections of the MD&A of this Quarterly Report on Form 10-Q and Part I, Item 1A, “Risk Factors” of our 20152016 Form 10-K are incorporated by reference herein. There have been no material changes from the risk factors discussed in Part I, Item 1A, “Risk Factors” of our 20152016 Form 10-K.
Item 2. Unregistered Sales of Equity Securities and Use of Proceeds
The following table provides certain information with respect to our purchases of shares of the Company’s common stock during the second fiscal quarter of 2016:2017:
Issuer Purchases of Equity Securities(a)
|
| | | | | | | | | | |
| Period | Total Number of Shares Purchased(a), (b) |
| Average Price Paid per Share(a), (b) |
| Total Number of Shares Purchased as Part of Publicly Announced Plan(a) |
| Approximate Dollar Value of Shares That May Yet Be Purchased Under the Plan(a) |
|
| April 4, 2016 through May 1, 2016 | 7,854 |
| $ | 31.19 |
| — |
| $ | 11,355,862,076 |
|
| May 2, 2016 through May 29 2016 | 6,352 |
| $ | 36.53 |
| — |
| $ | 11,355,862,076 |
|
| May 30, 2016 through July 3, 2016 | 18,182,673 |
| $ | 32.39 |
| 18,157,790 |
| $ | 11,355,862,076 |
|
| Total | 18,196,879 |
| $ | 32.39 |
| 18,157,790 |
| |
|
| | | | | | | | | | | | | | |
| Period | | Total Number of Shares Purchased(a), (b) |
| | Average Price Paid per Share(a), (b) |
| | Total Number of Shares Purchased as Part of Publicly Announced Plan(a) |
| | Approximate Dollar Value of Shares That May Yet Be Purchased Under the Plan(a) |
|
| April 3, 2017 through April 30, 2017 | | 19,093 |
| | $ | 34.08 |
| | — |
| | $ | 6,355,862,076 |
|
| May 1, 2017 through May 28 2017 | | 24,055,296 |
| | $ | 33.31 |
| | 24,047,727 |
| | $ | 6,355,862,076 |
|
| May 29, 2017 through July 2, 2017 | | 46,290 |
| | $ | 32.23 |
| | — |
| | $ | 6,355,862,076 |
|
| Total | | 24,120,679 |
| | $ | 33.31 |
| | 24,047,727 |
| | |
| |
(a) | OnOur October 23, 2014 we announced that the Board of Directors had authorized an $11 billion share-purchase plan and share purchases commenced thereunderwas exhausted in January 2015 (the October 2014 Stock Purchase Plan)the first quarter of 2017. In December 2015, the Board of Directors authorized a newan $11 billion share repurchase program, to be utilized over time.and share repurchases commenced thereunder in the first quarter of 2017. On March 8, 2016,February 2, 2017, we entered into an accelerated share repurchase agreement with GS&Co.Citibank to repurchase $5 billion of our common stock. Pursuant to the terms of the agreement, on March 10, 2016,February 6, 2017, we paid $5 billion to GS&Co.Citibank and received an initial delivery of approximately 136126 million shares of our common stock from GS&Co. based onCitibank at a price of $29.36$31.73 per share, which represented, based on the closing share price of our common stock on the NYSE on March 8, 2016,February 2, 2017, approximately 80% of the notional amount of the accelerated share repurchase agreement. On June 20, 2016,May 16, 2017, the accelerated share repurchase agreement with GS&Co.Citibank was completed, which, per the terms of the agreement, resulted in GS&Co.Citibank owing us a certain number of shares of Pfizer common stock. Pursuant to the agreement’s settlement terms, we received an additional 1824 million shares of our common stock from GS&Co.Citibank on June 20, 2016.May 19, 2017. The average price paid for all of the shares delivered under the accelerated share repurchase agreement was $32.38$33.31 per share. The common stock received is included in Treasury stockStock. This agreement was entered into pursuant to our previously announced share repurchase authorization. After giving effect to the accelerated share repurchase agreement,At July 2, 2017, our remaining share-purchase authorization iswas approximately $11.4 billion at July 3, 2016.$6.4 billion.
|
| |
(b) | In addition to the amounts purchased under the accelerated share repurchase agreement, these columns reflect the following transactions during the second fiscal quarter of 2016:2017: (i) the surrender to Pfizer of 40,08866,444 shares of common stock to satisfy tax withholding obligations in connection with the vesting of restricted stock units issued to employees; (ii) the surrender to Pfizer of 944366 shares of common stock to satisfy tax withholding obligations in connection with the vesting of performance share awards issued to employees; (iii) the surrender to Pfizer of 76725 shares of common stock to paysatisfy withholding obligations in connection with the exercise pricesettlement of total shareholder return units; (iv) the open market purchase by the trustee of 5,805 shares of common stock in connection with the reinvestment of dividends paid on common stock held in trust for employees who were granted performance share awards and who deferred receipt of such awards; and (v) the surrender to Pfizer of 312 shares of common stock to satisfy tax withholding obligations in connection with the exercisevesting of employee stock options; and (iv) the clawback of a first quarter payment of total shareholder return units in accordance with the terms of the grant resulting in the reversal of the surrender of 2,710 shares of common stockoptions issued to satisfy withholding obligations.employees. |
Item 3. Defaults Upon Senior Securities
None.
Item 4. Mine Safety Disclosures
Not applicable.
Item 5. Other Information
None.
|
| | | |
| | Exhibit 10.1 | - | Amendment No. 2 to Amended and Restated Deferred Compensation Plan, dated April 27, 2016. |
| | - | Computation of Ratio of Earnings to Fixed Charges. |
| | | - | Accountants’ Acknowledgment. |
| | | - | Certification by the Chief Executive Officer Pursuant to Section 302 of the Sarbanes-Oxley Act of 2002. |
| | | - | Certification by the Chief Financial Officer Pursuant to Section 302 of the Sarbanes-Oxley Act of 2002. |
| | | - | Certification by the Chief Executive Officer Pursuant to 18 U.S.C. Section 1350, as Adopted Pursuant to Section 906 of the Sarbanes-Oxley Act of 2002. |
| | | - | Certification by the Chief Financial Officer Pursuant to 18 U.S.C. Section 1350, as Adopted Pursuant to Section 906 of the Sarbanes-Oxley Act of 2002. |
| | Exhibit 101: | | |
| | EX-101.INS | | XBRL Instance Document - the instance document does not appear in the Interactive Data File because its XBRL tags are embedded within the Inline XBRL document. |
| EX-101.SCH EX-101.CAL EX-101.LAB EX-101.PRE EX-101.DEF | | XBRL Instance Document
XBRL Taxonomy Extension Schema XBRL Taxonomy Extension Calculation Linkbase XBRL Taxonomy Extension Label Linkbase XBRL Taxonomy Extension Presentation Linkbase XBRL Taxonomy Extension Definition Document |
SIGNATURE
Pursuant to the requirements of the Securities Exchange Act of 1934, the registrant has duly caused this report to be signed on its behalf by the undersigned thereunto duly authorized.
|
| | |
| | | Pfizer Inc. |
| | | (Registrant) |
| | | |
| | | |
| Dated: | August 11, 201610, 2017 | /s/ Loretta V. Cangialosi |
| | | Loretta V. Cangialosi, Senior Vice President and Controller (Principal Accounting Officer and Duly Authorized Officer) |