UNITED STATES
SECURITIES AND EXCHANGE COMMISSION
Washington, D.C.
FORM 10-Q
QUARTERLY REPORT PURSUANT TO SECTION 13 OR 15(d) OF
THE SECURITIES EXCHANGE ACT OF 1934
|
| | |
| For the quarterly period ended | April 2, 20161, 2017 | Commission file number 1–6770 |
MUELLER INDUSTRIES, INC.
(Exact name of registrant as specified in its charter)
Delaware
|
|
|
| Delaware | 25-0790410 |
| (State or other jurisdiction | (I.R.S. Employer |
| of incorporation or organization) | Identification No.) |
|
| |
| 8285 Tournament Drive, Suite 150 | |
Memphis, Tennessee | 38125 |
| (Address of principal executive offices) | (Zip Code) |
(901) 753-3200
(Registrant'sRegistrant’s telephone number, including area code)
Indicate by check mark whether the Registrant (1) has filed all reports required to be filed by Section 13 or 15(d) of the Securities Exchange Act of 1934 during the preceding 12 months (or for such shorter period that the Registrant was required to file such reports), and (2) has been subject to such filing requirements for the past 90 days.
Yesx ☒ No☐
Indicate by check mark whether the registrant has submitted electronically and posted on its corporate Web site, if any, every Interactive Data File required to be submitted and posted pursuant to Rule 405 of Regulation S-T (§232.405 of this chapter) during the preceding 12 months (or for such shorter period that the registrant was required to submit and post such files). Yesx No☐
Yes ☒ No ☐
Indicate by check mark whether the registrant is a large accelerated filer, an accelerated filer, a non-accelerated filer, or a smaller reporting company, or an emerging growth company. See the definitions of "large“large accelerated filer"filer”, "accelerated filer"“accelerated filer”, and "smaller“smaller reporting company"company” and “emerging growth company” in Rule 12b-2 of the Exchange Act.
|
| |
| Large accelerated filer ☒ | Accelerated filer ☐ |
Non-accelerated filer ☐ | Smaller reporting company ☐ |
| Emerging growth company ☐ |
If an emerging growth company, indicate by check mark if the registrant has elected not to use the extended transition period for complying with any new or revised financial accounting standards provided pursuant to Section 13(a) of the Exchange Act. ☐
Indicate by check mark whether the Registrant is a shell company (as defined in Rule 12b-2 of the Exchange Act).
Yeso ☐ No☒
The number of shares of the Registrant'sRegistrant’s common stock outstanding as of April 25, 2016,21, 2017 was 57,126,707.57,602,082.
MUELLER INDUSTRIES, INC.
FORM 10-Q
For the Quarterly Period Ended April 2, 20161, 2017
__________________________As used in this report, the terms "Company," "Mueller,"“Company,” “Mueller,” and "Registrant"“Registrant” mean Mueller Industries, Inc. and its consolidated subsidiaries taken as a whole, unless the context indicates otherwise.
__________________________
INDEX
| FINANCIAL INFORMATION |
Item 1. | Financial Statements |
PART I. FINANCIAL INFORMATION
Item 1. Financial Statements
MUELLER INDUSTRIES, INC.INC.
CONDENSED CONSOLIDATED STATEMENTS OF INCOME
(Unaudited)
| | | For the Quarter Ended | |
| (In thousands, except per share data) | | April 2, 2016 | | | March 28, 2015 | |
| | | | | | | |
| Net sales | | $ | 532,809 | | | $ | 537,242 | |
| | | | | | | | | |
| Cost of goods sold | | | 446,642 | | | | 460,834 | |
| Depreciation and amortization | | | 8,920 | | | | 7,853 | |
| Selling, general, and administrative expense | | | 35,780 | | | | 32,831 | |
| | | | | | | | | |
| Operating income | | | 41,467 | | | | 35,724 | |
| | | | | | | | | |
| Interest expense | | | (1,848 | ) | | | (2,076 | ) |
| Other income, net | | | 245 | | | | 105 | |
| | | | | | | | | |
| Income before income taxes | | | 39,864 | | | | 33,753 | |
| | | | | | | | | |
| Income tax expense | | | (14,121 | ) | | | (11,413 | ) |
| Income from unconsolidated affiliates | | | 2,922 | | | | — | |
| | | | | | | | | |
| Consolidated net income | | | 28,665 | | | | 22,340 | |
| | | | | | | | | |
| Net income attributable to noncontrolling interest | | | (35 | ) | | | (362 | ) |
| | | | | | | | | |
| Net income attributable to Mueller Industries, Inc. | | $ | 28,630 | | | $ | 21,978 | |
| | | | | | | | | |
| Weighted average shares for basic earnings per share | | | 56,467 | | | | 56,193 | |
| Effect of dilutive stock-based awards | | | 495 | | | | 731 | |
| | | | | | | | | |
| Adjusted weighted average shares for diluted earnings per share | | | 56,962 | | | | 56,924 | |
| | | | | | | | | |
| Basic earnings per share | | $ | 0.51 | | | $ | 0.39 | |
| | | | | | | | | |
| Diluted earnings per share | | $ | 0.50 | | | $ | 0.39 | |
| | | | | | | | | |
| Dividends per share | | $ | 0.075 | | | $ | 0.075 | |
| | | | | | | | | |
| See accompanying notes to condensed consolidated financial statements. | |
|
| | | | | | | | |
| | | For the Quarter Ended |
| (In thousands, except per share data) | | April 1, 2017 | | April 2, 2016 |
| | | | | |
| Net sales | | $ | 577,920 |
| | $ | 532,809 |
|
| | | | | |
| Cost of goods sold | | 488,427 |
| | 446,642 |
|
| Depreciation and amortization | | 8,355 |
| | 8,920 |
|
| Selling, general, and administrative expense | | 35,531 |
| | 35,780 |
|
| | | | | |
| Operating income | | 45,607 |
| | 41,467 |
|
| | | | | |
| Interest expense | | (2,531 | ) | | (1,848 | ) |
| Other income, net | | 551 |
| | 245 |
|
| | | | | |
| Income before income taxes | | 43,627 |
| | 39,864 |
|
| | | | | |
| Income tax expense | | (11,929 | ) | | (14,121 | ) |
| (Loss) income from unconsolidated affiliates, net of tax | | (1,243 | ) | | 2,922 |
|
| | | | | |
| Consolidated net income | | 30,455 |
| | 28,665 |
|
| | | | | |
| Net income attributable to noncontrolling interests | | (468 | ) | | (35 | ) |
| | | | | |
| Net income attributable to Mueller Industries, Inc. | | $ | 29,987 |
| | $ | 28,630 |
|
| | | | | |
| Weighted average shares for basic earnings per share | | 56,780 |
| | 56,467 |
|
| Effect of dilutive stock-based awards | | 658 |
| | 495 |
|
| | | | | |
| Adjusted weighted average shares for diluted earnings per share | | 57,438 |
| | 56,962 |
|
| | | | | |
| Basic earnings per share | | $ | 0.53 |
| | $ | 0.51 |
|
| | | | | |
| Diluted earnings per share | | $ | 0.52 |
| | $ | 0.50 |
|
| | | | | |
| Dividends per share | | $ | 8.100 |
| | $ | 0.075 |
|
3
See accompanying notes to condensed consolidated financial statements.
MUELLER INDUSTRIES, INC.
CONDENSED CONSOLIDATED STATEMENTS OF COMPREHENSIVE INCOME
(Unaudited)
| | | For the Quarter Ended | |
| (In thousands) | | April 2, 2016 | | | March 28, 2015 | |
| | | | | | | |
| Consolidated net income | | $ | 28,665 | | | $ | 22,340 | |
| | | | | | | | | |
| Other comprehensive income (loss), net of tax: | | | | | | | | |
| Foreign currency translation | | | (1,111 | ) | | | (8,404 | ) |
| Net change with respect to derivative instruments and hedging activities, net of tax of $(221) in 2016 and $274 in 2015 | | | 594 | | | | (198 | ) |
| Net actuarial loss on pension and postretirement obligations, net of tax of $(398) in 2016 and $(501) in 2015 | | | 1,172 | | | | 1,416 | |
| Other, net | | | 14 | | | | (27 | ) |
| | | | | | | | | |
| Total other comprehensive income (loss) | | | 669 | | | | (7,213 | ) |
| | | | | | | | | |
| Comprehensive income | | | 29,334 | | | | 15,127 | |
| Comprehensive loss attributable to noncontrolling interest | | | 739 | | | | 345 | |
| | | | | | | | | |
| Comprehensive income attributable to Mueller Industries, Inc. | | $ | 30,073 | | | $ | 15,472 | |
| | | | | | | | | |
| See accompanying notes to condensed consolidated financial statements. | |
|
| | | | | | | | |
| | | For the Quarter Ended |
(In thousands) | | April 1, 2017 | | April 2, 2016 |
| | | | | |
| Consolidated net income | | $ | 30,455 |
| | $ | 28,665 |
|
| | | | | |
| Other comprehensive income (loss), net of tax: | | |
| | |
|
| Foreign currency translation | | 7,210 |
| | (1,111 | ) |
| Net change with respect to derivative instruments and hedging activities, net of tax of $(96) in 2017 and $(221) in 2016 | | 56 |
| | 594 |
|
| Net change in pension and postretirement obligation adjustments, net of tax of $11 in 2017 and $(398) in 2016 | | 40 |
| | 1,172 |
|
| Attributable to unconsolidated affiliates, net of tax of $903 in 2017 | | (1,598 | ) | | — |
|
| Other, net | | (144 | ) | | 14 |
|
| | | | | |
| Total other comprehensive income, net | | 5,564 |
| | 669 |
|
| | | | | |
| Consolidated comprehensive income | | 36,019 |
| | 29,334 |
|
| Comprehensive (income) loss attributable to noncontrolling interests | | (1,117 | ) | | 739 |
|
| | | | | |
| Comprehensive income attributable to Mueller Industries, Inc. | | $ | 34,902 |
| | $ | 30,073 |
|
4
See accompanying notes to condensed consolidated financial statements.
MUELLER INDUSTRIES, INC.
CONDENSED CONSOLIDATED BALANCE SHEETS
|
| | | | | | | | |
| (In thousands, except share data) | | April 1,
2017 | | December 31, 2016 |
| Assets | | | | |
| Current assets: | | | | |
| Cash and cash equivalents | | $ | 146,891 |
| | $ | 351,317 |
|
| Accounts receivable, less allowance for doubtful accounts of $962 in 2017 and $637 in 2016 | | 312,095 |
| | 256,291 |
|
| Inventories | | 251,958 |
| | 242,013 |
|
| Other current assets | | 45,141 |
| | 44,702 |
|
| | | | | |
| Total current assets | | 756,085 |
| | 894,323 |
|
| | | | | |
| Property, plant, and equipment, net | | 296,360 |
| | 295,231 |
|
| Goodwill, net | | 124,272 |
| | 123,993 |
|
| Intangible assets, net | | 35,573 |
| | 36,168 |
|
| Investment in unconsolidated affiliates | | 73,367 |
| | 77,110 |
|
| Other assets | | 19,264 |
| | 20,651 |
|
| | | | | |
| Total assets | | $ | 1,304,921 |
| | $ | 1,447,476 |
|
| | | | | |
| Liabilities | | |
| | |
|
| Current liabilities: | | |
| | |
|
| Current portion of debt | | $ | 14,939 |
| | $ | 13,655 |
|
| Accounts payable | | 117,251 |
| | 103,175 |
|
| Accrued wages and other employee costs | | 28,348 |
| | 35,121 |
|
| Other current liabilities | | 71,150 |
| | 67,041 |
|
| | | | | |
| Total current liabilities | | 231,688 |
| | 218,992 |
|
| | | | | |
| Long-term debt, less current portion | | 489,787 |
| | 213,709 |
|
| Pension liabilities | | 14,429 |
| | 14,890 |
|
| Postretirement benefits other than pensions | | 16,583 |
| | 16,383 |
|
| Environmental reserves | | 20,993 |
| | 21,208 |
|
| Deferred income taxes | | 18,249 |
| | 19,573 |
|
| Other noncurrent liabilities | | 6,447 |
| | 6,284 |
|
| | | | | |
| Total liabilities | | 798,176 |
| | 511,039 |
|
| | | | | |
| Equity | | |
| | |
|
| Mueller Industries, Inc. stockholders' equity: | | |
| | |
|
| Preferred stock - $1.00 par value; shares authorized 5,000,000; none outstanding | | — |
| | — |
|
| Common stock - $.01 par value; shares authorized 100,000,000; issued 80,183,004; outstanding 57,602,082 in 2017 and 57,395,209 in 2016 | | 802 |
| | 802 |
|
| Additional paid-in capital | | 273,129 |
| | 273,345 |
|
| Retained earnings | | 705,240 |
| | 1,141,831 |
|
| Accumulated other comprehensive loss | | (62,041 | ) | | (66,956 | ) |
| Treasury common stock, at cost | | (449,255 | ) | | (450,338 | ) |
| | | | | |
| Total Mueller Industries, Inc. stockholders' equity | | 467,875 |
| | 898,684 |
|
| Noncontrolling interests | | 38,870 |
| | 37,753 |
|
| | | | | |
| Total equity | | 506,745 |
| | 936,437 |
|
| | | | | |
| Commitments and contingencies | | — |
| | — |
|
| Total liabilities and equity | | $ | 1,304,921 |
| | $ | 1,447,476 |
|
| (In thousands, except share data) | | April 2, 2016 | | | December 26, 2015 | |
| Assets | | | | | | |
| Current assets: | | | | | | |
| Cash and cash equivalents | | $ | 270,149 | | | $ | 274,844 | |
| Accounts receivable, less allowance for doubtful accounts of $496 in 2016 and $623 in 2015 | | | 275,881 | | | | 251,571 | |
| Inventories | | | 240,608 | | | | 239,378 | |
| Other current assets | | | 34,123 | | | | 34,608 | |
| | | | | | | | | |
| Total current assets | | | 820,761 | | | | 800,401 | |
| | | | | | | | | |
| Property, plant, and equipment, net | | | 278,481 | | | | 280,224 | |
| Goodwill, net | | | 121,112 | | | | 120,252 | |
| Intangible assets, net | | | 40,617 | | | | 40,636 | |
| Investment in unconsolidated affiliates | | | 68,822 | | | | 65,900 | |
| Other assets | | | 31,227 | | | | 31,388 | |
| | | | | | | | | |
| Total assets | | $ | 1,361,020 | | | $ | 1,338,801 | |
| | | | | | | | | |
| Liabilities | | | | | | | | |
| Current liabilities: | | | | | | | | |
| Current portion of debt | | $ | 4,583 | | | $ | 11,760 | |
| Accounts payable | | | 98,324 | | | | 88,051 | |
| Accrued wages and other employee costs | | | 27,974 | | | | 35,636 | |
| Other current liabilities | | | 71,727 | | | | 73,982 | |
| | | | | | | | | |
| Total current liabilities | | | 202,608 | | | | 209,429 | |
| | | | | | | | | |
| Long-term debt, less current portion | | | 206,000 | | | | 204,250 | |
| Pension liabilities | | | 16,319 | | | | 17,449 | |
| Postretirement benefits other than pensions | | | 17,396 | | | | 17,427 | |
| Environmental reserves | | | 20,932 | | | | 20,943 | |
| Deferred income taxes | | | 8,310 | | | | 7,161 | |
| Other noncurrent liabilities | | | 2,973 | | | | 2,440 | |
| | | | | | | | | |
| Total liabilities | | | 474,538 | | | | 479,099 | |
| | | | | | | | | |
| Equity | | | | | | | | |
| Mueller Industries, Inc. stockholders' equity: | | | | | | | | |
| Preferred stock - $1.00 par value; shares authorized 5,000,000; none outstanding | | | — | | | | — | |
| Common stock - $.01 par value; shares authorized 100,000,000; issued 80,183,004; outstanding 57,126,707 in 2016 and 57,158,608 in 2015 | | | 802 | | | | 802 | |
| Additional paid-in capital | | | 273,576 | | | | 271,158 | |
| Retained earnings | | | 1,087,927 | | | | 1,063,543 | |
| Accumulated other comprehensive loss | | | (53,547 | ) | | | (54,990 | ) |
| Treasury common stock, at cost | | | (453,954 | ) | | | (453,228 | ) |
| | | | | | | | | |
| Total Mueller Industries, Inc. stockholders' equity | | | 854,804 | | | | 827,285 | |
| Noncontrolling interest | | | 31,678 | | | | 32,417 | |
| | | | | | | | | |
| Total equity | | | 886,482 | | | | 859,702 | |
| | | | | | | | | |
| Commitments and contingencies | | | — | | | | — | |
| | | | | | | | | |
| Total liabilities and equity | | $ | 1,361,020 | | | $ | 1,338,801 | |
| | | | | | | | | |
| See accompanying notes to condensed consolidated financial statements. | |
MUELLER INDUSTRIES, INC.
CONDENSED CONSOLIDATED STATEMENTS OF CASH FLOWS
|
| | | | | | | | |
| | | For the Quarter Ended |
| (In thousands) | | April 1, 2017 | | April 2, 2016 |
| | | | | |
| Cash flows from operating activities | | | | |
| Consolidated net income | | $ | 30,455 |
| | $ | 28,665 |
|
| Reconciliation of consolidated net income to net cash provided by operating activities: | | |
| | |
|
| Depreciation and amortization | | 8,419 |
| | 9,011 |
|
| Stock-based compensation expense | | 1,736 |
| | 1,236 |
|
| Loss (income) from unconsolidated affiliates | | 1,243 |
| | (2,922 | ) |
| Gain on disposals of assets | | (16 | ) | | (23 | ) |
| Gain on sales of securities | | (254 | ) | | — |
|
| Deferred income taxes | | (80 | ) | | 1,895 |
|
| Income tax benefit from exercise of stock options | | — |
| | (96 | ) |
| Changes in assets and liabilities, net of businesses acquired: | | |
| | |
|
| Receivables | | (53,756 | ) | | (25,089 | ) |
| Inventories | | (6,991 | ) | | (1,631 | ) |
| Other assets | | 1,205 |
| | (370 | ) |
| Current liabilities | | 8,215 |
| | 655 |
|
| Other liabilities | | (668 | ) | | (704 | ) |
| Other, net | | (930 | ) | | (291 | ) |
| | | | | |
| Net cash (used in) provided by operating activities | | (11,422 | ) | | 10,336 |
|
| | | | | |
| Cash flows from investing activities | | |
| | |
|
| Capital expenditures | | (7,345 | ) | | (5,892 | ) |
| Net (deposits in) withdrawals from restricted cash balances | | (1,403 | ) | | 84 |
|
| Proceeds from sales of assets | | 192 |
| | 1 |
|
| Proceeds from sales of securities | | 1,444 |
| | — |
|
| | | | | |
| Net cash used in investing activities | | (7,112 | ) | | (5,807 | ) |
| | | | | |
| Cash flows from financing activities | | |
| | |
|
| Dividends paid to stockholders of Mueller Industries, Inc. | | (179,848 | ) | | (4,236 | ) |
| Issuance of long-term debt | | — |
| | 2,000 |
|
| Repayment of debt by consolidated joint ventures, net | | (7,367 | ) | | (7,024 | ) |
| Net cash (used) received to settle stock-based awards | | (870 | ) | | 361 |
|
| Repayments of long-term debt | | (306 | ) | | (250 | ) |
| Income tax benefit from exercise of stock options | | — |
| | 96 |
|
| | | | | |
| Net cash used in financing activities | | (188,391 | ) | | (9,053 | ) |
| | | | | |
| Effect of exchange rate changes on cash | | 2,499 |
| | (171 | ) |
| | | | | |
| Decrease in cash and cash equivalents | | (204,426 | ) | | (4,695 | ) |
| Cash and cash equivalents at the beginning of the period | | 351,317 |
| | 274,844 |
|
| | | | | |
| Cash and cash equivalents at the end of the period | | $ | 146,891 |
| | $ | 270,149 |
|
| | | For the Quarter Ended | |
| (In thousands) | | April 2, 2016 | | | March 28, 2015 | |
| | | | |
| Cash flows from operating activities | | | | | | |
| Consolidated net income | | $ | 28,665 | | | $ | 22,340 | |
| Reconciliation of consolidated net income to net cash provided by operating activities: | | | | | | | | |
| Depreciation and amortization | | | 9,011 | | | | 8,015 | |
| Stock-based compensation expense | | | 1,236 | | | | 1,349 | |
| Equity in earnings of unconsolidated affiliates | | | (2,922 | ) | | | — | |
| (Gain) loss on disposal of properties | | | (23 | ) | | | 1 | |
| Deferred income taxes | | | 1,895 | | | | (570 | ) |
| Income tax benefit from exercise of stock options | | | (96 | ) | | | (69 | ) |
| Changes in assets and liabilities: | | | | | | | | |
| Receivables | | | (25,089 | ) | | | (36,692 | ) |
| Inventories | | | (1,631 | ) | | | 7,534 | |
| Other assets | | | (370 | ) | | | 9,257 | |
| Current liabilities | | | 655 | | | | (7,389 | ) |
| Other liabilities | | | (704 | ) | | | (131 | ) |
| Other, net | | | (291 | ) | | | 245 | |
| | | | | | | | | |
| Net cash provided by operating activities | | | 10,336 | | | | 3,890 | |
| | | | | | | | | |
| Cash flows from investing activities | | | | | | | | |
| Capital expenditures | | | (5,892 | ) | | | (7,392 | ) |
| Net withdrawals from (deposits into) restricted cash | | | 84 | | | | (12,593 | ) |
| Proceeds from the sale of assets | | | 1 | | | | 492 | |
| | | | | | | | | |
| Net cash used in investing activities | | | (5,807 | ) | | | (19,493 | ) |
| | | | | | | | | |
| Cash flows from financing activities | | | | | | | | |
| Repayments of long-term debt | | | (250 | ) | | | (250 | ) |
| Dividends paid to stockholders of Mueller Industries, Inc. | | | (4,236 | ) | | | (4,216 | ) |
| Repayment of debt by joint venture, net | | | (7,024 | ) | | | (3,817 | ) |
| Issuance of debt | | | 2,000 | | | | — | |
| Net cash received to settle stock-based awards | | | 361 | | | | 93 | |
| Income tax benefit from exercise of stock options | | | 96 | | | | 69 | |
| | | | | | | | | |
| Net cash used in financing activities | | | (9,053 | ) | | | (8,121 | ) |
| | | | | | | | | |
| Effect of exchange rate changes on cash | | | (171 | ) | | | (1,516 | ) |
| | | | | | | | | |
| Decrease in cash and cash equivalents | | | (4,695 | ) | | | (25,240 | ) |
| Cash and cash equivalents at the beginning of the period | | �� | 274,844 | | | | 352,134 | |
| | | | | | | | | |
| Cash and cash equivalents at the end of the period | | $ | 270,149 | | | $ | 326,894 | |
| | | | | | | | | |
| See accompanying notes to condensed consolidated financial statements. | |
MUELLER INDUSTRIES, INC.
NOTES TO CONDENSED CONSOLIDATED FINANCIAL STATEMENTS
(Unaudited)
General
Certain information and footnote disclosures normally included in annual financial statements prepared in accordance with accounting principles generally accepted in the United States (U.S. GAAP) have been condensed or omitted. Results of operations for the interim periods presented are not necessarily indicative of results which may be expected for any other interim period or for the year as a whole. This Quarterly Report on Form 10-Q should be read in conjunction with the Company'sCompany’s Annual Report on Form 10-K, including the annual financial statements incorporated therein.
The accompanying unaudited interim financial statements include all normal recurring adjustments which are, in the opinion of management, necessary for a fair presentation of the results for the interim periods includedpresented herein. The fiscal quarter ended April 1, 2017 contained 13 weeks, while the fiscal quarter ended April 2, 2016 contained 14 weeks, while the fiscal quarter ended March 28, 2015 contained 13 weeks.
Note 1 – Earnings per Common Share
Basic per share amounts have been computed based on the average number of common shares outstanding. Diluted per share amounts reflect the increase in average common shares outstanding that would result from the assumed exercise of outstanding stock options and vesting of restricted stock awards, computed using the treasury stock method. Approximately 579 thousand and 180 thousand stock-based awards were excluded from the computation of diluted earnings per share for the quartersquarter ended April 2, 2016 and March 28, 2015, respectively, because they were antidilutive.
Note 2 – Special Dividend
On March 9, 2017, the Company distributed a special dividend of $3.00 in cash and $5.00 in principal amount of the Company’s 6% Subordinated Debentures (Debentures) due March 1, 2027 for each share of common stock outstanding. Interest on the Debentures is payable semiannually on September 1 and March 1, commencing September 1, 2017. At issuance, the Debentures were recorded at their estimated fair value. The fair value of the Debentures is estimated based on quoted market prices for the same or similar issues, the current rates offered to the Company for debt of the same remaining maturities, or the use of market standard models. The carrying value of the Debentures approximate fair value at April 1, 2017.
The Debentures are subordinated to all other funded debt of the Company and are callable, in whole or in part, at any time at the option of the Company, subject to declining call premiums during the first five years. The Debentures also grant each holder the right to require the Company to repurchase such holder’s Debentures in the event of a change in control at declining repurchase premiums during the first five years. The Debentures may be redeemed, subject to the conditions set forth above, at the following redemption price (expressed as a percentage of principal amount) plus any accrued but unpaid interest to, but excluding, the redemption date:
If redeemed during the 12-month period beginning March 9,:
|
| | |
| Year | | Redemption Price |
| | | |
| 2017 | | 106% |
| 2018 | | 105 |
| 2019 | | 104 |
| 2020 | | 103 |
| 2021 | | 102 |
| 2022 and thereafter | | 100 |
The effect of the special dividend was a decrease in stockholders’ equity of approximately $458.7 million, an increase in long-term debt of approximately $284.5 million, and a decrease in cash of approximately $174.2 million.
Note 23 –Segment Information
During the first quarter of 2016, the Company made changes to its management reporting structure as a result of a change in the way the Chief Executive Officer, who serves as the Chief Operating Decision Maker, manages and evaluates the business, makes key operating decisions, and allocates resources. Previously, the Company had two reportable segments: Plumbing & Refrigeration and OEM. During the quarter, the Company realigned its operating segments into three reportable segments: Piping Systems, Industrial Metals, and Climate. Management has recast certain prior period amounts to conform the current period presentation. Each of the Company’s reportable segments is composed of certain operating segments that are aggregated primarily by the nature of products offered as follows:
Piping Systems
Piping Systems is composed of the following operating segments: Domestic Piping Systems Group, Canadian Operations, European Operations, Trading Group, and Mueller-Xingrong the Company's(the Company’s Chinese joint venture.venture), and Jungwoo-Mueller (the Company’s South Korean joint venture). The Domestic Piping Systems Group manufactures copper tube and fittings, plastic fittings, and line sets. These products are manufactured in the U.S., sold in the U.S, and exported to markets worldwide. Outside the U.S., the Canadian Operations manufacture copper tube and line sets in Canada and sell the products primarily in the U.S. and Canada, and the European Operations manufacture copper tube in the U.K. which is sold primarily in Europe. The Trading Group manufactures pipe nipples and imports and resells brass and plastic plumbing valves, malleable iron fittings, faucets, and plumbing specialty products in the U.S. and Mexico. Mueller-Xingrong manufactures engineered copper tube primarily for air-conditioning applications in China. Jungwoo-Mueller manufactures copper-based joining products that are sold worldwide. The Piping System segment'sSystems segment’s products are sold primarily to plumbing, refrigeration, and air-conditioning wholesalers, hardware wholesalers and co-ops, building product retailers, and air-conditioning OEMs.original equipment manufacturers (OEMs).
Industrial Metals
Industrial Metals is composed of the following operating segments: Brass Rod & Copper Bar Products, Impacts & Micro Gauge, and Brass Value-Added Products. These businesses manufacture brass rod, impact extrusions, and forgings, as well as a wide variety of end products including plumbing brass, automotive components, valves, fittings, and gas assemblies. These products are manufactured in the U.S. and sold primarily to OEMs in the U.S,U.S., many of which are in the industrial, construction, heating, ventilation, and air-conditioning, plumbing, and refrigeration markets.
Climate
Climate is composed of the following operating segments: Refrigeration Products, Fabricated Tube Products, Westermeyer, and Turbotec. These domestic businesses manufacture and fabricate valves, assemblies, high pressure components, and assembliescoaxial heat exchangers primarily for the heating, ventilation, air-conditioning, and refrigeration markets in the U.S.
Summarized segment information is as follows:
| | | For the Quarter Ended April 2, 2016 | |
| (In thousands) | | Piping Systems | | | Industrial Metals | | | Climate | | | Corporate and Eliminations | | | Total | |
| | | | | | | | | | | | | | | | |
| Net sales | | $ | 368,890 | | | $ | 134,521 | | | $ | 30,706 | | | $ | (1,308 | ) | | $ | 532,809 | |
| | | | | | | | | | | | | | | | | | | | | |
| Cost of goods sold | | | 313,792 | | | | 109,229 | | | | 23,705 | | | | (84 | ) | | | 446,642 | |
| Depreciation and amortization | | | 5,649 | | | | 2,135 | | | | 599 | | | | 537 | | | | 8,920 | |
| Selling, general, and administrative expense | | | 18,290 | | | | 3,245 | | | | 2,523 | | | | 11,722 | | | | 35,780 | |
| | | | | | | | | | | | | | | | | | | | | |
| Operating income | | | 31,159 | | | | 19,912 | | | | 3,879 | | | | (13,483 | ) | | | 41,467 | |
| | | | | | | | | | | | | | | | | | | | | |
| Interest expense | | | | | | | | | | | | | | | | | | | (1,848 | ) |
| Other income, net | | | | | | | | | | | | | | | | | | | 245 | |
| | | | | | | | | | | | | | | | | | | | | |
| Income before taxes | | | | | | | | | | | | | | | | | | $ | 39,864 | |
|
| | | | | | | | | | | | | | | | | | | | |
| | | For the Quarter Ended April 1, 2017 |
| (In thousands) | | Piping Systems | | Industrial Metals | | Climate | | Corporate and Eliminations | | Total |
| | | | | | | | | | | |
| Net sales | | $ | 398,775 |
| | $ | 149,837 |
| | $ | 34,279 |
| | $ | (4,971 | ) | | $ | 577,920 |
|
| | | | | | | | | | | |
| Cost of goods sold | | 344,646 |
| | 124,043 |
| | 25,564 |
| | (5,826 | ) | | 488,427 |
|
| Depreciation and amortization | | 5,342 |
| | 1,898 |
| | 629 |
| | 486 |
| | 8,355 |
|
| Selling, general, and administrative expense | | 18,421 |
| | 3,230 |
| | 2,476 |
| | 11,404 |
| | 35,531 |
|
| | | | | | | | | | | |
| Operating income | | 30,366 |
| | 20,666 |
| | 5,610 |
| | (11,035 | ) | | 45,607 |
|
| | | | | | | | | | | |
| Interest expense | | |
| | |
| | |
| | |
| | (2,531 | ) |
| Other income, net | | |
| | |
| | |
| | |
| | 551 |
|
| | | | | | | | | | | |
| Income before income taxes | | |
| | |
| | |
| | |
| | $ | 43,627 |
|
| | | For the Quarter Ended March 28, 2015 | |
| (In thousands) | | Piping Systems | | | Industrial Metals | | | Climate | | | Corporate and Eliminations | | | Total | |
| | | | | | | | | | | | | | | | |
| Net sales | | $ | 361,482 | | | $ | 151,036 | | | $ | 25,811 | | | $ | (1,087 | ) | | $ | 537,242 | |
| | | | �� | | | | | | | | | | | | | | | | | |
| Cost of goods sold | | | 312,690 | | | | 127,724 | | | | 21,267 | | | | (847 | ) | | | 460,834 | |
| Depreciation and amortization | | | 5,187 | | | | 1,655 | | | | 425 | | | | 586 | | | | 7,853 | |
| Selling, general, and administrative expense | | | 17,346 | | | | 2,698 | | | | 1,854 | | | | 10,933 | | | | 32,831 | |
| | | | | | | | | | | | | | | | | | | | | |
| Operating income | | | 26,259 | | | | 18,959 | | | | 2,265 | | | | (11,759 | ) | | | 35,724 | |
| | | | | | | | | | | | | | | | | | | | | |
| Interest expense | | | | | | | | | | | | | | | | | | | (2,076 | ) |
| Other income, net | | | | | | | | | | | | | | | | | | | 105 | |
| | | | | | | | | | | | | | | | | | | | | |
| Income before taxes | | | | | | | | | | | | | | | | | | $ | 33,753 | |
|
| | | | | | | | | | | | | | | | | | | | |
| | | For the Quarter Ended April 2, 2016 |
| (In thousands) | | Piping Systems | | Industrial Metals | | Climate | | Corporate and Eliminations | | Total |
| | | | | | | | | | | |
| Net sales | | $ | 368,890 |
| | $ | 134,521 |
| | $ | 30,706 |
| | $ | (1,308 | ) | | $ | 532,809 |
|
| | | | | | | | | | | |
| Cost of goods sold | | 313,792 |
| | 109,229 |
| | 23,705 |
| | (84 | ) | | 446,642 |
|
| Depreciation and amortization | | 5,649 |
| | 2,135 |
| | 599 |
| | 537 |
| | 8,920 |
|
| Selling, general, and administrative expense | | 18,290 |
| | 3,245 |
| | 2,523 |
| | 11,722 |
| | 35,780 |
|
| | | | | | | | | | | |
| Operating income | | 31,159 |
| | 19,912 |
| | 3,879 |
| | (13,483 | ) | | 41,467 |
|
| | | | | | | | | | | |
| Interest expense | | |
| | |
| | |
| | |
| | (1,848 | ) |
| Other income, net | | |
| | |
| | |
| | |
| | 245 |
|
| | | | | | | | | | | |
| Income before income taxes | | |
| | |
| | |
| | |
| | $ | 39,864 |
|
| (In thousands) | | April 2, 2016 | | | December 26, 2015 | |
| | | | | | | |
| Segment assets: | | | | | | |
| Piping Systems | | $ | 815,400 | | | $ | 811,343 | |
| Industrial Metals | | | 193,662 | | | | 174,897 | |
| Climate | | | 41,172 | | | | 39,876 | |
| General Corporate | | | 310,786 | | | | 312,685 | |
| | | | | | | | | |
| | | $ | 1,361,020 | | | $ | 1,338,801 | |
Note 34 – Inventories
| (In thousands) | | April 2, 2016 | | | December 26, 2015 | |
| | | | | | | |
| Raw materials and supplies | | $ | 53,983 | | | $ | 58,987 | |
| Work-in-process | | | 37,656 | | | | 25,161 | |
| Finished goods | | | 154,592 | | | | 161,410 | |
| Valuation reserves | | | (5,623 | ) | | | (6,180 | ) |
| | | | | | | | | |
| Inventories | | $ | 240,608 | | | $ | 239,378 | |
| | | | | | | | | |
|
| | | | | | | | |
| (In thousands) | | April 1, 2017 | | December 31, 2016 |
| | | | | |
| Raw materials and supplies | | $ | 66,430 |
| | $ | 57,387 |
|
| Work-in-process | | 28,013 |
| | 42,227 |
|
| Finished goods | | 163,839 |
| | 149,288 |
|
| Valuation reserves | | (6,324 | ) | | (6,889 | ) |
| | | | | |
| Inventories | | $ | 251,958 |
| | $ | 242,013 |
|
Note 45 – Derivative Instruments and Hedging Activities
The Company'sCompany’s earnings and cash flows are subject to fluctuations due to changes in commodity prices, foreign currency exchange rates, and interest rates. The Company uses derivative instruments such as commodity futures contracts, foreign currency forward contracts, and interest rate swaps to manage these exposures.
All derivatives are recognized in the Condensed Consolidated Balance Sheets at their fair value. On the date the derivative contract is entered into, it is either a) designated as (i) a hedge of (i) a forecasted transaction or the variability of cash flow to be paid (cash flow hedge), or (ii) a hedge of the fair value of a recognized asset or liability (fair value hedge), or b) not designated in a hedge accounting relationship, even though the derivative contract was executed to mitigate an economic exposure, as the Company does not enter into derivative contracts for trading purposes (economic hedge). Changes in the fair value of a derivative instrument that is qualified, designated and highly effective as a cash flow hedge are recorded in stockholders’ equity within accumulated other comprehensive income (AOCI), to the extent effective, until they are reclassified to earnings in the same period or periods during which the hedged transaction affects earnings. Changes in the fair value of a derivative instrument that is qualified, designated and highly effective as a fair value hedge, along with the gain or loss on the hedged recognized asset or liability that is attributable to the hedged risk, are recorded in current earnings. Changes in the fair value of undesignated derivative instrumentsderivatives executed as economic hedges and the ineffective portion of designated derivative instrumentsderivatives are reported in current earnings.
The Company documents all relationships between hedgingderivative instruments and hedged items, as well as the risk-management objective and strategy for undertaking various hedge transactions. This process includes linking all derivativesderivative instruments that are designated as fair value hedges to specific assets and liabilities in the Condensed Consolidated Balance Sheets and linking cash flow hedges to specific forecasted transactions or variability of cash flow.
The Company also assesses, both at the hedge'shedge’s inception and on an ongoing basis, whether the designated derivativesderivative instruments that are used in hedging transactions are highly effective in offsetting changes in cash flow or fair values of hedged items. When a derivative instrument is determined not to be highly effective as a hedge or the underlying hedged transaction is no longer probable of occurring, hedge accounting is discontinued prospectively in accordance with the derecognition criteria for hedge accounting.
Commodity Futures Contracts
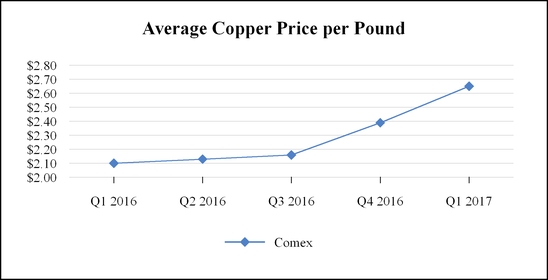
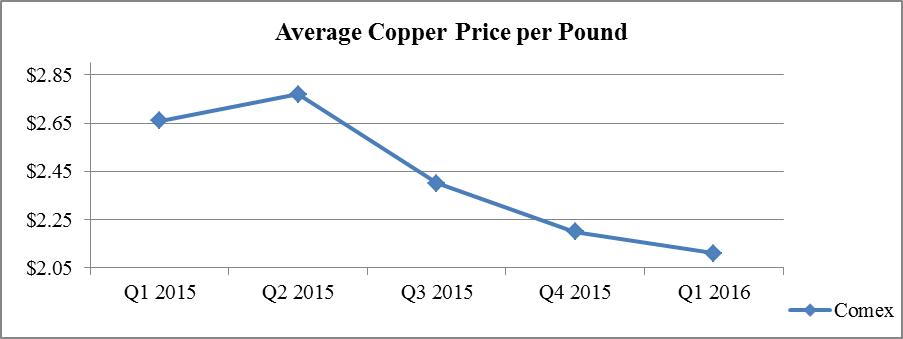
Copper and brass represent the largest component of the Company'sCompany’s variable costs of production. The cost of these materials is subject to global market fluctuations caused by factors beyond the Company'sCompany’s control. The Company occasionally enters into forward fixed-price arrangements with certain customers; the risk of these arrangements is generally managed with commodity futures contracts. These futures contracts have been designated as cash flow hedges.
At April 2, 2016,1, 2017, the Company held open futures contracts to purchase approximately $23.7$20.1 million of copper over the next nine months related to fixed price sales orders. The fair value of those futures contracts was a $21$178 thousand net gain position, which was determined by obtaining quoted market prices (level 1 within the fair value hierarchy). In the next twelve12 months, the Company will reclassify into earnings realized gains or losses relating to cash flow hedges. At April 2, 2016,1, 2017, this amount was approximately $105$92 thousand of deferred net losses,gains, net of tax.
The Company may also enter into futures contracts to protect the value of inventory against market fluctuations. At April 2, 2016,1, 2017, the Company held open futures contracts to sell approximately $21.0$38.6 million of copper over the next foursix months related to copper inventory. The fair value of those futures contracts was a $307$293 thousand lossnet gain position, which was determined by obtaining quoted market prices (level 1 within the fair value hierarchy).
Foreign Currency Forward Contracts
The Company has entered into certain contracts to purchase heavy machinery and equipment denominated in euros.
In anticipation of entering into these contracts, the Company entered into forward contracts to purchase euros to protect itself against adverse foreign exchange rate fluctuations.
At April 2, 2016, the Company held open forward contracts to purchase approximately 2.7 million euros over the next eight months. The fair value of these contracts, which was determined by obtaining quoted market prices (level 1 within the fair value hierarchy), was an $88 thousand gain position. At April 2, 2016, there was $184 thousand of deferred net gains, net of tax, included in AOCI that are expected to be reclassified into depreciation expense over the useful life of the heavy machinery and equipment.
Interest Rate Swap
On February 20, 2013, the Company entered into a two-year forward-starting interest rate swap agreement with an effective date of January 12, 2015, and an underlying notional amount of $200.0 million, pursuant to which the Company receives variable interest payments based on one-month LIBOR and pays fixed interest at a rate of 1.4 percent. Based on the Company'sCompany’s current variable premium pricing on its Term Loan Facility,revolving credit facility, the all-in fixed rate as of the effective date is 2.72.46 percent. The interest rate swap will mature on December 11, 2017, and is structured to offset the interest rate risk associated with the Company'sCompany’s floating-rate, LIBOR-based Term Loan Facility Agreement. The swap was designated and accounted for as a cash flow hedge fromat inception. During the fourth quarter of 2016, the Company discontinued hedge accounting prospectively.
The fair value of the interest rate swap is estimated based on the present value of the difference between expected cash flows calculated at the contracted interest rate and the expected cash flows at the current market interest rate using observable benchmarks for LIBOR forward rates at the end of the period (level 2 within the fair value hierarchy). Interest payable and receivable under the swap agreement is accrued and recorded as an adjustment to interest expense. The fair value of the interest rate swap was a $2.3 million$295 thousand loss position at April 2, 2016,1, 2017, and there was $1.5 million$405 thousand of deferred net losses, net of tax, included in AOCI that are expected to be reclassified into interest expense over the term of the hedged item.interest rate swap.
The Company presents its derivative assets and liabilities in ourthe Condensed Consolidated Balance Sheets on a net basis by counterparty. The following table summarizes the location and fair value of the derivative instruments and disaggregates ourthe net derivative assets and liabilities into gross components on a contract-by-contract basis:
| | Asset Derivatives | | Liability Derivatives | |
| | | | Fair Value | | | | Fair Value | |
| (In thousands) | Balance Sheet Location | | April 2, 2016 | | | December 26, 2015 | | Balance Sheet Location | | April 2, 2016 | | | December 26, 2015 | |
| Hedging instrument: | | | | | | | | | | | | | | |
| Commodity contracts - gains | Other current assets | | $ | 654 | | | $ | 60 | | Other current liabilities | | $ | 122 | | | $ | 238 | |
| Commodity contracts - losses | Other current assets | | | (82 | ) | | | — | | Other current liabilities | | | (979 | ) | | | (1,864 | ) |
| Foreign currency contracts - gains | Other current assets | | | 88 | | | | — | | Other current liabilities | | | — | | | | 34 | |
| Foreign currency contracts - losses | Other current assets | | | — | | | | — | | Other current liabilities | | | — | | | | (75 | ) |
| Interest rate swap | Other assets | | | — | | | | — | | Other liabilities | | | (2,319 | ) | | | (1,692 | ) |
| | | | | | | | | | | | | | | | | | | |
Total derivatives (1) | | | $ | 660 | | | $ | 60 | | | | $ | (3,176 | ) | | $ | (3,359 | ) |
| | | | | | | | | | | | | | | | | | | |
(1) Does not include the impact of cash collateral provided to counterparties. | |
|
| | | | | | | | | | | | | | | | | | | | |
| | | Asset Derivatives | | Liability Derivatives |
| | | | | Fair Value | | | | Fair Value |
| (In thousands) | | Balance Sheet Location | | April 1, 2017 | | December 31, 2016 | | Balance Sheet Location | | April 1, 2017 | | December 31, 2016 |
| Hedging instrument: | | | | | | | | | | | | |
| Commodity contracts - gains | | Other current assets | | $ | 600 |
| | $ | 1,013 |
| | Other current liabilities | | $ | 68 |
| | $ | 564 |
|
| Commodity contracts - losses | | Other current assets | | — |
| | (148 | ) | | Other current liabilities | | (197 | ) | | (920 | ) |
| Interest rate swap | | Other current assets | | — |
| | — |
| | Other current liabilities | | (295 | ) | | (787 | ) |
| | | | | | | | | | | | | |
Total derivatives (1) | | | | $ | 600 |
| | $ | 865 |
| | | | $ | (424 | ) | | $ | (1,143 | ) |
(1)Does not include the impact of cash collateral received from or provided to counterparties.
The following tables summarize the effects of derivative instruments in ouron the Company’s Condensed Consolidated Statements of Income:
| | | | Three Months Ended | |
| (In thousands) | Location | | April 2, 2016 | | March 28, 2015 | |
| Fair value hedges: | | | | | | |
| (Loss) gain on commodity contracts (qualifying) | Cost of goods sold | | $ | (50 | ) | | $ | 213 | |
| Gain (loss) on hedged item - Inventory | Cost of goods sold | | | 62 | | | | (247 | ) |
| | | | | | | | | | |
| Undesignated derivatives: | | | | | | | | | |
| Gain on commodity contracts (nonqualifying) | Cost of goods sold | | $ | 494 | | | $ | 234 | |
|
| | | | | | | | | | |
| | | | | For the Quarter Ended |
| (In thousands) | | Location | | April 1, 2017 | | April 2, 2016 |
| Fair value hedges: | | | | | | |
| Gain (loss) on commodity contracts (qualifying) | | Cost of goods sold | | $ | — |
| | $ | (50 | ) |
| Gain on hedged item - inventory | | Cost of goods sold | | — |
| | 62 |
|
| | | | | | | |
| Undesignated derivatives: | | | | | | |
| (Loss) gain on qualifying contracts (nonqualifying) | | Cost of goods sold | | (1,095 | ) | | 494 |
|
The following tables summarize amounts recognized in and reclassified from AOCI during the period:
| | | Three Months Ended April 2, 2016 | |
| (In thousands) | | Gain (Loss) Recognized in AOCI (Effective Portion), Net of Tax | | Classification Gains (Losses) | | Loss (Gain) Reclassified from AOCI (Effective Portion), Net of Tax | |
| Cash flow hedges: | | | | | | | |
| Commodity contracts | | $ | 873 | | Cost of goods sold | | $ | 68 | |
| Foreign currency contracts | | | 66 | | Depreciation expense | | | — | |
| Interest rate swap | | | (470 | ) | Interest expense | | | 69 | |
| Other | | | (12 | ) | Other | | | — | |
| Total | | $ | 457 | | Total | | $ | 137 | |
|
| | | | | | | | | | |
| | | For the Quarter Ended April 1, 2017 |
| (In thousands) | | (Loss) Gain Recognized in AOCI (Effective Portion), Net of Tax | | Classification Gains (Losses) | | Loss Reclassified from AOCI (Effective Portion), Net of Tax |
| Cash flow hedges: | | | | | | |
| Commodity contracts | | $ | (563 | ) | | Cost of goods sold | | $ | 352 |
|
| Interest rate swap | | — |
| | Interest expense | | 149 |
|
| Other | | 118 |
| | Other | | — |
|
| | | | | | | |
| Total | | $ | (445 | ) | | Total | | $ | 501 |
|
|
| | | | | | | | | | |
| | | For the Quarter Ended April 2, 2016 |
| (In thousands) | | Gain (Loss) Recognized in AOCI (Effective Portion), Net of Tax | | Classification Gains (Losses) | | Loss Reclassified from AOCI (Effective Portion), Net of Tax |
| Cash flow hedges: | | | | | | |
| Commodity contracts | | $ | 873 |
| | Cost of goods sold | | $ | 68 |
|
| Interest rate swap | | (470 | ) | | Interest expense | | 69 |
|
| Other | | 54 |
| | Other | | — |
|
| | | | | | | |
| Total | | $ | 457 |
| | Total | | $ | 137 |
|
| | | Three Months Ended March 28, 2015 | |
| (In thousands) | | Gain (Loss) Recognized in AOCI (Effective Portion), Net of Tax | | Classification Gains (Losses) | | Loss (Gain) Reclassified from AOCI (Effective Portion), Net of Tax | |
| Cash flow hedges: | | | | | | | |
| Commodity contracts | | $ | 274 | | Cost of goods sold | | $ | 571 | |
| Foreign currency contracts | | | (55 | ) | Depreciation expense | | | — | |
| Interest rate swap | | | (1,032 | ) | Interest expense | | | 68 | |
| Other | | | (24 | ) | Other | | | — | |
| Total | | $ | (837 | ) | Total | | $ | 639 | |
The Company enters into futures and forward contracts that closely match the terms of the underlying transactions. As a result, the ineffective portion of the open hedge contracts through April 2, 20161, 2017 was not material to the Condensed Consolidated Statements of Income.
The Company primarily enters into International Swaps and Derivatives Association master netting agreements with major financial institutions that permit the net settlement of amounts owed under their respective derivative contracts. Under these master netting agreements, net settlement generally permits the Company or the counterparty to determine the net amount payable for contracts due on the same date and in the same currency for similar types of derivative transactions. The master netting agreements generally also provide for net settlement of all outstanding contracts with a counterparty in the case of an event of default or a termination event. The Company does not offset fair value amounts for derivative instruments and fair value amounts recognized for the right to reclaim cash collateral. At April 2, 20161, 2017 and December 26, 2015,31, 2016, the Company had recorded restricted cash in other current assets of $2.7$2.0 million and $2.6$1.4 million, respectively, as collateral related to open derivative contracts under the master netting arrangements.
Note 56 – Investment in Unconsolidated Affiliates
The Company owns a 50 percent interest in Tecumseh Products Holdings LLC (Joint Venture), an unconsolidated affiliate that acquired Tecumseh Products Company (Tecumseh) during the third quarter of 2015. The Company also owns a 50 percent interest in a second unconsolidated affiliate that provided financing to Tecumseh in conjunction with the acquisition. These investments are accounted forrecorded using the equity method of accounting, as the Company can exercise significant influence but does not own a majority equity interest or otherwise control the repectiverespective entities. Under the equity method of accounting, these investments are stated at initial cost and are adjusted for subsequent additional investments and the Company'sCompany’s proportionate share of earnings or losses and distributions.
The Company records its proportionate share of the investee'sinvestees’ net income or loss one quarter in arrears as income (loss) from unconsolidated affiliates, net of tax, in the Condensed Consolidated Statements of Income and its proportionate share of the investees’ other comprehensive income (loss), net of income taxes, in the Condensed Consolidated Statements of Comprehensive Income. In general, the equity investment in unconsolidated affiliates is equal to the current equity investment plus the entities’ undistributed earnings.
The following tables present summarized financial information derived from the Company'sCompany’s equity method investees'investees’ combined consolidated financial statements, which are prepared in accordance with U.S. GAAP.
| (In thousands) | | December 31, 2015 | | September 30, 2015 | |
| | | | | | |
| Current assets | | $ | 225,500 | | | $ | 251,389 | |
| Noncurrent assets | | | 118,600 | | | | 112,156 | |
| Current liabilities | | | 138,781 | | | | 178,784 | |
| Noncurrent liabilities | | | 71,700 | | | | 63,643 | |
| | | | | | | | | |
| | | | | | | | |
12 |
| | | | | | | | |
| | | April 1, 2017 | | December 31, 2016 |
| | | | | |
| Current assets | | $ | 231,485 |
| | $ | 244,323 |
|
| Noncurrent assets | | 129,500 |
| | 130,400 |
|
| Current liabilities | | 152,710 |
| | 148,806 |
|
| Noncurrent liabilities | | 62,126 |
| | 71,681 |
|
| | | | | | | |
| | | | | | | |
| | For the Quarter Ended | |
| (In thousands) | December 31, 2015 | | September 30, 2015 | |
| | | | | | | |
| Net sales | | $ | 151,600 | | | $ | — | |
| Gross profit | | | 18,000 | | | | — | |
| Net income | | | 5,843 | | | | — | |
Included in the equity method investees' |
| | | | | | | | |
| | | For the Quarter Ended |
| (In thousands) | | April 1, 2017 | | April 2, 2016 |
| | | | | |
| Net sales | | $ | 126,300 |
| | $ | 151,600 |
|
| Gross profit | | 15,600 |
| | 18,000 |
|
| Net (loss) income | | (2,487 | ) | | 5,843 |
|
The Company’s income from unconsolidated affiliates, net incomeof tax, for the quarter ended December 31, 2015 isApril 2, 2016 included a gain of $17.1 million that resulted from the allocation of the purchase price, which was finalized during the quarter. That gain waspartially offset by restructuring and impairment charges of $5.3 million and operatingnet losses of $6.0 million.
Note 6 – Benefits7 –Benefit Plans
The Company sponsors several qualified and nonqualified pension plans and other postretirement benefit plans for certain of its employees. The components of net periodic benefit cost (income) are as follows:
| | | For the Quarter Ended | |
| (In thousands) | | April 2, 2016 | | | March 28, 2015 | |
| | | | |
| Pension benefits: | | | | | | |
| Service cost | | $ | 195 | | | $ | 272 | |
| Interest cost | | | 1,975 | | | | 2,054 | |
| Expected return on plan assets | | | (2,466 | ) | | | (2,654 | ) |
| Amortization of net loss | | | 774 | | | | 714 | |
| | | | | | | | | |
| Net periodic benefit cost | | $ | 478 | | | $ | 386 | |
| | | | | | | | | |
| Other benefits: | | | | | | | | |
| Service cost | | $ | 62 | | | $ | 96 | |
| Interest cost | | | 156 | | | | 196 | |
| Amortization of prior service (credit) cost | | | (224 | ) | | | 2 | |
| Amortization of net loss | | | 2 | | | | 3 | |
| | | | | | | | | |
| Net periodic benefit (income) cost | | $ | (4 | ) | | $ | 297 | |
| | | | | | | | | |
|
| | | | | | | | |
| | | For the Quarter Ended |
| (In thousands) | | April 1, 2017 | | April 2, 2016 |
| | | | | |
| Pension benefits: | | | | |
| Service cost | | $ | 35 |
| | $ | 195 |
|
| Interest cost | | 1,665 |
| | 1,975 |
|
| Expected return on plan assets | | (2,182 | ) | | (2,466 | ) |
| Amortization of net loss | | 556 |
| | 774 |
|
| | | | | |
| Net periodic benefit cost | | $ | 74 |
| | $ | 478 |
|
| | | | | |
| Other benefits: | | |
| | |
|
| Service cost | | $ | 56 |
| | $ | 62 |
|
| Interest cost | | 149 |
| | 156 |
|
| Amortization of prior service credit | | (225 | ) | | (224 | ) |
| Amortization of net (gain) loss | | (5 | ) | | 2 |
|
| | | | | |
| Net periodic benefit income | | $ | (25 | ) | | $ | (4 | ) |
Note 78 – Commitments and Contingencies
The Company is involved in certain litigation as a result of claims that arose in the ordinary course of business, which management believes will not have a material adverse effect on the Company'sCompany’s financial position, results of operations, or cash flows. ItThe Company may also realize the benefit of certain legal claims and litigation in the future; these gain contingencies are not recognized in the Condensed Consolidated Financial Statements.
Equal Employment Opportunity Commission Matter
On October 5, 2016, the Company received a demand letter from the Los Angeles District Office of the United States Equal Employment Opportunity Commission (EEOC). The EEOC alleges that between May 2011 and April 2015, various Company employees were terminated in violation of the Americans with Disabilities Act, and that certain of the Company’s employee leave and attendance policies were discriminatory in nature. On that basis, the EEOC’s letter includes a demand for monetary relief on behalf of an identified class of 20 individuals, and an unidentified class of 150 individuals, in addition to injunctive relief.
The Company believes the EEOC’s allegations are without merit. Notwithstanding the Company’s position, in consultation with its liability insurers, the Company entered into a conciliation process with the EEOC for purposes of resolving the claims. On
April 12, 2017, the Company received a letter from the EEOC stating that the conciliation process had concluded without a resolution of the claims, and that the matter would be referred to its Legal Department for potential litigation. Due to the procedural stage of this matter, the Company is unable to determine the likelihood of a material adverse outcome in this matter, or the amount or range of a potential loss in excess of any available insurance coverage.
Guarantees
Guarantees, in the form of letters of credit, are issued by the Company generally to assure the payment of insurance deductibles and certain retiree health benefits. The terms of the guarantees are generally one year but are renewable annually as required. These letters are primarily backed by the Company'sCompany’s revolving credit facility. The maximum payments that the Company could be required to make under its guarantees at April 2, 20161, 2017 were $6.6$7.0 million.
Note 89 – Income Taxes
The Company'sCompany’s effective tax rate for the first quarter of 20162017 was 3527 percent compared with 3435 percent for the same period last year. The items impacting the effective tax rate for the first quarter of 2017 were primarily attributable to reductions for the U.S. production activities deduction of $0.9 million; the effect of foreign tax rates lower than statutory tax rates of $1.4 million; the tax benefit of equity compensation deductions of $1.7 million; and the impact of investments in unconsolidated affiliates of $0.8 million. These items were partially offset by the provision for state income taxes, net of the federal benefit, of $0.9 million.
The items impacting the effective tax rate for the first quarter of 2016 were primarily attributable to reductions for the U.S. production activities deduction of $0.9 million and the effect of foreign tax rates lower than statutory tax rates of $1.1 million. These items were partially offset by the provision for state income taxes, net of the federal benefit, of $0.8 million and the recording of thea basis difference in unconsolidated affiliates of $1.0 million.
The difference between the effective tax rate and the amount computed using the U.S. federal statutory tax rate for the first quarter of 2015 was primarily attributable to reductions for the U.S. production activities deduction of $1.0 million and the effect of foreign tax rates lower than statutory tax rates of $0.5 million. These items were partially offset by the provision for state income taxes, net of the federal benefit, of $0.8 million.
The Company files a consolidated U.S. federal income tax return and numerous consolidated and separate-company income tax returns in many state, local, and foreign jurisdictions. The statute of limitations is open for the Company'sCompany’s federal tax return and most state income tax returns for 20122013 and all subsequent years and is open for certain state and foreign returns for earlier tax years due to ongoing audits and differing statute periods. The Internal Revenue Service is currently auditing the Company's 2013 federal tax return. While the Company believes that it is adequately reserved for possible future audit adjustments, the final resolution of these examinations cannot be determined with certainty and could result in final settlements that differ from current estimates.
Note 910 – Accumulated Other Comprehensive Income
AOCI includes certain foreign currency translation adjustments from those subsidiaries not using the U.S. dollar as their functional currency, net deferred gains and losses on certain derivative instruments accounted for as cash flow hedges, adjustments to pension and OPEB liabilities, and unrealized gains and losses on marketable securities classified as available-for-sale.available-for-sale, and other comprehensive income attributable to unconsolidated affiliates.
The following table provides changes in AOCI by component, net of taxes and noncontrolling interestinterests (amounts in parentheses indicate debits to AOCI):
| | | For the Quarter Ended April 2, 2016 | |
| (In thousands) | | Cumulative Translation Adjustment | | | Unrealized (Losses)/Gains on Derivatives | | | Minimum Pension/OPEB Liability Adjustment | | | Unrealized Gains on Equity Investments | | | Total | |
| | | | | | | | | | | | | | | | |
| Balance at December 26, 2015 | | $ | (24,773 | ) | | $ | (2,009 | ) | | $ | (28,429 | ) | | $ | 221 | | | $ | (54,990 | ) |
| | | | | | | | | | | | | | | | | | | | | |
| Other comprehensive income (loss) before reclassifications | | | (337 | ) | | | 457 | | | | 760 | | | | 14 | | | | 894 | |
| Amounts reclassified from accumulated OCI | | | — | | | | 137 | | | | 412 | | | | — | | | | 549 | |
| | | | | | | | | | | | | | | | | | | | | |
| Net current-period other comprehensive income | | | (337 | ) | | | 594 | | | | 1,172 | | | | 14 | | | | 1,443 | |
| | | | | | | | | | | | | | | | | | | | | |
| Balance at April 2, 2016 | | $ | (25,110 | ) | | $ | (1,415 | ) | | $ | (27,257 | ) | | $ | 235 | | | $ | (53,547 | ) |
|
| | | | | | | | | | | | | | | | | | | | | | | |
| | | For the Quarter Ended April 1, 2017 |
| (In thousands) | | Cumulative Translation Adjustment | | Unrealized (Loss) Gain on Derivatives | | Pension/OPEB Liability Adjustment | | Unrealized Gain (Loss) on Equity Securities | | Attributable to Unconsol. Affiliates | | Total |
| | | | | | | | | | | | | |
| Balance as of December 31, 2016 | | $ | (49,965 | ) | | $ | (300 | ) | | $ | (23,046 | ) | | 380 |
| | $ | 5,975 |
| | $ | (66,956 | ) |
| | | | | | | | | | | | | |
| Other comprehensive income (loss) before reclassifications | | 6,561 |
| | (445 | ) | | (222 | ) | | 16 |
| | (1,598 | ) | | 4,312 |
|
| Amounts reclassified from AOCI | | — |
| | 501 |
| | 262 |
| | (160 | ) | | — |
| | 603 |
|
| | | | | | | | | | | | | |
| Net current-period other comprehensive income (loss) | | 6,561 |
| | 56 |
| | 40 |
| | (144 | ) | | (1,598 | ) | | 4,915 |
|
| | | | | | | | | | | | | |
| Balance as of April 1, 2017 | | $ | (43,404 | ) | | $ | (244 | ) | | $ | (23,006 | ) | | 236 |
| | $ | 4,377 |
| | $ | (62,041 | ) |
|
| | | | | | | | | | | | | | | | | | | | | | | |
| | | For the Quarter Ended April 2, 2016 |
| (In thousands) | | Cumulative Translation Adjustment | | Unrealized (Loss) Gain on Derivatives | | Pension/OPEB Liability Adjustment | | Unrealized Gain on Equity Securities | | Attributable to Unconsol. Affiliates | | Total |
| | | | | | | | | | | | | |
| Balance as of December 26, 2015 | | $ | (24,773 | ) | | $ | (2,009 | ) | | $ | (28,429 | ) | | 221 |
| | $ | — |
| | $ | (54,990 | ) |
| | | | | | | | | | | | | |
| Other comprehensive (loss) income before reclassifications | | (337 | ) | | 457 |
| | 760 |
| | 14 |
| | — |
| | 894 |
|
| Amounts reclassified from AOCI | | — |
| | 137 |
| | 412 |
| | — |
| | — |
| | 549 |
|
| | | | | | | | | | | | | |
| Net current-period other comprehensive (loss) income | | (337 | ) | | 594 |
| | 1,172 |
| | 14 |
| | — |
| | 1,443 |
|
| | | | | | | | | | | | | |
| Balance as of April 2, 2016 | | $ | (25,110 | ) | | $ | (1,415 | ) | | $ | (27,257 | ) | | 235 |
| | $ | — |
| | $ | (53,547 | ) |
| | | For the Quarter Ended March 28, 2015 | |
| (In thousands) | | Cumulative Translation Adjustment | | | Unrealized (Losses)/Gains on Derivatives | | | Minimum Pension/OPEB Liability Adjustment | | | Unrealized Gains on Equity Investments | | | Total | |
| | | | | | | | | | | | | | | | |
| Balance at December 27, 2014 | | $ | (7,076 | ) | | $ | (953 | ) | | $ | (35,164 | ) | | $ | 270 | | | $ | (42,923 | ) |
| | | | | | | | | | | | | | | | | | | | | |
| Other comprehensive income (loss) before reclassifications | | | (7,697 | ) | | | (837 | ) | | | 895 | | | | (27 | ) | | | (7,666 | ) |
| Amounts reclassified from accumulated OCI | | | — | | | | 639 | | | | 521 | | | | — | | | | 1,160 | |
| | | | | | | | | | | | | | | | | | | | | |
| Net current-period other comprehensive income | | | (7,697 | ) | | | (198 | ) | | | 1,416 | | | | (27 | ) | | | (6,506 | ) |
| | | | | | | | | | | | | | | | | | | | | |
| Balance at March 28, 2015 | | $ | (14,773 | ) | | $ | (1,151 | ) | | $ | (33,748 | ) | | $ | 243 | | | $ | (49,429 | ) |
Reclassification adjustments out of AOCI were as follows:
| | | Amount reclassified from AOCI |
| | | For the Quarter Ended | | |
| (In thousands) | | April 2, 2016 | | | March 28, 2015 | | Affected line item |
| | | | | | |
| Unrealized losses/(gains) on derivatives: | | | | | | | |
| Commodity contracts | | $ | 237 | | | $ | 762 | | Cost of goods sold |
| Interest rate swap | | | 108 | | | | 106 | | Interest expense |
| | | | (208 | ) | | | (229 | ) | Income tax expense |
| | | | 137 | | | | 639 | | Net of tax |
| | | | — | | | | — | | Noncontrolling interest |
| | | | | | | | | | |
| | | $ | 137 | | | $ | 639 | | Net of tax and noncontrolling interest |
| | | | | | | | | | |
| Amortization of net loss and prior service cost on employee benefit plans | | $ | 552 | | | $ | 719 | | Selling, general, and administrative expense |
| | | | (140 | ) | | | (198 | ) | Income tax expense |
| | | | 412 | | | | 521 | | Net of tax |
| | | | — | | | | — | | Noncontrolling interest |
| | | | | | | | | | |
| | | $ | 412 | | | $ | 521 | | Net of tax and noncontrolling interest |
|
| | | | | | | | | | |
| | | Amount reclassified from AOCI |
| | | For the Quarter Ended | | |
| (In thousands) | | April 1, 2017 | | April 2, 2016 | | Affected line item |
| | | | | | | |
| Unrealized losses (gains) on derivatives: | | | | | | |
| Commodity contracts | | $ | 422 |
| | $ | 237 |
| | Cost of goods sold |
| Interest rate swap | | 232 |
| | 108 |
| | Interest expense |
| | | (153 | ) | | (208 | ) | | Income tax expense |
| | | 501 |
| | 137 |
| | Net of tax |
| | | — |
| | — |
| | Noncontrolling interests |
| | | | | | | |
| | | $ | 501 |
| | $ | 137 |
| | Net of tax and noncontrolling interests |
| | | | | | | |
| Amortization of net loss and prior service cost on employee benefit plans | | $ | 326 |
| | $ | 552 |
| | Selling, general, and administrative expense |
| | | (64 | ) | | (140 | ) | | Income tax expense |
| | | 262 |
| | 412 |
| | Net of tax |
| | | — |
| | — |
| | Noncontrolling interests |
| | | | | | | |
| | | $ | 262 |
| | $ | 412 |
| | Net of tax and noncontrolling interests |
| | | | | | | |
| Sale of available-for-sale securities | | $ | (254 | ) | | $ | — |
| | Other income |
| | | 94 |
| | — |
| | Income tax expense |
| | | (160 | ) | | — |
| | Net of tax |
| | | — |
| | — |
| | Noncontrolling interests |
| | |
|
| |
|
| |
|
| | | $ | (160 | ) | | $ | — |
| | Net of tax and noncontrolling
interests |
Note 11 – Noncontrolling Interests
|
| | | |
| (In thousands) | Noncontrolling Interests |
| | |
| Balance as of December 31, 2016 | $ | 37,753 |
|
| Net income attributable to noncontrolling interests | 468 |
|
| Other comprehensive income attributable to noncontrolling interests, net of tax: | |
| Foreign currency translation | 649 |
|
| | |
|
| Balance as of April 1, 2017 | $ | 38,870 |
|
Note 1012 – Recently Issued Accounting Standards
In March 2016,2017, the Financial Accounting Standards Board (FASB) issued ASU (AccountingAccounting Standards Update)Update (ASU) No. 2015-09, 2017-07, Compensation – Stock Compensation- Retirement Benefits (Topic 718)715): Improvement to Employee Share-Based Payment Accounting Improving the Presentation of Net Periodic Pension Cost and Net Periodic Postretirement Benefit Cost(ASU 2016-09). The ASU requires allemployers that sponsor defined benefit pension and/or other postretirement benefit
plans to present the service cost component of net periodic benefit cost in the same income statement line item(s) as other employee compensation costs arising from services rendered during the period and other components of net periodic benefits cost separately from the line item(s) that includes the service cost and outside of any subtotal of operating income. The guidance is effective for the Company in interim and annual periods beginning in 2018. Early adoption is permitted as of the beginning of an annual period for which financial statements have not been issued or made available for issuance. The Company does not expect the adoption of the standard to have a material impact on its Condensed Consolidated Financial Statements.
In January 2017, the FASB issued ASU No. 2017-04, Intangibles – Goodwill and Other (Topic 350): Simplifying the Test for Goodwill Impairment. The ASU eliminates step two from the goodwill impairment test and instead requires an entity to perform its annual, or interim, goodwill impairment test by comparing the fair value of a reporting unit with its carrying amount. The entity should recognize an impairment charge for the amount by which the carrying amount exceeds the reporting unit’s fair value, not to exceed the total amount of goodwill allocated to the reporting unit. The updated guidance requires a prospective adoption. Early adoption is permitted. The guidance is effective for the Company beginning in 2020. The Company is in the process of evaluating the effects of the provisions of the ASU on its Condensed Consolidated Financial Statements.
In January 2017, the FASB issued ASU No. 2017-01, Business Combinations (Topic 805): Clarifying the Definition of a Business. The ASU provides guidance to assist entities in evaluating whether transactions should be accounted for as acquisitions (or disposals) of assets or businesses. The updated guidance requires a prospective adoption. Early adoption is permitted. This update will be effective for the Company beginning in 2018. The Company does not expect the provisions of the ASU to have a material impact on its Condensed Consolidated Financial Statements.
In December 2016, the FASB issued ASU No. 2016-20, Technical Corrections and Improvements to Topic 606, Revenue from Contracts with Customers. The ASU provides correction or improvement to the guidance previously issued in ASU 2014-09, Revenue from Contracts with Customers (Topic 606). Under the ASU, an entity will recognize revenue to depict the transfer of promised goods or services to customers at an amount that reflects the consideration that it expects to receive in exchange for the goods or services. It also requires more detailed disclosures to enable users of financial statements to understand the nature, amount, timing and uncertainty of revenue and cash flows arising from contracts with customers. This guidance is effective for the Company at the beginning of 2018. The Company is in the process of examining contract specific terms within each segment and assessing potential changes to its accounting policies, practices, and internal controls over financial reporting to support the standard.
In November 2016, the FASB issued ASU No. 2016-18, Statement of Cash Flows (Topic 230): Restricted Cash. The ASU requires entities to show the changes in the total of cash, cash equivalents, restricted cash, and restricted cash equivalents in the statement of cash flows. As a result, entities will no longer present transfers between cash and cash equivalents and restricted cash and restricted cash equivalents in the statement of cash flows. The guidance will be applied retrospectively and is effective for public business entities in interim and annual periods beginning after December 15, 2017. Early adoption is permitted. The Company does not expect the adoption of the standard to have a material impact on its Condensed Consolidated Financial Statements.
In October 2016, the FASB issued ASU No. 2016-16, Income Taxes (Topic 740): Intra-Entity Transfers of Assets Other Than Inventory. The ASU requires companies to account for the income tax effects of awardsintercompany transfers of assets other than inventory when the transfer occurs. Companies will still be required to be recognized indefer the income statement whentax effects of intercompany inventory transactions in an exception to the awards vest or are settled. It will also allow a company to make a policy election to account for forfeitures as they occur.income tax accounting guidance. The guidance is effective for public business entities in interim and fiscalannual periods beginning after December 15, 2016.2017. Early adoption is permitted but allas of the guidance must be adopted in the samebeginning of an annual period. The Company is in the process ofstill evaluating the impacteffects that the provisions of the ASU 2016-09will have on its Condensed Consolidated Financial Statements.
In February 2016, the FASB issued ASU No. 2016-02,Leases (Topic 842) (ASU 2016-02). The ASU 2016-02 requires an entity to recognize a right-of-use asset and lease liability for all leases with terms of more than 12 months. Recognition, measurement and presentation of expenses will depend on classification as a financing or operating lease. The amendments also require certain quantitative and qualitative disclosures about leasing arrangements. The ASU will be effective for interim and fiscalannual periods beginning after December 15, 2018. Early adoption is permitted. The updated guidance requires a modified retrospective adoption. The Company is still evaluating the effects that the provision of the ASU 2016-02 will have on its Condensed Consolidated Financial Statements.
In April 2015, the FASB issued ASU No. 2015-03, Interest – Imputation of Interest (Topic 835-30): Simplifying the Presentation of Debt Issue Costs (ASU 2015-03). The ASU simplifies the presentation of debt issuance costs by requiring debt issuance costs related to a recognized debt liability to be presented on the balance sheet as a direct deduction from the debt liability rather than as a separate asset. In circumstances in which there is not an associated debt liability amount recorded in the financial statements when the debt issuance costs are incurred, they will be reported on the balance sheet as an asset until the debt liability is recorded. The guidance is effective for public business entities in interim and fiscal periods beginning after December 15, 2015. Retrospective application is required. The Company adopted ASU 2015-03 effective December 27, 2015. The adoption of the ASU did not have a material impact on the Company's Condensed Consolidated Financial Statements.
In May 2014, the FASB issued ASU No. 2014-09, Revenue from Contracts with Customers (Topic 606) (ASU 2014-09). The ASU will supersede virtually all existing revenue recognition guidance under U.S. GAAP and will be effective for annual reporting periods beginning after December 15, 2017. The fundamental principles of the new guidance are that companies should recognize revenue in a manner that reflects the timing of the transfer of services to customers and the amount of revenue recognized reflects the consideration that a company expects to receive for the goods and services provided. The new guidance establishes a five-step approach for the recognition of revenue. The Company is in the process of evaluating the impact of ASU 2014-09 on its Condensed Consolidated Financial Statements.
Note 11 – Subsequent Event
In February 2016, the Company entered into an agreement providing for the purchase of a 60 percent equity interest in Jungwoo Metal Ind. Co., LTD (Jungwoo) for KRW 25 billion or approximately $22.0 million. Jungwoo is a manufacturer of copper-based pipe joining products headquartered in Seoul, South Korea and serves markets worldwide. The transaction was subject to certain closing conditions, including Korean regulatory approval, and was completed on April 26, 2016.
Item 2. | Management'sItem 2. Management’s Discussion and Analysis of Financial Condition and Results of Operations |
General Overview
We are a leading manufacturer of copper, brass, aluminum, and plastic products. The range of these products is broad: copper tube and fittings; line sets; brass and copper alloy rod, bar, and shapes; aluminum and brass forgings; aluminum and copper impact extrusions; plastic fittings and valves; refrigeration valves and fittings; fabricated tubular products; and steel nipples. We also resell imported
brass and plastic plumbing valves, malleable iron fittings, faucets, and plumbing specialty products. Mueller'sMueller’s operations are located throughout the United States and in Canada, Mexico, Great Britain, South Korea, and China.
During the first quarter of 2016, the Company made changes to its management reporting structure as a result of a change in the way the Chief Executive Officer, who serves as the Chief Operating Decision Maker, manages and evaluates the business, makes key operating decisions, and allocates resources. Previously, the Company had two reportable segments: Plumbing & Refrigeration and OEM. During the quarter, the Company realigned its operating segments into three reportable segments: Piping Systems, Industrial Metals, and Climate. Management has recast certain prior period amounts to conform to the current period presentation. Each of theour reportable segments is composed of certain operating segments that are aggregated primarily by the nature of products offered as follows:
· | Piping Systems: The Piping Systems segment is composed of Domestic Piping Systems Group, Canadian Operations, European Operations, Trading Group, and Mueller-Xingrong, our Chinese joint venture. The Domestic Piping Systems Group manufactures and sells copper tube, copper and plastic fittings, line sets, and valves in North America. The Canadian Operations manufacture copper tube and line sets in Canada and sellsPiping Systems: The Piping Systems segment is composed of Domestic Piping Systems Group, Canadian Operations, European Operations, Trading Group, Mueller-Xingrong (our Chinese joint venture), and Jungwoo-Mueller (our South Korean joint venture). The Domestic Piping Systems Group manufactures copper tube and fittings, plastic fittings, and line sets. These products are manufactured in the U.S., sold in the U.S., and exported to markets worldwide. The Canadian Operations manufacture copper tube and line sets in Canada and sell the products primarily in the U.S. and Canada. European Operations manufacture copper tube in the United Kingdom, which is sold throughout Europe. The Trading Group manufactures pipe nipples and sources products for import distribution in North America. Mueller-Xingrong manufactures engineered copper tube primarily for air-conditioning applications; these products are sold primarily to OEMs located in China. Jungwoo-Mueller manufactures copper-based joining products that are sold worldwide. The Piping Systems segment sells products to wholesalers in the plumbing and refrigeration markets, distributors to the manufactured housing and recreational vehicle industries, building material retailers, and air-conditioning OEMs.
|
· | Industrial Metals: The Industrial Metals segment is composed of Brass Rod & Copper Bar Products, Impacts & Micro Gauge, and Brass-Value AddedIndustrial Metals: The Industrial Metals segment is composed of Brass Rod & Copper Bar Products, Impacts & Micro Gauge, and Brass Value-Added Products. The segment manufactures and sells brass and copper alloy rod, bar, and shapes; aluminum and brass forgings; aluminum and copper impact extrusions; and gas valves and assemblies. The segment manufactures and sells its products primarily to domestic OEMs in the industrial, construction, heating, ventilation, and air-conditioning, plumbing, and refrigeration markets. |
· | Climate: The Climate segment is composed of Refrigeration Products, Fabricated Tube Products, Westermeyer, and Turbotec. The segment manufactures and sells refrigeration valves and fittings and fabricated tubular products.Climate: The Climate segment is composed of Refrigeration Products, Fabricated Tube Products, Westermeyer, and Turbotec. The segment manufactures and sells refrigeration valves and fittings, fabricated tubular products, high pressure components, and coaxial heat exchangers. The segment sells its products primarily to the heating, ventilation, air-conditioning, and refrigeration markets in the U.S. |
New housing starts and commercial construction are important determinants of the Company'sCompany’s sales to the heating, ventilation, and air-conditioning, refrigeration, and plumbing markets because the principal end use of a significant portion of our products is in the construction of single and multi-family housing and commercial buildings. Repairs and remodeling projects are also important drivers of underlying demand for these products.
Residential construction activity has shown improvement in recent years, but remains at levels below long-term historical averages. Continued improvement is expected, but may be tempered by continuing low labor participation rates, the pace of household formations, and tighter lending standards. Per the U.S. Census Bureau, the March 20162017 seasonally adjusted annual rate of new housing starts was 1.11.2 million compared with the March 20152016 rate of 1.01.1 million. Mortgage rates remain at historically low levels, as the average 30-year fixed mortgage rate was 3.744.17 percent for the first three monthsquarter of 20162017 and 3.853.65 percent for the twelve months ended December 2015.2016.
The private non-residential construction sector, which includes offices, industrial, health care, and retail projects, began showinghas shown improvement in 2016 and 2015 after declines in previousrecent years. Per the U.S. Census Bureau, the actual (not seasonally adjusted) value of private non-residential construction put in place was $389.0 billion in 2015 compared to $347.7 billion in 2014. The seasonally adjusted annual value of private non-residentialnonresidential construction put in place was $398.3$432.7 billion in February 20162017 compared to the December 2015February 2016 rate of $392.8 billion and the February 2015 rate of $360.2$402.4 billion. We expect that most of these conditions will continue to improve.
Profitability of certain of the Company'sour product lines depends upon the "spreads"“spreads” between the costcosts of raw materialmaterials and the selling prices of itsour products. The open market prices for copper cathode and scrap, for example, influence the selling price of copper tube, a principal product manufactured by the Company. We attempt to minimize the effects on profitability from fluctuations in material costs by passing through these costs to our customers. Our earnings and cash flow are dependent upon these spreads that fluctuate based upon market conditions.
Earnings and profitability are also impacted by unit volumes that are subject to market trends, such as substitute products, imports, technologies, and market share. In core product lines, we intensively manage our pricing structure while attempting to maximize our profitability. From time-to-time, this practice results in lost sales opportunities and lower volume. For plumbing systems, plastics are the primary substitute product; these products represent an increasing share of consumption. U.S. consumption of copper tube is still predominantly supplied by U.S. manufacturers. For certain air-conditioning and refrigeration applications, aluminum basedaluminum-based systems are the primary substitution threat. We cannot predict the acceptance or the rate of switching that may occur. In
recent years, brass rod consumption in the U.S. has declined due to the outsourcing of many manufactured products from offshore regions.
Results of Operations
Consolidated Results
The following table compares summary operating results for the first quarter of 20162017 and 2015:2016:
| | | Three Months Ended | | Percent Change | |
| (In thousands) | | April 2, 2016 | | March 28, 2015 | | 2016 vs. 2015 | |
| | | | | | | | |
| Net sales | | $ | 532,809 | | | $ | 537,242 | | | | (0.8 | )% |
| Operating income | | | 41,467 | | | | 35,724 | | | | 16.1 | |
| Net income | | | 28,630 | | | | 21,978 | | | | 30.3 | |
|
| | | | | | | | | | | |
| | | Quarter Ended | | Percent Change |
| (In thousands) | | April 1, 2017 | | April 2, 2016 | | 2017 vs. 2016 |
| | | | | | | |
| Net sales | | $ | 577,920 |
| | $ | 532,809 |
| | 8.5 | % |
| Operating income | | 45,607 |
| | 41,467 |
| | 10.0 |
|
| Net income | | 29,987 |
| | 28,630 |
| | 4.7 |
|
The following are components of changes in net sales compared to the prior year:
|
| | 2016 vs. 2015 | | |
| | | | | 2017 vs. 2016 |
| Net selling price in core product lines | | (14.0 | ) | % 12.5 | % |
| Unit sales volume in core product lines | | (1.13.7 | ) | | |
| Acquisitions | | 14.02.0 | | |
|
| Other | | 0.3(2.3 | ) |
| | | |
| | | (0.8 | ) | % 8.5 | |
| | | | | % |
The increase in net sales during the first quarter of 2017 was primarily due to $57.3(i) higher net selling prices of $66.8 million in our core product lines, primarily copper tube and brass rod, and (ii) $10.8 million of sales recorded by Great Lakes Copper Ltd. (Great Lakes)Jungwoo Metal Ind. Co., LTD (Jungwoo-Mueller), acquired in July 2015, $12.3 million of sales recorded by Sherwood Valve Products, LLC (Sherwood), acquired in June 2015, and $5.6 million of sales recorded by Turbotec Products, Inc. (Turbotec), acquired in March 2015.April 2016. These increases were offset by lower net selling prices of $75.4 million in our core products. In addition, we had an increase in unit sales volume in the core product linesof $19.7 million, primarily in our domestic Piping Systems segment that was offset by lower unit sales volume in the Industrial Metals segment and at Mueller-Xingrong.non-domestic copper tube businesses.
Net selling prices generally fluctuate with changes in raw material costs. Changes in raw material costs are generally passed through to customers by adjustments to selling prices. The following graph shows the Comex average copper price per pound by quarter for the current and prior fiscal years:
The following tables compare cost of goods sold and operating expenses as dollar amounts and as a percent of net sales for the first quarter of 20162017 and 2015:2016:
| | | Three Months Ended | |
| (In thousands) | | April 2, 2016 | | | March 28, 2015 | |
| | | | | | | |
| Cost of goods sold | | $ | 446,642 | | | $ | 460,834 | |
| Depreciation and amortization | | | 8,920 | | | | 7,853 | |
| Selling, general, and administrative expense | | | 35,780 | | | | 32,831 | |
| | | | | | | | | |
| Operating expenses | | $ | 491,342 | | | $ | 501,518 | |
|
| | | | | | | | |
| | | For the Quarter Ended |
| (In thousands) | | April 1, 2017 | | April 2, 2016 |
| | | | | |
| Cost of goods sold | | $ | 488,427 |
| | $ | 446,642 |
|
| Depreciation and amortization | | 8,355 |
| | 8,920 |
|
| Selling, general and administrative expense | | 35,531 |
| | 35,780 |
|
| | | | | |
| Operating expenses | | $ | 532,313 |
| | $ | 491,342 |
|
| | | Three Months Ended | |
| | | April 2, 2016 | | | March 28, 2015 | |
| | | | | | | | | |
| Cost of goods sold | | | 83.8 | % | | | 85.8 | % |
| Depreciation and amortization | | | 1.7 | | | | 1.5 | |
| Selling, general, and administrative expense | | | 6.7 | | | | 6.1 | |
| | | | | | | | | |
| Operating expenses | | | 92.2 | % | | | 93.4 | % |
|
| | | | | | |
| | | For the Quarter Ended |
| | | April 1, 2017 | | April 2, 2016 |
| | | | | |
| Cost of goods sold | | 84.5 | % | | 83.8 | % |
| Depreciation and amortization | | 1.4 |
| | 1.7 |
|
| Selling, general and administrative expense | | 6.1 |
| | 6.7 |
|
| | | | | |
| Operating expenses | | 92.0 | % | | 92.2 | % |
The decreaseincrease in cost of goods sold was primarily due to the decreaseincrease in the average cost of copper, our principal raw material, and the increase in sales volume related to the acquisition of Jungwoo-Mueller, partially offset by the increasedecrease in sales volume related to the businesses acquired.in certain other businesses. Depreciation and amortization increaseddecreased in the first quarter of 20162017 primarily as a result of depreciation and amortization ofseveral long-lived assets for businesses acquired. becoming fully depreciated and amortized. Selling, general, and administrative expense decreased slightly for the first quarter of 2017 primarily as a result of the period having 13 weeks as compared to 14 weeks in the first quarter of 2016. This was offset by incremental expenses associated with Jungwoo-Mueller of $0.8 million.
Interest expense increased for the first quarter of 20162017 primarily as a result of incremental expensesinterest associated with businesses acquiredour 6% Subordinated Debentures that were issued during 2015.
Interest expense decreased slightly in the first quarter as part of 2016 primarily as a result of decreased borrowing costs at Mueller-Xingrong.our special dividend. Other income, net, for the first quarter of 20162017 was consistent with the first quarter of 2015.2016.
Our effective tax rate for the first quarter of 20162017 was 3527 percent compared with 3435 percent for the same period last year. The items impacting the effective tax rate for the first quarter of 2017 were primarily attributable to reductions for the U.S. production activities deduction of $0.9 million; the effect of foreign tax rates lower than statutory tax rates of $1.4 million; the tax benefit of equity compensation deductions of $1.7 million; and the impact of investments in unconsolidated affiliates of $0.8 million. These items were partially offset by the provision for state income taxes, net of the federal benefit, of $0.9 million.
For the first quarter of 2016, the difference between the effective tax rate and the amount computed using the U.S. federal statutory tax rate for the first quarter of 2016 was primarily attributable to reductions for the U.S. production activities deduction of $0.9 million and the effect of foreign tax rates lower than statutory tax rates of $1.1 million. These items were partially offset by the provision for state income taxes, net of the federal benefit, of $0.8 million and the recording of thea basis difference in unconsolidated affiliates of $1.0 million.
The difference between the effective tax rate and the amount computed using the U.S. federal statutory tax rate for the first quarter of 2015 was primarily attributable to reductions for the U.S. production activities deduction of $1.0 million and the effect of foreign tax rates lower than statutory tax rates of $0.5 million. These items were partially offset by the provision for state income taxes, net of the federal benefit, of $0.8 million.
We own a 50 percent interest in Tecumseh Products Holdings LLC, an unconsolidated affiliate that acquired Tecumseh Products Company (Tecumseh) during the third quarter of 2015. We also own a 50 percent interest in a second unconsolidated affiliate that provided financing to Tecumseh in conjunction with the acquisition. We account for these investments using the equity method of accounting. For the first quarter of 2016,2017, we recognized losses of $1.2 million on these investments, compared to income of $2.9 million in the first quarter of income on these investments. Included in income from unconsolidated affiliates is a gain that resulted from the allocation of purchase price, which was finalized during the quarter. That gain was offset by restructuring and impairment charges and operating losses.2016.
Piping Systems Segment
The following table compares summary operating results for the first quarter of 20162017 and 20152016 for the businesses comprising our Piping Systems segment:
| | Three Months Ended | | Percent Change | |
| (In thousands) | April 2, 2016 | | March 28, 2015 | | 2016 vs. 2015 | |
| | | | | | | | |
| Net sales | | $ | 368,890 | | | $ | 361,482 | | | | 2.0 | % |
| Operating income | | | 31,159 | | | | 26,259 | | | | 18.7 | |
|
| | | | | | | | | | | |
| | | For the Quarter Ended | | Percent Change |
| (In thousands) | | April 1, 2017 | | April 2, 2016 | | 2017 vs. 2016 |
| | | | | | | |
| Net sales | | $ | 398,775 |
| | $ | 368,890 |
| | 8.1 | % |
| Operating income | | 30,366 |
| | 31,159 |
| | (2.5 | ) |
The following are components of changes in net sales compared to the prior year:
|
| | 2016 vs. 2015 | | |
| | | | | 2017 vs. 2016 |
| Net selling price in core product lines | | (14.7 | ) | % 12.4 | % |
| Unit sales volume in core product lines | | 0.9(5.1 | | | ) |
| Acquisitions | | 15.92.9 | | |
|
| Other | | (0.12.1 | ) |
| | |
| | | 2.08.1 | | % | |
| | | | | |
The increase in net sales during the first quarter of 2017 was primarily dueattributable to (i) $57.3higher net selling prices in the segment’s core product lines, primarily copper tube, of $45.5 million, and (ii) $10.8 million of sales recorded by Great Lakes and (ii) higher unit sales volume in the segment's domestic core product lines, primarily copper tube.Jungwoo-Mueller. These increases were offset by (i) lower net selling pricesunit sales volume of $53.0$18.7 million in the segment'ssegment’s core product lines, and (ii) a decreaseprimarily in sales by the segment's other product lines, primarily Mueller-Xingrong.our non-domestic copper tube businesses.
The following tables compare cost of goods sold and operating expenses as dollar amounts and as a percent of net sales for the first quarter of 20162017 and 2015:2016:
| | | Three Months Ended | |
| (In thousands) | | April 2, 2016 | | | March 28, 2015 | |
| | | | | | | |
| Cost of goods sold | | $ | 313,792 | | | $ | 312,690 | |
| Depreciation and amortization | | | 5,649 | | | | 5,187 | |
| Selling, general, and administrative expense | | | 18,290 | | | | 17,346 | |
| | | | | | | | | |
| Operating expenses | | $ | 337,731 | | | $ | 335,223 | |
|
| | | | | | | | |
| | | For the Quarter Ended |
| (In thousands) | | April 1, 2017 | | April 2, 2016 |
| | | | | |
| Cost of goods sold | | $ | 344,646 |
| | $ | 313,792 |
|
| Depreciation and amortization | | 5,342 |
| | 5,649 |
|
| Selling, general and administrative expense | | 18,421 |
| | 18,290 |
|
| | | | | |
| Operating expenses | | $ | 368,409 |
| | $ | 337,731 |
|
|
| | | | | | |
| | | For the Quarter Ended |
| | | April 1, 2017 | | April 2, 2016 |
| | | | | |
| Cost of goods sold | | 86.4 | % | | 85.1 | % |
| Depreciation and amortization | | 1.3 |
| | 1.5 |
|
| Selling, general and administrative expense | | 4.6 |
| | 5.0 |
|
| | | | | |
| Operating expenses | | 92.3 | % | | 91.6 | % |
| | | Three Months Ended | |
| | | April 2, 2016 | | | March 28, 2015 | |
| | | | | | | | | |
| Cost of goods sold | | | 85.1 | % | | | 86.5 | % |
| Depreciation and amortization | | | 1.5 | | | | 1.4 | |
| Selling, general, and administrative expense | | | 5.0 | | | | 4.8 | |
| | | | | | | | | |
| Operating expenses | | | 91.6 | % | | | 92.7 | % |
The increase in cost of goods sold was primarily due to the increase in the average cost of copper and the increase in sales volume related to Great Lakes, largelythe acquisition of Jungwoo-Mueller, partially offset by the decrease in the average cost of copper. sales volume in certain other businesses.
Depreciation and amortization increaseddecreased slightly as a result of depreciation and amortization of theseveral long-lived assets acquired at Great Lakes.becoming fully depreciated and amortized. Selling, general, and administrative expensesexpense increased slightly for the first quarter of 2016 primarily2017 as a result of incremental expenses associated with Great LakesJungwoo-Mueller of $1.6$0.8 million. This was offset by a reduction as a result of $0.4 millionthe first quarter of equipment relocation costs related2017 having 13 weeks as compared to the rationalization of Yorkshire Copper Tube in 2015 as well as foreign currency transaction gains of $0.5 million14 weeks in the current quarter. first quarter of 2016.
Industrial Metals Segment
The following table compares summary operating results for the first quarter of 20162017 and 20152016 for the businesses comprising our Industrial Metals segment:
| | Three Months Ended | | Percent Change | |
| (In thousands) | April 2, 2016 | | March 28, 2015 | | 2016 vs. 2015 | |
| | | | | | | | |
| Net sales | | $ | 134,521 | | | $ | 151,036 | | | | (10.9 | )% |
| Operating income | | | 19,912 | | | | 18,959 | | | | 5.0 | |
|
| | | | | | | | | | | |
| | | For the Quarter Ended | | Percent Change |
| (In thousands) | | April 1, 2017 | | April 2, 2016 | | 2017 vs. 2016 |
| | | | | | | |
| Net sales | | $ | 149,837 |
| | $ | 134,521 |
| | 11.4 | % |
| Operating income | | 20,666 |
| | 19,912 |
| | 3.8 |
|
The following are components of changes in net sales compared to the prior year:
|
| | 2016 vs. 2015 | | |
| | | | | 2017 vs. 2016 |
| Net selling price in core product lines | | (14.7 | ) | % 15.8 | % |
| Unit sales volume in core product lines | | (6.00.7 | ) | | |
Acquisitions | | 8.1 | | | |
| Other | | 1.7(3.7 | ) |
| | | |
| | | (10.9 | ) | % 11.4 | |
| | | | | % |
The decreaseincrease in net sales during the first quarter of 2017 was primarily due to (i) lowerhigher net selling prices of $22.2 million and (ii) lower unit sales volume of $9.1$21.3 million in the segment'ssegment’s core product lines, primarily brass rod. This increase was offset by $12.3lower sales of $7.0 million of sales recorded by Sherwood.in the segment’s non-core product lines.
The following tables compare cost of goods sold and operating expenses as dollar amounts and as a percent of net sales for the first quarter of 20162017 and 2015:2016:
| | | Three Months Ended | |
| (In thousands) | | April 2, 2016 | | | March 28, 2015 | |
| | | | | | | |
| Cost of goods sold | | $ | 109,229 | | | $ | 127,724 | |
| Depreciation and amortization | | | 2,135 | | | | 1,655 | |
| Selling, general, and administrative expense | | | 3,245 | | | | 2,698 | |
| | | | | | | | | |
| Operating expenses | | $ | 114,609 | | | $ | 132,077 | |
|
| | | | | | | | |
| | | For the Quarter Ended |
| (In thousands) | | April 1, 2017 | | April 2, 2016 |
| | | | | |
| Cost of goods sold | | $ | 124,043 |
| | $ | 109,229 |
|
| Depreciation and amortization | | 1,898 |
| | 2,135 |
|
| Selling, general and administrative expense | | 3,230 |
| | 3,245 |
|
| | | | | |
| Operating expenses | | $ | 129,171 |
| | $ | 114,609 |
|
| | | Three Months Ended | |
| | | April 2, 2016 | | | March 28, 2015 | |
| | | | | | | | | |
| Cost of goods sold | | | 81.2 | % | | | 84.6 | % |
| Depreciation and amortization | | | 1.6 | | | | 1.1 | |
| Selling, general, and administrative expense | | | 2.4 | | | | 1.7 | |
| | | | | | | | | |
| Operating expenses | | | 85.2 | % | | | 87.4 | % |
|
| | | | | | |
| | | For the Quarter Ended |
| | | April 1, 2017 | | April 2, 2016 |
| | | | | |
| Cost of goods sold | | 82.8 | % | | 81.2 | % |
Depreciation and amortization | | 1.3 |
| | 1.6 |
|
| Selling, general and administrative expense | | 2.2 |
| | 2.4 |
|
| | | | | |
| Operating expenses | | 86.3 | % | | 85.2 | % |
The decreaseincrease in cost of goods sold was relatedprimarily due to factors consistent with those noted regarding changesthe increase in net sales.the average cost of copper. Depreciation and amortization increaseddecreased slightly as a result of depreciation and amortization of the long-livedseveral fixed assets acquired at Sherwood and recent capital expenditures.becoming fully depreciated. Selling, general, and administrative expenses increased primarily as a resultfor the first quarter of incremental expenses associated2017 were consistent with Sherwoodthe first quarter of $0.7 million. This was offset by lower net periodic pension costs of $0.2 million. 2016.
Climate Segment
The following table compares summary operating results for the first quarter of 20162017 and 20152016 for the businesses comprising our Climate segment:
| | Three Months Ended | | Percent Change | |
| (In thousands) | April 2, 2016 | | March 28, 2015 | | 2016 vs. 2015 | |
| | | | | | | | |
| Net sales | | $ | 30,706 | | | $ | 25,811 | | | | 19.0 | % |
| Operating income | | | 3,879 | | | | 2,265 | | | | 71.3 | |
|
| | | | | | | | | | | |
| | | For the Quarter Ended | | Percent Change |
| (In thousands) | | April 1, 2017 | | April 2, 2016 | | 2017 vs. 2016 |
| | | | | | | |
| Net sales | | $ | 34,279 |
| | $ | 30,706 |
| | 11.6 | % |
| Operating income | | 5,610 |
| | 3,879 |
| | 44.6 |
|
TheSales for the first quarter of 2017 increased primarily as a result of an increase in net sales was primarily due to additional sales recorded by Turbotec, acquired in June 2015.volume and product mix.
The following tables compare cost of goods sold and operating expenses as dollar amounts and as a percent of net sales for the first quarter of 20162017 and 2015:2016:
| | | Three Months Ended | |
| (In thousands) | | April 2, 2016 | | | March 28, 2015 | |
| | | | | | | |
| Cost of goods sold | | $ | 23,705 | | | $ | 21,267 | |
| Depreciation and amortization | | | 599 | | | | 425 | |
| Selling, general, and administrative expense | | | 2,523 | | | | 1,854 | |
| | | | | | | | | |
| Operating expenses | | $ | 26,827 | | | $ | 23,546 | |
|
| | | | | | | | |
| | | For the Quarter Ended |
| (In thousands) | | April 1, 2017 | | April 2, 2016 |
| | | | | |
| Cost of goods sold | | $ | 25,564 |
| | $ | 23,705 |
|
Depreciation and amortization | | 629 |
| | 599 |
|
| Selling, general and administrative expense | | 2,476 |
| | 2,523 |
|
| | | | | |
| Operating expenses | | $ | 28,669 |
| | $ | 26,827 |
|
| | | Three Months Ended | |
| | | April 2, 2016 | | | March 28, 2015 | |
| | | | | | | | | |
| Cost of goods sold | | | 77.2 | % | | | 82.4 | % |
| Depreciation and amortization | | | 2.0 | | | | 1.6 | |
| Selling, general, and administrative expense | | | 8.2 | | | | 7.2 | |
| | | | | | | | | |
| Operating expenses | | | 87.4 | % | | | 91.2 | % |
|
| | | | | | |
| | | For the Quarter Ended |
| | | April 1, 2017 | | April 2, 2016 |
| | | | | |
| Cost of goods sold | | 74.6 | % | | 77.2 | % |
Depreciation and amortization | | 1.8 |
| | 2.0 |
|
| Selling, general and administrative expense | | 7.2 |
| | 8.2 |
|
| | | | | |
| Operating expenses | | 83.6 | % | | 87.4 | % |
Cost of goods sold was relatedincreased during the first quarter of 2017 primarily due to the increase in volume offset byand improved margins and product mix within the segment. Depreciation and amortization increased slightly as a result of depreciation and amortization of the long-lived assets acquired at Turbotec. Selling,selling, general, and administrative expenses increased primarily as a resultfor the first quarter of incremental expenses associated2017 were consistent with Turbotecthe expense recorded for the first quarter of $0.6 million.
2016.
Liquidity and Capital Resources
The following table presents selected financial information for the first quarter of 20162017 and 2015:2016:
| (In thousands) | | 2016 | | | 2015 | |
| | | | | | | |
| Cash and cash equivalents | | $ | 270,149 | | | $ | 326,894 | |
| Property, plant, and equipment, net | | | 278,481 | | | | 244,909 | |
| Total debt | | | 210,583 | | | | 236,676 | |
| Working capital, net of cash and current debt | | | 352,587 | | | | 421,753 | |
| | | | | | | | | |
| Cash provided by operating activities | | | 10,336 | | | | 3,890 | |
| Cash used in investing activities | | | (5,807 | ) | | | (19,493 | ) |
| Cash used in financing activities | | | (9,053 | ) | | | (8,121 | ) |
|
| | | | | | | | |
| (In thousands) | | 2017 | | 2016 |
| | | | | |
| Increase (decrease) in: | | | | |
| Cash and cash equivalents | | $ | (204,426 | ) | | $ | (4,695 | ) |
| Property, plant, and equipment, net | | 1,129 |
| | (1,743 | ) |
| Total debt | | 277,362 |
| | (5,427 | ) |
| Working capital, net of cash and current debt | | 54,776 |
| | 24,699 |
|
| | | | | |
| Net cash (used in) provided by operating activities | | (11,422 | ) | | 10,336 |
|
| Net cash used in investing activities | | (7,112 | ) | | (5,807 | ) |
| Net cash used in financing activities | | (188,391 | ) | | (9,053 | ) |
Cash Provided by Operating Activities
During the three monthsquarter ended April 1, 2017, net cash used in operating activities was primarily attributable to an increase in receivables of $53.8 million. This cash decrease was offset by consolidated net income of $30.5 million, and depreciation and amortization of $8.4 million. The fluctuations are primarily due to additional working capital needs in the first quarter of 2017.
During the quarter ended April 2, 2016, net cash provided by operating activities was primarily attributable to consolidated net income of $28.7 million and depreciation and amortization of $9.0 million. This wasThese cash increases were partially offset by increasedan increase in receivables of $25.1 million primarily due to a net increase in working capital needs related to higher sales at the end of the first quarter.
During the three months ended March 28, 2015, cash provided by operating activities was primarily attributable to consolidated net income of $22.3 million, depreciation and amortization of $8.0 million, decreased other assets of $9.3 million, and decreased inventories of $7.5 million, partially offset by increased receivables of $36.7 million and decreased current liabilities of $7.4 million. These fluctuations are primarily due to a net increase in working capital needs related to higher sales at the end of the first quarter.
Cash Used in Investing Activities
NetThe major components of net cash used in investing activities during the quarter ended April 1, 2017 included capital expenditures of $7.3 million and net deposits in restricted cash balances of $1.4 million, offset by $1.4 million in proceeds from the first three monthssale of securities.
The major components of net cash used in investing activities during the quarter ended April 2, 2016 was primarily related to capital expenditures of $5.9 million.
The major components ofCash Used in Financing Activities
For the quarter ended April 1, 2017, net cash used in investingfinancing activities inconsisted primarily of $179.8 million used for the first three monthspayment of 2015 included net deposits into restricted cash balancesthe special dividend and the regular quarterly dividend to stockholders of $12.6the Company and $7.4 million used for repayment of debt by Mueller-Xingrong and capital expenditures of $7.4 million.
Cash Used in Financing ActivitiesJungwoo-Mueller.
For the first quarter ofended April 2, 2016, net cash used in financing activities consisted primarily of $7.0 million used for the repayment of debt by Mueller-Xingrong of $7.0 million and payment of regular quarterly dividends to stockholders of the Company of $4.2 million, offset by issuance of debt of $2.0 million.
For the first quarter of 2015, net cash used in financing activities consisted primarily of $4.2 million used for payment of regular quarterly dividends to stockholders of the Company, and $3.8 million used for the repaymentoffset by issuance of debt by Mueller-Xingrong.of $2.0 million.
Liquidity and Outlook
Management believes that cash provided by operations, funds available under the credit agreement, and cash and cash equivalents on hand will be adequate to meet our liquidity needs, including working capital, capital expenditures, and debt payment obligations. OurAs of April 1, 2017 our current ratio was 4.13.3 to 1 as of April 2, 2016.1.
We have significant environmental remediation obligations which we expect to pay over future years. Cash used for environmental remediation activities was approximately $0.2$0.1 million during the first three monthsquarter of 2016.2017. We expect to spend approximately $0.5 million for the remainder of 20162017 for ongoing environmental remediation activities.
The Company declared and paid a quarterly cash dividend of 10.0 cents per common share during the first quarter of 2017 and 7.5 cents per common share in the first quarter of 20162016. Additionally, the Company distributed a special dividend composed of $3.00 in cash and 2015.$5.00 in principal amount of the Company’s 6% Subordinated Debentures (Debentures) due 2027 for each share of common stock outstanding. Payment of dividends in the future is dependent upon our financial condition, cash flows, capital requirements, earnings, and other factors.
In February 2016, the Company entered into an agreement providing for the purchase of a 60 percent equity interest in Jungwoo Metal Ind. Co., LTD (Jungwoo) for KRN 25 billion or approximately $22.0 million. Jungwoo is a manufacturer of copper-based pipe joining products headquartered in Seoul, South Korea and serves markets worldwide. The transaction was subject to certain closing conditions, including Korean regulatory approval, and was completed on April 26, 2016.
Long-Term Debt
The Company's credit agreementCompany’s Credit Agreement provides for an unsecured $200.0$350.0 million revolving credit facility (the Revolvingwhich matures on December 6, 2021. Total borrowings under the Credit Facility) and aAgreement were $200.0 million Term Loan Facility, both of which mature on December 11,at April 1, 2017. The Revolving Credit FacilityAgreement backed approximately $6.6$7.0 million in letters of credit at the end of the quarter.first quarter of 2017.
On March 23, 2016, Mueller-Xingrong entered into a new secured revolving credit arrangement with a total borrowing capacityThe Debentures distributed as part of RMB 150 million (or approximately $24.1 million). In addition, Mueller-Xingrong occasionally finances working capital through various accounts receivableour special dividend are subordinated to all other funded debt of the Company and bank draft discount arrangements. Borrowings are secured by the real property and equipment and bank draft receivables of Mueller-Xingrong and bear interestcallable, in whole or in part, at any time at the latest base-lending rate published byoption of the People's BankCompany, subject to declining call premiums during the first five years. The Debentures also grant each holder the right to require the Company to repurchase such holder’s Debentures in the event of China, which was 4.35 percenta change in control at declining repurchase premiums during the first five years. Interest is payable semiannually on September 1 and March 1, commencing September 1, 2017. Total Debentures outstanding as of April 2, 2016. Total borrowings at Mueller-Xingrong1, 2017 were $3.6 million as of April 2, 2016.$284.5 million.
As of April 2, 2016,1, 2017, the Company'sCompany’s total debt was $210.6$504.7 million or 19.249.9 percent of its total capitalization.
Covenants contained in the Company'sCompany’s financing obligations require, among other things, the maintenance of minimum levels of tangible net worth and the satisfaction of certain minimum financial ratios. As of April 2, 2016,1, 2017, the Company was in compliance with all of its debt covenants.
Share Repurchase Program
OurThe Company’s Board of Directors has extended, until October 2016,2017, its authorization to repurchase up to 20 million shares of the Company'sCompany’s common stock through open market transactions or through privately negotiated transactions. The Company hasWe have no obligation to repurchase any shares and may cancel, suspend, or extend the time period for the repurchase of shares at any time. Any repurchases will be funded primarily through existing cash and cash from operations. The CompanyWe may hold any shares repurchased in treasury or use a portion of the repurchased shares for employee benefit plans, as well as for other corporate purposes. From its initial authorization in 1999 through April 2, 2016,1, 2017, the Company has repurchased approximately 4.7 million shares under this authorization.
Contractual Cash Obligations
There have been no significant changes in the Company'sour contractual cash obligations reported at December 26, 201531, 2016 other than the aforementioned commitment to purchase Jungwoo for $22.0 million, which was funded duringdebt and interest payments on the second quarter of 2016.Debentures due in 2027.
Item 3. | Item 3. Quantitative and Qualitative Disclosures About Market Risk |
The Company is exposed to market risk from changes in raw material and energy costs, interest rates, and foreign currency exchange rates. To reduce such risks, the Companywe may periodically use financial instruments. Hedging transactions are authorized and executed pursuant to policies and procedures. Further, the Company doeswe do not buy or sell financial instruments for trading purposes.
Cost and Availability of Raw Materials and Energy
Raw materials, primarily copper and brass, represent the largest component of the Company'sCompany’s variable costs of production. The cost of these materials is subject to global market fluctuations caused by factors beyond our control. Significant increases in the cost of metal, to the extent not reflected in prices for ourthe Company’s finished products, or the lack of availability could materially and adversely affect our business, results of operations, and financial condition.
The Company occasionally enters into forwardfuture fixed-price arrangements with certain customers. We may utilize futures contracts to hedge risks associated with these forward fixed-price arrangements. We may also utilize futures contracts to manage price risk associated with inventory. Depending on the nature of the hedge, changes in the fair value of the futures contracts will either be offset against
the change in fair value of the inventory through earnings or recognized as a component of accumulated other comprehensive income (AOCI) and reflected in earnings upon the sale of inventory. Periodic value fluctuations of the contracts generally offset the value fluctuations of the underlying fixed-price transactions or inventory. At quarter-end,April 1, 2017, we held open futures contracts to purchase approximately $23.7$20.1 million of copper over the next nine months related to fixed-price sales orders and to sell approximately $20.8$38.6 million of copper over the next foursix months related to copper inventory.
We may enter into futures contracts or forward fixed-price arrangements with certain vendors to manage price risk associated with natural gas purchases. The effective portion of gains and losses with respect to futuresthese positions are deferred in equity as a component of AOCI and reflected in earnings upon consumption of natural gas. Periodic value fluctuations of the futures contracts generally offset the value fluctuations of the underlying natural gas prices. There wereAs of April 1, 2017, we held no open futures contracts to purchase natural gas at April 2, 2016.gas.
Interest Rates
At April 2, 2016, the Company1, 2017, we had variable-rate debt outstanding of $210.6$204.7 million. At thesethis borrowing levels,level, a hypothetical 10 percent increase in interest rates would have had an insignificant unfavorable impact on the Company'sour pretax earnings and cash flows. The primary interest rate exposures on floating-ratevariable-rate debt are based on LIBOR and the base-lending rate published by the People'sPeople’s Bank of China. There was no fixed rate debt outstanding as of April 2, 2016.
Included in the variable-rate debt outstanding is the Company'sCompany’s $200.0 million Term Loan FacilityCredit Agreement which bears interest based on LIBOR. We have reduced our exposure to increases in LIBOR by entering into interest rate swap contracts. These contracts have beenwere designated as cash flow hedges.hedges through December 2016, at which time the Company discontinued hedge accounting prospectively. The fair value of these contracts hashave been recorded in the Condensed Consolidated Balance Sheets, and the related gains and losses on the contracts arewere deferred in stockholders'stockholders’ equity as a component of AOCI.AOCI through December 2016, but are reported in current earnings subsequent to that date. Deferred gains or losses on the contracts will beare recognized in interest expense in the period in which the related interest payment being hedged is expensed.
Foreign Currency Exchange Rates
Foreign currency exposures arising from transactions include firm commitments and anticipated transactions denominated in a currency other than an entity'sentity’s functional currency. The Company and its subsidiaries generally enter into transactions denominated in their respective functional currencies. We may utilize certain futures or forward contracts with financial institutions to hedge foreign currency transactional exposures. Gains and losses with respect to these positions are deferred in equity as a component of AOCI and reflected in earnings upon collection of receivables or payment of commitments. At April 2, 2016, the Company1, 2017, we had open forward contracts with a financial institution to sell approximately 2.76.0 million euros, 8.121.5 million Swedish kronor, and 9.09.6 million Norwegian kroner through July 2016. It also held open forward contracts to buy approximately 2.7 million euros through November 2016.2017.
The Company'sCompany’s primary foreign currency exposure arises from foreign-denominated revenues and profits and their translation into U.S. dollars. The primary currencies to which we are exposed include the Canadian dollar, the British pound sterling, the euro, the Mexican peso, the South Korean won, and the Chinese renminbi. The Company generally views as long-term its investments in foreign subsidiaries with a functional currency other than the U.S. dollar as long-term.dollar. As a result, we generally do not hedge these net investments.
Cautionary Statement Regarding Forward Looking Information
This Quarterly Report contains various forward-looking statements and includes assumptions concerning the Company'sCompany’s operations, future results, and prospects. These forward-looking statements are based on current expectations and are subject to risk and uncertainties, and may be influenced by factors that could cause actual outcomes and results to be materially different from those predicted. The forward-looking statements reflect knowledge and information available as of the date of preparation of the Quarterly Report, and the Company undertakes no obligation to update these forward-looking statements. We identify the forward-looking statements by using the words "anticipates," "believes," "expects," "intends"“anticipates,” “believes,” “expects,” “intends” or similar expressions in such statements.
In connection with the "safe harbor"“safe harbor” provisions of the Private Securities Litigation Reform Act of 1995, the Company provides the following cautionary statement identifying important economic, political, and technological factors, among others, which could cause actual results or events to differ materially from those set forth in or implied by the forward-looking statements and related assumptions. In addition to those factors discussed under "Risk Factors"“Risk Factors” in thisthe Annual Report on Form 10-K for the year ended December 31, 2016, such factors include: (i) the current and projected future business environment, including interest rates and capital and consumer spending; (ii) the domestic housing and commercial construction industry environment; (iii) availability
and price fluctuations in commodities (including copper, natural gas, and other raw materials, including crude oil that indirectly affects plastic resins); (iv) competitive factors and competitor responses to the Company'sCompany’s initiatives; (v) stability of government laws and regulations, including taxes; (vi) availability of financing; and (vii) continuation of the environment to make acquisitions, domestic and foreign, including regulatory requirements and market values of candidates.
| Item 4. Controls and Procedures |
Evaluation of Disclosure Controls and Procedures
The Company maintains disclosure controls and procedures designed to ensure information required to be disclosed in Company reports filed under the Securities Exchange Act of 1934, as amended (the Exchange Act), is recorded, processed, summarized, and reported within the time periods specified in the SEC'sSEC’s rules and forms. Disclosure controls and procedures are designed to provide reasonable assurance that information required to be disclosed in Company reports filed under the Exchange Act is accumulated and communicated to management, including the Company'sCompany’s Chief Executive Officer and Chief Financial Officer, as appropriate, to allow timely decisions regarding required disclosure.
The Company'sCompany’s management, with the participation of the Company'sCompany’s Chief Executive Officer and Chief Financial Officer, has evaluated the effectiveness of the Company'sCompany’s disclosure controls and procedures pursuant to Rule 13a-15(e) of the Exchange Act as of April 2, 2016.1, 2017. Based on that evaluation, the Company'sCompany’s Chief Executive Officer and Chief Financial Officer have concluded that the Company'sCompany’s disclosure controls and procedures are effective as of April 2, 20161, 2017 to ensure that information required to be disclosed in Company reports filed under the Exchange Act is (i) recorded, processed, summarized and reported within the time periods specified in the SEC rules and forms and (ii) accumulated and communicated to management, including the Company'sCompany’s principal executive officer and principal financial officer, as appropriate to allow timely decisions regarding required disclosure.
Changes in Internal Control over Financial Reporting
There were no changes in the Company'sCompany’s internal control over financial reporting during itsthe Company’s fiscal quarter ending April 2, 2016,1, 2017, that have materially affected, or are reasonably likely to materially affect, the Company'sCompany’s internal control over financial reporting.
PART II | OTHER INFORMATION |
| PART II. OTHER INFORMATION Item 1. Legal Proceedings |
General
The Company is involved in certain litigation as a result of claims that arose in the ordinary course of business. Additionally, the Company may realize the benefit of certain legal claims and litigation in the future; these gain contingencies are not recognized in the Condensed Consolidated Financial Statements.
The Company is exposed to risk as it operates its businesses. To provide a framework to understand the operating environment of the Company, we have provided a brief explanation of the more significant risks associated with our businesses in our 20152016 Annual Report on Form 10-K. There have been no material changes in risk factors that were previously disclosed in our 20152016 Annual Report on Form 10-K.
Item 2. | Item 2. Unregistered Sales of Equity Securities and Use of Proceeds |
Issuer Purchases of Equity Securities
The Company'sCompany’s Board of Directors has extended, until October 2016,2017, its authorization to repurchase up to 20 million shares of the Company'sCompany’s common stock through open market transactions or through privately negotiated transactions. The Company has no obligation to repurchase any shares and may cancel, suspend, or extend the time period for the repurchase of shares at any time. Any repurchases will be funded primarily through existing cash and cash from operations. The Company may hold any shares repurchased in treasury or use a portion of the repurchased shares for employee benefit plans, as well as for other corporate purposes. From its initial authorization in 1999 through April 2, 2016,1, 2017, the Company had repurchased approximately 4.7 million shares under this authorization. Below is a summary of the Company'sCompany’s stock repurchases for the period ended April 2, 2016.
| | | (a) | | | | (b) | | | (c) | | | (d) | | |
| | | Total Number of Shares Purchased | | | | Average Price Paid per Share | | | Total Number of Shares Purchased as Part of Publicly Announced Plans or Programs | | | Maximum Number of Shares That May Yet Be Purchased Under the Plans or Programs | | |
| | | | | | | | | | | | | | | |
| | | | | | | | | | | | | | 15,287,060 | | (1) |
| | | | | | | | | | | | | | | | |
| December 27, 2015 – January 30, 2016 | | | — | | (2) | | $ | — | | | | — | | | | | | |
| | | | | | | | | | | | | | | | | | | |
| January 31 – February 27, 2016 | | | 1,013 | | (2) | | $ | 26.16 | | | | — | | | | | | |
| | | | | | | | | | | | | | | | | | | |
| February 28 – April 2, 2016 | | | 83,290 | | (2) | | $ | 20.77 | | | | — | | | | | | |
| | | | | | | | | | | | | | | | | | | |
| Total | | | 84,303 | | | | | | | | | | | | | | | |
| | | | | | | | | | | | | | | | | | | |
| (1) Shares available to be purchased under the Company's 20 million share repurchase authorization until October 2016. The extension of the authorization was announced on October 21, 2015. | |
| | | | | | | | | | | | | | | | | | | |
| (2) Shares tendered to the Company by holders of stock-based awards in payment of the purchase price and/or withholding taxes upon exercise and/or vesting. Also includes shares resulting from restricted stock forfeitures. | |
1, 2017.
INDEX |
| | | | | | | | | | | | | | |
| | | (a) Total Number of Shares Purchased | | (b) Average Price Paid per Share | | (c) Total Number of Shares Purchased as Part of Publicly Announced Plans or Programs | | (d) Maximum Number of Shares That May Yet Be Purchased Under the Plans or Programs | |
| | | | | | | | | | |
| | | | | | | | | 15,287,060 |
| (1) |
| January 1 - January 28, 2017 | | 1,135 |
| (2) | $ | 31.77 |
| | — |
| | |
| |
| January 29 - February 25, 2017 | | 135,471 |
| (2) | $ | 41.92 |
| | — |
| | |
| |
| February 26 - April 1, 2017 | | — |
| | $ | — |
| | — |
| | |
| |
(1) Shares available to be purchased under the Company’s 20 million share repurchase authorization until October 2017. The extension of the authorization was announced on October 27, 2016.
(2) Shares tendered to the Company by holders of stock-based awards in payment of the purchase price and/or withholding taxes upon exercise and/or vesting. Also includes shares resulting from restricted stock forfeitures.
Item 6. Exhibits
Item 6. | Exhibits
|
| 10.1 | Separation and Release Agreement, by and between the Company and Douglas J. Murdock, dated as of March 11, 2016 (Incorporated herein by reference to Exhibit 10.1 of the Regristrant's Current Report on Form 8-K, dated March 15, 2016). | |
| | | |
| 31.1 | Certification of Chief Executive Officer pursuant to Rule 13a-14(a) and Rule 15d-14(a) of the Securities Exchange Act of 1934, as amended. | |
| | | | |
| 31.2 | Certification of Chief Financial Officer pursuant to Rule 13a-14(a) and Rule 15d-14(a) of the Securities Exchange Act of 1934, as amended. | |
| | | | |
| 32.1 | Certification of Chief Executive Officer pursuant to 18 U.S.C. 1350, as adopted pursuant to Section 906 of the Sarbanes-Oxley Act of 2002. | |
| | | | |
| 32.2 | Certification of Chief Financial Officer pursuant to 18 U.S.C. 1350, as adopted pursuant to Section 906 of the Sarbanes-Oxley Act of 2002. | |
| | | | |
| 101.CAL | XBRL Taxonomy Extension Calculation Linkbase | |
| | | | |
| 101.DEF | XBRL Taxonomy Extension Definition Linkbase | |
| | | | |
| 101.INS | XBRL Instance Document | |
| | | | |
| 101.LAB | XBRL Taxonomy Extension Label Linkbase | |
| | | | |
| 101.PRE | XBRL Presentation Linkbase Document | |
| | | | |
| 101.SCH | XBRL Taxonomy Extension Schema | |
Items 3, 4, and 5 are not applicable and have been omitted.
SIGNATURES
Pursuant to the requirements of the Securities Exchange Act of 1934, the Registrant has duly caused this report to be signed on its behalf by the undersigned thereunto duly authorized.
|
| |
| | MUELLER INDUSTRIES, INC. |
| | |
| | |
| | /s/ Jeffrey A. Martin |
| | Jeffrey A. Martin |
April 27, 2016 26, 2017 | Chief Financial Officer and Treasurer |
| Date | (Principal Financial and Accounting Officer) |
| | |
| | |
| | /s/ Anthony J. Steinriede |
April 27, 2016 26, 2017 | Anthony J. Steinriede |
| Date | Vice President – Corporate Controller |
| | |
| |
| |
| |
| |
| |
| |
| |
| |
| |
29
|
| |
| EXHIBIT INDEX |
| | |
Exhibits | Description |
| | |
| 31.1 | Certification of Chief Executive Officer pursuant to Rule 13a-14(a) and Rule 15d-14(a) of the Securities Exchange Act of 1934, as amended. |
| | |
| 31.2 | Certification of Chief Financial Officer pursuant to Rule 13a-14(a) and Rule 15d-14(a) of the Securities Exchange Act of 1934, as amended. |
| | |
| 32.1 | Certification of Chief Executive Officer pursuant to 18 U.S.C. 1350, as adopted pursuant to Section 906 of the Sarbanes-Oxley Act of 2002. |
| | |
| 32.2 | Certification of Chief Financial Officer pursuant to 18 U.S.C. 1350, as adopted pursuant to Section 906 of the Sarbanes-Oxley Act of 2002. |
| | |
| 101.CAL | XBRL Taxonomy Extension Calculation Linkbase |
| | |
| 101.DEF | XBRL Taxonomy Extension Definition Linkbase |
| | |
| 101.INS | XBRL Instance Document |
| | |
| 101.LAB | XBRL Taxonomy Extension Label Linkbase |
| | |
| 101.PRE | XBRL Presentation Linkbase Document |
| | |
| 101.SCH | XBRL Taxonomy Extension Schema |