false--12-31Q22019truefalse00000915760.040.0250.0250.0250.025KEYCORP /NEW/10000000000010000000000040.40000.20000.21000.800000.17000.0300.01190.030200.01400.95750.78570.90400.03820.0240.03100.03130.01920.026343850000007600000082380000437500000062000000675500000.16780.14810.30000.15060.49002000000P0YP0Y111400000000210000000012567020811256702081000010000001000000100000010000000.01400.01280.00740.00250.00200.00500.02190.01310.30000.15950.38001911.000.9915100.00020.36709.0210.4920.02100.74621911.00100.00029.1340.500.023610700000013900000001000000100000010000001000000100000006780000003090000000710000000710000000400000024000000680000009900000030000003000000100000010000001000000200000050000006000000200000006700000091000000147000000000012.500.382813250.76562612.500.3828130.353125250.7656260.70625210005000004250004500000.15000.07000.09060.11540.07000.09260.03000.110.01000.0850.01170.08540.020.10.01000.0750.01130.07530.49390.08390.09170.62060.10950.12521000000100000023719894425358797300 0000091576 us-gaap:CreditRiskContractMemberFairValueMeasurementsNonrecurringMember 2020-06-30 0000091576 us-gaap:InterestRateContractMember key:CorporateServicesMemberConsumerMortgageIncomeMember 2019-04-01 2019-06-30
UNITED STATES
SECURITIES AND EXCHANGE COMMISSION
Washington D.C. 20549
FORM 10-Q
QUARTERLY REPORT PURSUANT TO SECTION 13 OR 15(d)
OF THE SECURITIES EXCHANGE ACT OF 1934
For the Quarterly Period Ended June 30, 20192020
Commission File Number 001-11302

Exact name of registrant as specified in its charter:
|
| |
| Ohio | 34-6542451 |
| State or other jurisdiction of incorporation or organization: | I.R.S. Employer Identification Number: |
|
| | | |
| 127 Public Square, | Cleveland, | Ohio | 44114-1306 |
| Address of principal executive offices: | Zip Code: |
(216) 689-3000
Registrant’s telephone number, including area code:
SECURITIES REGISTERED PURSUANT TO SECTION 12(b) OF THE ACT:
|
| | |
| Title of each class | Trading Symbol(s) | Name of each exchange on which registered |
| Common Shares, $1 par value | KEY | New York Stock Exchange |
| Depositary Shares (each representing a 1/40th interest in a share of Fixed-to-Floating Rate | KEY PrI | New York Stock Exchange |
| Perpetual Non-Cumulative Preferred Stock, Series E) | | |
| Depositary Shares (each representing a 1/40th interest in a share of Fixed Rate Perpetual Non- | KEY PrJ | New York Stock Exchange |
| Cumulative Preferred Stock, Series F) | | |
| Depositary Shares (each representing a 1/40th interest in a share of Fixed Rate Perpetual Non- | KEY PrK | New York Stock Exchange |
| Cumulative Preferred Stock, Series G) | | |
Indicate by check mark whether the registrant (1) has filed all reports required to be filed by Section 13 or 15(d) of the Securities Exchange Act of 1934 during the preceding 12 months (or for such shorter period that the registrant was required to file such reports), and (2) has been subject to such filing requirements for the past 90 days. Yes ☒ No ☐
Indicate by check mark whether the registrant has submitted electronically every Interactive Data File required to be submitted pursuant to Rule 405 of Regulation S-T (§232.405 of this chapter) during the preceding 12 months (or for such shorter period that the registrant was required to submit and such files). Yes ☒ No ☐
Indicate by check mark whether the registrant is a large accelerated filer, an accelerated filer, a non-accelerated filer, a smaller reporting company, or an emerging growth company. See the definitions of “large accelerated filer,” “accelerated filer,” “smaller reporting company,” and “emerging growth company” in Rule 12b-2 of the Exchange Act.
|
| | | | | |
| Large accelerated filer | ☒ | Accelerated filer | ☐ | Non-accelerated filer | ☐ |
| Smaller reporting company | ☐ | Emerging growth company | ☐ | | |
If an emerging growth company, indicate by check mark if the registrant has elected not to use the extended transition period for complying with any new or revised financial accounting standards provided pursuant to Section 13(a) of the Exchange Act. ☐
Indicate by check mark whether the registrant is a shell company (as defined in Rule 12b-2 of the Exchange Act). Yes ☐ No ☒
Indicate the number of shares outstanding of each of the issuer’s classes of common stock, as of the latest practicable date.
|
| |
| Common Shares with a par value of $1 each | 1,003,258,801975,999,979 shares |
| Title of class | Outstanding at July 29, 201930, 2020 |
KEYCORP
TABLE OF CONTENTS
PART I. FINANCIAL INFORMATION
|
| | |
| | PART II. OTHER INFORMATION | |
| Item 1. | | |
| Item 1A. | | |
| Item 2. | | |
| Item 6. | | |
| | | |
PART I. FINANCIAL INFORMATION
Item 2. Management’s Discussion & Analysis of Financial Condition & Results of Operations
Introduction
This section reviews the financial condition and results of operations of KeyCorp and its subsidiaries for the quarterly periods ended June 30, 2019,2020, and June 30, 2018.2019. Some tables may include additional periods to comply with disclosure requirements or to illustrate trends in greater depth. When you read this discussion, you should also refer to the consolidated financial statements and related notes in this report. The page locations of specific sections and notes that we refer to are presented in the Table of Contents.
References to our “2018“2019 Form 10-K” refer to our Form 10-K for the year ended December 31, 2018,2019, which has been filed with the SEC and is available on its website (www.sec.gov) and on our website (www.key.com/ir).
Terminology
Throughout this discussion, references to “Key,” “we,” “our,” “us,” and similar terms refer to the consolidated entity consisting of KeyCorp and its subsidiaries. “KeyCorp” refers solely to the parent holding company, and “KeyBank” refers to KeyCorp’s subsidiary bank, KeyBank National Association.
We want to explain some industry-specific terms at the outset so you can better understand the discussion that follows.
| |
| • | We use the phrase continuing operations in this document to mean all of our businesses other than our government-guaranteed and private education lending businessesbusiness and Austin.Austin Capital Management, Ltd. The government-guaranteed and private education lending business and Austin Capital Management, Ltd. have been accounted for as discontinued operations since 2009. |
| |
| • | We engage in capital markets activities primarily through business conducted by our Commercial Bank segment. These activities encompass a variety of products and services. Among other things, we trade securities as a dealer, enter into derivative contracts (both to accommodate clients’ financing needs and to mitigate certain risks), and conduct transactions in foreign currencies (both to accommodate clients’ needs and to benefit from fluctuations in exchange rates). |
| |
| • | For regulatory purposes, capital is divided into two classes. Federal regulations currently prescribe that at least one-half of a bank or BHC’s total risk-based capital must qualify as Tier 1 capital. Both total and Tier 1 capital serve as bases for several measures of capital adequacy, which is an important indicator of financial stability and condition. Banking regulators evaluate a component of Tier 1 capital, known as Common Equity Tier 1, under the Regulatory Capital Rules. The “Capital” section of this report under the heading “Capital adequacy” provides more information on total capital, Tier 1 capital, and the Regulatory Capital Rules, including Common Equity Tier 1, and describes how these measures are calculated. |
The acronyms and abbreviations identified below are used in the Management’s Discussion & Analysis of Financial Condition & Results of Operations as well as in the Notes to Consolidated Financial Statements (Unaudited). You may find it helpful to refer back to this page as you read this report.
|
| |
| ALCO: Asset/Liability Management Committee. | KBCM: KeyBanc Capital Markets, Inc.ISDA: International Swaps and Derivatives |
| ALLL: Allowance for loan and lease losses. | KCC: Key Capital Corporation.Association. |
| A/LM: Asset/liability management. | KCDC: Key Community Development Corporation. |
| AOCI: Accumulated other comprehensive income (loss). | KEF: Key Equipment Finance. |
APBO: Accumulated postretirement benefit obligation.ARRC: Alternative Reference Rates Committee. | KEF: Key Equipment Finance.LGD: Loss given default. |
| ASC: Accounting Standards Codification. | KIBS: Key Insurance & Benefits Services, Inc. |
Austin: Austin Capital Management, Ltd. | KMS: Key Merchant Services, LLC.LIBOR: London Interbank Offered Rate. |
| BHCs: Bank holding companies. | KPP: Key Principal Partners.LIHTC: Low-income housing tax credit. |
| Board: KeyCorp Board of Directors. | KREEC: Key Real Estate Equity Capital, Inc. |
Cain Brothers: Cain Brothers & Company, LLC. | LCR: Liquidity coverage ratio.LTV: Loan-to-value. |
| CCAR: Comprehensive Capital Analysis and Review. | LIBOR: London Interbank Offered Rate.Moody’s: Moody’s Investor Services, Inc. |
| CECL: Current expected credit losses. | MRC: Market Risk Committee. |
| CMBS: Commercial mortgage-backed securities. | LIHTC: Low-income housing tax credit. |
CME: Chicago Mercantile Exchange. | LTV: Loan-to-value.MRM: Market Risk Management group. |
| CMO: Collateralized mortgage obligation. | Moody’s: Moody’s Investor Services, Inc.N/A: Not applicable. |
| Common Shares: KeyCorp common shares, $1 par value. | MRC: Market Risk Committee.NAV: Net asset value. |
DIF: Deposit Insurance Fund of the FDIC.DCF: Discounted cash flow. | MRM: Market Risk Management group.N/M: Not meaningful. |
| Dodd-Frank Act: Dodd-Frank Wall Street Reform and | N/A: Not applicable.NMTC: New market tax credit. |
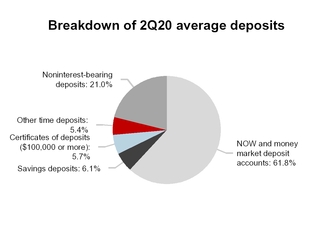
| Consumer Protection Act of 2010. | NAV: Net asset value.NOW: Negotiable Order of Withdrawal. |
| EAD: Exposure at default. | NYSE: New York Stock Exchange. |
| EBITDA: Earnings before interest, taxes, depreciation, and | N/M: Not meaningful. |
amortization. | NMTC: New market tax credit. |
EPS: Earnings per share. | NOW: Negotiable Order of Withdrawal. |
ERISA: Employee Retirement Income Security Act of 1974. | NPR: Notice of proposed rulemaking. |
ERM: Enterprise risk management. | NYSE: New York Stock Exchange. |
EVE: Economic value of equity. | OCC: Office of the Comptroller of the Currency. |
FASB: Financial Accounting Standards Board.amortization. | OCI: Other comprehensive income (loss). |
| EPS: Earnings per share. | OREO: Other real estate owned. |
| ERM: Enterprise risk management. | PBO: Projected benefit obligation. |
| EVE: Economic value of equity. | PCD: Purchased credit deteriorated. |
| FASB: Financial Accounting Standards Board. | PCI: Purchased credit impaired. |
| FDIC: Federal Deposit Insurance Corporation. | OREO: Other real estate owned.PD: Probability of default. |
| Federal Reserve: Board of Governors of the Federal | OTTI: Other-than-temporary impairment.PPP: Paycheck Protection Program. |
| Reserve System. | PBO: Projected benefit obligation. |
FHLB: Federal Home Loan Bank of Cincinnati. | PCI: Purchased credit impaired. |
FHLMC: Federal Home Loan Mortgage Corporation. | RMBS: Residential mortgage-backed securities. |
FICO: Fair Isaac Corporation. | S&P: Standard and Poor’s Ratings Services, |
First Niagara: First Niagara Financial Group, Inc.FHLB: Federal Home Loan Bank of Cincinnati. | a Division of The McGraw-Hill Companies, Inc. |
FNMA:FHLMC: Federal NationalHome Loan Mortgage Association, or FannieCorporation. | SEC: U.S. Securities and Exchange Commission. |
Mae.FICO: Fair Isaac Corporation. | TCJ Act: Tax Cuts and Jobs Act.SOFR: Secured Overnight Financing Rate. |
FSOC: Financial Stability Oversight Council.FNMA: Federal National Mortgage Association, or Fannie | TDR: Troubled debt restructuring. |
| Mae. | TE: Taxable-equivalent. |
| GAAP: U.S. generally accepted accounting principles. | TE: Taxable-equivalent. |
GNMA: Government National Mortgage Association, or | U.S. Treasury: United States Department of the |
Ginnie Mae.GNMA: Government National Mortgage Association, or | Treasury. |
HelloWallet: HelloWallet, LLC.Ginnie Mae. | VaR: Value at risk. |
| HTC: Historic tax credit. | VEBA: Voluntary Employee Beneficiary Association. |
ISDA: International Swaps and Derivatives Association. | VIE: Variable interest entity. |
KAHC: Key Affordable Housing Corporation. | |
Forward-looking statements
From time to time, we have made or will make forward-looking statements within the meaning of the Private Securities Litigation Reform Act of 1995. These statements do not relate strictly to historical or current facts. Forward-looking statements usually can be identified by the use of words such as “goal,” “objective,” “plan,” “expect,” “assume,” “anticipate,” “intend,” “project,” “believe,” “estimate,” or other words of similar meaning. Forward-looking statements provide our current expectations or forecasts of future events, circumstances, results or aspirations. Our disclosures in this report contain forward-looking statements. We may also make forward-looking
statements in other documents filed with or furnished to the SEC. In addition, we may make forward-looking statements orally to analysts, investors, representatives of the media, and others.
Forward-looking statements, by their nature, are subject to assumptions, risks, and uncertainties, many of which are outside of our control. Our actual results may differ materially from those set forth in our forward-looking statements. There is no assurance that any list of risks and uncertainties or risk factors is complete. Factors that could cause our actual results to differ from those described in forward-looking statements include, but are not limited to:
our concentrated credit exposure in commercial and industrial loans;
deterioration of commercial real estate market fundamentals;
defaults by our loan counterparties or clients;
adverse changes in credit quality trends;
declining asset prices;
our concentrated credit exposure in commercial and industrial loans;
the extensive regulation of the U.S. financial services industry;
changes in accounting policies, standards, and interpretations;
operational or risk management failures by us or critical third parties;
breaches of security or failures of our technology systems due to technological or other factors and
cybersecurity threats;
negative outcomes from claims or litigation;
failure or circumvention of our controls and procedures;
the occurrence of natural or man-made disasters, global pandemics, conflicts, or terrorist attacks, or other adverse external
events;
evolving capital and liquidity standards under applicable regulatory rules;
disruption of the U.S. financial system;
our ability to receive dividends from our subsidiaries, including KeyBank;
unanticipated changes in our liquidity position, including but not limited to, changes in our access to or the cost
of funding and our ability to secure alternative funding sources;
downgrades in our credit ratings or those of KeyBank;
a reversal of the U.S. economic recovery due to financial, political or other shocks;
our ability to anticipate interest rate changes and manage interest rate risk;
uncertainty regardingsurrounding the future of LIBOR;transition from LIBOR to an alternative reference rate;
deterioration of economic conditions in the U.S. and the geographic regions where we operate;
the soundness of other financial institutions;
tax reform and other changes in tax laws, including the impact of the TCJ Act;
our ability to attract and retain talented executives and employees and to manage our reputational risks;
our ability to timely and effectively implement our strategic initiatives;
increased competitive pressure;
our ability to adapt our products and services to industry standards and consumer preferences;
unanticipated adverse effects of strategic partnerships or acquisitions and dispositions of assets or businesses;
our ability to realize the anticipated benefits of the First Niagara merger; and
our ability to develop and effectively use the quantitative models we rely upon in our business planning.planning; and
the impact of the COVID-19 global pandemic.
Any forward-looking statements made by us or on our behalf speak only as of the date they are made, and we do not undertake any obligation to update any forward-looking statement to reflect the impact of subsequent events or circumstances. Before making an investment decision, you should carefully consider all risks and uncertainties disclosed in our 20182019 Form 10-K and any subsequent reports filed with the SEC by Key, including the additional risk factors disclosed in Part II, Item 1A. of our First Quarter 2020 Form 10-Q, as well as our registration statements under the Securities Act of 1933, as amended, all of which are or will upon filing be accessible on the SEC’s website at www.sec.gov and on our website at www.key.com/ir.
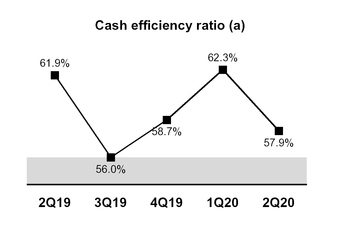
Long-term financial targets
| |
| (a) | See the section entitled “GAAP to Non-GAAP Reconciliations,” which presents the computations of certain financial measures related to “cash efficiency.” The section includes tables that reconcile the GAAP performance measures to the corresponding non-GAAP measures, which provides a basis for period-to-period comparisons. |
| |
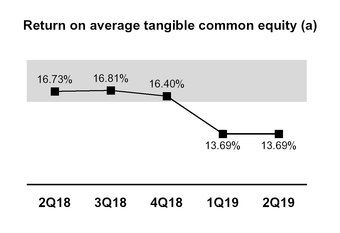
| (a) | See the section entitled “GAAP to Non-GAAP Reconciliations,” which presents the computations of certain financial measures related to “tangible common equity.” The section includes tables that reconcile the GAAP performance measures to the corresponding non-GAAP measures, which provides a basis for period-to-period comparisons. |
Positive Operating Leverage
Generate positive operating leverage and a cash efficiency ratio in the range of 54.0% to 56.0%.
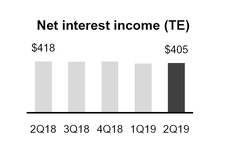
We saw solid revenue trends duringOur strong results for the second quarter of 2019, reflecting balance sheet growth2020 are attributable to the resiliency and momentum in our fee-based businesses. We also have realized substantially alldedication of our $200 million in cost savings.team and their commitment to serving our clients. We expect to reachgenerated positive operating leverage compared with the year-ago quarter. Revenue was up 7% from the year-ago quarter primarily driven by our targeted cash efficiency ratio rangeconsumer mortgage business which had a record level of 54.0% to 56.0%loan originations and related fees in the second halfquarter of 2019.
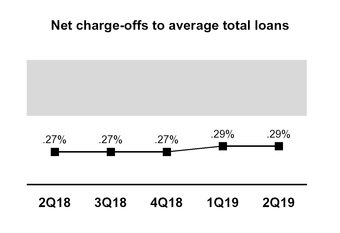
Moderate Risk Profile
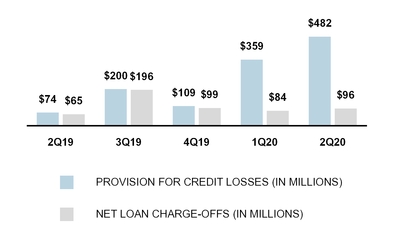
Maintain a moderate risk profile by targeting a net loan charge-offs to average loans ratio in the range of .40% to .60% through a credit cycle.
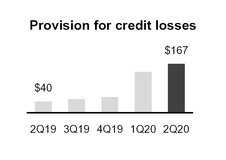
DuringThe economic outlook continues to be challenging as we update our outlook for the second quarterexpected impact of 2019,the pandemic. We updated our CECL forecast to incorporate a more severe downturn in economic activity with a recovery beginning later this year. Despite the build in our ALLL, our credit quality metrics remained strong, with net loan charge-offs to average total loans ratio remained below our targeted range. We continue to remain consistent and disciplined in our credit underwriting and portfolio management and are committed to maintaining our moderate risk profile in 2019.with prior quarter.
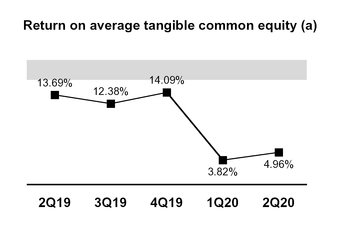
Financial Return
A return on average tangible common equity in the range of 16.00% to 19.00%.
DuringOur ratios this quarter reflected the second quarterimpact of 2019,balance sheet growth, provision build, and improving earnings. We announced on March 17, 2020, that we repurchased $180 million of Common Shares. On April 18, 2019, we announced our 2019 capital plan which includes $1.0 billion ofwould be temporarily suspending Common Share repurchases beginningrepurchase activity in response to the third quarter of 2019.pandemic. Our 2019 capital plan also includes a 9% increasetarget was established to provide sufficient capital to operate in our Common Stock dividend to $.185 per Common Share, which was approved by our Board of Directors on July 17, 2019.stressed environments. We remain committed to consistently delivering on our stated priorities of supporting organic growth, increasing dividends,continuing our strong dividend, and prudently repurchasing Common Shares.
Selected financial data
Our financial performance for each of the last five quarters is summarized in Figure 1.
Figure 1. Selected Financial Data | | | | 2019 | | 2018 | | Six months ended June 30, | 2020 | | 2019 | | Six months ended June 30, |
| dollars in millions, except per share amounts | Second |
| First |
| | Fourth |
| Third |
| Second |
| | 2019 |
| 2018 |
| Second |
| First |
| | Fourth |
| Third |
| Second |
| | 2020 |
| 2019 |
|
| FOR THE PERIOD | | | | | | | | | | | | |
| Interest income | $ | 1,329 |
| $ | 1,304 |
| | $ | 1,297 |
| $ | 1,239 |
| $ | 1,205 |
| | $ | 2,633 |
| $ | 2,342 |
| $ | 1,190 |
| $ | 1,251 |
| | $ | 1,285 |
| $ | 1,317 |
| $ | 1,329 |
| | $ | 2,441 |
| $ | 2,633 |
|
| Interest expense | 348 |
| 327 |
| | 297 |
| 253 |
| 226 |
| | 675 |
| 419 |
| 172 |
| 270 |
| | 306 |
| 345 |
| 348 |
| | 442 |
| 675 |
|
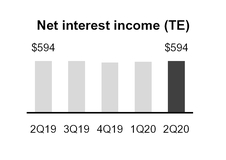
| Net interest income | 981 |
| 977 |
| | 1,000 |
| 986 |
| 979 |
| | 1,958 |
| 1,923 |
| 1,018 |
| 981 |
| | 979 |
| 972 |
| 981 |
| | 1,999 |
| 1,958 |
|
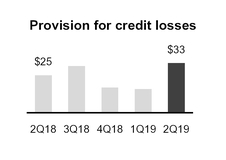
| Provision for credit losses | 74 |
| 62 |
| | 59 |
| 62 |
| 64 |
| | 136 |
| 125 |
| 482 |
| 359 |
| | 109 |
| 200 |
| 74 |
| | 841 |
| 136 |
|
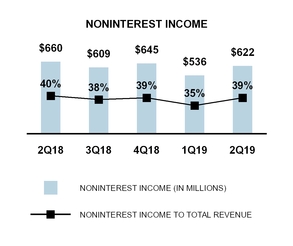
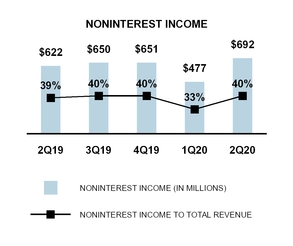
| Noninterest income | 622 |
| 536 |
| | 645 |
| 609 |
| 660 |
| | 1,158 |
| 1,261 |
| 692 |
| 477 |
| | 651 |
| 650 |
| 622 |
| | 1,169 |
| 1,158 |
|
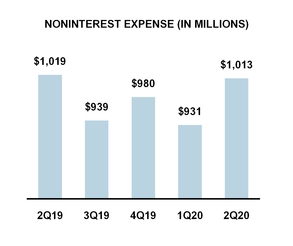
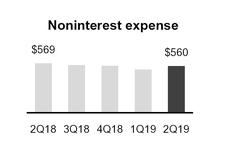
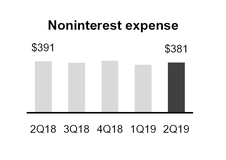
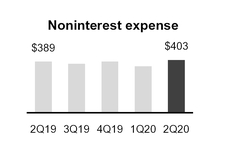
| Noninterest expense | 1,019 |
| 963 |
| | 1,012 |
| 964 |
| 993 |
| | 1,982 |
| 1,999 |
| 1,013 |
| 931 |
| | 980 |
| 939 |
| 1,019 |
| | 1,944 |
| 1,982 |
|
| Income (loss) from continuing operations before income taxes | 510 |
| 488 |
| | 574 |
| 569 |
| 582 |
| | 998 |
| 1,060 |
| 215 |
| 168 |
| | 541 |
| 483 |
| 510 |
| | 383 |
| 998 |
|
| Income (loss) from continuing operations attributable to Key | 423 |
| 406 |
| | 482 |
| 482 |
| 479 |
| | 829 |
| 895 |
| 185 |
| 145 |
| | 466 |
| 413 |
| 423 |
| | 330 |
| 829 |
|
| Income (loss) from discontinued operations, net of taxes | 2 |
| 1 |
| | 2 |
| — |
| 3 |
| | 3 |
| 5 |
| 2 |
| 1 |
| | 3 |
| 3 |
| 2 |
| | 3 |
| 3 |
|
| Net income (loss) attributable to Key | 425 |
| 407 |
| | 484 |
| 482 |
| 482 |
| | 832 |
| 900 |
| 187 |
| 146 |
| | 469 |
| 416 |
| 425 |
| | 333 |
| 832 |
|
| Income (loss) from continuing operations attributable to Key common shareholders | 403 |
| 386 |
| | 459 |
| 468 |
| 464 |
| | 789 |
| 866 |
| 159 |
| 118 |
| | 439 |
| 383 |
| 403 |
| | 277 |
| 789 |
|
| Income (loss) from discontinued operations, net of taxes | 2 |
| 1 |
| | 2 |
| — |
| 3 |
| | 3 |
| 5 |
| 2 |
| 1 |
| | 3 |
| 3 |
| 2 |
| | 3 |
| 3 |
|
| Net income (loss) attributable to Key common shareholders | 405 |
| 387 |
| | 461 |
| 468 |
| 467 |
| | 792 |
| 871 |
| 161 |
| 119 |
| | 442 |
| 386 |
| 405 |
| | 280 |
| 792 |
|
| PER COMMON SHARE | | | | | | | | | | |
| Income (loss) from continuing operations attributable to Key common shareholders | $ | .40 |
| $ | .38 |
| | $ | .45 |
| $ | .45 |
| $ | .44 |
| | $ | .79 |
| $ | .82 |
| $ | .16 |
| $ | .12 |
| | $ | .45 |
| $ | .39 |
| $ | .40 |
| | $ | .29 |
| $ | .79 |
|
| Income (loss) from discontinued operations, net of taxes | — |
| — |
| | — |
| — |
| — |
| | — |
| — |
| — |
| — |
| | — |
| — |
| — |
| | — |
| — |
|
Net income (loss) attributable to Key common shareholders (a) | .40 |
| .38 |
| | .45 |
| .45 |
| .44 |
| | .79 |
| .82 |
| .17 |
| .12 |
| | .45 |
| .39 |
| .40 |
| | .29 |
| .79 |
|
| Income (loss) from continuing operations attributable to Key common shareholders — assuming dilution | .40 |
| .38 |
| | .45 |
| .45 |
| .44 |
| | .78 |
| .81 |
| .16 |
| .12 |
| | .45 |
| .38 |
| .40 |
| | .28 |
| .78 |
|
| Income (loss) from discontinued operations, net of taxes — assuming dilution | — |
| — |
| | — |
| — |
| — |
| | — |
| — |
| — |
| — |
| | — |
| — |
| — |
| | — |
| — |
|
Net income (loss) attributable to Key common shareholders — assuming dilution (a) | .40 |
| .38 |
| | .45 |
| .45 |
| .44 |
| | .78 |
| .81 |
| .17 |
| .12 |
| | .45 |
| .39 |
| .40 |
| | .29 |
| .78 |
|
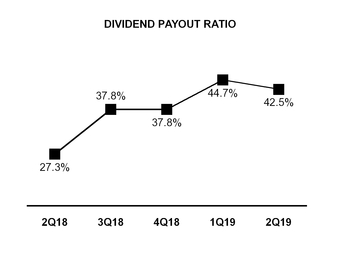
| Cash dividends paid | .17 |
| .17 |
| | .17 |
| .17 |
| .120 |
| | .340 |
| .225 |
| .185 |
| .185 |
| | .185 |
| .185 |
| .17 |
| | .370 |
| .34 |
|
| Book value at period end | 15.07 |
| 14.31 |
| | 13.90 |
| 13.33 |
| 13.29 |
| | 15.07 |
| 13.29 |
| 16.07 |
| 15.95 |
| | 15.54 |
| 15.44 |
| 15.07 |
| | 16.07 |
| 15.07 |
|
| Tangible book value at period end | 12.12 |
| 11.55 |
| | 11.14 |
| 10.59 |
| 10.59 |
| | 12.12 |
| 10.59 |
| 13.12 |
| 12.98 |
| | 12.56 |
| 12.48 |
| 12.12 |
| | 13.12 |
| 12.12 |
|
| Weighted-average common shares outstanding (000) | 999,163 |
| 1,006,717 |
| | 1,018,614 |
| 1,036,479 |
| 1,052,652 |
| | 1,003,047 |
| 1,054,378 |
| 967,147 |
| 967,446 |
| | 973,450 |
| 988,319 |
| 999,163 |
| | 967,380 |
| 1,003,047 |
|
Weighted-average common shares and potential common shares outstanding (000) (b) | 1,007,964 |
| 1,016,504 |
| | 1,030,417 |
| 1,049,976 |
| 1,065,793 |
| | 1,012,365 |
| 1,068,939 |
| 972,141 |
| 976,110 |
| | 984,361 |
| 998,328 |
| 1,007,964 |
| | 974,272 |
| 1,012,365 |
|
| AT PERIOD END | | | | | | | | | | |
| Loans | $ | 91,937 |
| $ | 90,178 |
| | $ | 89,552 |
| $ | 89,268 |
| $ | 88,222 |
| | $ | 91,937 |
| $ | 88,222 |
| $ | 106,159 |
| $ | 103,198 |
| | $ | 94,646 |
| $ | 92,760 |
| $ | 91,937 |
| | $ | 106,159 |
| $ | 91,937 |
|
| Earning assets | 130,213 |
| 127,296 |
| | 125,803 |
| 125,007 |
| 123,472 |
| | 130,213 |
| 123,472 |
| 156,177 |
| 141,333 |
| | 130,807 |
| 132,160 |
| 130,213 |
| | 156,177 |
| 130,213 |
|
| Total assets | 144,545 |
| 141,515 |
| | 139,613 |
| 138,805 |
| 137,792 |
| | 144,545 |
| 137,792 |
| 171,192 |
| 156,197 |
| | 144,988 |
| 146,691 |
| 144,545 |
| | 171,192 |
| 144,545 |
|
| Deposits | 109,946 |
| 108,175 |
| | 107,309 |
| 105,780 |
| 104,548 |
| | 109,946 |
| 104,548 |
| 135,513 |
| 115,304 |
| | 111,870 |
| 111,649 |
| 109,946 |
| | 135,513 |
| 109,946 |
|
| Long-term debt | 14,312 |
| 14,168 |
| | 13,732 |
| 13,849 |
| 13,853 |
| | 14,312 |
| 13,853 |
| 13,734 |
| 13,732 |
| | 12,448 |
| 14,470 |
| 14,312 |
| | 13,734 |
| 14,312 |
|
| Key common shareholders’ equity | 15,069 |
| 14,474 |
| | 14,145 |
| 13,758 |
| 14,075 |
| | 15,069 |
| 14,075 |
| 15,642 |
| 15,511 |
| | 15,138 |
| 15,216 |
| 15,069 |
| | 15,642 |
| 15,069 |
|
| Key shareholders’ equity | 16,969 |
| 15,924 |
| | 15,595 |
| 15,208 |
| 15,100 |
| | 16,969 |
| 15,100 |
| 17,542 |
| 17,411 |
| | 17,038 |
| 17,116 |
| 16,969 |
| | 17,542 |
| 16,969 |
|
| PERFORMANCE RATIOS — FROM CONTINUING OPERATIONS | | | | | | | | | | |
| Return on average total assets | 1.19 | % | 1.18 | % | | 1.37 | % | 1.40 | % | 1.41 | % | | 1.18 | % | 1.33 | % | .45 | % | .40 | % | | 1.27 | % | 1.14 | % | 1.19 | % | | .43 | % | 1.18 | % |
| Return on average common equity | 10.94 |
| 10.98 |
| | 13.07 |
| 13.36 |
| 13.29 |
| | 10.96 |
| 12.53 |
| 4.05 |
| 3.10 |
| | 11.40 |
| 9.99 |
| 10.94 |
| | 3.58 |
| 10.96 |
|
Return on average tangible common equity (c) | 13.69 |
| 13.69 |
| | 16.40 |
| 16.81 |
| 16.73 |
| | 13.69 |
| 15.82 |
| 4.96 |
| 3.82 |
| | 14.09 |
| 12.38 |
| 13.69 |
| | 4.40 |
| 13.69 |
|
| Net interest margin (TE) | 3.06 |
| 3.13 |
| | 3.16 |
| 3.18 |
| 3.19 |
| | 3.10 |
| 3.17 |
| 2.76 |
| 3.01 |
| | 2.98 |
| 3.00 |
| 3.06 |
| | 2.88 |
| 3.10 |
|
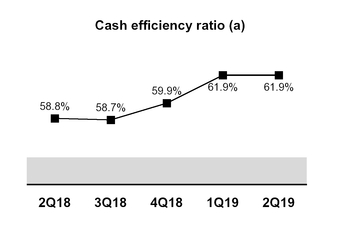
Cash efficiency ratio (c) | 61.9 |
| 61.9 |
| | 59.9 |
| 58.7 |
| 58.8 |
| | 61.9 |
| 60.8 |
| 57.9 |
| 62.3 |
| | 58.7 |
| 56.0 |
| 61.9 |
| | 60.0 |
| 61.9 |
|
| PERFORMANCE RATIOS — FROM CONSOLIDATED OPERATIONS | | | | | | | | | | |
| Return on average total assets | 1.19 | % | 1.17 | % | | 1.37 | % | 1.39 | % | 1.40 | % | | 1.18 | % | 1.33 | % | .46 | % | .40 | % | | 1.27 | % | 1.14 | % | 1.19 | % | | .43 | % | 1.18 | % |
| Return on average common equity | 11.00 |
| 11.01 |
| | 13.13 |
| 13.36 |
| 13.37 |
| | 11.01 |
| 12.60 |
| 4.10 |
| 3.12 |
| | 11.48 |
| 10.07 |
| 11.00 |
| | 3.62 |
| 11.01 |
|
Return on average tangible common equity (c) | 13.75 |
| 13.72 |
| | 16.47 |
| 16.81 |
| 16.84 |
| | 13.74 |
| 15.91 |
| 5.02 |
| 3.86 |
| | 14.19 |
| 12.48 |
| 13.75 |
| | 4.45 |
| 13.74 |
|
| Net interest margin (TE) | 3.05 |
| 3.12 |
| | 3.14 |
| 3.16 |
| 3.17 |
| | 3.08 |
| 3.15 |
| 2.76 |
| 3.00 |
| | 2.97 |
| 2.98 |
| 3.05 |
| | 2.87 |
| 3.08 |
|
Loan-to-deposit (d) | 86.1 |
| 85.1 |
| | 85.6 |
| 87.0 |
| 86.9 |
| | 86.1 |
| 86.9 |
| 80.4 |
| 92.1 |
| | 86.6 |
| 85.3 |
| 86.1 |
| | 80.4 |
| 86.1 |
|
| CAPITAL RATIOS AT PERIOD END | | | | | | | | | | |
| Key shareholders’ equity to assets | 11.74 | % | 11.25 | % | | 11.17 | % | 10.96 | % | 10.96 | % | | 11.74 | % | 10.96 | % | 10.2 | % | 11.1 | % | | 11.8 | % | 11.7 | % | 11.7 | % | | 10.2 | % | 11.7 | % |
| Key common shareholders’ equity to assets | 10.46 |
| 10.25 |
| | 10.15 |
| 9.93 |
| 10.21 |
| | 10.46 |
| 10.21 |
| 9.2 |
| 10.0 |
| | 10.5 |
| 10.4 |
| 10.5 |
| | 9.2 |
| 10.5 |
|
Tangible common equity to tangible assets (c) | 8.59 |
| 8.43 |
| | 8.30 |
| 8.05 |
| 8.32 |
| | 8.59 |
| 8.32 |
| 7.6 |
| 8.3 |
| | 8.6 |
| 8.6 |
| 8.6 |
| | 7.6 |
| 8.6 |
|
| Common Equity Tier 1 | 9.57 |
| 9.81 |
| | 9.93 |
| 9.95 |
| 10.13 |
| | 9.57 |
| 10.13 |
| 9.1 |
| 8.9 |
| | 9.4 |
| 9.5 |
| 9.6 |
| | 9.1 |
| 9.6 |
|
| Tier 1 risk-based capital | 11.01 |
| 10.94 |
| | 11.08 |
| 11.11 |
| 10.95 |
| | 11.01 |
| 10.95 |
| 10.5 |
| 10.2 |
| | 10.9 |
| 10.9 |
| 11.0 |
| | 10.5 |
| 11.0 |
|
| Total risk-based capital | 13.03 |
| 12.98 |
| | 12.89 |
| 12.99 |
| 12.83 |
| | 13.03 |
| 12.83 |
| 12.8 |
| 12.2 |
| | 12.8 |
| 12.9 |
| 13.0 |
| | 12.8 |
| 13.0 |
|
| Leverage | 10.00 |
| 9.89 |
| | 9.89 |
| 10.03 |
| 9.87 |
| | 10.00 |
| 9.87 |
| 8.8 |
| 9.8 |
| | 9.9 |
| 9.9 |
| 10.0 |
| | 8.8 |
| 10.0 |
|
| TRUST ASSETS | | | | | | | | | | |
| Assets under management | $ | 38,942 |
| $ | 38,742 |
| | $ | 36,775 |
| $ | 40,575 |
| $ | 39,663 |
| | $ | 38,942 |
| $ | 39,663 |
| $ | 39,722 |
| $ | 36,189 |
| | $ | 40,833 |
| $ | 39,416 |
| $ | 38,942 |
| | $ | 39,722 |
| $ | 38,942 |
|
| OTHER DATA | | | | | | | | | | |
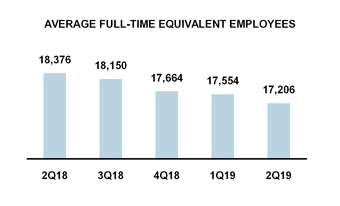
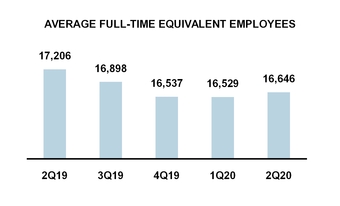
| Average full-time-equivalent employees | 17,206 |
| 17,554 |
| | 17,664 |
| 18,150 |
| 18,376 |
| | 17,379 |
| 18,458 |
| 16,646 |
| 16,529 |
| | 16,537 |
| 16,898 |
| 17,206 |
| | 16,587 |
| 17,379 |
|
| Branches | 1,102 |
| 1,158 |
| | 1,159 |
| 1,166 |
| 1,177 |
| | 1,102 |
| 1,177 |
| 1,077 |
| 1,082 |
| | 1,098 |
| 1,101 |
| 1,102 |
| | 1,077 |
| 1,102 |
|
| |
| (a) | EPS may not foot due to rounding. |
| |
| (b) | Assumes conversion of Common Share options and other stock awards and/or convertible preferred stock, as applicable. |
| |
| (c) | See the section entitled “GAAP to Non-GAAP Reconciliations,” which presents the computations of certain financial measures related to “tangible common equity” and “cash efficiency.” The section includes tables that reconcile the GAAP performance measures to the corresponding non-GAAP measures, which provides a basis for period-to-period comparisons. |
| |
| (d) | Represents period-end consolidated total loans and loans held for sale divided by period-end consolidated total deposits. |
Strategic developments
Our actionsThe second quarter of 2020 continued to pose unprecedented challenges given the impacts from the COVID-19 pandemic and results duringwidespread disruption to people’s lives in the economy. We have remained committed to supporting our employees, our communities, and our clients through these difficult times. Providing value to all stakeholders creates the foundation to deliver sustainable long-term performance. The corporate governance processes that we have in place allow us to oversee any changes and new requirements that may occur across our geographic footprint. Additionally, our strong financial performance in the second quarter of 2019 supported our corporate strategy described indemonstrated the “Introduction” section under the “Corporate strategy” heading on page 39resiliency of our 2018 Form 10-K.team and business, the strength of our balance sheet, and our strong risk management practices. Here are just a few of the ways we have continued to respond to this unprecedented situation and some of the ways we plan to operate going forward:
| |
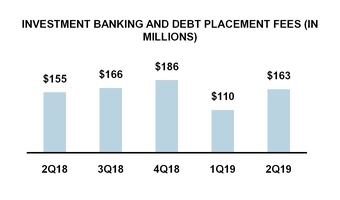
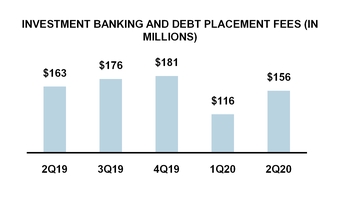
| • | WeOur business resiliency plans remained in effect and we maintained our operational effectiveness across the entire organization. The health and safety of our clients, employees, and communities in which we operate have continued to make progress duringbe our top priority. While we started the quarter with our bank branches serving clients by drive-thru service and by appointment only, as of June 29, 2020, nearly every branch was opened for business with guidelines on how to minimize physical contact with our clients and between our employees. We have also developed return-to-work protocols that began in the second quarter of 20192020 and will continue to grow profitably heading intobe rolled out through the second halfrest of 2019. Investment bankingthe year. This plan is flexible as the ongoing pandemic changes and debt placement fees reached a record second quarter levelmay impact the communities in which our employees and are positioned well for the second half of 2019. We also saw increases from ongoing investments we have made in our residential mortgage business. Noninterest expense was up from the second quarter of 2018 primarily due to an increase in charitable contributions and volume-driven expenses which offset the benefit from the successful implementation of our expense initiatives. We expect to reach our targeted cash efficiency ratio range of 54.0% to 56.0% in the second half of 2019.clients operate differently.
|
| |
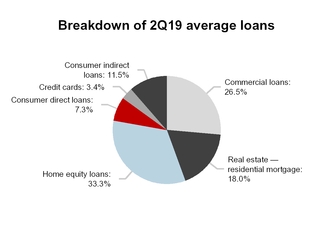
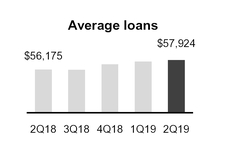
| • | On April 3, 2019, we closedWe are committed to playing a critical role in providing capital and assistance to our acquisitionclients and supporting broader initiatives to strengthen our economy. We assisted clients with their applications for the PPP, which entailed thousands of Laurel Road Bank’s digital lending business as we acquire and expand targeted client relationships. The acquisition of Laurel Road has driven an increase of average consumer direct loans of 33.0% duringour employees collaborating to deliver this much-needed funding to our clients. We were the second quarter of 2019 when compared to the same period one year ago. Overall, Laurel Road added over $400 million in loan originationsseventh overall lender in the second quarter of 2019 which has exceededPPP based on $8 billion in funding. We also supported our initial expectations. We remain very excited about our Laurel Road acquisition, which bolsters our digital capabilitiesclients through payment deferrals, hardship support, borrower assistance programs, and aligns well with our relationship strategy,forbearance options to build broad-based relationships.help provide a bridge for individuals and businesses through these uncertain times.
|
| |
| • | DuringAlthough our financial outlook has been impacted by the second quartereconomic fallout from the COVID-19 pandemic, we are operating from a position of 2019,strength. Our business model and clear strategy position us well during this period of economic and financial stress and we believe it will provide us with significant opportunities through the recovery phase. effectively managed risk and rewardsOur long-term financial targets have not changed as net loan charge-offs wereand on the other side of this crisis, we expect to continue to deliver positive operating leverage and strong financial returns. However, given our inability to estimate the impact of the pandemic on our business and operations in 2020, we previously withdrew our financial outlook for the full year 2020 that was issued on January 23, 2020.
|
.29%Credit quality is also playing a critical role in this environment. Our risk profile and strategy is different than the one we had during the 2007-2009 financial crisis. We have significantly reduced our exposure to high-risk sectors and industries and have positioned Key to perform well through all phases of average loans, belowthe business cycle, including highly stressed environments, like the one in which we operated during the last 4 months. Our moderate risk profile will continue to inform our targeted range. Net loan charge-offs forcredit decisions and the three months ended June 30, 2019, increased from the same period one year ago, primarily due to an increase in net loan charge-offs in our consumer loan portfolios.way we underwrite loans.
| |
| • | Maintaining financial strengthwhile driving long-term shareholder value was again a focusCapital and liquidity continued to be clear strengths for us during the second quarter of 2019. At June 30, 2019,2020. We participated in several rounds of government-mandated stress tests since the 2007-2009 financial crisis. These tests have shown that we would remain well capitalized through periods of severe economic and financial stress while continuing to support our Common Equity Tier 1 and Tier 1 risk-based capital ratios stood at 9.57% and 11.01%, respectively. Consistent with our 2018 capital plan, we completed $180 million of Common Share repurchasesclients and the Board declared acommunities in which we operate. Our strong balance sheet, liquidity, and capital positions our company to weather adverse economic scenarios, while continuing to support our clients, invest in our business, and provide returns for our shareholders. Our capital plans included maintaining our common sharestock dividend of $.17 per Common Share. On April 18, 2019, we announced our 2019 capital plan. Share repurchases of up to $1.0 billion are included in the 2019 capital plan which is effective fromfor the third quarter of 2019 through2020 at the same level as the second quarter of 2020. Our 2019 capital plan also includes a 9% increase in our Common Stock dividend to $.185 per Common Share, which was approved by our Board of Directors on July 17, 2019.
|
| |
• | On May 29, 2019, we released our 2018 Corporate Responsibility report, highlighting our ongoing legacy as a responsible bank and citizen. Included in the report are the results from the first two years of the National Community Benefits Plan, under which we invested over $7.1 billion in communities. Highlights of the report also include detail on KeyBank's efforts around: diversity and inclusion; fostering sustainable communities and operations; financial wellness; employee volunteerism; and transformative philanthropy which promotes one of our strategic goals to engage a high-performing, talented, and diverse workforce.
|
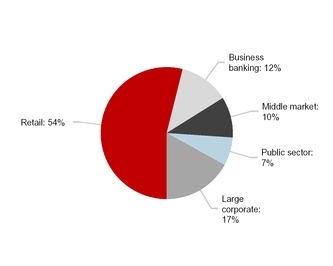
Demographics
In the first quarter of 2019, Key revised its management structure and changed its basis of presentation into two business segments, Consumer Bank and Commercial Bank. Note 19 (“Business Segment Reporting”) describes the products and services offered by each of these business segments and provides more detailed financial information pertaining to the segments, including changes in basis of presentation.
The Consumer Bank serves individuals and small businesses throughout our 15-state branch footprint by offering a variety of deposit and investment products, personal finance and financial wellness services, lending, student loan refinancing, mortgage and home equity, credit card, treasury services, and business advisory services. The Consumer Bank also purchases retail auto sales contracts via a network of auto dealerships. The auto dealerships finance the sale of automobiles as the initial lender and then assign the contracts to us pursuant to dealer agreements. In addition, wealth management and investment services are offered to assist non-profit and high-net-worth clients with their banking, trust, portfolio management, life insurance, charitable giving, and related needs.
The Commercial Bank delivers a broad suite of banking and capital markets products to its clients, including syndicated finance, debt and equity capital markets, commercial payments, equipment finance, commercial
mortgage banking, derivatives, foreign exchange, financial advisory, and public finance. The Commercial Bank is also a significant servicer of commercial mortgage loans and a significant special servicer of CMBS.
Supervision and regulation
The following discussion provides a summary of recent regulatory developments and should be read in conjunction with the disclosure included in our 20182019 Form 10-K under the heading “Supervision and Regulation” in Item 1. Business and under the heading “II. Compliance Risk” in Item 1A. Risk Factors.
Regulatory capital requirements
The final rule to implement the Basel III international capital framework (“Basel III”) was effective January 1, 2015, with a multi-year transition period ending on December 31, 2018 (“Regulatory Capital Rules”). As of April 1, 2020, the Regulatory Capital Rules are fully phased-in for Key. The Basel III capital framework and the U.S. implementation of the Basel III capital framework are discussed in more detail in Item 1. Business of our 20182019 Form 10-K under the heading “Supervision and Regulation — Regulatory capital requirements.”
Under the Regulatory Capital Rules, standardized approach banking organizations, such as KeyCorp and KeyBank, are required to meet the minimum capital and leverage ratios set forth in Figure 2 below. At June 30, 2019, Key had an estimated Common Equity Tier 1 Capital Ratio of 9.49%2020, KeyCorp’s ratios under the fully phased-in Regulatory Capital Rules. Also, at June 30, 2019, based on the fully phased-in Regulatory Capital Rules Key estimates that its capital and leverage ratios, after adjustment for market risk, would be asare set forth in Figure 2.
Figure 2. Pro Forma Ratios vs. Minimum Capital Ratios Calculatedand KeyCorp Ratios Under the Fully Phased-In Regulatory Capital Rules
| | | Ratios (including capital conservation buffer) | Regulatory Minimum Requirement | Capital Conservation Buffer (c) | Regulatory Minimum With Capital Conservation Buffer | Key
June 30, 2019
Pro forma | Regulatory Minimum Requirement | Capital Conservation Buffer (b) | Regulatory Minimum With Capital Conservation Buffer | KeyCorp June 30, 2020 (c) |
Common Equity Tier 1 (a) | 4.50 | % | 2.50 | % | 7.00 | % | 9.49 | % | 4.5 | % | 2.5 | % | 7.0 | % | 9.1 | % |
| Tier 1 Capital | 6.00 |
| 2.50 |
| 8.50 |
| 10.92 |
| 6.0 |
| 2.5 |
| 8.5 |
| 10.5 |
|
| Total Capital | 8.00 |
| 2.50 |
| 10.50 |
| 13.05 |
| 8.0 |
| 2.5 |
| 10.5 |
| 12.8 |
|
Leverage (b)(a) | 4.00 |
| N/A |
| 4.00 |
| 10.00 |
| 4.0 |
| N/A |
| 4.0 |
| 8.8 |
|
| |
| (a) | See section entitled “GAAP to Non-GAAP Reconciliations,” which presents the computation of Common Equity Tier 1 capital under the fully phased-in regulatory capital rules. |
| |
(b) | As a standardized approach banking organization, KeyCorp is not subject to the 3% supplemental leverage ratio requirement, which became effective January 1, 2018. |
| |
(c)(b) | Capital conservation buffer must consist of Common Equity Tier 1 capital. As a standardized approach banking organization, KeyCorp is not subject to the countercyclical capital buffer of up to 2.5% imposed upon an advanced approaches banking organization under the Regulatory Capital Rules. |
| |
| (c) | Ratios reflect the five-year transition of CECL impacts on regulatory ratios. |
Revised prompt corrective action framework
The federal prompt corrective action (“PCA”) framework under the FDIA groups FDIC-insured depository institutions into one of five prompt corrective action capital categories: “well capitalized,” “adequately capitalized,” “undercapitalized,” “significantly undercapitalized,” and “critically undercapitalized.” In addition to implementing the Basel III capital framework in the United States, the Regulatory Capital Rules also revised the PCA capital category threshold ratios applicable to FDIC-insured depository institutions such as KeyBank, with an effective date of January 1, 2015. The revised PCA framework table in Figure 3 identifies the capital category thresholds for a “well capitalized” and an “adequately capitalized” institution under the PCA Framework.
Figure 3. "Well Capitalized" and "Adequately Capitalized" Capital Category Ratios under Revised PCA Framework
|
| | | | | |
| Prompt Corrective Action | | Capital Category |
| Ratio | | Well Capitalized (a) | Adequately Capitalized |
| Common Equity Tier 1 Risk-Based | | 6.5 | % | 4.5 | % |
| Tier 1 Risk-Based | | 8.0 |
| 6.0 |
|
| Total Risk-Based | | 10.0 |
| 8.0 |
|
Tier 1 Leverage (b) | | 5.0 |
| 4.0 |
|
| |
| (a) | A “well capitalized” institution also must not be subject to any written agreement, order, or directive to meet and maintain a specific capital level for any capital measure. |
| |
| (b) | As a “standardized approach” banking organization, KeyBank is not subject to the 3% supplemental leverage ratio requirement, which became effective January 1, 2018. |
We believe that, as of June 30, 2019,2020, KeyBank (consolidated) satisfied the risk-based and leverage capital requirements necessary to be considered “well capitalized” for purposes of the PCA framework. However, investors should not regard this determination as a representation of the overall financial condition or prospects of KeyBank because the PCA framework is intended to serve a limited supervisory function. Moreover, it is important to note that the PCA framework does not apply to BHCs, like KeyCorp.
Recent regulatory capital-related developments
A final rule adopted by the federal banking agencies in February 2019 provides banking organizations with the option to phase in, over a three-year period, the adverse day-one regulatory capital effects of the adoption of the CECL accounting standard. On July 9, 2019,March 27, 2020, the federal banking agencies issued aan interim final rule that gives banking organizations that implement CECL before the end of 2020 the option to simplify certain aspectsdelay for two years CECL’s adverse effects on regulatory capital (“CECL Interim Final Rule”). This is in addition to the three-year transition period already in place, resulting in an optional five-year transition. The agencies noted this relief is being provided in order to allow banking organizations to better focus on lending to creditworthy households and businesses affected by recent strains on the U.S. economy caused by COVID-19. Comments on the CECL Interim Final Rule were due by May 15, 2020.
The Coronavirus Aid, Relief, and Economic Security Act (“CARES Act”), enacted on March 27, 2020, provides banking organizations with the option to not comply with CECL until the earlier of (i) the termination date of the Regulatory Capital Rules for standardized approachnational emergency concerning COVID-19 declared by the President under the National Emergencies Act or (ii) December 31, 2020. The federal banking agencies issued a statement on March 31, 2020, indicating that banking organizations including Key. The final rule simplifies, for thesethat elect to use the optional, temporary statutory relief will be able to elect the remaining period of regulatory capital relief provided under the CECL Interim Final Rule after the end of the statutory relief period. Alternatively, banking organizations may adopt CECL as planned in 2020 and use the regulatory capital requirements for mortgage servicing assets, certain deferred tax assets arising from temporary differences, and investmentsrelief provided under the CECL Interim Final Rule starting at the time of their adoption of CECL. Key elected to adopt CECL as planned in the capitalfirst quarter of unconsolidated financial institutions. The final rule replaces multiple deduction thresholds with2020 and exercise the option to use a single 25% deduction threshold for each of these categories and requires that a 250% risk weight be appliedfive-year transition to mortgage servicing assets and deferred tax assets that are not deducted from capital. The final rule also simplifies the calculation of the amount of capital issued by a consolidated subsidiary of a banking organization and held by third parties that is includable inmeasure CECL’s effects on regulatory capital. In addition, the final rule makes certain technical amendments to the Regulatory Capital Rules that are applicable to standardized approach banking organizations as well as advanced approaches banking organizations. The technical amendments are effective on October 1, 2019, and the simplification changes are effective on April 1, 2020.
On July 12, 2019, the federal banking agencies released an NPR to expand upon a proposal issued in September 2018 to amend the Regulatory Capital Rules by revising the definition of a high volatility commercial real estate (“HVCRE”) exposure. HVCRE exposures are subject to a heightened risk weight under the Regulatory Capital Rules. The September 2018 proposal seeks to conform the HVCRE definition to statutory changes enacted in May 2018. The July 2019 NPR expands upon the September 2018 proposal to request comment on the treatment of loans that finance the development of land for purposes of the one- to four-family residential properties exclusion in the revised HVCRE exposure definition. Comments are due 30 days after the NPR is published in the Federal Register.
See Item 1. Business of our 20182019 Form 10-K under the heading “Supervision and Regulation — Regulatory capital requirements — Recent regulatory capital-related developments” for a discussion of other recent regulatory capital-related developments.
Capital planning and stress testing
On March 4, 2020, the Federal Reserve adopted a final rule integrating certain aspects of the Federal Reserve’s Regulatory Capital Rules with CCAR and the stress test rules in order to simplify the overall capital framework that is currently applicable to BHCs that have $100 billion or more in total consolidated assets (including KeyCorp). Under the final rule, the Federal Reserve amended the capital conservation buffer requirement under the Regulatory Capital Rules by replacing the static risk-weighted assets component of the buffer with a new measure, the stress capital buffer, which will be based on the results of an individual BHC’s supervisory stress test and cannot be less than 2.5 percent of risk-weighted assets. A firm will be subject to limitations on capital distributions and discretionary bonus payments if it does not satisfy all minimum capital requirements and its stress capital buffer requirement. A firm’s stress capital buffer requirement will become effective on October 1 of each year and will remain in effect until September 30 of the following year unless the firm receives an updated stress capital buffer requirement from the Federal Reserve.
On March 20, 2020, the federal banking agencies published an interim final rule that revises the definition of eligible retained income as that term is used in the agencies’ Regulatory Capital Rules. The revised definition applies to all buffer requirements applicable to a banking organization, including the stress capital buffer requirement adopted by the Federal Reserve on March 4, 2020. The revised definition of eligible retained income will make any automatic limitations on capital distributions that could apply under the agencies’ capital rules more gradual with the objective of promoting continued lending during a period of stress, including the period of stress resulting from the COVID-19 pandemic. Comments on the interim final rule were due by May 4, 2020.
In April 2020, we submitted our 2020 capital plan to the Federal Reserve under the Federal Reserve’s CCAR process. On June 25, 2020, the Federal Reserve publicly announced the results of its CCAR process and the supervisory stress test that it conducted of 34 BHCs having more than $100 billion in total consolidated assets (including KeyCorp). The Federal Reserve indicated that it will use the results of this stress test to set the new stress capital buffer requirement for these firms, which will take effect in the fourth quarter of 2020. The Federal Reserve also announced the results of a sensitivity analysis it conducted to assess the resiliency of these firms under three hypothetical downside scenarios which could result from the COVID-19 disruptions.
Because of the results of its sensitivity analysis, the Federal Reserve decided to take certain actions to require large banking organizations to preserve capital and re-evaluate their capital plans. Specifically, the Federal Reserve
stated that it is requiring each firm subject to its capital plan rule to update and resubmit its capital plan to the appropriate Reserve Bank within 45 days after the Federal Reserve provides updated scenarios. The Federal Reserve further indicated that for the third quarter of 2020, these firms are prohibited from (i) making share repurchases (other than share repurchases relating to issuances of common stock for employee stock ownership plans) and (ii) paying common stock dividends that exceed the amount paid in the second quarter of 2020 or exceed an amount equal to the average of the firm’s net income for the four preceding calendar quarters unless otherwise specified by the Federal Reserve. The Federal Reserve said that it may extend these restrictions quarter-by-quarter depending upon the economic circumstances.
On June 30, 2020, KeyCorp announced that its preliminary stress capital requirement, provided by the Federal Reserve as part of the 2020 Federal Reserve capital stress testing exercise, is 2.5%, which represents the minimum buffer required for banking organizations the size of Key. KeyCorp also announced that its capital plans included maintaining its common stock dividend for the third quarter of 2020 at the same level as the second quarter of 2020, subject to approval by KeyCorp’s Board of Directors, which the Board subsequently approved on July 8, 2020.
See Item 1. Business of our 20182019 Form 10-K under the heading “Supervision and Regulation —- Regulatory capital requirements —- Capital planning and stress testing” and “Supervision and Regulation — Regulatory capital requirements — Recent developments in capital planning and stress testing” for an overview of capital planning and stress testing requirements as well as recent developments in those areas.
Additional recent developments regarding capital planning and stress testing are discussed in Item 1. Business of our 2018 Form 10-K under the heading “Supervision and Regulation — Other Regulatory Developments — Economic Growth, Regulatory Relief, and Consumer Protection Act.”requirements.
Liquidity requirements
See Item. 1 Business of our 20182019 Form 10-K under the heading “Supervision and Regulation — Regulatory capital requirements — Liquidity requirements” for a discussion of liquidity requirements, including the Liquidity Coverage Rules.
Recent developments regarding liquidity requirements are discussed in Item 1. Business of our 2018 Form 10-K under the heading “Supervision and Regulation — Other Regulatory Developments — Economic Growth, Regulatory Relief, and Consumer Protection Act.”
Resolution planning
BHCs with at least $50 billion in total consolidated assets, like KeyCorp, are required to periodically submit to the Federal Reserve and FDIC a plan discussing how the company could be rapidly and efficiently resolved if the company failed or experienced material financial distress. Insured depository institutions with at least $50 billion in total consolidated assets, like KeyBank, are also required to submit a resolution plan to the FDIC. These plans are due annually unless the requirement to submit the plans is deferred by the regulators. On December 1, 2017, KeyCorp submitted its resolution plan to the Federal Reserve and the FDIC. KeyBank submitted its resolution plan to the FDIC on June 20, 2018. KeyCorp was not required to submit a resolution plan to the Federal Reserve and FDIC for 2018 because the FDIC and Federal Reserve deferred such requirement (for 14 firms, including KeyCorp)
until December 2019. KeyBank will not be required to submit a resolution plan to the FDIC in 2019 because the FDIC extended the next filing due date for all depository institution resolution plan submissions until no sooner than July 1, 2020. The Federal Reserve and FDIC make available on their websites the public sections of resolution plans for the companies, including KeyCorp and KeyBank, that submitted plans. The public sections of the resolution plans of KeyCorp and KeyBank are available at http://www.federalreserve.gov/supervisionreg/resolution-plans.htm and https://www.fdic.gov/regulations/reform/resplans/.
In April 2019, the Federal Reserve and FDIC released a proposal to modify the resolution planning requirements applicable to large BHCs. Under this proposal, BHCs with less than $250 billion in total consolidated assets would no longer be required to submit a resolution plan unless they have $75 billion or more in certain risk-based indicators. If this proposal is adopted, KeyCorp will no longer be subject to resolution planning requirements. Comments on this proposal were due by June 21, 2019. On April 16, 2019, the FDIC issued an advance notice of proposed rulemaking (“ANPR”) requesting public comment on potential changes to its rule imposing resolution planning requirements on large insured depository institutions, including potential modifications to the rule in the following areas: (i) creation of tiered resolution planning requirements based on institution size, complexity, and other factors; (ii) revisions to the frequency and required content of plan submissions, including elimination of plan submissions for a category of smaller and less complex institutions; (iii) improvements to the process for periodic engagements between the FDIC and institutions on resolution-related matters; and (iv) revision of the $50 billion asset threshold in the current rule. The FDIC indicated that it is considering two alternate approaches with respect to the tiering of resolution plan requirements. Under each of these approaches, institutions would be placed into three groups with the first two groups required to submit resolution plans with streamlined content requirements and the third group not required to submit a resolution plan. The FDIC would engage with institutions in all three groups on a periodic basis on a limited number of items related to resolution planning and would conduct periodic testing of the resolution planning capabilities of these institutions. Comments on this ANPR were due by June 21, 2019. Any changes to this rule will impact KeyBank. The FDIC extended the due date for the next resolution plan submission for all institutions until after the rulemaking is completed.
Economic Growth, Regulatory Relief, and Consumer Protection Act
See Item 1. Business of our 2018 Form 10-K under the heading “Supervision and Regulation — Other Regulatory Developments — Economic Growth, Regulatory Relief, and Consumer Protection Act” (“EGRRCPA”) for a discussion of the EGRRCPA and NPRs related to its implementation.
Volcker Rule
The Volcker Rule is discussed in detail in Item 1. Business of our 20182019 Form 10-K under the heading “Supervision and Regulation —- Other Regulatory Developments — Volcker Rule.”
Deposit insurance
In December 2016, the FDIC issuedOn June 25, 2020, five federal agencies announced their adoption of a final rule that imposes recordkeeping requirements on insured depository institutions with two million or more deposit accounts (including KeyBank) in order to facilitate rapid payment of insured deposits to customers ifclarify and streamline the institutions were to fail. The rule requires those insured depository institutions to: (i) maintain complete and accurate data on each depositor’s ownership interest by right and capacity for allcovered fund-related provisions of the institution’s deposit accounts; and (ii) develop the capability to calculate the insured and uninsured amounts for each deposit owner within 24 hours of failure. The FDIC will conduct periodic testing of compliance with these requirements, and institutions subject to the rule must submit to the FDIC a certification of compliance, signed by the bank’s chief executive officer, and a deposit insurance coverage summary report on or before the mandatory compliance date and annually thereafter. The final rule became effective on April 1, 2017, with a mandatory compliance date of April 1, 2020. On July 16, 2019, the FDIC approved amendments that revise certain aspects of this rule.Volcker Rule. Among other things, the amendments to thisfinal rule (i) providepermits certain low-risk transactions (including intraday credit, riskless principal, and payment, clearing, and settlement transactions) between a banking entity and covered institutions withfunds for which the optionbanking entity serves as the investment adviser, investment manager, or sponsor; (ii) clarifies exclusions from the covered fund definition for foreign public funds, loan securitizations, small business investment companies, and public welfare investment funds; and (iii) permits banking entities to extendinvest in or sponsor certain types of funds that do not raise the compliance dateconcerns that the Volcker Rule was intended to no later than Apriladdress, such as credit funds, venture capital funds, customer facilitation funds, and family wealth management vehicles. The final rule is effective on October 1, 2021, upon notification to the FDIC; (ii) clarify the certification requirement; (iii) revise the actions that must be taken for deposit accounts insured on a pass-through basis (where the bank’s account holder is holding funds on behalf of the beneficial owners of the funds); and (iv) streamline the process for submitting exception requests to the FDIC.
Control standards
On April 23, 2019,January 30, 2020, the Federal Reserve released an NPR requesting public comment onadopted a final rule setting forth a new, comprehensive framework for determining control under the Bank Holding Company ActBHCA and the Home Owners’ Loan Act. The proposal would simplifyfinal rule simplifies and provideprovides greater transparency regarding the standards used by the Federal Reserve to determine whether one company has control over another company. The proposal would codifyfinal rule codifies existing Federal Reserve precedents on control and would makemakes certain targeted adjustments to these precedents. The proposal would providefinal rule provides a tiered framework that would looklooks at the size of an investing company’s voting and total equity investment in another company along with a variety of other factors, including board representation, officer and employee interlocks, and the existence of business relationships between the companies. By providing greater clarity regarding the standards that wouldwill be applied for control determinations, the proposalfinal rule may facilitate (1) BHCs making minority investments in nonbank companies and (2) nonbank investors taking minority stakes in banking organizations. CommentsOn March 31, 2020, the Federal Reserve announced that it was delaying the effective date of the new control final rule to September 30, 2020, from the original date of April 1, 2020, in order to reduce operational burdens on organizations affected by this proposal were due by July 15, 2019.rule.
Community Reinvestment Act
See Item 1. BusinessThe Community Reinvestment Act (“CRA”) was enacted in 1977 to encourage depository institutions to help meet the credit needs of our 2018 Form 10-Kthe communities that they serve, including low- and moderate-income (“LMI”) neighborhoods, consistent with the institutions’ safe and sound operations. The CRA requires the federal banking agencies to assess the record of each institution that they supervise in meeting the credit needs of its entire community, including LMI neighborhoods.
On May 20, 2020, the OCC issued a final rule to revise the agency’s CRA regulation to strengthen and modernize the framework by which the OCC assesses a bank’s CRA performance. The OCC stated that it was doing so in order to make the CRA regulatory framework more objective, transparent, consistent in application, and reflective of changes in banking and thereby better achieve the statutory purpose of encouraging banks to serve the needs of their communities, particularly LMI neighborhoods and other communities that have been underserved. The final rule (i) clarifies and expands the activities that qualify for CRA credit; (ii) updates the definition of the assessment areas where activities are evaluated for CRA purposes; (iii) creates a more consistent and objective method for evaluating CRA performance; and (iv) provides for more timely and transparent CRA-related data collection, recordkeeping, and reporting. The OCC indicated that it was deferring to a future rulemaking the decision for how to calibrate the thresholds and benchmarks used in the rule to determine the level of performance necessary for a bank to achieve a specific performance rating. The final rule is effective on October 1, 2020. Large national banks, like KeyBank, are required to comply with the rule by January 1, 2023.
Regulatory developments concerning COVID-19
Federal, state, and local governments have adopted various statutes, rules, regulations, orders, and guidelines in order to address the COVID-19 pandemic and the adverse economic effects of this pandemic on individuals, families, businesses, and governments. Financial institutions, including Key, are affected by many of these measures, including measures that are broadly applicable to businesses operating in the communities where Key does business. These measures include “stay-at-home orders” that allow only essential businesses to operate. Financial services firms are generally regarded as “essential businesses” under these orders, but financial services firms, like other essential businesses, are required to operate in a manner that seeks to protect the health and safety of their customers and employees.
During the COVID-19 crisis, the federal banking agencies issued a number of statements encouraging financial institutions to meet the financial needs of their customers and have taken steps to provide financial institutions with additional flexibility to meet their customers’ needs. Certain of these steps are discussed above under the headingheadings “Supervision and Regulation — Other Regulatory Developmentscapital requirements — Community Reinvestment Act”Recent regulatory capital-related developments” and “Supervision and Regulation — Capital planning and stress testing.” In addition, the federal banking agencies along with state bank regulators issued an interagency statement on March 22, 2020, addressing loan modifications that are made by financial institutions for borrowers affected by the COVID-19 crisis. The agencies stated that short-term loan modifications made on a good faith basis in response to COVID-19 for borrowers who were current prior to any relief do not need to be categorized as TDRs and that financial institutions are not expected to designate loans with deferrals granted due to COVID-19 as past due because of the deferral.
The CARES Act, enacted on March 27, 2020, contains a number of provisions that affect banking organizations. The CARES Act provides funding for various programs under which the federal government will lend to, guarantee loans to, or make investments in, businesses. Banking organizations are expected to play a role in some of these programs, and when they do so, they will be subject to certain requirements. One of these programs is the PPP, a program administered by the Small Business Administration (the “SBA”) to provide loans to small businesses for payroll and other basic expenses during the COVID-19 crisis. The loans can be made by SBA-certified lenders and are 100% guaranteed by the SBA. The loans are eligible to be forgiven if certain conditions are satisfied, in which event the SBA will make payment to the lender for the forgiven amounts. KeyBank has participated in the PPP as a lender.
The CARES Act also authorizes temporary changes to certain provisions applicable to banking organizations. Among other changes, the CARES Act gives financial institutions the right to elect to suspend GAAP principles and regulatory determinations for loan modifications relating to COVID-19 that would otherwise be categorized as TDRs from March 1, 2020, through the earlier of December 31, 2020, or 60 days after the COVID-19 national emergency ends. In addition, the CARES Act requires mortgage servicers to grant, on a borrower’s request, forbearance for up to 180 days (which can be extended for an overviewadditional 180 days) on a federally-backed single-family mortgage loan
or forbearance for up to 30 days (which can be extended for two additional 30-day periods) on a federally-backed multi-family mortgage loan when the borrowers experience financial hardship as a result of the Community ReinvestmentCOVID-19 emergency.
On April 3, 2020, federal banking agencies along with state bank regulators issued a joint statement indicating that the agencies do not plan to take supervisory or enforcement action against mortgage servicers for delays in taking loss-mitigation actions or sending notices required by the mortgage servicing rules if they provide short-term forbearance on mortgage loans to borrowers facing hardships relating to the COVID-19 emergency, including forbearance provided in accordance with the CARES Act, provided that the mortgage servicers make good faith efforts to take these actions and recent developmentssend these notices within a reasonable time.
On April 7, 2020, the federal banking agencies, in consultation with state bank regulators, issued an interagency statement clarifying the interaction between (i) their earlier statement discussing whether loan modifications relating to COVID-19 need to be treated as TDRs and (ii) the CARES Act provision on this subject. In this interagency statement, the agencies also said that when exercising supervisory and enforcement responsibility with respect to consumer protection requirements, they will take into account the unique circumstances impacting borrowers and institutions resulting from the COVID-19 emergency and that they do not expect to take a consumer compliance public enforcement action against an institution, provided that the circumstances were related to it.this emergency and the institution made good faith efforts to support borrowers and comply with the consumer protection requirements and addressed any needed corrective action.
The Federal Reserve has established several lending facilities that are intended to support the flow of credit to households, businesses, and governments. One of these facilities is the Paycheck Protection Program Liquidity Facility (“PPPLF”) which was set up to allow the Federal Reserve Banks to extend credit to financial institutions that originate PPP loans, taking the loans as collateral at face value. On April 9, 2020, the federal banking agencies issued an interim final rule to allow banking organizations to neutralize the effect of PPP loans financed under the PPPLF on the leverage capital ratios of these organizations. In addition, on June 22, 2020, the FDIC issued a final rule that mitigates the impact of PPP lending on banks’ deposit insurance assessments. Also, in accordance with the CARES Act, a PPP loan will be assigned a risk weight of zero percent under the federal banking agencies’ risk-based capital rules.
On June 23, 2020, the federal banking agencies, in conjunction with state bank regulators, issued interagency examiner guidance outlining supervisory principles for assessing the safety and soundness of banks given the ongoing impact of the COVID-19 pandemic. The agencies stated that they will consider the unique, evolving, and potentially long-term nature of the issues that banks are confronting and will exercise appropriate flexibility in their supervisory response. The agencies said that they will continue to assess institutions in accordance with existing agency policies and procedures and will consider whether banks’ management has managed risk appropriately, including taking appropriate actions in response to stresses caused by the COVID-19 pandemic.
Results of Operations
Earnings overview
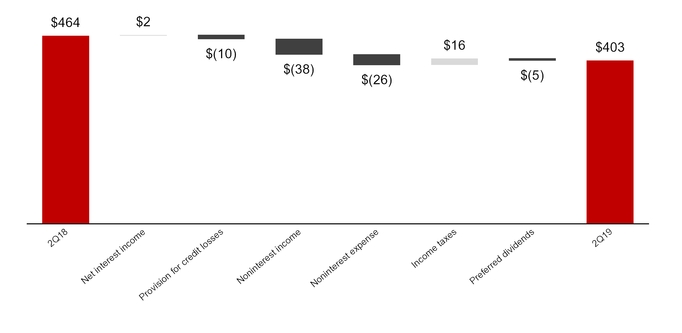
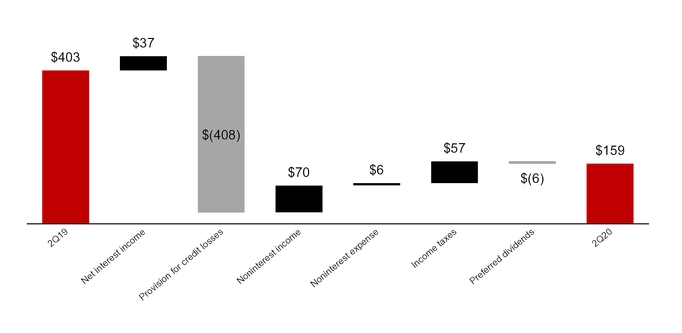
The following chart provides a reconciliation of net income from continuing operations attributable to Key common shareholders for the three months ended June 30, 2018,2019, to the three months ended June 30, 20192020 (dollars in millions):
The following discussion explains the key factors that caused these elements to change. Given our inability to estimate the impact of COVID-19 on our business and operations in 2020, we previously withdrew our financial outlook for the full-year 2020 that was issued on January 23, 2020.
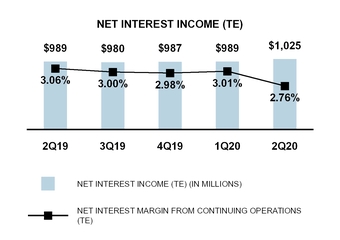
Net interest income
One of our principal sources of revenue is net interest income. Net interest income is the difference between interest income received on earning assets (such as loans and securities) and loan-related fee income, and interest expense paid on deposits and borrowings. There are several factors that affect net interest income, including:
the volume, pricing, mix, and maturity of earning assets and interest-bearing liabilities;
the volume and value of net free funds, such as noninterest-bearing deposits and equity capital;
the use of derivative instruments to manage interest rate risk;
interest rate fluctuations and competitive conditions within the marketplace;
asset quality; and
fair value accounting of acquired earning assets and interest-bearing liabilities.
To make it easier to compare both the results across several periods and the yields on various types of earning assets (some taxable, some not), we present net interest income in this discussion on a “TE basis” (i.e., as if all income were taxable and at the same rate). For example, $100 of tax-exempt income would be presented as $126, an amount that, if taxed at the statutory federal income tax rate of 21%, would yield $100.
Figure 4 shows the various components of our balance sheet that affect interest income and expense and their respective yields or rates over the past five quarters. This figure also presents a reconciliation of TE net interest income to net interest income reported in accordance with GAAP for each of those quarters. The net interest margin, which is an indicator of the profitability of the earning assets portfolio less cost of funding, is calculated by dividing annualized TE net interest income by average earning assets.
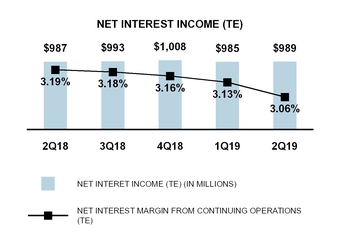
TE net interest income was $1.0 billion for the second quarter of 2020, compared to TE net interest income of $989 million for the second quarter of 2019, compared to TE net interest income of $987 million for the second quarter of 2018.2019. The increase in net interest income reflects the benefit from higher earning asset balances and higher interest rates, partially offset by a lower net interest margin. The net interest margin drivenwas impacted by anlower interest rates, a lag in deposit pricing as interest rates declined, and a change in balance sheet mix, including elevated levellevels of liquidity higher interest-bearing deposit costs, lower loan fees, and a continued declineour participation in purchase accounting accretion. Second quarter 2019 net interest income included $17 million of purchase accounting accretion, a decline of $11 million from the second quarter of 2018.PPP.
For the six months ended June 30, 2019,2020, TE net interest income was $2.0 billion, an increase of $35increased $40 million from TE net interest income of $1.9 billion for the same period last year. The increase in net interest income reflects higher earning asset balances, and higher interest rates, partly offset by a lower net interest margin driven by balance sheet mix, higher interest-bearing deposit costs, lower loan fees,interest rates and a continued declinelag in purchase accounting accretion. In 2019, we expect TE netdeposit pricing as interest income to be in the range of $4.0 billion to $4.1 billion, with our outlook assuming one 25 basis point interest rate decrease in 2019.rates declined.
Average loans were $90.8$107.9 billion for the second quarter of 2019,2020, an increase of $2.1$17.2 billion compared to the second quarter of 2018.2019. Commercial loans increased $1.6$13.3 billion, reflecting growth from participation in the PPP during the current quarter, as well as core broad-based growth in commercial and industrial loans partially offset by declines in commercial mortgage and construction loans.increased utilization versus the year-ago period. Consumer loans increased $573 million,$3.8 billion, driven by solid growthstrength from Laurel Road residentialand Key's consumer mortgage loans, and indirect auto lending. Home equity loans declined $900 million, largely the result of continued paydowns in home equity lines of credit. For 2019, we anticipate average loans to be in the range of $90 billion to $91 billion.business.
Average deposits totaled $109.6$128.0 billion for the second quarter of 2019,2020, an increase of $5.6$18.4 billion compared to the year-ago quarter, reflecting strength in our retail banking franchise and growth from consumer and commercial relationships. For 2019, we anticipate average deposits to berelationships, partially offset by a decline in the range of $108 billion to $109 billion.time deposits.
Figure 4. Consolidated Average Balance Sheets, Net Interest Income, and Yields/Rates and Components of Net Interest Income Changes from Continuing Operations
| | | | Three months ended June 30, 2019 | | Three months ended June 30, 2018 | | Change in Net interest income due to | Three months ended June 30, 2020 | | Three months ended June 30, 2019 | | Change in Net interest income due to |
| dollars in millions | Average Balance | Interest (a) | Yield/ Rate (a) | | Average
Balance | Interest (a) | Yield/
Rate (a) | | Volume | Yield/Rate | Total | Average Balance | Interest (a) | Yield/ Rate (a) | | Average
Balance | Interest (a) | Yield/
Rate (a) | | Volume | Yield/Rate | Total |
| ASSETS | | | | | | | | | | | | | | |
Loans (b), (c) | | | | | | | | | | | | | | |
Commercial and industrial (d) | $ | 47,227 |
| $ | 547 |
| 4.65 | % | | $ | 45,030 |
| $ | 485 |
| 4.32 | % | | $ | 24 |
| $ | 38 |
| $ | 62 |
| $ | 60,480 |
| $ | 518 |
| 3.44 | % | | $ | 47,227 |
| $ | 547 |
| 4.65 | % | | $ | 133 |
| $ | (162 | ) | $ | (29 | ) |
| Real estate — commercial mortgage | 13,866 |
| 175 |
| 5.06 |
| | 14,055 |
| 172 |
| 4.89 |
| | (2 | ) | 5 |
| 3 |
| 13,510 |
| 128 |
| 3.80 |
| | 13,866 |
| 175 |
| 5.06 |
| | (4 | ) | (43 | ) | (47 | ) |
| Real estate — construction | 1,423 |
| 20 |
| 5.41 |
| | 1,789 |
| 23 |
| 4.97 |
| | (5 | ) | 2 |
| (3 | ) | 1,756 |
| 17 |
| 3.97 |
| | 1,423 |
| 20 |
| 5.41 |
| | 4 |
| (7 | ) | (3 | ) |
| Commercial lease financing | 4,476 |
| 41 |
| 3.65 |
| | 4,550 |
| 41 |
| 3.61 |
| | (1 | ) | 1 |
| — |
| 4,584 |
| 33 |
| 2.96 |
| | 4,476 |
| 41 |
| 3.65 |
| | 1 |
| (9 | ) | (8 | ) |
| Total commercial loans | 66,992 |
| 783 |
| 4.69 |
| | 65,424 |
| 721 |
| 4.41 |
| | 16 |
| 46 |
| 62 |
| 80,330 |
| 696 |
| 3.49 |
| | 66,992 |
| 783 |
| 4.69 |
| | 134 |
| (221 | ) | (87 | ) |
| Real estate — residential mortgage | 5,790 |
| 58 |
| 4.03 |
| | 5,451 |
| 54 |
| 3.97 |
| | 3 |
| 1 |
| 4 |
| 7,783 |
| 69 |
| 3.57 |
| | 5,790 |
| 58 |
| 4.03 |
| | 18 |
| (7 | ) | 11 |
|
| Home equity loans | 10,701 |
| 135 |
| 5.05 |
| | 11,601 |
| 135 |
| 4.67 |
| | (11 | ) | 11 |
| — |
| 9,949 |
| 97 |
| 3.89 |
| | 10,701 |
| 135 |
| 5.05 |
| | (9 | ) | (29 | ) | (38 | ) |
| Consumer direct loans | 2,352 |
| 43 |
| 7.39 |
| | 1,768 |
| 33 |
| 7.54 |
| | 11 |
| (1 | ) | 10 |
| 4,152 |
| 55 |
| 5.24 |
| | 2,352 |
| 43 |
| 7.39 |
| | 26 |
| (14 | ) | 12 |
|
| Credit cards | 1,091 |
| 31 |
| 11.26 |
| | 1,080 |
| 30 |
| 11.21 |
| | — |
| 1 |
| 1 |
| 983 |
| 25 |
| 10.22 |
| | 1,091 |
| 31 |
| 11.26 |
| | (3 | ) | (3 | ) | (6 | ) |
| Consumer indirect loans | 3,859 |
| 40 |
| 4.15 |
| | 3,320 |
| 35 |
| 4.26 |
| | 6 |
| (1 | ) | 5 |
| 4,744 |
| 45 |
| 3.82 |
| | 3,859 |
| 40 |
| 4.15 |
| | 9 |
| (4 | ) | 5 |
|
| Total consumer loans | 23,793 |
| 307 |
| 5.17 |
| | 23,220 |
| 287 |
| 4.97 |
| | 9 |
| 11 |
| 20 |
| 27,611 |
| 291 |
| 4.22 |
| | 23,793 |
| 307 |
| 5.17 |
| | 41 |
| (57 | ) | (16 | ) |
| Total loans | 90,785 |
| 1,090 |
| 4.81 |
| | 88,644 |
| 1,008 |
| 4.56 |
| | 25 |
| 57 |
| 82 |
| 107,941 |
| 987 |
| 3.67 |
| | 90,785 |
| 1,090 |
| 4.81 |
| | 175 |
| (278 | ) | (103 | ) |
| Loans held for sale | 1,302 |
| 15 |
| 4.56 |
| | 1,375 |
| 16 |
| 4.50 |
| | (1 | ) | — |
| (1 | ) | 2,463 |
| 21 |
| 3.50 |
| | 1,302 |
| 15 |
| 4.56 |
| | 11 |
| (5 | ) | 6 |
|
Securities available for sale (b), (e) | 21,086 |
| 135 |
| 2.54 |
| | 17,443 |
| 97 |
| 2.13 |
| | 22 |
| 16 |
| 38 |
| 20,749 |
| 121 |
| 2.43 |
| | 21,086 |
| 135 |
| 2.54 |
| | (2 | ) | (12 | ) | (14 | ) |
Held-to-maturity securities (b) | 11,058 |
| 67 |
| 2.41 |
| | 12,226 |
| 72 |
| 2.36 |
| | (7 | ) | 2 |
| (5 | ) | 9,331 |
| 56 |
| 2.43 |
| | 11,058 |
| 67 |
| 2.41 |
| | (10 | ) | (1 | ) | (11 | ) |
| Trading account assets | 1,124 |
| 9 |
| 3.28 |
| | 943 |
| 7 |
| 3.21 |
| | 1 |
| 1 |
| 2 |
| 760 |
| 5 |
| 2.43 |
| | 1,124 |
| 9 |
| 3.28 |
| | (3 | ) | (1 | ) | (4 | ) |
| Short-term investments | 3,200 |
| 17 |
| 2.23 |
| | 2,015 |
| 8 |
| 1.76 |
| | 6 |
| 3 |
| 9 |
| 7,892 |
| 7 |
| .31 |
| | 3,200 |
| 17 |
| 2.23 |
| | 12 |
| (22 | ) | (10 | ) |
Other investments (e) | 640 |
| 4 |
| 2.00 |
| | 710 |
| 5 |
| 3.08 |
| | — |
| (1 | ) | (1 | ) | 672 |
| — |
| .29 |
| | 640 |
| 4 |
| 2.00 |
| | — |
| (4 | ) | (4 | ) |
| Total earning assets | 129,195 |
| 1,337 |
| 4.14 |
| | 123,356 |
| 1,213 |
| 3.92 |
| | 46 |
| 78 |
| 124 |
| 149,808 |
| 1,197 |
| 3.22 |
| | 129,195 |
| 1,337 |
| 4.14 |
| | 183 |
| (323 | ) | (140 | ) |
| Allowance for loan and lease losses | (881 | ) | | | | (875 | ) | | | | | (1,413 | ) | | | | (881 | ) | | | | |
| Accrued income and other assets | 14,321 |
| | | | 13,897 |
| | | | | 15,704 |
| | | | 14,321 |
| | | | |
| Discontinued assets | 1,009 |
| | | | 1,241 |
| | | | | 793 |
| | | | 1,009 |
| | | | |
| Total assets | $ | 143,644 |
| | | | $ | 137,619 |
| | | | | $ | 164,892 |
| | | | $ | 143,644 |
| | | | |
| | | | | | | | | | | | | | | | | |
| LIABILITIES | | | | | | | | | | | | | | |
| NOW and money market deposit accounts | $ | 63,071 |
| 147 |
| .93 |
| | $ | 54,749 |
| 59 |
| .44 |
| | 10 |
| 78 |
| 88 |
| $ | 75,297 |
| 56 |
| .30 |
| | $ | 63,071 |
| 147 |
| .93 |
| | 24 |
| (115 | ) | (91 | ) |
| Savings deposits | 4,781 |
| 1 |
| .09 |
| | 6,276 |
| 5 |
| .35 |
| | (1 | ) | (3 | ) | (4 | ) | 5,130 |
| — |
| .04 |
| | 4,781 |
| 1 |
| .09 |
| | — |
| (1 | ) | (1 | ) |
| Certificates of deposit ($100,000 or more) | 8,147 |
| 48 |
| 2.37 |
| | 7,516 |
| 32 |
| 1.70 |
| | 3 |
| 13 |
| 16 |
| 4,950 |
| 24 |
| 1.93 |
| | 8,147 |
| 48 |
| 2.37 |
| | (17 | ) | (7 | ) | (24 | ) |
| Other time deposits | 5,569 |
| 27 |
| 1.93 |
| | 4,949 |
| 16 |
| 1.22 |
| | 2 |
| 9 |
| 11 |
| 4,333 |
| 16 |
| 1.52 |
| | 5,569 |
| 27 |
| 1.93 |
| | (5 | ) | (6 | ) | (11 | ) |
| Total interest-bearing deposits | 81,568 |
| 223 |
| 1.10 |
| | 73,490 |
| 112 |
| .61 |
| | 14 |
| 97 |
| 111 |
| 89,710 |
| 96 |
| .43 |
| | 81,568 |
| 223 |
| 1.10 |
| | 2 |
| (129 | ) | (127 | ) |
| Federal funds purchased and securities sold under repurchase agreements | 194 |
| — |
| .20 |
| | 1,475 |
| 5 |
| 1.41 |
| | (2 | ) | (3 | ) | (5 | ) | 242 |
| — |
| .03 |
| | 194 |
| — |
| .20 |
| | — |
| — |
| — |
|
| Bank notes and other short-term borrowings | 842 |
| 5 |
| 2.46 |
| | 1,116 |
| 7 |
| 2.27 |
| | (2 | ) | — |
| (2 | ) | 2,869 |
| 5 |
| .57 |
| | 842 |
| 5 |
| 2.46 |
| | 5 |
| (5 | ) | — |
|
Long-term debt (f), (g) | 13,213 |
| 120 |
| 3.67 |
| | 12,748 |
| 102 |
| 3.20 |
| | 4 |
| 14 |
| 18 |
| 12,954 |
| 71 |
| 2.30 |
| | 13,213 |
| 120 |
| 3.67 |
| | (2 | ) | (47 | ) | (49 | ) |
| Total interest-bearing liabilities | 95,817 |
| 348 |
| 1.46 |
| | 88,829 |
| 226 |
| 1.02 |
| | 14 |
| 108 |
| 122 |
| 105,775 |
| 172 |
| .66 |
| | 95,817 |
| 348 |
| 1.46 |
| | 5 |
| (181 | ) | (176 | ) |
| Noninterest-bearing deposits | 28,033 |
| | | | 30,513 |
| | | | | 38,267 |
| | | | 28,033 |
| | | | |
| Accrued expense and other liabilities | 2,253 |
| | | | 2,002 |
| | | | | 2,369 |
| | | | 2,253 |
| | | | |
Discontinued liabilities (g) | 1,009 |
| | | | 1,241 |
| | | | | 793 |
| | | | 1,009 |
| | | | |
| Total liabilities | 127,112 |
| | | | 122,585 |
| | | | | 147,204 |
| | | | 127,112 |
| | | | |
| EQUITY | | | | | | | | | | | | | | |
| Key shareholders’ equity | 16,531 |
| | | | 15,032 |
| | | | | 17,688 |
| | | | 16,531 |
| | | | |
| Noncontrolling interests | 1 |
| | | | 2 |
| | | | | — |
| | | | 1 |
| | | | |
| Total equity | 16,532 |
| | | | 15,034 |
| | | | | 17,688 |
| | | | 16,532 |
| | | | |
| Total liabilities and equity | $ | 143,644 |
| | | | $ | 137,619 |
| | | | | $ | 164,892 |
| | | | $ | 143,644 |
| | | | |
| | | | | | | | | | | | | | | |
| Interest rate spread (TE) | | 2.68 | % | | | 2.90 | % | | | | 2.56 | % | | | 2.68 | % | | |
| Net interest income (TE) and net interest margin (TE) | | 989 |
| 3.06 | % | | | 987 |
| 3.19 | % | | $ | 32 |
| $ | (30 | ) | 2 |
| | 1,025 |
| 2.76 | % | | | 989 |
| 3.06 | % | | $ | 178 |
| $ | (142 | ) | 36 |
|
TE adjustment (b) | | 8 |
| | | | 8 |
| | | | | 7 |
| | | | 8 |
| | | |
| Net interest income, GAAP basis | | $ | 981 |
| | | | $ | 979 |
| | | | | $ | 1,018 |
| | | | $ | 981 |
| | | |
| | | | | | | | | | | | | | | |
| |
| (a) | Results are from continuing operations. Interest excludes the interest associated with the liabilities referred to in (g), calculated using a matched funds transfer pricing methodology. |
| |
| (b) | Interest income on tax-exempt securities and loans has been adjusted to a taxable-equivalent basis using the statutory federal income tax rate of 21% for the three months ended June 30, 2019,2020, and June 30, 2018.2019. |
| |
| (c) | For purposes of these computations, nonaccrual loans are included in average loan balances. |
| |
| (d) | Commercial and industrial average balances include $141$135 million and $126$141 million of assets from commercial credit cards for the three months ended June 30, 2019,2020, and June 30, 2018,2019, respectively. |
| |
| (e) | Yield is calculated on the basis of amortized cost. |
| |
| (f) | Rate calculation excludes basis adjustments related to fair value hedges. |
| |
| (g) | A portion of long-term debt and the related interest expense is allocated to discontinued liabilities as a result of applying our matched funds transfer pricing methodology to discontinued operations. |
Figure 4. Consolidated Average Balance Sheets, Net Interest Income, and Yields/Rates and Components of Net Interest Income Changes from Continuing Operations | | | | Six months ended June 30, 2019 | | Six months ended June 30, 2018 | | Change in Net interest income due to | Six months ended June 30, 2020 | | Six months ended June 30, 2019 | | Change in Net interest income due to |
| dollars in millions | Average Balance | Interest (a) | Yield/ Rate (a) | | Average
Balance | Interest (a) | Yield/
Rate (a) | | Volume | Yield/Rate | Total | Average Balance | Interest (a) | Yield/ Rate (a) | | Average
Balance | Interest (a) | Yield/
Rate (a) | | Volume | Yield/Rate | Total |
| ASSETS | | | | | | | | | | | | | | |
Loans (b), (c) | | | | | | | | | | | | | | |
Commercial and industrial (d) | $ | 46,616 |
| $ | 1,079 |
| 4.67 | % | | $ | 43,888 |
| $ | 919 |
| 4.22 | % | | $ | 59 |
| $ | 101 |
| $ | 160 |
| $ | 54,973 |
| $ | 1,026 |
| 3.75 | % | | $ | 46,616 |
| $ | 1,079 |
| 4.67 | % | | $ | 175 |
| $ | (228 | ) | $ | (53 | ) |
| Real estate — commercial mortgage | 14,094 |
| 354 |
| 5.07 |
| | 14,070 |
| 337 |
| 4.83 |
| | 1 |
| 16 |
| 17 |
| 13,529 |
| 283 |
| 4.20 |
| | 14,094 |
| 354 |
| 5.07 |
| | (14 | ) | (57 | ) | (71 | ) |
| Real estate — construction | 1,492 |
| 41 |
| 5.45 |
| | 1,872 |
| 45 |
| 4.80 |
| | (10 | ) | 6 |
| (4 | ) | 1,711 |
| 37 |
| 4.35 |
| | 1,492 |
| 41 |
| 5.45 |
| | 5 |
| (9 | ) | (4 | ) |
| Commercial lease financing | 4,486 |
| 82 |
| 3.66 |
| | 4,607 |
| 82 |
| 3.57 |
| | (2 | ) | 2 |
| — |
| 4,575 |
| 72 |
| 3.17 |
| | 4,486 |
| 82 |
| 3.66 |
| | 2 |
| (12 | ) | (10 | ) |
| Total commercial loans | 66,688 |
| 1,556 |
| 4.70 |
| | 64,437 |
| 1,383 |
| 4.32 |
| | 48 |
| 125 |
| 173 |
| 74,788 |
| 1,418 |
| 3.81 |
| | 66,688 |
| 1,556 |
| 4.70 |
| | 168 |
| (306 | ) | (138 | ) |
| Real estate — residential mortgage | 5,667 |
| 114 |
| 4.02 |
| | 5,465 |
| 108 |
| 3.96 |
| | 4 |
| 2 |
| 6 |
| 7,500 |
| 137 |
| 3.66 |
| | 5,667 |
| 114 |
| 4.02 |
| | 34 |
| (11 | ) | 23 |
|
| Home equity loans | 10,847 |
| 272 |
| 5.06 |
| | 11,738 |
| 269 |
| 4.61 |
| | (21 | ) | 24 |
| 3 |
| 10,052 |
| 210 |
| 4.19 |
| | 10,847 |
| 272 |
| 5.06 |
| | (19 | ) | (43 | ) | (62 | ) |
| Consumer direct loans | 2,109 |
| 80 |
| 7.68 |
| | 1,767 |
| 66 |
| 7.53 |
| | 13 |
| 1 |
| 14 |
| 3,930 |
| 109 |
| 5.56 |
| | 2,109 |
| 80 |
| 7.68 |
| | 55 |
| (26 | ) | 29 |
|
| Credit cards | 1,098 |
| 63 |
| 11.53 |
| | 1,080 |
| 60 |
| 11.27 |
| | 1 |
| 2 |
| 3 |
| 1,032 |
| 56 |
| 10.89 |
| | 1,098 |
| 63 |
| 11.53 |
| | (4 | ) | (3 | ) | (7 | ) |
| Consumer indirect loans | 3,811 |
| 79 |
| 4.14 |
| | 3,303 |
| 70 |
| 4.28 |
| | 11 |
| (2 | ) | 9 |
| 4,756 |
| 91 |
| 3.84 |
| | 3,811 |
| 79 |
| 4.14 |
| | 18 |
| (6 | ) | 12 |
|
| Total consumer loans | 23,532 |
| 608 |
| 5.20 |
| | 23,353 |
| 573 |
| 4.94 |
| | 8 |
| 27 |
| 35 |
| 27,270 |
| 603 |
| 4.44 |
| | 23,532 |
| 608 |
| 5.20 |
| | 84 |
| (89 | ) | (5 | ) |
| Total loans | 90,220 |
| 2,164 |
| 4.83 |
| | 87,790 |
| 1,956 |
| 4.49 |
| | 56 |
| 152 |
| 208 |
| 102,058 |
| 2,021 |
| 3.98 |
| | 90,220 |
| 2,164 |
| 4.83 |
| | 252 |
| (395 | ) | (143 | ) |
| Loans held for sale | 1,212 |
| 28 |
| 4.64 |
| | 1,282 |
| 28 |
| 4.31 |
| | (2 | ) | 2 |
| — |
| 2,174 |
| 40 |
| 3.71 |
| | 1,212 |
| 28 |
| 4.64 |
| | 19 |
| (7 | ) | 12 |
|
Securities available for sale (b), (e) | 20,649 |
| 264 |
| 2.52 |
| | 17,665 |
| 192 |
| 2.09 |
| | 35 |
| 37 |
| 72 |
| 20,960 |
| 250 |
| 2.46 |
| | 20,649 |
| 264 |
| 2.52 |
| | 4 |
| (18 | ) | (14 | ) |
Held-to-maturity securities (b) | 11,213 |
| 135 |
| 2.41 |
| | 12,134 |
| 141 |
| 2.33 |
| | (11 | ) | 5 |
| (6 | ) | 9,575 |
| 118 |
| 2.47 |
| | 11,213 |
| 135 |
| 2.41 |
| | (20 | ) | 3 |
| (17 | ) |
| Trading account assets | 1,041 |
| 17 |
| 3.31 |
| | 925 |
| 14 |
| 3.11 |
| | 2 |
| 1 |
| 3 |
| 913 |
| 13 |
| 2.73 |
| | 1,041 |
| 17 |
| 3.31 |
| | (2 | ) | (2 | ) | (4 | ) |
| Short-term investments | 2,965 |
| 33 |
| 2.25 |
| | 2,032 |
| 16 |
| 1.64 |
| | 9 |
| 8 |
| 17 |
| 4,828 |
| 13 |
| .52 |
| | 2,965 |
| 33 |
| 2.25 |
| | 14 |
| (34 | ) | (20 | ) |
Other investments (e) | 647 |
| 8 |
| 2.35 |
| | 716 |
| 11 |
| 3.02 |
| | (1 | ) | (2 | ) | (3 | ) | 643 |
| 1 |
| .34 |
| | 647 |
| 8 |
| 2.35 |
| | — |
| (7 | ) | (7 | ) |
| Total earning assets | 127,947 |
| 2,649 |
| 4.16 |
| | 122,544 |
| 2,358 |
| 3.85 |
| | 88 |
| 203 |
| 291 |
| 141,151 |
| 2,456 |
| 3.51 |
| | 127,947 |
| 2,649 |
| 4.16 |
| | 267 |
| (460 | ) | (193 | ) |
| Allowance for loan and lease losses | (879 | ) | | | | (875 | ) | | | | | (1,255 | ) | | | | (879 | ) | | | | |
| Accrued income and other assets | 14,317 |
| | | | 13,982 |
| | | | | 15,268 |
| | | | 14,317 |
| | | | |
| Discontinued assets | 1,037 |
| | | | 1,272 |
| | | | | 815 |
| | | | 1,037 |
| | | | |
| Total assets | $ | 142,422 |
| | | | $ | 136,923 |
| | | | | $ | 155,979 |
| | | | $ | 142,422 |
| | | | |
| | | | | | | | | | | | | | | | | |
| LIABILITIES | | | | | | | | | | | | | | |
| NOW and money market deposit accounts | $ | 61,928 |
| 277 |
| .90 |
| | $ | 54,129 |
| 105 |
| .39 |
| | 17 |
| 155 |
| 172 |
| $ | 71,009 |
| 168 |
| .47 |
| | $ | 61,928 |
| 277 |
| .90 |
| | 36 |
| (145 | ) | (109 | ) |
| Savings deposits | 4,796 |
| 2 |
| .08 |
| | 6,254 |
| 10 |
| .32 |
| | (2 | ) | (6 | ) | (8 | ) | 4,893 |
| 1 |
| .04 |
| | 4,796 |
| 2 |
| .08 |
| | — |
| (1 | ) | (1 | ) |
| Certificates of deposit ($100,000 or more) | 8,261 |
| 95 |
| 2.31 |
| | 7,246 |
| 59 |
| 1.64 |
| | 9 |
| 27 |
| 36 |
| 5,630 |
| 58 |
| 2.08 |
| | 8,261 |
| 95 |
| 2.31 |
| | (28 | ) | (9 | ) | (37 | ) |
| Other time deposits | 5,535 |
| 51 |
| 1.86 |
| | 4,907 |
| 29 |
| 1.17 |
| | 4 |
| 18 |
| 22 |
| 4,617 |
| 38 |
| 1.67 |
| | 5,535 |
| 51 |
| 1.86 |
| | (8 | ) | (5 | ) | (13 | ) |
| Total interest-bearing deposits | 80,520 |
| 425 |
| 1.06 |
| | 72,536 |
| 203 |
| .56 |
| | 28 |
| 194 |
| 222 |
| 86,149 |
| 265 |
| .62 |
| | 80,520 |
| 425 |
| 1.06 |
| | — |
| (160 | ) | (160 | ) |
| Federal funds purchased and securities sold under repurchase agreements | 301 |
| 1 |
| .67 |
| | 1,448 |
| 9 |
| 1.26 |
| | (5 | ) | (3 | ) | (8 | ) | 1,122 |
| 6 |
| 1.05 |
| | 301 |
| 1 |
| .67 |
| | 4 |
| 1 |
| 5 |
|
| Bank notes and other short-term borrowings | 746 |
| 9 |
| 2.59 |
| | 1,228 |
| 13 |
| 2.05 |
| | (6 | ) | 2 |
| (4 | ) | 2,135 |
| 10 |
| .90 |
| | 746 |
| 9 |
| 2.59 |
| | 9 |
| (8 | ) | 1 |
|
Long-term debt (f), (g) | 13,187 |
| 240 |
| 3.67 |
| | 12,608 |
| 194 |
| 3.08 |
| | 9 |
| 37 |
| 46 |
| 12,698 |
| 161 |
| 2.62 |
| | 13,187 |
| 240 |
| 3.67 |
| | (9 | ) | (70 | ) | (79 | ) |
| Total interest-bearing liabilities | 94,754 |
| 675 |
| 1.44 |
| | 87,820 |
| 419 |
| .96 |
| | 26 |
| 230 |
| 256 |
| 102,104 |
| 442 |
| .87 |
| | 94,754 |
| 675 |
| 1.44 |
| | 4 |
| (237 | ) | (233 | ) |
| Noninterest-bearing deposits | 28,074 |
| | | | 30,747 |
| | | | | 33,004 |
| | | | 28,074 |
| | | | |
| Accrued expense and other liabilities | 2,437 |
| | | | 2,121 |
| | | | | 2,604 |
| | | | 2,437 |
| | | | |
Discontinued liabilities (g) | 1,037 |
| | | | 1,272 |
| | | | | 815 |
| | | | 1,037 |
| | | | |
| Total liabilities | 126,302 |
| | | | 121,960 |
| | | | | 138,527 |
| | | | 126,302 |
| | | | |
| EQUITY | | | | | | | | | | | | | | |
| Key shareholders’ equity | 16,119 |
| | | | 14,961 |
| | | | | 17,452 |
| | | | 16,119 |
| | | | |
| Noncontrolling interests | 1 |
| | | | 2 |
| | | | | — |
| | | | 1 |
| | | | |
| Total equity | 16,120 |
| | | | 14,963 |
| | | | | 17,452 |
| | | | 16,120 |
| | | | |
| Total liabilities and equity | $ | 142,422 |
| | | | $ | 136,923 |
| | | | | $ | 155,979 |
| | | | $ | 142,422 |
| | | | |
| | | | | | | | | | | | | | | |
| Interest rate spread (TE) | | 2.72 | % | | | 2.89 | % | | | | 2.64 | % | | | 2.72 | % | | |
| Net interest income (TE) and net interest margin (TE) | | 1,974 |
| 3.10 | % | | | 1,939 |
| 3.17 | % | | $ | 62 |
| $ | (27 | ) | $ | 35 |
| | 2,014 |
| 2.88 | % | | | 1,974 |
| 3.10 | % | | $ | 263 |
| $ | (223 | ) | $ | 40 |
|
TE adjustment (b) | | 16 |
| | | | 16 |
| | | | | 15 |
| | | | 16 |
| | | |
| Net interest income, GAAP basis | | $ | 1,958 |
| | | | $ | 1,923 |
| | | | | $ | 1,999 |
| | | | $ | 1,958 |
| | | |
| | | | | | | | | | | | | | | |
| |
| (a) | Results are from continuing operations. Interest excludes the interest associated with the liabilities referred to in (g) below, calculated using a matched funds transfer pricing methodology. |
| |
| (b) | Interest income on tax-exempt securities and loans has been adjusted to a taxable-equivalent basis using the statutory federal income tax rate of 21% for the six months ended June 30, 2019,2020, and June 30, 2018,2019, respectively. |
| |
| (c) | For purposes of these computations, nonaccrual loans are included in average loan balances. |
| |
| (d) | Commercial and industrial average balances include $137$140 million and $123$137 million of assets from commercial credit cards for the six months ended June 30, 2019,2020, and June 30, 2018,2019, respectively. |
| |
| (e) | Yield is calculated on the basis of amortized cost. |
| |
| (f) | Rate calculation excludes basis adjustments related to fair value hedges. |
| |
| (g) | A portion of long-term debt and the related interest expense is allocated to discontinued liabilities as a result of applying Key’s matched funds transfer pricing methodology to discontinued operations. |
Provision for credit losses
Our provision for credit losses was $482 million for the three months ended June 30, 2020, compared to $74 million for the three months ended June 30, 2019, compared to $642019. The provision for credit losses was $841 million for the threesix months ended June 30, 2018. Provision for credit losses was2020, compared to $136 million for the six months ended June 30, 2019, compared to $125 million for2019. We adopted the six months endedCECL accounting standard effective January 1, 2020, and the economic scenario used in the estimation of expected credit losses as of June 30, 2018. The provision for credit losses increased during2020, was materially affected by the three and six months ended June 30, 2019, primarily due to an increase in net loan charge-offs compared to the same periods one year ago. In 2019, we expect the provision to slightly exceed net loan charge-offs to provide for loan growth.COVID-19 pandemic.
Noninterest income
As shown in Figure 5, noninterest income was $622$692 million, and represented 39%40% of total revenue for the second quarter of 2019,2020, compared to $660$622 million, representing 40%39% of total revenue for the year-ago quarter. Noninterest income was $1.2 billion for the six months ended June 30, 2019, compared to $1.3 billion for the six months ended June 30, 2018. In 2019, we expect noninterest income to be in the range of $2.5 billion to $2.6 billion.
The following discussion explains the composition of certain elements of our noninterest income and the factors that caused those elements to change.
Figure 5. Noninterest Income
| |
| (a) | Other noninterest income includes operating lease income and other leasing gains, corporate services income, corporate-owned life insurance income, consumer mortgage income, commercial mortgage servicing fees, and other income. See the "Consolidated Statements of Income" in Item 1. Financial Statements of this report. |
Trust and investment services income
Trust and investment services income consists of brokerage commissions, trust and asset management fees, and insurance income. The assets under management that primarily generate these revenues are shown in Figure 6. For the three months ended June 30, 2019,2020, trust and investment services income decreased $6increased $1 million,
or 4.7%.8%, compared to the same period one year ago. For the six months ended June 30, 2019,2020, trust and investment services income was down $24increased $19 million, or 9.2%8.0%, from the six months ended June 30, 2018.2019. These decreasesincreases were primarily relateddue to the salean increase in brokerage commissions as a result of KIBS in May 2018, which contributed $7 million of income in the second quarter of 2018 and $22 million of income for the six months ended June 30, 2018. elevated trading volume due to market volatility.
A significant portion of our trust and investment services income depends on the value and mix of assets under management. At June 30, 2019,2020, our bank, trust, and registered investment advisory subsidiaries had assets under management of $38.9$39.7 billion, compared to $39.7$38.9 billion at June 30, 2018.2019. Assets under management were down,up, as shown in Figure 6, as the market continueddue to recover from the market decline that occurred during the second half of 2018.increased portfolio yields.
Figure 6. Assets Under Management
| | | in millions | June 30, 2019 | March 31, 2019 | December 31, 2018 | September 30, 2018 | June 30, 2018 | June 30, 2020 | March 31, 2020 | December 31, 2019 | September 30, 2019 | June 30, 2019 |
| Assets under management by investment type: | | |
| Equity | $ | 23,805 |
| $ | 23,299 |
| $ | 21,325 |
| $ | 24,958 |
| $ | 24,125 |
| $ | 23,303 |
| $ | 20,421 |
| $ | 25,271 |
| $ | 23,967 |
| $ | 23,805 |
|
| Securities lending | 520 |
| 761 |
| 774 |
| 1,049 |
| 977 |
| 171 |
| 188 |
| 309 |
| 455 |
| 520 |
|
| Fixed income | 10,800 |
| 10,817 |
| 10,696 |
| 10,946 |
| 11,276 |
| 11,318 |
| 10,911 |
| 11,000 |
| 10,954 |
| 10,800 |
|
| Money market | 3,817 |
| 3,865 |
| 3,980 |
| 3,622 |
| 3,285 |
| 4,930 |
| 4,669 |
| 4,253 |
| 4,040 |
| 3,817 |
|
| Total assets under management | $ | 38,942 |
| $ | 38,742 |
| $ | 36,775 |
| $ | 40,575 |
| $ | 39,663 |
| $ | 39,722 |
| $ | 36,189 |
| $ | 40,833 |
| $ | 39,416 |
| $ | 38,942 |
|
| | | |
Investment banking and debt placement fees
Investment banking and debt placement fees consists of syndication fees, debt and equity financing fees, financial adviser fees, gains on sales of commercial mortgages, and agency origination fees. Investment banking and debt placement fees decreased $7 million, or 4.3%, from the year-ago quarter. For the six months ended June 30, 2020, investment banking and debt placement fees decreased $1 million, or .4%, from the six months ended June 30,
placement fees increased $8 million, or 5.2%, from the year-ago quarter. The increase was2019. These decreases were primarily driven by lower syndication and merger and acquisition fees, partially offset by higher syndications fees and agency origination fees.gains on the sales of commercial mortgages.
Service charges on deposit accounts
Service charges on deposit accounts decreased $15 million, or 18.1%, for the three months ended June 30, 2020, compared to the same period one year ago. For the six months ended June 30, 2019, investment banking and debt placement fees were down $252020, service charges on deposit accounts decreased $13 million, or 8.4%7.9%, from the six months ended June 30, 2018,2019. These decreases were primarily due to lower customer spending and higher fee waivers related to the market disruption from the government shutdown early in 2019.ongoing COVID-19 pandemic.
Cards and payments income
Cards and payments income, which consists of debit card, consumer and commercial credit card, and merchant services income, increased $2$18 million, or 2.8%, from the year-ago quarter. For the six months ended June 30, 2019, cards and payments income was up $6 million, or 4.5%, from the six months ended June 30, 2018. These increases were primarily due to higher debit card, credit card, and merchant fees.
Service charges on deposit accounts
Service charges on deposit accounts decreased $8 million, or 8.8%24.7%, for the three months ended June 30, 2019,2020, compared to the same period one year ago. For the six months ended June 30, 2019, service charges on deposit accounts was down $152020, cards and payments income increased $18 million, or 8.3%12.9%, from the six months ended June 30, 2018.2019. These increases were driven by increased prepaid card activity due to state support program activity.
Other noninterest income
Other noninterest income includes operating lease income and other leasing gains, corporate services income,
corporate-owned life insurance income, consumer mortgage income, commercial mortgage servicing fees, and other income. Other noninterest income decreased $34increased $73 million, or 15.8%40.3%, from the year-ago quarter. quarter, primarily driven by higher consumer mortgage income, driven by a record level of loan originations and related fees in the second quarter of 2020 and higher operating lease income and other leasing gains, driven by gains from the sale of leveraged leases.
For the six months ended June 30, 2019,2020, other noninterest income was down $45$12 million, or 11.6%3.5%, from the six months ended June 30, 2018. Other income was down2019, primarily due to a $78 million gaindecline in other income related to market-related valuation adjustments of customer derivatives due to the significant increase in credit spreads, as well as trading losses and portfolio marks also related to the sale of KIBS duringwidening credit spreads in the secondmarket that occurred in the first quarter of 2018. Partially offsetting this was an increase in operating lease income and other leasing gains which was negatively impacted by a $42 million lease residual loss in the second quarter of 2018.2020.
Noninterest expense
As shown in Figure 7, noninterest expense was $1.0 billion for the second quarter of 2019,2020, compared to $993 million$1.0 billion for the second quarter of 2018. Noninterest expense was $2.0 billion for the six months ended June 30, 2019, compared to $2.0 billion for the six months ended June 30, 2018. In 2019, we expect noninterest expense to be in the range of $3.85 billion to $3.95 billion, excluding the impact of third quarter of 2019 activity as disclosed in Note 21 (“Subsequent Event”) of this report.2019.
The following discussion explains the composition of certain elements of our noninterest expense and the factors that caused those elements to change.
Figure 7. Noninterest Expense
| |
| (a) | Other noninterest expense includes equipment, operating lease expense, marketing, FDIC assessment, intangible asset amortization, OREO expense, net, and other expense. See the "Consolidated Statements of Income" in Item 1. Financial Statements of this report. |
Personnel
Personnel expense, the largest category of our noninterest expense, increaseddecreased by $3$17 million, or .5%2.9%, for the three months ended June 30, 2019, compared to the same period one year ago. This increase was driven by higher severance expense related to efficiency initiative actions taken during the quarter and higher incentive and stock-based compensation, partially offset by lower salaries and contract labor. For the six months ended June 30, 2019, personnel expense was down $28 million, or 2.4%, from the six months ended June 30, 2018, primarily due to lower salaries and contract labor and employee benefits, partially offset by higher severance expense related to efficiency initiative actions taken during the six months ended June 30, 2019.
Net occupancy
Net occupancy expense decreased $6 million, or 7.6%, for the second quarter of 2019,2020, compared to the same period one year ago. For the six months ended June 30, 2019, net occupancy2020, personnel expense was down $12$65 million, or 7.6%5.6%, from the six months ended June 30, 2018.2019. These decreases werereflected the successful implementation of our expense initiatives which drove personnel expenses lower.
Net occupancy
Net occupancy expense decreased $2 million, or 2.7%, for the second quarter of 2020, compared to the same period one year ago, driven by lower maintenance expenses and lease termination fees. For the six months ended June 30, 2020, net occupancy expense increased $2 million, or 1.4%, from the six months ended June 30, 2019. This increase was primarily due to lower rental expenses and real estate taxes. These decreases were partially offset by an increase in lease termination fees.higher property reserve expenses.
Other noninterest expense
Other noninterest expense includes equipment, operating lease expense, marketing, FDIC assessment, intangible asset amortization, OREO expense, and other miscellaneous expense categories. Other noninterest expense increased $30$9 million, or 13.3%3.5%, from the year-ago quarter. For the six months ended June 30, 2019,2020, other noninterest expense was up $19$20 million, or 4.1%, from the six months ended June 30, 2018.2019. These increases were primarily duerelated to an increasehigher other expense from $25 million of payments-related expenses incurred in charitable contributions and volume-driven expenses, which were partially offset by the eliminationsecond quarter of the FDIC surcharge.2020.
Income taxes
We recorded tax expense of $30 million for the second quarter of 2020 and $87 million for the second quarter of 2019 and $103 million for the second quarter of 2018.2019.
Our federal tax expense differs from the amount that would be calculated using the federal statutory tax rate, primarily because we generate income from investments in tax-advantaged assets, such as corporate-owned life insurance and credits associated with renewable energy and low-income housing investments, and make periodic adjustments to our tax reserves.
Additional information pertaining to how our tax expense (benefit) and the resulting effective tax rates were derived is included in Note 1314 (“Income Taxes”) beginning on page 144148 of our 20182019 Form 10-K.
Business Segment Results
Key previously reported its results of operations through two business segments, Key Community Bank and Key Corporate Bank, with the remaining operations recorded in Other. In the first quarter of 2019, Key underwent a company-wide organizational change, resulting in the realignment of its businesses into two reportable business segments, Consumer Bank and Commercial Bank, with the remaining operations that do not meet the criteria for disclosure as a separate reportable business recorded in Other. The new business segment structure aligns with how management reviews performance and makes decisions by client, segment and business unit. Prior period information was restated to conform to the new business segment structure.
This section summarizes the highlights and segment imperatives, market and business overview, and financial performance of our two major business segments (operating segments): Consumer Bank and Commercial Bank. Note 19 (“Business Segment Reporting”) describes the products and services offered by each of these business segments and provides more detailed financial information pertaining to the segments. For more information on the segment imperatives and market and business overview, see “Business Segment Results” beginning on page 50 of our 2019 Form 10-K. Dollars in the charts are presented in millions.
Consumer Bank
Segment imperatives
Simplification and digitalization to drive growth and operating leverage
Relationship-based strategy with a focus on financial wellness as a differentiator
Deliver ease, value, and expertise to help guide our clients to the right approach to meet their goals
Market and business overview
As the banking industry moves forward, so do our clients. Anticipating our client's needs not only today, but for tomorrow and into the future, has become one of the biggest challenges for the banking industry. We view these challenges as an opportunity to help our current client base meet their own goals, as well as attract new and diverse clients. In an increasingly digital world focused on specialized convenience, we have made meaningful steps to meet those demands through new digital portals and the acquisitions of HelloWallet in 2017 and Laurel Road in 2019. These platforms place us in a unique position to develop long lasting and meaningful relationships with our current and prospective clients. Financial wellness is a core tenet of our customer relationships and we see it in three different ways: diagnose, enhance, and sustain. Our goal is to get our clients to a place where they can comfortably sustain their current financial position so we can be there for them when they are ready to grow. Clients no longer go to a branch to conduct transactions only, they go to seek advice and gain new perspectives on issues they may be facing. Overall, we have a passion to help our clients through:
Ease - enabling simple and clear banking with no surprises
Value - knowing our clients and valuing each relationship
Expertise - provide our clients with industry-leading expertise and personalized service
Summary of operations
Net income attributable to Key of $172$91 million for the second quarter of 2019,2020, compared to $155$177 million for the year-ago quarter.quarter
Taxable equivalent net interest income was flat compared to the second quarter of 2019 as the lower interest rate environment offset balance sheet growth
Average loans and leases increased $7.3 billion, or 22.9%, driven by loan production related to the PPP, as well as growth from Laurel Road and consumer mortgage
Average deposits increased $7.2 billion, or 10.0%, from the second quarter of 2019. This was driven by consumer stimulus payments and lower consumer spend activity
Taxable-equivalent net interest income increased by $20 million, or 3.5%, from the second quarter of 2018. The increase in net interest income was primarily driven by balance sheet growth.
Average loans and leases increased $605 million, or 1.9%. This was driven by Laurel Road and strength in residential mortgage and indirect auto lending. This growth was partially offset by an $878 million, or 7.6%, decrease in home equity balances.
Average deposits increased $4.0 billion, or 5.9%, from the second quarter of 2018. This was driven by growth in money market and certificates of deposit, reflecting Key’s relationship strategy.
Provision for credit losses increased $1$127 million compared to the second quarter of 2018,2019. The increase in provision for credit losses is mainly attributable to the change in the economic scenario under the CECL accounting methodology, as credit quality remained stable.well as balance sheet growth
Noninterest income decreased $5increased $16 million, or 2.1%6.9%, from the year-ago quarter, driven by a record quarter in consumer mortgage income partially offset by lower service charges on deposit accounts.consumer spend activity
Noninterest expense decreased $9increased $3 million, or 1.6%.5%, from the year-ago quarter. The decline reflects the benefit of efficiency initiatives, strong expense discipline, and the elimination of the FDIC quarterly surcharge. The decline in expense was partially offset by the acquisition of Laurel Road.year ago quarter
Commercial Bank
Segment imperatives
Solve complex client needs through a differentiated product set of banking and capital markets capabilities
Drive targeted scale through distinct product capabilities delivered to a broad set of clients
Utilize industry expertise and broad capabilities to build relationships with narrowly targeted client sets
Market and business overview
Building relationships and delivering complex solutions for middle market clients requires a distinct operating model that understands their business and can provide a broad set of product capabilities. As competition for these clients intensifies, we have positioned the business to maintain and grow our competitive advantage by building targeted scale in businesses and client segments. Strong market share in businesses such as real estate loan servicing and equipment finance highlight our ability to successfully meet customer needs through targeted scale in distinct product capabilities. Clients expect us to understand every aspect of their business. Our seven industry verticals are aligned to drive targeted scale in segments where we have a deep breadth of industry expertise. Healthcare is the largest sector of the economy and one of our targeted verticals. Our acquisition of Cain Brothers in 2017 is one example of how we have expanded our business capabilities to further enhance our reputation as a trusted advisor to current and prospective clients. Our business model is positioned to meet our client needs because our focus is not on being a universal bank, but rather being the right bank for our clients.
Summary of operations
Net income attributable to Key of $283$120 million for the second quarter of 2019,2020, compared to $256$277 million for the year-ago quarter.quarter
Taxable-equivalent net interest income decreasedincreased by $13$37 million, compared to the second quarter of 2019, with balance sheet growth partially offset by lower interest rate environment
Average loan and lease balances increased $10.1 billion, or 3.1%17.5%, compared to the second quarter of 2018,2019 driven by lower purchase accounting accretiongrowth in commercial and loan spread compression.industrial loans from line draws and PPP loans
Average loan and leasedeposit balances increased $1.7$10.1 billion, or 3.1%28.2%, compared to the second quarter of 20182019, driven by broad-basedrelationship and targeted strategic growth in commercial and industrial loans.
Average deposit balances increased $2.8 billion, or 8.4%, compared to the second quarter of 2018, driven by growth in core deposits and short term transactional deposits.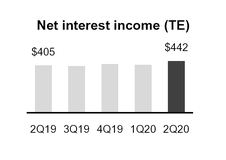
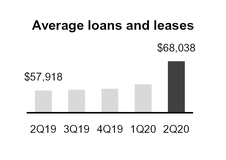
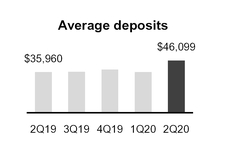
Provision for credit losses increased $8$281 million compared to the second quarter of 2018, driven2019. The increase in provision for credit losses is mainly attributable to the change in the economic scenario under the CECL accounting methodology, but it was also impacted by loan growth. Credit quality remained stable compared toline draws on commercial credits
Noninterest income increased $50 million, or 14.1%, from the second quarter of 2018.
Noninterest2019, driven by higher cards and payments income increased $51 million, or 16.8%, from the prior year. The year-ago quarter included a notable item of $42 million related to a residual loss on an operating lease. Investment banking and debt placement fees increased $8 million, or 5.2%, from the prior year, primarily related to strength in loan syndication fees.
Noninterest expense decreasedincreased by $10$14 million, or 2.6%3.6%, from the second quarter of 2018. The decline reflects the benefit of efficiency initiatives,2019 driven by higher incentives related to strong expense discipline, and the elimination of the FDIC quarterly surcharge.revenue production
Financial Condition
Loans and loans held for sale
Figure 8. Breakdown of Loans at June 30, 20192020
| |
| (a) | Other consumer loans include Consumer direct loans, Credit cards, and Consumer indirect loans. See Note 3 (“Loan Portfolio”) Item 1. Financial Statements of this report. |
At June 30, 2019,2020, total loans outstanding from continuing operations were $91.9$106.2 billion, compared to $89.6$94.6 billion at December 31, 2018.2019. For more information on balance sheet carrying value, see Note 1 (“Summary of Significant Accounting Policies”) under the headings “Loans” and “Loans Held for Sale” on page 99100 of our 20182019 Form 10-K.
COVID-19 Hardship Relief Programs
In response to the COVID-19 pandemic, beginning in March 2020, we began providing relief and flexibility to our customers through a variety of solutions, including fee waivers, short-term loan modifications, and payment deferrals as well as the suspension of vehicle repossessions and home foreclosures. While the solutions for our commercial borrowers are individually negotiated and tailored to each borrower’s specific facts and circumstances, the most commonly offered relief measures included temporary covenant waivers and/or deferrals of principal and/or interest payments for up to 90 days. We have also granted short-term loan modifications for our consumer loan customers through extensions, deferrals, and forbearance. As of June 30, 2020, commercial loans with an aggregate outstanding balance of $3.1 billion, representing 4.0% of the commercial portfolio, are in a short-term payment deferral or forbearance period as a result of a COVID-19 hardship. As of June 30, 2020, consumer loans with an aggregate outstanding balance of $1.5 billion, representing 5.5% of the consumer portfolio, are in a short-term payment deferral or forbearance period as a result of a COVID-19 hardship.
Under the CARES Act as well as banking regulator interagency guidance, certain loan modifications to borrowers experiencing financial distress as a result of the economic impacts created by COVID-19 may not be required to be treated as TDRs under U.S GAAP. For COVID-19 related loan modifications which occurred from March 1, 2020, through June 30, 2020, and met the loan modification criteria under either the CARES Act or the criteria specified by
the regulatory agencies or were otherwise considered to be short term in nature, we have elected to suspend TDR accounting for such loan modifications. Additionally, loans qualifying for these modifications are not required to be reported as delinquent, nonaccrual, impaired, or criticized solely as a result of a COVID-19 loan modification. Refer to Note 4 (“Asset Quality”) under the headings “TDRs” and “Nonperforming and Past Due Loans”.
For loans that receive a payment deferral or forbearance under these hardship relief programs, we continue to accrue interest and recognize interest income during the period of the deferral. Depending on the terms of each program, all or a portion of this accrued interest may be paid directly by the borrower (either during the relief period, at the end of the relief period, or at maturity of the loan) or added to the customer’s outstanding balance. For certain programs, the maturity date of the loan may also be extended by the number of payments deferred. Interest income will continue to be accrued at the original contractual interest rate unless that rate is concurrently modified upon entering the relief program (in which case, the modified rate would be used to recognize interest).
Commercial loan portfolio
Commercial loans outstanding were $67.9$78.2 billion at June 30, 2019,2020, an increase of $1.6$10.2 billion, or 2.3%15.0%, compared to December 31, 2018,2019, driven by the funding of over $8 billion of loans related to the PPP and an increase in commercial and industrial line draws.
As a result of the current economic environment, our commercial loan portfolio is going through active portfolio surveillance. We are conducting ongoing portfolio reviews on our commercial loans partially offsetwith any risk rating migrations being closely monitored. We have centralized internal reporting on enterprise-wide relief initiatives, as well as following any potential relief initiatives that may come in the future. We have also established a pandemic watchlist and are performing ongoing reviews of commercial clients that are likely to be impacted by declines in commercial mortgageCOVID-19. Overall, most of these clients represent a small portion of the overall portfolio and construction loans.are diversified by type and geography. Figure 9 summarizes our commercial portfolios that are at risk of being impacted by the COVID-19 pandemic as of June 30, 2020.
Figure 9. Select Commercial Portfolio Focus Areas
|
| | | | | |
| dollars in millions | Outstanding as of June 30, 2020 | Percent of
Loan Type to
Total Loans |
Consumer behavior (a) | $ | 5,206 |
| 4.9 | % |
| Education | 1,592 |
| 1.5 |
|
| Sports | 622 |
| .6 |
|
| Restaurants | 413 |
| .4 |
|
| | | |
Retail commercial real estate (b) | 684 |
| .6 |
|
| | | |
Nondurable retail (c) | 752 |
| .7 |
|
| | | |
Travel/Tourism (d) | 2,994 |
| 2.8 |
|
| Hotels | 905 |
| .9 |
|
| | | |
Leveraged lending (e) | 1,891 |
| 1.8 |
|
| | | |
| Oil and gas | 2,356 |
| 2.2 |
|
| Upstream (reserve based) | 1,505 |
| 1.4 |
|
| Midstream | 424 |
| .4 |
|
| Downstream | 161 |
| .2 |
|
| | | |
| |
| (a) | Consumer behavior includes restaurants, sports, entertainment and leisure, services, education, etc. |
| |
| (b) | Retail commercial real estate is mainly composed of regional malls, strip centers (unanchored) and lifestyle centers. |
| |
| (c) | Nondurable retail includes direct lending to retailers including apparel, hobby shops, nursery garden centers, cosmetics, and gas stations with convenience stores. |
| |
| (d) | Travel/Tourism includes hotels, tours, and air/water/rail leasing. |
| |
| (e) | Leveraged lending exposures have total debt to EBITDA greater than four times or senior debt to EBITDA greater than three times and meet the purpose test (the new debt finances a buyout, acquisition, or capital distribution). |
Figure 10 provides our commercial loan portfolios by industry classification at June 30, 2019,2020, and December 31, 2018.2019.
Figure 9.10. Commercial Loans by Industry | | | June 30, 2019 | Commercial and industrial | | Commercial real estate | | Commercial lease financing | | Total commercial loans | | Percent of total | |
| June 30, 2020 | | Commercial and industrial | | Commercial real estate | | Commercial lease financing | | Total commercial loans | | Percent of total |
| dollars in millions | Commercial and industrial | | Commercial real estate | | Commercial lease financing | | Total commercial loans | | Percent of total | |
| Industry classification: | | | | | | | | | | |
| Agriculture | $ | 972 |
| | $ | 172 |
| | $ | 113 |
| | $ | 1,257 |
| | 1.9 | % | $ | 1,060 |
| | $ | 158 |
| | $ | 105 |
| | $ | 1,323 |
| | 1.7 | % |
| Automotive | 2,033 |
| | 445 |
| | 31 |
| | 2,509 |
| | 3.7 |
| 1,836 |
| | 510 |
| | 22 |
| | 2,368 |
| | 3.0 |
|
| Business products | 1,607 |
| | 116 |
| | 60 |
| | 1,783 |
| | 2.6 |
| 1,726 |
| | 122 |
| | 49 |
| | 1,897 |
| | 2.4 |
|
| Business services | 2,949 |
| | 136 |
| | 229 |
| | 3,314 |
| | 4.9 |
| 4,632 |
| | 199 |
| | 191 |
| | 5,022 |
| | 6.4 |
|
| Chemicals | 877 |
| | 47 |
| | 54 |
| | 978 |
| | 1.5 |
| 820 |
| | 38 |
| | 42 |
| | 900 |
| | 1.2 |
|
| Commercial real estate | 6,098 |
| | 10,363 |
| | 27 |
| | 16,488 |
| | 24.3 |
| 5,838 |
| | 10,862 |
| | 12 |
| | 16,712 |
| | 21.4 |
|
| Construction materials and contractors | 1,955 |
| | 221 |
| | 225 |
| | 2,401 |
| | 3.5 |
| 2,815 |
| | 241 |
| | 247 |
| | 3,303 |
| | 4.2 |
|
| Consumer discretionary | 3,725 |
| | 416 |
| | 444 |
| | 4,585 |
| | 6.8 |
| 4,229 |
| | 400 |
| | 411 |
| | 5,040 |
| | 6.4 |
|
| Consumer services | 3,586 |
| | 714 |
| | 186 |
| | 4,486 |
| | 6.6 |
| 7,125 |
| | 913 |
| | 522 |
| | 8,560 |
| | 10.9 |
|
| Equipment | 1,583 |
| | 89 |
| | 75 |
| | 1,747 |
| | 2.6 |
| 1,794 |
| | 79 |
| | 126 |
| | 1,999 |
| | 2.6 |
|
| Finance | 5,648 |
| | 55 |
| | 398 |
| | 6,101 |
| | 9.0 |
| 6,541 |
| | 80 |
| | 378 |
| | 6,999 |
| | 9.0 |
|
| Healthcare | 3,956 |
| | 1,553 |
| | 342 |
| | 5,851 |
| | 8.6 |
| 4,296 |
| | 1,408 |
| | 331 |
| | 6,035 |
| | 7.7 |
|
| Materials manufacturing and mining | 1,007 |
| | 52 |
| | 41 |
| | 1,100 |
| | 1.6 |
| |
| Metals and mining | | 1,223 |
| | 47 |
| | 41 |
| | 1,311 |
| | 1.7 |
|
| Oil and gas | 1,944 |
| | 57 |
| | 60 |
| | 2,061 |
| | 3.0 |
| 2,290 |
| | 48 |
| | 80 |
| | 2,418 |
| | 3.1 |
|
| Public exposure | 2,817 |
| | 76 |
| | 1,042 |
| | 3,935 |
| | 5.8 |
| 2,350 |
| | 25 |
| | 688 |
| | 3,063 |
| | 3.9 |
|
| Technology | 885 |
| | 28 |
| | 127 |
| | 1,040 |
| | 1.5 |
| 831 |
| | 25 |
| | 212 |
| | 1,068 |
| | 1.4 |
|
| Transportation | 1,393 |
| | 194 |
| | 806 |
| | 2,393 |
| | 3.5 |
| 1,554 |
| | 220 |
| | 706 |
| | 2,480 |
| | 3.2 |
|
| Utilities | 4,830 |
| | 3 |
| | 318 |
| | 5,151 |
| | 7.6 |
| 6,551 |
| | 1 |
| | 361 |
| | 6,913 |
| | 8.8 |
|
| Other | 679 |
| | 1 |
| | — |
| | 680 |
| | 1.0 |
| 786 |
| | 8 |
| | — |
| | 794 |
| | 1.0 |
|
| Total | $ | 48,544 |
| | $ | 14,738 |
| | $ | 4,578 |
| | $ | 67,860 |
| | 100.0 | % | $ | 58,297 |
| | $ | 15,384 |
| | $ | 4,524 |
| | $ | 78,205 |
| | 100.0 | % |
| | | | | | | | | | | | | | | | | | | |
| December 31, 2018 | Commercial and industrial | | Commercial real estate | | Commercial lease financing | | Total commercial loans | | Percent of total | |
| December 31, 2019 | | Commercial and industrial | | Commercial real estate | | Commercial lease financing | | Total commercial loans | | Percent of total |
| dollars in millions | Commercial and industrial | | Commercial real estate | | Commercial lease financing | | Total commercial loans | | Percent of total | |
| Industry classification: | | | | | | | | | | |
| Agriculture | $ | 1,045 |
| | $ | 176 |
| | $ | 120 |
| | $ | 1,341 |
| | 2.0 | % | $ | 1,036 |
| | $ | 178 |
| | $ | 112 |
| | $ | 1,326 |
| | 1.9 | % |
| Automotive | 2,140 |
| | 448 |
| | 46 |
| | 2,634 |
| | 4.0 |
| 2,048 |
| | 467 |
| | 18 |
| | 2,533 |
| | 3.7 |
|
| Business products | 1,596 |
| | 127 |
| | 50 |
| | 1,773 |
| | 2.7 |
| 1,513 |
| | 111 |
| | 57 |
| | 1,681 |
| | 2.5 |
|
| Business services | 2,779 |
| | 136 |
| | 228 |
| | 3,143 |
| | 4.7 |
| 3,083 |
| | 203 |
| | 210 |
| | 3,496 |
| | 5.2 |
|
| Chemicals | 933 |
| | 43 |
| | 56 |
| | 1,032 |
| | 1.6 |
| 776 |
| | 40 |
| | 46 |
| | 862 |
| | 1.3 |
|
| Commercial real estate | 5,808 |
| | 10,830 |
| | 28 |
| | 16,666 |
| | 25.1 |
| 5,126 |
| | 10,469 |
| | 12 |
| | 15,607 |
| | 22.9 |
|
| Construction materials and contractors | 1,756 |
| | 207 |
| | 221 |
| | 2,184 |
| | 3.3 |
| 1,876 |
| | 238 |
| | 244 |
| | 2,358 |
| | 3.5 |
|
| Consumer discretionary | 3,675 |
| | 516 |
| | 489 |
| | 4,680 |
| | 7.1 |
| 3,646 |
| | 400 |
| | 467 |
| | 4,513 |
| | 6.6 |
|
| Consumer services | 3,354 |
| | 746 |
| | 195 |
| | 4,295 |
| | 6.5 |
| 4,567 |
| | 863 |
| | 535 |
| | 5,965 |
| | 8.8 |
|
| Equipment | 1,586 |
| | 89 |
| | 81 |
| | 1,756 |
| | 2.6 |
| 1,428 |
| | 76 |
| | 98 |
| | 1,602 |
| | 2.4 |
|
| Finance | 5,178 |
| | 459 |
| | 357 |
| | 5,994 |
| | 9.0 |
| 6,186 |
| | 64 |
| | 386 |
| | 6,636 |
| | 9.7 |
|
| Healthcare | 2,999 |
| | 1,743 |
| | 369 |
| | 5,111 |
| | 7.7 |
| 3,000 |
| | 1,564 |
| | 331 |
| | 4,895 |
| | 7.2 |
|
| Materials manufacturing and mining | 1,093 |
| | 46 |
| | 41 |
| | 1,180 |
| | 1.8 |
| |
| Metals and mining | | 1,117 |
| | 44 |
| | 41 |
| | 1,202 |
| | 1.8 |
|
| Oil and gas | 1,739 |
| | 51 |
| | 57 |
| | 1,847 |
| | 2.8 |
| 2,219 |
| | 54 |
| | 90 |
| | 2,363 |
| | 3.5 |
|
| Public exposure | 2,656 |
| | 73 |
| | 1,054 |
| | 3,783 |
| | 5.7 |
| 2,422 |
| | 24 |
| | 706 |
| | 3,152 |
| | 4.6 |
|
| Technology | 996 |
| | 28 |
| | 64 |
| | 1,088 |
| | 1.6 |
| 916 |
| | 27 |
| | 182 |
| | 1,125 |
| | 1.6 |
|
| Transportation | 1,377 |
| | 229 |
| | 829 |
| | 2,435 |
| | 3.7 |
| 1,298 |
| | 218 |
| | 737 |
| | 2,253 |
| | 3.3 |
|
| Utilities | 4,357 |
| | 4 |
| | 321 |
| | 4,682 |
| | 7.1 |
| 5,560 |
| | 2 |
| | 397 |
| | 5,959 |
| | 8.8 |
|
| Other | 686 |
| | — |
| | — |
| | 686 |
| | 1.0 |
| 478 |
| | 7 |
| | 19 |
| | 504 |
| | .7 |
|
| Total | $ | 45,753 |
| | $ | 15,951 |
| | $ | 4,606 |
| | $ | 66,310 |
| | 100.0 | % | $ | 48,295 |
| | $ | 15,049 |
| | $ | 4,688 |
| | $ | 68,032 |
| | 100.0 | % |
| | | | | | | | | | | | | | | | | | | |
Commercial and industrial. Commercial and industrial loans are the largest component of our loan portfolio, representing 53%55% of our total loan portfolio at June 30, 2019,2020, and 51% at December 31, 2018.2019. This portfolio is approximately 85%74% variable rate and consists of loans originated primarily to large corporate, middle market, and small business clients.
Commercial and industrial loans totaled $48.5$58.3 billion at June 30, 2019,2020, an increase of $2.8$10.0 billion, or 6.1%20.7%, compared to December 31, 2018.2019. The growth was broad-based and spread across most industry categories, including increased lendingas the impact of COVID-19 resulted in higher utilization rates and the finance, healthcare, utilities, and commercial real estate lending.second quarter of 2020 included over $8 billion of loans related to the PPP.
Commercial real estate loans. Our commercial real estate portfolio includes both mortgage and construction loans and is originated through two primary sources: our 15-state banking franchise, and KeyBank
Real Estate Capital, a national line of business within the Commercial Bank that cultivates relationships with owners of commercial real estate located both within and beyond the branch system. Nonowner-occupied properties, generally properties for which at least 50% of the debt service is provided by rental income from nonaffiliated third parties, represented 80% of total commercial real estate loans outstanding at June 30, 2019.2020. Construction loans, which provide a stream of funding for properties not fully leased at origination to support debt service payments over the term of the contract or project, represented 10%12% of commercial real estate loans at period end.
At June 30, 2019, commercial real estate loans totaled $14.7 billion, which includes $1.4 billion of construction loans. Compared to December 31, 2018, this portfolio decreased $1.2 billion, or 7.6%. driven by elevated paydowns
resulting from competitive headwinds and strategic exits. In addition, weAt June 30, 2020, commercial real estate loans totaled $15.4 billion, which includes $1.9 billion of construction loans. Compared to December 31, 2019, this portfolio increased $335 million, or 2.2%, We continue to focus primarily on owners of completed and stabilized commercial real estate in accordance with our relationship strategy.
As shown in Figure 10,11, our commercial real estate loan portfolio includes various property types and geographic
locations of the underlying collateral. These loans include commercial mortgage and construction loans in both
Consumer Bank and Commercial Bank.
Figure 10.11. Commercial Real Estate Loans
| | | | Geographic Region | | Total | Percent of Total | Construction | Commercial Mortgage | Geographic Region | | Total | Percent of Total | Construction | Commercial Mortgage |
| dollars in millions | West | Southwest | Central | Midwest | Southeast | Northeast | National | West | Southwest | Central | Midwest | Southeast | Northeast | National |
| June 30, 2019 | | | | |
| June 30, 2020 | | | | |
| Nonowner-occupied: | | | | | | |
| Retail properties | $ | 106 |
| $ | 41 |
| $ | 117 |
| $ | 151 |
| $ | 168 |
| $ | 637 |
| $ | 188 |
| $ | 1,408 |
| 9.6 | % | $ | 90 |
| $ | 1,318 |
| $ | 120 |
| $ | 15 |
| $ | 138 |
| $ | 124 |
| $ | 72 |
| $ | 468 |
| $ | 118 |
| $ | 1,055 |
| 6.9 | % | $ | 52 |
| $ | 1,003 |
|
| Multifamily properties | 550 |
| 199 |
| 929 |
| 590 |
| 1,051 |
| 1,397 |
| 610 |
| 5,326 |
| 36.1 |
| 1,093 |
| 4,233 |
| 652 |
| 247 |
| 901 |
| 866 |
| 1,439 |
| 1,421 |
| 256 |
| 5,782 |
| 37.6 |
| 1,464 |
| 4,318 |
|
| Health facilities | 66 |
| — |
| 72 |
| 82 |
| 165 |
| 529 |
| 370 |
| 1,284 |
| 8.7 |
| 25 |
| 1,259 |
| 73 |
| 77 |
| 85 |
| 94 |
| 167 |
| 474 |
| 368 |
| 1,338 |
| 8.7 |
| 65 |
| 1,273 |
|
| Office buildings | 204 |
| 7 |
| 252 |
| 114 |
| 167 |
| 758 |
| 130 |
| 1,632 |
| 11.1 |
| 77 |
| 1,555 |
| 269 |
| — |
| 304 |
| 151 |
| 215 |
| 659 |
| 173 |
| 1,771 |
| 11.5 |
| 43 |
| 1,728 |
|
| Warehouses | 39 |
| 35 |
| 26 |
| 22 |
| 42 |
| 233 |
| 153 |
| 550 |
| 3.7 |
| 9 |
| 541 |
| 60 |
| 33 |
| 87 |
| 85 |
| 43 |
| 257 |
| 135 |
| 700 |
| 4.5 |
| 46 |
| 654 |
|
| Manufacturing facilities | 30 |
| — |
| 35 |
| 6 |
| 40 |
| 57 |
| 56 |
| 224 |
| 1.5 |
| 4 |
| 220 |
| 41 |
| — |
| 36 |
| 5 |
| 40 |
| 37 |
| 61 |
| 220 |
| 1.4 |
| — |
| 220 |
|
| Hotels/Motels | 61 |
| — |
| 7 |
| — |
| 6 |
| 179 |
| 66 |
| 319 |
| 2.2 |
| — |
| 319 |
| 76 |
| — |
| 18 |
| — |
| 11 |
| 120 |
| 94 |
| 319 |
| 2.1 |
| 17 |
| 302 |
|
| Residential properties | — |
| — |
| — |
| 3 |
| 22 |
| 104 |
| — |
| 129 |
| .9 |
| 5 |
| 124 |
| — |
| — |
| — |
| 3 |
| — |
| 67 |
| — |
| 70 |
| .4 |
| 4 |
| 66 |
|
| Land and development | 17 |
| 5 |
| 5 |
| 3 |
| — |
| 6 |
| — |
| 36 |
| .2 |
| 30 |
| 6 |
| 19 |
| 5 |
| — |
| 2 |
| 2 |
| 29 |
| — |
| 57 |
| .4 |
| 33 |
| 24 |
|
| Other | 61 |
| 9 |
| 42 |
| 97 |
| 14 |
| 266 |
| 329 |
| 818 |
| 5.6 |
| 13 |
| 805 |
| 106 |
| 30 |
| 29 |
| 88 |
| 121 |
| 260 |
| 336 |
| 970 |
| 6.3 |
| 67 |
| 903 |
|
| Total nonowner-occupied | 1,134 |
| 296 |
| 1,485 |
| 1,068 |
| 1,675 |
| 4,166 |
| 1,902 |
| 11,726 |
| 79.6 |
| 1,346 |
| 10,380 |
| 1,416 |
| 407 |
| 1,598 |
| 1,418 |
| 2,110 |
| 3,792 |
| 1,541 |
| 12,282 |
| 79.8 |
| 1,791 |
| 10,491 |
|
| Owner-occupied | 818 |
| 14 |
| 292 |
| 496 |
| 84 |
| 1,308 |
| — |
| 3,012 |
| 20.4 |
| 93 |
| 2,919 |
| 859 |
| 4 |
| 298 |
| 543 |
| 69 |
| 1,329 |
| — |
| 3,102 |
| 20.2 |
| 128 |
| 2,974 |
|
| Total | $ | 1,952 |
| $ | 310 |
| $ | 1,777 |
| $ | 1,564 |
| $ | 1,759 |
| $ | 5,474 |
| $ | 1,902 |
| 14,738 |
| 100.0 | % | $ | 1,439 |
| $ | 13,299 |
| $ | 2,275 |
| $ | 411 |
| $ | 1,896 |
| $ | 1,961 |
| $ | 2,179 |
| $ | 5,121 |
| $ | 1,541 |
| 15,384 |
| 100.0 | % | $ | 1,919 |
| $ | 13,465 |
|
| | | | | | | |
| Nonperforming loans | — |
| — |
| — |
| $ | 11 |
| $ | 9 |
| $ | 18 |
| $ | 51 |
| $ | 89 |
| N/M |
| 2 |
| $ | 87 |
| $ | 2 |
| — |
| — |
| $ | 9 |
| $ | 7 |
| $ | 23 |
| $ | 52 |
| $ | 93 |
| N/M |
| $ | 1 |
| $ | 92 |
|
| Accruing loans past due 90 days or more | 1 |
| — |
| — |
| 1 |
| — |
| 9 |
| — |
| 11 |
| N/M |
| $ | — |
| 11 |
| — |
| — |
| — |
| — |
| — |
| 14 |
| — |
| 14 |
| N/M |
| 2 |
| 12 |
|
| Accruing loans past due 30 through 89 days | $ | — |
| 3 |
| $ | 2 |
| 6 |
| 11 |
| 20 |
| — |
| 42 |
| N/M |
| 20 |
| 22 |
| 4 |
| — |
| $ | 20 |
| 10 |
| 1 |
| 58 |
| — |
| 93 |
| N/M |
| — |
| 93 |
|
| | | | | | | |
| December 31, 2018 | | | | |
| December 31, 2019 | | | | |
| Nonowner-occupied: | | | | | | |
| Retail properties | $ | 126 |
| $ | 45 |
| $ | 142 |
| $ | 174 |
| $ | 184 |
| $ | 674 |
| $ | 302 |
| $ | 1,647 |
| 10.3 | % | $ | 82 |
| $ | 1,565 |
| $ | 133 |
| $ | 41 |
| $ | 143 |
| $ | 155 |
| $ | 161 |
| $ | 580 |
| $ | 124 |
| $ | 1,337 |
| 8.9 | % | $ | 85 |
| $ | 1,252 |
|
| Multifamily properties | 452 |
| 210 |
| 914 |
| 608 |
| 1,153 |
| 1,708 |
| 693 |
| 5,738 |
| 36.0 |
| 1,163 |
| 4,575 |
| 698 |
| 354 |
| 767 |
| 795 |
| 1,205 |
| 1,350 |
| 225 |
| 5,394 |
| 35.8 |
| 1,189 |
| 4,205 |
|
| Health facilities | 98 |
| — |
| 49 |
| 59 |
| 153 |
| 724 |
| 385 |
| 1,468 |
| 9.2 |
| 20 |
| 1,449 |
| 76 |
| 44 |
| 104 |
| 93 |
| 163 |
| 497 |
| 405 |
| 1,382 |
| 9.2 |
| 40 |
| 1,342 |
|
| Office buildings | 270 |
| 7 |
| 224 |
| 90 |
| 165 |
| 851 |
| 119 |
| 1,726 |
| 10.8 |
| 120 |
| 1,605 |
| 214 |
| 7 |
| 293 |
| 132 |
| 244 |
| 725 |
| 134 |
| 1,749 |
| 11.6 |
| 69 |
| 1,680 |
|
| Warehouses | 66 |
| 34 |
| 20 |
| 47 |
| 71 |
| 290 |
| 203 |
| 731 |
| 4.6 |
| 48 |
| 684 |
| 51 |
| 34 |
| 51 |
| 51 |
| 46 |
| 238 |
| 134 |
| 605 |
| 4.0 |
| 7 |
| 598 |
|
| Manufacturing facilities | 42 |
| — |
| 36 |
| 3 |
| 25 |
| 38 |
| 91 |
| 235 |
| 1.5 |
| 20 |
| 215 |
| 36 |
| — |
| 38 |
| 4 |
| 40 |
| 43 |
| 54 |
| 215 |
| 1.4 |
| 5 |
| 210 |
|
| Hotels/Motels | 95 |
| — |
| 19 |
| — |
| 6 |
| 204 |
| 62 |
| 386 |
| 2.4 |
| — |
| 386 |
| 76 |
| — |
| 19 |
| — |
| 12 |
| 129 |
| 57 |
| 293 |
| 1.9 |
| 6 |
| 287 |
|
| Residential properties | 3 |
| — |
| — |
| 3 |
| 21 |
| 135 |
| — |
| 162 |
| 1.0 |
| 53 |
| 109 |
| — |
| — |
| — |
| 2 |
| — |
| 98 |
| — |
| 100 |
| .7 |
| 5 |
| 95 |
|
| Land and development | 17 |
| 4 |
| 5 |
| 2 |
| — |
| 48 |
| — |
| 76 |
| .5 |
| 52 |
| 23 |
| 20 |
| 5 |
| — |
| 3 |
| 2 |
| 9 |
| — |
| 39 |
| .3 |
| 34 |
| 5 |
|
| Other | 46 |
| 9 |
| 61 |
| 53 |
| 4 |
| 323 |
| 151 |
| 647 |
| 4.0 |
| 11 |
| 636 |
| 80 |
| 9 |
| 71 |
| 86 |
| 22 |
| 259 |
| 358 |
| 885 |
| 5.9 |
| 23 |
| 862 |
|
| Total nonowner-occupied | 1,215 |
| 309 |
| 1,470 |
| 1,039 |
| 1,782 |
| 4,995 |
| 2,006 |
| 12,816 |
| 80.3 |
| 1,569 |
| 11,247 |
| 1,384 |
| 494 |
| 1,486 |
| 1,321 |
| 1,895 |
| 3,928 |
| 1,491 |
| 11,999 |
| 79.7 |
| 1,463 |
| 10,536 |
|
| Owner-occupied | 837 |
| 25 |
| 283 |
| 493 |
| 58 |
| 1,439 |
| — |
| 3,135 |
| 19.7 |
| 97 |
| 3,038 |
| 833 |
| 4 |
| 285 |
| 536 |
| 71 |
| 1,321 |
| — |
| 3,050 |
| 20.3 |
| 95 |
| 2,955 |
|
| Total | $ | 2,052 |
| $ | 334 |
| $ | 1,753 |
| $ | 1,532 |
| $ | 1,840 |
| $ | 6,434 |
| $ | 2,006 |
| $ | 15,951 |
| 100.0 | % | $ | 1,666 |
| $ | 14,285 |
| $ | 2,217 |
| $ | 498 |
| $ | 1,771 |
| $ | 1,857 |
| $ | 1,966 |
| $ | 5,249 |
| $ | 1,491 |
| $ | 15,049 |
| 100.0 | % | $ | 1,558 |
| $ | 13,491 |
|
| | | | | | | |
| Nonperforming loans | $ | 1 |
| — |
| — |
| $ | 8 |
| — |
| $ | 7 |
| $ | 53 |
| $ | 69 |
| N/M |
| — |
| $ | 69 |
| $ | 1 |
| — |
| — |
| $ | 7 |
| 7 |
| $ | 20 |
| $ | 52 |
| $ | 87 |
| N/M |
| 2 |
| $ | 85 |
|
| Accruing loans past due 90 days or more | — |
| — |
| — |
| 2 |
| $ | 11 |
| 11 |
| — |
| 24 |
| N/M |
| $ | 12 |
| 12 |
| — |
| — |
| — |
| 2 |
| $ | — |
| 11 |
| — |
| 13 |
| N/M |
| $ | 1 |
| 12 |
|
| Accruing loans past due 30 through 89 days | — |
| — |
| $ | 11 |
| 1 |
| 1 |
| 23 |
| 13 |
| 49 |
| N/M |
| 13 |
| 36 |
| 1 |
| — |
| — |
| 7 |
| — |
| 8 |
| — |
| 16 |
| N/M |
| 2 |
| 14 |
|
|
| |
| West – | Alaska, California, Hawaii, Idaho, Montana, Oregon, Washington, and Wyoming |
| Southwest – | Arizona, Nevada, and New Mexico |
| Central – | Arkansas, Colorado, Oklahoma, Texas, and Utah |
| Midwest – | Illinois, Indiana, Iowa, Kansas, Michigan, Minnesota, Missouri, Nebraska, North Dakota, Ohio, South Dakota, and Wisconsin |
| Southeast – | Alabama, Delaware, Florida, Georgia, Kentucky, Louisiana, Maryland, Mississippi, North Carolina, South Carolina, Tennessee, Virginia, Washington D.C., and West Virginia |
| Northeast – | Connecticut, Maine, Massachusetts, New Hampshire, New Jersey, New York, Pennsylvania, Rhode Island, and Vermont |
| National – | Accounts in three or more regions |
Consumer loan portfolio
Consumer loans outstanding increased by $835 million,$1.3 billion, or 3.6%5.0%, from December 31, 2018, as2019, driven by growth from the consumer mortgage business and Laurel Road, residential mortgage loans, and indirect auto lending more than offset the decline in home equity loans. Laurel Road loan originations were over $400 million for the quarter.Road.
The home equity portfolio is comprised of loans originated by our Consumer Bank within our 15-state footprint and is the largest segment of our consumer loan portfolio, representing 44%35% of consumer loans outstanding at June 30, 2019.2020.
We held the first lien position for approximately 60%63% of the home equity portfolio at both June 30, 2019,2020, and June 30, 2018.61% at December 31, 2019. For loans with real estate collateral, we track borrower performance monthly. Regardless of the lien position, credit metrics are refreshed quarterly, including recent FICO scores as well as updated loan-to-value ratios. This information is used in establishing the ALLL. Our methodology is described in Note 1 (“SummaryBasis of SignificantPresentation and Accounting Policies”) under the heading “Allowance for Loan and Lease Losses” beginning on page 101 of our 2018 Form 10-K.this report.
Figure 11.12. Consumer Loans by State
| | | | Real estate — residential mortgage | Home equity loans | Consumer direct loans | Credit cards | Consumer indirect loans | Total | Real estate — residential mortgage | Home equity loans | Consumer direct loans | Credit cards | Consumer indirect loans | Total |
| June 30, 2019 | | |
| June 30, 2020 | | |
| New York | $ | 1,143 |
| $ | 2,718 |
| $ | 410 |
| $ | 393 |
| $ | 740 |
| $ | 5,404 |
| $ | 1,155 |
| $ | 2,575 |
| $ | 591 |
| $ | 346 |
| $ | 753 |
| $ | 5,420 |
|
| Ohio | 525 |
| 1,466 |
| 388 |
| 239 |
| 632 |
| 3,250 |
| 666 |
| 1,387 |
| 478 |
| 213 |
| 902 |
| 3,646 |
|
| Washington | 853 |
| 1,645 |
| 219 |
| 100 |
| 9 |
| 2,826 |
| 1,465 |
| 1,426 |
| 246 |
| 88 |
| 8 |
| 3,233 |
|
| Pennsylvania | 282 |
| 691 |
| 85 |
| 53 |
| 344 |
| 1,455 |
| 291 |
| 659 |
| 243 |
| 49 |
| 503 |
| 1,745 |
|
| Maine | 105 |
| 444 |
| 61 |
| 37 |
| 309 |
| 956 |
| |
| California | | 280 |
| 16 |
| 250 |
| 4 |
| 23 |
| 573 |
|
| Texas | | 37 |
| 9 |
| 191 |
| 3 |
| 12 |
| 252 |
|
| Colorado | 347 |
| 475 |
| 73 |
| 33 |
| 2 |
| 930 |
| 697 |
| 392 |
| 128 |
| 30 |
| 2 |
| 1,249 |
|
| Connecticut | 1,065 |
| 387 |
| 36 |
| 24 |
| 146 |
| 1,658 |
| 988 |
| 362 |
| 81 |
| 23 |
| 146 |
| 1,600 |
|
| Oregon | | 636 |
| 823 |
| 97 |
| 41 |
| 2 |
| 1,599 |
|
| Massachusetts | 252 |
| 49 |
| 31 |
| 5 |
| 377 |
| 714 |
| 253 |
| 48 |
| 92 |
| 5 |
| 439 |
| 837 |
|
| Oregon | 417 |
| 869 |
| 79 |
| 47 |
| 2 |
| 1,414 |
| |
| Indiana | 104 |
| 406 |
| 110 |
| 46 |
| 75 |
| 741 |
| |
| Other | 960 |
| 1,425 |
| 858 |
| 119 |
| 1,367 |
| 4,729 |
| 1,681 |
| 2,085 |
| 1,930 |
| 172 |
| 1,932 |
| 7,800 |
|
| Total | $ | 6,053 |
| $ | 10,575 |
| $ | 2,350 |
| $ | 1,096 |
| $ | 4,003 |
| $ | 24,077 |
| $ | 8,149 |
| $ | 9,782 |
| $ | 4,327 |
| $ | 974 |
| $ | 4,722 |
| $ | 27,954 |
|
| | | |
| | | |
| | Real estate — residential mortgage | Home equity loans | Consumer direct loans | Credit cards | Consumer indirect loans | Total | Real estate — residential mortgage | Home equity loans | Consumer direct loans | Credit cards | Consumer indirect loans | Total |
| December 31, 2018 | | |
| December 31, 2019 | | |
| New York | $ | 1,117 |
| $ | 2,881 |
| $ | 402 |
| $ | 415 |
| $ | 730 |
| $ | 5,545 |
| $ | 1,146 |
| $ | 2,655 |
| $ | 548 |
| $ | 404 |
| $ | 797 |
| $ | 5,550 |
|
| Ohio | 479 |
| 1,538 |
| 383 |
| 252 |
| 506 |
| 3,158 |
| 601 |
| 1,458 |
| 461 |
| 247 |
| 827 |
| 3,594 |
|
| Washington | 714 |
| 1,714 |
| 234 |
| 104 |
| 11 |
| 2,777 |
| 1,126 |
| 1,546 |
| 252 |
| 102 |
| 8 |
| 3,034 |
|
| Pennsylvania | 275 |
| 726 |
| 83 |
| 52 |
| 276 |
| 1,412 |
| 282 |
| 677 |
| 189 |
| 55 |
| 477 |
| 1,680 |
|
| California | 49 |
| 27 |
| 13 |
| 4 |
| 38 |
| 131 |
| |
| Connecticut | | 1,029 |
| 375 |
| 68 |
| 26 |
| 154 |
| 1,652 |
|
| Oregon | | 517 |
| 852 |
| 94 |
| 48 |
| 2 |
| 1,513 |
|
| Colorado | 256 |
| 509 |
| 76 |
| 35 |
| 2 |
| 878 |
| 544 |
| 428 |
| 109 |
| 34 |
| 2 |
| 1,117 |
|
| Connecticut | 1,090 |
| 413 |
| 30 |
| 23 |
| 143 |
| 1,699 |
| |
| Texas | 1 |
| 15 |
| 8 |
| 4 |
| 18 |
| 46 |
| |
| Oregon | 366 |
| 905 |
| 80 |
| 47 |
| 3 |
| 1,401 |
| |
| Maine | | 123 |
| 434 |
| 71 |
| 38 |
| 359 |
| 1,025 |
|
| Indiana | | 117 |
| 412 |
| 131 |
| 47 |
| 118 |
| 825 |
|
| Massachusetts | 255 |
| 50 |
| 27 |
| 5 |
| 341 |
| 678 |
| 257 |
| 48 |
| 62 |
| 6 |
| 437 |
| 810 |
|
| Other | 911 |
| 2,364 |
| 473 |
| 203 |
| 1,566 |
| 5,517 |
| 1,281 |
| 1,389 |
| 1,528 |
| 123 |
| 1,493 |
| 5,814 |
|
| Total | $ | 5,513 |
| $ | 11,142 |
| $ | 1,809 |
| $ | 1,144 |
| $ | 3,634 |
| $ | 23,242 |
| $ | 7,023 |
| $ | 10,274 |
| $ | 3,513 |
| $ | 1,130 |
| $ | 4,674 |
| $ | 26,614 |
|
| | | |
Figure 1213 summarizes our loan sales for the first six months of 20192020 and all of 2018.2019.
Figure 12.13. Loans Sold (Including Loans Held for Sale)
| | | in millions | Commercial | Commercial Real Estate | Commercial Lease Financing | Residential Real Estate | Total | Commercial | Commercial Real Estate | Commercial Lease Financing | Residential Real Estate | Consumer Direct | Total |
| 2019 | | |
| 2020 | | | | |
| Second quarter | $ | 154 |
| $ | 1,864 |
| $ | 96 |
| $ | 329 |
| $ | 2,443 |
| $ | 82 |
| $ | 2,661 |
| $ | 47 |
| $ | 925 |
| — |
| $ | 3,715 |
|
| First quarter | 301 |
| 1,536 |
| 34 |
| 225 |
| 2,096 |
| 55 |
| 2,022 |
| 81 |
| 546 |
| — |
| 2,704 |
|
| Total | $ | 455 |
| $ | 3,400 |
| $ | 130 |
| $ | 554 |
| $ | 4,539 |
| $ | 137 |
| $ | 4,683 |
| $ | 128 |
| $ | 1,471 |
| — |
| $ | 6,419 |
|
| 2018 | | | |
| 2019 | | | | |
| Fourth quarter | $ | 157 |
| $ | 4,918 |
| $ | 104 |
| $ | 331 |
| $ | 5,510 |
| $ | 50 |
| $ | 3,138 |
| $ | 222 |
| $ | 559 |
| — |
| $ | 3,969 |
|
| Third quarter | 247 |
| 2,242 |
| 52 |
| 302 |
| 2,843 |
| 220 |
| 2,600 |
| 68 |
| 569 |
| $ | 247 |
| 3,704 |
|
| Second quarter | 253 |
| 2,266 |
| 144 |
| 308 |
| 2,971 |
| 154 |
| 1,864 |
| 96 |
| 329 |
| — |
| 2,443 |
|
| First quarter | 141 |
| 2,251 |
| 66 |
| 284 |
| 2,742 |
| 301 |
| 1,536 |
| 34 |
| 225 |
| — |
| 2,096 |
|
| Total | $ | 798 |
| $ | 11,677 |
| $ | 366 |
| $ | 1,225 |
| $ | 14,066 |
| $ | 725 |
| $ | 9,138 |
| $ | 420 |
| $ | 1,682 |
| $ | 247 |
| $ | 12,212 |
|
| | | |
Figure 1314 shows loans that are either administered or serviced by us, but not recorded on the balance sheet; this includes loans that were sold.
Figure 13.14. Loans Administered or Serviced
| | | in millions | June 30, 2019 |
| March 31, 2019 |
| December 31, 2018 |
| September 30, 2018 |
| June 30, 2018 |
| June 30, 2020 |
| March 31, 2020 |
| December 31, 2019 |
| September 30, 2019 |
| June 30, 2019 |
|
| Commercial real estate loans | $ | 310,792 |
| $ | 300,989 |
| $ | 291,158 |
| $ | 270,771 |
| $ | 256,062 |
| $ | 357,509 |
| $ | 354,919 |
| $ | 347,186 |
| $ | 317,152 |
| $ | 310,792 |
|
| Residential mortgage | 5,428 |
| 5,304 |
| 5,209 |
| 5,046 |
| 4,893 |
| 6,922 |
| 6,405 |
| 6,146 |
| 5,749 |
| 5,428 |
|
| Education loans | 693 |
| 727 |
| 766 |
| 804 |
| 845 |
| 567 |
| 594 |
| 625 |
| 658 |
| 693 |
|
| Commercial lease financing | 934 |
| 924 |
| 916 |
| 892 |
| 915 |
| 1,126 |
| 1,029 |
| 1,047 |
| 969 |
| 934 |
|
| Commercial loans | 588 |
| 562 |
| 549 |
| 534 |
| 518 |
| 623 |
| 614 |
| 591 |
| 590 |
| 588 |
|
| Consumer direct | | 1,710 |
| 1,999 |
| 2,243 |
| 2,272 |
| — |
|
| Total | $ | 318,435 |
| $ | 308,506 |
| $ | 298,598 |
| $ | 278,047 |
| $ | 263,233 |
| $ | 368,457 |
| $ | 365,560 |
| $ | 357,838 |
| $ | 327,390 |
| $ | 318,435 |
|
| | | |
In the event of default by a borrower, we are subject to recourse with respect to approximately $4.4$5.5 billion of the $318.4$368.5 billion of loans administered or serviced at June 30, 2019.2020. Additional information about this recourse arrangement is included in Note 16 (“Contingent Liabilities and Guarantees”) under the heading “Recourse agreement with FNMA.”
We derive income from several sources when retaining the right to administer or service loans that are sold. We earn noninterest income (recorded as “mortgage“Consumer mortgage income” and “Commercial mortgage servicing fees”) from fees for servicing or administering loans. This fee income is reduced by the amortization of related servicing assets. In addition, we earn interest income from investing funds generated by escrow deposits collected in connection with the servicing loans. Additional information about our mortgage servicing assets is included in Note 8 (“Mortgage Servicing Assets”).
Securities
Our securities portfolio totaled $32.4$32.7 billion at June 30, 2019,2020, compared to $30.9$31.9 billion at December 31, 2018.2019. Available-for-sale securities were $21.5$23.6 billion at June 30, 2019,2020, compared to $19.4$21.8 billion at December 31, 2018.2019. Held-to-maturity securities were $10.9$9.1 billion at June 30, 2019,2020, and $11.5$10.1 billion at December 31, 2018.2019.
As shown in Figure 14,15, all of our mortgage-backed securities, which include both securities available for sale and held-to-maturity securities, are issued by government-sponsored enterprises or GNMA and traded in liquid secondary markets. These securities are recorded on the balance sheet at fair value for the available-for-sale portfolio and at amortized cost for the held-to-maturity portfolio. For more information about these securities, see Note 1 (“Basis of Presentation and Accounting Policies”), Note 5 (“Fair Value Measurements”) under the heading “Qualitative Disclosures of Valuation Techniques”Techniques,” and Note 6 (“Securities”).
Figure 14.15. Mortgage-Backed Securities by Issuer
| | | in millions | June 30, 2019 | December 31, 2018 | June 30, 2020 | December 31, 2019 |
| FHLMC | $ | 5,645 |
| $ | 7,048 |
| $ | 5,465 |
| $ | 5,115 |
|
| FNMA | 12,597 |
| 10,076 |
| 10,653 |
| 12,308 |
|
| GNMA | 13,837 |
| 13,637 |
| 13,051 |
| 14,112 |
|
Total (a) | $ | 32,079 |
| $ | 30,761 |
| $ | 29,169 |
| $ | 31,535 |
|
| | | |
| |
| (a) | Includes securities held in the available-for-sale and held-to-maturity portfolios. |
Securities available for sale
The majority of our securities available for sale portfolio consists of federal agency CMOs and mortgage-backed securities. CMOs are debt securities secured by a pool of mortgages or mortgage-backed securities. These mortgage securities generate interest income, serve as collateral to support certain pledging agreements, and provide liquidity value under regulatory requirements.
Figure 1516 shows the composition, yields, and remaining maturities of our securities available for sale. For more information about these securities, including gross unrealized gains and losses by type of security and securities pledged, see Note 6 (“Securities”).
Figure 15.16. Securities Available for Sale
| | | dollars in millions | U.S. Treasury, Agencies, and Corporations | States and Political Subdivisions | Agency Residential Collateralized Mortgage Obligations (a) | Agency Residential Mortgage-backed Securities (a) | Agency Commercial Mortgage-backed Securities (a) | Other Securities | Total | Weighted-Average Yield (b) | U.S. Treasury, Agencies, and Corporations | States and Political Subdivisions | Agency Residential Collateralized Mortgage Obligations (a) | Agency Residential Mortgage-backed Securities (a) | Agency Commercial Mortgage-backed Securities (a) | Other Securities | Total | Weighted-Average Yield (b) |
| June 30, 2019 | | | |
| June 30, 2020 | | | |
| Remaining maturity: | | | | |
| One year or less | $ | 173 |
| $ | 2 |
| $ | 162 |
| $ | 6 |
| — |
| $ | 35 |
| $ | 378 |
| 2.29 | % | $ | 3,465 |
| $ | 4 |
| $ | 447 |
| $ | 1 |
| — |
| $ | 11 |
| $ | 3,928 |
| .39 | % |
| After one through five years | 98 |
| 3 |
| 12,064 |
| 1,135 |
| $ | 3,235 |
| — |
| 16,535 |
| 2.47 |
| — |
| — |
| 9,930 |
| 1,424 |
| $ | 3,670 |
| — |
| 15,024 |
| 2.39 |
|
| After five through ten years | — |
| — |
| 1,386 |
| 912 |
| 2,308 |
| — |
| 4,606 |
| 2.93 |
| — |
| — |
| 1,570 |
| 18 |
| 3,057 |
| 1 |
| 4,646 |
| 2.53 |
|
| After ten years | 1 |
| — |
| — |
| 8 |
| — |
| — |
| 9 |
| 3.25 |
| — |
| — |
| — |
| 2 |
| — |
| — |
| 2 |
| 3.34 |
|
| Fair value | $ | 272 |
| $ | 5 |
| $ | 13,612 |
| $ | 2,061 |
| $ | 5,543 |
| $ | 35 |
| $ | 21,528 |
| — |
| $ | 3,465 |
| $ | 4 |
| $ | 11,947 |
| $ | 1,445 |
| $ | 6,727 |
| $ | 12 |
| $ | 23,600 |
| — |
|
| Amortized cost | 272 |
| 5 |
| 13,593 |
| 2,035 |
| 5,472 |
| 17 |
| 21,394 |
| 2.56 | % | $ | 3,465 |
| $ | 3 |
| $ | 11,600 |
| $ | 1,373 |
| $ | 6,301 |
| $ | 8 |
| $ | 22,750 |
| 2.07 | % |
Weighted-average yield (b) | 1.95 | % | 5.40 | % | 2.40 | % | 2.71 | % | 2.93 | % | — |
| 2.56 | % | — |
| 0.16 | % | 4.43 | % | 2.16 | % | 2.78 | % | 2.80 | % | .05 | % | 2.07 | % | — |
|
| Weighted-average maturity | 1.6 years |
| 1.0 years |
| 3.6 years |
| 4.6 years |
| 5.1 years |
| .7 years |
| 4.0 years |
| — |
| .2 years |
| .4 years |
| 3.6 years |
| 3.5 years |
| 5.1 years |
| .8 years |
| 3.5 years |
| — |
|
| December 31, 2018 | | | |
| December 31, 2019 | | | |
| Fair value | $ | 147 |
| $ | 7 |
| $ | 13,962 |
| $ | 2,105 |
| $ | 3,187 |
| $ | 20 |
| $ | 19,428 |
| — |
| $ | 334 |
| $ | 4 |
| $ | 12,783 |
| $ | 1,714 |
| $ | 6,997 |
| $ | 11 |
| $ | 21,843 |
| — |
|
| Amortized cost | 150 |
| 7 |
| 14,315 |
| 2,128 |
| 3,300 |
| 17 |
| 19,917 |
| 2.46 | % | 334 |
| 4 |
| 12,772 |
| 1,677 |
| 6,898 |
| 7 |
| 21,692 |
| 2.52 | % |
| |
| (a) | Maturity is based upon expected average lives rather than contractual terms. |
| |
| (b) | Weighted-average yields are calculated based on amortized cost. Such yields have been adjusted to a TE basis using the statutory federal income tax rate of 21%. |
Held-to-maturity securities
Federal agency CMOs and mortgage-backed securities constitute essentially all of our held-to-maturity securities. The remaining balance is comprised of foreign bonds.bonds and asset-backed securities. Figure 1617 shows the composition, yields, and remaining maturities of these securities.
Figure 16.17. Held-to-Maturity Securities
| | | dollars in millions | Agency Residential Collateralized Mortgage Obligations (a) | Agency Residential Mortgage-backed Securities (a) | Agency Commercial Mortgage-backed Securities (a) | Other Securities | Total | Weighted-Average Yield (b) | Agency Residential Collateralized Mortgage Obligations (a) | Agency Residential Mortgage-backed Securities (a) | Agency Commercial Mortgage-backed Securities (a) | Asset-backed securities | Other Securities | Total | Weighted-Average Yield (b) |
| June 30, 2019 | | | |
| June 30, 2020 | | | |
| Remaining maturity: | | | | |
| One year or less | $ | 37 |
| — |
| — |
| $ | 4 |
| $ | 41 |
| 1.95 | % | $ | 122 |
| — |
| — |
| $ | 1 |
| $ | 3 |
| $ | 126 |
| 2.75 | % |
| After one through five years | 5,547 |
| — |
| $ | 2,047 |
| 11 |
| 7,605 |
| 2.33 |
| 3,951 |
| $ | 295 |
| $ | 2,056 |
| 9 |
| 12 |
| 6,323 |
| 2.35 |
|
| After five through ten years | 851 |
| $ | 456 |
| 1,925 |
| — |
| 3,232 |
| 2.63 |
| 813 |
| 64 |
| 1,749 |
| — |
| — |
| 2,626 |
| 2.66 |
|
| After ten years | — |
| — |
| — |
| — |
| — |
| — |
| — |
| — |
| — |
| — |
| — |
| — |
| — |
|
| Amortized cost | $ | 6,435 |
| $ | 456 |
| $ | 3,972 |
| $ | 15 |
| $ | 10,878 |
| 2.42 | % | $ | 4,886 |
| $ | 359 |
| $ | 3,805 |
| $ | 10 |
| $ | 15 |
| $ | 9,075 |
| 2.45 | % |
| Fair value | 6,404 |
| 457 |
| 4,023 |
| 15 |
| 10,899 |
| — |
| $ | 5,037 |
| $ | 375 |
| $ | 4,083 |
| $ | 10 |
| $ | 15 |
| $ | 9,520 |
| — |
|
Weighted-average yield (b) | 2.11 | % | 2.70 | % | 2.88 | % | 3.29 | % | 2.42 | % | — |
| 2.12 | % | 2.50 | % | 2.86 | % | 2.78 | % | 2.40 | % | 2.45 | % | — |
|
| Weighted-average maturity | 3.9 years |
| 6.6 years |
| 5.9 years |
| 2.4 years |
| 4.7 years |
| — |
| 3.51 years |
| 4.42 years |
| 5.2 years |
| 2.23 years |
| 2.52 years |
| 4.25 years |
| — |
|
| December 31, 2018 | | | |
| December 31, 2019 | | | |
| Amortized cost | $ | 7,021 |
| $ | 490 |
| $ | 3,996 |
| $ | 12 |
| $ | 11,519 |
| 2.41 | % | $ | 5,692 |
| $ | 409 |
| $ | 3,940 |
| 11 |
| $ | 15 |
| $ | 10,067 |
| 2.43 | % |
| Fair value | 6,769 |
| 476 |
| 3,865 |
| 12 |
| 11,122 |
| — |
| 5,666 |
| 415 |
| 4,009 |
| 11 |
| 15 |
| 10,116 |
| — |
|
| |
| (a) | Maturity is based upon expected average lives rather than contractual terms. |
| |
| (b) | Weighted-average yields are calculated based on amortized cost. Such yields have been adjusted to a TE basis using the statutory federal income tax rate of 21%. |
Deposits and other sources of funds
Figure 17.18. Breakdown of Deposits at June 30, 20192020
Deposits are our primary source of funding. At June 30, 2019,2020, our deposits totaled $109.9$135.5 billion, an increase of $2.6$23.6 billion compared to December 31, 2018.2019. The increase reflects strength in our retail banking franchisewas driven by existing relationships and targeted strategic growth of commercial clients, as well as growth from commercial relationships.consumer stimulus payments and lower consumer spending.
Wholesale funds, consisting of short-term borrowings and long-term debt, totaled $15.2$15.7 billion at June 30, 2019,2020, compared to $14.613.5 billion at December 31, 2018.2019. The increase from December 31, 2018, was largelydriven by a combination of secured and unsecured short-term funding during the resultfirst quarter of an increase in long-term debt.2020, mostly due to the impact of the COVID-19 pandemic.
Capital
The objective of capital management is to maintain capital levels consistent with our risk appetite and of a sufficient amount to operate under a wide range of economic conditions. We have identified three primary uses of capital:
1. Investing in our businesses, supporting our clients, and loan growth;
2. Maintaining or increasing our Common Share dividend; and
3. Returning capital in the form of Common Share repurchases to our shareholders.
The following sections discuss certain ways we have deployed our capital. For further information, see the Consolidated Statements of Changes in Equity and Note 18 (“Shareholders' Equity”).
2019 capital plan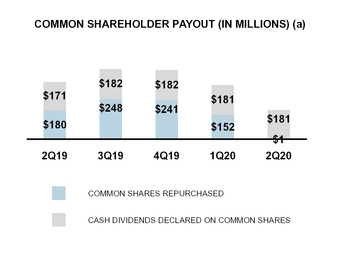
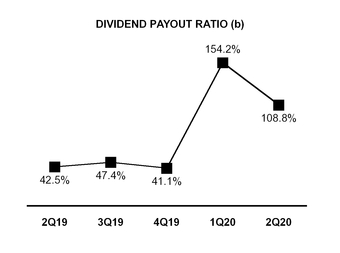
| |
| (a) | Common Share repurchases were suspended during the first quarter of 2020 in response to the COVID-19 pandemic. |
| |
| (b) | The dividend payout ratio for the first and second quarters of 2020 was impacted by lower EPS which was impacted by the economic fallout from the COVID-19 pandemic. |
On April 18, 2019, we announced our 2019 capital plan. Share repurchases of up to $1.0 billion are included in the 2019 capital plan which is effective from the third quarter of 2019 through the second quarter of 2020. Our 2019 capital plan also includes a 9% increase in our Common Stock dividend to $.185 per Common Share, which was approved by our Board of Directors on July 17, 2019.
Dividends
Consistent with our 20182019 capital plan, we paid a quarterly dividend of $.17$.185 per Common Share for the second quarter of 2019.2020. The suspension of our share repurchase program announced on March 17, 2020, does not impact our dividend per Common Share, and we believe our capital level provides sufficient capacity to maintain our dividend (subject to any restrictions that may be imposed by the Federal Reserve, as discussed in “Capital planning and stress testing” in the “Supervision and Regulation” section). Further information regarding the capital planning process and CCAR is included under the heading “Capital planning and stress testing” in the “Supervision and Regulation” section beginning on page 15 of our 20182019 Form 10-K.
Common shares outstanding
Our Common Shares are traded on the NYSE under the symbol KEY with 33,93432,697 holders of record at June 30, 2019.2020. Our book value per Common Share was $15.07$16.07 based on 1.003 billion975.9 million shares outstanding at June 30, 2019,2020, compared to $13.90$15.54 per Common Share based on 1.020 billion977.2 million shares outstanding at December 31, 2018.2019. At June 30, 2019,2020, our tangible book value per Common Share was $12.12,$13.12, compared to $11.14$12.56 per Common Share at December 31, 2018.2019.
Figure 1819 shows activities that caused the change in outstanding common shares over the past five quarters.
Figure 18.19. Changes in Common Shares Outstanding
| | | | 2019 | | 2018 | 2020 | | 2019 |
| in thousands | Second |
| First |
| | Fourth |
| Third |
| Second |
| Second |
| First |
| | Fourth |
| Third |
| Second |
|
| Shares outstanding at beginning of period | 1,013,186 |
| 1,019,503 |
| | 1,034,287 |
| 1,058,944 |
| 1,064,939 |
| 975,319 |
| 977,189 |
| | 988,538 |
| 1,003,114 |
| 1,013,186 |
|
| Open market repurchases and return of shares under employee compensation plans | (10,412 | ) | (11,791 | ) | | (15,216 | ) | (25,418 | ) | (6,259 | ) | (19 | ) | (7,862 | ) | | (12,968 | ) | (15,076 | ) | (10,412 | ) |
| Shares issued under employee compensation plans (net of cancellations) | 340 |
| 5,474 |
| | 432 |
| 761 |
| 264 |
| 647 |
| 5,992 |
| | 1,619 |
| 500 |
| 340 |
|
| Shares outstanding at end of period | 1,003,114 |
| 1,013,186 |
| | 1,019,503 |
| 1,034,287 |
| 1,058,944 |
| 975,947 |
| 975,319 |
| | 977,189 |
| 988,538 |
| 1,003,114 |
|
| | | | | | | |
As shown above, Common Shares outstanding decreasedincreased by 10.1.6 million shares during the second quarter of 2019.2020.
At June 30, 2019,2020, we had 253.6280.8 million treasury shares, compared to 237.2279.5 million treasury shares at December 31, 2018.2019. Going forward we expect to reissue treasury shares as needed in connection with stock-based compensation awards and for other corporate purposes.
Information on repurchases of Common Shares by KeyCorp is included in Part II, Item 2. “Unregistered Sales of Equity Securities and Use of Proceeds” of this report.
Preferred stock
On April 29, 2019, we issued $450 million of depositary shares, each representing a 1/40th ownership interest in a share of our Fixed Rate Perpetual Noncumulative Series G Preferred Stock.
Capital adequacy
Capital adequacy is an important indicator of financial stability and performance. All of our capital ratios remained in excess of regulatory requirements at June 30, 2019.2020. Our capital and liquidity levels are intended to position us to weather an adverse operating environment while continuing to serve our clients’ needs, as well as to meet the Regulatory Capital Rules described in Item 1. Business of our 20182019 Form 10-K under the heading “Supervision and Regulation.” Our shareholders’ equity to assets ratio was 11.74%10.2% at June 30, 2019,2020, compared to 11.17%11.8% at December 31, 2018.2019. Our tangible common equity to tangible assets ratio was 8.59%7.6% at June 30, 2019,2020, compared to 8.30%8.6% at December 31, 2018.2019. See the section entitled “GAAP to Non-GAAP Reconciliations,” which presents the computations of certain financial measures related to “tangible common equity.” The minimum capital and leverage ratios under the Regulatory Capital Rules together with the estimated ratios of KeyCorp at June 30, 2019, calculated on a fully phased-in basis,2020, are set forth in the “Supervision and regulation — Regulatory capital requirements” section in Item 2 of this report.
Figure 1920 represents the details of our regulatory capital positions at June 30, 2019,2020, and December 31, 2018,2019, under the Regulatory Capital Rules. Information regarding the regulatory capital ratios of KeyCorp’s banking subsidiaries is presented annually, with the most recent information included in Note 2324 (“Shareholders' Equity”) beginning on page 167169 of our 20182019 Form 10-K.
Figure 19.20. Capital Components and Risk-Weighted Assets
| | | | dollars in millions | June 30, 2019 | December 31, 2018 | dollars in millions | June 30, 2020 | December 31, 2019 |
| COMMON EQUITY TIER 1 | COMMON EQUITY TIER 1 | | COMMON EQUITY TIER 1 | |
| Key shareholders’ equity (GAAP) | Key shareholders’ equity (GAAP) | $ | 16,969 |
| $ | 15,595 |
| Key shareholders’ equity (GAAP) | $ | 17,542 |
| $ | 17,038 |
|
| Less: | Preferred Stock (a) | 1,856 |
| 1,421 |
| Preferred Stock (a) | 1,856 |
| 1,856 |
|
| Add: | | CECL phase-in (b) | 396 |
| — |
|
| | Common Equity Tier 1 capital before adjustments and deductions | 15,113 |
| 14,174 |
| Common Equity Tier 1 capital before adjustments and deductions | 16,082 |
| 15,182 |
|
| Less: | Goodwill, net of deferred taxes | 2,593 |
| 2,455 |
| Goodwill, net of deferred taxes | 2,574 |
| 2,584 |
|
| | Intangible assets, net of deferred taxes | 241 |
| 250 |
| Intangible assets, net of deferred taxes | 178 |
| 207 |
|
| | Deferred tax assets | 15 |
| 9 |
| Deferred tax assets | — |
| 9 |
|
| | Net unrealized gains (losses) on available-for-sale securities, net of deferred taxes | 102 |
| (372 | ) | Net unrealized gains (losses) on available-for-sale securities, net of deferred taxes | 650 |
| 115 |
|
| | Accumulated gains (losses) on cash flow hedges, net of deferred taxes | 244 |
| (78 | ) | Accumulated gains (losses) on cash flow hedges, net of deferred taxes | 613 |
| 250 |
|
| | Amounts in AOCI attributed to pension and postretirement benefit costs, net of deferred taxes | (361 | ) | (381 | ) | Amounts in AOCI attributed to pension and postretirement benefit costs, net of deferred taxes | (327 | ) | (339 | ) |
| | Total Common Equity Tier 1 capital | $ | 12,279 |
| $ | 12,291 |
| Total Common Equity Tier 1 capital | $ | 12,394 |
| $ | 12,356 |
|
| TIER 1 CAPITAL | TIER 1 CAPITAL | | TIER 1 CAPITAL | |
| Common Equity Tier 1 | Common Equity Tier 1 | $ | 12,279 |
| $ | 12,291 |
| Common Equity Tier 1 | $ | 12,394 |
| $ | 12,356 |
|
| Additional Tier 1 capital instruments and related surplus | Additional Tier 1 capital instruments and related surplus | 1,856 |
| 1,421 |
| Additional Tier 1 capital instruments and related surplus | 1,856 |
| 1,856 |
|
| Less: | Deductions | — |
| — |
| Deductions | — |
| — |
|
| | Total Tier 1 capital | 14,135 |
| 13,712 |
| Total Tier 1 capital | 14,250 |
| 14,212 |
|
| TIER 2 CAPITAL | TIER 2 CAPITAL | | TIER 2 CAPITAL | |
| Tier 2 capital instruments and related surplus | Tier 2 capital instruments and related surplus | 1,621 |
| 1,279 |
| Tier 2 capital instruments and related surplus | 1,721 |
| 1,546 |
|
Allowance for losses on loans and liability for losses on lending-related commitments (b) | 967 |
| 962 |
| |
Allowance for losses on loans and liability for losses on lending-related commitments (c) | | Allowance for losses on loans and liability for losses on lending-related commitments (c) | 1,476 |
| 978 |
|
| Less: | Deductions | — |
| — |
| Deductions | — |
| — |
|
| | Total Tier 2 capital | 2,588 |
| 2,241 |
| Total Tier 2 capital | 3,197 |
| 2,524 |
|
| | Total risk-based capital | $ | 16,723 |
| $ | 15,953 |
| Total risk-based capital | $ | 17,447 |
| $ | 16,736 |
|
| RISK-WEIGHTED ASSETS | RISK-WEIGHTED ASSETS | | RISK-WEIGHTED ASSETS | |
| Risk-weighted assets on balance sheet | Risk-weighted assets on balance sheet | $ | 101,096 |
| $ | 98,232 |
| Risk-weighted assets on balance sheet | $ | 106,649 |
| $ | 102,441 |
|
| Risk-weighted off-balance sheet exposure | Risk-weighted off-balance sheet exposure | 25,732 |
| 24,593 |
| Risk-weighted off-balance sheet exposure | 27,453 |
| 27,303 |
|
| Market risk-equivalent assets | Market risk-equivalent assets | 1,527 |
| 963 |
| Market risk-equivalent assets | 2,241 |
| 1,121 |
|
| Gross risk-weighted assets | Gross risk-weighted assets | 128,355 |
| 123,788 |
| Gross risk-weighted assets | 136,343 |
| 130,865 |
|
| Less: | Excess allowance for loan and lease losses | — |
| — |
| Excess allowance for loan and lease losses | — |
| — |
|
| | Net risk-weighted assets | $ | 128,355 |
| $ | 123,788 |
| Net risk-weighted assets | $ | 136,343 |
| $ | 130,865 |
|
| AVERAGE QUARTERLY TOTAL ASSETS | AVERAGE QUARTERLY TOTAL ASSETS | $ | 141,292 |
| $ | 138,689 |
| AVERAGE QUARTERLY TOTAL ASSETS | $ | 161,994 |
| $ | 143,910 |
|
| CAPITAL RATIOS | CAPITAL RATIOS | | CAPITAL RATIOS | |
| Tier 1 risk-based capital | Tier 1 risk-based capital | 11.01 | % | 11.08 | % | Tier 1 risk-based capital | 10.5 | % | 10.9 | % |
| Total risk-based capital | Total risk-based capital | 13.03 |
| 12.89 |
| Total risk-based capital | 12.8 |
| 12.8 |
|
Leverage (c) | 10.00 |
| 9.89 |
| |
Leverage (d) | | Leverage (d) | 8.8 |
| 9.9 |
|
| Common Equity Tier 1 | Common Equity Tier 1 | 9.57 |
| 9.93 |
| Common Equity Tier 1 | 9.1 |
| 9.4 |
|
| |
| (a) | Net of capital surplus. |
| |
| (b) | Amount reflects our decision to adopt the CECL transitional provision. |
| |
| (c) | The ALLL included in Tier 2 capital is limited by regulation to 1.25% of the institution’s standardized total risk-weighted assets (excluding its standardized market risk-weighted assets). The ALLL includes $12$43 million and $14$10 million of allowance classified as “discontinued assets” on the balance sheet at June 30, 2019,2020, and December 31, 2018,2019, respectively. |
| |
(c)(d) | This ratio is Tier 1 capital divided by average quarterly total assets as defined by the Federal Reserve less: (i) goodwill, (ii) the disallowed intangible and deferred tax assets, and (iii) other deductions from assets for leverage capital purposes. |
Risk Management
Overview
Like all financial services companies, we engage in business activities and assume the related risks. The most significant risks we face are credit, compliance, operational, liquidity, market, reputation, strategic, and model risks. Our risk management activities are focused on ensuring that we properly identify, measure, and manage such risks across the entire enterprise to maintain safety and soundness, and to maximize profitability. There have been no significant changes in our Risk Management practices as described under the heading “Risk Management” beginning on page 65 of our 20182019 Form 10-K. These Risk Management practices include heightened monitoring and risk evaluation activities in light of the impact of the COVID-19 global pandemic.
Market risk management
Market risk is the risk that movements in market risk factors, including interest rates, foreign exchange rates, equity prices, commodity prices, credit spreads, and volatilities will reduce Key’s income and the value of its portfolios. These factors influence prospective yields, values, or prices associated with the instrument. We are exposed to market risk both in our trading and nontrading activities, which include asset and liability management activities. Information regarding our fair value policies, procedures, and methodologies is provided in Note 1 (“Summary of Significant Accounting Policies”) under the heading “Fair Value Measurements” on page 102104 of our 20182019 Form 10-K and Note 5 (“Fair Value Measurements”) in this report.
Trading market risk
Key incurs market risk as a result of trading activities that are used in support of client facilitation and hedging activities, principally within our investment banking and capital markets businesses. Key has exposures to a wide range of risk factors including interest rates, equity prices, foreign exchange rates, credit spreads, and commodity prices, as well as the associated implied volatilities and spreads. Our primary market risk exposures are a result of trading and hedging activities in the derivative and fixed income markets, including securitization positions exposures. At June 30, 2019,2020, we did not have any re-securitization positions. We maintain modest trading inventories to facilitate customer flow, make markets in securities, and hedge certain risks including but not limited to credit risk and interest rate risk. The risks associated with these activities are mitigated in accordance with the Market Risk hedging policy. The majority of our positions are traded in active markets.
Market risk management is an integral part of Key’s risk culture. The Risk Committee of our Board provides oversight of trading market risks. The ERM Committee and the Market Risk Committee regularly review and discuss market risk reports prepared by our MRM that contain our market risk exposures and results of monitoring activities. Market risk policies and procedures have been defined and approved by the Market Risk Committee, a Tier 2 Risk Governance Committee, and take into account our tolerance for risk and consideration for the business environment. For more information regarding monitoring of trading positions and the activities related to the Market Risk Rule compliance, see ”Market Risk Management” beginning on page 66 of our 20182019 Form 10-K.
VaR and stressed VaR. VaR is the estimate of the maximum amount of loss on an instrument or portfolio due to adverse market conditions during a given time interval within a stated confidence level. Stressed VaR is used to assess extreme conditions on market risk within our trading portfolios. The MRM calculates VaR and stressed VaR on a daily basis, and the results are distributed to appropriate management. VaR and stressed VaR results are also provided to our regulators and utilized in regulatory capital calculations.
We use a historical simulation VaR model to measure the potential adverse effect of changes in interest rates, foreign exchange rates, equity prices, and credit spreads on the fair value of our covered positions and other non-covered positions. We analyze market risk by portfolios and do not separately measure and monitor our portfolios by risk type. VaR is calculated using daily observations over a one-year time horizon and approximates a 95% confidence level. Statistically, this means that we would expect to incur losses greater than VaR, on average, five out of 100 trading days, or three to four times each quarter. We also calculate VaR and stressed VaR at a 99% confidence level. For more information regarding our VaR model, its governance and assumptions, see ”Market Risk Management” on page 66 of our 20182019 Form 10-K.
Actual losses for the total covered portfolios did not exceed the aggregate daily VaR at a 99% confidence level during the quarter ended June 30, 2020. Actual losses for the total covered positions did not exceed aggregate
daily VaR on any day during the quartersquarter ended June 30, 2019, and June 30, 2018.2019. The MRM backtests our VaR model on a daily basis to evaluate its predictive power. The test compares VaR model results at the 99% confidence level to daily held profit and loss.
Results of backtesting are provided to the MRC. Backtesting exceptions occur when trading losses exceed VaR. We do not engage in correlation trading or utilize the internal model approach for measuring default and credit migration risk. Our net VaR approach incorporates diversification, but our VaR calculation does not include the impact of counterparty risk and our own credit spreads on derivatives.
The aggregate VaR at the 99% confidence level with a one day holding period for all covered positions was $2.6 million at June 30, 2020, and $.6 million at June 30, 2019, and $1.1 million at June 30, 2018.2019. Figure 2021 summarizes our VaR at the 99% confidence level with a one day holding period for significant portfolios of covered positions for the three months ended June 30, 2019,2020, and June 30, 2018.2019.
Figure 20.21. VaR for Significant Portfolios of Covered Positions
| | | | 2019 | | 2018 | 2020 | | 2019 |
| | Three months ended June 30, | | | Three months ended June 30, | | Three months ended June 30, | | | Three months ended June 30, | |
| in millions | High |
| Low |
| Mean |
| June 30, |
| | High |
| Low |
| Mean |
| June 30, | High |
| Low |
| Mean |
| June 30, |
| | High |
| Low |
| Mean |
| June 30, |
| Trading account assets: | | | | | | |
| Fixed income | $ | .9 |
| $ | .3 |
| $ | .5 |
| $ | .3 |
| | $ | 1.2 |
| $ | .6 |
| $ | .8 |
| $ | .9 |
| $ | 3.3 |
| $ | 1.9 |
| $ | 2.7 |
| $ | 2.1 |
| | $ | .9 |
| $ | .3 |
| $ | .5 |
| $ | .3 |
|
| Derivatives: | | | | | | |
| Interest rate | $ | .1 |
| — |
| $ | .1 |
| $ | .1 |
| | $ | .1 |
| $ | — |
| $ | .1 |
| $ | .1 |
| $ | .3 |
| .1 |
| $ | .2 |
| $ | .3 |
| | $ | .1 |
| — |
| $ | .1 |
| $ | .1 |
|
Stressed VaR is calculated by running the portfolios through a predetermined stress period which is approved by the MRC and is calculated at the 99% confidence level using the same model and assumptions used for general VaR. The aggregate stressed VaR for all covered positions was $1.6 million at June 30, 2020, and $5.2 million at June 30, 2019, and $5.4 million at June 30, 2018.2019. Figure 2122 summarizes our stressed VaR at the 99% confidence level with a one day holding period for significant portfolios of covered positions for the three months ended June 30, 2019,2020, and June 30, 2018.2019.
Figure 21.22. Stressed VaR for Significant Portfolios of Covered Positions
| | | | 2019 | | 2018 | 2020 | | 2019 |
| | Three months ended June 30, | | | Three months ended June 30, | | Three months ended June 30, | | | Three months ended June 30, | |
| in millions | High |
| Low |
| Mean |
| June 30, |
| | High |
| Low |
| Mean |
| June 30, |
| High |
| Low |
| Mean |
| June 30, |
| | High |
| Low |
| Mean |
| June 30, |
|
| Trading account assets: | | | | | | |
| Fixed income | $ | 8.0 |
| $ | 3.4 |
| $ | 5.1 |
| $ | 3.7 |
| | $ | 6.2 |
| $ | 4.1 |
| $ | 5.3 |
| $ | 4.2 |
| $ | 2.4 |
| $ | 1.2 |
| $ | 1.7 |
| $ | 1.3 |
| | $ | 8.0 |
| $ | 3.4 |
| $ | 5.1 |
| $ | 3.7 |
|
| Derivatives: | | | | | | |
| Interest rate | $ | 1.2 |
| $ | .3 |
| $ | .5 |
| $ | .9 |
| | $ | .5 |
| $ | .3 |
| $ | .4 |
| $ | .5 |
| $ | .4 |
| $ | .1 |
| $ | .1 |
| $ | .1 |
| | $ | 1.2 |
| $ | .3 |
| $ | .5 |
| $ | .9 |
|
Internal capital adequacy assessment. Market risk is a component of our internal capital adequacy assessment. Our risk-weighted assets include a market risk-equivalent asset amount, which consists of a VaR component, stressed VaR component, a de minimis exposure amount, and a specific risk add-on including the securitization positions. The aggregate market value of the securitization positions as defined by the Market Risk Rule was$68 $37 million at June 30, 2019. This amount included $41 million2020, all of which were mortgage-backed securities positions and $27 million of asset-backed securitiessecurity positions. Specific risk is the price risk of individual financial instruments, which is not accounted for by changes in broad market risk factors and is measured through a standardized approach. Market risk weighted assets, including the specific risk calculations, are run quarterly by the MRM in accordance with the Market Risk Rule, and approved by the Chief Market Risk Officer.
Nontrading market risk
Most of our nontrading market risk is derived from interest rate fluctuations and its impacts on our traditional loan and deposit products, as well as investments, hedging relationships, long-term debt, and certain short-term borrowings. Interest rate risk, which is inherent in the banking industry, is measured by the potential for fluctuations in net interest income and the EVE that result from changes in interest rates and differences in the repricing and maturity characteristics of assets and liabilities. We manage the exposure to changes in net interest income and the EVE in accordance with our risk appetite and in accordance with the Board approved ERM policy.
Interest rate risk positions are influenced by a number of factors, including the balance sheet positioning that arises out of customer preferences for loan and deposit products, economic conditions, the competitive environment within our markets, changes in market interest rates that affect client activity, and our hedging, investing, funding, and
capital positions. The primary components of interest rate risk exposure consist of reprice risk, basis risk, yield curve risk, and option risk.
| |
| • | “Reprice risk” is the exposure to changes in the level of interest rates and occurs when the volume of interest-bearing liabilities and the volume of interest-earning assets they fund (e.g., deposits used to fund loans) do not mature or reprice at the same time. |
| |
| • | “Basis risk” is the exposure to asymmetrical changes in interest rate indices and occurs when floating-rate assets and floating-rate liabilities reprice at the same time, but in response to different market factors or indexes. |
| |
| • | “Yield curve risk” is the exposure to nonparallel changes in the slope of the yield curve (where the yield curve depicts the relationship between the yield on a particular type of security and its term to maturity) and occurs when interest-bearing liabilities and the interest-earning assets that they fund do not price or reprice to the same term point on the yield curve. |
| |
| • | “Option risk” is the exposure to a customer or counterparty’s ability to take advantage of the interest rate environment and terminate or reprice one of our assets, liabilities, or off-balance sheet instruments prior to contractual maturity without a penalty. Option risk occurs when exposures to customer and counterparty early withdrawals or prepayments are not mitigated with an offsetting position or appropriate compensation. |
The management of nontrading market risk is centralized within Corporate Treasury. The Risk Committee of our Board provides oversight of nontrading market risk. The ERM Committee and the ALCO review reports on the interest rate risk exposures described above. In addition, the ALCO reviews reports on stress tests and sensitivity analyses related to interest rate risk. The ERM Committee and the ALCO have various responsibilities related to managing nontrading market risk, including recommending, approving, and monitoring strategies that maintain risk positions within approved tolerance ranges. The A/LM policy provides the framework for the oversight and management of interest rate risk and is administered by the ALCO. The MRM, as the second line of defense, provides additional oversight.
LIBOR Transition
As disclosed in Item 1A. Risk Factors of our 2019 Form 10-K, LIBOR in its current form is not expected to be available after 2021. The most likely replacement rate is expected to be SOFR, which has been recommended by the ARRC. The Federal Reserve has encouraged financial institutions not to wait for the end of 2021 to make the transition away from LIBOR. We have established an enterprise wide program to identify and address all LIBOR transition issues. We are collaborating closely with regulators and industry groups on the transition and closely monitoring developments in industry practices related to LIBOR alternatives. The goals of our LIBOR transition program are to:
Identify and analyze LIBOR-based exposure and develop and execute transition strategies;
Review and update near-term strategies and actions for our current LIBOR-based business currently being written;
Assess financial impact and risk while planning and executing mitigation actions;
Understand and strategically address the current market approach to LIBOR and SOFR; and
Determine and execute system and process work to be operationally ready for SOFR.
As part of the LIBOR transition program, we completed an initial risk assessment to help us identify the impact and risks associated with various products, systems, processes, and models. This risk assessment will assist us in making necessary updates to our infrastructure and operational systems and processes to implement a replacement rate. We have also focused on compiling an inventory of existing legal contracts that are impacted by the LIBOR transition and assessing the LIBOR fallback language in those contracts, as well as refining LIBOR fallback language in new legal contracts. We expect to leverage recommendations made by the ARRC and ISDA that are tailored to our specific client segments.
Net interest income simulation analysis. The primary tool we use to measure our interest rate risk is simulation analysis. For purposes of this analysis, we estimate our net interest income based on the current and projected composition of our on- and off-balance sheet positions, accounting for recent and anticipated trends in customer activity. The analysis also incorporates assumptions for the current and projected interest rate environments and balance sheet growth projections based on a most likely macroeconomic view. The results of this simulation analysis reflect management's desired interest rate risk positioning. The modeling incorporates investment portfolio and swap portfolio balances consistent with management's desired interest rate risk positioning. The simulation model estimates the amount of net interest income at risk by simulating the change in
net interest income that would occur if interest rates were to gradually increase or decrease from current levels over the next 12 months. Due to the low interest rate environment as of June 30, 2018, our standard decrease scenario was modifiedmonths (subject to a gradual, parallel decrease of 175 basis points over 11 months. As of March 31, 2019, the standard 20025 basis point decline was reinstated.floor in rates).
Figure 2223 presents the results of the simulation analysis at June 30, 2019,2020, and June 30, 2018.2019. At June 30, 2019,2020, our simulated impact to changes in interest rates was modest. The asset sensitive position declinedexposure to interest rate changes is significantly lower than in 2019 due primarily to the lower level of current market rates. Exposure to declining rates is nominal given the low level of market rates in comparison the 25 bps floor utilized in the scenario. Exposure to rising rates has changed from 2018a detriment in 2019 to a benefit currently as a result of hedging actions executedthe lower actual market rates reduce the need for additional modeled hedges and lower the projected beta to guide the position closer to neutral over time.rising rates. Tolerance levels for risk management require the development of remediation plans to maintain residual risk within tolerance if simulation modeling demonstrates that a gradual, parallel 200 basis point increase or 200 basis point decrease in interest rates over the next 12 months would adversely affect net interest income over the same period by more than 5.5%. Current modeled exposure is within Board approved tolerances.
Figure 22.23. Simulated Change in Net Interest Income
| | | | June 30, 2019 | June 30, 2018 | June 30, 2020 | June 30, 2019 |
| Basis point change assumption (short-term rates) | -200 |
| | +200 | | -175 |
| | +200 | | -200 |
| | 200 | | -200 |
| | +200 | |
| Tolerance level | -5.50 |
| % | -5.50 | % | -5.50 |
| % | -5.50 | % | -5.50 |
| % | -5.50 | % | -5.50 |
| % | -5.50 | % |
| Interest rate risk assessment | -2.34 |
| % | -.98 | % | -5.30 |
| % | 1.90 | % | -.39 |
| % | 6.54 | % | -2.34 |
| % | -.98 | % |
Simulation analysis produces a sophisticated estimate of interest rate exposure based on assumptions input into the model. We tailor certain assumptions to the specific interest rate environment and yield curve shape being modeled and validate those assumptions on a regular basis. However, actual results may differ from those derived in simulation analysis due to unanticipated changes to the balance sheet composition, customer behavior, product pricing, market interest rates, changes in management’s desired interest rate risk positioning, investment, funding and hedging activities, and repercussions from unanticipated or unknown events.
We also perform regular stress tests and sensitivity analyses on the model inputs that could materially change the resulting risk assessments. Assessments are performed using different shapes of the yield curve, including steepening or flattening of the yield curve, immediate changes in market interest rates, and changes in the relationship of money market interest rates. Assessments are also performed on changes to the following assumptions: loan and deposit balances, the pricing of deposits without contractual maturities, changes in lending spreads, prepayments on loans and securities, investment, funding and hedging activities, and liquidity and capital management strategies.
The results of additional assessments indicate that net interest income could increase or decrease from the base simulation results presented in Figure 22.23. Net interest income is highly dependent on the timing, magnitude, frequency, and path of interest rate increases and the associated assumptions for deposit repricing relationships, lending spreads, and the balance behavior of transaction accounts. If fixed rate assets increase by $1 billion, or fixed rate liabilities decrease by $1 billion, then the benefit to rising rates would decrease by approximately 25 basis points. If the interest-bearing liquid deposit beta assumption increases or decreases by 5% (e.g., 40% to 45%), then the benefit to rising rates would decrease or increase by approximately 8595 basis points.
Our current interest rate risk position could fluctuate to higher or lower levels of risk depending on the competitive environment and client behavior that may affect the actual volume, mix, maturity, and repricing characteristics of loan and deposit flows. Corporate Treasury discretionary activities related to funding, investing, and hedging may also change as a result of changes in customer business flows or changes in management’s desired interest rate risk positioning. As changes occur to both the configuration of the balance sheet and the outlook for the economy, management proactively evaluates hedging opportunities that may change our interest rate risk profile.
We also conduct simulations that measure the effect of changes in market interest rates in the second and third years of a three-year horizon. These simulations are conducted in a manner similar to those based on a 12-month horizon. To capture longer-term exposures, we calculate exposures to changes of the EVE as discussed in the following section.
Economic value of equity modeling. EVE complements net interest income simulation analysis as it estimates risk exposure beyond 12-, 24-, and 36-month horizons. EVE modeling measures the extent to which the economic values of assets, liabilities, and off-balance sheet instruments may change in response to fluctuations in interest
rates. EVE is calculated by subjecting the balance sheet to an immediate 200 basis point increase or decrease in interest rates, measuring the resulting change in the values of assets, liabilities, and off-balance sheet instruments, and comparing those amounts with the base case of the current interest rate environment. This analysis is highly dependent upon assumptions applied to assets and liabilities with non-contractual maturities. Those assumptions are based on historical behaviors, as well as our expectations. We develop remediation plans that would maintain residual risk within tolerance if this analysis indicates that our EVE will decrease by more than 15% in response to an immediate increase or decrease in interest rates. We are operating within these guidelines as of June 30, 2019.2020.
Management of interest rate exposure. We use the results of our various interest rate risk analyses to formulate A/LM strategies to achieve the desired risk profile while managing to our objectives for capital adequacy and liquidity risk exposures. Specifically, we manage interest rate risk positions by purchasing securities, issuing term debt with floating or fixed interest rates, and using derivatives. We predominantly use interest rate swaps and options, which modify the interest rate characteristics of certain assets and liabilities.
Figure 2324 shows all swap positions that we hold for A/LM purposes. These positions are used to convert the contractual interest rate index of agreed-upon amounts of assets and liabilities (i.e., notional amounts) to another interest rate index. For example, fixed-rate debt is converted to a floating rate through a “receive fixed/pay variable” interest rate swap. The volume, maturity, and mix of portfolio swaps change frequently as we adjust our broader A/LM objectives and the balance sheet positions to be hedged. For more information about how we use interest rate swaps to manage our risk profile, see Note 7 (“Derivatives and Hedging Activities”).
Figure 23.24. Portfolio Swaps by Interest Rate Risk Management Strategy
|
| | | | | | | | | | | | | | | | | | | | |
| | June 30, 2019 | | | | |
| | | | | Weighted-Average | | December 31, 2018 | |
| dollars in millions | Notional
Amount | Fair
Value | | Maturity
(Years) | Receive
Rate | Pay
Rate | | Notional
Amount | Fair
Value | |
Receive fixed/pay variable — conventional A/LM (a) | $ | 16,320 |
| $ | 235 |
| | 2.6 | 2.2 | % | 2.4 | % | | $ | 10,720 |
| $ | (87 | ) | |
| Receive fixed/pay variable — conventional debt | 9,727 |
| 238 |
| | 3.3 | 3.0 |
| 1.8 |
| | 9,923 |
| (7 | ) | |
| Receive fixed/pay variable — forward A/LM | 3,050 |
| 121 |
| | 3.2 | 2.1 |
| 2.3 |
| | 3,050 |
| 45 |
| |
| Pay fixed/receive variable — conventional debt | 50 |
| (7 | ) | | 9.0 | 2.6 |
| 3.6 |
| | 50 |
| (4 | ) | |
| Total portfolio swaps | $ | 29,147 |
| $ | 587 |
| (c) | 2.9 | 2.3 | % | 2.3 | % | | $ | 23,743 |
| $ | (53 | ) | (c) |
| | | | | | | | | | | |
Floors — conventional A/LM (b) | $ | 5,050 |
| 4 |
| | .3 | — |
| — |
| | $ | 4,760 |
| — |
| |
Floors — forward A/LM (b) | 2,600 |
| $ | 54 |
| | 2.5 | — |
| — |
| | — |
| — |
| |
| | | | | | | | | | | |
|
| | | | | | | | | | | | | | | | | | | | |
| | June 30, 2020 | | | | |
| | | | | Weighted-Average | | December 31, 2019 | |
| dollars in millions | Notional
Amount | Fair
Value | | Maturity
(Years) | Receive
Rate | Pay
Rate | | Notional
Amount | Fair
Value | |
| Interest rate swaps | | | | | | | | | | |
| Cash flow: | | | | | | | | | | |
| Receive fixed — asset | $ | 17,565 |
| $ | 837 |
| | 2.2 | 2.3 | % | .2 | % | | $ | 19,270 |
| $ | 312 |
| |
| Receive fixed forward starting — asset | — |
| — |
| | — | — |
| — |
| | 3,400 |
| 32 |
| |
| Pay fixed swap — debt | 50 |
| (12 | ) | | 8.0 | 1.4 | % | 3.6 | % | | 50 |
| (7 | ) | |
| Total cash flow swaps | 17,615 |
| 825 |
| | 2.3 | 2.3 | % | .2 | % | | 22,720 |
| 337 |
| |
| | | | | | | | | | | |
| Fair value: | | | | | | | | | | |
| Received fixed — debt | 8,709 |
| 538 |
| | 3.9 | 2.0 | % | .2 | % | | 8,189 |
| 240 |
| |
| Total interest rate swaps | $ | 26,324 |
| $ | 1,363 |
| | 2.8 | 2.2 | % | .2 | % | | $ | 30,909 |
| $ | 577 |
| |
| | | | | | | | | | | |
| Interest rate options | | | | | | | | | | |
| Cash flow: | | | | | | | | | | |
| Floors — purchased | $ | 7,800 |
| $ | 34 |
| | 1.0 | — |
| — |
| | $ | 4,200 |
| $ | 149 |
| |
| Floors — sold | — |
| — |
| | — | — |
| — |
| | 3,900 |
| (15 | ) | |
| Total interest rate options | $ | 7,800 |
| $ | 34 |
| | 1.0 | — |
| — |
| | $ | 8,100 |
| $ | 134 |
| |
| | | | | | | | | | | |
| |
| (a) | Portfolio swaps designated as A/LM are used to manage interest rate risk tied to both assets and liabilities. |
| |
| (b) | Conventional A/LM and forward A/LM floors do not have a stated receive rate or pay rate and are given a strike price on the option. |
| |
| (c) | Excludes accrued interest of $549$146 million and $114$107 million at June 30, 2019,2020, and December 31, 2018,2019, respectively. |
Liquidity risk management
Liquidity risk, which is inherent in the banking industry, is measured by our ability to accommodate liability maturities and deposit withdrawals, meet contractual obligations, and fund new business opportunities at a reasonable cost, in a timely manner, and without adverse consequences. Liquidity management involves maintaining sufficient and diverse sources of funding to accommodate planned, as well as unanticipated, changes in assets and liabilities under both normal and adverse conditions.
Factors affecting liquidity
Our liquidity could be adversely affected by both direct and indirect events. An example of a direct event would be a downgrade in our public credit ratings by a rating agency. Examples of indirect events (events unrelated to us) that could impair our access to liquidity would be an act of terrorism or war, natural disasters, global pandemics (including COVID-19), political events, or the default or bankruptcy of a major corporation, mutual fund, or hedge fund. Similarly, market speculation, or rumors about us or the banking industry in general, may adversely affect the cost and availability of normal funding sources. See Part II, Item 1A. Risk Factors in our First Quarter 2020 Form
10-Q for a discussion of how the COVID-19 global pandemic has impacted our liquidity and may continue to impact it in the future.
Our credit ratings at June 30, 2019,2020, are shown in Figure 24.25. We believe these credit ratings, under normal conditions in the capital markets, would enable KeyCorp or KeyBank to issue fixed income securities to investors.
Figure 24.25. Credit Ratings
|
| | | | | | |
June 30, 20192020 | Short-Term
Borrowings | Long-Term
Deposits | Senior
Long-Term
Debt | Subordinated
Long-Term
Debt | Capital
Securities | Preferred
Stock |
| KEYCORP (THE PARENT COMPANY) | | | | | | |
| Standard & Poor’s | A-2 | N/A | BBB+ | BBB | BB+ | BB+ |
| Moody’s | P-2 | N/A | Baa1 | Baa1 | Baa2 | Baa3 |
| Fitch Ratings, Inc. | F1 | N/A | A- | BBB+ | BB+ | BBBB+ |
| DBRS, Inc. | R-1 (low) | N/A | A | A (low) | BBB (high)A (low) | BBB (high) | BBB (low) |
| | | | | | | |
| KEYBANK | | | | | | |
| Standard & Poor’s | A-2 | N/A | A- | BBB+ | N/A | N/A |
| Moody’s | P-2 | Aa3 | A3 | Baa1 | N/A | N/A |
| Fitch Ratings, Inc. | F1 | A | A- | BBB+ | N/A | N/A |
| DBRS, Inc. | R-1 (low) | A | A(middle) | A (low)(high) | A (high) | A | N/A | N/A |
Sources of liquidity
Our primary source of funding for KeyBank is retail and commercial deposits. As of June 30, 2019,2020, our consolidated loan-to-deposit ratio was 86%80%. In addition, we also have access to various sources of wholesale funding, maintain a portfolio of liquid assets, and have borrowing capacity at the FHLB and Federal Reserve Bank of Cleveland. Our liquid asset portfolio at June 30, 2019,2020, totaled $26.4$34.8 billion, consisting of $24.2$20.9 billion of unpledged securities, $174$104 million of securities available for secured funding at the FHLB, and $2.0$13.8 billion of net balances of federal funds sold and balances in our Federal Reserve account. Additionally, as of June 30, 2019,2020, our unused borrowing capacity secured by loan collateral was $26$26.7 billion at the Federal Reserve Bank of Cleveland and $7.3$8.0 billion at the FHLB.
During the second quarter of 2019,2020, our outstanding FHLB advancessecured term borrowings decreased $2.0 billion as $3 million of term advances were paid down.
Liquidity for KeyCorp
The primary source of liquidity for KeyCorp is from subsidiary dividends, primarily from KeyBank. KeyCorp has sufficient liquidity when it can service its debt, support customary corporate operations and activities (including acquisitions), support occasional guarantees of subsidiaries’ obligations in transactions with third parties at a reasonable cost, in a timely manner, and without adverse consequences, and pay dividends to shareholders.
At June 30, 2019,2020, KeyCorp held $3.7$4.5 billion in cash, which we projected to be sufficient to meet our projected obligations, including the repayment of our maturing debt obligations for the periods prescribed by our risk tolerance.
Typically, KeyCorp meets its liquidity requirements through regular dividends from KeyBank. During the second quarter of 2019,2020, KeyBank paid $275$225 million in cash dividends to KeyCorp. As of June 30, 2019,2020, KeyBank had regulatory capacity to pay $1.2 billion$740 million in dividends to KeyCorp without prior regulatory approval.
Our liquidity position and recent activity
Over the past quarter, our liquid asset portfolio, which includes overnight and short-term investments, as well as unencumbered, high quality liquid securities held as protection against a range of potential liquidity stress scenarios, has increased as a result of an increase in cash held at the Federal Reserve, which was partially offset by a decrease in unpledged securities. The liquid asset portfolio continues to exceed the amount that we estimate would be necessary to manage through an adverse liquidity event by providing sufficient time to develop and execute a longer-term solution.
The Consolidated Statements of Cash Flows summarize our sources and uses of cash by type of activity for the six-month periods ended June 30, 2019,2020, and June 30, 2018.2019.
For more information regarding liquidity governance structure, factoringsfactors affecting liquidity, management of liquidity risk at KeyBank and KeyCorp, long-term liquidity strategies, and other liquidity programs, see ”Liquidity Risk Management” beginning on page 71 of our 20182019 Form 10-K.
Credit risk management
Credit risk is the risk of loss to us arising from an obligor’s inability or failure to meet contractual payment or performance terms. Like other financial services institutions, we make loans, extend credit, purchase securities, add financial and payments products, and enter into financial derivative contracts, all of which have related credit risk.
Credit policy, approval, and evaluation
We manage credit risk exposure through a multifaceted program. The Credit Risk Committee approves management credit policies and recommends for approval significant credit policies to the appropriate Board committee or to the Board. These policies are communicated throughout the organization to foster a consistent approach to granting credit. There have been no significant changesAs a result of the current economic environment, our commercial loan portfolio is going through active portfolio surveillance which is described in our Credit Risk Management practices as described undermore detail in the heading “Credit risk management” beginning on page 74 of our 2018 Form 10-K.section entitled “Loans and loans held for sale — Commercial loan portfolio.”
Allowance for loan and lease losses
We estimate the appropriate level of the ALLL on at least a quarterly basis. The methodology used is described in Note 1 (“SummaryBasis of SignificantPresentation and Accounting Policies”) under the heading “Allowance for Loan and Lease Losses” beginningin this report. Briefly, the ALLL estimate uses various models and estimation techniques based on page 101 of our 2018 Form 10-K. Briefly, our allowance applies incurredhistorical loss rates to existing loans with similar risk characteristics. We exercise judgment to assess any adjustment to the incurred loss rates for the impact of factors such as changes in economicexperience, current borrower characteristics, current conditions, lending policies including underwriting standards,reasonable and the level of credit risk associated with specific industriessupportable forecasts and markets.other relevant factors. The ALLL at June 30, 2019,2020, represents our best estimate of the incurredlifetime expected credit losses inherent in the loan portfolio at that date. For more information about impaired loans, see Note 4 (“Asset Quality”).
As shown in Figure 25,26, our ALLL from continuing operations increased by $7$808 million, or .8%89.8%, from December 31, 2018.2019. Our commercial ALLL decreased by $124 million, or 16.5%, with the adoption of ASU 2016-13, Financial Instruments — Credit Losses at January 1, 2020. The commercial ALLL increased by $4$486 million, or .5%77.5%, from December 31, 2018, primarily due to loan growth and risk rating migration. The commercial increase was concentrated inJanuary 1, 2020, driven by updated economic forecasts that capture additional deterioration triggered by the commercial and industrial portfolio.global COVID-19 pandemic. Our consumer ALLL increased by $3$328 million, or 2.1%220.1%, with the adoption of ASU 2016-13, Financial Instruments — Credit Losses at January 1, 2020. The consumer ALLL increased $118 million, or 24.7%, from December 31, 2018, primarily due to loan growth and modest shifts in credit quality metrics.January 1, 2020, driven by updated economic forecasts that capture additional deterioration triggered by the global COVID-19 pandemic.
Figure 25.26. Allocation of the Allowance for Loan Lease Losses (a)
| | | | June 30, 2019 | | December 31, 2018 | June 30, 2020 | | December 31, 2019 |
| dollars in millions | Amount | Percent of Allowance to Total Allowance | Percent of Loan Type to Total Loans | | Amount | Percent of Allowance to Total Allowance | Percent of Loan Type to Total Loans | Amount | Percent of Allowance to Total Allowance | Percent of Loan Type to Total Loans | | Amount | Percent of Allowance to Total Allowance | Percent of Loan Type to Total Loans |
| Commercial and industrial | $ | 549 |
| 61.7 | % | 52.8 | % | | $ | 532 |
| 60.2 | % | 51.1 | % | $ | 725 |
| 42.5 | % | 54.9 | % | | $ | 551 |
| 61.2 | % | 51.0 | % |
| Commercial real estate: | | | | | | | | | | |
| Commercial mortgage | 139 |
| 15.6 |
| 14.4 |
| | 142 |
| 16.1 |
| 15.9 |
| 292 |
| 17.1 |
| 12.7 |
| | 143 |
| 15.9 |
| 14.3 |
|
| Construction | 24 |
| 2.7 |
| 1.6 |
| | 33 |
| 3.8 |
| 1.9 |
| 41 |
| 2.4 |
| 1.8 |
| | 22 |
| 2.4 |
| 1.6 |
|
| Total commercial real estate loans | 163 |
| 18.3 |
| 16.0 |
| | 175 |
| 19.9 |
| 17.8 |
| 333 |
| 19.5 |
| 14.5 |
| | 165 |
| 18.3 |
| 15.9 |
|
| Commercial lease financing | 35 |
| 3.9 |
| 5.0 |
| | 36 |
| 4.1 |
| 5.1 |
| 55 |
| 3.2 |
| 4.3 |
| | 35 |
| 3.9 |
| 5.0 |
|
| Total commercial loans | 747 |
| 83.9 |
| 73.8 |
| | 743 |
| 84.2 |
| 74.0 |
| 1,113 |
| 65.2 |
| 73.7 |
| | 751 |
| 83.4 |
| 71.9 |
|
| Real estate — residential mortgage | 7 |
| .8 |
| 6.6 |
| | 7 |
| .8 |
| 6.2 |
| 101 |
| 5.9 |
| 7.7 |
| | 7 |
| .8 |
| 7.4 |
|
| Home equity loans | 36 |
| 4.1 |
| 11.5 |
| | 35 |
| 3.9 |
| 12.4 |
| 197 |
| 11.5 |
| 9.2 |
| | 31 |
| 3.5 |
| 10.9 |
|
| Consumer direct loans | 32 |
| 3.6 |
| 2.6 |
| | 30 |
| 3.4 |
| 2.0 |
| 130 |
| 7.6 |
| 4.1 |
| | 34 |
| 3.8 |
| 3.7 |
|
| Credit cards | 44 |
| 4.9 |
| 1.2 |
| | 48 |
| 5.4 |
| 1.3 |
| 107 |
| 6.3 |
| 0.9 |
| | 47 |
| 5.2 |
| 1.2 |
|
| Consumer indirect loans | 24 |
| 2.7 |
| 4.3 |
| | 20 |
| 2.3 |
| 4.1 |
| 60 |
| 3.5 |
| 4.4 |
| | 30 |
| 3.3 |
| 4.9 |
|
| Total consumer loans | 143 |
| 16.1 |
| 26.2 |
| | 140 |
| 15.8 |
| 26.0 |
| 595 |
| 34.8 |
| 26.3 |
| | 149 |
| 16.6 |
| 28.1 |
|
Total loans (a) | $ | 890 |
| 100.0 | % | 100.0 | % | | $ | 883 |
| 100.0 | % | 100.0 | % | |
Total ALLL — continuing operations (b) | | $ | 1,708 |
| 100.0 | % | 100.0 | % | | $ | 900 |
| 100.0 | % | 100.0 | % |
| | | | | | | | | | | |
| |
| (a) | The ALLL at December 31, 2019, was calculated under the incurred-loss methodology which was replaced by the CECL methodology beginning on January 1, 2020. See Note 1 (“Summary of Significant Accounting Policies”) and Note 5 (“Asset Quality”) for more information. |
| |
| (b) | Excludes allocations of the ALLL related to the discontinued operations of the education lending business in the amount of $12$43 million at June 30, 2019,2020, and $14$10 million at December 31, 2018.2019. |
Net loan charge-offs
Figure 2627 shows the trend in our net loan charge-offs by loan type, while the composition of loan charge-offs and recoveries by type of loan is presented in Figure 27.28.
Net loan charge-offs for the three months ended June 30, 2019,2020, increased $5$31 million compared to the year-ago quarter. This increase was primarily due to an increase in net loan charge-offs in our consumer loan portfolios. In 2019, we expect net loan charge-offs to averagecommercial and industrial loans to remain below our long-term targeted range of 40 to 60 basis points.charged off.
Figure 26.27. Net Loan Charge-offs from Continuing Operations (a)
| | | | 2019 | | 2018 | 2020 | | 2019 |
| dollars in millions | Second |
| First |
| | Fourth |
| Third |
| Second |
| Second |
| First |
| | Fourth |
| Third |
| Second |
|
| Commercial and industrial | $ | 24 |
| $ | 26 |
| | $ | 26 |
| $ | 33 |
| $ | 32 |
| $ | 66 |
| $ | 55 |
| | $ | 72 |
| $ | 170 |
| $ | 24 |
|
| Real estate — Commercial mortgage | — |
| 4 |
| | 11 |
| 5 |
| 1 |
| 2 |
| 2 |
| | 2 |
| — |
| — |
|
| Real estate — Construction | — |
| 4 |
| | (1 | ) | — |
| — |
| — |
| — |
| | 1 |
| — |
| — |
|
| Commercial lease financing | 14 |
| 7 |
| | — |
| 1 |
| 4 |
| 3 |
| 2 |
| | — |
| — |
| 14 |
|
| Total commercial loans | 38 |
| 41 |
| | 36 |
| 39 |
| 37 |
| 71 |
| 59 |
| | 75 |
| 170 |
| 38 |
|
| Real estate — Residential mortgage | 1 |
| — |
| | — |
| — |
| — |
| 2 |
| — |
| | (1 | ) | 1 |
| 1 |
|
| Home equity loans | 4 |
| 2 |
| | 5 |
| 1 |
| 3 |
| 1 |
| 2 |
| | 1 |
| 4 |
| 4 |
|
| Consumer direct loans | 8 |
| 9 |
| | 7 |
| 9 |
| 7 |
| 8 |
| 10 |
| | 9 |
| 8 |
| 8 |
|
| Credit cards | 10 |
| 9 |
| | 8 |
| 8 |
| 10 |
| 10 |
| 9 |
| | 9 |
| 9 |
| 10 |
|
| Consumer indirect loans | 4 |
| 3 |
| | 4 |
| 3 |
| 3 |
| 4 |
| 4 |
| | 6 |
| 4 |
| 4 |
|
| Total consumer loans | 27 |
| 23 |
| | 24 |
| 21 |
| 23 |
| 25 |
| 25 |
| | 24 |
| 26 |
| 27 |
|
| Total net loan charge-offs | $ | 65 |
| $ | 64 |
| | $ | 60 |
| $ | 60 |
| $ | 60 |
| $ | 96 |
| $ | 84 |
| | $ | 99 |
| $ | 196 |
| $ | 65 |
|
| Net loan charge-offs to average loans | .29 | % | .29 | % | | .27 | % | .27 | % | .27 | % | .36 | % | .35 | % | | .42 | % | .85 | % | .29 | % |
| Net loan charge-offs from discontinued operations — education lending business | $ | 3 |
| $ | 3 |
| | $ | 3 |
| $ | 3 |
| $ | 2 |
| — |
| $ | 1 |
| | $ | 1 |
| — |
| $ | 3 |
|
| |
| (a) | Credit amounts indicate that recoveries exceeded charge-offs. |
Figure 27.28. Summary of Loan and Lease Loss Experience from Continuing Operations | | | | Three months ended June 30, | | Six months ended June 30, | Three months ended June 30, | | Six months ended June 30, |
| dollars in millions | 2019 |
| 2018 |
| | 2019 |
| 2018 |
| 2020 |
| 2019 |
| | 2020 |
| 2019 |
|
| Average loans outstanding | $ | 90,785 |
| $ | 88,644 |
| | $ | 90,220 |
| $ | 87,790 |
| $ | 107,941 |
| $ | 90,785 |
| | $ | 102,058 |
| $ | 90,220 |
|
| Allowance for loan and lease losses at the end of the prior period | | $ | 1,359 |
| $ | 883 |
| | $ | 900 |
| $ | 883 |
|
Cumulative effect from change in accounting principle (a) | | — |
| — |
| | 204 |
| — |
|
| Allowance for loan and lease losses at beginning of period | $ | 883 |
| $ | 881 |
| | $ | 883 |
| $ | 877 |
| 1,359 |
| 883 |
| | 1,104 |
| 883 |
|
| Loans charged off: | | | | | | |
| Commercial and industrial | 30 |
| 39 |
| | 66 |
| 76 |
| 71 |
| 30 |
| | 131 |
| 66 |
|
| Real estate — commercial mortgage | 1 |
| 2 |
| | 6 |
| 3 |
| 2 |
| 1 |
| | 5 |
| 6 |
|
| Real estate — construction | — |
| — |
| | 4 |
| — |
| — |
| — |
| | — |
| 4 |
|
| Commercial lease financing | 16 |
| 4 |
| | 24 |
| 5 |
| 4 |
| 16 |
| | 6 |
| 24 |
|
| Total commercial loans | 47 |
| 45 |
| | 100 |
| 84 |
| 77 |
| 47 |
| | 142 |
| 100 |
|
| Real estate — residential mortgage | 1 |
| — |
| | 2 |
| 1 |
| 2 |
| 1 |
| | 2 |
| 2 |
|
| Home equity loans | 6 |
| 6 |
| | 10 |
| 10 |
| 2 |
| 6 |
| | 6 |
| 10 |
|
| Consumer direct loans | 10 |
| 9 |
| | 20 |
| 17 |
| 10 |
| 10 |
| | 22 |
| 20 |
|
| Credit cards | 12 |
| 12 |
| | 23 |
| 24 |
| 12 |
| 12 |
| | 23 |
| 23 |
|
| Consumer indirect loans | 8 |
| 7 |
| | 16 |
| 15 |
| 7 |
| 8 |
| | 16 |
| 16 |
|
| Total consumer loans | 37 |
| 34 |
| | 71 |
| 67 |
| 33 |
| 37 |
| | 69 |
| 71 |
|
| Total loans charged off | 84 |
| 79 |
| | 171 |
| 151 |
| 110 |
| 84 |
| | 211 |
| 171 |
|
| Recoveries: | | | | | | |
| Commercial and industrial | 6 |
| 7 |
| | 16 |
| 13 |
| 5 |
| 6 |
| | 10 |
| 16 |
|
| Real estate — commercial mortgage | 1 |
| 1 |
| | 2 |
| 1 |
| — |
| 1 |
| | 1 |
| 2 |
|
| Real estate — construction | — |
| — |
| | — |
| 1 |
| — |
| — |
| | — |
| — |
|
| Commercial lease financing | 2 |
| — |
| | 3 |
| 1 |
| 1 |
| 2 |
| | 1 |
| 3 |
|
| Total commercial loans | 9 |
| 8 |
| | 21 |
| 16 |
| 6 |
| 9 |
| | 12 |
| 21 |
|
| Real estate — residential mortgage | — |
| — |
| | 1 |
| — |
| — |
| — |
| | — |
| 1 |
|
| Home equity loans | 2 |
| 3 |
| | 4 |
| 6 |
| 1 |
| 2 |
| | 3 |
| 4 |
|
| Consumer direct loans | 2 |
| 2 |
| | 3 |
| 4 |
| 2 |
| 2 |
| | 4 |
| 3 |
|
| Credit cards | 2 |
| 2 |
| | 4 |
| 3 |
| 2 |
| 2 |
| | 4 |
| 4 |
|
| Consumer indirect loans | 4 |
| 4 |
| | 9 |
| 8 |
| 3 |
| 4 |
| | 8 |
| 9 |
|
| Total consumer loans | 10 |
| 11 |
| | 21 |
| 21 |
| 8 |
| 10 |
| | 19 |
| 21 |
|
| Total recoveries | 19 |
| 19 |
| | 42 |
| 37 |
| 14 |
| 19 |
| | 31 |
| 42 |
|
| Net loan charge-offs | (65 | ) | (60 | ) | | (129 | ) | (114 | ) | (96 | ) | (65 | ) | | (180 | ) | (129 | ) |
| Provision (credit) for loan and lease losses | 72 |
| 66 |
| | 136 |
| 124 |
| 445 |
| 72 |
| | 784 |
| 136 |
|
| Allowance for loan and lease losses at end of period | $ | 890 |
| $ | 887 |
| | $ | 890 |
| $ | 887 |
| |
| Liability for credit losses on lending-related commitments at beginning of period | $ | 62 |
| $ | 60 |
| | $ | 64 |
| $ | 57 |
| |
| Provision (credit) for losses on lending-related commitments | 2 |
| (2 | ) | | — |
| 1 |
| |
Liability for credit losses on lending-related commitments at end of period (a) | $ | 64 |
| $ | 58 |
| | $ | 64 |
| $ | 58 |
| |
Allowance for loan and lease losses at end of period (c) | | $ | 1,708 |
| $ | 890 |
| | $ | 1,708 |
| $ | 890 |
|
| Liability for credit losses on lending-related commitments at the end of the prior period | | $ | 161 |
| $ | 62 |
| | $ | 68 |
| $ | 64 |
|
| Liability for credit losses on contingent guarantees at the end of the prior period | | — |
| — |
| | 7 |
| — |
|
Cumulative effect from change in accounting principle (a), (b) | | — |
| — |
| | 66 |
| — |
|
| Liability for credit losses on off-balance sheet exposures at beginning of period | | 161 |
| 62 |
| | 141 |
| 64 |
|
| Provision (credit) for losses on off-balance sheet exposures | | 37 |
| 2 |
| | 57 |
| — |
|
Liability for credit losses on off-balance sheet exposures at end of period (d) | | $ | 198 |
| $ | 64 |
| | $ | 198 |
| $ | 64 |
|
| Total allowance for credit losses at end of period | $ | 954 |
| $ | 945 |
| | $ | 954 |
| $ | 945 |
| $ | 1,906 |
| $ | 954 |
| | $ | 1,906 |
| $ | 954 |
|
| Net loan charge-offs to average total loans | .29 | % | .27 | % | | .29 | % | .26 | % | .36 | % | .29 | % | | .35 | % | .29 | % |
| Allowance for loan and lease losses to period-end loans | .97 |
| 1.01 |
| | .97 |
| 1.01 |
| 1.61 |
| .97 |
| | 1.61 |
| .97 |
|
| Allowance for credit losses to period-end loans | 1.04 |
| 1.07 |
| | 1.04 |
| 1.07 |
| 1.80 |
| 1.04 |
| | 1.80 |
| 1.04 |
|
| Allowance for loan and lease losses to nonperforming loans | 158.6 |
| 162.8 |
| | 158.6 |
| 162.8 |
| 224.7 |
| 158.6 |
| | 224.7 |
| 158.6 |
|
| Allowance for credit losses to nonperforming loans | 170.1 |
| 173.4 |
| | 170.1 |
| 173.4 |
| 250.8 |
| 170.1 |
| | 250.8 |
| 170.1 |
|
| | | | | | | |
| Discontinued operations — education lending business: | | | | | | |
| Loans charged off | $ | 4 |
| $ | 3 |
| | $ | 8 |
| $ | 7 |
| $ | 2 |
| $ | 4 |
| | $ | 4 |
| $ | 8 |
|
| Recoveries | 1 |
| 1 |
| | 2 |
| 3 |
| 2 |
| 1 |
| | 3 |
| 2 |
|
| Net loan charge-offs | $ | (3 | ) | $ | (2 | ) | | $ | (6 | ) | $ | (4 | ) | $ | — |
| $ | (3 | ) | | $ | (1 | ) | $ | (6 | ) |
| | | | | | | |
| |
| (a) | The cumulative effect from change in accounting principle relates to the January 1, 2020, adoption of ASU 2016-13. |
| |
| (b) | Excludes $4 million related to the provision for other financial assets. |
| |
| (c) | The ALLL at December 31, 2019, was calculated under the incurred-loss methodology which was replaced by the CECL methodology beginning on January 1, 2020. See Note 1 (“Summary of Significant Accounting Policies”) and Note 5 (“Asset Quality”) for more information. |
| |
| (d) | Included in “accrued"Accrued expense and other liabilities”liabilities" on the balance sheet. |
Nonperforming assets
Figure 2829 shows the composition of our nonperforming assets. As shown in Figure 28,29, nonperforming assets at June 30, 2019,2020, increased $31$236 million from December 31, 2018.2019. This increase was primarily driven by nominal net increasesan increase in nonperforming loans in our nonperforming loans coupled with our consumeroil and gas portfolio and the transfer of one commercial credit being transferred to OREO portfolio. in the first quarter of 2020.
Overall, our credit quality trends remain benign. Under the CARES Act as well as banking regulator interagency guidance, certain loan modifications to borrowers experiencing financial distress as a result of the economic impacts created by the COVID-19 pandemic may not be required to be reported nonperforming. Refer to Note 4 (“Asset Quality”) under the heading “Nonperforming and Past Due Loans”.
For a summary of our nonaccrual and charge-off policies, see Note 1 (“SummaryBasis of SignificantPresentation and Accounting Policies”) under the headings “Nonperforming Loans,” “Impaired Loans,” and “Allowance for Loan and Lease Losses” beginning on page 100and Note 1 (“Summary of Significant Accounting Policies”) of our 20182019 Form 10-K.
Figure 28.29. Summary of Nonperforming Assets and Past Due Loans from Continuing Operations
| | | dollars in millions | June 30, 2019 |
| March 31, 2019 |
| December 31, 2018 |
| September 30, 2018 |
| June 30, 2018 |
| June 30, 2020 |
| March 31, 2020 |
| December 31, 2019 |
| September 30, 2019 |
| June 30, 2019 |
|
| Commercial and industrial | $ | 189 |
| $ | 170 |
| $ | 152 |
| $ | 227 |
| $ | 178 |
| $ | 404 |
| $ | 277 |
| $ | 264 |
| $ | 238 |
| $ | 189 |
|
| Real estate — commercial mortgage | 85 |
| 82 |
| 81 |
| 98 |
| 42 |
| 91 |
| 87 |
| 83 |
| 92 |
| 85 |
|
| Real estate — construction | 2 |
| 2 |
| 2 |
| 2 |
| 2 |
| 1 |
| 2 |
| 2 |
| 2 |
| 2 |
|
Total commercial real estate loans (a) | 87 |
| 84 |
| 83 |
| 100 |
| 44 |
| 92 |
| 89 |
| 85 |
| 94 |
| 87 |
|
| Commercial lease financing | 7 |
| 9 |
| 9 |
| 10 |
| 21 |
| 9 |
| 5 |
| 6 |
| 7 |
| 7 |
|
Total commercial loans (b) | 283 |
| 263 |
| 244 |
| 337 |
| 243 |
| 505 |
| 371 |
| 355 |
| 339 |
| 283 |
|
| Real estate — residential mortgage | 62 |
| 64 |
| 62 |
| 62 |
| 55 |
| 89 |
| 89 |
| 48 |
| 42 |
| 62 |
|
| Home equity loans | 191 |
| 195 |
| 210 |
| 221 |
| 222 |
| 141 |
| 143 |
| 145 |
| 179 |
| 191 |
|
| Consumer direct loans | 3 |
| 3 |
| 4 |
| 4 |
| 4 |
| 3 |
| 4 |
| 4 |
| 3 |
| 3 |
|
| Credit cards | 2 |
| 3 |
| 2 |
| 2 |
| 2 |
| 2 |
| 3 |
| 3 |
| 2 |
| 2 |
|
| Consumer indirect loans | 20 |
| 20 |
| 20 |
| 19 |
| 19 |
| 20 |
| 22 |
| 22 |
| 20 |
| 20 |
|
| Total consumer loans | 278 |
| 285 |
| 298 |
| 308 |
| 302 |
| 255 |
| 261 |
| 222 |
| 246 |
| 278 |
|
Total nonperforming loans (c) | 561 |
| 548 |
| 542 |
| 645 |
| 545 |
| 760 |
| 632 |
| 577 |
| 585 |
| 561 |
|
| OREO | 38 |
| 40 |
| 35 |
| 28 |
| 26 |
| 112 |
| 119 |
| 35 |
| 39 |
| 38 |
|
| Nonperforming loans held for sale | | 75 |
| 89 |
| 94 |
| 78 |
| — |
|
| Other nonperforming assets | 9 |
| 9 |
| — |
| 1 |
| — |
| 4 |
| 4 |
| 9 |
| 9 |
| 9 |
|
Total nonperforming assets (c) | $ | 608 |
| $ | 597 |
| $ | 577 |
| $ | 674 |
| $ | 571 |
| |
| Total nonperforming assets | | $ | 951 |
| $ | 844 |
| $ | 715 |
| $ | 711 |
| $ | 608 |
|
| Accruing loans past due 90 days or more | $ | 74 |
| $ | 118 |
| $ | 112 |
| $ | 87 |
| $ | 103 |
| $ | 87 |
| $ | 128 |
| $ | 97 |
| $ | 54 |
| $ | 74 |
|
| Accruing loans past due 30 through 89 days | 299 |
| 290 |
| 312 |
| 368 |
| 429 |
| 419 |
| 393 |
| 329 |
| 366 |
| 299 |
|
Restructured loans — accruing and nonaccruing (d) | 395 |
| 365 |
| 399 |
| 366 |
| 347 |
| |
Restructured loans included in nonperforming loans (d) | 228 |
| 198 |
| 247 |
| 211 |
| 184 |
| |
Restructured loans — accruing and nonaccruing (c) | | 310 |
| 340 |
| 347 |
| 347 |
| 395 |
|
Restructured loans included in nonperforming loans (c) | | 166 |
| 172 |
| 183 |
| 176 |
| 228 |
|
| Nonperforming assets from discontinued operations — education lending business | 7 |
| 7 |
| 8 |
| 6 |
| 6 |
| 7 |
| 7 |
| 7 |
| 7 |
| 7 |
|
Nonperforming loans to period-end portfolio loans (c) | .61 | % | .61 | % | .61 | % | .72 | % | .62 | % | |
Nonperforming assets to period-end portfolio loans plus OREO and other nonperforming assets (c) | .66 |
| .66 | % | .64 | % | .75 | % | .65 | % | |
| Nonperforming loans to period-end portfolio loans | | .72 | % | .61 | % | .61 | % | .63 | % | .61 | % |
| Nonperforming assets to period-end portfolio loans plus OREO and other nonperforming assets | | .89 |
| .82 | % | .75 | % | .77 | % | .66 | % |
| |
| (a) | See Figure 1011 and the accompanying discussion in the “Loans and loans held for sale” section for more information related to our commercial real estate loan portfolio. |
| |
| (b) | See Figure 910 and the accompanying discussion in the “Loans and loans held for sale” section for more information related to our commercial loan portfolio. |
| |
| (c) | Nonperforming loan balances exclude $518 million, $551 million, $575 million, $606 million, and $629 million of PCI loans at June 30, 2019, March 31, 2019, December 31, 2018, September 30, 2018, and June 30, 2018, respectively. |
| |
(d) | Restructured loans (i.e., TDRs) are those for which Key, for reasons related to a borrower’s financial difficulties, grants a concession to the borrower that it would not otherwise consider. These concessions are made to improve the collectability of the loan and generally take the form of a reduction of the interest rate, extension of the maturity date or reduction in the principal balance. |
Figure 2930 shows the types of activity that caused the change in our nonperforming loan balance during each of the last five quarters.
Figure 29.30. Summary of Changes in Nonperforming Loans from Continuing Operations
| | | | 2019 | | 2018 | 2020 | | 2019 |
| in millions | Second |
| First |
| | Fourth |
| Third |
| Second |
| Second |
| First |
| | Fourth |
| Third |
| Second |
|
| Balance at beginning of period | $ | 548 |
| $ | 542 |
| | $ | 645 |
| $ | 545 |
| $ | 541 |
| $ | 632 |
| $ | 577 |
| | $ | 585 |
| $ | 561 |
| $ | 548 |
|
Loans placed on nonaccrual status | 189 |
| 196 |
| | 103 |
| 263 |
| 175 |
| 293 |
| 219 |
| | 268 |
| 271 |
| 189 |
|
| Charge-offs | (84 | ) | (91 | ) | | (92 | ) | (81 | ) | (78 | ) | (111 | ) | (100 | ) | | (114 | ) | (91 | ) | (84 | ) |
| Loans sold | (38 | ) | (18 | ) | | (16 | ) | — |
| (1 | ) | (5 | ) | (4 | ) | | (1 | ) | — |
| (38 | ) |
| Payments | (23 | ) | (22 | ) | | (53 | ) | (57 | ) | (33 | ) | (29 | ) | (31 | ) | | (59 | ) | (37 | ) | (23 | ) |
| Transfers to OREO | (4 | ) | (8 | ) | | (10 | ) | (5 | ) | (5 | ) | — |
| (3 | ) | | (3 | ) | (4 | ) | (4 | ) |
| Transfers to nonperforming loans held for sale | | — |
| — |
| | (47 | ) | (78 | ) | — |
|
| Transfers to other nonperforming assets | — |
| (13 | ) | | — |
| — |
| — |
| — |
| — |
| | — |
| — |
| — |
|
| Loans returned to accrual status | (27 | ) | (38 | ) | | (35 | ) | (20 | ) | (54 | ) | (20 | ) | (26 | ) | | (52 | ) | (37 | ) | (27 | ) |
Balance at end of period (a) | $ | 561 |
| $ | 548 |
| | $ | 542 |
| $ | 645 |
| $ | 545 |
| |
| Balance at end of period | | $ | 760 |
| $ | 632 |
| | $ | 577 |
| $ | 585 |
| $ | 561 |
|
| | | | | | | |
| |
| (a) | Nonperforming loan balances exclude $518 million, $551 million, $575 million, $606 million, and $629 million of PCI loans at June 30, 2019, March 31, 2019, December 31, 2018, September 30, 2018, and June 30, 2018, respectively.meeting nonperforming criteria were historically excluded from Key's nonperforming disclosures. As a result of CECL implementation on January 1, 2020, PCI loans became PCD loans. PCD loans that met the definition of nonperforming are now included in nonperforming disclosures, resulting in a $45 million increase in nonperforming loans in the first quarter of 2020. |
Operational and compliance risk management
Like all businesses, we are subject to operational risk, which is the risk of loss resulting from human error or malfeasance, inadequate or failed internal processes and systems, and external events. These events include, among other things, threats to our cybersecurity, as we are reliant upon information systems and the Internet to conduct our business activities. Operational risk also encompasses compliance risk, which is the risk of loss from violations of, or noncompliance with, laws, rules and regulations, prescribed practices, and ethical standards. This includes our compliance with lending programs established by the CARES Act, including the PPP and Main Street Lending Program. Under the Dodd-Frank Act, large financial companies like Key are subject to heightened prudential standards and regulation. This heightened level of regulation has increased our operational risk. Resulting operational risk losses and/or additional regulatory compliance costs could take the form of explicit charges, increased operational costs, harm to our reputation, or foregone opportunities.
We seek to mitigate operational risk through identification and measurement of risk, alignment of business strategies with risk appetite and tolerance, and a system of internal controls and reporting. We continuously strive to strengthen our system of internal controls to improve the oversight of our operational risk and to ensure compliance with laws, rules, and regulations. For example, an operational event database tracks the amounts and sources of operational risk and losses. This tracking mechanism helps to identify weaknesses and to highlight the need to take corrective action. We also rely upon software programs designed to assist in assessing operational risk and monitoring our control processes. This technology has enhanced the reporting of the effectiveness of our controls to senior management and the Board.
The Operational Risk Management Program provides the framework for the structure, governance, roles, and responsibilities, as well as the content, to manage operational risk for Key. The Compliance Risk Committee serves the same function in managing compliance risk for Key. The Operational Risk Committee supports the ERM Committee by identifying early warning events and trends, escalating emerging risks, and discussing forward-looking assessments. The Operational Risk Committee includes attendees from each of the Three Lines of Defense. Primary responsibility for managing and monitoring internal control mechanisms lies with the managers of our various lines of business. The Operational Risk Committee and Compliance Risk Committee are senior management committees that oversee our level of operational and compliance risk and direct and support our operational and compliance infrastructure and related activities. These committees and the Operational Risk Management and Compliance functions are an integral part of our ERM Program. Our Risk Review function regularly assesses the overall effectiveness of our Operational Risk Management and Compliance Programs and our system of internal controls. Risk Review reports the results of reviews on internal controls and systems to senior management and the Risk and Audit Committees and independently supports the Risk Committee’s oversight of these controls.
See Part II, Item 1A. Risk Factors in our First Quarter 2020 Form 10-Q for a discussion of additional operational risks stemming from the COVID-19 global pandemic.
Cybersecurity
We maintain comprehensive Cyber Incident Response Plans, and we devote significant time and resources to maintaining and regularly updating our technology systems and processes to protect the security of our computer
systems, software, networks, and other technology assets against attempts by third parties to obtain unauthorized access to confidential information, destroy data, disrupt or degrade service, sabotage systems, shut down access to systems for ransom, or cause other damage. WeAs the threat landscape continues to evolve, critical infrastructure, including financial services, remains a top target for cyberattacks. The emergence of COVID-19 has created a unique situation globally with many more employees and many other U.S. financial institutions have experienced distributed denial-of-servicethird-party service providers working from home, which inherently introduces additional risk. Cyberattacks may include, but are not limited to, attacks from technologically sophisticated third parties. These attacksthat are intended to disrupt or disable online banking services and prevent banking transactions. We also periodically experience othertransactions, attempts to breach the security of our systems and data. Financial institutions have also been the target of scams that usedata, and social engineering to trickattempts aimed at tricking employees and clients into wiring funds by making it appear the request is coming from a trusted source. These cyberattacks have not, to date, resulted in any material disruption of our operationsproviding sensitive information or material harm to our customers, and have not had a material adverse effect on our results of operations.executing financial transactions.
Cyberattack risks may also occur with our third-party technology service providers and may result in financial loss or liability that could adversely affect our financial condition or results of operations. Cyberattacks could also interfere with third-party providers’ ability to fulfill their contractual obligations to us. Recent high-profile cyberattacks have targeted retailers, credit bureaus, and other businesses for the purpose of acquiring the confidential information (including personal, financial, and credit card information) of customers, some of whom are customers of ours. We may incur expenses related to the investigation of such attacks or related to the protection of our customers from identity theft as a result of such attacks. We may also incur expenses to enhance our systems or processes to protect against cyber or other security incidents. Risks and exposures related to cyberattacks are expected to remain high for the foreseeable future due to the rapidly evolving nature and sophistication of these
threats, as well as due to the expanding use of Internet banking, mobile banking, and other technology-based products and services by us and our clients. To date, Key has not experienced material disruption of our operations, or material harm to our customers, as a result of the heightened threat landscape or cyberattacks.
See Part II, Item 1A. Risk Factors in our First Quarter 2020 Form 10-Q for a discussion of additional cybersecurity risks stemming from the COVID-19 global pandemic.
As described in more detail starting on page 65 of our 20182019 Form 10-K under the heading “Risk Management — Overview,” the Board serves in an oversight capacity ensuring that Key’s risks are managed in a manner that is effective and balanced and adds value for the shareholders. The Board’s Risk Committee has primary oversight for enterprise-wide risk at KeyCorp, including operational risk (which includes cybersecurity). The Risk Committee reviews and provides oversight of management’s activities related to the enterprise-wide risk management framework, including cyber-related risk. The ERM Committee, chaired by the Chief Executive Officer and comprising other senior level executives, is responsible for managing risk (including cyber-related risk) and ensuring that the corporate risk profile is managed in a manner consistent with our risk appetite. The ERM Committee reports to the Board’s Risk Committee.
GAAP to Non-GAAP Reconciliations
Non-GAAP financial measures have inherent limitations, are not required to be uniformly applied, and are not
audited. Although these non-GAAP financial measures are frequently used by investors to evaluate a company,
they have limitations as analytical tools, and should not be considered in isolation, nor as a substitute for analyses
of results as reported under GAAP.
The tangible common equity ratio and the return on tangible common equity ratio have been a focus for some
investors, and management believes that these ratios may assist investors in analyzing Key’s capital position
without regard to the effects of intangible assets and preferred stock. Since analysts and banking regulators may
assess our capital adequacy using tangible common equity, we believe it is useful to enable investors to assess our
capital adequacy on these same bases.
|
| | | | | | | | | | | | | | | | | | | | | | | |
| | | Three months ended | | Six months ended |
| dollars in millions | 6/30/2019 | 3/31/2019 | 12/31/2018 | 9/30/2018 | 6/30/2018 | | 6/30/2019 | 6/30/2018 |
| Tangible common equity to tangible assets at period-end | | | | | | | | |
| Key shareholders’ equity (GAAP) | $ | 16,969 |
| $ | 15,924 |
| $ | 15,595 |
| $ | 15,208 |
| $ | 15,100 |
| | | |
| Less: | Intangible assets (a) | 2,952 |
| 2,804 |
| 2,818 |
| 2,838 |
| 2,858 |
| | | |
| | Preferred Stock (b) | 1,856 |
| 1,421 |
| 1,421 |
| 1,421 |
| 1,009 |
| | | |
| | Tangible common equity (non-GAAP) | $ | 12,161 |
| $ | 11,699 |
| $ | 11,356 |
| $ | 10,949 |
| $ | 11,233 |
| | | |
| Total assets (GAAP) | $ | 144,545 |
| $ | 141,515 |
| $ | 139,613 |
| $ | 138,805 |
| $ | 137,792 |
| | | |
| Less: | Intangible assets (a) | 2,952 |
| 2,804 |
| 2,818 |
| 2,838 |
| 2,858 |
| | | |
| | Tangible assets (non-GAAP) | $ | 141,593 |
| $ | 138,711 |
| $ | 136,795 |
| $ | 135,967 |
| $ | 134,934 |
| | | |
| | Tangible common equity to tangible assets ratio (non-GAAP) | 8.59 | % | 8.43 | % | 8.30 | % | 8.05 | % | 8.32 | % | | | |
| Average tangible common equity | | | | | | | | |
| Average Key shareholders’ equity (GAAP) | $ | 16,531 |
| $ | 15,702 |
| $ | 15,384 |
| $ | 15,210 |
| $ | 15,032 |
| | $ | 16,119 |
| $ | 14,961 |
|
| Less: | Intangible assets (average) (c) | 2,959 |
| 2,813 |
| 2,828 |
| 2,848 |
| 2,883 |
| | 2,886 |
| 2,899 |
|
| | Preferred Stock (average) | 1,762 |
| 1,450 |
| 1,450 |
| 1,316 |
| 1,025 |
| | 1,607 |
| 1,025 |
|
| | Average tangible common equity (non-GAAP) | $ | 11,810 |
| $ | 11,439 |
| $ | 11,106 |
| $ | 11,046 |
| $ | 11,124 |
| | $ | 11,626 |
| $ | 11,037 |
|
| Return on average tangible common equity from continuing operations | | | | | | | | |
| Net income (loss) from continuing operations attributable to Key common shareholders (GAAP) | $ | 403 |
| $ | 386 |
| $ | 459 |
| $ | 468 |
| $ | 464 |
| | $ | 789 |
| $ | 866 |
|
| Average tangible common equity (non-GAAP) | 11,810 |
| 11,439 |
| 11,106 |
| 11,046 |
| 11,124 |
| | 11,626 |
| 11,037 |
|
| Return on average tangible common equity from continuing operations (non-GAAP) | 13.69 | % | 13.69 | % | 16.40 | % | 16.81 | % | 16.73 | % | | 13.69 | % | 15.82 | % |
| Return on average tangible common equity consolidated | | | | | | | | |
| Net income (loss) attributable to Key common shareholders (GAAP) | $ | 405 |
| $ | 387 |
| $ | 461 |
| $ | 468 |
| $ | 467 |
| | $ | 792 |
| $ | 871 |
|
| Average tangible common equity (non-GAAP) | 11,810 |
| 11,439 |
| 11,106 |
| 11,046 |
| 11,124 |
| | 11,626 |
| 11,037 |
|
| Return on average tangible common equity consolidated (non-GAAP) | 13.75 | % | 13.72 | % | 16.47 | % | 16.81 | % | 16.84 | % | | 13.74 | % | 15.91 | % |
|
| | | | | | | | | | | | | | | | | | | | | | | |
| | | Three months ended | | Six months ended |
| dollars in millions | 6/30/2020 | 3/31/2020 | 12/31/2019 | 9/30/2019 | 6/30/2019 | | 6/30/2020 | 6/30/2019 |
| Tangible common equity to tangible assets at period-end | | | | | | | | |
| Key shareholders’ equity (GAAP) | $ | 17,542 |
| $ | 17,411 |
| $ | 17,038 |
| $ | 17,116 |
| $ | 16,969 |
| | | |
| Less: | Intangible assets (a) | 2,877 |
| 2,894 |
| 2,910 |
| 2,928 |
| 2,952 |
| | | |
| | Preferred Stock (b) | 1,856 |
| 1,856 |
| 1,856 |
| 1,856 |
| 1,856 |
| | | |
| | Tangible common equity (non-GAAP) | $ | 12,809 |
| $ | 12,661 |
| $ | 12,272 |
| $ | 12,332 |
| $ | 12,161 |
| | | |
| Total assets (GAAP) | $ | 171,192 |
| $ | 156,197 |
| $ | 144,988 |
| $ | 146,691 |
| $ | 144,545 |
| | | |
| Less: | Intangible assets (a) | 2,877 |
| 2,894 |
| 2,910 |
| 2,928 |
| 2,952 |
| | | |
| | Tangible assets (non-GAAP) | $ | 168,315 |
| $ | 153,303 |
| $ | 142,078 |
| $ | 143,763 |
| $ | 141,593 |
| | | |
| | Tangible common equity to tangible assets ratio (non-GAAP) | 7.6 | % | 8.3 | % | 8.6 | % | 8.6 | % | 8.6 | % | | | |
| Average tangible common equity | | | | | | | | |
| Average Key shareholders’ equity (GAAP) | $ | 17,688 |
| $ | 17,216 |
| $ | 17,178 |
| $ | 17,113 |
| $ | 16,531 |
| | $ | 17,452 |
| $ | 16,119 |
|
| Less: | Intangible assets (average) (c) | 2,886 |
| 2,902 |
| 2,919 |
| 2,942 |
| 2,959 |
| | 2,894 |
| 2,886 |
|
| | Preferred Stock (average) | 1,900 |
| 1,900 |
| 1,900 |
| 1,900 |
| 1,762 |
| | 1,900 |
| 1,607 |
|
| | Average tangible common equity (non-GAAP) | $ | 12,902 |
| $ | 12,414 |
| $ | 12,359 |
| $ | 12,271 |
| $ | 11,810 |
| | $ | 12,658 |
| $ | 11,626 |
|
| Return on average tangible common equity from continuing operations | | | | | | | | |
| Net income (loss) from continuing operations attributable to Key common shareholders (GAAP) | $ | 159 |
| $ | 118 |
| $ | 439 |
| $ | 383 |
| $ | 403 |
| | $ | 277 |
| $ | 789 |
|
| Average tangible common equity (non-GAAP) | 12,902 |
| 12,414 |
| 12,359 |
| 12,271 |
| 11,810 |
| | 12,658 |
| 11,626 |
|
| Return on average tangible common equity from continuing operations (non-GAAP) | 4.96 | % | 3.82 | % | 14.09 | % | 12.38 | % | 13.69 | % | | 4.40 | % | 13.69 | % |
| Return on average tangible common equity consolidated | | | | | | | | |
| Net income (loss) attributable to Key common shareholders (GAAP) | $ | 161 |
| $ | 119 |
| $ | 442 |
| $ | 386 |
| $ | 405 |
| | $ | 280 |
| $ | 792 |
|
| Average tangible common equity (non-GAAP) | 12,902 |
| 12,414 |
| 12,359 |
| 12,271 |
| 11,810 |
| | 12,658 |
| 11,626 |
|
| Return on average tangible common equity consolidated (non-GAAP) | 5.02 | % | 3.86 | % | 14.19 | % | 12.48 | % | 13.75 | % | | 4.45 | % | 13.74 | % |
| |
| (a) | For the three months ended June 30, 2019,2020, March 31, 2019,2020, December 31, 2018,2019, September 30, 2018,2019, and June 30, 2018,2019, intangible assets exclude $10$5 million, $12$6 million, $14$7 million, $17$9 million, and $20$10 million, respectively, of period-end purchased credit card receivables. |
| |
| (b) | Net of capital surplus. |
| |
| (c) | For the three months ended June 30, 2019,2020, March 31, 2019,2020, December 31, 2018,2019, September 30, 2018,2019, and June 30, 2018,2019, average intangible assets exclude $11$6 million, $13$7 million, $15$8 million, $18$9 million, and $21$11 million, respectively, of average purchased credit card receivablesreceivables. For the six months ended June 30, 2020, and June 30, 2019, average intangible assets exclude $6 million and $12 million, respectively, of average purchased credit card receivables. |
The cash efficiency ratio is a ratio of two non-GAAP performance measures, adjusted noninterest expense and total taxable-equivalent revenue. Accordingly, there is no directly comparable GAAP performance measure. The cash efficiency ratio excludes the impact of our intangible asset amortization from the calculation. We believe this ratio provides greater consistency and comparability between our results and those of our peer banks. Additionally, this ratio is used by analysts and investors to evaluate how effectively management is controlling noninterest expenses in generating revenue, as they develop earnings forecasts and peer bank analysis.
|
| | | | | | | | | | | | | | | | | | | | | | | |
| | | Three months ended | | Six months ended |
| dollars in millions | 6/30/2019 | 3/31/2019 | 12/31/2018 | 9/30/2018 | 6/30/2018 | | 6/30/2019 | 6/30/2018 |
| Cash efficiency ratio | | | | | | | | |
| Noninterest expense (GAAP) | $ | 1,019 |
| $ | 963 |
| $ | 1,012 |
| $ | 964 |
| $ | 993 |
| | $ | 1,982 |
| $ | 1,999 |
|
| Less: | Intangible asset amortization | 22 |
| 22 |
| 22 |
| 23 |
| 25 |
| | 44 |
| 54 |
|
| Adjusted noninterest expense (non-GAAP) | $ | 997 |
| $ | 941 |
| $ | 990 |
| $ | 941 |
| $ | 968 |
| | $ | 1,938 |
| $ | 1,945 |
|
| Net interest income (GAAP) | $ | 981 |
| $ | 977 |
| $ | 1,000 |
| $ | 986 |
| $ | 979 |
| | $ | 1,958 |
| $ | 1,923 |
|
| Plus: | Taxable-equivalent adjustment | 8 |
| 8 |
| 8 |
| 7 |
| 8 |
| | 16 |
| 16 |
|
| | Noninterest income (GAAP) | 622 |
| 536 |
| 645 |
| 609 |
| 660 |
| | 1,158 |
| 1,261 |
|
| Total taxable-equivalent revenue (non-GAAP) | $ | 1,611 |
| $ | 1,521 |
| $ | 1,653 |
| $ | 1,602 |
| $ | 1,647 |
| | $ | 3,132 |
| $ | 3,200 |
|
| Cash efficiency ratio (non-GAAP) | 61.9 | % | 61.9 | % | 59.9 | % | 58.7 | % | 58.8 | % | | 61.9 | % | 60.8 | % |
|
| | | | | | | | | | | | | | | | | | | | | | | |
| | | Three months ended | | Six months ended |
| dollars in millions | 6/30/2020 | 3/31/2020 | 12/31/2019 | 9/30/2019 | 6/30/2019 | | 6/30/2020 | 6/30/2019 |
| Cash efficiency ratio | | | | | | | | |
| Noninterest expense (GAAP) | $ | 1,013 |
| $ | 931 |
| $ | 980 |
| $ | 939 |
| $ | 1,019 |
| | $ | 1,944 |
| $ | 1,982 |
|
| Less: | Intangible asset amortization | 18 |
| 17 |
| 19 |
| 26 |
| 22 |
| | 35 |
| 44 |
|
| Adjusted noninterest expense (non-GAAP) | $ | 995 |
| $ | 914 |
| $ | 961 |
| $ | 913 |
| $ | 997 |
| | $ | 1,909 |
| $ | 1,938 |
|
| Net interest income (GAAP) | $ | 1,018 |
| $ | 981 |
| $ | 979 |
| $ | 972 |
| $ | 981 |
| | $ | 1,999 |
| $ | 1,958 |
|
| Plus: | Taxable-equivalent adjustment | 7 |
| 8 |
| 8 |
| 8 |
| 8 |
| | 15 |
| 16 |
|
| | Noninterest income (GAAP) | 692 |
| 477 |
| 651 |
| 650 |
| 622 |
| | 1,169 |
| 1,158 |
|
| Total taxable-equivalent revenue (non-GAAP) | $ | 1,717 |
| $ | 1,466 |
| $ | 1,638 |
| $ | 1,630 |
| $ | 1,611 |
| | $ | 3,183 |
| $ | 3,132 |
|
| Cash efficiency ratio (non-GAAP) | 57.9 | % | 62.3 | % | 58.7 | % | 56.0 | % | 61.9 | % | | 60.0 | % | 61.9 | % |
Critical Accounting Policies and Estimates
Our business is dynamic and complex. Consequently, we must exercise judgment in choosing and applying accounting policies and methodologies. These choices are critical – not only are they necessary to comply with GAAP, they also reflect our view of the appropriate way to record and report our overall financial performance. All accounting policies are important, and all policies described in Note 1 (“Summary of Significant Accounting Policies”) beginning on page 99100 of our 20182019 Form 10-K should be reviewed for a greater understanding of how we record and report our financial performance. Note 1 (“Basis of Presentation and Accounting Policies”) of this report should also be reviewed for more information on accounting standards that have been adopted during the period.
In our opinion, some accounting policies are more likely than others to have a critical effect on our financial results and to expose those results to potentially greater volatility. These policies apply to areas of relatively greater business importance or require us to exercise judgment and to make assumptions and estimates that affect amounts reported in the financial statements. Because these assumptions and estimates are based on current circumstances, they may prove to be inaccurate, or we may find it necessary to change them.
We rely heavily on the use of judgment, assumptions, and estimates to make a number of core decisions, including accounting for the ALLL; contingent liabilities, guarantees and income taxes; derivatives and related hedging
activities; and assets and liabilities that involve valuation methodologies. In addition, we may employ outside valuation experts to assist us in determining fair values of certain assets and liabilities. A brief discussion of each of these areas appears on pages 84 through 87 of our 20182019 Form 10-K.
During the first six months of 2019,2020, we did not significantly alter the manner in which we applied our critical accounting policies or developed related assumptions and estimates.estimates except for our ALLL as a result of the adoption of ASC 326 on January 1, 2020.
In conjunction with the adoption of ASC 326, the critical accounting policy and estimate disclosure for our ALLL was updated from what was disclosed in our 2019 Form 10-K. The accounting policy for goodwill was also updated due to the adoption of ASU 2017-04, “Intangibles - Goodwill and Other (Topic 350): Simplifying the Test for Goodwill Impairment.” These updates are as follows:
Allowance for loan and lease losses
The allowance for loans and leases represents management’s estimate of all expected credit losses over the expected contractual life of our existing loan portfolio. Determining the appropriateness of the allowance is complex and requires judgment by management about the effect of matters that are inherently uncertain. These critical estimates include significant use of our own historical data and complex methods to interpret them. We have an ongoing process to evaluate and enhance the quality, quantity, and timeliness of our data and interpretation methods used in the determination of these allowances. These evaluations are inherently subjective, as they require material estimates and may be susceptible to significant change, and include, among others:
PD,
LGD,
Outstanding balance of the loan,
Movement through delinquency stages,
Amounts and timing of expected future cash flows,
Value of collateral, which may be obtained from third parties,
Economic forecasts which are obtained from a third party provider,
Qualitative factors, such as changes in current economic conditions, that may not be reflected in modeled results.
As described in our accounting policy related to the ALLL in Note 1 (“Basis of Presentation and Accounting Policies”) of this report under the heading “Allowance for Loan and Lease Losses," we employ a disciplined process and methodology to establish our allowance for loan and lease losses, which has three main components: (i) asset specific / individual loan reserves; (ii) quantitative (formulaic or pooled) reserves; and (iii) qualitative (judgmental) reserves.
We use a non-DCF factor-based approach to estimate expected credit losses that include component PD/LGD/EAD models as well as less complex estimation methods for smaller loan portfolios. Probability of default models estimate the likelihood a borrower will cease making payments as agreed. These models use observed loan-level information and projected paths of macroeconomic variables. Borrower credit attributes including FICO scores of consumers and internally assigned risk ratings for commercial borrowers are significant inputs to the models. Consumer FICO scores are refreshed quarterly and commercial risk ratings are updated annually with select borrowers updated more frequently. The macroeconomic trends that have a significant impact on the probability of default vary by portfolio segment. Exposure at default models estimate the loan balance at the time the borrower stops making payments. We use an amortization based formulaic approach to estimate account level EAD for all term loans. We use portfolio specific methods in each of our revolving product portfolios. LGD models estimate the loss we will suffer once a loan is in default. Account level inputs to LGD models include collateral attributes, such as loan to value.
If we observe limitations in the data or models, we use model overlays to make adjustments to model outputs to capture a particular risk or compensate for a known limitation. These variables and others may result in actual loan losses that differ from the originally estimated amounts.
This estimate produced by our models is forward-looking and requires management to use forecasts about future economic conditions to determine the expected credit loss over the remaining life of an instrument. Moody’s Consensus forecast is the source of macroeconomic projections, including the interest rate forecasts used in the credit models. We use a two year reasonable and supportable period across all products to forecast economic conditions. As the length of the life of a financial asset increases, these inputs may become impractical to estimate
as reasonable and supportable. We believe the two year time horizon appropriately aligns with our business planning, available industry guidance, and reliability of various forecasting services. Following this two year period in which supportable forecasts can be generated, for all modeled loan portfolios, we revert expected credit losses to a level that is consistent with our historical information by reverting the macroeconomic variables (model inputs) to their long run average. We revert to historical loss rates for less complex estimation methods for smaller portfolios. A four quarter reversion period is used where the macroeconomic variables linearly revert to their long run average following the two year reasonable and supportable period. We use a 20 year lookback period for determining long run historical average of the macroeconomic variables. We determined the 20 year lookback period is appropriate as it captures the previous two economic cycles including the last downturn and our more recent positive credit experience.
The ALLL is sensitive to various macroeconomic drivers such as GDP and unemployment as well as portfolio attributes such as remaining term, outstanding balance, risk ratings, FICO, LTV, and delinquency status. Our ALLL models were designed to capture the correlation between economic and portfolio changes. As such, evaluating shifts in individual portfolio attributes and macroeconomic variables in isolation may not be indicative of past or future performance.
It is difficult to estimate how potential changes in any one factor or input might affect the overall ALLL because we consider a wide variety of factors and inputs in estimating the ALLL. Changes in the factors and inputs considered may not occur at the same rate and may not be consistent across all geographies or product types, and changes in factors and input may be directionally inconsistent, such that improvement in one factor may offset deterioration in others. However, to consider the impact of a hypothetical alternate economic forecast, we compared the modeled quantitative allowance results using a downside economic scenario. The maximum difference in the quarterly macroeconomic variables between the base and downside scenarios over the two year reasonable and supportable period includes an approximate 17% decline in GDP annualized growth and an approximate 5% increase in the U.S. unemployment rate. The difference between these two scenarios would have driven an increase of approximately 1.8x for commercial and 1.4x for the consumer modeled allowance results.
Similarly, deteriorating conditions for portfolio factors were also considered by moderately stressing key portfolio drivers, relative to the baseline portfolio conditions. Stressing risk ratings by two grades and utilization by 10% for commercial loans generates a 1.4x increase in the commercial modeled allowance results. Stressing FICO by ten points, and LTV and utilization by 10% for consumer loans generates a 1.2x increase in the consumer modeled allowance results.
Note that these analyses demonstrate the sensitivity of the ALLL to key quantitative assumptions; however, it is not intended to estimate changes in the overall ALLL as they do not reflect qualitative factors related to idiosyncratic risk factors, changes in current economic conditions that may not be reflected in quantitatively derived results, and other relevant factors must be considered to ensure the ALLL reflects our best estimate of current expected credit losses. With the unprecedented economic uncertainty caused by the COVID-19 pandemic, future ALLL results may vary considerably based on the actual magnitude of the pandemic and impact of the United States' monetary and fiscal response.
Goodwill
Goodwill is initially recorded as the excess of the purchase price over the fair value of net assets acquired in a business combination. Goodwill is tested for impairment for all three of our reporting units: Consumer Bank, Commercial Bank and Institutional Bank. We perform our annual impairment test as of October 1st and on an interim basis if events or changes in circumstances between annual tests suggest additional testing is needed.
Effective January 1, 2020, we adopted ASU 2017-04, “Intangibles - Goodwill and Other (Topic 350): Simplifying the Test for Goodwill Impairment,” eliminating the second step of goodwill impairment testing. Under the new guidance, if the fair value of a reporting unit declines below its carrying value, an impairment charge will be recognized for any amount by which the carrying value exceeds the reporting unit’s fair value, to the extent that the loss recognized does not exceed the amount of the goodwill allocated to that reporting unit. The adoption of ASU 2017-04 did not impact our current financial condition or results of operations.
In consideration of the deterioration in macroeconomic conditions and industry and market conditions due to the COVID-19 pandemic during the second quarter of 2020, we identified a triggering event as of June 30, 2020.
Impairment indicators considered comprised economic conditions, including projections of the duration of current conditions and timing of a potential recovery; industry and market considerations; government intervention and regulatory updates; the impact of recent events to financial performance and cost factors of the reporting units; performance of our stock and other relevant events. We further considered the amount by which fair value exceeded book value for each reporting unit in the most recent quantitative analysis and sensitivities performed.
After considering the triggering event together with other relevant factors, we concluded it was not more-likely-than-not that the fair value of each reporting unit had declined below their carrying value as of June 30, 2020. Goodwill assessments are highly sensitive to economic projections and the related assumptions used by management. In the event of a prolonged economic downturn or further deterioration in the economic outlook, continued assessments of our goodwill balance will likely be required in future periods.
Accounting and Reporting Developments
Accounting Guidance Pending Adoption at June 30, 20192020 |
| | | |
| Standard | Required Adoption | Description | Effect on Financial Statements or Other Significant Matters |
ASU 2016-13,2019-12, Measurement ofSimplifying the
Credit Losses onAccounting for
Financial
Instruments
ASU 2018-19, Codification Improvements to Topic 326, Financial Instruments—Credit Losses
ASU 2019-04,
Codification Improvements to Topic 326, Financial Instruments—Credit Losses
ASU 2019-05,
Financial Instruments—Credit Losses: Targeted Transition ReliefIncome Taxes
| January 1, 20202021
Early adoption is permitted as of January 1, 2019
| The ASUs amend ASC Topic 326, Financial Instruments-Credit Losses, and significantly change how entities will measure credit losses for most financial assets and certain other instruments that are not measured at fair value through net income. The standard replaces today’s “incurred loss” approach with an “expected loss” model for instruments such as loans and held-to-maturity securities that are measured at amortized cost. The standard requires credit losses relating to available-for-sale debt securities to be recorded through an allowance rather than a reduction of the carrying amount. It also changesThis ASU simplifies the accounting for purchased credit-impaired debt securities income
taxes by removing certain exceptions to the existing guidance, such as exceptions related to the incremental approach for intraperiod tax allocation, the methodology for calculating income taxes in an interim period when a year-to-date loss exceeds the anticipated loss, and loans. The ASUs retain manythe recognition of the current disclosure requirements in current GAAPdeferred tax liabilities when a foreign subsidiary becomes an equity method investment and expand certain disclosure requirements.when a foreign equity method investment becomes a subsidiary.
Along with general improvements, it adds simplifications related to franchise taxes, the tax basis of goodwill, and the method for recognizing an enacted change in tax laws. The new guidance also allows optional relief for certain instruments measured at amortized cost withspecifies that an optionentity is not required to irrevocably electallocate the fair value option in ASC Topic 825, Financial Instruments.consolidated | This new guidance will affect the accounting for our loans, debt securities held to maturity and available for sale, and liabilities for credit losses on unfunded lending related commitments as well as purchased financial assets with a more-than insignificant amount of credit deterioration since origination.certain tax expense to a legal entity
Key has formed cross-functional implementation working groups comprised of teams throughout Key, including finance, credit, and modeling. The implementation team has completed the development of initial loss forecasting models, including establishment of macroeconomic forecasting methodologies and approachesnot subject to meet the requirements of the new guidance. Key has conducted limited parallel runs in the first half of 2019, focusing on challenging model outputs, with plans of running a complete parallel production including the finalization of loss forecasting methodologies and processes in the second half of 2019. Key also continues to monitor proposed and approved amendments to the new standard. As a result of ASU 2019-04, Key has been able to make an accounting policy election to not measure an allowance for credit losses on accrued interest receivable due to Key's credit policy to reverse accrued interest on non-performing loans and leases in a timely manner.
Key expects that the new guidance will generally result in an increasetax in its allowance for credit losses for loans, primarily for long-term consumer loans, as it will cover credit losses over the full remaining expected life of loans and commitments and will consider future changes in macroeconomic conditions. Since the magnitude of the anticipated increase in the allowance for credit losses will be impacted by economic conditions and trends in the Company’s portfolio at the time of adoption, the quantitative impact cannot yet be reasonably estimated. While we are still assessing the new standard, the adoption of this guidance is not anticipated to have a material impact on the available-for-sale debt securities or held-to-maturity securities measured at amortized cost.
|
ASU 2017-04,own separate financial
Simplifying the
Test for Goodwill
Impairment
| January 1, 2020
Early adoption is permitted
| The ASU amends ASC Topic 350, Intangibles - Goodwill and Other andeliminates the second step of the test for goodwill impairment. Under the new guidance, entities will compare the fair value of a reporting unit with its carrying amount. If the carrying amount exceeds the reporting unit’s fair value, the entity is required to recognize an impairment charge for this amount. The new method applies to all reporting units and the performance of a qualitative assessment is still allowable.statements.
The guidance should be implemented usingapplied on either a retrospective, modified retrospective, or prospective approach.basis depending on the amendment.
| The adoption of this accounting guidance is not expected to have a material effect on our financial condition or results of operations.
|
ASU 2018-14, Changes to2020-01, Clarifying the Disclosure Requirements for Defined Benefit Plans Interactions between Topic 321,Investments —Equity Securities; Topic 323, Investments— Equity Method and Joint Ventures; and Topic 815, Derivatives and Hedging
| January 1, 20202021
Early adoption is permitted
| This guidance clarifies that when applying the measurement alternative in Topic 321, companies should consider certain observable transactions that require the application or discontinuance of the equity method under Topic 323.
It also clarifies that companies should not consider whether the underlying securities in certain forward contracts and purchased options would be accounted for under the equity method or fair value option when determining the method of accounting for those contracts.
This guidance should be applied on a prospective basis.
| The ASU amends the disclosure requirements for sponsors of defined benefit plans. Entities are required to provide new disclosures, including the weighted-average interest crediting rate for cash balance plans and explanations for the significant gains and losses related to changes in the benefit obligation for the period. Certain existing disclosure requirements are eliminated.
The guidance should be adopted using a retrospective approach.
| The adoption of this standard willaccounting guidance is not result in significant changesexpected to Key’s disclosures, and there will be nohave amaterial effect toon our financial condition or results of operations.
|
European Sovereign and Nonsovereign Debt Exposures
Our total European sovereign and Nonsovereign debt exposure is presented in Figure 30.31.
Figure 30.31. European Sovereign and Nonsovereign Debt Exposures | | | June 30, 2019 | Short-and Long- Term Commercial Total (a) | Foreign Exchange and Derivatives
with Collateral (b) | Net Exposure | |
| June 30, 2020 | Short- and Long- Term Commercial Total (a) | Foreign Exchange and Derivatives
with Collateral (b) | Net Exposure |
| in millions | Short-and Long- Term Commercial Total (a) | Foreign Exchange and Derivatives
with Collateral (b) | Net Exposure |
| France: | |
|
| Sovereigns | — |
| — |
| — |
| — |
| — |
| — |
|
| Nonsovereign financial institutions | — |
| $ | 1 |
| $ | 1 |
| — |
| — |
| — |
|
| Nonsovereign non-financial institutions | $ | 2 |
| — |
| 2 |
| $ | 1 |
| — |
| $ | 1 |
|
| Total | 2 |
| 1 |
| 3 |
| 1 |
| — |
| 1 |
|
| Germany: | |
| |
|
| Sovereigns | — |
| — |
| — |
| |
| Nonsovereign financial institutions | — |
| — |
| — |
| |
| Nonsovereign non-financial institutions | 19 |
| — |
| 19 |
| |
| Total | 19 |
| — |
| 19 |
| |
| Italy: | |
| |
| Sovereigns | — |
| — |
| — |
| — |
| — |
| — |
|
| Nonsovereign financial institutions | — |
| — |
| — |
| — |
| — |
| — |
|
| Nonsovereign non-financial institutions | 1 |
| — |
| 1 |
| 38 |
| — |
| 38 |
|
| Total | 1 |
| — |
| 1 |
| 38 |
| — |
| 38 |
|
| Luxembourg: | |
| |
|
| Sovereigns | — |
| — |
| — |
| — |
| — |
| �� |
|
| Nonsovereign financial institutions | — |
| — |
| — |
| — |
| — |
| — |
|
| Nonsovereign non-financial institutions | 10 |
| — |
| 10 |
| 8 |
| — |
| 8 |
|
| Total | 10 |
| — |
| 10 |
| 8 |
| — |
| 8 |
|
| United Kingdom: | |
| |
|
| Sovereigns | — |
| — |
| — |
| — |
| — |
| — |
|
| Nonsovereign financial institutions | — |
| 138 |
| 138 |
| — |
| $ | 461 |
| 461 |
|
| Nonsovereign non-financial institutions | 1 |
| — |
| 1 |
| 1 |
| — |
| 1 |
|
| Total | 1 |
| 138 |
| 139 |
| 1 |
| 461 |
| 462 |
|
| Total Europe: | |
| |
|
| Sovereigns | — |
| — |
| — |
| — |
| — |
| — |
|
| Nonsovereign financial institutions | — |
| 139 |
| 139 |
| — |
| 461 |
| 461 |
|
| Nonsovereign non-financial institutions | 33 |
| — |
| 33 |
| 48 |
| — |
| 48 |
|
| Total | $ | 33 |
| $ | 139 |
| $ | 172 |
| $ | 48 |
| $ | 461 |
| $ | 509 |
|
| | | |
| |
| (a) | Represents our outstanding leases. |
| |
| (b) | Represents contracts to hedge our balance sheet asset and liability needs and to accommodate our clients’ trading and/or hedging needs. Our derivative mark-to-market exposures are calculated and reported on a daily basis. These exposures are largely covered by cash or highly marketable securities collateral with daily collateral calls. |
Our credit risk exposure is largely concentrated in developed countries with emerging market exposure essentially limited to commercial facilities; these exposures are actively monitored by management. We do not have at-risk exposures in the rest of the world.
Item 1. Financial Statements
Consolidated Balance Sheets
| | | in millions, except per share data | June 30,
2019 |
| December 31,
2018 |
| June 30,
2020 |
| December 31,
2019 |
|
| | (Unaudited) |
| | (Unaudited) |
| |
| ASSETS | | |
| Cash and due from banks | $ | 607 |
| $ | 678 |
| $ | 1,059 |
| $ | 732 |
|
| Short-term investments | 2,443 |
| 2,562 |
| 14,036 |
| 1,272 |
|
| Trading account assets | 1,005 |
| 849 |
| 645 |
| 1,040 |
|
| Securities available for sale | 21,528 |
| 19,428 |
| 23,600 |
| 21,843 |
|
| Held-to-maturity securities (fair value: $10,899 and $11,122) | 10,878 |
| 11,519 |
| |
| Held-to-maturity securities (fair value: $9,520 and $10,116) | | 9,075 |
| 10,067 |
|
| Other investments | 632 |
| 666 |
| 655 |
| 605 |
|
| Loans, net of unearned income of $309 and $678 | 91,937 |
| 89,552 |
| |
| Loans, net of unearned income of $515 and $603 | | 106,159 |
| 94,646 |
|
| Less: Allowance for loan and lease losses | (890 | ) | (883 | ) | (1,708 | ) | (900 | ) |
| Net loans | 91,047 |
| 88,669 |
| 104,451 |
| 93,746 |
|
Loans held for sale (a) | 1,790 |
| 1,227 |
| 2,007 |
| 1,334 |
|
| Premises and equipment | 829 |
| 882 |
| 776 |
| 814 |
|
| Goodwill | 2,664 |
| 2,516 |
| 2,664 |
| 2,664 |
|
| Other intangible assets | 298 |
| 316 |
| 218 |
| 253 |
|
| Corporate-owned life insurance | 4,201 |
| 4,171 |
| 4,251 |
| 4,233 |
|
| Accrued income and other assets | 5,633 |
| 5,030 |
| 6,976 |
| 5,494 |
|
| Discontinued assets | 990 |
| 1,100 |
| 779 |
| 891 |
|
| Total assets | $ | 144,545 |
| $ | 139,613 |
| $ | 171,192 |
| $ | 144,988 |
|
| LIABILITIES | | |
| Deposits in domestic offices: | | |
| NOW and money market deposit accounts | $ | 63,619 |
| $ | 59,918 |
| $ | 78,853 |
| $ | 66,714 |
|
| Savings deposits | 4,747 |
| 4,854 |
| 5,371 |
| 4,651 |
|
| Certificates of deposit ($100,000 or more) | 8,084 |
| 7,913 |
| 4,476 |
| 6,598 |
|
| Other time deposits | 5,524 |
| 5,332 |
| 4,011 |
| 5,054 |
|
| Total interest-bearing deposits | 81,974 |
| 78,017 |
| 92,711 |
| 83,017 |
|
| Noninterest-bearing deposits | 27,972 |
| 29,292 |
| 42,802 |
| 28,853 |
|
| Total deposits | 109,946 |
| 107,309 |
| 135,513 |
| 111,870 |
|
| Federal funds purchased and securities sold under repurchase agreements | 161 |
| 319 |
| 267 |
| 387 |
|
| Bank notes and other short-term borrowings | 720 |
| 544 |
| 1,716 |
| 705 |
|
| Accrued expense and other liabilities | 2,435 |
| 2,113 |
| 2,420 |
| 2,540 |
|
| Long-term debt | 14,312 |
| 13,732 |
| 13,734 |
| 12,448 |
|
| Total liabilities | 127,574 |
| 124,017 |
| 153,650 |
| 127,950 |
|
| EQUITY | | |
| Preferred stock | 1,900 |
| 1,450 |
| 1,900 |
| 1,900 |
|
| Common Shares, $1 par value; authorized 2,100,000,000 and 1,400,000,000 shares; issued 1,256,702,081 and 1,256,702,081 shares | 1,257 |
| 1,257 |
| |
| Common Shares, $1 par value; authorized 2,100,000,000 and 2,100,000,000 shares; issued 1,256,702,081 and 1,256,702,081 shares | | 1,257 |
| 1,257 |
|
| Capital surplus | 6,266 |
| 6,331 |
| 6,240 |
| 6,295 |
|
| Retained earnings | 12,005 |
| 11,556 |
| 12,154 |
| 12,469 |
|
| Treasury stock, at cost (253,587,973 and 237,198,944 shares) | (4,457 | ) | (4,181 | ) | |
| Treasury stock, at cost (280,755,557 and 279,513,530 shares) | | (4,945 | ) | (4,909 | ) |
| Accumulated other comprehensive income (loss) | (2 | ) | (818 | ) | 936 |
| 26 |
|
| Key shareholders’ equity | 16,969 |
| 15,595 |
| 17,542 |
| 17,038 |
|
| Noncontrolling interests | 2 |
| 1 |
| — |
| — |
|
| Total equity | 16,971 |
| 15,596 |
| 17,542 |
| 17,038 |
|
| Total liabilities and equity | $ | 144,545 |
| $ | 139,613 |
| $ | 171,192 |
| $ | 144,988 |
|
| | | |
| |
| (a) | Total loans held for sale include real estate — residential mortgage loans held for sale at fair value of $164$250 million at June 30, 2019,2020, and $54$140 million at December 31, 2018.2019. |
See Notes to Consolidated Financial Statements (Unaudited).
Consolidated Statements of Income
| | | dollars in millions, except per share amounts | Three months ended June 30, | | Six months ended June 30, | Three months ended June 30, | | Six months ended June 30, |
| (Unaudited) | 2019 |
| 2018 |
| | 2019 |
| 2018 |
| 2020 |
| 2019 |
| | 2020 |
| 2019 |
|
| INTEREST INCOME | | | | | | |
| Loans | $ | 1,082 |
| $ | 1,000 |
| | $ | 2,148 |
| $ | 1,940 |
| $ | 980 |
| $ | 1,082 |
| | $ | 2,006 |
| $ | 2,148 |
|
| Loans held for sale | 15 |
| 16 |
| | 28 |
| 28 |
| 21 |
| 15 |
| | 40 |
| 28 |
|
| Securities available for sale | 135 |
| 97 |
| | 264 |
| 192 |
| 121 |
| 135 |
| | 250 |
| 264 |
|
| Held-to-maturity securities | 67 |
| 72 |
| | 135 |
| 141 |
| 56 |
| 67 |
| | 118 |
| 135 |
|
| Trading account assets | 9 |
| 7 |
| | 17 |
| 14 |
| 5 |
| 9 |
| | 13 |
| 17 |
|
| Short-term investments | 17 |
| 8 |
| | 33 |
| 16 |
| 7 |
| 17 |
| | 13 |
| 33 |
|
| Other investments | 4 |
| 5 |
| | 8 |
| 11 |
| — |
| 4 |
| | 1 |
| 8 |
|
| Total interest income | 1,329 |
| 1,205 |
| | 2,633 |
| 2,342 |
| 1,190 |
| 1,329 |
| | 2,441 |
| 2,633 |
|
| INTEREST EXPENSE | | | | | | |
| Deposits | 223 |
| 112 |
| | 425 |
| 203 |
| 96 |
| 223 |
| | 265 |
| 425 |
|
| Federal funds purchased and securities sold under repurchase agreements | — |
| 5 |
| | 1 |
| 9 |
| — |
| — |
| | 6 |
| 1 |
|
| Bank notes and other short-term borrowings | 5 |
| 7 |
| | 9 |
| 13 |
| 5 |
| 5 |
| | 10 |
| 9 |
|
| Long-term debt | 120 |
| 102 |
| | 240 |
| 194 |
| 71 |
| 120 |
| | 161 |
| 240 |
|
| Total interest expense | 348 |
| 226 |
| | 675 |
| 419 |
| 172 |
| 348 |
| | 442 |
| 675 |
|
| NET INTEREST INCOME | 981 |
| 979 |
| | 1,958 |
| 1,923 |
| 1,018 |
| 981 |
| | 1,999 |
| 1,958 |
|
| Provision for credit losses | 74 |
| 64 |
| | 136 |
| 125 |
| 482 |
| 74 |
| | 841 |
| 136 |
|
| Net interest income after provision for credit losses | 907 |
| 915 |
| | 1,822 |
| 1,798 |
| 536 |
| 907 |
| | 1,158 |
| 1,822 |
|
| NONINTEREST INCOME | | | | | | |
| Trust and investment services income | 122 |
| 128 |
| | 237 |
| 261 |
| 123 |
| 122 |
| | 256 |
| 237 |
|
| Investment banking and debt placement fees | 163 |
| 155 |
| | 273 |
| 298 |
| 156 |
| 163 |
| | 272 |
| 273 |
|
| Service charges on deposit accounts | 83 |
| 91 |
| | 165 |
| 180 |
| 68 |
| 83 |
| | 152 |
| 165 |
|
| Operating lease income and other leasing gains | 44 |
| (6 | ) | | 81 |
| 26 |
| 60 |
| 44 |
| | 90 |
| 81 |
|
| Corporate services income | 53 |
| 61 |
| | 108 |
| 123 |
| 52 |
| 53 |
| | 114 |
| 108 |
|
| Cards and payments income | 73 |
| 71 |
| | 139 |
| 133 |
| 91 |
| 73 |
| | 157 |
| 139 |
|
| Corporate-owned life insurance income | 33 |
| 32 |
| | 65 |
| 64 |
| 35 |
| 33 |
| | 71 |
| 65 |
|
| Consumer mortgage income | 10 |
| 7 |
| | 18 |
| 14 |
| 62 |
| 15 |
| | 82 |
| 26 |
|
| Mortgage servicing fees | 24 |
| 22 |
| | 45 |
| 42 |
| |
| Commercial mortgage servicing fees | | 12 |
| 19 |
| | 30 |
| 37 |
|
Other income (a) | 17 |
| 99 |
| | 27 |
| 120 |
| 33 |
| 17 |
| | (55 | ) | 27 |
|
| Total noninterest income | 622 |
| 660 |
| | 1,158 |
| 1,261 |
| 692 |
| 622 |
| | 1,169 |
| 1,158 |
|
| NONINTEREST EXPENSE | | | | | | |
| Personnel | 589 |
| 586 |
| | 1,152 |
| 1,180 |
| 572 |
| 589 |
| | 1,087 |
| 1,152 |
|
| Net occupancy | 73 |
| 79 |
| | 145 |
| 157 |
| 71 |
| 73 |
| | 147 |
| 145 |
|
| Computer processing | 56 |
| 51 |
| | 110 |
| 103 |
| 56 |
| 56 |
| | 111 |
| 110 |
|
| Business services and professional fees | 45 |
| 51 |
| | 89 |
| 92 |
| 49 |
| 45 |
| | 93 |
| 89 |
|
| Equipment | 24 |
| 26 |
| | 48 |
| 52 |
| 25 |
| 24 |
| | 49 |
| 48 |
|
| Operating lease expense | 32 |
| 30 |
| | 58 |
| 57 |
| 34 |
| 32 |
| | 70 |
| 58 |
|
| Marketing | 24 |
| 26 |
| | 43 |
| 51 |
| 24 |
| 24 |
| | 45 |
| 43 |
|
| FDIC assessment | 9 |
| 21 |
| | 16 |
| 42 |
| 8 |
| 9 |
| | 17 |
| 16 |
|
| Intangible asset amortization | 22 |
| 25 |
| | 44 |
| 54 |
| 18 |
| 22 |
| | 35 |
| 44 |
|
| OREO expense, net | 4 |
| — |
| | 7 |
| 2 |
| 6 |
| 4 |
| | 9 |
| 7 |
|
| Other expense | 141 |
| 98 |
| | 270 |
| 209 |
| 150 |
| 141 |
| | 281 |
| 270 |
|
| Total noninterest expense | 1,019 |
| 993 |
| | 1,982 |
| 1,999 |
| 1,013 |
| 1,019 |
| | 1,944 |
| 1,982 |
|
| INCOME (LOSS) FROM CONTINUING OPERATIONS BEFORE INCOME TAXES | 510 |
| 582 |
| | 998 |
| 1,060 |
| 215 |
| 510 |
| | 383 |
| 998 |
|
| Income taxes | 87 |
| 103 |
| | 169 |
| 165 |
| 30 |
| 87 |
| | 53 |
| 169 |
|
| INCOME (LOSS) FROM CONTINUING OPERATIONS | 423 |
| 479 |
| | 829 |
| 895 |
| 185 |
| 423 |
| | 330 |
| 829 |
|
| Income (loss) from discontinued operations | 2 |
| 3 |
| | 3 |
| 5 |
| 2 |
| 2 |
| | 3 |
| 3 |
|
| NET INCOME (LOSS) | 425 |
| 482 |
| | 832 |
| 900 |
| 187 |
| 425 |
| | 333 |
| 832 |
|
| Less: Net income (loss) attributable to noncontrolling interests | — |
| — |
| | — |
| — |
| — |
| — |
| | — |
| — |
|
| NET INCOME (LOSS) ATTRIBUTABLE TO KEY | $ | 425 |
| $ | 482 |
| | $ | 832 |
| $ | 900 |
| $ | 187 |
| $ | 425 |
| | $ | 333 |
| $ | 832 |
|
| Income (loss) from continuing operations attributable to Key common shareholders | $ | 403 |
| $ | 464 |
| | $ | 789 |
| $ | 866 |
| $ | 159 |
| $ | 403 |
| | $ | 277 |
| $ | 789 |
|
| Net income (loss) attributable to Key common shareholders | 405 |
| 467 |
| | 792 |
| 871 |
| 161 |
| 405 |
| | 280 |
| 792 |
|
| Per Common Share: | | | | | | |
| Income (loss) from continuing operations attributable to Key common shareholders | $ | .40 |
| $ | .44 |
| | $ | .79 |
| $ | .82 |
| $ | .16 |
| $ | .40 |
| | $ | .29 |
| $ | .79 |
|
| Income (loss) from discontinued operations, net of taxes | — |
| — |
| | — |
| — |
| — |
| — |
| | — |
| — |
|
Net income (loss) attributable to Key common shareholders (b) | .40 |
| .44 |
| | .79 |
| .82 |
| .17 |
| .40 |
| | .29 |
| .79 |
|
| Per Common Share — assuming dilution: | | | | | | |
| Income (loss) from continuing operations attributable to Key common shareholders | $ | .40 |
| $ | .44 |
| | $ | .78 |
| $ | .81 |
| $ | .16 |
| $ | .40 |
| | $ | .28 |
| $ | .78 |
|
| Income (loss) from discontinued operations, net of taxes | — |
| — |
| | — |
| — |
| — |
| — |
| | — |
| — |
|
Net income (loss) attributable to Key common shareholders (b) | .40 |
| .44 |
| | .78 |
| .81 |
| .17 |
| .40 |
| | .29 |
| .78 |
|
| Cash dividends declared per Common Share | $ | .17 |
| $ | .120 |
| | $ | .340 |
| $ | .225 |
| $ | .185 |
| $ | .17 |
| | $ | .370 |
| $ | .34 |
|
| Weighted-average Common Shares outstanding (000) | 999,163 |
| 1,052,652 |
| | 1,003,047 |
| 1,054,378 |
| 967,147 |
| 999,163 |
| | 967,380 |
| 1,003,047 |
|
| Effect of Common Share options and other stock awards | 8,801 |
| 13,141 |
| | 9,318 |
| 14,561 |
| 4,994 |
| 8,801 |
| | 6,892 |
| 9,318 |
|
Weighted-average Common Shares and potential Common Shares outstanding (000) (c) | 1,007,964 |
| 1,065,793 |
| | 1,012,365 |
| 1,068,939 |
| 972,141 |
| 1,007,964 |
| | 974,272 |
| 1,012,365 |
|
| | | | | | | |
| |
| (a) | For the three andmonths ended June 30, 2020, we had 0 net securities gains (losses). For the six months ended June 30, 2019, and June 30, 2018,2020, net securities gains (losses) totaled less than $1$4 million. For the three and six months ended June 30, 2019, net securities gains (losses) totaled less than $1 million. For the three months ended June 30, 2020, and June 30, 2018,2019, we did not0t have any impairment losses related to securities. |
| |
| (b) | EPS may not foot due to rounding. |
| |
| (c) | Assumes conversion of Common Share options and other stock awards and/or convertible preferred stock, as applicable. |
See Notes to Consolidated Financial Statements (Unaudited).
Consolidated Statements of Comprehensive Income
| | | in millions | Three months ended June 30, | | Six months ended June 30, | Three months ended June 30, | | Six months ended June 30, |
| (Unaudited) | 2019 |
| 2018 |
| | 2019 |
| 2018 |
| 2020 |
| 2019 |
| | 2020 |
| 2019 |
|
| Net income (loss) | $ | 425 |
| $ | 482 |
| | $ | 832 |
| $ | 900 |
| $ | 187 |
| $ | 425 |
| | $ | 333 |
| $ | 832 |
|
| Other comprehensive income (loss), net of tax: | | | | | | |
| Net unrealized gains (losses) on securities available for sale, net of income taxes of $91, ($20), $147, and ($67) | 291 |
| (66 | ) | | 475 |
| (216 | ) | |
| Net unrealized gains (losses) on derivative financial instruments, net of income taxes of $68, ($4), $99 and ($24) | 219 |
| (17 | ) | | 318 |
| (80 | ) | |
| Foreign currency translation adjustments, net of income taxes of $1, $3, $1 and $3 | 1 |
| (14 | ) | | 4 |
| (16 | ) | |
| Net pension and postretirement benefit costs, net of income taxes of $5, $1, $6 and $2 | 17 |
| 3 |
| | 19 |
| 6 |
| |
| Net unrealized gains (losses) on securities available for sale, net of income taxes of $40, $91, $166 and $147 | | 130 |
| 291 |
| | 535 |
| 475 |
|
| Net unrealized gains (losses) on derivative financial instruments, net of income taxes of ($5), $68. $112, and $99 | | (14 | ) | 219 |
| | 363 |
| 318 |
|
| Foreign currency translation adjustments, net of income taxes of $0, $1, $0, and $1 | | — |
| 1 |
| | — |
| 4 |
|
| Net pension and postretirement benefit costs, net of income taxes of $2, $5, $4, and $6 | | 6 |
| 17 |
| | 12 |
| 19 |
|
| Total other comprehensive income (loss), net of tax | 528 |
| (94 | ) | | 816 |
| (306 | ) | 122 |
| 528 |
| | 910 |
| 816 |
|
| Comprehensive income (loss) | 953 |
| 388 |
| | 1,648 |
| 594 |
| 309 |
| 953 |
| | 1,243 |
| 1,648 |
|
| Less: Comprehensive income attributable to noncontrolling interests | — |
| — |
| | — |
| — |
| — |
| — |
| | — |
| — |
|
| Comprehensive income (loss) attributable to Key | $ | 953 |
| $ | 388 |
| | $ | 1,648 |
| $ | 594 |
| $ | 309 |
| $ | 953 |
| | $ | 1,243 |
| $ | 1,648 |
|
| | | | | | | |
See Notes to Consolidated Financial Statements (Unaudited).
Consolidated Statements of Changes in Equity
| | | | Key Shareholders’ Equity | | Key Shareholders’ Equity | |
dollars in millions, except per share amounts (Unaudited) | Preferred Shares Outstanding (000) | Common Shares Outstanding (000) | Preferred Stock | Common Shares | Capital Surplus | Retained Earnings | Treasury Stock, at Cost | Accumulated Other Comprehensive Income (Loss) | Noncontrolling Interests | Preferred Shares Outstanding (000) | Common Shares Outstanding (000) | Preferred Stock | Common Shares | Capital Surplus | Retained Earnings | Treasury Stock, at Cost | Accumulated Other Comprehensive Income (Loss) | Noncontrolling Interests |
| BALANCE AT DECEMBER 31, 2018 | 946 |
| 1,019,503 |
| $ | 1,450 |
| $ | 1,257 |
| $ | 6,331 |
| $ | 11,556 |
| $ | (4,181 | ) | $ | (818 | ) | $ | 1 |
| |
| BALANCE AT DECEMBER 31, 2019 | | 1,396 |
| 977,189 |
| $ | 1,900 |
| $ | 1,257 |
| $ | 6,295 |
| $ | 12,469 |
| $ | (4,909 | ) | $ | 26 |
| — |
|
Cumulative effect from changes in accounting principle (a) | | | | (230 | ) | | |
| Net income (loss) | | | 832 |
| | — |
| | | 333 |
| | — |
|
| Other comprehensive income (loss) | | | 816 |
| | | | 910 |
| |
| Deferred compensation | | | 1 |
| | | | — |
| | |
| Cash dividends declared | | | | | |
| Common Shares ($.34 per share) | | | (343 | ) | | |
| Common Shares ($.37 per share) | | | | (362 | ) | | |
| Series D Preferred Stock ($25 per depositary share) | | | (13 | ) | | | | (13 | ) | | |
| Series E Preferred Stock ($.765626 per depositary share) | | | (15 | ) | | | | (15 | ) | | |
| Series F Preferred Stock ($.70625 per depositary share) | | | (12 | ) | | | | (12 | ) | | |
| Issuance of Series G Preferred Stock | 450 |
| | 450 |
| | (15 | ) | | |
| Series G Preferred Stock ($.703126 per depositary share) | | | | (13 | ) | | |
| Open market Common Share repurchases | | (20,325 | ) | | (346 | ) | | | (6,067 | ) | | (117 | ) | | |
| Employee equity compensation program Common Share repurchases | | (1,878 | ) | | (3 | ) | | (33 | ) | | | (1,814 | ) | | (55 | ) | | (36 | ) | | |
| Common Shares reissued (returned) for stock options and other employee benefit plans | | 5,814 |
| | (48 | ) | | 103 |
| | | 6,639 |
| | — |
| | 117 |
| | |
| Net contribution from (distribution to) noncontrolling interests | | | 1 |
| | | — |
|
| BALANCE AT JUNE 30, 2019 | 1,396 |
| 1,003,114 |
| $ | 1,900 |
| $ | 1,257 |
| $ | 6,266 |
| $ | 12,005 |
| $ | (4,457 | ) | $ | (2 | ) | $ | 2 |
| |
| Other | | | | (3 | ) | | |
| BALANCE AT JUNE 30, 2020 | | 1,396 |
| 975,947 |
| $ | 1,900 |
| $ | 1,257 |
| $ | 6,240 |
| $ | 12,154 |
| $ | (4,945 | ) | $ | 936 |
| — |
|
| | | | | | |
| BALANCE AT MARCH 31, 2019 | 946 |
| 1,013,186 |
| $ | 1,450 |
| $ | 1,257 |
| $ | 6,259 |
| $ | 11,771 |
| $ | (4,283 | ) | $ | (530 | ) | $ | 2 |
| |
| BALANCE AT MARCH 31, 2020 | | 1,396 |
| 975,319 |
| $ | 1,900 |
| $ | 1,257 |
| $ | 6,222 |
| $ | 12,174 |
| $ | (4,956 | ) | $ | 814 |
| — |
|
| Net income (loss) | | | 425 |
| | — |
| | | 187 |
| | — |
|
| Other comprehensive income (loss) | | | 528 |
| | | | 122 |
| |
| Deferred compensation | | | 4 |
| | | | 1 |
| | |
| Cash dividends declared | | | | | |
| Common Shares ($.17 per share) | | | (171 | ) | | |
| Common Shares ($.185 per share) | | | | (181 | ) | | |
| Series D Preferred Stock ($12.50 per depositary share) | | | (7 | ) | | | | (6 | ) | | |
| Series E Preferred Stock ($.382813 per depositary share) | | | (7 | ) | | | | (7 | ) | | |
| Series F Preferred Stock ($.353125 per depositary share) | | | (6 | ) | | | | (6 | ) | | |
| Issuance of Series G Preferred Stock | 450 |
| | 450 |
| | (15 | ) | | |
| Series G Preferred Stock ($.351563 per depositary share) | | | | (7 | ) | | |
| Open market Common Share repurchases | | (10,357 | ) | | (179 | ) | | | — |
| | — |
| | |
| Employee equity compensation program Common Share repurchases | | (55 | ) | | (1 | ) | | (1 | ) | | | (19 | ) | | 17 |
| | (1 | ) | | |
| Common Shares reissued (returned) for stock options and other employee benefit plans | | 340 |
| | 19 |
| | 6 |
| | | 647 |
| | — |
| | 12 |
| | |
| Net contribution from (distribution to) noncontrolling interests | | | $ | — |
| | | — |
|
| BALANCE AT JUNE 30, 2019 | 1,396 |
| 1,003,114 |
| $ | 1,900 |
| $ | 1,257 |
| $ | 6,266 |
| $ | 12,005 |
| $ | (4,457 | ) | $ | (2 | ) | $ | 2 |
| |
| Other | | | | — |
| | |
| BALANCE AT JUNE 30, 2020 | | 1,396 |
| 975,947 |
| $ | 1,900 |
| $ | 1,257 |
| $ | 6,240 |
| $ | 12,154 |
| $ | (4,945 | ) | $ | 936 |
| — |
|
| | | | | | |
See Notes to Consolidated Financial Statements (Unaudited).
|
| | | | | | | | | | | | | | | | | | | | | | | | | |
| | Key Shareholders’ Equity | |
dollars in millions, except per share amounts (Unaudited) | Preferred Shares Outstanding (000) | Common Shares Outstanding (000) | Preferred Stock | Common Shares | Capital Surplus | Retained Earnings | Treasury Stock, at Cost | Accumulated Other Comprehensive Income (Loss) | Noncontrolling Interests |
| BALANCE AT DECEMBER 31, 2017 | 521 |
| 1,069,084 |
| $ | 1,025 |
| $ | 1,257 |
| $ | 6,335 |
| $ | 10,335 |
| $ | (3,150 | ) | $ | (779 | ) | $ | 2 |
|
Cumulative effect from changes in accounting principle (a) | | | | | | (2 | ) | | | |
| Other reclassification of AOCI | | | | | | 5 |
| | | |
| Net income (loss) | | | | | | 900 |
| | | — |
|
| Other comprehensive income (loss) | | | | | | | | (306 | ) | |
| Deferred compensation | | | | | 12 |
| | | | |
| Cash dividends declared | | | | | | | | | |
| Common Shares ($.225 per share) | | | | | | (239 | ) | | | |
| Series D Preferred Stock ($25 per depositary share) | | | | | | (13 | ) | | | |
| Series E Preferred Stock ($.765626 per depositary share) | | | | | | (16 | ) | | | |
| Open market Common Share repurchases | | (13,438 | ) | | | | | (279 | ) | | |
| Employee equity compensation program Common Share repurchases | | (2,221 | ) | | | | | (46 | ) | | |
| Common Shares reissued (returned) for stock options and other employee benefit plans | | 5,519 |
| | | (32 | ) | | 93 |
| | |
| BALANCE AT JUNE 30, 2018 | 521 |
| 1,058,944 |
| $ | 1,025 |
| $ | 1,257 |
| $ | 6,315 |
| $ | 10,970 |
| $ | (3,382 | ) | $ | (1,085 | ) | $ | 2 |
|
| | | | | | | | | | |
| BALANCE AT MARCH 31, 2018 | 521 |
| 1,064,939 |
| $ | 1,025 |
| $ | 1,257 |
| $ | 6,289 |
| $ | 10,624 |
| $ | (3,260 | ) | $ | (991 | ) | $ | 2 |
|
| Other reclassification of AOCI | | | | | | 5 |
| | | |
| Net income (loss) | | | | | | 482 |
| | | — |
|
| Other comprehensive income (loss): | | | | | | | | $ | (94 | ) | |
| Deferred compensation | | | | | 6 |
| | | | |
| Cash dividends declared | | | | | | | | | |
| Common Shares ($.12 per share) | | | | | | (127 | ) | | | |
| Series D Preferred Stock ($12.50 per depositary share) | | | | | | (6 | ) | | | |
| Series E Preferred Stock ($.382813 per depositary share) | | | | | | (8 | ) | | | |
| Open market Common Share repurchases | | (6,105 | ) | | | | | (123 | ) | | |
| Employee equity compensation program Common Share repurchases | | (155 | ) | | | | | (3 | ) | | |
| Common shares reissued (returned) for stock options and other employee benefit plans | | 265 |
| | | 20 |
| | 4 |
| | |
| BALANCE AT JUNE 30, 2018 | 521 |
| 1,058,944 |
| $ | 1,025 |
| $ | 1,257 |
| $ | 6,315 |
| $ | 10,970 |
| $ | (3,382 | ) | $ | (1,085 | ) | $ | 2 |
|
| | | | | | | | | | |
| |
| (a) | Includes the impact of implementing ASU 2014-09, ASU 2016-01,2016-13, Financial Instruments - Credit Losses (ASC 326): Measurement of Credit Losses on Financial Instruments. See Note 1 (“Basis of Presentation and ASU 2017-12.Accounting Policies”) for more information on our adoption of this guidance and the impact to our results of operations. |
See Notes to Consolidated Financial Statements (Unaudited).
|
| | | | | | | | | | | | | | | | | | | | | | | | | |
| | | | | | | | | | |
| | Key Shareholders’ Equity | |
dollars in millions, except per share amounts (Unaudited) | Preferred Shares Outstanding (000) | Common Shares Outstanding (000) | Preferred Stock | Common Shares | Capital Surplus | Retained Earnings | Treasury Stock, at Cost | Accumulated Other Comprehensive Income (Loss) | Noncontrolling Interests |
| BALANCE AT DECEMBER 31, 2018 | 946 |
| 1,019,503 |
| $ | 1,450 |
| $ | 1,257 |
| $ | 6,331 |
| $ | 11,556 |
| $ | (4,181 | ) | $ | (818 | ) | $ | 1 |
|
| Net income (loss) | | | | | | 832 |
| | | — |
|
| Other comprehensive income (loss): | | | | | | | | 816 |
| |
| Deferred compensation | | | | | 1 |
| | | | |
| Cash dividends declared | | | | | | | | | |
| Common Shares ($.34 per share) | | | | | | (343 | ) | | | |
| Series D Preferred Stock ($25 per depositary share) | | | | | | (13 | ) | | | |
| Series E Preferred Stock ($.765626 per depositary share) | | | | | | (15 | ) | | | |
| Series F Preferred Stock ($.70625 per depositary share) | | | | | | (12 | ) | | | |
| Issuance of Series G Preferred Stock | 450 |
| | 450 |
| | (15 | ) | | | | |
| Open market Common Share repurchases | | (20,325 | ) | | | | | (346 | ) | | |
| Employee equity compensation program Common Share repurchases | | (1,878 | ) | | | (3 | ) | | (33 | ) | | |
| Common shares reissued (returned) for stock options and other employee benefit plans | | 5,814 |
| | | (48 | ) | | 103 |
| | |
| Net contribution from (distribution to) noncontrolling interests | | | | | | | | | 1 |
|
| BALANCE AT JUNE 30, 2019 | 1,396 |
| 1,003,114 |
| $ | 1,900 |
| $ | 1,257 |
| $ | 6,266 |
| $ | 12,005 |
| $ | (4,457 | ) | $ | (2 | ) | $ | 2 |
|
| | | | | | | | | | |
| BALANCE AT MARCH 31, 2019 | 946 |
| 1,013,186 |
| $ | 1,450 |
| $ | 1,257 |
| $ | 6,259 |
| $ | 11,771 |
| $ | (4,283 | ) | $ | (530 | ) | $ | 2 |
|
| Net income (loss) | | | | | | 425 |
| | | |
| Other comprehensive income (loss): | | | | | | | | | |
| Deferred compensation | | | | | 4 |
| | | | — |
|
| Cash dividends declared | | | | | | | | 528 |
| |
| Common Shares ($.17 per share) | | | | | | (171 | ) | | | |
| Series D Preferred Stock ($12.50 per depositary share) | | | | | | (7 | ) | | | |
| Series E Preferred Stock ($.382813 per depositary share) | | | | | | (7 | ) | | | |
| Series F Preferred Stock ($.353125 per depositary share) | | | | | | (6 | ) | | | |
| Issuance of Series G Preferred Stock | 450 |
| | $ | 450 |
| | (15 | ) | | | | |
| Open market Common Share repurchases | | (10,357 | ) | | | | | (179 | ) | | |
| Employee equity compensation program Common Share repurchases | | (55 | ) | | | (1 | ) | | (1 | ) | | |
| Common shares reissued (returned) for stock options and other employee benefit plans | | 340 |
| | | 19 |
| | 6 |
| | |
| Net contribution from (distribution to) noncontrolling interests | | | | | | | | | — |
|
| BALANCE AT JUNE 30, 2019 | 1,396 |
| 1,003,114 |
| $ | 1,900 |
| $ | 1,257 |
| $ | 6,266 |
| $ | 12,005 |
| $ | (4,457 | ) | $ | (2 | ) | $ | 2 |
|
| | | | | | | | | | |
Consolidated Statements of Cash Flows
| | | in millions | Six months ended June 30, | Six months ended June 30, |
| (Unaudited) | 2019 |
| | 2018 |
| 2020 |
| | 2019 |
|
| OPERATING ACTIVITIES | | | | | | |
| Net income (loss) | $ | 832 |
| | $ | 900 |
| $ | 333 |
| | $ | 832 |
|
| Adjustments to reconcile net income (loss) to net cash provided by (used in) operating activities: | | | | | | |
| Provision for credit losses | 136 |
| | 125 |
| 841 |
| | 136 |
|
| Depreciation and amortization expense, net | 121 |
| | 195 |
| 86 |
| | 121 |
|
| Accretion of acquired loans | 28 |
| | 22 |
| 18 |
| | 28 |
|
| Increase in cash surrender value of corporate-owned life insurance | (57 | ) | | (56 | ) | (58 | ) | | (57 | ) |
| Stock-based compensation expense | 48 |
| | 53 |
| 51 |
| | 48 |
|
| FDIC reimbursement (payments), net of FDIC expense | 1 |
| | 2 |
| |
| Deferred income taxes (benefit) | 68 |
| | 17 |
| (148 | ) | | 68 |
|
| Proceeds from sales of loans held for sale | 4,445 |
| | 5,703 |
| 6,437 |
| | 4,445 |
|
| Originations of loans held for sale, net of repayments | (4,890 | ) | | (5,944 | ) | (6,816 | ) | | (4,890 | ) |
| Net losses (gains) on sales of loans held for sale | (70 | ) | | (89 | ) | (109 | ) | | (70 | ) |
| Net losses (gains) and writedown on OREO | 4 |
| | 2 |
| |
| Net losses (gains) on leased equipment | (11 | ) | | (37 | ) | (16 | ) | | (11 | ) |
| Net securities losses (gains) | | (4 | ) | | — |
|
| Net losses (gains) on sales of fixed assets | 11 |
| | 4 |
| 3 |
| | 11 |
|
| Net decrease (increase) in trading account assets | (155 | ) | | 3 |
| 395 |
| | (155 | ) |
| Gain on sale of KIBS | — |
| | (78 | ) | |
| Other operating activities, net | 209 |
| | (414 | ) | (908 | ) | | 224 |
|
| NET CASH PROVIDED BY (USED IN) OPERATING ACTIVITIES | 720 |
| | 408 |
| 105 |
| | 730 |
|
| INVESTING ACTIVITIES | | | | | | |
| Cash received (used) in acquisitions, net of cash acquired | (185 | ) | | — |
| — |
| | (185 | ) |
| Proceeds from sale of KIBS | — |
| | 119 |
| |
| Net decrease (increase) in short-term investments, excluding acquisitions | 119 |
| | 1,801 |
| (12,764 | ) | | 119 |
|
| Purchases of securities available for sale | (2,940 | ) | | (1,167 | ) | (4,567 | ) | | (2,940 | ) |
| Proceeds from sales of securities available for sale | | 583 |
| | — |
|
| Proceeds from prepayments and maturities of securities available for sale | 1,457 |
| | 1,640 |
| 2,933 |
| | 1,457 |
|
| Proceeds from prepayments and maturities of held-to-maturity securities | 652 |
| | 797 |
| 998 |
| | 652 |
|
| Purchases of held-to-maturity securities | (9 | ) | | (1,242 | ) | (5 | ) | | (9 | ) |
| Purchases of other investments | (30 | ) | | (6 | ) | (96 | ) | | (30 | ) |
| Proceeds from sales of other investments | 28 |
| | 22 |
| 26 |
| | 28 |
|
| Proceeds from prepayments and maturities of other investments | 36 |
| | 2 |
| 11 |
| | 36 |
|
| Net decrease (increase) in loans, excluding acquisitions, sales and transfers | (2,747 | ) | | (2,044 | ) | (11,967 | ) | | (2,747 | ) |
| Proceeds from sales of portfolio loans | 146 |
| | 99 |
| 91 |
| | 146 |
|
| Proceeds from corporate-owned life insurance | 27 |
| | 41 |
| 40 |
| | 27 |
|
| Purchases of premises, equipment, and software | (38 | ) | | (36 | ) | (27 | ) | | (38 | ) |
| Proceeds from sales of premises and equipment | 1 |
| | 1 |
| — |
| | 1 |
|
| Proceeds from sales of OREO | 10 |
| | 14 |
| |
| NET CASH PROVIDED BY (USED IN) INVESTING ACTIVITIES | (3,473 | ) | | 41 |
| (24,744 | ) | | (3,483 | ) |
| FINANCING ACTIVITIES | | | | | | |
| Net increase (decrease) in deposits, excluding acquisitions | 2,637 |
| | (687 | ) | 23,643 |
| | 2,637 |
|
| Net increase (decrease) in short-term borrowings | 18 |
| | 1,295 |
| 891 |
| | 18 |
|
| Net proceeds from issuance of long-term debt | 1,351 |
| | 1,758 |
| 2,501 |
| | 1,351 |
|
| Payments on long-term debt | (1,002 | ) | | (2,123 | ) | (1,507 | ) | | (1,002 | ) |
| Issuance of preferred shares | 435 |
| | — |
| — |
| | 435 |
|
| Open market Common Share repurchases | (346 | ) | | (279 | ) | (117 | ) | | (346 | ) |
| Employee equity compensation program Common Share repurchases | (33 | ) | | (46 | ) | (36 | ) | | (33 | ) |
| Net proceeds from reissuance of Common Shares | 5 |
| | 14 |
| 6 |
| | 5 |
|
| Cash dividends paid | (383 | ) | | (268 | ) | (415 | ) | | (383 | ) |
| NET CASH PROVIDED BY (USED IN) FINANCING ACTIVITIES | 2,682 |
| | (336 | ) | 24,966 |
| | 2,682 |
|
| NET INCREASE (DECREASE) IN CASH AND DUE FROM BANKS | (71 | ) | | 113 |
| 327 |
| | (71 | ) |
| CASH AND DUE FROM BANKS AT BEGINNING OF PERIOD | 678 |
| | 671 |
| 732 |
| | 678 |
|
| CASH AND DUE FROM BANKS AT END OF PERIOD | $ | 607 |
| | $ | 784 |
| $ | 1,059 |
| | $ | 607 |
|
| Additional disclosures relative to cash flows: | | | | | | |
| Interest paid | $ | 619 |
| | $ | 389 |
| $ | 465 |
| | $ | 619 |
|
| Income taxes paid (refunded) | (43 | ) | | 14 |
| 59 |
| | (43 | ) |
| Noncash items: | | | | | | |
| Reduction of secured borrowing and related collateral | $ | 2 |
| | 15 |
| $ | 3 |
| | $ | 2 |
|
| Loans transferred to portfolio from held for sale | 5 |
| | 21 |
| 25 |
| | 5 |
|
| Loans transferred to held for sale from portfolio | 52 |
| | 3 |
| 210 |
| | 52 |
|
| Loans transferred to OREO | 16 |
| | 9 |
| 93 |
| | 16 |
|
| CMBS risk retentions | 9 |
| | — |
| 27 |
| | 9 |
|
| ABS risk retentions | | 9 |
| | — |
|
| | | | | | | |
See Notes to Consolidated Financial Statements (Unaudited).
Notes to Consolidated Financial Statements (Unaudited)
1. Basis of Presentation and Accounting Policies
The consolidated financial statements include the accounts of KeyCorp and its subsidiaries. All significant intercompany accounts and transactions have been eliminated in consolidation. Some previously reported amounts have been reclassified to conform to current reporting practices.
The consolidated financial statements include any voting rights entities in which we have a controlling financial interest. In accordance with the applicable accounting guidance for consolidations, we consolidate a VIE if we have: (i) a variable interest in the entity; (ii) the power to direct activities of the VIE that most significantly affect the entity’s economic performance; and (iii) the obligation to absorb losses of the entity or the right to receive benefits from the entity that could potentially be significant to the VIE (i.e., we are considered to be the primary beneficiary). Variable interests can include equity interests, subordinated debt, derivative contracts, leases, service agreements, guarantees, standby letters of credit, loan commitments, and other contracts, agreements, and financial instruments. See Note 10 (“Variable Interest Entities”) for information on our involvement with VIEs.
We use the equity method to account for unconsolidated investments in voting rights entities or VIEs if we have significant influence over the entity’s operating and financing decisions (usually defined as a voting or economic interest of 20% to 50%, but not controlling). Unconsolidated investments in voting rights entities or VIEs in which we have a voting or economic interest of less than 20% are carried at the cost measurement alternative or at fair value. Investments held by our registered broker-dealer and investment company subsidiaries (principal investing entities and Real Estate Capital line of business) are carried at fair value.
We believe that the unaudited consolidated interim financial statements reflect all adjustments of a normal recurring nature and disclosures that are necessary for a fair presentation of the results for the interim periods presented. The results of operations for the interim period are not necessarily indicative of the results of operations to be expected for the full year. The interim financial statements should be read in conjunction with the audited consolidated financial statements and related notes included in our 20182019 Form 10-K.
In preparing these financial statements, subsequent events were evaluated through the time the financial statements were issued. Financial statements are considered issued when they are widely distributed to all shareholders and other financial statement users or filed with the SEC.
Accounting Guidance Adopted in 20192020
|
| | | |
Standard | Date of Adoption | Description | Effect on Financial Statements or Other Significant Matters |
ASU 2016-02, Leases (Topic 842)
ASU 2018-01, Leases (Topic 842): Land Easement Practical Expedient
ASU 2018-10, Codification Improvements to Topic 842
ASU 2018-11, Leases (Topic 842): Targeted Improvements
ASU 2018-20, Leases (Topic 842): Narrow Scope ImprovementsMeasurement of Credit Losses on Financial Instruments (ASU 2016-13, ASU 2018-19, ASU 2019-04, ASU 2019-05, ASU 2019-11, ASU 2020-02, ASU 2020-03)
On January 1, 2020, we adopted ASU 2016-13, Financial Instruments - Credit Losses (ASC 326): Measurement of Credit Losses on Financial Instruments, which replaces the incurred-loss methodology that recognized losses when a probable threshold was met with an expected-loss methodology, specifically, recognizing current expected credit losses (CECL) for the remaining life of the asset at the time of origination or acquisition. The CECL methodology applies to loans, debt securities, and other financial assets and net investment in leases measured at amortized cost. It also applies to off-balance sheet credit exposures (loan commitments, standby letters of credit, financial guarantees, and other similar instruments). Assets in the scope of ASC 326 are presented at the net amount expected to be collected after deducting the allowance for credit losses from the amortized cost basis of the assets. ASC 326 also requires credit losses relating to available-for-sale debt securities that management does not intend to sell or believes that it is more likely than not they will be required to sell to be recorded through an allowance rather than a reduction of the carrying amount.
ASC 326 replaces the purchased credit impaired concept of accounting, previously required under Subtopic 310-30, with a purchased financial assets with credit deterioration (PCD) concept. In accordance with ASC 326, we did not reassess whether recognized purchased credit impaired loans met the criteria of a PCD loan and modifications to individual acquired loans accounted for in pools were TDRs as of the date of adoption. At adoption, we elected to not maintain the pools of loans previously accounted for under Subtopic 310-30.
The prospective application resulted in a $4 million adjustment to the amortized cost basis of PCD loans to reflect the addition to the allowance for loans and leases as of January 1, 2020. After the adjustment for the allowance for Lessors
ASU 2019-01, Codification Improvements to Topic 842
| January 1, 2019
| The ASUs create and amend ASC Topic 842, Leases, and supersede Topic 840, Leases. The new guidance requires that a lessee recognize assets and liabilities for leases with lease terms of more than 12 months. For leases with a term of 12 months or less, a lessee is permitted to make an accounting policy election by class of underlying asset not to recognize lease assets and lease liabilities. Leveraged leases that commenced before the effective date of the new guidance are grandfathered. The recognition, measurement, and presentation of expenses and cash flows arising from a lease by a lessee primarily will depend on its classification as a finance or operating lease. However, both types of leases are required to be recognized on the balance sheet. ASC 842 requires enhanced disclosures to better understand the amount, timing, and uncertainty of cash flows arising from leases. Qualitative and quantitative disclosures are required to provide additional information about the amounts recorded in the financial statements. Although substantially unchanged, certain amendments provide clarifications related to lessor accounting.
The guidance should be implemented using a modified retrospective approach. However, entities may choose to measure and present the changes at the beginning of the earliest period presented or to reflect the changes as of the adoption date.
| Key adopted this guidance on January 1, 2019, using the package of practical expedients, which allowed Key to maintain historic lease identification and classification, and permitted Key not to reassess initial direct costs under the new guidance. Key also elected the practical expedient on not separating lease components from nonlease components for all of its leases.
Adoption resulted in an increase in right-of-use assets and associated lease liabilities arising from operating leases in which Key is the lessee of approximately $710 million on our Consolidated Balance Sheets at January 1, 2019. Right of use assets, lease liabilities, and other changes as a result of adoption are not reflected in comparable periods presented prior to that date. The adoption of this guidance did not have a material impact on the recognition of operating lease expense in our Consolidated Statements of Income. The amount of the right-of-use assets and associated lease liabilities recorded at adoption was based on the present value of unpaid future minimum lease payments. These payments were discounted using Key’s incremental borrowing rate, consistent with what Key would pay to borrow on a collateralized basis over a term similar to each lease.
For more information, please see Note 9 (“Leases”).
|
ASU 2017-08,
Premium
Amortization on
Purchased
Callable Debt
Securities
| January 1, 2019
| The ASU amends ASC Topic 310-20, Receivables
— Nonrefundable Fees and Other Costs, and shortens the amortization period to the earliest call date for certain callable debt securities held at a premium. Securities held at a discount will continue to be amortized to maturity.
The guidance should be implemented on a modified retrospective basis using a cumulative-effect adjustment.
| The adoption of this guidance did not have a material effect on our financial condition or results of operations.
|
ASU 2018-07, Stock Compensation - Improvements to Nonemployee
Share-Based Payment Accounting
| January 1, 2019 | The ASU amends ASC Topic 718, Stock Compensation, and simplifies the accounting for share based payments granted to nonemployees for goods and services.
The guidance should be implemented on a modified retrospective basis using a cumulative-effect adjustment.
| The adoption of this guidance did not affect our financial condition or results of operations.
|
ASU 2018-13, Fair Value Measurement: Disclosure Framework
| September 30, 2018 (removed disclosures only); January 1, 2019, remaining requirements
An entity is permitted to early adopt any removed or modified disclosures upon issuance of this ASU and delay adoption of the additional disclosures until their effective date.
| The ASU amends disclosure requirements related to fair value measurements. Specifically, entities are no longer required to disclose transfers between Level 1 and Level 2 of the fair value hierarchy, or qualitatively disclose the valuation process for Level 3 fair value measurements. The updated guidance requires disclosure of the changes in unrealized gains and losses for the period included in Other Comprehensive Income for recurring Level 3 fair value measurements. Entities also will be required to disclose the range and weighted average used to develop significant unobservable inputs for Level 3 fair value measurements.
The additional provisions of the guidance should be adopted prospectively, while the eliminated requirements should be adopted retrospectively. | Key removed the disclosures no longer required by the guidance as of September 30, 2018, and early adopted the additional provisions of the standard in the first quarter of 2019. The adoption of this standard did not result in significant changes to Key’s disclosures, and there was no effect to our financial condition or results of operations. |
the loans and leases, the noncredit discount of $15 million will be accreted to interest income using the interest method based on the effective interest rate determined after the adjustment from credit losses as of January 1, 2020.
|
| | | |
Standard | Date of Adoption | Description | Effect on Financial Statements or Other Significant Matters |
ASU 2018-15, Customer’s Accounting for Implementation Costs Incurred in a Cloud Computing Arrangement That is a Service Contract
| January 1, 2019
Early adoption.
| The ASU amends ASC Topic 350-40 to align the accounting for costs incurred in a cloud computing arrangement with the guidance on developing internal use software. Specifically, if a cloud computing arrangement is deemed to be a service contract, certain implementation costs are eligible for capitalization. The new guidance prescribes the balance sheet and income statement presentation and cash flow classification for the capitalized costs and related amortization expense. It also requires additional quantitative and qualitative disclosures.
The guidance may be adopted prospectively or retrospectively.
| Key early adopted this guidance effective January 1, 2019, on a prospective basis. The adoption of this guidance did not have a material effect on our financial condition or results of operations.
|
ASU 2019-04,
Codification Improvements to Topic 815, Derivatives and Hedging (ASU Topic #3), and Topic 825, Financial Instruments (ASU Topic #4)
| May 1, 2019
Early adoption upon issuance
| The ASU provides technical corrections to previously adopted ASUs 2016-01 and 2017-12 and clarifies issues related to partial-term fair value hedges, fair value hedge basis adjustments, and how to measure changes in fair value of a hedged item. It also clarifies certain issues related to equity securities and the measurement alternative.
Amendments related to ASU 2016-01 should be adopted using a modified retrospective approach, except for those related to equity securities without readily determinable fair values for which the measurement alternative is elected, that should be applied prospectively. Amendments related to ASU 2017-12 can be applied on either a prospective or retrospective basis, with certain exceptions.
| Key early adopted this guidance effective May 1, 2019. The adoption of this accounting guidance did not effect our financial condition or results of operations.
|
The ASU requires use of a modified retrospective approach through a cumulative-effect adjustment to retained earnings as of the beginning of the period of adoption. Results for reporting periods beginning after January 1, 2020, are presented under ASC 326 while prior period amounts continue to be reported in accordance with previously applicable GAAP. We posted an adjusting entry decreasing retained earnings as of January 1, 2020, by $230 million, net of deferred taxes of $71 million, for the cumulative effect of adopting ASC 326. The main drivers of the adjustment to retained earnings are summarized in the following table.
|
| | | | | | | | | |
| | Pre-ASC 326 Adoption | Impact of ASC 326 Adoption | As Reported Under ASC 326 |
| in millions | December 31, 2019 | January 1, 2020 |
| Allowance for credit losses | | | |
| Commercial | | | |
| Commercial and industrial | $ | 551 |
| $ | (141 | ) | $ | 410 |
|
| Real estate — commercial mortgage | 143 |
| 16 |
| 159 |
|
| Real estate — construction | 22 |
| (7 | ) | 15 |
|
| Commercial lease financing | 35 |
| 8 |
| 43 |
|
| Total commercial loans | 751 |
| (124 | ) | 627 |
|
| Consumer | | | |
| Real estate — residential mortgage | 7 |
| 77 |
| 84 |
|
| Home equity loans | 31 |
| 147 |
| 178 |
|
| Consumer direct loans | 34 |
| 63 |
| 97 |
|
| Credit cards | 47 |
| 35 |
| 82 |
|
| Consumer indirect loans | 30 |
| 6 |
| 36 |
|
| Total consumer loans | 149 |
| 328 |
| 477 |
|
| Total ALLL — continuing operations | 900 |
| 204 |
| 1,104 |
|
| Discontinued operations | 10 |
| 31 |
| 41 |
|
| Total ALLL | 910 |
| 235 |
| 1,145 |
|
| Accrued expense and other liabilities | 75 |
| 70 |
| 145 |
|
| Total allowance for credit losses | $ | 985 |
| $ | 305 |
| $ | 1,290 |
|
| | | | |
In conjunction with the adoption of ASC 326, the following are additional disclosures about our significant accounting policies related to CECL.
Allowance for Held-to-Maturity Securities
Debt securities that we have the intent and ability to hold until maturity are classified as held-to-maturity and are carried at cost and adjusted for amortization of premiums and accretion of discounts using the interest method. This method produces a constant rate of return on the adjusted carrying amount.
Management classifies the held-to-maturity portfolio into the following major security types: agency residential collateralized mortgage obligations, agency residential mortgage-backed securities, agency commercial mortgage-backed securities, asset backed securities, and other. Management measures expected credit losses on held-to-maturity securities on a collective basis by major security type. The estimate of expected losses considers historical credit loss information that is adjusted for current conditions and reasonable and supportable forecasts. We do not measure expected credit losses on held-to-maturity securities in which historical credit loss information adjusted for current conditions and reasonable and supportable forecasts results in an expectation that nonpayment of the amortized cost basis is zero.
All of our mortgage-backed securities are issued by U.S. government-sponsored enterprises or GNMA, are highly rated by major rating agencies and have a long history of no credit losses. Other securities are comprised of State of Israel bonds denominated and paid in U.S. dollars. Israel bonds have a long history of no credit losses. Additionally, as of June 30, 2020, the State of Israel's credit rating remains "stable" among Fitch, Moody's, and S&P (A+, A1, AA-).
Allowance for Available-for-Sale Securities
Debtsecurities that we intend to hold for an indefinite period of time but that may be sold in response to changes in interest rates, prepayment risk, liquidity needs, or other factors are classified as available-for-sale and reported at fair value. Realized gains and losses resulting from sales of securities using the specific identification method are included in “other income” on the income statement. Unrealized gains and losses (net of income taxes) are recorded in equity as a component of AOCI.
For available-for-sale securities in an unrealized loss position, we first assess whether we intend to sell, or it is more likely than not that we will be required to sell the security before recovery of its amortized cost basis. If either of these criteria regarding intent or requirement to sell is met, the security's amortized cost basis is written down to fair value in “other income” on the income statement. For debt securities that do not meet the aforementioned criteria, we evaluate whether the decline in fair value has resulted from credit losses or other factors. In making this assessment, management considers the extent to which fair value is less than amortized cost, nature of the security, the underlying collateral, and the financial condition of the issuer, among other factors. If this assessment indicates a credit loss exists, the present value of cash flows expected to be collected from the security are compared to the amortized cost basis of the security. If the present value of the cash flows expected to be collected is less than the amortized cost basis, a credit loss exists and an allowance for available-for-sale securities is recorded for the credit loss, limited by the amount that the fair value is less than the amortized cost basis. Any impairment that has not been recorded through an allowance for available-for-sale securities is recognized in other comprehensive income.
Changes in the allowance for available-for-sale securities are recorded as provision for (or reversal of) credit loss. Losses are charged against the allowance for available-for-sale securities when management believes the uncollectibility of an available-for-sale security is confirmed or when either criteria regarding intent or requirement to sell is met.
Loans
Accrued interest on loans is included in "other assets" on the balance sheet and is excluded from the calculation of the allowance for credit losses due to our charge-off policy to reverse accrued interest on nonperforming loans against interest income in a timely manner. We have not classified loans that receive a payment deferral or forbearance under a COVID-19 hardship relief program as nonperforming loans and continue to accrue and recognize interest income during the period of the deferral. We, therefore, recognize an allowance for credit losses for accrued interest receivable amounts that result from deferred payments under a COVID-19 hardship relief program because those amounts would not be considered to be written off in a timely manner. As of June 30, 2020, the allowance for credit losses on accrued interest receivable was immaterial.
Expected credit losses on net investments in leases, including any unguaranteed residual asset, are included in the ALLL.
Purchased Credit Deteriorated (PCD) Loans
In addition to originating loans, we also acquire loans through portfolio purchases or acquisitions of other financial services companies. Purchased loans that have evidence of more than insignificant credit deterioration since origination are deemed PCD loans. In accordance with ASC 326, we did not reassess whether recognized purchased credit impaired loans met the criteria of a PCD loan as of the date of adoption. PCD loans are initially recorded at fair value along with an allowance for credit losses determined using the same methodology as originated loans. The sum of the loan's purchase price and allowance for credit losses becomes its initial amortized cost basis. The difference between the initial amortized cost basis and the par value of the loan is a noncredit discount or premium, which is amortized into interest income over the life of the loan. Subsequent changes to the allowance for credit losses are recorded through provision for credit losses.
Nonperforming Loans
Nonperforming loans are loans for which we do not accrue interest income, and include commercial and consumer loans and leases, as well as current year TDRs and nonaccruing TDR loans from prior years. Nonperforming loans do not include loans held for sale. Once a loan is designated nonaccrual, the interest accrued but not collected is
reversed against interest income, and payments subsequently received are applied to principal until qualifying for return to accrual.
Allowance for Loan and Lease Losses
We estimate the ALLL using relevant available information, from internal and external sources, relating to past events, current conditions, and reasonable and supportable forecasts. The ALLL is measured on a collective (pool) basis when similar risk characteristics exist. Our portfolio segments include commercial and consumer. Each of these two segments comprises multiple loan classes. Classes are characterized by similarities in initial measurement, risk attributes, and the manner in which we monitor and assess credit risk. The commercial segment is composed of commercial and industrial, commercial real estate, and commercial lease financing loan classes. The consumer lending segment is composed of residential mortgage, home equity, consumer direct, credit card, and consumer indirect loan classes.
The ALLL represents our current estimate of lifetime credit losses inherent in our loan portfolio at the balance sheet date. In determining the ALLL, we estimate expected future losses for the loan's entire contractual term adjusted for expected prepayments when appropriate. The contractual term excludes expected extensions, renewals, and modifications.
The ALLL is the sum of three components: (i) asset specific/ individual loan reserves; (ii) quantitative (formulaic or pooled) reserves; and (iii) qualitative (judgmental) reserves.
Asset Specific / Individual Component
Loans that do not share risk characteristics are evaluated on an individual basis. Loans evaluated individually are not included in the collective evaluation. We have elected to apply the practical expedient to measure expected credit losses of a collateral dependent asset using the fair value of the collateral, less any costs to sell, when foreclosure is not probable, when repayment of the loan is expected to be provided substantially through the operation or sale of the collateral, and the borrower is experiencing financial difficulty.
Individual reserves are determined as follows:
For commercial non-accruing loans greater than or equal to a defined dollar threshold, individual reserves are determined based on an analysis of the present value of the loan's expected future cash flows, the loan's observable market value, or the fair value of the collateral less costs to sell.
For commercial non-accruing loans below the defined dollar threshold, an established LGD percentage is multiplied by the loan balance and the results are aggregated for purposes of measuring specific reserve impairment.
The population of individually assessed consumer loans includes loans deemed collateral dependent, in addition to all TDRs. The expected loss for these loans is estimated based on the present value of the loan's expected future cash flows, except in instances where the loan is collateral dependent, in which case the loan is written down based on the collateral's fair market value less costs to sell.
Quantitative Component
We use a non-DCF factor-based approach to estimate expected credit losses that include component PD/LGD/EAD models as well as less complex estimation methods for smaller loan portfolios.
PD: This component model is used to estimate the likelihood that a borrower will cease making payments as agreed. The major contributors to this are the borrower credit attributes and macro-economic trends. The objective of the PD model is to produce default likelihood forecasts based on the observed loan-level information and projected paths of macroeconomic variables.
LGD: This component model is used to estimate the loss on a loan once a loan is in default.
EAD: Estimates the loan balance at the time the borrower stops making payments. For all term loans, an amortization based formulaic approach is used for account level EAD estimates. We calculate EAD using a portfolio specific method in each of our revolving product portfolios. For line products that are unconditionally cancellable, the balances will either use a paydown curve or be held flat through the life of the loan.
Additional information about the critical estimates and judgments we make in developing these models is provided in the section “Allowance for loan and lease losses” under the heading “Critical Accounting Policies and Estimates” in Item 2 of this report.
Qualitative Component
The ALLL also includes identified qualitative factors related to idiosyncratic risk factors, changes in current economic conditions that may not be reflected in quantitatively derived results, and other relevant factors to ensure the ALLL reflects our best estimate of current expected credit losses.
While our reserve methodologies strive to reflect all relevant risk factors, there continues to be uncertainty associated with, but not limited to, potential imprecision in the estimation process due to the inherent time lag
of obtaining information and normal variations between estimates and actual outcomes. We provide additional reserves that are designed to provide coverage for losses attributable to such risks. The ALLL also includes factors that may not be directly measured in the determination of individual or collective reserves. Such qualitative factors may include:
The nature and volume of the institution’s financial assets;
The existence, growth, and effect of any concentrations of credit;
The volume and severity of past due financial assets, the volume of nonaccrual assets, and the volume and severity of adversely classified or graded assets;
The value of the underlying collateral for loans that are not collateral dependent;
The institution’s lending policies and procedures, including changes in underwriting standards and practices for collections, write-offs, and recoveries;
The quality of the institution’s credit review function;
The experience, ability, and depth of the institution’s lending, investment, collection, and other relevant management and staff;
The effect of other external factors such as the regulatory, legal and technological environments; competition; and events such as natural disasters; and
Actual and expected changes in international, national, regional, and local economic and business conditions and developments in which the institution operates that affect the collectability of financial assets.
Liability for Credit Losses on Lending-Related Commitments
The liability for credit losses on lending-related commitments, such as letters of credit and unfunded loan commitments, is included in “accrued expense and other liabilities” on the balance sheet. Expected credit losses are estimated over the contractual period in which we are exposed to credit risk via a contractual obligation unless that obligation is unconditionally cancellable by us. The liability for credit losses on lending-related commitments is adjusted as a provision for credit losses. The estimate includes consideration of the likelihood that funding will occur and an estimate of expected credit losses on commitments expected to be funded over its estimated useful life. Consistent with our estimation process on our loan and lease portfolio, we use a non-DCF factor-based approach to estimate expected credit losses that include component PD/LGD/EAD models as well as less complex estimation methods for smaller portfolios.
Allowance for Credit Losses on Other Financial Assets
The allowance for credit losses on other financial assets, such as other receivables and servicing advances, is determined based on historical loss information and other available indicators. If such information does not indicate any expected credit losses, Key may estimate the allowance for credit losses on other financial assets to be zero or close to zero. As of June 30, 2020, the allowance for credit losses on other financial assets was immaterial.
Simplifying the Test for Goodwill Impairment (ASU 2017-04)
On January 1, 2020, we adopted ASU 2017-04. The ASU amends ASC Topic 350, Intangibles - Goodwill and Other and eliminates the second step of the test for goodwill impairment. Goodwill represents the amount by which the cost of net assets acquired in a business combination exceeds their fair value. Goodwill is assigned to reporting units as of the acquisition date based on the expected benefit to such reporting unit from the synergies of the business combination. Goodwill is not amortized. Goodwill is tested at the reporting unit level for impairment, at least annually as of October 1, or when indicators of impairment exist.
When indicators of impairment exist we may look to both quantitative and qualitative information to determine whether or not it is more-likely-than-not that the fair value of a reporting unit is less than its carrying amount. Factors considered in the assessment include, but are not limited to, macroeconomic conditions, industry and market considerations, stock performance, financial performance of the reporting units, and previous results of goodwill impairment tests. When it is more-likely-than-not that the fair value of a reporting unit is less than its carrying amount a quantitative test is required. Under the new accounting guidance, the quantitative analysis requires the estimated fair value of each reporting unit to be compared to its carrying amount, including goodwill. If the estimated fair value of the reporting unit is less than its carrying value, an impairment charge would be recorded for the excess, not to exceed the amount of goodwill allocated to the reporting unit. The adoption of this accounting guidance must be applied prospectively and is not expected to have a material effect on our financial condition or results of operations.
Reference Rate Reform (Topic 848) Facilitation of the Effects of Reference Rate Reform on Financial Reporting (ASU 2020-04)
We adopted ASU 2020-04 upon issuance. The amendments provide optional expedients and exceptions for certain contracts, hedging relationships, and other transactions that reference LIBOR or another reference rate expected to be discontinued because of rate reform. The guidance is effective from the date of issuance until December 31, 2022. The guidance permits Key not to apply modification accounting or remeasure lease payments in lease contracts if the changes to the contract are related to the discontinuation of the reference rate. If certain criteria are met, the amendments also allow exceptions to the dedesignation criteria of the hedging relationship and the assessment of hedge effectiveness during the transition period. It also allows Key to make a one time election to sell, transfer, or both sell and transfer debt securities classified as held to maturity that reference a rate affected by reference rate reform and that are classified as held to maturity before January 1, 2020. This one time election may be made at any time after March 12, 2020, but no later than December 31, 2022. Key has not yet made a determination on whether it will make this election. At the time of adoption, the guidance did not have a significant impact on Key’s financial condition and results of operations. We will continue to assess the impact as the reference rate transition occurs over the next two years.
2. Earnings Per Common Share
Basic earnings per share is the amount of earnings (adjusted for dividends declared on our preferred stock) available to each Common Share outstanding during the reporting periods. Diluted earnings per share is the amount of earnings available to each Common Share outstanding during the reporting periods adjusted to include the effects of potentially dilutive Common Shares. Potentially dilutive Common Shares include stock options and other stock-based awards. Potentially dilutive Common Shares are excluded from the computation of diluted earnings per share in the periods where the effect would be antidilutive.
Our basic and diluted earnings per Common Share are calculated as follows:
| | | | Three months ended June 30, | | Six months ended June 30, | Three months ended June 30, | | Six months ended June 30, |
| dollars in millions, except per share amounts | 2019 | 2018 | | 2019 | 2018 | 2020 | 2019 | | 2020 | 2019 |
| EARNINGS | | | | | | |
| Income (loss) from continuing operations | $ | 423 |
| $ | 479 |
| | $ | 829 |
| $ | 895 |
| $ | 185 |
| $ | 423 |
| | $ | 330 |
| $ | 829 |
|
| Less: Net income (loss) attributable to noncontrolling interests | — |
| — |
| | — |
| — |
| — |
| — |
| | — |
| — |
|
| Income (loss) from continuing operations attributable to Key | 423 |
| 479 |
| | 829 |
| 895 |
| 185 |
| 423 |
| | 330 |
| 829 |
|
| Less: Dividends on Preferred Stock | 20 |
| 15 |
| | 40 |
| 29 |
| 26 |
| 20 |
| | 53 |
| 40 |
|
| Income (loss) from continuing operations attributable to Key common shareholders | 403 |
| 464 |
| | 789 |
| 866 |
| 159 |
| 403 |
| | 277 |
| 789 |
|
| Income (loss) from discontinued operations, net of taxes | 2 |
| 3 |
| | 3 |
| 5 |
| 2 |
| 2 |
| | 3 |
| 3 |
|
| Net income (loss) attributable to Key common shareholders | $ | 405 |
| $ | 467 |
| | $ | 792 |
| $ | 871 |
| $ | 161 |
| $ | 405 |
| | $ | 280 |
| $ | 792 |
|
| WEIGHTED-AVERAGE COMMON SHARES | | | | | | |
| Weighted-average Common Shares outstanding (000) | 999,163 |
| 1,052,652 |
| | 1,003,047 |
| 1,054,378 |
| 967,147 |
| 999,163 |
| | 967,380 |
| 1,003,047 |
|
| Effect of Common Share options and other stock awards | 8,801 |
| 13,141 |
| | 9,318 |
| 14,561 |
| 4,994 |
| 8,801 |
| | 6,892 |
| 9,318 |
|
Weighted-average Common Shares and potential Common Shares outstanding (000) (a) | 1,007,964 |
| 1,065,793 |
| | 1,012,365 |
| 1,068,939 |
| 972,141 |
| 1,007,964 |
| | 974,272 |
| 1,012,365 |
|
| EARNINGS PER COMMON SHARE | | | | | | |
| Income (loss) from continuing operations attributable to Key common shareholders | $ | .40 |
| $ | .44 |
| | $ | .79 |
| $ | .82 |
| $ | .16 |
| $ | .40 |
| | $ | .29 |
| $ | .79 |
|
| Income (loss) from discontinued operations, net of taxes | — |
| — |
| | — |
| — |
| — |
| — |
| | — |
| — |
|
Net income (loss) attributable to Key common shareholders (b) | .40 |
| .44 |
| | .79 |
| .82 |
| .17 |
| .40 |
| | .29 |
| .79 |
|
| | | | | | | |
| Income (loss) from continuing operations attributable to Key common shareholders — assuming dilution | $ | .40 |
| $ | .44 |
| | $ | .78 |
| $ | .81 |
| $ | .16 |
| $ | .40 |
| | $ | .28 |
| $ | .78 |
|
| Income (loss) from discontinued operations, net of taxes — assuming dilution | — |
| — |
| | — |
| — |
| — |
| — |
| | — |
| — |
|
Net income (loss) attributable to Key common shareholders — assuming dilution (b) | .40 |
| .44 |
| | .78 |
| .81 |
| .17 |
| .40 |
| | .29 |
| .78 |
|
| |
| (a) | Assumes conversion of Common Share options and other stock awards and/or convertible preferred stock, as applicable. |
| |
| (b) | EPS may not foot due to rounding. |
3. Loan Portfolio
Loan Portfolio by Portfolio Segment and Financing Receivable(a)
| | | in millions | June 30, 2019 | December 31, 2018 | June 30, 2020 | December 31, 2019 |
Commercial and industrial (a)(b) | $ | 48,544 |
| $ | 45,753 |
| $ | 58,297 |
| $ | 48,295 |
|
| Commercial real estate: | | |
| Commercial mortgage | 13,299 |
| 14,285 |
| 13,465 |
| 13,491 |
|
| Construction | 1,439 |
| 1,666 |
| 1,919 |
| 1,558 |
|
| Total commercial real estate loans | 14,738 |
| 15,951 |
| 15,384 |
| 15,049 |
|
Commercial lease financing (b)(c) | 4,578 |
| 4,606 |
| 4,524 |
| 4,688 |
|
| Total commercial loans | 67,860 |
| 66,310 |
| 78,205 |
| 68,032 |
|
| Residential — prime loans: | | |
| Real estate — residential mortgage | 6,053 |
| 5,513 |
| 8,149 |
| 7,023 |
|
| Home equity loans | 10,575 |
| 11,142 |
| 9,782 |
| 10,274 |
|
| Total residential — prime loans | 16,628 |
| 16,655 |
| 17,931 |
| 17,297 |
|
| Consumer direct loans | 2,350 |
| 1,809 |
| 4,327 |
| 3,513 |
|
| Credit cards | 1,096 |
| 1,144 |
| 974 |
| 1,130 |
|
| Consumer indirect loans | 4,003 |
| 3,634 |
| 4,722 |
| 4,674 |
|
| Total consumer loans | 24,077 |
| 23,242 |
| 27,954 |
| 26,614 |
|
Total loans (c)(d) | $ | 91,937 |
| $ | 89,552 |
| $ | 106,159 |
| $ | 94,646 |
|
| | | |
| |
| (a) | Accrued interest of $225 million and $244 million at June 30, 2020, and December 31, 2019, respectively, presented in "other assets" on the Consolidated Balance Sheets is excluded from the amortized cost basis disclosed in this table. |
| |
| (b) | Loan balances include $143$132 million and $132$144 million of commercial credit card balances at June 30, 2019,2020, and December 31, 2018,2019, respectively. |
| |
(b)(c) | Commercial lease financing includes receivables held as collateral for a secured borrowing of $11$18 million and $10$15 million at June 30, 2019,2020, and December 31, 2018,2019, respectively. Principal reductions are based on the cash payments received from these related receivables. Additional information pertaining to this secured borrowing is included in Note 1920 (“Long-Term Debt”) beginning on page 160163 of our 20182019 Form 10-K. |
| |
(c)(d) | Total loans exclude loans of $964$780 million at June 30, 2019,2020, and $1.1 billion$865 million at December 31, 2018,2019, related to the discontinued operations of the education lending business. |
4. Asset Quality
ALLL
We assessestimate the appropriate level of the ALLL on at least a quarterly basis. The methodology is described in Note 1 ("Basis of Presentation and Accounting Policies") under the heading "Allowance for Loan and Lease Losses" of this report.
The ALLL at June 30, 2020, represents our current estimate of lifetime credit quality oflosses inherent in the loan portfolio at that date. The changes in the ALLL by monitoring netloan category for the periods indicated are as follows:
Three months ended June 30, 2020: |
| | | | | | | | | | | | | | | | |
| in millions | March 31, 2020 | Provision | | Charge-offs | Recoveries | June 30, 2020 |
| Commercial and Industrial | $ | 542 |
| $ | 249 |
| | $ | (71 | ) | $ | 5 |
| $ | 725 |
|
| Commercial real estate: | | | | | | |
| Real estate — commercial mortgage | 207 |
| 87 |
| | (2 | ) | — |
| 292 |
|
| Real estate — construction | 25 |
| 16 |
| | — |
| — |
| 41 |
|
| Total commercial real estate loans | 232 |
| 103 |
| | (2 | ) | — |
| 333 |
|
| Commercial lease financing | 44 |
| 14 |
| | (4 | ) | 1 |
| 55 |
|
| Total commercial loans | 818 |
| 366 |
| | (77 | ) | 6 |
| 1,113 |
|
| Real estate — residential mortgage | 89 |
| 14 |
| | (2 | ) | — |
| 101 |
|
| Home equity loans | 184 |
| 14 |
| | (2 | ) | 1 |
| 197 |
|
| Consumer direct loans | 116 |
| 22 |
| | (10 | ) | 2 |
| 130 |
|
| Credit cards | 104 |
| 13 |
| | (12 | ) | 2 |
| 107 |
|
| Consumer indirect loans | 48 |
| 16 |
| | (7 | ) | 3 |
| 60 |
|
| Total consumer loans | 541 |
| 79 |
| | (33 | ) | 8 |
| 595 |
|
| Total ALLL — continuing operations | 1,359 |
| 445 |
| (a) | (110 | ) | 14 |
| 1,708 |
|
| Discontinued operations | 43 |
| — |
| | (2 | ) | 2 |
| 43 |
|
| Total ALLL — including discontinued operations | $ | 1,402 |
| $ | 445 |
| | $ | (112 | ) | $ | 16 |
| $ | 1,751 |
|
| | | | | | | |
| |
| (a) | Excludes a provision for losses on lending-related commitments of $37 million. |
Three months ended June 30, 2019:
|
| | | | | | | | | | | | | | | | |
| in millions | March 31, 2019 | Provision | | Charge-offs | Recoveries | June 30, 2019 |
| Commercial and Industrial | $ | 530 |
| $ | 43 |
| | $ | (30 | ) | $ | 6 |
| $ | 549 |
|
| Commercial real estate: | | | | | | |
| Real estate — commercial mortgage | 144 |
| (5 | ) | | (1 | ) | 1 |
| 139 |
|
| Real estate — construction | 28 |
| (4 | ) | | — |
| — |
| 24 |
|
| Total commercial real estate loans | 172 |
| (9 | ) | | (1 | ) | 1 |
| 163 |
|
| Commercial lease financing | 35 |
| 14 |
| | (16 | ) | 2 |
| 35 |
|
| Total commercial loans | 737 |
| 48 |
| | (47 | ) | 9 |
| 747 |
|
| Real estate — residential mortgage | 8 |
| — |
| | (1 | ) | — |
| 7 |
|
| Home equity loans | 36 |
| 4 |
| | (6 | ) | 2 |
| 36 |
|
| Consumer direct loans | 33 |
| 7 |
| | (10 | ) | 2 |
| 32 |
|
| Credit cards | 47 |
| 7 |
| | (12 | ) | 2 |
| 44 |
|
| Consumer indirect loans | 22 |
| 6 |
| | (8 | ) | 4 |
| 24 |
|
| Total consumer loans | 146 |
| 24 |
| | (37 | ) | 10 |
| 143 |
|
| Total ALLL — continuing operations | 883 |
| 72 |
| (a) | (84 | ) | 19 |
| 890 |
|
| Discontinued operations | 13 |
| 2 |
| | (4 | ) | 1 |
| 12 |
|
| Total ALLL — including discontinued operations | $ | 896 |
| $ | 74 |
| | $ | (88 | ) | $ | 20 |
| $ | 902 |
|
| | | | | | | |
| |
| (a) | Excludes a provision for losses on lending-related commitments of $2 million. |
Six months ended June 30, 2020: |
| | | | | | | | | | | | | | | | | | | | | | |
| in millions | December 31, 2019 | Impact of ASC 326 Adoption | January 1, 2020 | Provision | | Charge-offs | Recoveries | June 30, 2020 |
| Commercial and Industrial | $ | 551 |
| $ | (141 | ) | $ | 410 |
| $ | 436 |
| | $ | (131 | ) | $ | 10 |
| $ | 725 |
|
| Commercial real estate: | | | | | | | | |
| Real estate — commercial mortgage | 143 |
| 16 |
| 159 |
| 137 |
| | (5 | ) | 1 |
| 292 |
|
| Real estate — construction | 22 |
| (7 | ) | 15 |
| 26 |
| | — |
| — |
| 41 |
|
| Total commercial real estate loans | 165 |
| 9 |
| 174 |
| 163 |
| | (5 | ) | 1 |
| 333 |
|
| Commercial lease financing | 35 |
| 8 |
| 43 |
| 17 |
| | (6 | ) | 1 |
| 55 |
|
| Total commercial loans | 751 |
| (124 | ) | 627 |
| 616 |
| | (142 | ) | 12 |
| 1,113 |
|
| Real estate — residential mortgage | 7 |
| 77 |
| 84 |
| 19 |
| | (2 | ) | — |
| 101 |
|
| Home equity loans | 31 |
| 147 |
| 178 |
| 22 |
| | (6 | ) | 3 |
| 197 |
|
| Consumer direct loans | 34 |
| 63 |
| 97 |
| 51 |
| | (22 | ) | 4 |
| 130 |
|
| Credit cards | 47 |
| 35 |
| 82 |
| 44 |
| | (23 | ) | 4 |
| 107 |
|
| Consumer indirect loans | 30 |
| 6 |
| 36 |
| 32 |
| | (16 | ) | 8 |
| 60 |
|
| Total consumer loans | 149 |
| 328 |
| 477 |
| 168 |
| | (69 | ) | 19 |
| 595 |
|
| Total ALLL — continuing operations | 900 |
| 204 |
| 1,104 |
| 784 |
| (a) | (211 | ) | 31 |
| 1,708 |
|
| Discontinued operations | 10 |
| 31 |
| 41 |
| 3 |
| | (4 | ) | 3 |
| 43 |
|
| Total ALLL — including discontinued operations | $ | 910 |
| $ | 235 |
| $ | 1,145 |
| $ | 787 |
| | $ | (215 | ) | $ | 34 |
| $ | 1,751 |
|
| | | | | | | | | |
| |
| (a) | Excludes a provision for losses on lending-related commitments of $57 million. |
Six months ended June 30, 2019:
|
| | | | | | | | | | | | | | | |
| in millions | December 31, 2018 | Provision | Charge-offs | Recoveries | June 30, 2019 |
| Commercial and Industrial | $ | 532 |
| $ | 67 |
| $ | (131 | ) | $ | 10 |
| $ | 549 |
|
| Commercial real estate: | | | | | |
| Real estate — commercial mortgage | 142 |
| 1 |
| (5 | ) | 1 |
| 139 |
|
| Real estate — construction | 33 |
| (5 | ) | — |
| — |
| 24 |
|
| Total commercial real estate loans | 175 |
| (4 | ) | (5 | ) | 1 |
| 163 |
|
| Commercial lease financing | 36 |
| 20 |
| (6 | ) | 1 |
| 35 |
|
| Total commercial loans | 743 |
| 83 |
| (142 | ) | 12 |
| 747 |
|
| Real estate — residential mortgage | 7 |
| 1 |
| (2 | ) | — |
| 7 |
|
| Home equity loans | 35 |
| 7 |
| (6 | ) | 3 |
| 36 |
|
| Consumer direct loans | 30 |
| 19 |
| (22 | ) | 4 |
| 32 |
|
| Credit cards | 48 |
| 15 |
| (23 | ) | 4 |
| 44 |
|
| Consumer indirect loans | 20 |
| 11 |
| (16 | ) | 8 |
| 24 |
|
| Total consumer loans | 140 |
| 53 |
| (69 | ) | 19 |
| 143 |
|
| Total ALLL — continuing operations | 883 |
| 136 |
| (211 | ) | 31 |
| 890 |
|
| Discontinued operations | 14 |
| 4 |
| (4 | ) | 3 |
| 12 |
|
| Total ALLL — including discontinued operations | $ | 897 |
| $ | 140 |
| $ | (215 | ) | $ | 34 |
| $ | 902 |
|
| | | | | | |
As described in Note 1 ("Basis of Presentation and Accounting Policies"), we estimate the ALLL using relevant available information, from internal and external sources, relating to past events, current conditions, and reasonable and supportable forecasts. In our estimation of expected credit losses, we use a two year reasonable and supportable period across all products. Following this two year period in which supportable forecasts can be generated, for all modeled loan portfolios, we revert expected credit losses to a level that is consistent with our historical information by reverting the macroeconomic variables (model inputs) to their long run average. We revert to historical loss rates for less complex estimation methods for smaller portfolios. A 20 year fixed length look back period is used to calculate the long run average of the macroeconomic variables. A four quarter reversion period is used where the macroeconomic variables linearly revert to their long run average following the two year reasonable and supportable period.
We develop our reasonable and supportable forecasts using relevant data including, but not limited to, changes in economic output, unemployment rates, property values, and other factors associated with the credit losses on financial assets. Some macroeconomic variables apply to all portfolio segments, while others are more portfolio specific. The following table discloses key macroeconomic variables for each loan portfolio.
|
| | |
| Segment | Portfolio | Key Macroeconomic Variables (a) |
| Commercial | Commercial and industrial | BBB corporate bond rate (spread), GDP, industrial production, and unemployment rate |
| Commercial real estate | BBB corporate bond rate (spread), property and real estate price indices, and unemployment rate |
| Commercial lease financing | BBB corporate bond rate (spread), GDP, and unemployment rate |
| Consumer | Real estate — residential mortgage | GDP, home price index, unemployment rate, and 30 year mortgage rate |
| Home equity | Home price index, unemployment rate, and 30 year mortgage rate |
| Consumer direct | Unemployment rate and U.S. household income |
| Consumer indirect | New vehicle sales and unemployment rate |
| Credit cards | Unemployment rate and U.S. household income |
| Discontinued operations | Unemployment rate |
| |
| (a) | Variables include all transformations and interactions with other risk drivers. Additionally, variables may have varying impacts at different points in the economic cycle. |
In addition to macroeconomic drivers, portfolio attributes such as remaining term, outstanding balance, risk ratings, FICO, LTV, and delinquency also drive ALLL changes. Our ALLL models were designed to capture the correlation between economic and portfolio changes. As such, evaluating shifts in individual portfolio attributes and macroeconomic variables in isolation may not be indicative of past or future performance.
Economic Outlook
As of June 30, 2020, the COVID-19 pandemic has continued to create unprecedented economic stress and uncertainty in the U.S. and globally. We leveraged the Moody’s May 2020 Consensus forecast to estimate our expected credit losses as of June 30, 2020. This forecast considered the global economic fallout from the ongoing pandemic as well as the United States' monetary and fiscal response. We determined such forecast to be a reasonable view of the outlook for the global economy given the available information at current quarter end.
The baseline scenario reflects a notable economic slowdown over the next two years in markets in which we operate. U.S. GDP was forecasted to decline 34% at an annualized rate in the second quarter of 2020 but improves in the second half of the year to decline approximately 5% in all of 2020. GDP is not expected to return to pre-pandemic levels until late 2021. The national unemployment rate forecast was adjusted to capture the expected impact from the fiscal stimulus, which had the effect of nonperforming assets, delinquencies,boosting personal income, partially offsetting the impact of job loss. The adjusted unemployment rate forecast peaks at 10.5% in the third quarter of 2020 and is expected to remain in the upper-single digits throughout 2021.
While cognizant of potentially more adverse economic outlooks, we also considered that the government’s stimulus efforts and programs instituted by the Federal Reserve will partially offset the economic contraction, as evidenced by the temporary disconnect between employment and personal income during the second quarter of 2020. As such, the scenario selected reasonably captured the ultimate expected loss experience for our portfolio as of June 30, 2020. To the extent we identified credit quality ratingsrisk considerations that were not captured by the third-party economic forecast, we addressed the risk through management’s qualitative adjustments to the ALLL.
As a result of the unprecedented economic uncertainty caused by the COVID-19 pandemic, our future loss estimates may vary considerably from our June 30, 2020, assumptions.
Commercial Loan Portfolio
The ALLL from continuing operations for the commercial segment increased by $486 million, or 77.5%, from March 31, 2020. The overall increase in the allowance is driven by updated economic forecasts that capture additional deterioration triggered by the global COVID-19 pandemic.
The primary drivers in changes to the economic forecast are (1) an increase in unemployment levels, which impacts all commercial portfolios; and (2) real estate price indices, which predominately impact our commercial real estate portfolio. We continue to closely monitor oil & gas price forecasts and made several downgrades during the quarter aligning with the semi-annual borrowing base re-determination process.
As of June 30, 2020, we concluded that no ALLL is necessary for $8.0 billion in outstanding PPP loans as definedthey are 100% guaranteed by management.the SBA.
Consumer Loan Portfolio
The ALLL from continuing operations for the consumer segment increased by $118 million, or 24.7%, from March 31, 2020. The overall increase in the allowance is driven by updated economic forecasts that capture additional deterioration triggered by the global COVID-19 pandemic.
The main driver in the change in the economic forecast is an increase in unemployment levels, which is most impactful for our credit card and indirect loan portfolios. Deterioration in the HPI outlook is also contributing to the ALLL increase for the residential mortgage and home equity segments. Incremental credit risk considerations as a result of the economic stress and related borrower assistance programs are addressed through qualitative adjustments in cases where these are not already captured by the economic scenarios and quantitative estimates. As it relates to changes in the ALLL due to portfolio factors, minimal shifts are largely driven by targeted portfolio growth across several segments and ongoing portfolio seasoning activity.
Credit Quality IndicatorsRisk Profile
The prevalent risk characteristic for both commercial and consumer loans is the risk of loss arising from an obligor’s inability or failure to meet contractual payment or performance terms. Evaluation of this risk is stratified and monitored by the loan risk rating grades assigned for the commercial loan portfolios and the refreshed FICO score assigned for the consumer loan portfolios. AdditionalThe internal risk grades assigned to loans follow our definitions of Pass and Criticized, which are consistent with published definitions of regulatory risk classifications. Loans with a pass rating represent those loans not classified on our rating scale for problem credits, as minimal credit risk has been identified. Criticized loans are those loans that either have a potential weakness deserving management's close attention or have a well-defined weakness that may put full collection of contractual cash flows at risk. Borrower FICO scores provide information pertainingabout the credit quality of our consumer loan portfolio as they provide an indication as to the likelihood that a debtor will repay its debts. The scores are obtained from a nationally recognized consumer rating agency and are presented in the tables below at the dates indicated.
Most extensions of credit are subject to loan grading or scoring. Loan grades are assigned at the time of origination, verified by credit risk management, and scoringperiodically re-evaluated thereafter. This risk rating methodology blends our judgment with quantitative modeling. Commercial loans generally are assigned two internal risk ratings. The first rating reflects the probability that the borrower will default on an obligation; the second rating reflects expected recovery rates on the credit facility. Default probability is includeddetermined based on, among other factors, the financial strength of the borrower, an assessment of the borrower’s management, the borrower’s competitive position within its industry sector, and our view of industry risk in Note 5 (“Asset Quality”) on page 165the context of our 2018 Form 10-K.
Commercial Credit Exposure — Excluding PCI
Credit Risk Profile by Creditworthiness Category(a), (b) |
| | | | | | | | | | | | | | | | | | | | | | | | | | | | | | |
| | Commercial and industrial | RE — Commercial | RE — Construction | Commercial lease | Total |
| in millions | June 30, |
| December 31, |
| June 30, |
| December 31, |
| June 30, |
| December 31, |
| June 30, |
| December 31, |
| June 30, |
| December 31, |
|
| RATING | 2019 |
| 2018 |
| 2019 |
| 2018 |
| 2019 |
| 2018 |
| 2019 |
| 2018 |
| 2019 |
| 2018 |
|
| Pass | $ | 46,773 |
| $ | 44,138 |
| $ | 12,756 |
| $ | 13,672 |
| $ | 1,379 |
| $ | 1,537 |
| $ | 4,535 |
| $ | 4,557 |
| $ | 65,443 |
| $ | 63,904 |
|
| Criticized (Accruing) | 1,529 |
| 1,402 |
| 303 |
| 354 |
| 57 |
| 125 |
| 36 |
| 41 |
| 1,925 |
| 1,922 |
|
| Criticized (Nonaccruing) | 189 |
| 152 |
| 85 |
| 81 |
| 2 |
| 2 |
| 7 |
| 8 |
| 283 |
| 243 |
|
| Total | $ | 48,491 |
| $ | 45,692 |
| $ | 13,144 |
| $ | 14,107 |
| $ | 1,438 |
| $ | 1,664 |
| $ | 4,578 |
| $ | 4,606 |
| $ | 67,651 |
| $ | 66,069 |
|
| | | | | | | | | | | |
| |
(a) | Credit quality indicators are updated on an ongoing basis and reflect credit quality information as of the dates indicated. |
| |
(b) | The term criticized refers to those loans that are internally classified by Key as special mention or worse, which are asset quality categories defined by regulatory authorities. These assets have an elevated level of risk and may have a high probability of default or total loss. Pass rated refers to all loans not classified as criticized. |
Consumer Credit Exposure — Excluding PCI
Non-PCI Loans by Refreshed FICO Score(a)
|
| | | | | | | | | | | | | | | | | | | | | | | | | | | | | | |
| | Residential — Prime | Consumer direct loans | Credit cards | Consumer indirect loans | Total |
| in millions | June 30, |
| December 31, |
| June 30, |
| December 31, |
| June 30, |
| December 31, |
| June 30, |
| December 31, |
| June 30, |
| December 31, |
|
| FICO SCORE | 2019 |
| 2018 |
| 2019 |
| 2018 |
| 2019 |
| 2018 |
| 2019 |
| 2018 |
| 2019 |
| 2018 |
|
| 750 and above | $ | 10,040 |
| $ | 9,794 |
| $ | 827 |
| $ | 549 |
| $ | 499 |
| $ | 521 |
| $ | 1,849 |
| $ | 1,647 |
| $ | 13,215 |
| $ | 12,511 |
|
| 660 to 749 | 4,681 |
| 4,906 |
| 822 |
| 700 |
| 481 |
| 507 |
| 1,440 |
| 1,320 |
| 7,424 |
| 7,433 |
|
| Less than 660 | 1,341 |
| 1,411 |
| 219 |
| 224 |
| 116 |
| 116 |
| 573 |
| 565 |
| 2,249 |
| 2,316 |
|
| No Score | 260 |
| 213 |
| 479 |
| 333 |
| — |
| — |
| 141 |
| 102 |
| 880 |
| 648 |
|
| Total | $ | 16,322 |
| $ | 16,324 |
| $ | 2,347 |
| $ | 1,806 |
| $ | 1,096 |
| $ | 1,144 |
| $ | 4,003 |
| $ | 3,634 |
| $ | 23,768 |
| $ | 22,908 |
|
| | | | | | | | | | | |
| |
(a) | Borrower FICO scores provide information about the credit quality of our consumer loan portfolio as they provide an indication as to the likelihood that a debtor will repay its debts. The scores are obtained from a nationally recognized consumer rating agency and are presented in the above table at the dates indicated. |
Commercial Credit Exposure— PCI
Credit Risk Profile by Creditworthiness Category and Vintage (a), (b)
|
| | | | | | | | | | | | | | | | | | | | | | | | | | | | |
| | Commercial and Industrial | RE — Commercial | RE — Construction | Commercial Lease | Total |
| in millions | June 30, |
| December 31, |
| June 30, |
| December 31, |
| June 30, |
| December 31, |
| June 30, |
| December 31, |
| June 30, |
| December 31, |
|
| RATING | 2019 |
| 2018 |
| 2019 |
| 2018 |
| 2019 |
| 2018 |
| 2019 |
| 2018 |
| 2019 |
| 2018 |
|
| Pass | $ | 32 |
| $ | 37 |
| $ | 111 |
| $ | 125 |
| $ | 1 |
| $ | 2 |
| — |
| — |
| $ | 144 |
| $ | 164 |
|
| Criticized | 21 |
| 24 |
| 44 |
| 53 |
| — |
| — |
| — |
| — |
| 65 |
| 77 |
|
| Total | $ | 53 |
| $ | 61 |
| $ | 155 |
| $ | 178 |
| $ | 1 |
| $ | 2 |
| — |
| — |
| $ | 209 |
| $ | 241 |
|
| | | | | | | | | | | |
|
| | | | | | | | | | | | | | | | | | | | | | | | | | | |
| As of June 30, 2020 | Term Loans | Revolving Loans Amortized Cost Basis | Revolving Loans Converted to Term Loans Amortized Cost Basis | |
| | Amortized Cost Basis by Origination Year and Internal Risk Rating | |
| in millions | 2020 | 2019 | 2018 | 2017 | 2016 | Prior | Total |
| Commercial and Industrial | | | | | | | | | |
| Risk Rating: | | | | | | | | | |
| Pass | $ | 12,011 |
| $ | 6,386 |
| $ | 5,004 |
| $ | 3,290 |
| $ | 2,393 |
| $ | 3,996 |
| $ | 22,395 |
| $ | 141 |
| $ | 55,616 |
|
| Criticized (Accruing) | 24 |
| 60 |
| 164 |
| 164 |
| 70 |
| 169 |
| 1,608 |
| 18 |
| 2,277 |
|
| Criticized (Nonaccruing) | 3 |
| 12 |
| 28 |
| 31 |
| 38 |
| 58 |
| 234 |
| — |
| 404 |
|
| Total commercial and industrial | 12,038 |
| 6,458 |
| 5,196 |
| 3,485 |
| 2,501 |
| 4,223 |
| 24,237 |
| 159 |
| 58,297 |
|
| Real estate — commercial mortgage | | | | | | | | |
|
| Risk Rating: | | | | | | | | |
|
| Pass | 1,087 |
| 3,303 |
| 1,955 |
| 1,040 |
| 963 |
| 3,600 |
| 1,039 |
| 37 |
| 13,024 |
|
| Criticized (Accruing) | — |
| 8 |
| 29 |
| 65 |
| 34 |
| 193 |
| 16 |
| 5 |
| 350 |
|
| Criticized (Nonaccruing) | — |
| — |
| 1 |
| 3 |
| 4 |
| 78 |
| 4 |
| 1 |
| 91 |
|
| Total real estate — commercial mortgage | 1,087 |
| 3,311 |
| 1,985 |
| 1,108 |
| 1,001 |
| 3,871 |
| 1,059 |
| 43 |
| 13,465 |
|
| Real estate — construction | | | | | | | | |
|
| Risk Rating: | | | | | | | | |
|
| Pass | 205 |
| 603 |
| 721 |
| 239 |
| 68 |
| 21 |
| 18 |
| 3 |
| 1,878 |
|
| Criticized (Accruing) | — |
| 4 |
| 8 |
| — |
| 24 |
| 3 |
| 1 |
| — |
| 40 |
|
| Criticized (Nonaccruing) | — |
| — |
| — |
| — |
| | 1 |
| — |
| — |
| 1 |
|
| Total real estate — construction | 205 |
| 607 |
| 729 |
| 239 |
| 92 |
| 25 |
| 19 |
| 3 |
| 1,919 |
|
| Commercial lease financing | | | | | | | | |
|
| Risk Rating: | | | | | | | | |
|
| Pass | 503 |
| 1,275 |
| 702 |
| 640 |
| 307 |
| 1,030 |
| — |
| — |
| 4,457 |
|
| Criticized (Accruing) | 6 |
| 8 |
| 12 |
| 11 |
| 10 |
| 11 |
| — |
| — |
| 58 |
|
| Criticized (Nonaccruing) | — |
| — |
| 2 |
| 3 |
| 4 |
| — |
| — |
| — |
| 9 |
|
| Total commercial lease financing | 509 |
| 1,283 |
| 716 |
| 654 |
| 321 |
| 1,041 |
| | — |
| 4,524 |
|
| Total commercial loans | $ | 13,839 |
| $ | 11,659 |
| $ | 8,626 |
| $ | 5,486 |
| $ | 3,915 |
| $ | 9,160 |
| $ | 25,315 |
| $ | 205 |
| $ | 78,205 |
|
| | | | | | | | | | |
| |
| (a) | Credit quality indicators are updatedAccrued interest of $121 million, presented in Other Assets on an ongoingthe Consolidated Balance Sheets, was excluded from the amortized cost basis and reflect credit quality information as of the dates indicated. |
| |
(b) | The term “criticized” refers to those loans that are internally classified by Key as special mention or worse, which are asset quality categories defined by regulatory authorities. These assets have an elevated level of risk and may have a high probability of default or total loss. Pass rated refers to all loans not classified as criticized.disclosed in this table. |
Consumer Credit Exposure— PCI
PCI LoansCredit Risk Profile by Refreshed FICO Score and Vintage (a)
| | | As of June 30, 2020 | | Term Loans | Revolving Loans Amortized Cost Basis | Revolving Loans Converted to Term Loans Amortized Cost Basis | |
| | Residential — Prime | Consumer direct loans | Credit cards | Consumer indirect loans | Total | Amortized Cost Basis by Origination Year and FICO Score | |
| in millions | June 30, |
| December 31, |
| June 30, |
| December 31, |
| June 30, |
| December 31, |
| June 30, |
| December 31, |
| June 30, |
| December 31, |
| 2020 | 2019 | 2018 | 2017 | 2016 | Prior | Total |
| FICO SCORE | 2019 |
| 2018 |
| 2019 |
| 2018 |
| 2019 |
| 2018 |
| 2019 |
| 2018 |
| 2019 |
| 2018 |
| |
| Real estate — residential mortgage | | |
| FICO Score: | | |
| 750 and above | $ | 119 |
| $ | 137 |
| 1 |
| — |
| — |
| — |
| — |
| — |
| $ | 120 |
| $ | 137 |
| $ | 1,681 |
| $ | 1,878 |
| $ | 294 |
| $ | 320 |
| $ | 648 |
| $ | 1,523 |
| — |
| — |
| $ | 6,344 |
|
| 660 to 749 | 103 |
| 95 |
| $ | 1 |
| $ | 1 |
| — |
| — |
| — |
| — |
| 104 |
| 96 |
| 348 |
| 398 |
| 96 |
| 67 |
| 115 |
| 402 |
| — |
| — |
| 1,426 |
|
| Less than 660 | 78 |
| 97 |
| 1 |
| 2 |
| — |
| — |
| — |
| — |
| 79 |
| 99 |
| 17 |
| 30 |
| 24 |
| 12 |
| 32 |
| 193 |
| — |
| — |
| 308 |
|
| No Score | 6 |
| 2 |
| — |
| — |
| — |
| — |
| — |
| — |
| 6 |
| 2 |
| — |
| 2 |
| 3 |
| 7 |
| 2 |
| 57 |
| — |
| — |
| 71 |
|
| Total | $ | 306 |
| $ | 331 |
| $ | 3 |
| $ | 3 |
| — |
| — |
| — |
| — |
| $ | 309 |
| $ | 334 |
| |
| Total real estate — residential mortgage | | 2,046 |
| 2,308 |
| 417 |
| 406 |
| 797 |
| 2,175 |
| — |
| — |
| 8,149 |
|
| Home equity loans | | |
| FICO Score: | | |
| 750 and above | | 386 |
| 450 |
| 190 |
| 217 |
| 206 |
| 901 |
| $ | 2,809 |
| $ | 406 |
| 5,565 |
|
| 660 to 749 | | 176 |
| 275 |
| 125 |
| 129 |
| 106 |
| 428 |
| 1,760 |
| 196 |
| 3,195 |
|
| Less than 660 | | 19 |
| 54 |
| 32 |
| 32 |
| 37 |
| 164 |
| 604 |
| 65 |
| 1,007 |
|
| No Score | | 2 |
| 2 |
| 1 |
| — |
| — |
| 3 |
| 5 |
| 2 |
| 15 |
|
| Total home equity loans | | 583 |
| 781 |
| 348 |
| 378 |
| 349 |
| 1,496 |
| 5,178 |
| 669 |
| 9,782 |
|
| Consumer direct loans | | |
| FICO Score: | | |
| 750 and above | | 1,113 |
| 1,214 |
| 146 |
| 44 |
| 24 |
| 69 |
| 127 |
| — |
| 2,737 |
|
| 660 to 749 | | 274 |
| 351 |
| 101 |
| 32 |
| 18 |
| 39 |
| 270 |
| — |
| 1,085 |
|
| Less than 660 | | 10 |
| 43 |
| 28 |
| 11 |
| 7 |
| 13 |
| 98 |
| — |
| 210 |
|
| No Score | | 23 |
| 49 |
| 26 |
| 17 |
| 9 |
| 13 |
| 158 |
| — |
| 295 |
|
| Total consumer direct loans | | 1,420 |
| 1,657 |
| 301 |
| 104 |
| 58 |
| 134 |
| 653 |
| — |
| 4,327 |
|
| Credit cards | | |
| FICO Score: | | |
| 750 and above | | — |
| — |
| — |
| — |
| — |
| — |
| 450 |
| — |
| 450 |
|
| 660 to 749 | | — |
| — |
| — |
| — |
| — |
| — |
| 416 |
| — |
| 416 |
|
| Less than 660 | | — |
| — |
| — |
| — |
| — |
| — |
| 107 |
| — |
| 107 |
|
| No Score | | — |
| — |
| — |
| — |
| — |
| — |
| 1 |
| — |
| 1 |
|
| Total credit cards | | — |
| — |
| — |
| — |
| — |
| — |
| 974 |
| — |
| 974 |
|
| Consumer indirect loans | | |
| FICO Score: | | |
| 750 and above | | 557 |
| 1,056 |
| 457 |
| 254 |
| 107 |
| 97 |
| — |
| — |
| 2,528 |
|
| 660 to 749 | | 336 |
| 717 |
| 303 |
| 137 |
| 57 |
| 73 |
| — |
| — |
| 1,623 |
|
| Less than 660 | | 69 |
| 208 |
| 129 |
| 74 |
| 37 |
| 39 |
| — |
| — |
| 556 |
|
| No Score | | 15 |
| — |
| — |
| — |
| — |
| — |
| — |
| — |
| 15 |
|
| Total consumer indirect loans | | 977 |
| 1,981 |
| 889 |
| 465 |
| 201 |
| 209 |
| — |
| — |
| 4,722 |
|
| Total consumer loans | | $ | 5,026 |
| $ | 6,727 |
| $ | 1,955 |
| $ | 1,353 |
| $ | 1,405 |
| $ | 4,014 |
| $ | 6,805 |
| $ | 669 |
| $ | 27,954 |
|
| | | | | |
| |
| (a) | Borrower FICO scores provide information about the credit qualityAccrued interest of our consumer loan portfolio as they provide an indication as to the likelihood that a debtor will repay its debts. The scores are obtained from a nationally recognized consumer rating agency and are$104 million, presented in Other Assets on the above table atConsolidated Balance Sheets, was excluded from the dates indicated.amortized cost basis disclosed in this table. |
Nonperforming and Past Due Loans
Our policies for determining past due loans, placing loans on nonaccrual, applying payments on nonaccrual loans, and resuming accrual of interest for our commercial and consumer loan portfolios are disclosed in Note 1 (”Basis of Presentation and Accounting Policies”) and Note 1 (“Summary of Significant Accounting Policies”) under the heading “Nonperforming Loans” beginning on page 100101 of our 20182019 Form 10-K.
Under the CARES Act as well as banking regulator interagency guidance, certain loan modifications to borrowers experiencing financial distress as a result of the economic impacts created by the COVID-19 pandemic may not be required to be reported as past due and nonperforming. For COVID-19 related loan modifications which occurred from March 1, 2020, through June 30, 2020, and met the loan modification criteria under either the CARES Act or the criteria specified by the regulatory agencies, we have elected to re-age to current status all commercial loans and consumer loans that are not secured by real-estate and freeze the delinquency status of consumer real estate secured loans as of the modification or forbearance grant date. At June 30, 2020, $3.9 billion of loan modifications and forbearances made under the criteria of either the CARES Act or banking regulator interagency guidance were not reported as nonperforming.
The following aging analysis of past due and current loans as of June 30, 2019,2020, and December 31, 2018,2019, provides further information regarding Key’s credit exposure.
Aging Analysis of Loan Portfolio(a) | | | June 30, 2019 | Current | 30-59 Days Past Due (b) | 60-89 Days Past Due (b) | 90 and Greater Days Past Due (b) | Non-performing Loans | Total Past Due and Non-performing Loans | Purchased Credit Impaired | Total Loans (c), (d) | |
| June 30, 2020 | Current | 30-59 Days Past Due (b) | 60-89 Days Past Due (b) | 90 and Greater Days Past Due (b) | Non-performing Loans (c) | Total Past Due and Non-performing Loans (c) | Total Loans (d) |
| in millions | Current | 30-59 Days Past Due (b) | 60-89 Days Past Due (b) | 90 and Greater Days Past Due (b) | Non-performing Loans | Total Past Due and Non-performing Loans | Purchased Credit Impaired | Total Loans (c), (d) |
| LOAN TYPE | |
| Commercial and industrial | $ | 48,136 |
| $ | 116 |
| $ | 20 |
| $ | 30 |
| $ | 189 |
| $ | 355 |
| $ | 53 |
| $ | 48,544 |
| $ | 57,659 |
| $ | 116 |
| $ | 71 |
| $ | 47 |
| $ | 404 |
| $ | 638 |
| $ | 58,297 |
|
| Commercial real estate: | | |
| Commercial mortgage | 13,029 |
| 17 |
| 3 |
| 10 |
| 85 |
| 115 |
| 155 |
| 13,299 |
| 13,269 |
| 52 |
| 41 |
| 12 |
| 91 |
| 196 |
| 13,465 |
|
| Construction | 1,416 |
| 20 |
| — |
| — |
| 2 |
| 22 |
| 1 |
| 1,439 |
| 1,916 |
| — |
| — |
| 2 |
| 1 |
| 3 |
| 1,919 |
|
| Total commercial real estate loans | 14,445 |
| 37 |
| 3 |
| 10 |
| 87 |
| 137 |
| 156 |
| 14,738 |
| 15,185 |
| 52 |
| 41 |
| 14 |
| 92 |
| 199 |
| 15,384 |
|
| Commercial lease financing | 4,547 |
| 13 |
| 3 |
| 8 |
| 7 |
| 31 |
| — |
| 4,578 |
| 4,472 |
| 40 |
| — |
| 3 |
| 9 |
| 52 |
| 4,524 |
|
| Total commercial loans | $ | 67,128 |
| $ | 166 |
| $ | 26 |
| $ | 48 |
| $ | 283 |
| $ | 523 |
| $ | 209 |
| $ | 67,860 |
| $ | 77,316 |
| $ | 208 |
| $ | 112 |
| $ | 64 |
| $ | 505 |
| $ | 889 |
| $ | 78,205 |
|
| Real estate — residential mortgage | $ | 5,686 |
| $ | 11 |
| $ | 2 |
| $ | 1 |
| $ | 62 |
| $ | 76 |
| $ | 291 |
| $ | 6,053 |
| $ | 8,039 |
| $ | 16 |
| $ | 5 |
| $ | — |
| $ | 89 |
| $ | 110 |
| $ | 8,149 |
|
| Home equity loans | 10,329 |
| 27 |
| 8 |
| 5 |
| 191 |
| 231 |
| 15 |
| 10,575 |
| 9,592 |
| 31 |
| 12 |
| 6 |
| 141 |
| 190 |
| 9,782 |
|
| Consumer direct loans | 2,322 |
| 10 |
| 5 |
| 7 |
| 3 |
| 25 |
| 3 |
| 2,350 |
| 4,306 |
| 9 |
| 4 |
| 5 |
| 3 |
| 21 |
| 4,327 |
|
| Credit cards | 1,073 |
| 6 |
| 4 |
| 11 |
| 2 |
| 23 |
| — |
| 1,096 |
| 957 |
| 3 |
| 3 |
| 9 |
| 2 |
| 17 |
| 974 |
|
| Consumer indirect loans | 3,947 |
| 28 |
| 6 |
| 2 |
| 20 |
| 56 |
| — |
| 4,003 |
| 4,683 |
| 13 |
| 3 |
| 3 |
| 20 |
| 39 |
| 4,722 |
|
| Total consumer loans | $ | 23,357 |
| $ | 82 |
| $ | 25 |
| $ | 26 |
| $ | 278 |
| $ | 411 |
| $ | 309 |
| $ | 24,077 |
| $ | 27,577 |
| $ | 72 |
| $ | 27 |
| $ | 23 |
| $ | 255 |
| $ | 377 |
| $ | 27,954 |
|
| Total loans | $ | 90,485 |
| $ | 248 |
| $ | 51 |
| $ | 74 |
| $ | 561 |
| $ | 934 |
| $ | 518 |
| $ | 91,937 |
| $ | 104,893 |
| $ | 280 |
| $ | 139 |
| $ | 87 |
| $ | 760 |
| $ | 1,266 |
| $ | 106,159 |
|
| | | |
| |
| (a) | Amounts in table represent amortized cost and exclude loans held for sale. |
| |
| (b) | Accrued interest of $225 million presented in “other assets” on the Consolidated Balance Sheets is excluded from the amortized cost basis disclosed in this table. |
| |
| (c) | PCI loans meeting nonperforming criteria were historically excluded from Key's nonperforming disclosures. As a result of CECL implementation on January 1, 2020, PCI loans became PCD loans. PCD loans that met the definition of nonperforming are now included in nonperforming disclosures. |
| |
| (d) | Net of unearned income, net of deferred fees and costs, and unamortized discounts and premiums. |
|
| | | | | | | | | | | | | | | | | | | | | | | | |
| December 31, 2019 | Current | 30-59 Days Past Due (b) | 60-89 Days Past Due (b) | 90 and Greater Days Past Due (b) | Non-performing Loans | Total Past Due and Non-performing Loans | Purchased Credit Impaired | Total Loans |
| in millions |
| LOAN TYPE | | | | | | | | |
| Commercial and industrial | $ | 47,768 |
| $ | 110 |
| $ | 52 |
| $ | 53 |
| $ | 264 |
| $ | 479 |
| 48 |
| $ | 48,295 |
|
| Commercial real estate: | | | | | | | | |
| Commercial mortgage | 13,258 |
| 8 |
| 5 |
| 13 |
| 83 |
| 109 |
| 124 |
| 13,491 |
|
| Construction | 1,551 |
| 3 |
| — |
| 1 |
| 2 |
| 6 |
| 1 |
| 1,558 |
|
| Total commercial real estate loans | 14,809 |
| 11 |
| 5 |
| 14 |
| 85 |
| 115 |
| 125 |
| 15,049 |
|
| Commercial lease financing | 4,647 |
| 22 |
| 11 |
| 2 |
| 6 |
| 41 |
| — |
| 4,688 |
|
| Total commercial loans | $ | 67,224 |
| $ | 143 |
| $ | 68 |
| $ | 69 |
| $ | 355 |
| $ | 635 |
| 173 |
| $ | 68,032 |
|
| Real estate — residential mortgage | $ | 6,705 |
| $ | 7 |
| $ | 5 |
| $ | 1 |
| $ | 48 |
| $ | 61 |
| $ | 257 |
| $ | 7,023 |
|
| Home equity loans | 10,071 |
| 30 |
| 10 |
| 5 |
| 145 |
| 190 |
| 13 |
| 10,274 |
|
| Consumer direct loans | 3,484 |
| 10 |
| 5 |
| 7 |
| 4 |
| 26 |
| 3 |
| 3,513 |
|
| Credit cards | 1,104 |
| 6 |
| 5 |
| 12 |
| 3 |
| 26 |
| — |
| 1,130 |
|
| Consumer indirect loans | 4,609 |
| 32 |
| 8 |
| 3 |
| 22 |
| 65 |
| — |
| 4,674 |
|
| Total consumer loans | $ | 25,973 |
| $ | 85 |
| $ | 33 |
| $ | 28 |
| $ | 222 |
| $ | 368 |
| $ | 273 |
| $ | 26,614 |
|
| Total loans | $ | 93,197 |
| $ | 228 |
| $ | 101 |
| $ | 97 |
| $ | 577 |
| $ | 1,003 |
| $ | 446 |
| $ | 94,646 |
|
| | | | | | | | | |
| |
| (a) | Amounts in table represent recorded investment and exclude loans held for sale. Recorded investment represents the faceprincipal amount of the loan increased or decreased by applicable accrued interest, net deferred loan fees and costs, and unamortized premium or discount, and reflects direct charge-offs. |
| |
| (b) | Past due loan amounts exclude PCI, even if contractually past due (or if we do not expect to collect principal or interest in full based on the original contractual terms), as we are currently accreting income over the remaining term of the loans. |
| |
(c) | Net of unearned income, net deferred loan fees and costs, and unamortized discounts and premiums. |
| |
(d) | Future accretable yield related to PCI loans is not included in the analysis of the loan portfolio. |
|
| | | | | | | | | | | | | | | | | | | | | | | | |
| December 31, 2018 | Current | 30-59 Days Past Due (b) | 60-89 Days Past Due (b) | 90 and Greater Days Past Due (b) | Non-performing Loans | Total Past Due and Non-performing Loans | Purchased Credit Impaired | Total Loans (c), (d) |
| in millions |
| LOAN TYPE | | | | | | | | |
| Commercial and industrial | $ | 45,375 |
| $ | 89 |
| $ | 31 |
| $ | 45 |
| $ | 152 |
| $ | 317 |
| 61 |
| $ | 45,753 |
|
| Commercial real estate: | | | | | | | | |
| Commercial mortgage | 13,957 |
| 27 |
| 17 |
| 25 |
| 81 |
| 150 |
| 178 |
| 14,285 |
|
| Construction | 1,646 |
| — |
| 13 |
| 3 |
| 2 |
| 18 |
| 2 |
| 1,666 |
|
| Total commercial real estate loans | 15,603 |
| 27 |
| 30 |
| 28 |
| 83 |
| 168 |
| 180 |
| 15,951 |
|
| Commercial lease financing | 4,580 |
| 12 |
| 1 |
| 4 |
| 9 |
| 26 |
| — |
| 4,606 |
|
| Total commercial loans | $ | 65,558 |
| $ | 128 |
| $ | 62 |
| $ | 77 |
| $ | 244 |
| $ | 511 |
| 241 |
| $ | 66,310 |
|
| Real estate — residential mortgage | $ | 5,119 |
| $ | 11 |
| $ | 3 |
| $ | 4 |
| $ | 62 |
| $ | 80 |
| $ | 314 |
| $ | 5,513 |
|
| Home equity loans | 10,862 |
| 31 |
| 12 |
| 10 |
| 210 |
| 263 |
| 17 |
| 11,142 |
|
| Consumer direct loans | 1,780 |
| 11 |
| 5 |
| 6 |
| 4 |
| 26 |
| 3 |
| 1,809 |
|
| Credit cards | 1,119 |
| 6 |
| 5 |
| 12 |
| 2 |
| 25 |
| — |
| 1,144 |
|
| Consumer indirect loans | 3,573 |
| 31 |
| 7 |
| 3 |
| 20 |
| 61 |
| — |
| 3,634 |
|
| Total consumer loans | $ | 22,453 |
| $ | 90 |
| $ | 32 |
| $ | 35 |
| $ | 298 |
| $ | 455 |
| $ | 334 |
| $ | 23,242 |
|
| Total loans | $ | 88,011 |
| $ | 218 |
| $ | 94 |
| $ | 112 |
| $ | 542 |
| $ | 966 |
| $ | 575 |
| $ | 89,552 |
|
| | | | | | | | | |
| |
(a) | Amounts in table represent recorded investment and exclude loans held for sale. Recorded investment represents the face amount of the loan increased or decreased by applicable accrued interest, net deferred loan fees and costs, and unamortized premium or discount, and reflects direct charge-offs. |
| |
(b) | Past due loan amounts exclude PCI, even if contractually past due (or if we do not expect to collect principal or interest in full based on the original contractual terms), as we are currently accreting income over the remaining term of the loans. |
| |
(c) | Net of unearned income, net deferred loan fees and costs, and unamortized discounts and premiums. |
| |
(d) | Future accretable yield related to purchased credit impaired loans is not included in the analysis of the loan portfolio. |
At June 30, 2019,2020, the approximate carrying amount of our commercial nonperforming loans outstanding represented 79% of their original contractual amount owed, total nonperforming loans outstanding represented 82%80% of their original contractual amount owed, and nonperforming assets in total were carried at 87%88% of their original contractual amount owed.
Nonperforming loans and loans held for sale reduced expected interest income by $7 million and $13 million for the three and six months ended June 30, 2020, respectively, and $9 million and $17 million for the three and six months ended June 30, 2019, respectively, and $7respectively.
The amortized cost basis of nonperforming loans on nonaccrual status for which there is no related allowance for credit losses was $403 million and $14 million for the three and six months endedat June 30, 2018, respectively.2020.
Collateral-dependent Financial Assets
The following tables set forth a further breakdownWe classify financial assets as collateral-dependent when our borrower is experiencing financial difficulty, and we expect repayment to be provided substantially through the operation or sale of individually impairedthe collateral. Our commercial loans as of June 30, 2019,have collateral that includes commercial machinery, commercial properties, and December 31, 2018:commercial real estate construction projects. Our consumer loans have collateral that includes residential real estate, automobiles, boats, and RVs.
|
| | | | | | | | | | | | | | | | | | | |
| | June 30, 2019 | | December 31, 2018 |
| | Recorded Investment (a) | Unpaid Principal Balance (b) | Specific Allowance | | Recorded Investment (a) | Unpaid Principal Balance (b) | Specific Allowance |
| in millions |
| With no related allowance recorded: | | | | | | | |
| Commercial and industrial | $ | 118 |
| $ | 151 |
| — |
| | $ | 118 |
| $ | 175 |
| — |
|
| Commercial real estate: | | | | | | | |
| Commercial mortgage | 61 |
| 73 |
| — |
| | 64 |
| 70 |
| — |
|
| Total commercial real estate loans | 61 |
| 73 |
| — |
| | 64 |
| 70 |
| — |
|
| Total commercial loans | 179 |
| 224 |
| — |
| | 182 |
| 245 |
| — |
|
| Real estate — residential mortgage | 4 |
| 6 |
| — |
| | 4 |
| 5 |
| — |
|
| Home equity loans | 47 |
| 53 |
| — |
| | 49 |
| 56 |
| — |
|
| Consumer direct loans | — |
| 1 |
| — |
| | 1 |
| 1 |
| — |
|
| Consumer indirect loans | 2 |
| 4 |
| — |
| | 2 |
| 4 |
| — |
|
| Total consumer loans | 53 |
| 64 |
| — |
| | 56 |
| 66 |
| — |
|
| Total loans with no related allowance recorded | 232 |
| 288 |
| — |
| | 238 |
| 311 |
| — |
|
| With an allowance recorded: | | | | | | | |
| Commercial and industrial | 65 |
| 83 |
| $ | 10 |
| | 44 |
| 47 |
| $ | 5 |
|
| Commercial real estate: | | | | | | | |
| Commercial mortgage | 3 |
| 3 |
| 1 |
| | 2 |
| 3 |
| 1 |
|
| Total commercial real estate loans | 3 |
| 3 |
| 1 |
| | 2 |
| 3 |
| 1 |
|
| Total commercial loans | 68 |
| 86 |
| 11 |
| | 46 |
| 50 |
| 6 |
|
| Real estate — residential mortgage | 44 |
| 68 |
| 3 |
| | 45 |
| 70 |
| 3 |
|
| Home equity loans | 81 |
| 87 |
| 9 |
| | 78 |
| 85 |
| 8 |
|
| Consumer direct loans | 4 |
| 4 |
| — |
| | 3 |
| 3 |
| — |
|
| Credit cards | 3 |
| 3 |
| — |
| | 3 |
| 3 |
| — |
|
| Consumer indirect loans | 33 |
| 34 |
| 3 |
| | 34 |
| 34 |
| 2 |
|
| Total consumer loans | 165 |
| 196 |
| 15 |
| | 163 |
| 195 |
| 13 |
|
| Total loans with an allowance recorded | 233 |
| 282 |
| 26 |
| | 209 |
| 245 |
| 19 |
|
| Total | $ | 465 |
| $ | 570 |
| $ | 26 |
| | $ | 447 |
| $ | 556 |
| $ | 19 |
|
| | | | | | | | |
| |
(a) | The Recorded Investment represents the face amount of the loan increased or decreased by applicable accrued interest, net deferred loan fees and costs, and unamortized premium or discount, and reflects direct charge-offs. This amount is a component of total loans on our Consolidated Balance Sheet. |
| |
(b) | The Unpaid Principal Balance represents the customer’s legal obligation to us. |
The following table sets forth a further breakdown ofThere were no significant changes in the average individually impaired loans reported by Key:
|
| | | | | | | | | | | | |
Average Recorded Investment (a) | Three Months Ended June 30, | Six Months Ended June 30, |
| in millions | 2019 | 2018 | 2019 |
| 2018 |
|
| Commercial and industrial | $ | 176 |
| $ | 178 |
| $ | 172 |
| $ | 161 |
|
| Commercial real estate: | | | | |
| Commercial mortgage | 63 |
| 16 |
| 65 |
| 16 |
|
| Total commercial real estate loans | 63 |
| 16 |
| 65 |
| 16 |
|
| Total commercial loans | 239 |
| 194 |
| 237 |
| 177 |
|
| Real estate — residential mortgage | 48 |
| 49 |
| 49 |
| 49 |
|
| Home equity loans | 128 |
| 124 |
| 127 |
| 121 |
|
| Consumer direct loans | 4 |
| 4 |
| 4 |
| 4 |
|
| Credit cards | 2 |
| 3 |
| 3 |
| 3 |
|
| Consumer indirect loans | 36 |
| 35 |
| 36 |
| 34 |
|
| Total consumer loans | 218 |
| 215 |
| 219 |
| 211 |
|
| Total | $ | 457 |
| $ | 409 |
| $ | 456 |
| $ | 388 |
|
| | | | | |
| |
(a) | The Recorded Investment represents the face amount of the loan increased or decreased by applicable accrued interest, net deferred loan fees and costs, and unamortized premium or discount, and reflects direct charge-offs. This amount is a component of total loans on our Consolidated Balance Sheet. |
Interest income recognized on the outstanding balances of accruing impaired loans totaled $3 million and $6 million forextent to which collateral secures our collateral-dependent financial assets during the three and six months ended June 30, 2019, respectively, and $3 million and $5 million for the three and six months ended June 30, 2018, respectively.2020.
TDRs
We classify loan modifications as TDRs when a borrower is experiencing financial difficulties and we have granted a concession without commensurate financial, structural, or legal consideration. Additional information pertainingOur loan modifications are handled on a case-by-case basis and are negotiated to achieve mutually agreeable terms that maximize loan collectability and meet the borrower’s financial needs. Under the CARES Act as well as banking regulator interagency guidance, certain loan modifications to borrowers experiencing financial distress as a result of the economic impacts created by the COVID-19 pandemic may not be required to be treated as TDRs is included in Note 5 (“Asset Quality”) on page 117under U.S GAAP. We elected to suspend TDR accounting for $3.9 billion of our 2018 Form 10-K.COVID-19 related loan modifications as of June 30, 2020 as such loan modifications met the criteria under either the CARES Act or banking regulator interagency guidance.
As TDRs are individually evaluated for impairment under the specific reserve methodology, subsequent defaults do not generally have a significant additional impact on the ALLL. Commitments outstanding to lend additional funds to borrowers whose loan terms have been modified in TDRs were $5$1 million and $5 million at June 30, 2019,2020, and December 31, 2018,2019, respectively.
The consumer TDR other concession category in the table below primarily includes those borrowers’ debts that are discharged through Chapter 7 bankruptcy and have not been formally re-affirmed. At June 30, 2019,2020, and December 31, 2018,2019, the recorded investment of consumer residential mortgage loans in the process of foreclosure was approximately $96$63 million and $113 million, respectively. At June 30, 2019, and December 31, 2018, we had $38 million and $35 million, respectively, of OREO which included the carrying value of foreclosed residential real estate of approximately $38 million and $35$97 million, respectively.
The following table shows the post-modification outstanding recorded investment by concession type for our commercial and consumer accruing and nonaccruing TDRs that occurred during the periods indicated:
| | | | Three Months Ended June 30, | Six Months Ended June 30, | Three Months Ended June 30, | Six Months Ended June 30, |
| in millions | 2019 | 2018 | 2019 | 2018 | 2020 | 2019 | 2020 | 2019 |
| Commercial loans: | | |
| Forgiveness of principal | $ | — |
| 5 |
| $ | — |
| 5 |
| |
| Extension of Maturity Date | 6 |
| $ | 14 |
| $ | 6 |
| $ | 15 |
| 8 |
| $ | 6 |
| $ | 8 |
| $ | 6 |
|
| Payment or Covenant Modification/Deferment | 18 |
| 20 |
| 18 |
| 20 |
| — |
| 18 |
| — |
| 18 |
|
| Bankruptcy Plan Modification | 11 |
| 7 |
| 11 |
| 7 |
| — |
| 11 |
| — |
| 11 |
|
| Increase in new commitment or new money | | 4 |
| — |
| 4 |
| — |
|
| Total | 35 |
| $ | 46 |
| $ | 35 |
| $ | 47 |
| 12 |
| $ | 35 |
| $ | 12 |
| $ | 35 |
|
| Consumer loans: | | |
| Interest rate reduction | $ | 4 |
| $ | 8 |
| $ | 8 |
| $ | 18 |
| $ | 1 |
| $ | 4 |
| $ | 9 |
| $ | 8 |
|
| Other | 9 |
| 10 |
| 16 |
| 21 |
| 5 |
| 9 |
| 13 |
| 16 |
|
| Total | $ | 13 |
| $ | 18 |
| $ | 24 |
| $ | 39 |
| $ | 6 |
| $ | 13 |
| $ | 22 |
| $ | 24 |
|
| Total commercial and consumer TDRs | $ | 48 |
| $ | 64 |
| $ | 59 |
| $ | 86 |
| |
| Total TDRs | | $ | 18 |
| $ | 48 |
| $ | 34 |
| $ | 59 |
|
The following table summarizes the change in the post-modification outstanding recorded investment of our accruing and nonaccruing TDRs during the periods indicated:
| | | | Three Months Ended June 30, | Six Months Ended June 30, | Three Months Ended June 30, | Six Months Ended June 30, |
| in millions | 2019 | 2018 | 2019 | 2018 | 2020 | 2019 | 2020 | 2019 |
| Balance at beginning of the period | $ | 365 |
| $ | 317 |
| $ | 399 |
| $ | 317 |
| $ | 340 |
| $ | 365 |
| $ | 347 |
| $ | 399 |
|
| Additions | 54 |
| 54 |
| 68 |
| 75 |
| 22 |
| 54 |
| 39 |
| 68 |
|
| Payments | (19 | ) | (22 | ) | (58 | ) | (41 | ) | (35 | ) | (19 | ) | (53 | ) | (58 | ) |
| Charge-offs | (5 | ) | (2 | ) | (14 | ) | (4 | ) | (17 | ) | (5 | ) | (23 | ) | (14 | ) |
| Balance at end of period | $ | 395 |
| $ | 347 |
| $ | 395 |
| $ | 347 |
| $ | 310 |
| $ | 395 |
| $ | 310 |
| $ | 395 |
|
| | | | | |
A further breakdown of TDRs included in nonperforming loans by loan category for the periods indicated are as follows: | | | | June 30, 2019 | | December 31, 2018 | June 30, 2020 | | December 31, 2019 |
| | Number of Loans | Pre-modification Outstanding Recorded Investment | Post-modification Outstanding Recorded Investment | | Number of Loans | Pre-modification Outstanding Recorded Investment | Post-modification Outstanding Recorded Investment | Number of Loans | Pre-modification Outstanding Recorded Investment | Post-modification Outstanding Recorded Investment | | Number of Loans | Pre-modification Outstanding Recorded Investment | Post-modification Outstanding Recorded Investment |
| dollars in millions |
| LOAN TYPE | | | | | | | | | | |
| Nonperforming: | | | | | | | | | | |
| Commercial and industrial | 57 |
| $ | 111 |
| $ | 88 |
| | 35 |
| $ | 121 |
| $ | 85 |
| 50 |
| $ | 57 |
| $ | 43 |
| | 51 |
| $ | 72 |
| $ | 53 |
|
| Commercial real estate: | | | | | | | | | | |
| Commercial mortgage | 8 |
| 67 |
| 61 |
| | 6 |
| 66 |
| 62 |
| 8 |
| 65 |
| 58 |
| | 6 |
| 64 |
| 58 |
|
| Total commercial real estate loans | 8 |
| 67 |
| 61 |
| | 6 |
| 66 |
| 62 |
| 8 |
| 65 |
| 58 |
| | 6 |
| 64 |
| 58 |
|
| Total commercial loans | 65 |
| 178 |
| 149 |
| | 41 |
| 187 |
| 147 |
| 58 |
| 122 |
| 101 |
| | 57 |
| 136 |
| 111 |
|
| Real estate — residential mortgage | 297 |
| 21 |
| 19 |
| | 281 |
| 21 |
| 20 |
| 191 |
| 16 |
| 14 |
| | 181 |
| 13 |
| 11 |
|
| Home equity loans | 801 |
| 49 |
| 45 |
| | 1,142 |
| 66 |
| 63 |
| 574 |
| 36 |
| 34 |
| | 713 |
| 42 |
| 41 |
|
| Consumer direct loans | 129 |
| 1 |
| 1 |
| | 171 |
| 2 |
| 1 |
| 134 |
| 2 |
| 2 |
| | 172 |
| 2 |
| 2 |
|
| Credit cards | 251 |
| 1 |
| 1 |
| | 330 |
| 2 |
| 2 |
| 290 |
| 2 |
| 2 |
| | 368 |
| 2 |
| 2 |
|
| Consumer indirect loans | 968 |
| 16 |
| 13 |
| | 1,098 |
| 18 |
| 14 |
| 939 |
| 16 |
| 13 |
| | 1,131 |
| 19 |
| 16 |
|
| Total consumer loans | 2,446 |
| 88 |
| 79 |
| | 3,022 |
| 109 |
| 100 |
| 2,128 |
| 72 |
| 65 |
| | 2,565 |
| 78 |
| 72 |
|
| Total nonperforming TDRs | 2,511 |
| 266 |
| 228 |
| | 3,063 |
| 296 |
| 247 |
| 2,186 |
| 194 |
| 166 |
| | 2,622 |
| 214 |
| 183 |
|
Prior-year accruing:(a) | | | | | | | | | | |
| Commercial and industrial | 10 |
| 34 |
| 28 |
| | 11 |
| 37 |
| 32 |
| 3 |
| 2 |
| — |
| | 6 |
| 30 |
| 25 |
|
| Commercial real estate | | | | | | | | | | |
| Commercial mortgage | 1 |
| — |
| — |
| | 2 |
| — |
| — |
| 1 |
| — |
| — |
| | 1 |
| — |
| — |
|
| Total commercial real estate loans | 1 |
| — |
| — |
| | 2 |
| — |
| — |
| 1 |
| — |
| — |
| | 1 |
| — |
| — |
|
| Total commercial loans | 11 |
| 34 |
| 28 |
| | 13 |
| 37 |
| 32 |
| 4 |
| 2 |
| — |
| | 7 |
| 30 |
| 25 |
|
| Real estate — residential mortgage | 467 |
| 35 |
| 29 |
| | 491 |
| 36 |
| 30 |
| 487 |
| 36 |
| 30 |
| | 493 |
| 37 |
| 31 |
|
| Home equity loans | 1,716 |
| 100 |
| 83 |
| | 1,403 |
| 82 |
| 64 |
| 1,872 |
| 111 |
| 91 |
| | 1,751 |
| 104 |
| 84 |
|
| Consumer direct loans | 138 |
| 5 |
| 3 |
| | 79 |
| 4 |
| 3 |
| 183 |
| 4 |
| 3 |
| | 139 |
| 4 |
| 3 |
|
| Credit cards | 600 |
| 3 |
| 2 |
| | 479 |
| 3 |
| 1 |
| 602 |
| 4 |
| 2 |
| | 486 |
| 3 |
| 1 |
|
| Consumer indirect loans | 766 |
| 36 |
| 22 |
| | 556 |
| 33 |
| 22 |
| 820 |
| 31 |
| 18 |
| | 714 |
| 33 |
| 20 |
|
| Total consumer loans | 3,687 |
| 179 |
| 139 |
| | 3,008 |
| 158 |
| 120 |
| 3,964 |
| 186 |
| 144 |
| | 3,583 |
| 181 |
| 139 |
|
| Total prior-year accruing TDRs | 3,698 |
| 213 |
| 167 |
| | 3,021 |
| 195 |
| 152 |
| 3,968 |
| 188 |
| 144 |
| | 3,590 |
| 211 |
| 164 |
|
| Total TDRs | 6,209 |
| $ | 479 |
| $ | 395 |
| | 6,084 |
| $ | 491 |
| $ | 399 |
| 6,154 |
| $ | 382 |
| $ | 310 |
| | 6,212 |
| $ | 425 |
| $ | 347 |
|
| | | | | | | | | | | |
| |
| (a) | All TDRs that were restructured prior to January 1, 2019,2020, and January 1, 2018,2019, and are fully accruing. |
Commercial loan TDRs are considered defaulted when principal and interest payments are 90 days past due. Consumer loan TDRs are considered defaulted when principal and interest payments are more than 60 days past due. During the three months ended June 30, 2019,2020, there were no0 commercial loan TDRs and 10243 consumer loan TDRs with a combined recorded investment of $1 million that experienced payment defaults after modifications resulting in TDR status during 2019. During the three months ended June 30, 2019, there were 0 commercial loan TDRs and 102 consumer loan TDRs with a combined recorded investment of $2 million that experienced payment defaults after modifications resulting in TDR status during 2018.
During the threesix months ended June 30, 2018,2020, there were no0 commercial loan TDRs and 55127 consumer loan TDRs with a combined recorded investment of $1$3 million that experienced payment defaults after modifications resulting in TDR status during 2017.
2019. During the six months ended June 30, 2019, there were no0 commercial loan TDRs and 174consumer loan TDRs with a combined recorded investment of $4 million that experienced payment defaults after modifications resulting in TDR status during 2018. During the six months ended June 30, 2018, there were no commercial loan TDRs and 96 consumer loan TDRs with a combined recorded investment of $2 million that experienced payment defaults after modifications resulting in TDR status during 2017.
ALLL and Liability for Credit Losses on Unfunded Lending-Related CommitmentsOff Balance Sheet Exposures
We determine the appropriate level of the ALLL on at least a quarterly basis. The methodology is described in Note 1 (“Summary of Significant Accounting Policies”) under the heading “Allowance for Loan and Lease Losses” beginning on page 101 of our 2018 Form 10-K.
The ALLL on the acquired non-impaired loan portfolio is estimated using the same methodology as the originated portfolio, however, the estimated ALLL is compared to the remaining accretable yield to determine if an ALLL must be recorded. For PCI loans, Key estimates cash flows expected to be collected quarterly. Decreases in expected cash flows are recognized as impairment through a provision for loan and lease losses and an increase in the ALLL.
The ALLL at June 30, 2019, represents our best estimate of the incurred credit losses inherent in the loan portfolio at that date. The changes in the ALLL by loan category for the periods indicated are as follows:
Three months ended June 30, 2019: |
| | | | | | | | | | | | | | | | |
| in millions | March 31, 2019 | Provision | | Charge-offs | Recoveries | June 30, 2019 |
| Commercial and Industrial | $ | 530 |
| $ | 43 |
| | $ | (30 | ) | $ | 6 |
| $ | 549 |
|
| Commercial real estate: | | | | | | |
| Real estate — commercial mortgage | 144 |
| (5 | ) | | (1 | ) | 1 |
| 139 |
|
| Real estate — construction | 28 |
| (4 | ) | | — |
| — |
| 24 |
|
| Total commercial real estate loans | 172 |
| (9 | ) | | (1 | ) | 1 |
| 163 |
|
| Commercial lease financing | 35 |
| 14 |
| | (16 | ) | 2 |
| 35 |
|
| Total commercial loans | 737 |
| 48 |
| | (47 | ) | 9 |
| 747 |
|
| Real estate — residential mortgage | 8 |
| — |
| | (1 | ) | — |
| 7 |
|
| Home equity loans | 36 |
| 4 |
| | (6 | ) | 2 |
| 36 |
|
| Consumer direct loans | 33 |
| 7 |
| | (10 | ) | 2 |
| 32 |
|
| Credit cards | 47 |
| 7 |
| | (12 | ) | 2 |
| 44 |
|
| Consumer indirect loans | 22 |
| 6 |
| | (8 | ) | 4 |
| 24 |
|
| Total consumer loans | 146 |
| 24 |
| | (37 | ) | 10 |
| 143 |
|
| Total ALLL — continuing operations | 883 |
| 72 |
| (a) | (84 | ) | 19 |
| 890 |
|
| Discontinued operations | 13 |
| 2 |
| | (4 | ) | 1 |
| 12 |
|
| Total ALLL — including discontinued operations | $ | 896 |
| $ | 74 |
| | $ | (88 | ) | $ | 20 |
| $ | 902 |
|
| | | | | | | |
| |
(a) | Excludes a provision for losses on lending-related commitments of $2 million. |
Three months ended June 30, 2018:
|
| | | | | | | | | | | | | | | | |
| in millions | March 31, 2018 | Provision | | Charge-offs | Recoveries | June 30, 2018 |
| Commercial and Industrial | $ | 533 |
| $ | 41 |
| | $ | (39 | ) | $ | 7 |
| $ | 542 |
|
| Commercial real estate: | | | | | | |
| Real estate — commercial mortgage | 136 |
| 4 |
| | (2 | ) | 1 |
| 139 |
|
| Real estate — construction | 33 |
| (5 | ) | | — |
| — |
| 28 |
|
| Total commercial real estate loans | 169 |
| (1 | ) | | (2 | ) | 1 |
| 167 |
|
| Commercial lease financing | 40 |
| 4 |
| | (4 | ) | — |
| 40 |
|
| Total commercial loans | 742 |
| 44 |
| | (45 | ) | 8 |
| 749 |
|
| Real estate — residential mortgage | 9 |
| 1 |
| | — |
| — |
| 10 |
|
| Home equity loans | 38 |
| 2 |
| | (6 | ) | 3 |
| 37 |
|
| Consumer direct loans | 27 |
| 6 |
| | (9 | ) | 2 |
| 26 |
|
| Credit cards | 45 |
| 11 |
| | (12 | ) | 2 |
| 46 |
|
| Consumer indirect loans | 20 |
| 2 |
| | (7 | ) | 4 |
| 19 |
|
| Total consumer loans | 139 |
| 22 |
| | (34 | ) | 11 |
| 138 |
|
| Total ALLL — continuing operations | 881 |
| 66 |
| (a) | (79 | ) | 19 |
| 887 |
|
| Discontinued operations | 16 |
| — |
| | (3 | ) | 1 |
| 14 |
|
| Total ALLL — including discontinued operations | $ | 897 |
| $ | 66 |
| | $ | (82 | ) | $ | 20 |
| $ | 901 |
|
| | | | | | | |
| |
(a) | Excludes a credit for losses on lending-related commitments of $2 million. |
Six months ended June 30, 2019: |
| | | | | | | | | | | | | | | | |
| in millions | December 31, 2018 | Provision | | Charge-offs | Recoveries | June 30, 2019 |
| Commercial and Industrial | 532 |
| $ | 67 |
| | $ | (66 | ) | $ | 16 |
| $ | 549 |
|
| Commercial real estate: | | | | | | |
| Real estate — commercial mortgage | 142 |
| 1 |
| | (6 | ) | 2 |
| 139 |
|
| Real estate — construction | 33 |
| (5 | ) | | (4 | ) | — |
| 24 |
|
| Total commercial real estate loans | 175 |
| (4 | ) | | (10 | ) | 2 |
| 163 |
|
| Commercial lease financing | 36 |
| 20 |
| | (24 | ) | 3 |
| 35 |
|
| Total commercial loans | 743 |
| 83 |
| | (100 | ) | 21 |
| 747 |
|
| Real estate — residential mortgage | 7 |
| 1 |
| | (2 | ) | 1 |
| 7 |
|
| Home equity loans | 35 |
| 7 |
| | (10 | ) | 4 |
| 36 |
|
| Consumer direct loans | 30 |
| 19 |
| | (20 | ) | 3 |
| 32 |
|
| Credit cards | 48 |
| 15 |
| | (23 | ) | 4 |
| 44 |
|
| Consumer indirect loans | 20 |
| 11 |
| | (16 | ) | 9 |
| 24 |
|
| Total consumer loans | 140 |
| 53 |
| | (71 | ) | 21 |
| 143 |
|
| Total ALLL — continuing operations | 883 |
| 136 |
| (a) | (171 | ) | 42 |
| 890 |
|
| Discontinued operations | 14 |
| 4 |
| | (8 | ) | 2 |
| 12 |
|
| Total ALLL — including discontinued operations | $ | 897 |
| $ | 140 |
| | $ | (179 | ) | $ | 44 |
| $ | 902 |
|
| | | | | | | |
Six months ended June 30, 2018: |
| | | | | | | | | | | | | | | | |
| in millions | December 31, 2017 | Provision | | Charge-offs | Recoveries | June 30, 2018 |
| Commercial and Industrial | $ | 529 |
| $ | 76 |
| | $ | (76 | ) | $ | 13 |
| $ | 542 |
|
| Commercial real estate: | | | | | | |
| Real estate — commercial mortgage | 133 |
| 8 |
| | (3 | ) | 1 |
| 139 |
|
| Real estate — construction | 30 |
| (3 | ) | | — |
| 1 |
| 28 |
|
| Total commercial real estate loans | 163 |
| 5 |
| | (3 | ) | 2 |
| 167 |
|
| Commercial lease financing | 43 |
| 1 |
| | (5 | ) | 1 |
| 40 |
|
| Total commercial loans | 735 |
| 82 |
| | (84 | ) | 16 |
| 749 |
|
| Real estate — residential mortgage | 7 |
| 4 |
| | (1 | ) | — |
| 10 |
|
| Home equity loans | 43 |
| (2 | ) | | (10 | ) | 6 |
| 37 |
|
| Consumer direct loans | 28 |
| 11 |
| | (17 | ) | 4 |
| 26 |
|
| Credit cards | 44 |
| 23 |
| | (24 | ) | 3 |
| 46 |
|
| Consumer indirect loans | 20 |
| 6 |
| | (15 | ) | 8 |
| 19 |
|
| Total consumer loans | 142 |
| 42 |
| | (67 | ) | 21 |
| 138 |
|
| Total ALLL — continuing operations | 877 |
| 124 |
| (a) | (151 | ) | 37 |
| 887 |
|
| Discontinued operations | 16 |
| 2 |
| | (7 | ) | 3 |
| 14 |
|
| Total ALLL — including discontinued operations | $ | 893 |
| $ | 126 |
| | $ | (158 | ) | $ | 40 |
| $ | 901 |
|
| | | | | | | |
| |
(a) | Excludes a provision for losses on lending-related commitments of $1 million. |
A breakdown of the individual and collective ALLL and the corresponding loan balances as of June 30, 2019, follows:
|
| | | | | | | | | | | | | | | | | | | | | | | | |
| | Allowance | | Outstanding |
| June 30, 2019 | Individually Evaluated for Impairment | Collectively Evaluated for Impairment | Purchased Credit Impaired | | Loans | | Individually Evaluated for Impairment | Collectively Evaluated for Impairment | | Purchased Credit Impaired |
| in millions | | |
| Commercial and industrial | $ | 10 |
| $ | 538 |
| $ | 1 |
| | $ | 48,544 |
| | $ | 183 |
| $ | 48,308 |
| | $ | 53 |
|
| Commercial real estate: | | | | | | | | | | |
| Commercial mortgage | 1 |
| 137 |
| 1 |
| | 13,299 |
| | 64 |
| 13,080 |
| | 155 |
|
| Construction | — |
| 24 |
| — |
| | 1,439 |
| | — |
| 1,438 |
| | 1 |
|
| Total commercial real estate loans | 1 |
| 161 |
| 1 |
| | 14,738 |
| | 64 |
| 14,518 |
| | 156 |
|
| Commercial lease financing | — |
| 35 |
| — |
| | 4,578 |
| | — |
| 4,578 |
| | — |
|
Total commercial loans | 11 |
| 734 |
| 2 |
| | 67,860 |
| | 247 |
| 67,404 |
| | 209 |
|
| Real estate — residential mortgage | 3 |
| 3 |
| 1 |
| | 6,053 |
| | 48 |
| 5,714 |
| | 291 |
|
| Home equity loans | 9 |
| 26 |
| 1 |
| | 10,575 |
| | 128 |
| 10,432 |
| | 15 |
|
| Consumer direct loans | — |
| 32 |
| — |
| | 2,350 |
| | 4 |
| 2,343 |
| | 3 |
|
| Credit cards | — |
| 44 |
| — |
| | 1,096 |
| | 3 |
| 1,093 |
| | — |
|
| Consumer indirect loans | 3 |
| 21 |
| — |
| | 4,003 |
| | 35 |
| 3,968 |
| | — |
|
| Total consumer loans | 15 |
| 126 |
| 2 |
| | 24,077 |
| | 218 |
| 23,550 |
| | 309 |
|
| Total ALLL — continuing operations | 26 |
| 860 |
| 4 |
| | 91,937 |
| | 465 |
| 90,954 |
| | 518 |
|
| Discontinued operations | 2 |
| 10 |
| — |
| | 964 |
| (a) | 23 |
| 941 |
| (a) | — |
|
| Total ALLL — including discontinued operations | $ | 28 |
| $ | 870 |
| $ | 4 |
| | $ | 92,901 |
| | $ | 488 |
| $ | 91,895 |
| | $ | 518 |
|
| | | | | | | | | | | |
| |
(a) | Amount includes $2 million of loans carried at fair value that are excluded from ALLL consideration. |
A breakdown of the individual and collective ALLL and the corresponding loan balances as of December 31, 2018, follows:
|
| | | | | | | | | | | | | | | | | | | | | | | | |
| | Allowance | | Outstanding |
| December 31, 2018 | Individually Evaluated for Impairment | Collectively Evaluated for Impairment | Purchased Credit Impaired | | Loans | | Individually Evaluated for Impairment | Collectively Evaluated for Impairment | | Purchased Credit Impaired |
| in millions | | |
| Commercial and Industrial | $ | 5 |
| $ | 526 |
| $ | 1 |
| | $ | 45,753 |
| | $ | 162 |
| $ | 45,530 |
| | $ | 61 |
|
| Commercial real estate: | | | | | | | | | | |
| Commercial mortgage | — |
| 139 |
| 3 |
| | 14,285 |
| | 66 |
| 14,041 |
| | 178 |
|
| Construction | — |
| 33 |
| — |
| | 1,666 |
| | — |
| 1,664 |
| | 2 |
|
| Total commercial real estate loans | — |
| 172 |
| 3 |
| | 15,951 |
| | 66 |
| 15,705 |
| | 180 |
|
| Commercial lease financing | — |
| 36 |
| — |
| | 4,606 |
| | — |
| 4,606 |
| | — |
|
| Total commercial loans | 5 |
| 734 |
| 4 |
| | 66,310 |
| | 228 |
| 65,841 |
| | 241 |
|
| Real estate — residential mortgage | 3 |
| 4 |
| — |
| | 5,513 |
| | 49 |
| 5,150 |
| | 314 |
|
| Home equity loans | 8 |
| 26 |
| 1 |
| | 11,142 |
| | 127 |
| 10,998 |
| | 17 |
|
| Consumer direct loans | — |
| 30 |
| — |
| | 1,809 |
| | 4 |
| 1,802 |
| | 3 |
|
| Credit cards | — |
| 48 |
| — |
| | 1,144 |
| | 3 |
| 1,141 |
| | — |
|
| Consumer indirect loans | 3 |
| 17 |
| — |
| | 3,634 |
| | 36 |
| 3,598 |
| | — |
|
| Total consumer loans | 14 |
| 125 |
| 1 |
| | 23,242 |
| | 219 |
| 22,689 |
| | 334 |
|
| Total ALLL — continuing operations | 19 |
| 859 |
| 5 |
| | 89,552 |
| | 447 |
| 88,530 |
| | 575 |
|
| Discontinued operations | 2 |
| 12 |
| — |
| | 1,073 |
| (a) | 23 |
| 1,050 |
| (a) | — |
|
| Total ALLL — including discontinued operations | $ | 21 |
| $ | 871 |
| $ | 5 |
| | $ | 90,625 |
| | $ | 470 |
| $ | 89,580 |
| | $ | 575 |
|
| | | | | | | | | | | |
| |
(a) | Amount includes $2 million of loans carried at fair value that are excluded from ALLL consideration. |
The liability for credit losses inherent in unfunded lending-related commitments, such as letters of credit and unfunded loan commitments, and certain financial guarantees is included in “accrued expense and other liabilities” on the balance sheet. We establish the amount of this reserve by considering both historical trends and current market conditions quarterly, or more often if deemed necessary.
Changes in the liability for credit losses on unfunded lending-related commitmentsoff balance sheet exposures are summarized as follows:
|
| | | | | | | | | | | | |
| | Three months ended June 30, | Six months ended June 30, |
| in millions | 2019 | 2018 | 2019 | 2018 |
| Balance at beginning of period | $ | 62 |
| $ | 60 |
| $ | 64 |
| $ | 57 |
|
| Provision (credit) for losses on lending-related commitments | 2 |
| (2 | ) | — |
| 1 |
|
| Balance at end of period | $ | 64 |
| $ | 58 |
| $ | 64 |
| $ | 58 |
|
| | | | | |
PCI Loans
Purchased loans that have evidence of deterioration in credit quality since origination and for which it is probable, at acquisition, that all contractually required payments will not be collected are deemed PCI. Our policies for determining, recording payments on, and derecognizing PCI loans are disclosed in Note 1 (“Summary of Significant Accounting Policies”) under the heading “Purchased Loans” beginning on page 105 of our 2018 Form 10-K.
We have PCI loans from two separate acquisitions, one in 2012 and one in 2016. The following tables present the roll-forward of the accretable yield and the beginning and ending outstanding unpaid principal balance and carrying amount of all PCI loans for the six months ended June 30, 2019, and the twelve months ended December 31, 2018.
|
| | | | | | | | | | | | | | | | | | | |
| | Three Months Ended June 30, | | Six Months Ended June 30, |
| | 2019 | | 2019 |
| in millions | Accretable Yield | Carrying Amount | Outstanding Unpaid Principal Balance | | Accretable Yield | Carrying Amount | Outstanding Unpaid Principal Balance |
| Balance at beginning of period | $ | 118 |
| $ | 547 |
| $ | 578 |
| | $ | 117 |
| $ | 571 |
| $ | 607 |
|
| Accretion | (9 | ) | | | | (19 | ) | | |
| Net reclassifications from nonaccretable to accretable | (5 | ) | | | | 8 |
| | |
| Payments received, net | (3 | ) | | | | (5 | ) | | |
| Balance at end of period | $ | 101 |
| $ | 513 |
| $ | 541 |
| | $ | 101 |
| $ | 513 |
| $ | 541 |
|
| | | | | | | | |
|
| | | | | | | | | |
| | Twelve Months Ended December 31, |
| | 2018 |
| in millions | Accretable Yield | Carrying Amount | Outstanding Unpaid Principal Balance |
| Balance at beginning of period | $ | 131 |
| $ | 738 |
| $ | 803 |
|
| Accretion | (42 | ) | | |
| Net reclassifications from nonaccretable to accretable | 50 |
| | |
| Payments received, net | (21 | ) | | |
| Loans charged off | (1 | ) | | |
| Balance at end of period | $ | 117 |
| $ | 571 |
| $ | 607 |
|
| | | | |
|
| | | | | | | | | | | | |
| | Three months ended June 30, | Six months ended June 30, |
| in millions | 2020 | 2019 | 2020 | 2019 |
| Balance at the end of the prior period | $ | 161 |
| $ | 62 |
| $ | 68 |
| $ | 64 |
|
| Liability for credit losses on contingent guarantees at the end of the prior period | — |
| — |
| 7 |
| — |
|
Cumulative effect from change in accounting principle (a), (b) | — |
| — |
| 66 |
| — |
|
| Balance at beginning of period | 161 |
| 62 |
| 141 |
| 64 |
|
| Provision (credit) for losses on off balance sheet exposures | 37 |
| 2 |
| 57 |
| — |
|
| Balance at end of period | $ | 198 |
| $ | 64 |
| $ | 198 |
| $ | 64 |
|
| | | | | |
| |
| (a) | The cumulative effect from change in accounting principle relates to the January 1, 2020, adoption of ASU 2016-13. |
| |
| (b) | Excludes $4 million related to the provision for other financial assets. |
5. Fair Value Measurements
In accordance with GAAP, Key measures certain assets and liabilities at fair value. Fair value is defined as the price to sell an asset or transfer a liability in an orderly transaction between market participants in our principal market. Additional information regarding our accounting policies for determining fair value is provided in Note 6 (“Fair Value Measurements”) and Note 1 (“Summary of Significant Accounting Policies”) under the heading “Fair Value Measurements” of our 20182019 Form 10-K.
Assets and Liabilities Measured at Fair Value on a Recurring Basis
Certain assets and liabilities are measured at fair value on a recurring basis in accordance with GAAP. The following tables present these assets and liabilities at June 30, 2019,2020, and December 31, 2018.2019.
| | | | June 30, 2019 | December 31, 2018 | June 30, 2020 | December 31, 2019 |
| | Level 1 | Level 2 | Level 3 | Total | Level 1 | Level 2 | Level 3 | Total | Level 1 | Level 2 | Level 3 | Total | Level 1 | Level 2 | Level 3 | Total |
| in millions |
| ASSETS MEASURED ON A RECURRING BASIS | | |
| Trading account assets: | | |
| U.S. Treasury, agencies and corporations | — |
| $ | 853 |
| — |
| $ | 853 |
| — |
| $ | 578 |
| — |
| $ | 578 |
| — |
| $ | 531 |
| — |
| $ | 531 |
| — |
| $ | 843 |
| — |
| $ | 843 |
|
| States and political subdivisions | — |
| 32 |
| — |
| 32 |
| — |
| 60 |
| — |
| 60 |
| — |
| 40 |
| — |
| 40 |
| — |
| 30 |
| — |
| 30 |
|
| Other mortgage-backed securities | — |
| 36 |
| — |
| 36 |
| — |
| 164 |
| — |
| 164 |
| — |
| 16 |
| $ | 36 |
| 52 |
| — |
| 78 |
| — |
| 78 |
|
| Other securities | — |
| 62 |
| — |
| 62 |
| — |
| 22 |
| — |
| 22 |
| — |
| 13 |
| — |
| 13 |
| — |
| 44 |
| — |
| 44 |
|
| Total trading account securities | — |
| 983 |
| — |
| 983 |
| — |
| 824 |
| — |
| 824 |
| — |
| 600 |
| 36 |
| 636 |
| — |
| 995 |
| — |
| 995 |
|
| Commercial loans | — |
| 22 |
| — |
| 22 |
| — |
| 25 |
| — |
| 25 |
| — |
| 9 |
| — |
| 9 |
| — |
| 45 |
| — |
| 45 |
|
| Total trading account assets | — |
| 1,005 |
| — |
| 1,005 |
| — |
| 849 |
| — |
| 849 |
| — |
| 609 |
| 36 |
| 645 |
| — |
| 1,040 |
| — |
| 1,040 |
|
| Securities available for sale: | | |
| U.S. Treasury, agencies and corporations | — |
| 272 |
| — |
| 272 |
| — |
| 147 |
| — |
| 147 |
| — |
| 3,465 |
| — |
| 3,465 |
| — |
| 334 |
| — |
| 334 |
|
| States and political subdivisions | — |
| 5 |
| — |
| 5 |
| — |
| 7 |
| — |
| 7 |
| — |
| 4 |
| — |
| 4 |
| — |
| 4 |
| — |
| 4 |
|
| Agency residential collateralized mortgage obligations | — |
| 13,612 |
| — |
| 13,612 |
| — |
| 13,962 |
| — |
| 13,962 |
| — |
| 11,947 |
| — |
| 11,947 |
| — |
| 12,783 |
| — |
| 12,783 |
|
| Agency residential mortgage-backed securities | — |
| 2,061 |
| — |
| 2,061 |
| — |
| 2,105 |
| — |
| 2,105 |
| — |
| 1,445 |
| — |
| 1,445 |
| — |
| 1,714 |
| — |
| 1,714 |
|
| Agency commercial mortgage-backed securities | — |
| 5,543 |
| — |
| 5,543 |
| — |
| 3,187 |
| — |
| 3,187 |
| — |
| 6,727 |
| — |
| 6,727 |
| — |
| 6,997 |
| — |
| 6,997 |
|
| Other securities | — |
| 24 |
| $ | 11 |
| 35 |
| — |
| — |
| $ | 20 |
| 20 |
| — |
| — |
| 12 |
| 12 |
| — |
| — |
| $ | 11 |
| 11 |
|
| Total securities available for sale | — |
| 21,517 |
| 11 |
| 21,528 |
| — |
| 19,408 |
| 20 |
| 19,428 |
| — |
| 23,588 |
| 12 |
| 23,600 |
| — |
| 21,832 |
| 11 |
| 21,843 |
|
| Other investments: | | |
| Principal investments: | | |
| Direct | — |
| — |
| 1 |
| 1 |
| — |
| — |
| 1 |
| 1 |
| — |
| — |
| 1 |
| 1 |
| — |
| — |
| 1 |
| 1 |
|
Indirect (measured at NAV) (a) | — |
| — |
| — |
| 76 |
| — |
| — |
| — |
| 96 |
| — |
| — |
| — |
| 56 |
| — |
| — |
| — |
| 68 |
|
| Total principal investments | — |
| — |
| 1 |
| 77 |
| — |
| — |
| 1 |
| 97 |
| — |
| — |
| 1 |
| 57 |
| — |
| — |
| 1 |
| 69 |
|
| Equity investments: | | |
| Direct | — |
| — |
| 7 |
| 7 |
| — |
| 1 |
| 7 |
| 8 |
| — |
| — |
| 12 |
| 12 |
| — |
| — |
| 12 |
| 12 |
|
Direct (measured at NAV) (a) | — |
| — |
| — |
| 1 |
| — |
| — |
| — |
| 1 |
| — |
| — |
| — |
| 1 |
| — |
| — |
| — |
| 1 |
|
Indirect (measured at NAV) (a) | — |
| — |
| — |
| 8 |
| — |
| — |
| — |
| 9 |
| — |
| — |
| — |
| 8 |
| — |
| — |
| — |
| 8 |
|
| Total equity investments | — |
| — |
| 7 |
| 16 |
| — |
| 1 |
| 7 |
| 18 |
| — |
| — |
| 12 |
| 21 |
| — |
| — |
| 12 |
| 21 |
|
| Total other investments | — |
| — |
| 8 |
| 93 |
| — |
| 1 |
| 8 |
| 115 |
| — |
| — |
| 13 |
| 78 |
| — |
| — |
| 13 |
| 90 |
|
| Loans, net of unearned income (residential) | — |
| — |
| 3 |
| 3 |
| — |
| — |
| 3 |
| 3 |
| — |
| — |
| 5 |
| 5 |
| — |
| — |
| 4 |
| 4 |
|
| Loans held for sale (residential) | — |
| 164 |
| — |
| 164 |
| — |
| 54 |
| — |
| 54 |
| — |
| 250 |
| — |
| 250 |
| — |
| 140 |
| — |
| 140 |
|
| Derivative assets: | | |
| Interest rate | — |
| 885 |
| 4 |
| 889 |
| — |
| 410 |
| 5 |
| 415 |
| — |
| 1,968 |
| 52 |
| 2,020 |
| — |
| 941 |
| 22 |
| 963 |
|
| Foreign exchange | $ | 41 |
| 29 |
| — |
| 70 |
| $ | 70 |
| 36 |
| — |
| 106 |
| $ | 79 |
| 29 |
| — |
| 108 |
| $ | 49 |
| 18 |
| — |
| 67 |
|
| Commodity | — |
| 246 |
| — |
| 246 |
| — |
| 333 |
| — |
| 333 |
| — |
| 487 |
| — |
| 487 |
| — |
| 208 |
| — |
| 208 |
|
| Credit | — |
| 1 |
| — |
| 1 |
| — |
| 1 |
| — |
| 1 |
| — |
| 1 |
| 3 |
| 4 |
| — |
| — |
| 1 |
| 1 |
|
| Other | — |
| 10 |
| 6 |
| 16 |
| — |
| 6 |
| 3 |
| 9 |
| — |
| 37 |
| 46 |
| 83 |
| — |
| 9 |
| 5 |
| 14 |
|
| Derivative assets | 41 |
| 1,171 |
| 10 |
| 1,222 |
| 70 |
| 786 |
| 8 |
| 864 |
| 79 |
| 2,522 |
| 101 |
| 2,702 |
| 49 |
| 1,176 |
| 28 |
| 1,253 |
|
Netting adjustments (b) | — |
| — |
| — |
| (413 | ) | — |
| — |
| — |
| (333 | ) | — |
| — |
| — |
| (609 | ) | — |
| — |
| — |
| (473 | ) |
| Total derivative assets | 41 |
| 1,171 |
| 10 |
| 809 |
| 70 |
| 786 |
| 8 |
| 531 |
| 79 |
| 2,522 |
| 101 |
| 2,093 |
| 49 |
| 1,176 |
| 28 |
| 780 |
|
| Accrued income and other assets | — |
| — |
| — |
| — |
| — |
| — |
| — |
| — |
| — |
| — |
| — |
| — |
| — |
| — |
| — |
| — |
|
| Total assets on a recurring basis at fair value | $ | 41 |
| $ | 23,857 |
| $ | 32 |
| $ | 23,602 |
| $ | 70 |
| $ | 21,098 |
| $ | 39 |
| $ | 20,980 |
| $ | 79 |
| $ | 26,969 |
| $ | 167 |
| $ | 26,671 |
| $ | 49 |
| $ | 24,188 |
| $ | 56 |
| $ | 23,897 |
|
| LIABILITIES MEASURED ON A RECURRING BASIS | | |
| Bank notes and other short-term borrowings: | | |
| Short positions | $ | 7 |
| $ | 713 |
| — |
| $ | 720 |
| $ | 14 |
| $ | 530 |
| — |
| $ | 544 |
| $ | 285 |
| $ | 430 |
| — |
| $ | 715 |
| $ | 19 |
| $ | 686 |
| — |
| $ | 705 |
|
| Derivative liabilities: | | |
| Interest rate | — |
| 220 |
| — |
| 220 |
| — |
| 297 |
| — |
| 297 |
| — |
| 337 |
| — |
| 337 |
| — |
| 253 |
| — |
| 253 |
|
| Foreign exchange | 35 |
| 29 |
| — |
| 64 |
| 58 |
| 37 |
| — |
| 95 |
| 69 |
| 28 |
| — |
| 97 |
| 43 |
| 17 |
| — |
| 60 |
|
| Commodity | — |
| 236 |
| — |
| 236 |
| — |
| 323 |
| — |
| 323 |
| — |
| 462 |
| — |
| 462 |
| — |
| 200 |
| — |
| 200 |
|
| Credit | — |
| 2 |
| $ | 1 |
| 3 |
| — |
| 1 |
| — |
| 1 |
| — |
| — |
| $ | 20 |
| 20 |
| — |
| 1 |
| $ | 9 |
| 10 |
|
| Other | — |
| 13 |
| — |
| 13 |
| — |
| 7 |
| — |
| 7 |
| — |
| 23 |
| — |
| 23 |
| — |
| 10 |
| — |
| 10 |
|
| Derivative liabilities | 35 |
| 500 |
| 1 |
| 536 |
| 58 |
| 665 |
| — |
| 723 |
| 69 |
| 850 |
| 20 |
| 939 |
| 43 |
| 481 |
| 9 |
| 533 |
|
Netting adjustments (b) | — |
| — |
| — |
| (319 | ) | — |
| — |
| — |
| (337 | ) | — |
| — |
| — |
| (629 | ) | — |
| — |
| — |
| (335 | ) |
| Total derivative liabilities | 35 |
| 500 |
| 1 |
| 217 |
| 58 |
| 665 |
| — |
| 386 |
| 69 |
| 850 |
| 20 |
| 310 |
| 43 |
| 481 |
| 9 |
| 198 |
|
| Accrued expense and other liabilities | — |
| — |
| — |
| — |
| — |
| — |
| — |
| — |
| |
| Total liabilities on a recurring basis at fair value | $ | 42 |
| $ | 1,213 |
| $ | 1 |
| $ | 937 |
| $ | 72 |
| $ | 1,195 |
| — |
| $ | 930 |
| $ | 354 |
| $ | 1,280 |
| $ | 20 |
| $ | 1,025 |
| $ | 62 |
| $ | 1,167 |
| $ | 9 |
| $ | 903 |
|
| | | |
| |
| (a) | Certain investments that are measured at fair value using the net asset value per share (or its equivalent) practical expedient have not been classified in the fair value hierarchy. The fair value amounts presented in this table are intended to permit reconciliation of the fair value hierarchy to the amounts presented in the consolidated balance sheet. |
| |
| (b) | Netting adjustments represent the amounts recorded to convert our derivative assets and liabilities from a gross basis to a net basis in accordance with the applicable accounting guidance. The net basis takes into account the impact of bilateral collateral and master netting agreements that allow us to settle all derivative contracts with a single counterparty on a net basis and to offset the net derivative position with the related cash collateral. Total derivative assets and liabilities include these netting adjustments. |
Qualitative Disclosures of Valuation Techniques
The following table describes the valuation techniques and significant inputs used to measure the classes of assets and liabilities reported at fair value on a recurring basis, as well as the classification of each within the valuation hierarchy.
|
| | |
| Asset/liability class | Valuation technique | Valuation hierarchy classification(s) |
| Securities (trading account assets and available for sale) | Fair value of levelLevel 1 securities is determined by: • Quoted market prices available in an active market for identical securities. This includes exchange-traded equity securities. Fair value of levelLevel 2 securities is determined by: • Pricing models (either by a third party pricing service or internally). Inputs include: yields, benchmark securities, bids, offers, actual trade data (i.e., spreads, credit ratings, and interest rates) for comparable assets, spread tables, matrices, high-grade scales, and option-adjusted spreads. • Observable market prices of similar securities. Fair value of levelLevel 3 securities is determined by: • Internal models,Internally developed valuation techniques, principally discounted cash flow modelsmethods (income approach). • Revenue multiples of comparable public companies (market approach).
For levelLevel 3 securities, increases (decreases) in the discount rate and marketability discount used in the discounted cash flow models would have resulted in lower (higher) fair value measurements. Higher volatility factors would have further magnified changes in fair value.
The valuations provided by the third-party pricing service are based on observable market inputs, which include benchmark yields, reported trades, issuer spreads, benchmark securities, bids, offers, and reference data obtained from market research publications. Inputs used by the third-party pricing service in valuing CMOs and other mortgage-backed securities also include new issue data, monthly payment information, whole loan collateral performance, and “To Be Announced” prices. In valuations of securities issued by state and political subdivisions, inputs used by the third-party pricing service also include material event notices. | Level 1, 2, and 3 (primarily Level 2) |
| Commercial loans (trading account assets) | Fair value is based on: • Observable market price spreads for similar loans. Valuations reflect prices within the bid-ask spread that are most representative of fair value. | Level 2 |
| Principal investments (direct) | Direct principal investments consist of equity and debt instruments of private companies made by our principal investing entities. Fair value is determined using: • Operating performance and market multiples of comparable businesses • Other unique facts and circumstances related to each individual investment Direct principal investments are accounted for as investment companies in accordance with the applicable accounting guidance, whereby each investment is adjusted to fair value with any net realized or unrealized gain/loss recorded in the current period’s earnings.
We are in the process of winding down our direct principal investment portfolio. As of June 30, 2019,2020, the balance is less than $1 million. | Level 3 |
| Principal investments (indirect) | Indirect principal investments include primary and secondary investments in private equity funds engaged mainly in venture- and growth-oriented investing. These investments do not have readily determinable fair values and qualify for the practical expedient to estimate fair value based upon net asset value per share (or its equivalent, such as member units or an ownership interest in partners’ capital to which a proportionate share of net assets is attributed). Indirect principal investments are also accounted for as investment companies, whereby each investment is adjusted to fair value with any net realized or unrealized gain/loss recorded in the current period’s earnings.
Under the provisions of the Volcker Rule, we are required to dispose or conform our indirect investments to the requirements of the statute by no later than July 21, 2022. As of June 30, 2019,2020, we have not committed to a plan to sell these investments. Therefore, these investments continue to be valued using the net asset value per share methodology. | NAV |
The following table presents the fair value of our direct and indirect principal investments and related unfunded commitments at June 30, 2019,2020, as well as financial support provided for the three and six months ended June 30, 2019,2020, and June 30, 2018.2019.
| | | | | | Financial support provided | | | Financial support provided |
| | | | Three months ended June 30, | | Six months ended June 30, | | | Three months ended June 30, | | Six months ended June 30, |
| | June 30, 2019 | | 2019 | | 2018 | | 2019 | | 2018 | June 30, 2020 | | 2020 | | 2019 | | 2020 | | 2019 |
| in millions | Fair Value | Unfunded Commitments | | Funded Commitments | Funded Other | | Funded Commitments | Funded Other | | Funded Commitments | Funded Other | | Funded Commitments | Funded Other | Fair Value | Unfunded Commitments | | Funded Commitments | Funded Other | | Funded Commitments | Funded Other | | Funded Commitments | Funded Other | | Funded Commitments | Funded Other |
| INVESTMENT TYPE | | | | | | | | | | | | | | | | | | | | | | |
| Direct investments | $ | 1 |
| — |
| | — |
| $ | — |
| | — |
| — |
| | — |
| — |
| | — |
| — |
| $ | 1 |
| — |
| | — |
| $ | — |
| | — |
| — |
| | — |
| — |
| | — |
| — |
|
Indirect investments (measured at NAV) (a) | 76 |
| $ | 24 |
| | $ | — |
| — |
| | — |
| — |
| | $ | 2 |
| — |
| | $ | 1 |
| — |
| 56 |
| $ | 18 |
| | $ | — |
| — |
| | — |
| — |
| | $ | — |
| — |
| | $ | 2 |
| — |
|
| Total | $ | 77 |
| $ | 24 |
| | — |
| $ | — |
| | — |
| — |
| | $ | 2 |
| — |
| | $ | 1 |
| — |
| $ | 57 |
| $ | 18 |
| | — |
| $ | — |
| | — |
| — |
| | $ | — |
| — |
| | $ | 2 |
| — |
|
| | | | | | | | | | | | | | | | | | | | | | | |
| |
| (a) | Our indirect investments consist of buyout funds, venture capital funds, and fund of funds. These investments are generally not redeemable. Instead, distributions are received through the liquidation of the underlying investments of the fund. An investment in any one of these funds typically can be sold only with the approval of the fund’s general partners. At June 30, 2019,2020, no significant liquidation of the underlying investments has been communicated to Key. The purpose of funding our capital commitments to these investments is to allow the funds to make additional follow-on investments and pay fund expenses until the fund dissolves. We, and all other investors in the fund, are obligated to fund the full amount of our respective capital commitments to the fund based on our and their respective ownership percentages, as noted in the applicable Limited Partnership Agreement. |
|
| | |
| Asset/liability class | Valuation technique | Valuation hierarchy classification(s) |
| Other direct equity investments | Fair value is determined using: • Discounted cash flows • Operating performance and market/exit multiples of comparable businesses • Other unique facts and circumstances related to each individual investment For levelLevel 3 securities, increases (decreases) in the discount rate and marketability discount used in the discounted cash flow models would have resulted in lower (higher) fair value measurements. Higher volatility factors would have further magnified changes in fair value. Level 2 investments reflect the price of recent investments, which is deemed representative of fair value. | Level 2 and 3 |
| Other direct and indirect equity investments (NAV) | Certain direct investments do not have readily determinable fair values and qualify for the practical expedient in the accounting guidance that allows us to estimate fair value based upon net asset value per share. | NAV |
| Loans held for sale and held for investment (residential) | Residential mortgage loans held for sale are accounted for at fair value. The election of the fair value option aligns the accounting for these assets with the related forward loan sale commitments. Fair values are based on: • Quoted market prices, where available • Prices for other traded mortgage loans with similar characteristics • Purchase commitments and bid information received from market participants Prices are adjusted as necessary to include: • The embedded servicing value in the loans • The specific characteristics of certain loans that are priced based on the pricing of similar loans. (These adjustments represent unobservable inputs to the valuation but are not considered significant given the relative insensitivity of the value to changes in these inputs to the fair value of the loans.) Residential loans held for investment: Certain residential loans held for sale contain salability exceptions that make them unable to be sold into the performing loan sales market. Loans in this category are transferred to the held to maturity loan portfolio and are included in “Loans, net of unearned income” on the balance sheet. This type of loan is classified as levelLevel 3 in the valuation hierarchy as transaction details regarding sales of this type of loan are often unavailable. Fair value is based upon: • Unobservable bid information from brokers and investors Higher (lower) unobservable bid information would have resulted in higher (lower) fair value measurements. | Level 1, 2 and 3 (primarily levelLevel 2) |
|
| | |
| Asset/liability class | Valuation technique | Valuation hierarchy classification(s) |
| Derivatives | Exchange-traded derivatives are valued using quoted prices in active markets and, therefore, are classified as Level 1 instruments.
The majority of our derivative positions are levelLevel 2 and are valued using internally developed models based on market convention and observable market inputs. These derivative contracts include interest rate swaps, certain options, floors, cross currency swaps, credit default swaps, and forward mortgage loan sale commitments. Significant inputs used in the valuation models include: • Interest rate curves • Yield curves
• LIBOR and Overnight Index Swap (OIS) discount rates
• LIBOR and OIS curves, index pricing curves, foreign currency curves
• Volatility surfaces (a three-dimensional graph of implied volatility against strike price and maturity) | Level 1, 2, and 3 (primarily level 2) |
|
| | |
Asset/liability class | Valuation technique | Valuation hierarchy classification(s) |
Derivatives (continued) | We have several customized derivative instruments and risk participations that are classified as Level 3 instruments. These derivative positions are valued using internally developed models, with inputs consisting of available market data, such as:including:
• BondCredit spreads and asset valuesinterest rates
The unobservable internally derived assumptions include:
• Loss probabilitiesgiven default
• Internal risk ratingsassessments of customers
The fair value represents an estimate of the amount that the risk participation counterparty would need to pay/receive as of the measurement date based on the probability of customer default on the swap transaction and the fair value of the underlying customer swap. Therefore, for sold risk participation agreements, a higher (lower) loss probabilitiesprobability and internal risk ratings would have resulted in a lower (higher)credit rating would negatively affect the fair value measurementof the risk participations and a lower loss probability and higher credit rating would positively affect the fair value of the risk participations. A directionally similar change(For purchased risk participation agreements, higher loss probabilities and lower credit ratings would have also applied to other customized derivative instruments classified as Level 3.positively affect the fair value.)
We use interest rate lock commitments for our residential mortgage business, which are classified as Level 3 instruments. The significant components of the valuation model include: • Interest rates observable in the market
• Investor supplied prices for similar securities
• The probability of the loan closing (i.e. the "pull-through" amount, a significant unobservable input). Increases (decreases) in the probability of the loan closing would have resulted in higher (lower) fair value measurements. Valuation of residential mortgage forward sale commitments utilizes observable market prices of comparable commitments and mortgage securities (Level 2). | Level 1, 2, and 3 (primarily levelLevel 2) |
| Liability for short positions | This includes fixed income securities held by our broker dealer in its trading inventory. Fair value of levelLevel 1 securities is determined by: • Quoted market prices available in an active market for identical securities Fair value of levelLevel 2 securities is determined by: • Observable market prices of similar securities • Market activity, spreads, credit ratings and interest rates for each security type | Level 1 and 2 |
Changes in Level 3 Fair Value Measurements
The following table shows the components of the change in the fair values of our Level 3 financial instruments measured at fair value on a recurring basis for the three and six months ended June 30, 2019,2020, and June 30, 2018. 2019.
| | | in millions | Beginning of Period Balance | Gains (Losses) Included in Other Comprehensive Income | Gains (Losses) Included in Earnings | Purchases | Sales | Settlements | Transfers Other | Transfers into Level 3 | Transfers out of Level 3 | End of Period Balance | Unrealized Gains (Losses) Included in Earnings | Beginning of Period Balance | Gains (Losses) Included in Other Comprehensive Income | Gains (Losses) Included in Earnings | Purchases | Sales | Settlements | Transfers Other | Transfers into Level 3 | Transfers out of Level 3 | End of Period Balance | Unrealized Gains (Losses) Included in Earnings |
| Six months ended June 30, 2019 | | | | | | | | | | |
| Six months ended June 30, 2020 | | | | | | | | | | | | |
| Trading account assets | | | | | | | | | | | | |
| Other mortgage-backed securities | | — |
| — |
| — |
| | — |
| — |
| — |
| — |
| $ | 36 |
| (d) | — |
| | $ | 36 |
| — |
| |
| Securities available for sale | | | | | | | | | | | | | | | | | | | | |
| Other securities | $ | 20 |
| $ | 15 |
| — |
| | — |
| — |
| — |
| — |
| — |
| | (24 | ) | | $ | 11 |
| — |
| | $ | 11 |
| $ | 1 |
| — |
| | — |
| — |
| — |
| — |
| — |
| | — |
| | 12 |
| — |
| |
| Other investments | | | | | | | | | | | | | | | | | | | | |
| Principal investments | | | | | | | | | | | | | | | | | | | | |
| Direct | 1 |
| — |
| — |
| | $ | — |
| $ | — |
| — |
| — |
| — |
| | — |
| | 1 |
| — |
| | 1 |
| — |
| — |
| | — |
| — |
| — |
| — |
| — |
| | — |
| | 1 |
| — |
| |
| Equity investments | | | | | | | | | | | | | | | | | | | | |
| Direct | 7 |
| — |
| (1 | ) | | — |
| — |
| — |
| — |
| $ | 1 |
| | — |
| | 7 |
| — |
| | 12 |
| — |
| — |
| | — |
| — |
| — |
| — |
| $ | — |
| | — |
| | 12 |
| — |
| |
| Loans held for sale (residential) | — |
| — |
| — |
| | — |
| (1 | ) | — |
| $ | 1 |
| — |
| | — |
| | — |
| — |
| | — |
| — |
| — |
| | — |
| $ | (10 | ) | — |
| $ | 10 |
| — |
| | — |
| | — |
| — |
| |
| Loans, net of unearned income (residential) | 3 |
| — |
| — |
| | — |
| — |
| — |
| — |
| — |
| | — |
| | 3 |
| — |
| | 4 |
| — |
| — |
| | — |
| (1 | ) | — |
| 2 |
| — |
| | — |
| | 5 |
| — |
| |
Derivative instruments (b) | | | | | | | | | | | | | | | | | | | | |
| Interest rate | 5 |
| — |
| $ | 3 |
| (c) | — |
| — |
| — |
| — |
| 2 |
| (d) | $ | (6 | ) | (d) | 4 |
| — |
| | 22 |
| — |
| $ | 22 |
| (c) | $ | 11 |
| (1 | ) | — |
| — |
| 62 |
| (d) | $ | (64 | ) | (d) | 52 |
| — |
| |
| Credit | — |
| — |
| — |
| | (1 | ) | — |
| — |
| — |
| — |
| | — |
| | (1 | ) | — |
| | (8 | ) | — |
| (10 | ) | (c) | 1 |
| — |
| — |
| — |
| — |
| | — |
| | (17 | ) | — |
| |
Other (e) | 3 |
| — |
| — |
| | — |
| — |
| — |
| 3 |
| — |
| | — |
| | 6 |
| — |
| | 5 |
| — |
| — |
| | — |
| — |
| — |
| 41 |
| — |
| | — |
| | 46 |
| — |
| |
| Three months ended June 30, 2019 | | | | | | | | | | |
| Three months ended June 30, 2020 | | | | | | | | | | | | |
| Trading account assets | | | | | | | | | | | | |
| Other mortgage-backed securities | | — |
| — |
| — |
| | — |
| — |
| — |
| — |
| $ | 36 |
| (d) | — |
| | $ | 36 |
| — |
| |
| Securities available for sale | | | | | | | | | | | | | | | | | | | | |
| Other securities | $ | 25 |
| $ | 10 |
| — |
| | — |
| — |
| — |
| — |
| — |
| | $ | (24 | ) | | $ | 11 |
| — |
| | $ | 9 |
| $ | 3 |
| — |
| | — |
| — |
| — |
| — |
| — |
| | — |
| | 12 |
| — |
| |
| Other investments | | | | | | | | | | | | | | | | | | | | |
| Principal investments | | | | | | | | | | | | | | | | | | | | |
| Direct | 1 |
| — |
| $ | — |
| | (1 | ) | 1 |
| — |
| — |
| — |
| | — |
| | 1 |
| — |
| | 1 |
| — |
| — |
| | — |
| — |
| — |
| — |
| — |
| | — |
| | 1 |
| — |
| |
| Other indirect | — |
| — |
| — |
| | — |
| — |
| — |
| — |
| — |
| | — |
| | — |
| — |
| | |
| Equity investments | | | | | | | | | | | | | | | | | | | | |
| Direct | 8 |
| — |
| (1 | ) | | — |
| — |
| — |
| — |
| — |
| | — |
| | 7 |
| — |
| | 10 |
| — |
| $ | 2 |
| (a) | — |
| — |
| — |
| — |
| — |
| | — |
| | 12 |
| 2 |
| (a) |
| Loans held for sale (residential) | 1 |
| — |
| — |
| | — |
| (1 | ) | — |
| — |
| — |
| | — |
| | — |
| — |
| | 10 |
| — |
| — |
| | — |
| $ | (10 | ) | — |
| — |
| — |
| | — |
| | — |
| — |
| |
| Loans, net of unearned income (residential) | 3 |
| — |
| — |
| | — |
| — |
| — |
| — |
| — |
| | — |
| | 3 |
| — |
| | 3 |
| — |
| — |
| | — |
| — |
| — |
| $ | 2 |
| — |
| | — |
| | 5 |
| — |
| |
Derivative instruments (b) | | | | | | | | | | | | | | | | | | | | |
| Interest rate | 3 |
| — |
| 2 |
| (c) | — |
| — |
| — |
| — |
| — |
| (d) | (1 | ) | (d) | 4 |
| — |
| | 96 |
| — |
| 3 |
| (c) | — |
| — |
| — |
| — |
| 7 |
| (d) | $ | (54 | ) | (d) | 52 |
| — |
| |
| Credit | (1 | ) | — |
| — |
| | — |
| — |
| $ | — |
| — |
| — |
| | — |
| | (1 | ) | — |
| | (23 | ) | — |
| 6 |
| (c) | — |
|
|
| — |
| — |
| — |
| |
|
| | (17 | ) | — |
| |
Other (e) | 4 |
| — |
| — |
| | — |
| — |
| — |
| 2 |
| — |
| | — |
| | 6 |
| — |
| | 23 |
| — |
| — |
| | — |
| — |
| — |
| 23 |
| — |
| | — |
| | 46 |
| — |
| |
| | | in millions | Beginning of Period Balance | Gains (Losses) Included in Other Comprehensive Income | Gains (Losses) Included in Earnings | Purchases | Sales | Settlements | Transfers Other | Transfers into Level 3 | Transfers out of Level 3 | End of Period Balance | Unrealized Gains (Losses) Included in Earnings | Beginning of Period Balance | Gains (Losses) Included in Other Comprehensive Income | Gains (Losses) Included in Earnings | Purchases | Sales | Settlements | Transfers Other | Transfers into Level 3 | Transfers out of Level 3 | End of Period Balance | Unrealized Gains (Losses) Included in Earnings |
| Six months ended June 30, 2018 | | | | | | | | | | | |
| Six months ended June 30, 2019 | | | | | | | | |
| Securities available for sale | | | | | | | | |
| Other securities | | $ | 20 |
| $ | 15 |
| — |
| | — |
| — |
| — |
| — |
| — |
| | $ | (24 | ) | | $ | 11 |
| — |
|
| Other investments | | | | | | | | |
| Principal investments | | | | | | | | |
Direct (a) | | 1 |
| — |
| — |
| | — |
| — |
| — |
| — |
| — |
| | — |
| | 1 |
| — |
|
| Equity investments | | | | | | | | |
| Direct | | 7 |
| — |
| $ | (1 | ) | (a) | — |
| — |
| — |
| — |
| $ | 1 |
| | — |
| | 7 |
| (1 | ) |
| Loans held for sale (residential) | | — |
| — |
| — |
| | — |
| $ | (1 | ) | — |
| $ | 1 |
| — |
| | — |
| | — |
| — |
|
| Loans, net of unearned income (residential) | | 3 |
| — |
| — |
| | — |
| — |
| — |
| — |
| — |
| | — |
| | 3 |
| — |
|
Derivative instruments (b) | | | | | | | | |
| Interest rate | | 5 |
| — |
| 3 |
| (c) | — |
| — |
| — |
| — |
| 2 |
| (d) | (6 | ) | (d) | 4 |
| — |
|
| Credit | | — |
| — |
| — |
| | $ | (1 | ) | — |
| — |
| — |
| — |
| | — |
| | (1 | ) | — |
|
Other (e) | | 3 |
| — |
| — |
| | — |
| — |
| — |
| 3 |
| — |
| | — |
| | 6 |
| — |
|
| Three months ended June 30, 2019 | | | | | | | | |
| Securities available for sale | | | | | | | | | | | | | | | | | |
| Other securities | $ | 20 |
| — |
| — |
| | — |
| — |
| — |
| — |
| — |
| | — |
| | $ | 20 |
| — |
| | $ | 25 |
| $ | 10 |
| — |
| | — |
| — |
| — |
| — |
| — |
| | $ | (24 | ) | | $ | 11 |
| — |
|
| Other investments | | | | | | | | | | | | | | | | | |
| Principal investments | | | | | | | | | | | | | | | | | |
| Direct | 13 |
| — |
| — |
| | $ | 1 |
| $ | (1 | ) | — |
| — |
| — |
| | — |
| | 13 |
| $ | 1 |
| (a) | 1 |
| — |
| — |
| | $ | (1 | ) | $ | 1 |
| — |
| — |
| — |
| | — |
| | 1 |
| $ | — |
|
| Equity investments | | | | | | | | | | | | | | | | | |
| Direct | 3 |
| — |
| — |
| | — |
| — |
| — |
| — |
| $ | 4 |
| | — |
| | 7 |
| — |
| | 8 |
| — |
| $ | (1 | ) | (a) | — |
| — |
| — |
| — |
| — |
| | — |
| | 7 |
| (1 | ) |
| Loans held for sale (residential) | 1 |
| — |
| — |
| | — |
| (1 | ) | — |
| — |
| — |
| | — |
| | — |
| — |
| | 1 |
| — |
| — |
| | — |
| (1 | ) | — |
| — |
| — |
| | — |
| | — |
| — |
|
| Loans, net of unearned income (residential) | 2 |
| — |
| — |
| | — |
| — |
| — |
| $ | 1 |
| — |
| | — |
| | 3 |
| — |
| | 3 |
| — |
| — |
| | — |
| — |
| — |
| — |
| — |
| | — |
| | 3 |
| — |
|
Derivative instruments (b) | | | | | | | | | | | | | | | | | |
| Interest rate | 9 |
| — |
| $ | (2 | ) | (c) | 1 |
| (2 | ) | — |
| — |
| 4 |
| (d) | $ | (5 | ) | (d) | 5 |
| — |
| | 3 |
| — |
| 2 |
| (c) | — |
| — |
| — |
| — |
| $ | — |
| | (1 | ) | (d) | 4 |
| — |
|
| Credit | 1 |
| — |
| (20 | ) | (c) | — |
| — |
| $ | 10 |
| — |
| — |
| | — |
| | (9 | ) | — |
| | (1 | ) | — |
| — |
| | — |
| — |
| $ | — |
| — |
| — |
| | — |
| | (1 | ) | — |
|
Other (e) | 3 |
| — |
| — |
| | — |
| — |
| — |
| $ | — |
| — |
| | — |
| | 3 |
| — |
| | 4 |
| — |
| — |
| | — |
| — |
| — |
| 2 |
| — |
| | — |
| | 6 |
| — |
|
| Three months ended June 30, 2018 | | | | | | | | | | | |
| Securities available for sale | | | | | | | | | | | |
| Other securities | $ | 20 |
| — |
| — |
| | — |
| — |
| — |
| — |
| — |
| | — |
| | $ | 20 |
| — |
| | |
| Other investments | | | | | | | | | | | |
| Principal investments | | | | | | | | | | | |
| Direct | 12 |
| — |
| $ | 1 |
| (a) | $ | 1 |
| $ | (1 | ) | — |
| — |
| — |
| | — |
| | 13 |
| $ | 2 |
| (a) | |
| Equity investments | | | | | | | | | | | |
| Direct | 7 |
| — |
| — |
| | — |
| — |
| — |
| — |
| — |
| | — |
| | 7 |
| — |
| | |
| Loans held for sale (residential) | 1 |
| — |
| — |
| | — |
| (1 | ) | — |
| — |
| — |
| | — |
| | — |
| — |
| | |
| Loans, net of unearned income (residential) | 2 |
| — |
| — |
| | — |
| — |
| — |
| $ | 1 |
| — |
| | — |
| | 3 |
| — |
| | |
Derivative instruments (b) | | | | | | | | | | | |
| Interest rate | 4 |
| — |
| (1 | ) | (c) | — |
| (2 | ) | — |
| — |
| $ | 4 |
| (d) | — |
| | 5 |
| — |
| | |
| Credit | — |
| — |
| (15 | ) | (c) | — |
| — |
| $ | 6 |
| — |
| — |
| | — |
| | (9 | ) | — |
| | |
Other (e) | 3 |
| — |
| — |
| | — |
| — |
| — |
| — |
| — |
| | — |
| | 3 |
| — |
| | |
| |
| (a) | Realized and unrealized gains and losses on principal investments and other equity investments are reported in “other income” on the income statement. |
| |
| (b) | Amounts represent Level 3 derivative assets less Level 3 derivative liabilities. |
| |
| (c) | Realized and unrealized gains and losses on derivative instruments are reported in “corporate services income” and “other income” on the income statement. |
| |
| (d) | Certain trading account assets and derivatives previously classified as Level 2 were transferred to Level 3 because Level 3 unobservable inputs became significant. Certain derivatives previously classified as Level 3 were transferred to Level 2 because Level 3 unobservable inputs became less significant. |
| |
| (e) | Amounts represent Level 3 interest rate lock commitments. |
Assets and Liabilities Measured at Fair Value on a Nonrecurring Basis
Certain assets and liabilities are measured at fair value on a nonrecurring basis in accordance with GAAP. The adjustments to fair value generally result from the application of accounting guidance that requires assets and liabilities to be recorded at the lower of cost or fair value, or assessed for impairment. There were no0 liabilities measured at fair value on a nonrecurring basis at June 30, 2019,2020, and December 31, 2018.2019.
The following table presents our assets measured at fair value on a nonrecurring basis at June 30, 2019,2020, and December 31, 2018:2019:
| | | | June 30, 2019 | | December 31, 2018 | June 30, 2020 | | December 31, 2019 |
| in millions | Level 1 | Level 2 | Level 3 | Total | | Level 1 | Level 2 | Level 3 | Total | Level 1 | Level 2 | Level 3 | Total | | Level 1 | Level 2 | Level 3 | Total |
| ASSETS MEASURED ON A NONRECURRING BASIS | | | | | | | | | | |
| Impaired loans and leases | — |
| $ | — |
| $ | 57 |
| $ | 57 |
| | — |
| — |
| $ | 42 |
| $ | 42 |
| |
| Collateral-dependent loans | | — |
| $ | — |
| $ | 135 |
| $ | 135 |
| | — |
| — |
| $ | 76 |
| $ | 76 |
|
| Accrued income and other assets | — |
| — |
| 21 |
| 21 |
| | — |
| — |
| 16 |
| 16 |
| — |
| — |
| 91 |
| 91 |
| | — |
| $ | 118 |
| 51 |
| 169 |
|
| Total assets on a nonrecurring basis at fair value | — |
| $ | — |
| $ | 78 |
| $ | 78 |
| | — |
| — |
| $ | 58 |
| $ | 58 |
| — |
| $ | — |
| $ | 226 |
| $ | 226 |
| | — |
| $ | 118 |
| $ | 127 |
| $ | 245 |
|
| | | | | | | | | | | |
Qualitative Disclosures of Valuation Techniques
The following table describes the valuation techniques and significant inputs used to measure the significant classes of assets and liabilities reported at fair value on a nonrecurring basis, as well as the classification of each within the valuation hierarchy.
|
| | |
| Asset/liability class | Valuation technique | Valuation hierarchy classification(s) |
ImpairedCollateral-dependent loans and leases
| Loans are evaluated for impairment onWhen a quarterly basis; impairment typically occurs when thereloan is evidence of a probable loss andcollateral-dependent, the expectedfair value of the loan is less than the contractual value of the loan. The amount of the impairment may be determined based on the estimated present value of future cash flows, the fair value of the underlying collateral (Level 3), or the loan’s observable market price based on recent sales of similar loans and collateral (Level 2).
Cash flow analysis considers internally developed inputs including:
• Discount rates
• Default rates
• Changes in collateral values and costs of foreclosure
collateral. | Level 2 and 3 |
Commercial loans held for sale and student loans held for sale | Through a quarterly analysis of our loan portfolios held for sale, which include both performing and nonperforming commercial loans and student loans, we determine any adjustments necessary to record the portfolios at the lower of cost or fair value in accordance with GAAP. Valuation inputs include:
• Non-binding bids for the respective loans or similar loans
• Recent sales transactions
• Internal models that emulate recent securitizations | Level 2 and 3 |
| Direct financing leases and operating lease assets held for sale | Valuations of direct financing leases and operating lease assets held for sale are performed using an internal model that relies on market data, including:
• Swap rates and bond ratings • Our own assumptions about the exit market for the leases • Details about the individual leases in the portfolio Leases for which we receive a current nonbinding bid, and for which the sale is considered probable, may be classified as Level 2. Valuations of lease and operating lease assets held for sale that employ our own assumptions are classified as Level 3 assets. The inputs based on our own assumptions include changes in the value of leased items and internal credit ratings. | Level 2 and 3 |
OREO, other repossessed personal property, and right-of-use assets(a) | OREO, other repossessed properties, and right-of-use assets are valued based on:
• Appraisals and third-party price opinions, less estimated selling costs
Generally, we classify these assets as Level 3, but OREO and other repossessed properties for which we receive binding purchase agreements are classified as Level 2. Returned lease inventory is valued based on market data for similar assets and is classified as Level 2. | Level 2 and 3 |
|
| | |
| Asset/liability class | Valuation technique | Valuation hierarchy classification(s) |
LIHTC, HTC, and NMTC investments(a) | Valuation of LIHTC, HTC and NMTC involves measuring the present value of future tax benefits and comparing that value against the current carrying value of the investment. Expected future tax benefits are discounted to their present value using discounted cash flow modeling that incorporates an appropriate risk premium. LIHTC and HTC investments are impaired when it is more likely than not that the carrying amount of the investment will not be realized. | Level 3 |
| Other equity investments | We have other investments in equity securities that do not have readily determinable fair values and do not qualify for the practical expedient to measure the investment using a net asset value per share. We have elected to measure these securities at cost less impairment plus or minus adjustments due to observable orderly transactions.
Impairment is recorded when there is evidence that the expected fair value of the investment has declined to below the recorded cost. At each reporting period, we assess if these investments continue to qualify for this measurement alternative.
At June 30, 2019,2020, and December 31, 2018,2019, the carrying amount of equity investments under this method was $139$147 million and $107$134 million, respectively. No impairment was recorded for the three or six months ended June 30, 2019. 2020. | Level 3 |
Mortgage Servicing RightsAssets(a) | Refer to Note 8. Mortgage Servicing Assets | Level 3 |
| |
| (a) | Asset classes included in “Accrued income and other assets” on the Consolidated Balance Sheets |
Quantitative Information about Level 3 Fair Value Measurements
The following table describesrange and weighted-average of the significant unobservable inputs ofused to fair value our levelmaterial Level 3
recurring and nonrecurring assets at June 30, 2020, and liabilities:December 31, 2019, along with the valuation
techniques used, are shown in the following table:
| | | June 30, 2019 | Level 3 Asset (Liability) | Valuation Technique | Significant Unobservable Input | Range (Weighted-Average) (b), (c) | |
| | Level 3 Asset (Liability) | Valuation Technique | Significant Unobservable Input | Range (Weighted-Average) (b), (c) |
dollars in millions | Level 3 Asset (Liability) | Valuation Technique | Significant Unobservable Input | Range (Weighted-Average) (b), (c) | June 30, 2020 | December 31, 2019 | June 30, 2020 | December 31, 2019 |
| Recurring | | | | |
| Trading account assets: | | | | |
| Other mortgage-backed securities | | $ | 36 |
| $ | — |
| Discounted cash flows | Discount rate | 2.37% - 5.82% (3.05%) | N/A |
| | | | | Conditional prepayment rate | 8.5 - 14.0 (10.65) | N/A |
| | | | | Constant default rate | 0.5 - 2 (1.13) | N/A |
| | | | | Loss severity | 50 - 70% (55.70%) | N/A |
| Securities available-for-sale: | | | | |
| Other securities | $ | 11 |
| Discounted cash flows | Discount rate | N/A (15.95%) | $ | 12 |
| 11 |
| Discounted cash flows | Discount rate | N/A (15.09%) | N/A (16.10%) |
| | | | Marketability discount | N/A (30.00%) | | | Marketability discount | N/A (30.00%) | N/A (30.00%) |
| | | | Volatility factor | N/A (38.00%) | | | Volatility factor | N/A (44.00%) | N/A (43.00%) |
Other investments:(a) | | | | |
| Equity investments | | | | |
| Direct | 7 |
| Discounted cash flows | Discount rate | 14.81 - 16.78% (15.06%) | 12 |
| 12 |
| Discounted cash flows | Discount rate | 13.48 - 16.88% (15.14%) | 13.91 - 17.24% (15.61%) |
| | | | Marketability discount | N/A (30.00%) | | | Marketability discount | N/A (30.00%) | N/A (30.00%) |
| | | | Volatility factor | N/A (49.00%) | | | Volatility factor | N/A (55.00%) | N/A (47.00%) |
| Loans, net of unearned income (residential) | 3 |
| Market comparable pricing | Comparability factor | 78.57 - 95.75% (90.40%) | 5 |
| 4 |
| Market comparable pricing | Comparability factor | 79.00-98.16% (90.80%) | 79.00 - 98.00% (91.05%) |
| Derivative instruments: | | | | |
| Interest rate | 4 |
| Discounted cash flows | Probability of default | .02 - 100% (2.10%) | 52 |
| 22 |
| Discounted cash flows | Probability of default | .02 - 100% (11.20%) | .02 - 100% (5.40%) |
| | | | Internal risk rating | 1 - 19 (9.021) | | | Internal risk rating | 1 - 19 (9.359) | 1 - 19 (9.168) |
| | | | Loss given default | 0 - 1 (.492) | | | Loss given default | 0 - 1 (.478) | 0 - 1 (.492) |
| Credit | (1 | ) | Discounted cash flows | Probability of default | .02 - 100% (2.36%) | |
| Credit (assets) | | 3 |
| 1 |
| Discounted cash flows | Probability of default | .02 - 100% (9.20%) | .02 - 100% (4.2%) |
| | | | | Internal risk rating | 1 - 19 (10.32) | 1 - 19 (10.13) |
| | | | | Loss given default | 0 - 1 (.491) | 0 - 1 (.498) |
| Credit (liabilities) | | (20 | ) | (9 | ) | Discounted cash flows | Probability of default | .02 - 100% (19.33%) | .02 - 100% (12.24%) |
| | | | Internal risk rating | 1 - 19 (9.134) | | | Internal risk rating | 1 - 19 (7.73) | 1 - 19 (8.058) |
| | | | Loss given default | 0 - 1 (.50) | | | Loss given default | 0 - 1 (.393) | 0 - 1 (.411) |
Other(d) | 6 |
| Discounted cash flows | Loan closing rates | 36.70 - 99.15% (74.62%) | 46 |
| 5 |
| Discounted cash flows | Loan closing rates | 33.78 - 99.70 % (75.74%) | 37.71 - 99.69% (79.33%) |
| Nonrecurring | | | | | | | |
| Impaired loans | $ | 57 |
| Fair value of underlying collateral | Discount rate | 0 - 80.00% (17.00%) | |
| Collateral-dependent loans | | 135 |
| 76 |
| Fair value of collateral | Discount rate | 0 - 55.00% (23.00%) | 0 - 60.00% (10.00%) |
| Accrued income and other assets: | | | | |
OREO and other Level 3 assets(e) | $ | 18 |
| Appraised value | Appraised value | N/M | 2 |
| 5 |
| Appraised value | N/M | N/M |
|
| | | | | | |
| December 31, 2018 | Level 3 Asset (Liability) | Valuation Technique | Significant Unobservable Input | Range (Weighted-Average(b)(c)) |
dollars in millions |
| Nonrecurring | | | | |
| Impaired loans | $ | 42 |
| Fair value of underlying collateral | Discount rate | 20.00 - 40.00% (21.00%) |
| |
| (a) | Principal investments, direct is excluded from this table as the balance at June 30, 2020, and December 31, 2019, is insignificant (less than $1 million). |
| |
| (b) | The weighted average of significant unobservable inputs is calculated using a weighting relative to fair value. |
| |
| (c) | For significant unobservable inputs with no range, a single figure is reported to denote the single quantitative factor used. |
| |
| (d) | Amounts represent interest rate lock commitments. |
| |
| (e) | Excludes balances$89 million and $46 million pertaining to mortgage servicing assets.assets at June 30, 2020 and December 31, 2019. Refer to Note 9. 8 (“Mortgage Servicing AssetsAssets”) for significant unobservable inputs pertaining to these assets. |
Fair Value Disclosures of Financial Instruments
The levelsLevels in the fair value hierarchy ascribed to our financial instruments and the related carrying amounts at June 30, 2019,2020, and December 31, 2018,2019, are shown in the following tables. Assets and liabilities are further arranged by measurement category.
| | | | June 30, 2019 | June 30, 2020 |
| | | Fair Value | | Fair Value |
| in millions | Carrying Amount | Level 1 | Level 2 | Level 3 | Measured at NAV | Netting Adjustment | | Total | Carrying Amount | Level 1 | Level 2 | Level 3 | Measured at NAV | Netting Adjustment | | Total |
| ASSETS (by measurement category) | | | | | | |
| Fair value - net income | | | | | | |
Trading account assets (b) | $ | 1,005 |
| $ | — |
| $ | 1,005 |
| — |
| — |
| — |
| | $ | 1,005 |
| $ | 645 |
| $ | — |
| $ | 609 |
| $ | 36 |
| — |
| — |
| | $ | 645 |
|
Other investments (b) | 632 |
| — |
| — |
| $ | 547 |
| $ | 85 |
| — |
| | 632 |
| 655 |
| — |
| — |
| 590 |
| $ | 65 |
| — |
| | 655 |
|
Loans, net of unearned income (residential) (d) | 3 |
| — |
| — |
| 3 |
| — |
| — |
| | 3 |
| 5 |
| — |
| — |
| 5 |
| — |
| — |
| | 5 |
|
Loans held for sale (residential) (b) | 164 |
| — |
| 164 |
| — |
| — |
| — |
| | 164 |
| 250 |
| — |
| 250 |
| — |
| — |
| — |
| | 250 |
|
Derivative assets - trading (b) | 715 |
| 41 |
| 1,065 |
| 11 |
| — |
| $ | (402 | ) | (f) | 715 |
| 1,974 |
| 79 |
| 2,433 |
| 101 |
| — |
| $ | (639 | ) | (f) | 1,974 |
|
| Fair value - OCI | | | | | | |
Securities available for sale (b) | 21,528 |
| — |
| 21,517 |
| $ | 11 |
| — |
| — |
| | 21,528 |
| 23,600 |
| — |
| 23,588 |
| $ | 12 |
| — |
| — |
| | 23,600 |
|
Derivative assets - hedging (b)(g) | 94 |
| — |
| 105 |
| — |
| — |
| (11 | ) | (f) | 94 |
| 119 |
| — |
| 89 |
| — |
| — |
| 30 |
| (f) | 119 |
|
| Amortized cost | | | | | | |
Held-to-maturity securities (c) | 10,878 |
| — |
| 10,899 |
| — |
| — |
| — |
| | 10,899 |
| 9,075 |
| — |
| 9,520 |
| — |
| — |
| — |
| | 9,520 |
|
Loans, net of unearned income (d) | 91,044 |
| — |
| — |
| 89,803 |
| — |
| — |
| | 89,803 |
| 104,446 |
| — |
| — |
| 102,765 |
| — |
| — |
| | 102,765 |
|
Loans held for sale (b) | 1,626 |
| — |
| — |
| 1,626 |
| — |
| — |
| | 1,626 |
| 1,757 |
| — |
| — |
| 1,757 |
| — |
| — |
| | 1,757 |
|
| Other | | | | | | |
Cash and short-term investments (a) | 3,050 |
| 3,050 |
| — |
| — |
| — |
| — |
| | 3,050 |
| 15,095 |
| 15,095 |
| — |
| — |
| — |
| — |
| | 15,095 |
|
| LIABILITIES (by measurement category) | | | | | | |
| Fair value - net income | | | | | | |
Derivative liabilities - trading (b) | $ | 216 |
| $ | 33 |
| $ | 490 |
| 1 |
| — |
| $ | (308 | ) | (f) | $ | 216 |
| $ | 309 |
| $ | 69 |
| $ | 845 |
| 20 |
| — |
| $ | (625 | ) | (f) | $ | 309 |
|
| Fair value - OCI | | | | | | |
Derivative liabilities - hedging (b)(g) | 1 |
| 2 |
| 10 |
| — |
| — |
| (11 | ) | (f) | 1 |
| 1 |
| — |
| 5 |
| — |
| — |
| (4 | ) | (f) | 1 |
|
| Amortized cost | | | | | | |
Time deposits (e) | 13,608 |
| — |
| 13,716 |
| — |
| — |
| — |
| | 13,716 |
| 8,487 |
| — |
| 8,540 |
| — |
| — |
| — |
| | 8,540 |
|
Short-term borrowings (a) | 881 |
| 7 |
| 874 |
| — |
| — |
| — |
| | 881 |
| 1,983 |
| 285 |
| 1,698 |
| — |
| — |
| — |
| | 1,983 |
|
Long-term debt (e) | 14,312 |
| 13,557 |
| 1,229 |
| — |
| — |
| — |
| | 14,786 |
| 13,734 |
| 13,870 |
| 731 |
| — |
| — |
| — |
| | 14,601 |
|
| Other | | | | | | |
Deposits with no stated maturity (a) | 96,338 |
| — |
| 96,338 |
| — |
| — |
| — |
| | 96,338 |
| 127,026 |
| — |
| 127,026 |
| — |
| — |
| — |
| | 127,026 |
|
| | | | December 31, 2018 | December 31, 2019 |
| | | Fair Value | | Fair Value |
| in millions | Carrying Amount | Level 1 | Level 2 | Level 3 | Measured at NAV | Netting Adjustment | | Total | Carrying Amount | Level 1 | Level 2 | Level 3 | Measured at NAV | Netting Adjustment | | Total |
| ASSETS (by measurement category) | | | | | | |
| Fair value - net income | | | | | | |
Trading account assets (b) | $ | 849 |
| — |
| $ | 849 |
| — |
| — |
| — |
| | $ | 849 |
| $ | 1,040 |
| — |
| $ | 1,040 |
| — |
| — |
| — |
| | $ | 1,040 |
|
Other investments (b) | 666 |
| — |
| 1 |
| $ | 559 |
| $ | 106 |
| — |
| | 666 |
| 605 |
| — |
| — |
| $ | 528 |
| $ | 77 |
| — |
| | 605 |
|
Loans, net of unearned income (residential) (d) | 3 |
| — |
| — |
| 3 |
| — |
| — |
| | 3 |
| 4 |
| — |
| — |
| 4 |
| — |
| — |
| | 4 |
|
Loans held for sale (residential) (b) | 54 |
| — |
| 54 |
| — |
| — |
| — |
| | 54 |
| 140 |
| — |
| 140 |
| — |
| — |
| — |
| | 140 |
|
Derivative assets - trading (b) | 462 |
| $ | 68 |
| 736 |
| 8 |
| — |
| $ | (350 | ) | (f) | 462 |
| 715 |
| $ | 49 |
| 985 |
| 28 |
| — |
| $ | (347 | ) | (f) | 715 |
|
| Fair value - OCI | | | | | | |
Securities available for sale (b) | 19,428 |
| — |
| 19,408 |
| 20 |
| — |
| — |
| | 19,428 |
| 21,843 |
| — |
| 21,832 |
| 11 |
| — |
| — |
| | 21,843 |
|
Derivative assets - hedging (b)(g) | 69 |
| 2 |
| 50 |
| — |
| — |
| 17 |
| (f) | 69 |
| 65 |
| — |
| 191 |
| — |
| — |
| (126 | ) | (f) | 65 |
|
| Amortized cost | | | | | | |
Held-to-maturity securities (c) | 11,519 |
| — |
| 11,122 |
| — |
| — |
| — |
| | 11,122 |
| 10,067 |
| — |
| 10,116 |
| — |
| — |
| — |
| | 10,116 |
|
Loans, net of unearned income (d) | 88,666 |
| — |
| — |
| 86,224 |
| — |
| — |
| | 86,224 |
| 93,742 |
| — |
| — |
| 92,641 |
| — |
| — |
| | 92,641 |
|
Loans held for sale (b) | 1,173 |
| — |
| — |
| 1,173 |
| — |
| — |
| | 1,173 |
| 1,194 |
| — |
| — |
| 1,194 |
| — |
| — |
| | 1,194 |
|
| Other | | | | | | |
Cash and short-term investments (a) | 3,240 |
| 3,240 |
| — |
| — |
| — |
| — |
| | 3,240 |
| 2,004 |
| 2,004 |
| — |
| — |
| — |
| — |
| | 2,004 |
|
| LIABILITIES (by measurement category) | | | | | | |
| Fair value - net income | | | | | | |
Derivative liabilities - trading (b) | $ | 395 |
| $ | 58 |
| $ | 675 |
| — |
| — |
| $ | (338 | ) | (f) | $ | 395 |
| $ | 194 |
| $ | 43 |
| $ | 461 |
| 9 |
| — |
| $ | (319 | ) | (f) | $ | 194 |
|
| Fair value - OCI | | | | | | |
Derivative liabilities - hedging (b)(g) | (9 | ) | — |
| (10 | ) | — |
| — |
| 1 |
| (f) | (9 | ) | 4 |
| — |
| 20 |
| — |
| — |
| (16 | ) | (f) | 4 |
|
| Amortized cost | | | | | | |
Time deposits (e) | 13,245 |
| — |
| 13,331 |
| — |
| — |
| — |
| | 13,331 |
| 11,652 |
| — |
| 11,752 |
| — |
| — |
| — |
| | 11,752 |
|
Short-term borrowings (a) | 863 |
| 14 |
| 849 |
| — |
| — |
| — |
| | 863 |
| 1,092 |
| 19 |
| 1,073 |
| — |
| — |
| — |
| | 1,092 |
|
Long-term debt (e) | 13,732 |
| 12,576 |
| 1,211 |
| — |
| — |
| — |
| | 13,787 |
| 12,448 |
| 12,694 |
| 249 |
| — |
| — |
| — |
| | 12,943 |
|
| Other | | | | | | |
Deposits with no stated maturity (a) | 94,064 |
| — |
| 94,064 |
| — |
| — |
| — |
| | 94,064 |
| 100,218 |
| — |
| 100,218 |
| — |
| — |
| — |
| | 100,218 |
|
Valuation Methods and Assumptions
| |
| (a) | Fair value equals or approximates carrying amount. The fair value of deposits with no stated maturity does not take into consideration the value ascribed to core deposit intangibles. |
| |
| (b) | Information pertaining to our methodology for measuring the fair values of these assets and liabilities is included in the sections entitled “Qualitative Disclosures of Valuation Techniques” and “Assets and Liabilities Measured at Fair Value on a Nonrecurring Basis” in this Note. Investments accounted for under the cost method (or cost less impairment adjusted for observable price changes for certain equity investments) are classified as Level 3 assets. These investments are not actively traded in an open market as sales for these types of investments are rare. The carrying amount of the investments carried at cost are adjusted for declines in value if they are considered to be other-than-temporary (or due to observable orderly transactions of the same issuer for equity investments eligible for the cost less impairment measurement alternative). These adjustments are included in “other income” on the income statement. |
| |
| (c) | Fair values of held-to-maturity securities are determined by using models that are based on security-specific details, as well as relevant industry and economic factors. The most significant of these inputs are quoted market prices, interest rate spreads on relevant benchmark securities, and certain prepayment assumptions. We review the valuations derived from the models to ensure that they are reasonable and consistent with the values placed on similar securities traded in the secondary markets. |
| |
| (d) | The fair value of loans is based on the present value of the expected cash flows. The projected cash flows are based on the contractual terms of the loans, adjusted for prepayments and use of a discount rate based on the relative risk of the cash flows, taking into account the loan type, maturity of the loan, liquidity risk, servicing costs, and a required return on debt and capital. In addition, an incremental liquidity discount is applied to certain loans, using historical sales of loans during periods of similar economic conditions as a benchmark. The fair value of loans includes lease financing receivables at their aggregate carrying amount, which is equivalent to their fair value. |
| |
| (e) | Fair values of time deposits and long-term debt are based on discounted cash flows utilizing relevant market inputs. |
| |
| (f) | Netting adjustments represent the amounts recorded to convert our derivative assets and liabilities from a gross basis to a net basis in accordance with the applicable accounting guidance. The net basis takes into account the impact of bilateral collateral and master netting agreements that allow us to settle all derivative contracts with a single counterparty on a net basis and to offset the net derivative position with the related cash collateral. Total derivative assets and liabilities include these netting adjustments. |
| |
| (g) | Derivative assets-hedging and derivative liabilities-hedging includes both cash flow and fair value hedges. Additional information regarding our accounting policies for cash flow and fair value hedges is provided in Note 1 (“1. Summary of Significant Accounting Policies”) under the heading “Derivatives and Hedging” beginning on page 103105 of our 20182019 Form 10-K. |
EducationDIscontinued assets — education lending business. Our discontinued assets include government-guaranteed and private education loans originated through our education lending business that was discontinued in September 2009. This portfolio consists of loans recorded at carrying value with appropriate valuation reserves, and loans in portfolio recorded at fair value. All of these loans were excluded from the table above as follows:
Loans at carrying value, net of allowance, of $1.0 billion$737 million ($809608 million at fair value) at June 30, 2019,2020, and $1.1 billion$855 million ($890729 million at fair value) at December 31, 2018;2019;
Portfolio loans at fair value of $2 million at June 30, 2019,2020, and $2 million at December 31, 2018.2019.
These loans and securities are classified as Level 3 because we rely on unobservable inputs when determining fair value since observable market data is not available.
6. Securities
The amortized cost, unrealized gains and losses, and approximate fair value of our securities available for sale and held-to-maturity securities are presented in the following tables. Gross unrealized gains and losses represent the difference between the amortized cost and the fair value of securities on the balance sheet as of the dates indicated. Accordingly, the amount of these gains and losses may change in the future as market conditions change.
| | | | June 30, 2019 | | December 31, 2018 | June 30, 2020 | | December 31, 2019 |
| in millions | Amortized Cost | Gross Unrealized Gains | Gross Unrealized Losses | Fair Value | | Amortized Cost | Gross Unrealized Gains | Gross Unrealized Losses | Fair Value | Amortized Cost (a) | Gross Unrealized Gains | Gross Unrealized Losses | Fair Value | | Amortized Cost | Gross Unrealized Gains | Gross Unrealized Losses | Fair Value |
| SECURITIES AVAILABLE FOR SALE | | | | | | |
| U.S. Treasury, agencies, and corporations | $ | 272 |
| — |
| — |
| $ | 272 |
| | $ | 150 |
| — |
| $ | 3 |
| $ | 147 |
| $ | 3,465 |
| — |
| — |
| $ | 3,465 |
| | $ | 334 |
| — |
| — |
| $ | 334 |
|
| States and political subdivisions | 5 |
| — |
| — |
| 5 |
| | 7 |
| — |
| — |
| 7 |
| 3 |
| $ | 1 |
| — |
| 4 |
| | 4 |
| — |
| — |
| 4 |
|
| Agency residential collateralized mortgage obligations | 13,593 |
| $ | 111 |
| $ | 92 |
| 13,612 |
| | 14,315 |
| $ | 20 |
| 373 |
| 13,962 |
| 11,600 |
| 348 |
| $ | 1 |
| 11,947 |
| | 12,772 |
| $ | 82 |
| $ | 71 |
| 12,783 |
|
| Agency residential mortgage-backed securities | 2,035 |
| 36 |
| 10 |
| 2,061 |
| | 2,128 |
| 13 |
| 36 |
| 2,105 |
| 1,373 |
| 72 |
| — |
| 1,445 |
| | 1,677 |
| 41 |
| 4 |
| 1,714 |
|
| Agency commercial mortgage-backed securities | 5,472 |
| 128 |
| 57 |
| 5,543 |
| | 3,300 |
| 19 |
| 132 |
| 3,187 |
| 6,301 |
| 426 |
| — |
| 6,727 |
| | 6,898 |
| 139 |
| 40 |
| 6,997 |
|
| Other securities | 17 |
| 18 |
| — |
| 35 |
| | 17 |
| 3 |
| — |
| 20 |
| 8 |
| 4 |
| — |
| 12 |
| | 7 |
| 4 |
| — |
| 11 |
|
| Total securities available for sale | $ | 21,394 |
| $ | 293 |
| $ | 159 |
| $ | 21,528 |
| | $ | 19,917 |
| $ | 55 |
| $ | 544 |
| $ | 19,428 |
| $ | 22,750 |
| $ | 851 |
| $ | 1 |
| $ | 23,600 |
| | $ | 21,692 |
| $ | 266 |
| $ | 115 |
| $ | 21,843 |
|
| HELD-TO-MATURITY SECURITIES | | | | | | |
| Agency residential collateralized mortgage obligations | $ | 6,435 |
| $ | 28 |
| $ | 59 |
| $ | 6,404 |
| | $ | 7,021 |
| $ | 2 |
| $ | 254 |
| $ | 6,769 |
| $ | 4,886 |
| $ | 151 |
| — |
| $ | 5,037 |
| | $ | 5,692 |
| $ | 23 |
| $ | 49 |
| $ | 5,666 |
|
| Agency residential mortgage-backed securities | 456 |
| 2 |
| 1 |
| 457 |
| | 490 |
| — |
| 14 |
| 476 |
| 359 |
| 16 |
| — |
| 375 |
| | 409 |
| 6 |
| — |
| 415 |
|
| Agency commercial mortgage-backed securities | 3,972 |
| 64 |
| 13 |
| 4,023 |
| | 3,996 |
| 2 |
| 133 |
| 3,865 |
| 3,805 |
| 278 |
| — |
| 4,083 |
| | 3,940 |
| 78 |
| 9 |
| 4,009 |
|
| Asset-backed securities | | 10 |
| — |
| — |
| 10 |
| | 11 |
| — |
| — |
| 11 |
|
| Other securities | 15 |
| — |
| — |
| 15 |
| | 12 |
| — |
| — |
| 12 |
| 15 |
| — |
| — |
| 15 |
| | 15 |
| — |
| — |
| 15 |
|
| Total held-to-maturity securities | $ | 10,878 |
| $ | 94 |
| $ | 73 |
| $ | 10,899 |
| | $ | 11,519 |
| $ | 4 |
| $ | 401 |
| $ | 11,122 |
| $ | 9,075 |
| $ | 445 |
| — |
| $ | 9,520 |
| | $ | 10,067 |
| $ | 107 |
| $ | 58 |
| $ | 10,116 |
|
| | | | | | | |
The following table summarizes our securities that were in an unrealized loss position as of June 30, 2019, and December 31, 2018.
| |
| (a) | Amortized cost amounts exclude accrued interest receivable which is recorded within “other assets” on the balance sheet. At June 30, 2020, accrued interest receivable on available for sale securities and held-to-maturity securities totaled $39 million and $18 million, respectively. |
The following table summarizes available for sale securities in an unrealized loss position for which an allowance for credit losses has not been recorded as of June 30, 2020, and December 31, 2019.
| | | | Duration of Unrealized Loss Position | | Duration of Unrealized Loss Position | | |
| | Less than 12 Months | | 12 Months or Longer | Total | Less than 12 Months | | 12 Months or Longer | | Total |
| in millions | Fair Value | Gross Unrealized Losses | | Fair Value | Gross Unrealized Losses | Fair Value | Gross Unrealized Losses | Fair Value | Gross Unrealized Losses | | Fair Value | Gross Unrealized Losses | | Fair Value | Gross Unrealized Losses |
| June 30, 2019 | | | | |
| June 30, 2020 | | | | | | |
| Securities available for sale: | | | | | | | | |
| U.S Treasury, agencies, and corporations | $ | 10 |
| — |
| | $ | 45 |
| — |
| $ | 55 |
| — |
| $ | 455 |
| — |
| (a) | — |
| — |
| | $ | 455 |
| — |
|
| Agency residential collateralized mortgage obligations | 183 |
| $ | 1 |
| | 6,941 |
| $ | 91 |
| 7,124 |
| $ | 92 |
| 371 |
| — |
| (a) | $ | 58 |
| $ | 1 |
| | 429 |
| $ | 1 |
|
| Agency residential mortgage-backed securities | 1 |
| — |
| (a) | 996 |
| 10 |
| 997 |
| 10 |
| 10 |
| — |
| (a) | 5 |
| — |
| (a) | 15 |
| — |
|
| Agency commercial mortgage-backed securities | — |
| — |
| | 1,779 |
| 57 |
| 1,779 |
| 57 |
| |
| Held-to-maturity securities: | | | | | | | | |
| Agency residential collateralized mortgage obligations | — |
| — |
| | 3,941 |
| 59 |
| 3,941 |
| 59 |
| — |
| — |
| | 37 |
| — |
| (a) | 37 |
| — |
|
| Agency residential mortgage-backed securities | 58 |
| — |
| (a) | 81 |
| 1 |
| 139 |
| 1 |
| |
| Agency commercial mortgage-backed securities | — |
| — |
| | 514 |
| 13 |
| 514 |
| 13 |
| |
| Asset-backed securities | | 1 |
| — |
| (a) | — |
| — |
| | 1 |
| — |
|
| Other securities | 7 |
| — |
| (a) | — |
| — |
| 7 |
| — |
| 10 |
| — |
| (a) | — |
| — |
| | 10 |
| — |
|
| Total temporarily impaired securities | $ | 259 |
| $ | 1 |
| | $ | 14,298 |
| $ | 231 |
| $ | 14,557 |
| $ | 232 |
| |
| December 31, 2018 | | | | |
| Total securities in an unrealized loss position | | $ | 847 |
| — |
| | $ | 100 |
| $ | 1 |
| | $ | 947 |
| $ | 1 |
|
| December 31, 2019 | | | | | | |
| Securities available for sale: | | | | | | | | |
| U.S. Treasury, agencies, and corporations | — |
| — |
| | $ | 147 |
| $ | 3 |
| $ | 147 |
| $ | 3 |
| $ | 30 |
| — |
| (b) | $ | 30 |
| — |
| (b) | $ | 60 |
| — |
|
| Agency residential collateralized mortgage obligations | $ | 570 |
| $ | 2 |
| | 10,945 |
| 371 |
| 11,515 |
| 373 |
| 3,432 |
| $ | 20 |
| | 3,221 |
| $ | 51 |
| | 6,653 |
| $ | 71 |
|
| Agency residential mortgage-backed securities | 4 |
| — |
| (b) | 1,087 |
| 36 |
| 1,091 |
| 36 |
| 33 |
| — |
| (b) | 629 |
| 4 |
| | 662 |
| 4 |
|
| Agency commercial mortgage-backed securities | — |
| — |
| | 1,729 |
| 132 |
| 1,729 |
| 132 |
| 1,541 |
| 17 |
| | 1,213 |
| 23 |
| | 2,754 |
| 40 |
|
| Held-to-maturity securities: | | | | | | | | |
| Agency residential collateralized mortgage obligations | — |
| — |
| | 6,416 |
| 254 |
| 6,416 |
| 254 |
| 1,626 |
| 14 |
| | 2,289 |
| 35 |
| | 3,915 |
| 49 |
|
| Agency residential mortgage-backed securities | — |
| — |
| | 475 |
| 14 |
| 475 |
| 14 |
| 56 |
| — |
| (b) | — |
| — |
| | 56 |
| — |
|
| Agency commercial mortgage-backed securities | 73 |
| — |
| (b) | 3,359 |
| 133 |
| 3,432 |
| 133 |
| 518 |
| 9 |
| | — |
| — |
| | 518 |
| 9 |
|
| Total temporarily impaired securities | $ | 647 |
| $ | 2 |
| | $ | 24,158 |
| $ | 943 |
| $ | 24,805 |
| $ | 945 |
| |
| Asset-backed securities | | 11 |
| — |
| (b) | — |
| — |
| | 11 |
| — |
|
| Other securities | | 3 |
| — |
| (b) | — |
| — |
| | 3 |
| — |
|
| Total securities in an unrealized loss position | | $ | 7,250 |
| $ | 60 |
| | $ | 7,382 |
| $ | 113 |
| | $ | 14,632 |
| $ | 173 |
|
| | | | | | | | | |
| |
| (a) | At June 30, 2019,2020, gross unrealized losses totaled less than$1 $1 million for U.S. Treasury, agencies, and corporations, agency residential collateralized mortgage obligations, and agency residential mortgage-backed securities available for sale and less than$1 million for agency residential mortgage-back securities and other securities held-to-maturity securities with a loss duration of less than 12 months. |
| |
(b) | At December 31, 2018,June 30, 2020, gross unrealized losses totaled less than $1 million for asset-backed securities and other securities held-to-maturity with a loss duration of less than 12 months. At June 30, 2020, gross unrealized losses totaled less than $1 million for agency residential mortgage-backed securities available for sale with a loss duration of lessgreater than 12 months andor longer. At June 30, 2020, gross unrealized losses totaled less than $1 million for agency commercialresidential collateralized mortgage obligations held-to-maturity with a loss duration greater than 12 months or longer. |
| |
| (b) | At December 31, 2019, gross unrealized losses totaled less than $1 million for U.S. Treasury, agencies, and corporations and agency residential mortgage-backed securities available for sale with a loss duration of less than 12 months. At December 31, 2019, gross unrealized losses totaled less than $1 million for U.S. Treasury, Agencies, and Corporations securities available for sale with a loss duration greater than 12 months or longer. At December 31, 2019, gross unrealized losses totaled less than $1 million for agency residential mortgage-backed securities, asset-backed securities, and other securities held-to-maturity with a loss duration of less than 12 months. |
At June 30, 2019, we had $92 million of gross unrealized losses related to 278 fixed-rate agency residential CMOs that we invested in as part ofBased on our overall A/LM strategy. These securities had a weighted-average maturity of 3.72 yearsevaluation at June 30, 2019. At June 30, 2019, we also had $10 million of gross2020, under the new impairment model, an allowance for credit losses has not been recorded nor have unrealized losses related to 213 agency residential mortgage-backedbeen recognized into income. The issuers of the securities positionsare of high credit quality and $57 million of gross unrealized losses related to 14 agency commercial mortgage backed securities positions with weighted-average maturities of 3.75 years and 4.12 years, respectively. Because these securities have a fixed interest rate,long history of no credit losses, management does not intend to sell and it is likely that management will not be required to sell the securities prior to their anticipated recovery, and the decline in fair value is sensitivelargely attributed to movementschanges in interest rates and other market conditions. The issuers continue to make timely principle and interest rates. These unrealized losses are considered temporary since we expect to collect all contractually due amounts from these securities. Accordingly, these investments were reduced to their fair value through OCI, not through earnings.
We regularly assess our securities portfolio for OTTI. The assessments are based on the nature of the securities, the underlying collateral, the financial condition of the issuer, the extent and duration of the loss, our intent related to the individual securities, and the likelihood that we will have to sell securities prior to expected recovery. We did not have any impairment losses recognized in earnings for the six months ended June 30, 2019.payments.
At June 30, 2019,2020, securities available for sale and held-to-maturity securities totaling $8.5$11.9 billion were pledged to secure securities sold under repurchase agreements, to secure public and trust deposits, to facilitate access to secured funding, and for other purposes required or permitted by law.
The following table shows our securities by remaining maturity. CMOs and other mortgage-backed securities in the available for sale portfolio and held-to-maturity portfolio are presented based on their expected average lives. The remaining securities, in both the available-for-sale and held-to-maturity portfolios, are presented based on their remaining contractual maturity. Actual maturities may differ from expected or contractual maturities since borrowers have the right to prepay obligations with or without prepayment penalties.
| | | June 30, 2019 | Securities Available for Sale | Held to Maturity Securities | |
| June 30, 2020 | | Securities Available for Sale | Held to Maturity Securities |
| in millions | Amortized Cost | Fair Value | Amortized Cost | Fair Value | Amortized Cost | Fair Value | Amortized Cost | Fair Value |
| Due in one year or less | $ | 360 |
| $ | 378 |
| $ | 41 |
| $ | 41 |
| $ | 3,918 |
| $ | 3,928 |
| $ | 126 |
| $ | 128 |
|
| Due after one through five years | 16,532 |
| 16,535 |
| 7,605 |
| 7,590 |
| 14,490 |
| 15,024 |
| 6,323 |
| 6,564 |
|
| Due after five through ten years | 4,493 |
| 4,606 |
| 3,232 |
| 3,268 |
| 4,340 |
| 4,646 |
| 2,626 |
| 2,828 |
|
| Due after ten years | 9 |
| 9 |
| — |
| — |
| 2 |
| 2 |
| — |
| — |
|
| Total | $ | 21,394 |
| $ | 21,528 |
| $ | 10,878 |
| $ | 10,899 |
| $ | 22,750 |
| $ | 23,600 |
| $ | 9,075 |
| $ | 9,520 |
|
| | | |
7. Derivatives and Hedging Activities
We are a party to various derivative instruments, mainly through our subsidiary, KeyBank. The primary derivatives that we use are interest rate swaps, caps, floors, and futures; foreign exchange contracts; commodity derivatives; and credit derivatives. Generally, these instruments help us manage exposure to interest rate risk, mitigate the credit risk inherent in our loan portfolio, hedge against changes in foreign currency exchange rates, and meet client financing and hedging needs.
At June 30, 2019,2020, after taking into account the effects of bilateral collateral and master netting agreements, we had $94$119 million of derivative assets and $1 million of derivative liabilities that relate to contracts entered into for hedging purposes. As of the same date, after taking into account the effects of bilateral collateral and master netting agreements and a reserve for potential future losses, we had derivative assets of $715 million$2.0 billion and derivative liabilities of $216$309 million that were not designated as hedging instruments. These positions are primarily comprised of derivative contracts entered into for client accommodation purposes.
Additional information regarding our accounting policies for derivatives is provided in Note 1 (“Summary of Significant Accounting Policies”) under the heading “Derivatives and Hedging” beginning on page 103105 of our 20182019 Form 10-K. Our derivative strategies and related risk management objectives are described in Note 8 (“Derivatives and Hedging Activities”) beginning on page 132134 of our 20182019 Form 10-K.
Fair Values, Volume of Activity, and Gain/Loss Information Related to Derivative Instruments
The following table summarizes the fair values of our derivative instruments on a gross and net basis as of June 30, 2019,2020, and December 31, 2018.2019. The derivative asset and liability balances are presented on a gross basis, prior to the application of bilateral collateral and master netting agreements, but after the variation margin payments with central clearing organizations have been applied as settlement, as applicable. Total derivative assets and liabilities are adjusted to take into account the impact of legally enforceable master netting agreements that allow us to settle all derivative contracts with a single counterparty on a net basis and to offset the net derivative position with the related cash collateral. Securities collateral related to legally enforceable master netting agreements is not offset on the balance sheet. Our derivative instruments are included in “accrued income and other assets” or “accrued expenses and other liabilities” on the balance sheet, as follows:
| | | | June 30, 2019 | | December 31, 2018 | June 30, 2020 | | December 31, 2019 |
| | | Fair Value | | | Fair Value | | Fair Value | | | Fair Value |
| in millions | Notional Amount | Derivative Assets | Derivative Liabilities | | Notional Amount | Derivative Assets | Derivative Liabilities | Notional Amount | Derivative Assets | Derivative Liabilities | | Notional Amount | Derivative Assets | Derivative Liabilities |
| Derivatives designated as hedging instruments: | | | | | | |
| Interest rate | $ | 37,147 |
| $ | 105 |
| $ | 10 |
| | $ | 28,546 |
| $ | 50 |
| $ | (10 | ) | $ | 34,602 |
| $ | 89 |
| $ | 5 |
| | $ | 39,208 |
| $ | 191 |
| $ | 20 |
|
| Foreign exchange | 122 |
| — |
| 2 |
| | 122 |
| 2 |
| — |
| |
| Total | 37,269 |
| 105 |
| 12 |
| | 28,668 |
| 52 |
| (10 | ) | |
| Derivatives not designated as hedging instruments: | | | | | | |
| Interest rate | 68,202 |
| 784 |
| 210 |
| | 63,454 |
| 365 |
| 307 |
| 79,573 |
| 1,931 |
| 332 |
| | 71,209 |
| 772 |
| 233 |
|
| Foreign exchange | 5,702 |
| 70 |
| 62 |
| | 6,829 |
| 104 |
| 95 |
| 6,040 |
| 108 |
| 97 |
| | 6,572 |
| 67 |
| 60 |
|
| Commodity | 6,662 |
| 246 |
| 236 |
| | 2,002 |
| 333 |
| 323 |
| 6,399 |
| 487 |
| 462 |
| | 5,324 |
| 208 |
| 200 |
|
| Credit | 453 |
| 1 |
| 3 |
| | 226 |
| 1 |
| 1 |
| 591 |
| 4 |
| 20 |
| | 427 |
| 1 |
| 10 |
|
Other (a) | 4,483 |
| 16 |
| 13 |
| | 1,466 |
| 9 |
| 7 |
| 7,818 |
| 83 |
| 23 |
| | 3,337 |
| 14 |
| 10 |
|
| Total | 85,502 |
| 1,117 |
| 524 |
| | 73,977 |
| 812 |
| 733 |
| 100,421 |
| 2,613 |
| 934 |
| | 86,869 |
| 1,062 |
| 513 |
|
Netting adjustments (b) | — |
| (413 | ) | (319 | ) | | — |
| (333 | ) | (337 | ) | — |
| (609 | ) | (629 | ) | | — |
| (473 | ) | (335 | ) |
| Net derivatives in the balance sheet | 122,771 |
| 809 |
| 217 |
| | 102,645 |
| 531 |
| 386 |
| 135,023 |
| 2,093 |
| 310 |
| | 126,077 |
| 780 |
| 198 |
|
Other collateral (c) | — |
| (3 | ) | (46 | ) | | — |
| (2 | ) | (33 | ) | — |
| (3 | ) | (1 | ) | | — |
| (2 | ) | (42 | ) |
| Net derivative amounts | $ | 122,771 |
| $ | 806 |
| $ | 171 |
| | $ | 102,645 |
| $ | 529 |
| $ | 353 |
| $ | 135,023 |
| $ | 2,090 |
| $ | 309 |
| | $ | 126,077 |
| $ | 778 |
| $ | 156 |
|
| | | | | | | |
| |
| (a) | Other derivatives include interest rate lock commitments and forward sale commitments related to our residential mortgage banking activities, forward purchase and sales contracts consisting of contractual commitments associated with “to be announced” securities and when-issued securities, and other customized derivative contracts. |
| |
| (b) | Netting adjustments represent the amounts recorded to convert our derivative assets and liabilities from a gross basis to a net basis in accordance with the applicable accounting guidance. |
| |
| (c) | Other collateral represents the amount that cannot be used to offset our derivative assets and liabilities from a gross basis to a net basis in accordance with the applicable accounting guidance. The other collateral consists of securities and is exchanged under bilateral collateral and master netting agreements that allow us to offset the net derivative position with the related collateral. The application of the other collateral cannot reduce the net derivative position below zero. Therefore, excess other collateral, if any, is not reflected above. |
Fair value hedges. During the six-month period ended June 30, 2019,2020, we did not exclude any portion of fair value hedging instruments from the assessment of hedge effectiveness.
The following tables summarize the amounts that were recorded on the balance sheet as of June 30, 2019,2020, and December 31, 2018,2019, related to cumulative basis adjustments for fair value hedges.
|
| | | | | | | |
| | June 30, 2019 |
| in millions | Balance sheet line item in which the hedge item is included | Carrying amount of hedged item (a) | Hedge accounting basis adjustment (b) |
| Interest rate contracts | Long-term debt | $ | 9,559 |
| $ | 237 |
|
| Interest rate contracts | Certificate of deposit ($100,000 or more) | 194 |
| — |
|
| Interest rate contracts | Other time deposits | 175 |
| — |
|
| | | | |
| | December 31, 2018 |
| | Balance sheet line item in which the hedge item is included | Carrying amount of hedged item (a) | Hedge accounting basis adjustment (b) |
| Interest rate contracts | Long-term debt | $ | 9,363 |
| $ | (6 | ) |
| Interest rate contracts | Certificate of deposit ($100,000 or more) | 343 |
| (1 | ) |
| Interest rate contracts | Other time deposits | 178 |
| — |
|
|
| | | | | | | |
| | June 30, 2020 |
| in millions | Balance sheet line item in which the hedge item is included | Carrying amount of hedged item (a) | Hedge accounting basis adjustment (b) |
| Interest rate contracts | Long-term debt | $ | 9,222 |
| $ | 538 |
|
| | | | |
| | December 31, 2019 |
| | Balance sheet line item in which the hedge item is included | Carrying amount of hedged item (a) | Hedge accounting basis adjustment (b) |
| Interest rate contracts | Long-term debt | $ | 8,408 |
| $ | 240 |
|
| |
| (a) | The carrying amount represents the portion of the liability designated as the hedged item. |
| |
| (b) | Basis adjustments related to de-designated hedged items that no longer qualify as fair value hedges reduced the hedge accounting basis adjustment by $10$9 million and $10$9 million at June 30, 2019,2020, and December 31, 2018,2019, respectively, |
Cash flow hedges. During the six-month period ended June 30, 2019,2020, we did not exclude any portion of cash flow hedging instruments from the assessment of hedge effectiveness.
Considering the interest rates, yield curves, and notional amounts as of June 30, 2019,2020, we expect to reclassify an estimated $63$276 million of after-tax net lossesgains on derivative instruments designated as cash flow hedges from AOCI to income during the next 12 months. In addition, we expect to reclassify approximately $10$77 million of net lossesgains related to terminated cash flow hedges from AOCI to income during the next 12 months. As of June 30, 2019,2020, the maximum length of time over which we hedge forecasted transactions is 109 years.
The following tables summarize the effect of fair value and cash flow hedge accounting on the income statement for the three- and six-month periods ended June 30, 2019,2020, and June 30, 2018.2019.
| | | | Location and amount of net gains (losses) recognized in income on fair value and cash flow hedging relationships | Location and amount of net gains (losses) recognized in income on fair value and cash flow hedging relationships |
| in millions | Interest expense – long-term debt | Interest income – loans | Interest expense - deposits | Other income | Interest expense – long-term debt | Interest income – loans | Interest expense - deposits | Other income |
| Three months ended June 30, 2020 | | |
| Total amounts presented in the consolidated statement of income | | $ | (71 | ) | $ | 980 |
| $ | (96 | ) | $ | 33 |
|
| | | |
| Net gains (losses) on fair value hedging relationships | | |
| Interest contracts | | |
| Recognized on hedged items | | (5 | ) | — |
| — |
| — |
|
| Recognized on derivatives designated as hedging instruments | | 39 |
| — |
| — |
| — |
|
| Net income (expense) recognized on fair value hedges | | $ | 34 |
| — |
| — |
| — |
|
| Net gain (loss) on cash flow hedging relationships | | |
| Interest contracts | | |
| Realized gains (losses) (pre-tax) reclassified from AOCI into net income | | $ | (1 | ) | $ | 90 |
| — |
| — |
|
| Net income (expense) recognized on cash flow hedges | | $ | (1 | ) | $ | 90 |
| — |
| — |
|
| | | |
| Three months ended June 30, 2019 | | |
| Total amounts presented in the consolidated statement of income | $ | (120 | ) | $ | 1,082 |
| $ | (223 | ) | $ | 17 |
| $ | (120 | ) | $ | 1,082 |
| $ | (223 | ) | $ | 17 |
|
| | | |
| Net gains (losses) on fair value hedging relationships | | |
| Interest contracts | | |
| Recognized on hedged items | (152 | ) | — |
| (1 | ) | — |
| $ | (152 | ) | — |
| $ | (1 | ) | — |
|
| Recognized on derivatives designated as hedging instruments | 142 |
| — |
| — |
| — |
| 142 |
| — |
| — |
| — |
|
| Net income (expense) recognized on fair value hedges | $ | (10 | ) | — |
| (1 | ) | — |
| $ | (10 | ) | — |
| $ | (1 | ) | — |
|
| Net gain (loss) on cash flow hedging relationships | | |
| Interest contracts | | |
| Realized gains (losses) (pre-tax) reclassified from AOCI into net income | $ | — |
| $ | (19 | ) | — |
| — |
| $ | — |
| $ | (19 | ) | — |
| — |
|
| Net income (expense) recognized on cash flow hedges | $ | — |
| $ | (19 | ) | — |
| — |
| $ | — |
| $ | (19 | ) | — |
| — |
|
| | | |
| Three months ended June 30, 2018 | | |
| Total amounts presented in the consolidated statement of income | $ | (102 | ) | $ | 1,000 |
| $ | (112 | ) | $ | 99 |
| |
| | | |
| Net gains (losses) on fair value hedging relationships | | |
| Interest contracts | | |
| Recognized on hedged items | $ | 22 |
| — |
| $ | 1 |
| — |
| |
| Recognized on derivatives designated as hedging instruments | (25 | ) | — |
| — |
| — |
| |
| Net income (expense) recognized on fair value hedges | $ | (3 | ) | — |
| $ | 1 |
| — |
| |
| Net gain (loss) on cash flow hedging relationships | | |
| Interest contracts | | |
| Realized gains (losses) (pre-tax) reclassified from AOCI into net income | $ | 1 |
| $ | (25 | ) | — |
| — |
| |
| Net income (expense) recognized on cash flow hedges | $ | 1 |
| $ | (25 | ) | — |
| — |
| |
| | | |
| | | | Location and amount of net gains (losses) recognized in income on fair value and cash flow hedging relationships | Location and amount of net gains (losses) recognized in income on fair value and cash flow hedging relationships |
| in millions | Interest expense – long-term debt | Interest income – loans | Interest expense - deposits | Other income | Interest expense – long-term debt | Interest income – loans | Interest expense - deposits | Other income |
| Six months ended June 30, 2020 | | |
| Total amounts presented in the consolidated statement of income | | $ | (161 | ) | $ | 2,006 |
| $ | (265 | ) | $ | (55 | ) |
| | | |
| Net gains (losses) on fair value hedging relationships | | |
| Interest contracts | | |
| Recognized on hedged items | | (299 | ) | — |
| — |
| — |
|
| Recognized on derivatives designated as hedging instruments | | 350 |
| — |
| — |
| — |
|
| Net income (expense) recognized on fair value hedges | | $ | 51 |
| — |
| — |
| — |
|
| Net gain (loss) on cash flow hedging relationships | | |
| Interest contracts | | |
| Realized gains (losses) (pre-tax) reclassified from AOCI into net income | | $ | (2 | ) | $ | 124 |
| — |
| — |
|
| Net income (expense) recognized on cash flow hedges | | $ | (2 | ) | $ | 124 |
| — |
| — |
|
| | | |
| Six months ended June 30, 2019 | | |
| Total amounts presented in the consolidated statement of income | $ | (240 | ) | $ | 2,148 |
| $ | (425 | ) | $ | 27 |
| $ | (240 | ) | $ | 2,148 |
| $ | (425 | ) | $ | 27 |
|
| | | |
| Net gains (losses) on fair value hedging relationships | | |
| Interest contracts | | |
| Recognized on hedged items | (245 | ) | — |
| (1 | ) | — |
| $ | (245 | ) | — |
| $ | (1 | ) | — |
|
| Recognized on derivatives designated as hedging instruments | 224 |
| — |
| — |
| — |
| 224 |
| — |
| — |
| — |
|
| Net income (expense) recognized on fair value hedges | $ | (21 | ) | — |
| (1 | ) | — |
| $ | (21 | ) | — |
| $ | (1 | ) | — |
|
| Net gain (loss) on cash flow hedging relationships | | |
| Interest contracts | | |
| Realized gains (losses) (pre-tax) reclassified from AOCI into net income | $ | (1 | ) | $ | (43 | ) | — |
| — |
| $ | (1 | ) | $ | (43 | ) | — |
| — |
|
| Net income (expense) recognized on cash flow hedges | $ | (1 | ) | $ | (43 | ) | — |
| — |
| $ | (1 | ) | $ | (43 | ) | — |
| — |
|
| | | |
| Six months ended June 30, 2018 | | |
| Total amounts presented in the consolidated statement of income | $ | (194 | ) | $ | 1,940 |
| $ | (203 | ) | $ | 120 |
| |
| | | |
| Net gains (losses) on fair value hedging relationships | | |
| Interest contracts | | |
| Recognized on hedged items | $ | 93 |
| — |
| $ | 1 |
| — |
| |
| Recognized on derivatives designated as hedging instruments | (94 | ) | — |
| — |
| — |
| |
| Net income (expense) recognized on fair value hedges | $ | (1 | ) | — |
| $ | 1 |
| — |
| |
| Net gain (loss) on cash flow hedging relationships | | |
| Interest contracts | | |
| Realized gains (losses) (pre-tax) reclassified from AOCI into net income | — |
| $ | (27 | ) | — |
| — |
| |
| Net income (expense) recognized on cash flow hedges | — |
| $ | (27 | ) | — |
| — |
| |
| | | |
Net investment hedges. We enterpreviously entered into foreign currency forward contracts to hedge our exposure to changes in the carrying value of our investments in foreign subsidiaries as a result of changes in the related foreign exchange rates. At June 30,In December 2019, AOCI reflected unrecognized, after-tax gains totaling $24 million related to cumulative changesour last remaining net investment hedge was discontinued in connection with the fair valuesubstantial liquidation of the net assets of KEF’s Canadian subsidiary. Additional information regarding the discontinuance of this net investment hedge is provided in Note 8 (Derivatives and Hedging Activities) on page 137 of our net investment hedges, which offset the unrecognized, after-tax foreign currency losses on net investment balances. We did not exclude any portion of our hedging instruments from the assessment of hedge effectiveness during the six-month period ended June 30, 2019.2019 Form 10-K.
The following tables summarize the pre-tax net gains (losses) on our cash flow and net investment hedges for the three- and six-month periods ended June 30, 2019,2020, and June 30, 2018,2019, and where they are recorded on the income statement. The table includes net gains (losses) recognized in OCI during the period and net gains (losses) reclassified from OCI into income during the current period.
|
| | | | | | | |
| in millions | Net Gains (Losses) Recognized in OCI | Income Statement Location of Net Gains (Losses) Reclassified From OCI Into Income | Net Gains (Losses) Reclassified From OCI Into Income |
| Three months ended June 30, 2019 | | | |
| Cash Flow Hedges | | | |
| Interest rate | $ | 270 |
| Interest income — Loans | $ | (19 | ) |
| Interest rate | (2 | ) | Interest expense — Long-term debt | — |
|
| Interest rate | (1 | ) | Investment banking and debt placement fees | — |
|
| Net Investment Hedges | | | |
| Foreign exchange contracts | (1 | ) | Other Income | — |
|
| Total | $ | 266 |
| | $ | (19 | ) |
| Three months ended June 30, 2018 | | | |
| Cash Flow Hedges | | | |
| Interest rate | $ | (58 | ) | Interest income — Loans | $ | (25 | ) |
| Interest rate | 2 |
| Interest expense — Long-term debt | 1 |
|
| Interest rate | 1 |
| Investment banking and debt placement fees | — |
|
| Net Investment Hedges | | | |
| Foreign exchange contracts | 10 |
| Other Income | — |
|
| Total | $ | (45 | ) | | $ | (24 | ) |
| | | | |
|
| | | | | | | |
| in millions | Net Gains (Losses) Recognized in OCI | Income Statement Location of Net Gains (Losses) Reclassified From OCI Into Income | Net Gains (Losses) Reclassified From OCI Into Income |
| Three months ended June 30, 2020 | | | |
| Cash Flow Hedges | | | |
| Interest rate | $ | 62 |
| Interest income — Loans | $ | 90 |
|
| Interest rate | (1 | ) | Interest expense — Long-term debt | (1 | ) |
| Interest rate | 10 |
| Investment banking and debt placement fees | — |
|
| Total | $ | 71 |
| | $ | 89 |
|
| Three months ended June 30, 2019 | | | |
| Cash Flow Hedges | | | |
| Interest rate | $ | 270 |
| Interest income — Loans | $ | (19 | ) |
| Interest rate | (2 | ) | Interest expense — Long-term debt | — |
|
| Interest rate | (1 | ) | Investment banking and debt placement fees | — |
|
| Net Investment Hedges | | | |
| Foreign exchange contracts | (1 | ) | Other Income | — |
|
| Total | $ | 266 |
| | $ | (19 | ) |
| | | | |
| | | in millions | Net Gains (Losses) Recognized in OCI | Income Statement Location of Net Gains (Losses) Reclassified From OCI Into Income | Net Gains (Losses) Reclassified From OCI Into Income(a) | Net Gains (Losses) Recognized in OCI | Income Statement Location of Net Gains (Losses) Reclassified From OCI Into Income | Net Gains (Losses) Reclassified From OCI Into Income(a) |
| Six months ended June 30, 2020 | | | | |
| Cash Flow Hedges | | | | |
| Interest rate | | $ | 624 |
| Interest income — Loans | $ | 124 |
|
| Interest rate | | (6 | ) | Interest expense — Long-term debt | (2 | ) |
| Interest rate | | (20 | ) | Investment banking and debt placement fees | — |
|
| Net Investment Hedges | | | | |
| Foreign exchange contracts | | — |
| Other Income | — |
|
| Total | | $ | 598 |
| | $ | 122 |
|
| Six months ended June 30, 2019 | | | | | | |
| Cash Flow Hedges | | | | | | |
| Interest rate | $ | 385 |
| Interest income — Loans | $ | (43 | ) | $ | 385 |
| Interest income — Loans | $ | (43 | ) |
| Interest rate | (3 | ) | Interest expense — Long-term debt | (1 | ) | (3 | ) | Interest expense — Long-term debt | (1 | ) |
| Interest rate | (6 | ) | Investment banking and debt placement fees | — |
| (6 | ) | Investment banking and debt placement fees | — |
|
| Net Investment Hedges | | | | | | |
| Foreign exchange contracts | (4 | ) | Other Income | — |
| (4 | ) | Other Income | — |
|
| Total | $ | 372 |
| | $ | (44 | ) | $ | 372 |
| | $ | (44 | ) |
| Six months ended June 30, 2018 | | | | |
| Cash Flow Hedges | | | | |
| Interest rate | $ | (146 | ) | Interest income — Loans | $ | (27 | ) | |
| Interest rate | 4 |
| Interest expense — Long-term debt | — |
| |
| Interest rate | 1 |
| Investment banking and debt placement fees | — |
| |
| Net Investment Hedges | | | | |
| Foreign exchange contracts | 10 |
| Other Income | — |
| |
| Total | $ | (131 | ) | | $ | (27 | ) | |
| | | | | | | |
Nonhedging instruments
The following table summarizes the pre-tax net gains (losses) on our derivatives that are not designated as hedging instruments for the three- and six-month periods ended June 30, 2019,2020, and June 30, 2018,2019, and where they are recorded on the income statement. |
| | | | | | | | | | | | | | | | | | | | | | | |
| | Three months ended June 30, 2019 | | Three months ended June 30, 2018 |
| in millions | Corporate services income | Consumer mortgage income | Other income | Total | | Corporate services income | Consumer mortgage income | Other income | Total |
| NET GAINS (LOSSES) | | | | | | | | | |
| Interest rate | $ | 7 |
| — |
| $ | — |
| $ | 7 |
| | $ | 11 |
| — |
| — |
| $ | 11 |
|
| Foreign exchange | 11 |
| — |
| — |
| 11 |
| | 11 |
| — |
| — |
| 11 |
|
| Commodity | 2 |
| — |
| — |
| 2 |
| | 3 |
| — |
| — |
| 3 |
|
| Credit | — |
| — |
| (8 | ) | (8 | ) | | — |
| — |
| $ | (14 | ) | (14 | ) |
| Other | — |
| — |
| 2 |
| 2 |
| | — |
| — |
| 16 |
| 16 |
|
| Total net gains (losses) | $ | 20 |
| — |
| $ | (6 | ) | $ | 14 |
| | $ | 25 |
| — |
| $ | 2 |
| $ | 27 |
|
| | | | | | | | | | |
|
| | | | | | | | | | | | | | | | | | | | | | | |
| | Three months ended June 30, 2020 | | Three months ended June 30, 2019 |
| in millions | Corporate services income | Consumer mortgage income | Other income | Total | | Corporate services income | Consumer mortgage income | Other income | Total |
| NET GAINS (LOSSES) | | | | | | | | | |
| Interest rate | $ | 7 |
| — |
| $ | — |
| $ | 7 |
| | $ | 7 |
| — |
| — |
| $ | 7 |
|
| Foreign exchange | 8 |
| — |
| — |
| 8 |
| | 11 |
| — |
| — |
| 11 |
|
| Commodity | 6 |
| — |
| — |
| 6 |
| | 2 |
| — |
| — |
| 2 |
|
| Credit | 6 |
| — |
| (13 | ) | (7 | ) | | — |
| — |
| $ | (8 | ) | (8 | ) |
| Other | — |
| 4 |
| 16 |
| 20 |
| | — |
| — |
| 2 |
| 2 |
|
| Total net gains (losses) | $ | 27 |
| 4 |
| $ | 3 |
| $ | 34 |
| | $ | 20 |
| — |
| $ | (6 | ) | $ | 14 |
|
| | | | | | | | | | |
| | | | Six months ended June 30, 2019 | | Six months ended June 30, 2018 | Six months ended June 30, 2020 | | Six months ended June 30, 2019 |
| in millions | Corporate services income | Consumer mortgage income | Other income | Total | | Corporate services income | Consumer mortgage income | Other income | Total | Corporate services income | Consumer mortgage income | Other income | Total | | Corporate services income | Consumer mortgage income | Other income | Total |
| NET GAINS (LOSSES) | | | | | | |
| Interest rate | $ | 15 |
| $ | — |
| $ | (2 | ) | $ | 13 |
| | $ | 20 |
| — |
| $ | 2 |
| $ | 22 |
| $ | 18 |
| $ | — |
| $ | (9 | ) | $ | 9 |
| | $ | 15 |
| — |
| $ | (2 | ) | $ | 13 |
|
| Foreign exchange | 21 |
| — |
| — |
| 21 |
| | 22 |
| — |
| — |
| 22 |
| 20 |
| — |
| — |
| 20 |
| | 21 |
| — |
| — |
| 21 |
|
| Commodity | 3 |
| — |
| — |
| 3 |
| | 6 |
| — |
| — |
| 6 |
| 8 |
| — |
| — |
| 8 |
| | 3 |
| — |
| — |
| 3 |
|
| Credit | 1 |
| — |
| (15 | ) | (14 | ) | | 2 |
| — |
| (19 | ) | (17 | ) | (10 | ) | — |
| (12 | ) | (22 | ) | | 1 |
| — |
| (15 | ) | (14 | ) |
| Other | — |
| — |
| 3 |
| 3 |
| | — |
| $ | — |
| 12 |
| 12 |
| — |
| 8 |
| 25 |
| 33 |
| | — |
| $ | — |
| 3 |
| 3 |
|
| Total net gains (losses) | $ | 40 |
| $ | — |
| $ | (14 | ) | $ | 26 |
| | $ | 50 |
| $ | — |
| $ | (5 | ) | $ | 45 |
| $ | 36 |
| $ | 8 |
| $ | 4 |
| $ | 48 |
| | $ | 40 |
| $ | — |
| $ | (14 | ) | $ | 26 |
|
| | | | | | | |
Counterparty Credit Risk
We hold collateral in the form of cash and highly rated securities issued by the U.S. Treasury, government-sponsored enterprises, or GNMA. Cash collateral of $160$169 million was netted against derivative assets on the balance sheet at June 30, 2019,2020, compared to $33$207 million of cash collateral netted against derivative assets at December 31, 2018.2019. The cash collateral netted against derivative liabilities totaled $66$190 million at June 30, 2019,2020, and $37$69 million at December 31, 2018.2019. Our means of mitigating and managing exposure to credit risk on derivative contracts is described in Note 8 (“Derivatives and Hedging Activities”) beginning on page 136138 of our 20182019 Form 10-K under the heading “Counterparty Credit Risk.”
The following table summarizes the fair value of our derivative assets by type at the dates indicated. These assets represent our gross exposure to potential loss after taking into account the effects of bilateral collateral and master netting agreements and other means used to mitigate risk.
| | | in millions | June 30, 2019 |
| December 31, 2018 |
| June 30, 2020 |
| December 31, 2019 |
|
| Interest rate | $ | 793 |
| $ | 308 |
| $ | 1,860 |
| $ | 848 |
|
| Foreign exchange | 36 |
| 60 |
| 49 |
| 30 |
|
| Commodity | 124 |
| 187 |
| 270 |
| 95 |
|
| Credit | — |
| — |
| — |
| — |
|
| Other | 16 |
| 9 |
| 83 |
| 14 |
|
| Derivative assets before collateral | 969 |
| 564 |
| 2,262 |
| 987 |
|
| Less: Related collateral | 160 |
| 33 |
| 169 |
| 207 |
|
| Total derivative assets | $ | 809 |
| $ | 531 |
| $ | 2,093 |
| $ | 780 |
|
| | | |
We enter into derivative transactions with two primary groups: broker-dealers and banks, and clients. Given that these groups have different economic characteristics, we have different methods for managing counterparty credit exposure and credit risk.
We enter into transactions with broker-dealers and banks for various risk management purposes. These types of
transactions are primarily high dollar volume. We enter into bilateral collateral and master netting agreements with
these counterparties. We clear certain types of derivative transactions with these counterparties, whereby central
clearing organizations become the counterparties to our derivative contracts. In addition, we enter into derivative
contracts through swap execution facilities. Swap clearing and swap execution facilities reduce our exposure to
counterparty credit risk. At June 30, 2019,2020, we had gross exposure of $384$623 million to broker-dealers and banks. We had net exposure of $117$297 million after the application of master netting agreements and cash collateral, where such qualifying agreements exist. We had net exposure of $113$293 million after considering $4 million of additional collateral held in the form of securities.
We enter into transactions using master netting agreements with clients to accommodate their business needs. In
most cases, we mitigate our credit exposure by cross-collateralizing these transactions to the underlying loan collateral. For transactions that are not clearable, we mitigate our market risk by buying and selling U.S. Treasuries and Eurodollar futures or entering into offsetting positions. Due to the smaller size and magnitude ofcross-collateralization to the individual contracts with clients,underlying loan, we generallytypically do not exchange cash or marketable securities collateral in connection with these derivative transactions. To address the risk of default associated with the uncollateralizedthese contracts, we have established a credit valuation adjustmentCVA reserve (included in “accrued
“accrued income and other assets”) in the amount of $6$74 million at June 30, 2019, which we estimate to be the 2020. The CVA is calculated from
potential future losses on amounts due from client counterparties in the eventexposures, expected recovery rates, and market-implied probabilities of default. At June 30, 2019,2020, we had gross exposure of $731 million$1.9 billion to client counterparties and other entities that are not broker-dealers or banks for derivatives that have associated master netting agreements. We had net exposure of $692 million$1.8 billion on our derivatives with these counterparties after the application of master netting agreements, collateral, and the related reserve.
Credit Derivatives
We are a buyer and, under limited circumstances, may be a seller of credit protection through the credit derivative market. We purchase credit derivatives to manage the credit risk associated with specific commercial lending and swap obligations as well as exposures to debt securities. Our credit derivative portfolio was in a net liability position of $2$16 million as of June 30, 2019,2020, and less than $1$9 million as of December 31, 2018.2019. Our credit derivative portfolio consists of single-name credit default swaps, traded credit default swap indices and risk participation agreements. Additional descriptions of our credit derivatives are provided in Note 8 (“Derivatives and Hedging Activities”) beginning on page 137139 of our 20182019 Form 10-K under the heading “Credit Derivatives.”
The following table provides information on the types of credit derivatives sold by us and held on the balance sheet at June 30, 2019,2020, and December 31, 2018. The sold credit derivatives represented in the following table include only Risk Participation Agreements; there were no traded indexes sold.2019. The notional amount represents the maximum amount that the seller could
be required to pay. The payment/performance risk assessment at June 30, 2019, is based on the internal probability of default of the reference entity consistent with our Fair Value Methodology. The payment/performance risk shown in the table represents a weighted-averageweighted average of the default
probabilities for all reference entities.entities in the respective portfolios. These default probabilities are directly correlated to the probability that we will have to make a payment underimplied from
observed credit indices in the credit derivative contracts.default swap market, which are mapped to reference entities based on Key’s
internal risk rating.
| | | | June 30, 2019 | | December 31, 2018 | June 30, 2020 | | December 31, 2019 |
| dollars in millions | Notional Amount | Average Term (Years) | Payment / Performance Risk | | Notional Amount | Average Term (Years) | Payment / Performance Risk | Notional Amount | Average Term (Years) | Payment / Performance Risk | | Notional Amount | Average Term (Years) | Payment / Performance Risk |
| Other | $ | 126 |
| 13.84 |
| 2.50 | % | | $ | 22 |
| 13.43 |
| 17.18 | % | $ | 327 |
| 13.94 |
| 19.84 | % | | $ | 134 |
| 14.30 |
| 14.56 | % |
| Total credit derivatives sold | $ | 126 |
| — |
| — |
| | $ | 22 |
| — |
| — |
| $ | 327 |
| — |
| — |
| | $ | 134 |
| — |
| — |
|
| | | | | | | | | | | |
Credit Risk Contingent Features
We have entered into certain derivative contracts that require us to post collateral to the counterparties when these contracts are in a net liability position. The amount of collateral to be posted is based on the amount of the net liability and thresholds generally related to our long-term senior unsecured credit ratings with Moody’s and S&P. Collateral requirements also are based on minimum transfer amounts, which are specific to each Credit Support Annex (a component of the ISDA Master Agreement) that we have signed with the counterparties. In a limited number of instances, counterparties have the right to terminate their ISDA Master Agreements with us if our ratings fall below a certain level, usually investment-grade level (i.e., “Baa3” for Moody’s and “BBB-” for S&P). At June 30, 2019,2020, KeyBank’s rating was “A3” with Moody’s and “A-” with S&P, and KeyCorp’s rating was “Baa1” with Moody’s and “BBB+” with S&P. As of June 30, 2019,2020, the aggregate fair value of all derivative contracts with credit risk contingent features (i.e., those containing collateral posting or termination provisions based on our ratings) held by KeyBank that were in a net liability position totaled $8$109 million, which was comprised of $6$62 million in derivative assets and $14$171 million in derivative liabilities. We had $9$107 million in cash and securities collateral posted to cover those positions as of June 30, 2019.2020. There were no0 derivative contracts with credit risk contingent features held by KeyCorp at June 30, 2019.2020.
The following table summarizes the additional cash and securities collateral that KeyBank would have been required to deliver under the ISDA Master Agreements had the credit risk contingent features been triggered for the derivative contracts in a net liability position as of June 30, 2019,2020, and December 31, 2018.2019. The additional collateral amounts were calculated based on scenarios under which KeyBank’s ratings are downgraded one, two, or three ratings as of June 30, 2019,2020, and December 31, 2018,2019, and take into account all collateral already posted. A similar calculation was performed for KeyCorp, and no additional collateral would have been required as of June 30, 2019,2020, and December 31, 2018.2019. For more information about the credit ratings for KeyBank and KeyCorp, see the discussion under the heading “Factors affecting liquidity” in the section entitled “Liquidity risk management” in Item 2 of this report.
| | | | June 30, 2019 | | December 31, 2018 | June 30, 2020 | | December 31, 2019 |
| in millions | Moody’s | S&P | | Moody’s | S&P | Moody’s | S&P | | Moody’s | S&P |
| KeyBank’s long-term senior unsecured credit ratings | A3 |
| A- |
| | A3 |
| A- |
| A3 |
| A- |
| | A3 |
| A- |
|
| One rating downgrade | $ | — |
| $ | — |
| | $ | 2 |
| $ | 2 |
| $ | 1 |
| $ | 1 |
| | $ | 1 |
| $ | 1 |
|
| Two rating downgrades | — |
| — |
| | 2 |
| 2 |
| 1 |
| 1 |
| | 1 |
| 1 |
|
| Three rating downgrades | — |
| — |
| | 2 |
| 2 |
| 1 |
| 1 |
| | 1 |
| 1 |
|
KeyBank’s long-term senior unsecured credit rating was four4 ratings above noninvestment grade at Moody’s and S&P as of June 30, 2019,2020, and December 31, 2018.2019. If KeyBank’s ratings had been downgraded below investment grade as of June 30, 2019,2020, or December 31, 2018,2019, payments of less than $1$2 million and $4$3 million, respectively, would have been required to either terminate the contracts or post additional collateral for those contracts in a net liability position, taking into account all collateral already posted. If KeyCorp’s ratings had been downgraded below investment grade as of June 30, 2019,2020, or December 31, 2018,2019, no payments would have been required to either terminate the contracts or post additional collateral for those contracts in a net liability position, taking into account all collateral already posted.
8. Mortgage Servicing Assets
We originate and periodically sell commercial and residential mortgage loans but continue to service those loans for the buyers. We also may purchase the right to service commercial mortgage loans for other lenders. We record a servicing asset if we purchase or retain the right to service loans in exchange for servicing fees that exceed the going market servicing rate and are considered more than adequate compensation for servicing. Additional information pertaining to the accounting for mortgage and other servicing assets is included in Note 1 (“Summary of Significant Accounting Policies”) under the heading “Servicing Assets” beginning on page 106 of our 20182019 Form 10-K.
Commercial
Changes in the carrying amount of commercial mortgage servicing assets are summarized as follows:
| | | | Three months ended June 30, | | Six months ended June 30, | Three months ended June 30, | | Six months ended June 30, |
| in millions | 2019 |
| 2018 |
| | 2019 |
| 2018 |
| 2020 |
| 2019 |
| | 2020 |
| 2019 |
|
| Balance at beginning of period | $ | 497 |
| $ | 435 |
| | $ | 502 |
| $ | 412 |
| $ | 543 |
| $ | 497 |
| | $ | 539 |
| $ | 502 |
|
| Servicing retained from loan sales | 23 |
| 29 |
| | 41 |
| 56 |
| 53 |
| 23 |
| | 77 |
| 41 |
|
| Purchases | 17 |
| 12 |
| | 23 |
| 33 |
| 7 |
| 17 |
| | 18 |
| 23 |
|
| Amortization | (28 | ) | (25 | ) | | (57 | ) | (50 | ) | (30 | ) | (28 | ) | | (59 | ) | (57 | ) |
| Temporary impairments | | (8 | ) | — |
| | (10 | ) | — |
|
| Balance at end of period | $ | 509 |
| $ | 451 |
| | $ | 509 |
| $ | 451 |
| $ | 565 |
| $ | 509 |
| | $ | 565 |
| $ | 509 |
|
| Fair value at end of period | $ | 723 |
| $ | 646 |
| | $ | 723 |
| $ | 646 |
| $ | 663 |
| $ | 723 |
| | $ | 663 |
| $ | 723 |
|
| | | | | | | |
The fair value of commercial mortgage servicing assets is determined by calculating the present value of future cash flows associated with servicing the loans. This calculation uses a number of assumptions that are based on current market conditions. The range and weighted average of the significant unobservable inputs used to determine the fair value of our commercial mortgage servicing assets at June 30, 2019,2020, and June 30, 2018,2019, along with the valuation techniques, are shown in the following table:
|
| | | | | |
| | dollars in millions | | June 30, 20192020 | | June 30, 20182019 |
| | Valuation Technique | Significant Unobservable Input | Range (Weighted Average) |
| |
| | Discounted cash flow | Expected defaults | 1.00 - 2.00% (1.13%(1.15%) | | 1.00 - 3.00% (1.17%2.00% (1.13%) |
| | | Residual cash flows discount rate | 7.006.97 - 11.54% (9.26%16.16% (9.42%) | | 7.00 - 15.00% (9.06%11.54% (9.26%) |
| | | Escrow earn rate | 0.78 - 2.25% (1.66%) | | 1.92 - 3.13% (2.63%) | | 2.40 - 3.82% (3.10%) |
| | | Loan assumption rate | 0.00 - 3.02% (1.40%3.37% (1.32%) | | 0.00 - 3.00% (1.19%3.02% (1.40%) |
If these economic assumptions change or prove incorrect, the fair value of commercial mortgage servicing assets may also change. Expected credit losses, escrow earning rates, and discount rates are critical to the valuation of commercial mortgage servicing assets. Estimates of these assumptions are based on how a market participant would view the respective rates, and reflect historical data associated with the commercial mortgage loans, industry trends, and other considerations. Actual rates may differ from those estimated due to changes in a variety of economic factors. A decrease in the value assigned to the escrow earning rates would cause a decrease in the fair value of our commercial mortgage servicing assets. An increase in the assumed default rates of commercial mortgage loans or an increase in the assigned discount rates would cause a decrease in the fair value of our commercial mortgage servicing assets. Prepayment activity on commercial serviced loans does not significantly affect the valuation of our commercial mortgage servicing assets. Unlike residential mortgages, commercial mortgages experience significantly lower prepayments due to certain contractual restrictions affecting the borrower’s ability to prepay the mortgage.
The amortization of commercial servicing assets is determined in proportion to, and over the period of, the estimated net servicing income. The amortization of commercial servicing assets for each period, as shown in the table at the beginning of this note, is recorded as a reduction to contractual fee income. The contractual fee income from servicing commercial mortgage loans totaled $99 million for the six-month period ended June 30, 2020, and $95 million for the six-month period ended June 30, 2019, and $85 million for the six-month period ended June 30, 2018.2019. This fee income was offset by $57$59 million of amortization for the six-month period ended June 30, 2019,2020, and $50$57 million for the six-month period ended June 30, 2018.2019. Both the contractual fee income and the amortization are recorded, net, in “mortgage“commercial mortgage servicing fees” on the income statement.
Residential
Changes in the carrying amount of residential mortgage servicing assets are summarized as follows:
| | | | Three months ended June 30, | | Six months ended June 30, | Three months ended June 30, | | Six months ended June 30, |
| in millions | 2019 |
| 2018 |
| | 2019 |
| 2018 |
| 2020 |
| 2019 |
| | 2020 |
| 2019 |
|
| Balance at beginning of period | $ | 38 |
| $ | 32 |
| | $ | 37 |
| $ | 31 |
| $ | 40 |
| $ | 38 |
| | $ | 46 |
| $ | 37 |
|
| Servicing retained from loan sales | 2 |
| 3 |
| | 4 |
| 5 |
| 8 |
| 2 |
| | 13 |
| 4 |
|
| Purchases | — |
| — |
| | — |
| — |
| — |
| — |
| | — |
| — |
|
| Amortization | (1 | ) | (1 | ) | | (2 | ) | (2 | ) | (3 | ) | (1 | ) | | (5 | ) | (2 | ) |
| Temporary (impairments) recoveries | | 1 |
| — |
| | (8 | ) | — |
|
| Balance at end of period | $ | 39 |
| $ | 34 |
| | $ | 39 |
| $ | 34 |
| $ | 46 |
| $ | 39 |
| | $ | 46 |
| $ | 39 |
|
| Fair value at end of period | $ | 45 |
| $ | 43 |
| | $ | 45 |
| $ | 43 |
| $ | 46 |
| $ | 45 |
| | $ | 46 |
| $ | 45 |
|
| | | | | | | |
The fair value of mortgage servicing assets is determined by calculating the present value of future cash flows associated with servicing the loans. This calculation uses a number of assumptions that are based on current market conditions. The range and weighted-average of the significant unobservable inputs used to fair value our mortgage servicing assets at June 30, 2019,2020, and June 30, 2018,2019, along with the valuation techniques, are shown in the following table:
|
| | | | | |
| | dollars in millions | | June 30, 2020 | | June 30, 2019 | | June 30, 2018 |
| | Valuation Technique | Significant Unobservable Input | Range (Weighted Average) |
| |
| | Discounted cash flow | Prepayment speed | 12.29 - 55.18% (16.89%) | | 10.95 - 62.06% (12.52%) | | 8.39 - 49.39% (9.17%) |
| | | Discount rate | 7.55 - 9.27% (7.64%) | | 7.50 - 10.00% (7.53%) | | 8.50 - 11.00% (8.54%) |
| | | Servicing cost | $62 - $4,375$5,135 ($67.55)77.45) | | $7662 - $4,385$4,375 ($82.38)67.55) |
If these economic assumptions change or prove incorrect, the fair value of residential mortgage servicing assets may also change. Prepayment speed, discount rates, and servicing cost are critical to the valuation of servicing assets. Estimates of these assumptions are based on how a market participant would view the respective rates, and reflect historical data associated with the loans, industry trends, and other considerations. Actual rates may differ from those estimated due to changes in a variety of economic factors. An increase in the prepayment speed, assigned discount rates, and servicing cost assumptions would also cause a negative impact on the fair value of our residential mortgage servicing assets.
The amortization of residential servicing assets is determined in proportion to, and over the period of, the estimated net residential servicing income. The amortization of servicing assets for June 30, 2019,2020, as shown in the table above, is recorded as a reduction to contractual fee income. The contractual fee income from servicing residential mortgage loans totaled $14 million for the six-month period ended June 30, 2020, and $9 million for the six-month period ended June 30, 2019,2019. This fee income was offset by $5 million of amortization for the six-month period ended June 30, 2020, and $7$2 million for the six-month period ended June 30, 2018. This fee income was offset by $2 million of amortization for both the six-month periods ended June 30, 2019, and June 30, 2018.2019. Both the contractual fee income and the amortization are recorded, net, in “mortgage servicing fees”“consumer mortgage income” on the income statement.
9. Leases
As a lessee, we enter into leases of land, buildings, and equipment. Our real estate leases primarily relate to bank branches and office space. The leases of equipment principally relate to technology assets for data processing and data storage. As a lessor, we primarily provide financing through our equipment leasing business.
Lessee
Our leases are classified as either operating or financing and have remaining terms ranging from 1 to 20 years with the exception For more information on our leasing activity, see Note 10 (“Leases”) beginning on page 143 of certain ground leases that have terms over 30 years. Leases with an initial term of less than 1 year are not recorded on the balance sheet. The related expense is recognized on a straight-line basis over the lease term. For leases with initial terms greater than one year, right-of-use assets are reported on the balance sheet.
Certain leases contain options to extend the lease term for up to five years. Some leases give us the option to terminate, for a penalty or at the lessor's discretion. Leases with variable payments are primarily based on adjustments for inflation over the term of the lease based on a contractually defined index. Certain ATM leases include variable payments based on volume of transactions.
Operating lease expense is recognized in "net occupancy" and "equipment" on the income statement. The components of lease expense are summarized as follows:
|
| | | | | | |
| in millions | Three months ended June 30, 2019 | Six months ended June 30, 2019 |
| Operating lease cost | $ | 34 |
| $ | 68 |
|
| Finance lease cost: | | |
| Amortization of right-of-use assets | 1 |
| 1 |
|
| Variable lease cost | 6 |
| 11 |
|
Total lease cost (a), (b) | $ | 41 |
| $ | 80 |
|
| | | |
| |
(a) | Interest on lease liabilities for finance leases was less than $1 million for the three and six months ended June 30, 2019. |
| |
(b) | Short-term lease cost was less than less than $1 million for the three and six months ended June 30, 2019. |
Cash flows related to leases are summarized as follows:
|
| | | | | | |
| in millions | Three months ended June 30, 2019 | Six months ended June 30, 2019 |
Cash paid for amounts included in the measurement of lease liabilities: (a) | | |
| Operating cash flows from operating leases | $ | 37 |
| $ | 73 |
|
| Financing cash flows from finance leases | 1 |
| 1 |
|
Right-of-use assets obtained in exchange for lease obligations: (b) | | |
| Operating leases | $ | 16 |
| $ | 44 |
|
| | | |
| |
(a) | Operating cash flows from finance leases were less than $1 million for the three and six months ended June 30, 2019. |
| |
(b) | There were no right-of-use assets obtained in exchange for finance lease obligations for the three and six months ended June 30, 2019. |
Additional balance sheet information related to leases is summarized as follows:
|
| | | | |
| in millions | Balance sheet classification | June 30, 2019 |
| Operating lease assets | Accrued income and other assets | $ | 695 |
|
| Operating lease liabilities | Accrued expense and other liabilities | 775 |
|
| Finance leases: | | |
| Property and equipment, gross | Premises and equipment | 28 |
|
| Accumulated depreciation | Premises and equipment | (16 | ) |
| Property and equipment, net | | 12 |
|
| | | |
| Finance lease liabilities | Long-term debt | 15 |
|
| | | |
Information pertaining to the lease term and weighted-average discount rate is summarized as follows:
|
| | |
| June 30, 2019 |
Weighted-average remaining lease term: | |
Operating leases | 7.8 |
|
Finance leases | 6.44 |
|
Weighted-average discount rate: | |
Operating leases | 3.28 | % |
Finance leases | 3.90 | % |
| |
Maturities of lease liabilities are summarized as follows:
|
| | | | | | | | | |
| in millions | Operating Leases | Finance Leases | Total |
| 2019 | $ | 72 |
| $ | 2 |
| $ | 74 |
|
| 2020 | 141 |
| 3 |
| 144 |
|
| 2021 | 127 |
| 3 |
| 130 |
|
| 2022 | 111 |
| 3 |
| 114 |
|
| 2023 | 95 |
| 2 |
| 97 |
|
| Thereafter | 339 |
| 5 |
| 344 |
|
| Total lease payments | 885 |
| 18 |
| 903 |
|
| Less imputed interest | 110 |
| 3 |
| 113 |
|
| Total | $ | 775 |
| $ | 15 |
| $ | 790 |
|
| | | | |
Lessor Equipment Leasing
Leases may have fixed or floating rate terms. Variable payments are based on an index or other specified rate and are included in rental payments. Certain leases contain an option to extend the lease term or the option to terminate at the discretion of the lessee. Under certain conditions, lease agreements may also contain the option for a lessee to purchase the underlying asset.
Interest income from sales-type and direct financing leases is recognized in "interest income — loans" on the statement of income.income statement. Income related to operating leases is recognized in “operating lease income and other leasing gains” on the income statement. The components of equipment leasing income are summarized in the table below:
| | | | | | | | | Three months ended June 30, | | Six months ended June 30, |
| in millions | Three months ended June 30, 2019 | Six months ended June 30, 2019 | 2020 |
| 2019 |
| | 2020 |
| 2019 |
|
| Sales-type and direct financing leases | | | | |
| Interest income on lease receivable | $ | 31 |
| $ | 61 |
| $ | 27 |
| $ | 31 |
| | $ | 55 |
| $ | 61 |
|
| Interest income related to accretion of unguaranteed residual asset | 3 |
| 6 |
| 3 |
| 3 |
| | 6 |
| 6 |
|
| Interest income on deferred fees and costs | — |
| — |
| — |
| — |
| | — |
| — |
|
| Total sales-type and direct financing lease income | 34 |
| 67 |
| 30 |
| 34 |
| | 61 |
| 67 |
|
| Operating leases | | | | |
| Operating lease income related to lease payments | 33 |
| 66 |
| 35 |
| 33 |
| | 69 |
| 66 |
|
| Other operating leasing gains | 11 |
| 15 |
| 25 |
| 11 |
| | 21 |
| 15 |
|
| Total operating lease income and other leasing gains | 44 |
| 81 |
| 60 |
| 44 |
| | 90 |
| 81 |
|
| Total lease income | $ | 78 |
| $ | 148 |
| $ | 90 |
| $ | 78 |
| | $ | 151 |
| $ | 148 |
|
| | | | | |
Equipment leasing receivablesIn April 2020, the FASB provided elections under which entities can choose to account for eligible rent concessions either by applying the modification accounting in ASC 842 or by applying an expedient to account for them outside of the modification framework, thus, forgoing the performance of an assessment to determine whether contractual provisions in existing lease arrangements provide enforceable rights and obligations. Modification accounting may require remeasurement and reallocation of contract consideration. To be eligible for the expedient, rent concessions must relate to sales-typethe COVID-19 pandemic and direct financing leases. The composition of the net investment in sales-type and direct financing leases is as follows:
|
| | | |
| in millions | June 30, 2019 |
| Lease receivables | $ | 3,689 |
|
| Unearned income | (345 | ) |
| Unguaranteed residual value | 430 |
|
| Deferred fees and costs | 17 |
|
| Net investment in sales-type and direct financing leases | $ | 3,791 |
|
| | |
The residual value component of a lease represents the fair value of the leased asset at the end of the lease term. We rely on industry data, historical experience, independent appraisals and the experience of the equipment leasing asset management team to value lease residuals. Relationships with a number of equipment vendors give the asset management team insight into the life cycle of the leased equipment, pending product upgrades and competing products. Effective January 1, 2019, asmeet certain criteria. As a result of the implementation of ASU 2016-02,pandemic, Key will assess net investments inhas begun providing lessees with 90 day deferrals on its equipment leases including residual values, for impairment and recognize any impairment losses in accordance with the impairment guidance for financial instruments. The carrying amount of residual assets covered by residual value guarantees was $289 millionhas elected not to apply modification accounting. Rent concessions were not material at June 30, 2019.
At June 30, 2019, minimum future lease payments to be received for sales-type and direct financing leases are as follows:
|
| | | |
| in millions | Sales-type and direct financing lease payments |
| 2019 | $ | 640 |
|
| 2020 | 1,008 |
|
| 2021 | 731 |
|
| 2022 | 493 |
|
| 2023 | 318 |
|
| Thereafter | 499 |
|
| Total lease payments | $ | 3,689 |
|
| | |
At June 30, 2019, minimum future lease payments to be received for operating leases are as follows:
|
| | | |
| in millions | Operating lease payments |
| 2019 | $ | 64 |
|
| 2020 | 123 |
|
| 2021 | 106 |
|
| 2022 | 90 |
|
| 2023 | 75 |
|
| Thereafter | 220 |
|
| Total lease payments | $ | 678 |
|
| | |
The carrying amount of operating lease assets at June 30, 2019, was $948 million.2020.
10. Variable Interest Entities
Our significant VIEs are summarized below. Additional information pertaining to the criteria used in determining if an entity is a VIE is included in Note 1213 (“Variable Interest Entities “) beginning on page 142146 of our 20182019 Form 10-K.
LIHTC investments. We had $1.4 billion and $1.4$1.5 billion of investments in LIHTC operating partnerships at June 30, 2019,2020, and December 31, 2018,2019, respectively. These investments are recorded in “accrued income and other assets” on our balance sheet. We do not have any loss reserves recorded related to these investments because we believe the likelihood of any loss to be remote. For all legally binding, unfunded equity commitments, we increase our recognized investment and recognize a liability. As of June 30, 2019,2020, and December 31, 2018,2019, we had liabilities of $489$465 million and $532$546 million, respectively, related to investments in qualified affordable housing projects, which are recorded in “accrued expenses and other liabilities” on our balance sheet. We continue to invest in these LIHTC operating partnerships.
The assets and liabilities presented in the table below convey the size of KCDC’s direct and indirect investments at June 30, 2019,2020, and December 31, 2018.2019. As these investments represent unconsolidated VIEs, the assets and liabilities of the investments themselves are not recorded on our balance sheet. Additional information pertaining to our LIHTC investments is included in Note 1213 (“Variable Interest Entities “)Entities”) beginning on page 142146 of our 20182019 Form 10-K.
| | | | Unconsolidated VIEs | Unconsolidated VIEs |
| in millions | Total Assets | Total Liabilities | Maximum Exposure to Loss | Total Assets | Total Liabilities | Maximum Exposure to Loss |
| June 30, 2019 | | |
| June 30, 2020 | | |
| LIHTC investments | $ | 6,276 |
| $ | 2,588 |
| $ | 1,739 |
| $ | 6,300 |
| $ | 2,534 |
| $ | 1,760 |
|
| December 31, 2018 | | |
| December 31, 2019 | | |
| LIHTC investments | $ | 5,932 |
| $ | 2,569 |
| $ | 1,740 |
| $ | 6,405 |
| $ | 2,526 |
| $ | 1,846 |
|
We amortize our LIHTC investments over the period that we expect to receive the tax benefits. During the first six months of 2019,2020, we recognized $89$97 million of amortization and $92$90 million of tax credits associated with these investments within “income taxes” on our income statement. During the first six months of 2018,2019, we recognized $83$89 million of amortization and $81$92 million of tax credits associated with these investments within “income taxes” on our income statement.
Principal investments. Our maximum exposure to loss associated with indirect principal investments consists of the investments’ fair value plus any unfunded equity commitments. The fair value of our indirect principal investments totaled $76$56 million and $96$68 million at June 30, 2019,2020, and December 31, 2018,2019, respectively. These
investments are recorded in “other investments” on our balance sheet. The table below reflects the size of the private equity funds in which we were invested as well as our maximum exposure to loss in connection with these investments at June 30, 2019,2020, and December 31, 2018.2019.
| | | | Unconsolidated VIEs | Unconsolidated VIEs |
| in millions | Total Assets | Total Liabilities | Maximum Exposure to Loss | Total Assets | Total Liabilities | Maximum Exposure to Loss |
| June 30, 2019 | | |
| June 30, 2020 | | |
| Indirect investments | $ | 15,018 |
| $ | 286 |
| $ | 100 |
| $ | 9,930 |
| $ | 177 |
| $ | 74 |
|
| December 31, 2018 | | |
| December 31, 2019 | | |
| Indirect investments | $ | 19,659 |
| $ | 376 |
| $ | 122 |
| $ | 12,954 |
| $ | 205 |
| $ | 89 |
|
Through our principal investing entities, we have formed and funded operating entities that provide management and other related services to our investment company funds, which directly invest in portfolio companies. These entities had no0 assets at June 30, 20192020, and December 31, 20182019, that can be used to settle the entities’ obligations. The entities had no0 liabilities at June 30, 20192020, and December 31, 2018,2019, and other equity investors have no recourse to our general credit.
Additional information on our indirect and direct principal investments is provided in Note 5 (“Fair Value Measurements”) and in Note 1213 (“Variable Interest Entities “) beginning on page 142146 of our 20182019 Form 10-K.
Other unconsolidated VIEs. We are involved with other various entities in the normal course of business which we have determined to be VIEs. We have determined that we are not the primary beneficiary of these VIEs because we do not have the power to direct the activities that most significantly impact their economic performance. Our assets associated with these unconsolidated VIEs totaled $287$300 million at June 30, 2019,2020, and $248$282 million at December 31, 2018.2019. These assets are recorded in “accrued income and other assets,” “other investments,” “securities available for sale,” and “loans, net of unearned income” on our balance sheet. We had liabilities totaling $2$1 million and $2$1 million associated with these unconsolidated VIEs at June 30, 2019,2020, and December 31, 2018,2019, respectively. Additional information pertaining to our other unconsolidated VIEs is included in Note 1213 (“Variable Interest Entities“) under the heading “Other unconsolidated VIEs” on page 144148 of our 20182019 Form 10-K.
11. Income Taxes
Income Tax Provision
In accordance with the applicable accounting guidance, the principal method established for computing the provision for income taxes in interim periods requires us to make our best estimate of the effective tax rate expected to be applicable for the full year. This estimated effective tax rate is then applied to interim consolidated pre-tax operating income to determine the interim provision for income taxes.
The effective tax rate, which is the provision for income taxes as a percentage of income before income taxes, was 14.0% for the second quarter of 2020 and 16.8% for the second quarter of 2019 and 17.6% for the second quarter of 2018.2019. The effective tax rates are less than our combined federal and state statutory tax rate of 23.7%, primarily due to income from investments in tax-advantaged assets such as corporate-owned life insurance and credits associated with renewable energy and low-income housing investments.
Deferred Tax AssetTaxes
At June 30, 2019,2020, we had a net deferred tax liability of $101$177 million, compared to a net deferred tax assetliability of $222$89 million at December 31, 2018,2019, which are both included in “accrued income and other assets” on the balance sheet.
To determine the amount of deferred tax assets that are more likely than not to be realized, and therefore recorded, we conduct a quarterly assessment of all available evidence. This evidence includes, but is not limited to, taxable income in prior periods, projected future taxable income, and projected future reversals of deferred tax items. These assessments involve a degree of subjectivity and may undergo change. Based on these criteria, we had a0 valuation allowance of $11 million at June 30, 2019,2020, and $11 million at December 31, 2018. The valuation allowance is associated with certain state net operating loss carryforwards, state credit carryforwards, and federal and state capital loss carryforwards.2019.
Unrecognized Tax Benefits
At June 30, 2020, Key’s unrecognized tax benefits were $18 million. As permitted under the applicable accounting guidance for income taxes, it is our policy to recognize interest and penalties related to unrecognized tax benefits in “income tax expense.” At June 30, 2019, Key’s unrecognized tax benefits were $37 million.
Pre-1988 Bank Reserves Acquired in a Business Combination
Retained earnings of KeyBank included approximately $92 million of allocated bad debt deductions for which no income taxes have been recorded. Under current federal law, these reserves are subject to recapture into taxable income if KeyBank, or any successor, fails to maintain its bank status under the Internal Revenue Code or makes non-dividend distributions or distributions greater than its accumulated earnings and profits. No deferred tax liability has been established as these events are not expected to occur in the foreseeable future.
12. Acquisitions, Divestiture,Acquisition and Discontinued Operations
AcquisitionsAcquisition
Laurel Road Digital Lending Business. On April 3, 2019, KeyBank acquired Laurel Road's digital lending business from Laurel Road Bank. Laurel Road Bank's three3 bank branches located in southeast Connecticut were
not part of this transaction. Through the acquisition, KeyBank expects to enhance its digital capabilities with state-of-the-art, customer-centric technology and to leverage Laurel Road's proven ability to attract and serve professional millennial clients. The acquisition is accounted for as a business combination. DuringAs a result of the second quarter of 2019,acquisition, we recognized provisional identifiable intangible assets with an estimateda fair value of $37 million. We also recognized provisionalmillion and goodwill of $148 million in connection with this acquisition. These fair value estimates represent our best estimate of fair value and are expected to be finalized over a period of up to one year from the acquisition date.
Divestiture
Key Insurance & Benefits Services, Inc.On March 29, 2018, we announced that we had entered into a definitive agreement to sell KIBS to USI Insurance Services. We acquired KIBS as a partmillion. The valuation of the 2016 merger with First Niagara. We completed the sale to USI Insurance Services on May 4, 2018. At the closeacquired assets and liabilities of the sale, we recognized a $73 million net gain on sale. In the third quarter of 2018, we recognized an additional $5 million gain upon the finalization of the purchase price.Laurel Road was final at June 30, 2020.
Discontinued operations
Discontinued operations primarily includes our government-guaranteed and private education lending business. At June 30, 2019,2020, and December 31, 2018,2019, approximately $964$780 million and $1.1 billion,$865 million, respectively, of education loans are included in discontinued assets on the consolidated balance sheets. Net interest income after provision for credit losses for this business is not material and is included in income (loss) from discontinued operations, net of taxes on the consolidated statements of income.
13. Securities Financing Activities
We enter into repurchase agreements to finance overnight customer sweep deposits. We also enter into repurchase and reverse repurchase agreements to settle other securities obligations. We account for these securities financing agreements as collateralized financing transactions. Repurchase and reverse repurchase agreements are recorded on the balance sheet at the amounts for which the securities will be subsequently sold or repurchased. Securities borrowed transactions are recorded on the balance sheet at the amounts of cash collateral advanced. While our securities financing agreements incorporate a right of set off, the assets and liabilities are reported on a gross basis. Reverse repurchase agreements and securities borrowed transactions are included in “short-term investments” on the balance sheet; repurchase agreements are included in “federal funds purchased and securities sold under repurchase agreements.” Additional information regarding our securities financing activities, including risk management activities, is provided in Note 16 (“Securities Financing Activities”) beginning on page 148151 of our 20182019 Form 10-K.
The following table summarizes our securities financing agreements at June 30, 2019,2020, and December 31, 2018:2019:
| | | | June 30, 2019 | | December 31, 2018 | June 30, 2020 | | December 31, 2019 |
| in millions | Gross Amount Presented in Balance Sheet | Netting Adjustments (a) | Collateral (b) | Net Amounts | | Gross Amount Presented in Balance Sheet | Netting Adjustments (a) | Collateral (b) | Net Amounts | Gross Amount Presented in Balance Sheet | Netting Adjustments (a) | Collateral (b) | Net Amounts | | Gross Amount Presented in Balance Sheet | Netting Adjustments (a) | Collateral (b) | Net Amounts |
| Offsetting of financial assets: | | | | | | | | | | |
| Reverse repurchase agreements | $ | 210 |
| $ | (6 | ) | $ | (204 | ) | — |
| | $ | 14 |
| $ | (14 | ) | — |
| — |
| $ | 9 |
| $ | (6 | ) | (3 | ) | — |
| | $ | 5 |
| $ | (5 | ) | — |
| — |
|
| Total | $ | 210 |
| $ | (6 | ) | $ | (204 | ) | — |
| | $ | 14 |
| $ | (14 | ) | — |
| — |
| $ | 9 |
| $ | (6 | ) | (3 | ) | — |
| | $ | 5 |
| $ | (5 | ) | — |
| — |
|
| | | | | | | | | | | |
| Offsetting of financial liabilities: | | | | | | | | | | |
Repurchase agreements (c) | $ | 161 |
| $ | (6 | ) | $ | (155 | ) | — |
| | $ | 319 |
| $ | (14 | ) | $ | (305 | ) | — |
| $ | 267 |
| $ | (6 | ) | $ | (261 | ) | — |
| | $ | 187 |
| $ | (7 | ) | $ | (180 | ) | — |
|
| Total | $ | 161 |
| $ | (6 | ) | $ | (155 | ) | — |
| | $ | 319 |
| $ | (14 | ) | $ | (305 | ) | — |
| $ | 267 |
| $ | (6 | ) | $ | (261 | ) | — |
| | $ | 187 |
| $ | (7 | ) | $ | (180 | ) | — |
|
| | | | | | | | | | | |
| |
| (a) | Netting adjustments take into account the impact of master netting agreements that allow us to settle with a single counterparty on a net basis. |
| |
| (b) | These adjustments take into account the impact of bilateral collateral agreements that allow us to offset the net positions with the related collateral. The application of collateral cannot reduce the net position below zero. Therefore, excess collateral, if any, is not reflected above. |
| |
| (c) | Repurchase agreements are collateralized by mortgaged-backed agency securities and are contracted on an overnight or continuous basis. |
As of June 30, 2019,2020, the carrying amount of assets pledged as collateral against repurchase agreements totaled $211$396 million. Assets pledged as collateral are reported in “securities available for sale” and “held-to-maturity securities” on our balance sheet. At June 30, 2019,2020, the liabilities associated with collateral pledged were solely comprised of customer sweep financing activity and had a carrying value of $155$260 million. The collateral pledged under customer sweep repurchase agreements is posted to a third-party custodian and cannot be sold or repledged
by the secured party. The risk related to a decline in the market value of collateral pledged is minimal given the collateral's high credit quality and the overnight duration of the repurchase agreements.
14. Employee Benefits
Pension Plans
The components of net pension cost (benefit) for all funded and unfunded plans are recorded in “other expense” and are summarized in the following table. For more information on our Pension Plans and Other Postretirement Benefit Plans, see Note 1718 (“Employee Benefits”) beginning on page 151155 of our 20182019 Form 10-K.
| | | | Three months ended June 30, | | Six months ended June 30, | Three months ended June 30, | | Six months ended June 30, |
| in millions | 2019 |
| 2018 |
| | 2019 |
| 2018 |
| 2020 |
| 2019 |
| | 2020 |
| 2019 |
|
| Interest cost on PBO | $ | 12 |
| $ | 10 |
| | $ | 23 |
| $ | 20 |
| $ | 8 |
| $ | 12 |
| | $ | 17 |
| $ | 23 |
|
| Expected return on plan assets | (12 | ) | (13 | ) | | (24 | ) | (26 | ) | (9 | ) | (12 | ) | | (19 | ) | (24 | ) |
| Amortization of losses | 3 |
| 4 |
| | 7 |
| 8 |
| 4 |
| 3 |
| | 8 |
| 7 |
|
| Settlement loss | | 4 |
| — |
| | 8 |
| — |
|
| Net pension cost | $ | 3 |
| $ | 1 |
| | $ | 6 |
| $ | 2 |
| $ | 7 |
| $ | 3 |
| | $ | 14 |
| $ | 6 |
|
| | | | | | | |
15. Trust Preferred Securities Issued by Unconsolidated Subsidiaries
We own the outstanding common stock of business trusts formed by us that issued corporation-obligated, mandatorily redeemable, trust preferred securities. The trusts used the proceeds from the issuance of their trust preferred securities and common stock to buy debentures issued by KeyCorp. These debentures are the trusts’ only assets; the interest payments from the debentures finance the distributions paid on the mandatorily redeemable trust preferred securities. The outstanding common stock of these business trusts is recorded in “other investments” on our balance sheet. We unconditionally guarantee the following payments or distributions on behalf of the trusts:
required distributions on the trust preferred securities;
the redemption price when a capital security is redeemed; and
the amounts due if a trust is liquidated or terminated.
The Regulatory Capital Rules, discussed in “Supervision and regulation” in Item 2 of this report, require us to treat our mandatorily redeemable trust preferred securities as Tier 2 capital.
The trust preferred securities, common stock, and related debentures are summarized as follows:
| | | dollars in millions | Trust Preferred Securities, Net of Discount (a) | Common Stock | Principal Amount of Debentures, Net of Discount (b) | Interest Rate of Trust Preferred Securities and Debentures (c) | Maturity of Trust Preferred Securities and Debentures | Trust Preferred Securities, Net of Discount (a) | Common Stock | Principal Amount of Debentures, Net of Discount (b) | Interest Rate of Trust Preferred Securities and Debentures (c) | Maturity of Trust Preferred Securities and Debentures |
| June 30, 2019 | | | |
| June 30, 2020 | | | |
| KeyCorp Capital I | $ | 156 |
| $ | 6 |
| $ | 162 |
| 3.332 | % | 2028 |
| $ | 156 |
| $ | 6 |
| $ | 162 |
| 2.173 | % | 2028 |
|
| KeyCorp Capital II | 106 |
| 4 |
| 110 |
| 6.875 |
| 2029 |
| 114 |
| 4 |
| 118 |
| 6.875 |
| 2029 |
|
| KeyCorp Capital III | 138 |
| 4 |
| 142 |
| 7.750 |
| 2029 |
| 149 |
| 4 |
| 153 |
| 7.750 |
| 2029 |
|
| HNC Statutory Trust III | 19 |
| 1 |
| 20 |
| 3.924 |
| 2035 |
| 19 |
| 1 |
| 20 |
| 1.760 |
| 2035 |
|
| Willow Grove Statutory Trust I | 18 |
| 1 |
| 19 |
| 3.720 |
| 2036 |
| 19 |
| 1 |
| 20 |
| 1.631 |
| 2036 |
|
| HNC Statutory Trust IV | 16 |
| 1 |
| 17 |
| 3.863 |
| 2037 |
| 17 |
| 1 |
| 18 |
| 2.040 |
| 2037 |
|
| Westbank Capital Trust II | 7 |
| — |
| 7 |
| 4.577 |
| 2034 |
| 8 |
| — |
| 8 |
| 2.496 |
| 2034 |
|
| Westbank Capital Trust III | 7 |
| — |
| 7 |
| 4.577 |
| 2034 |
| 8 |
| — |
| 8 |
| 2.496 |
| 2034 |
|
| Total | $ | 467 |
| $ | 17 |
| $ | 484 |
| 5.536 | % | — |
| $ | 490 |
| $ | 17 |
| $ | 507 |
| 4.932 | % | — |
|
| | | | | |
| December 31, 2018 | $ | 454 |
| $ | 17 |
| $ | 471 |
| 5.447 | % | — |
| |
| December 31, 2019 | | $ | 466 |
| $ | 17 |
| $ | 483 |
| 5.214 | % | — |
|
| | | | | |
| |
| (a) | The trust preferred securities must be redeemed when the related debentures mature, or earlier if provided in the governing indenture. Each issue of trust preferred securities carries an interest rate identical to that of the related debenture. Certain trust preferred securities include basis adjustments related to fair value hedges totaling $58$78 million at June 30, 2019,2020, and $46$57 million at December 31, 2018.2019. See Note 7 (“Derivatives and Hedging Activities”) for an explanation of fair value hedges. |
| |
| (b) | We have the right to redeem these debentures. If the debentures purchased by KeyCorp Capital I, HNC Statutory Trust III, Willow Grove Statutory Trust I, HNC Statutory Trust IV, Westbank Capital Trust II, or Westbank Capital Trust III are redeemed before they mature, the redemption price will be the principal amount, plus any accrued but unpaid interest. If the debentures purchased by KeyCorp Capital II or KeyCorp Capital III are redeemed before they mature, the redemption price will be the greater of: (i) the principal amount, plus any accrued but unpaid interest, or (ii) the sum of the present values of principal and interest payments discounted at the Treasury Rate (as defined in the applicable indenture), plus 20 basis points for KeyCorp Capital II or 25 basis points for KeyCorp Capital III, or 50 basis points in the case of redemption upon either a tax or a capital treatment event for either KeyCorp Capital II or KeyCorp Capital III, plus any accrued but unpaid interest. The principal amount of certain debentures includes basis adjustments related to fair value hedges totaling $58$78 million at June 30, 2019,2020, and $46$57 million at December 31, 2018.2019. See Note 7 (“Derivatives and Hedging Activities”) for an explanation of fair value hedges. The principal amount of debentures, net of discounts, is included in “long-term debt” on the balance sheet. |
| |
| (c) | The interest rates for the trust preferred securities issued by KeyCorp Capital II and KeyCorp Capital III are fixed. The trust preferred securities issued by KeyCorp Capital I have a floating interest rate, equal to three-month LIBOR plus 74 basis points, that reprices quarterly. The trust preferred securities issued by HNC Statutory Trust III have a floating interest rate, equal to three-month LIBOR plus 140 basis points, that reprices quarterly. The trust preferred securities issued by Willow Grove Statutory Trust I have a floating interest rate, equal to three-month LIBOR plus 131 basis points, that reprices quarterly. The trust preferred securities issued by HNC Statutory Trust IV have a floating interest rate, equal to three-month LIBOR plus 128 basis points, that reprices quarterly. The trust preferred securities issued by Westbank Capital Trust II and Westbank Capital Trust III each have a floating interest rate, equal to three-month LIBOR plus 219 basis points, that reprices quarterly. The total interest rates are weighted-average rates. |
16. Contingent Liabilities and Guarantees
Legal Proceedings
Litigation. From time to time, in the ordinary course of business, we and our subsidiaries are subject to various litigation, investigations, and administrative proceedings. Private, civil litigations may range from individual actions involving a single plaintiff to putative class action lawsuits with potentially thousands of class members. Investigations may involve both formal and informal proceedings, by both government agencies and self-regulatory bodies. These matters may involve claims for substantial monetary relief. At times, these matters may present novel claims or legal theories. Due to the complex nature of these various other matters, it may be years before some matters are resolved. While it is impossible to ascertain the ultimate resolution or range of financial liability, based on information presently known to us, we do not believe there is any matter to which we are a party, or involving any of our properties that, individually or in the aggregate, would reasonably be expected to have a material adverse effect on our financial condition. We continually monitor and reassess the potential materiality of these litigation matters. We note, however, that in light of the inherent uncertainty in legal proceedings there can be no assurance that the ultimate resolution will not exceed established reserves. As a result, the outcome of a particular matter, or a combination of matters, may be material to our results of operations for a particular period, depending upon the size of the loss or our income for that particular period.
Guarantees
We are a guarantor in various agreements with third parties. The following table shows the types of guarantees that we had outstanding at June 30, 2019.2020. Information pertaining to the basis for determining the liabilities recorded in connection with these guarantees is included in Note 1 (“Summary of Significant Accounting Policies”) under the heading “Guarantees”“Contingencies and Guarantees” beginning on page 106108 of our 20182019 Form 10-K.
| | | June 30, 2019 | Maximum Potential Undiscounted Future Payments | Liability Recorded | |
| June 30, 2020 | Maximum Potential Undiscounted Future Payments | Liability Recorded |
| in millions | Maximum Potential Undiscounted Future Payments | Liability Recorded |
| Financial guarantees: | |
| Standby letters of credit | $ | 3,086 |
| $ | 73 |
| $ | 3,048 |
| $ | 69 |
|
| Recourse agreement with FNMA | 4,392 |
| 6 |
| 5,463 |
| 22 |
|
| Residential mortgage reserve | 1,617 |
| 6 |
| 2,057 |
| 8 |
|
Written put options (a) | 2,854 |
| 49 |
| 3,276 |
| 84 |
|
| Total | $ | 11,949 |
| $ | 134 |
| $ | 13,844 |
| $ | 183 |
|
| | | |
| |
| (a) | The maximum potential undiscounted future payments represent notional amounts of derivatives qualifying as guarantees. |
We determine the payment/performance risk associated with each type of guarantee described below based on the probability that we could be required to make the maximum potential undiscounted future payments shown in the preceding table. We use a scale of low (0% to 30% probability of payment), moderate (greater than 30% to 70% probability of payment), or high (greater than 70% probability of payment) to assess the payment/performance risk, and have determined that the payment/performance risk associated with each type of guarantee outstanding at June 30, 2019,2020, is low. Information pertaining to the nature of each of the guarantees listed below is included in Note 2122 (“Commitments, Contingent Liabilities, and Guarantees”) under the heading “Guarantees” beginning on page 163165 of our 20182019 Form 10-K.
Standby letters of credit. At June 30, 2019,2020, our standby letters of credit had a remaining weighted-average life of two years, with remaining actual lives ranging from less than one year to as many as 1615 years.
Recourse agreement with FNMA. At June 30, 2019,2020, the outstanding commercial mortgage loans in this program had a weighted-average remaining term of 7.87.9 years, and the unpaid principal balance outstanding of loans sold by us as a participant was $15.1$18.2 billion. The maximum potential amount of undiscounted future payments that we could be required to make under this program, as shown in the preceding table, is equal to approximately 29% of the principal balance of loans outstanding at June 30, 2019.
Residential Mortgage Banking. At June 30, 2019, the unpaid principal balance outstanding of loans sold by us in this program was $5.4 billion. The risk assessment is low for the residential mortgage product. The maximum potential amount of undiscounted future payments that we could be required to make under this program, as shown in the preceding table, is equal to approximately 30% of the principal balance of loans outstanding at June 30, 2019. 2020. FNMA delegates responsibility for originating, underwriting, and servicing mortgages, and we assume a limited portion of the risk of loss during the remaining term on each commercial mortgage loan that we sell to FNMA. We maintain a reserve for such potential losses in an amount that we believe approximates the fair value of our liability in addition to the expected credit loss for the guarantee as described in Note 4 (“Asset Quality “).
TableResidential Mortgage Banking. At June 30, 2020, the unpaid principal balance outstanding of contentsloans sold by us in this program was $6.9 billion. The maximum potential amount of undiscounted future payments that we could be required to make under this program, as shown in the preceding table, is equal to approximately 30% of the principal balance of loans outstanding at June 30, 2020.
Our liability for estimated repurchase obligations on loans sold, which is included in other liabilities on our balance sheet, was $6$8 million at June 30, 2019.2020. For more information on our residential mortgages, see Note 8 (“Mortgage Servicing Assets “).
Written put options. At June 30, 2019,2020, our written put options had an average life of three years. These written put options are accounted for as derivatives at fair value, as further discussed in Note 7 (“Derivatives and Hedging Activities”).
Written put options where the counterparty is a broker-dealer or bank are accounted for as derivatives at fair value but are not considered guarantees since these counterparties typically do not hold the underlying instruments. In addition, we are a purchaser and seller of credit derivatives, which are further discussed in Note 7 (“Derivatives and Hedging Activities”).
Other Off-Balance Sheet Risk
Other off-balance sheet risk stems from financial instruments that do not meet the definition of a guarantee as specified in the applicable accounting guidance, and from other relationships. Additional information pertaining to types of other off-balance sheet risk is included in Note 2122 (“Commitments, Contingent Liabilities, and Guarantees”) under the heading “Other Off-Balance Sheet Risk” on page 165168 of our 20182019 Form 10-K.
17. Accumulated Other Comprehensive Income
Our changes in AOCI for the three and six months ended June 30, 2019,2020, and June 30, 2018,2019, are as follows:
| | | in millions | Unrealized gains (losses) on securities available for sale | Unrealized gains (losses) on derivative financial instruments | Foreign currency translation adjustment | Net pension and postretirement benefit costs | Total | Unrealized gains (losses) on securities available for sale | Unrealized gains (losses) on derivative financial instruments | Foreign currency translation adjustment | Net pension and postretirement benefit costs | Total |
| Balance at December 31, 2019 | | $ | 115 |
| $ | 250 |
| — |
| $ | (339 | ) | $ | 26 |
|
| Other comprehensive income before reclassification, net of income taxes | | 538 |
| 456 |
| — |
| — |
| 994 |
|
Amounts reclassified from AOCI, net of income taxes (a) | | (3 | ) | (93 | ) | — |
| 12 |
| (84 | ) |
| Net current-period other comprehensive income, net of income taxes | | 535 |
| 363 |
| — |
| 12 |
| 910 |
|
| Balance at June 30, 2020 | | $ | 650 |
| $ | 613 |
| — |
| $ | (327 | ) | $ | 936 |
|
| | | |
| Balance at March 31, 2020 | | $ | 520 |
| $ | 627 |
| — |
| $ | (333 | ) | $ | 814 |
|
| Other comprehensive income before reclassification, net of income taxes | | 130 |
| 54 |
| — |
| — |
| 184 |
|
Amounts reclassified from AOCI, net of income taxes (a) | | — |
| (68 | ) | — |
| 6 |
| (62 | ) |
| Net current-period other comprehensive income, net of income taxes | | 130 |
| (14 | ) | — |
| 6 |
| 122 |
|
| Balance at June 30, 2020 | | $ | 650 |
| $ | 613 |
| — |
| $ | (327 | ) | $ | 936 |
|
| | | |
| Balance at December 31, 2018 | $ | (373 | ) | $ | (50 | ) | $ | (14 | ) | $ | (381 | ) | $ | (818 | ) | $ | (373 | ) | $ | (50 | ) | $ | (14 | ) | $ | (381 | ) | $ | (818 | ) |
| Other comprehensive income before reclassification, net of income taxes | 475 |
| 284 |
| 4 |
| 14 |
| 777 |
| 475 |
| 284 |
| 4 |
| 14 |
| 777 |
|
Amounts reclassified from AOCI, net of income taxes (a) | — |
| 34 |
| — |
| 5 |
| 39 |
| — |
| 34 |
| — |
| 5 |
| 39 |
|
| Net current-period other comprehensive income, net of income taxes | 475 |
| 318 |
| 4 |
| 19 |
| 816 |
| 475 |
| 318 |
| 4 |
| 19 |
| 816 |
|
| Balance at June 30, 2019 | $ | 102 |
| $ | 268 |
| $ | (10 | ) | $ | (362 | ) | $ | (2 | ) | $ | 102 |
| $ | 268 |
| $ | (10 | ) | $ | (362 | ) | $ | (2 | ) |
| | | |
| Balance at March 31, 2019 | $ | (189 | ) | $ | 49 |
| $ | (11 | ) | $ | (379 | ) | $ | (530 | ) | $ | (189 | ) | $ | 49 |
| $ | (11 | ) | $ | (379 | ) | $ | (530 | ) |
| Other comprehensive income before reclassification, net of income taxes | 291 |
| 204 |
| 1 |
| 15 |
| 511 |
| 291 |
| 204 |
| 1 |
| 15 |
| 511 |
|
Amounts reclassified from AOCI, net of income taxes (a) | — |
| 15 |
| — |
| 2 |
| 17 |
| — |
| 15 |
| — |
| 2 |
| 17 |
|
| Net current-period other comprehensive income, net of income taxes | 291 |
| 219 |
| 1 |
| 17 |
| 528 |
| 291 |
| 219 |
| 1 |
| 17 |
| 528 |
|
| Balance at June 30, 2019 | $ | 102 |
| $ | 268 |
| $ | (10 | ) | $ | (362 | ) | $ | (2 | ) | $ | 102 |
| $ | 268 |
| $ | (10 | ) | $ | (362 | ) | $ | (2 | ) |
| | | |
| Balance at December 31, 2017 | $ | (311 | ) | $ | (86 | ) | $ | 9 |
| $ | (391 | ) | $ | (779 | ) | |
| Other comprehensive income before reclassification, net of income taxes | (216 | ) | (100 | ) | (11 | ) | — |
| (327 | ) | |
Amounts reclassified from AOCI, net of income taxes (a) | — |
| 20 |
| — |
| 6 |
| 26 |
| |
| Other amounts reclassified from AOCI, net of income taxes | — |
| — |
| (5 | ) | — |
| (5 | ) | |
| Net current-period other comprehensive income, net of income taxes | (216 | ) | (80 | ) | (16 | ) | 6 |
| (306 | ) | |
| Balance at June 30, 2018 | $ | (527 | ) | $ | (166 | ) | $ | (7 | ) | $ | (385 | ) | $ | (1,085 | ) | |
| | | |
| Balance at March 31, 2018 | (461 | ) | $ | (149 | ) | $ | 7 |
| $ | (388 | ) | $ | (991 | ) | |
| Other comprehensive income before reclassification, net of income taxes | (66 | ) | (35 | ) | (9 | ) | — |
| (110 | ) | |
Amounts reclassified from AOCI, net of income taxes (a) | — |
| 18 |
| — |
| 3 |
| 21 |
| |
| Other amounts reclassified from AOCI, net of income taxes | — |
| — |
| (5 | ) | — |
| (5 | ) | |
| Net current-period other comprehensive income, net of income taxes | (66 | ) | (17 | ) | (14 | ) | 3 |
| (94 | ) | |
| Balance at June 30, 2018 | $ | (527 | ) | $ | (166 | ) | $ | (7 | ) | $ | (385 | ) | $ | (1,085 | ) | |
| | | |
| |
| (a) | See table below for details about these reclassifications. |
Our reclassifications out of AOCI for the three and six months ended June 30, 2019,2020, and June 30, 2018,2019, are as follows: |
| | | | | | | |
| | Six months ended June 30, | Affected Line Item in the Statement Where Net Income is Presented |
| in millions | 2019 | 2018 |
| Unrealized gains (losses) on derivative financial instruments | | | |
| Interest rate | $ | (43 | ) | $ | (27 | ) | Interest income — Loans |
| Interest rate | (1 | ) | — |
| Interest expense — Long-term debt |
| | (44 | ) | (27 | ) | Income (loss) from continuing operations before income taxes |
| | (10 | ) | (7 | ) | Income taxes |
| | $ | (34 | ) | $ | (20 | ) | Income (loss) from continuing operations |
| Net pension and postretirement benefit costs | | | |
| Amortization of losses | $ | (7 | ) | $ | (8 | ) | Personnel expense |
| | (7 | ) | (8 | ) | Income (loss) from continuing operations before income taxes |
| | (2 | ) | (2 | ) | Income taxes |
| | $ | (5 | ) | $ | (6 | ) | Income (loss) from continuing operations |
| | | | |
| | | | | | | |
| | Three months ended June 30, | Affected Line Item in the Statement Where Net Income is Presented | Three months ended June 30, | Affected Line Item in the Statement Where Net Income is Presented |
| in millions | 2019 | 2018 | 2020 | 2019 |
| Unrealized gains (losses) on derivative financial instruments | | | | |
| Interest rate | $ | (19 | ) | $ | (25 | ) | Interest income — Loans | $ | 90 |
| $ | (19 | ) | Interest income — Loans |
| Interest rate | — |
| 1 |
| Interest expense — Long-term debt | (1 | ) | — |
| Interest expense — Long-term debt |
| | (19 | ) | (24 | ) | Income (loss) from continuing operations before income taxes | 89 |
| (19 | ) | Income (loss) from continuing operations before income taxes |
| | (4 | ) | (6 | ) | Income taxes | 21 |
| (4 | ) | Income taxes |
| | $ | (15 | ) | (18 | ) | Income (loss) from continuing operations | $ | 68 |
| (15 | ) | Income (loss) from continuing operations |
| Net pension and postretirement benefit costs | | | | | | |
| Amortization of losses | $ | (3 | ) | (4 | ) | Personnel expense | $ | (4 | ) | $ | (3 | ) | Other expense |
| Settlement loss | | (4 | ) | — |
| Other expense |
| | (3 | ) | (4 | ) | Income (loss) from continuing operations before income taxes | (8 | ) | (3 | ) | Income (loss) from continuing operations before income taxes |
| | (1 | ) | (1 | ) | Income taxes | (2 | ) | (1 | ) | Income taxes |
| | $ | (2 | ) | $ | (3 | ) | Income (loss) from continuing operations | $ | (6 | ) | $ | (2 | ) | Income (loss) from continuing operations |
| | | | | |
|
| | | | | | | |
| | Six months ended June 30, | Affected Line Item in the Statement Where Net Income is Presented |
| in millions | 2020 | 2019 |
| Unrealized gains (losses) on available for sale securities | | | |
| Realized gains | $ | 4 |
| — |
| Other income |
| | 4 |
| — |
| Income (loss) from continuing operations before income taxes |
| | 1 |
| — |
| Income taxes |
| | $ | 3 |
| — |
| Income (loss) from continuing operations |
| Unrealized gains (losses) on derivative financial instruments | | | |
| Interest rate | $ | 124 |
| $ | (43 | ) | Interest income — Loans |
| Interest rate | (2 | ) | (1 | ) | Interest expense — Long-term debt |
| | 122 |
| (44 | ) | Income (loss) from continuing operations before income taxes |
| | 29 |
| (10 | ) | Income taxes |
| | $ | 93 |
| (34 | ) | Income (loss) from continuing operations |
| Net pension and postretirement benefit costs | | | |
| Amortization of losses | $ | (8 | ) | $ | (7 | ) | Other expense |
| Settlement loss | (8 | ) | — |
| Other expense |
| | (16 | ) | (7 | ) | Income (loss) from continuing operations before income taxes |
| | (4 | ) | (2 | ) | Income taxes |
| | $ | (12 | ) | $ | (5 | ) | Income (loss) from continuing operations |
| | | | |
18. Shareholders' Equity
Comprehensive Capital Plan
As previously reported and as authorized by the Board and pursuant to our 2018 capital plan (which was effective through the second quarter of 2019) submitted and not objected to by the Federal Reserve, we have authority to repurchase up to $1.225 billion of our Common Shares. We completed $180 million of Common Share repurchases, including $179 million of Common Share repurchases in the open market and $1 million of Common Share repurchases related to employee equity compensation programs, in the second quarter of 2019 under this authorization.
Consistent with our 20182019 capital plan, the Board declared a quarterly dividend of $.17$.185 per Common Share for the second quarter of 2019.2020. Per our announcement on March 17, 2020, share repurchase activity has been temporarily suspended in response to the COVID-19 pandemic.
On April 18, 2019, we announced our 2019 capital plan. Share repurchases of up to $1.0 billion are included in the 2019 capital plan which is effective from the third quarter of 2019 through the second quarter of 2020. Our 2019 capital plan also includes a 9% increase in our Common Stock dividend to $.185 per Common Share, which was approved by our Board of Directors on July 17, 2019.
Preferred Stock
On April 29, 2019, we issued $450 million of depositary shares, each representing a 1/40th ownership interest in a share of our Fixed Rate Perpetual Noncumulative Series G Preferred Stock.
| | | Preferred stock series | Amount outstanding (in millions) |
| Shares authorized and outstanding |
| Par value |
| Liquidation preference |
| Ownership interest per depositary share | Liquidation preference per depositary share |
| Second quarter 2019 dividends paid per depositary share |
| Amount outstanding (in millions) |
| Shares authorized and outstanding |
| Par value |
| Liquidation preference |
| Ownership interest per depositary share | Liquidation preference per depositary share |
| Second quarter 2020 dividends paid per depositary share |
|
| Fixed-to-Floating Rate Perpetual Noncumulative Series D | $ | 525 |
| 21,000 |
| $ | 1 |
| $ | 25,000 |
| 1/25th | $ | 1,000 |
| $ | 12.50 |
| $ | 525 |
| 21,000 |
| $ | 1 |
| $ | 25,000 |
| 1/25th | $ | 1,000 |
| $ | 12.50 |
|
| Fixed-to-Floating Rate Perpetual Noncumulative Series E | 500 |
| 500,000 |
| 1 |
| 1,000 |
| 1/40th | 25 |
| .382813 |
| 500 |
| 500,000 |
| 1 |
| 1,000 |
| 1/40th | 25 |
| .382813 |
|
| Fixed Rate Perpetual Noncumulative Series F | 425 |
| 425,000 |
| 1 |
| 1,000 |
| 1/40th | 25 |
| .353125 |
| 425 |
| 425,000 |
| 1 |
| 1,000 |
| 1/40th | 25 |
| .353125 |
|
| Fixed Rate Perpetual Non-Cumulative Series G | 450 |
| 450,000 |
| 1 |
| 1,000 |
| 1/40th | 25 |
| — |
| 450 |
| 450,000 |
| 1 |
| 1,000 |
| 1/40th | 25 |
| .351563 |
|
| | | | | | | | | | | |
19. Business Segment Reporting
Key previously reported its results of operations through two reportable business segments, Key Community Bank and Key Corporate Bank. In the first quarter of 2019, Key underwent a company-wide organizational change, resulting in the realignment of its businesses into two reportable business segments, Consumer Bank and Commercial Bank, with the remaining operations that do not meet the criteria for disclosure as a separate reportable business recorded in Other. The new business segment structure aligns with how management reviews performance and makes decisions by client, segment and business unit. Prior period information was restated to conform to the new business segment structure. Additionally, goodwill was reallocated to the new segments on a relative fair value basis. On March 31, 2019, the Consumer Bank was allocated goodwill in the amount of $1.6 billion and the Commercial Bank was allocated goodwill in the amount of $912 million.
The following is a description of the segments and their primary businesses at June 30, 2019.
Consumer Bank
The Consumer Bank serves individuals and small businesses throughout our 15-state branch footprint by offering a variety of deposit and investment products, personal finance and financial wellness services, lending, mortgage and home equity, student loan refinancing, credit card, treasury services, and business advisory services. The Consumer Bank also purchases retail auto sales contracts via a network of auto dealerships. The auto dealerships finance the sale of automobiles as the initial lender and then assign the contracts to us pursuant to dealer agreements. In addition, wealth management and investment services are offered to assist institutional, non-profit, and high-net-worth clients with their banking, trust, portfolio management, life insurance, charitable giving, and related needs.
Commercial Bank
The Commercial Bank is an aggregation of our Institutional and Commercial operating segments. The Commercial operating segment is a full-service corporate bank focused principally on serving the needs of middle market clients in seven7 industry sectors: consumer, energy, healthcare, industrial, public sector, real estate, and technology. The Commercial operating segment is also a significant servicer of commercial mortgage loans and a significant special servicer of CMBS. The Institutional operating segment delivers a broad suite of banking and capital markets products to its clients, including syndicated finance, debt and equity capital markets, commercial payments, equipment finance, commercial mortgage banking, derivatives, foreign exchange, financial advisory, and public finance.
Other
Other includes various corporate treasury activities such as management of our investment securities portfolio, long-term debt, short-term liquidity and funding activities, and balance sheet risk management, our principal investing unit, and various exit portfolios as well as reconciling items which primarily represents the unallocated portion of nonearning assets of corporate support functions. Charges related to the funding of these assets are part of net interest income and are allocated to the business segments through noninterest expense. Reconciling items
also include intercompany eliminations and certain items that are not allocated to the business segments because they do not reflect their normal operations.
The development and application of the methodologies that we use to allocate items among our business segments is a dynamic process. Accordingly, financial results may be revised periodically to reflect enhanced alignment of expense base allocations drivers, changes in the risk profile of a particular business, or changes in our organizational structure.
The table below shows selected financial data for our business segments for the three- and six-month periods ended June 30, 2019,2020, and June 30, 2018.2019.
| | | Three months ended June 30, | Consumer Bank | | Commercial Bank | | Other | | Total Key | Consumer Bank | | Commercial Bank | | Other | | Total Key |
| dollars in millions | 2019 |
| 2018 |
| | 2019 |
| 2018 |
| | 2019 |
| 2018 |
| | 2019 |
| 2018 |
| 2020 |
| 2019 |
| | 2020 |
| 2019 |
| | 2020 |
| 2019 |
| | 2020 |
| 2019 |
|
| SUMMARY OF OPERATIONS | | | | | | | | | | | | | | |
| Net interest income (TE) | $ | 594 |
| $ | 574 |
| | $ | 405 |
| $ | 418 |
| | $ | (10 | ) | $ | (5 | ) | | $ | 989 |
| $ | 987 |
| $ | 594 |
| $ | 594 |
| | $ | 442 |
| $ | 405 |
| | $ | (11 | ) | $ | (10 | ) | | $ | 1,025 |
| $ | 989 |
|
| Noninterest income | 231 |
| 236 |
| | 354 |
| 303 |
| | 37 |
| 121 |
| | 622 |
| 660 |
| 247 |
| 231 |
| | 405 |
| 355 |
| | 40 |
| 36 |
| | 692 |
| 622 |
|
Total revenue (TE) (a) | 825 |
| 810 |
| | 759 |
| 721 |
| | 27 |
| 116 |
| | 1,611 |
| 1,647 |
| 841 |
| 825 |
| | 847 |
| 760 |
| | 29 |
| 26 |
| | 1,717 |
| 1,611 |
|
| Provision for credit losses | 40 |
| 39 |
| | 33 |
| 25 |
| | 1 |
| — |
| | 74 |
| 64 |
| 167 |
| 40 |
| | 314 |
| 33 |
| | 1 |
| 1 |
| | 482 |
| 74 |
|
| Depreciation and amortization expense | 25 |
| 26 |
| | 35 |
| 34 |
| | 37 |
| 39 |
| | 97 |
| 99 |
| 20 |
| 25 |
| | 37 |
| 35 |
| | 34 |
| 37 |
| | 91 |
| 97 |
|
| Other noninterest expense | 535 |
| 543 |
| | 346 |
| 357 |
| | 41 |
| (6 | ) | | 922 |
| 894 |
| 535 |
| 527 |
| | 366 |
| 354 |
| | 21 |
| 41 |
| | 922 |
| 922 |
|
| Income (loss) from continuing operations before income taxes (TE) | 225 |
| 202 |
| | 345 |
| 305 |
| | (52 | ) | 83 |
| | 518 |
| 590 |
| 119 |
| 233 |
| | 130 |
| 338 |
| | (27 | ) | (53 | ) | | 222 |
| 518 |
|
| Allocated income taxes and TE adjustments | 53 |
| 47 |
| | 62 |
| 49 |
| | (20 | ) | 15 |
| | 95 |
| 111 |
| 28 |
| 56 |
| | 10 |
| 61 |
| | (1 | ) | (22 | ) | | 37 |
| 95 |
|
| Income (loss) from continuing operations | 172 |
| 155 |
| | 283 |
| 256 |
| | (32 | ) | 68 |
| | 423 |
| 479 |
| 91 |
| 177 |
| | 120 |
| 277 |
| | (26 | ) | (31 | ) | | 185 |
| 423 |
|
| Income (loss) from discontinued operations, net of taxes | — |
| — |
| | — |
| — |
| | 2 |
| 3 |
| | 2 |
| 3 |
| — |
| — |
| | — |
| — |
| | 2 |
| 2 |
| | 2 |
| 2 |
|
| Net income (loss) | 172 |
| 155 |
| | 283 |
| 256 |
| | (30 | ) | 71 |
| | 425 |
| 482 |
| 91 |
| 177 |
| | 120 |
| 277 |
| | (24 | ) | (29 | ) | | 187 |
| 425 |
|
| Less: Net income (loss) attributable to noncontrolling interests | — |
| — |
| | — |
| — |
| | — |
| — |
| | — |
| — |
| — |
| — |
| | — |
| — |
| | — |
| — |
| | — |
| — |
|
| Net income (loss) attributable to Key | $ | 172 |
| $ | 155 |
| | $ | 283 |
| $ | 256 |
| | $ | (30 | ) | $ | 71 |
| | $ | 425 |
| $ | 482 |
| $ | 91 |
| $ | 177 |
| | $ | 120 |
| $ | 277 |
| | $ | (24 | ) | $ | (29 | ) | | $ | 187 |
| $ | 425 |
|
| | | | | | | | | | | | | | | |
AVERAGE BALANCES (b) | | | | | | | | | | | | | | |
| Loans and leases | $ | 31,881 |
| $ | 31,276 |
| | $ | 57,924 |
| $ | 56,175 |
| | $ | 980 |
| $ | 1,193 |
| | $ | 90,785 |
| $ | 88,644 |
| $ | 39,197 |
| $ | 31,881 |
| | $ | 68,038 |
| $ | 57,918 |
| | $ | 706 |
| $ | 986 |
| | $ | 107,941 |
| $ | 90,785 |
|
Total assets (a) | 35,469 |
| 34,495 |
| | 65,907 |
| 63,948 |
| | 41,259 |
| 37,935 |
| | 142,635 |
| 136,378 |
| 44,106 |
| 35,469 |
| | 76,974 |
| 65,901 |
| | 43,019 |
| 41,265 |
| | 164,099 |
| 142,635 |
|
| Deposits | 72,303 |
| 68,279 |
| | 35,961 |
| 33,169 |
| | 1,337 |
| 2,555 |
| | 109,601 |
| 104,003 |
| 79,502 |
| 72,303 |
| | 46,099 |
| 35,960 |
| | 2,376 |
| 1,338 |
| | 127,977 |
| 109,601 |
|
| OTHER FINANCIAL DATA | | | | | | | | | | | | | | |
Net loan charge-offs (b) | $ | 40 |
| $ | 39 |
| | $ | 23 |
| $ | 22 |
| | 2 |
| (1 | ) | | $ | 65 |
| $ | 60 |
| $ | 39 |
| $ | 40 |
| | $ | 57 |
| $ | 23 |
| | $ | 1 |
| $ | 2 |
| | $ | 97 |
| $ | 65 |
|
Return on average allocated equity (b) | 21.12 | % | 18.88 | % | | 24.57 | % | 22.99 | % | | (1.48 | )% | 3.75 | % | | 10.26 | % | 12.78 | % | 10.38 | % | 21.75 | % | | 10.00 | % | 24.09 | % | | (1.12 | )% | (1.44 | )% | | 4.21 | % | 10.26 | % |
| Return on average allocated equity | 21.12 |
| 18.88 |
| | 24.57 |
| 22.99 |
| | (1.39 | ) | 3.92 |
| | 10.31 |
| 12.86 |
| 10.38 |
| 21.75 |
| | 10.00 |
| 24.09 |
| | (1.03 | ) | (1.34 | ) | | 4.25 |
| 10.31 |
|
Average full-time equivalent employees (c) | 9,440 |
| 10,067 |
| | 2,260 |
| 2,467 |
| | 5,506 |
| 5,842 |
| | 17,206 |
| 18,376 |
| 8,863 |
| 9,440 |
| | 2,096 |
| 2,260 |
| | 5,687 |
| 5,506 |
| | 16,646 |
| 17,206 |
|
| |
| (a) | Substantially all revenue generated by our major business segments is derived from clients that reside in the United States. Substantially all long-lived assets, including premises and equipment, capitalized software, and goodwill held by our major business segments, are located in the United States. |
| |
| (b) | From continuing operations. |
| |
| (c) | The number of average full-time equivalent employees was not adjusted for discontinued operations. |
| | | Six months ended June 30, | Consumer Bank | | Commercial Bank | | Other | | Total Key | Consumer Bank | | Commercial Bank | | Other | | Total Key |
| dollars in millions | 2019 |
| 2018 |
| | 2019 |
| 2018 |
| | 2019 |
| 2018 |
| | 2019 |
| 2018 |
| 2020 |
| 2019 |
| | 2020 |
| 2019 |
| | 2020 |
| | 2019 |
| | 2020 |
| 2019 |
|
| SUMMARY OF OPERATIONS | | | | | | | | | | | | | | | | |
| Net interest income (TE) | $ | 1,185 |
| $ | 1,126 |
| | $ | 806 |
| $ | 824 |
| | $ | (17 | ) | $ | (11 | ) | | $ | 1,974 |
| $ | 1,939 |
| $ | 1,184 |
| $ | 1,185 |
| | $ | 852 |
| $ | 807 |
| | $ | (22 | ) | | $ | (18 | ) | | $ | 2,014 |
| $ | 1,974 |
|
| Noninterest income | 445 |
| 457 |
| | 655 |
| 636 |
| | 58 |
| 168 |
| | 1,158 |
| 1,261 |
| 478 |
| 445 |
| | 624 |
| 654 |
| | 67 |
| | 59 |
| | 1,169 |
| 1,158 |
|
Total revenue (TE) (a) | 1,630 |
| 1,583 |
| | 1,461 |
| 1,460 |
| | 41 |
| 157 |
| | 3,132 |
| 3,200 |
| 1,662 |
| 1,630 |
| | 1,476 |
| 1,461 |
| | 45 |
| | 41 |
| | 3,183 |
| 3,132 |
|
| Provision for credit losses | 85 |
| 73 |
| | 49 |
| 54 |
| | 2 |
| (2 | ) | | 136 |
| 125 |
| 307 |
| 85 |
| | 529 |
| 49 |
| | 5 |
| | 2 |
| | 841 |
| 136 |
|
| Depreciation and amortization expense | 48 |
| 53 |
| | 65 |
| 69 |
| | 72 |
| 81 |
| | 185 |
| 203 |
| 41 |
| 48 |
| | 73 |
| 65 |
| | 68 |
| | 72 |
| | 182 |
| 185 |
|
| Other noninterest expense | 1,061 |
| 1,093 |
| | 680 |
| 700 |
| | 56 |
| 3 |
| | 1,797 |
| 1,796 |
| 1,058 |
| 1,044 |
| | 681 |
| 697 |
| | 23 |
| | 56 |
| | 1,762 |
| 1,797 |
|
| Income (loss) from continuing operations before income taxes (TE) | 436 |
| 364 |
| | 667 |
| 637 |
| | (89 | ) | 75 |
| | 1,014 |
| 1,076 |
| 256 |
| 453 |
| | 193 |
| 650 |
| | (51 | ) | | (89 | ) | | 398 |
| 1,014 |
|
| Allocated income taxes and TE adjustments | 103 |
| 86 |
| | 127 |
| 96 |
| | (45 | ) | (1 | ) | | 185 |
| 181 |
| 61 |
| 108 |
| | 3 |
| 123 |
| | 4 |
| | (46 | ) | | 68 |
| 185 |
|
| Income (loss) from continuing operations | 333 |
| 278 |
| | 540 |
| 541 |
| | (44 | ) | 76 |
| | 829 |
| 895 |
| 195 |
| 345 |
| | 190 |
| 527 |
| | (55 | ) | | (43 | ) | | 330 |
| 829 |
|
| Income (loss) from discontinued operations, net of taxes | — |
| — |
| | — |
| — |
| | 3 |
| 5 |
| | 3 |
| 5 |
| — |
| — |
| | — |
| — |
| | 3 |
| | 3 |
| | 3 |
| 3 |
|
| Net income (loss) | 333 |
| 278 |
| | 540 |
| 541 |
| | (41 | ) | 81 |
| | 832 |
| 900 |
| 195 |
| 345 |
| | 190 |
| 527 |
| | (52 | ) | | (40 | ) | | 333 |
| 832 |
|
| Less: Net income (loss) attributable to noncontrolling interests | — |
| — |
| | — |
| — |
| | — |
| — |
| | — |
| — |
| — |
| — |
| | — |
| — |
| | — |
| | — |
| | — |
| — |
|
| Net income (loss) attributable to Key | $ | 333 |
| $ | 278 |
| | $ | 540 |
| $ | 541 |
| | $ | (41 | ) | $ | 81 |
| | $ | 832 |
| $ | 900 |
| $ | 195 |
| $ | 345 |
| | $ | 190 |
| $ | 527 |
| | $ | (52 | ) | (d) | $ | (40 | ) | | $ | 333 |
| $ | 832 |
|
| | | | | | | | | | | | | | | | | |
AVERAGE BALANCES (b) | | | | | | | | | | | | | | | | |
| Loans and leases | $ | 31,603 |
| $ | 31,409 |
| | $ | 57,610 |
| $ | 55,210 |
| | $ | 1,007 |
| $ | 1,171 |
| | $ | 90,220 |
| $ | 87,790 |
| $ | 37,197 |
| $ | 31,603 |
| | $ | 64,060 |
| $ | 57,594 |
| | $ | 801 |
| | $ | 1,023 |
| | $ | 102,058 |
| $ | 90,220 |
|
Total assets (a) | 35,103 |
| 34,638 |
| | 65,405 |
| 62,865 |
| | 40,877 |
| 38,148 |
| | 141,385 |
| 135,651 |
| 41,283 |
| 35,103 |
| | 73,178 |
| 65,390 |
| | 40,703 |
| | 40,892 |
| | 155,164 |
| 141,385 |
|
| Deposits | 71,798 |
| 67,852 |
| | 35,194 |
| 32,983 |
| | 1,602 |
| 2,448 |
| | 108,594 |
| 103,283 |
| 76,411 |
| 71,798 |
| | 41,078 |
| 35,193 |
| | 1,664 |
| | 1,603 |
| | 119,153 |
| 108,594 |
|
| OTHER FINANCIAL DATA | | | | | | | | | | | | | | | | |
Net loan charge-offs (b) | $ | 74 |
| $ | 73 |
| | $ | 53 |
| $ | 41 |
| | 2 |
| — |
| | $ | 129 |
| $ | 114 |
| $ | 83 |
| $ | 74 |
| | $ | 97 |
| $ | 53 |
| | 1 |
| | 2 |
| | $ | 181 |
| $ | 129 |
|
Return on average allocated equity (b) | 20.76 | % | 16.98 | % | | 23.93 | % | 24.74 | % | | (1.06 | )% | 2.11 | % | | 10.37 | % | 12.06 | % | 11.21 | % | 21.51 | % | | 8.03 | % | 23.36 | % | | (1.20 | )% | | (1.04 | )% | | 3.80 | % | 10.37 | % |
| Return on average allocated equity | 20.76 |
| 16.98 |
| | 23.93 |
| 24.74 |
| | (.99 | ) | 2.25 |
| | 10.41 |
| 12.13 |
| 11.21 |
| 21.51 |
| | 8.03 |
| 23.36 |
| | (1.14 | ) | | (.97 | ) | | 3.84 |
| 10.41 |
|
Average full-time equivalent employees (c) | 9,531 |
| 10,082 |
| | 2,314 |
| 2,466 |
| | 5,534 |
| 5,910 |
| | 17,379 |
| 18,458 |
| 8,885 |
| 9,531 |
| | 2,082 |
| 2,314 |
| | 5,620 |
| | 5,534 |
| | 16,587 |
| 17,379 |
|
| |
| (a) | Substantially all revenue generated by our major business segments is derived from clients that reside in the United States. Substantially all long-lived assets, including premises and equipment, capitalized software, and goodwill held by our major business segments, are located in the United States. |
| |
| (b) | From continuing operations. |
| |
| (c) | The number of average full-time equivalent employees was not adjusted for discontinued operations. |
20. Revenue from Contracts with Customers
The following table represents a disaggregation of revenue from contracts with customers, by business segment, for the three- and six-month periods ended June 30, 2019,2020, and June 30, 2018. Refer to Note 19 (“Business Segment Reporting”) for a description of the company-wide organizational change which occurred in the first quarter of 2019 resulting in the realignment of Key’s businesses into two reportable business segments, Consumer Bank and Commercial Bank. Prior period information was restated to conform to the new business segment structure.2019.
| | | | Three months ended June 30, 2019 | | Three months ended June 30, 2018 | Three months ended June 30, 2020 | | Three months ended June 30, 2019 |
| dollars in millions | Consumer Bank | Commercial Bank | Total Contract Revenue | | Consumer Bank | Commercial Bank | Total Contract Revenue | Consumer Bank | Commercial Bank | Total Contract Revenue | | Consumer Bank | Commercial Bank | Total Contract Revenue |
| NONINTEREST INCOME | | | | | | |
| Trust and investment services income | $ | 91 |
| $ | 17 |
| $ | 108 |
| | $ | 91 |
| $ | 19 |
| $ | 110 |
| $ | 87 |
| $ | 15 |
| $ | 102 |
| | $ | 92 |
| $ | 17 |
| $ | 109 |
|
| Investment banking and debt placement fees | — |
| 65 |
| 65 |
| | — |
| 68 |
| 68 |
| — |
| 60 |
| 60 |
| | — |
| 65 |
| 65 |
|
| Services charges on deposit accounts | 56 |
| 27 |
| 83 |
| | 62 |
| 28 |
| 90 |
| 38 |
| 30 |
| 68 |
| | 56 |
| 27 |
| 83 |
|
| Cards and payments income | 44 |
| 28 |
| 72 |
| | 40 |
| 29 |
| 69 |
| 37 |
| 52 |
| 89 |
| | 44 |
| 28 |
| 72 |
|
| Other noninterest income | 4 |
| — |
| 4 |
| | 5 |
| — |
| 5 |
| 2 |
| — |
| 2 |
| | 4 |
| — |
| 4 |
|
| Total revenue from contracts with customers | $ | 195 |
| $ | 137 |
| $ | 332 |
| | $ | 198 |
| $ | 144 |
| $ | 342 |
| $ | 164 |
| $ | 157 |
| $ | 321 |
| | $ | 196 |
| $ | 137 |
| $ | 333 |
|
| | | | | | | |
Other noninterest income (a) | | $ | 253 |
| | | $ | 197 |
| | $ | 331 |
| | | $ | 253 |
|
Noninterest income from Other(b) | | 37 |
| | | 121 |
| | 40 |
| | | 36 |
|
| Total noninterest income | | $ | 622 |
| | | $ | 660 |
| | $ | 692 |
| | | $ | 622 |
|
| | | | | | | |
| |
| (a) | Noninterest income considered earned outside the scope of contracts with customers. |
| |
| (b) | Other includes other segments that consists of corporate treasury, our principal investing unit, and various exit portfolios as well as reconciling items which primarily represents the unallocated portion of nonearning assets of corporate support functions. Charges related to the funding of these assets are part of net interest income and are allocated to the business segments through noninterest expense. Reconciling items also includes intercompany eliminations and certain items that are not allocated to the business segments because they do not reflect their normal operations. Refer to Note 19 (“Business Segment Reporting”) for more information. |
| | | | Six months ended June 30, 2019 | | Six months ended June 30, 2018 | Six months ended June 30, 2020 | | Six months ended June 30, 2019 |
| dollars in millions | Consumer Bank | Commercial Bank | Total Contract Revenue | | Consumer Bank | Commercial Bank | Total Contract Revenue | Consumer Bank | Commercial Bank | Total Contract Revenue | | Consumer Bank | Commercial Bank | Total Contract Revenue |
| NONINTEREST INCOME | | | | | | |
| Trust and investment services income | $ | 176 |
| $ | 32 |
| $ | 208 |
| | $ | 176 |
| $ | 36 |
| $ | 212 |
| $ | 179 |
| $ | 34 |
| $ | 213 |
| | $ | 176 |
| $ | 32 |
| $ | 208 |
|
| Investment banking and debt placement fees | — |
| 110 |
| 110 |
| | — |
| 115 |
| 115 |
| — |
| 107 |
| 107 |
| | — |
| 110 |
| 110 |
|
| Services charges on deposit accounts | 110 |
| 55 |
| 165 |
| | 123 |
| 56 |
| 179 |
| 94 |
| 58 |
| 152 |
| | 111 |
| 55 |
| 166 |
|
| Cards and payments income | 81 |
| 55 |
| 136 |
| | 75 |
| 55 |
| 130 |
| 75 |
| 78 |
| 153 |
| | 81 |
| 54 |
| 135 |
|
| Other noninterest income | 6 |
| — |
| 6 |
| | 10 |
| — |
| 10 |
| 4 |
| — |
| 4 |
| | 6 |
| — |
| 6 |
|
| Total revenue from contracts with customers | $ | 373 |
| $ | 252 |
| $ | 625 |
| | $ | 384 |
| $ | 262 |
| $ | 646 |
| $ | 352 |
| $ | 277 |
| $ | 629 |
| | $ | 374 |
| $ | 251 |
| $ | 625 |
|
| | | | | | | |
Other noninterest income (a) | | $ | 475 |
| | | $ | 447 |
| | $ | 473 |
| | | $ | 474 |
|
Noninterest income from Other(b) | | 58 |
| | | 168 |
| | 67 |
| | | 59 |
|
| Total noninterest income | | $ | 1,158 |
| | | $ | 1,261 |
| | $ | 1,169 |
| | | $ | 1,158 |
|
| | | | | | | |
| |
| (a) | Noninterest income considered earned outside the scope of contracts with customers. |
| |
| (b) | Other includes other segments that consists of corporate treasury, our principal investing unit, and various exit portfolios as well as reconciling items which primarily represents the unallocated portion of nonearning assets of corporate support functions. Charges related to the funding of these assets are part of net interest income and are allocated to the business segments through noninterest expense. Reconciling items also includes intercompany eliminations and certain items that are not allocated to the business segments because they do not reflect their normal operations. Refer to Note 19 (“Business Segment Reporting”) for more information. |
We had no material contract assets or contract liabilities as of June 30, 2019,2020, and June 30, 2018.
21. Subsequent Event
As previously reported, on or about July 9, 2019, we discovered fraudulent activity associated with transactions conducted in the third quarter of 2019 by a business customer of KeyBank. We continue to investigate this matter to determine the potential exposure to us, which we currently estimate could be up to $90 million, net of tax. The ultimate financial impact could be lower and will depend, in part, on our success in our efforts to recover the funds. We plan to pursue all available sources of recovery and other means of mitigating the potential loss.
We are working with the appropriate law enforcement authorities in connection with this matter. We may be limited in what information we can disclose due to the ongoing investigation.
Based on our review of the circumstances of the fraudulent activity, we believe this incident is an isolated occurrence involving a single business relationship.2019.
Report of Ernst & Young LLP, Independent Registered Public Accounting Firm
To the Shareholders and Board of Directors of KeyCorp
Results of Review of Interim Financial Statements
We have reviewed the accompanying consolidated balance sheet of KeyCorp as of June 30, 2019,2020, the related consolidated statements of income, comprehensive income, and changes in equity for the three- and six- monthsix-month periods ended June 30, 20192020 and 2018,June 30, 2019, the related consolidated statements of cash flows for the six-month periodperiods ended June 30, 20192020 and 2018,2019, and the related notes (collectively referred to as the “consolidated interim financial statements”). Based on our reviews, we are not aware of any material modifications that should be made to the consolidated interim financial statements for them to be in conformity with U.S. generally accepted accounting principles.
We have previously audited, in accordance with the standards of the Public Company Accounting Oversight Board (United States) (PCAOB), the consolidated balance sheet of KeyCorp as of December 31, 2018,2019, and the related consolidated statements of income, comprehensive income, changes in equity and cash flows for the year then ended, and the related notes (not presented herein); and in our report dated February 25, 2019,26, 2020, we expressed an unqualified opinion on those consolidated financial statements. In our opinion, the information set forth in the accompanying consolidated balance sheet as of December 31, 20182019 is fairly stated, in all material respects, in relation to the consolidated balance sheet from which it has been derived.
Basis for Review Results
These financial statements are the responsibility of the KeyCorp's management. We are a public accounting firm registered with the PCAOB and are required to be independent with respect to KeyCorp in accordance with the U.S. federal securities laws and the applicable rules and regulations of the SEC and the PCAOB. We conducted our review in accordance with the standards of the PCAOB. A review of interim financial statements consists principally of applying analytical procedures and making inquiries of persons responsible for financial and accounting matters. It is substantially less in scope than an audit conducted in accordance with the standards of the PCAOB, the objective of which is the expression of an opinion regarding the financial statements taken as a whole. Accordingly, we do not express such an opinion.
|
| |
| |
| Cleveland, Ohio | |
August 1, 20193, 2020 | |
| |
| Item 3. | Quantitative and Qualitative Disclosure about Market Risk |
The information presented in the “Market risk management” section of the Management’s Discussion & Analysis of Financial Condition & Results of Operations is incorporated herein by reference.
| |
| Item 4. | Controls and Procedures |
As of the end of the period covered by this report, KeyCorp carried out an evaluation, under the supervision and with the participation of KeyCorp’s management, including our Chief Executive Officer and Chief Financial Officer, of the effectiveness of the design and operation of KeyCorp’s disclosure controls and procedures (as defined in Rule 13a-15(e) under the Securities Exchange Act of 1934 (the “Exchange Act”)), to ensure that information required to be disclosed by KeyCorp in reports that it files or submits under the Exchange Act, is recorded, processed, summarized and reported within the time periods specified in the SEC’s rules and forms, and that such information is accumulated and communicated to KeyCorp’s management, including its Chief Executive Officer and Chief Financial Officer, as appropriate, to allow for timely decisions regarding required disclosure. Based upon that evaluation, KeyCorp’s Chief Executive Officer and Chief Financial Officer concluded that the design and operation of these disclosure controls and procedures were effective, in all material respects, as of the end of the period covered by this report.
No changes were made to KeyCorp’s internal control over financial reporting (as defined in Rule 13a-15(f) under
the Exchange Act) during the last quarter that materially affected, or are reasonably likely to materially affect,
KeyCorp’s internal control over financial reporting. We implemented internal controls to ensure we adequately calculated changes due to, and properly assessed the impact of, the accounting standards updates related to our allowance for credit losses on our financial statements to facilitate its adoption on January 1, 2020. There were no significant changes to our internal control over financial reporting due to the adoption of the new standard.
PART II. OTHER INFORMATION
The information presented in the Legal Proceedings section of Note 16 (“Contingent Liabilities and Guarantees”) of the Notes to Consolidated Financial Statements (Unaudited) is incorporated herein by reference.
On at least a quarterly basis, we assess our liabilities and contingencies in connection with outstanding legal proceedings utilizing the latest information available. Where it is probable that we will incur a loss and the amount of the loss can be reasonably estimated, we record a liability in our consolidated financial statements. These legal reserves may be increased or decreased to reflect any relevant developments on a quarterly basis. Where a loss is not probable or the amount of the loss is not estimable, we have not accrued legal reserves, consistent with applicable accounting guidance. Based on information currently available to us, advice of counsel, and available insurance coverage, we believe that our established reserves are adequate and the liabilities arising from the legal proceedings will not have a material adverse effect on our consolidated financial condition. We note, however, that in light of the inherent uncertainty in legal proceedings there can be no assurance that the ultimate resolution will not exceed established reserves. As a result, the outcome of a particular matter or a combination of matters may be material to our results of operations for a particular period, depending upon the size of the loss or our income for that particular period.
For a discussion of certain risk factors affecting us, see the section titled “Supervision and Regulation” in Part I, Item 1. Business, on pages 10-23 of our 20182019 Form 10-K; Part I, Item 1A. Risk Factors, on pages 23-3423-33 of our 20182019 Form 10-K; the sectionsections titled “Supervision and regulation” and “Strategic developments” in this Form 10-Q; and our disclosure regarding forward-looking statements in this Form 10-Q. In addition, see the additional risk factors set forth in Part II, Item 1A. Risk Factors, on pages 97-99 of our First Quarter 2020 Form 10-Q for disclosure of new risk factors that have become applicable due to COVID-19 since the filing of our 2019 Form 10-K.
| |
| Item 2. | Unregistered Sales of Equity Securities and Use of Proceeds |
From time to time, KeyCorp or its principal subsidiary, KeyBank, may seek to retire, repurchase, or exchange outstanding debt of KeyCorp or KeyBank, and capital securities or preferred stock of KeyCorp, through cash purchase, privately negotiated transactions, or otherwise. Such transactions, if any, depend on prevailing market conditions, our liquidity and capital requirements, contractual restrictions, and other factors. The amounts involved may be material.
InOn April 2018,18, 2019, we submitted to the Federal Reserve and provided to the OCCannounced our 2018 capital plan under the annual CCAR process. On June 28, 2018, the Federal Reserve announced that it did not object to our 20182019 capital plan. Share repurchases of up to $1.225$1.0 billion were included in the 20182019 capital plan, which was effective from the third quarter of 20182019 through the second quarter of 2019.2020.
We completed $180 million of Common Share repurchases, including $179 million of Common Share repurchasesPer our announcement on March 17, 2020, share repurchase activity has been temporarily suspended in response to the open market and $1 million of Common Share repurchases related to employee equity compensation programs, in the second quarter of 2019 under our 2018 capital plan authorization.COVID-19 pandemic.
The following table summarizes our repurchases of our Common Shares for the three months ended June 30, 2019.2020.
|
| | | | | | | | | | | |
| Calendar month | Total number of shares
purchased (a) | | Average price paid per share | | Total number of shares purchased as part of publicly announced plans or programs | | Maximum number of shares that may yet be purchased as part of publicly announced plans or programs (b) |
| April 1-30 | 4,451,457 |
| | 17.19 |
| | 4,451,457 |
| | 7,432,069 |
|
| May 1-31 | 4,563,140 |
| | 17.43 |
| | 4,563,140 |
| | 3,187,148 |
|
| June 1-30 | 1,397,078 |
| | 17.18 |
| | 1,397,078 |
| | 1,515,114 |
|
| Total | 10,411,675 |
| | 17.29 |
| | 10,411,675 |
| | |
| | | | | | | | |
|
| | | | | | | | | | | |
| Calendar month | Total number of shares
purchased (a) | | Average price paid per share | | Total number of shares purchased as part of publicly announced plans or programs | | Maximum number of shares that may yet be purchased as part of publicly announced plans or programs (b) |
| April 1 - 30 | 6,866 |
| | 11.09 |
| | 6,866 |
| | 30,781,325 |
|
| May 1 - 31 | 12,457 |
| | 12.19 |
| | 12,457 |
| | 30,248,994 |
|
| June 1 - 30 | — |
| | — |
| | — |
| | 29,429,440 |
|
| Total | 19,323 |
| | 11.80 |
| | 19,323 |
| | |
| | | | | | | | |
| |
| (a) | Includes Common Shares deemed surrendered by employees in connection with our stock compensation and benefit plans to satisfy tax obligations. |
| |
| (b) | Calculated using the remaining general repurchase amount divided by the closing price of KeyCorp Common Shares as follows: on April 30, 20192020 at $17.55;$11.65; on May 31, 2019,29, 2020, at $15.97;$11.85; and on June 28, 2019,30, 2020, at $17.75$12.18. |
Item 6. Exhibits
|
| |
| |
| |
| |
| |
| |
| |
| |
| |
| |
| |
| |
| |
| |
| |
| |
| 101 | The following materials from KeyCorp’s Form 10-Q Report for the quarterly period ended June 30, 2019,2020, formatted in inline XBRL: (i) the Consolidated Balance Sheets; (ii) the Consolidated Statements of Income and Consolidated Statements of Comprehensive Income; (iii) the Consolidated Statements of Changes in Equity; (iv) the Consolidated Statements of Cash Flows; and (v) the Notes to Consolidated Financial Statements. |
| 104 | The cover page from KeyCorp’s Form 10-Q for the quarterly period ended June 30, 2019,2020, formatted in inline XBRL (contained in Exhibit 101). |
|
| |
#
| Indicates management contract or compensatory plan or arrangement. |
* | Furnished herewith. |
Information Available on Website
KeyCorp makes available free of charge on its website, www.key.com, its 20182019 Form 10-K, quarterly reports on Form 10-Q, current reports on Form 8-K, and amendments to these reports as soon as reasonably practicable after KeyCorp electronically files such material with, or furnishes it to, the SEC. We also make available a summary of filings made with the SEC of statements of beneficial ownership of our equity securities filed by our directors and officers under Section 16 of the Exchange Act. The “Financials — Regulatory Disclosures and Filings” tab of the investor relations section of our website includes public disclosures concerning our prior annual and mid-year stress-testing activities under the Dodd-Frank Act. Information contained on or accessible through our website or any other website referenced in this report is not part of this report.
SIGNATURE
Pursuant to the requirements of the Securities Exchange Act of 1934, the Registrant has duly caused this report to be signed on its behalf by the undersigned, thereunto duly authorized, on the date indicated.
|
| |
| | KEYCORP |
| | (Registrant) |
| | |
Date: August 1, 20193, 2020 | /s/ Douglas M. Schosser |
| | By: Douglas M. Schosser |
| | Chief Accounting Officer (Principal Accounting Officer) |