0000092230us-gaap:IntersegmentEliminationMembertfc:ConsumerBankingAndWealthMember2023-01-012023-03-31
UNITED STATES
SECURITIES AND EXCHANGE COMMISSION
Washington, D.C. 20549
FORM 10-Q
☒ Quarterly Report Pursuant to Section 13 or 15(d)
of the Securities Exchange Act of 1934
For the quarterly period ended: March 31, 20232024
Commission File Number: 1-10853
TRUIST FINANCIAL CORPORATION
(Exact name of registrant as specified in its charter)
| | | | | | | | | | | |
| North Carolina | 56-0939887 |
| (State or other jurisdiction of incorporation or organization) | (I.R.S. Employer Identification No.) |
| | | |
| 214 North Tryon Street | | |
| Charlotte, | North Carolina | 28202 |
| (Address of principal executive offices) | (Zip Code) |
| | |
| Registrant’s telephone number, including area code: | (336) | 733-2000 |
|
Securities registered pursuant to Section 12(b) of the Act: | | | | | | | | | | | | | | |
| Title of each class | | Trading Symbol | | Name of each exchange on which registered |
| Common Stock, $5 par value | | TFC | | New York Stock Exchange |
| Depositary Shares each representing 1/4,000th interest in a share of Series I Perpetual Preferred Stock | | TFC.PI | | New York Stock Exchange |
| 5.853% Fixed-to-Floating Rate Normal Preferred Purchase Securities each representing 1/100th interest in a share of Series J Perpetual Preferred Stock | | TFC.PJ | | New York Stock Exchange |
| Depositary Shares each representing 1/1,000th interest in a share of Series O Non-Cumulative Perpetual Preferred Stock | | TFC.PO | | New York Stock Exchange |
| Depositary Shares each representing 1/1,000th interest in a share of Series R Non-Cumulative Perpetual Preferred Stock | | TFC.PR | | New York Stock Exchange |
Indicate by check mark whether the registrant (1) has filed all reports required to be filed by Section 13 or 15(d) of the Securities Exchange Act of 1934 during the preceding 12 months (or for such shorter period that the registrant was required to file such reports), and (2) has been subject to such filing requirements for the past 90 days. Yes ☒ No ☐
Indicate by check mark whether the registrant has submitted electronically every Interactive Data File required to be submitted pursuant to Rule 405 of Regulation S-T (§232.405 of this chapter) during the preceding 12 months (or for such shorter period that the registrant was required to submit such files). Yes ☒ No ☐
Indicate by check mark whether the registrant is a large accelerated filer, an accelerated filer, a non-accelerated filer, a smaller reporting company, or an emerging growth company. See the definitions of “large accelerated filer,” “accelerated filer,” “smaller reporting company” and “emerging growth company” in Rule 12b-2 of the Exchange Act. | | | | | | | | | | | | | | |
| Large accelerated filer | ☒ | | Accelerated filer | ☐ |
| Non-accelerated filer | ☐ | | Smaller reporting company | ☐ |
| | | Emerging growth company | ☐ |
If an emerging growth company, indicate by check mark if the registrant has elected not to use the extended transition period for complying with any new or revised financial accounting standards provided pursuant to Section 13(a) of the Exchange Act. ☐
Indicate by check mark whether the registrant is a shell company (as defined in Rule 12b-2 of the Exchange Act). Yes ☐ No ☒
At March 31, 2023, 1,331,917,8872024, 1,338,096,145 shares of the registrant’s common stock, $5 par value, were outstanding.
| | | | | | | | | | |
| | | | |
| TABLE OF CONTENTS | |
| TRUIST FINANCIAL CORPORATION | |
| FORM 10-Q | |
March 31, 20232024 | |
| | | Page No. | |
| PART I - Financial Information | |
| | Glossary of Defined Terms | | |
| | Forward-Looking Statements | | |
| Item 1. | | Financial Statements | | |
| | Consolidated Balance Sheets (Unaudited) | | |
| | Consolidated Statements of Income (Unaudited) | | |
| | Consolidated Statements of Comprehensive Income (Unaudited) | | |
| | Consolidated Statements of Changes in Shareholders’ Equity (Unaudited) | | |
| | Consolidated Statements of Cash Flows (Unaudited) | | |
| | Notes to Consolidated Financial Statements (Unaudited) | | |
| | Note 1. Basis of Presentation | | |
| | Note 2. Business Combinations, Divestitures, and Noncontrolling InterestsDiscontinued Operations | | |
| | | | |
| | Note 3. Securities Financing Activities | | |
| | Note 4. Investment Securities | | |
| | Note 5. Loans and ACL | | |
| | Note 6. Goodwill and Other Intangible Assets | | |
| | Note 7. Loan Servicing | | |
| | Note 8. Other Assets and Liabilities | | |
| | Note 9. Borrowings | | |
| | Note 10. Shareholders’ Equity | | |
| | Note 11. AOCI | | |
| | Note 12. Income Taxes | | |
| | Note 13. Benefit Plans | | |
| | Note 14. Commitments and Contingencies | | |
| | Note 15. Fair Value Disclosures | | |
| | Note 16. Derivative Financial Instruments | | |
| | Note 17. Computation of EPS | | |
| | Note 18. Operating Segments | | |
| | Note 19. Subsequent Events | | |
| Item 2. | | Management’s Discussion and Analysis of Financial Condition and Results of Operations | | |
| | Regulatory and Supervisory Considerations | | |
| | Executive Overview | | |
| | Analysis of Results of Operations | | |
| | Analysis of Financial Condition | | |
| | Risk Management | | |
| | Liquidity | | |
| | Capital | | |
| | Share Repurchase activityLiquidity | | |
| | Capital | | |
| | | | |
| | Critical Accounting Policies | | |
| Item 3. | | Quantitative and Qualitative Disclosures About Market Risk (see Market Risk in MD&A) | | |
| Item 4. | | Controls and Procedures | | |
| PART II - Other Information | |
| Item 1. | | Legal Proceedings | | |
| Item 1A. | | Risk Factors | | |
| Item 2. | | Unregistered Sales of Equity Securities, and Use of Proceeds, and Issuer Purchases of Equity Securities | | |
| Item 3. | | Defaults Upon Senior Securities - (none) | | |
| Item 4. | | Mine Safety Disclosures - (not applicable) | | |
| Item 5. | | Other Information - (none to be reported) | | |
| Item 6. | | Exhibits | | |
| | | | |
| |
| | | | |
| | | | |
| | | | |
| | | | |
| | | | |
| | | | |
| | | | |
| | | | |
| | | | |
| | | | |
| | | | |
| | | | |
| | | | |
| | | | |
| | | | |
| | | | |
| | | | |
| | | | |
| | | | |
| | | | |
| | | | |
| | | | |
| | | | |
| | | | |
| | | | |
| | | | |
| | | | |
| | | | |
| | | | |
| | | | |
| | | | |
| | | | |
| | | | |
| | | | |
| | | | |
| | | | |
| | | | |
| | | | |
| | | | |
| | | | |
| | | | |
| | | | |
| | | | |
| | | | |
| | | | |
| | | | |
| | | | |
| | | | |
| | | | |
| | | | |
| | | | |
| | | | |
| | | | |
| | | | |
| | | | |
| | | | |
| | | | |
| | | | |
| | | | |
| | | | |
| | | | |
| | | | |
| | | | |
| | | | |
| | | | |
| | | | |
| | | | |
| | | | |
| | | | |
| | | | |
Glossary of Defined Terms
The following terms may be used throughout this report, including the consolidated financial statements and related notes. | | | | | |
| Term | Definition |
| ACL | Allowance for credit losses |
| AD and CL | Acquisition and development and commercial land |
| AFS | Available-for-sale |
| Agency MBS | Mortgage-backed securities issued by a U.S. government agency or GSE |
| ALCO | Asset and Liability Committee |
| ALLL | Allowance for loan and lease losses |
| |
| |
| AOCI | Accumulated other comprehensive income (loss) |
| |
| |
| |
| BCBS | Basel Committee on Banking Supervision |
BB&TBHC | BB&T Corporation and subsidiaries (changed to “Truist Financial Corporation” effective with the Merger)Bank holding company |
| BHCA | |
| |
| Bank Holding Company Act of 1956, as amended |
| Board | Truist’s Board of Directors |
| |
| BRC | Board Risk Committee |
| |
| C&CB | Corporate and Commercial Banking, an operating segment |
CARES Act | The Coronavirus Aid, Relief, and Economic Security Act prior to the Company’s realignment as of January 1, 2024 |
| CB&W | Consumer Banking and Wealth, an operating segment prior to the Company’s realignment as of January 1, 2024 |
| CCAR | Comprehensive Capital Analysis and Review |
| |
| CD | Certificate of deposit |
| CDI | Core deposit intangible |
| CECL | Current expected credit loss model |
| CEO | Chief Executive Officer |
| CET1 | Common equity tier 1 |
| CFO | Chief Financial Officer |
| CET1 |
| CFTC | Common equity tier 1Commodity Futures Trading Commission |
| |
| CIO | Chief Information Officer |
| CFPB | Consumer Financial Protection Bureau
| |
| Company | Truist Financial Corporation and its subsidiaries (interchangeable with “Truist” below) |
| |
COVID-19CP | Coronavirus disease 2019Construction and permanent |
| |
| CRE | Commercial real estate |
| |
| |
DEI | Diversity, Equity & Inclusion |
| |
| |
DTACSBB | Deferred tax assetConsumer and Small Business Banking, an operating segment after the Company’s realignment as of January 1, 2024 |
| |
| |
| DIF | Deposit Insurance Fund administered by the FDIC |
| |
| |
| |
| |
| |
| EPS | Earnings per common share |
| ESG | Environmental, Social, and Governance
| |
| |
| Exchange Act | Securities Exchange Act of 1934, as amended |
| EVE | Economic value of equity |
| FASB | Financial Accounting Standards Board |
| FDIC | Federal Deposit Insurance Corporation |
| |
| |
| FHLB | Federal Home Loan Bank |
| FHLMC | Federal Home Loan Mortgage Corporation |
| |
| FNMA | Federal National Mortgage Association |
| FRB | Board of Governors of the Federal Reserve System |
| FTE | Full-time equivalent employee |
| GAAP | Accounting principles generally accepted in the United States of America |
| GCO | Governance and Controls Organization |
| GDP | Gross Domestic Product |
| |
| |
Grandbridge | Grandbridge Real Estate Capital, LLC |
| GSE | U.S. government-sponsored enterprise |
| |
| HFI | Held for investment |
| |
| HQLA | High-quality liquid assets |
| HTM | Held-to-maturity |
| |
| IH | Insurance Holdings, ana discontinued operating segment following the announcement of the sale of TIH |
| IPV | Independent price verification |
| |
| IRR | Interest rate risk |
| |
| ISDA | International Swaps and Derivatives Association, Inc.
| LCR | Liquidity Coverage Ratio |
| LHFS | Loans held for sale |
| LIBOR | London Interbank Offered Rate
| LIBOR Act | Adjustable Interest Rate (LIBOR) Act
| LOCOM | Lower of cost or market |
| Market Risk Rule | Market risk capital requirements issued jointly by the OCC, U.S. Treasury, FRB, and FDIC |
| MBS | Mortgage-backed securities |
| MD&A | Management’s Discussion and Analysis of Financial Condition and Results of Operations |
| Merger | Merger of BB&T and SunTrust effective December 6, 2019
| |
| MRO | Model Risk Oversight |
| MSR | Mortgage servicing right |
| |
| NA | Not applicable |
| |
| |
| NII | Net interest income |
| NIM | Net interest margin, computed on a TE basis |
| NM | Not meaningful |
| NPA | Nonperforming asset |
| NPL | Nonperforming loan |
| NSFR | Net stable funding ratio |
| NYSE | New York Stock Exchange |
| OAS | Option adjusted spread |
| OCC | Office of the Comptroller of the Currency |
| OCI | Other comprehensive income (loss) |
| |
Truist Financial Corporation 1
| | | | | |
| Term | Definition |
| OPEB | Other post-employment benefit |
| OREO | Other real estate owned |
| OT&C | Other, Treasury and Corporate |
| |
| Parent Company | Truist Financial Corporation, the parent company of Truist Bank and other subsidiaries |
| |
| PCD | Purchased credit deteriorated loans |
| |
| |
PPP | Paycheck Protection Program, established by the CARES Act |
| |
| |
| |
Truist Financial Corporation 1
| | | | | |
Term | Definition |
| ROU assets | Right-of-use assets |
| |
| RSU | Restricted stock unit |
| RUFC | Reserve for unfunded lending commitments |
| S&P | Standard & Poor’s |
| |
| SBIC | Small Business Investment Company |
| SCB | Stress Capital Buffer |
| SEC | Securities and Exchange Commission |
| SOFR | Secured Overnight Financing Rate
| SunTrust | SunTrust Banks, Inc.
| |
| |
| TBVPS | Tangible book value per common share |
| TCFD | Task Force on Climate-Related Financial Disclosures
TDR | Troubled debt restructuring |
| TE | Taxable-equivalent |
| TIH | Truist Insurance Holdings, LLC, an entity classified as held for sale |
| TRS | Total Return Swap |
| Truist | Truist Financial Corporation and its subsidiaries (interchangeable with the “Company” above) |
| Truist Bank | Truist Bank, formerly Branch Banking and Trust Companya North Carolina-charted member bank |
| U.S. | United States of America |
| U.S. DOJ | United States Department of Justice |
| U.S. Treasury | United States Department of the Treasury |
| UPB | Unpaid principal balance |
| USAA | United Services Automobile Association
| |
| VaR | Value-at-risk |
| VIE | Variable interest entity |
| WB | Wholesale Banking, an operating segment after the Company’s realignment as of January 1, 2024 |
2 Truist Financial Corporation
Forward-Looking Statements
This Quarterly Report on Form 10-Q contains “forward-looking statements”From time to time we have made, and in the future will make, forward-looking statements within the meaning of the Private Securities Litigation Reform Act of 1995, regarding1995. These statements can be identified by the financial condition, results of operations, business plans and the future performance of Truist. Wordsfact that they do not relate strictly to historical or current facts. Forward-looking statements often use words such as “anticipates,“believe,” “believes,“expect,” “estimates,“anticipate,” “expects,“intend,” “forecasts,“pursue,” “intends,“seek,” “plans,“continue,” “projects,“estimate,” “project,” “outlook,” “forecast,” “potential,” “target,” “objective,” “trend,” “plan,” “goal,” “initiative,” “priorities,” or other words of comparable meaning or future-tense or conditional verbs such as “may,” “will,” “should,” “would,” “could,or “could.” and other similar expressions are intended to identify these forward-looking statements.Forward-looking statements convey our expectations, intentions, or forecasts about future events, circumstances, or results.
Forward-lookingThis report, including any information incorporated by reference in this report, contains forward-looking statements. We also may make forward-looking statements in other documents that are not based on historical facts but instead represent management’s expectationsfiled or furnished with the SEC. In addition, we may make forward-looking statements orally or in writing to investors, analysts, members of the media, and assumptions regarding Truist’s business, the economy, and other future conditions. Suchothers. All forward-looking statements, involve inherent uncertainties,by their nature, are subject to assumptions, risks, and changes in circumstances thatuncertainties, which may change over time and many of which are difficult to predict. As such, Truist’s actualbeyond our control. You should not rely on any forward-looking statement as a prediction or guarantee about the future. Actual future objectives, strategies, plans, prospects, performance, conditions, and results may differ materially from those contemplated byset forth in any forward-looking statements.statement. While there can be no assurance that any list of assumptions, risks, and uncertainties or risk factors iscould be complete, importantsome of the factors that couldmay cause actual results or other future events or circumstances to differ materially from those contemplated byin forward-looking statements include the following, without limitation, as well as the risks and uncertainties more fully discussed in Part I, Item 1A-Risk Factors in Truist’s Form 10-K for the year ended December 31, 2022:include:
•changes in the interest rate environment, including the replacement of LIBOR as an interest rate benchmark, could adversely affect Truist’s revenueevolving political, business, economic, and expenses, the value of assetsmarket conditions at local, regional, national, and obligations, including our portfolio of investment securities, and the availability and cost of capital, cash flows, and liquidity;international levels;
•Truist is subject to credit riskmonetary, fiscal, and trade laws or policies, including as a result of actions by lendinggovernmental agencies, central banks, or committing to lend money, may have more credit risk and higher credit losses to the extent that loans are concentrated by loan type, industry segment, borrower type or location of the borrower or collateral, and may suffer losses if the value of collateral declines in stressed market conditions;supranational authorities;
•inability to access short-term funding or liquidity, loss of client deposits orthe legal, regulatory, and supervisory environment, including changes in Truist’s credit ratings could increase the cost of funding, limit access to capital markets,financial-services legislation, regulation, policies, or negatively affect Truist’s overall liquiditygovernment officials or capitalization;other personnel;
•Truistour ability to address heightened scrutiny and expectations from supervisory or other governmental authorities and to timely and credibly remediate related concerns or deficiencies;
•judicial, regulatory, and administrative inquiries, examinations, investigations, proceedings, disputes, or rulings that create uncertainty for or are adverse to us or the financial-services industry;
•the outcomes of judicial, regulatory, and administrative inquiries, examinations, investigations, proceedings, or disputes to which we are or may be impacted by actualsubject and our ability to absorb and address any damages or perceived soundnessother remedies that are sought or awarded and any collateral consequences;
•evolving accounting standards and policies;
•the adequacy of otherour corporate governance, risk-management framework, compliance programs, and internal controls over financial institutions,reporting, including our ability to control lapses or deficiencies in financial reporting, to make appropriate estimates, or to effectively mitigate or manage operational risk;
•any instability or breakdown in the financial system, including as a result of the financialactual or operational failureperceived soundness of a majoranother financial institution or concerns about the creditworthiness of such a financial institution or its ability to fulfill its obligations, which can cause substantial and cascading disruption withinanother participant in the financial markets and increased expenses, including FDIC insurance premiums, and could affect our ability to attract and retain depositors and to borrow or raise capital;system;
•general economicdisruptions and shifts in investor sentiment or business conditions, either globally, nationallybehavior in the securities, capital, or regionally, may be less favorable than expected, including as a result of supply chain disruptions, inflationary pressures and labor shortages, and instability in global geopolitical matters, including due to an outbreak or escalation of hostilities, or volatility inother financial markets, could resultincluding financial or systemic shocks and volatility or changes in among other things, slower depositmarket liquidity, interest or asset growth, a deterioration in credit quality,currency rates, or a reduced demand for credit, insurance, or other services;valuations;
•the monetaryour ability to cost-effectively fund our businesses and fiscal policies of the federal governmentoperations, including by accessing long- and its agencies, including in response to higher inflation, could have a material adverse effect on the economyshort-term funding and Truist’s profitability;liquidity and by retaining and growing client deposits;
•changes in any of our credit ratings;
•our ability to manage any unexpected outflows of uninsured deposits may require us to selland avoid selling investment securities or other assets at an unfavorable time or at a loss;
•a loss of valuenegative market perceptions of our investment portfolio could negatively impact market perceptions of us and could lead to deposit withdrawals;or its value;
•the effects of COVID-19 adversely impacted the Company’s operations and financial performance and similar adverse impacts resulting from pandemics could occur in future periods;publicity or other reputational harm to us, our service providers, or our senior officers;
•risk management oversight functions may not identifybusiness and consumer sentiment, preferences, or address risks adequately, and management may not be able to effectively manage credit risk;behavior, including spending, borrowing, or saving by businesses or households;
•there are risks resulting from the extensive use of models in Truist’s business, which may impact decisions made by management and regulators;
•deposit attrition, client loss or revenue loss following completed mergers or acquisitions may be greater than anticipated;
•Truist could failour ability to execute on strategic orand operational plans, including simplifying our businesses, achieving cost-savings targets and lowering expense growth, accelerating franchise momentum, and improving our capital position;
•changes in our corporate and business strategies, the composition of our assets, or the way in which we fund those assets;
•our ability to successfully make and integrate acquisitions and to effect divestitures, including the ability to successfully complete or integrate mergersdeploy the proceeds from the sale of TIH and acquisitions;perform our obligations under the transition services arrangements supporting TIH in a cost-effective and efficient manner;
•increased competition,our ability to develop, maintain, and market our products or services or to absorb unanticipated costs or liabilities associated with those products or services;
•our ability to innovate, to anticipate the needs of current or future clients, to successfully compete, to increase or hold market share in changing competitive environments, or to deal with pricing or other competitive pressures;
•our ability to maintain secure and functional financial, accounting, technology, data processing, or other operating systems or infrastructure, including from (i) newthose that safeguard personal and other sensitive information;
•our ability to appropriately underwrite loans that we originate or existingpurchase and to otherwise manage credit risk, including in connection with commercial and consumer mortgage loans;
•our ability to satisfactorily and profitably perform loan servicing and similar obligations;
•the credit, liquidity, or other financial condition of our clients, counterparties, service providers, or competitors;
•our ability to effectively deal with economic, business, or market slowdowns or disruptions;
•the efficacy of our methods or models in assessing business strategies or opportunities or in valuing, measuring, estimating, monitoring, or managing positions or risk;
•our ability to keep pace with changes in technology that affect us or our clients, counterparties, service providers, or competitors that could have greater financial resources or be subject to different regulatory standardsmaintain rights or compliance costs,interests in associated intellectual property;
•our ability to attract, hire, and (ii)retain key teammates and to engage in adequate succession planning;
•the performance and availability of third-party service providers on whom we rely in delivering products and services offered by non-bank financial technology companies, may reduce Truist’s client base, cause Truist to lower prices for its productsour clients and servicesotherwise in order to maintain market share or otherwise adversely impact Truist’s businesses or results ofconducting our business and operations;
•failureour ability to maintain or enhance Truist’s competitive position with respect to new products, services,detect, prevent, mitigate, and technology, whether it fails to anticipate client expectations or because its technological developments fail to perform as desired or do not achieve market acceptance or regulatory approval or for other reasons, may cause Truist to lose market share or incur additional expense;
•negative public opinion could damage Truist’s reputation and adversely impact business and revenues, including the effects of social media on market perceptions of Truist and banks generally;
•regulatory matters, litigation or other legal actions may result in, among other things, costs, fines, penalties, restrictions on Truist’s business activities, reputational harm, negative publicity, or other adverse consequences;
•Truist faces substantial legal and operational risks in safeguarding personal information;
•evolving legislative, accounting and regulatory standards, including with respect to climate, capital, and liquidity requirements, which may become more stringent in light of recent market events, and results of regulatory examinations may adversely affect Truist’s financial condition and results of operations;
•increased scrutiny regarding Truist’s consumer sales practices, training practices, incentive compensation design, and governance could damage its reputation and adversely impact business and revenues;
•accounting policies and processes require management to make estimates about matters that are uncertain, including the potential write down to goodwill if there is an elongated period of decline in market value for Truist’s stock and adverse economic conditions are sustained over a period of time;
•Truist faces risks related to originating and selling mortgages, including repurchase and indemnity demands from purchasers related to representations and warranties on loans sold, which could result in an increase in the amount of losses for loan repurchases;
•there are risks relating to Truist’s role as a loan servicer, including an increase in the scope or costs of the services Truist is required to perform without any corresponding increase in servicing fees or a breach of Truist’s obligations as servicer;
•Truist’s success depends on hiring and retaining key teammates, and if these individuals leave or change roles without effective replacements, Truist’s operations could be adversely impacted, which could be exacerbated in the increased work-from-home environment as job markets may be less constrained by physical geography;
•Truist’s operations rely on its ability, and the ability of key external parties, to maintain appropriate-staffed workforces, and on the competence, trustworthiness, health and safety of teammates;
•Truist facesotherwise manage the risk of fraud or misconduct by internal or external parties, which Truist may not be ableparties; our ability to prevent, detect, or mitigate;
•securitymanage and mitigate physical-security and cybersecurity risks, including denial of servicedenial-of-service attacks, hacking, social engineeringphishing, social-engineering attacks, targeting Truist’s teammates and clients, malware intrusion, data corruptiondata-corruption attempts, system breaches, cyberattacks, which have increased in frequency with geopolitical tensions, identity theft, ransomware attacks, and physical security risks, such as natural disasters, environmental conditions, and intentional acts of destruction, could result in the disclosure of confidential information, adversely affect Truist’s businessdestruction;
•natural or reputation or create significant legal or financial exposure;other disasters, calamities, and conflicts, including terrorist events, cyber-warfare, and pandemics;
•widespread outages of operational, communication, orand other systems, whether internal or provided by third parties, natural orsystems;
•our ability to maintain appropriate ESG practices, oversight, and disclosures;
•policies and other disasters (including actsactions of terrorismgovernments to manage and pandemics),mitigate climate and related environmental risks, and the effects of climate change including physical risks, such as more frequent and intense weather events, and risks related toor the transition to a lower carbonlower-carbon economy such as regulatoryon our business, operations, and reputation; and
•other assumptions, risks, or technological changes or shiftsuncertainties described in market dynamics or consumer preferences, could have an adverse effect on Truist’s financial conditionthe Risk Factors (Item 1A), Management’s Discussion and resultsAnalysis of operations, lead to material disruptionFinancial Condition and Results of Truist’s operationsOperations (Item 7), or the abilityNotes to the Consolidated Financial Statements (Item 8) in our Annual Report on Form 10-K or willingnessdescribed in any of clients to access Truist’s products and services.the Company’s subsequent quarterly or current reports.
Readers are cautioned not to place undue relianceAny forward-looking statement made by us or on these forward-looking statements, which speakour behalf speaks only as of the date they arethat it was made. ExceptWe do not undertake to update any forward-looking statement to reflect the extentimpact of events, circumstances, or results that arise after the date that the statement was made, except as required by applicable lawsecurities laws. You, however, should consult further disclosures (including disclosures of a forward-looking nature) that we may make in any subsequent Annual Report on Form 10-K, Quarterly Report on Form 10-Q, or regulation, Truist undertakes no obligation to revise or update any forward-looking statements.Current Report on Form 8-K.
Truist Financial Corporation 3
ITEM 1. FINANCIAL STATEMENTS
CONSOLIDATED BALANCE SHEETS
TRUIST FINANCIAL CORPORATION AND SUBSIDIARIES | | Unaudited
(Dollars in millions, except per share data, shares in thousands) | Unaudited
(Dollars in millions, except per share data, shares in thousands) | Mar 31, 2023 | | Dec 31, 2022 | |
| Unaudited
(Dollars in millions, except per share data, shares in thousands) | |
| Unaudited
(Dollars in millions, except per share data, shares in thousands) | |
| Assets | |
| Assets | |
| Assets | Assets | | |
| Cash and due from banks | Cash and due from banks | $ | 4,629 | | | $ | 5,379 | | |
| Cash and due from banks | |
| Cash and due from banks | |
| Interest-bearing deposits with banks | |
| Interest-bearing deposits with banks | |
| Interest-bearing deposits with banks | Interest-bearing deposits with banks | 32,967 | | | 16,042 | | |
| Securities borrowed or purchased under agreements to resell | Securities borrowed or purchased under agreements to resell | 3,637 | | | 3,181 | | |
| Securities borrowed or purchased under agreements to resell | |
| Securities borrowed or purchased under agreements to resell | |
| Trading assets at fair value | |
| Trading assets at fair value | |
| Trading assets at fair value | Trading assets at fair value | 4,601 | | | 4,905 | | |
| AFS securities at fair value | AFS securities at fair value | 71,858 | | | 71,801 | | |
| HTM securities (fair value of $48,097 and $47,791, respectively) | 56,932 | | | 57,713 | | |
| LHFS (including $1,911 and $1,065 at fair value, respectively) | 2,160 | | | 1,444 | | |
| Loans and leases (including $17 and $18 at fair value, respectively) | 327,673 | | | 325,991 | | |
| AFS securities at fair value | |
| AFS securities at fair value | |
| HTM securities (fair value of $43,041 and $44,630, respectively) | |
| HTM securities (fair value of $43,041 and $44,630, respectively) | |
| HTM securities (fair value of $43,041 and $44,630, respectively) | |
| LHFS (including $1,201 and $852 at fair value, respectively) | |
| LHFS (including $1,201 and $852 at fair value, respectively) | |
| LHFS (including $1,201 and $852 at fair value, respectively) | |
| Loans and leases (including $14 and $15 at fair value, respectively) | |
| Loans and leases (including $14 and $15 at fair value, respectively) | |
| Loans and leases (including $14 and $15 at fair value, respectively) | |
| ALLL | |
| ALLL | |
| ALLL | ALLL | (4,479) | | | (4,377) | | |
| Loans and leases, net of ALLL | Loans and leases, net of ALLL | 323,194 | | | 321,614 | | |
| Loans and leases, net of ALLL | |
| Loans and leases, net of ALLL | |
| Premises and equipment | |
| Premises and equipment | |
| Premises and equipment | Premises and equipment | 3,519 | | | 3,605 | | |
| Goodwill | Goodwill | 27,014 | | | 27,013 | | |
| Goodwill | |
| Goodwill | |
| CDI and other intangible assets | |
| CDI and other intangible assets | |
| CDI and other intangible assets | CDI and other intangible assets | 3,535 | | | 3,672 | | |
| Loan servicing rights at fair value | Loan servicing rights at fair value | 3,303 | | | 3,758 | | |
| Other assets (including $1,549 and $1,582 at fair value, respectively) | 37,005 | | | 35,128 | | |
| Loan servicing rights at fair value | |
| Loan servicing rights at fair value | |
| Other assets (including $1,359 and $1,311 at fair value, respectively) | |
| Other assets (including $1,359 and $1,311 at fair value, respectively) | |
| Other assets (including $1,359 and $1,311 at fair value, respectively) | |
| Assets of discontinued operations | |
| Assets of discontinued operations | |
| Assets of discontinued operations | |
| Total assets | |
| Total assets | |
| Total assets | Total assets | $ | 574,354 | | | $ | 555,255 | | |
| Liabilities | Liabilities | | |
| Liabilities | |
| Liabilities | |
| Noninterest-bearing deposits | Noninterest-bearing deposits | $ | 128,719 | | | $ | 135,742 | | |
| Interest-bearing deposits | 276,278 | | | 277,753 | | |
| Short-term borrowings (including $1,789 and $1,551 at fair value, respectively) | 23,678 | | | 23,422 | | |
| Noninterest-bearing deposits | |
| Noninterest-bearing deposits | |
| Interest-bearing deposits (including $23 and $0 at fair value, respectively) | |
| Interest-bearing deposits (including $23 and $0 at fair value, respectively) | |
| Interest-bearing deposits (including $23 and $0 at fair value, respectively) | |
| Short-term borrowings (including $2,034 and $1,625 at fair value, respectively) | |
| Short-term borrowings (including $2,034 and $1,625 at fair value, respectively) | |
| Short-term borrowings (including $2,034 and $1,625 at fair value, respectively) | |
| Long-term debt | Long-term debt | 69,895 | | | 43,203 | | |
| Other liabilities (including $2,589 and $2,971 at fair value, respectively) | 13,390 | | | 14,598 | | |
| Long-term debt | |
| Long-term debt | |
| Other liabilities (including $2,990 and $2,597 at fair value, respectively) | |
| Other liabilities (including $2,990 and $2,597 at fair value, respectively) | |
| Other liabilities (including $2,990 and $2,597 at fair value, respectively) | |
| Liabilities of discontinued operations | |
| Liabilities of discontinued operations | |
| Liabilities of discontinued operations | |
| Total liabilities | |
| Total liabilities | |
| Total liabilities | Total liabilities | 511,960 | | | 494,718 | | |
| Shareholders’ Equity | Shareholders’ Equity | | |
| Shareholders’ Equity | |
| Shareholders’ Equity | |
| Preferred stock | |
| Preferred stock | |
| Preferred stock | Preferred stock | 6,673 | | | 6,673 | | |
| Common stock, $5 par value | Common stock, $5 par value | 6,660 | | | 6,634 | | |
| Common stock, $5 par value | |
| Common stock, $5 par value | |
| Additional paid-in capital | |
| Additional paid-in capital | |
| Additional paid-in capital | Additional paid-in capital | 34,582 | | | 34,544 | | |
| Retained earnings | Retained earnings | 27,038 | | | 26,264 | | |
| Retained earnings | |
| Retained earnings | |
| AOCI, net of deferred income taxes | |
| AOCI, net of deferred income taxes | |
| AOCI, net of deferred income taxes | AOCI, net of deferred income taxes | (12,581) | | | (13,601) | | |
| Noncontrolling interests | Noncontrolling interests | 22 | | | 23 | | |
| Noncontrolling interests | |
| Noncontrolling interests | |
| Total shareholders’ equity | |
| Total shareholders’ equity | |
| Total shareholders’ equity | Total shareholders’ equity | 62,394 | | | 60,537 | | |
| Total liabilities and shareholders’ equity | Total liabilities and shareholders’ equity | $ | 574,354 | | | $ | 555,255 | | |
| Total liabilities and shareholders’ equity | |
| Total liabilities and shareholders’ equity | |
| Common shares outstanding | |
| Common shares outstanding | |
| Common shares outstanding | Common shares outstanding | 1,331,918 | | | 1,326,829 | | |
| Common shares authorized | Common shares authorized | 2,000,000 | | | 2,000,000 | | |
| Common shares authorized | |
| Common shares authorized | |
| Preferred shares outstanding | |
| Preferred shares outstanding | |
| Preferred shares outstanding | Preferred shares outstanding | 223 | | | 223 | | |
| Preferred shares authorized | Preferred shares authorized | 5,000 | | | 5,000 | | |
| Preferred shares authorized | |
| Preferred shares authorized | |
The accompanying notes are an integral part of these consolidated financial statements.
4 Truist Financial Corporation
CONSOLIDATED STATEMENTS OF INCOME
TRUIST FINANCIAL CORPORATION AND SUBSIDIARIES
| | Unaudited
(Dollars in millions, except per share data, shares in thousands) | Unaudited
(Dollars in millions, except per share data, shares in thousands) | | Three Months Ended March 31, |
| Unaudited
(Dollars in millions, except per share data, shares in thousands) | Unaudited
(Dollars in millions, except per share data, shares in thousands) | | 2023 | | 2022 | |
| Unaudited
(Dollars in millions, except per share data, shares in thousands) | |
| | 2024 | |
| 2024 | |
| Interest Income | |
| Interest Income | |
| Interest Income | Interest Income | | | | | |
| Interest and fees on loans and leases | Interest and fees on loans and leases | | $ | 4,656 | | | $ | 2,644 | | |
| Interest and fees on loans and leases | |
| Interest and fees on loans and leases | |
| Interest on securities | |
| Interest on securities | |
| Interest on securities | Interest on securities | | 752 | | | 640 | | |
| Interest on other earning assets | Interest on other earning assets | | 377 | | | 73 | | |
| Interest on other earning assets | |
| Interest on other earning assets | |
| Total interest income | |
| Total interest income | |
| Total interest income | Total interest income | | 5,785 | | | 3,357 | | |
| Interest Expense | Interest Expense | | | | | |
| Interest Expense | |
| Interest Expense | |
| Interest on deposits | |
| Interest on deposits | |
| Interest on deposits | Interest on deposits | | 1,125 | | | 32 | | |
| Interest on long-term debt | Interest on long-term debt | | 514 | | | 132 | | |
| Interest on long-term debt | |
| Interest on long-term debt | |
| Interest on other borrowings | |
| Interest on other borrowings | |
| Interest on other borrowings | Interest on other borrowings | | 278 | | | 10 | | |
| Total interest expense | Total interest expense | | 1,917 | | | 174 | | |
| Total interest expense | |
| Total interest expense | |
| Net Interest Income | |
| Net Interest Income | |
| Net Interest Income | Net Interest Income | | 3,868 | | | 3,183 | | |
| Provision for credit losses | Provision for credit losses | | 502 | | | (95) | | |
| Provision for credit losses | |
| Provision for credit losses | |
| Net Interest Income After Provision for Credit Losses | |
| Net Interest Income After Provision for Credit Losses | |
| Net Interest Income After Provision for Credit Losses | Net Interest Income After Provision for Credit Losses | | 3,366 | | | 3,278 | | |
| Noninterest Income | Noninterest Income | | | | | |
| Insurance income | | 813 | | | 727 | | |
| Noninterest Income | |
| Noninterest Income | |
| Wealth management income | |
| Wealth management income | |
| Wealth management income | Wealth management income | | 339 | | | 343 | | |
| Investment banking and trading income | Investment banking and trading income | | 261 | | | 261 | | |
| Investment banking and trading income | |
| Investment banking and trading income | |
| Card and payment related fees | |
| Card and payment related fees | |
| Card and payment related fees | |
| Service charges on deposits | Service charges on deposits | | 249 | | | 252 | | |
| Card and payment related fees | | 230 | | | 212 | | |
| Service charges on deposits | |
| Service charges on deposits | |
| Mortgage banking income | |
| Mortgage banking income | |
| Mortgage banking income | Mortgage banking income | | 142 | | | 121 | | |
| Lending related fees | Lending related fees | | 106 | | | 85 | | |
| Lending related fees | |
| Lending related fees | |
| Operating lease income | |
| Operating lease income | |
| Operating lease income | Operating lease income | | 67 | | | 58 | | |
| | Securities gains (losses) | | — | | | (69) | | |
| | Other income | |
| | Other income | |
| | Other income | Other income | | 27 | | | 152 | | |
| Total noninterest income | Total noninterest income | | 2,234 | | | 2,142 | | |
| Total noninterest income | |
| Total noninterest income | |
| Noninterest Expense | |
| Noninterest Expense | |
| Noninterest Expense | Noninterest Expense | | | | | |
| Personnel expense | Personnel expense | | 2,181 | | | 2,051 | | |
| Personnel expense | |
| Personnel expense | |
| Professional fees and outside processing | |
| Professional fees and outside processing | |
| Professional fees and outside processing | Professional fees and outside processing | | 314 | | | 363 | | |
| Software expense | Software expense | | 214 | | | 232 | | |
| Software expense | |
| Software expense | |
| Net occupancy expense | |
| Net occupancy expense | |
| Net occupancy expense | Net occupancy expense | | 183 | | | 208 | | |
| Amortization of intangibles | Amortization of intangibles | | 136 | | | 137 | | |
| Amortization of intangibles | |
| Amortization of intangibles | |
| Equipment expense | |
| Equipment expense | |
| Equipment expense | Equipment expense | | 110 | | | 118 | | |
| Marketing and customer development | Marketing and customer development | | 78 | | | 84 | | |
| Marketing and customer development | |
| Marketing and customer development | |
| Operating lease depreciation | |
| Operating lease depreciation | |
| Operating lease depreciation | Operating lease depreciation | | 46 | | | 48 | | |
| | Regulatory costs | Regulatory costs | | 75 | | | 35 | | |
| Merger-related and restructuring charges | | 63 | | | 216 | | |
| | Regulatory costs | |
| | Regulatory costs | |
| Restructuring charges | |
| Restructuring charges | |
| Restructuring charges | |
| | Other expense | |
| | Other expense | |
| | | Other expense | Other expense | | 291 | | | 182 | | |
| Total noninterest expense | Total noninterest expense | | 3,691 | | | 3,674 | | |
| Total noninterest expense | |
| Total noninterest expense | |
| Earnings | |
| Earnings | |
| Earnings | Earnings | | | | | |
| Income before income taxes | Income before income taxes | | 1,909 | | | 1,746 | | |
| Income before income taxes | |
| Income before income taxes | |
| Provision for income taxes | Provision for income taxes | | 394 | | | 330 | | |
| Provision for income taxes | |
| Provision for income taxes | |
| Net income from continuing operations | |
| Net income from continuing operations | |
| Net income from continuing operations | |
| Net income from discontinued operations | |
| Net income from discontinued operations | |
| Net income from discontinued operations | |
| Net income | Net income | | 1,515 | | | 1,416 | | |
| Noncontrolling interests | | 2 | | | 1 | | |
| Net income | |
| Net income | |
| Noncontrolling interests from discontinued operations | |
| Noncontrolling interests from discontinued operations | |
| Noncontrolling interests from discontinued operations | |
| | Preferred stock dividends and other | |
| | Preferred stock dividends and other | |
| | Preferred stock dividends and other | Preferred stock dividends and other | | 103 | | | 88 | | |
| Net income available to common shareholders | Net income available to common shareholders | | $ | 1,410 | | | $ | 1,327 | | |
| Net income available to common shareholders | |
| Net income available to common shareholders | |
| Basic earnings from continuing operations | |
| Basic earnings from continuing operations | |
| Basic earnings from continuing operations | |
| | Basic EPS | Basic EPS | | $ | 1.06 | | | $ | 1.00 | | |
| | Basic EPS | |
| | Basic EPS | |
| Diluted earnings from continuing operations | |
| Diluted earnings from continuing operations | |
| Diluted earnings from continuing operations | |
| | Diluted EPS | |
| | Diluted EPS | |
| | Diluted EPS | Diluted EPS | | 1.05 | | | 0.99 | | |
| Basic weighted average shares outstanding | Basic weighted average shares outstanding | | 1,328,602 | | | 1,329,037 | | |
| Basic weighted average shares outstanding | |
| Basic weighted average shares outstanding | |
| Diluted weighted average shares outstanding | Diluted weighted average shares outstanding | | 1,339,480 | | | 1,341,563 | | |
| Diluted weighted average shares outstanding | |
| Diluted weighted average shares outstanding | |
The accompanying notes are an integral part of these consolidated financial statements.
Truist Financial Corporation 5
CONSOLIDATED STATEMENTS OF COMPREHENSIVE INCOME
TRUIST FINANCIAL CORPORATION AND SUBSIDIARIES | | Unaudited
(Dollars in millions) | |
| Unaudited
(Dollars in millions) | |
| Unaudited
(Dollars in millions) | Unaudited
(Dollars in millions) | | Three Months Ended March 31, | | | Three Months Ended March 31, |
| 2023 | | 2022 | |
| Net income | Net income | | $ | 1,515 | | | $ | 1,416 | | |
| Net income | |
| Net income | |
| OCI, net of tax: | |
| OCI, net of tax: | |
| OCI, net of tax: | OCI, net of tax: | | | | | |
| Net change in net pension and postretirement costs | Net change in net pension and postretirement costs | | (14) | | | 8 | | |
| Net change in net pension and postretirement costs | |
| Net change in net pension and postretirement costs | |
| Net change in cash flow hedges | |
| Net change in cash flow hedges | |
| Net change in cash flow hedges | Net change in cash flow hedges | | 125 | | | 5 | | |
| Net change in AFS securities | Net change in AFS securities | | 853 | | | (4,989) | | |
| Net change in AFS securities | |
| Net change in AFS securities | |
| Net change in HTM securities | |
| Net change in HTM securities | |
| Net change in HTM securities | Net change in HTM securities | | 55 | | | 44 | | |
| Other, net | Other, net | | 1 | | | 1 | | |
| Other, net | |
| Other, net | |
| Total OCI, net of tax | |
| Total OCI, net of tax | |
| Total OCI, net of tax | Total OCI, net of tax | | 1,020 | | | (4,931) | | |
| Total OCI | Total OCI | | $ | 2,535 | | | $ | (3,515) | | |
| Total OCI | |
| Total OCI | |
| Income Tax Effect of Items Included in OCI: | |
| Income Tax Effect of Items Included in OCI: | |
| Income Tax Effect of Items Included in OCI: | Income Tax Effect of Items Included in OCI: | | | |
| Net change in net pension and postretirement costs | Net change in net pension and postretirement costs | | $ | (3) | | | $ | 2 | | |
| Net change in net pension and postretirement costs | |
| Net change in net pension and postretirement costs | |
| Net change in cash flow hedges | |
| Net change in cash flow hedges | |
| Net change in cash flow hedges | Net change in cash flow hedges | | 38 | | | 1 | | |
| Net change in AFS securities | Net change in AFS securities | | 262 | | | (1,513) | | |
| Net change in AFS securities | |
| Net change in AFS securities | |
| Net change in HTM securities | |
| Net change in HTM securities | |
| Net change in HTM securities | Net change in HTM securities | | 15 | | | 13 | | |
| | Total income taxes related to OCI | Total income taxes related to OCI | | $ | 312 | | | $ | (1,497) | | |
| | Total income taxes related to OCI | |
| | Total income taxes related to OCI | |
The accompanying notes are an integral part of these consolidated financial statements.
6 Truist Financial Corporation
CONSOLIDATED STATEMENTS OF CHANGES IN SHAREHOLDERS’ EQUITY
TRUIST FINANCIAL CORPORATION AND SUBSIDIARIES | | Unaudited
(Dollars in millions, shares in thousands) | |
| Unaudited
(Dollars in millions, shares in thousands) | |
| Unaudited
(Dollars in millions, shares in thousands) | Unaudited
(Dollars in millions, shares in thousands) | Shares of Common Stock | | Preferred Stock | | Common Stock | | Additional Paid-In Capital | | Retained Earnings | | AOCI | | Noncontrolling Interests | | Total Shareholders’ Equity | |
| | Balance, January 1, 2022 | 1,327,818 | | | $ | 6,673 | | | $ | 6,639 | | | $ | 34,565 | | | $ | 22,998 | | | $ | (1,604) | | | $ | — | | | $ | 69,271 | | |
| Net income | — | | | — | | | — | | | — | | | 1,415 | | | — | | | 1 | | | 1,416 | | |
| OCI | — | | | — | | | — | | | — | | | — | | | (4,931) | | | — | | | (4,931) | | |
| | Issued in connection with equity awards, net | 3,596 | | | — | | | 18 | | | (106) | | | (1) | | | — | | | — | | | (89) | | |
| | Cash dividends declared on common stock | — | | | — | | | — | | | — | | | (637) | | | — | | | — | | | (637) | | |
| Cash dividends declared on preferred stock | — | | | — | | | — | | | — | | | (88) | | | — | | | — | | | (88) | | |
| Equity-based compensation expense | — | | | — | | | — | | | 80 | | | — | | | — | | | — | | | 80 | | |
| | Other, net | — | | | — | | | — | | | — | | | — | | | — | | | 22 | | | 22 | | |
| Balance, March 31, 2022 | 1,331,414 | | | $ | 6,673 | | | $ | 6,657 | | | $ | 34,539 | | | $ | 23,687 | | | $ | (6,535) | | | $ | 23 | | | $ | 65,044 | | |
| Balance, January 1, 2023 | Balance, January 1, 2023 | 1,326,829 | | | $ | 6,673 | | | $ | 6,634 | | | $ | 34,544 | | | $ | 26,264 | | | $ | (13,601) | | | $ | 23 | | | $ | 60,537 | | |
| Net income | — | | | — | | | — | | | — | | | 1,513 | | | — | | | 2 | | | 1,515 | | |
| OCI | — | | | — | | | — | | | — | | | — | | | 1,020 | | | — | | | 1,020 | | |
| | Issued in connection with equity awards, net | 5,089 | | | — | | | 26 | | | (45) | | | (1) | | | — | | | — | | | (20) | | |
| | Cash dividends declared on common stock | — | | | — | | | — | | | — | | | (691) | | | — | | | — | | | (691) | | |
| Cash dividends declared on preferred stock | — | | | — | | | — | | | — | | | (103) | | | — | | | — | | | (103) | | |
| Equity-based compensation expense | — | | | — | | | — | | | 83 | | | — | | | — | | | — | | | 83 | | |
| | Other, net | — | | | — | | | — | | | — | | | 56 | | | — | | | (3) | | | 53 | | |
| Balance, March 31, 2023 | 1,331,918 | | | $ | 6,673 | | | $ | 6,660 | | | $ | 34,582 | | | $ | 27,038 | | | $ | (12,581) | | | $ | 22 | | | $ | 62,394 | | |
| | | Balance, January 1, 2023 | |
| | Balance, January 1, 2023 | |
| Net income | |
| Net income | |
| Net income | |
| OCI | |
| OCI | |
| OCI | |
| | Issued in connection with equity awards, net | |
| | Issued in connection with equity awards, net | |
| | Issued in connection with equity awards, net | |
| | Cash dividends declared on common stock | |
| | Cash dividends declared on common stock | |
| | Cash dividends declared on common stock | |
| Cash dividends declared on preferred stock | |
| Cash dividends declared on preferred stock | |
| Cash dividends declared on preferred stock | |
| Equity-based compensation expense | |
| Equity-based compensation expense | |
| Equity-based compensation expense | |
| | Other, net | |
| | Other, net | |
| | Other, net | |
| Balance, March 31, 2023 | |
| Balance, March 31, 2023 | |
| Balance, March 31, 2023 | |
| Balance, January 1, 2024 | |
| Balance, January 1, 2024 | |
| Balance, January 1, 2024 | |
| Net income | |
| Net income | |
| Net income | |
| OCI | |
| OCI | |
| OCI | |
| | Issued in connection with equity awards, net | |
| | Issued in connection with equity awards, net | |
| | Issued in connection with equity awards, net | |
| | Cash dividends declared on common stock | |
| | Cash dividends declared on common stock | |
| | Cash dividends declared on common stock | |
| Cash dividends declared on preferred stock | |
| Cash dividends declared on preferred stock | |
| Cash dividends declared on preferred stock | |
| Equity-based compensation expense | |
| Equity-based compensation expense | |
| Equity-based compensation expense | |
| | Other, net | |
| | Other, net | |
| | Other, net | |
| Balance, March 31, 2024 | |
| Balance, March 31, 2024 | |
| Balance, March 31, 2024 | |
|
The accompanying notes are an integral part of these consolidated financial statements.
Truist Financial Corporation 7
CONSOLIDATED STATEMENTS OF CASH FLOWS(1)
TRUIST FINANCIAL CORPORATION AND SUBSIDIARIES | | Unaudited
(Dollars in millions) | |
| Unaudited
(Dollars in millions) | |
| Unaudited
(Dollars in millions) | Unaudited
(Dollars in millions) | | Three Months Ended March 31, | | Three Months Ended March 31, |
| 2023 | | 2022 | |
| Cash Flows From Operating Activities: | Cash Flows From Operating Activities: | | | | | |
| Cash Flows From Operating Activities: | |
| Cash Flows From Operating Activities: | |
| Net income | |
| Net income | |
| Net income | Net income | | $ | 1,515 | | | $ | 1,416 | | |
| Adjustments to reconcile net income to net cash from operating activities: | Adjustments to reconcile net income to net cash from operating activities: | | | | | |
| Adjustments to reconcile net income to net cash from operating activities: | |
| Adjustments to reconcile net income to net cash from operating activities: | |
| Provision for credit losses | Provision for credit losses | | 502 | | | (95) | | |
| Provision for credit losses | |
| Provision for credit losses | |
| | Depreciation | |
| | Depreciation | |
| | Depreciation | Depreciation | | 180 | | | 195 | | |
| | Amortization of intangibles | Amortization of intangibles | | 136 | | | 137 | | |
| | Securities (gains) losses | | — | | | 69 | | |
| Amortization of intangibles | |
| | Amortization of intangibles | |
| | Net change in operating assets and liabilities: | |
| | Net change in operating assets and liabilities: | |
| | Net change in operating assets and liabilities: | Net change in operating assets and liabilities: | | | | | |
| LHFS | LHFS | | (846) | | | 180 | | |
| Loan servicing rights | | 27 | | | (380) | | |
| LHFS | |
| LHFS | |
| | Pension asset | |
| | Pension asset | |
| | Pension asset | Pension asset | | (1,346) | | | (410) | | |
| Derivative assets and liabilities | Derivative assets and liabilities | | (12) | | | 986 | | |
| Derivative assets and liabilities | |
| Derivative assets and liabilities | |
| Trading assets | Trading assets | | 304 | | | (1,497) | | |
| Trading assets | |
| Trading assets | |
| Other assets and other liabilities | |
| Other assets and other liabilities | |
| Other assets and other liabilities | Other assets and other liabilities | | (490) | | | (558) | | |
| | Other, net | Other, net | | 148 | | | (231) | | |
| | Other, net | |
| | Other, net | |
| Net cash from operating activities | |
| Net cash from operating activities | |
| Net cash from operating activities | Net cash from operating activities | | 118 | | | (188) | | |
| Cash Flows From Investing Activities: | Cash Flows From Investing Activities: | | | | | |
| Cash Flows From Investing Activities: | |
| Cash Flows From Investing Activities: | |
| Proceeds from sales of AFS securities | |
| Proceeds from sales of AFS securities | |
| Proceeds from sales of AFS securities | Proceeds from sales of AFS securities | | 4 | | | 3,127 | | |
| Proceeds from maturities, calls and paydowns of AFS securities | Proceeds from maturities, calls and paydowns of AFS securities | | 1,279 | | | 5,259 | | |
| Proceeds from maturities, calls and paydowns of AFS securities | |
| Proceeds from maturities, calls and paydowns of AFS securities | |
| Purchases of AFS securities | |
| Purchases of AFS securities | |
| Purchases of AFS securities | Purchases of AFS securities | | (140) | | | (7,219) | | |
| Proceeds from maturities, calls and paydowns of HTM securities | Proceeds from maturities, calls and paydowns of HTM securities | | 858 | | | 857 | | |
| Purchases of HTM securities | | — | | | (3,020) | | |
| Proceeds from maturities, calls and paydowns of HTM securities | |
| Proceeds from maturities, calls and paydowns of HTM securities | |
| | Originations and purchases of loans and leases, net of sales and principal collected | |
| | Originations and purchases of loans and leases, net of sales and principal collected | |
| | Originations and purchases of loans and leases, net of sales and principal collected | Originations and purchases of loans and leases, net of sales and principal collected | | (1,835) | | | (134) | | |
| Net cash received (paid) for FHLB stock | Net cash received (paid) for FHLB stock | | (1,147) | | | (1) | | |
| Net cash received (paid) for FHLB stock | |
| Net cash received (paid) for FHLB stock | |
| Net cash received (paid) for securities borrowed or purchased under agreements to resell | |
| Net cash received (paid) for securities borrowed or purchased under agreements to resell | |
| Net cash received (paid) for securities borrowed or purchased under agreements to resell | Net cash received (paid) for securities borrowed or purchased under agreements to resell | | (456) | | | 1,706 | | |
| | Net cash received (paid) for asset acquisitions, business combinations, and divestitures | | — | | | (488) | | |
| | Other, net | |
| | Other, net | |
| | | Other, net | Other, net | | (613) | | | (121) | | |
| Net cash from investing activities | Net cash from investing activities | | (2,050) | | | (34) | | |
| Net cash from investing activities | |
| Net cash from investing activities | |
| Cash Flows From Financing Activities: | |
| Cash Flows From Financing Activities: | |
| Cash Flows From Financing Activities: | Cash Flows From Financing Activities: | | | |
| Net change in deposits | Net change in deposits | | (8,498) | | | 11,842 | | |
| Net change in deposits | |
| Net change in deposits | |
| Net change in short-term borrowings | |
| Net change in short-term borrowings | |
| Net change in short-term borrowings | Net change in short-term borrowings | | 224 | | | (145) | | |
| Proceeds from issuance of long-term debt | Proceeds from issuance of long-term debt | | 35,029 | | | 66 | | |
| Proceeds from issuance of long-term debt | |
| Proceeds from issuance of long-term debt | |
| Repayment of long-term debt | |
| Repayment of long-term debt | |
| Repayment of long-term debt | Repayment of long-term debt | | (8,444) | | | (1,699) | | |
| | Cash dividends paid on common stock | Cash dividends paid on common stock | | (691) | | | (637) | | |
| Cash dividends paid on preferred stock | | (103) | | | (88) | | |
| Net cash received (paid) for hedge unwinds | | (378) | | | (198) | | |
| Other, net | | (32) | | | (92) | | |
| Net cash from financing activities | | 17,107 | | | 9,049 | | |
| Net Change in Cash and Cash Equivalents | | 15,175 | | | 8,827 | | |
| Cash and Cash Equivalents, January 1 | | 21,421 | | | 20,295 | | |
| Cash and Cash Equivalents, March 31 | | $ | 36,596 | | | $ | 29,122 | | |
| Supplemental Disclosure of Cash Flow Information: | | | |
| Net cash paid (received) during the period for: | | | |
| Interest expense | | $ | 1,667 | | | $ | 156 | | |
| Income taxes | | 23 | | | 40 | | |
| | Noncash investing activities: | | | |
| Cash dividends paid on common stock | |
| | Cash dividends paid on common stock | |
| Cash dividends paid on preferred stock | |
| Cash dividends paid on preferred stock | |
| Cash dividends paid on preferred stock | |
| Net cash received (paid) for hedge unwinds | |
| Net cash received (paid) for hedge unwinds | |
| Net cash received (paid) for hedge unwinds | |
| | Other, net | |
| | Other, net | |
| | Other, net | |
| Net cash from financing activities | |
| Net cash from financing activities | |
| Net cash from financing activities | |
| Net Change in Cash and Cash Equivalents | |
| Net Change in Cash and Cash Equivalents | |
| Net Change in Cash and Cash Equivalents | |
| Cash and Cash Equivalents of Continuing and Discontinued Operations, January 1 | |
| Cash and Cash Equivalents of Continuing and Discontinued Operations, January 1 | |
| Cash and Cash Equivalents of Continuing and Discontinued Operations, January 1 | |
| Cash and Cash Equivalents of Continuing and Discontinued Operations, March 31 | |
| Cash and Cash Equivalents of Continuing and Discontinued Operations, March 31 | |
| Cash and Cash Equivalents of Continuing and Discontinued Operations, March 31 | |
| Supplemental Disclosure of Cash Flow Information: | |
| Supplemental Disclosure of Cash Flow Information: | |
| Supplemental Disclosure of Cash Flow Information: | |
| Net cash paid (received) during the period for: | |
| Net cash paid (received) during the period for: | |
| Net cash paid (received) during the period for: | |
| Interest expense | |
| Interest expense | |
| Interest expense | |
| Income taxes | |
| Income taxes | |
| Income taxes | |
| | Transfer of AFS securities to HTM | | — | | | 59,436 | | |
| |
(1)Cash flows of discontinued operations are reflected within operating, investing, and financing activities in the Consolidated Statements of Cash Flows. The cash balance of these operations is reported as assets of discontinued operations on the Consolidated Balance Sheets. Refer to “Note 2. Discontinued Operations” for additional information related to discontinued operations.
The accompanying notes are an integral part of these consolidated financial statements.
8 Truist Financial Corporation
NOTE 1. Basis of Presentation
General
See the Glossary of Defined Terms at the beginning of this Report for terms used herein. These consolidated financial statements and notes are presented in accordance with the instructions for Form 10-Q, and, therefore, do not include all information and notes necessary for a complete presentation of financial position, results of operations, and cash flow activity required in accordance with GAAP. In the opinion of management, all normal recurring adjustments necessary for a fair statement of the consolidated financial position and consolidated results of operations have been made. The year-end consolidated balance sheet data was derived from audited annual financial statements but does not contain all of the footnote disclosures from the annual financial statements. The information contained in the financial statements and notes included in the Annual Report on Form 10-K for the year ended December 31, 20222023 should be referred to in connection with these unaudited interim consolidated financial statements. The Company updated its accounting policies in connection with recently adopted accounting standards.standards, as applicable, which are described in this footnote. There were no other significant changes to the Company’s accounting policies from those disclosed in the Annual Report on Form 10-K for the year ended December 31, 20222023 that could have a material effect on the Company’s financial statements.
Discontinued Operations
The Company classifies assets and liabilities as held for sale when management, having the authority to approve the action, commits to a plan to sell the disposal group, the sale is probable to occur within one year, and the disposal group is available for immediate sale in its present condition. The Company also considers whether an active program to locate a buyer has been initiated, whether the disposal group is marketed actively for sale at a price that is reasonable in relation to its current fair value, and whether actions required to complete the plan indicate it is unlikely significant changes to the plan will be made or the plan will be withdrawn. An asset or business that meets the criteria for held for sale classification is reported as discontinued operations when the disposal represents a strategic shift that has had or will have a major effect on the Company’s operating results.
Assets and liabilities of discontinued operations are presented separately in the Consolidated Balance Sheets for current and prior periods commencing in the period in which the asset or business meets all of the held for sale criteria described above. Net income from discontinued operations, net of tax, are separately reported in the Consolidated Statements of Income for current and prior periods commencing in the period in which the asset or business meets all of the held for sale criteria described above, including any gain or loss recognized on the sale or adjustment of the carrying amount to fair value less cost to sell.
Certain activity of TIH impacting the Company's footnote disclosures have been removed or revised. The footnote disclosures included herein are presented on a continuing operations basis, unless otherwise noted.
Refer to “Note 2. Discontinued Operations” for additional information.
Segment Realignment
Effective January 1, 2024, several business activities were realigned reflecting updates to the Company’s operating structure. First, the CB&W segment was renamed CSBB and the C&CB segment was renamed WB. Second, the Wealth business was realigned into the WB segment from the CSBB segment, representing a separate reporting unit in that segment. Third, the small business banking client segmentation was realigned into the CSBB segment from the WB segment. Further, TIH was the principal legal entity of the IH segment. As the operations of TIH are now included in discontinued operations, the Company no longer presents the IH segment as one of its reportable segments. The segment disclosures have been revised to reflect the new structure. Refer to “Note 18. Operating Segments” for additional information.
Reclassifications
In the first quarter of 2023, the Company reclassified certain portfolios within the consumer portfolio segment to delineate home equity from other consumer portfolios. Additionally, during the first quarter of 2023, Truist reorganized Prime Rate Premium Finance Corporation, which includes AFCO Credit Corporation and CAFO Holding Company, into the C&CB segment from the IH segment. Prior periods were revised to conformaddition to the current presentation. Certainreclassifications discussed above in the Consolidated Balance Sheets, Consolidated Statements of Income, and certain footnotes for discontinued operations and the segment realignment, as applicable, certain other amounts reported in prior periods’ consolidated financial statements have been reclassified to conform to the current presentation.
Truist Financial Corporation 9
Use of Estimates in the Preparation of Financial Statements
The preparation of financial statements in conformity with GAAP requires management to make estimates and assumptions that affect the reported amounts of assets and liabilities and disclosure of contingent assets and liabilities as of the date of the financial statements and the reported amounts of revenues and expenses during the reporting periods. Actual results could differ from those estimates. Material estimates that are particularly susceptible to significant change include the determination of the ACL; determination of fair value for securities, MSRs, LHFS, trading loans, and derivative assets and liabilities; goodwill and other intangible assets; income taxes; and pension and postretirement benefit obligations.
Loan Modifications
In certain circumstances, the Company enters into agreements to modify the terms of loans to borrowers that are experiencing financial difficulty. The scope of these loan modifications varies from portfolio to portfolio but generally falls into one of the following categories:
•Renewals: represent the renewal of a loan where the Company has concluded that the borrower is experiencing financial difficulty. Commercial renewals result in an extension of the maturity date of the loan (or in some cases a contraction of the loan term), and other significant terms of the loan (e.g., interest rate, collateral, guarantor support, etc.) are re-evaluated in connection with the renewal event.
•Term extensions: represent an adjustment to the maturity date of the loan that typically results in a reduction to the borrower’s scheduled payment over the remainder of the loan.
•Capitalizations: represents the capitalization of forborne loan payments and/or other amounts advanced on behalf of the borrower into the principal balance of a residential mortgage loan.
•Payment delays: provide the borrower with a temporary postponement of loan payments that is considered other-than-insignificant, which has been defined as a payment delay that exceeds 90 days, or three payment cycles, over a rolling 12-month period. These postponed loan payments may result in an extension of the ultimate maturity date of the loan or may be capitalized into the principal balance of the loan in certain circumstances.
•Combinations: in certain circumstances more than one type of a modification is provided to a borrower (e.g., interest rate reduction and term extension).
•Other: represents other types of loan modifications that are not considered significant for disclosure purposes.
The Company has identified borrowers that are included in the Loan Modifications disclosures in “Note 5. Loans and ACL” as follows:
•Commercial: the Company evaluates all modifications of loans to commercial borrowers that are rated substandard or worse and includes the modifications in its disclosure to the extent that the modification is considered other-than-insignificant.
•Consumer and credit card: loan modifications to consumer and credit borrowers are generally limited to borrowers that are experiencing financial difficulty. As a result, the Company evaluates all modifications of consumer and credit card loans and includes them in the disclosure to the extent that they are considered other-than insignificant.
Truist Financial Corporation 9
Refer to the Annual Report on Form 10-K for the year ended December 31, 2022 for accounting policies related to prior period, including the Company’s TDR policies.
ALLL
The ALLL represents management’s best estimate of expected future credit losses related to its loan and lease portfolio at the balance sheet date. The Company’s ALLL estimation process gives consideration to relevant available information from internal and external sources relating to past events, current conditions and reasonable and supportable forecasts. The quantitative models used to forecast expected credit losses use portfolio balances, macroeconomic forecast data, portfolio composition and loan attributes as the primary inputs. Loss estimates are informed by historical loss experience that includes losses incurred on loans that were previously modified by the Company. As a result, the Company has concluded that aside from the limited circumstances where principal forgiveness is granted to a borrower, the financial effect of loan modifications is already inherently included in the ALLL.
Income Taxes
The Company’s provision for income taxes is based on income and expense reported for financial statement purposes after adjustments for permanent differences such as interest income from lending to tax-exempt entities, tax credits, and amortization expense related to qualified tax credit investments. In computing the provision for income taxes, the Company evaluates the technical merits of its income tax positions based on current legislative, judicial, and regulatory guidance. The proportional amortization method of accounting is used on affordable housing and other qualified tax credit investments, such that the initial cost of the investment giving rise to tax credits is amortized in proportion to the allocation of tax credits in each period as a component of the provision for income taxes. Truist includes the initial investment cash flows and subsequent credits within operating activities in the Consolidated Statement of Cash Flows.
Changes in Accounting Principles and Effects of New Accounting Pronouncements
| | | | | | | | |
| Standard / Adoption Date | Description | Effects on the Financial Statements |
|
| | |
| | |
| | |
Standards Not Yet Adopted During the Current Year |
Troubled Debt Restructurings and VintageImprovements to Income Tax Disclosures
January 1, 20232025 | Eliminates TDRs, while enhancing disclosure requirements forImproves the transparency of income tax disclosures by requiring (1) consistent categories and greater disaggregation of information in the rate reconciliation and (2) income taxes paid disaggregated by jurisdiction. It also includes certain loan refinancings and restructurings by creditors madeother amendments to borrowers experiencing financial difficulty. Additionally, requires disclosureimprove the effectiveness of current-period gross write-offs by yearincome tax disclosures. | Truist is evaluating the impact of origination for financing receivables and net investment in leases. | Truist adopted this standard on a modified-retrospective basis. Upon adoption,its disclosures. This standard relates to footnote disclosures only. |
Improvements to Reportable Segment Disclosures
December 31, 2024 | Improves reportable segment disclosure requirements primarily through enhanced disclosures about significant segment expenses. | Truist is evaluating the Company eliminated the separate ACL estimation process for loans classified as TDRs. The adoptionimpact of this standard did not have a material impact on the financial statements. The Company’s revisedits disclosures. This standard relates to footnote disclosures in accordance with the new standard are included in “Note 5. Loans and ACL.” |
Fair Value Hedging – Portfolio Layer Method
January 1, 2023only. | Introduces the portfolio layer method, which expands the current single-layer method to allow multiple hedged layers of a single closed portfolio. Additionally, expands the scope of the portfolio layer method to include non-prepayable assets, specifies eligible hedging instruments in a single-layer hedge, provides additional guidance on the accounting for and disclosure of hedge basis adjustments under the portfolio layer method and specifies how hedge basis adjustments should be considered when determining credit losses for the assets included in the closed portfolio. | The adoption of this standard did not have a material impact on the Company’s active last-of-layer hedges. |
Investments in Tax Credit Structures
January 1, 2023 | Allows reporting entities to elect to account for qualifying tax equity investments using the proportional amortization method, regardless of the program giving rise to the related income tax credits. Previously, reporting entities were only permitted to apply the proportional amortization method only to qualifying tax equity investments in low-income housing tax credit structures. | Truist early adopted this standard on a modified-retrospective basis. The adoption of this standard did not have a material impact on the financial statements. Refer to “Note 14. Commitments and Contingencies” for additional information regarding tax credit investments. |
| | |
|
| | |
10 Truist Financial Corporation
NOTE 2. Business Combinations, Divestitures, and Noncontrolling Interests
Noncontrolling InterestDiscontinued Operations
On April 3, 2023,February 20, 2024, the Company completed its sale of a 20%entered into an agreement to sell the remaining stake of the common equity in Truist Insurance Holdings, LLCTIH to an investor group led by Stone Point Capital LLC and Clayton, Dubilier & Rice for $1.95 billion, witha purchase price that implied an enterprise value for TIH of $15.5 billion. The divestiture of TIH represents a strategic shift that has a major effect on our operations and financial results. The Company reclassified all of the proceeds, netassets and liabilities of tax, recognized as an increaseTIH to shareholders’ equity. Indiscontinued operations in connection with the transaction,announcement of the noncontrolling interest holder received profit interests representing 3.75% coverage on disposition of the business. As such, financial information attributed to TIH has been recast to reflect discontinued operations for the periods presented herein. The following footnotes reflect impacts of discontinued operations: “Note 1. Basis of Presentation,” “Note 2. Discontinued Operations,” “Note 6. Goodwill and Other Intangible Assets,” “Note 8. Other Assets and Liabilities,” “Note 12. Income Taxes,” “Note 13. Benefit Plans,” “Note 17. Computation of EPS,” and “Note 18. Operating Segments.”
The following is a summary of the assets and liabilities of discontinued operations:
| | | | | | | | | | | | | | |
| (Dollars in millions) | | Mar 31, 2024 | | Dec 31, 2023 |
| Assets of discontinued operations: | | | | |
| Cash and due from banks | | $ | 83 | | | $ | 72 | |
| Interest-bearing deposits with banks | | 352 | | | 342 | |
| Premises and equipment | | 66 | | | 72 | |
| Goodwill | | 3,745 | | | 3,745 | |
| CDI and other intangible assets | | 1,229 | | | 1,251 | |
| Other assets | | 2,297 | | | 2,173 | |
| Total assets of discontinued operations | | $ | 7,772 | | | $ | 7,655 | |
| Liabilities of discontinued operations: | | | | |
| Other liabilities | | $ | 3,122 | | | $ | 3,539 | |
| Total liabilities of discontinued operations | | $ | 3,122 | | | $ | 3,539 | |
The following presents operating results of TIH classified as discontinued operations: | | | | | | | | | | | | | | | | | |
| (Dollars in millions) | Three Months Ended March 31, | | |
| 2024 | | 2023 | | | | | | |
| Interest Income | | | | | | | | | |
| Interest on other earning assets | $ | 24 | | | $ | 1 | | | | | | | |
| Total interest income | 24 | | | 1 | | | | | | | |
| Noninterest income | | | | | | | | | |
| Insurance income | $ | 892 | | | $ | 815 | | | | | | | |
| Other income | 5 | | | 3 | | | | | | | |
| Total noninterest income | 897 | | | 818 | | | | | | | |
| Expenses | | | | | | | | | |
| Personnel expense | 634 | | | 513 | | | | | | | |
| Professional fees and outside processing | 48 | | | 27 | | | | | | | |
| Software expense | 17 | | | 14 | | | | | | | |
| Net occupancy expense | 15 | | | 14 | | | | | | | |
| Amortization of intangibles | 21 | | | 36 | | | | | | | |
| Equipment expense | 9 | | | 8 | | | | | | | |
| Marketing and customer development | 10 | | | 10 | | | | | | | |
| | | | | | | | | |
| Restructuring charges | 19 | | | 7 | | | | | | | |
| Other expense | 58 | | | 52 | | | | | | | |
| Total noninterest expense | 831 | | | 681 | | | | | | | |
| Earnings | | | | | | | | | |
| Income before income taxes from discontinued operations | 90 | | | 138 | | | | | | | |
| Provision for income taxes | 23 | | | 33 | | | | | | | |
| Net income from discontinued operations | 67 | | | 105 | | | | | | | |
| Noncontrolling interests | 3 | | | 2 | | | | | | | |
| Net income from discontinued operations attributable to controlling interest | $ | 64 | | | $ | 103 | | | | | | | |
The components of net cash provided by operating, investing, and financing activities of discontinued operations included in the Consolidated Statements of Cash Flows are as follows: | | | | | | | | | | | | | | | | | |
| (Dollars in millions) | Three Months Ended March 31, | | |
| 2024 | | 2023 | | | | | | |
| Net cash from operating activities | $ | (346) | | | $ | (134) | | | | | | | |
| Net cash from investing activities | (4) | | | (7) | | | | | | | |
| Net cash from financing activities | 373 | | | (45) | | | | | | | |
| | | | | | | | | |
| | | | | | | | | |
Truist Insurance Holdings’ fully diluted equity value at transaction close, and certain consent and exit rights commensurate with a noncontrolling investor.Financial Corporation 11
On May 6, 2024, the Company completed the sale, which resulted in after-tax cash proceeds to Truist of approximately $10.1 billion. The transaction improves Truist’s relative capital position and allows Truist to maintain strategic flexibilityflexibility. Upon closing, the transaction resulted in a full deconsolidation of the TIH subsidiary from Truist and future upsideresulted in an approximate after-tax gain of approximately $4.7 billion. Refer to “Note 19. Subsequent Events” for additional information.
In connection with the sale of TIH, the Company has entered into various agreements with entities controlled by the buyers and TIH, including a transition services agreement and several commercial agreements, ranging from one to seven years. The transition services agreement includes the following support services: information technology, finance and accounting, human resources, marketing and communications, procurement, and real estate. The Company will be compensated for such services on a monthly basis. The commercial agreements represent arrangements for both the Company and TIH to continue engaging in certain business activities after the completion of the sale. Such activities include referral services and certain brokerage and administration services. In addition, TIH will retain its depository relationship with Truist Insurance Holdings, which will continue to benefit from Truist’sBank after completion of the sale. TIH holds the majority of its cash in depository accounts with Truist Bank. TIH held $1.2 billion and $1.6 billion of deposits at Truist Bank as of March 31, 2024 and December 31, 2023, respectively. Such deposits are not presented in assets of discontinued operations access to capital, and client relationships, while creating additional opportunities for growth of Truist Insurance Holdings through the support of a strong blue-chip investor in Stone Point Capital.as they are eliminated upon consolidation.
NOTE 3. Securities Financing Activities
Securities purchased under agreements to resell are primarily collateralized by U.S. government or agency securities and are carried at the amounts at which the securities will be subsequently sold, plus accrued interest. Securities borrowed are primarily collateralized by corporate securities. The Company borrows securities and purchases securities under agreements to resell as part of its securities financing activities. On the acquisition date of these securities, the Company and the related counterparty agree on the amount of collateral required to secure the principal amount loaned under these arrangements. The Company monitors collateral values daily and calls for additional collateral to be provided as warranted under the respective agreements. The following table presents securities borrowed or purchased under agreements to resell: | | (Dollars in millions) | (Dollars in millions) | | Mar 31, 2023 | | Dec 31, 2022 | (Dollars in millions) | | Mar 31, 2024 | | Dec 31, 2023 |
| Securities purchased under agreements to resell | Securities purchased under agreements to resell | | $ | 2,685 | | | $ | 2,415 | |
| Securities borrowed | Securities borrowed | | 952 | | | 766 | |
| Total securities borrowed or purchased under agreements to resell | Total securities borrowed or purchased under agreements to resell | | $ | 3,637 | | | $ | 3,181 | |
| | Fair value of collateral permitted to be resold or repledged | Fair value of collateral permitted to be resold or repledged | | $ | 3,520 | | | $ | 3,058 | |
| Fair value of collateral permitted to be resold or repledged | |
| Fair value of collateral permitted to be resold or repledged | |
| Fair value of securities resold or repledged | Fair value of securities resold or repledged | | 657 | | | 864 | |
|
For securities sold under agreements to repurchase, the Company would be obligated to provide additional collateral in the event of a significant decline in fair value of the collateral pledged. This risk is managed by monitoring the liquidity and credit quality of the collateral, as well as the maturity profile of the transactions. Refer to “Note 14. Commitments and Contingencies” for additional information related to pledged securities. The following table presents the Company’s related activity, by collateral type and remaining contractual maturity: | | March 31, 2023 | | December 31, 2022 |
| March 31, 2024 | |
| March 31, 2024 | |
| March 31, 2024 | | | December 31, 2023 |
| (Dollars in millions) | (Dollars in millions) | Overnight and Continuous | | Up to 30 days | | | Total | | Overnight and Continuous | | Up to 30 days | | | Total | (Dollars in millions) | Overnight and Continuous | | Up to 30 days | | 30-90 days | | Total | | Overnight and Continuous | | Up to 30 days | | | | Total |
| U.S. Treasury | U.S. Treasury | $ | 631 | | | $ | 10 | | | | $ | 641 | | | $ | 318 | | | $ | — | | | | $ | 318 | |
| State and Municipal | State and Municipal | 297 | | | — | | | | 297 | | | 272 | | | — | | | | 272 | |
| GSE | 23 | | | — | | | | 23 | | | 74 | | | — | | | | 74 | |
| Agency MBS - residential | 666 | | | 6 | | | | 672 | | | 1,019 | | | 26 | | | | 1,045 | |
| | Agency MBS – residential | |
| Agency MBS – residential | |
| Agency MBS – residential | |
| Corporate and other debt securities | Corporate and other debt securities | 185 | | | 304 | | | | 489 | | | 369 | | | 50 | | | | 419 | |
| Total securities sold under agreements to repurchase | Total securities sold under agreements to repurchase | $ | 1,802 | | | $ | 320 | | | | $ | 2,122 | | | $ | 2,052 | | | $ | 76 | | | | $ | 2,128 | |
|
There were no securities financing transactions subject to legally enforceable master netting arrangements that were eligible for balance sheet netting for the periods presented.
12 Truist Financial Corporation 11
NOTE 4. Investment Securities
The following tables summarize the Company’s AFS and HTM securities: | March 31, 2023
(Dollars in millions) | | Amortized Cost | | Gross Unrealized | | Fair Value | |
| Gains | | Losses | | |
March 31, 2024
(Dollars in millions) | |
| March 31, 2024
(Dollars in millions) | |
| | | Gains | |
| | Gains | |
| AFS securities: | |
| AFS securities: | |
| AFS securities: | AFS securities: | | | | | | | | | |
| U.S. Treasury | U.S. Treasury | | $ | 11,083 | | | $ | 2 | | | $ | 644 | | | $ | 10,441 | | |
| U.S. Treasury | |
| U.S. Treasury | |
| GSE | GSE | | 332 | | | — | | | 31 | | | 301 | | |
| Agency MBS - residential | | 64,382 | | | 1 | | | 9,208 | | | 55,175 | | |
| Agency MBS - commercial | | 2,872 | | | — | | | 474 | | | 2,398 | | |
| GSE | |
| GSE | |
| Agency MBS – residential | |
| Agency MBS – residential | |
| Agency MBS – residential | |
| Agency MBS – commercial | |
| Agency MBS – commercial | |
| Agency MBS – commercial | |
| States and political subdivisions | |
| States and political subdivisions | |
| States and political subdivisions | States and political subdivisions | | 425 | | | 17 | | | 17 | | | 425 | | |
| Non-agency MBS | Non-agency MBS | | 3,884 | | | — | | | 786 | | | 3,098 | | |
| Non-agency MBS | |
| Non-agency MBS | |
| Other | Other | | 20 | | | — | | | — | | | 20 | | |
| Other | |
| Other | |
| Total AFS securities, excluding portfolio level basis adjustments | |
| Total AFS securities, excluding portfolio level basis adjustments | |
| Total AFS securities, excluding portfolio level basis adjustments | |
Portfolio level basis adjustments(1) | |
Portfolio level basis adjustments(1) | |
Portfolio level basis adjustments(1) | |
| Total AFS securities | Total AFS securities | | $ | 82,998 | | | $ | 20 | | | $ | 11,160 | | | $ | 71,858 | | |
| Total AFS securities | |
| Total AFS securities | |
| HTM securities: | |
| HTM securities: | |
| HTM securities: | HTM securities: | | | | | | | | | |
| | Agency MBS - residential | | $ | 56,932 | | | $ | — | | | $ | 8,835 | | | $ | 48,097 | | |
| Agency MBS – residential | |
| | Agency MBS – residential | |
| | Agency MBS – residential | |
| | December 31, 2022
(Dollars in millions) | | Amortized Cost | | Gross Unrealized | | Fair Value | |
| Gains | | Losses | | |
| AFS securities: | | | | | | | | | |
| U.S. Treasury | | $ | 11,080 | | | $ | — | | | $ | 785 | | | $ | 10,295 | | |
| GSE | | 339 | | | — | | | 36 | | | 303 | | |
| Agency MBS - residential | | 65,377 | | | — | | | 10,152 | | | 55,225 | | |
| Agency MBS - commercial | | 2,887 | | | — | | | 463 | | | 2,424 | | |
| States and political subdivisions | | 425 | | | 15 | | | 24 | | | 416 | | |
| Non-agency MBS | | 3,927 | | | — | | | 810 | | | 3,117 | | |
| Other | | 21 | | | — | | | — | | | 21 | | |
| Total AFS securities | | $ | 84,056 | | | $ | 15 | | | $ | 12,270 | | | $ | 71,801 | | |
| HTM securities: | | | | | | | | | |
| | Agency MBS - residential | | $ | 57,713 | | | $ | — | | | $ | 9,922 | | | $ | 47,791 | | |
December 31, 2023
(Dollars in millions) | |
| | | December 31, 2023
(Dollars in millions) | |
| | December 31, 2023
(Dollars in millions) | |
| | | Gains | |
| | Gains | |
| AFS securities: | |
| AFS securities: | |
| AFS securities: | |
| U.S. Treasury | |
| U.S. Treasury | |
| U.S. Treasury | |
| GSE | |
| GSE | |
| GSE | |
| Agency MBS – residential | |
| Agency MBS – residential | |
| Agency MBS – residential | |
| Agency MBS – commercial | |
| Agency MBS – commercial | |
| Agency MBS – commercial | |
| States and political subdivisions | |
| States and political subdivisions | |
| States and political subdivisions | |
| Non-agency MBS | |
| Non-agency MBS | |
| Non-agency MBS | |
| Other | |
| Other | |
| Other | |
| | Total AFS securities | |
| | Total AFS securities | |
| | Total AFS securities | |
| HTM securities: | |
| HTM securities: | |
| HTM securities: | |
| | Agency MBS – residential | |
| | Agency MBS – residential | |
| | Agency MBS – residential | |
|
(1)Represents fair value hedge basis adjustments related to active portfolio layer method hedges, which are not allocated to individual securities. For additional information, refer to “Note 16. Derivative Financial Instruments.”
The amortized cost and estimated fair value of certain MBS securities issued by FNMA and FHLMC that exceeded 10% of shareholders’ equity are shown in the table below:
| | March 31, 2023 |
| | March 31, 2024 | | | | March 31, 2024 |
| (Dollars in millions) | (Dollars in millions) | | Amortized Cost | | Fair Value | (Dollars in millions) | | Amortized Cost | | Fair Value |
| FNMA | FNMA | | $ | 41,783 | | | $ | 35,517 | |
| FHLMC | FHLMC | | 42,308 | | | 35,747 | |
The amortized cost and estimated fair value of the securities portfolio by contractual maturity are shown in the following table. The expected life of MBS may be shorter than the contractual maturities because borrowers have the right to prepay their obligations with or without penalties. | | | | | | | | | | | | | | | | | | | | | | | | | | | | | | | | | | | | | | | | | | | | | | | | | | | | | | | | | | | | | |
| Amortized Cost | | Fair Value | | |
March 31, 2023
(Dollars in millions) | Due in one year or less | | Due after one year through five years | | Due after five years through ten years | | Due after ten years | | Total | | Due in one year or less | | Due after one year through five years | | Due after five years through ten years | | Due after ten years | | Total | | |
| AFS securities: | | | | | | | | | | | | | | | | | | | | | |
| U.S. Treasury | $ | 2,587 | | | $ | 8,448 | | | $ | 19 | | | $ | 29 | | | $ | 11,083 | | | $ | 2,528 | | | $ | 7,869 | | | $ | 18 | | | $ | 26 | | | $ | 10,441 | | | |
| GSE | — | | | 7 | | | 11 | | | 314 | | | 332 | | | — | | | 7 | | | 10 | | | 284 | | | 301 | | | |
| Agency MBS - residential | — | | | 65 | | | 580 | | | 63,737 | | | 64,382 | | | — | | | 62 | | | 547 | | | 54,566 | | | 55,175 | | | |
| Agency MBS - commercial | 1 | | | 7 | | | 71 | | | 2,793 | | | 2,872 | | | 1 | | | 7 | | | 68 | | | 2,322 | | | 2,398 | | | |
| States and political subdivisions | 3 | | | 94 | | | 139 | | | 189 | | | 425 | | | 3 | | | 93 | | | 148 | | | 181 | | | 425 | | | |
| Non-agency MBS | — | | | — | | | — | | | 3,884 | | | 3,884 | | | — | | | — | | | — | | | 3,098 | | | 3,098 | | | |
| Other | 6 | | | — | | | 14 | | | — | | | 20 | | | 6 | | | — | | | 14 | | | — | | | 20 | | | |
| Total AFS securities | $ | 2,597 | | | $ | 8,621 | | | $ | 834 | | | $ | 70,946 | | | $ | 82,998 | | | $ | 2,538 | | | $ | 8,038 | | | $ | 805 | | | $ | 60,477 | | | $ | 71,858 | | | |
| HTM securities: | | | | | | | | | | | | | | | | | | | | | |
| | | | | | | | | | | | | | | | | | | | | |
| | | | | | | | | | | | | | | | | | | | | |
| Agency MBS - residential | $ | — | | | $ | — | | | $ | — | | | $ | 56,932 | | | $ | 56,932 | | | $ | — | | | $ | — | | | $ | — | | | $ | 48,097 | | | $ | 48,097 | | | |
| | | | | | | | | | | | | | | | | | | | | |
| | | | | | | | | | | | | | | | | | | | | |
| | | | | | | | | | | | | | | | | | | | | |
| | | | | | | | | | | | | | | | | | | | | |
| | | | | | | | | | | | | | | | | | | | | | | | | | | | | | | | | | | | | | | | | | | | | | | | | | | | | | | | | | | | | |
| Amortized Cost | | Fair Value | | |
March 31, 2024
(Dollars in millions) | Due in one year or less | | Due after one year through five years | | Due after five years through ten years | | Due after ten years | | Total | | Due in one year or less | | Due after one year through five years | | Due after five years through ten years | | Due after ten years | | Total | | |
| AFS securities: | | | | | | | | | | | | | | | | | | | | | |
| U.S. Treasury | $ | 2,871 | | | $ | 6,566 | | | $ | 14 | | | $ | 29 | | | $ | 9,480 | | | $ | 2,850 | | | $ | 6,133 | | | $ | 13 | | | $ | 24 | | | $ | 9,020 | | | |
| GSE | — | | | 7 | | | 12 | | | 366 | | | 385 | | | — | | | 7 | | | 11 | | | 332 | | | 350 | | | |
| Agency MBS – residential | — | | | 120 | | | 447 | | | 61,378 | | | 61,945 | | | — | | | 113 | | | 420 | | | 50,617 | | | 51,150 | | | |
| Agency MBS – commercial | — | | | — | | | 71 | | | 2,751 | | | 2,822 | | | — | | | — | | | 66 | | | 2,142 | | | 2,208 | | | |
| States and political subdivisions | 49 | | | 48 | | | 168 | | | 155 | | | 420 | | | 48 | | | 47 | | | 174 | | | 150 | | | 419 | | | |
| Non-agency MBS | — | | | — | | | 214 | | | 3,434 | | | 3,648 | | | — | | | — | | | 164 | | | 2,720 | | | 2,884 | | | |
| Other | — | | | 7 | | | 12 | | | — | | | 19 | | | — | | | 7 | | | 12 | | | — | | | 19 | | | |
| Total AFS securities | $ | 2,920 | | | $ | 6,748 | | | $ | 938 | | | $ | 68,113 | | | $ | 78,719 | | | $ | 2,898 | | | $ | 6,307 | | | $ | 860 | | | $ | 55,985 | | | $ | 66,050 | | | |
| HTM securities: | | | | | | | | | | | | | | | | | | | | | |
| | | | | | | | | | | | | | | | | | | | | |
| | | | | | | | | | | | | | | | | | | | | |
| Agency MBS – residential | $ | — | | | $ | — | | | $ | — | | | $ | 53,369 | | | $ | 53,369 | | | $ | — | | | $ | — | | | $ | — | | | $ | 43,041 | | | $ | 43,041 | | | |
| | | | | | | | | | | | | | | | | | | | | |
| | | | | | | | | | | | | | | | | | | | | |
| | | | | | | | | | | | | | | | | | | | | |
| | | | | | | | | | | | | | | | | | | | | |
12 Truist Financial Corporation 13
The following tables present the fair values and gross unrealized losses of investments based on the length of time that individual securities have been in a continuous unrealized loss position: | | Less than 12 months | | 12 months or more | | Total |
March 31, 2023
(Dollars in millions) | Fair Value | | Unrealized Losses | | Fair Value | | Unrealized Losses | | Fair Value | | Unrealized Losses |
| Less than 12 months | | | Less than 12 months | | 12 months or more | | Total |
March 31, 2024
(Dollars in millions) | | March 31, 2024
(Dollars in millions) | Fair Value | | Unrealized Losses | | Fair Value | | Unrealized Losses | | Fair Value | | Unrealized Losses |
| AFS securities: | AFS securities: | | | | | | | | | | | | AFS securities: | | | |
| U.S. Treasury | U.S. Treasury | $ | 1,267 | | | $ | 27 | | | $ | 8,977 | | | $ | 617 | | | $ | 10,244 | | | $ | 644 | |
| GSE | GSE | 112 | | | 5 | | | 175 | | | 26 | | | 287 | | | 31 | |
| Agency MBS - residential | 1,267 | | | 65 | | | 53,717 | | | 9,143 | | | 54,984 | | | 9,208 | |
| Agency MBS - commercial | 318 | | | 24 | | 2,066 | | | 450 | | | 2,384 | | | 474 | |
| Agency MBS – residential | |
| Agency MBS – commercial | |
| States and political subdivisions | States and political subdivisions | 42 | | | 1 | | | 210 | | | 16 | | | 252 | | | 17 | |
| Non-agency MBS | Non-agency MBS | — | | | — | | | 3,098 | | | 786 | | | 3,098 | | | 786 | |
| Other | Other | 5 | | | — | | | 15 | | | — | | | 20 | | | — | |
| Total | Total | $ | 3,011 | | | $ | 122 | | | $ | 68,258 | | | $ | 11,038 | | | $ | 71,269 | | | $ | 11,160 | |
| HTM securities: | HTM securities: | | | | | | | | | | | | HTM securities: | | | |
| | Agency MBS - residential | $ | — | | | $ | — | | | $ | 48,097 | | | $ | 8,835 | | | $ | 48,097 | | | $ | 8,835 | |
| Agency MBS – residential | |
| | Agency MBS – residential | |
| | Agency MBS – residential | |
| | | Less than 12 months | |
| | Less than 12 months | | 12 months or more | | Total |
December 31, 2022
(Dollars in millions) | Fair Value | | Unrealized Losses | | Fair Value | | Unrealized Losses | | Fair Value | | Unrealized Losses |
| | | Less than 12 months | |
| | Less than 12 months | | | 12 months or more | | Total |
December 31, 2023
(Dollars in millions) | | December 31, 2023
(Dollars in millions) | Fair Value | | Unrealized Losses | | Fair Value | | Unrealized Losses | | Fair Value | | Unrealized Losses |
| | AFS securities: | |
| AFS securities: | |
| AFS securities: | AFS securities: | | | | | | | | | | | | | | |
| U.S. Treasury | U.S. Treasury | $ | 2,069 | | | $ | 49 | | | $ | 8,186 | | | $ | 736 | | | $ | 10,255 | | | $ | 785 | |
| GSE | GSE | 180 | | | 14 | | | 114 | | | 22 | | | 294 | | | 36 | |
| Agency MBS - residential | 25,041 | | | 3,263 | | | 30,050 | | | 6,889 | | | 55,091 | | | 10,152 | |
| Agency MBS - commercial | 790 | | | 92 | | | 1,631 | | | 371 | | | 2,421 | | | 463 | |
| Agency MBS – residential | |
| Agency MBS – commercial | |
| States and political subdivisions | States and political subdivisions | 251 | | | 21 | | | 20 | | | 3 | | | 271 | | | 24 | |
| Non-agency MBS | Non-agency MBS | — | | | — | | | 3,117 | | | 810 | | | 3,117 | | | 810 | |
| Other | Other | 21 | | | — | | | — | | | — | | | 21 | | | — | |
| Total | Total | $ | 28,352 | | | $ | 3,439 | | | $ | 43,118 | | | $ | 8,831 | | | $ | 71,470 | | | $ | 12,270 | |
| HTM securities: | HTM securities: | | | | | | | | | | | | HTM securities: | | | |
| | Agency MBS - residential | $ | 29,369 | | | $ | 5,613 | | | $ | 18,422 | | | $ | 4,309 | | | $ | 47,791 | | | $ | 9,922 | |
| Agency MBS – residential | |
| | Agency MBS – residential | |
| | Agency MBS – residential | |
|
At March 31, 20232024 and December 31, 2022,2023, no ACL was established for AFS or HTM securities. Substantially all of the unrealized losses on the securities portfolio, including non-agency MBS, were the result of changes in market interest rates compared to the date the securities were acquired rather than the credit quality of the issuers or underlying loans. HTM debt securities consist of residential agency MBS. Accordingly, the Company does not expect to incur any credit losses on investment securities.
The following table presents gross securities gains and losses recognized in earnings: | | | | | | | | | | | | | | | | | | | | |
| (Dollars in millions) | | | | Three Months Ended March 31, |
| | | | | 2023 | | 2022 | | |
| Gross realized gains | | | | | | $ | — | | | $ | 13 | | | |
| Gross realized losses | | | | | | — | | | (82) | | | |
| | | | | | | | | | |
| | | | | | | | | | |
| Securities gains (losses), net | | | | | | $ | — | | | $ | (69) | | | |
| | | | | | | | | | |
14 Truist Financial Corporation 13
NOTE 5. Loans and ACL
In the first quarter of 2023, the Company adopted the Troubled Debt Restructurings and Vintage Disclosures accounting standard. Certain newly required disclosures in this footnote are presented as of and for the period ended March 31, 2023 only as the adoption of this guidance did not impact the prior periods. As such, disclosures were provided related to TDRs as of December 31, 2022 and for the three months ended March 31, 2022 under prior accounting standards. Refer to “Note 1. Basis of Presentation” for additional information.
The following tables present loans and leases HFI by aging category. Government guaranteed loans are not placed on nonperforming status regardless of delinquency because collection of principal and interest is reasonably assured. | | Accruing | |
March 31, 2023
(Dollars in millions) | | Current | | 30-89 Days Past Due | | 90 Days Or More Past Due(1) | | Nonperforming | | Total |
| | Accruing | |
March 31, 2024
(Dollars in millions) | |
March 31, 2024
(Dollars in millions) | |
March 31, 2024
(Dollars in millions) | | | Current | | 30-89 Days Past Due | | 90 Days Or More Past Due(1) | | Nonperforming | | Total |
| Commercial: | Commercial: | | | | | | | | | | | Commercial: | | |
| Commercial and industrial | Commercial and industrial | | $ | 166,663 | | | $ | 125 | | | $ | 35 | | | $ | 394 | | | $ | 167,217 | |
| CRE | CRE | | 22,519 | | | 34 | | | — | | | 117 | | | 22,670 | |
| Commercial construction | Commercial construction | | 5,947 | | | 3 | | | — | | | 1 | | | 5,951 | |
| | Consumer: | Consumer: | |
| Consumer: | |
| Consumer: | |
| Residential mortgage | |
| Residential mortgage | |
| Residential mortgage | Residential mortgage | | 55,057 | | | 491 | | | 674 | | | 233 | | | 56,455 | |
| Home equity | Home equity | | 10,370 | | | 65 | | | 10 | | | 132 | | | 10,577 | |
| Indirect auto | Indirect auto | | 26,498 | | | 511 | | | — | | | 270 | | | 27,279 | |
| Other consumer | Other consumer | | 27,523 | | | 164 | | | 10 | | | 45 | | | 27,742 | |
| Student | | 4,046 | | | 356 | | | 594 | | | — | | | 4,996 | |
| | Credit card | |
| Credit card | |
| Credit card | Credit card | | 4,692 | | | 56 | | | 38 | | | — | | | 4,786 | |
| | Total | Total | | $ | 323,315 | | | $ | 1,805 | | | $ | 1,361 | | | $ | 1,192 | | | $ | 327,673 | |
(1)Includes government guaranteed loans of $649 million in the residential mortgage portfolio and $590 million in the student portfolio. | | Total | |
| Total | |
(1)Includes government guaranteed loans of $408 million in the residential mortgage portfolio. | | (1)Includes government guaranteed loans of $408 million in the residential mortgage portfolio. |
| | Accruing | |
December 31, 2022
(Dollars in millions) | | Current | | 30-89 Days Past Due | | 90 Days Or More Past Due(1) | | Nonperforming | | Total |
| | Accruing | |
| | Accruing | |
| | Accruing | |
December 31, 2023
(Dollars in millions) | |
December 31, 2023
(Dollars in millions) | |
December 31, 2023
(Dollars in millions) | | | Current | | 30-89 Days Past Due | | 90 Days Or More Past Due(1) | | Nonperforming | | Total |
| Commercial: | Commercial: | | | | | | | | | | | Commercial: | | |
| Commercial and industrial | Commercial and industrial | | $ | 163,604 | | | $ | 256 | | | $ | 49 | | | $ | 398 | | | $ | 164,307 | |
| CRE | CRE | | 22,568 | | | 25 | | | 1 | | | 82 | | | 22,676 | |
| Commercial construction | Commercial construction | | 5,844 | | | 5 | | | — | | | — | | | 5,849 | |
| | Consumer: | Consumer: | | | | | | | | | |
| Consumer: | |
| Consumer: | |
| Residential mortgage | |
| Residential mortgage | |
| Residential mortgage | Residential mortgage | | 55,005 | | | 614 | | | 786 | | | 240 | | | 56,645 | |
| Home equity | Home equity | | 10,661 | | | 68 | | | 12 | | | 135 | | | 10,876 | |
| Indirect auto | Indirect auto | | 27,015 | | | 646 | | | 1 | | | 289 | | | 27,951 | |
| Other consumer | Other consumer | | 27,289 | | | 187 | | | 13 | | | 44 | | | 27,533 | |
| Student | | 4,179 | | | 402 | | | 706 | | | — | | | 5,287 | |
| | Credit card | |
| Credit card | |
| Credit card | Credit card | | 4,766 | | | 64 | | | 37 | | | — | | | 4,867 | |
| | Total | Total | | $ | 320,931 | | | $ | 2,267 | | | $ | 1,605 | | | $ | 1,188 | | | $ | 325,991 | |
(1)Includes government guaranteed loans of $759 million in the residential mortgage portfolio and $702 million in the student portfolio. | | Total | |
| Total | |
(1)Includes government guaranteed loans of $418 million in the residential mortgage portfolio. | | (1)Includes government guaranteed loans of $418 million in the residential mortgage portfolio. |
14 Truist Financial Corporation 15
The following tables present the amortized cost basis of loans by origination year and credit quality indicator: | March 31, 2023
(Dollars in millions) | Amortized Cost Basis by Origination Year | | Revolving Credit | | Loans Converted to Term | | Other(1) | | |
| 2023 | | 2022 | | 2021 | | 2020 | | 2019 | | Prior | | Total | |
March 31, 2024
(Dollars in millions) | |
| March 31, 2024
(Dollars in millions) | |
| | 2024 | |
| 2024 | |
| Commercial: | |
| Commercial: | |
| Commercial: | Commercial: | | | | | | | | | |
| Commercial and industrial: | Commercial and industrial: | | |
| Commercial and industrial: | |
| Commercial and industrial: | |
| Pass | |
| Pass | |
| Pass | Pass | $ | 9,673 | | | $ | 41,280 | | | $ | 19,702 | | | $ | 10,213 | | | $ | 7,556 | | | $ | 13,686 | | | $ | 59,715 | | | $ | — | | | $ | (217) | | | $ | 161,608 | | |
| Special mention | Special mention | 56 | | | 585 | | | 357 | | | 113 | | | 83 | | | 137 | | | 643 | | | — | | | — | | | 1,974 | | |
| Special mention | |
| Special mention | |
| Substandard | |
| Substandard | |
| Substandard | Substandard | 65 | | | 745 | | | 375 | | | 166 | | | 452 | | | 440 | | | 998 | | | — | | | — | | | 3,241 | | |
| Nonperforming | Nonperforming | 1 | | | 55 | | | 50 | | | 41 | | | 22 | | | 57 | | | 168 | | | — | | | — | | | 394 | | |
| Nonperforming | |
| Nonperforming | |
| Total | |
| Total | |
| Total | Total | 9,795 | | | 42,665 | | | 20,484 | | | 10,533 | | | 8,113 | | | 14,320 | | | 61,524 | | | — | | | (217) | | | 167,217 | | |
| Gross charge-offs | Gross charge-offs | — | | | 9 | | | 15 | | | 1 | | | 3 | | | 15 | | | 32 | | | — | | | — | | | 75 | | |
| Gross charge-offs | |
| Gross charge-offs | |
| CRE: | |
| CRE: | |
| CRE: | CRE: | | |
| Pass | Pass | 1,042 | | | 5,649 | | | 3,269 | | | 2,302 | | | 3,426 | | | 3,902 | | | 834 | | | — | | | (74) | | | 20,350 | | |
| Pass | |
| Pass | |
| Special mention | |
| Special mention | |
| Special mention | Special mention | 6 | | | 273 | | | 113 | | | 74 | | | 289 | | | 208 | | | — | | | — | | | — | | | 963 | | |
| Substandard | Substandard | 38 | | | 223 | | | 47 | | | 33 | | | 526 | | | 372 | | | 1 | | | — | | | — | | | 1,240 | | |
| Substandard | |
| Substandard | |
| Nonperforming | |
| Nonperforming | |
| Nonperforming | Nonperforming | — | | | 37 | | | 3 | | | 2 | | | — | | | 75 | | | — | | | — | | | — | | | 117 | | |
| Total | Total | 1,086 | | | 6,182 | | | 3,432 | | | 2,411 | | | 4,241 | | | 4,557 | | | 835 | | | — | | | (74) | | | 22,670 | | |
| Total | |
| Total | |
| Gross charge-offs | |
| Gross charge-offs | |
| Gross charge-offs | Gross charge-offs | — | | | 2 | | | — | | | — | | | — | | | 4 | | | — | | | — | | | — | | | 6 | | |
| Commercial construction: | Commercial construction: | | |
| Commercial construction: | |
| Commercial construction: | |
| Pass | |
| Pass | |
| Pass | Pass | 219 | | | 1,628 | | | 1,618 | | | 636 | | | 219 | | | 157 | | | 1,021 | | | — | | | — | | | 5,498 | | |
| Special mention | Special mention | 37 | | | 84 | | | 36 | | | 176 | | | — | | | — | | | 1 | | | — | | | — | | | 334 | | |
| Special mention | |
| Special mention | |
| Substandard | |
| Substandard | |
| Substandard | Substandard | 1 | | | 39 | | | 6 | | | 19 | | | — | | | 53 | | | — | | | — | | | — | | | 118 | | |
| Nonperforming | Nonperforming | — | | | — | | | — | | | — | | | 1 | | | — | | | — | | | — | | | — | | | 1 | | |
| Nonperforming | |
| Nonperforming | |
| Total | Total | 257 | | | 1,751 | | | 1,660 | | | 831 | | | 220 | | | 210 | | | 1,022 | | | — | | | — | | | 5,951 | | |
| Total | |
| Total | |
| Gross charge-offs | |
| Gross charge-offs | |
| Gross charge-offs | |
| | | Consumer: | |
| | Consumer: | |
| | Consumer: | Consumer: | | |
| Residential mortgage: | Residential mortgage: | | |
| Residential mortgage: | |
| Residential mortgage: | |
| | Current | |
| | Current | |
| | Current | Current | 649 | | | 13,827 | | | 17,194 | | | 6,076 | | | 3,037 | | | 14,274 | | | — | | | — | | | — | | | 55,057 | | |
| 30 - 89 days past due | 30 - 89 days past due | 2 | | | 33 | | | 57 | | | 25 | | | 29 | | | 345 | | | — | | | — | | | — | | | 491 | | |
| 30 - 89 days past due | |
| 30 - 89 days past due | |
| 90 days or more past due | |
| 90 days or more past due | |
| 90 days or more past due | 90 days or more past due | — | | | 11 | | | 29 | | | 50 | | | 56 | | | 528 | | | — | | | — | | | — | | | 674 | | |
| Nonperforming | Nonperforming | — | | | 6 | | | 11 | | | 9 | | | 12 | | | 195 | | | — | | | — | | | — | | | 233 | | |
| Nonperforming | |
| Nonperforming | |
| Total | |
| Total | |
| Total | Total | 651 | | | 13,877 | | | 17,291 | | | 6,160 | | | 3,134 | | | 15,342 | | | — | | | — | | | — | | | 56,455 | | |
| Gross charge-offs | Gross charge-offs | — | | | — | | | 1 | | | — | | | — | | | — | | | — | | | — | | | — | | | 1 | | |
| Gross charge-offs | |
| Gross charge-offs | |
| Home equity: | |
| Home equity: | |
| Home equity: | Home equity: | | |
| | Current | Current | | 6,506 | | | 3,864 | | | — | | | 10,370 | | |
| | Current | |
| | Current | |
| 30 - 89 days past due | |
| 30 - 89 days past due | |
| 30 - 89 days past due | 30 - 89 days past due | | 44 | | | 21 | | | — | | | 65 | | |
| 90 days or more past due | 90 days or more past due | | 6 | | | 4 | | | — | | | 10 | | |
| 90 days or more past due | |
| 90 days or more past due | |
| Nonperforming | |
| Nonperforming | |
| Nonperforming | Nonperforming | | 46 | | | 86 | | | — | | | 132 | | |
| Total | Total | — | | | — | | | — | | | — | | | — | | | — | | | 6,602 | | | 3,975 | | | — | | | 10,577 | | |
| Total | |
| Total | |
| Gross charge-offs | Gross charge-offs | — | | | — | | | — | | | — | | | — | | | — | | | 2 | | | — | | | — | | | 2 | | |
| Gross charge-offs | |
| Gross charge-offs | |
| Indirect auto: | |
| Indirect auto: | |
| Indirect auto: | Indirect auto: | | |
| | Current | Current | 2,077 | | | 10,757 | | | 6,504 | | | 3,667 | | | 2,147 | | | 1,339 | | | — | | | — | | | 7 | | | 26,498 | | |
| | Current | |
| | Current | |
| 30 - 89 days past due | 30 - 89 days past due | 6 | | | 147 | | | 130 | | | 82 | | | 70 | | | 76 | | | — | | | — | | | — | | | 511 | | |
| | 30 - 89 days past due | |
| 30 - 89 days past due | |
| 90 days or more past due | |
| 90 days or more past due | |
| 90 days or more past due | |
| Nonperforming | |
| Nonperforming | |
| Nonperforming | Nonperforming | — | | | 57 | | | 71 | | | 49 | | | 48 | | | 45 | | | — | | | — | | | — | | | 270 | | |
| Total | Total | 2,083 | | | 10,961 | | | 6,705 | | | 3,798 | | | 2,265 | | | 1,460 | | | — | | | — | | | 7 | | | 27,279 | | |
| Total | |
| Total | |
| Gross charge-offs | Gross charge-offs | — | | | 39 | | | 34 | | | 17 | | | 16 | | | 21 | | | — | | | — | | | — | | | 127 | | |
| Gross charge-offs | |
| Gross charge-offs | |
| Other consumer: | |
| Other consumer: | |
| Other consumer: | Other consumer: | | |
| | Current | Current | 2,915 | | | 10,324 | | | 5,181 | | | 2,777 | | | 1,563 | | | 1,690 | | | 3,053 | | | 20 | | | — | | | 27,523 | | |
| | Current | |
| | Current | |
| 30 - 89 days past due | |
| 30 - 89 days past due | |
| 30 - 89 days past due | 30 - 89 days past due | 4 | | | 71 | | | 36 | | | 20 | | | 16 | | | 12 | | | 4 | | | 1 | | | — | | | 164 | | |
| 90 days or more past due | 90 days or more past due | — | | | 8 | | | 1 | | | — | | | — | | | — | | | 1 | | | — | | | — | | | 10 | | |
| 90 days or more past due | |
| 90 days or more past due | |
| Nonperforming | |
| Nonperforming | |
| Nonperforming | Nonperforming | — | | | 4 | | | 15 | | | 10 | | | 6 | | | 9 | | | — | | | 1 | | | — | | | 45 | | |
| Total | Total | 2,919 | | | 10,407 | | | 5,233 | | | 2,807 | | | 1,585 | | | 1,711 | | | 3,058 | | | 22 | | | — | | | 27,742 | | |
| Gross charge-offs | — | | | 45 | | | 25 | | | 14 | | | 10 | | | 5 | | | 6 | | | — | | | — | | | 105 | | |
| Student: | | |
| Current | — | | | — | | | — | | | 16 | | 66 | | 3,964 | | | — | | | — | | | — | | | 4,046 | | |
| 30 - 89 days past due | — | | | — | | | — | | | — | | | 1 | | 355 | | | — | | | — | | | — | | | 356 | | |
| 90 days or more past due | — | | | — | | | — | | | — | | | 1 | | 593 | | | — | | | — | | | — | | | 594 | | |
| | Total | |
| Total | Total | — | | | — | | | — | | | 16 | | | 68 | | | 4,912 | | | — | | | — | | | — | | | 4,996 | | |
| Gross charge-offs | Gross charge-offs | — | | | — | | | — | | | — | | | — | | | 5 | | | — | | | — | | | — | | | 5 | | |
| Credit card: | | |
| Current | | 4,675 | | | 17 | | | — | | | 4,692 | | |
| 30 - 89 days past due | | 54 | | | 2 | | | — | | | 56 | | |
| 90 days or more past due | | 36 | | | 2 | | | — | | | 38 | | |
| | Total | — | | | — | | | — | | | — | | | — | | | — | | | 4,765 | | | 21 | | | — | | | 4,786 | | |
| Gross charge-offs | Gross charge-offs | — | | | — | | | — | | | — | | | — | | | — | | | 50 | | | 1 | | | — | | | 51 | | |
| Total | $ | 16,791 | | | $ | 85,843 | | | $ | 54,805 | | | $ | 26,556 | | | $ | 19,626 | | | $ | 42,512 | | | $ | 77,806 | | | $ | 4,018 | | | $ | (284) | | | $ | 327,673 | | |
| Gross charge-offs | Gross charge-offs | $ | — | | | $ | 95 | | | $ | 75 | | | $ | 32 | | | $ | 29 | | | $ | 50 | | | $ | 90 | | | $ | 1 | | | $ | — | | | $ | 372 | | |
| | | | Credit card: | |
| | Credit card: | |
| | Credit card: | |
| Current | |
| Current | |
| Current | |
| 30 - 89 days past due | |
| 30 - 89 days past due | |
| 30 - 89 days past due | |
| 90 days or more past due | |
| 90 days or more past due | |
| 90 days or more past due | |
| | Total | |
| | Total | |
| | Total | |
| Gross charge-offs | |
| Gross charge-offs | |
| Gross charge-offs | |
| Total | |
| Total | |
| Total | |
| Gross charge-offs | |
| Gross charge-offs | |
| Gross charge-offs | |
|
16 Truist Financial Corporation 15
| December 31, 2022
(Dollars in millions) | Amortized Cost Basis by Origination Year | | Revolving Credit | | Loans Converted to Term | | Other(1) | | |
| 2022 | | 2021 | | 2020 | | 2019 | | 2018 | | Prior | | Total | |
December 31, 2023
(Dollars in millions) | |
| December 31, 2023
(Dollars in millions) | |
| | 2023 | |
| 2023 | |
| Commercial: | |
| Commercial: | |
| Commercial: | Commercial: | | |
| Commercial and industrial: | Commercial and industrial: | | |
| Commercial and industrial: | |
| Commercial and industrial: | |
| Pass | |
| Pass | |
| Pass | Pass | $ | 45,890 | | | $ | 21,642 | | | $ | 11,219 | | | $ | 8,258 | | | $ | 4,977 | | | $ | 9,686 | | | $ | 57,854 | | | $ | — | | | $ | (199) | | | $ | 159,327 | | |
| Special mention | Special mention | 243 | | | 302 | | | 143 | | | 160 | | | 61 | | | 88 | | | 721 | | | — | | | — | | | 1,718 | | |
| Special mention | |
| Special mention | |
| Substandard | |
| Substandard | |
| Substandard | Substandard | 518 | | | 387 | | | 113 | | | 413 | | | 249 | | | 187 | | | 997 | | | — | | | — | | | 2,864 | | |
| Nonperforming | Nonperforming | 47 | | | 53 | | | 10 | | | 28 | | | 46 | | | 27 | | | 187 | | | — | | | — | | | 398 | | |
| Nonperforming | |
| Nonperforming | |
| Total | Total | 46,698 | | | 22,384 | | | 11,485 | | | 8,859 | | | 5,333 | | | 9,988 | | | 59,759 | | | — | | | (199) | | | 164,307 | | |
| Total | |
| Total | |
| Gross charge-offs | |
| Gross charge-offs | |
| Gross charge-offs | |
| CRE: | |
| CRE: | |
| CRE: | CRE: | | |
| Pass | Pass | 6,141 | | | 3,595 | | | 2,220 | | | 3,846 | | | 2,092 | | | 2,265 | | | 757 | | | — | | | (70) | | | 20,846 | | |
| Pass | |
| Pass | |
| Special mention | |
| Special mention | |
| Special mention | Special mention | 106 | | | 118 | | | 74 | | | 229 | | | 281 | | | 5 | | | 18 | | | — | | | — | | | 831 | | |
| Substandard | Substandard | 106 | | | 99 | | | 35 | | | 422 | | | 121 | | | 134 | | | — | | | — | | | — | | | 917 | | |
| Substandard | |
| Substandard | |
| Nonperforming | |
| Nonperforming | |
| Nonperforming | Nonperforming | — | | | 3 | | | — | | | — | | | 77 | | | 2 | | | — | | | — | | | — | | | 82 | | |
| Total | Total | 6,353 | | | 3,815 | | | 2,329 | | | 4,497 | | | 2,571 | | | 2,406 | | | 775 | | | — | | | (70) | | | 22,676 | | |
| Total | |
| Total | |
| Gross charge-offs | |
| Gross charge-offs | |
| Gross charge-offs | |
| Commercial construction: | |
| Commercial construction: | |
| Commercial construction: | Commercial construction: | | |
| Pass | Pass | 1,501 | | | 1,500 | | | 825 | | | 290 | | | 212 | | | 71 | | | 1,056 | | | — | | | — | | | 5,455 | | |
| Pass | |
| Pass | |
| Special mention | |
| Special mention | |
| Special mention | Special mention | 80 | | | — | | | 93 | | | — | | | — | | | — | | | 35 | | | — | | | — | | | 208 | | |
| Substandard | Substandard | 114 | | | — | | | 18 | | | 1 | | | 53 | | | — | | | — | | | — | | | — | | | 186 | | |
| Substandard | |
| Substandard | |
| Nonperforming | |
| Nonperforming | |
| Nonperforming | |
| Total | |
| Total | |
| Total | |
| Gross charge-offs | |
| Gross charge-offs | |
| Gross charge-offs | |
| | Total | 1,695 | | | 1,500 | | | 936 | | | 291 | | | 265 | | | 71 | | | 1,091 | | | — | | | — | | | 5,849 | | |
| | Consumer: | |
| | Consumer: | |
| | Consumer: | Consumer: | | |
| Residential mortgage: | Residential mortgage: | | |
| Residential mortgage: | |
| Residential mortgage: | |
| | Current | |
| | Current | |
| | Current | Current | 13,824 | | | 17,340 | | | 6,167 | | | 3,084 | | | 1,384 | | | 13,206 | | | — | | | — | | | — | | | 55,005 | | |
| 30 - 89 days past due | 30 - 89 days past due | 55 | | | 61 | | | 32 | | | 37 | | | 43 | | | 386 | | | — | | | — | | | — | | | 614 | | |
| 30 - 89 days past due | |
| 30 - 89 days past due | |
| 90 or more days past due | |
| 90 or more days past due | |
| 90 or more days past due | 90 or more days past due | 5 | | | 31 | | | 62 | | | 62 | | | 91 | | | 535 | | | — | | | — | | | — | | | 786 | | |
| Nonperforming | Nonperforming | 4 | | | 6 | | | 10 | | | 12 | | | 17 | | | 191 | | | — | | | — | | | — | | | 240 | | |
| Nonperforming | |
| Nonperforming | |
| Total | Total | 13,888 | | | 17,438 | | | 6,271 | | | 3,195 | | | 1,535 | | | 14,318 | | | — | | | — | | | — | | | 56,645 | | |
| Total | |
| Total | |
| Gross charge-offs | |
| Gross charge-offs | |
| Gross charge-offs | |
| Home equity: | |
| Home equity: | |
| Home equity: | Home equity: | | |
| | Current | Current | | 6,843 | | | 3,818 | | | — | | | 10,661 | | |
| | Current | |
| | Current | |
| 30 - 89 days past due | |
| 30 - 89 days past due | |
| 30 - 89 days past due | 30 - 89 days past due | | 48 | | | 20 | | | — | | | 68 | | |
| 90 days or more past due | 90 days or more past due | | 9 | | | 3 | | | — | | | 12 | | |
| 90 days or more past due | |
| 90 days or more past due | |
| Nonperforming | |
| Nonperforming | |
| Nonperforming | Nonperforming | | 44 | | | 91 | | | — | | | 135 | | |
| Total | Total | — | | | — | | | — | | | — | | | — | | | — | | | 6,944 | | | 3,932 | | | — | | | 10,876 | | |
| Total | |
| Total | |
| Gross charge-offs | |
| Gross charge-offs | |
| Gross charge-offs | |
| Indirect auto: | |
| Indirect auto: | |
| Indirect auto: | Indirect auto: | | |
| | Current | Current | 11,646 | | | 7,141 | | | 4,105 | | | 2,461 | | | 1,096 | | | 559 | | | — | | | — | | | 7 | | | 27,015 | | |
| | Current | |
| | Current | |
| 30 - 89 days past due | |
| 30 - 89 days past due | |
| 30 - 89 days past due | 30 - 89 days past due | 147 | | | 174 | | | 111 | | | 100 | | | 60 | | | 54 | | | — | | | — | | | — | | | 646 | | |
| 90 days or more past due | 90 days or more past due | 1 | | | — | | | — | | | — | | | — | | | — | | | — | | | — | | | — | | | 1 | | |
| 90 days or more past due | |
| 90 days or more past due | |
| Nonperforming | |
| Nonperforming | |
| Nonperforming | Nonperforming | 41 | | | 77 | | | 56 | | | 56 | | | 34 | | | 25 | | | — | | | — | | | — | | | 289 | | |
| Total | Total | 11,835 | | | 7,392 | | | 4,272 | | | 2,617 | | | 1,190 | | | 638 | | | — | | | — | | | 7 | | | 27,951 | | |
| Total | |
| Total | |
| Gross charge-offs | |
| Gross charge-offs | |
| Gross charge-offs | |
| Other consumer: | |
| Other consumer: | |
| Other consumer: | Other consumer: | | |
| | Current | Current | 11,270 | | | 5,805 | | | 3,167 | | | 1,814 | | | 865 | | | 1,061 | | | 3,278 | | | 29 | | | — | | | 27,289 | | |
| | Current | |
| | Current | |
| 30 - 89 days past due | |
| 30 - 89 days past due | |
| 30 - 89 days past due | 30 - 89 days past due | 68 | | | 44 | | | 26 | | | 20 | | | 10 | | | 7 | | | 10 | | | 2 | | | — | | | 187 | | |
| 90 days or more past due | 90 days or more past due | 8 | | | 1 | | | 1 | | | 1 | | | — | | | — | | | 2 | | | — | | | — | | | 13 | | |
| 90 days or more past due | |
| 90 days or more past due | |
| Nonperforming | |
| Nonperforming | |
| Nonperforming | Nonperforming | 4 | | | 11 | | | 8 | | | 9 | | | 2 | | | 8 | | | 2 | | | — | | | — | | | 44 | | |
| Total | Total | 11,350 | | | 5,861 | | | 3,202 | | | 1,844 | | | 877 | | | 1,076 | | | 3,292 | | | 31 | | | — | | | 27,533 | | |
| Student: | | |
| Total | |
| Total | |
| Gross charge-offs | |
| Gross charge-offs | |
| Gross charge-offs | |
Student:(2) | |
Student:(2) | |
Student:(2) | |
| | Gross charge-offs | |
| | Gross charge-offs | |
| | Gross charge-offs | |
| Credit card: | |
| Credit card: | |
| Credit card: | |
| Current | |
| Current | |
| Current | Current | — | | | — | | | 17 | | | 71 | | | 57 | | | 4,034 | | | — | | | — | | | — | | | 4,179 | | |
| 30 - 89 days past due | 30 - 89 days past due | — | | | — | | | — | | | 1 | | | 1 | | | 400 | | | — | | | — | | | — | | | 402 | | |
| 30 - 89 days past due | |
| 30 - 89 days past due | |
| 90 days or more past due | |
| 90 days or more past due | |
| 90 days or more past due | 90 days or more past due | — | | | — | | | — | | | 1 | | | 1 | | | 704 | | | — | | | — | | | — | | | 706 | | |
| | Total | Total | — | | | — | | | 17 | | | 73 | | | 59 | | | 5,138 | | | — | | | — | | | — | | | 5,287 | | |
| Credit card: | | |
| Current | | 4,750 | | | 16 | | | — | | | 4,766 | | |
| 30 - 89 days past due | | 63 | | | 1 | | | — | | | 64 | | |
| 90 days or more past due | | 36 | | | 1 | | | — | | | 37 | | |
| | Total | Total | — | | | — | | | — | | | — | | | — | | | — | | | 4,849 | | | 18 | | | — | | | 4,867 | | |
| | Total | Total | $ | 91,819 | | | $ | 58,390 | | | $ | 28,512 | | | $ | 21,376 | | | $ | 11,830 | | | $ | 33,635 | | | $ | 76,710 | | | $ | 3,981 | | | $ | (262) | | | $ | 325,991 | | |
| Gross charge-offs | |
| Gross charge-offs | |
| Gross charge-offs | |
| Total | |
| Total | |
| Total | |
| Gross charge-offs | |
| Gross charge-offs | |
| Gross charge-offs | |
|
(1)Includes certain deferred fees and costs and other adjustments.
(2)Truist sold its student loan portfolio at the end of the second quarter of 2023. Charge-offs include $98 million related to the sale.
16 Truist Financial Corporation 17
ACL
The following tables present activity in the ACL:
| | | (Dollars in millions) | (Dollars in millions) | | Balance at Jan 1, 2022 | | Charge-Offs | | Recoveries | | Provision (Benefit) | | Other(1) | | Balance at Mar 31, 2022 |
| | (Dollars in millions) | |
| | (Dollars in millions) | | | Balance at Jan 1, 2023 | | Charge-Offs | | Recoveries | | Provision (Benefit) | | Other(1) | | Balance at Mar 31, 2023 |
| Commercial: | Commercial: | |
| Commercial and industrial | |
| Commercial and industrial | |
| Commercial and industrial | Commercial and industrial | | $ | 1,426 | | | $ | (31) | | | $ | 17 | | | $ | (93) | | | $ | — | | | $ | 1,319 | |
| CRE | CRE | | 350 | | | (1) | | | 1 | | | (67) | | | — | | | 283 | |
| Commercial construction | Commercial construction | | 52 | | | (1) | | | 1 | | | 1 | | | — | | | 53 | |
| | Consumer: | Consumer: | |
| Consumer: | |
| Consumer: | |
| Residential mortgage | |
| Residential mortgage | |
| Residential mortgage | Residential mortgage | | 308 | | | (2) | | | 6 | | | (2) | | | — | | | 310 | |
| Home equity | Home equity | | 96 | | | (1) | | | 5 | | | (12) | | | — | | | 88 | |
| Indirect auto | Indirect auto | | 1,022 | | | (102) | | | 23 | | | 14 | | | — | | | 957 | |
| Other consumer | Other consumer | | 714 | | | (76) | | | 21 | | | 38 | | | — | | | 697 | |
| Student | | 117 | | | (6) | | | — | | | 3 | | | 1 | | | 115 | |
Student(2) | |
| Credit card | Credit card | | 350 | | | (41) | | | 9 | | | 30 | | | — | | | 348 | |
| | ALLL | |
| ALLL | |
| ALLL | ALLL | | 4,435 | | | (261) | | | 83 | | | (88) | | | 1 | | | 4,170 | |
| RUFC | RUFC | | 260 | | | — | | | — | | | (7) | | | — | | | 253 | |
| ACL | ACL | | $ | 4,695 | | | $ | (261) | | | $ | 83 | | | $ | (95) | | | $ | 1 | | | $ | 4,423 | |
| | (Dollars in millions) | |
| (Dollars in millions) | |
| (Dollars in millions) | (Dollars in millions) | | Balance at Jan 1, 2023 | | Charge-Offs | | Recoveries | | Provision (Benefit) | | Other(1) | | Balance at Mar 31, 2023 | | Balance at Jan 1, 2024 | | Charge-Offs | | Recoveries | | Provision (Benefit) | | Other(1) | | Balance at Mar 31, 2024 |
| Commercial: | Commercial: | | | | | | | | | | | | | Commercial: | | |
| Commercial and industrial | Commercial and industrial | | $ | 1,409 | | | $ | (75) | | | $ | 13 | | | $ | 151 | | | $ | (1) | | | $ | 1,497 | |
| CRE | CRE | | 224 | | | (6) | | | 1 | | | 32 | | | — | | | 251 | |
| Commercial construction | Commercial construction | | 46 | | | — | | | 1 | | | 40 | | | — | | | 87 | |
| | Consumer: | Consumer: | | | | | | | | | | | |
| Consumer: | |
| Consumer: | |
| Residential mortgage | |
| Residential mortgage | |
| Residential mortgage | Residential mortgage | | 399 | | | (1) | | | 2 | | | 13 | | | (81) | | | 332 | |
| Home equity | Home equity | | 90 | | | (2) | | | 6 | | | (7) | | | — | | | 87 | |
| Indirect auto | Indirect auto | | 981 | | | (127) | | | 26 | | | 100 | | | 13 | | | 993 | |
| Other consumer | Other consumer | | 770 | | | (105) | | | 17 | | | 98 | | | (1) | | | 779 | |
| Student | | 98 | | | (5) | | | — | | | 5 | | | — | | | 98 | |
| | Credit card | |
| Credit card | |
| Credit card | Credit card | | 360 | | | (51) | | | 9 | | | 40 | | | (3) | | | 355 | |
| | ALLL | |
| ALLL | |
| ALLL | ALLL | | 4,377 | | | (372) | | | 75 | | | 472 | | | (73) | | | 4,479 | |
| RUFC | RUFC | | 272 | | | — | | | — | | | 10 | | | — | | | 282 | |
| ACL | ACL | | $ | 4,649 | | | $ | (372) | | | $ | 75 | | | $ | 482 | | | $ | (73) | | | $ | 4,761 | |
|
(1)Includes the amounts for the ALLL for PCD acquisitions, the impact of adopting the Troubled Debt Restructurings and Vintage Disclosures accounting standard, and other activity.
(2)Truist sold its student loan portfolio at the end of the second quarter of 2023.
The commercial ALLL increased $156$27 million and the consumer ALLL decreased $49$25 million for the three months ended March 31, 2023.2024. The increase in the commercial ALLL primarily reflects loan growthan increase in reserves related to the CRE and increased economic uncertainty.commercial construction portfolios. The decrease in the consumer ALLL was primarily driven by the impactreflects a reduction in loan volume and consideration of the Troubled Debt Restructuringscontinued performance and Vintage Disclosures accounting standard, under which reasonable expectations of TDRs are no longer considered,improved outlook in consumer real estate, partially offset by increased economic uncertainty. Considerations for the increased economic uncertainty include the potential impacts related to the risks associated with inflation, rising rates, geopolitical events, and recession.an increase in certain consumer non-real estate portfolios.
The quantitative models have been designed to estimate losses using macro-economic forecasts over a reasonable and supportable forecast period of two years, followed by a reversion to long-term historical loss conditions over a one-year period. Forecasts of macroeconomic variables used in loss forecasting include, but are not limited to, unemployment trends, U.S. real GDP, corporate credit spreads, rental rates, property values, home price indices, and used car prices.
The primaryoverall economic forecast incorporates a third-party baseline forecast that is adjusted to reflect Truist’s interest rate outlook. Management also considers optimistic and pessimistic third-party macro-economic forecasts in order to capture uncertainty in the economic environment. These forecasts, along with the primary economic forecast, are weighted 40% baseline, 30% optimistic, and 30% pessimistic in the March 31, 20232024 ACL, unchanged since December 31, 2022.2023. While the scenario weightings were unchanged, each forecast scenario reflected deteriorationthe economic outlook relative to the prior period varied by economic variables, including improvement in certain economic variables (e.g., House Price Index) and projected softness in others over the reasonable and supportable forecast period when compared to the prior period. The primaryoverall economic forecast shaping the ACL estimate at March 31, 20232024 included GDP growth in the low-single digits and an unemployment rate near the mid-single digits.
18 Truist Financial Corporation 17
Quantitative models have certain limitations with respect to estimating expected losses, particularly in times of rapidly changing macro-economic conditions and forecasts. As a result, management believes that the qualitative component of the ACL, which incorporates management’s expert judgment related to expected future credit losses, will continue to be an important component of the ACL for the foreseeable future. The March 31, 20232024 ACL estimate includes adjustments to consider the impact of current and expected events or risks not captured by the loss forecasting models, the outcomes of which are uncertain and may not be completely considered by quantitative models. Refer to “Note 1. Basis of Presentation” in Truist’s Annual Report on Form 10-K for the year ended December 31, 20222023 for additional information.
NPAs
The following table provides a summary of nonperforming loans and leases, excluding LHFS: | | March 31, 2023 | | December 31, 2022 | |
| Recorded Investment | | Recorded Investment | |
| March 31, 2024 | |
| March 31, 2024 | |
| March 31, 2024 | |
| Recorded Investment | |
| Recorded Investment | |
| Recorded Investment | |
| (Dollars in millions) | |
| (Dollars in millions) | |
| (Dollars in millions) | (Dollars in millions) | Without an ALLL | | With an ALLL | | Without an ALLL | | With an ALLL | |
| Commercial: | Commercial: | | | |
| Commercial: | |
| Commercial: | |
| Commercial and industrial | |
| Commercial and industrial | |
| Commercial and industrial | Commercial and industrial | $ | 68 | | | $ | 326 | | | $ | 120 | | | $ | 278 | | |
| CRE | CRE | 11 | | | 106 | | | 75 | | | 7 | | |
| CRE | |
| CRE | |
| Commercial construction | |
| Commercial construction | |
| Commercial construction | Commercial construction | — | | | 1 | | | — | | | — | | |
| | Consumer: | Consumer: | | |
| | Consumer: | |
| | Consumer: | |
| Residential mortgage | |
| Residential mortgage | |
| Residential mortgage | Residential mortgage | — | | | 233 | | | 4 | | | 236 | | |
| Home equity | Home equity | 1 | | | 131 | | | 2 | | | 171 | | |
| Home equity | |
| Home equity | |
| Indirect auto | |
| Indirect auto | |
| Indirect auto | Indirect auto | — | | | 270 | | | 3 | | | 286 | | |
| Other consumer | Other consumer | — | | | 45 | | | — | | | 6 | | |
| Other consumer | |
| Other consumer | |
| | Total | |
| | Total | |
| | Total | Total | $ | 80 | | | $ | 1,112 | | | $ | 204 | | | $ | 984 | | |
| | | |
The following table presents a summary of nonperforming assets and residential mortgage loans in the process of foreclosure: | | (Dollars in millions) | (Dollars in millions) | Mar 31, 2023 | | Dec 31, 2022 | |
| (Dollars in millions) | |
| (Dollars in millions) | |
| Nonperforming loans and leases HFI | Nonperforming loans and leases HFI | $ | 1,192 | | | $ | 1,188 | | |
| | Nonperforming loans and leases HFI | |
| Nonperforming loans and leases HFI | |
| Nonperforming LHFS | |
| Nonperforming LHFS | |
| Nonperforming LHFS | |
| Foreclosed real estate | |
| Foreclosed real estate | |
| Foreclosed real estate | Foreclosed real estate | 3 | | | 4 | | |
| Other foreclosed property | Other foreclosed property | 66 | | | 58 | | |
| Other foreclosed property | |
| Other foreclosed property | |
| Total nonperforming assets | |
| Total nonperforming assets | |
| Total nonperforming assets | Total nonperforming assets | $ | 1,261 | | | $ | 1,250 | | |
| | Residential mortgage loans in the process of foreclosure | Residential mortgage loans in the process of foreclosure | $ | 226 | | | $ | 248 | | |
| | Residential mortgage loans in the process of foreclosure | |
| | Residential mortgage loans in the process of foreclosure | |
Loan Modifications
The following table summarizestables summarize the period-end amortized cost basis and the weighted average financial effect of loans to borrowers experiencing financial difficulty that were modified during the period, disaggregated by class of financing receivable and type of modification granted. This table includes modification activity that occurred on or after January 1, 2023. The volume of payment delay modifications is expected to increase throughout 2023 as the cumulative period over which such modifications are evaluated gradually extends to a full 12-month rolling period: | March 31, 2023
(Dollars in millions) | Renewals | | Term Extensions | | Capitalizations | | Payment Delays | | Combination -
Interest Rate Reduction and Term Extension | | Combination -
Capitalization and Term Extension | | Combination -
Capitalization, Interest Rate and Term Extension | | Other | | Total Modified Loans | | Percentage of Total Class of Financing Receivable | |
Three Months Ended March 31, 2024
(Dollars in millions) | |
Three Months Ended March 31, 2024
(Dollars in millions) | |
Three Months Ended March 31, 2024
(Dollars in millions) | |
| Commercial: | |
| Commercial: | |
| Commercial: | Commercial: | | |
| Commercial and industrial | Commercial and industrial | $ | 390 | | | $ | 51 | | | $ | — | | | $ | — | | | $ | — | | | $ | — | | | $ | — | | | $ | — | | | $ | 441 | | | 0.26 | % | |
| Commercial and industrial | |
| Commercial and industrial | |
| CRE | |
| CRE | |
| CRE | CRE | 103 | | | — | | | — | | | 71 | | | — | | | — | | | — | | | — | | | 174 | | | 0.77 | | |
| Commercial construction | Commercial construction | 1 | | | — | | | — | | | — | | | — | | | — | | | — | | | — | | | 1 | | | 0.02 | | |
| Commercial construction | |
| Commercial construction | |
| Consumer: | |
| Consumer: | |
| Consumer: | Consumer: | | |
| Residential mortgage | Residential mortgage | — | | | 29 | | | 32 | | | 25 | | | 1 | | | 92 | | | 20 | | | 4 | | | 203 | | | 0.36 | | |
| Residential mortgage | |
| Residential mortgage | |
| Home equity | |
| Home equity | |
| Home equity | Home equity | — | | | — | | | — | | | — | | | 2 | | | — | | | — | | | 1 | | | 3 | | | 0.03 | | |
| Indirect auto | Indirect auto | — | | | 5 | | | — | | | 5 | | | 5 | | | — | | | — | | | 6 | | | 21 | | | 0.08 | | |
| Indirect auto | |
| Indirect auto | |
| Other consumer | Other consumer | — | | | 5 | | | — | | | — | | | 1 | | | — | | | — | | | 1 | | | 7 | | | 0.03 | | |
| | Other consumer | |
| Other consumer | |
| Credit card | Credit card | — | | | — | | | — | | | — | | | — | | | — | | | — | | | 5 | | | 5 | | | 0.10 | | |
| Credit card | |
| Credit card | |
| Total | |
| Total | |
| Total | Total | $ | 494 | | | $ | 90 | | | $ | 32 | | | $ | 101 | | | $ | 9 | | | $ | 92 | | | $ | 20 | | | $ | 17 | | | $ | 855 | | | 0.26 | | |
| | |
18Truist Financial Corporation 19
| | | | | | | | | | | | | | | | | | | | | | | | | | | | | | | | | | | | | | | | | | | | | | | | | | | | | | | | | | | | | | | | |
Three Months Ended March 31, 2023
(Dollars in millions) | Renewals | | Term Extensions | | Capitalizations | | Payment Delays | | Combination -
Interest Rate Adjustment and Term Extension | | Combination -
Capitalization and Term Extension | | Combination -
Capitalization, Interest Rate and Term Extension | | Other | | Total Modified Loans | | Percentage of Total Class of Financing Receivable | | | | | |
| Commercial: | | | | | | | | | | | | | | | | | | | | | | | | |
| Commercial and industrial | $ | 390 | | | $ | 51 | | | $ | — | | | $ | — | | | $ | — | | | $ | — | | | $ | — | | | $ | — | | | $ | 441 | | | 0.26 | % | | | | | |
| CRE | 103 | | | — | | | — | | | 71 | | | — | | | — | | | — | | | — | | | 174 | | | 0.77 | | | | | | |
| Commercial construction | 1 | | | — | | | — | | | — | | | — | | | — | | | — | | | — | | | 1 | | | 0.02 | | | | | | |
| Consumer: | | | | | | | | | | | | | | | | | | | | | | | | |
| Residential mortgage | — | | | 29 | | | 32 | | | 25 | | | 1 | | | 92 | | | 20 | | | 4 | | | 203 | | | 0.36 | | | | | | |
| Home equity | — | | | — | | | — | | | — | | | 2 | | | — | | | — | | | 1 | | | 3 | | | 0.03 | | | | | | |
| Indirect auto | — | | | 5 | | | — | | | 5 | | | 5 | | | — | | | — | | | 6 | | | 21 | | | 0.08 | | | | | | |
| Other consumer | — | | | 5 | | | — | | | — | | | 1 | | | — | | | — | | | 1 | | | 7 | | | 0.03 | | | | | | |
| | | | | | | | | | | | | | | | | | | | | | | | |
| Credit card | — | | | — | | | — | | | — | | | — | | | — | | | — | | | 5 | | | 5 | | | 0.10 | | | | | | |
| Total | $ | 494 | | | $ | 90 | | | $ | 32 | | | $ | 101 | | | $ | 9 | | | $ | 92 | | | $ | 20 | | | $ | 17 | | | $ | 855 | | | 0.26 | % | | | | | |
| | | | | | | | | | | | | | | | | | | | | | | | |
| | | | | | | | | | | | | | | | | | | | | | | | |
| | | | | | | | | | | | | | | | | | | | | | | | |
| | | | | | | | | | | | | | | | | | | | | | | | |
| | | | | | | | | | | | | | | | | | | | | | | | |
| | | | | | | | | | | | | | | | | | | | | | | | |
| | | | | | | | | | | | | | | | | | | | | | | | |
| | | | | | | | | | | | | | | | | | | | | | | | |
| | | | | | | | | | | | | | | | | | | | | | | | |
| | | | | | | | | | | | | | | | | | | | | | | | |
| | | | | | | | | | | | | | | | | | | | | | | | |
| | | | | | | | | | | | | | | | | | | | | | | | |
| | | | | | | | | | | | | | | | | | | | | | | | |
| | | | | | | | | | | | | | | | | | | | | | | | |
| | | | | | | | | | | | | | | | | | | | | | | | |
| | | | | | | | | | | | | | | | | | | | | | | | |
| | | | | | | | | | | | | | | | | | | | | | |
| Three Months Ended March 31, 2024 | | | | | | | | | | | | | | |
| Loan Type | | Financial Effect | | | | | | | | | | | | | | |
| Renewals | | | | | | | | | | | | | | |
| Commercial and industrial | | Extended the term by 11 months and increased the interest rate by 0.5% | | | | | | | | | | | | | | |
| CRE | | Extended the term by 6 months and increased the interest rate by 0.5% | | | | | | | | | | | | | | |
| Commercial construction | | Extended the term by 11 months and increased the interest rate by 0.1% | | | | | | | | | | | | | | |
| Term Extensions | | | | | | | | | | | | | | |
| Residential mortgage | | Extended the term by 105 months. | | | | | | | | | | | | | | |
| | | | | | | | | | | | | | | | |
| Indirect auto | | Extended the term by 26 months. | | | | | | | | | | | | | | |
| Other consumer | | Extended the term by 26 months. | | | | | | | | | | | | | | |
| Capitalizations | | | | | | | | | | | | | | |
| Residential mortgage | | Capitalized a portion of forborne loan and other advanced payments into the outstanding loan balance. | | | | | | | | | | | | | | |
| Payment Delays | | | | | | | | | | | | | | |
| Commercial and industrial | | Provided 90 days of payment deferral. | | | | | | | | | | | | | | |
| CRE | | Provided 90 days of payment deferral. | | | | | | | | | | | | | | |
| Residential mortgage | | Provided 193 days of payment deferral. | | | | | | | | | | | | | | |
| Indirect auto | | Provided 186 days of payment deferral. | | | | | | | | | | | | | | |
| Combination - Interest Rate Adjustment and Term Extension | | | | | | | | | | | | | | |
| Home equity | | Extended the term by 275 months and decreased the interest rate by 3%. | | | | | | | | | | | | | | |
| Indirect auto | | Extended the term by 33 months and decreased the interest rate by 3%. | | | | | | | | | | | | | | |
| Other consumer | | Extended the term by 61 months and increased the interest rate by 0.025%. | | | | | | | | | | | | | | |
| Combination - Capitalization and Term Extension | | | | | | | | | | | | | | |
| Residential mortgage | | Capitalized a portion of forborne loan and other advanced payments into the outstanding loan balance and extended the term by 85 months. | | | | | | | | | | | | | | |
| Combination - Capitalization, Interest Rate and Term Extension | | | | | | | | | | | | | | |
| Residential mortgage | | Capitalized a portion of forborne loan and other advanced payments into the outstanding loan balance, extended the term by 134 months, and decreased the interest rate by 0.5%. | | | | | | | | | | | | | | |
| | | | | | | | | | | | | | | | |
| | | | | | | | | | | | | | |
| | | | | | | | | | | | | | | | |
| | | | | | | | | | | | | | |
| | | | | | | | | | | | | | | | |
| | | | | | | | | | | | | | | | |
| | | | | | | | | | | | | | | | |
| | | | | | | | | | | | | | |
| | | | | | | | | | | | | | | | |
| | | | | | | | | | | | | | | | |
| | | | | | | | | | | | | | | | |
| | | | | | | | | | | | | | | | |
| | | | | | | | | | | | | | |
| | | | | | | | | | | | | | | | |
| | | | | | | | | | | | | | |
| | | | | | | | | | | | | | | | |
| | | | | | | | | | | | | | | | |
| | | | | | | | | | | | | | | | |
| | | | | | | | | | | | | | | | |
| | | | | | | | | | | | | | | | |
| | | | | | | | | | | | | | | | |
| | | | | | | | | | | | | | |
| | | | | | | | | | | | | | | | |
| | | | | | | | | | | | | | | | |
| | | | | | | | | | | | | | | | |
| | | | | | | | | | | | | | | | |
| | | | | | | | | | | | | | | | |
| | | | | | | | | | | | | | |
| | | | | | | | | | | | | | | | |
| | | | | | | | | | | | | | |
| | | | | | | | | | | | | | | | |
20 Truist Financial Corporation
| | | | | | | | | | | | | | | | | | | | | | |
| Three Months Ended March 31, 2023 | | | | | | | | | | | | | | |
| Loan Type | | Financial Effect | | | | | | | | | | | | | | |
| Renewals | | | | | | | | | | | | | | |
| Commercial and industrial | | Extended the term by 4 months and increased the interest rate by 0.4%. | | | | | | | | | | | | | | |
| CRE | | Extended the term by 9 months and increased the interest rate by 0.1%. | | | | | | | | | | | | | | |
| Commercial construction | | Extended the term by 5 months. | | | | | | | | | | | | | | |
| Term Extensions | | | | | | | | | | | | | | |
| Commercial and industrial | | Extended the term by 3 months. | | | | | | | | | | | | | | |
| Residential mortgage | | Extended the term by 158 months. | | | | | | | | | | | | | | |
| Indirect auto | | Extended the term by 25 months. | | | | | | | | | | | | | | |
| Other Consumer | | Extended the term by 25 months. | | | | | | | | | | | | | | |
| Capitalizations | | | | | | | | | | | | | | |
| Residential mortgage | | Capitalized a portion of forborne loan and other advanced payments into the outstanding loan balance. | | | | | | | | | | | | | | |
| Payment Delays | | | | | | | | | | | | | | |
| CRE | | Provided 233 days of payment deferral. | | | | | | | | | | | | | | |
| Residential mortgage | | Provided 195 days of payment deferral. | | | | | | | | | | | | | | |
| Indirect auto | | Provided 129 days of payment deferral. | | | | | | | | | | | | | | |
| Combination - Interest Rate Adjustment and Term Extension | | | | | | | | | | | | | | |
| Residential mortgage | | Extended the term by 97 months and decreased the interest rate by 0.8%. | | | | | | | | | | | | | | |
| Home equity | | Extended the term by 318 months and decreased the interest rate by 2.3%. | | | | | | | | | | | | | | |
| Indirect auto | | Extended the term by 11 months and decreased the interest rate by 7%. | | | | | | | | | | | | | | |
| Other consumer | | Extended the term by 101 months and decreased the interest rate by 3%. | | | | | | | | | | | | | | |
| Combination - Capitalization and Term Extension | | | | | | | | | | | | | | |
| Residential mortgage | | Capitalized a portion of forborne loan and other advanced payments into the outstanding loan balance and extended the term by 111 months. | | | | | | | | | | | | | | |
| Combination - Capitalization, Interest Rate and Term Extension | | | | | | | | | | | | | | |
| Residential mortgage | | Capitalized a portion of forborne loan and other advanced payments into the outstanding loan balance, extended the term by 82 months, and decreased the interest rate by 0.3%. | | | | | | | | | | | | | | |
The tabletables above excludesexclude trial modifications totaling $40 million and $64 million as offor the three months ended March 31, 2023.2024 and 2023, respectively. Such modifications will be included in the modification activity disclosure if the borrower successfully completes the trial period and the loan modification is finalized.
As of March 31, 2024 and December 31, 2023, Truist had $353$489 million and $702 million, respectively, in unfunded lending commitments related to the modified obligations summarized in the table above.
The following table describes the financial effect of the modifications madelend additional funds to borrowers experiencing financial difficulty: | | | | | | | | | | | | | | | | | | | | | | |
For the Three Months Ended March 31, 2023 | | | | | | | | | | | | | | |
Loan Type | | Financial Effect | | | | | | | | | | | | | | |
Renewals | | | | | | | | | | | | | | |
Commercial and industrial | | Extended weighted average term by 4 months and increased the weighted average interest rate by 0.4%. | | | | | | | | | | | | | | |
CRE | | Extended weighted average term by 9 months and increased the weighted average interest rate by 0.1%. | | | | | | | | | | | | | | |
Commercial construction | | Extended weighted average term by 5 months. | | | | | | | | | | | | | | |
Term Extensions | | | | | | | | | | | | | | |
Commercial and industrial | | Extended weighted average term by 3 months. | | | | | | | | | | | | | | |
Residential mortgage | | Extended weighted average term by 158 months. | | | | | | | | | | | | | | |
Indirect auto | | Extended weighted average term by 25 months. | | | | | | | | | | | | | | |
Other Consumer | | Extended weighted average term by 25 months. | | | | | | | | | | | | | | |
Capitalizations | | | | | | | | | | | | | | |
Residential mortgage | | Capitalized $19 thousand on a weighted average basis into the outstanding balance of the loan. | | | | | | | | | | | | | | |
Payment Delays | | | | | | | | | | | | | | |
CRE | | Provided 233 days of payment deferral on a weighted average basis. | | | | | | | | | | | | | | |
Residential mortgage | | Provided 195 days of payment deferral on a weighted average basis. | | | | | | | | | | | | | | |
Indirect auto | | Provided 129 days of payment deferral on a weighted average basis. | | | | | | | | | | | | | | |
Combination - Interest Rate Adjustment and Term Extension | | | | | | | | | | | | | | |
Residential mortgage | | Extended weighted average term by 97 months and decreased the weighted average interest rate by 0.8%. | | | | | | | | | | | | | | |
Home equity | | Extended weighted average term by 318 months and decreased the weighted average interest rate by 2.3%. | | | | | | | | | | | | | | |
Indirect auto | | Extended weighted average term by 11 months and decreased the weighted average interest rate by 7%. | | | | | | | | | | | | | | |
Other consumer | | Extended weighted average term by 101 months and decreased the weighted average interest rate by 3%. | | | | | | | | | | | | | | |
Combination - Capitalization and Term Extension | | | | | | | | | | | | | | |
Residential mortgage | | Extended weighted average term by 111 months and capitalized $31 thousand on a weighted average basis into the outstanding loan balance. | | | | | | | | | | | | | | |
Combination - Capitalization, Interest Rate and Term Extension | | | | | | | | | | | | | | |
Residential mortgage | | Extended weighted average term by 82 months, decreased weighted average interest rate by 0.3% and capitalized $23 thousand on a weighted average basis into the outstanding loan balance. | | | | | | | | | | | | | | |
difficulty for which Truist has modified the terms of the receivables in the ways described above during the twelve months preceding March 31, 2024 and December 31, 2023, respectively.
Upon Truist’s determination that a modified loan (or portion of a loan) has subsequently been deemed uncollectible, the loan (or a portion of the loan) is written off. Therefore, the amortized cost basis of the loan is reduced by the uncollectible amount and the allowance for credit losses is adjusted by the same amount.
Truist Financial Corporation 1921
Truist closely monitors the performance of the loans that are modified to borrowers experiencing financial difficulty to understand the effectiveness of its modification efforts. The following table summarizes the period-end delinquency status and amortized cost of loans that were modified in the last 12 months. The period-end delinquency status of loans that were modified duringare disclosed at amortized cost and reflect the quarter:impact of any paydowns, payoffs, and/or charge-offs that occurred subsequent to modification. | | Payment Status (Amortized Cost Basis) | |
March 31, 2023 (Dollars in millions) | Current | | 30-89 Days Past Due | | 90 Days or More Past Due | | Total | |
| Payment Status (Amortized Cost Basis) | |
| Payment Status (Amortized Cost Basis) | |
| Payment Status (Amortized Cost Basis) | |
March 31, 2024 (Dollars in millions) | |
March 31, 2024 (Dollars in millions) | |
March 31, 2024 (Dollars in millions) | |
| Commercial: | |
| Commercial: | |
| Commercial: | Commercial: | | |
| Commercial and industrial | Commercial and industrial | $ | 406 | | | $ | 1 | | | $ | 34 | | | $ | 441 | | |
| Commercial and industrial | |
| Commercial and industrial | |
| CRE | |
| CRE | |
| CRE | CRE | 174 | | | — | | | — | | | 174 | | |
| Commercial construction | Commercial construction | 1 | | | — | | | — | | | 1 | | |
| Commercial construction | |
| Commercial construction | |
| Consumer: | |
| Consumer: | |
| Consumer: | Consumer: | | |
| Residential mortgage | Residential mortgage | 153 | | | 33 | | | 17 | | | 203 | | |
| Residential mortgage | |
| Residential mortgage | |
| Home equity | |
| Home equity | |
| Home equity | Home equity | 3 | | | — | | | — | | | 3 | | |
| Indirect auto | Indirect auto | 19 | | | 1 | | | 1 | | | 21 | | |
| Indirect auto | |
| Indirect auto | |
| Other consumer | Other consumer | 7 | | | — | | | — | | | 7 | | |
| | Other consumer | |
| Other consumer | |
| Credit card | |
| Credit card | |
| Credit card | Credit card | 3 | | | 1 | | | 1 | | | 5 | | |
| Total | Total | $ | 766 | | | $ | 36 | | | $ | 53 | | | $ | 855 | | |
| Total | |
| Total | |
| Total nonaccrual loans included above | Total nonaccrual loans included above | $ | 131 | | | $ | 10 | | | $ | 39 | | | $ | 180 | | |
| Total nonaccrual loans included above | |
| Total nonaccrual loans included above | |
| | Payment Status (Amortized Cost Basis) | |
| | Payment Status (Amortized Cost Basis) | |
| | Payment Status (Amortized Cost Basis) | |
December 31, 2023 (Dollars in millions) | |
December 31, 2023 (Dollars in millions) | |
December 31, 2023 (Dollars in millions) | |
| Commercial: | |
| Commercial: | |
| Commercial: | |
| Commercial and industrial | |
| Commercial and industrial | |
| Commercial and industrial | |
| CRE | |
| CRE | |
| CRE | |
| Commercial construction | |
| Commercial construction | |
| Commercial construction | |
| Consumer: | |
| Consumer: | |
| Consumer: | |
| Residential mortgage | |
| Residential mortgage | |
| Residential mortgage | |
| Home equity | |
| Home equity | |
| Home equity | |
| Indirect auto | |
| Indirect auto | |
| Indirect auto | |
| Other consumer | |
| Other consumer | |
| Other consumer | |
| Credit card | |
| Credit card | |
| Credit card | |
| Total | |
| Total | |
| Total | |
| Total nonaccrual loans included above | |
| Total nonaccrual loans included above | |
| Total nonaccrual loans included above | |
22 Truist Financial Corporation
The following table provides the amortized cost basis of financing receivables that were modified during the quarter thatand were in payment default:default in the last twelve months: | March 31, 2023 (Dollars in millions) | Renewals | | Term Extensions | | Capitalizations | | Payment Delays | | Combination -
Capitalization and Term Extension | | Combination -
Capitalization, Interest Rate and Term Extension | | Other | | Total | |
March 31, 2024 (Dollars in millions) | |
March 31, 2024 (Dollars in millions) | |
March 31, 2024 (Dollars in millions) | |
| Commercial: | Commercial: | | |
| Commercial: | |
| Commercial: | |
| Commercial and industrial | |
| Commercial and industrial | |
| Commercial and industrial | Commercial and industrial | $ | 34 | | | $ | — | | | $ | — | | | $ | — | | | $ | — | | | $ | — | | | $ | — | | | 34 | | |
| | Consumer: | Consumer: | | |
| | Consumer: | |
| | Consumer: | |
| Residential mortgage | |
| Residential mortgage | |
| Residential mortgage | Residential mortgage | — | | | 2 | | | 1 | | | 5 | | | 6 | | | 2 | | | 1 | | | 17 | | |
| | Indirect auto | Indirect auto | — | | | — | | | — | | | — | | | — | | | — | | | 1 | | | 1 | | |
| | Indirect auto | |
| | Indirect auto | |
| | Credit card | |
| | Credit card | |
| | Credit card | Credit card | — | | | — | | | — | | | — | | | — | | | — | | | 1 | | | 1 | | |
| Total | Total | $ | 34 | | | $ | 2 | | | $ | 1 | | | $ | 5 | | | $ | 6 | | | $ | 2 | | | $ | 3 | | | $ | 53 | | |
| Total | |
| Total | |
| December 31, 2023 (Dollars in millions) | |
| December 31, 2023 (Dollars in millions) | |
| December 31, 2023 (Dollars in millions) | |
| Commercial: | |
| Commercial: | |
| Commercial: | |
| Commercial and industrial | |
| Commercial and industrial | |
| Commercial and industrial | |
| CRE | |
| CRE | |
| CRE | |
| | Consumer: | |
| | Consumer: | |
| | Consumer: | |
| Residential mortgage | |
| Residential mortgage | |
| Residential mortgage | |
| | Indirect auto | |
| | Indirect auto | |
| | Indirect auto | |
| | Credit card | |
| | Credit card | |
| | Credit card | |
| Total | |
| Total | |
| Total | |
TDRs
The following table presents a summary of TDRs: | | | | | | | |
(Dollars in millions) | | | Dec 31, 2022 |
Performing TDRs: | | | |
Commercial: | | | |
Commercial and industrial | | | $ | 136 | |
CRE | | | 5 | |
Commercial construction | | | 1 | |
| | | |
Consumer: | | | |
Residential mortgage | | | 1,252 | |
Home equity | | | 51 | |
Indirect auto | | | 462 | |
Other consumer | | | 31 | |
Student | | | 30 | |
Credit card | | | 18 | |
Total performing TDRs | | | 1,986 | |
Nonperforming TDRs | | | 214 | |
Total TDRs | | | $ | 2,200 | |
ALLL attributable to TDRs | | | $ | 152 | |
The primary type of modification for newly designated TDRs is summarized in the tables below. New TDR balances represent the recorded investment at the end of the quarter in which the modification was made. The prior quarter balance represents recorded investment at the beginning of the quarter in which the modification was made. Rate modifications consist of TDRs made with below market interest rates, including those that also have modifications of loan structures.
20 Truist Financial Corporation
| | | | | | | | | | | | | | | | | | | | | | | | | | | | | | | |
| | | | | | | | | | | | | | | |
| | | |
| | | | | | | | | | | |
| | | | | | | | | | |
| | | | | | | | | | | | | | |
| | | | | | | | | | | | | | | |
| | | | | | | | | | | | | | | |
| | | | | | | | | | | | | | | |
| | | | | | | | | | | | | | | |
| | | | | | | | | | | | | | | |
| | | | | | | | | | | | | | | |
| | | | | | | | | | | | | | | |
| | | | | | | | | | | | | | | |
| | | | | | | | | | | | | | | |
| | | | | | | | | | | | | | | |
| | | | | | | | | | | | | | | |
| | | | | | | | | | | | | | | |
| | | | | | | | | | | | | | | |
| | | | | | | | | | | | | | | |
| | | | | | | | | | | | | | | |
| | | As of / For the Three Months Ended March 31, 2022 |
| | | | | | | Type of Modification | | Prior Quarter Loan Balance | | Related ALLL at Period End |
| (Dollars in millions) | | | | | | | Rate | | Structure | | |
| Newly designated TDRs: | | | | | | | | | | | | | | | |
| Commercial | | | | | | | | | $ | — | | | $ | 8 | | | $ | 10 | | | $ | — | |
| | | | | | | | | | | | | | | |
| | | | | | | | | | | | | | | |
| | | | | | | | | | | | | | | |
| | | | | | | | | | | | | | | |
| Consumer | | | | | | | | | 148 | | | 191 | | | 329 | | | 15 | |
| | | | | | | | | | | | | | | |
| | | | | | | | | | | | | | | |
| | | | | | | | | | | | | | | |
| | | | | | | | | | | | | | | |
| | | | | | | | | | | | | | | |
| Credit card | | | | | | | | | 2 | | | — | | | 2 | | | 1 | |
| Re-modification of previously designated TDRs | | | | | | | | | 21 | | | 11 | | | | | |
| | | | | | | | | | | | | | | |
| | | | | | | | | |
| | | | | | | | | | | | | |
| | | | | | | | | | | | | |
| | | | | | | | | | | | | | | |
| | | | | | | | | | | | | | | |
| | | | | | | | | | | | | | | |
| | | | | | | | | | | | | | | |
| | | | | | | | | | | | | | | |
| | | | | | | | | | | | | | | |
| | | | | | | | | | | | | | | |
| | | | | | | | | | | | | | | |
| | | | | | | | | | | | | | | |
| | | | | | | | | | | | | | | |
| | | | | | | | | | | | | | | |
| | | | | | | | | | | | | | | |
| | | | | | | | | | | | | | | |
| | | | | | | | | | | | | | | |
Unearned Income, Discounts, and Net Deferred Loan Fees and Costs
The following table presents additional information about loans and leases: | | (Dollars in millions) | (Dollars in millions) | Mar 31, 2023 | | Dec 31, 2022 | |
| (Dollars in millions) | |
| (Dollars in millions) | |
| Unearned income, discounts, and net deferred loan fees and costs | Unearned income, discounts, and net deferred loan fees and costs | $ | 299 | | | $ | 269 | | |
| Unearned income, discounts, and net deferred loan fees and costs | |
| Unearned income, discounts, and net deferred loan fees and costs | |
Truist Financial Corporation 23
NOTE 6. Goodwill and Other Intangible Assets
Effective January 1, 2024, several business activities were realigned reflecting updates to the Company’s operating structure. First, the CB&W segment was renamed CSBB and the C&CB segment was renamed WB. Second, the Wealth business was realigned into the WB segment from the CSBB segment, representing a separate reporting unit in that segment. Third, the small business banking client segmentation was realigned into the CSBB segment from the WB segment. Further, TIH was the principal legal entity of the IH segment. As the operations of TIH are now included in discontinued operations, the Company no longer presents the IH segment as one of its reportable segments. Following the realignment of these business activities, the Company’s three reporting units with goodwill balances are CSBB, WB, and Wealth.
In conjunction with these realignments, goodwill of $1.7 billion was realigned to WB from CSBB based on the relative fair value of CSBB and Wealth, and goodwill of $220 million was realigned to CSBB from WB based on the relative fair value of WB and the realigned small business banking client segmentation. In addition, the Company completed an assessment of any potential goodwill impairment for all impacted reporting units immediately prior and subsequent to the realignments and determined that no impairment existed. The quantitative valuation of WB performed in conjunction with these goodwill realignments indicated that as of January 1, 2024, the fair value of the WB reporting unit exceeded its carrying value by less than 10%, indicating that the goodwill of the WB reporting unit may be at risk of impairment.
The Company performed a qualitative assessment of currentmonitored events and circumstances during the period from January 1, 2024 to March 31, 2024, including macroeconomic and market factors, industry and banking sector events, Truist specific performance indicators, and a comparison of management’s forecast and assumptions to those used in its OctoberJanuary 1, 2022 qualitative impairment test.2024 quantitative valuations associated with the realignments of goodwill, and the sensitivity of the January 1, 2024 quantitative results to changes in assumptions as of March 31, 2024. Based on these considerations, Truist concluded that it was not more-likely-than-not that the fair value of one or more of its reporting units is below its respective carrying amount as of March 31, 2023, and therefore no triggering event occurred that required a quantitative goodwill impairment test. Refer to “Note 1. Basis of Presentation” in Truist’s Annual Report on Form 10-K for the year ended December 31, 2022 for additional information.2024.
The changes in the carrying amount of goodwill attributable to operating segments are reflected in the table below. Activity during 20232024 primarily relates to the reorganization of Prime Rate Premium Finance Corporation. Activity during 2022 reflects the acquisition of BankDirect Capital Finance, BenefitMall, and Kensington Vanguard National Land Services.segment realignment described above. Refer to “Note 2. Business Combinations” in Truist’s Annual Report on Form 10-K for the year ended December 31, 2022Discontinued Operations” for additional information on the acquisitionsrelated to discontinued operations and “Note 18. Operating Segments” for additional information on segments.
| | | | | | | | | | | | | | | | | | | | | | | | | | | |
| | | | | | | | | | | |
| (Dollars in millions) | CB&W | | C&CB | | IH | | Total | | | | |
| | | | | | | | | | | |
| | | | | | | | | | | |
| | | | | | | | | | | |
| Goodwill, January 1, 2022 | $ | 16,870 | | | $ | 6,149 | | | $ | 3,079 | | | $ | 26,098 | | | | | |
| Mergers and acquisitions | — | | | — | | | 912 | | | 912 | | | | | |
| Adjustments and other | (5) | | | 5 | | | 3 | | | 3 | | | | | |
| Goodwill, December 31, 2022 | 16,865 | | | 6,154 | | | 3,994 | | | 27,013 | | | | | |
| | | | | | | | | | | |
| Adjustments and other | — | | | 216 | | | (215) | | | 1 | | | | | |
| Goodwill, March 31, 2023 | $ | 16,865 | | | $ | 6,370 | | | $ | 3,779 | | | $ | 27,014 | | | | | |
| | | | | | | | | | | |
| | | | | | | | | | | | | | | | | | | | | |
| | | | | | | | | |
| (Dollars in millions) | CSBB | | WB | | Total | | | | |
| | | | | | | | | |
| | | | | | | | | |
| | | | | | | | | |
| | | | | | | | | |
| | | | | | | | | |
| | | | | | | | | |
| | | | | | | | | |
| Goodwill, December 31, 2023 | $ | 13,503 | | | $ | 3,653 | | | $ | 17,156 | | | | | |
| Segment realignment | (1,498) | | | 1,498 | | | — | | | | | |
| | | | | | | | | |
| | | | | | | | | |
| Adjustments and other | — | | | 1 | | | 1 | | | | | |
| Goodwill, March 31, 2024 | $ | 12,005 | | | $ | 5,152 | | | $ | 17,157 | | | | | |
| | | | | | | | | |
The following table, which excludes fully amortized intangibles, presents information for identifiable intangible assets: | | | |
| | | | | March 31, 2023 | | December 31, 2022 | | March 31, 2024 | | December 31, 2023 |
| (Dollars in millions) | (Dollars in millions) | Gross Carrying Amount | | Accumulated Amortization | | Net Carrying Amount | | Gross Carrying Amount | | Accumulated Amortization | | Net Carrying Amount | (Dollars in millions) | Gross Carrying Amount | | Accumulated Amortization | | Net Carrying Amount | | Gross Carrying Amount | | Accumulated Amortization | | Net Carrying Amount |
| CDI | CDI | | $ | 2,473 | | | $ | (1,465) | | | $ | 1,008 | | | $ | 2,473 | | | $ | (1,403) | | | $ | 1,070 | |
| Other, primarily client relationship intangibles | Other, primarily client relationship intangibles | | 3,802 | | | (1,275) | | | 2,527 | | | 3,812 | | | (1,210) | | | 2,602 | |
| Total | Total | | $ | 6,275 | | | $ | (2,740) | | | $ | 3,535 | | | $ | 6,285 | | | $ | (2,613) | | | $ | 3,672 | |
|
24 Truist Financial Corporation 21
NOTE 7. Loan Servicing
The Company acquires servicing rights, and retains servicing rights related to certain of its sales or securitizations of residential mortgages, commercial mortgages, and other consumer loans. Servicing rights are capitalized by the Company as Loan servicing rights on the Consolidated Balance Sheets. Income earned by the Company on its loan servicing rights is derived primarily from contractually specified servicing fees, late fees, net of curtailment costs, and other ancillary fees.
Residential Mortgage Activities
The following tables summarize residential mortgage servicing activities:
| | | (Dollars in millions) | (Dollars in millions) | | Mar 31, 2023 | | Dec 31, 2022 | |
| | (Dollars in millions) | |
| | (Dollars in millions) | |
| UPB of residential mortgage loan servicing portfolio | |
| UPB of residential mortgage loan servicing portfolio | |
| UPB of residential mortgage loan servicing portfolio | UPB of residential mortgage loan servicing portfolio | | $ | 272,323 | | | $ | 274,028 | | |
| UPB of residential mortgage loans serviced for others, primarily agency conforming fixed rate | UPB of residential mortgage loans serviced for others, primarily agency conforming fixed rate | | 214,830 | | | 217,046 | | |
| UPB of residential mortgage loans serviced for others, primarily agency conforming fixed rate | |
| UPB of residential mortgage loans serviced for others, primarily agency conforming fixed rate | |
| Mortgage loans sold with recourse | |
| Mortgage loans sold with recourse | |
| Mortgage loans sold with recourse | Mortgage loans sold with recourse | | 200 | | | 200 | | |
| Maximum recourse exposure from mortgage loans sold with recourse liability | Maximum recourse exposure from mortgage loans sold with recourse liability | | 128 | | | 127 | | |
| Maximum recourse exposure from mortgage loans sold with recourse liability | |
| Maximum recourse exposure from mortgage loans sold with recourse liability | |
| Indemnification, recourse and repurchase reserves | |
| Indemnification, recourse and repurchase reserves | |
| Indemnification, recourse and repurchase reserves | Indemnification, recourse and repurchase reserves | | 55 | | | 56 | | |
| As of / For the Three Months Ended March 31,
(Dollars in millions) | As of / For the Three Months Ended March 31,
(Dollars in millions) | | 2023 | | 2022 | |
| As of / For the Three Months Ended March 31,
(Dollars in millions) | |
| As of / For the Three Months Ended March 31,
(Dollars in millions) | |
| UPB of residential mortgage loans sold from LHFS | |
| UPB of residential mortgage loans sold from LHFS | |
| UPB of residential mortgage loans sold from LHFS | UPB of residential mortgage loans sold from LHFS | | $ | 2,507 | | | $ | 8,818 | | |
| Pre-tax gains recognized on mortgage loans sold and held for sale | Pre-tax gains recognized on mortgage loans sold and held for sale | | 16 | | | 39 | | |
| Pre-tax gains recognized on mortgage loans sold and held for sale | |
| Pre-tax gains recognized on mortgage loans sold and held for sale | |
| Servicing fees recognized from mortgage loans serviced for others | |
| Servicing fees recognized from mortgage loans serviced for others | |
| Servicing fees recognized from mortgage loans serviced for others | Servicing fees recognized from mortgage loans serviced for others | | 163 | | | 145 | | |
| Approximate weighted average servicing fee on the outstanding balance of residential mortgage loans serviced for others | Approximate weighted average servicing fee on the outstanding balance of residential mortgage loans serviced for others | | 0.27 | % | | 0.31 | % | |
| Approximate weighted average servicing fee on the outstanding balance of residential mortgage loans serviced for others | |
| Approximate weighted average servicing fee on the outstanding balance of residential mortgage loans serviced for others | |
| Weighted average interest rate on mortgage loans serviced for others | Weighted average interest rate on mortgage loans serviced for others | | 3.52 | | | 3.41 | | |
| Weighted average interest rate on mortgage loans serviced for others | |
| Weighted average interest rate on mortgage loans serviced for others | |
The following table presents a roll forward of the carrying value of residential MSRs recorded at fair value: | | | Three Months Ended March 31, | | |
| | (Dollars in millions) | (Dollars in millions) | | 2023 | | 2022 | |
| | (Dollars in millions) | |
| | (Dollars in millions) | |
| Residential MSRs, carrying value, January 1 | |
| Residential MSRs, carrying value, January 1 | |
| Residential MSRs, carrying value, January 1 | Residential MSRs, carrying value, January 1 | | $ | 3,428 | | | $ | 2,305 | | |
| | Additions | Additions | | 44 | | | 147 | | |
| | Additions | |
| | Additions | |
| Sales | Sales | | (428) | | | — | | |
| Sales | |
| Sales | |
Change in fair value due to changes in valuation inputs or assumptions(1) | |
Change in fair value due to changes in valuation inputs or assumptions(1) | |
Change in fair value due to changes in valuation inputs or assumptions(1) | Change in fair value due to changes in valuation inputs or assumptions(1) | | (1) | | | 350 | | |
| | Realization of expected net servicing cash flows, passage of time, and other | Realization of expected net servicing cash flows, passage of time, and other | | (57) | | | (110) | | |
| | Realization of expected net servicing cash flows, passage of time, and other | |
| | Realization of expected net servicing cash flows, passage of time, and other | |
| Residential MSRs, carrying value, March 31 | |
| Residential MSRs, carrying value, March 31 | |
| Residential MSRs, carrying value, March 31 | Residential MSRs, carrying value, March 31 | | $ | 2,986 | | | $ | 2,692 | | |
|
(1)The first quarter ofthree months ended March 31, 2023 includes realized gains on the portfolio sale of excess servicing.
The sensitivity of the fair value of the Company’s residential MSRs to changes in key assumptions is presented in the following table: | | March 31, 2023 | | December 31, 2022 |
| Range | | Weighted Average | | Range | | Weighted Average |
| March 31, 2024 | | | March 31, 2024 | | December 31, 2023 |
| Range | | | Range | | Weighted Average | | Range | | Weighted Average |
| (Dollars in millions) | (Dollars in millions) | Min | | Max | | Weighted Average | | Min | | Max | | Weighted Average |
| Prepayment speed | |
| Prepayment speed | |
| Prepayment speed | Prepayment speed | 7.7 | % | | 14.0 | % | | 8.3 | % | | 8.6 | % | | 12.5 | % | | 9.0 | % | 6.5 | % | | 17.3 | % | | 7.3 | % | | 6.7 | % | | 18.2 | % | | 7.5 | % |
| Effect on fair value of a 10% increase | Effect on fair value of a 10% increase | | $ | (87) | | | $ | (110) | |
| Effect on fair value of a 20% increase | Effect on fair value of a 20% increase | | (167) | | | (211) | |
| OAS | OAS | 1.7 | % | | 12.1 | % | | 4.6 | % | | 1.2 | % | | 11.4 | % | | 4.0 | % | OAS | 2.4 | % | | 11.9 | % | | 4.5 | % | | 2.2 | % | | 12.0 | % | | 4.6 | % |
| Effect on fair value of a 10% increase | Effect on fair value of a 10% increase | | $ | (57) | | | $ | (55) | |
| Effect on fair value of a 20% increase | Effect on fair value of a 20% increase | | (111) | | | (108) | |
| Composition of loans serviced for others: | Composition of loans serviced for others: | | | | | | | Composition of loans serviced for others: | | | | | | | | |
| Fixed-rate residential mortgage loans | Fixed-rate residential mortgage loans | | 99.5 | % | | 99.5 | % | Fixed-rate residential mortgage loans | | | | | 99.6 | % | | | | | | 99.6 | % |
| Adjustable-rate residential mortgage loans | Adjustable-rate residential mortgage loans | | 0.5 | | | 0.5 | |
| Total | Total | | | | | 100.0 | % | | | | | | 100.0 | % | Total | | | | | 100.0 | % | | | | 100.0 | % |
| Weighted average life | Weighted average life | | | | | 7.1 years | | | | | | 6.8 years | Weighted average life | | | | | 7.6 years | | | | 7.5 years |
The sensitivity calculations above are hypothetical and should not be considered predictive of future performance. As indicated, changes in fair value based on adverse changes in assumptions generally cannot be extrapolated because the relationship of the change in assumption to the change in fair value may not be linear. Also, in the above table, the effect of an adverse variation in one assumption on the fair value of the MSRs is calculated without changing any other assumption; while in reality, changes in one factor may result in changes in another, which may magnify or counteract the effect of the change. See “Note 15. Fair Value Disclosures” for additional information on the valuation techniques used.
22 Truist Financial Corporation 25
Commercial Mortgage Activities
The following table summarizes commercial mortgage servicing activities: | | | (Dollars in millions) | |
| (Dollars in millions) | |
| (Dollars in millions) | (Dollars in millions) | Mar 31, 2023 | | Dec 31, 2022 | Mar 31, 2024 | | Dec 31, 2023 |
| UPB of CRE mortgages serviced for others | UPB of CRE mortgages serviced for others | $ | 36,245 | | | $ | 36,622 | |
| CRE mortgages serviced for others covered by recourse provisions | CRE mortgages serviced for others covered by recourse provisions | 9,829 | | | 9,955 | |
| Maximum recourse exposure from CRE mortgages sold with recourse liability | Maximum recourse exposure from CRE mortgages sold with recourse liability | 2,820 | | | 2,861 | |
| Recorded reserves related to recourse exposure | Recorded reserves related to recourse exposure | 16 | | | 17 | |
| CRE mortgages originated during the year-to-date period | CRE mortgages originated during the year-to-date period | 1,041 | | | 7,779 | |
| Commercial MSRs at fair value | Commercial MSRs at fair value | 291 | | | 301 | |
|
NOTE 8. Other Assets and Liabilities
Lessee Operating and Finance Leases
The Company leases certain assets, consisting primarily of real estate, and assesses at contract inception whether a contract is, or contains, a lease. The following tables present additional information on leases, excluding leases related to the lease financing businesses: | | March 31, 2024 | |
| | March 31, 2024 | |
| | March 31, 2024 | | | December 31, 2023 |
| | | | March 31, 2023 | | December 31, 2022 |
| | | (Dollars in millions) | |
| | (Dollars in millions) | |
| | | (Dollars in millions) | (Dollars in millions) | Operating Leases | | Finance Leases | | Operating Leases | | Finance Leases | Operating Leases | | Finance Leases | | Operating Leases | | Finance Leases |
| ROU assets | ROU assets | $ | 1,151 | | | $ | 19 | | | $ | 1,193 | | | $ | 20 | |
| | Total lease liabilities | Total lease liabilities | 1,498 | | | 22 | | | 1,545 | | | 23 | |
| | Total lease liabilities | |
| | Total lease liabilities | |
| Weighted average remaining term | Weighted average remaining term | 6.4 years | | 5.4 years | | 6.6 years | | 5.6 years | Weighted average remaining term | 6.1 years | | 6.6 years | | 6.2 years | | 6.6 years |
| Weighted average discount rate | Weighted average discount rate | 2.8 | % | | 3.4 | % | | 2.7 | % | | 3.4 | % | Weighted average discount rate | 3.2 | % | | 5.2 | % | | 3.1 | % | | 5.1 | % |
| | | Three Months Ended March 31, |
| | | Three Months Ended March 31, | |
| | | Three Months Ended March 31, | |
| | | Three Months Ended March 31, | |
| (Dollars in millions) | (Dollars in millions) | | 2023 | | 2022 | |
| Operating lease costs | Operating lease costs | | $ | 82 | | | $ | 85 | | |
| Operating lease costs | |
| Operating lease costs | |
Lessor Operating Leases
The Company’s two primary lessor businesses are equipment financing and structured real estate with income recorded in Operating lease income on the Consolidated Statements of Income. The following table presents a summary of assets under operating leases.leases held for investment. This table excludes subleases on assets included in premises and equipment. | | (Dollars in millions) | (Dollars in millions) | | | Mar 31, 2023 | | Dec 31, 2022 |
Assets held under operating leases(1) | | | $ | 2,090 | | | $ | 2,090 | |
| (Dollars in millions) | |
| (Dollars in millions) | | | | Mar 31, 2024 | | Dec 31, 2023 |
Assets held under operating leases(1)(2) | |
| | Accumulated depreciation | Accumulated depreciation | | | (554) | | | (550) | |
| | Accumulated depreciation | |
| | Accumulated depreciation | |
| Net | Net | | | $ | 1,536 | | | $ | 1,540 | |
(1)Includes certain land parcels subject to operating leases that have indefinite lives.
(2)Excludes operating leases held-for-sale that totaled $40 million and $32 million at March 31, 2024 and December 31, 2023, respectively.
Bank-Owned Life Insurance
Bank-owned life insurance consists of life insurance policies held on certain teammates for which the Company is the beneficiary. The carrying value of bank-owned life insurance was $7.7 billion at March 31, 20232024 and $7.6 billion at December 31, 2022.2023.
26 Truist Financial Corporation 23
NOTE 9. Borrowings
The following table presents a summary of short-term borrowings: | | (Dollars in millions) | |
| (Dollars in millions) | |
| (Dollars in millions) | (Dollars in millions) | | Mar 31, 2023 | | Dec 31, 2022 | |
| | FHLB advances | FHLB advances | | $ | 18,900 | | | | $ | 18,900 | | |
| | FHLB advances | |
| | FHLB advances | |
| Securities sold under agreements to repurchase | |
| Securities sold under agreements to repurchase | |
| Securities sold under agreements to repurchase | Securities sold under agreements to repurchase | | 2,122 | | | | 2,128 | | |
| Securities sold short | Securities sold short | | 1,789 | | | | 1,551 | | |
| Collateral in excess of derivative exposures | | 455 | | | | 403 | | |
| Master notes | | 310 | | | | 370 | | |
| Securities sold short | |
| Securities sold short | |
| | Other short-term borrowings | |
| | Other short-term borrowings | |
| | Other short-term borrowings | Other short-term borrowings | | 102 | | | | 70 | | |
| Total short-term borrowings | Total short-term borrowings | | $ | 23,678 | | | | $ | 23,422 | | |
| Total short-term borrowings | |
| Total short-term borrowings | |
|
The following table presents a summary of long-term debt: | | (Dollars in millions) | (Dollars in millions) | | Mar 31, 2023 | | Dec 31, 2022 |
| | (Dollars in millions) | | | | | | | | | | | Mar 31, 2024 | | Dec 31, 2023 |
| | | | | | | | Carrying Amount | | (Dollars in millions) | | | | | | | | | Carrying Amount | | Carrying Amount |
| | Truist Financial Corporation: | Truist Financial Corporation: | | |
| Truist Financial Corporation: | |
| Truist Financial Corporation: | |
Fixed rate senior notes(1) | |
Fixed rate senior notes(1) | |
Fixed rate senior notes(1) | |
| Floating rate senior notes | |
Fixed rate subordinated notes(1)(2) | |
Capital notes(2) | |
| | Truist Bank: | |
| Truist Bank: | |
| Truist Bank: | |
| Fixed rate senior notes | |
| Fixed rate senior notes | |
| Fixed rate senior notes | Fixed rate senior notes | | $ | 16,059 | | | $ | 14,107 | |
| Floating rate senior notes | Floating rate senior notes | | 999 | | | 999 | |
Fixed rate subordinated notes(1) | | 1,895 | | | 1,882 | |
Capital notes(1) | | 626 | | | 625 | |
Structured notes(2) | | 12 | | | 12 | |
| Truist Bank: | | |
| Fixed rate senior notes | | 5,246 | | | 6,982 | |
| Floating rate senior notes | | 1,249 | | | 1,749 | |
Fixed rate subordinated notes(1) | | 4,795 | | | 4,767 | |
| Fixed rate FHLB advances | | 2 | | | 2 | |
Fixed rate subordinated notes(2) | |
| | Floating rate FHLB advances | |
| Floating rate FHLB advances | |
| Floating rate FHLB advances | Floating rate FHLB advances | | 37,800 | | | 10,800 | |
Other long-term debt(3) | Other long-term debt(3) | | 1,212 | | | 1,278 | |
| | Total long-term debt | Total long-term debt | | $ | 69,895 | | | $ | 43,203 | |
| | Total long-term debt | |
| | Total long-term debt | |
| |
(1)Certain senior and subordinated notes convert from fixed to floating one year prior to maturity, and are callable within the final year of maturity at par.
(2)Subordinated and capital notes with a remaining maturity of one year or greater qualify under the risk-based capital guidelines as Tier 2 supplementary capital, subject to certain limitations.
(2)Consist of notes with various terms that include fixed or floating rate interest or returns that are linked to an equity index.
(3)Includes debt associated with finance leases, tax credit investments, and other.
24 Truist Financial Corporation 27
NOTE 10. Shareholders’ Equity
Common Stock
The following table presents total dividends declared per share of common stock: | | | | | | | | | | | | | | | | | | | | |
| | | | Three Months Ended March 31, |
| | | | | | 2023 | | 2022 | | |
| Cash dividends declared per share | | | | | | $ | 0.52 | | | $ | 0.48 | | | |
| | | | | | | | | | | | | | | | | | | | |
| | | | Three Months Ended March 31, |
| | | | | | 2024 | | 2023 | | |
| Cash dividends declared per share | | | | | | $ | 0.52 | | | $ | 0.52 | | | |
NOTE 11. AOCI
AOCI includes the after-tax change in unrecognized net costs related to defined benefit pension and OPEB plans as well as unrealized gains and losses on cash flow hedges, AFS securities, and HTM securities transferred from AFS securities. | | | (Dollars in millions) | (Dollars in millions) | Pension and OPEB Costs | | Cash Flow Hedges | | AFS Securities | | HTM Securities | | Other, net | | Total |
| AOCI balance, January 1, 2022 | $ | (86) | | | $ | (9) | | | $ | (1,510) | | | $ | — | | | $ | 1 | | | $ | (1,604) | |
| OCI before reclassifications, net of tax | 2 | | | — | | | (5,036) | | | — | | | 1 | | | (5,033) | |
| AFS Securities transferred to HTM, net of tax | — | | | — | | | 2,872 | | | (2,872) | | | — | | | — | |
| Amounts reclassified from AOCI: | | | | | | | | | |
| Before tax | 8 | | | 6 | | | 61 | | | 57 | | | — | | | 132 | |
| Tax effect | 2 | | | 1 | | | 14 | | | 13 | | | — | | | 30 | |
| Amounts reclassified, net of tax | 6 | | | 5 | | | 47 | | | 44 | | | — | | | 102 | |
| Total OCI, net of tax | 8 | | | 5 | | | (4,989) | | | 44 | | | 1 | | | (4,931) | |
| AOCI balance, March 31, 2022 | $ | (78) | | | $ | (4) | | | $ | (3,627) | | | $ | (2,828) | | | $ | 2 | | | $ | (6,535) | |
| | (Dollars in millions) | |
| | (Dollars in millions) | | Pension and OPEB Costs | | Cash Flow Hedges | | AFS Securities | | HTM Securities | | Other, net | | Total |
| AOCI balance, January 1, 2023 | AOCI balance, January 1, 2023 | $ | (1,535) | | | $ | (78) | | | $ | (9,395) | | | $ | (2,588) | | | $ | (5) | | | $ | (13,601) | |
| OCI before reclassifications, net of tax | OCI before reclassifications, net of tax | (26) | | | 125 | | | 903 | | | — | | | 1 | | | 1,003 | |
| | Amounts reclassified from AOCI: | |
| Amounts reclassified from AOCI: | |
| Amounts reclassified from AOCI: | Amounts reclassified from AOCI: | | | | | | | | | | | | | | | | | | |
| Before tax | Before tax | 16 | | | — | | | (65) | | | 70 | | | — | | | 21 | |
| Tax effect | Tax effect | 4 | | | — | | | (15) | | | 15 | | | — | | | 4 | |
| Amounts reclassified, net of tax | Amounts reclassified, net of tax | 12 | | | — | | | (50) | | | 55 | | | — | | | 17 | |
| Total OCI, net of tax | Total OCI, net of tax | (14) | | | 125 | | | 853 | | | 55 | | | 1 | | | 1,020 | |
| AOCI balance, March 31, 2023 | AOCI balance, March 31, 2023 | $ | (1,549) | | | $ | 47 | | | $ | (8,542) | | | $ | (2,533) | | | $ | (4) | | | $ | (12,581) | |
| AOCI balance, January 1, 2024 | |
| OCI before reclassifications, net of tax | |
| | Amounts reclassified from AOCI: | |
| Amounts reclassified from AOCI: | |
| Amounts reclassified from AOCI: | | | | | | | | | | |
| Before tax | |
| Tax effect | |
| Amounts reclassified, net of tax | |
| Total OCI, net of tax | |
| AOCI balance, March 31, 2024 | |
| | Primary income statement location of amounts reclassified from AOCI | Other expense | | Net interest income and Other expense | | Securities gains (losses) and Net interest income | | Net interest income | | Net interest income | |
| |
28 Truist Financial Corporation 25
NOTE 12. Income Taxes
For the three months ended March 31, 20232024 and 2022,2023, the provision for income taxes from continuing operations was $394$232 million and $330$361 million, respectively, representing effective tax rates of 20.6%17.0% and 18.9%20.4%, respectively. The higherlower effective tax rate for the three months ended March 31, 20232024 was primarily due to higher income before taxes, discrete tax expense recognizeda decrease in the current quarter compared to discrete tax benefits recognized in the three months ended March 31, 2022, and the adoption of the Investments in Tax Credit Structures accounting standard related to the proportional amortization of tax credit investments in the current quarter. Refer to “Note 1. Basis of Presentation” for additional information on the adoption of this guidance.full year forecasted pre-tax earnings. The Company calculated the provision for income taxes by applying the estimated annual effective tax rate to year-to-date pre-tax income and adjusting for discrete items that occurred during the period.
NOTE 13. Benefit Plans
The components of net periodic (benefit) cost for defined benefit pension plans are summarized in the following table: | | Three Months Ended March 31, | |
| | Three Months Ended March 31, | |
| | Three Months Ended March 31, | |
| | Three Months Ended March 31, | |
| (Dollars in millions) | (Dollars in millions) | Income Statement Location | 2023 | | 2022 | |
| Service cost | Personnel expense | $ | 93 | | | $ | 139 | | |
| (Dollars in millions) | |
| (Dollars in millions) | |
Service cost(1) | |
Service cost(1) | |
Service cost(1) | |
| Interest cost | |
| Interest cost | |
| Interest cost | Interest cost | Other expense | 111 | | | 88 | | |
| Estimated return on plan assets | Estimated return on plan assets | Other expense | (228) | | | (269) | | |
| Estimated return on plan assets | |
| Estimated return on plan assets | |
| Amortization and other | |
| Amortization and other | |
| Amortization and other | Amortization and other | Other expense | 20 | | | 8 | | |
| Net periodic (benefit) cost | Net periodic (benefit) cost | | $ | (4) | | | $ | (34) | | |
| Net periodic (benefit) cost | |
| Net periodic (benefit) cost | |
(1)Includes $7 million for the three months ended March 31, 2024 and 2023 of service cost reported in net income from discontinued operations for the qualified defined benefit pension plan for employees of TIH. Following the sale of TIH, Truist will (i) no longer recognize the service costs for TIH employees, (ii) retain the related postretirement benefit obligation for TIH employees, and (iii) remeasure the postretirement benefit obligation of the plan.
Truist makes contributions to the qualified pension plans up to the maximum amount deductible for federal income tax purposes. Discretionary contributions totaling $1.3 billion were madeTruist did not make a discretionary contribution to the Truist pension plan during the three months ended March 31, 2023.2024.
26 Truist Financial Corporation
NOTE 14. Commitments and Contingencies
Truist utilizes a variety of financial instruments to mitigate exposure to risks and meet the financing needs and provide investment opportunities for clients. These financial instruments include commitments to extend credit, letters of credit and financial guarantees, derivatives, and other investments. Truist also has commitments to fund certain affordable housing investments and contingent liabilities related to certain sold loans.
Tax Credit and Certain Equity Investments
The Company invests as a limited partner in certain projects through the New Market Tax Credit program, which is a Federal financial program aimed to stimulate business and real estate investment in underserved communities via a Federal tax credit. Following the first quarter of 2023 adoption of the Investments in Tax Credit Structures accounting standard, these tax credits, referred to as “Other qualified tax credits” below, qualify for the proportional amortization method. Refer to “Note 1. Basis of Presentation” for additional information.
The following table summarizes certain tax credit and certain equity investments: | | (Dollars in millions) | (Dollars in millions) | Balance Sheet Location | Mar 31, 2023 | | Dec 31, 2022 | (Dollars in millions) | Balance Sheet Location | Mar 31, 2024 | | Dec 31, 2023 |
| Investments in affordable housing projects and other qualified tax credits: | Investments in affordable housing projects and other qualified tax credits: | | | | | Investments in affordable housing projects and other qualified tax credits: | | |
| Carrying amount | Carrying amount | Other assets | $ | 5,765 | | | $ | 5,869 | |
| Amount of future funding commitments included in carrying amount | Amount of future funding commitments included in carrying amount | Other liabilities | 1,726 | | | 1,762 | |
| Lending exposure | Lending exposure | Loans and leases for funded amounts | 1,625 | | | 1,547 | |
| | Renewable energy investments: | Renewable energy investments: | |
| Renewable energy investments: | |
| Renewable energy investments: | |
| Carrying amount | |
| Carrying amount | |
| Carrying amount | Carrying amount | Other assets | 272 | | | 264 | |
| Amount of future funding commitments not included in carrying amount | Amount of future funding commitments not included in carrying amount | NA | 444 | | | 361 | |
| SBIC and certain other equity method investments: | SBIC and certain other equity method investments: | |
| Carrying amount | Carrying amount | Other assets | 597 | | | 596 | |
| Carrying amount | |
| Carrying amount | |
| Amount of future funding commitments not included in carrying amount | Amount of future funding commitments not included in carrying amount | NA | 597 | | | 532 | |
Truist Financial Corporation 29
The following table presents a summary of tax credits and amortization expense associated with the Company’s tax credit investment activity. Activity related to the Company’s renewable energy investments, other than qualified tax credits, was immaterial. | | | | | | | | | | | | | | | | | | | | |
| | | | Three Months Ended March 31, |
| (Dollars in millions) | Income Statement Location | | | | | 2023 | | 2022 | | |
| Tax credits: | | | | | | | | | | |
| | | | | | | | | | |
| | | | | | | | | | |
| Investments in affordable housing projects, other qualified tax credits, and other community development investments | Provision for income taxes | | | | | $ | 157 | | | $ | 150 | | | |
| | | | | | | | | | |
| Amortization and other changes in carrying amount: | | | | | | | | | | |
Investments in affordable housing projects and other qualified tax credits(1) | Provision for income taxes | | | | | $ | 148 | | | $ | 124 | | | |
Other community development investments(1) | Other noninterest income | | | | | 2 | | | 19 | | | |
| | | | | | | | | | |
(1)In the first quarter of 2023, the Company adopted the Investments in Tax Credit Structures accounting standard. As a result, amortization related to these tax credits started being recognized in the Provision for income taxes as of the adoption of this standard. This activity was previously recognized in Other income. Refer to “Note 1. Basis of Presentation” for additional information. | | | | | | | | | | | | | | | | | | | | |
| | Three Months Ended March 31, | | |
| (Dollars in millions) | Income Statement Location | 2024 | | 2023 | | | | | | |
| Tax credits: | | | | | | | | | | |
| | | | | | | | | | |
| | | | | | | | | | |
| Investments in affordable housing projects, other qualified tax credits, and other community development investments | Provision for income taxes | $ | 185 | | | $ | 157 | | | | | | | |
| | | | | | | | | | |
| Amortization and other changes in carrying amount: | | | | | | | | | | |
| Investments in affordable housing projects and other qualified tax credits | Provision for income taxes | $ | 171 | | | $ | 148 | | | | | | | |
| Other community development investments | Other noninterest income | 2 | | | 2 | | | | | | | |
| | | | | | | | | | |
Letters of Credit and Financial Guarantees
In the normal course of business, Truist utilizes certain financial instruments to meet the financing needs of clients and to mitigate exposure to risks. Such financial instruments include commitments to extend credit and certain contractual agreements, including standby letters of credit and financial guarantee arrangements.
The following is a summary of selected notional amounts of off-balance sheet financial instruments: | | (Dollars in millions) | (Dollars in millions) | Mar 31, 2023 | Dec 31, 2022 | (Dollars in millions) | Mar 31, 2024 | Dec 31, 2023 |
| Commitments to extend, originate, or purchase credit and other commitments | Commitments to extend, originate, or purchase credit and other commitments | $ | 215,998 | | | $ | 216,838 | |
| Residential mortgage loans sold with recourse | Residential mortgage loans sold with recourse | 200 | | | 200 | |
| CRE mortgages serviced for others covered by recourse provisions | CRE mortgages serviced for others covered by recourse provisions | 9,829 | | | 9,955 | |
| Other loans serviced for others covered by recourse provisions | 759 | | | 723 | |
| Other loans serviced for others covered by recourse and other provisions | |
| Letters of credit | Letters of credit | 6,158 | | | 6,030 | |
|
Truist Financial Corporation 27
Total Return Swaps
The Company facilitates matched book TRS transactions on behalf of clients, whereby a VIE purchases reference assets identified by a client and the Company enters into a TRS with the VIE, with a mirror-image TRS facing the client. The Company provides senior financing to the VIE in the form of demand notes to fund the purchase of the reference assets. Reference assets are typically fixed income instruments primarily composed of syndicated bank loans. The TRS contracts pass through interest and other cash flows on the reference assets to the third-party clients, along with exposing those clients to decreases in value on the assets and providing them with the rights to appreciation on the assets. The terms of the TRS contracts require the third parties to post initial margin collateral, as well as ongoing margin as the fair values of the underlying reference assets change. The following table provides a summary of the TRS transactions with VIE purchases. VIE assets include trading loans and bonds: | | (Dollars in millions) | (Dollars in millions) | | Mar 31, 2023 | | Dec 31, 2022 | (Dollars in millions) | | Mar 31, 2024 | | Dec 31, 2023 |
| Total return swaps: | Total return swaps: | |
| VIE assets | VIE assets | | $ | 1,880 | | | $ | 1,830 | |
| VIE assets | |
| VIE assets | |
| Trading loans and bonds | Trading loans and bonds | | 1,801 | | | 1,790 | |
| VIE liabilities | VIE liabilities | | 118 | | | 163 | |
The Company concluded that the associated VIEs should be consolidated because the Company has (i) the power to direct the activities that most significantly impact the economic performance of the VIE and (ii) the obligation to absorb losses and the right to receive benefits, which could potentially be significant. The activities of the VIEs are restricted to buying and selling the reference assets, and the risks/benefits of any such assets owned by the VIEs are passed to the third-party clients via the TRS contracts. For additional information on TRS contracts and the related VIEs, see “Note 16. Derivative Financial Instruments.”
30 Truist Financial Corporation
Pledged Assets
Certain assets were pledged to secure municipal deposits, securities sold under agreements to repurchase, certain derivative agreements, and borrowings or borrowing capacity, as well as to fund certain obligations related to nonqualified defined benefit and defined contribution retirement plans and for other purposes as required or permitted by law. Assets pledged to the FHLB and FRB are subject to applicable asset discounts when determining borrowing capacity. The Company has capacity for secured financing from both the FRB and FHLB and letters of credit from the FHLB. The Company’s letters of credit from the FHLB can be used to secure various client deposits, including public fund relationships. Excluding assets related to nonqualified benefit plans, the majority of the agreements governing the pledged assets do not permit the other party to sell or repledge the collateral. The following table provides the total carrying amount of pledged assets by asset type: | | (Dollars in millions) | (Dollars in millions) | | Mar 31, 2023 | | Dec 31, 2022 | (Dollars in millions) | | Mar 31, 2024 | | Dec 31, 2023 |
| Pledged securities | Pledged securities | | $ | 71,890 | | | $ | 38,012 | |
| | Pledged loans: | Pledged loans: | |
| Pledged loans: | |
| Pledged loans: | |
| FRB | |
| FRB | |
| FRB | FRB | | 75,018 | | | 71,234 | |
| FHLB | FHLB | | 70,766 | | | 68,988 | |
| Unused borrowing capacity: | Unused borrowing capacity: | |
| FRB | FRB | | 53,291 | | | 49,250 | |
| FRB | |
| FRB | |
| FHLB | FHLB | | 24,678 | | | 20,770 | |
LitigationLegal Proceedings and RegulatoryOther Matters
Truist and/orand its subsidiaries are routinely named as defendants in or parties to numerous actual or threatened legal proceedings including civiland other matters and are or may be subject to potential liability in connection with them. The legal proceedings and other matters may be formal or informal and include litigation and arbitration with one or more identified claimants, certified or purported class actions with yet-to-be-identified claimants, and regulatory or other governmental information-gathering requests, examinations, investigations, and enforcement proceedings. Claims may be based in law or enforcement matters,equity—such as those arising from the ordinary conductunder contracts or in tort and those involving banking, consumer-protection, securities, antitrust, tax, employment, and other laws—and some present novel legal theories, allegations of its regular business activities. The matters range from individual actions involving a single plaintiff to class action lawsuits with many class members and can involve claims for substantial or indeterminate alleged damages, ordemands for injunctive or other relief. Investigations may involve both formalsimilar relief, and informal proceedings, by both governmental agencies and self-regulatory organizations, and could result inrequests for fines, penalties, restitution, and/or alterations in Truist’s business practices. TheseOur legal proceedings are atand other matters exist in varying stages of adjudication, arbitration, negotiation, or investigation and span our business lines and operations.
The course and outcome of legal proceedings and other matters are inherently unpredictable. This is especially so when a matter is still in its early stages, the damages sought are indeterminate or unsupported, significant facts are unclear or disputed, novel questions of law or other meaningful legal uncertainties exist, a request to certify a proceeding as a class action is outstanding or granted, multiple parties are named, or regulatory or other governmental entities are involved. As a result, we often are unable to determine how or when actual or threatened legal proceedings and other matters will be resolved and what losses may consist of a variety of claims, including common law tortbe incrementally and contract claims, as well as statutory antitrust, securities, and consumer protection claims. The ultimate resolution of any proceeding and the timing of such resolution is uncertain and inherently difficult to predict.ultimately incurred. It is possible that the ultimate resolution of these matters, including those described below, if unfavorable, may be material to the consolidated financial position, consolidated results of operations, or consolidated cash flows of Truist, or cause significant reputational consequences.
Truist establishes accruals for legal proceedings and other matters when potential losses associated with the actions become probable and the amount of loss can be reasonably estimated. There is no assurance that the ultimate resolution of these matters will not significantly exceed the amounts that Truist has accrued. Accruals for legal matters are evaluated each quarter and may be adjusted, upward or downward, based on management’sour best judgment after consultation with counsel and others. No assurance exists that our accruals will not need to be adjusted in the future. Actual losses may be higher or lower than any amounts accrued, possibly to a significant degree.
28 Truist Financial Corporation
The Company estimates reasonably possible losses, in excess of amounts accrued, of up to approximately $200$375 million as of March 31, 2023.2024. This estimate does not represent Truist’s maximum loss exposure, and actual losses may vary significantly. Also, the outcome of a particular matter may be one that the Company did not take into account in its estimate because the Company judged the likelihood of that outcome to be remote. In addition, the matters underlying this estimate willmay change from time to time. Estimated losses, like accruals, are based upon currently available information and involve considerable judgment, given that claims often include significant legal uncertainties damages alleged by plaintiffs are often unspecified or overstated, discovery may not have started or may not be complete, and material facts may be disputed or unsubstantiated, among other factors.judgment.
For certain matters, Truist may be unable to estimate the loss or range of loss, even if it believes that a loss is probable or reasonably possible, until developments in the casematter provide additional information sufficient to support such an estimate. SuchThese matters are not accrued for and are not reflected in the estimate of reasonably possible losses.
Truist Financial Corporation 31
The following is a description of certain legal proceedings and other matters in which Truist is involved:
Bickerstaff v. SunTrust Bank
This class action case was filed in the Fulton County State Court on July 12, 2010, and an amended complaint was filed on August 9, 2010. Plaintiff assertsalleges that all overdraft fees charged to his account which related to debit card and ATM transactions are actually interest charges and therefore subject to the usury laws of Georgia. Plaintiff has broughtThe amended complaint asserts claims for violations of civil and criminal usury laws, conversion, and money had and received, and seeks damages on a class-wide basis, including refunds of challenged overdraft fees and pre-judgment interest. On October 6, 2017, the trial court granted plaintiff’s motion for class certification and defined the class as “Every Georgia citizen who had or has one or more accounts with SunTrust Bank and who, from July 12, 2006, to October 6, 2017 (i) had at least one overdraft of $500.00 or less resulting from an ATM or debit card transaction (the “Transaction”); (ii) paid any Overdraft Fees as a result of the Transaction; and (iii) did not receive a refund of those Fees,” and the granting of a certified class was affirmed on appeal. The Company previously filedclass seeks a motionreturn of up to $452 million in paid overdraft fees from the 2006 to 2017 period above, plus prejudgment interest which, based on the amount of claimed fees, was estimated to be approximately $407 million as of March 31, 2024. A court-ordered mediation was held on February 28, 2024, but no resolution was reached. On March 4, 2024, the trial court issued an order granting in part and denying in part Truist’s motions to amend the class definition in which it sought to narrow the scope of the class, and renewed motions to compel arbitration against certain class members, whichand for summary judgment. Truist and the court found were premature. On September 22, 2022,class filed separate notices of appeal from the trial court’s order, and Truist has filed a notice of cross-appeal. The trial court entered a scheduling order holding thatsuspended the court will consider such motions after discovery, which is ongoing, is completed. Trial is presently set to commence onpreviously scheduled trial date of April 29, 2024. The Company continues to believe that the underlying claims are without merit.2024, related pre-trial deadlines pending appeal.
United Services Automobile Association v. Truist BankRecordkeeping Matters
USAA filed a lawsuit on July 29, 2022 againstThe SEC and CFTC have requested information from various subsidiaries of the Company in the United States District Courtthat conduct broker-dealer, investment adviser, and swap dealer activities regarding compliance with applicable recordkeeping requirements for the Eastern District of Texas alleging that the Company’s mobile remote deposit capture systems infringe certain patents held by USAA. The complaint seeks damages, including for alleged willful infringement and a corresponding request that the amount of actual damages be trebled, as well as injunctive and other equitable relief.business-related electronic communications. The Company filed its answerhas cooperated with these requests and affirmative defenses on October 11, 2022, denying that it infringes anyis in advanced discussions regarding resolutions of these matters with the patents at issue inagencies though there can be no assurance as to the lawsuit and asserting that USAA’s patents are invalid or unenforceable. On December 30, 2022, the Company filed a motion for leave to amend its answer to assert counterclaims seeking damages as well as injunctive relief against USAA for infringing certain patents owned by the Company and practiced by USAA’s mobile remote deposit capture systems, which motion was granted on April 8, 2023. On March 20, 2023, USAA filed a motion for leave to file an amended complaint which would add a claim that the Company’s mobile remote deposit capture systems infringe an additional USAA patent. On April 14, 2023, USAA filed a motion seeking to sever Truist’s counterclaims from the case. USAA’s motions above are both pending. Discovery in the district court proceedings is ongoing, and trial is presently set to commence on March 18, 2024.outcome of these discussions.
At the Patent Trial and Appeal Board, the Company filed separate petitions for inter partes review on October 11, November 7, and November 15, 2022 challenging the validity of each of the three patents asserted by USAA in the lawsuit. In addition, on April 13, 2023, the Company filed a petition for inter partes review challenging the validity of the fourth patent USAA is seeking to add to the lawsuit. If institution of any of the petitions for inter partes review is granted, the Patent Trial and Appeal Board will review the validity of the claims in the applicable patent(s).Investigation Regarding Trusts
In 2016 and 2018, the Civil Division of the U.S. DOJ issued subpoenas to a corporate predecessor of Truist Bank under the Financial Institutions Reform, Recovery, and Enforcement Act. These subpoenas requested documents and other information related to specified trusts for which Truist Bank serves as trustee. Truist Bank is continuing to cooperate in the investigation.
FDIC Special Assessment
In November 2023, the FDIC issued a final rule to implement a special assessment to recoup losses to the DIF associated with bank failures in the first half of 2023. The assessment is based on an insured depository institution’s estimated uninsured deposits reported as of December 31, 2022. The special assessment for Truist is $582 million, with $507 million recognized in the fourth quarter of 2023 and an additional $75 million recognized in the first quarter of 2024 due to an increase in the estimated relevant losses to the DIF reported by the FDIC in February 2024. The special assessment will be paid in eight quarterly installments beginning in the second quarter of 2024. The ultimate amount of expenses associated with the special assessment will also be impacted by the finalization of the losses incurred by the FDIC in the resolutions of Silicon Valley Bank and Signature Bank, which could result in additional expense.
32 Truist Financial Corporation 29
NOTE 15. Fair Value Disclosures
Recurring Fair Value Measurements
Accounting standards define fair value as the price that would be received on the measurement date to sell an asset or the price paid to transfer a liability in the principal or most advantageous market available to the entity in an orderly transaction between market participants, with a three-level measurement hierarchy:
•Level 1: Quoted prices for identical instruments in active markets
•Level 2: Quoted prices for similar instruments in active markets; quoted prices for identical or similar instruments in markets that are not active; and model-derived valuations in which all significant inputs are observable in active markets
•Level 3: Valuations derived from valuation techniques in which one or more significant inputs are unobservable
The following tables present fair value information for assets and liabilities measured at fair value on a recurring basis: | March 31, 2023
(Dollars in millions) | | Total | | Level 1 | | Level 2 | | Level 3 | | Netting Adjustments(1) | |
March 31, 2024
(Dollars in millions) | |
March 31, 2024
(Dollars in millions) | |
March 31, 2024
(Dollars in millions) | |
| Assets: | |
| Assets: | |
| Assets: | Assets: | | | | | | | | | | |
| Trading assets: | Trading assets: | | |
| Trading assets: | |
| Trading assets: | |
| U.S. Treasury | |
| U.S. Treasury | |
| U.S. Treasury | U.S. Treasury | | $ | 120 | | | $ | — | | | $ | 120 | | | $ | — | | | $ | — | | |
| GSE | GSE | | 112 | | | — | | | 112 | | | — | | | — | | |
| Agency MBS - residential | | 797 | | | — | | | 797 | | | — | | | — | | |
| GSE | |
| GSE | |
| | States and political subdivisions | |
| | States and political subdivisions | |
| | | States and political subdivisions | States and political subdivisions | | 293 | | | — | | | 293 | | | — | | | — | | |
| | Corporate and other debt securities | Corporate and other debt securities | | 1,118 | | | — | | | 1,118 | | | — | | | — | | |
| | Corporate and other debt securities | |
| | Corporate and other debt securities | |
| Loans | |
| Loans | |
| Loans | Loans | | 1,869 | | | — | | | 1,869 | | | — | | | — | | |
| Other | Other | | 292 | | | 260 | | | 32 | | | — | | | — | | |
| Other | |
| Other | |
| Total trading assets | |
| Total trading assets | |
| Total trading assets | Total trading assets | | 4,601 | | | 260 | | | 4,341 | | | — | | | — | | |
| AFS securities: | AFS securities: | | | | |
| AFS securities: | |
| AFS securities: | |
| U.S. Treasury | |
| U.S. Treasury | |
| U.S. Treasury | U.S. Treasury | | 10,441 | | | — | | | 10,441 | | | — | | | — | | |
| GSE | GSE | | 301 | | | — | | | 301 | | | — | | | — | | |
| Agency MBS - residential | | 55,175 | | | — | | | 55,175 | | | — | | | — | | |
| Agency MBS - commercial | | 2,398 | | | — | | | 2,398 | | | — | | | — | | |
| GSE | |
| GSE | |
| Agency MBS – residential | |
| Agency MBS – residential | |
| Agency MBS – residential | |
| Agency MBS – commercial | |
| Agency MBS – commercial | |
| Agency MBS – commercial | |
| States and political subdivisions | |
| States and political subdivisions | |
| States and political subdivisions | States and political subdivisions | | 425 | | | — | | | 425 | | | — | | | — | | |
| Non-agency MBS | Non-agency MBS | | 3,098 | | | — | | | 3,098 | | | — | | | — | | |
| Non-agency MBS | |
| Non-agency MBS | |
| Other | |
| Other | |
| Other | Other | | 20 | | | — | | | 20 | | | — | | | — | | |
| Total AFS securities | Total AFS securities | | 71,858 | | | — | | | 71,858 | | | — | | | — | | |
| Total AFS securities | |
| Total AFS securities | |
| LHFS at fair value | |
| LHFS at fair value | |
| LHFS at fair value | LHFS at fair value | | 1,911 | | | — | | | 1,911 | | | — | | | — | | |
| Loans and leases | Loans and leases | | 17 | | | — | | | — | | | 17 | | | — | | |
| Loans and leases | |
| Loans and leases | |
| Loan servicing rights at fair value | |
| Loan servicing rights at fair value | |
| Loan servicing rights at fair value | Loan servicing rights at fair value | | 3,303 | | | — | | | — | | | 3,303 | | | — | | |
| Other assets: | Other assets: | | |
| Other assets: | |
| Other assets: | |
| Derivative assets | Derivative assets | | 692 | | | 625 | | | 1,816 | | | 13 | | | (1,762) | | |
| Derivative assets | |
| Derivative assets | |
| Equity securities | |
| Equity securities | |
| Equity securities | Equity securities | | 857 | | | 757 | | | 100 | | | — | | | — | | |
| | Total assets | Total assets | | $ | 83,239 | | | $ | 1,642 | | | $ | 80,026 | | | $ | 3,333 | | | $ | (1,762) | | |
| | Total assets | |
| | Total assets | |
| Liabilities: | Liabilities: | | | | | | | | | | |
| Liabilities: | |
| Liabilities: | |
| Interest-bearing deposits: | |
| Interest-bearing deposits: | |
| Interest-bearing deposits: | |
| Brokered time deposits | |
| Brokered time deposits | |
| Brokered time deposits | |
| Short-term borrowings: | |
| Short-term borrowings: | |
| Short-term borrowings: | |
| Securities sold short | |
| Securities sold short | |
| Securities sold short | |
| Other liabilities: | |
| Other liabilities: | |
| Other liabilities: | |
| Derivative liabilities | Derivative liabilities | | $ | 2,589 | | | $ | 394 | | | $ | 3,971 | | | $ | 31 | | | $ | (1,807) | | |
| Securities sold short | | 1,789 | | | 113 | | | 1,676 | | | — | | | — | | |
| Derivative liabilities | |
| Derivative liabilities | |
| Total liabilities | |
| Total liabilities | |
| Total liabilities | Total liabilities | | $ | 4,378 | | | $ | 507 | | | $ | 5,647 | | | $ | 31 | | | $ | (1,807) | | |
| |
30 Truist Financial Corporation 33
| December 31, 2022
(Dollars in millions) | | Total | | Level 1 | | Level 2 | | Level 3 | | Netting Adjustments(1) | |
December 31, 2023
(Dollars in millions) | |
December 31, 2023
(Dollars in millions) | |
December 31, 2023
(Dollars in millions) | |
| Assets: | |
| Assets: | |
| Assets: | Assets: | | | | | | | | | | |
| Trading assets: | Trading assets: | | |
| Trading assets: | |
| Trading assets: | |
| U.S. Treasury | |
| U.S. Treasury | |
| U.S. Treasury | U.S. Treasury | | $ | 137 | | | $ | — | | | $ | 137 | | | $ | — | | | $ | — | | |
| GSE | GSE | | 457 | | | — | | | 457 | | | — | | | — | | |
| Agency MBS - residential | | 804 | | | — | | | 804 | | | — | | | — | | |
| Agency MBS - commercial | | 62 | | | — | | | 62 | | | — | | | — | | |
| GSE | |
| GSE | |
| | States and political subdivisions | |
| | States and political subdivisions | |
| | States and political subdivisions | States and political subdivisions | | 422 | | | — | | | 422 | | | — | | | — | | |
| | Corporate and other debt securities | Corporate and other debt securities | | 761 | | | — | | | 761 | | | — | | | — | | |
| | Corporate and other debt securities | |
| | Corporate and other debt securities | |
| Loans | |
| Loans | |
| Loans | Loans | | 1,960 | | | — | | | 1,960 | | | — | | | — | | |
| Other | Other | | 302 | | | 261 | | | 41 | | | — | | | — | | |
| Other | |
| Other | |
| Total trading assets | |
| Total trading assets | |
| Total trading assets | Total trading assets | | 4,905 | | | 261 | | | 4,644 | | | — | | | — | | |
| AFS securities: | AFS securities: | | | | | | | | | | |
| AFS securities: | |
| AFS securities: | |
| U.S. Treasury | |
| U.S. Treasury | |
| U.S. Treasury | U.S. Treasury | | 10,295 | | | — | | | 10,295 | | | — | | | — | | |
| GSE | GSE | | 303 | | | — | | | 303 | | | — | | | — | | |
| Agency MBS - residential | | 55,225 | | | — | | | 55,225 | | | — | | | — | | |
| Agency MBS - commercial | | 2,424 | | | — | | | 2,424 | | | — | | | — | | |
| GSE | |
| GSE | |
| Agency MBS – residential | |
| Agency MBS – residential | |
| Agency MBS – residential | |
| Agency MBS – commercial | |
| Agency MBS – commercial | |
| Agency MBS – commercial | |
| States and political subdivisions | |
| States and political subdivisions | |
| States and political subdivisions | States and political subdivisions | | 416 | | | — | | | 416 | | | — | | | — | | |
| Non-agency MBS | Non-agency MBS | | 3,117 | | | — | | | 3,117 | | | — | | | — | | |
| Non-agency MBS | |
| Non-agency MBS | |
| Other | |
| Other | |
| Other | Other | | 21 | | | — | | | 21 | | | — | | | — | | |
| Total AFS securities | Total AFS securities | | 71,801 | | | — | | | 71,801 | | | — | | | — | | |
| Total AFS securities | |
| Total AFS securities | |
| LHFS at fair value | |
| LHFS at fair value | |
| LHFS at fair value | LHFS at fair value | | 1,065 | | | — | | | 1,065 | | | — | | | — | | |
| Loans and leases | Loans and leases | | 18 | | | — | | | — | | | 18 | | | — | | |
| Loans and leases | |
| Loans and leases | |
| Loan servicing rights at fair value | |
| Loan servicing rights at fair value | |
| Loan servicing rights at fair value | Loan servicing rights at fair value | | 3,758 | | | — | | | — | | | 3,758 | | | — | | |
| Other assets: | Other assets: | | | | | | | | | | |
| Other assets: | |
| Other assets: | |
| Derivative assets | Derivative assets | | 684 | | | 472 | | | 1,980 | | | 1 | | | (1,769) | | |
| Derivative assets | |
| Derivative assets | |
| Equity securities | |
| Equity securities | |
| Equity securities | Equity securities | | 898 | | | 796 | | | 102 | | | — | | | — | | |
| | Total assets | Total assets | | $ | 83,129 | | | $ | 1,529 | | | $ | 79,592 | | | $ | 3,777 | | | $ | (1,769) | | |
| | Total assets | |
| | Total assets | |
| Liabilities: | Liabilities: | | | | | | | | | | |
| Liabilities: | |
| Liabilities: | |
| | Short-term borrowings: | |
| | Short-term borrowings: | |
| | Short-term borrowings: | |
| Securities sold short | |
| Securities sold short | |
| Securities sold short | |
| Other liabilities: | |
| Other liabilities: | |
| Other liabilities: | |
| Derivative liabilities | Derivative liabilities | | $ | 2,971 | | | $ | 364 | | | $ | 4,348 | | | $ | 37 | | | $ | (1,778) | | |
| Securities sold short | | 1,551 | | | 114 | | | 1,437 | | | — | | | — | | |
| Derivative liabilities | |
| Derivative liabilities | |
| Total liabilities | |
| Total liabilities | |
| Total liabilities | Total liabilities | | $ | 4,522 | | | $ | 478 | | | $ | 5,785 | | | $ | 37 | | | $ | (1,778) | | |
|
(1)Refer to “Note 16. Derivative Financial Instruments” for additional discussion on netting adjustments.
At March 31, 20232024 and December 31, 2022,2023, investments totaling $367$464 million and $385$459 million, respectively, have been excluded from the table above as they are valued based on net asset value as a practical expedient. These investments primarily consist of certain SBIC funds.
The following discussion focuses on the valuation techniques and significant inputs for brokered time deposit liabilities that are measured at fair value on a recurring basis. For additional information on the valuation techniques and significant inputs for Level 2 and Level 3 assets and liabilities that are measured at fair value on a recurring basis, see “Note 18. Fair Value Disclosures” of the Annual Report on Form 10-K for the year ended December 31, 2022.2023.
Brokered time deposits: The Company has elected to measure certain CDs that contain embedded derivatives at fair value. This fair value election better aligns the economics of the CDs with the Company’s risk management strategies. The Company elects, on an instrument by instrument basis, whether a new issuance will be measured at fair value. The Company has classified CDs measured at fair value as level 2 instruments due to the Company’s ability to observe all significant inputs to model-derived valuations in active markets. The Company employs a discounted cash flow approach based on observable market interest rates for the term of the CD and an estimate of the Bank’s credit risk. For any embedded derivative features, the Company uses the same valuation methodologies as if the derivative were a standalone derivative, as discussed in the “Derivative assets and liabilities” section in “Note 18. Fair Value Disclosures” of the Annual Report on Form 10-K for the year ended December 31, 2023.
34 Truist Financial Corporation
Activity for Level 3 assets and liabilities is summarized below: | | | | | | | | | | | | | | | | | | | | | | | | |
| | | | | | | | | | | | |
| | | | | | | | | | | | |
Three Months Ended March 31, 2023 and 2022
(Dollars in millions) | | | | | Loans and Leases | | Loan Servicing Rights | | Net Derivatives | | | |
| Balance at January 1, 2022 | | | | | $ | 23 | | | $ | 2,633 | | | $ | (12) | | | | |
| Total realized and unrealized gains (losses): | | | | | | | | | | | | |
| Included in earnings | | | | | — | | | 357 | | | (170) | | | | |
| | | | | | | | | | | | |
| | | | | | | | | | | | |
| Issuances | | | | | — | | | 158 | | | 17 | | | | |
| | | | | | | | | | | | |
| Settlements | | | | | — | | | (135) | | | 91 | | | | |
| | | | | | | | | | | | |
| Transfers out of level 3 and other | | | | | (2) | | | — | | | — | | | | |
| Balance at March 31, 2022 | | | | | $ | 21 | | | $ | 3,013 | | | $ | (74) | | | | |
| Balance at January 1, 2023 | | | | | $ | 18 | | | $ | 3,758 | | | $ | (36) | | | | |
| Total realized and unrealized gains (losses): | | | | | | | | | | | | |
| Included in earnings | | | | | — | | | (5) | | | (2) | | | | |
| | | | | | | | | | | | |
| | | | | | | | | | | | |
| Issuances | | | | | — | | | 48 | | | (2) | | | | |
| Sales | | | | | — | | | (428) | | | — | | | | |
| Settlements | | | | | (1) | | | (70) | | | 22 | | | | |
| | | | | | | | | | | | |
| | | | | | | | | | | | |
| Balance at March 31, 2023 | | | | | $ | 17 | | | $ | 3,303 | | | $ | (18) | | | | |
| Change in unrealized gains (losses) included in earnings for the period, attributable to assets and liabilities still held at March 31, 2023 | | | | | $ | — | | | $ | (54) | | | $ | (5) | | | | |
| | | | | | | | | | | | |
| | | | | | | | | | | | |
| | | | | | | | | | | | |
| | | | | | | | | | | | |
| | | | | | | | | | | | |
| | | | | | | | | | | | |
| | | | | | | | | | | | |
| | | | | | | | | | | | |
| | | | | | | | | | | | |
| | | | | | | | | | | | |
| | | | | | | | | | | | |
| | | | | | | | | | | | |
| | | | | | | | | | | | |
| | | | | | | | | | | | |
| | | | | | | | | | | | |
| | | | | | | | | | | | |
| | | | | | | | | | | | |
| | | | | | | | | | | | |
| | | | | | | | | | | | |
| | | | | | | | | | | | |
| | | | | | | | | | | | |
| | | | | | | | | | | | |
| | | | | | | | | | | | |
| | | | | | | | | | | | |
| | | | | | | | | | | | |
| | | | | | | | | | | | |
| | | | | | | | | | | | |
| | | | | | | | | | | | |
| | | | | | | | | | | | |
| | | | | | | | | | | | |
| | | | | | | | | | | | |
| | | | | | | | | | | | |
| | | | | | | | | | | | |
| | | | | | | | | | | | |
| | | | | | | | | | | | |
| | | | | | | | | | | | |
| | | | | | | | | | | | |
| | | | | | | | | | | | |
| | | | | | | | | | | | |
| | | | | | | | | | | | |
| | | | | | | | | | | | |
| | | | | | | | | | | | |
| | | | | | | | | | | | |
| | | | | | | | | | | | |
Truist Financial Corporation 31
| | | | | | | | | | | | | | | | | | | | | | | | |
| | | | | | | | | | | | |
| | | | | | | | | | | | |
Three Months Ended March 31, 2024 and 2023
(Dollars in millions) | | | | | Loans and Leases | | Loan Servicing Rights | | Net Derivatives | | | |
| Balance at January 1, 2023 | | | | | $ | 18 | | | $ | 3,758 | | | $ | (36) | | | | |
| Total realized and unrealized gains (losses): | | | | | | | | | | | | |
| Included in earnings | | | | | — | | | (5) | | | (2) | | | | |
| | | | | | | | | | | | |
| | | | | | | | | | | | |
| Issuances | | | | | — | | | 48 | | | (2) | | | | |
| Sales | | | | | — | | | (428) | | | — | | | | |
| Settlements | | | | | (1) | | | (70) | | | 22 | | | | |
| | | | | | | | | | | | |
| | | | | | | | | | | | |
| Balance at March 31, 2023 | | | | | $ | 17 | | | $ | 3,303 | | | $ | (18) | | | | |
| Balance at January 1, 2024 | | | | | $ | 15 | | | $ | 3,378 | | | $ | (19) | | | | |
| Total realized and unrealized gains (losses): | | | | | | | | | | | | |
| Included in earnings | | | | | — | | | 82 | | | (3) | | | | |
| | | | | | | | | | | | |
| | | | | | | | | | | | |
| Issuances | | | | | — | | | 32 | | | (1) | | | | |
| Sales | | | | | — | | | (1) | | | — | | | | |
| Settlements | | | | | (1) | | | (74) | | | 2 | | | | |
| | | | | | | | | | | | |
| | | | | | | | | | | | |
| Balance at March 31, 2024 | | | | | $ | 14 | | | $ | 3,417 | | | $ | (21) | | | | |
| Change in unrealized gains (losses) included in earnings for the period, attributable to assets and liabilities still held at March 31, 2024 | | | | | $ | — | | | $ | 82 | | | $ | (9) | | | | |
| | | | | | | | | | | | |
| | | | | | | | | | | | |
| | | | | | | | | | | | |
| | | | | | | | | | | | |
| | | | | | | | | | | | |
| | | | | | | | | | | | |
| | | | | | | | | | | | |
| | | | | | | | | | | | |
| | | | | | | | | | | | |
| | | | | | | | | | | | |
| | | | | | | | | | | | |
| | | | | | | | | | | | |
| | | | | | | | | | | | |
| | | | | | | | | | | | |
| | | | | | | | | | | | |
| | | | | | | | | | | | |
| | | | | | | | | | | | |
| | | | | | | | | | | | |
| | | | | | | | | | | | |
| | | | | | | | | | | | |
| | | | | | | | | | | | |
| | | | | | | | | | | | |
| | | | | | | | | | | | |
| | | | | | | | | | | | |
| | | | | | | | | | | | |
| | | | | | | | | | | | |
| | | | | | | | | | | | |
| | | | | | | | | | | | |
| | | | | | | | | | | | |
| | | | | | | | | | | | |
| | | | | | | | | | | | |
| | | | | | | | | | | | |
| | | | | | | | | | | | |
| | | | | | | | | | | | |
| | | | | | | | | | | | |
| | | | | | | | | | | | |
| | | | | | | | | | | | |
| | | | | | | | | | | | |
| | | | | | | | | | | | |
| | | | | | | | | | | | |
| | | | | | | | | | | | |
| Primary income statement location of realized gains (losses) included in earnings | | | | | Other income | | Mortgage banking income | | Mortgage banking income | | | |
| | | | | | | | | | | | |
| | | | | | | | | | | | |
| | | | | | | | | | | | |
Fair Value Option
The following table details the fair value and UPB of certain loans and time deposits that were elected to be measured at fair value: | | | | | March 31, 2023 | | December 31, 2022 | | | March 31, 2024 | | December 31, 2023 |
| (Dollars in millions) | (Dollars in millions) | | Fair Value | | UPB | | Difference | | Fair Value | | UPB | | Difference | (Dollars in millions) | | Fair Value | | UPB | | Difference | | Fair Value | | UPB | | Difference |
| Trading loans | Trading loans | | $ | 1,869 | | | $ | 1,989 | | | $ | (120) | | | $ | 1,960 | | | $ | 2,101 | | | $ | (141) | |
| Loans and leases | Loans and leases | | 17 | | | 19 | | | (2) | | | 18 | | | 20 | | | (2) | |
| LHFS at fair value | LHFS at fair value | | 1,911 | | | 1,883 | | | 28 | | | 1,065 | | | 1,056 | | | 9 | |
| Brokered time deposits | |
|
Nonrecurring Fair Value Measurements
The following table provides information about certain assets measured at fair value on a nonrecurring basis still held as of period end. The carrying values represent end of period values, which approximate the fair value measurements that occurred on the various measurement dates throughout the period. These assets are considered to be Level 3 assets. | | (Dollars in millions) | (Dollars in millions) | | Mar 31, 2023 | | | Dec 31, 2022 | |
| (Dollars in millions) | |
| (Dollars in millions) | |
| Carrying value: | |
| Carrying value: | |
| Carrying value: | Carrying value: | | | | |
| LHFS | LHFS | | $ | 127 | | | | $ | 271 | | |
| LHFS | |
| LHFS | |
| Loans and leases | Loans and leases | | 434 | | | | 500 | | |
| Loans and leases | |
| Loans and leases | |
| Other | |
| Other | |
| Other | Other | | 98 | | | | 120 | | |
|
The following table provides information about valuation adjustments for certain assets measured at fair value on a nonrecurring basis. The valuation adjustments represent the amounts recorded during the period regardless of whether the asset is still held at period end. | | | | | | | | | | | | | | | | |
| | Three Months Ended March 31, |
| (Dollars in millions) | | 2023 | | 2022 | | |
| Valuation adjustments: | | | | | | |
| LHFS | | $ | — | | | $ | (3) | | | |
| Loans and leases | | (166) | | | (97) | | | |
Other(1) | | (44) | | | (29) | | | |
(1)Prior period amounts were revised. | | | | | | | | | | | | | | | | |
| | Three Months Ended March 31, |
| (Dollars in millions) | | 2024 | | 2023 | | |
| Valuation adjustments: | | | | | | |
| LHFS | | $ | (9) | | | $ | — | | | |
| Loans and leases | | (272) | | | (166) | | | |
| Other | | (83) | | | (44) | | | |
LHFS with valuation adjustments in the table above consisted primarily of residential mortgages and commercial loans that were valued using market prices and measured at LOCOM. The table above excludes $122$44 million and $108$409 million of LHFS carried at cost at March 31, 20232024 and December 31, 2022,2023, respectively, that did not require a valuation adjustment during the period. The remainder of LHFS is carried at fair value.
Truist Financial Corporation 35
Loans and leases consist of larger commercial loans and leases that are collateral-dependent and other secured loans and leases that have been charged-off to the fair value of the collateral. Valuation adjustments for loans and leases are primarily recorded in the Provision for credit losses in the Consolidated Statement of Income. Refer to “Note 1. Basis of Presentation” in Truist’s Annual Report on Form 10-K for the year ended December 31, 20222023 for additional discussion of individually evaluated loans and leases.
Other includes foreclosed real estate, other foreclosed property, ROU assets,partnership investments, premises and equipment, OREO, and OREO,held for sale operating leases, and consists primarily of residential homes, commercial properties, vacant lots, and automobiles. ROU assetsPartnership investments are measured based on the fair value of the assets, which considers the potential for sublease income.discounted expected future cash flows. The remaining assets are measured at LOCOM, less costs to sell.
32 Truist Financial Corporation
Financial Instruments Not Recorded at Fair Value
For financial instruments not recorded at fair value, estimates of fair value are based on relevant market data and information about the instruments. Values obtained relate to trading without regard to any premium or discount that may result from concentrations of ownership, possible tax ramifications, estimated transaction costs that may result from bulk sales, or the relationship between various instruments.
An active market does not exist for certain financial instruments. Fair value estimates for these instruments are based on current economic conditions and interest rate risk characteristics, loss experience, and other factors. Many of these estimates involve uncertainties and matters of significant judgment and cannot be determined with precision. Therefore, the fair value estimates in many instances cannot be substantiated by comparison to independent markets. In addition, changes in assumptions could significantly affect these fair value estimates. Financial assets and liabilities not recorded at fair value are summarized below: | | March 31, 2023 | | December 31, 2022 |
| | | March 31, 2024 | | | | | March 31, 2024 | | December 31, 2023 |
| (Dollars in millions) | (Dollars in millions) | Fair Value Hierarchy | | Carrying Amount | | Fair Value | | Carrying Amount | | Fair Value | (Dollars in millions) | Fair Value Hierarchy | | Carrying Amount | | Fair Value | | Carrying Amount | | Fair Value |
| Financial assets: | Financial assets: | |
| HTM securities | HTM securities | Level 2 | | $ | 56,932 | | | $ | 48,097 | | | $ | 57,713 | | | $ | 47,791 | |
| HTM securities | |
| HTM securities | |
| Loans and leases HFI, net of ALLL | Loans and leases HFI, net of ALLL | Level 3 | | 323,177 | | | 312,107 | | | 321,596 | | | 308,738 | |
| Financial liabilities: | Financial liabilities: | | | | | |
| Time deposits | |
| Time deposits | |
| Time deposits | Time deposits | Level 2 | | 32,326 | | | 32,140 | | | 23,474 | | | 23,383 | |
| Long-term debt | Long-term debt | Level 2 | | 69,895 | | | 65,114 | | | 43,203 | | | 40,951 | |
|
The carrying value of the RUFC, which approximates the fair value of unfunded commitments, was $282$297 million and $272$295 million at March 31, 20232024 and December 31, 2022,2023, respectively.
36 Truist Financial Corporation 33
NOTE 16. Derivative Financial Instruments
Impact of Derivatives on the Consolidated Balance Sheets
The following table presents the gross notional amounts and estimated fair value of derivative instruments employed by the Company: | | March 31, 2024 | |
| March 31, 2024 | |
| March 31, 2024 | |
| | | March 31, 2023 | | December 31, 2022 | |
| | | Notional Amount | | Fair Value | | Notional Amount | | Fair Value | |
| (Dollars in millions) | (Dollars in millions) | | Assets | | Liabilities | | Assets | | Liabilities | |
| (Dollars in millions) | |
| (Dollars in millions) | |
| Cash flow hedges: | Cash flow hedges: | | | | | | | | | | | | |
| Cash flow hedges: | |
| Cash flow hedges: | |
| Interest rate contracts: | |
| Interest rate contracts: | |
| Interest rate contracts: | Interest rate contracts: | | | | | | | | | | | | |
| | Swaps hedging commercial loans | Swaps hedging commercial loans | $ | 19,400 | | | $ | — | | | $ | — | | | $ | 16,650 | | | $ | — | | | $ | — | | |
| | Swaps hedging commercial loans | |
| | Swaps hedging commercial loans | |
| Fair value hedges: | |
| Fair value hedges: | |
| Fair value hedges: | Fair value hedges: | | | | | | | |
| Interest rate contracts: | Interest rate contracts: | | | | | | | |
| Interest rate contracts: | |
| Interest rate contracts: | |
| Swaps hedging long-term debt | |
| Swaps hedging long-term debt | |
| Swaps hedging long-term debt | Swaps hedging long-term debt | 16,018 | | | — | | | (53) | | | 16,393 | | | — | | | (68) | | |
| | Swaps hedging AFS securities | Swaps hedging AFS securities | 7,097 | | | — | | | — | | | 7,097 | | | — | | | — | | |
| | Swaps hedging AFS securities | |
| | Swaps hedging AFS securities | |
| | Total | |
| | Total | |
| | Total | Total | 23,115 | | | — | | | (53) | | | 23,490 | | | — | | | (68) | | |
| Not designated as hedges: | Not designated as hedges: | | | | | | | | | | | | |
| Not designated as hedges: | |
| Not designated as hedges: | |
| Client-related and other risk management: | |
| Client-related and other risk management: | |
| Client-related and other risk management: | Client-related and other risk management: | | | | | | | | | | | | |
| Interest rate contracts: | Interest rate contracts: | | | | | | | | | | | | |
| Interest rate contracts: | |
| Interest rate contracts: | |
| Swaps | Swaps | 160,381 | | | 625 | | | (2,169) | | | 155,670 | | | 579 | | | (2,665) | | |
| | Swaps | |
| Swaps | |
| Options | |
| Options | |
| Options | Options | 42,648 | | | 171 | | | (166) | | | 29,840 | | | 172 | | | (192) | | |
| Forward commitments | Forward commitments | 791 | | | 2 | | | (10) | | | 1,495 | | | 8 | | | (2) | | |
| Forward commitments | |
| Forward commitments | |
| Other | |
| Other | |
| Other | Other | 3,092 | | | 8 | | | (7) | | | 3,823 | | | 1 | | | — | | |
| Equity contracts | Equity contracts | 34,979 | | | 727 | | | (1,109) | | | 33,185 | | | 644 | | | (901) | | |
| Equity contracts | |
| Equity contracts | |
| Credit contracts: | |
| Credit contracts: | |
| Credit contracts: | Credit contracts: | | |
| Trading assets | Trading assets | 160 | | | — | | | — | | | 140 | | | — | | | — | | |
| Trading assets | |
| Trading assets | |
| Loans and leases | |
| Loans and leases | |
| Loans and leases | Loans and leases | 780 | | | — | | | (1) | | | 394 | | | — | | | — | | |
| Risk participation agreements | Risk participation agreements | 7,156 | | | — | | | (3) | | | 6,824 | | | — | | | (3) | | |
| Risk participation agreements | |
| Risk participation agreements | |
| Total return swaps | Total return swaps | 1,793 | | | 71 | | | (6) | | | 1,729 | | | 81 | | | (2) | | |
| | Total return swaps | |
| Total return swaps | |
| Foreign exchange contracts | |
| Foreign exchange contracts | |
| Foreign exchange contracts | Foreign exchange contracts | 21,527 | | | 300 | | | (304) | | | 19,022 | | | 364 | | | (380) | | |
| Commodity | Commodity | 7,534 | | | 454 | | | (450) | | | 4,881 | | | 444 | | | (447) | | |
| | Commodity | |
| Commodity | |
| Total | |
| Total | |
| Total | Total | 280,841 | | | 2,358 | | | (4,225) | | | 257,003 | | | 2,293 | | | (4,592) | | |
| Mortgage banking: | Mortgage banking: | | | | | | | | | | | | |
| Mortgage banking: | |
| Mortgage banking: | |
| Interest rate contracts: | |
| Interest rate contracts: | |
| Interest rate contracts: | Interest rate contracts: | | | | | | | | | | | | |
| Swaps | Swaps | 227 | | | — | | | — | | | 115 | | | — | | | — | | |
| | Swaps | |
| Swaps | |
| Options | |
| Options | |
| Options | |
| Interest rate lock commitments | |
| Interest rate lock commitments | |
| Interest rate lock commitments | Interest rate lock commitments | 1,837 | | | 12 | | | (12) | | | 999 | | | 1 | | | (17) | | |
| When issued securities, forward rate agreements and forward commitments | When issued securities, forward rate agreements and forward commitments | 3,470 | | | 15 | | | (17) | | | 2,128 | | | 25 | | | (6) | | |
| When issued securities, forward rate agreements and forward commitments | |
| When issued securities, forward rate agreements and forward commitments | |
| Other | |
| Other | |
| Other | Other | 243 | | | 1 | | | — | | | 140 | | | 1 | | | — | | |
| | Total | Total | 5,777 | | | 28 | | | (29) | | | 3,382 | | | 27 | | | (23) | | |
| | Total | |
| | Total | |
| MSRs: | |
| MSRs: | |
| MSRs: | MSRs: | | | | | | | | | | | | |
| Interest rate contracts: | Interest rate contracts: | | | | | | | | | | | | |
| Interest rate contracts: | |
| Interest rate contracts: | |
| Swaps | Swaps | 14,329 | | | — | | | — | | | 14,566 | | | — | | | — | | |
| | Swaps | |
| Swaps | |
| Options | |
| Options | |
| Options | Options | 15,089 | | | 53 | | | (85) | | | 13,930 | | | 122 | | | (48) | | |
| When issued securities, forward rate agreements and forward commitments | When issued securities, forward rate agreements and forward commitments | 2,184 | | | 14 | | | (3) | | | 2,459 | | | 11 | | | (15) | | |
| When issued securities, forward rate agreements and forward commitments | |
| When issued securities, forward rate agreements and forward commitments | |
| Other | |
| Other | |
| Other | Other | 2,268 | | | 1 | | | (1) | | | 1,532 | | | — | | | (3) | | |
| Total | Total | 33,870 | | | 68 | | | (89) | | | 32,487 | | | 133 | | | (66) | | |
| Total | |
| Total | |
| Total derivatives not designated as hedges | |
| Total derivatives not designated as hedges | |
| Total derivatives not designated as hedges | Total derivatives not designated as hedges | 320,488 | | | 2,454 | | | (4,343) | | | 292,872 | | | 2,453 | | | (4,681) | | |
| Total derivatives | Total derivatives | $ | 363,003 | | | 2,454 | | | (4,396) | | | $ | 333,012 | | | 2,453 | | | (4,749) | | |
| Total derivatives | |
| Total derivatives | |
| Gross amounts in the Consolidated Balance Sheets: | Gross amounts in the Consolidated Balance Sheets: | | | | | | | | | | |
| Amounts subject to master netting arrangements | | (1,251) | | | 1,251 | | | | | (1,223) | | | 1,223 | | |
| Gross amounts in the Consolidated Balance Sheets: | |
| Gross amounts in the Consolidated Balance Sheets: | |
| Amounts subject to master netting arrangements and exchange traded derivatives | |
| Amounts subject to master netting arrangements and exchange traded derivatives | |
| Amounts subject to master netting arrangements and exchange traded derivatives | |
| Cash collateral (received) posted for amounts subject to master netting arrangements | Cash collateral (received) posted for amounts subject to master netting arrangements | | | (511) | | | 556 | | | | | (546) | | | 555 | | |
| Cash collateral (received) posted for amounts subject to master netting arrangements | |
| Cash collateral (received) posted for amounts subject to master netting arrangements | |
| | Net amount | |
| | Net amount | |
| | Net amount | Net amount | | | $ | 692 | | | $ | (2,589) | | | | | $ | 684 | | | $ | (2,971) | | |
|
34 Truist Financial Corporation 37
The following table presents the offsetting of derivative instruments including financial instrument collateral related to legally enforceable master netting agreements and amounts held or pledged as collateral. U.S. GAAP does not permit netting of non-cash collateral balances in the Consolidated Balance Sheets: | March 31, 2023
(Dollars in millions) | Gross Amount | | Amount Offset | | Net Amount in Consolidated Balance Sheets | | Held/Pledged Financial Instruments | | Net Amount |
March 31, 2024
(Dollars in millions) | | March 31, 2024
(Dollars in millions) | Gross Amount | | Amount Offset | | Net Amount in Consolidated Balance Sheets | | Held/Pledged Financial Instruments | | Net Amount |
| Derivative assets: | Derivative assets: | |
| Derivatives subject to master netting arrangement or similar arrangement | |
| Derivatives subject to master netting arrangement or similar arrangement | |
| Derivatives subject to master netting arrangement or similar arrangement | Derivatives subject to master netting arrangement or similar arrangement | $ | 1,722 | | | $ | (1,370) | | | $ | 352 | | | $ | — | | | $ | 352 | |
| Derivatives not subject to master netting arrangement or similar arrangement | Derivatives not subject to master netting arrangement or similar arrangement | 107 | | | — | | | 107 | | | — | | | 107 | |
| Exchange traded derivatives | Exchange traded derivatives | 625 | | | (392) | | | 233 | | | — | | | 233 | |
| Total derivative assets | Total derivative assets | $ | 2,454 | | | $ | (1,762) | | | $ | 692 | | | $ | — | | | $ | 692 | |
| Derivative liabilities: | Derivative liabilities: | |
| Derivatives subject to master netting arrangement or similar arrangement | Derivatives subject to master netting arrangement or similar arrangement | $ | (3,431) | | | $ | 1,415 | | | $ | (2,016) | | | $ | 95 | | | $ | (1,921) | |
| Derivatives subject to master netting arrangement or similar arrangement | |
| Derivatives subject to master netting arrangement or similar arrangement | |
| Derivatives not subject to master netting arrangement or similar arrangement | Derivatives not subject to master netting arrangement or similar arrangement | (572) | | | — | | | (572) | | | — | | | (572) | |
| Exchange traded derivatives | Exchange traded derivatives | (393) | | | 392 | | | (1) | | | — | | | (1) | |
| Total derivative liabilities | Total derivative liabilities | $ | (4,396) | | | $ | 1,807 | | | $ | (2,589) | | | $ | 95 | | | $ | (2,494) | |
| December 31, 2022
(Dollars in millions) | Gross Amount | | Amount Offset | | Net Amount in Consolidated Balance Sheets | | Held/Pledged Financial Instruments | | Net Amount |
December 31, 2023
(Dollars in millions) | |
December 31, 2023
(Dollars in millions) | |
December 31, 2023
(Dollars in millions) | | Gross Amount | | Amount Offset | | Net Amount in Consolidated Balance Sheets | | Held/Pledged Financial Instruments | | Net Amount |
| Derivative assets: | Derivative assets: | |
| Derivatives subject to master netting arrangement or similar arrangement | |
| Derivatives subject to master netting arrangement or similar arrangement | |
| Derivatives subject to master netting arrangement or similar arrangement | Derivatives subject to master netting arrangement or similar arrangement | $ | 1,895 | | | $ | (1,408) | | | $ | 487 | | | $ | — | | | $ | 487 | |
| Derivatives not subject to master netting arrangement or similar arrangement | Derivatives not subject to master netting arrangement or similar arrangement | 86 | | | — | | | 86 | | | — | | | 86 | |
| Exchange traded derivatives | Exchange traded derivatives | 472 | | | (361) | | | 111 | | | — | | | 111 | |
| Total derivative assets | Total derivative assets | $ | 2,453 | | | $ | (1,769) | | | $ | 684 | | | $ | — | | | $ | 684 | |
| Derivative liabilities: | Derivative liabilities: | |
| Derivatives subject to master netting arrangement or similar arrangement | |
| Derivatives subject to master netting arrangement or similar arrangement | |
| Derivatives subject to master netting arrangement or similar arrangement | Derivatives subject to master netting arrangement or similar arrangement | $ | (3,688) | | | $ | 1,417 | | | $ | (2,271) | | | $ | 43 | | | $ | (2,228) | |
| Derivatives not subject to master netting arrangement or similar arrangement | Derivatives not subject to master netting arrangement or similar arrangement | (697) | | | — | | | (697) | | | — | | | (697) | |
| Exchange traded derivatives | Exchange traded derivatives | (364) | | | 361 | | | (3) | | | — | | | (3) | |
| Total derivative liabilities | Total derivative liabilities | $ | (4,749) | | | $ | 1,778 | | | $ | (2,971) | | | $ | 43 | | | $ | (2,928) | |
|
The following table presents the carrying value of hedged items in fair value hedging relationships: | | March 31, 2023 | | December 31, 2022 |
| | Hedge Basis Adjustment | | | Hedge Basis Adjustment |
| | March 31, 2024 | | | | March 31, 2024 | | December 31, 2023 |
| | | | Hedge Basis Adjustment | | | | | | Hedge Basis Adjustment | | | | Hedge Basis Adjustment |
| (Dollars in millions) | (Dollars in millions) | | Hedged Asset / Liability Basis | | Items Currently Designated | | Discontinued Hedges | | Hedged Asset / Liability Basis | | Items Currently Designated | | Discontinued Hedges | (Dollars in millions) | | Hedged Asset / Liability Basis | | Items Currently Designated | | Discontinued Hedges | | Hedged Asset / Liability Basis | | Items Currently Designated | | Discontinued Hedges |
AFS securities(1) | AFS securities(1) | | $ | 38,761 | | | $ | (534) | | | $ | (4) | | | $ | 38,773 | | | $ | (630) | | | $ | (4) | |
| Loans and leases | Loans and leases | | 350 | | | — | | | 9 | | | 353 | | | — | | | 10 | |
| | Long-term debt | Long-term debt | | 27,385 | | | (303) | | | (134) | | | 25,378 | | | (780) | | | 218 | |
| Long-term debt | |
| Long-term debt | |
| |
(1)The amortized cost of AFS securities was $45.5$58.7 billion at March 31, 20232024 and $46.2$62.2 billion at December 31, 2022.2023. Further, as of March 31, 2024, closed portfolios of securities hedged under the portfolio layer method have an amortized cost of $57.6 billion, of which $25.0 billion was designated as hedged. The remaining amount of amortized cost is from securities with terminated hedges where the basis adjustment is being amortized into earnings using the effective interest method over the contractual life of the security.
38 Truist Financial Corporation 35
Impact of Derivatives on the Consolidated Statements of Income and Comprehensive Income
Derivatives Designated as Hedging Instruments under GAAP
No portion of the change in fair value of derivatives designated as hedges has been excluded from effectiveness testing.
The following table summarizes amounts related to cash flow hedges, which consist of interest rate contracts: | | | Three Months Ended March 31, |
| Three Months Ended March 31, | |
| Three Months Ended March 31, | |
| Three Months Ended March 31, | |
| (Dollars in millions) | |
| (Dollars in millions) | |
| (Dollars in millions) | (Dollars in millions) | | 2023 | | 2022 | |
| Pre-tax gain (loss) recognized in OCI: | Pre-tax gain (loss) recognized in OCI: | | | |
| Pre-tax gain (loss) recognized in OCI: | |
| Pre-tax gain (loss) recognized in OCI: | |
| Commercial loans | |
| Commercial loans | |
| Commercial loans | Commercial loans | | $ | 163 | | | $ | — | | |
| | Pre-tax gain (loss) reclassified from AOCI into interest expense: | | | |
| Pre-tax gain (loss) reclassified from AOCI into interest expense or interest income: | |
| | Long-term debt | | $ | — | | | $ | (6) | | |
| | Pre-tax gain (loss) reclassified from AOCI into interest expense or interest income: | |
| | Pre-tax gain (loss) reclassified from AOCI into interest expense or interest income: | |
| | Commercial Loans | |
| | Commercial Loans | |
| | Commercial Loans | |
|
The following table summarizes the impact on net interest income related to fair value hedges: | | | Three Months Ended March 31, | |
| Three Months Ended March 31, | |
| Three Months Ended March 31, | |
| Three Months Ended March 31, | |
| (Dollars in millions) | |
| (Dollars in millions) | |
| (Dollars in millions) | (Dollars in millions) | | 2023 | | 2022 | |
| Investment securities: | Investment securities: | | | |
| Investment securities: | |
| Investment securities: | |
| Amounts related to interest settlements | |
| Amounts related to interest settlements | |
| Amounts related to interest settlements | Amounts related to interest settlements | | $ | 76 | | | $ | (5) | | |
| Recognized on derivatives | Recognized on derivatives | | (95) | | | 414 | | |
| Recognized on derivatives | |
| Recognized on derivatives | |
| Recognized on hedged items | |
| Recognized on hedged items | |
| Recognized on hedged items | Recognized on hedged items | | 106 | | | (402) | | |
Net income (expense) recognized(1) | Net income (expense) recognized(1) | | 87 | | | 7 | | |
Net income (expense) recognized(1) | |
Net income (expense) recognized(1) | |
| Loans and leases: | |
| Loans and leases: | |
| Loans and leases: | Loans and leases: | | | |
| | Recognized on hedged items | Recognized on hedged items | | (1) | | | (1) | | |
| Net income (expense) recognized | | (1) | | | (1) | | |
| | Recognized on hedged items | |
| | Recognized on hedged items | |
| | Long-term debt: | |
| | Long-term debt: | |
| | | Long-term debt: | Long-term debt: | | | |
| Amounts related to interest settlements | Amounts related to interest settlements | | (46) | | | 16 | | |
| Amounts related to interest settlements | |
| Amounts related to interest settlements | |
| Recognized on derivatives | |
| Recognized on derivatives | |
| Recognized on derivatives | Recognized on derivatives | | 156 | | | (429) | | |
| Recognized on hedged items | Recognized on hedged items | | (142) | | | 486 | | |
| Recognized on hedged items | |
| Recognized on hedged items | |
| Net income (expense) recognized | |
| Net income (expense) recognized | |
| Net income (expense) recognized | Net income (expense) recognized | | (32) | | | 73 | | |
| Net income (expense) recognized, total | Net income (expense) recognized, total | | $ | 54 | | | $ | 79 | | |
| Net income (expense) recognized, total | |
| Net income (expense) recognized, total | |
(1)Includes $10 million and $8$9 million of income recognized for the three months ended March 31, 20232024, respectively, and 2022,$10 million for the three months ended March 31, 2023, respectively, from securities with terminated hedges that were reclassified to HTM. The income recognized was offset by the amortization of the fair value mark.
36 Truist Financial Corporation 39
The following table presents information about the Company’s cash flow and fair value hedges: | | (Dollars in millions) | (Dollars in millions) | | Mar 31, 2023 | | Dec 31, 2022 | |
| (Dollars in millions) | |
| (Dollars in millions) | |
| Cash flow hedges: | |
| Cash flow hedges: | |
| Cash flow hedges: | Cash flow hedges: | | |
| Net unrecognized after-tax gain (loss) on active hedges recorded in AOCI | Net unrecognized after-tax gain (loss) on active hedges recorded in AOCI | | $ | 6 | | | $ | (118) | | |
| Net unrecognized after-tax gain (loss) on active hedges recorded in AOCI | |
| Net unrecognized after-tax gain (loss) on active hedges recorded in AOCI | |
| Net unrecognized after-tax gain (loss) on terminated hedges recorded in AOCI (to be recognized in earnings through 2029) | |
| Net unrecognized after-tax gain (loss) on terminated hedges recorded in AOCI (to be recognized in earnings through 2029) | |
| Net unrecognized after-tax gain (loss) on terminated hedges recorded in AOCI (to be recognized in earnings through 2029) | Net unrecognized after-tax gain (loss) on terminated hedges recorded in AOCI (to be recognized in earnings through 2029) | | 41 | | | 40 | | |
| Estimated portion of net after-tax gain (loss) on active and terminated hedges to be reclassified from AOCI into earnings during the next 12 months | Estimated portion of net after-tax gain (loss) on active and terminated hedges to be reclassified from AOCI into earnings during the next 12 months | | (54) | | | (31) | | |
| Estimated portion of net after-tax gain (loss) on active and terminated hedges to be reclassified from AOCI into earnings during the next 12 months | |
| Estimated portion of net after-tax gain (loss) on active and terminated hedges to be reclassified from AOCI into earnings during the next 12 months | |
| Maximum time period over which Truist is hedging a portion of the variability in future cash flows for forecasted transactions excluding those transactions relating to the payment of variable interest on existing instruments | |
| Maximum time period over which Truist is hedging a portion of the variability in future cash flows for forecasted transactions excluding those transactions relating to the payment of variable interest on existing instruments | |
| Maximum time period over which Truist is hedging a portion of the variability in future cash flows for forecasted transactions excluding those transactions relating to the payment of variable interest on existing instruments | Maximum time period over which Truist is hedging a portion of the variability in future cash flows for forecasted transactions excluding those transactions relating to the payment of variable interest on existing instruments | | 6 years | | 6 years | |
| Fair value hedges: | Fair value hedges: | | |
Unrecognized pre-tax net gain (loss) on terminated hedges (to be recognized as interest primarily through 2033)(1) | | $ | 308 | | | $ | 669 | | |
| Fair value hedges: | |
| Fair value hedges: | |
Unrecognized pre-tax net gain (loss) on terminated hedges(1) | |
Unrecognized pre-tax net gain (loss) on terminated hedges(1) | |
Unrecognized pre-tax net gain (loss) on terminated hedges(1) | |
| Portion of pre-tax net gain (loss) on terminated hedges to be recognized as a change in interest during the next 12 months | |
| Portion of pre-tax net gain (loss) on terminated hedges to be recognized as a change in interest during the next 12 months | |
| Portion of pre-tax net gain (loss) on terminated hedges to be recognized as a change in interest during the next 12 months | Portion of pre-tax net gain (loss) on terminated hedges to be recognized as a change in interest during the next 12 months | | 52 | | | 163 | | |
|
(1)Includes deferred gains that are recorded in AOCI as a result of the reclassification to HTM of previously hedged securities of $447$404 million at March 31, 20232024 and $457$413 million at December 31, 2022.2023.
Derivatives Not Designated as Hedging Instruments under GAAP
The Company also enters into derivatives that are not designated as accounting hedges under GAAP to economically hedge certain risks as well as in a trading capacity with its clients.
The following table presents pre-tax gain (loss) recognized in income for derivative instruments not designated as hedges: | | | Three Months Ended March 31, |
| | Three Months Ended March 31, | |
| | Three Months Ended March 31, | |
| | Three Months Ended March 31, | |
| (Dollars in millions) | |
| (Dollars in millions) | |
| (Dollars in millions) | (Dollars in millions) | Income Statement Location | | 2023 | | 2022 | |
| Client-related and other risk management: | Client-related and other risk management: | | | |
| Client-related and other risk management: | |
| Client-related and other risk management: | |
| Interest rate contracts | |
| Interest rate contracts | |
| Interest rate contracts | Interest rate contracts | Investment banking and trading income and other income | | $ | 34 | | | $ | 56 | | |
| Foreign exchange contracts | Foreign exchange contracts | Investment banking and trading income and other income | | (3) | | | 32 | | |
| Foreign exchange contracts | |
| Foreign exchange contracts | |
| Equity contracts | |
| Equity contracts | |
| Equity contracts | Equity contracts | Investment banking and trading income and other income | | 2 | | | 5 | | |
| Credit contracts | Credit contracts | Investment banking and trading income and other income | | (33) | | | 8 | | |
| Credit contracts | |
| Credit contracts | |
| Commodity contracts | |
| Commodity contracts | |
| Commodity contracts | Commodity contracts | Investment banking and trading income | | 10 | | | 5 | | |
| Mortgage banking: | Mortgage banking: | | | | | | |
| Interest rate contracts - residential | Mortgage banking income | | (1) | | | 261 | | |
| Interest rate contracts - commercial | Mortgage banking income | | 1 | | | (1) | | |
| Mortgage banking: | |
| Mortgage banking: | |
| Interest rate contracts – residential | |
| Interest rate contracts – residential | |
| Interest rate contracts – residential | |
| Interest rate contracts – commercial | |
| Interest rate contracts – commercial | |
| Interest rate contracts – commercial | |
| MSRs: | MSRs: | | | | | | |
| Interest rate contracts - residential | Mortgage banking income | | 1 | | | (349) | | |
| Interest rate contracts - commercial | Mortgage banking income | | 3 | | | (9) | | |
| MSRs: | |
| MSRs: | |
| Interest rate contracts – residential | |
| Interest rate contracts – residential | |
| Interest rate contracts – residential | |
| Interest rate contracts – commercial | |
| Interest rate contracts – commercial | |
| Interest rate contracts – commercial | |
| Total | Total | | | $ | 14 | | | $ | 8 | | |
| Total | |
| Total | |
40 Truist Financial Corporation
Credit Derivative Instruments
As part of the Company’s corporate and investment banking business, the Company enters into contracts that are, in form or substance, written guarantees; specifically, risk participations, TRS, and credit default swaps. The Company accounts for these contracts as derivatives.
Truist has entered into risk participation agreements to share the credit exposure with other financial institutions on client-related interest rate derivative contracts. Under these agreements, the Company has guaranteed payment to a dealer counterparty in the event the counterparty experiences a loss on the derivative due to a failure to pay by the counterparty’s client. The Company manages its payment risk on its risk participations by monitoring the creditworthiness of the underlying client through the normal credit review process that the Company would have performed had it entered into a derivative directly with the obligors. At March 31, 2023,2024, the remaining terms on these risk participations ranged from less than one year to 1513 years. The potential future exposure represents the Company’s maximum estimated exposure to written risk participations, as measured by projecting a maximum value of the guaranteed derivative instruments based on scenario simulations and assuming 100% default by all obligors on the maximum value.
The Company has also entered into TRS contracts on loans and bonds. To mitigate its credit risk, the Company typically receives initial margin from the counterparty upon entering into the TRS and variation margin if the fair value of the underlying reference assets deteriorates. For additional information on the Company’s TRS contracts, see “Note 14. Commitments and Contingencies.”
Truist Financial Corporation 37
The Company enters into credit default swaps to hedge credit risk associated with certain loans and leases. The Company accounts for these contracts as derivatives, and accordingly, recognizes these contracts at fair value.
The following table presents additional information related to interest rate derivative risk participation agreements and total return swaps: | | (Dollars in millions) | (Dollars in millions) | Mar 31, 2023 | | Dec 31, 2022 | (Dollars in millions) | Mar 31, 2024 | | Dec 31, 2023 |
| Risk participation agreements: | Risk participation agreements: | |
| | Maximum potential amount of exposure | Maximum potential amount of exposure | $ | 618 | | | $ | 575 | |
| | Maximum potential amount of exposure | |
| | Maximum potential amount of exposure | |
| Total return swaps: | Total return swaps: | |
| | Cash collateral held | 473 | | | 453 | |
| Cash and other collateral received | |
| | Cash and other collateral received | |
| | Cash and other collateral received | |
The following table summarizes collateral positions with counterparties: | | (Dollars in millions) | (Dollars in millions) | Mar 31, 2023 | | Dec 31, 2022 | (Dollars in millions) | Mar 31, 2024 | | Dec 31, 2023 |
| Dealer and other counterparties: | Dealer and other counterparties: | |
| Cash and other collateral received from counterparties | |
| Cash and other collateral received from counterparties | |
| Cash and other collateral received from counterparties | Cash and other collateral received from counterparties | $ | 511 | | | $ | 542 | |
| Derivatives in a net gain position secured by collateral received | Derivatives in a net gain position secured by collateral received | 586 | | | 618 | |
| Unsecured positions in a net gain with counterparties after collateral postings | Unsecured positions in a net gain with counterparties after collateral postings | 75 | | | 76 | |
| Cash collateral posted to counterparties | Cash collateral posted to counterparties | 636 | | | 590 | |
| Derivatives in a net loss position secured by collateral | Derivatives in a net loss position secured by collateral | 809 | | | 692 | |
| | Central counterparties clearing: | Central counterparties clearing: | |
| Cash collateral, including initial margin, received from central clearing parties | — | | | 4 | |
| Central counterparties clearing: | |
| Central counterparties clearing: | |
| | Cash collateral, including initial margin, posted to central clearing parties | |
| | Cash collateral, including initial margin, posted to central clearing parties | |
| | Cash collateral, including initial margin, posted to central clearing parties | Cash collateral, including initial margin, posted to central clearing parties | 85 | | | 45 | |
| Derivatives in a net loss position | Derivatives in a net loss position | 19 | | | 13 | |
| Derivatives in a net gain position | Derivatives in a net gain position | 1 | | | 12 | |
| Securities pledged to central counterparties clearing | Securities pledged to central counterparties clearing | 933 | | | 639 | |
Truist Financial Corporation 41
NOTE 17. Computation of EPS
Basic and diluted EPS calculations are presented in the following table: | | | |
| | | | | Three Months Ended March 31, | | | Three Months Ended March 31, |
| (Dollars in millions, except per share data, shares in thousands) | (Dollars in millions, except per share data, shares in thousands) | | 2023 | | 2022 | |
| Net income available to common shareholders from continuing operations | |
| Net income available to common shareholders from continuing operations | |
| Net income available to common shareholders from continuing operations | |
| Net income available to common shareholders from discontinued operations | |
| Net income available to common shareholders from discontinued operations | |
| Net income available to common shareholders from discontinued operations | |
| Net income available to common shareholders | |
| Net income available to common shareholders | |
| Net income available to common shareholders | Net income available to common shareholders | | $ | 1,410 | | | $ | 1,327 | | |
| Weighted average number of common shares | Weighted average number of common shares | | 1,328,602 | | | 1,329,037 | | |
| Weighted average number of common shares | |
| Weighted average number of common shares | |
| Effect of dilutive outstanding equity-based awards | |
| Effect of dilutive outstanding equity-based awards | |
| Effect of dilutive outstanding equity-based awards | Effect of dilutive outstanding equity-based awards | | 10,878 | | | 12,526 | | |
| Weighted average number of diluted common shares | Weighted average number of diluted common shares | | 1,339,480 | | | 1,341,563 | | |
| Weighted average number of diluted common shares | |
| Weighted average number of diluted common shares | |
| Basic earnings from continuing operations | |
| Basic earnings from continuing operations | |
| Basic earnings from continuing operations | |
| Basic earnings from discontinued operations | |
| Basic earnings from discontinued operations | |
| Basic earnings from discontinued operations | |
| Basic EPS | Basic EPS | | $ | 1.06 | | | $ | 1.00 | | |
| Basic EPS | |
| Basic EPS | |
| Diluted earnings from continuing operations | |
| Diluted earnings from continuing operations | |
| Diluted earnings from continuing operations | |
| Diluted earnings from discontinued operations | |
| Diluted earnings from discontinued operations | |
| Diluted earnings from discontinued operations | |
| Diluted EPS | |
| Diluted EPS | |
| Diluted EPS | Diluted EPS | | $ | 1.05 | | | $ | 0.99 | | |
| Anti-dilutive awards | Anti-dilutive awards | | 621 | | | — | | |
| Anti-dilutive awards | |
| Anti-dilutive awards | |
NOTE 18. Operating Segments
Effective January 1, 2024, several business activities were realigned reflecting updates to the Company’s operating structure. First, the CB&W segment was renamed CSBB and the C&CB segment was renamed WB. Second, the Wealth business was realigned into the WB segment from the CSBB segment, representing a separate reporting unit in that segment. Third, the small business banking client segmentation was realigned into the CSBB segment from the WB segment.
Following the segment realignment, Truist operates and measures business activity across threetwo segments: CB&W, C&CB,CSBB and IH,WB, with functional activities included in OT&C. The Company’s business segment structure is based on the manner in which financial information is evaluated by management as well as the products and services provided or the type of client served. For additional information, see “Note 21. Operating Segments” of the Annual Report on Form 10-K for the year ended December 31, 2022.
DuringOn February 20, 2024, the first quarterCompany entered into an agreement to sell the remaining stake of 2023, Truist reorganized Prime Rate Premium Finance Corporation,the common equity in TIH to an investor group, representing substantially all of the Company’s IH segment, which includes AFCO Credit Corporationrepresented a material strategic shift for the Company, and CAFO Holdingas a result, the Company intorecast results for all periods presented under the C&CB segment fromdiscontinued operations basis of presentation. On May 6, 2024, the Company completed the sale of its remaining equity interests in TIH. TIH was the principal legal entity of the IH segment. Prior period results have been revisedAs the operations of TIH are now included in discontinued operations, the Company no longer presents the IH segment as one of its reportable segments. Refer to conform“Note 2. Discontinued Operations” for additional information related to discontinued operations.
Consumer and Small Business Banking
CSBB serves consumer and small businesses clients, providing deposits and payment services, credit cards, loans, mortgages, brokerage, and investment advisory services and insurance solutions through an extensive network of branches, ATMs, digital channels, contact centers, and other channels. Lending solutions include personal and unsecured loans originated through the current presentation.branch network and digital channels; indirect lending services providing a comprehensive set of technology-enabled consumer lending solutions including point-of-sale offerings for autos, recreational vehicles, outdoor power sports, equipment, and home improvement; and real estate lending providing residential mortgages through its retail, direct, and correspondent channels, with the loans either sold in the secondary market, typically with servicing rights retained or held in the Company’s loan portfolio, and home equity loans delivered through the branch network. CSBB also serves as an entry point for clients to access services from other businesses.
Wholesale Banking
WB delivers a comprehensive suite of solutions to our commercial, corporate, institutional, real estate, and wealth clients bringing together a combination of both local and specialized industry expertise. This segment is focused on providing core banking, specialized lending, investment banking, capital markets, strategic advisory, market-making, asset management, trust, brokerage, and investment related services, as well as cash management and payment processing. Truist’s investment banking and corporate banking teams serve clients across the nation, while offering a unique, high-touch advisory approach through our industry experts. Truist’s wealth professionals provide investment advisory services, institutional investment management, full-service and online/discount brokerage products, family office services, as well as other wealth management disciplines.
3842 Truist Financial Corporation
Other, Treasury & Corporate
OT&C includes management of the Company’s investment securities portfolio, long-term debt, derivative instruments used for balance sheet hedging, short-term liquidity and funding activities, balance sheet risk management and most real estate assets, as well as the Company’s functional activities such as finance, enterprise risk, legal, and enterprise technology and management, among others. Additionally, OT&C houses intercompany eliminations, including intersegment net referral fees and residual interest rate risk after segment allocations have taken place.
Truist promotes revenue growth through the Company’s Integrated Relationship Management approach, which is designed to deepen client relationships and bring the full breadth and depth of Truist’s products and services to meet clients’ financial needs. The objective is to provide Truist’s entire suite of products to its clients with the end goal of providing clients the best financial experience in the marketplace. Revenues of certain products and services are reflected in the results of the segment providing those products and services and are also allocated to CSBB and WB. These allocated revenues between segments are reflected as net referral fees in noninterest income and eliminated in OT&C.
The segment results are presented based on internal management methodologies that were designed to support these strategic objectives. Unlike financial accounting, there is no comprehensive authoritative body of guidance for management accounting equivalent to GAAP. The performance of the segments is not comparable with Truist’s consolidated results or with similar information presented by any other financial institution. Additionally, because of the interrelationships between the various segments, the information presented is not indicative of how the segments would perform if they operated as independent entities.
Because business segment results are presented based on management accounting practices, the transition to the consolidated results prepared under U.S. GAAP creates certain differences, which are reflected as residuals in OT&C. Business segment reporting conventions include, but are not limited to, the items as detailed below.
Segment net interest income reflects matched maturity funds transfer pricing, which ascribes credits or charges based on the economic value or cost created by assets and liabilities of each segment. Residual differences between these credits and charges are captured in OT&C.
Noninterest income includes inter-segment referral fees, as well as federal and state tax credits that are grossed up on a pre-tax equivalent basis, related primarily to certain community development investments. Recoveries for these allocations are reported in OT&C.
Corporate expense allocations, including overhead or functional expenses that are not directly charged to the segments, are allocated to segments based on various drivers (number of FTEs, number of accounts, loan balances, net revenue, etc.). Recoveries for these allocations are reported in OT&C.
Provision for credit losses represents net charge-offs by segment combined with an allocation to the segments for the provision attributable to each segment’s quarterly change in the ALLL. Provision for income taxes is calculated using a blended income tax rate for each segment and includes reversals of the noninterest income tax adjustments described above. The difference between the calculated provision for income taxes at the segment level and the consolidated provision for income taxes is reported in OT&C.
The application and development of management reporting methodologies is an active process and undergoes periodic enhancements. The implementation of these enhancements to the internal management reporting methodology may materially affect the results disclosed for each segment, with no impact on consolidated results. When significant changes to management reporting methodologies take place, the impact of these changes is quantified and prior period information is revised as practicable.
Truist Financial Corporation 43
The following table presents results by segment: | Three Months Ended March 31,
(Dollars in millions) | Three Months Ended March 31,
(Dollars in millions) | CB&W | | C&CB | | IH | | OT&C(1) | | Total | |
| 2023 | | 2022 | | 2023 | | 2022 | | 2023 | | 2022 | | 2023 | | 2022 | | 2023 | | 2022 | |
Three Months Ended March 31,
(Dollars in millions) | |
| | 2024 | |
| 2024 | |
| Net interest income (expense) | |
| Net interest income (expense) | |
| Net interest income (expense) | Net interest income (expense) | $ | 1,601 | | | $ | 1,528 | | | $ | 2,308 | | | $ | 1,118 | | | $ | 1 | | | $ | 1 | | | $ | (42) | | | $ | 536 | | | $ | 3,868 | | | $ | 3,183 | | |
| Net intersegment interest income (expense) | Net intersegment interest income (expense) | 1,139 | | | 656 | | | (556) | | | 171 | | | 13 | | | 2 | | | (596) | | | (829) | | | — | | | — | | |
| Net intersegment interest income (expense) | |
| Net intersegment interest income (expense) | |
| Segment net interest income | |
| Segment net interest income | |
| Segment net interest income | Segment net interest income | 2,740 | | | 2,184 | | | 1,752 | | | 1,289 | | | 14 | | | 3 | | | (638) | | | (293) | | | 3,868 | | | 3,183 | | |
| Allocated provision for credit losses | Allocated provision for credit losses | 274 | | | 74 | | | 232 | | | (150) | | | — | | | — | | | (4) | | | (19) | | | 502 | | | (95) | | |
| Allocated provision for credit losses | |
| Allocated provision for credit losses | |
| Segment net interest income after provision | |
| Segment net interest income after provision | |
| Segment net interest income after provision | Segment net interest income after provision | 2,466 | | | 2,110 | | | 1,520 | | | 1,439 | | | 14 | | | 3 | | | (634) | | | (274) | | | 3,366 | | | 3,278 | | |
| Noninterest income | Noninterest income | 873 | | | 910 | | | 630 | | | 656 | | | 817 | | | 733 | | | (86) | | | (157) | | | 2,234 | | | 2,142 | | |
| Noninterest income | |
| Noninterest income | |
| Amortization of intangibles | |
| Amortization of intangibles | |
| Amortization of intangibles | Amortization of intangibles | 69 | | | 73 | | | 31 | | | 33 | | | 36 | | | 30 | | | — | | | 1 | | | 136 | | | 137 | | |
| Other noninterest expense | Other noninterest expense | 1,900 | | | 1,812 | | | 812 | | | 755 | | | 648 | | | 516 | | | 195 | | | 454 | | | 3,555 | | | 3,537 | | |
| Income (loss) before income taxes | 1,370 | | | 1,135 | | | 1,307 | | | 1,307 | | | 147 | | | 190 | | | (915) | | | (886) | | | 1,909 | | | 1,746 | | |
| Other noninterest expense | |
| Other noninterest expense | |
| Income (loss) before income taxes from continuing operations | |
| Income (loss) before income taxes from continuing operations | |
| Income (loss) before income taxes from continuing operations | |
| Provision (benefit) for income taxes | Provision (benefit) for income taxes | 326 | | | 274 | | | 273 | | | 284 | | | 36 | | | 47 | | | (241) | | | (275) | | | 394 | | | 330 | | |
| Segment net income (loss) | $ | 1,044 | | | $ | 861 | | | $ | 1,034 | | | $ | 1,023 | | | $ | 111 | | | $ | 143 | | | $ | (674) | | | $ | (611) | | | $ | 1,515 | | | $ | 1,416 | | |
| Provision (benefit) for income taxes | |
| Provision (benefit) for income taxes | |
| Segment net income (loss) from continuing operations | |
| Segment net income (loss) from continuing operations | |
| Segment net income (loss) from continuing operations | |
| | Identifiable assets (period end) | $ | 168,701 | | | $ | 159,939 | | | $ | 213,143 | | | $ | 188,806 | | | $ | 7,263 | | | $ | 6,494 | | | $ | 185,247 | | | $ | 188,740 | | | $ | 574,354 | | | $ | 543,979 | | |
| Identifiable assets (period end) of continuing operations | |
| | Identifiable assets (period end) of continuing operations | |
| | Identifiable assets (period end) of continuing operations | |
| | | | | | | |
(1)Includes financial data from business units below the quantitative and qualitative thresholds requiring disclosure.
44 Truist Financial Corporation
NOTE 19. Subsequent Events
On May 6, 2024, the Company completed the sale of its remaining equity interests in TIH. The sale resulted in cash proceeds to Truist of approximately $10.1 billion after-tax, reflecting certain closing adjustments for cash, debt and debt-like items, including the settlement of certain previously granted TIH equity awards, working capital, transaction expenses and an investor return amount associated with the originally sold 20% stake. The transaction improves Truist’s relative capital position and allows Truist to maintain strategic flexibility. Upon closing, the transaction resulted in a full deconsolidation of the TIH subsidiary from Truist and resulted in an approximate after-tax gain of approximately $4.7 billion. Additionally, following the sale, Truist will retain the related postretirement benefit obligation for TIH employees, and will remeasure the postretirement benefit obligation of the plan in the second quarter of 2024. Refer to “Note 2. Discontinued Operations” for additional information related to discontinued operations.
Following the completion of the sale of TIH, Truist executed a strategic balance sheet repositioning of a portion of its AFS investment securities portfolio by selling $27.7 billion of lower-yielding investment securities, resulting in an after-tax loss of $5.1 billion in the second quarter of 2024. The investment securities that were sold had a book value of $34.4 billion and a weighted average book yield of 2.80% for the remainder of 2024 including the impact of hedges and based on the Federal Funds futures curve. Including the tax benefit, the repositioning generated $29.3 billion available for reinvestment.
Truist invested approximately $18.7 billion of the $39.4 billion available in shorter duration investment securities yielding 5.27%. The remaining $20.7 billion will be held in cash. The blended reinvestment rate on the new investment securities purchased and cash is 5.22% for the remainder of 2024 including the impact of hedges and based on the Federal Funds futures curve.
Truist Financial Corporation 3945
ITEM 2. MANAGEMENT’S DISCUSSION AND ANALYSIS OF FINANCIAL CONDITION AND RESULTS OF OPERATIONS
MD&A is intended to assist readers in their analysis of the accompanying Consolidated Financial Statements and supplemental financial information. It should be read in conjunction with the Consolidated Financial Statements, the accompanying Notes to the Consolidated Financial Statements in this Form 10-Q, other information contained in this document, as well as with Truist’s Annual Report on Form 10-K for the year ended December 31, 2022.2023.
A description of certain factors that may affect our future results and risk factors is set forth in Part I, Item 1A-Risk Factors in our Annual Report on Form 10-K for the year ended December 31, 2022.2023.
Regulatory and Supervisory Considerations
We are subject to significant regulatory frameworks that affect the products and services that we may offer and the manner in which we may offer them, the risks that we may take, the ways in which we may operate, and the corporate and financial actions that we may take. We are also subject to direct supervision and periodic examinations by various governmental agencies and self-regulatory organizations that are charged with overseeing the kinds of business activities in which we engage. The regulatory and supervisory framework applicable to banking organizations is intended primarily for the protection of depositors and other customers, the DIF, the broader economy, and the stability of the U.S. financial system, rather than for the protection of shareholders and non-deposit creditors. Truist is subjectIn addition to banking laws and regulations, andTruist is subject to various other laws and regulations, all of which directly or indirectly affect the operations and management of Truist and its ability to make distributions to shareholders. Truist and its subsidiaries are also subject to supervision and examination by multiple regulators. The descriptions below summarize certain updates to significant federal and state laws to which Truist is subject since the filing of the Annual Report on Form 10-K for the year ended December 31, 2022 to state and federal laws to which Truist is subject.2023. These descriptions do not summarize all possible or proposed changes in current laws or regulations and are not intended to be a substitute for the related statuesstatutes or regulatory provisions. Refer to “Regulatory and Supervisory Considerations” in Truist’s Annual Report on Form 10-K for the year ended December 31, 20222023 for additional disclosures.
In MarchNovember 2023, the FRB createdFDIC issued a final rule to implement a special assessment to recoup losses to the Bank Term Funding ProgramDIF associated with bank failures in the first half of 2023. Under the rule, the assessment base for the special assessment is equal to support American businessesan insured depository institution’s estimated uninsured deposits reported as of December 31, 2022, adjusted to exclude the first $5 billion of uninsured deposits. The special assessment for Truist is $582 million, with $507 million recognized in the fourth quarter of 2023 and households by makingan additional funding available$75 million recognized in the first quarter of 2024 due to eligible depository institutions. This program offers loans upan increase in the estimated relevant losses to one year in length to banks, savings associations, credit unions, and other eligible depository institutions pledging any collateral eligible for purchasethe DIF reported by the FRBFDIC in open market operations, such as U.S. Treasuries, U.S. agency securities,February 2024. The ultimate amount of expenses associated with the special assessment will also be impacted by the finalization of the losses incurred by the FDIC in the resolutions of Silicon Valley Bank and U.S. agency mortgage-backed securities. These assets will be valued at par.Signature Bank, which could result in additional expense.
In March 2024, the aftermathFDIC released proposed revisions to its statement of policy on bank merger transactions. The proposal reflects regulatory, legislative, and industry changes since the statement of policy was last published for comment and amended, makes the statement more principles-based, communicates the FDIC Board’s expectations regarding the evaluation of merger applications filed under the Bank Merger Act, and describes the types of merger applications for which the FDIC is the responsible agency. We continue to evaluate the proposal and the potential impacts, if adopted as proposed, on the Company and Truist Bank.
The FRB’s capital plan rule provides that a BHC must update and resubmit its capital plan if the BHC determines there has been or will be a material change in its risk profile, financial condition, or corporate structure since it last submitted the capital plan. Truist determined that the sale of our remaining equity interests in TIH constitutes such a material change and, therefore, addressed the material change in our capital plan submitted in April 2024. The capital plan rule further provides that, upon the occurrence of an event requiring resubmission, a BHC may not make any capital distribution unless it has received prior approval of the recent bank failures, we expect that the banking agencies will propose certain actions, including reforms that may impose differentFRB. Accordingly, Truist’s capital and liquidity requirements, including increased requirements to issue long term debt. In addition, there may be special assessments to repay lossesdistributions are now subject to the FDIC’s Deposit Insurance Fund. It is not yet possible to quantifyprior approval of the impactFRB, pending the FRB's consideration of these potential actions.our capital plan and stress capital buffer requirement. Truist’s Board of Directors declared common and preferred stock dividends payable in June 2024, which have been approved by the FRB.
Executive Overview
In a challengingWe are pleased with the progress and unique quarter for the banking industry, Truist demonstrated strength and leadership that reflects our diverse business model, granular and relationship-oriented deposit base, and strong capital and liquidity position. Truist has significant access to liquidity and a very robust liquidity management process that includes internal and external stress testing, as well as real-time monitoringmomentum of our liquidity position. We also closed on the sale of a 20% minority stake in Truist Insurance Holdings, LLC on April 3, 2023, which provides strategic and financial flexibility for both Truist and Truist Insurance Holdings.
We continued to experience the benefits of our shift from integrating to operating, including improving organic production and integrated relationship management momentum, although these benefits were offset by higher-than-expected funding costs. Asset quality metrics remain strong, and we prudently increased our ALLL ratio by three basis points to reflect increased economic uncertainty.
Our focus on clients was unwavering during the first quarter of 2023. Our teammates continue to care for our clients and stakeholders and live our purpose to inspire and build better lives and communities. Truist continues to be a source of strength and stability for our clients and communities.
Truist made a $1 billion uninsured time deposit in First Republic Bank during the first quarter joining the nation’s largest financial intuitions to show support for the U.S. banking system and the economy. On Monday, May 1, 2023, JPMorgan Chase Bank, National Association assumed all of the deposits and purchased the substantial majority of assets of First Republic Bank from the FDIC. JPMorgan Chase Bank, National Association has indicated that the deposit Truist made at First Republic Bank will be repaid post-closing of the transaction.
Detailed below are actions that we have taken to fulfill our purpose to inspire and build better lives and communities, followed by a discussion of our financial results for the first quarter of 2023.
•Made meaningful improvement in our client experience, with Voice of the Client metrics rising since the second quarter of 2022, and continued positive momentum with branch satisfaction scoresbusiness in the first quarter of 20232024. Our expense discipline was evident and reflects important decisions we made last year. Investments we have made in our investment banking business resulted in strong performance in improving markets. Loan demand was muted and deposit costs continue to be under pressure.
•Opened T3 Accelerator Lab in the Innovation & Technology Center where we’re redefining the clientAsset quality metrics are normalizing but remain manageable as our nonperforming loans remained relatively stable on a linked-quarter basis and teammate experience, putting feedback and ideas to the test in real-world scenarios before rolling out to clientsloan losses were within our expectations.
4046 Truist Financial Corporation
•Continued growth for Truist Momentum, Truist’s financial wellness program
•Published 2022 Corporate Responsibility Report, TCFD Report,Effective January 1, 2024, several business activities were realigned reflecting updates to the Company’s operating structure. First, the CB&W segment was renamed CSBB and ESG Disclosure Summary, highlighting our progress across multiple dimensions including community, financial inclusion, DEI, and climate and energy
◦We made important progress on our sustainability commitments through 2022, including our goal of achievingthe C&CB segment was renamed WB. Second, the Wealth business was realigned into the WB segment from the CSBB segment, representing a 35% reductionseparate reporting unit in both Scope 1 and Scope 2 emissions by 2030 from our baseline year of 2019. We reduced Scope 1 emissions by 17% and Scope 2 emissions by 26%.
•Successfully migrated certain consumer andthat segment. Third, the small business credit cards to a new processing platformbanking client segmentation was realigned into the CSBB segment from the WB segment.
•Announced a new goal to increase female and ethnically diverse representationFollowing the departure of our CIO in leadership roles by 15% and 20%, respectively, by 2025
•Committed $282 million from Truist Community Capital to support affordable housing and job creation in underserved communities and $22 million through Truist FoundationApril 2024, we have appointed an interim CIO while our search for a multiyear programpermanent CIO continues. Our Interim CIO has 20 years of banking experience across risk management, commercial, consumer, operations, technology, and vertically integrated businesses. He oversees the provision of comprehensive technology, data, security, and information related platforms.
On May 6, 2024, we completed the sale of TIH previously announced on February 20, which strengthened our relative capital position, facilitated a balance sheet repositioning, and will allow Truist to strengthen small businessesprovide even greater support to our core banking clients and create career pathwaysevaluate a return of capital to shareholders via share buybacks later in 2024 depending upon market conditions and other factors. Financial information attributed to TIH has been reflected in discontinued operations for ethnically diverse individualsthe periods presented within and, entrepreneursunless otherwise stated, the following discussion excludes amounts reported as discontinued operations. Refer to “Note 2. Discontinued Operations” for additional information.
•Our strengthening capital position allows us to better weather any economic environment, and importantly, will enable us to be in a more offensive position with our core banking franchise. We are alsooptimistic about our future as we operate Truist from this increased position of financial strength in some of the best markets in the process of realigning our LightStream platforms with our broader consumer business, with the goal of bringing the innovation, digital capabilities, efficiencies, and certain cloud-based infrastructure of LightStream to the broader Truist client basecountry.
Financial Results
Net income available to common shareholders for the first quarter of 20232024 of $1.4$1.1 billion was up 6.3%down 23% compared with the first quarter of 2022.2023. On a diluted per common share basis, earnings for the first quarter of 20232024 were $1.05, an increase$0.81, a decrease of $0.06,$0.24, or 6.1%23%, compared to the first quarter of 2022.2023. Truist’s results of operations for the first quarter of 20232024 produced an annualized return on average assets of 1.10%0.91% and an annualized return on average common shareholders’ equity of 10.3%8.4% compared to prior year returns of 1.07%1.10% and 9.0%10.3%, respectively.
Net income from continuing operations was $1.1 billion for the first quarter of 2024, compared to $1.4 billion for the first quarter of 2023.
•Results from continuing operations for the first quarter of 20232024 included merger-related and restructuring charges of $63$51 million ($4839 million after-tax, or $0.03 per share) and the FDIC special assessment of $75 million ($57 million after-tax, or $0.04 per share).
•Results from continuing operations for the first quarter of 20222023 included $216restructuring charges of $56 million ($16643 million after-tax, or $0.12$0.03 per share).
Net income from discontinued operations was $67 million for the first quarter of merger-related2024, compared to $105 million for the first quarter of 2023.
•Results from discontinued operations for the first quarter of 2024 included the accelerated recognition of TIH equity compensation expense for certain event-driven awards of $89 million ($68 million after tax, or $0.05 per share), and restructuring charges $202of $19 million ($15514 million after-tax, or $0.12 per share) of incremental operating expenses related to the Merger, a gain on the redemption of noncontrolling equity interest of $74 million ($57 million after-tax, or $0.04 per share) related to the acquisition of certain merchant services relationships, and net losses on the sales of securities of $69 million ($53 million after-tax, or $0.04$0.01 per share).
Taxable-equivalent net interest income for the first quarter of 20232024 was up $710down $493 million, or 22%13%, compared to the first quarter of 20222023 primarily due to higher short-term interest ratesfunding costs and strong loan growth, alongside well controlled deposit costs. These increases were partially offset by lower purchase accounting accretion and PPP revenue.earning assets. Net interest margin was 3.17%2.89%, up 41down 28 basis points.
•The yield on the average total loan portfolio was 5.81%6.38%, up 21257 basis points, primarily reflecting higher market interest rates, partially offset by lower purchase accounting accretion and PPP revenue.rates. The yield on the average securities portfolio was 2.14%2.46%, up 46 basis points primarily due to the higher rate environment. The average cost of total deposits was 1.12%, up 10932 basis points.
•The average cost of total deposits was 2.03%, up 91 basis points. The average cost of short-term borrowings was 4.69%5.62%, up 40993 basis points. The average cost of long-term debt was 4.05%4.74%, up 25569 basis points. The increase in rates on deposits and other funding sources was largely attributable to the higher rate environment.
Noninterest income was up $92$25 million, or 4.3%1.8%, compared to the first quarter of 20222023 due to 12% growth in insurancehigher investment banking and trading income and higher mortgage bankingother income, higher fees from lending-related activities and card and payment related activities. These items were partially offset by lower other income. The first quarter of 2022 included $69 million of securities lossesmortgage banking income and a $74 million gainservice charges on the redemption of noncontrolling equity interest (included in other income).deposits.
Noninterest expense was up $17down $62 million, or 0.5%2.1%, compared to the first quarter of 20222023 due to higher personnel expense,lower other expense and regulatory costs. These increases werepersonnel expense, partially offset by lower merger-related and restructuring charges and professional fees and outside processing expenses. Merger-related and restructuring charges and incremental operating expenses related to the merger decreased $153 million and $202 million, respectively, due to the completionFDIC special assessment (regulatory costs) of integration-related activities.$75 million. Adjusted noninterest expenses, which exclude merger-related coststhe FDIC special assessment, restructuring charges, and the amortization of intangibles, increased $373decreased $120 million, or 12%.4.2%, compared to the earlier quarter.
The provision for income taxes was $394 million for the first quarter of 2023, compared to $330 million for the earlier quarter. The effective tax rate for the first quarter of 2023 was 20.6%,2024 decreased compared to 18.9% for the earlier quarter.first quarter of 2023 primarily due to a decrease in the full year forecasted pre-tax earnings.
Asset quality remains excellent, reflecting Truist’s prudent risk culture and diverse portfolio. Truist Financial Corporation 47
An increase in the loan loss reserve reflects normalization of asset quality.
•Nonperforming loans and leases held for investment were 0.36%0.45% of loans and leases held for investment at March 31, 2023, flat2024, up one basis point compared to December 31, 2022.
Truist Financial Corporation 41
•The allowance for credit losses was $4.8$5.1 billion and includes $4.5$4.8 billion for the allowance for loan and lease losses and $282$297 million for the reserve for unfunded commitments. The ALLL ratio was 1.37%1.56%, up threetwo basis points compared with December 31, 2022 primarily due to increased economic uncertainty.2023.
•The provision for credit losses was $502$500 million compared to a benefit of $95$502 million for the first quarter of 2022. The increase in the current quarter provision expense primarily reflects increased economic uncertainty in the current period, whereas the earlier quarter included a reserve release due to the improving credit environment during that period.2023.
•The net charge-off ratio was 3764 basis points, up 1227 basis points compared to the first quarter of 2022 driven by2023 due to higher net charge-offs in the CRE, other consumer, credit card, and indirect auto and other consumer portfolios due to normalizing trends, as well as an increase in the commercial and industrial portfolio.portfolios.
Capital and liquidity remained strong compared toduring the regulatory requirements for well capitalized banks.first quarter of 2024.
•TruistTruist’s CET1 ratio was 9.1%10.1% as of March 31, 2023. The increase since2024, flat compared to December 31, 2022 represents2023 as organic capital generation and RWA optimization were partially offset by the CECL phase-in.
•Truist closed the sale of the minority stake in TIH on April 3, 2023, which adds 30 basis points to the risk-based regulatory capital ratios.
•Truist declared common dividends of $0.52 per share during the first quarter of 2023.2024. The dividend payout ratio for the first quarter of 20232024 was 49%64%. Truist did not repurchase any shares in the first quarter of 2023.2024.
•Truist’s average consolidated LCR was 113%115% for the three months ended March 31, 2023,2024, compared to the regulatory minimum of 100%.
•
On May 6, 2024, the Company completed the sale of its remaining equity interests in TIH. The sale resulted in after-tax cash proceeds to Truist has significantof approximately $10.1 billion, reflecting certain closing adjustments for cash, debt and strong accessdebt-like items, including the settlement of certain previously granted TIH equity awards, working capital, transaction expenses and an investor return amount associated with the originally sold 20% stake. The transaction improves Truist’s relative capital position and allows Truist to liquidity with $166maintain strategic flexibility. Upon closing, the transaction resulted in a full deconsolidation of the TIH subsidiary from Truist and resulted in an approximate after-tax gain of approximately $4.7 billion. Additionally, following the sale, Truist will retain the related postretirement benefit obligation for TIH employees, and will remeasure the postretirement benefit obligation of the plan in the second quarter of 2024. Refer to “Note 2. Discontinued Operations” for additional information related to discontinued operations.
Following the completion of the sale of TIH, Truist executed a strategic balance sheet repositioning of a portion of its AFS investment securities portfolio by selling $27.7 billion of lower-yielding investment securities, resulting in an after-tax loss of $5.1 billion in the second quarter of 2024. The investment securities that were sold had a book value of $34.4 billion and a weighted average book yield of 2.80% for the remainder of 2024 including the impact of hedges and based on the Federal Funds futures curve. Including the tax benefit, the repositioning generated $29.3 billion available liquidity as of March 31, 2023.for reinvestment.
•Truist increased itsinvested approximately $18.7 billion of the $39.4 billion available in shorter duration investment securities yielding 5.27%. The remaining $20.7 billion will be held in cash. The blended reinvestment rate on the new investment securities purchased and cash position in response to market events.
•AOCI improved by $1.0 billion, or 7.5%, since December 31, 2022.is 5.22% for the remainder of 2024 including the impact of hedges and based on the Federal Funds futures curve.
Analysis of Results of Operations
Net Interest Income and NIM
Taxable-equivalent net interest income for the first quarter of 20232024 was up $710down $493 million, or 22%13%, compared to the first quarter of 20222023 primarily due to higher short-term interest ratesfunding costs and strong loan growth, alongside well controlled deposit costs. These increases were partially offset by lower purchase accounting accretion and PPP revenue.earning assets. Net interest margin was 3.17%2.89%, up 41down 28 basis points.
•Average earning assets increased $29.2decreased $22.6 billion, or 6.2%4.5%, primarily due to growthdeclines in average total loans of $35.1$18.1 billion, or 12%5.5%, and a decrease in average securities of $9.3 billion, or 6.6%, partially offset by growth in other earning assets of $6.7$5.4 billion, or 35%21%, primarily due to an increase in balances held at the Federal Reserve to support liquidity build, partially offset by a decrease in average securities of $12.1 billion, or 7.9%.liquidity.
•The yield on the average total loan portfolio was 5.81%6.38%, up 21257 basis points, primarily reflecting higher market interest rates, partially offset by lower purchase accounting accretion and PPP revenue.rates. The yield on the average securities portfolio was 2.14%2.46%, up 4632 basis points primarily due to the higher rate environment.points.
•Average deposits decreased $6.8$19.4 billion, or 1.6%4.7%, average short-term borrowings increased $17.1$2.2 billion, or 9.0%, and average long-term debt increased $15.7decreased $10.3 billion, or 44.5%20%.
•The average cost of total deposits was 1.12%2.03%, up 10991 basis points. The average cost of short-term borrowings was 4.69%5.62%, up 40993 basis points. The average cost of long-term debt was 4.05%4.74%, up 25569 basis points. The increase in rates on deposits and other funding sources was largely attributable to the higher rate environment.
As of March 31, 2023, the remaining unamortized fair value marks on the loan and lease portfolio and long-term debt were $673 million and $69 million, respectively. As of December 31, 2022, the remaining unamortized fair value marks on the loan and lease portfolio and long-term debt were $741 million and $81 million, respectively.
The remaining unamortized purchase accounting fair value mark on loans and leases consists of $447 million for consumer loans and leases, and $226 million for commercial loans and leases. These amounts will be recognized over the remaining contractual lives of the underlying instruments or as paydowns occur.
The major components of net interest income and the related annualized yields as well as the variances between the periods caused by changes in interest rates versus changes in volumes are summarized below.
4248 Truist Financial Corporation
| | Table 1: Taxable-Equivalent Net Interest Income and Rate / Volume Analysis | Table 1: Taxable-Equivalent Net Interest Income and Rate / Volume Analysis | Table 1: Taxable-Equivalent Net Interest Income and Rate / Volume Analysis |
Three Months Ended March 31,
(Dollars in millions) | Three Months Ended March 31,
(Dollars in millions) | Average Balances(1) | | Annualized Yield/Rate(2) | | Income/Expense | | Incr.
(Decr.) | | Change due to | Three Months Ended March 31,
(Dollars in millions) | Average Balances(1) | | Annualized Yield/Rate(2) | | Income/Expense | | Incr.
(Decr.) | | Change due to |
| 2023 | | 2022 | | 2023 | | 2022 | | 2023 | | 2022 | | Rate | | Volume | 2024 | | 2023 | | 2024 | | 2023 | | 2024 | | 2023 | | | Rate | | Volume |
| Assets | Assets | | | | | | | | | | | | | | | | | | Assets | | | |
| AFS and HTM securities at amortized cost: | AFS and HTM securities at amortized cost: | | | | | | | | | | | | | | | | | | AFS and HTM securities at amortized cost: | | | |
| U.S. Treasury | U.S. Treasury | $ | 11,117 | | | $ | 9,890 | | | 1.07 | % | | 0.72 | % | | $ | 30 | | | $ | 18 | | | $ | 12 | | | $ | 10 | | | $ | 2 | |
| GSE | GSE | 335 | | | 1,120 | | | 2.86 | | | 2.13 | | | 2 | | | 6 | | | (4) | | | 2 | | | (6) | |
| Agency MBS | Agency MBS | 124,746 | | | 137,052 | | | 2.23 | | | 1.72 | | | 694 | | | 590 | | | 104 | | | 160 | | | (56) | |
| States and political subdivisions | States and political subdivisions | 425 | | | 374 | | | 4.07 | | | 3.72 | | | 4 | | | 3 | | | 1 | | | — | | | 1 | |
| Non-agency MBS | Non-agency MBS | 3,907 | | | 4,224 | | | 2.34 | | | 2.25 | | | 23 | | | 24 | | | (1) | | | 1 | | | (2) | |
| Other | Other | 21 | | | 27 | | | 5.30 | | | 2.04 | | | — | | | — | | | — | | | — | | | — | |
| | Total securities | Total securities | 140,551 | | | 152,687 | | | 2.14 | | | 1.68 | | | 753 | | | 641 | | | 112 | | | 173 | | | (61) | |
| Total securities | |
| Total securities | |
| Interest earning trading assets | Interest earning trading assets | 5,462 | | | 5,837 | | | 6.09 | | | 3.04 | | | 83 | | | 43 | | | 40 | | | 43 | | | (3) | |
Other earning assets(3) | Other earning assets(3) | 25,589 | | | 18,932 | | | 4.67 | | | 0.63 | | | 295 | | | 30 | | | 265 | | | 251 | | | 14 | |
| Loans and leases, net of unearned income: | Loans and leases, net of unearned income: | | | | | | | | | | | | | | | | |
| | Commercial and industrial | Commercial and industrial | 165,095 | | | 138,872 | | | 5.98 | | | 2.88 | | | 2,436 | | | 987 | | | 1,449 | | | 1,233 | | | 216 | |
| | Commercial and industrial | |
| | Commercial and industrial | |
| CRE | CRE | 22,689 | | | 23,555 | | | 6.32 | | | 2.84 | | | 355 | | | 168 | | | 187 | | | 193 | | | (6) | |
| Commercial Construction | Commercial Construction | 5,863 | | | 5,046 | | | 7.14 | | | 3.05 | | | 101 | | | 35 | | | 66 | | | 59 | | | 7 | |
| | | Residential mortgage | |
| | Residential mortgage | |
| | Residential mortgage | Residential mortgage | 56,422 | | | 47,976 | | | 3.73 | | | 3.57 | | | 526 | | | 428 | | | 98 | | | 20 | | | 78 | |
| Home equity | Home equity | 10,735 | | | 10,822 | | | 6.80 | | | 4.33 | | | 180 | | | 116 | | | 64 | | | 65 | | | (1) | |
| Indirect auto | Indirect auto | 27,743 | | | 26,088 | | | 5.82 | | | 5.56 | | | 398 | | | 357 | | | 41 | | | 17 | | | 24 | |
| Other consumer | Other consumer | 27,559 | | | 24,921 | | | 6.76 | | | 6.24 | | | 459 | | | 383 | | | 76 | | | 33 | | | 43 | |
| Student | Student | 5,129 | | | 6,648 | | | 7.04 | | | 3.86 | | | 89 | | | 63 | | | 26 | | | 43 | | | (17) | |
| Credit card | Credit card | 4,785 | | | 4,682 | | | 11.43 | | | 8.97 | | | 136 | | | 104 | | | 32 | | | 30 | | | 2 | |
| | Total loans and leases HFI | Total loans and leases HFI | 326,020 | | | 288,610 | | | 5.81 | | | 3.70 | | | 4,680 | | | 2,641 | | | 2,039 | | | 1,693 | | | 346 | |
| Total loans and leases HFI | |
| Total loans and leases HFI | |
| LHFS | LHFS | 1,527 | | | 3,874 | | | 6.71 | | | 2.87 | | | 25 | | | 28 | | | (3) | | | 21 | | | (24) | |
| Total loans and leases | Total loans and leases | 327,547 | | | 292,484 | | | 5.81 | | | 3.69 | | | 4,705 | | | 2,669 | | | 2,036 | | | 1,714 | | | 322 | |
| Total earning assets | Total earning assets | 499,149 | | | 469,940 | | | 4.72 | | | 2.90 | | | 5,836 | | | 3,383 | | | 2,453 | | | 2,181 | | | 272 | |
| Nonearning assets | Nonearning assets | 60,478 | | | 66,041 | | | | | | | | | | | | | | |
| Assets of discontinued operations | |
| Assets of discontinued operations | |
| Assets of discontinued operations | |
| Total assets | |
| Total assets | |
| Total assets | Total assets | $ | 559,627 | | | $ | 535,981 | | | | | | | | | | | | | | |
| Liabilities and Shareholders’ Equity | Liabilities and Shareholders’ Equity | | | | | | | | | | | | | | | | |
| Liabilities and Shareholders’ Equity | |
| Liabilities and Shareholders’ Equity | |
| Interest-bearing deposits: | Interest-bearing deposits: | | | | | | | | | | | | | | | | |
| Interest-bearing deposits: | |
| Interest-bearing deposits: | |
| Interest-checking | |
| Interest-checking | |
| Interest-checking | Interest-checking | $ | 108,886 | | | $ | 112,159 | | | 1.60 | | | 0.05 | | | 430 | | | 14 | | | 416 | | | 416 | | | — | |
| Money market and savings | Money market and savings | 139,802 | | | 141,500 | | | 1.38 | | | 0.03 | | | 476 | | | 11 | | | 465 | | | 465 | | | — | |
| Time deposits | Time deposits | 28,671 | | | 15,646 | | | 3.10 | | | 0.18 | | | 219 | | | 7 | | | 212 | | | 202 | | | 10 | |
| | Total interest-bearing deposits | |
| Total interest-bearing deposits | |
| Total interest-bearing deposits | Total interest-bearing deposits | 277,359 | | | 269,305 | | | 1.64 | | | 0.05 | | | 1,125 | | | 32 | | | 1,093 | | | 1,083 | | | 10 | |
| Short-term borrowings | Short-term borrowings | 24,056 | | | 6,944 | | | 4.69 | | | 0.60 | | | 278 | | | 10 | | | 268 | | | 197 | | | 71 | |
| Long-term debt | Long-term debt | 51,057 | | | 35,337 | | | 4.05 | | | 1.50 | | | 514 | | | 132 | | | 382 | | | 303 | | | 79 | |
| Total interest-bearing liabilities | Total interest-bearing liabilities | 352,472 | | | 311,586 | | | 2.20 | | | 0.22 | | | 1,917 | | | 174 | | | 1,743 | | | 1,583 | | | 160 | |
| Noninterest-bearing deposits | Noninterest-bearing deposits | 131,099 | | | 145,933 | | | | | | | | | | | | | | | | Noninterest-bearing deposits | 108,888 | | | 131,099 | | 131,099 | | | | | |
| Other liabilities | Other liabilities | 13,979 | | | 11,664 | | | | | | | | | | | | | | | | Other liabilities | 12,885 | | | 11,225 | | 11,225 | | | | | |
| Liabilities of discontinued operations | |
| Shareholders’ equity | |
| Shareholders’ equity | |
| Shareholders’ equity | Shareholders’ equity | 62,077 | | | 66,798 | | | | | | | | | | | | | | | | 59,011 | | | 62,077 | | 62,077 | | | | | |
| Total liabilities and shareholders’ equity | Total liabilities and shareholders’ equity | $ | 559,627 | | | $ | 535,981 | | | | | | | | | | | | | | | | Total liabilities and shareholders’ equity | $ | 531,002 | | | $ | | $ | 559,627 | | | | | |
| Average interest-rate spread | Average interest-rate spread | | | | | 2.52 | % | | 2.68 | % | | | | | | | | | | | Average interest-rate spread | | | | | 2.00 | % | | 2.53 | % | | |
| NIM/net interest income - taxable equivalent | NIM/net interest income - taxable equivalent | | | | | 3.17 | % | | 2.76 | % | | $ | 3,919 | | | $ | 3,209 | | | $ | 710 | | | $ | 598 | | | $ | 112 | |
| Taxable-equivalent adjustment | Taxable-equivalent adjustment | | | | | | | | | $ | 51 | | | $ | 26 | | | | | | | | Taxable-equivalent adjustment | | | | | | | | | $ | 53 | | | $ | | $ | 51 | | | | | |
| Memo: Total deposits | Memo: Total deposits | $ | 408,458 | | | $ | 415,238 | | | 1.12 | % | | 0.03 | % | | $ | 1,125 | | | $ | 32 | | | $ | 1,093 | | |
(1)Represents daily average balances. Excludes basis adjustments for fair value hedges.
(2)Yields are stated on a TE basis utilizing federal tax rate. The change in interest not solely due to changes in rate or volume has been allocated based on the pro-rata absolute dollar amount of each. Interest income includes certain fees, deferred costs, and dividends.
(3)Includes cash equivalents, interest-bearing deposits with banks, FHLB stock, and other earning assets.
Truist Financial Corporation 4349
Provision for Credit Losses
The provision for credit losses was $502$500 million compared to a benefit of $95$502 million for the first quarter of 2022. 2023.
•The net charge-off ratiocurrent quarter provision expense was 37 basis points, up 12 basis pointsrelatively flat compared to the first quarter of 2022.
•The increase in the current quarter provision expense primarily reflects increased economic uncertainty in the current period, whereas the earlier quarter included a reserve release due to the improving credit environment during that period.2023.
•The net charge-off ratio was up compared to the first quarter of 20222023 driven by higher net charge-offs in the CRE, other consumer, credit card, and indirect auto and other consumer portfolios due to normalizing trends, as well as an increase in the commercial and industrial portfolio.portfolios.
Refer to “Note 5. Loans and ACL” for additional discussion of the ACL.
Noninterest Income
Noninterest income is a significant contributor to Truist’s financial results. Management focuses on diversifying its sources of revenue to reduce Truist’s reliance on traditional spread-based interest income, as certain fee-based activities are a relatively stable revenue source during periods of changing interest rates. The following table provides a breakdown of Truist’s noninterest income: | | Table 2: Noninterest Income | Table 2: Noninterest Income | |
| | Three Months Ended March 31, | |
| Table 2: Noninterest Income | |
| Table 2: Noninterest Income | |
| Three Months Ended March 31, | |
| Three Months Ended March 31, | |
| Three Months Ended March 31, | |
| (Dollars in millions) | (Dollars in millions) | | 2023 | | 2022 | | | % Change | |
| Insurance income | | $ | 813 | | | $ | 727 | | | | 11.8 | % | |
| (Dollars in millions) | |
| (Dollars in millions) | |
| Wealth management income | |
| Wealth management income | |
| Wealth management income | Wealth management income | | 339 | | | 343 | | | | (1.2) | | |
| Investment banking and trading income | Investment banking and trading income | | 261 | | | 261 | | | | — | | |
| Investment banking and trading income | |
| Investment banking and trading income | |
| Card and payment related fees | |
| Card and payment related fees | |
| Card and payment related fees | |
| Service charges on deposits | Service charges on deposits | | 249 | | | 252 | | | | (1.2) | | |
| Card and payment related fees | | 230 | | | 212 | | | | 8.5 | | |
| Service charges on deposits | |
| Service charges on deposits | |
| Mortgage banking income | |
| Mortgage banking income | |
| Mortgage banking income | Mortgage banking income | | 142 | | | 121 | | | | 17.4 | | |
| Lending related fees | Lending related fees | | 106 | | | 85 | | | | 24.7 | | |
| Lending related fees | |
| Lending related fees | |
| Operating lease income | Operating lease income | | 67 | | | 58 | | | | 15.5 | | |
| Securities gains (losses) | | — | | | (69) | | | | NM | |
| Operating lease income | |
| Operating lease income | |
| | Other income | Other income | | 27 | | | 152 | | | | (82.2) | | |
| | Other income | |
| | Other income | |
| Total noninterest income | |
| Total noninterest income | |
| Total noninterest income | Total noninterest income | | $ | 2,234 | | | $ | 2,142 | | | | 4.3 | | |
|
Noninterest income was up $92$25 million, or 4.3%1.8%, compared to the first quarter of 20222023 due to 12% growth in insurancehigher investment banking and trading income and higher mortgage bankingother income, higher fees from lending-related activities and card and payment related activities. These items were partially offset by lower other income. The first quarter of 2022 included $69 million of securities lossesmortgage banking income and a $74 million gainservice charges on the redemption of noncontrolling equity interest (included in other income).deposits.
•Insurance income increased primarily due to acquisitionsInvestment banking and 4.7% organic growth.
•Mortgage bankingtrading income increased due to a gain on the sale of a servicing portfolio, partially offset by mortgage servicing rights valuation adjustments in the current quarter.
•Lending relatedhigher merger and acquisition fees increased primarily due toand higher unused commitmentequity and bond origination fees.
•Card and payment related fees increased due to higher volumes and the acquisition of a merchant portfolio.
•Other income decreasedincreased due to the aforementioned gain in the year ago quarter, lower investment income from the Company’s SBIC and other investments, partially offset by higher income from investments held for certain post-retirement benefits (which is primarily offset by higher personnel expense)., partially offset by lower income from certain equity investments.
•Mortgage banking income decreased due to a gain on the sale of a servicing portfolio in the prior year, partially offset by mortgage servicing rights valuation adjustments in the prior year.
•Service charges on deposits decreased primarily due to reduced overdraft fees as a result of continued growth of Truist One Banking.
44 Truist Financial Corporation
Noninterest Expense
The following table provides a breakdown of Truist’s noninterest expense: | Table 3: Noninterest Expense | | Three Months Ended March 31, | |
| Table 3: Noninterest Expense | |
| Table 3: Noninterest Expense | |
| | | | | Three Months Ended March 31, | |
| | | | | Three Months Ended March 31, | |
| | | | | Three Months Ended March 31, | |
| (Dollars in millions) | |
| (Dollars in millions) | |
| (Dollars in millions) | (Dollars in millions) | 2023 | | 2022 | | % Change | |
| Personnel expense | Personnel expense | $ | 2,181 | | | $ | 2,051 | | | 6.3 | % | |
| Personnel expense | |
| Personnel expense | |
| Professional fees and outside processing | |
| Professional fees and outside processing | |
| Professional fees and outside processing | Professional fees and outside processing | 314 | | | 363 | | | (13.5) | | |
| Software expense | Software expense | 214 | | | 232 | | | (7.8) | | |
| Software expense | |
| Software expense | |
| Net occupancy expense | |
| Net occupancy expense | |
| Net occupancy expense | Net occupancy expense | 183 | | | 208 | | | (12.0) | | |
| Amortization of intangibles | Amortization of intangibles | 136 | | | 137 | | | (0.7) | | |
| Amortization of intangibles | |
| Amortization of intangibles | |
| Equipment expense | |
| Equipment expense | |
| Equipment expense | Equipment expense | 110 | | | 118 | | | (6.8) | | |
| Marketing and customer development | Marketing and customer development | 78 | | | 84 | | | (7.1) | | |
| Marketing and customer development | |
| Marketing and customer development | |
| Operating lease depreciation | |
| Operating lease depreciation | |
| Operating lease depreciation | Operating lease depreciation | 46 | | | 48 | | | (4.2) | | |
| Regulatory costs | Regulatory costs | 75 | | | 35 | | | 114.3 | | |
| Merger-related and restructuring charges | 63 | | | 216 | | | (70.8) | | |
| Regulatory costs | |
| Regulatory costs | |
| Restructuring charges | |
| Restructuring charges | |
| Restructuring charges | |
| | Other expense | Other expense | 291 | | | 182 | | | 59.9 | | |
| | Other expense | |
| | Other expense | |
| Total noninterest expense | |
| Total noninterest expense | |
| Total noninterest expense | Total noninterest expense | $ | 3,691 | | | $ | 3,674 | | | 0.5 | | |
|
50 Truist Financial Corporation
Noninterest expense was up $17down $62 million, or 0.5%2.1%, compared to the first quarter of 20222023 due to higher personnel expense,lower other expense and regulatory costs. These increases werepersonnel expense, partially offset by lower merger-related and restructuring charges and professional fees and outside processing expenses. Merger-related and restructuring charges and incremental operating expenses related to the merger decreased $153 million and $202 million, respectively, due to the completionFDIC special assessment (regulatory costs) of integration-related activities.$75 million. Adjusted noninterest expenses, which exclude merger-related coststhe FDIC special assessment, restructuring charges, and the amortization of intangibles, increased $373decreased $120 million, or 12%.4.2%, compared to the earlier quarter.
•Other expense decreased primarily due to lower pension expense and operating losses.
•Personnel expense increaseddecreased due to investments in teammateslower headcount, partially offset by increasing Truist’s minimum wage, the impact from acquisitions, investments in revenue producing businesses and enterprise technology, and higher other post-retirement benefit expense (which is almost entirely offset by higher other income), partially offset by lower pension expenses.
•Other expense increased primarily due to higher pension expense (driven primarily by lower plan assets) and higher operating losses.
•Regulatory costs increased primarily due to an increase in the FDIC’s deposit insurance assessment rate.
•Professional fees and outside processing expenses decreased due to lower project spend for merger-related activities, partially offset by enterprise technology investments..
Merger-Related and Restructuring Charges
The following table presents a summary of merger-related and restructuring charges and the related accruals. The 2023 merger-related and2024 restructuring costs primarilypredominately reflect charges as a result of the restructuring activities,various initiatives, including costs for severance and other benefits and costs related to exiting facilities, and other restructuring initiatives.facilities. | | Table 4: Merger-Related and Restructuring Accrual Activity | | Table 4: Restructuring Accrual Activity | |
| | Table 4: Restructuring Accrual Activity | |
| | Table 4: Restructuring Accrual Activity | |
| | (Dollars in millions) | (Dollars in millions) | Accrual at Jan 1, 2023 | | Expense | | Utilized | | Accrual at Mar 31, 2023 | |
| (Dollars in millions) | |
| (Dollars in millions) | |
| Severance and personnel-related | |
| Severance and personnel-related | |
| Severance and personnel-related | Severance and personnel-related | $ | 9 | | | $ | 39 | | | $ | (31) | | | $ | 17 | | |
| Occupancy and equipment | Occupancy and equipment | — | | | 19 | | | (19) | | | — | | |
| Professional services | 12 | | | 1 | | | (12) | | | 1 | | |
| Occupancy and equipment | |
| Occupancy and equipment | |
| | Other | 5 | | | 4 | | | (5) | | | 4 | | |
| | Total | Total | $ | 26 | | | $ | 63 | | | $ | (67) | | | $ | 22 | | |
| | | Total | |
| | Total | |
|
Provision for Income Taxes
The
For the three months ended March 31, 2024 and 2023, the provision for income taxes from continuing operations was $394$232 million for the first quarterand $361 million, respectively, representing effective tax rates of 2023, compared to $330 million for the earlier quarter.17.0% and 20.4%, respectively. The effective tax rate for the first quarter of 2023 was 20.6%, compared to 18.9% for the earlier quarter.
•The effective tax rate increased2024 decreased compared to the first quarter of 20222023 primarily driven by higher income before taxes, discrete tax expense recognizeddue to a decrease in the current quarter compared to discrete tax benefits recognized in the prior quarter, and the adoption of the Investments in Tax Credit Structures accounting standard related to the proportional amortization of tax credit investments in the current quarter. This guidance resulted in an increase in other income and an increase in tax expense of $17 million for the first quarter of 2023 with no impact to net income. The guidance was adopted prospectively and had no impact on prior periods results. Refer to “Note 1. Basis of Presentation” for additional information on the adoption of this guidance.full year forecasted pre-tax earnings.
Truist Financial Corporation 45
Segment Results
Truist operates and measures business activity across threetwo segments: Consumer BankingCSBB and Wealth, Corporate and Commercial Banking, and Insurance Holdings,WB, with functional activities included in Other, Treasury, and Corporate.OT&C. The Company’s business segment structure is based on the manner in which financial information is evaluated by management as well as the products and services provided or the type of client served. During
Effective January 1, 2024, several business activities were realigned reflecting updates to the first quarter of 2023, Truist reorganized Prime Rate Premium Finance Corporation, which includes AFCO Credit CorporationCompany’s operating structure. First, the CB&W segment was renamed CSBB and CAFO Holding Company, into the C&CB segment was renamed WB. Second, the Wealth business was realigned into the WB segment from the CSBB segment, representing a separate reporting unit in that segment. Third, the small business banking client segmentation was realigned into the CSBB segment from the WB segment.
On February 20, 2024, the Company entered into an agreement to sell the remaining stake of the common equity in TIH to an investor group, representing substantially all of the Company’s IH segment, which represented a material strategic shift for the Company, and as a result, the Company recast results for all periods presented under the discontinued operations basis of presentation. On May 6, 2024, the Company completed the sale of its remaining equity interests in TIH. TIH was the principal legal entity of the IH segment. Prior period results have been revisedAs the operations of TIH are now included in discontinued operations, the Company no longer presents the IH segment as one of its reportable segments. Refer to conform to the current presentation.
See “Note 18. Operating Segments” herein and “Note 21. Operating Segments” in Truist’s Annual Report on Form 10-K for the year ended December 31, 20222. Discontinued Operations” for additional disclosuresinformation related to Truist’s reportable business segments, including additional details related to results ofdiscontinued operations. Fluctuations in noninterest income and noninterest expense are more fully discussed in the Noninterest Income and Noninterest Expense sections above. | | | | | | | | | | | | | | | | | | | | | | | | | | | | | | | | | | | | | | | | | |
| Table 5: Net Income by Reportable Segment |
| | Three Months Ended March 31, | | | | | | | | | | |
| (Dollars in millions) | 2023 | | 2022 | | | | % Change | | | | | | | | | | | | | | | | | | | | | | |
| Consumer Banking and Wealth | $ | 1,044 | | | $ | 861 | | | | | 21.3 | % | | | | | | | | | | | | | | | | | | | | | | |
| Corporate and Commercial Banking | 1,034 | | | 1,023 | | | | | 1.1 | | | | | | | | | | | | | | | | | | | | | | | |
| Insurance Holdings | 111 | | | 143 | | | | | (22.4) | | | | | | | | | | | | | | | | | | | | | | | |
| Other, Treasury & Corporate | (674) | | | (611) | | | | | (10.3) | | | | | | | | | | | | | | | | | | | | | | | |
| Truist Financial Corporation | $ | 1,515 | | | $ | 1,416 | | | | | 7.0 | | | | | | | | | | | | | | | | | | | | | | | |
| | | | | | | | | | | | | | | | | | | | | | | | | | | | | | | | | | | | | | | | | |
| Table 5: Net Income from Continuing Operations by Reportable Segment |
| | | | | | | | | | | | | | Three Months Ended March 31, | | | | | | % Change |
| (Dollars in millions) | | | | | | | | | | | | | | | | | 2024 | | 2023 | | | | | | | | 2024 vs. 2023 | | |
| Consumer and Small Business Banking | | | | | | | | | | | | | | | | | $ | 880 | | | $ | 1,023 | | | | | | | | | (14.0) | % | | |
| Wholesale Banking | | | | | | | | | | | | | | | | | 876 | | | 987 | | | | | | | | | (11.2) | | | |
| Other, Treasury & Corporate | | | | | | | | | | | | | | | | | (623) | | | (600) | | | | | | | | | 3.8 | | | |
| Truist Financial Corporation | | | | | | | | | | | | | | | | | $ | 1,133 | | | $ | 1,410 | | | | | | | | | (19.6) | | | |
Consumer Banking and WealthSmall Business Banking
CB&WCSBB net income was $1.0 billion$880 million for the first quarter of 2023, an increase2024, a decrease of $183$143 million compared to the first quarter of 2022.2023.
•Segment net interest income increased $556decreased $87 million primarily driven by favorable funding credit on deposits attributable to the higher rate environmentlower deposit and higher average loan balances, partially offset by higher funding costs, lower averagecredit on deposits and lower purchase accounting accretion.one extra day in the current period.
Truist Financial Corporation 51
•The provision for credit losses increased $200$33 million reflecting increased economic uncertainty in the current quarter as well as higher charge offs in the other consumer and indirect auto portfolios, partially offset by an allowance release in the current quarter and other consumer portfolios and a reserve releasean allowance build in the earlier quarter.
•Noninterest income decreased $37 million compared to earlier quarter primarily due to a gain on the redemption of noncontrolling equity interest in the earlier quarter, partially offset by higher mortgage banking income in the current quarter.
•Noninterest expense increased $84 million compared to the earlier quarter primarily driven primarily by higher corporate technology, risk, and operations support expenses along with increased salaries expense, partially offset by lower marketing and customer development and incentives expense.
CB&W average loans and leases held for investment increased $11.2 billion, or 8.5%, for the first quarter of 2023 compared to the first quarter of 2022, primarily driven by an increase in residential mortgage balances due to slower run-off and increased correspondent production, along with increased Service Finance and Dealer Finance loans, partially offset by lower Student and Partnership loans.
Average total deposits decreased $14.4 billion, or 5.7%, for the first quarter of 2023 compared to the first quarter of 2022, primarily driven by decreases in interest bearing checking, money market and savings, and noninterest bearing deposits.
Corporate and Commercial Banking
C&CB net income was $1.0 billion for the first quarter of 2023, an increase of $11 million compared to the first quarter of 2022.
•Segment net interest income increased $463 million primarily due to higher funding credit on deposits and higher average loan balances, partially offset by lower purchase accounting accretion and lower PPP revenue.
•The provision for credit losses increased $382 million which reflects an increase in reserves driven by increased economic uncertainty and loan growth in the current quarter as well as an allowance release in the earlier quarter.
•Noninterest income decreased $26$50 million compared to the earlier quarter primarily due to lower investment income from the Company’s SBIC and other investments, lower structured real estate fees, and commercialresidential mortgage income partially offset by increases in lending related fees, core trading revenues, and merger and acquisition fees.decreased service charges on deposits.
•Noninterest expense increased $55$11 million compared to the earlier quarter driven by higher operations support expenses, corporate technology costs and the FDIC special assessment, partially offset by lower salaries expense and operating charge-offs.
CSBB average loans and leases held for investment decreased $12.6 billion, or 9.2%, for the first quarter of 2024 compared to the first quarter of 2023, primarily driven by a decrease in indirect auto balances, the sale of the student loan portfolio at the end of the second quarter of 2023, and decreases in residential mortgage as well as decreases in small business loans, partially offset by increases in the outdoor power sports, equipment, and home improvement balances.
CSBB average total deposits decreased $7.3 billion, or 3.3%, for the first quarter of 2024 compared to the first quarter of 2023, primarily driven by decreases in interest checking, noninterest-bearing deposits, and money market and savings, partially offset by an increase in time deposits.
Wholesale Banking
WB net income was $876 million for the first quarter of 2024, a decrease of $111 million compared to the first quarter of 2023.
•Segment net interest income decreased $153 million primarily due to lower deposit and loan balances combined with higher cost of deposits, partially offset by favorable loan spreads.
•The provision for credit losses decreased $37 million which reflects a lower allowance build in the current quarter compared to the earlier quarter, partially offset by higher commercial and industrial loan charge offs.
•Noninterest income increased $25 million compared to the earlier quarter primarily due to higher income from merger and acquisition activity and higher equity and bond origination fees, partially offset by lower income from strategic investments and commercial mortgage lending.
•Noninterest expense increased $75 million compared to the earlier quarter primarily due to the FDIC special assessment as well as higher corporate technology costs and operations support expenses, partially offset by lower personnel expenses, and merger-relatedexpense and restructuring charges.
46 Truist Financial Corporation
C&CBWB average loans held for investment increased $26.7decreased $4.9 billion, or 17%2.6%, for the first quarter of 20232024 compared to the first quarter of 2022,2023, primarily due to increasesdecreases in commercial and industrial loans, partially offset by decreases in average PPP loans (commercial and industrial) and average commercial real estate.loans.
AverageWB average total deposits decreased $11.4$17.7 billion, or 7.5%11%, for the first quarter of 20232024 compared to the first quarter of 2022,2023, primarily due to declines in average noninterest bearingnoninterest-bearing deposits, partially offset by increases in money market and savings.
Insurance Holdings
IH net income was $111 million for the first quarter of 2023, a decrease of $32 million compared to the first quarter of 2022.
•Segment netsavings, and interest income increased $11 million driven primarily by favorable funding credits.
•Noninterest income increased $84 million primarily due to continued organic growth and acquisitions.
•Noninterest expense increased $138 million primarily due to the impact of acquisitions, investments in new hires and teammates, performance-driven incentive expense, and higher operational loss reserves.checking.
Other, Treasury & Corporate
OT&C generated a net loss of $674$623 million in the first quarter of 2023,2024, compared to a net loss of $611$600 million in the first quarter of 2022.2023.
•NetSegment net interest income decreased $345$255 million primarily due to higher funding credit on deposits to other segments and higher rates on Treasury funding, partially offset by higher funding charges primarily on loans to other segments from the higher rate environment.
•The provision for credit losses increased $15 million due to increased economic uncertainty in the current quarter.segments.
•Noninterest income increased $71$50 million primarily due to losses on the sale of securities in the earlier quarter.higher income from investments held for certain post-retirement benefits (which is more than offset by higher personnel expense).
•Noninterest expense decreased $260$148 million compared to the earlier quarter primarily due to a decrease in incremental operatingcredit from other segments for operations support expenses related to the merger,and corporate technology project support, partially offset by an increase in professional fees and outside processing, salaries, and regulatory costs.higher other post-retirement benefit expense (which is almost entirely offset by higher other income).
Truist Financial Corporation 47
Analysis of Financial Condition
Investment Activities
The securities portfolio totaled $128.8$119.4 billion at March 31, 2023,2024, compared to $129.5$121.5 billion at December 31, 2022.2023. U.S. Treasury, GSE, and Agency MBS represents 97% of the total securities portfolio as of March 31, 20232024 and December 31, 2022.2023. While the overwhelming majority of the portfolio remains in agency MBS securities, the Company also holds AAA rated non-agency MBS as the risk adjusted returns for these securities are more attractive than agency MBS.
52 Truist Financial Corporation
•The decrease in 2024 includes paydowns and maturities of $2.1$4.7 billion as well as a decrease in the fair value of AFS securities, partially offset by unrealized gains of $1.1$3.8 billion during the quarter.in purchases.
•As of March 31, 2023, 41%2024, 40% of the investment securities portfolio was classified as held-to-maturity based on amortized cost.cost, excluding portfolio level basis adjustments.
•As of March 31, 2023 and December 31, 2022,2024, approximately 5.6% of the securities portfolio was variable rate, excluding the impact of swaps.swaps, compared to 5.7% as of December 31, 2023.
•The effective duration of the AFS securities portfolio was 6.76.0 years at March 31, 20232024 and 6.1 years at December 31, 2022.2023, excluding the impact of swaps, or 3.9 years at March 31, 2024 and 4.0 years at December 31, 2023, including the impact of swaps. The effective duration of the HTM securities portfolio was 7.1 years at March 31, 2024 and 7.3 years at December 31, 2023.
Lending Activities
The following table presents the composition of average loans and leases: | | Table 6: Average Loans and Leases | Table 6: Average Loans and Leases | Table 6: Average Loans and Leases |
For the Three Months Ended (Dollars in millions) | | Mar 31, 2023 | | Dec 31, 2022 | | Sep 30, 2022 | | Jun 30, 2022 | | Mar 31, 2022 |
| | Three Months Ended | | | | Three Months Ended |
| (Dollars in millions) | | (Dollars in millions) | | Mar 31, 2024 | | Dec 31, 2023 | | Sep 30, 2023 | | Jun 30, 2023 | | Mar 31, 2023 |
| Commercial: | Commercial: | |
| Commercial and industrial | |
| Commercial and industrial | |
| Commercial and industrial | Commercial and industrial | | $ | 165,095 | | | $ | 159,308 | | | $ | 152,123 | | | $ | 145,558 | | | $ | 138,872 | |
| CRE | CRE | | 22,689 | | | 22,497 | | | 22,245 | | | 22,508 | | | 23,555 | |
| Commercial construction | Commercial construction | | 5,863 | | | 5,711 | | | 5,284 | | | 5,256 | | | 5,046 | |
| | Consumer: | Consumer: | |
| Consumer: | |
| Consumer: | |
| Residential mortgage | |
| Residential mortgage | |
| Residential mortgage | Residential mortgage | | 56,422 | | | 56,292 | | | 53,271 | | | 49,237 | | | 47,976 | |
| Home equity | Home equity | | 10,735 | | | 10,887 | | | 10,767 | | | 10,677 | | | 10,822 | |
| Indirect auto | Indirect auto | | 27,743 | | | 28,117 | | | 28,057 | | | 26,496 | | | 26,088 | |
| Other consumer | Other consumer | | 27,559 | | | 27,479 | | | 26,927 | | | 25,918 | | | 24,921 | |
| Student | Student | | 5,129 | | | 5,533 | | | 5,958 | | | 6,331 | | | 6,648 | |
| Credit card | Credit card | | 4,785 | | | 4,842 | | | 4,755 | | | 4,728 | | | 4,682 | |
| | Total average loans and leases HFI | Total average loans and leases HFI | | $ | 326,020 | | | $ | 320,666 | | | $ | 309,387 | | | $ | 296,709 | | | $ | 288,610 | |
| Total average loans and leases HFI | |
| Total average loans and leases HFI | |
Average loans increased $5.4held for investment decreased $4.1 billion, or 1.7%1.3%, compared to the prior quarter primarily due to momentum from the prior quarter within the commercial portfolio and the impact of the BankDirect acquisition. Loan growth moderated during the quarter as production in lower return portfolios was reduced with end of period loans up 0.5% compared to December 31, 2022.quarter.
•Average commercial loans increased 3.3%decreased 0.9% due to broad-based growth withina decline in the commercial and industrial portfolio and the BankDirect acquisition. The BankDirect acquisition contributed approximately $900 million of average loan growth compared to the fourth quarter of 2022.portfolio.
•Average consumer loans decreased 0.6%2.0% due to runoff in student loans and partnership lending, as well as lower indirect auto production.declines across all portfolios.
At March 31, 20232024 and December 31, 2022,2023, 54% and 53%, respectively, of loans and leases HFI were variable rate.
48 Truist Financial Corporation 53
Asset Quality
The following tables summarize asset quality information:
| | Table 7: Asset Quality | Table 7: Asset Quality | |
| Table 7: Asset Quality | |
| Table 7: Asset Quality | |
| (Dollars in millions) | |
| (Dollars in millions) | |
| (Dollars in millions) | (Dollars in millions) | Mar 31, 2023 | | Dec 31, 2022 | | Sep 30, 2022 | | Jun 30, 2022 | | Mar 31, 2022 | |
| NPAs: | NPAs: | | |
| NPAs: | |
| NPAs: | |
| NPLs: | |
| NPLs: | |
| NPLs: | NPLs: | | |
| Commercial and industrial | Commercial and industrial | $ | 394 | | | $ | 398 | | | $ | 443 | | | $ | 393 | | | $ | 330 | | |
| Commercial and industrial | |
| Commercial and industrial | |
| CRE | CRE | 117 | | | 82 | | | 5 | | | 19 | | | 27 | | |
| CRE | |
| CRE | |
| Commercial construction | |
| Commercial construction | |
| Commercial construction | Commercial construction | 1 | | | — | | | — | | | — | | | — | | |
| | Residential mortgage | Residential mortgage | 233 | | | 240 | | | 227 | | | 269 | | | 315 | | |
| | Residential mortgage | |
| | Residential mortgage | |
| Home equity | |
| Home equity | |
| Home equity | Home equity | 132 | | | 135 | | | 132 | | | 133 | | | 122 | | |
| Indirect auto | Indirect auto | 270 | | | 289 | | | 260 | | | 244 | | | 227 | | |
| Indirect auto | |
| Indirect auto | |
| Other consumer | |
| Other consumer | |
| Other consumer | Other consumer | 45 | | | 44 | | | 39 | | | 32 | | | 23 | | |
| | Total NPLs HFI | Total NPLs HFI | 1,192 | | | 1,188 | | | 1,106 | | | 1,090 | | | 1,044 | | |
| | Total NPLs HFI | |
| | Total NPLs HFI | |
| Loans held for sale | |
| Loans held for sale | |
| Loans held for sale | Loans held for sale | — | | | — | | | 72 | | | 33 | | | 39 | | |
| Total nonaccrual loans and leases | Total nonaccrual loans and leases | 1,192 | | | 1,188 | | | 1,178 | | | 1,123 | | | 1,083 | | |
| Total nonaccrual loans and leases | |
| Total nonaccrual loans and leases | |
| Foreclosed real estate | |
| Foreclosed real estate | |
| Foreclosed real estate | Foreclosed real estate | 3 | | | 4 | | | 4 | | | 3 | | | 3 | | |
| Other foreclosed property | Other foreclosed property | 66 | | | 58 | | | 58 | | | 47 | | | 49 | | |
| Other foreclosed property | |
| Other foreclosed property | |
| Total nonperforming assets | |
| Total nonperforming assets | |
| Total nonperforming assets | Total nonperforming assets | $ | 1,261 | | | $ | 1,250 | | | $ | 1,240 | | | $ | 1,173 | | | $ | 1,135 | | |
| | Loans 90 days or more past due and still accruing: | Loans 90 days or more past due and still accruing: | | |
| | Loans 90 days or more past due and still accruing: | |
| | Loans 90 days or more past due and still accruing: | |
| Commercial and industrial | Commercial and industrial | $ | 35 | | | $ | 49 | | | $ | 44 | | | $ | 27 | | | $ | 22 | | |
| CRE | — | | | 1 | | | 1 | | | 3 | | | — | | |
| Commercial and industrial | |
| Commercial and industrial | |
| | Commercial construction | Commercial construction | — | | | — | | | — | | | 3 | | | — | | |
| | Residential mortgage - government guaranteed | 649 | | | 759 | | | 808 | | | 884 | | | 996 | | |
| Residential mortgage - nonguaranteed | 25 | | | 27 | | | 26 | | | 27 | | | 31 | | |
| Commercial construction | |
| | Commercial construction | |
| | Residential mortgage – government guaranteed | |
| | Residential mortgage – government guaranteed | |
| | Residential mortgage – government guaranteed | |
| Residential mortgage – nonguaranteed | |
| Residential mortgage – nonguaranteed | |
| Residential mortgage – nonguaranteed | |
| Home equity | |
| Home equity | |
| Home equity | Home equity | 10 | | | 12 | | | 9 | | | 8 | | | 9 | | |
| Indirect auto | Indirect auto | — | | | 1 | | | 1 | | | 1 | | | 1 | | |
| Indirect auto | |
| Indirect auto | |
| Other consumer | Other consumer | 10 | | | 13 | | | 9 | | | 5 | | | 5 | | |
| Student - government guaranteed | 590 | | | 702 | | | 770 | | | 796 | | | 818 | | |
| Student - nonguaranteed | 4 | | | 4 | | | 5 | | | 5 | | | 4 | | |
| Other consumer | |
| Other consumer | |
| Student – government guaranteed | |
| Student – government guaranteed | |
| Student – government guaranteed | |
| Student – nonguaranteed | |
| Student – nonguaranteed | |
| Student – nonguaranteed | |
| Credit card | |
| Credit card | |
| Credit card | Credit card | 38 | | | 37 | | | 36 | | | 28 | | | 28 | | |
| | Total loans 90 days or more past due and still accruing | Total loans 90 days or more past due and still accruing | $ | 1,361 | | | $ | 1,605 | | | $ | 1,709 | | | $ | 1,787 | | | $ | 1,914 | | |
| | Total loans 90 days or more past due and still accruing | |
| | Total loans 90 days or more past due and still accruing | |
| Loans 30-89 days past due and still accruing: | |
| Loans 30-89 days past due and still accruing: | |
| Loans 30-89 days past due and still accruing: | Loans 30-89 days past due and still accruing: | | |
| Commercial and industrial | Commercial and industrial | $ | 125 | | | $ | 256 | | | $ | 162 | | | $ | 223 | | | $ | 280 | | |
| Commercial and industrial | |
| Commercial and industrial | |
| CRE | |
| CRE | |
| CRE | CRE | 34 | | | 25 | | | 15 | | | 10 | | | 13 | | |
| Commercial construction | Commercial construction | 3 | | | 5 | | | 3 | | | 4 | | | 1 | | |
| Commercial construction | |
| Commercial construction | |
| | Residential mortgage - government guaranteed | 232 | | | 268 | | | 234 | | | 233 | | | 216 | | |
| Residential mortgage - nonguaranteed | 259 | | | 346 | | | 300 | | | 302 | | | 326 | | |
| Residential mortgage – government guaranteed | |
| | Residential mortgage – government guaranteed | |
| | Residential mortgage – government guaranteed | |
| Residential mortgage – nonguaranteed | |
| Residential mortgage – nonguaranteed | |
| Residential mortgage – nonguaranteed | |
| Home equity | |
| Home equity | |
| Home equity | Home equity | 65 | | | 68 | | | 67 | | | 68 | | | 80 | | |
| Indirect auto | Indirect auto | 511 | | | 646 | | | 591 | | | 584 | | | 529 | | |
| Indirect auto | |
| Indirect auto | |
| Other consumer | Other consumer | 164 | | | 187 | | | 152 | | | 166 | | | 127 | | |
| Student - government guaranteed | 350 | | | 396 | | | 375 | | | 447 | | | 476 | | |
| Student - nonguaranteed | 6 | | | 6 | | | 6 | | | 6 | | | 6 | | |
| Other consumer | |
| Other consumer | |
| Student – government guaranteed | |
| Student – government guaranteed | |
| Student – government guaranteed | |
| Student – nonguaranteed | |
| Student – nonguaranteed | |
| Student – nonguaranteed | |
| Credit card | |
| Credit card | |
| Credit card | Credit card | 56 | | | 64 | | | 52 | | | 48 | | | 47 | | |
| | Total loans 30-89 days past due and still accruing | Total loans 30-89 days past due and still accruing | $ | 1,805 | | | $ | 2,267 | | | $ | 1,957 | | | $ | 2,091 | | | $ | 2,101 | | |
| | Total loans 30-89 days past due and still accruing | |
| | Total loans 30-89 days past due and still accruing | |
Nonperforming assets totaled $1.3$1.5 billion at March 31, 2023, relatively stable2024, down slightly compared to December 31, 2022.2023, due to declines in LHFS and the CRE and indirect auto portfolios, partially offset by an increase in the commercial and industrial portfolio. Nonperforming loans and leases held for investment were 0.36%0.45% of loans and leases held for investment at March 31, 2023, unchanged2024, up one basis point compared to December 31, 2022.2023.
Loans 90 days or more past due and still accruing totaled $1.4 billion$538 million at March 31, 2023, down $244 million, or seven2024, up one basis pointspoint as a percentage of loans and leases compared with the prior quarter primarily due to declines in government guaranteed student loans and government guaranteed residential mortgages.quarter. Excluding government guaranteed loans, the ratio of loans 90 days or more past due and still accruing as a percentage of loans and leases was 0.04% at March 31, 2023, flat2024, unchanged from December 31, 2022.2023.
Loans 30-89 days past due and still accruing of $1.8$1.7 billion at March 31, 20232024 were down $462$255 million, or 15seven basis points as a percentage of loans and leases, compared to the prior quarter primarily due to a seasonal decreasedecreases in the consumer portfolios coupled with a decline in theindirect auto, commercial and industrial, portfolio.and other consumer portfolios.
54 Truist Financial Corporation 49
Problem loans include NPLs and loans that are 90 days or more past due and still accruing as disclosed in Table 7. In addition, for the commercial portfolio segment, loans that are rated special mention or substandard performing are closely monitored by management as potential problem loans. Refer to “Note 5. Loans and ACL” for the amortized cost basis of loans by origination year and credit quality indicator as well as additional disclosures related to NPLs. | | Table 8: Asset Quality Ratios | Table 8: Asset Quality Ratios | |
| Mar 31, 2023 | | Dec 31, 2022 | | Sep 30, 2022 | | Jun 30, 2022 | | Mar 31, 2022 | |
| Table 8: Asset Quality Ratios | |
| Table 8: Asset Quality Ratios | |
| Mar 31, 2024 | |
| Mar 31, 2024 | |
| Mar 31, 2024 | |
| Loans 30-89 days past due and still accruing as a percentage of loans and leases HFI | |
| Loans 30-89 days past due and still accruing as a percentage of loans and leases HFI | |
| Loans 30-89 days past due and still accruing as a percentage of loans and leases HFI | Loans 30-89 days past due and still accruing as a percentage of loans and leases HFI | 0.55 | % | | 0.70 | % | | 0.62 | % | | 0.69 | % | | 0.72 | % | |
| Loans 90 days or more past due and still accruing as a percentage of loans and leases HFI | Loans 90 days or more past due and still accruing as a percentage of loans and leases HFI | 0.42 | | | 0.49 | | | 0.54 | | | 0.59 | | | 0.66 | | |
| Loans 90 days or more past due and still accruing as a percentage of loans and leases HFI | |
| Loans 90 days or more past due and still accruing as a percentage of loans and leases HFI | |
| NPLs as a percentage of loans and leases HFI | |
| NPLs as a percentage of loans and leases HFI | |
| NPLs as a percentage of loans and leases HFI | NPLs as a percentage of loans and leases HFI | 0.36 | | | 0.36 | | | 0.35 | | | 0.36 | | | 0.36 | | |
NPLs as a percentage of total loans and leases(1) | NPLs as a percentage of total loans and leases(1) | 0.36 | | | 0.36 | | | 0.37 | | | 0.37 | | | 0.37 | | |
NPLs as a percentage of total loans and leases(1) | |
NPLs as a percentage of total loans and leases(1) | |
| NPAs as a percentage of: | |
| NPAs as a percentage of: | |
| NPAs as a percentage of: | NPAs as a percentage of: | | |
Total assets(1) | Total assets(1) | 0.22 | | | 0.23 | | | 0.23 | | | 0.22 | | | 0.21 | | |
Total assets(1) | |
Total assets(1) | |
| Loans and leases HFI plus foreclosed property | Loans and leases HFI plus foreclosed property | 0.38 | | | 0.38 | | | 0.37 | | | 0.38 | | | 0.38 | | |
| Loans and leases HFI plus foreclosed property | |
| Loans and leases HFI plus foreclosed property | |
| | ALLL as a percentage of loans and leases HFI | |
| | ALLL as a percentage of loans and leases HFI | |
| | ALLL as a percentage of loans and leases HFI | ALLL as a percentage of loans and leases HFI | 1.37 | | | 1.34 | | | 1.34 | | | 1.38 | | | 1.44 | | |
| | Ratio of ALLL to NPLs | Ratio of ALLL to NPLs | 3.8x | | 3.7x | | 3.8x | | 3.8x | | 4.0x | |
| | Ratio of ALLL to NPLs | |
| | Ratio of ALLL to NPLs | |
Loans 90 days or more past due and still accruing as a percentage of loans and leases HFI, excluding government guaranteed(2) | |
Loans 90 days or more past due and still accruing as a percentage of loans and leases HFI, excluding government guaranteed(2) | |
Loans 90 days or more past due and still accruing as a percentage of loans and leases HFI, excluding government guaranteed(2) | Loans 90 days or more past due and still accruing as a percentage of loans and leases HFI, excluding government guaranteed(2) | 0.04 | % | | 0.04 | % | | 0.04 | % | | 0.04 | % | | 0.04 | % | |
| | |
(1)Includes LHFS.
(2)This asset quality ratio has been adjusted to remove the impact of government guaranteed loans. Management believes the inclusion of such assets in this asset quality ratio results in distortion of this ratio because collection of principal and interest is reasonably assured, or the ratio might not be comparable to other periods presented or to other portfolios that do not have government guarantees.
| | Table 9: Asset Quality Ratios (Continued) | Table 9: Asset Quality Ratios (Continued) | |
| Table 9: Asset Quality Ratios (Continued) | |
| Table 9: Asset Quality Ratios (Continued) | |
| | Quarter Ended | |
| | Three Months Ended | |
| | | Mar 31, 2023 | | Dec 31, 2022 | | Sep 30, 2022 | | Jun 30, 2022 | | Mar 31, 2022 | |
| | Three Months Ended | |
| | | Three Months Ended | |
| | Mar 31, 2024 | |
| | Mar 31, 2024 | |
| | Mar 31, 2024 | |
| Net charge-offs as a percentage of average loans and leases HFI: | |
| Net charge-offs as a percentage of average loans and leases HFI: | |
| Net charge-offs as a percentage of average loans and leases HFI: | Net charge-offs as a percentage of average loans and leases HFI: | |
| Commercial: | Commercial: | | |
| Commercial: | |
| Commercial: | |
| Commercial and industrial | |
| Commercial and industrial | |
| Commercial and industrial | Commercial and industrial | | 0.15 | % | | 0.08 | % | | 0.02 | % | | 0.01 | % | | 0.04 | % | |
| CRE | CRE | | 0.09 | | | 0.19 | | | (0.01) | | | (0.10) | | | 0.01 | | |
| CRE | |
| CRE | |
| Commercial construction | |
| Commercial construction | |
| Commercial construction | Commercial construction | | (0.04) | | | (0.06) | | | (0.10) | | | (0.08) | | | (0.02) | | |
| | Consumer: | Consumer: | | |
| | Consumer: | |
| | Consumer: | |
| Residential mortgage | |
| Residential mortgage | |
| Residential mortgage | Residential mortgage | | — | | | (0.02) | | | 0.01 | | | (0.02) | | | (0.03) | | |
| Home equity | Home equity | | (0.15) | | | (0.01) | | | (0.13) | | | (0.17) | | | (0.12) | | |
| Home equity | |
| Home equity | |
| Indirect auto | |
| Indirect auto | |
| Indirect auto | Indirect auto | | 1.47 | | | 1.52 | | | 1.15 | | | 0.77 | | | 1.23 | | |
| Other consumer | Other consumer | | 1.29 | | | 1.11 | | | 1.31 | | | 1.27 | | | 0.87 | | |
| Other consumer | |
| Other consumer | |
| Student | |
| Student | |
| Student | Student | | 0.42 | | | 0.34 | | | 0.40 | | | 0.30 | | | 0.33 | | |
| Credit card | Credit card | | 3.54 | | | 3.68 | | | 2.80 | | | 2.63 | | | 2.77 | | |
| Credit card | |
| Credit card | |
| Total | |
| Total | |
| Total | Total | | 0.37 | | | 0.34 | | | 0.27 | | | 0.22 | | | 0.25 | | |
| | Ratio of ALLL to net charge-offs | Ratio of ALLL to net charge-offs | | 3.7x | | 4.1x | | 5.0x | | 6.5x | | 5.8x | |
| | Ratio of ALLL to net charge-offs | |
| | Ratio of ALLL to net charge-offs | |
Ratios are annualized, as applicable.
The following table presents activity related to NPAs: | | Table 10: Rollforward of NPAs | Table 10: Rollforward of NPAs | |
| Table 10: Rollforward of NPAs | |
| Table 10: Rollforward of NPAs | |
| (Dollars in millions) | |
| (Dollars in millions) | |
| (Dollars in millions) | (Dollars in millions) | | 2023 | | 2022 | |
| Balance, January 1 | Balance, January 1 | | $ | 1,250 | | | $ | 1,163 | | |
| Balance, January 1 | |
| Balance, January 1 | |
| New NPAs | |
| New NPAs | |
| New NPAs | New NPAs | | 621 | | | 395 | | |
| Advances and principal increases | Advances and principal increases | | 214 | | | 108 | | |
| Advances and principal increases | |
| Advances and principal increases | |
Disposals of foreclosed assets(1) | |
Disposals of foreclosed assets(1) | |
Disposals of foreclosed assets(1) | Disposals of foreclosed assets(1) | | (147) | | | (112) | | |
Disposals of NPLs(2) | Disposals of NPLs(2) | | (3) | | | (37) | | |
Disposals of NPLs(2) | |
Disposals of NPLs(2) | |
| Charge-offs and losses | |
| Charge-offs and losses | |
| Charge-offs and losses | Charge-offs and losses | | (204) | | | (115) | | |
| Payments | Payments | | (306) | | | (180) | | |
| Payments | |
| Payments | |
| Transfers to performing status | |
| Transfers to performing status | |
| Transfers to performing status | Transfers to performing status | | (160) | | | (101) | | |
| Other, net | Other, net | | (4) | | | 14 | | |
| Other, net | |
| Other, net | |
| Ending balance, March 31 | Ending balance, March 31 | | $ | 1,261 | | | $ | 1,135 | | |
| Ending balance, March 31 | |
| Ending balance, March 31 | |
(1)Includes charge-offs and losses recorded upon sale of $42$66 million and $29$42 million for the three months ended March 31, 20232024 and 2022,2023, respectively.
(2)Includes gains, net of charge-offs recorded upon sale of $5 million and charge-offs and losses recorded upon sale of $3$4 million and $5 million for the three months ended March 31, 20232024 and 2022,2023, respectively.
50Truist Financial Corporation 55
Commercial Credit Concentrations
Truist has established the following general practices to manage commercial credit risk:
•limiting the amount of credit that Truist may extend to a borrower;
•establishing a process for credit approval accountability;
•initial underwriting and analysis of borrower, transaction, market, and collateral risks;
•ongoing servicing and monitoring of individual loans and lending relationships;
•continuous monitoring of the portfolio, market dynamics, and the economy; and
•periodically reevaluating the Company’s strategy and overall exposure as economic, market, and other relevant conditions change.
Truist continuously monitors various segments of its credit portfolios to assess potential concentration risks. Management is actively involved in the credit approval and review process, and risk acceptance criteria are adjusted as needed to reflect the Company’s risk appetite. Consistent with established risk management objectives, the Company utilizes various risk mitigation techniques, including collecting collateral and security interests, obtaining guarantees, and, to a limited extent, through the purchase of credit loss protection via third party insurance and/or use of credit derivatives such as credit default swaps.
In the commercial portfolio, risk concentrations are evaluated regularly on both an aggregate portfolio level and on an individual client basis. The Company manages its commercial exposure through portfolio targets, limits, and transactional risk acceptance criteria as well as other techniques, including but not limited to, loan syndications/participations, loan sales, collateral, structure, covenants, and other risk reduction techniques.
The following tables provide industry distribution by major types of commercial credit exposure and the geographical distribution of commercial exposures. Industry classification for commercial and industrial loans is based on the North American Industry Classification System. Commercial real estate loans are classified based on type of property. For the geographic disclosures, amounts are generally assigned to a state based on the physical billing address of the client or physical property address.
56 Truist Financial Corporation
CRE | | | | | | | | | | | | | | | | | | | | | | | | | | | | | | | | | | | | | | | | | | | | | | | | | | | | |
| Table 11: Commercial and Industrial Portfolio Industry and Geography | | | | | | | | | | | | | | | |
| March 31, 2024 | | December 31, 2023 | |
| | | | | | | | | | | | | | | | | | | | | | | | |
| (Dollars in millions) | LHFI | | % of Total | | | | | | | | NPL | | | | LHFI | | % of Total | | | | | | | | NPL | | | |
| Industry: | | | | | | | | | | | | | | | | | | | | | | | | | | | | |
| Manufacturing | $ | 14,598 | | | 9.3 | % | | | | | | | | $ | 104 | | | | | $ | 14,418 | | | 9.0 | % | | | | | | | | $ | 65 | | | | |
| Finance and insurance | 13,927 | | | 8.8 | | | | | | | | | 35 | | | | | 15,526 | | | 9.7 | | | | | | | | | 40 | | | | |
| Health care and social assistance | 12,951 | | | 8.2 | | | | | | | | | 136 | | | | | 12,997 | | | 8.1 | | | | | | | | | 46 | | | | |
| Real estate and rental and leasing | 12,446 | | | 7.9 | | | | | | | | | 8 | | | | | 12,663 | | | 7.9 | | | | | | | | | 16 | | | | |
| Retail trade | 12,339 | | | 7.8 | | | | | | | | | 85 | | | | | 12,740 | | | 7.9 | | | | | | | | | 89 | | | | |
| Public administration | 9,721 | | | 6.2 | | | | | | | | | — | | | | | 9,802 | | | 6.1 | | | | | | | | | — | | | | |
| Information | 8,363 | | | 5.3 | | | | | | | | | 1 | | | | | 8,346 | | | 5.2 | | | | | | | | | — | | | | |
| Wholesale trade | 7,963 | | | 5.1 | | | | | | | | | 2 | | | | | 8,263 | | | 5.1 | | | | | | | | | 3 | | | | |
| Transportation and warehousing | 5,612 | | | 3.6 | | | | | | | | | 17 | | | | | 5,703 | | | 3.5 | | | | | | | | | 8 | | | | |
| Educational services | 4,844 | | | 3.1 | | | | | | | | | 30 | | | | | 5,151 | | | 3.2 | | | | | | | | | 31 | | | | |
| Professional, scientific, and technical services | 4,351 | | | 2.8 | | | | | | | | | 12 | | | | | 4,445 | | | 2.8 | | | | | | | | | 26 | | | | |
| Utilities | 4,172 | | | 2.6 | | | | | | | | | — | | | | | 4,555 | | | 2.8 | | | | | | | | | — | | | | |
| Administrative and support and waste management and remediation services | 3,476 | | | 2.2 | | | | | | | | | 14 | | | | | 3,716 | | | 2.3 | | | | | | | | | 49 | | | | |
| Arts, entertainment, and recreation | 3,384 | | | 2.1 | | | | | | | | | — | | | | | 3,227 | | | 2.0 | | | | | | | | | — | | | | |
| Other services (except public administration) | 3,138 | | | 2.0 | | | | | | | | | 1 | | | | | 3,305 | | | 2.1 | | | | | | | | | 1 | | | | |
| Accommodation and food services | 2,937 | | | 1.9 | | | | | | | | | 4 | | | | | 3,067 | | | 1.9 | | | | | | | | | 13 | | | | |
Other(1) | 12,761 | | | 8.0 | | | | | | | | | 27 | | | | | 12,159 | | | 7.5 | | | | | | | | | 41 | | | | |
| Subtotal | 136,983 | | | 86.9 | | | | | | | | | 476 | | | | | 140,083 | | | 87.1 | | | | | | | | | 428 | | | | |
| Business owner occupied | 20,686 | | | 13.1 | | | | | | | | | 36 | | | | | 20,705 | | | 12.9 | | | | | | | | | 42 | | | | |
| Total commercial and industrial | $ | 157,669 | | | 100.0 | % | | | | | | | | $ | 512 | | | | | $ | 160,788 | | | 100.0 | % | | | | | | | | $ | 470 | | | | |
| | | | | | | | | | | | | | | | | | | | | | | | | | | | |
| Geography: | | | | | | | | | | | | | | | | | | | | | | | | | | | | |
| Florida | $ | 18,842 | | | 12.0 | % | | | | | | | | $ | 261 | | | | | $ | 18,947 | | | 11.8 | % | | | | | | | | $ | 228 | | | | |
| Texas | 14,666 | | | 9.3 | | | | | | | | | 8 | | | | | 15,374 | | | 9.6 | | | | | | | | | 24 | | | | |
| North Carolina | 12,528 | | | 7.9 | | | | | | | | | 12 | | | | | 12,959 | | | 8.1 | | | | | | | | | 11 | | | | |
| Georgia | 12,167 | | | 7.7 | | | | | | | | | 49 | | | | | 12,167 | | | 7.6 | | | | | | | | | 32 | | | | |
| New York | 10,527 | | | 6.7 | | | | | | | | | 3 | | | | | 10,336 | | | 6.4 | | | | | | | | | 3 | | | | |
| Virginia | 9,341 | | | 5.9 | | | | | | | | | 10 | | | | | 9,724 | | | 6.0 | | | | | | | | | 35 | | | | |
| California | 8,679 | | | 5.5 | | | | | | | | | 12 | | | | | 9,115 | | | 5.7 | | | | | | | | | 1 | | | | |
| Pennsylvania | 7,328 | | | 4.6 | | | | | | | | | 5 | | | | | 7,423 | | | 4.6 | | | | | | | | | 4 | | | | |
| Maryland | 6,740 | | | 4.3 | | | | | | | | | 4 | | | | | 6,668 | | | 4.1 | | | | | | | | | 6 | | | | |
| Tennessee | 5,375 | | | 3.4 | | | | | | | | | 85 | | | | | 5,852 | | | 3.6 | | | | | | | | | 43 | | | | |
| South Carolina | 3,991 | | | 2.5 | | | | | | | | | 2 | | | | | 4,134 | | | 2.6 | | | | | | | | | 1 | | | | |
| Illinois | 3,910 | | | 2.5 | | | | | | | | | — | | | | | 3,892 | | | 2.4 | | | | | | | | | 10 | | | | |
| New Jersey | 3,788 | | | 2.4 | | | | | | | | | 30 | | | | | 3,754 | | | 2.3 | | | | | | | | | 36 | | | | |
| Ohio | 2,904 | | | 1.8 | | | | | | | | | — | | | | | 3,220 | | | 2.0 | | | | | | | | | 6 | | | | |
Other(2) | 36,883 | | | 23.5 | | | | | | | | | 31 | | | | | 37,223 | | | 23.2 | | | | | | | | | 30 | | | | |
| Total commercial and industrial | $ | 157,669 | | | 100.0 | % | | | | | | | | $ | 512 | | | | | $ | 160,788 | | | 100.0 | % | | | | | | | | $ | 470 | | | | |
(1)Represents other remaining industries that are deemed to be individually insignificant.
(2)Includes non-U.S. loans of $4.7 billion and Commercial Construction$5.1 billion at March 31, 2024 and December 31, 2023, respectively. The remainder represents other remaining states that are deemed to be individually insignificant.
Truist has noted that the CRE and commercial construction portfolios have the potential for heightened risk in the current environment. Truist maintainsseeks to maintain a high-quality portfolio through disciplined risk management and prudent client selection. In addition, the Company’s exposure to large CRE tends to have more institutional sponsorship and the Company has reduced exposure to smaller CRE.
Truist’s CRE and commercial construction portfolios was $28.6totaled $29.6 billion as of March 31, 2023.2024, which includes 35% related to multifamily residential, 17% related to industrial, 16% related to office, 14% related to retail, and the remainder composed of hotel and other commercial real estate.
Our office portfolio, which makes up approximately 18% of totalcombined CRE and commercial construction loans,office portfolio is weighted towards Class Aprimarily composed of multi-tenant, non-gateway properties located within Truist Bank’s footprint. As of March 31, 2024, approximately 98% of these properties are multi-tenant. Additionally, as of March 31, 2023. Nonperforming2024, 25% and 29% of these exposures are scheduled to mature in 2024 and 2025, respectively, with the remainder scheduled to mature in 2026 and beyond.
Truist Financial Corporation 57
| | | | | | | | | | | | | | | | | | | | | | | | | | | | | | | | | | | | | | | | | | | | | | | | | | | | |
| Table 12: CRE Portfolio Property Type and Geography | | | | | | | | | | | | | | | |
| March 31, 2024 | | December 31, 2023 | |
| | | | | | | | | | | | | | | | | | | | | | | | |
| (Dollars in millions) | LHFI | | % of Total | | | | | | | | NPL | | | | LHFI | | % of Total | | | | | | | | NPL | | | |
| Industry: | | | | | | | | | | | | | | | | | | | | | | | | | | | | |
| Multifamily | $ | 5,825 | | | 26.3 | % | | | | | | | | $ | 1 | | | | | $ | 5,731 | | | 25.4 | % | | | | | | | | $ | 3 | | | | |
| Office | 4,117 | | | 18.6 | | | | | | | | | 244 | | | | | 4,286 | | | 19.0 | | | | | | | | | 264 | | | | |
| Retail | 4,080 | | | 18.4 | | | | | | | | | 6 | | | | | 4,172 | | | 18.5 | | | | | | | | | 9 | | | | |
| Industrial | 3,976 | | | 18.0 | | | | | | | | | 3 | | | | | 4,054 | | | 18.0 | | | | | | | | | 3 | | | | |
| Hotel | 2,378 | | | 10.7 | | | | | | | | | — | | | | | 2,445 | | | 10.8 | | | | | | | | | — | | | | |
Other(1) | 1,766 | | | 8.0 | | | | | | | | | 7 | | | | | 1,882 | | | 8.3 | | | | | | | | | 5 | | | | |
| Total CRE | $ | 22,142 | | | 100.0 | % | | | | | | | | $ | 261 | | | | | $ | 22,570 | | | 100.0 | % | | | | | | | | $ | 284 | | | | |
| | | | | | | | | | | | | | | | | | | | | | | | | | | | |
| Geography: | | | | | | | | | | | | | | | | | | | | | | | | | | | | |
| North Carolina | $ | 2,607 | | | 11.8 | % | | | | | | | | $ | 4 | | | | | $ | 2,726 | | | 12.1 | % | | | | | | | | $ | 1 | | | | |
| Georgia | 2,461 | | | 11.1 | | | | | | | | | 147 | | | | | 2,532 | | | 11.2 | | | | | | | | | 120 | | | | |
| Florida | 2,432 | | | 11.0 | | | | | | | | | 5 | | | | | 2,481 | | | 11.0 | | | | | | | | | 5 | | | | |
| California | 1,729 | | | 7.8 | | | | | | | | | 56 | | | | | 1,709 | | | 7.6 | | | | | | | | | 81 | | | | |
| Texas | 1,600 | | | 7.2 | | | | | | | | | — | | | | | 1,611 | | | 7.1 | | | | | | | | | — | | | | |
| New York | 1,567 | | | 7.1 | | | | | | | | | 3 | | | | | 1,574 | | | 7.0 | | | | | | | | | 3 | | | | |
| Pennsylvania | 1,353 | | | 6.1 | | | | | | | | | — | | | | | 1,403 | | | 6.2 | | | | | | | | | — | | | | |
| Virginia | 1,235 | | | 5.6 | | | | | | | | | — | | | | | 1,276 | | | 5.7 | | | | | | | | | — | | | | |
| District of Columbia | 1,020 | | | 4.6 | | | | | | | | | 10 | | | | | 1,043 | | | 4.6 | | | | | | | | | — | | | | |
| Maryland | 897 | | | 4.1 | | | | | | | | | 12 | | | | | 956 | | | 4.2 | | | | | | | | | 16 | | | | |
Other(2) | 5,241 | | | 23.6 | | | | | | | | | 24 | | | | | 5,259 | | | 23.3 | | | | | | | | | 58 | | | | |
| Total CRE | $ | 22,142 | | | 100.0 | % | | | | | | | | $ | 261 | | | | | $ | 22,570 | | | 100.0 | % | | | | | | | | $ | 284 | | | | |
(1)Represents other remaining property types that are deemed to be individually insignificant.
(2)Includes non-U.S. loans of $69 million and criticized$73 million at March 31, 2024 and December 31, 2023, respectively. The remainder represents other remaining states that are deemed to be individually insignificant.
| | | | | | | | | | | | | | | | | | | | | | | | | | | | | | | | | | | | | | | | | | | | | | | | | | | | |
| Table 13: Commercial Construction Portfolio Property Type and Geography | | | | | | | | | | | | | | | |
| March 31, 2024 | | December 31, 2023 | |
| | | | | | | | | | | | | | | | | | | | | | | | |
| (Dollars in millions) | LHFI | | % of Total | | | | | | | | NPL | | | | LHFI | | % of Total | | | | | | | | NPL | | | |
| Industry: | | | | | | | | | | | | | | | | | | | | | | | | | | | | |
| Multifamily | $ | 4,547 | | | 60.9 | % | | | | | | | | $ | 23 | | | | | $ | 3,868 | | | 57.9 | % | | | | | | | | $ | 23 | | | | |
| Industrial | 1,050 | | | 14.1 | | | | | | | | | — | | | | | 877 | | | 13.1 | | | | | | | | | — | | | | |
| Single Family - CP | 801 | | | 10.7 | | | | | | | | | — | | | | | 819 | | | 12.3 | | | | | | | | | — | | | | |
| Office | 581 | | | 7.8 | | | | | | | | | — | | | | | 634 | | | 9.5 | | | | | | | | | 1 | | | | |
| Single Family – AD and CL | 172 | | | 2.3 | | | | | | | | | — | | | | | 196 | | | 2.9 | | | | | | | | | — | | | | |
Other(1) | 321 | | | 4.2 | | | | | | | | | — | | | | | 289 | | | 4.3 | | | | | | | | | — | | | | |
| Total commercial construction | $ | 7,472 | | | 100.0 | % | | | | | | | | $ | 23 | | | | | $ | 6,683 | | | 100.0 | % | | | | | | | | $ | 24 | | | | |
| | | | | | | | | | | | | | | | | | | | | | | | | | | | |
| Geography: | | | | | | | | | | | | | | | | | | | | | | | | | | | | |
| Georgia | $ | 1,147 | | | 15.4 | | | | | | | | | $ | — | | | | | $ | 1,059 | | | 15.8 | | | | | | | | | $ | — | | | | |
| Texas | 1,046 | | | 14.0 | | | | | | | | | 23 | | | | | 956 | | | 14.3 | | | | | | | | | 23 | | | | |
| North Carolina | 871 | | | 11.7 | | | | | | | | | — | | | | | 777 | | | 11.6 | | | | | | | | | — | | | | |
| Florida | 867 | | | 11.6 | | | | | | | | | — | | | | | 741 | | | 11.1 | | | | | | | | | — | | | | |
| California | 501 | | | 6.7 | | | | | | | | | — | | | | | 512 | | | 7.7 | | | | | | | | | — | | | | |
Other(2) | 3,040 | | | 40.6 | | | | | | | | | — | | | | | 2,638 | | | 39.5 | | | | | | | | | 1 | | | | |
| Total commercial construction | $ | 7,472 | | | 100.0 | % | | | | | | | | $ | 23 | | | | | $ | 6,683 | | | 100.0 | % | | | | | | | | $ | 24 | | | | |
(1)Represents other remaining property types that are deemed to be individually insignificant.
(2)Includes non-U.S. loans in this portfolio have trended higher in recent months.
| | | | | | | | | | | | | | | | | | | | | | | |
| Table 11: CRE and Commercial Construction by Type | | | | | | | |
| March 31, 2023 | | December 31, 2022 |
| (Dollars in millions) | LHFI | | NPL | | LHFI | | NPL |
| CRE and commercial construction: | | | | | | | |
| Multifamily | $ | 8,085 | | | $ | 2 | | | $ | 7,762 | | | $ | — | |
| Office | 5,151 | | | 109 | | | 5,258 | | | 75 | |
| Retail | 4,582 | | | 3 | | | 4,668 | | | 2 | |
| Industrial | 4,550 | | | — | | | 4,329 | | | — | |
| Hotel | 2,827 | | | — | | | 2,965 | | | — | |
| Other | 3,426 | | | 4 | | | 3,543 | | | 5 | |
| Total | $ | 28,621 | | | $ | 118 | | | $ | 28,525 | | | $ | 82 | |
| | | | | | | |
| | | | | | | |
See additional information on the CRE and commercial construction portfolios in “Note 5. Loans and ACL,” including loans by origination year and credit quality indicator.
58 Truist Financial Corporation 51
ACL
Activity related to the ACL is presented in the following tables: | | Table 12: Activity in ACL | |
| For the Three Months Ended | |
| Table 14: Activity in ACL | |
| Table 14: Activity in ACL | |
| Table 14: Activity in ACL | |
| Three Months Ended | |
| Three Months Ended | |
| Three Months Ended | |
| (Dollars in millions) | (Dollars in millions) | Mar 31, 2023 | | Dec 31, 2022 | | Sep 30, 2022 | | Jun 30, 2022 | | Mar 31, 2022 | |
| (Dollars in millions) | |
| (Dollars in millions) | |
Balance, beginning of period(1) | |
Balance, beginning of period(1) | |
Balance, beginning of period(1) | Balance, beginning of period(1) | $ | 4,649 | | | $ | 4,455 | | | $ | 4,434 | | | $ | 4,423 | | | $ | 4,695 | | |
| | Provision for credit losses | Provision for credit losses | 482 | | | 467 | | | 234 | | | 171 | | | (95) | | |
| | | Provision for credit losses | |
| | Provision for credit losses | |
| | Charge-offs: | |
| | Charge-offs: | |
| | Charge-offs: | Charge-offs: | | | | | | | | | | |
| Commercial and industrial | Commercial and industrial | (75) | | | (44) | | | (51) | | | (17) | | | (31) | | |
| Commercial and industrial | |
| Commercial and industrial | |
| CRE | CRE | (6) | | | (11) | | | — | | | (1) | | | (1) | | |
| CRE | |
| CRE | |
| Commercial construction | |
| Commercial construction | |
| Commercial construction | Commercial construction | — | | | — | | | — | | | — | | | (1) | | |
| | Residential mortgage | Residential mortgage | (1) | | | (1) | | | (4) | | | (2) | | | (2) | | |
| | Residential mortgage | |
| | Residential mortgage | |
| Home equity | |
| Home equity | |
| Home equity | Home equity | (2) | | | (6) | | | (3) | | | (3) | | | (1) | | |
| Indirect auto | Indirect auto | (127) | | | (129) | | | (103) | | | (77) | | | (102) | | |
| Indirect auto | |
| Indirect auto | |
| Other consumer | |
| Other consumer | |
| Other consumer | Other consumer | (105) | | | (96) | | | (109) | | | (100) | | | (76) | | |
| Student | Student | (5) | | | (5) | | | (7) | | | (4) | | | (6) | | |
| Student | |
| Student | |
| Credit card | |
| Credit card | |
| Credit card | Credit card | (51) | | | (53) | | | (42) | | | (40) | | | (41) | | |
| | Total charge-offs | Total charge-offs | (372) | | | (345) | | | (319) | | | (244) | | | (261) | | |
| | Total charge-offs | |
| | Total charge-offs | |
| Recoveries: | |
| Recoveries: | |
| Recoveries: | Recoveries: | | | | | | | | | | |
| Commercial and industrial | Commercial and industrial | 13 | | | 14 | | | 43 | | | 13 | | | 17 | | |
| Commercial and industrial | |
| Commercial and industrial | |
| CRE | CRE | 1 | | | 1 | | | — | | | 6 | | | 1 | | |
| CRE | |
| CRE | |
| Commercial construction | |
| Commercial construction | |
| Commercial construction | Commercial construction | 1 | | | 1 | | | 2 | | | 1 | | | 1 | | |
| | Residential mortgage | Residential mortgage | 2 | | | 3 | | | 3 | | | 4 | | | 6 | | |
| | Residential mortgage | |
| | Residential mortgage | |
| Home equity | |
| Home equity | |
| Home equity | Home equity | 6 | | | 6 | | | 8 | | | 6 | | | 5 | | |
| Indirect auto | Indirect auto | 26 | | | 21 | | | 21 | | | 26 | | | 23 | | |
| Indirect auto | |
| Indirect auto | |
| Other consumer | Other consumer | 17 | | | 17 | | | 21 | | | 20 | | | 21 | | |
| Student | — | | | 1 | | | — | | | — | | | — | | |
| Other consumer | |
| Other consumer | |
| | Credit card | |
| | Credit card | |
| | Credit card | Credit card | 9 | | | 8 | | | 8 | | | 9 | | | 9 | | |
| Total recoveries | Total recoveries | 75 | | | 72 | | | 106 | | | 85 | | | 83 | | |
| Total recoveries | |
| Total recoveries | |
| Net charge-offs | |
| Net charge-offs | |
| Net charge-offs | Net charge-offs | (297) | | | (273) | | | (213) | | | (159) | | | (178) | | |
Other(2) | Other(2) | (73) | | | — | | | — | | | (1) | | | 1 | | |
Other(2) | |
Other(2) | |
| Balance, end of period | |
| Balance, end of period | |
| Balance, end of period | Balance, end of period | $ | 4,761 | | | $ | 4,649 | | | $ | 4,455 | | | $ | 4,434 | | | $ | 4,423 | | |
| ACL:(1) | ACL:(1) | | |
| ACL:(1) | |
| ACL:(1) | |
| ALLL | |
| ALLL | |
| ALLL | ALLL | $ | 4,479 | | | $ | 4,377 | | | $ | 4,205 | | | $ | 4,187 | | | $ | 4,170 | | |
| RUFC | RUFC | 282 | | | 272 | | | 250 | | | 247 | | | 253 | | |
| RUFC | |
| RUFC | |
| Total ACL | Total ACL | $ | 4,761 | | | $ | 4,649 | | | $ | 4,455 | | | $ | 4,434 | | | $ | 4,423 | | |
| Total ACL | |
| Total ACL | |
(1)Excludes provision for credit losses and allowances related to other financial assets at amortized cost.
(2)The first quarter of 2023 includes the impact from the adoption of the Troubled Debt Restructurings and Vintage Disclosures accounting standard.
The allowance for credit losses was $4.8$5.1 billion and includes $4.5$4.8 billion for the allowance for loan and lease losses and $282$297 million for the reserve for unfunded commitments. The ALLL ratio was 1.37%1.56%, up threetwo basis points compared with December 31, 2022 primarily due to increased economic uncertainty.2023. The ALLL covered nonperforming loans and leases held for investment 3.8X3.4X compared to 3.7X3.5X at December 31, 2022.2023. At March 31, 2023,2024, the ALLL was 3.7X2.4X annualized net charge-offs, compared to 4.1X2.7X at December 31, 2022.2023.
52 Truist Financial Corporation 59
The following table presents an allocation of the ALLL. The entire amount of the allowance is available to absorb losses occurring in any category of loans and leases. | Table 13: Allocation of ALLL by Category | | March 31, 2023 | | December 31, 2022 |
| Table 15: Allocation of ALLL by Category | | Table 15: Allocation of ALLL by Category |
| March 31, 2024 | | | March 31, 2024 | | December 31, 2023 |
| (Dollars in millions) | (Dollars in millions) | Amount | | % ALLL in Each Category | | % Loans in Each Category | | Amount | | % ALLL in Each Category | | % Loans in Each Category | (Dollars in millions) | Amount | | % ALLL in Each Category | | % Loans in Each Category | | Amount | | % ALLL in Each Category | | % Loans in Each Category |
| Commercial and industrial | Commercial and industrial | $ | 1,497 | | | 33.5 | % | | 51.1 | % | | $ | 1,409 | | | 32.3 | % | | 50.3 | % | Commercial and industrial | $ | 1,360 | | | 28.3 | | 28.3 | % | | 51.4 | % | | $ | 1,404 | | | 29.4 | | 29.4 | % | | 51.6 | % |
| CRE | CRE | 251 | | | 5.6 | | | 6.9 | | | 224 | | | 5.1 | | | 7.0 | |
| Commercial construction | Commercial construction | 87 | | | 1.9 | | | 1.8 | | | 46 | | | 1.1 | | | 1.8 | |
| | Residential mortgage | Residential mortgage | 332 | | | 7.4 | | | 17.2 | | | 399 | | | 9.1 | | | 17.4 | |
| Residential mortgage | |
| Residential mortgage | |
| Home equity | Home equity | 87 | | | 1.9 | | | 3.2 | | | 90 | | | 2.0 | | | 3.3 | |
| Indirect auto | Indirect auto | 993 | | | 22.2 | | | 8.3 | | | 981 | | | 22.4 | | | 8.6 | |
| Other consumer | Other consumer | 779 | | | 17.4 | | | 8.5 | | | 770 | | | 17.6 | | | 8.5 | |
| Student | 98 | | | 2.2 | | | 1.5 | | | 98 | | | 2.2 | | | 1.6 | |
| | Credit card | |
| Credit card | |
| Credit card | Credit card | 355 | | | 7.9 | | | 1.5 | | | 360 | | | 8.2 | | | 1.5 | |
| Total ALLL | Total ALLL | 4,479 | | | 100.0 | % | | 100.0 | % | | 4,377 | | | 100.0 | % | | 100.0 | % | Total ALLL | 4,803 | | | 100.0 | | 100.0 | % | | 100.0 | % | | 4,798 | | | 100.0 | | 100.0 | % | | 100.0 | % |
| RUFC | RUFC | 282 | | | | | 272 | | | | RUFC | 297 | | | | | | | | | | | 295 | | | | | | | | | |
| Total ACL | Total ACL | $ | 4,761 | | | | | $ | 4,649 | | | | Total ACL | $ | 5,100 | | | | | | | | | | | $ | 5,093 | | | | | | | | | |
Truist monitors the performance of its home equity loans and lines secured by second liens similarly to other consumer loans and utilizes assumptions specific to these loans in determining the necessary ALLL. Truist also receives notification when the first lien holder, whether Truist or another financial institution, has initiated foreclosure proceedings against the borrower. When notified that the first lien is in the process of foreclosure, Truist obtains valuations to determine if any additional charge-offs or reserves are warranted. These valuations are updated at least annually thereafter.
Truist has limited ability to monitor the delinquency status of the first lien, unless the first lien is held or serviced by Truist. Truist estimates credit losses on second lien loans where the first lien is delinquent based on historical experience; the increased risk of loss on these credits is reflected in the ALLL. As of March 31, 2023,2024, Truist held or serviced the first lien on 32% of its second lien positions.
Other Assets
The components of other assets are presented in the following table: | | Table 14: Other Assets as of Period End | | |
| Table 16: Other Assets as of Period End | |
| Table 16: Other Assets as of Period End | |
| Table 16: Other Assets as of Period End | |
| (Dollars in millions) | (Dollars in millions) | Mar 31, 2023 | | Dec 31, 2022 | |
| (Dollars in millions) | |
| (Dollars in millions) | |
| Tax credit and other private equity investments | |
| Tax credit and other private equity investments | |
| Tax credit and other private equity investments | |
| Bank-owned life insurance | Bank-owned life insurance | $ | 7,651 | | | $ | 7,618 | | |
| Tax credit and other private equity investments | 6,730 | | | 6,825 | | |
| Bank-owned life insurance | |
| Bank-owned life insurance | |
| Prepaid pension assets | Prepaid pension assets | 5,885 | | | 4,539 | | |
| DTAs | 2,393 | | | 3,027 | | |
| Accounts receivable | 2,763 | | | 2,682 | | |
| Prepaid pension assets | |
| Prepaid pension assets | |
| DTAs, net | |
| DTAs, net | |
| DTAs, net | |
| Accrued income | |
| Accrued income | |
| Accrued income | Accrued income | 2,429 | | | 2,265 | | |
| Leased assets and related assets | Leased assets and related assets | 2,059 | | | 2,082 | | |
| Leased assets and related assets | |
| Leased assets and related assets | |
| Accounts receivable | |
| Accounts receivable | |
| Accounts receivable | |
| FHLB stock | FHLB stock | 2,426 | | | 1,279 | | |
| FHLB stock | |
| FHLB stock | |
| Prepaid expenses | |
| Prepaid expenses | |
| Prepaid expenses | |
| Derivative assets | |
| Derivative assets | |
| Derivative assets | |
| ROU assets | ROU assets | 1,151 | | | 1,193 | | |
| Prepaid expenses | 1,177 | | | 1,162 | | |
| Equity securities at fair value | 857 | | | 898 | | |
| Derivative assets | 692 | | | 684 | | |
| ROU assets | |
| ROU assets | |
| | Other | Other | 792 | | | 874 | | |
| | Other | |
| | Other | |
| Total other assets | |
| Total other assets | |
| Total other assets | Total other assets | $ | 37,005 | | | $ | 35,128 | | |
|
60 Truist Financial Corporation 53
Funding Activities
Deposits
The following table presents average deposits: | Table 15: Average Deposits | Three Months Ended (Dollars in millions) | | Mar 31, 2023 | | Dec 31, 2022 | | Sep 30, 2022 | | Jun 30, 2022 | | Mar 31, 2022 |
| Table 17: Average Deposits | |
| Table 17: Average Deposits | |
| Table 17: Average Deposits | |
| | Three Months Ended | | | | Three Months Ended |
| (Dollars in millions) | | (Dollars in millions) | | Mar 31, 2024 | | Dec 31, 2023 | | Sep 30, 2023 | | Jun 30, 2023 | | Mar 31, 2023 |
| Noninterest-bearing deposits | Noninterest-bearing deposits | | $ | 131,099 | | | $ | 141,032 | | | $ | 146,041 | | | $ | 148,610 | | | $ | 145,933 | |
| Interest checking | Interest checking | | 108,886 | | | 110,001 | | | 111,645 | | | 112,375 | | | 112,159 | |
| Money market and savings | Money market and savings | | 139,802 | | | 144,730 | | | 147,659 | | | 148,632 | | | 141,500 | |
| Time deposits | Time deposits | | 28,671 | | | 17,513 | | | 14,751 | | | 14,133 | | | 15,646 | |
| | Total average deposits | Total average deposits | | $ | 408,458 | | | $ | 413,276 | | | $ | 420,096 | | | $ | 423,750 | | | $ | 415,238 | |
| Total average deposits | |
| Total average deposits | |
Average deposits for the first quarter of 20232024 were $408.5$389.1 billion, a decrease of $4.8$6.3 billion, or 1.2%1.6%, compared to the prior quarter. The decrease in deposits was primarily driven by the impacts of monetary tightening and higher-rate alternatives.
Average noninterest-bearing deposits decreased 7.0%4.9% compared to the prior quarter and represented 32.1%28.0% of total deposits for the first quarter of 20232024 compared to 34.1%29.0% for the fourth quarter of 20222023 and 35.1%32.1% compared to the year ago quarter. Noninterest-bearing deposits declined primarily due to clients seeking high-rate alternatives. Average money market and savings andaccounts decreased 2.0%. Average interest checking declined 3.4% and 1.0%, respectively, compared to the prior quarter. Average time deposits increased 64% due to an increase in wholesale funding1.8% and retail-client time deposits.
Truist has a very granular and relationship-based deposit franchise. Approximately 63% of deposits are insured or collateralized. Truist deposit accounts are typically based on long-term relationships and include multiple products and services. Truist has strong market share in many of the fastest-growing markets in the United States. Truist currently ranks 1st, 2nd, or 3rd in deposit share in 17 of our top 20 markets, including Atlanta, Charlotte, DC, Miami, Tampa, Orlando, and Raleigh-Durham, among others. Truist’s commercial deposits are diversified across 21 industry groups, with no one sector representing more than 10% of Corporate and Commercial Banking deposits.
The estimated amount of deposits that are uninsured was $175.9 billion and $189.6 billion as of March 31, 2023 and December 31, 2022, respectively, calculated using the same methodology as the Call Report for Truist Bank. The decrease in uninsured deposits was largely due to commercial clients that chose to diversify into money market mutual funds or across multiple banks. These outflows were primarily higher-cost, non-operational deposits.0.8%, respectively.
Borrowings
At March 31, 2023,2024, short-term borrowings totaled $23.7$26.3 billion, an increase of $256 million$1.5 billion compared to December 31, 2022.2023. Average short-term borrowings were $24.1$26.2 billion, or 5.0%5.8% of total funding, for the three months ended March 31, 2023,2024, as compared to $6.9$24.1 billion, or 1.5%5.0%, for the same period in the prior year.
Long-term debt provides funding and, to a lesser extent, regulatory capital, and primarily consists of senior and subordinated notes issued by Truist and Truist Bank. Long-term debt totaled $69.9$39.1 billion at March 31, 2023,2024, an increase of $26.7 billion$153 million compared to December 31, 2022. This funding increase was largely to increase our cash position in response to market events.2023. During the three months ended March 31, 2023,2024, the Company had:
•Issued $3.5 billion fixed-to-floating rate senior notes with interest rates between 5.44% and 5.71% due from January 24, 2030 to January 24, 2035.
•Maturities and redemptions of $3.5$1.3 billion of senior notes.
•Issued $1.5Net redemptions of $2.0 billion fixed-to-floating rate senior notes with an interest rate of 4.87% due January 26, 2029 and $1.5 billion fixed-to-floating rate senior notes with an interest rate of 5.12% due January 26, 2034.
•Issued $27.0 billion notional, net, of prepayable FHLB floating rate advances with interest rates of 5.05% to 5.07% due April 10, 2024 to March 13, 2025.FHLB advances.
The average cost of long-term debt was 4.05% for the three months ended March 31, 2023, up 255 basis points compared to the same period in 2022.
54 Truist Financial Corporation
Shareholders’ Equity
Truist’s book value per common share and TBVPS are presented in the following table: | Table 16: Book Value per Common Share | | Table 18: Book Value per Common Share | | Table 18: Book Value per Common Share |
| (Dollars in millions, except per share data, shares in thousands) | (Dollars in millions, except per share data, shares in thousands) | | Mar 31, 2023 | | Dec 31, 2022 | (Dollars in millions, except per share data, shares in thousands) | | Mar 31, 2024 | | Dec 31, 2023 |
| Common equity per common share | Common equity per common share | | $ | 41.82 | | | $ | 40.58 | |
Non-GAAP capital measure:(1) | Non-GAAP capital measure:(1) | | | | | Non-GAAP capital measure:(1) | | | | |
| Tangible common equity per common share | Tangible common equity per common share | | $ | 19.45 | | | $ | 18.04 | |
Calculation of tangible common equity:(1) | Calculation of tangible common equity:(1) | | | | | Calculation of tangible common equity:(1) | | |
| Total shareholders’ equity | Total shareholders’ equity | | $ | 62,394 | | | $ | 60,537 | |
| Less: | Less: | | | | | Less: | | |
| Preferred stock | Preferred stock | | 6,673 | | | 6,673 | |
| Noncontrolling interests | Noncontrolling interests | | 22 | | | 23 | |
| Goodwill and intangible assets, net of deferred taxes | Goodwill and intangible assets, net of deferred taxes | | 29,788 | | | 29,908 | |
| Tangible common equity | Tangible common equity | | $ | 25,911 | | | $ | 23,933 | |
| | Common shares outstanding at end of period | Common shares outstanding at end of period | | 1,331,918 | | | 1,326,829 | |
| Common shares outstanding at end of period | |
| Common shares outstanding at end of period | |
|
(1)Tangible common equity and related measures areis a non-GAAP measuresmeasure that excludeexcludes the impact of intangible assets, net of deferred taxes, and their related amortization. These measures aretaxes. This measure is useful for evaluating the performance of a business consistently, whether acquired or developed internally. Truist’s management uses these measuresthis measure to assess profitability, returns relative to balance sheet risk and shareholder value.
Total shareholders’ equity was $62.4$59.1 billion at March 31, 2023, an increase2024, a decrease of $1.9 billion$200 million from December 31, 2022.2023. This increase includes $1.5 billion in net income and a $1.0 billion increase in AOCI, partially offsetdecrease was driven by $794$800 million in common and preferred dividends.dividends and $716 million in OCI, partially offset by net income of $1.2 billion. Truist’s book value per common share at March 31, 20232024 was $41.82,$38.97, compared to $40.58$39.31 at December 31, 2022. Truist2023. Truist’s TBVPS of $19.45was $21.64 at March 31, 2023, increased 7.8%2024, compared to $21.83 at December 31, 2022 due to increases in AOCI, primarily related to AFS securities, and retained earnings.2023.
Truist Financial Corporation 61
Risk Management
Truist maintainsseeks to maintain a comprehensive risk management framework supported by people, processes, and systems to identify, measure, monitor, manage, and report significant risks arising from its exposures and business activities. Effective risk management involves optimizing risk and return while operating in a safe and sound manner and promoting compliance with applicable laws and regulations. The Company’s risk management framework promotesis designed to promote the execution of business strategies and objectives in alignment with its risk appetite.
Truist has developed and employs a risk framework that further guides business functions in identifying, measuring, responding to, monitoring, and reporting on possible exposures to the organization. TheTruist has developed a risk taxonomy drivesdesigned to drive internal risk measurement and monitoring and enablesenable Truist to clearly and transparently communicate to stakeholders the level of potential risk the Company faces and the Company’s position on managing risk to acceptable levels.
Truist is committed to fostering a culture that supports identification and escalation of risks across the organization. All teammates are responsible for upholding the Company’s purpose, mission, and values, and are encouraged to speak up if there is any activity or behavior that is inconsistent with the Company’s culture. The Truist code of ethics guides the Company’s decision making and informs teammates on how to act in the absence of specific guidance.
Truist seeks an appropriate return for the risk taken in its business operations. Risk-taking activities aremust be evaluated and prioritized to identify those that present attractive risk-adjusted returns, while preserving asset value and capital.
Truist’s compensation plans are designed to consider teammate’s adherence to and successful implementation of Truist’s risk values and associated policies and procedures. The Company’s compensation structure supportsis designed to support its core values and sound risk management practices in an effort to promote judicious risk-taking behavior.
Refer to Truist’s Annual Report on Form 10-K for the year ended December 31, 2022 for additional disclosures under the section titled “Risk Management.”
Market Risk
Market risk is the risk to current or anticipated earnings, capital, or economic value arising from changes in the market value of portfolios, securities, or other financial instruments. Market risk results from changes in the level, volatility, or correlations among financial market risk factors or prices, including interest rates, credit spreads, foreign exchange rates, equity, and commodity prices.
Truist Financial Corporation 55
Effective management of market risk is essential to achieving Truist’s strategic financial objectives. Truist’s most significant market risk exposure is to interest rate risk in its balance sheet; however, market risk also results from underlying product liquidity risk, price risk, and volatility risk in Truist’s business units. Interest rate risk results from differences between the timing of rate changes and the timing of cash flows associated with assets and liabilities (re-pricing risk); from changing rate relationships among different yield curves affecting bank activities (basis risk); from changing rate relationships across the spectrum of maturities (yield curve risk); and from interest-related options inherently embedded in bank products (options risk).
The primary objectives of effective market risk management are to minimize adverse effects from changes in market risk factors on net interest income, net income, and capital, and to offset the risk of price changes for certain assets and liabilities recorded at fair value. At Truist, market risk management also includes the enterprise-wide IPV function.
Interest Rate Market Risk
As a financial institution, Truist is exposed to interest rate risk from assets, liabilities, and off-balance sheet positions. To keep net interest margin as stable as possible, Truist actively manages its interest rate risk exposure through the strategic repricing of its assets and liabilities, taking into account the volumes, maturities, and mix. Truist primarily uses three methods to measuremonitors this risk through two measurement types, (i) NII at risk and monitor its interest rate risk: (i) simulations of possible changes to net interest income over the next two years based on gradual changes in interest rates; (ii) analysis of interest rate shock scenarios; and (iii) analysis of economic value of equity, based on changes in interest rates.and manages this risk with securities, derivatives, and broader asset liability management activities.
The Company’s simulation model takes into account assumptions relatedIRR measurement is reported monthly through the ALCO. Monthly IRR reporting includes exposure and historical trends relative to prepayment trends, usingrisk limit scenarios, impacts to a combinationwide range of market datarate scenarios, and internal historical experiences for deposits and loans, as well as scheduled maturities and payments, and the expected outlook for the economy and interest rates. These assumptions are reviewed and adjusted monthly to reflect changes in current interest rates comparedsensitivity tests of key assumptions. IRR reporting is provided to the rates applicable to Truist’s assetsBRC monthly and liabilities. The model also considers Truist’s current and prospective liquidity position, current balance sheet volumes, projected growth and/or contractions, accessibilityreviews of funds for short-term needs and capital maintenance.varying IRR topics are performed quarterly.
Deposit betas (theIRR measurement is influenced by data, assumptions, and models. Due to their high sensitivity of deposit rate changes relative to market rates, mortgage (loan and security) prepayments leverage an industry model that results in varying prepayment speeds across rate changes) are an important assumption inscenarios. Prepayments for non-mortgage loans leverage a mix of dynamic models and static prepayment assumptions based on historical experience. Interest-bearing-deposit rate paid is projected to move at a ratio (deposit beta) of market rates, primarily the interest rate risk modeling process. Truist applies deposit beta assumptionsFederal Funds Rate, aligned to non-maturity interest-bearing deposit accounts when determining its interest rate sensitivity. Non-maturity, interest-bearing deposit accounts include interest checking accounts, savings accounts, and money market accounts that do not have a contractual maturity. Truist applies an average deposit beta of approximately 50% to its non-maturity interest-bearing accounts when determining its interest rate sensitivity. Truist also regularly conducts sensitivity analyses on other key variables, including noninterest-bearing deposits, to determine the impact these variables could have on the Company’s interest rate risk position. The predictive value of the simulation model depends upon the accuracy of the assumptions, but management believes that it provides helpful information for the management of interest rate risk.historical experience.
The following table shows the effect that the indicated changes in interest rates would have on netTruist uses derivatives to hedge interest income as projected for the next 12 months assuming a gradual change in interest rates as described below. | | | | | | | | | | | | | | | | | | | | | | | | | | |
| | | | | | | | |
| | | | | | | | |
| Table 17: Interest Sensitivity Simulation Analysis |
| Interest Rate Scenario | | Annualized Hypothetical Percentage Change in Net Interest Income |
| Gradual Change in Prime Rate (bps) | | Prime Rate | |
| Mar 31, 2023 | | Mar 31, 2022 | | Mar 31, 2023 | | Mar 31, 2022 |
| Up 100 | | 9.00 | % | | 4.50 | % | | (0.29) | % | | 4.27 | % |
| Up 50 | | 8.50 | | | 4.00 | | | (0.11) | | | 3.29 | |
| No Change | | 8.00 | | | 3.50 | | | — | | | — | |
Down 50(1) | | 7.50 | | | 3.00 | | | (0.58) | | | (3.46) | |
Down 100(1) | | 7.00 | | | 2.50 | | | (0.70) | | | (3.64) | |
(1)The Down 50variability of floating rate loans and 100 rate scenarios incorporate a floorto hedge valuation changes of one basis point.
Rate sensitivity decreased compared to prior periods, primarily driven by higher starting rates, higher deposit betas as rates increaselong-term debt and move into the highest beta tiers, and the addition of forward starting swaps.
Management considers how the interest rate risk position could be impacted by changes in balance sheet mix. Liquidity in the banking industry was very strong post-COVID-19, which resulted in growth in noninterest-bearing demand deposits. However, with the significant increase in rates in 2022 and the first quarter of 2023, noninterest-bearing deposits have begun to shift to interest-bearing accounts. Additional movement above what is currently projected would reduce the asset sensitivity of Truist’s balance sheet because the Company may increase interest-bearing funds to offset the loss of these advantageous noninterest-bearing deposits. Alternatively, the Company may reduce the size of its investment portfolio to offset the loss of noninterest-bearing demand deposits to limit the impact on the balance sheet’s asset sensitivity. The behavior of these noninterest-bearing deposits is one of the most important assumptions used in determining the interest rate risk position of Truist.
5662 Truist Financial Corporation
The following table shows
NII at risk measures the
results of Truist’s interest-rate sensitivity position assuming the loss of additional demand deposits and an associated increasechange in
managed rate deposits versus current projectionsNII under
variousalternate interest rate
scenarios. For purposes of this analysis, Truist modeledscenarios relative to Truist’s baseline scenario, which incorporates Truist’s current balance sheet and off-balance sheet hedges as well as expectations for new business over the
incremental beta of managed rate deposits for the replacementforecast horizon. Truist’s baseline scenario relies on assumptions including expectations of the
demand depositseconomy and interest rates – which are influenced by market conditions, new business volume, pricing, and customer behavior. In measuring NII at
100%. | | | | | | | | | | | | | | | | | | | | |
| Table 18: Deposit Mix Sensitivity Analysis |
| Gradual Change in Rates (bps) | | Base Scenario at March 31, 2023(1) | | Results Assuming a Decrease in Noninterest-Bearing Demand Deposits |
| | $20 Billion | | $40 Billion |
| Up 100 | | (0.29) | % | | (1.01) | % | | (1.72) | % |
| Up 50 | | (0.11) | | | (0.63) | | | (1.15) | |
(1)The base scenario is equalrisk, Truist assumes that changes in key factors, such as prepayments and deposit pricing (betas), largely move in line with those it has experienced in prior rate cycles. However, future behavior of key factors may vary from those used in this measurement. NII at risk measurement assumes, when applicable, that U.S. interest rates floor at zero and does not assume Truist takes any balance sheet or hedging actions in response to the annualized hypotheticalrate scenarios.
Truist evaluates a wide range of alternate scenarios including instantaneous and gradual as well as parallel and non-parallel changes in interest rates. The table below presents the estimated change to NII over the following 12 months for select parallel alternate scenarios, expressed as a percentage change relative to baseline NII. | | | | | | | | | | | |
| | | |
| | | |
| Table 19: Interest Sensitivity Simulation Analysis | | |
| Mar 31, 2024 | | Dec 31, 2023 |
| Up 200bps gradual change in interest rates | (2.35) | % | | (1.46) | % |
| Up 50bps instantaneous change in interest rates | (0.77) | | | (0.36) | |
| Down 50bps instantaneous change in interest rates | 0.31 | | | (0.10) | |
| Down 200bps gradual change in interest rates | 0.45 | | | (0.30) | |
Estimated changes to NII in the table above assume no change in deposit balances or mix relative to the baseline scenario. In increasing interest rate scenarios, rotation from non-interest-bearing into interest bearing deposits would reduce NII. Conversely, in decreasing interest rate scenarios, rotation from higher yielding to lower yielding deposits would benefit net interest income at March 31, 2023 as presentedincome. Truist performs and monitors sensitivity tests of deposit and other key assumptions used in the preceding table.NII risk including:
•Asset prepayment speeds
•New loan volume pricing spreads
•Interest-bearing deposit betas
•Non-interest-bearing demand deposit balance runoff, replaced by market funding
EVE measures changes in the economic value of Truist’s current balance sheet and off-balance sheet hedges under alternate rate scenarios relative to starting economic value. Truist uses financial instruments including derivatives to manageEVE as a longer-term measure of interest rate risk related to securities, commercial loans, MSRs,risk. Truist performs and mortgage banking operations, long-term debt, and other funding sources. Truist has utilized derivatives to facilitate transactions on behalfmonitors sensitivity tests of its clients and as part of associated hedging activities. As of March 31, 2023, Truist had derivative financial instruments outstanding with notional amounts totaling $363.0 billion. See “Note 16. Derivative Financial Instruments” for additional disclosures.key assumptions used in EVE including:
LIBOR Transition•Asset prepayment speeds
•Mortgage spreads (mortgage loan and security valuations)
•Interest-bearing deposit beta
•Deposit runoff / decay
For most tenors of U.S. dollar LIBOR,Key assumption tests are generally performed by increasing and decreasing the administrator of LIBOR extended publication until June 30, 2023. To prepare forassumption, whether static or dynamically modeled, relative to their respective starting values and then measuring the transitionresulting impact to an alternative referenceNII and EVE under baseline and alternate rate management formed a cross-functional project team to address the LIBOR transition. The project team performed an assessment to identify the potential risks related to the transition from LIBOR to a new index or multiple indices and provides updates to Executive Leadership and the Board. As of March 31, 2023, Truist had outstanding LIBOR-based instruments that mature after June 30, 2023, including loan and lease exposures totaling approximately $98 billion, notional derivative exposure totaling approximately $131 billion, long-term debt of $1.1 billion, and preferred stock of $1.5 billion. These amounts are inclusive of remediated contracts, which contain adequate fallback language for the transition.
Contract fallback language for existing loans and leases has been reviewed and certain contracts require amendments to support the transition away from LIBOR. Impacted lines of business have started remediating these contracts to include standardized fallback language or amending contracts to new reference rates at maturities or based on client request. Current fallback language used to remediate contracts that mature after June 30, 2023 is generally consistent with ARRC recommendations and includes use of “hardwired fallback” language, which will transition loans to a SOFR based rate after June 30, 2023.scenarios.
The progressidentification and approachtesting of key assumptions are influenced by market conditions and management views of key risks. The results of key assumption sensitivity tests are reported to remediation varies based on the typeALCO and BRC monthly. The inventory of contractkey assumptions and existing language used in the agreement. For commercial lending, a significant number of remaining LIBOR contracts required client outreachtheir associated sensitivity tests are reviewed with ALCO and remediation. Through mid-2022, the Company’s primary focus was supporting new loan production using SOFR and other alternative reference rates as well as transitioning any renewing LIBOR based contracts to alternative reference rates. Efforts have shifted to amend and remediate contracts, excluding mortgage and student loans, that mature post June 30, 2023 ($90 billion), which will continue to be the focus during 2023. Of the contracts remaining on LIBOR that have not yet been remediated or modified to a new reference rate, Truist’s intends to add updated fallback language or move these contracts to new reference rates prior to cessation. A significant portion of these contracts contain existing fallback language that will transition the contract to a Prime based rate if not remediated, while a smaller population contains no historical fallback language. Should the institution be unable to remediate all contracts, those based on Prime will be prioritized to provide a more consistent client experience with the “hardwired fallback” transition to SOFR. If there are remaining contracts without fallback language, Truist may leverage the LIBOR Act and corresponding safe harbor provision to transition these loans to SOFR.BRC at least annually.
Truist’s adjustable-rate mortgage products ($3.4 billion) have consistent and adequate fallback language to transition away from LIBOR in line with industry expectations; therefore, these contracts do not require remediation. Remediation of student loans ($4.4 billion) will follow recent guidance from the Department of Education on the replacement rate for payment allowances on certain student loans and recent guidance from the CFPB to allow transition to “comparable rates,” in the private student loan portfolio, where LIBOR is used directly. Based on the recent guidance, these portfolios will transition to rates based on SOFR.
Upon the discontinuation of LIBOR, derivatives that reference LIBOR will transition to a SOFR-based replacement rate as set forth in the ISDA protocol addressing LIBOR fallbacks through bilateral amendments, or as established under the LIBOR Act and rules promulgated thereunder by the FRB. Certain derivatives without a clearly defined or practicable replacement benchmark rate will use the LIBOR Act to replace LIBOR with a SOFR-based rate established by FRB rulemaking and follow the ISDA protocol for transition. This legislation will also provide additional administrative benefit for a small portion of the commercial and consumer lending portfolios where contracts do not contain fallback language and have not yet been remediated, providing a remediation path to a SOFR based rate.
Truist Financial Corporation 57
In addition, the transition from LIBOR to an alternative reference rate, such as SOFR, for the Company’s preferred stock and the Company’s and Truist Bank’s floating rate notes is dependent on a number of factors, including the fallback language for the applicable series of preferred stock or notes, the application of the LIBOR Act and the rules promulgated thereunder by the FRB, determinations to be made by third-party calculation or paying agents rather than the Company or Truist Bank as to the replacement rates, and the impact of any publication of a synthetic U.S. dollar LIBOR as currently proposed by the Financial Conduct Authority. With the most recent information available on these factors, Truist expects preferred stock issuances to utilize LIBOR to transition to SOFR. See “Note 12. Shareholders’ Equity” for information about preferred stock using LIBOR.
Training has been provided for impacted teammates and will continue during 2023. Truist will continue to provide timely notices and information to impacted clients about the transition during the first half of 2023. Truist continues to manage the impact of these contracts and other financial instruments, systems implications, hedging strategies, and related operational and market risks on established project plans for business and operational readiness to support the transition.
As of December 31, 2021, Truist ceased entering into new contracts with a LIBOR reference rate for all product offerings, except on a limited basis, as permissible. The Company is actively using SOFR as a reference rate and has originated approximately $124 billion of loans, issued $12.4 billion of senior and subordinated notes, including fixed rate notes that convert to SOFR in the future, and has $108 billion in notional derivative exposure using this alternative reference rate as of March 31, 2023. Alternatives, such as SOFR, may react differently from LIBOR in times of economic stress. Truist expects SOFR to be the primary pricing benchmark used across the industry and will continue to offer additional SOFR based products. Market risks associated with the transition to alternative reference rates are dependent on market conditions as loans are transitioned to alternative reference rates during 2022 and early 2023. Additional alternative reference rates, such as Bloomberg Short Term Bank Yield, will be supported based on market demand. For a further discussion of the various risks associated with the potential cessation of LIBOR and the transition to alternative reference rates, refer to the section titled “Item1A. Risk Factors” in the Form 10-K for the year ended December 31, 2022.
Market Risk from Trading Activities
As a financial intermediary, Truist provides its clients access to derivatives, foreign exchange and securities markets, which generate market risks. Trading market risk is managed using a comprehensive risk management approach, which includes measuring risk using VaR, stress testing, and sensitivity analysis. Risk metrics are monitored against a suite of limits on a daily basis at both the trading desk level and at the aggregate portfolio level, which is intended to ensure that exposures are in line with Truist’s risk appetite.level.
Truist is also subject to risk-based capital guidelines for market risk under the Market Risk Rule.
Truist Financial Corporation 63
Covered Trading Positions
Covered positions subject to the Market Risk Rule include trading assets and liabilities, specifically those held for the purpose of short-term resale or with the intent of benefiting from actual or expected short-term price movements or to lock in arbitrage profits. Truist’s trading portfolio of covered positions results primarily from market making and underwriting services for the Company’s clients, as well as associated risk mitigating hedging activity. The trading portfolio, measured in terms of VaR, consists primarily of four sub-portfolios of covered positions: (i) credit trading, (ii) fixed income securities, (iii) interest rate derivatives, and (iv) equity derivatives. As a market maker across different asset classes, Truist’s trading portfolio also contains other sub-portfolios, including foreign exchange, loan trading, and commodity derivatives; however, these portfolios do not generate material trading risk exposures.
Valuation policies and methodologies exist for all trading positions. Additionally, these positions are subject to independent price verification. See “Note 16. Derivative Financial Instruments,” “Note 15. Fair Value Disclosures,” and “Critical Accounting Policies” herein for discussion of valuation policies and methodologies.
Securitizations
As of March 31, 2023,2024, the aggregate market value of on-balance sheet securitization positions subject to the Market Risk Rule, was $18 million, all of which were non-agency asset backed securities positions.positions, was $71 million. Consistent with the Market Risk Rule requirements, the Company performs pre-purchase due diligence on each securitization position to identify the characteristics including, but not limited to, deal structure and the asset quality of the underlying assets, that materially affect valuation and performance. Securitization positions are subject to Truist’s comprehensive risk management framework, which includes daily monitoring against a suite of limits. There were no off-balance sheet securitization positions during the reporting period.
Correlation Trading Positions
The trading portfolio of covered positions did not contain any correlation trading positions as of March 31, 2023.
58 Truist Financial Corporation
VaR-Based Measures
VaR measures the potential loss of a given position or portfolio of positions at a specified confidence level and time horizon. Truist utilizes a historical VaR methodology to measure and aggregate risks across its covered trading positions. For risk management purposes, the VaR calculation is based on a historical simulation approach and measures the potential trading losses using a one-day holding period at a one-tail, 99% confidence level. For Market Risk Rule purposes, the Company calculates VaR using a 10-day holding period and a 99% confidence level. Due to inherent limitations of the VaR methodology, such as the assumption that past market behavior is indicative of future market performance, VaR is only one of several tools used to measure and manage market risk. Other tools used to actively manage market risk include stress testing, scenario analysis, and stop loss limits.
The trading portfolio’s VaR profile is influenced by a variety of factors, including the size and composition of the portfolio, market volatility, and the correlation between different positions. A portfolio of trading positions is typically less risky than the sum of the risk from each of the individual sub-portfolios, because, under normal market conditions, risk within each category partially offsets the exposure to other risk categories. The following table summarizes certain VaR-based measures for the three months ended March 31, 20232024 and 2022. Average one and ten-day VaR measures for the year ended March 31, 2023 decreased from the same period of last year, primarily driven by lower market making inventory.2023.
| | Table 19: VaR-based Measures | | |
| | Three Months Ended March 31, |
| | 2023 | | 2022 |
| Table 20: VaR-based Measures | |
| Table 20: VaR-based Measures | |
| Table 20: VaR-based Measures | |
| | | Three Months Ended March 31, | |
| | | Three Months Ended March 31, | |
| | | Three Months Ended March 31, | |
| | | | | 2024 | | | | | | | 2024 | | 2023 |
| (Dollars in millions) | (Dollars in millions) | | 10-Day Holding Period | | 1-Day Holding Period | | 10-Day Holding Period | | 1-Day Holding Period | (Dollars in millions) | | | | | | | | | 10-Day Holding Period | | 1-Day Holding Period | | 10-Day Holding Period | | 1-Day Holding Period |
| VaR-based Measures: | VaR-based Measures: | | |
| Maximum | |
| Maximum | |
| Maximum | Maximum | | $ | 22 | | | $ | 9 | | | $ | 38 | | | $ | 14 | |
| Average | Average | | 15 | | | 6 | | | 18 | | | 6 | |
| Minimum | Minimum | | 10 | | | 4 | | | 9 | | | 3 | |
| Period-end | Period-end | | 22 | | | 9 | | | 15 | | | 4 | |
| VaR by Risk Class: | VaR by Risk Class: | | |
| Interest Rate Risk | Interest Rate Risk | | | 8 | | | 4 | |
| Interest Rate Risk | |
| Interest Rate Risk | |
| Credit Spread Risk | Credit Spread Risk | | | 7 | | | 4 | |
| Equity Price Risk | Equity Price Risk | | | 1 | | | 4 | |
| | Foreign Exchange Risk | |
| Portfolio Diversification | Portfolio Diversification | | | (9) | | | (8) | |
| Period-end | Period-end | | | 8 | | | 4 | |
64 Truist Financial Corporation
Stressed VaR-based measures
Stressed VaR, another component of market risk capital, is calculated using the same internal models as used for the VaR-based measure. Stressed VaR is calculated over a ten-day holding period at a one-tail, 99% confidence level and employs a historical simulation approach based on a continuous twelve-month historical window selected to reflect a period of significant financial stress for the Company’s trading portfolio. The following table summarizes Stressed VaR-based measures:
| | Table 20: Stressed VaR-based Measures - 10 Day Holding Period | | |
| | Three Months Ended March 31, |
| Table 21: Stressed VaR-based Measures - 10 Day Holding Period | |
| Table 21: Stressed VaR-based Measures - 10 Day Holding Period | |
| Table 21: Stressed VaR-based Measures - 10 Day Holding Period | |
| | | Three Months Ended March 31, | |
| | | Three Months Ended March 31, | |
| | | Three Months Ended March 31, | |
| (Dollars in millions) | (Dollars in millions) | | 2023 | | 2022 | (Dollars in millions) | | | | | 2024 | | 2023 |
| Maximum | Maximum | | $ | 77 | | | $ | 109 | |
| Average | Average | | 44 | | | 76 | |
| Minimum | Minimum | | 25 | | | 59 | |
| Period-end | Period-end | | 31 | | | 72 | |
Compared to the same period of prior year, both VaR and Stressed VaR measures decreasedwere generally higher, primarily due to lowerhigher market making inventory levels in 2023.2024.
Specific Risk Measures
Specific risk is a measure of idiosyncratic risk that could result from risk factors other than broad market movements (e.g., default or event risks). The Market Risk Rule provides fixed risk weights under a standardized measurement method while also allowing a model-based approach, subject to regulatory approval. Truist utilizes the standardized measurement method to calculate the specific risk component of market risk regulatory capital. As such, incremental risk capital requirements do not apply.
Truist Financial Corporation 59
VaR Model Backtesting
In accordance with the Market Risk Rule, the Company evaluates the accuracy of its VaR model through daily backtesting by comparing aggregate daily trading gains and losses (excluding fees, commissions, reserves, net interest income, and intraday trading) from covered positions with the corresponding daily VaR-based measures generated by the model. As illustrated in the following graph, there were no Company-wide VaR backtesting exceptions during the twelve months ended March 31, 2023.2024. The total number of Company-wide VaR backtesting exceptions over the preceding twelve months is used to determine the multiplication factor for the VaR-based capital requirement under the Market Risk Rule. The capital multiplication factor increases from a minimum of three to a maximum of four, depending on the number of exceptions. All Company-wide VaR backtesting exceptions are thoroughly reviewed in the context of VaR model use and performance. There was no change in the capital multiplication factor over the preceding twelve months.
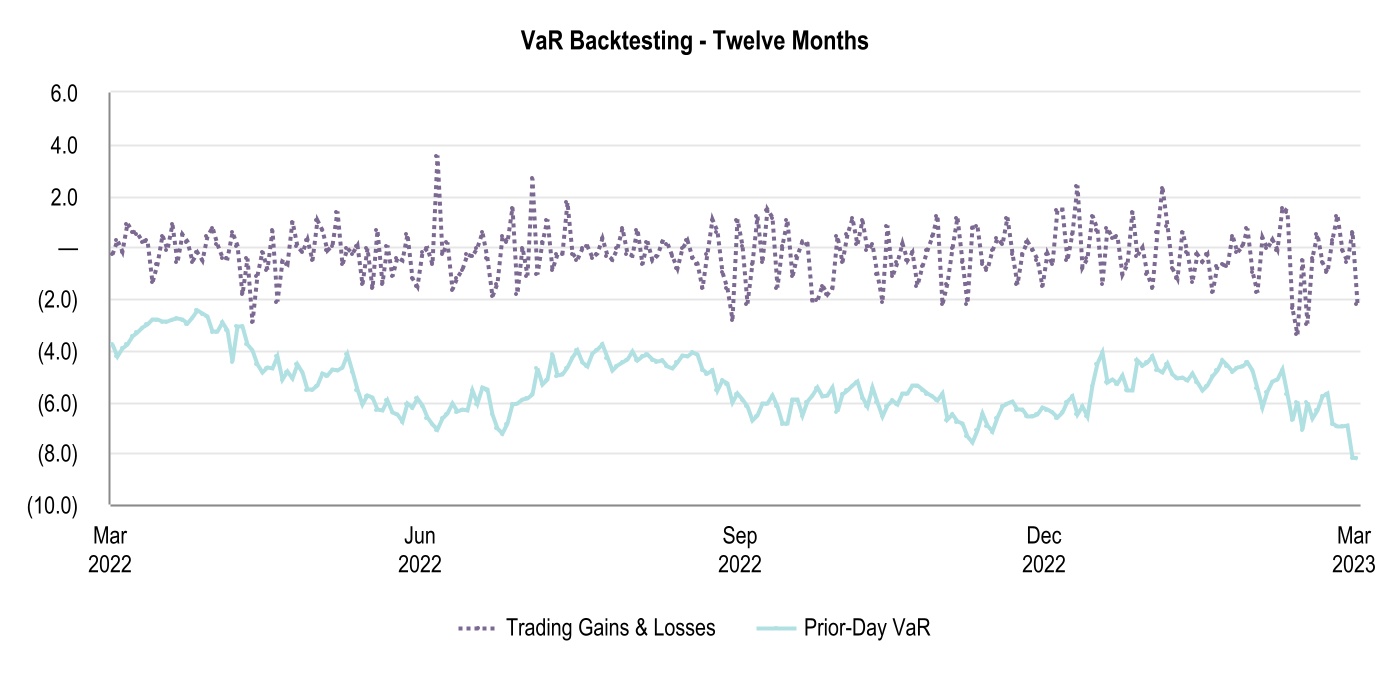
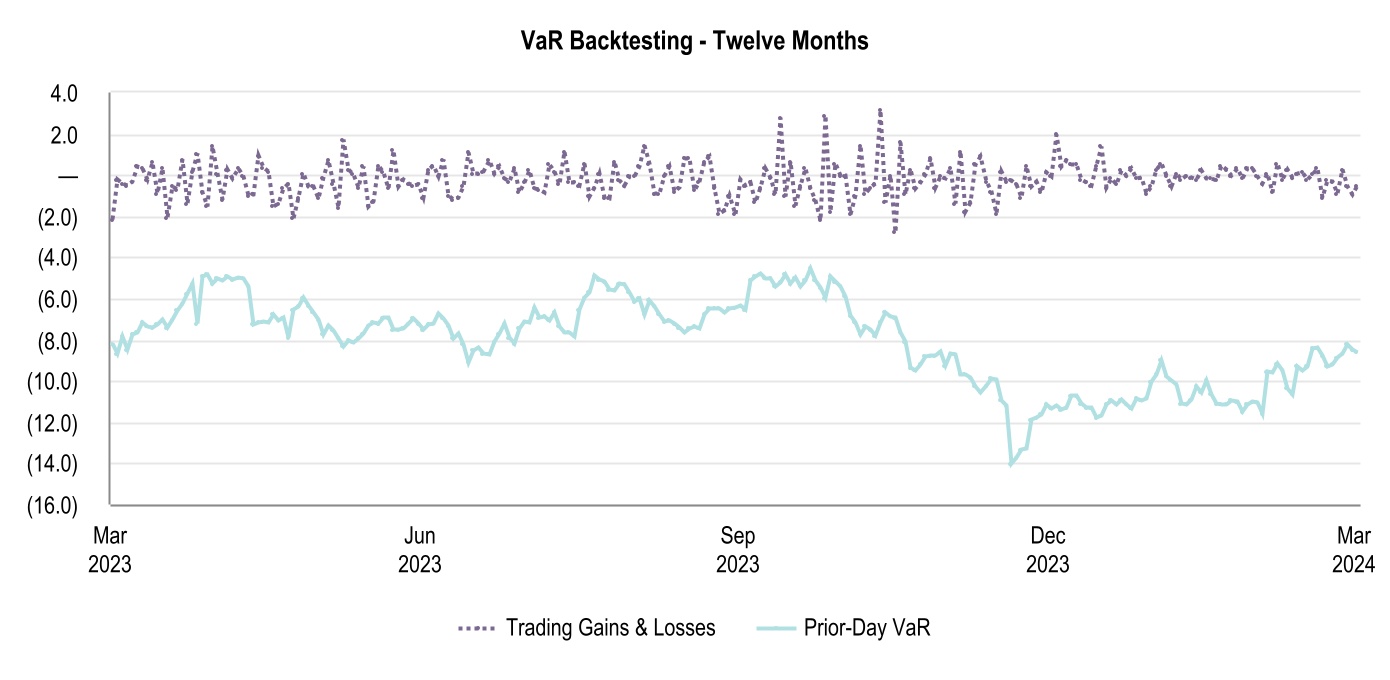
Truist Financial Corporation 65
Model Risk Oversight
MRO is responsible for the independent model validation of all decision tools and models including trading market risk models. The validation activities are conducted in accordance with MRO policy, which incorporates regulatory guidance related to the evaluation of model conceptual soundness, ongoing monitoring, and outcomes analysis. As part of ongoing monitoring efforts, the performance of all trading risk models areis reviewed regularly to preemptively address emerging developments in financial markets, assess evolving modeling approaches, and identify potential model enhancement.
Stress Testing
The Company uses a comprehensive range of stress testing techniques to help monitor risks across trading desks and to augment standard daily VaR and other risk limits reporting. The stress testing framework is designed to quantify the impact of extreme, but plausible, stress scenarios that could lead to large, unexpected losses. Stress tests include simulations for risk factor sensitivities, historical repeats, and hypothetical scenarios with varying liquidity horizons of key risk factor shocks.factors. All trading positions within each applicable market risk category (interest rate risk, equity risk, foreign exchange rate risk, credit spread risk, and commodity price risk) are included in the Company’s comprehensive stress testing framework. Management reviews stress testing scenarios on an ongoing basis and makes updates, as necessary, which is intended to ensure thatcapture both current and emerging risks are captured appropriately.risks. Management also utilizes stress analyses to support the Company’s capital adequacy assessment standards. See the “Capital” section of MD&A for additional discussion of capital adequacy.
Net interest income is liability sensitive as elevated rates and quantitative tightening have led to a reduction in deposits, rotation into interest bearing deposits, and higher deposit betas.
Interest rate scenarios in table 19 assume no change in deposit mix. Further rotation from non-interest bearing into interest bearing deposits would increase the liability sensitivity of Truist’s balance sheet.
Liquidity
Liquidity represents the continuing ability to meet funding needs, including deposit withdrawals, repayment of borrowings and other liabilities, and funding of loan commitments. In addition to the level of liquid assets, such as cash, cash equivalents, and AFS securities, other factors affect the ability to meet liquidity needs, including access to a variety of funding sources, maintaining borrowing capacity, growing core deposits, loan repayment, and the ability to securitize or package loans for sale.
60 Truist Financial Corporation
Truist monitors the ability to meet client demand for funds under both normal and stressed market conditions. In considering its liquidity position, management evaluates Truist’s funding mix based on client core funding, client rate-sensitive funding, and national markets funding. In addition, management evaluates exposure to rate-sensitive funding sources that mature in one year or less. Management also measures liquidity needs against 30 days of stressed cash outflows for Truist and Truist Bank. To ensurepromote a strong liquidity position and compliance with regulatory requirements, management maintains a liquid asset buffer of cash on hand and highly liquid unencumbered securities.
Internal Liquidity Stress Testing
Liquidity stress testing is designed to ensure thatconducted for Truist and Truist Bank have sufficient liquidity forusing a variety of institution-specific and market-wide adverse scenarios. Each liquidity stress test scenario applies defined assumptions to execute sources and uses of liquidity over varying planning horizons. The types of expected liquidity uses during a stressed event may include deposit attrition, contractual maturities, reductions in unsecured and secured funding, and increased draws on unfunded commitments. To mitigate liquidity outflows, Truist has identified sources of liquidity; however, access to these sources of liquidity could be affected within a stressed environment.
Truist maintains a liquidity buffer of cash on hand and highly liquid unencumbered securities that is sufficient to meet the projected net stressed cash-flow needs and maintain compliance with regulatory requirements. The liquidity buffer consists of unencumbered highly liquid assets and Truist’s liquidity buffer is substantially the same in composition to what qualifies as HQLA under the LCR Rule.
Contingency Funding Plan
Truist has a contingency funding plan designed to ensure that liquidity sources are sufficient to meetaddress ongoing obligations and commitments, particularly in the event of a liquidity contraction. This plan is designed to examine and quantify the organization’s liquidity under the various internal liquidity stress scenarios and is periodically tested to assess the plan’s reliability. Additionally, the plan provides a framework for management and other teammates to follow in the event of a liquidity contraction or in anticipation of such an event. The plan addresses authority for activation and decision making, liquidity options, and the responsibilities of key departments in the event of a liquidity contraction.
66 Truist Financial Corporation
LCR and HQLA
The LCR rule requires that Truist and Truist Bank maintain an amount of eligible HQLA that is sufficient to meet its estimated total net cash outflows over a prospective 30 calendar-day period of stress. Eligible HQLA, for purposes of calculating the LCR, is the amount of unencumbered HQLA that satisfy operational requirements of the LCR rule. Truist and Truist Bank are subject to the Category III reduced LCR requirements. Truist held average weighted eligible HQLA of $87.4$85.0 billion and Truist’s average LCR was 113%115% for the three months ended March 31, 2023.2024.
Effective July 2021, Truist became subject to final rules implementing the NSFR, which are designed to ensure thatrequire banking organizations to maintain a stable, long-term funding profile in relation to their asset composition and off-balance sheet activities. At March 31, 2023, the Company2024, Truist was compliant with this requirement.
Sources of Funds
Management believes current sources of liquidity are sufficient to meet Truist’s on- and off-balance sheet obligations. Truist funds its balance sheet through diverse sources of funding including client deposits, secured and unsecured capital markets funding, and shareholders’ equity. Truist Bank’s primary source of funding is client deposits. Continued access to client deposits is highly dependent on public confidence in the stability of Truist Bank and its ability to return funds to clients when requested.
Truist Bank maintains a number of diverse funding sources to meet its liquidity requirements. These sources include unsecured borrowings from the capital markets through the issuance of senior or subordinated bank notes, institutional CDs, overnight and term Federal funds markets, and retail brokered CDs. Truist Bank also maintains access to secured borrowing sources including FHLB advances, repurchase agreements, and the FRB discount window. Available investment securities could be pledged to create additional secured borrowing capacity. The following table presents a summary of Truist Bank’s available secured borrowing capacity and eligible cash at the FRB:
| | | | | | | | | | | |
| Table 21: Selected Liquidity Sources | | |
| (Dollars in millions) | Mar 31, 2023 | | Dec 31, 2022 |
| Unused borrowing capacity: | | | |
| FRB | $ | 53,291 | | | $ | 49,250 | |
| FHLB | 24,678 | | | 20,770 | |
| Available investment securities (after haircuts) | 56,626 | | | 85,401 | |
| Available secured borrowing capacity | 134,595 | | | 155,421 | |
| Eligible cash at the FRB | 31,544 | | | 15,556 | |
| Total | $ | 166,139 | | | $ | 170,977 | |
Truist Financial Corporation 61
| | | | | | | | | | | |
| Table 22: Selected Liquidity Sources | | |
| (Dollars in millions) | Mar 31, 2024 | | Dec 31, 2023 |
| Unused borrowing capacity: | | | |
| FRB | $ | 53,548 | | | $ | 55,252 | |
| FHLB | 25,031 | | | 24,712 | |
| Available investment securities (after haircuts) | 73,520 | | | 74,717 | |
| Available secured borrowing capacity | 152,099 | | | 154,681 | |
| Eligible cash at the FRB | 29,353 | | | 25,085 | |
| Total | $ | 181,452 | | | $ | 179,766 | |
At March 31, 2023,2024, Truist Bank’s available secured borrowing capacity represented approximately 3.6 times the amount of wholesale funding maturities in one-year or less. Truist additionally has the ability to increase sources of funding by pledging available investment securities without a haircut on fair value under the FRB Bank Term Funding Program.
Parent Company
The Parent Company serves as the primary source of capital for the operating subsidiaries. The Parent Company’s assets consist primarily of cash on deposit with Truist Bank, equity investments in subsidiaries, advances to subsidiaries, and notes receivable from subsidiaries. The principal obligations of the Parent Company are payments on long-term debt. The main sources of funds for the Parent Company are dividends and management fees from subsidiaries, repayments of advances to subsidiaries, and proceeds from the issuance of equity and long-term debt. The primary uses of funds by the Parent Company are investments in subsidiaries, advances to subsidiaries, dividend payments to common and preferred shareholders, repurchases of common stock, and payments on and, from time-to-time, potential repurchases or redemptions of a portion of an outstanding tranche of the long-term debt.debt of the Parent Company (as may be permitted by the terms of each respective series). See “Note 22. Parent Company Financial Information” in Truist’s Annual Report on Form 10-K for the year ended December 31, 20222023 for additional information regarding dividends from subsidiaries and debt transactions.
Access to funding at the Parent Company is more sensitive to market disruptions. Therefore, Truist prudently manages cash levels at the Parent Company to cover a minimum of one year of projected cash outflows which includes unfunded external commitments, debt service, common and preferred dividends and scheduled debt maturities, without the benefit of any new cash inflows. Truist maintains a significant buffer above the projected one year of cash outflows. In determining the buffer, Truist considers cash requirements for common and preferred dividends, unfunded commitments to affiliates, serving as a source of strength to Truist Bank, and being able to withstand sustained market disruptions that could limit access to the capital markets. At March 31, 20232024 and December 31, 2022,2023, the Parent Company had 4557 months and 3748 months, respectively, of cash on hand to satisfy projected cash outflows, and 2634 months and 2230 months, respectively, when including the payment of common stock dividends.
Truist Financial Corporation 67
Credit Ratings
Credit ratings are forward-looking opinions of rating agencies as to the Company’s ability to meet its financial commitments and repay its securities and obligations in accordance with their terms of issuance. Credit ratings influence both borrowing costs and access to the capital markets. The Company’s credit ratings are continuously monitored by the rating agencies and are subject to change at any time. As Truist seeks to maintain high-quality credit ratings, management meets with the major rating agencies on a regular basis to provide financial and business updates and to discuss current outlooks and trends. See Item 1A, “Risk Factors” in Truist’s Annual Report on Form 10-K for the year ended December 31, 20222023 for additional information regarding factors that influence credit ratings and potential risks that could materialize in the event of downgrade in the Company’s credit ratings:ratings. Recent changes in the Company’s credit ratings and outlooks include:
•On March 31,2023, S&P GlobalMay 8, 2024, Moody’s Ratings downgraded Truist's long-term senior unsecured rating to Baa1 from A3 and Truist Bank’s baseline credit assessment to a3 from a2 and long-term deposits rating to A1 from Aa3. In addition, Truist Bank’s short-term deposit rating was affirmed the ratings ofat Prime-1. Ratings outlooks for both Truist and Truist Bank and revised the outlook on those ratingswere changed to “stable” from “positive,” citing heightened market volatility in the wake of recent bank failures and, with inflation still elevated, higher uncertainty, and greater downside risk in the economic outlook. The change in outlook was part of a broader action by S&P Global Ratings whereby the “positive” outlook on three other large U.S. banks was revised to “stable.”stable.
Capital
The maintenance of appropriate levels of capital is a management priority and is monitored on a regular basis. Truist’s principal goals related to the maintenance of capital are to provide adequate capital to support Truist’s risk profile consistent with the Board-approved risk appetite, provide financial flexibility to support future growth and client needs, comply with relevant laws, regulations, and supervisory guidance, achieve optimal credit ratings for Truist and its subsidiaries, remain a source of strength for its subsidiaries, and provide a competitive return to shareholders. Risk-based capital ratios, which include CET1 capital, Tier 1 capital, and Total capital are calculated based on regulatory guidance related to the measurement of capital and risk-weighted assets.
62 Truist Financial Corporation
Truist regularly performs stress testing on its capital levels and is required to periodically submit the Company’s capital plans and stress testing results to the banking regulators. Management regularly monitors the capital position of Truist on both a consolidated and bank-level basis. In this regard, management’s objective is to maintain capital at levels that are in excess of internal capital limits, which are above the regulatory “well capitalized”“well-capitalized” minimums. Management has implemented internal stress capital ratio minimums to evaluate whether capital ratios calculated after the effect of alternative capital actions are likely to remain above internal minimums. Breaches of internal stressed minimums prompt a review of the planned capital actions included in Truist’s capital plan. | Table 22: Capital Requirements | | Table 23: Capital Requirements | |
| Table 23: Capital Requirements | |
| Table 23: Capital Requirements | |
| | |
| | |
| | | Minimum Capital | | Well Capitalized | | Minimum Capital Plus Stress Capital Buffer(1) | |
| | | | Truist | | Truist Bank | | |
| CET1 | CET1 | 4.5 | % | | NA | | 6.5 | % | | 7.0 | % | |
| CET1 | |
| CET1 | |
| Tier 1 capital | |
| Tier 1 capital | |
| Tier 1 capital | Tier 1 capital | 6.0 | | | 6.0 | % | | 8.0 | | | 8.5 | | |
| Total capital | Total capital | 8.0 | | | 10.0 | | | 10.0 | | | 10.5 | | |
| Total capital | |
| Total capital | |
| Leverage ratio | |
| Leverage ratio | |
| Leverage ratio | Leverage ratio | 4.0 | | | NA | | 5.0 | | | NA | |
| Supplementary leverage ratio | Supplementary leverage ratio | 3.0 | | | NA | | NA | | NA | |
| Supplementary leverage ratio | |
| Supplementary leverage ratio | |
|
(1)Reflects a SCB requirement of 2.5%2.9% applicable to Truist as of March 31, 2023.2024. Truist’s SCB requirement, received in the 20222023 CCAR process, is effective from October 1, 20222023 to September 30, 2023.2024. Truist will receive a new preliminary SCB requirement, to become effective October 1, 2023,2024, following the release of CCAR 20232024 results in late June 2023.2024.
The FRB’s capital plan rule provides that a BHC must update and resubmit its capital plan if the BHC determines there has been or will be a material change in its risk profile, financial condition, or corporate structure since it last submitted the capital plan. Truist determined that the sale of our remaining equity interests in TIH constitutes such a material change and, therefore, addressed the material change in our capital plan submitted in April 2024. The capital plan rule further provides that, upon the occurrence of an event requiring resubmission, a BHC may not make any capital distribution unless it has received prior approval of the FRB. Accordingly, Truist’s capital distributions are now subject to the prior approval of the FRB, pending the FRB's consideration of our capital plan and stress capital buffer requirement. Truist’s Board of Directors declared common and preferred stock dividends payable in June 2024, which have been approved by the FRB.
Truist’s capital ratios are presented in the following table: | Table 23: Capital Ratios - Truist Financial Corporation | | Table 24: Capital Ratios - Truist Financial Corporation | | Table 24: Capital Ratios - Truist Financial Corporation |
| (Dollars in millions) | (Dollars in millions) | | Mar 31, 2023 | | Dec 31, 2022 | (Dollars in millions) | | Mar 31, 2024 | | Dec 31, 2023 |
| Risk-based: | Risk-based: | | (preliminary) | | | Risk-based: | | (preliminary) | | |
| CET1 | CET1 | | 9.1 | % | | 9.0 | % | CET1 | | 10.1 | % | | 10.1 | % |
| Tier 1 capital | Tier 1 capital | | 10.6 | | | 10.5 | |
| Total capital | Total capital | | 12.6 | | | 12.4 | |
| Leverage ratio | Leverage ratio | | 8.5 | | | 8.5 | |
| Supplementary leverage ratio | Supplementary leverage ratio | | 7.3 | | | 7.3 | |
| Risk-weighted assets | Risk-weighted assets | | $ | 436,549 | | | $ | 434,413 | |
68 Truist Financial Corporation
Capital ratios remained strong compared to the regulatory requirements for well capitalized banks. Truist declared common dividends of $0.52 per share during the first quarter of 2023. The dividend payout ratio for the first quarter of 2023 was 49%.2024. Truist did not repurchase any shares in the first quarter of 2023 outside of standard activity related to equity compensation plans.2024.
TruistTruist’s CET1 ratio was 9.1%10.1% as of March 31, 2023. The increase since2024, flat compared to December 31, 2022 represents2023, as organic capital generation and RWA optimization were partially offset by the CECL phase-in. Truist closed
Truist’s average consolidated LCR was 115% for the sale of the minority stake in Truist Insurance Holdings on April 3, 2023, which adds 30 basis points and 24 basis pointsthree months ended March 31, 2024, compared to the risk-based regulatory capital ratios and leverage ratios, respectively.minimum of 100%.
Share Repurchase Activity
| | | | | | | | | | | | | | | | | | | | | | | |
| Table 24: Share Repurchase Activity |
| (Dollars in millions, except per share data, shares in thousands) | Total Number of Shares Purchased(1) | | Average Price Paid Per Share(2) | | Total Number of Shares Purchased as part of Publicly Announced Plans(3) | | Approximate Dollar Value of Shares that may yet be Purchased Under the Plans(3) |
| January 1, 2023 to January 31, 2023 | — | | | $ | — | | | — | | | $ | 4,100 | |
| February 1, 2023 to February 28, 2023 | 2 | | | 48.84 | | | — | | | 4,100 | |
| March 1, 2023 to March 31, 2023 | 31 | | | 32.10 | | | — | | | 4,100 | |
| Total | 33 | | | $ | 33.09 | | | — | | | |
| | | | | | | | | | | | | | | | | | | | | | | |
| Table 25: Share Repurchase Activity |
| (Dollars in millions, except per share data, shares in thousands) | Total Number of Shares Purchased(1) | | Average Price Paid Per Share(2) | | Total Number of Shares Purchased as part of Publicly Announced Plans | | Approximate Dollar Value of Shares that may yet be Purchased Under the Plans |
| January 1, 2024 to January 31, 2024 | — | | | $ | — | | | — | | | $ | — | |
| February 1, 2024 to February 29, 2024 | — | | | — | | | — | | | — | |
| March 1, 2024 to March 31, 2024 | 9 | | | 34.86 | | | — | | | — | |
| Total | 9 | | | $ | 34.86 | | | — | | | |
(1)Includes shares exchanged or surrendered in connection with the exercise of equity-based awards under equity-based compensation plans.
(2)Excludes commissions.
(3)In July 2022, the Board of Directors approved, effective October 1, 2022, new repurchase authority to effectuate repurchases up to an aggregate of $4.1 billion in shares of the Company’s common stock through September 30, 2023.
Truist Financial Corporation 63
Critical Accounting Policies
The accounting and reporting policies of Truist are in accordance with GAAP and conform to the accounting and reporting guidelines prescribed by bank regulatory authorities. Truist’s financial position and results of operations are affected by management’s application of accounting policies, including estimates, assumptions, and judgments made to arrive at the carrying value of assets and liabilities, and amounts reported for revenues and expenses. Different assumptions in the application of these policies could result in material changes in the consolidated financial position and/or consolidated results of operations, and related disclosures. Material estimates that are particularly susceptible to significant change include the determination of the ACL; determination of fair value for securities, MSRs, LHFS, trading loans, and derivative assets and liabilities; goodwill and other intangible assets; income taxes; and pension and postretirement benefit obligations. Understanding Truist’s accounting policies is fundamental to understanding the consolidated financial position and consolidated results of operations. The critical accounting policies are discussed in MD&A in Truist’s Annual Report on Form 10-K for the year ended December 31, 2022.2023. Significant accounting policies and changes in accounting principles and effects of new accounting pronouncements are discussed in “Note 1. Basis of Presentation” in Form 10-K for the year ended December 31, 2022.2023. Disclosures regarding the effects of new accounting pronouncements are included in “Note 1. Basis of Presentation” in this report. There have been no other changes to the significantcritical accounting policies during 2023.2024.
Goodwill and Other Intangible Assets
Effective January 1, 2024, several business activities were realigned reflecting updates to the Company’s operating structure. First, the CB&W segment was renamed CSBB and the C&CB segment was renamed WB. Second, the Wealth business was realigned into the WB segment from the CSBB segment, representing a separate reporting unit in that segment. Third, the small business banking client segmentation was realigned into the CSBB segment from the WB segment. Further, TIH was the principal legal entity of the IH segment. As the operations of TIH are now included in discontinued operations, the Company no longer presents the IH segment as one of its reportable segments. Following these realignments, the Company’s three reporting units with goodwill balances were CSBB, WB, and Wealth. Also in conjunction with these realignments, goodwill of $1.7 billion was realigned to WB from CSBB based on the relative fair value of CSBB and Wealth, and goodwill of $220 million was realigned to CSBB from WB based on the relative fair value of WB and the realigned small business banking client segmentation. In addition, the Company completed an assessment of any potential goodwill impairment for all impacted reporting units immediately prior and subsequent to the reassignments and determined that no impairment existed.
Truist Financial Corporation 69
The quantitative valuations of these reporting units for purposes of realigning goodwill use the income approach and a market-based approach, each weighted at 50%. The inputs and assumptions specific to each reporting unit are incorporated in the valuations, including projections of future cash flows, discount rates, and applicable valuation multiples based on the comparable public company information. The income approach utilizes a discounted cash flow analysis of multi-year financial forecasts developed for each reporting unit by considering several inputs and assumptions such as net interest margin, expected credit losses, noninterest income, noninterest expense, and required capital. The market-based approach utilizes comparable public company information, key valuation multiples, and considers a market control premium associated with cost synergies and other cash flow benefits that arise from obtaining control over a reporting unit, and guideline transactions, when applicable.
Truist also assesses the reasonableness of the aggregate estimated fair value of the reporting units by comparison to its market capitalization over a reasonable period of time, including consideration of expected acquirer expense synergies, historic bank control premiums, and the current market.
The projection of net interest margin and noninterest expense are the most significant inputs to the financial projections of the CSBB, WB, and Wealth reporting units. The long-term growth rate used in determining the terminal value of each reporting unit was 3% as of January 1, 2024, based on management’s assessment of the minimum expected terminal growth rate of each reporting unit. Discount rates are estimated based on the Capital Asset Pricing Model, which considers the risk-free interest rate, market risk premium, beta, and unsystematic risk adjustments specific to a particular reporting unit. The discount rates are also calibrated based on risks related to the projected cash flows of each reporting unit. The discount rates utilized for the CSBB, WB and Wealth reporting units as of January 1, 2024 were 13.0%, 11.5%, and 12.5%, respectively.
The quantitative valuation of WB performed in conjunction with the goodwill realignments indicated that as of January 1, 2024, the fair value of the WB reporting unit exceeded its carrying value by less than 10%, indicating that the goodwill of the WB reporting unit may be at risk of impairment. Circumstances that could negatively impact the fair value for the WB reporting unit in the future include a sustained decrease in Truist’s stock price, a decline in industry peer multiples, an increase in the applicable discount rate, and deterioration in the reporting unit’s forecast.
The estimated fair value of a reporting unit is highly sensitive to changes in management’s estimates and assumptions; therefore, in some instances, changes in these assumptions could impact whether the fair value of a reporting unit is greater than its carrying value. The valuation of the WB reporting unit as of January 1, 2024 indicated that if the discount rate were increased less than 50 basis points the reporting unit’s fair value would be less than its carrying value, resulting in a goodwill impairment. Ultimately, future potential changes in management’s assumptions may impact the estimated fair value of a reporting unit and cause the fair value of the reporting unit to be below its carrying value. Additionally, a reporting unit’s carrying value could change based on market conditions, change in the underlying makeup of the reporting unit, or the risk profile of those reporting units, which could impact whether the fair value of a reporting unit is less than carrying value.
The Company monitored events and circumstances during the period from January 1, 2024 to March 31, 2024, including macroeconomic and market factors, industry and banking sector events, Truist specific performance indicators, a comparison of management’s forecast and assumptions to those used in its January 1, 2024 quantitative valuations associated with the realignments of goodwill, and the sensitivity of the January 1, 2024 quantitative results to changes in assumptions as of March 31, 2024. Based on these considerations, Truist concluded that it was not more-likely-than-not that the fair value of one or more of its reporting units is below its respective carrying amount as of March 31, 2024.
ITEM 4. CONTROLS AND PROCEDURES
Evaluation of Disclosure Controls and Procedures
As of the end of the period covered by this report, the management of the Company, under the supervision and with the participation of the Company’s CEO and CFO, carried out an evaluation of the effectiveness of the Company’s disclosure controls and procedures as defined in Rules 13a-15(e) and 15d-15(e) of the Exchange Act. Based on that evaluation, the CEO and CFO concluded that the Company’s disclosure controls and procedures were effective as of the end of the period covered by the report.
Changes in Internal Control over Financial Reporting
Management of Truist is responsible for establishing and maintaining adequate internal control over financial reporting as defined in Rule 13a-15(f) of the Exchange Act. The Company’s internal control over financial reporting is a process designed to provide reasonable assurance regarding the reliability of financial reporting and the preparation of financial statements for external purposes in accordance with GAAP.
70 Truist Financial Corporation
There were no changes in the Company’s internal control over financial reporting (as defined in Rules 13a-15(f) and 15d-15(f) of the Exchange Act) that occurred during the quarter ended March 31, 20232024 that have materially affected, or are reasonably likely to materially affect, the Company’s internal control over financial reporting.
Truist Financial Corporation 71
PART II. OTHER INFORMATION
ITEM 1. LEGAL PROCEEDINGS
Refer to the LitigationLegal Proceedings and RegulatoryOther Matters section in “Note 14. Commitments and Contingencies,” which is incorporated by reference into this item.
ITEM 1A. RISK FACTORS
There have been no material changes to the risk factors disclosed in Truist’s Annual Report on Form 10-K for the year ended December 31, 2022.2023. Additional risks and uncertainties not currently known to Truist or that management has deemed to be immaterial also may materially adversely affect Truist’s business, financial condition, or operating results.
ITEM 2. UNREGISTERED SALES OF EQUITY SECURITIES AND USE OF PROCEEDS
Refer to the Share Repurchase Activity section in the MD&A, which is incorporated by reference into this item.
ITEM 5. OTHER INFORMATION
(c) During the three months ended March 31, 2024, no director or officer of the Company adopted or terminated a “Rule 10b5-1 trading arrangement” or “non-Rule 10b5-1 trading arrangement,” as each term is defined in Item 408(a) of Regulation S-K.
6472 Truist Financial Corporation
ITEM 6. EXHIBITS | | | | | | | | | | | | | | | |
| Exhibit No. | | Description | | Location |
| 2.1 | | Equity Interest Purchase Agreement, dated as of February 20, 2024, by and among Trident Butterfly Investor, Inc., Panther Blocker I, Inc., Panther Blocker II, Inc., Truist Bank, Truist TIH Holdings, Inc., Truist TIH Partners, Inc., TIH Management Holdings, LLC, TIH Management Holdings II, LLC and Truist Insurance Holdings, LLC. | | | | |
| | | | | |
| | | | | |
| | | | | |
| | | | | |
| | | | | |
| | | | | |
| | | | | |
| | | | | |
| | | | | |
| | | | | |
| | | | | |
| | | | | |
| | | | | |
| | | | | |
| | | | | |
| | | | | |
| | | | | |
| | | | | |
| | | | | |
| | | | | |
| | | | | |
| | | | | |
| | | | | |
| | | | | |
| | | | | |
| | | | | |
| | | | | |
| | | | | |
| | | | | |
| | | | | |
| | | | | |
| | | | | |
| | | | | |
| | | | | |
| | | | | |
| | | | | |
| | | | | |
| | | | | |
| | | | | |
| | | | | |
| | | | | |
| | | | | |
| | | | | |
| | | | | |
| | | | | |
| | | | | |
| | | | | |
| | | | | |
| | | | | |
| | | | | |
| | | | | |
| | | | | |
| | | | | |
| | | | | |
| | | | | |
| | | | | |
| | | | | |
| | | | | |
| | | | | |
| | | | | |
| | | | | |
| | | | | |
| | | | | |
| | | | | |
| | | | | |
| | | | | |
| | | | | |
| | | | | |
| | | | | |
| | | | | |
| | | | | |
| | | | | |
| | | | | |
| | | | | |
| | | | | |
| | | | | |
| | | | | |
| | | | | |
| | | | | |
| | | | | |
| | | | | |
| | | | | |
| | | | | |
| 10.1* | | Seventh Amendment to the Truist Financial Corporation 401(k) Savings Plan (August 1, 2020 Restatement) | | |
| 10.2* | | Amended and Restated Management Change of Control, Severance, and Noncompetition Plan | | |
| 10.3* | | Form of Restricted Stock Unit Agreement (Senior Executive – 60/5 Retirement) for the Truist Financial Corporation 2022 Incentive Plan. | | |
| 10.2* | | Form of Performance Unit Award Agreement (Senior Executive – 60/510 Retirement) for the Truist Financial Corporation 2022 Incentive Plan. | | |
| 10.3*10.4* | | Form of Performance Unit Award Agreement (Senior Executive – 60/10 Retirement) for the Truist Financial Corporation 2022 Incentive Plan. | | |
| 10.4* | | Form of LTIP Award Agreement (Senior Executive – 60/5 Retirement) for the Truist Financial Corporation 2022 Incentive Plan. | | |
| 10.5* | | Form of LTIP Award Agreement (Senior Executive – 60/10 Retirement) for the Truist Financial Corporation 2022 Incentive Plan. | | |
| 10.6* | | Third Amendment to the Truist Financial Corporation Non-Qualified Defined Contribution Plan | | 2023 Employment Agreement by and between Truist Insurance Holdings, Inc. and John Howard. | |
| 1110.7* | | Statement re computation of earnings per share.Fifth Amendment to the Truist Financial Corporation Non-Qualified Defined Benefit Plan (January 1, 2012 Restatement) | | |
| 10.8* | | Eighth Amendment to the Truist Financial Corporation Pension Plan (October 1, 2020 Restatement) | | | | |
| 10.9* | | Eighth Amendment to the Truist Financial Corporation 401(k) Savings Plan (August 1, 2020 Restatement) | | | | |
| | | | | |
| | | | | |
| | | | | |
| 31.1 | | Certification of Chief Executive Officer pursuant to Rule 13a-14(a) or 15d-14(a) of the Exchange Act, as adopted pursuant to Section 302 of the Sarbanes-Oxley Act of 2002. | | |
| 31.2 | | Certification of Chief Financial Officer pursuant to Rule 13a-14(a) or 15d-14(a) of the Exchange Act, as adopted pursuant to Section 302 of the Sarbanes-Oxley Act of 2002. | | |
| 32 | | Certification of Chief Executive Officer and Chief Financial Officer pursuant to 18 U.S.C. Section 1350, as adopted pursuant to Section 906 of the Sarbanes-Oxley Act of 2002. | | |
| | | | | |
| 101.INS | | XBRL Instance Document – the instance document does not appear in the interactive data file because its XBRL tags are embedded within the inline XBRL document. | | Filed herewith. |
| 101.SCH | | XBRL Taxonomy Extension Schema. | | Filed herewith. |
| 101.CAL | | XBRL Taxonomy Extension Calculation Linkbase. | | Filed herewith. |
| 101.LAB | | XBRL Taxonomy Extension Label Linkbase. | | Filed herewith. |
| 101.PRE | | XBRL Taxonomy Extension Presentation Linkbase. | | Filed herewith. |
| 101.DEF | | XBRL Taxonomy Definition Linkbase. | | Filed herewith. |
| 104 | | Cover Page Interactive Data File (formatted as inline XBRL with applicable taxonomy extension information contained in Exhibits101). | | Filed herewith. |
| |
| * Management compensatory plan or arrangement. |
Truist Financial Corporation 6573
SIGNATURES
Pursuant to the requirements of the Securities Exchange Act of 1934, the registrant has duly caused this report to be signed on its behalf by the undersigned thereunto duly authorized. | | | | | | | | | | | | | | |
| | | TRUIST FINANCIAL CORPORATION (Registrant) |
| | | | |
| Date: | May 1, 20239, 2024 | | By: | /s/ Michael B. Maguire |
| | | | Michael B. Maguire |
| | | | Senior Executive Vice President and Chief Financial Officer |
| | | | (Principal Financial Officer) |
| | | | |
| Date: | May 1, 20239, 2024 | | By: | /s/ Cynthia B. Powell |
| | | | Cynthia B. Powell |
| | | | Executive Vice President and Corporate Controller |
| | | | (Principal Accounting Officer) |
6674 Truist Financial Corporation