
| QUARTERLY REPORT PURSUANT TO SECTION 13 OR 15(d) OF THE SECURITIES EXCHANGE ACT OF 1934 | ||||||||
| TRANSITION REPORT PURSUANT TO SECTION 13 OR 15(d) OF THE SECURITIES EXCHANGE ACT OF 1934 | ||||||||
| Delaware | 38-1490038 | ||||||||||
| (State of Incorporation) | (I.R.S. Employer Identification No.) | ||||||||||
2000 North M-63 | |||||||||||
| Benton Harbor, | Michigan | 49022-2692 | |||||||||
| (Address of principal executive offices) | (Zip Code) | ||||||||||
| Title of each class | Trading symbol(s) | Name of each exchange on which registered | ||||||||||||||||||
| Common stock, par value $1.00 per share | WHR | Chicago Stock Exchange | and | New York Stock Exchange | ||||||||||||||||
Large accelerated filer | ☒ | Accelerated filer | ☐ | ||||||||
Non-accelerated filer | ☐ | Smaller reporting company | ☐ | ||||||||
Emerging growth company | ☐ | ||||||||||
| Class of common stock | Shares outstanding at October 15, 2021 | |||||||
| Common stock, par value $1.00 per share | 60,743,084 | |||||||
| PAGE | |||||||||
| PART I | |||||||||
| Item 1. | |||||||||
| Item 2. | |||||||||
| Item 3. | |||||||||
| Item 4. | |||||||||
| Item 1. | |||||||||
| Item 1A. | |||||||||
| Item 2. | |||||||||
| Item 3. | |||||||||
| Item 4. | |||||||||
| Item 5. | |||||||||
| Item 6. | |||||||||
| PART I. | FINANCIAL INFORMATION | ||
| ITEM 1. | FINANCIAL STATEMENTS | ||||
| PAGE | |||||
| FINANCIAL STATEMENTS AND SUPPLEMENTARY DATA | |||||
| PAGE | ||||||||
| NOTES TO THE CONSOLIDATED CONDENSED FINANCIAL STATEMENTS (UNAUDITED) | ||||||||
| 1. | ||||||||
| 2. | ||||||||
| 3. | ||||||||
| 4. | ||||||||
| 5. | ||||||||
| 6. | ||||||||
| 7. | ||||||||
| 8. | ||||||||
| 9. | ||||||||
| 10. | ||||||||
| 11. | ||||||||
| 12. | ||||||||
| 13. | ||||||||
| 14. | ||||||||
| 15. | ||||||||
| Three Months Ended | Nine Months Ended | |||||||||||||||||||||||||||||||||||||
| Three Months Ended | Nine Months Ended | 2021 | 2020 | 2021 | 2020 | |||||||||||||||||||||||||||||||||
| 2017 | 2016 | 2017 | 2016 | |||||||||||||||||||||||||||||||||||
| Net sales | $ | 5,418 | $ | 5,248 | $ | 15,551 | $ | 15,062 | Net sales | $ | 5,488 | $ | 5,291 | $ | 16,170 | $ | 13,658 | |||||||||||||||||||||
| Expenses | Expenses | |||||||||||||||||||||||||||||||||||||
| Cost of products sold | 4,503 | 4,308 | 12,934 | 12,330 | Cost of products sold | 4,380 | 4,143 | 12,823 | 11,182 | |||||||||||||||||||||||||||||
| Gross margin | 915 | 940 | 2,617 | 2,732 | Gross margin | 1,108 | 1,148 | 3,347 | 2,476 | |||||||||||||||||||||||||||||
| Selling, general and administrative | 521 | 519 | 1,546 | 1,535 | Selling, general and administrative | 524 | 513 | 1,526 | 1,354 | |||||||||||||||||||||||||||||
| Intangible amortization | 18 | 18 | 52 | 54 | Intangible amortization | 10 | 16 | 37 | 46 | |||||||||||||||||||||||||||||
| Restructuring costs | 45 | 29 | 150 | 116 | Restructuring costs | 7 | 63 | 35 | 186 | |||||||||||||||||||||||||||||
| (Gain) loss on sale and disposal of businesses | (Gain) loss on sale and disposal of businesses | 15 | (7) | (105) | (7) | |||||||||||||||||||||||||||||||||
| Operating profit | 331 | 374 | 869 | 1,027 | Operating profit | 552 | 563 | 1,854 | 897 | |||||||||||||||||||||||||||||
| Other (income) expense | Other (income) expense | |||||||||||||||||||||||||||||||||||||
| Interest and sundry (income) expense | 21 | 30 | 69 | 103 | Interest and sundry (income) expense | (78) | (22) | (139) | (38) | |||||||||||||||||||||||||||||
| Interest expense | 42 | 39 | 122 | 118 | Interest expense | 44 | 51 | 134 | 142 | |||||||||||||||||||||||||||||
| Earnings before income taxes | 268 | 305 | 678 | 806 | Earnings before income taxes | 586 | 534 | 1,859 | 793 | |||||||||||||||||||||||||||||
| Income tax (benefit) expense | (4 | ) | 61 | 69 | 64 | |||||||||||||||||||||||||||||||||
| Income tax expense (benefit) | Income tax expense (benefit) | 100 | 141 | 353 | 231 | |||||||||||||||||||||||||||||||||
| Net earnings | 272 | 244 | 609 | 742 | Net earnings | 486 | 393 | 1,506 | 562 | |||||||||||||||||||||||||||||
| Less: Net earnings (loss) available to noncontrolling interests | (4 | ) | 6 | (9 | ) | 34 | Less: Net earnings (loss) available to noncontrolling interests | 15 | 1 | 21 | (14) | |||||||||||||||||||||||||||
| Net earnings available to Whirlpool | $ | 276 | $ | 238 | $ | 618 | $ | 708 | Net earnings available to Whirlpool | $ | 471 | $ | 392 | $ | 1,485 | $ | 576 | |||||||||||||||||||||
| Per share of common stock | Per share of common stock | |||||||||||||||||||||||||||||||||||||
| Basic net earnings available to Whirlpool | $ | 3.78 | $ | 3.14 | $ | 8.36 | $ | 9.26 | Basic net earnings available to Whirlpool | $ | 7.56 | $ | 6.27 | $ | 23.67 | $ | 9.21 | |||||||||||||||||||||
| Diluted net earnings available to Whirlpool | $ | 3.72 | $ | 3.10 | $ | 8.23 | $ | 9.16 | Diluted net earnings available to Whirlpool | $ | 7.51 | $ | 6.19 | $ | 23.47 | $ | 9.14 | |||||||||||||||||||||
| Dividends declared | $ | 1.10 | $ | 1.00 | $ | 3.20 | $ | 2.90 | Dividends declared | $ | 1.40 | $ | 1.20 | $ | 4.05 | $ | 3.60 | |||||||||||||||||||||
| Weighted-average shares outstanding (in millions) | Weighted-average shares outstanding (in millions) | |||||||||||||||||||||||||||||||||||||
| Basic | 72.9 | 75.7 | 73.9 | 76.4 | Basic | 62.2 | 62.6 | 62.7 | 62.6 | |||||||||||||||||||||||||||||
| Diluted | 74.0 | 76.9 | 75.1 | 77.5 | Diluted | 62.7 | 63.3 | 63.2 | 63.1 | |||||||||||||||||||||||||||||
| Comprehensive income | $ | 286 | $ | 289 | $ | 694 | $ | 900 | Comprehensive income | $ | 532 | $ | 370 | $ | 1,905 | $ | 428 | |||||||||||||||||||||
| (Unaudited) | |||||||||||
| September 30, 2021 | December 31, 2020 | ||||||||||
| Assets | |||||||||||
| Current assets | |||||||||||
| Cash and cash equivalents | $ | 2,875 | $ | 2,924 | |||||||
| Accounts receivable, net of allowance of $103 and $132, respectively | 3,187 | 3,109 | |||||||||
| Inventories | 2,876 | 2,301 | |||||||||
| Prepaid and other current assets | 788 | 795 | |||||||||
| Total current assets | 9,726 | 9,129 | |||||||||
| Property, net of accumulated depreciation of $6,627 and $6,780, respectively | 2,713 | 3,199 | |||||||||
| Right of use assets | 973 | 989 | |||||||||
| Goodwill | 2,492 | 2,496 | |||||||||
| Other intangibles, net of accumulated amortization of $519 and $673, respectively | 1,993 | 2,194 | |||||||||
| Deferred income taxes | 2,061 | 2,189 | |||||||||
| Other noncurrent assets | 436 | 240 | |||||||||
| Total assets | $ | 20,394 | $ | 20,436 | |||||||
| Liabilities and stockholders' equity | |||||||||||
| Current liabilities | |||||||||||
| Accounts payable | $ | 5,127 | $ | 4,834 | |||||||
| Accrued expenses | 696 | 637 | |||||||||
| Accrued advertising and promotions | 810 | 831 | |||||||||
| Employee compensation | 587 | 648 | |||||||||
| Notes payable | 12 | 12 | |||||||||
| Current maturities of long-term debt | 298 | 298 | |||||||||
| Other current liabilities | 761 | 1,070 | |||||||||
| Total current liabilities | 8,291 | 8,330 | |||||||||
| Noncurrent liabilities | |||||||||||
| Long-term debt | 4,961 | 5,059 | |||||||||
| Pension benefits | 441 | 516 | |||||||||
| Postretirement benefits | 153 | 166 | |||||||||
| Lease liabilities | 813 | 838 | |||||||||
| Other noncurrent liabilities | 606 | 732 | |||||||||
| Total noncurrent liabilities | 6,974 | 7,311 | |||||||||
| Stockholders' equity | |||||||||||
| Common stock, $1 par value, 250 million shares authorized, 114 million and 113 million shares issued, respectively, and 61 million and 63 million shares outstanding, respectively | 114 | 113 | |||||||||
| Additional paid-in capital | 3,011 | 2,923 | |||||||||
| Retained earnings | 9,957 | 8,725 | |||||||||
| Accumulated other comprehensive loss | (2,412) | (2,811) | |||||||||
| Treasury stock, 53 million and 50 million shares, respectively | (5,706) | (5,065) | |||||||||
| Total Whirlpool stockholders' equity | 4,964 | 3,885 | |||||||||
| Noncontrolling interests | 165 | 910 | |||||||||
| Total stockholders' equity | 5,129 | 4,795 | |||||||||
| Total liabilities and stockholders' equity | $ | 20,394 | $ | 20,436 | |||||||
| (Unaudited) | |||||||
| September 30, 2017 | December 31, 2016 | ||||||
| Assets | |||||||
| Current assets | |||||||
| Cash and cash equivalents | $ | 1,087 | $ | 1,085 | |||
| Accounts receivable, net of allowance of $171 and $185, respectively | 3,102 | 2,711 | |||||
| Inventories | 3,345 | 2,623 | |||||
| Prepaid and other current assets | 1,115 | 920 | |||||
| Total current assets | 8,649 | 7,339 | |||||
| Property, net of accumulated depreciation of $6,741 and $6,055, respectively | 3,865 | 3,810 | |||||
| Goodwill | 3,093 | 2,956 | |||||
| Other intangibles, net of accumulated amortization of $455 and $387, respectively | 2,604 | 2,552 | |||||
| Deferred income taxes | 2,322 | 2,154 | |||||
| Other noncurrent assets | 305 | 342 | |||||
| Total assets | $ | 20,838 | $ | 19,153 | |||
| Liabilities and stockholders’ equity | |||||||
| Current liabilities | |||||||
| Accounts payable | $ | 4,728 | $ | 4,416 | |||
| Accrued expenses | 677 | 649 | |||||
| Accrued advertising and promotions | 792 | 742 | |||||
| Employee compensation | 428 | 390 | |||||
| Notes payable | 1,442 | 34 | |||||
| Current maturities of long-term debt | 671 | 560 | |||||
| Other current liabilities | 898 | 871 | |||||
| Total current liabilities | 9,636 | 7,662 | |||||
| Noncurrent liabilities | |||||||
| Long-term debt | 3,669 | 3,876 | |||||
| Pension benefits | 1,015 | 1,074 | |||||
| Postretirement benefits | 346 | 334 | |||||
| Other noncurrent liabilities | 485 | 479 | |||||
| Total noncurrent liabilities | 5,515 | 5,763 | |||||
| Stockholders’ equity | |||||||
| Common stock, $1 par value, 250 million shares authorized, 112 million and 111 million shares issued, and 72 million and 74 million shares outstanding, respectively | 112 | 111 | |||||
| Additional paid-in capital | 2,733 | 2,672 | |||||
| Retained earnings | 7,697 | 7,314 | |||||
| Accumulated other comprehensive loss | (2,316 | ) | (2,400 | ) | |||
| Treasury stock, 40 million and 37 million shares, respectively | (3,474 | ) | (2,924 | ) | |||
| Total Whirlpool stockholders’ equity | 4,752 | 4,773 | |||||
| Noncontrolling interests | 935 | 955 | |||||
| Total stockholders’ equity | 5,687 | 5,728 | |||||
| Total liabilities and stockholders’ equity | $ | 20,838 | $ | 19,153 | |||
| Nine Months Ended | |||||||||||
| 2021 | 2020 | ||||||||||
| Operating activities | |||||||||||
| Net earnings | $ | 1,506 | $ | 562 | |||||||
| Adjustments to reconcile net earnings to cash provided by (used in) operating activities: | |||||||||||
| Depreciation and amortization | 378 | 414 | |||||||||
| (Gain) loss on sale and disposal of businesses | (105) | — | |||||||||
| (Gain) loss on previously held equity interest | (42) | — | |||||||||
| Changes in assets and liabilities: | |||||||||||
| Accounts receivable | (289) | (663) | |||||||||
| Inventories | (785) | 168 | |||||||||
| Accounts payable | 617 | (162) | |||||||||
| Accrued advertising and promotions | 20 | (179) | |||||||||
| Accrued expenses and current liabilities | 207 | (163) | |||||||||
| Taxes deferred and payable, net | 50 | 88 | |||||||||
| Accrued pension and postretirement benefits | (89) | (55) | |||||||||
| Employee compensation | 10 | 137 | |||||||||
| Other | (184) | 260 | |||||||||
| Cash provided by (used in) operating activities | 1,294 | 407 | |||||||||
| Investing activities | |||||||||||
| Capital expenditures | (306) | (251) | |||||||||
| Proceeds from sale of assets and businesses | 299 | 27 | |||||||||
| Acquisition of businesses, net of cash acquired | (46) | — | |||||||||
| Cash held by divested businesses | (393) | — | |||||||||
| Cash provided by (used in) investing activities | (446) | (224) | |||||||||
| Financing activities | |||||||||||
| Net proceeds from borrowings of long-term debt | 300 | 1,031 | |||||||||
| Net proceeds (repayments) of long-term debt | (300) | (568) | |||||||||
| Net proceeds (repayments) from short-term borrowings | 1 | 1,405 | |||||||||
| Dividends paid | (253) | (232) | |||||||||
| Repurchase of common stock | (641) | (121) | |||||||||
| Common stock issued | 76 | 16 | |||||||||
| Other | (39) | — | |||||||||
| Cash provided by (used in) financing activities | (856) | 1,531 | |||||||||
| Effect of exchange rate changes on cash, cash equivalents and restricted cash | (51) | (125) | |||||||||
| Increase (decrease) in cash, cash equivalents and restricted cash | (59) | 1,589 | |||||||||
| Cash, cash equivalents and restricted cash at beginning of year | 2,934 | 1,952 | |||||||||
| Cash, cash equivalents and restricted cash at end of period | $ | 2,875 | $ | 3,541 | |||||||
| Nine Months Ended | |||||||
| 2017 | 2016 | ||||||
| Operating activities | |||||||
| Net earnings | $ | 609 | $ | 742 | |||
| Adjustments to reconcile net earnings to cash provided by (used in) operating activities: | |||||||
| Depreciation and amortization | 487 | 496 | |||||
| Changes in assets and liabilities: | |||||||
| Accounts receivable | (259 | ) | (438 | ) | |||
| Inventories | (589 | ) | (518 | ) | |||
| Accounts payable | 107 | (187 | ) | ||||
| Accrued advertising and promotions | 18 | (38 | ) | ||||
| Accrued expenses and current liabilities | (154 | ) | 72 | ||||
| Taxes deferred and payable, net | (144 | ) | (149 | ) | |||
| Accrued pension and postretirement benefits | (85 | ) | (53 | ) | |||
| Employee compensation | 49 | (30 | ) | ||||
| Other | (72 | ) | (72 | ) | |||
| Cash used in operating activities | (33 | ) | (175 | ) | |||
| Investing activities | |||||||
| Capital expenditures | (371 | ) | (360 | ) | |||
| Proceeds from sale of assets and business | 5 | 55 | |||||
| Change in restricted cash | 51 | 14 | |||||
| Investment in related businesses | (35 | ) | (10 | ) | |||
| Other | 1 | (2 | ) | ||||
| Cash used in investing activities | (349 | ) | (303 | ) | |||
| Financing activities | |||||||
| Proceeds from borrowings of long-term debt | — | 491 | |||||
| Repayments of long-term debt | (261 | ) | (507 | ) | |||
| Net proceeds from short-term borrowings | 1,365 | 1,369 | |||||
| Dividends paid | (235 | ) | (221 | ) | |||
| Repurchase of common stock | (550 | ) | (425 | ) | |||
| Common stock issued | 33 | 24 | |||||
| Other | (17 | ) | (2 | ) | |||
| Cash provided by financing activities | 335 | 729 | |||||
| Effect of exchange rate changes on cash and cash equivalents | 49 | 2 | |||||
| Increase in cash and cash equivalents | 2 | 253 | |||||
| Cash and cash equivalents at beginning of period | 1,085 | 772 | |||||
| Cash and cash equivalents at end of period | $ | 1,087 | $ | 1,025 | |||
| Note | Page | |
| 1. | ||
| 2. | ||
| 3. | ||
| 4. | ||
| 5. | ||
| 6. | ||
| 7. | ||
| 8. | ||
| 9. | ||
| 10. | ||
| 11. | ||
| 12. | ||
| Standard | Effective Date | |||||||
| 2019-12 | Income Taxes (Topic 740) - Simplifying the Accounting for Income Taxes | January 1, 2021 | ||||||
| Three Months Ended September 30, | Nine Months Ended September 30, | ||||||||||||||||||||||
| Millions of dollars | 2021 | 2020 | 2021 | 2020 | |||||||||||||||||||
| Major product categories: | |||||||||||||||||||||||
| Laundry | $ | 1,498 | $ | 1,588 | $ | 4,447 | $ | 3,989 | |||||||||||||||
| Refrigeration | 1,762 | 1,701 | 5,016 | 4,368 | |||||||||||||||||||
| Cooking | 1,348 | 1,159 | 4,097 | 3,011 | |||||||||||||||||||
| Dishwashing | 479 | 509 | 1,403 | 1,320 | |||||||||||||||||||
| Total major product category net sales | $ | 5,087 | $ | 4,957 | $ | 14,963 | $ | 12,688 | |||||||||||||||
| Spare parts and warranties | 302 | 247 | 860 | 681 | |||||||||||||||||||
| Other | 99 | 87 | 347 | 289 | |||||||||||||||||||
| Total net sales | $ | 5,488 | $ | 5,291 | $ | 16,170 | $ | 13,658 | |||||||||||||||
| Millions of dollars | December 31, 2020 | Charged to Earnings | Write-offs | Foreign Currency | Other (1) | September 30, 2021 | ||||||||||||||
| Accounts receivable allowance | ||||||||||||||||||||
| North America | $ | 7 | $ | 4 | (3) | — | $ | — | $ | 8 | ||||||||||
| EMEA | 67 | 1 | (15) | (6) | — | $ | 47 | |||||||||||||
| Latin America | 44 | 4 | (2) | (1) | — | $ | 45 | |||||||||||||
| Asia | 14 | — | — | — | (11) | $ | 3 | |||||||||||||
| Consolidated | $ | 132 | $ | 9 | $ | (20) | $ | (7) | $ | (11) | $ | 103 | ||||||||
| Financing receivable allowance | ||||||||||||||||||||
| Latin America | $ | 27 | $ | — | $ | — | $ | (1) | $ | — | $ | 26 | ||||||||
| Asia | 21 | — | — | — | (21) | — | ||||||||||||||
| $ | 48 | $ | — | $ | — | $ | (1) | $ | (21) | $ | 26 | |||||||||
| Consolidated | $ | 180 | $ | 9 | $ | (20) | $ | (8) | $ | (32) | $ | 129 | ||||||||
| September 30, | |||||||||||
| Millions of dollars | 2021 | 2020 | |||||||||
| Cash and cash equivalents as presented in our Consolidated Condensed Balance Sheets | $ | 2,875 | $ | 3,528 | |||||||
Restricted cash included in prepaid and other current assets(1) | — | 13 | |||||||||
| Cash, cash equivalents and restricted cash as presented in our Consolidated Condensed Statements of Cash Flows | $ | 2,875 | $ | 3,541 | |||||||
| December 31, | |||||||||||
| Millions of dollars | 2020 | 2019 | |||||||||
| Cash and cash equivalents as presented in our Consolidated Balance Sheets | $ | 2,924 | $ | 1,952 | |||||||
Restricted cash included in prepaid and other current assets (1) | 10 | — | |||||||||
| Cash, cash equivalents and restricted cash as presented in our Consolidated Statements of Cash Flows | $ | 2,934 | $ | 1,952 | |||||||
| Millions of dollars | September 30, 2021 | December 31, 2020 | ||||||||||||
| Finished products | $ | 2,134 | $ | 1,635 | ||||||||||
| Raw materials and work in process | 742 | 666 | ||||||||||||
| Total Inventories | $ | 2,876 | $ | 2,301 | ||||||||||
| Millions of dollars | September 30, 2021 | December 31, 2020 | ||||||||||||
| Land | $ | 83 | $ | 92 | ||||||||||
| Buildings | 1,289 | 1,517 | ||||||||||||
| Machinery and equipment | 7,968 | 8,370 | ||||||||||||
| Accumulated depreciation | (6,627) | (6,780) | ||||||||||||
Property, plant and equipment, net (1) | $ | 2,713 | $ | 3,199 | ||||||||||
| Millions of dollars | September 30, 2021 | December 31, 2020 | ||||||||||||
| Short-term borrowings due to banks | 12 | 12 | ||||||||||||
| Total notes payable | $ | 12 | $ | 12 | ||||||||||
| Product Warranty | ||||||||||||||
| Millions of dollars | 2021 | 2020 | ||||||||||||
| Balance at January 1 | $ | 273 | $ | 383 | ||||||||||
| Issuances/accruals during the period | 258 | 178 | ||||||||||||
| Settlements made during the period/other | (220) | (272) | ||||||||||||
| Balance at September 30 | $ | 311 | $ | 289 | ||||||||||
| Current portion | $ | 211 | $ | 186 | ||||||||||
| Non-current portion | 100 | 104 | ||||||||||||
| Total | $ | 311 | $ | 289 | ||||||||||
| Three Months Ended September 30, | ||||||||||||||||||||||||||||||||||||||
| United States Pension Benefits | Foreign Pension Benefits | Other Postretirement Benefits | ||||||||||||||||||||||||||||||||||||
| Millions of dollars | 2021 | 2020 | 2021 | 2020 | 2021 | 2020 | ||||||||||||||||||||||||||||||||
| Service cost | $ | 1 | $ | 1 | $ | 1 | $ | 1 | $ | — | $ | 1 | ||||||||||||||||||||||||||
| Interest cost | 20 | 25 | 4 | 4 | 1 | 1 | ||||||||||||||||||||||||||||||||
| Expected return on plan assets | $ | (39) | $ | (42) | $ | (9) | $ | (7) | $ | — | $ | — | ||||||||||||||||||||||||||
| Amortization: | ||||||||||||||||||||||||||||||||||||||
| Actuarial loss | $ | 17 | $ | 15 | $ | 4 | $ | 3 | $ | — | $ | — | ||||||||||||||||||||||||||
| Prior service credit | — | — | — | — | (12) | (12) | ||||||||||||||||||||||||||||||||
| Settlement and curtailment (gain) loss | 2 | — | — | 1 | — | — | ||||||||||||||||||||||||||||||||
| Net periodic benefit cost (credit) | $ | 1 | $ | (1) | $ | — | $ | 2 | $ | (11) | $ | (10) | ||||||||||||||||||||||||||
| Nine Months Ended September 30, | ||||||||||||||||||||||||||||||||||||||
| United States Pension Benefits | Foreign Pension Benefits | Other Postretirement Benefits | ||||||||||||||||||||||||||||||||||||
| Millions of dollars | 2021 | 2020 | 2021 | 2020 | 2021 | 2020 | ||||||||||||||||||||||||||||||||
| Service cost | $ | 2 | $ | 2 | $ | 4 | $ | 4 | $ | — | $ | 4 | ||||||||||||||||||||||||||
| Interest cost | 58 | 74 | 11 | 13 | 4 | 7 | ||||||||||||||||||||||||||||||||
| Expected return on plan assets | (118) | (124) | (26) | (22) | — | — | ||||||||||||||||||||||||||||||||
| Amortization: | ||||||||||||||||||||||||||||||||||||||
| Actuarial loss | 52 | 46 | 14 | 9 | — | — | ||||||||||||||||||||||||||||||||
| Prior service credit | — | — | — | — | (35) | (16) | ||||||||||||||||||||||||||||||||
| Settlement and curtailment (gain) loss | 5 | — | — | 1 | — | (4) | ||||||||||||||||||||||||||||||||
| Net periodic benefit cost (credit) | $ | (1) | $ | (2) | $ | 3 | $ | 5 | $ | (31) | $ | (9) | ||||||||||||||||||||||||||
| Three Months Ended September 30, | ||||||||||||||||||||||||||||||||||||||
| United States Pension Benefits | Foreign Pension Benefits | Other Postretirement Benefits | ||||||||||||||||||||||||||||||||||||
| Millions of dollars | 2021 | 2020 | 2021 | 2020 | 2021 | 2020 | ||||||||||||||||||||||||||||||||
| Operating profit (loss) | $ | 1 | $ | 1 | $ | 1 | $ | 1 | $ | — | $ | 1 | ||||||||||||||||||||||||||
| Interest and sundry (income) expense | — | (2) | (1) | 1 | (11) | (11) | ||||||||||||||||||||||||||||||||
| Net periodic benefit cost | $ | 1 | $ | (1) | $ | — | $ | 2 | $ | (11) | $ | (10) | ||||||||||||||||||||||||||
| Nine Months Ended September 30, | ||||||||||||||||||||||||||||||||||||||
| United States Pension Benefits | Foreign Pension Benefits | Other Postretirement Benefits | ||||||||||||||||||||||||||||||||||||
| Millions of dollars | 2021 | 2020 | 2021 | 2020 | 2021 | 2020 | ||||||||||||||||||||||||||||||||
| Operating profit (loss) | $ | 2 | $ | 2 | $ | 4 | $ | 4 | $ | — | $ | 4 | ||||||||||||||||||||||||||
| Interest and sundry (income) expense | (3) | (4) | (1) | 1 | (31) | (13) | ||||||||||||||||||||||||||||||||
| Net periodic benefit cost | $ | (1) | $ | (2) | $ | 3 | $ | 5 | $ | (31) | $ | (9) | ||||||||||||||||||||||||||
| Notional (Local) | Notional (USD) | Current Maturity | ||||||||||||||||||||||||||||||
| Instrument | 2021 | 2020 | 2021 | 2020 | ||||||||||||||||||||||||||||
| Foreign exchange forwards/options | MXN | 7,200 | MXN | 7,200 | $ | 350 | $ | 362 | August 2022 | |||||||||||||||||||||||
| Fair Value of | ||||||||||||||||||||||||||||||||||||||||||||||||||||||||
| Notional Amount | Hedge Assets | Hedge Liabilities | Maximum Term (Months) | |||||||||||||||||||||||||||||||||||||||||||||||||||||
| Millions of dollars | 2021 | 2020 | 2021 | 2020 | 2021 | 2020 | 2021 | 2020 | ||||||||||||||||||||||||||||||||||||||||||||||||
Derivatives accounted for as hedges(1) | ||||||||||||||||||||||||||||||||||||||||||||||||||||||||
| Commodity swaps/options | $ | 268 | $ | 215 | $ | 48 | $ | 39 | $ | 3 | $ | 4 | (CF) | 21 | 30 | |||||||||||||||||||||||||||||||||||||||||
| Foreign exchange forwards/options | 2,871 | 3,028 | 107 | 58 | 62 | 110 | (CF/NI) | 125 | 134 | |||||||||||||||||||||||||||||||||||||||||||||||
| Cross-currency swaps | 1,275 | 1,275 | 25 | 23 | 27 | 86 | (CF) | 89 | 98 | |||||||||||||||||||||||||||||||||||||||||||||||
| Interest rate derivatives | 300 | 300 | — | — | 7 | 28 | (CF) | 44 | 53 | |||||||||||||||||||||||||||||||||||||||||||||||
| Total derivatives accounted for as hedges | $ | 180 | $ | 120 | $ | 99 | $ | 228 | ||||||||||||||||||||||||||||||||||||||||||||||||
| Derivatives not accounted for as hedges | ||||||||||||||||||||||||||||||||||||||||||||||||||||||||
| Commodity swaps/options | $ | 1 | $ | 1 | $ | — | $ | — | $ | — | $ | — | N/A | 0 | 0 | |||||||||||||||||||||||||||||||||||||||||
| Foreign exchange forwards/options | 2,970 | 4,161 | 33 | 25 | 17 | 96 | N/A | 11 | 12 | |||||||||||||||||||||||||||||||||||||||||||||||
| Total derivatives not accounted for as hedges | 33 | 25 | 17 | 96 | ||||||||||||||||||||||||||||||||||||||||||||||||||||
| Total derivatives | $ | 213 | $ | 145 | $ | 116 | $ | 324 | ||||||||||||||||||||||||||||||||||||||||||||||||
| Current | $ | 205 | $ | 103 | $ | 80 | $ | 152 | ||||||||||||||||||||||||||||||||||||||||||||||||
| Noncurrent | 8 | 42 | 36 | 172 | ||||||||||||||||||||||||||||||||||||||||||||||||||||
| Total derivatives | $ | 213 | $ | 145 | $ | 116 | $ | 324 | ||||||||||||||||||||||||||||||||||||||||||||||||
| Three Months Ended September 30, | ||||||||||||||||||||||||||
Gain (Loss) Recognized in OCI (Effective Portion ) (2) | ||||||||||||||||||||||||||
| Millions of dollars | 2021 | 2020 | ||||||||||||||||||||||||
| Cash flow hedges | ||||||||||||||||||||||||||
| Commodity swaps/options | $ | 9 | $ | 23 | ||||||||||||||||||||||
| Foreign exchange forwards/options | 62 | (37) | ||||||||||||||||||||||||
| Cross-currency swaps | 40 | (62) | ||||||||||||||||||||||||
| Interest rate derivatives | 1 | 13 | ||||||||||||||||||||||||
| Net Investment hedges | ||||||||||||||||||||||||||
| Foreign currency | 7 | (14) | ||||||||||||||||||||||||
| 119 | (77) | |||||||||||||||||||||||||
| Three Months Ended September 30, | ||||||||||||||||||||||||||
| Location of Gain (Loss) Reclassified from OCI into Earnings (Effective Portion) | Gain (Loss) Reclassified from OCI into Earnings (Effective Portion)(3) | |||||||||||||||||||||||||
| Cash Flow Hedges - Millions of dollars | 2021 | 2020 | ||||||||||||||||||||||||
| Commodity swaps/options | Cost of products sold | $ | 21 | $ | (4) | |||||||||||||||||||||
| Foreign exchange forwards/options | Net sales | (2) | 2 | |||||||||||||||||||||||
| Foreign exchange forwards/options | Cost of products sold | (9) | 11 | |||||||||||||||||||||||
| Foreign exchange forwards/options | Interest and sundry (income) expense | 14 | (21) | |||||||||||||||||||||||
| Cross-currency swaps | Interest and sundry (income) expense | 37 | (51) | |||||||||||||||||||||||
| 61 | (63) | |||||||||||||||||||||||||
| Three Months Ended September 30, | ||||||||||||||||||||||||||
| Location of Gain (Loss) Recognized on Derivatives not Accounted for as Hedges | Gain (Loss) Recognized on Derivatives not Accounted for as Hedges | |||||||||||||||||||||||||
| Derivatives not Accounted for as Hedges - Millions of dollars | 2021 | 2020 | ||||||||||||||||||||||||
| Foreign exchange forwards/options | Interest and sundry (income) expense | $ | 38 | $ | (18) | |||||||||||||||||||||
| Nine Months Ended September 30, | ||||||||||||||||||||||||||
Gain (Loss) Recognized in OCI (Effective Portion)(4) | ||||||||||||||||||||||||||
| Millions of dollars | 2021 | 2020 | ||||||||||||||||||||||||
| Cash flow hedges | ||||||||||||||||||||||||||
| Commodity swaps/options | $ | 63 | $ | (8) | ||||||||||||||||||||||
| Foreign exchange | 69 | 58 | ||||||||||||||||||||||||
| Cross-currency swaps | 84 | 33 | ||||||||||||||||||||||||
| Interest rate derivatives | 21 | (53) | ||||||||||||||||||||||||
| Net investment hedges | ||||||||||||||||||||||||||
| Foreign currency | 4 | 39 | ||||||||||||||||||||||||
| $ | 241 | $ | 69 | |||||||||||||||||||||||
| Nine Months Ended September 30, | ||||||||||||||||||||||||||
| Location of Gain (Loss) Reclassified from OCI into Earnings (Effective Portion) | Gain (Loss) Reclassified from OCI into Earnings (Effective Portion)(5) | |||||||||||||||||||||||||
| Cash Flow Hedges - Millions of dollars | 2021 | 2020 | ||||||||||||||||||||||||
| Commodity swaps/options | Cost of products sold | $ | 50 | $ | (21) | |||||||||||||||||||||
| Foreign exchange forwards/options | Net sales | — | 5 | |||||||||||||||||||||||
| Foreign exchange forwards/options | Cost of products sold | (3) | 20 | |||||||||||||||||||||||
| Foreign exchange forwards/options | Interest and sundry (income) expense | 43 | (52) | |||||||||||||||||||||||
| Cross-currency swaps | Interest and sundry (income) expense | 88 | (40) | |||||||||||||||||||||||
| $ | 178 | $ | (88) | |||||||||||||||||||||||
| Nine Months Ended September 30, | ||||||||||||||||||||||||||
| Location of Gain (Loss) Recognized on Derivatives not Accounted for as Hedges | Gain (Loss) Recognized on Derivatives not Accounted for as Hedges | |||||||||||||||||||||||||
| Derivatives not Accounted for as Hedges - Millions of dollars | 2021 | 2020 | ||||||||||||||||||||||||
| Foreign exchange forwards/options | Interest and sundry (income) expense | $ | 70 | $ | (1) | |||||||||||||||||||||
| Fair Value | ||||||||||||||||||||||||||||||||||||||||||||||||||||||||||||||||||||||||||||||||||||||||||||||
| Total Cost Basis | Level 1 | Level 2 | Total | Fair Value | ||||||||||||||||||||||||||||||||||||||||||||||||||||||||||||||||||||||||||||||||||||||||||
| Millions of dollars | 2017 | 2016 | 2017 | 2016 | 2017 | 2016 | 2017 | 2016 | Millions of dollars | Total Cost Basis | Level 1 | Level 2 (2) | Total | |||||||||||||||||||||||||||||||||||||||||||||||||||||||||||||||||||||||||||||||||
Money market funds(1) | $ | 32 | $ | 29 | $ | 32 | $ | 29 | $ | — | $ | — | $ | 32 | $ | 29 | ||||||||||||||||||||||||||||||||||||||||||||||||||||||||||||||||||||||||||||||
| Measured at fair value on a recurring basis: | Measured at fair value on a recurring basis: | 2021 | 2020 | 2021 | 2020 | 2021 | 2020 | 2021 | 2020 | |||||||||||||||||||||||||||||||||||||||||||||||||||||||||||||||||||||||||||||||||||||
Short-term investments (1) | Short-term investments (1) | $ | 2,105 | $ | 2,164 | $ | 1,926 | $ | 1,603 | $ | 179 | $ | 561 | $ | 2,105 | $ | 2,164 | |||||||||||||||||||||||||||||||||||||||||||||||||||||||||||||||||||||||||||||
| Net derivative contracts | — | — | — | — | (84 | ) | 41 | (84 | ) | 41 | Net derivative contracts | — | — | — | — | 97 | (179) | 97 | (179) | |||||||||||||||||||||||||||||||||||||||||||||||||||||||||||||||||||||||||||
| Available for sale investments | 6 | 4 | 23 | 16 | — | — | 23 | 16 | ||||||||||||||||||||||||||||||||||||||||||||||||||||||||||||||||||||||||||||||||||||||
| Millions of dollars | September 30, 2017 | December 31, 2016 | ||||||
| Finished products | $ | 2,729 | $ | 2,070 | ||||
| Raw materials and work in process | 715 | 651 | ||||||
| 3,444 | 2,721 | |||||||
| Less: excess of FIFO cost over LIFO cost | (99 | ) | (98 | ) | ||||
| Total inventories | $ | 3,345 | $ | 2,623 | ||||
| Millions of dollars | September 30, 2017 | December 31, 2016 | ||||||
| Land | $ | 126 | $ | 128 | ||||
| Buildings | 1,683 | 1,652 | ||||||
| Machinery and equipment | 8,797 | 8,085 | ||||||
| Accumulated depreciation | (6,741 | ) | (6,055 | ) | ||||
| Property, plant and equipment, net | $ | 3,865 | $ | 3,810 | ||||
| Millions of dollars | September 30, 2017 | December 31, 2016 | ||||||
| Commercial paper | $ | 1,138 | $ | — | ||||
| Short-term borrowings to banks | 304 | 34 | ||||||
| Total notes payable | $ | 1,442 | $ | 34 | ||||
| Whirlpool Stockholders' Equity | ||||||||||||||||||||||||||||||||||||||
| Total | Retained Earnings | Accumulated Other Comprehensive Income (Loss) | Treasury Stock / Additional Paid-In-Capital | Common Stock | Non-Controlling Interest (1) | |||||||||||||||||||||||||||||||||
| Balances, December 31, 2020 | $ | 4,795 | $ | 8,725 | $ | (2,811) | $ | (2,142) | $ | 113 | $ | 910 | ||||||||||||||||||||||||||
| Comprehensive income | ||||||||||||||||||||||||||||||||||||||
| Net earnings | 440 | 433 | — | — | — | 7 | ||||||||||||||||||||||||||||||||
| Other comprehensive income | 124 | — | 124 | — | — | — | ||||||||||||||||||||||||||||||||
| Comprehensive income | 564 | 433 | 124 | — | — | 7 | ||||||||||||||||||||||||||||||||
| Stock issued (repurchased) | (141) | — | — | (141) | — | — | ||||||||||||||||||||||||||||||||
| Dividends declared | (79) | (79) | — | — | — | — | ||||||||||||||||||||||||||||||||
| Balances, March 31, 2021 | 5,139 | 9,079 | (2,687) | (2,283) | 113 | 917 | ||||||||||||||||||||||||||||||||
| Comprehensive income | ||||||||||||||||||||||||||||||||||||||
| Net earnings | 580 | 581 | — | — | — | (1) | ||||||||||||||||||||||||||||||||
| Other comprehensive income | 229 | — | 228 | — | — | 1 | ||||||||||||||||||||||||||||||||
| Comprehensive income | 809 | 581 | 228 | — | — | — | ||||||||||||||||||||||||||||||||
| Stock issued (repurchased) | 8 | — | — | 7 | 1 | — | ||||||||||||||||||||||||||||||||
| Dividends declared | (88) | (88) | — | — | — | — | ||||||||||||||||||||||||||||||||
| Divestitures | (783) | — | — | — | — | (783) | ||||||||||||||||||||||||||||||||
| Balances, June 30, 2021 | 5,085 | 9,572 | (2,459) | (2,276) | 114 | 134 | ||||||||||||||||||||||||||||||||
| Comprehensive income | ||||||||||||||||||||||||||||||||||||||
| Net earnings | 486 | 471 | — | — | — | 15 | ||||||||||||||||||||||||||||||||
| Other comprehensive income | 46 | — | 47 | — | — | (1) | ||||||||||||||||||||||||||||||||
| Comprehensive income | 532 | 471 | 47 | — | — | 14 | ||||||||||||||||||||||||||||||||
| Stock issued (repurchased) | (419) | — | — | (419) | — | — | ||||||||||||||||||||||||||||||||
| Dividends declared | (88) | (86) | — | — | — | (2) | ||||||||||||||||||||||||||||||||
Acquisitions(2) | 19 | — | — | — | — | 19 | ||||||||||||||||||||||||||||||||
| Balances, September 30, 2021 | $ | 5,129 | $ | 9,957 | $ | (2,412) | $ | (2,695) | $ | 114 | $ | 165 | ||||||||||||||||||||||||||
| Product Warranty | Legacy Product Warranty | Total | ||||||||||||||||||||||
| Millions of dollars | 2017 | 2016 | 2017 | 2016 | 2017 | 2016 | ||||||||||||||||||
| Balance at January 1 | $ | 251 | $ | 239 | $ | 69 | $ | 254 | $ | 320 | $ | 493 | ||||||||||||
| Issuances/accruals during the period | 251 | 228 | 1 | — | 252 | 228 | ||||||||||||||||||
| Settlements made during the period/other | (226 | ) | (218 | ) | (70 | ) | (145 | ) | (296 | ) | (363 | ) | ||||||||||||
| Balance at September 30 | $ | 276 | $ | 249 | $ | — | $ | 109 | $ | 276 | $ | 358 | ||||||||||||
| Current portion | $ | 203 | $ | 188 | $ | — | $ | 109 | $ | 203 | $ | 297 | ||||||||||||
| Non-current portion | 73 | 61 | — | — | 73 | 61 | ||||||||||||||||||
| Total | $ | 276 | $ | 249 | $ | — | $ | 109 | $ | 276 | $ | 358 | ||||||||||||
| Whirlpool Stockholders' Equity | ||||||||||||||||||||||||||||||||||||||
| Total | Retained Earnings | Accumulated Other Comprehensive Income (Loss) | Treasury Stock / Additional Paid-In-Capital | Common Stock | Non-Controlling Interest | |||||||||||||||||||||||||||||||||
| Balances, December 31, 2019 | $ | 4,210 | $ | 7,962 | $ | (2,618) | $ | (2,169) | $ | 112 | $ | 923 | ||||||||||||||||||||||||||
| Comprehensive income | ||||||||||||||||||||||||||||||||||||||
| Net earnings | 149 | 154 | — | — | — | (5) | ||||||||||||||||||||||||||||||||
| Other comprehensive income | (95) | — | (97) | — | — | 2 | ||||||||||||||||||||||||||||||||
| Comprehensive income | 54 | 154 | (97) | — | — | (3) | ||||||||||||||||||||||||||||||||
| Stock issued (repurchased) | (115) | — | — | (115) | — | — | ||||||||||||||||||||||||||||||||
| Dividends declared | (75) | (75) | — | — | — | — | ||||||||||||||||||||||||||||||||
| Balances, March 31, 2020 | $ | 4,074 | $ | 8,041 | $ | (2,715) | $ | (2,284) | $ | 112 | $ | 920 | ||||||||||||||||||||||||||
| Comprehensive income | ||||||||||||||||||||||||||||||||||||||
| Net earnings | 20 | 30 | — | — | — | (10) | ||||||||||||||||||||||||||||||||
| Other comprehensive income | (16) | — | (16) | — | — | — | ||||||||||||||||||||||||||||||||
| Comprehensive income | 4 | 30 | (16) | — | — | (10) | ||||||||||||||||||||||||||||||||
| Stock issued (repurchased) | 19 | — | — | 19 | — | — | ||||||||||||||||||||||||||||||||
| Dividends declared | (83) | (80) | — | — | — | (3) | ||||||||||||||||||||||||||||||||
| Balances, June 30, 2020 | 4,014 | 7,991 | (2,731) | (2,265) | 112 | 907 | ||||||||||||||||||||||||||||||||
| Comprehensive income | ||||||||||||||||||||||||||||||||||||||
| Net earnings | 393 | 392 | — | — | — | 1 | ||||||||||||||||||||||||||||||||
| Other comprehensive income | (23) | — | (23) | — | — | — | ||||||||||||||||||||||||||||||||
| Comprehensive income | 370 | 392 | (23) | — | — | 1 | ||||||||||||||||||||||||||||||||
| Stock issued (repurchased) | 55 | — | — | 54 | 1 | — | ||||||||||||||||||||||||||||||||
| Dividends declared | (77) | (76) | — | — | — | (1) | ||||||||||||||||||||||||||||||||
| Balances, September 30, 2020 | $ | 4,362 | $ | 8,307 | $ | (2,754) | $ | (2,211) | $ | 113 | $ | 907 | ||||||||||||||||||||||||||
| Notional (Local) | Notional (USD) | Maturity | ||||||||||||||||
| 2017 | 2016 | 2017 | 2016 | |||||||||||||||
| Instrument | ||||||||||||||||||
| Senior note - 0.625% | € | 500 | € | 500 | $ | 591 | $ | 527 | March 2020 | |||||||||
| Commercial Paper | € | 300 | € | — | $ | 354 | $ | — | October 2017 | |||||||||
| Foreign exchange forwards/options | MXN 7,200 | MXN 0 | $ | 396 | $ | — | August 2022 | |||||||||||
| Fair Value of | Type of Hedge(1) | |||||||||||||||||||||||||||||
| Notional Amount | Hedge Assets | Hedge Liabilities | Maximum Term (Months) | |||||||||||||||||||||||||||
| Millions of dollars | 2017 | 2016 | 2017 | 2016 | 2017 | 2016 | 2017 | 2016 | ||||||||||||||||||||||
| Derivatives accounted for as hedges | ||||||||||||||||||||||||||||||
| Foreign exchange forwards/options | $ | 3,257 | $ | 1,813 | $ | 9 | $ | 32 | $ | 108 | $ | 10 | (CF/NI) | 59 | 58 | |||||||||||||||
| Commodity swaps/options | 280 | 299 | 28 | 7 | 1 | 11 | (CF) | 39 | 36 | |||||||||||||||||||||
| Total derivatives accounted for as hedges | $ | 37 | $ | 39 | $ | 109 | $ | 21 | ||||||||||||||||||||||
| Derivatives not accounted for as hedges | ||||||||||||||||||||||||||||||
| Foreign exchange forwards/options | $ | 3,190 | $ | 3,262 | $ | 24 | $ | 39 | $ | 36 | $ | 16 | N/A | 36 | 35 | |||||||||||||||
| Commodity swaps/options | 1 | 2 | — | — | — | — | N/A | 8 | 2 | |||||||||||||||||||||
| Total derivatives not accounted for as hedges | 24 | 39 | 36 | 16 | ||||||||||||||||||||||||||
| Total derivatives | $ | 61 | $ | 78 | $ | 145 | $ | 37 | ||||||||||||||||||||||
| Current | $ | 52 | $ | 54 | $ | 82 | $ | 35 | ||||||||||||||||||||||
| Noncurrent | 9 | 24 | 63 | 2 | ||||||||||||||||||||||||||
| Total derivatives | $ | 61 | $ | 78 | $ | 145 | $ | 37 | ||||||||||||||||||||||
| Three Months Ended September 30, | |||||||||||||||||
| Gain (Loss) Recognized in OCI (Effective Portion) | Gain (Loss) Reclassified from OCI into Earnings (Effective Portion) (1) | ||||||||||||||||
| Cash Flow Hedges - Millions of dollars | 2017 | 2016 | 2017 | 2016 | |||||||||||||
| Foreign exchange forwards/options | $ | (49 | ) | $ | 9 | $ | (34 | ) | $ | (1 | ) | (a) | |||||
| Commodity swaps/options | 18 | (2 | ) | 11 | (6 | ) | (a) | ||||||||||
| Interest rate derivatives | — | — | (1 | ) | — | (b) | |||||||||||
| Net Investment Hedges | |||||||||||||||||
| Foreign currency | (23 | ) | — | — | — | ||||||||||||
| $ | (54 | ) | $ | 7 | $ | (24 | ) | $ | (7 | ) | |||||||
| Three Months Ended September 30, | |||||||||||||||||
Gain (Loss) Recognized on Derivatives not Accounted for as Hedges (2) | |||||||||||||||||
| Derivatives not Accounted for as Hedges - Millions of dollars | 2017 | 2016 | |||||||||||||||
| Foreign exchange forwards/options | $ | (21 | ) | $ | (9 | ) | |||||||||||
| Nine Months Ended September 30, | |||||||||||||||||
| Gain (Loss) Recognized in OCI (Effective Portion) | Gain (Loss) Reclassified from OCI into Earnings (Effective Portion) (1) | ||||||||||||||||
| Cash Flow Hedges - Millions of dollars | 2017 | 2016 | 2017 | 2016 | |||||||||||||
| Foreign exchange | $ | (109 | ) | $ | 3 | $ | (76 | ) | $ | 11 | (a) | ||||||
| Commodity swaps/options | 35 | 19 | 29 | (30 | ) | (a) | |||||||||||
| Interest rate derivatives | — | — | (1 | ) | — | (b) | |||||||||||
| Net Investment Hedges | |||||||||||||||||
| Foreign currency | (63 | ) | — | — | — | ||||||||||||
| $ | (137 | ) | $ | 22 | $ | (48 | ) | $ | (19 | ) | |||||||
| Nine Months Ended September 30, | |||||||||||||||||
Gain (Loss) Recognized on Derivatives not Accounted for as Hedges (2) | |||||||||||||||||
| Derivatives not Accounted for as Hedges - Millions of dollars | 2017 | 2016 | |||||||||||||||
| Foreign exchange forwards/options | $ | (100 | ) | $ | (43 | ) | |||||||||||
| Three Months Ended September 30, | ||||||||||||||||||||||||||
| 2021 | 2020 | |||||||||||||||||||||||||
| Millions of dollars | Pre-tax | Tax Effect | Net | Pre-tax | Tax Effect | Net | ||||||||||||||||||||
Currency translation adjustments (2) | $ | 8 | (2) | $ | 6 | $ | (117) | 5 | $ | (112) | ||||||||||||||||
| Cash flow hedges | 50 | (14) | 36 | — | — | — | ||||||||||||||||||||
| Pension and other postretirement benefits plans | 9 | (5) | 4 | 118 | (29) | 89 | ||||||||||||||||||||
| Other comprehensive income (loss) | 67 | (21) | 46 | 1 | (24) | (23) | ||||||||||||||||||||
| Less: Other comprehensive income (loss) available to noncontrolling interests | (1) | — | (1) | — | — | — | ||||||||||||||||||||
| Other comprehensive income (loss) available to Whirlpool | $ | 68 | $ | (21) | $ | 47 | $ | 1 | $ | (24) | $ | (23) | ||||||||||||||
| Three Months Ended September 30, | Nine Months Ended September 30, | |||||||||||||||||||||||||||||||||||||||||||||
| 2017 | 2016 | 2021 | 2020 | |||||||||||||||||||||||||||||||||||||||||||
| Millions of dollars | Pre-tax | Tax Effect | Net | Pre-tax | Tax Effect | Net | Millions of dollars | Pre-tax | Tax Effect | Net | Pre-tax | Tax Effect | Net | |||||||||||||||||||||||||||||||||
| Currency translation adjustments | $ | 20 | $ | — | $ | 20 | $ | 25 | $ | — | $ | 25 | $ | 334 | $ | (1) | $ | 333 | $ | (350) | $ | (12) | $ | (362) | ||||||||||||||||||||||
| Cash flow and net investment hedges | (22 | ) | 10 | (12 | ) | 23 | (9 | ) | 14 | |||||||||||||||||||||||||||||||||||||
| Cash flow hedges | Cash flow hedges | 58 | (21) | 37 | 118 | (25) | 93 | |||||||||||||||||||||||||||||||||||||||
| Pension and other postretirement benefits plans | (15 | ) | 14 | (1 | ) | 10 | (3 | ) | 7 | Pension and other postretirement benefits plans | 42 | (13) | 29 | 180 | (44) | 136 | ||||||||||||||||||||||||||||||
| Available for sale securities | 7 | — | 7 | (1 | ) | — | (1 | ) | ||||||||||||||||||||||||||||||||||||||
| Other comprehensive income (loss) | (10 | ) | 24 | 14 | 57 | (12 | ) | 45 | Other comprehensive income (loss) | 434 | (35) | 399 | (52) | (81) | (133) | |||||||||||||||||||||||||||||||
| Less: Other comprehensive income (loss) available to noncontrolling interests | 2 | — | 2 | — | — | — | Less: Other comprehensive income (loss) available to noncontrolling interests | — | — | — | 2 | — | 2 | |||||||||||||||||||||||||||||||||
| Other comprehensive income (loss) available to Whirlpool | $ | (12 | ) | $ | 24 | $ | 12 | $ | 57 | $ | (12 | ) | $ | 45 | Other comprehensive income (loss) available to Whirlpool | $ | 434 | $ | (35) | $ | 399 | $ | (54) | $ | (81) | $ | (135) | |||||||||||||||||||
| Nine Months Ended September 30, | ||||||||||||||||||||
| 2017 | 2016 | |||||||||||||||||||
| Millions of dollars | Pre-tax | Tax Effect | Net | Pre-tax | Tax Effect | Net | ||||||||||||||
| Currency translation adjustments | $ | 96 | $ | — | $ | 96 | $ | 81 | $ | — | $ | 81 | ||||||||
| Cash flow and net investment hedges | (47 | ) | 17 | (30 | ) | 61 | (20 | ) | 41 | |||||||||||
| Pension and other postretirement benefits plans | 5 | 7 | 12 | 62 | (22 | ) | 40 | |||||||||||||
| Available for sale securities | 7 | — | 7 | (4 | ) | — | (4 | ) | ||||||||||||
| Other comprehensive income (loss) | 61 | 24 | 85 | 200 | (42 | ) | 158 | |||||||||||||
| Less: Other comprehensive income (loss) available to noncontrolling interests | 1 | — | 1 | 2 | — | 2 | ||||||||||||||
| Other comprehensive income (loss) available to Whirlpool | $ | 60 | $ | 24 | $ | 84 | $ | 198 | $ | (42 | ) | $ | 156 | |||||||
| Three Months Ended | Nine Months Ended | |||||||||||||
| Millions of dollars | (Gain) Loss Reclassified | (Gain) Loss Reclassified | Classification in Earnings | |||||||||||
| Pension and postretirement benefits, pre-tax | $ | 9 | $ | 34 | Interest and sundry (income) expense | |||||||||
| Currency translation related to divestitures | $ | — | $ | (198) | (Gain) loss on sale and disposal of businesses | |||||||||
| Total | $ | 9 | $ | (164) | ||||||||||
| Three Months Ended | Nine Months Ended | |||||||||
| Millions of dollars | (Gain) Loss Reclassified | (Gain) Loss Reclassified | Classification in Earnings | |||||||
| Cash flow hedges, pre-tax | $ | 24 | $ | 48 | Cost of products sold | |||||
| Pension and postretirement benefits, pre-tax | 9 | 30 | Interest and sundry (income) expense | |||||||
| Millions of dollars | Total | Whirlpool Common Stockholders | Noncontrolling Interests | |||||||||
| Stockholders' equity, December 31, 2016 | $ | 5,728 | $ | 4,773 | $ | 955 | ||||||
| Net earnings (loss) | 609 | 618 | (9 | ) | ||||||||
| Other comprehensive income | 85 | 84 | 1 | |||||||||
| Comprehensive income (loss) | 694 | 702 | (8 | ) | ||||||||
| Common stock | 1 | 1 | — | |||||||||
| Treasury stock | (550 | ) | (550 | ) | — | |||||||
| Additional paid-in capital | 61 | 61 | — | |||||||||
| Dividends declared on common stock | (247 | ) | (235 | ) | (12 | ) | ||||||
| Stockholders' equity, September 30, 2017 | $ | 5,687 | $ | 4,752 | $ | 935 | ||||||
| Three Months Ended September 30, | Nine Months Ended September 30, | Three Months Ended September 30, | Nine Months Ended September 30, | |||||||||||||||||||||||||||||||||||||||
| Millions of dollars and shares | 2017 | 2016 | 2017 | 2016 | Millions of dollars and shares | 2021 | 2020 | 2021 | 2020 | |||||||||||||||||||||||||||||||||
| Numerator for basic and diluted earnings per share - Net earnings available to Whirlpool | $ | 276 | $ | 238 | $ | 618 | $ | 708 | ||||||||||||||||||||||||||||||||||
| Numerator for basic and diluted earnings per share - Net earnings (loss) available to Whirlpool | Numerator for basic and diluted earnings per share - Net earnings (loss) available to Whirlpool | $ | 471 | $ | 392 | $ | 1,485 | $ | 576 | |||||||||||||||||||||||||||||||||
| Denominator for basic earnings per share - weighted-average shares | 72.9 | 75.7 | 73.9 | 76.4 | Denominator for basic earnings per share - weighted-average shares | 62.2 | 62.6 | 62.7 | 62.6 | |||||||||||||||||||||||||||||||||
| Effect of dilutive securities – share-based compensation | 1.1 | 1.2 | 1.2 | 1.1 | ||||||||||||||||||||||||||||||||||||||
| Denominator for diluted earnings per share – adjusted weighted-average shares | 74.0 | 76.9 | 75.1 | 77.5 | ||||||||||||||||||||||||||||||||||||||
| Effect of dilutive securities - share-based compensation | Effect of dilutive securities - share-based compensation | 0.5 | 0.7 | 0.5 | 0.5 | |||||||||||||||||||||||||||||||||||||
| Denominator for diluted earnings per share - adjusted weighted-average shares | Denominator for diluted earnings per share - adjusted weighted-average shares | 62.7 | 63.3 | 63.2 | 63.1 | |||||||||||||||||||||||||||||||||||||
| Anti-dilutive stock options/awards excluded from earnings per share | 0.5 | 0.3 | 0.6 | 0.3 | Anti-dilutive stock options/awards excluded from earnings per share | 0.1 | 1.1 | 0.1 | 1.7 | |||||||||||||||||||||||||||||||||
Millions of dollars | December 31, 2016 | Charge to Earnings | Cash Paid | Non-cash and Other | September 30, 2017 | Millions of dollars | December 31, 2020 | Charges to Earnings | Cash Paid | Non-Cash and Other | September 30, 2021 | |||||||||||||||||||||
| Employee termination costs | $ | 71 | $ | 96 | $ | (85 | ) | $ | — | $ | 82 | Employee termination costs | $ | 145 | $ | 32 | $ | (72) | $ | — | $ | 105 | ||||||||||
| Asset impairment costs | — | 23 | — | (23 | ) | — | Asset impairment costs | 8 | 1 | — | (1) | 8 | ||||||||||||||||||||
| Facility exit costs | 2 | 18 | (17 | ) | — | 3 | Facility exit costs | — | 1 | (1) | — | — | ||||||||||||||||||||
| Other exit costs | 14 | 13 | (11 | ) | 10 | 26 | Other exit costs | 20 | 1 | (16) | (6) | (1) | ||||||||||||||||||||
| Total | $ | 87 | $ | 150 | $ | (113 | ) | $ | (13 | ) | $ | 111 | Total | $ | 173 | $ | 35 | $ | (89) | $ | (7) | $ | 112 | |||||||||
| Nine Months Ended | |||||
| Millions of dollars | September 30, 2021 | ||||
| North America | $ | — | |||
| EMEA | 32 | ||||
| Latin America | — | ||||
| Asia | 2 | ||||
| Corporate / Other | 1 | ||||
| Total | $ | 35 | |||
| Millions of dollars | September 30, 2017 | |||
| North America | $ | 10 | ||
| EMEA | 122 | |||
| Latin America | 7 | |||
| Asia | 3 | |||
| Corporate / Other | 8 | |||
| Total | $ | 150 | ||
| Three Months Ended September 30, | Nine Months Ended September 30, | |||||||||||||||
| Millions of dollars | 2017 | 2016 | 2017 | 2016 | ||||||||||||
| Earnings before income taxes | $ | 268 | $ | 305 | $ | 678 | $ | 806 | ||||||||
| Income tax (benefit) expense computed at United States statutory tax rate | 94 | 107 | 237 | 282 | ||||||||||||
| Valuation allowances (releases) | (84 | ) | (59 | ) | (77 | ) | (164 | ) | ||||||||
| Audits and settlements | 7 | (3 | ) | 1 | (35 | ) | ||||||||||
| U.S. foreign income items, net of credits | (17 | ) | 4 | (70 | ) | (6 | ) | |||||||||
| Foreign government tax incentive | (4 | ) | (2 | ) | (7 | ) | (5 | ) | ||||||||
| Other | — | 14 | (15 | ) | (8 | ) | ||||||||||
| Income tax (benefit) expense computed at effective worldwide tax rates | $ | (4 | ) | $ | 61 | $ | 69 | $ | 64 | |||||||
| Three Months Ended September 30, | Nine Months Ended September 30, | ||||||||||||||||||||||
| Millions of dollars | 2021 | 2020 | 2021 | 2020 | |||||||||||||||||||
| Earnings before income taxes | $ | 586 | $ | 534 | $ | 1,859 | $ | 793 | |||||||||||||||
| Income tax expense computed at United States statutory tax rate | 123 | 112 | 390 | 167 | |||||||||||||||||||
| State and local taxes, net of federal tax benefit | 17 | 15 | 49 | 22 | |||||||||||||||||||
| Valuation allowances | 3 | 6 | 5 | 12 | |||||||||||||||||||
| Audit and settlements | (32) | 14 | (17) | 31 | |||||||||||||||||||
| U.S. foreign income items, net of credits | (1) | (2) | (1) | (1) | |||||||||||||||||||
| Changes in enacted tax rates | — | (6) | (14) | (6) | |||||||||||||||||||
| Divestiture tax impact | (1) | — | (22) | — | |||||||||||||||||||
| Legal entity restructuring tax impact | — | — | (46) | — | |||||||||||||||||||
| Other | (9) | 2 | 9 | 6 | |||||||||||||||||||
| Income tax expense (benefit) computed at effective worldwide tax rates | $ | 100 | $ | 141 | $ | 353 | $ | 231 | |||||||||||||||
| Three Months Ended September 30, | ||||||||||||||||||||||||
| United States Pension Benefits | Foreign Pension Benefits | Other Postretirement Benefits | ||||||||||||||||||||||
| Millions of dollars | 2017 | 2016 | 2017 | 2016 | 2017 | 2016 | ||||||||||||||||||
| Service cost | $ | 1 | $ | 1 | $ | 1 | $ | 1 | $ | 1 | $ | 1 | ||||||||||||
| Interest cost | 34 | 37 | 6 | 7 | 4 | 5 | ||||||||||||||||||
| Expected return on plan assets | (43 | ) | (47 | ) | (8 | ) | (7 | ) | — | — | ||||||||||||||
| Amortization: | ||||||||||||||||||||||||
| Actuarial loss | 12 | 12 | 2 | 1 | — | — | ||||||||||||||||||
| Prior service credit | (1 | ) | — | — | — | (4 | ) | (3 | ) | |||||||||||||||
| Settlement and curtailment loss | — | — | — | 1 | — | — | ||||||||||||||||||
| Net periodic cost | $ | 3 | $ | 3 | $ | 1 | $ | 3 | $ | 1 | $ | 3 | ||||||||||||
| Nine Months Ended September 30, | ||||||||||||||||||||||||
| United States Pension Benefits | Foreign Pension Benefits | Other Postretirement Benefits | ||||||||||||||||||||||
| Millions of dollars | 2017 | 2016 | 2017 | 2016 | 2017 | 2016 | ||||||||||||||||||
| Service cost | $ | 2 | $ | 2 | $ | 4 | $ | 4 | $ | 5 | $ | 5 | ||||||||||||
| Interest cost | 101 | 111 | 17 | 21 | 12 | 13 | ||||||||||||||||||
| Expected return on plan assets | (131 | ) | (140 | ) | (23 | ) | (23 | ) | — | — | ||||||||||||||
| Amortization: | ||||||||||||||||||||||||
| Actuarial loss | 37 | 35 | 5 | 3 | — | — | ||||||||||||||||||
| Prior service credit | (2 | ) | (2 | ) | — | — | (11 | ) | (11 | ) | ||||||||||||||
| Settlement and curtailment loss | — | — | 1 | 1 | — | — | ||||||||||||||||||
| Net periodic cost | $ | 7 | $ | 6 | $ | 4 | $ | 6 | $ | 6 | $ | 7 | ||||||||||||
| Three Months Ended September 30, | ||||||||||||||||||||||||
| United States Pension Benefits | Foreign Pension Benefits | Other Postretirement Benefits | ||||||||||||||||||||||
| Millions of dollars | 2017 | 2016 | 2017 | 2016 | 2017 | 2016 | ||||||||||||||||||
| Operating profit (loss) | $ | 1 | $ | 1 | $ | 1 | $ | 1 | $ | 1 | $ | 1 | ||||||||||||
| Interest and sundry (income) expense | 2 | 2 | — | 2 | — | 2 | ||||||||||||||||||
| Net periodic benefit cost (credit) | $ | 3 | $ | 3 | $ | 1 | $ | 3 | $ | 1 | $ | 3 | ||||||||||||
| Nine Months Ended September 30, | ||||||||||||||||||||||||
| United States Pension Benefits | Foreign Pension Benefits | Other Postretirement Benefits | ||||||||||||||||||||||
| Millions of dollars | 2017 | 2016 | 2017 | 2016 | 2017 | 2016 | ||||||||||||||||||
| Operating profit (loss) | $ | 2 | $ | 2 | $ | 4 | $ | 4 | $ | 5 | $ | 5 | ||||||||||||
| Interest and sundry (income) expense | 5 | 4 | — | 2 | 1 | 2 | ||||||||||||||||||
| Net periodic benefit cost (credit) | $ | 7 | $ | 6 | $ | 4 | $ | 6 | $ | 6 | $ | 7 | ||||||||||||
| Three Months Ended September 30, | ||||||||||||||||||||||||
| OPERATING SEGMENTS | ||||||||||||||||||||||||
Millions of dollars | North America | EMEA | Latin America | Asia | Other/ Eliminations | Total Whirlpool | ||||||||||||||||||
| Net sales | ||||||||||||||||||||||||
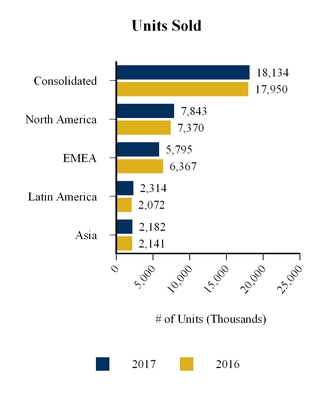
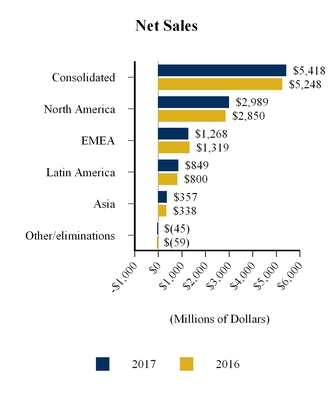
| 2017 | $ | 2,989 | $ | 1,268 | $ | 849 | $ | 357 | $ | (45 | ) | $ | 5,418 | |||||||||||
| 2016 | 2,850 | 1,319 | 800 | 338 | (59 | ) | 5,248 | |||||||||||||||||
| Intersegment sales | ||||||||||||||||||||||||
| 2017 | 45 | 36 | 45 | 82 | (208 | ) | — | |||||||||||||||||
| 2016 | 41 | 16 | 50 | 82 | (189 | ) | — | |||||||||||||||||
| Depreciation and amortization | ||||||||||||||||||||||||
| 2017 | 64 | 47 | 21 | 22 | 14 | 168 | ||||||||||||||||||
| 2016 | 65 | 66 | 19 | 15 | (1 | ) | 164 | |||||||||||||||||
| Operating profit (loss) | ||||||||||||||||||||||||
| 2017 | 350 | 11 | 53 | 2 | (85 | ) | 331 | |||||||||||||||||
| 2016 | 346 | 40 | 46 | 15 | (73 | ) | 374 | |||||||||||||||||
| Total assets | ||||||||||||||||||||||||
| September 30, 2017 | 8,777 | 8,367 | 2,909 | 2,883 | (2,098 | ) | (a) | 20,838 | ||||||||||||||||
| December 31, 2016 | 8,009 | 7,497 | 2,601 | 2,788 | (1,742 | ) | (a) | 19,153 | ||||||||||||||||
| Capital expenditures | ||||||||||||||||||||||||
| 2017 | 46 | 46 | 28 | 28 | 13 | 161 | ||||||||||||||||||
| 2016 | 43 | 37 | 28 | 26 | 20 | 154 | ||||||||||||||||||
| Nine Months Ended September 30, | ||||||||||||||||||||||||
| OPERATING SEGMENTS | ||||||||||||||||||||||||
Millions of dollars | North America | EMEA | Latin America | Asia | Other/ Eliminations | Total Whirlpool | ||||||||||||||||||
| Net sales | ||||||||||||||||||||||||
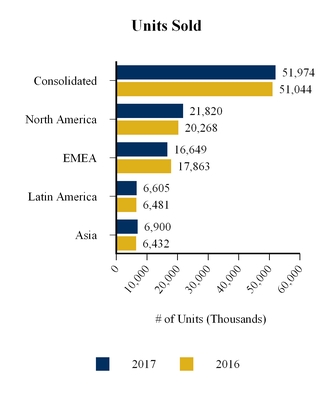
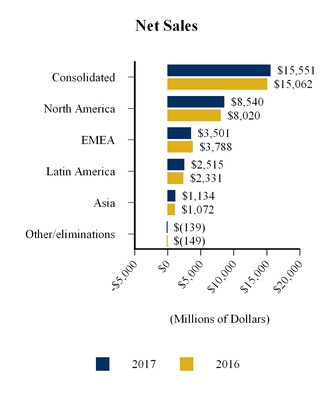
| 2017 | $ | 8,540 | $ | 3,501 | $ | 2,515 | $ | 1,134 | $ | (139 | ) | $ | 15,551 | |||||||||||
| 2016 | 8,020 | 3,788 | 2,331 | 1,072 | (149 | ) | 15,062 | |||||||||||||||||
| Intersegment sales | ||||||||||||||||||||||||
| 2017 | 136 | 80 | 142 | 220 | (578 | ) | — | |||||||||||||||||
| 2016 | 128 | 47 | 153 | 217 | (545 | ) | — | |||||||||||||||||
| Depreciation and amortization | ||||||||||||||||||||||||
| 2017 | 193 | 136 | 63 | 53 | 42 | 487 | ||||||||||||||||||
| 2016 | 199 | 155 | 53 | 48 | 41 | 496 | ||||||||||||||||||
| Operating profit (loss) | ||||||||||||||||||||||||
| 2017 | 991 | (6 | ) | 180 | (7 | ) | (289 | ) | 869 | |||||||||||||||
| 2016 | 936 | 141 | 139 | 56 | (245 | ) | 1,027 | |||||||||||||||||
| Total assets | ||||||||||||||||||||||||
| September 30, 2017 | 8,777 | 8,367 | 2,909 | 2,883 | (2,098 | ) | (a) | 20,838 | ||||||||||||||||
| December 31, 2016 | 8,009 | 7,497 | 2,601 | 2,788 | (1,742 | ) | (a) | 19,153 | ||||||||||||||||
| Capital expenditures | ||||||||||||||||||||||||
| 2017 | 122 | 82 | 76 | 61 | 30 | 371 | ||||||||||||||||||
| 2016 | 114 | 82 | 71 | 41 | 52 | 360 | ||||||||||||||||||
| Three Months Ended September 30, | |||||||||||||||||||||||||||||||||||
| OPERATING SEGMENTS | |||||||||||||||||||||||||||||||||||
| North America | EMEA | Latin America | Asia (1) | Other / Eliminations | Total Whirlpool | ||||||||||||||||||||||||||||||
| Net sales | |||||||||||||||||||||||||||||||||||
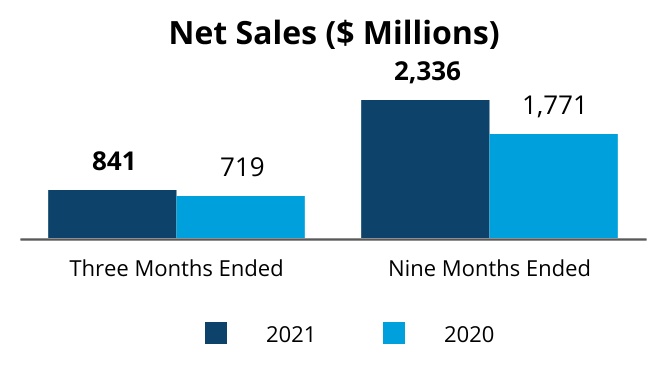
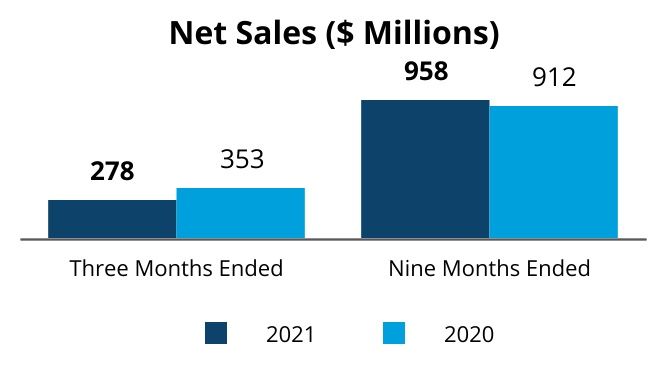
| 2021 | $ | 3,113 | $ | 1,256 | $ | 841 | $ | 278 | $ | — | $ | 5,488 | |||||||||||||||||||||||
| 2020 | 2,961 | 1,258 | 719 | 353 | — | 5,291 | |||||||||||||||||||||||||||||
| Intersegment sales | |||||||||||||||||||||||||||||||||||
| 2021 | $ | 89 | $ | 30 | $ | 327 | $ | 47 | $ | (493) | $ | — | |||||||||||||||||||||||
| 2020 | 84 | 31 | 344 | 117 | (576) | — | |||||||||||||||||||||||||||||
| Depreciation and amortization | |||||||||||||||||||||||||||||||||||
| 2021 | $ | 43 | $ | 39 | $ | 17 | $ | 4 | $ | 16 | $ | 119 | |||||||||||||||||||||||
| 2020 | 53 | 42 | 16 | 19 | 16 | 146 | |||||||||||||||||||||||||||||
| EBIT | |||||||||||||||||||||||||||||||||||
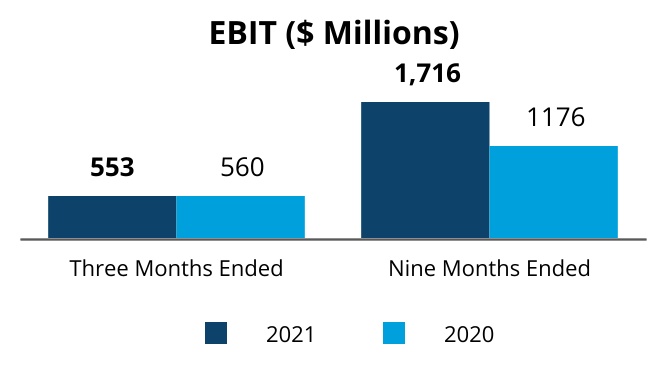
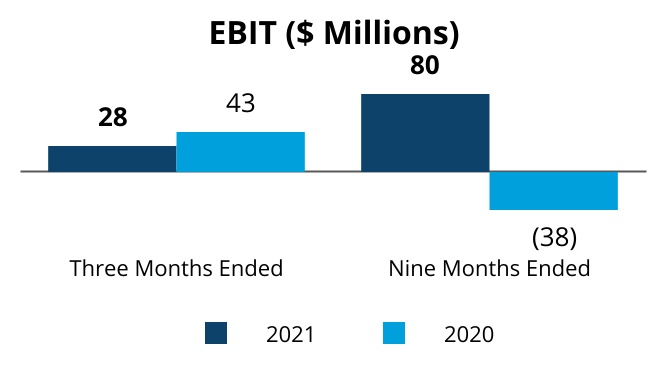
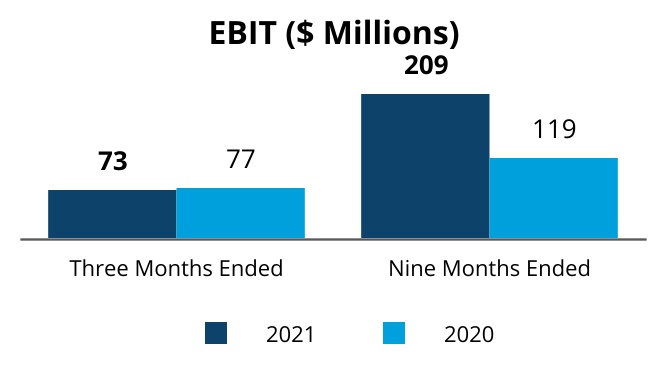
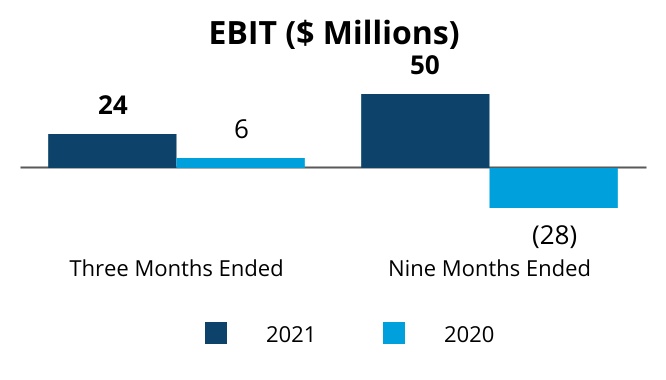
| 2021 | $ | 553 | $ | 28 | $ | 73 | $ | 24 | $ | (48) | $ | 630 | |||||||||||||||||||||||
| 2020 | 560 | 43 | 77 | 6 | (101) | 585 | |||||||||||||||||||||||||||||
| Total assets | |||||||||||||||||||||||||||||||||||
| September 30, 2021 | $ | 7,990 | $ | 10,032 | $ | 4,148 | $ | 1,646 | $ | (3,422) | $ | 20,394 | |||||||||||||||||||||||
| December 31, 2020 | 7,597 | 11,296 | 4,244 | 2,573 | (5,274) | 20,436 | |||||||||||||||||||||||||||||
| Capital expenditures | |||||||||||||||||||||||||||||||||||
| 2021 | $ | 42 | $ | 31 | $ | 34 | $ | 6 | $ | 9 | $ | 122 | |||||||||||||||||||||||
| 2020 | 34 | 29 | 12 | 10 | 11 | 96 | |||||||||||||||||||||||||||||
| Nine Months Ended September 30, | |||||||||||||||||||||||||||||||||||
| OPERATING SEGMENTS | |||||||||||||||||||||||||||||||||||
| North America | EMEA | Latin America | Asia (1) | Other / Eliminations | Total Whirlpool | ||||||||||||||||||||||||||||||
| Net sales | |||||||||||||||||||||||||||||||||||
| 2021 | $ | 9,200 | $ | 3,676 | $ | 2,336 | $ | 958 | $ | — | $ | 16,170 | |||||||||||||||||||||||
| 2020 | 8,002 | 2,973 | 1,771 | 912 | — | 13,658 | |||||||||||||||||||||||||||||
| Intersegment sales | |||||||||||||||||||||||||||||||||||
| 2021 | $ | 244 | $ | 76 | $ | 950 | $ | 239 | $ | (1,509) | $ | — | |||||||||||||||||||||||
| 2020 | 203 | 70 | 894 | 275 | (1,442) | — | |||||||||||||||||||||||||||||
| Depreciation and amortization | |||||||||||||||||||||||||||||||||||
| 2021 | $ | 132 | $ | 129 | $ | 48 | $ | 22 | $ | 47 | $ | 378 | |||||||||||||||||||||||
| 2020 | 143 | 123 | 47 | 52 | 49 | 414 | |||||||||||||||||||||||||||||
| EBIT | |||||||||||||||||||||||||||||||||||
| 2021 | $ | 1,716 | $ | 80 | $ | 209 | $ | 50 | $ | (62) | $ | 1,993 | |||||||||||||||||||||||
| 2020 | 1,176 | (38) | 119 | (28) | (294) | 935 | |||||||||||||||||||||||||||||
| Total assets | |||||||||||||||||||||||||||||||||||
| September 30, 2021 | $ | 7,990 | $ | 10,032 | $ | 4,148 | $ | 1,646 | $ | (3,422) | 20,394 | ||||||||||||||||||||||||
| December 31, 2020 | 7,597 | 11,296 | 4,244 | 2,573 | (5,274) | 20,436 | |||||||||||||||||||||||||||||
| Capital expenditures | |||||||||||||||||||||||||||||||||||
| 2021 | $ | 107 | $ | 78 | $ | 77 | $ | 18 | $ | 26 | $ | 306 | |||||||||||||||||||||||
| 2020 | 87 | 61 | 38 | 33 | 32 | 251 | |||||||||||||||||||||||||||||
| Three Months Ended September 30, | Nine Months Ended September 30, | ||||||||||||||||
| in millions | 2021 | 2020 | 2021 | 2020 | |||||||||||||
| Items not allocated to segments: | |||||||||||||||||
| Restructuring costs | $ | (7) | $ | (63) | $ | (35) | $ | (186) | |||||||||
| Gain (loss) on previously held equity interest | 42 | — | 42 | — | |||||||||||||
| Gain (loss) on sale and disposal of businesses | (13) | 7 | 107 | 7 | |||||||||||||
| Corrective action recovery | — | 13 | — | 13 | |||||||||||||
| Corporate expenses and other | (70) | (58) | (176) | (128) | |||||||||||||
| Total other/eliminations | $ | (48) | $ | (101) | $ | (62) | $ | (294) | |||||||||
| Three Months Ended September 30, | Nine Months Ended September 30, | |||||||||||||||||||
| in millions | 2021 | 2020 | 2021 | 2020 | ||||||||||||||||
| Operating profit | $ | 552 | $ | 563 | $ | 1,854 | $ | 897 | ||||||||||||
| Interest and sundry (income) expense | (78) | (22) | (139) | (38) | ||||||||||||||||
| Total EBIT | $ | 630 | $ | 585 | $ | 1,993 | $ | 935 | ||||||||||||
| Interest expense | 44 | 51 | 134 | 142 | ||||||||||||||||
| Income tax expense | 100 | 141 | 353 | 231 | ||||||||||||||||
| Net earnings (loss) | $ | 486 | $ | 393 | $ | 1,506 | $ | 562 | ||||||||||||
| Less: Net earnings available to noncontrolling interests | 15 | 1 | 21 | (14) | ||||||||||||||||
| Net earnings (loss) available to Whirlpool | $ | 471 | $ | 392 | $ | 1,485 | $ | 576 | ||||||||||||
| Millions of dollars | September 30, | December 31, | ||||||||||||||||||||||||
| 2021 | 2020 | |||||||||||||||||||||||||
| Cash and cash equivalents | $ | — | $ | 324 | ||||||||||||||||||||||
| Accounts receivable, net of allowance of $0 and $11, respectively | — | 85 | ||||||||||||||||||||||||
| Inventories | — | 98 | ||||||||||||||||||||||||
| Prepaid and other current assets | — | 93 | ||||||||||||||||||||||||
| Property, net of accumulated depreciation of $0 and $189, respectively | — | 309 | ||||||||||||||||||||||||
Other noncurrent assets (1) | — | 283 | ||||||||||||||||||||||||
| Total assets | $ | — | $ | 1,192 | ||||||||||||||||||||||
| Accounts payable | $ | — | $ | 216 | ||||||||||||||||||||||
| Accrued expenses | — | 53 | ||||||||||||||||||||||||
| Other current liabilities | — | 254 | ||||||||||||||||||||||||
| Other noncurrent liabilities | — | 7 | ||||||||||||||||||||||||
| Total liabilities | $ | — | $ | 530 | ||||||||||||||||||||||
| ITEM 2. | |||||
| Three Months Ended September 30, | Nine Months Ended September 30, | |||||||||||
| Consolidated - Millions of dollars, except per share data | 2017 | 2016 | Better/(Worse) | 2017 | 2016 | Better/(Worse) | ||||||
| Net sales | $5,418 | $5,248 | 3.2% | $15,551 | $15,062 | 3.2% | ||||||
| Gross margin | 915 | 940 | (2.7)% | 2,617 | 2,732 | (4.2)% | ||||||
| Selling, general and administrative | 521 | 519 | (0.4)% | 1,546 | 1,535 | (0.7)% | ||||||
| Restructuring costs | 45 | 29 | (59.9)% | 150 | 116 | (29.7)% | ||||||
| Interest and sundry (income) expense | 21 | 30 | 30.0% | 69 | 103 | 33.0% | ||||||
| Interest expense | 42 | 39 | (6.3)% | 122 | 118 | (3.1)% | ||||||
| Income tax (benefit) expense | (4) | 61 | nm | 69 | 64 | (7.3)% | ||||||
| Net earnings available to Whirlpool | 276 | 238 | 15.9% | 618 | 708 | (12.7)% | ||||||
| Diluted net earnings available to Whirlpool per share | $3.72 | $3.10 | 20.0% | $8.23 | $9.16 | (10.2)% | ||||||
| Three Months Ended September 30, | Nine Months Ended September 30, | |||||||||||||||
| Millions of dollars | 2017 | As a % of Net Sales | 2016 | As a % of Net Sales | 2017 | As a % of Net Sales | 2016 | As a % of Net Sales | ||||||||
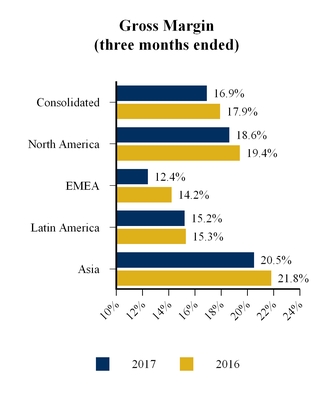
| North America | $200 | 6.7% | $203 | 7.1% | $584 | 6.8% | $583 | 7.3% | ||||||||
| EMEA | 138 | 10.9% | 141 | 10.7% | 401 | 11.5% | 429 | 11.3% | ||||||||
| Latin America | 75 | 8.8% | 75 | 9.4% | 242 | 9.6% | 221 | 9.5% | ||||||||
| Asia | 66 | 18.5% | 53 | 15.7% | 175 | 15.5% | 162 | 15.1% | ||||||||
| Corporate/other | 42 | — | 47 | — | 144 | — | 140 | — | ||||||||
| Consolidated | $521 | 9.6% | $519 | 9.9% | $1,546 | 9.9% | $1,535 | 10.2% | ||||||||
| 2017 | |||
| Current Outlook | |||
| Estimated earnings per diluted share, for the year ending December 31, 2017 | $11.10 | — | $11.40 |
| Including: | |||
| Restructuring Expense | $(2.66) | ||
| Out-of-Period Adjustment | $(0.27) | ||
| Income Tax Impact | $0.45 | ||
| Industry demand | |||
North America(1) | 4% | — | 6% |
| EMEA | Flat | — | 2% |
Latin America(2) | Flat | ||
| Asia | Flat | — | 2% |
| Three Months Ended September 30, | Nine Months Ended September 30, | |||||||||||||||||||
| Consolidated - Millions of dollars, except per share data | 2021 | 2020 | Better/(Worse) % | 2021 | 2020 | Better/(Worse) % | ||||||||||||||
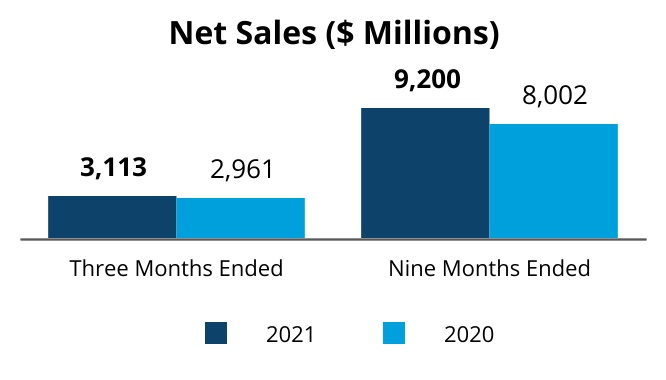
| Net sales | $ | 5,488 | $ | 5,291 | 3.7% | $ | 16,170 | $ | 13,658 | 18.4% | ||||||||||
| Gross margin | 1,108 | 1,148 | (3.5) | 3,347 | 2,476 | 35.2 | ||||||||||||||
| Selling, general and administrative | 524 | 513 | (2.1) | 1,526 | 1,354 | (12.7) | ||||||||||||||
| Restructuring costs | 7 | 63 | 88.9 | 35 | 186 | 81.2 | ||||||||||||||
| (Gain) loss on sale and disposal of businesses | 15 | (7) | nm | (105) | (7) | nm | ||||||||||||||
| Interest and sundry (income) expense | (78) | (22) | nm | (139) | (38) | nm | ||||||||||||||
| Interest expense | 44 | 51 | 13.7 | 134 | 142 | 5.6 | ||||||||||||||
| Income tax expense (benefit) | 100 | 141 | 29.1 | 353 | 231 | (52.8) | ||||||||||||||
| Net earnings available to Whirlpool | $ | 471 | $ | 392 | 20.2% | $ | 1,485 | $ | 576 | nm | ||||||||||
| Diluted net earnings available to Whirlpool per share | $ | 7.51 | $ | 6.19 | 21.3% | $ | 23.47 | $ | 9.14 | nm | ||||||||||

| Three Months Ended September 30, | Nine Months Ended September 30, | |||||||||||||||||||||||||||||||||||||||||||||||||
| Millions of dollars | 2021 | As a % of Net Sales | 2020 | As a % of Net Sales | 2021 | As a % of Net Sales | 2020 | As a % of Net Sales | ||||||||||||||||||||||||||||||||||||||||||
| North America | $ | 227 | 7.3 | % | $ | 181 | 6.1 | % | $ | 614 | 6.7 | % | $ | 517 | 6.5 | % | ||||||||||||||||||||||||||||||||||
| EMEA | 117 | 9.4 | 129 | 10.3 | 379 | 10.3 | 330 | 11.1 | ||||||||||||||||||||||||||||||||||||||||||
| Latin America | 70 | 8.3 | 65 | 9.0 | 192 | 8.2 | 172 | 9.7 | ||||||||||||||||||||||||||||||||||||||||||
| Asia | 27 | 9.7 | 57 | 16.2 | 120 | 12.6 | 167 | 18.4 | ||||||||||||||||||||||||||||||||||||||||||
| Corporate/other | 83 | — | 81 | — | 221 | — | 168 | — | ||||||||||||||||||||||||||||||||||||||||||
| Consolidated | $ | 524 | 9.5 | % | $ | 513 | 9.7 | % | $ | 1,526 | 9.4 | % | $ | 1,354 | 9.9 | % | ||||||||||||||||||||||||||||||||||
| 2017 | |||
| Millions of dollars | Current Outlook | ||
Cash provided by operating activities(1) | $1,550 | - | $1,600 |
| Capital expenditures, proceeds from sale of assets/businesses and changes in restricted cash | (650) | - | (700) |
| Free cash flow | ~ | $900 | |
| Nine Months Ended September 30, | ||||||||||||||
| Millions of dollars | 2021 | 2020 | ||||||||||||
| Cash provided by (used in): | ||||||||||||||
| Operating activities | $ | 1,294 | $ | 407 | ||||||||||
| Investing activities | (446) | (224) | ||||||||||||
| Financing activities | (856) | 1,531 | ||||||||||||
| Effect of exchange rate changes | (51) | (125) | ||||||||||||
| Net change in cash, cash equivalents and restricted cash | $ | (59) | $ | 1,589 | ||||||||||
| Nine Months Ended September 30, | ||||||||
| Millions of dollars | 2017 | 2016 | ||||||
| Cash provided by (used in): | ||||||||
| Operating activities | $ | (33 | ) | $ | (175 | ) | ||
| Investing activities | (349 | ) | (303 | ) | ||||
| Financing activities | 335 | 729 | ||||||
| Effect of exchange rate changes on cash | 49 | 2 | ||||||
| Net change in cash and cash equivalents | $ | 2 | $ | 253 | ||||
Ongoing Earnings Before Interest & Taxes (EBIT) Reconciliation: in millions | Three Months Ended | Nine Months Ended | |||||||||||||||
| 2021 | 2020 | 2021 | 2020 | ||||||||||||||
Net earnings available to Whirlpool (1) | $ | 471 | $ | 392 | $ | 1,485 | $ | 576 | |||||||||
| Net earnings (loss) available to noncontrolling interests | 15 | 1 | 21 | (14) | |||||||||||||
| Income tax expense (benefit) | 100 | 141 | 353 | 231 | |||||||||||||
| Interest expense | 44 | 51 | 134 | 142 | |||||||||||||
| Earnings before interest & taxes | $ | 630 | $ | 585 | $ | 1,993 | $ | 935 | |||||||||
Restructuring expense (a) | 7 | 63 | 35 | 186 | |||||||||||||
(Gain) loss on previously held equity interest (b) | (42) | — | (42) | — | |||||||||||||
(Gain) loss on sale and disposal of businesses (c) | 13 | (7) | (107) | (7) | |||||||||||||
Corrective action recovery (d) | — | (13) | — | (13) | |||||||||||||
Ongoing EBIT(2) | $ | 608 | $ | 628 | $ | 1,879 | $ | 1,101 | |||||||||
| Earnings Per Diluted Share | Three Months Ended | |||||||||||||
| 2021 | 2020 | |||||||||||||
| Earnings per diluted share | $ | 7.51 | $ | 6.19 | ||||||||||
Restructuring expense (a) | 0.10 | 1.00 | ||||||||||||
(Gain) loss on previously held equity interest (b) | (0.50) | — | ||||||||||||
(Gain) loss on sale and disposal of businesses (c) | 0.21 | (0.10) | ||||||||||||
Corrective action recovery (d) | — | (0.20) | ||||||||||||
| Income tax impact | 0.05 | (0.17) | ||||||||||||
Normalized tax rate adjustment (e) | (0.69) | 0.11 | ||||||||||||
| Ongoing earnings per diluted share | $ | 6.68 | $ | 6.83 | ||||||||||
Adjusted Free Cash Flow (FCF) Reconciliation: in millions | Nine Months Ended | |||||||
| 2021 | 2020 | |||||||
| Cash provided by (used in) operating activities | $ | 1,294 | $ | 407 | ||||
| Capital expenditures | (306) | (251) | ||||||
| Proceeds from sale of assets and business | 299 | 27 | ||||||
| Change in restricted cash | 9 | (13) | ||||||
| Adjusted free cash flow | $ | 1,296 | $ | 170 | ||||
| Cash provided by (used in) investing activities | $ | (446) | $ | (224) | ||||
| Cash provided by (used in) financing activities | (856) | 1,531 | ||||||
| 2021 | |||||
| Current Outlook | |||||
| Estimated earnings per diluted share, for the year ending December 31, 2021 | ~$27.80 | ||||
| Including: | |||||
| Restructuring expense | $(0.86) | ||||
| Gain (loss) on previously held equity interest | $0.49 | ||||
| Gain (loss) on sale and disposal of businesses | $1.71 | ||||
| Income tax impact | $(0.34) | ||||
| Normalized tax rate adjustment | $0.54 | ||||
| Industry Demand | |||||
| North America | 10%+ | ||||
| EMEA | 2% - 4% | ||||
| Latin America | 2% - 4% | ||||
| Asia | 6% - 8% | ||||
| Millions of dollars | 2021 | |||||||
| Current Outlook | ||||||||
Cash provided by (used in) operating activities (1) | ~$1,950 | |||||||
| Capital expenditures, proceeds from sale of assets/businesses and changes in restricted cash | (250) | |||||||
| Adjusted free cash flow | ~$1,700 | |||||||
| ITEM 3. | QUANTITATIVE AND QUALITATIVE DISCLOSURES ABOUT MARKET RISK | ||||
| ITEM 4. | CONTROLS AND PROCEDURES | ||||
| PART II. | OTHER INFORMATION | ||
| ITEM 1. | LEGAL PROCEEDINGS | ||||
| ITEM 1A. | RISK FACTORS | ||||
| ITEM 2. | UNREGISTERED SALES OF EQUITY SECURITIES AND USE OF PROCEEDS | ||||
| Period (Millions of dollars, except number and price per share) | Total Number of Shares Purchased | Average Price Paid per Share | Total Number of Shares Purchased as Part of Publicly Announced Plans or Programs | Approximate Dollar Value of Shares that May Yet Be Purchased Under the Plans | ||||||
| July 1, 2017 through July 31, 2017 | — | $ | — | — | $ | 2,350 | ||||
| August 1, 2017 through August 31, 2017 | 937,500 | 173.14 | 937,500 | 2,188 | ||||||
| September 1, 2017 through September 30, 2017 | 220,681 | 170.70 | 220,681 | 2,150 | ||||||
| Total | 1,158,181 | $ | 172.68 | 1,158,181 | ||||||
| Period (Millions of dollars, except number and price per share) | Total Number of Shares Purchased | Average Price Paid per Share | Total Number of Shares Purchased as Part of Publicly Announced Plans or Programs | Approximate Dollar Value of Shares that May Yet Be Purchased Under the Plans | ||||||||||
| July 1, 2021 through July 31, 2021 | 191,356 | $ | 219.46 | 191,356 | $ | 2,289 | ||||||||
| August 1, 2021 through August 31, 2021 | 680,567 | 225.52 | 680,567 | 2,136 | ||||||||||
| September 1, 2021 through September 30, 2021 | 1,115,456 | 220.30 | 1,115,456 | 1,890 | ||||||||||
| Total | 1,987,379 | $ | 222.01 | 1,987,379 | ||||||||||
| ITEM 3. | DEFAULTS UPON SENIOR SECURITIES | ||||
| ITEM 4. | MINE SAFETY DISCLOSURES | ||||
| ITEM 5. | OTHER INFORMATION | ||||
| ITEM 6. | EXHIBITS | ||||
| Exhibit | |||||
| Exhibit 31.2 | |||||
| Exhibit 32.1 | |||||
| 101.INS | XBRL Instance Document - the instance document does not appear in the Interactive Data File because its XBRL tags are embedded within the Inline XBRL document | ||||
| 101.SCH | Inline XBRL Taxonomy Extension Schema Document | ||||
| 101.CAL | Inline XBRL Taxonomy Extension Calculation Linkbase Document | ||||
| Inline XBRL Taxonomy Extension Definition Linkbase Document | |||||
| 101.LAB | Inline XBRL Taxonomy Extension Label Linkbase Document | ||||
| 101.PRE | Inline XBRL Taxonomy Extension Presentation Linkbase Document | ||||
| Cover Page Interactive Data File (formatted as Inline XBRL | |||||
| WHIRLPOOL CORPORATION | |||||||||||
| By: | |||||||||||
| /s/ JAMES W. PETERS | |||||||||||
| Name: | James W. Peters | ||||||||||
| Title: | Executive Vice President and Chief Financial Officer | ||||||||||
| Date: | October | ||||||||||