UNITED STATES SECURITIES AND EXCHANGE COMMISSION
WASHINGTON, D.C. 20549
________________________________________________________
FORM 10-Q
________________________________________________________ |
| | |
| ☒ | | QUARTERLY REPORT PURSUANT TO SECTION 13 OR 15(d) OF THE SECURITIES EXCHANGE ACT OF 1934 |
For the quarterly period ended June 30, 2019March 31, 2020
OR
|
| | |
| ☐ | | TRANSITION REPORT PURSUANT TO SECTION 13 OR 15(d) OF THE SECURITIES EXCHANGE ACT OF 1934 |
Commission file number 1-3932
WHIRLPOOL CORPORATION
(Exact name of registrant as specified in its charter)
|
| | | |
| Delaware | | 38-1490038 |
| (State of Incorporation) | | (I.R.S. Employer Identification No.) |
| | | | |
| 2000 North M-63 | | |
| Benton Harbor, | Michigan | | 49022-2692 |
| (Address of principal executive offices) | | (Zip Code) |
Registrant's telephone number, including area code (269) 923-5000
Securities registered pursuant to Section 12(b) of the Act:
|
| | | | | | |
| Title of each class | | Trading symbol(s) | | Name of each exchange on which registered |
| Common stock, par value $1.00 per share | | WHR | | Chicago Stock Exchange | and | New York Stock Exchange |
0.625% Senior Notes due 2020 | | WHR 20 | | New York Stock Exchange |
Indicate by check mark whether the registrant (1) has filed all reports required to be filed by Section 13 or 15(d) of the Securities Exchange Act of 1934 during the preceding 12 months (or for such shorter period that the registrant was required to file such reports), and (2) has been subject to such filing requirements for the past 90 days. Yes ☒ No ☐
Indicate by check mark whether the registrant has submitted electronically every Interactive Data File required to be submitted pursuant to Rule 405 of Regulation S-T (§232.405 of this chapter) during the preceding 12 months (or for such shorter period that the registrant was required to submit such files). Yes ☒ No ☐
Indicate by check mark whether the registrant is a large accelerated filer, an accelerated filer, a non-accelerated filer, a smaller reporting company, or an emerging growth company. See the definitions of "large accelerated filer," "accelerated filer," "smaller reporting company," and "emerging growth company" in Rule 12b-2 of the Exchange Act.
|
| | | |
| Large accelerated filer | ☒ | Accelerated filer | ☐ |
| Non-accelerated filer | ☐ | Smaller reporting company | ☐ |
| | | Emerging growth company | ☐ |
If an emerging growth company, indicate by check mark if the registrant has elected not to use the extended transition period for complying with any new or revised financial accounting standards provided pursuant to Section 13(a) of the Exchange Act. ☐
Indicate by check mark whether the registrant is a shell company (as defined in Rule 12b-2 of the Exchange Act). Yes ☐ No ☒
Number of shares outstanding of each of the issuer's classes of common stock, as of the latest practicable date:
|
| | |
| Class of common stock | | Shares outstanding at July 19, 2019April 24, 2020 |
Common stock, par value $1$1.00 per share | | 63,527,40962,163,066 |
WHIRLPOOL CORPORATION
QUARTERLY REPORT ON FORM 10-Q
Three and Six Months Ended June 30, 2019March 31, 2020
TABLE OF CONTENTS
|
| | |
| | | PAGE |
| |
| Item 1. | | |
| | | |
| | | |
| | | |
| | | |
| Item 2. | | |
| Item 3. | | |
| Item 4. | | |
| | | |
| |
| Item 1. | | |
| Item 1A. | | |
| Item 2. | | |
| Item 3. | | |
| Item 4. | | |
| Item 5. | | |
| Item 6. | | |
| | | |
| |
FORWARD-LOOKING STATEMENTS
The Private Securities Litigation Reform Act of 1995 provides a safe harbor for forward-looking statements made by us or on our behalf. Certain statements contained in this quarterly report, including those within the forward-looking perspective section within this report's Management's Discussion and Analysis, and other written and oral statements made from time to time by us or on our behalf do not relate strictly to historical or current facts and may contain forward-looking statements that reflect our current views with respect to future events and financial performance. As such, they are considered "forward-looking statements" which provide current expectations or forecasts of future events. Such statements can be identified by the use of terminology such as "may," "could," "will," "should," "possible," "plan," "predict," "forecast," "potential," "anticipate," "estimate," "expect," "project," "intend," "believe," "may impact," "on track," and similar words or expressions. Our forward-looking statements generally relate to our growth strategies, financial results, product development, and sales efforts. These forward-looking statements should be considered with the understanding that such statements involve a variety of risks and uncertainties, known and unknown, and may be affected by inaccurate assumptions. Consequently, no forward-looking statement can be guaranteed and actual results may vary materially.
This document contains forward-looking statements about Whirlpool Corporation and its consolidated subsidiaries ("Whirlpool") that speak only as of this date. Whirlpool disclaims any obligation to update these statements. Forward-looking statements in this document may include, but are not limited to, statements regarding expected earnings per share, cash flow, productivity and raw material prices.prices, and the impact of COVID-19 pandemic on our operations and financial condition. Many risks, contingencies and uncertainties could cause actual results to differ materially from Whirlpool's forward-looking statements. Among these factors are: (1) intense competition in the home appliance industry reflecting the impact of both new and established global competitors, including Asian and European manufacturers, and the impact of the changing retail environment;environment, including direct-to-consumer sales; (2) Whirlpool's ability to maintain or increase sales to significant trade customers and the ability of these trade customers to maintain or increase market share; (3) Whirlpool's ability to maintain its reputation and brand image; (4) the ability of Whirlpool to achieve its business plans, productivity improvements, and cost control objectives, and to leverage its global operating platform, and accelerate the rate of innovation; (5) Whirlpool's ability to obtain and protect intellectual property rights; (6) acquisition and investment-related risks, including risks associated with our past acquisitions, and risks associated with our increased presence in emerging markets; (7) risks related to our international operations, including changes in foreign regulations, regulatory compliance and disruptions arising from political, legal and economic instability; (8) information technology system failures, data security breaches, data privacy compliance, network disruptions, and cybersecurity attacks; (9) product liability and product recall costs; (10) the ability of suppliers of critical parts, components and manufacturing equipment to deliver sufficient quantities to Whirlpool in a timely and cost-effective manner; (11) our ability to attract, develop and retain executives and other qualified employees; (12) the impact of labor relations; (13) fluctuations in the cost of key materials (including steel, resins, copper and aluminum) and components and the ability of Whirlpool to offset cost increases; (14) Whirlpool's ability to manage foreign currency fluctuations; (15) impacts from goodwill impairment and related charges; (16) triggering events or circumstances impacting the carrying value of our long-lived assets; (17) inventory and other asset risk; (18) the uncertain global economy and changes in economic conditions which affect demand for our products; (19) health care cost trends, regulatory changes and variations between results and estimates that could increase future funding obligations for pension and postretirement benefit plans; (20) changes in LIBOR, or replacement of LIBOR with an alternative reference rate; (21) litigation, tax, and legal compliance risk and costs, especially if materially different from the amount we expect to incur or have accrued for, and any disruptions caused by the same; (21)(22) the effects and costs of governmental investigations or related actions by third parties; and (22)(23) changes in the legal and regulatory environment including environmental, health and safety regulations, and taxes and tariffs.tariffs; and (24) COVID-19 pandemic-related business disruption and economic uncertainty.
We undertake no obligation to update any forward-looking statement, and investors are advised to review disclosures in our filings with the SEC. It is not possible to foresee or identify all factors that could cause actual results to differ from expected or historic results. Therefore, investors should not consider the foregoing factors to be an exhaustive statement of all risks, uncertainties, or factors that could potentially cause actual results to differ from forward-looking statements.
Additional information concerning these and other factors can be found in "Risk Factors" in Part II, Item 1A of this report.
Unless otherwise indicated, the terms "Whirlpool," "the Company," "we," "us," and "our" refer to Whirlpool Corporation and its consolidated subsidiaries.
Website Disclosure
We routinely post important information for investors on our website, whirlpoolcorp.com, in the "Investors" section. We also intend to update the Hot Topics Q&A portion of this webpage as a means of disclosing material, non-public information and for complying with our disclosure obligations under Regulation FD. Accordingly, investors should monitor the Investors section of our website, in addition to following our press releases, SEC filings, public conference calls, presentations and webcasts. The information contained on, or that may be accessed through, our webpage is not incorporated by reference into, and is not a part of, this document.
|
|
| PART I. FINANCIAL INFORMATION |
|
| |
| ITEM 1. | FINANCIAL STATEMENTS |
TABLE OF CONTENTS
|
| |
| | PAGE |
| FINANCIAL STATEMENTS AND SUPPLEMENTARY DATA | |
| |
| |
| |
| | | | | PAGE | | PAGE |
NOTES TO THE CONSOLIDATED CONDENSED FINANCIAL STATEMENTS (UNAUDITED) | | 1. | | | | |
| 2. | | | | |
| 3. | | | | |
| 4. | | | | |
| 5. | | | | |
| 6. | | | | |
| 7. | | | | |
| 8. | | | | |
| 9. | | | | |
| 10. | | | | |
| 11. | | | | |
| 12. | | | | |
| 13. | | | | |
| 14. | | | | |
| 15. | | | |
| 16. | | | |
| 17. | | | |
WHIRLPOOL CORPORATION
CONSOLIDATED CONDENSED STATEMENTS OF COMPREHENSIVE INCOME (LOSS) (UNAUDITED)
FOR THE PERIODS ENDED JUNE 30MARCH 31
(Millions of dollars, except per share data)
|
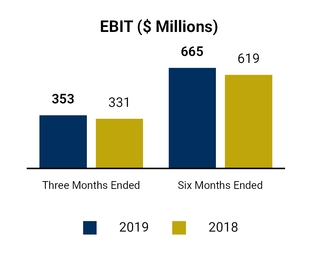
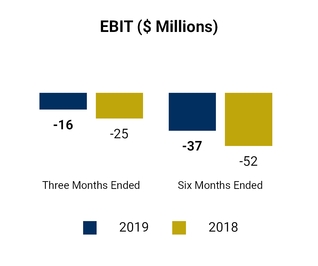
| | | | | | | | | | | | | | | |
| | Three Months Ended | | Six Months Ended |
| | 2019 | | 2018 | | 2019 | | 2018 |
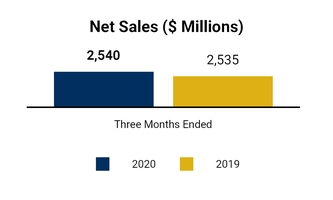
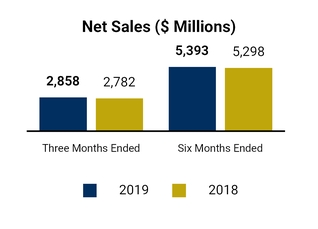
| Net sales | $ | 5,186 |
| | $ | 5,140 |
| | $ | 9,946 |
| | $ | 10,051 |
|
| Expenses | | | | | | | |
| Cost of products sold | 4,254 |
| | 4,260 |
| | 8,202 |
| | 8,359 |
|
| Gross margin | 932 |
| | 880 |
| | 1,744 |
| | 1,692 |
|
| Selling, general and administrative | 584 |
| | 541 |
| | 1,089 |
| | 1,046 |
|
| Intangible amortization | 18 |
| | 20 |
| | 36 |
| | 40 |
|
| Restructuring costs | 60 |
| | 44 |
| | 86 |
| | 188 |
|
| Impairment of goodwill and other intangibles | — |
| | 747 |
| | — |
| | 747 |
|
| Loss on disposal of businesses | 79 |
| | — |
| | 79 |
| | — |
|
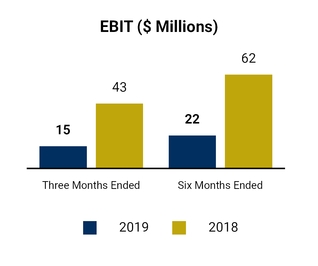
| Operating profit (loss) | 191 |
| | (472 | ) | | 454 |
| | (329 | ) |
| Other (income) expense | | | | |
| |
|
| Interest and sundry (income) expense | (63 | ) | | 90 |
| | (193 | ) | | 82 |
|
| Interest expense | 52 |
| | 47 |
| | 103 |
| | 89 |
|
| Earnings (loss) before income taxes | 202 |
| | (609 | ) | | 544 |
| | (500 | ) |
| Income tax expense (benefit) | 130 |
| | 30 |
| | (2 | ) | | 45 |
|
| Net earnings (loss) | 72 |
| | (639 | ) | | 546 |
| | (545 | ) |
| Less: Net earnings available to noncontrolling interests | 5 |
| | 18 |
| | 8 |
| | 18 |
|
| Net earnings (loss) available to Whirlpool | $ | 67 |
| | $ | (657 | ) | | $ | 538 |
| | $ | (563 | ) |
| Per share of common stock | | | | | | | |
| Basic net earnings (loss) available to Whirlpool | $ | 1.04 |
| | $ | (9.50 | ) | | $ | 8.42 |
| | $ | (8.03 | ) |
| Diluted net earnings (loss) available to Whirlpool | $ | 1.04 |
| | $ | (9.50 | ) | | $ | 8.35 |
| | $ | (8.03 | ) |
| Dividends declared | $ | 1.20 |
| | $ | 1.15 |
| | $ | 2.35 |
| | $ | 2.25 |
|
| Weighted-average shares outstanding (in millions) | | | | | | | |
| Basic | 63.8 |
| | 69.1 |
| | 63.9 |
| | 70.1 |
|
| Diluted | 64.3 |
| | 69.1 |
| | 64.4 |
| | 70.1 |
|
| | | | | | | | |
| Comprehensive income (loss) | $ | 16 |
| | $ | (802 | ) | | $ | 583 |
| | $ | (703 | ) |
|
| | | | | | | |
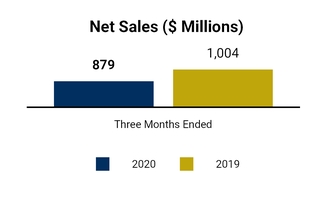
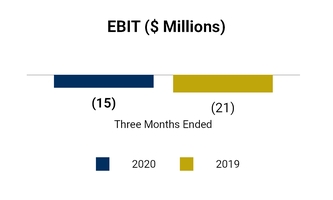
| | Three Months Ended |
| | 2020 | | 2019 |
| Net sales | $ | 4,325 |
| | $ | 4,760 |
|
| Expenses | | | |
| Cost of products sold | 3,625 |
| | 3,948 |
|
| Gross margin | 700 |
| | 812 |
|
| Selling, general and administrative | 420 |
| | 505 |
|
| Intangible amortization | 15 |
| | 18 |
|
| Restructuring costs | 5 |
| | 26 |
|
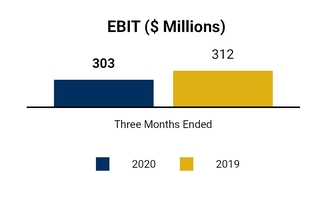
| Operating profit | 260 |
| | 263 |
|
| Other (income) expense |
| |
|
| Interest and sundry (income) expense | (1 | ) | | (130 | ) |
| Interest expense | 42 |
| | 51 |
|
| Earnings before income taxes | 219 |
| | 342 |
|
| Income tax expense (benefit) | 72 |
| | (132 | ) |
| Net earnings | 147 |
| | 474 |
|
| Less: Net earnings (loss) available to noncontrolling interests | (5 | ) | | 3 |
|
| Net earnings available to Whirlpool | $ | 152 |
| | $ | 471 |
|
| Per share of common stock | | | |
| Basic net earnings available to Whirlpool | $ | 2.42 |
| | $ | 7.36 |
|
| Diluted net earnings available to Whirlpool | $ | 2.41 |
| | $ | 7.31 |
|
| Dividends declared | $ | 1.20 |
| | $ | 1.15 |
|
| Weighted-average shares outstanding (in millions) | | | |
| Basic | 62.8 |
| | 64.0 |
|
| Diluted | 63.3 |
| | 64.5 |
|
| | | | |
| Comprehensive income | $ | 52 |
| | $ | 567 |
|
The accompanying notes are an integral part of these Consolidated Condensed Financial Statements.
WHIRLPOOL CORPORATION
CONSOLIDATED CONDENSED BALANCE SHEETS
(Millions of dollars, except share data)
| | | | (Unaudited) | | | (Unaudited) | | |
| June 30, 2019 |
| December 31, 2018 | March 31, 2020 |
| December 31, 2019 |
| Assets |
|
|
|
|
|
|
| Current assets |
|
|
|
|
|
|
| Cash and cash equivalents | $ | 1,178 |
|
| $ | 1,498 |
| $ | 2,837 |
|
| $ | 1,952 |
|
| Accounts receivable, net of allowance of $145 and $136, respectively | 2,387 |
|
| 2,210 |
| |
| Accounts receivable, net of allowance of $124 and $132, respectively | | 1,931 |
|
| 2,198 |
|
| Inventories | 3,008 |
|
| 2,533 |
| 2,543 |
|
| 2,438 |
|
| Prepaid and other current assets | 961 |
|
| 839 |
| 851 |
|
| 810 |
|
| Assets held for sale | 969 |
| | 818 |
| |
| Total current assets | 8,503 |
|
| 7,898 |
| 8,162 |
|
| 7,398 |
|
| Property, net of accumulated depreciation of $6,361 and $6,190, respectively | 3,318 |
|
| 3,414 |
| |
| Property, net of accumulated depreciation of $6,388 and $6,444, respectively | | 3,156 |
|
| 3,301 |
|
| Right of use assets | 788 |
| | — |
| 886 |
| | 921 |
|
| Goodwill | 2,450 |
|
| 2,451 |
| 2,424 |
|
| 2,440 |
|
| Other intangibles, net of accumulated amortization of $565 and $527, respectively | 2,260 |
|
| 2,296 |
| |
| Other intangibles, net of accumulated amortization of $600 and $593, respectively | | 2,185 |
|
| 2,225 |
|
| Deferred income taxes | 2,147 |
|
| 1,989 |
| 2,132 |
|
| 2,238 |
|
| Other noncurrent assets | 389 |
|
| 299 |
| 450 |
|
| 358 |
|
| Total assets | $ | 19,855 |
|
| $ | 18,347 |
| $ | 19,395 |
|
| $ | 18,881 |
|
| Liabilities and stockholders' equity |
|
|
|
|
|
|
| Current liabilities |
|
|
|
|
|
|
| Accounts payable | $ | 4,270 |
|
| $ | 4,487 |
| $ | 4,065 |
|
| $ | 4,547 |
|
| Accrued expenses | 634 |
|
| 690 |
| 527 |
|
| 652 |
|
| Accrued advertising and promotions | 652 |
|
| 827 |
| 505 |
|
| 949 |
|
| Employee compensation | 372 |
|
| 393 |
| 285 |
|
| 450 |
|
| Notes payable | 2,157 |
|
| 1,034 |
| 2,392 |
|
| 294 |
|
| Current maturities of long-term debt | 573 |
|
| 947 |
| — |
|
| 559 |
|
| Other current liabilities | 878 |
|
| 811 |
| 802 |
|
| 918 |
|
| Liabilities held for sale | 558 |
| | 489 |
| |
| Total current liabilities | 10,094 |
|
| 9,678 |
| 8,576 |
|
| 8,369 |
|
| Noncurrent liabilities |
|
|
| |
|
|
| Long-term debt | 4,155 |
|
| 4,046 |
| 4,662 |
|
| 4,140 |
|
| Pension benefits | 586 |
|
| 637 |
| 501 |
|
| 542 |
|
| Postretirement benefits | 314 |
|
| 318 |
| 315 |
|
| 322 |
|
| Lease liabilities | 660 |
| | — |
| 720 |
| | 778 |
|
| Other noncurrent liabilities | 379 |
|
| 463 |
| 641 |
|
| 612 |
|
| Total noncurrent liabilities | 6,094 |
|
| 5,464 |
| 6,839 |
|
| 6,394 |
|
| Stockholders' equity |
|
|
|
|
|
|
| Common stock, $1 par value, 250 million shares authorized, 112 million shares issued, and 63 million and 64 million shares outstanding, respectively | 112 |
|
| 112 |
| |
| Common stock, $1 par value, 250 million shares authorized, 112 million shares issued, and 62 million and 63 million shares outstanding, respectively | | 112 |
|
| 112 |
|
| Additional paid-in capital | 2,790 |
|
| 2,768 |
| 2,811 |
|
| 2,806 |
|
| Retained earnings | 7,380 |
|
| 6,933 |
| 7,947 |
|
| 7,870 |
|
| Accumulated other comprehensive loss | (2,657 | ) |
| (2,695 | ) | (2,715 | ) |
| (2,618 | ) |
| Treasury stock, 49 million and 48 million shares, respectively | (4,876 | ) |
| (4,827 | ) | |
| Treasury stock, 50 million and 49 million shares, respectively | | (5,095 | ) |
| (4,975 | ) |
| Total Whirlpool stockholders' equity | 2,749 |
|
| 2,291 |
| 3,060 |
|
| 3,195 |
|
| Noncontrolling interests | 918 |
|
| 914 |
| 920 |
|
| 923 |
|
| Total stockholders' equity | 3,667 |
|
| 3,205 |
| 3,980 |
|
| 4,118 |
|
| Total liabilities and stockholders' equity | $ | 19,855 |
|
| $ | 18,347 |
| $ | 19,395 |
|
| $ | 18,881 |
|
The accompanying notes are an integral part of these Consolidated Condensed Financial Statements.
WHIRLPOOL CORPORATION
CONSOLIDATED CONDENSED STATEMENTS OF CASH FLOWS (UNAUDITED)
FOR THE PERIODS ENDED JUNE 30MARCH 31
(Millions of dollars)
| |
| Six Months Ended | Three Months Ended |
| 2019 |
| 2018 | 2020 |
| 2019 |
| Operating activities |
|
|
|
|
|
|
| Net earnings (loss) | $ | 546 |
|
| $ | (545 | ) | |
| Net earnings | | $ | 147 |
| | $ | 474 |
|
| Adjustments to reconcile net earnings to cash provided by (used in) operating activities: |
|
|
| | | |
| Depreciation and amortization | 302 |
|
| 339 |
| 135 |
| | 142 |
|
| Impairment of goodwill and other intangibles | — |
| | 747 |
| |
| Loss on disposal of businesses | 79 |
| | — |
| |
| Changes in assets and liabilities: |
|
|
| | | |
| Accounts receivable | (251 | ) |
| (103 | ) | 125 |
| | (39 | ) |
| Inventories | (574 | ) |
| (399 | ) | (203 | ) | | (475 | ) |
| Accounts payable | (182 | ) |
| (287 | ) | (244 | ) | | (182 | ) |
| Accrued advertising and promotions | (180 | ) |
| (226 | ) | (415 | ) | | (271 | ) |
| Accrued expenses and current liabilities | (41 | ) |
| 191 |
| (193 | ) | | 29 |
|
| Taxes deferred and payable, net | (179 | ) |
| (66 | ) | 40 |
| | (190 | ) |
| Accrued pension and postretirement benefits | (39 | ) |
| (46 | ) | (11 | ) | | (23 | ) |
| Employee compensation | 7 |
|
| (31 | ) | (145 | ) | | (44 | ) |
| Other | (309 | ) |
| (158 | ) | (50 | ) | | (316 | ) |
| Cash used in operating activities | (821 | ) |
| (584 | ) | |
| Cash provided by (used in) operating activities | | (814 | ) |
| (895 | ) |
| Investing activities |
|
|
|
|
|
|
| Capital expenditures | (197 | ) |
| (194 | ) | (82 | ) | | (85 | ) |
| Proceeds from sale of assets and business | 5 |
|
| 27 |
| 26 |
| | 2 |
|
| Proceeds from held-to-maturity securities | — |
| | 60 |
| |
| Investment in related businesses | — |
|
| (2 | ) | |
| Other | (3 | ) |
| — |
| — |
| | (3 | ) |
| Cash used in investing activities | (195 | ) |
| (109 | ) | |
| Cash provided by (used in) investing activities | | (56 | ) |
| (86 | ) |
| Financing activities |
|
|
|
|
|
|
| Net proceeds from borrowings of long-term debt | 697 |
|
| 700 |
| 541 |
| | 695 |
|
| Repayments of long-term debt | (943 | ) |
| (376 | ) | (566 | ) | | (939 | ) |
| Net proceeds from short-term borrowings | 1,119 |
|
| 1,398 |
| |
| Net proceeds (repayments) from short-term borrowings | | 2,111 |
| | 991 |
|
| Dividends paid | (149 | ) |
| (159 | ) | (75 | ) | | (73 | ) |
| Repurchase of common stock | (50 | ) |
| (1,001 | ) | (121 | ) | | (50 | ) |
| Common stock issued | 4 |
|
| 7 |
| 3 |
| | 3 |
|
| Cash provided by financing activities | 678 |
|
| 569 |
| |
| Cash provided by (used in) financing activities | | 1,893 |
|
| 627 |
|
| Effect of exchange rate changes on cash, cash equivalents and restricted cash | 9 |
|
| (42 | ) | (138 | ) | | 11 |
|
| Decrease in cash, cash equivalents and restricted cash | (329 | ) |
| (166 | ) | |
| Cash, cash equivalents and restricted cash at beginning of period | 1,538 |
|
| 1,293 |
| |
| Cash, cash equivalents and restricted cash at end of period | $ | 1,209 |
|
| $ | 1,127 |
| |
| Increase (decrease) in cash, cash equivalents and restricted cash | | 885 |
|
| (343 | ) |
| Cash, cash equivalents and restricted cash at beginning of year | | 1,952 |
|
| 1,538 |
|
| Cash, cash equivalents and restricted cash at end of year | | $ | 2,837 |
|
| $ | 1,195 |
|
The accompanying notes are an integral part of these Consolidated Condensed Financial Statements.
NOTES TO THE CONSOLIDATED CONDENSED FINANCIAL STATEMENTS (UNAUDITED)
(1) BASIS OF PRESENTATION
General Information
The accompanying unaudited Consolidated Condensed Financial Statements have been prepared in accordance with accounting principles generally accepted in the United States of America ("GAAP") for interim financial information, and with the instructions to Form 10-Q and Article 10 of Regulation S-X. Accordingly, they do not include all information or footnotes required by U.S. GAAP for complete financial statements. As a result, this Form 10-Q should be read in conjunction with the Consolidated Financial Statements and accompanying Notes in our Form 10-K for the year ended December 31, 2018.2019.
Management believes that the accompanying Consolidated Condensed Financial Statements reflect all adjustments, including normal recurring items, considered necessary for a fair presentation of the interim periods.
We are required to make estimates and assumptions that affect the amounts reported in the Consolidated Condensed Financial Statements and accompanying Notes. Actual results could differ materially from those estimates.
Certain prior year amounts in the Consolidated Condensed Financial Statements have been reclassified to conform with current year presentation.
We have eliminated all material intercompany transactions in our Consolidated Condensed Financial Statements. We do not consolidate the financial statements of any company in which we have an ownership interest of 50% or less, unless that company is deemed to be a variable interest entity ("VIE") of which we are the primary beneficiary. VIEs are consolidated when the company is the primary beneficiary of these entities and has the ability to directly impact the activities of these entities.
Risks and Uncertainties
COVID-19 continues to spread throughout the United States and other countries across the world, and the duration and severity of the effects are currently unknown. It is possible the pandemic could materially impact our financial results in future periods. The Consolidated Condensed Financial Statements presented herein reflect estimates and assumptions made by management at March 31, 2020 and for the three-months ended March 31, 2020.
Such estimates and assumptions affect, among other things, the Company’s goodwill, long-lived asset and indefinite-lived intangible asset valuation; inventory valuation; assessment of the annual effective tax rate; valuation of deferred income taxes and income tax contingencies; and the allowance for expected credit losses and bad debt. Events and changes in circumstances arising after May 1, 2020, including those resulting from the impacts of COVID-19, will be reflected in management’s estimates for future periods.
Goodwill and indefinite-lived intangible assets
Our Critical Accounting Policies and Estimates for goodwill and other indefinite-life intangibles are disclosed in Note 1 to the Consolidated Financial Statements and in Management's Discussion and Analysis of our annual report on Form 10-K for the fiscal year ended December 31, 2019.
We continue to monitor the significant global economic uncertainty as a result of COVID-19 to assess the outlook for demand for our products and the impact on our business and our overall financial performance. The goodwill in our EMEA reporting unit and our Indesit, Hotpoint* and Maytag trademarks continue to be at risk at March 31, 2020. The goodwill in our other reporting units or indefinite-lived intangible assets is not at risk for future impairment.
The potential impact of COVID-19 related demand disruptions and related production impacts on our operating results for the EMEA reporting unit in the short-term is uncertain, but we remain committed to the strategic actions necessary to realize the long-term forecasted EBIT margins and expect that the macroeconomic environment will recover in the medium to long-term. The potential negative demand effect on revenues for the Indesit and Hotpoint* trademarks and the Maytag trademark is also uncertain given the volatile environment, but we expect that demand and production levels will also recover.
As a result of our analysis, and in consideration of the totality of events and circumstances, there were no triggering events of impairment identified during the first quarter of 2020.
*Whirlpool ownership of the Hotpoint brand in EMEA and Asia Pacific regions is not affiliated with the Hotpoint brand sold in the Americas.
A lack of recovery or further deterioration in market conditions, a sustained trend of weaker than expected financial performance in EMEA or for our Indesit, Hotpoint* and Maytag trademarks or a lack of recovery or further decline in the Company’s market capitalization, among other factors, as a result of the COVID-19 pandemic could result in an impairment charge in future periods which could have a material adverse effect on our financial statements.
Income taxes
Under U.S. GAAP, the Company calculates its quarterly tax provision based on an estimated effective tax rate for the year and then adjusts this amount by certain discrete items each quarter. The changing and volatile macro-economic conditions connected with the COVID-19 pandemic may cause fluctuations in forecasted earnings before income taxes. As such, the Company's effective tax rate could be subject to volatility as forecasted earnings before income taxes are impacted by events which cannot be predicted.
Other Accounting Matters
Synthetic lease arrangements
In the first quarter of 2020, we entered into a synthetic lease arrangement with a financial institution for non-core properties in the North America region. The term of these leases commenced in the first quarter of 2020 and will expire five years after commencement. The leases contain provisions for options to purchase, extend the original term for additional periods or return the property. These arrangements include a residual value guarantee that could potentially come due in future periods. The current obligation residual value guarantee is not material as of March 31, 2020. We have assessed the reasonable certainty of these provisions to determine the appropriate lease term.
We assessed the lease classification of the agreements and determined they were operating leases. These leases were measured using our incremental borrowing rate and are included in our right of use assets and lease liabilities in the Consolidated Condensed Balance Sheets for a nominal amount. Rental payments are calculated at the applicable LIBOR rate plus a margin and the annual lease payments are nominal
Adoption of New Accounting Standards
On January 1, 2019,2020 we adopted Accounting Standards Update (“ASU”("ASU") No. 2017-12, "Derivatives2016-13, "Financial Instruments - Credit Losses (Topic 326): Measurement of Credit Losses on Financial Instruments." The guidance in ASU 2016-13 creates a new impairment standard replacing the current "incurred loss" model. The incurred loss model required that for a loss to be impaired and Hedging (Topic 815): Targeted Improvementsrecognized on the financial statements it must be probable that it has been incurred at the measurement date. The new standard utilizes an "expected credit loss" model also referred to Accountingas "the current expected credit loss" (CECL) model. Under CECL, there is no threshold for Hedging Activities."impairment loss recognition, but it instead reflects a current estimate of all expected credit losses. The adoption of this standard did not have a material impact on our Consolidated Condensed Financial Statements, however we have expanded our use of hedge accounting to hedge contractually specified components in commodity contracts designated as cash flow hedges. For additional information on the required disclosures related to the impact of adopting this standard, see Note 10 to the Consolidated Condensed Financial Statements.
On January 1, 2019, we adopted ASU No. 2016-02, "Leases (Topic 842)" and as part of that process the Company made the following elections:
The Company did not elect the hindsight practical expedient, for all leases.
The Company elected the package of practical expedients and, as a result, did not reassess prior conclusions related to contracts containing leases, lease classification and initial direct costs for all leases.
In March 2018, the FASB approved an optional transition method that allows companies to use the effective date as the date of initial application on transition. The Company elected this transition method, and as a result, did not adjust its comparative period financial information or make the newly required lease disclosures for periods before the effective date.
The Company elected to make the accounting policy election for short-term leases resulting in lease payments being recorded as an expense on a straight-line basis over the lease term.
The Company elected to not separate lease and non-lease components for all leases.
The Company did not elect the land easement practical expedient.
Upon adoption, we recognized the cumulative effect of initially applying this new standard resulting in the addition of approximately $858 million of right of use assets, of which $46 million were classified as held for sale, as well as the corresponding short-term and long-term lease liabilities. Additionally, the Company has sold and leased back a group of properties in our Latin American region and, upon adoption, the Company recorded a cumulative adjustment to retained earnings of approximately $82 million related to deferred gains associated with these transactions.
For additional information on the required disclosures related to the impact of adopting this standard, see Note 32 to the Consolidated Condensed Financial Statements.
For additional informationWe adopted the following standards, none of which have a material impact on held for sale assets, see Note 16 to theour Consolidated Condensed Financial Statements.Statements:
|
| | |
| Standard | | Effective Date |
| 2018-13 | Fair Value Measurement (Topic 820) Disclosure Framework - Changes to the Disclosure Requirements for Fair Value Measurement | January 1, 2020 |
| 2018-15 | Intangibles - Goodwill and Other - Internal-Use Software (Subtopic 350-40) Customer's Accounting for Implementation Costs Incurred In a Cloud Computing Arrangement That Is a Service Contract | January 1, 2020 |
| 2018-18 | Collaborative Arrangements (Topic 808) - Clarifying the Interaction between Topic 808 and Topic 606 | January 1, 2020 |
All other newly issued and effective accounting standards during 20192020 were not relevant or material to the Company.
*Whirlpool ownership of the Hotpoint brand in EMEA and Asia Pacific regions is not affiliated with the Hotpoint brand sold in the Americas.
Accounting Pronouncements Issued But Not Yet Effective
In November 2018,March 2020, the FASB issued ASU 2018-18, "Collaborative ArrangementsUpdate 2020-04, "Reference Rate Reform (Topic 808)848): ClarifyingFacilitation of the Interaction between Topic 808Effects of Reference Rate Reform on Financial Reporting". The amendments in Update 2020-04 are elective and Topic 606."apply to all entities that have contracts, hedging relationships, and other transactions that reference LIBOR or another reference rate expected to be discontinued due to reference rate reform. The new standard clarifiesguidance provides the following optional expedients: simplify accounting analyses under current U.S. GAAP for contract modifications, simplify the assessment of hedge effectiveness, allow hedging relationships affected by reference rate reform to continue and allow a one-time election to sell or transfer debt securities classified as held to maturity that reference a rate affected by reference rate reform. The amendments are effective for all entities from the beginning of an interim period that includes the issuance date of the ASU. An entity may elect to apply the amendments prospectively through December 31, 2022. The Company is currently evaluating the impact of adopting this guidance.
In December 2019, the FASB issued Update 2019-12, "Income Taxes (Topic 740): Simplifying the Accounting for Income Taxes". The amendments in this Update affect entities within the scope of Topic 740, Income Taxes. The amendments in this Update simplify the accounting for income taxes by removing certain transactions between participantsexceptions to the general principles in a collaborative arrangement should be accounted for under Topic 606 when the counterparty is a customer for a good or service that is a distinct unit of account.740. The amendments also precludeimprove consistent application of and simplify GAAP for other areas of Topic 740 by clarifying and amending existing guidance. For public business entities, from presenting consideration from transactions with a collaborator that is not a customer together with revenue recognized from contracts with customers. The new standard isthe amendments in this Update are effective for fiscal years, and interim periods within those fiscal years, beginning after December 15, 2019, and interim periods within those fiscal years. Early adoption is permitted in any interim period for entities that have adopted ASC 606. The standard should be applied retrospectively to the period when initially adopted ASC 606.2020. The Company is currently evaluating the impact of adopting this guidance.
The FASB has issued the following relevant standards, which are not expected to have a material impact on our Consolidated Condensed Financial Statements:
|
| | |
| Standard | | Effective Date |
2016-13 | Financial Instruments - Credit Losses (Topic 326): Measurement of Credit Losses on Financial Instruments | January 1, 2020 |
2018-13 | Fair Value Measurement (Topic 820): Disclosure Framework - Changes to the Disclosure Requirements for Fair Value Measurement | January 1, 2020 |
| 2018-14 | Compensation - Retirement Benefits - Defined Benefit Plans - General (Subtopic 715-20): Disclosure Framework - Changes to the Disclosure Requirements for Defined Benefit Plans | January 1, 2021 |
2018-15 | Intangibles - Goodwill and Other - Internal-Use Software (Subtopic 350-40): Customer's Accounting for Implementation Costs Incurred In a Cloud Computing Arrangement That Is a Service Contract | January 1, 2020 |
2018-17 | Consolidation (Topic 810): Targeted Improvements to Related Party Guidance for Variable Interest Entities | January 1, 2020 |
All other issued and not yet effective accounting standards are not relevant or material to the Company.
(2) REVENUE RECOGNITION
Disaggregation of Revenue
The following table presents our disaggregated revenues by revenue source. We sell products within all product categories in each operating segment. Revenues related to compressors are fully reflected in our Latin America segment. For additional information on the disaggregated revenues by geographic regions, see Note 1514 to the Consolidated Condensed Financial Statements.
| | | | | Three Months Ended June 30, | | Six Months Ended June 30, | | Three Months Ended March 31, |
| Millions of dollars | | 2019 | | 2018 | | 2019 | | 2018 | | 2020 | | 2019 |
| Major product categories: | | | | | | | | | | | | |
| Laundry | | $ | 1,492 |
| | $ | 1,463 |
| | $ | 2,975 |
| | $ | 3,025 |
| | $ | 1,330 |
| | $ | 1,483 |
|
| Refrigeration | | 1,656 |
| | 1,606 |
| | 3,019 |
| | 2,897 |
| | 1,362 |
| | 1,363 |
|
| Cooking | | 1,075 |
| | 1,089 |
| | 2,119 |
| | 2,138 |
| | 943 |
| | 1,044 |
|
| Dishwashing | | 398 |
| | 412 |
| | 762 |
| | 808 |
| | 371 |
| | 364 |
|
| Total major product category net sales | | $ | 4,621 |
| | $ | 4,570 |
| | $ | 8,875 |
| | $ | 8,868 |
| | $ | 4,006 |
| | $ | 4,254 |
|
Compressors | | 323 |
| | 285 |
| | 635 |
| | 581 |
| | — |
| | 312 |
|
| Spare parts and warranties | | 180 |
| | 249 |
| | 371 |
| | 522 |
| | 228 |
| | 191 |
|
| Other | | 62 |
| | 36 |
| | 65 |
| | 80 |
| | 90 |
| | 3 |
|
| Total net sales | | $ | 5,186 |
| | $ | 5,140 |
| | $ | 9,946 |
| | $ | 10,051 |
| | $ | 4,325 |
| | $ | 4,760 |
|
| |
(1) | Change in compressors compared to the prior year is due to the divestiture of the Embraco compressor business. |
The impact to revenue related to prior period performance obligations was not material for the three and six months ended June 30, 2019.March 31, 2020.
Bad Debt Expense
Bad debt expense was not material for the three and six months ended June 30, 2019.
(3) LEASES
Leases
We lease certain manufacturing facilities, warehouses/distribution centers, office space, land, vehicles, and equipment. At lease inception, we determine the lease term by assuming the exercise of those renewal options that are reasonably assured. Leases with an initial term of 12 months or less are not recorded in the Consolidated Condensed Balance Sheets and we recognize lease expense for these leases on a straight-line basis over the lease term. The Company has operating lease costs of approximately $104 million for the six months endedJune 30, 2019.
As of June 30, 2019, we have approximately $82 million of non-cancelable operating lease commitments, primarily for warehouses, that have not yet commenced. These operating leases will commence between fiscal year 2019 and fiscal year 2020 with lease terms of up to 15 years.
At June 30, 2019, we have no financing leases and we have approximately $993 million of non-cancelable operating lease commitments, excluding variable consideration. The undiscounted annual future minimum lease payments are summarized by year in the table below:
|
| | | |
| Maturity of Lease Liabilities | Operating Leases (in millions) |
| 2019 | $ | 99 |
|
| 2020 | 179 |
|
| 2021 | 148 |
|
| 2022 | 124 |
|
| 2023 | 112 |
|
| After 2023 | 331 |
|
| Total lease payments | $ | 993 |
|
| Less: interest | 144 |
|
Present value of lease liabilities (1) | $ | 849 |
|
(1) Present value of lease liabilities includes liabilities held for sale of $36 million.
The long-term portion of the lease liabilities included in the amounts above is $660 million, excluding held for sale liabilities, and the remainder of our lease liabilities, excluding held for sale liabilities, are included in other current liabilities in the Consolidated Condensed Balance Sheets.
At June 30, 2019, the weighted average remaining lease term and weighted average discount rate for operating leases was 7 years and 5%, respectively.
During the six months ended June 30, 2019 the cash paid for amounts included in the measurement of the liabilities and the operating cash flows was $100 million. The right of use assets obtained in exchange for new liabilities was $61 million in the six months ended.
As the Company's lease agreements normally do not provide an implicit interest rate, we apply the Company's incremental borrowing rate based on the information available at commencement date in determining the present value of future lease payments. Relevant information used in determining the Company’s incremental borrowing rate includes the duration of the lease, location of the lease, and the Company’s credit risk relative to risk-free market rates.
Many of our leases include renewal options that can extend the lease term. The execution of those renewal options is at our sole discretion and reflected in the lease term when they are reasonably certain to be exercised.
Certain leases also include options to purchase the underlying asset at fair market value. If leased assets have leasehold improvements, typically the depreciable life of those leasehold improvements are limited by the expected lease term. Additionally, certain lease agreements include lease payment adjustments for inflation.
Our lease agreements do not contain any material residual value guarantees or material restrictive covenants.
Allowance for Expected Credit Losses and Bad Debt Expense
We rent or subleaseestimate our expected credit losses primarily by using an aging methodology and establish customer-specific reserves for higher risk trade customers. Our expected credit losses are evaluated and controlled within each geographic region considering the unique credit risk specific to the country, marketplace and economic environment. We take into account past events, current conditions and reasonable and supportable forecasts in developing the reserve. The adoption of the new credit loss standard did not have a material impact on the Consolidated Condensed Financial Statements as of March 31, 2020.
The following table summarizes our allowance for doubtful accounts by operating segment for the three months ended March 31, 2020.
|
| | | | | | | | | | | | | | | |
| Millions of dollars | December 31, 2019 | Charged to Earnings | Write-offs | Foreign Currency | March 31, 2020 |
| North America | $ | 4 |
| $ | 1 |
| $ | — |
| $ | — |
| $ | 5 |
|
| EMEA | 83 |
| 1 |
| (9 | ) | (4 | ) | 71 |
|
| Latin America | 33 |
| 6 |
| — |
| (6 | ) | 33 |
|
| Asia | 12 |
| 4 |
| — |
| (1 | ) | 15 |
|
| Consolidated | $ | 132 |
| $ | 12 |
| $ | (9 | ) | $ | (11 | ) | $ | 124 |
|
We also have an allowance on certain real estatefinancing receivables that are recorded in prepaid and other current assets and other noncurrent assets on our Consolidated Condensed Balance Sheets. The allowance at March 31, 2020 and December 31, 2019 was approximately $41 million and $48 million, respectively. The amount charged to third parties. Our sublease portfolio primarily consists of operating leases within our warehouses, resulting in a nominal amount of sublease income in 2019.earnings and write-offs for the three months ended March 31, 2020 was immaterial.
(4)(3) CASH, CASH EQUIVALENTS AND RESTRICTED CASH
The following table provides a reconciliation of cash, cash equivalents and restricted cash as reported within our Consolidated Condensed Statements of Cash Flows:
| | | | June 30, | March 31, |
| Millions of dollars | 2019 | | 2018 | 2020 | | 2019 |
| Cash and cash equivalents as presented in our Consolidated Condensed Balance Sheets | $ | 1,178 |
| | $ | 1,057 |
| $ | 2,837 |
| | $ | 1,163 |
|
Restricted cash included in prepaid and other current assets (1) | 25 |
| | 47 |
| — |
| | 32 |
|
Restricted cash included in other noncurrent assets (1) | — |
| | 23 |
| |
| Cash included in assets held for sale | 6 |
| | — |
| |
| Cash, cash equivalents and restricted cash as presented in our Consolidated Condensed Statements of Cash Flows | $ | 1,209 |
| | $ | 1,127 |
| $ | 2,837 |
| | $ | 1,195 |
|
| |
(1) | Change in restricted cash reflects realization of foreign currency translation adjustments of $(2) million for the three months ended March 31, 2019Change in restricted cash reflects realization of foreign currency translation adjustments of $(1) million and $1 million, respectively, for the six months ended June 30, 2019 and 2018 compared to the prior fiscal year end. |
| | | | December 31, | December 31, |
| Millions of dollars | 2018 | | 2017 | 2019 | | 2018 |
| Cash and cash equivalents as presented in our Consolidated Balance Sheets | $ | 1,498 |
| | $ | 1,196 |
| $ | 1,952 |
| | $ | 1,498 |
|
| Restricted cash included in prepaid and other current assets | 40 |
| | 48 |
| — |
| | 40 |
|
| Restricted cash included in other noncurrent assets | — |
| | 49 |
| |
| Cash, cash equivalents and restricted cash as presented in our Consolidated Statements of Cash Flows | $ | 1,538 |
| | $ | 1,293 |
| $ | 1,952 |
| | $ | 1,538 |
|
Restricted cash can only bewas used to fund capital expenditures and technical resources to enhance Whirlpool China's research and development and working capital, as required by the terms of the Whirlpool China (formerly Hefei Sanyo) acquisition completedacquisition. In 2019, we spent the remaining amount for these purposes resulting in October 2014.
(5) INVENTORIES
The following table summarizes our inventoryrestricted cash of $0 at June 30, 2019 and December 31, 2018:
|
| | | | | | | | |
| Millions of dollars |
| June 30, 2019 |
| December 31, 2018 |
| Finished products |
| $ | 2,547 |
|
| $ | 2,076 |
|
| Raw materials and work in process |
| 618 |
|
| 617 |
|
|
| 3,165 |
|
| 2,693 |
|
| Less: excess of FIFO cost over LIFO cost |
| (157 | ) |
| (160 | ) |
| Total inventories |
| $ | 3,008 |
|
| $ | 2,533 |
|
LIFO inventories represented 46% and 41% of total inventories at June 30, 2019 and December 31, 2018, respectively.2019.
(6)(4) INVENTORIES
The following table summarizes our inventories at March 31, 2020 and December 31, 2019:
|
| | | | | | | | |
| Millions of dollars |
| March 31, 2020 |
| December 31, 2019 |
| Finished products |
| $ | 2,063 |
|
| $ | 1,979 |
|
| Raw materials and work in process |
| 619 |
|
| 602 |
|
|
| 2,682 |
|
| 2,581 |
|
| Less: excess of FIFO cost over LIFO cost |
| (139 | ) |
| (143 | ) |
| Total inventories |
| $ | 2,543 |
|
| $ | 2,438 |
|
LIFO inventories represented 42% and 43% of total inventories at March 31, 2020 and December 31, 2019, respectively.
(5) PROPERTY, PLANT &AND EQUIPMENT
The following table summarizes our property, plant and equipment at June 30, 2019March 31, 2020 and December 31, 2018:2019:
| | | Millions of dollars |
| June 30, 2019 |
| December 31, 2018 |
| March 31, 2020 |
| December 31, 2019 |
| Land |
| $ | 101 |
|
| $ | 102 |
|
| $ | 88 |
|
| $ | 97 |
|
| Buildings |
| 1,607 |
|
| 1,593 |
|
| 1,503 |
|
| 1,540 |
|
| Machinery and equipment |
| 7,971 |
|
| 7,909 |
|
| 7,953 |
|
| 8,108 |
|
| Accumulated depreciation |
| (6,361 | ) |
| (6,190 | ) |
| (6,388 | ) |
| (6,444 | ) |
| Property, plant and equipment, net |
| $ | 3,318 |
|
| $ | 3,414 |
|
| $ | 3,156 |
|
| $ | 3,301 |
|
During the sixthree months ended June 30, 2019,March 31, 2020, we disposed of buildings, machinery and equipment no longer in use with a net book value of $6 million and the loss$18 million. The net gain on the disposal wasdisposals were not material.
(7)(6) FINANCING ARRANGEMENTS
Debt Offering
On February 21, 2020, Whirlpool EMEA Finance S.à r.l., an indirect, wholly-owned finance subsidiary of Whirlpool Corporation, completed a bond offering consisting of €500 million (approximately $540 million) in principal amount of 0.50% Senior Notes due in 2028 (the "Notes") in a public offering pursuant to a registration statement on Form S-3 (File No. 333-224381). The Notes were issued under an indenture, dated February 21, 2020, among Whirlpool EMEA Finance S.à r.l, as issuer, Whirlpool Corporation, as parent guarantor, and U.S. Bank National Association, as trustee. Whirlpool Corporation has fully and unconditionally guaranteed the Notes on a senior unsecured basis. The Notes contain covenants that limit Whirlpool Corporation's ability to incur certain liens or enter into certain sale and lease-back transactions. In addition, if we experience a specific kind of change of control, we are required to make an offer to purchase all of the Notes at a purchase price of 101% of the principal amount thereof, plus accrued and unpaid interest.
On February 26, 2019, Whirlpool Corporation completed a bond offering consisting of $700 million in principal amount of 4.75% Senior Notes due in 2029. The notes contain covenants that limit Whirlpool Corporation's ability to incur certain liens or enter into certain sale and lease-back transactions. In addition, if we experience a specific kind of change of control, we are required to make an offer to purchase all of the notes at a purchase price of 101% of the principal amount thereof, plus accrued and unpaid interest. The notes are registered under the Securities Act of 1933, as amended, pursuant to our Registration Statement on Form S-3 (File No.333-224381) previously filed with the Securities and Exchange Commission.
Debt Repayment
On March 12, 2020, €500 million (approximately $566 million) of 0.625% senior notes matured and were repaid.
On August 9, 2019, we repaid $1.0 billion pursuant to our April 23, 2018 Term Loan Agreement with Citibank, N.A., as Administrative Agent, and certain other financial institutions, representing full repayment of amounts borrowed under
the term loan. As previously disclosed, we agreed to repay this term loan amount with the net cash proceeds received from the sale of our Embraco business unit to Nidec Corporation, which closed on July 1, 2019.
On March 1, 2019, $250 million of 2.40% senior notes matured and were repaid.
On February 27, 2019, we repaid €600 million (approximately $673 million) pursuant to our June 5, 2018 term loan agreementTerm Loan Agreement with Wells Fargo Bank, National Association, as Administrative Agent, and certain other financial institutions (the "Whirlpool EMEA Finance Term Loan"), representing full repayment of amounts borrowed under the Whirlpool EMEA Finance Term Loan. On March 1, 2019, $250 million of 2.40% senior notes matured and were repaid. On April 26, 2018, $363 million of 4.50% senior notes matured and were repaid.
Term Loan Agreements
On April 23, 2018 the Company27, 2020, Whirlpool Corporation entered into and on May 14, 2018 and August 30, 2018 the Company amended, a Term Loanrevolving 364-Day Credit Agreement (the "Term Loan Agreement"“364-Day Facility”) by and among the Company, the lenders referred to therein, and Citibank, N.A.,N.A.. as Administrative Agent, JPMorgan Chase Bank, N.A. as Syndication Agent,Agent. The 364-Day Facility provides aggregate borrowing capacity of $500 million, and certain other financial institutions. Citibank, N.A., JPMorgan Chase Bank, N.A., BNP Paribas Securities Corp., Mizuho Bank, Ltd., and Wells Fargo Securities, LLC acted as Joint Lead Arrangers and Joint Bookrunners for the Term Loan Agreement. The Term Loan Agreement provides for an aggregate lender commitment of $1.0 billion and is recorded in notes payable in our Consolidated Condensed Balance Sheets. The Term Loan Agreement hadhas a maturitytermination date of April 22, 2019. On March 27, 2019 the Company extended the Termination Date of the Term Loan Agreement for an additional six months to October 23, 2019. The Company also has agreed to repay the outstanding term loan amounts with the net cash proceeds received from the closing of the Embraco sale transaction which will occur in the third quarter of 2019. The Embraco sale transaction closed on July 1, 2019. The proceeds of the Term Loan Agreement were used to fund accelerated share repurchases through a modified Dutch auction tender offer.26, 2021.
The interest and fee rates payable with respect to the term loan facility364-Day Facility based on the Company'sCompany’s current debt rating are as follows: (1) the spread over LIBOREurodollar Margin is 1.125%1.625%; (2) the spread over prime is 0.125%0.625%; and (3) the tickingunused commitment fee is 0.125%0.400%, as of the date hereof.April 27, 2020. The Term Loan Agreement, as amended,364-Day Facility contains customary covenants and warranties which are consistent with the Company’s $3.5 billion revolving credit facility, including, among other things, a debt to capitalization ratio of less than or equal to 0.65 to 1.00 as of the last day of each fiscal quarter, and a rolling twelve month interest coverage ratio required to be greater than or equal to 3.0 to 1.0 for each fiscal quarter. In addition, the covenants limit the Company'sCompany’s ability to (or to permit any subsidiaries to), subject to various exceptions and limitations: (i) merge with other companies; (ii) create liens on its property; and (iii) incur debt or off-balance sheet obligations at the subsidiary level; (iv) enter into transactions with affiliates, except on an arms-length basis or with or between subsidiaries; (v) enter into agreements restricting the payment of subsidiary dividends
or restricting the making of loans or repayment of debt by subsidiaries to the Company or other subsidiaries; and (vi) enter into agreements restricting the creation of liens on its assets.
Credit Facilitieslevel.
On September 27, 2017,August 6, 2019, Whirlpool Corporation exercised its commitment increase and term extension rights under the Thirdentered into a Fourth Amended and Restated Long-Term Credit Agreement (the "Amended Long-Term Facility", or "revolving credit facility") by and among the Company, certain other borrowers, the lenders referred to therein, JPMorgan Chase Bank, N.A. as Administrative Agent, and Citibank, N.A., as Syndication Agent. In connection with this exercise, the Company entered into a Consent to Commitment Increase agreement with the Administrative Agent, which increasesThe Amended Long-Term Facility provides aggregate borrowing capacity underof $3.5 billion, an increase of $500 million from the Company's prior amended and restated credit agreement. The Amended Long-Term Facility from $2.5 billion to $3.0 billion, and the Administrative Agent received extension request consents fromhas a majority of lenders, which extends the terminationmaturity date of the Amended Long-Term Facility by one year, to May 17, 2022.August 6, 2024, unless earlier terminated. On March 28, 2019, the Amended Long-Term Facility was amended to add one13, 2020 we initiated a borrowing of approximately $2.2 billion under this agreement and for which a portion of the Company's U.K. subsidiaries as an additional borrower.proceeds from the borrowing were used to fund commercial paper repayment.
The interest and fee rates payable with respect to the Amended Long-Term Facility based on our current debt rating are as follows: (1) the spread over LIBOREURIBOR is 1.125%; (2) the spread over prime is 0.125%; and (3) the unused commitmentticking fee is 0.125%0.100%. The Amended Long-Term Facility as amended, contains customary covenants and warranties including, among other things, a debt to capitalization ratio of less than or equal to 0.65 to 1.00 as of the last day of each fiscal quarter, and a rolling twelve month interest coverage ratio required to be greater than or equal to 3.0 to 1.0 for each fiscal quarter. In addition, the covenants limit our ability to (or to permit any subsidiaries to), subject to various exceptions and limitations: (i) merge with other companies; (ii) create liens on our property; (iii) incur debt or off-balance sheet obligations at the subsidiary level; (iv) enter into transactionslevel. We are in compliance with affiliates, except on an arms-length basis or with or between subsidiaries; (v) enter into agreements restrictingboth our debt to capitalization ratio and interest coverage ratio under the paymentrevolving credit facility as of subsidiary dividends or restrictingMarch 31, 2020.
At March 31, 2020, we had $2.2 billion outstanding and $1.3 billion of remaining availability under the making of loans or repayment of debt by subsidiaries toAmended Long-Term Facility. We had 0 borrowings outstanding under the Company or other subsidiaries; and (vi) enter into agreements restricting the creation of liens on our assets.Amended Long-Term Facility at December 31, 2019.
In addition to the committed $3.0$3.5 billion Amended Long-Term Facility, we have a committed European facility and committed credit facilities in Brazil. The European facility provides borrowings up to €250 million (approximately $284 million at June 30, 2019Brazil and $286 million at December 31, 2018), maturing on September 26, 2019.India. The committed credit facilities in Brazil and India provide borrowings up to 1.01 billion Brazilian reais and 1 billion Indian rupees (approximately $261$206 million at June 30, 2019March 31, 2020 and $258$262 million at December 31, 2018)2019), maturing through 2022.
We had no borrowings outstanding under the committed On August 5, 2019 we terminated a €250 million European revolving credit facilities at June 30, 2019 or December 31, 2018.facility that we entered into in July 2015. The termination of this facility did not have a material impact on our Consolidated Condensed Financial Statements.
Notes Payable
Notes payable, which consist of short-term borrowings payable to banks or commercial paper, are generally used to fund working capital requirements. The fair value of our notes payable approximates the carrying amount due to the short maturity of these obligations.
The following table summarizes the carrying value of notes payable at June 30, 2019March 31, 2020 and December 31, 2018:2019:
| | | Millions of dollars | | June 30, 2019 | | December 31, 2018 | | March 31, 2020 | | December 31, 2019 |
| Commercial paper | | $ | 947 |
| | $ | — |
| | $ | 197 |
| | $ | 274 |
|
| Short-term borrowings due to banks | | 1,210 |
| | 1,034 |
| | 2,195 |
| | 20 |
|
| Total notes payable | | $ | 2,157 |
| | $ | 1,034 |
| | $ | 2,392 |
| | $ | 294 |
|
Short-term borrowings due to banks include the current portion of the outstanding amount under the Amended Long-Term Facility which is expected to be repaid in the next twelve months.
Transfers and Servicing of Financial Assets
In an effort to manage economic and geographic trade customer risk, from time to time, the Company will transfer, primarily without recourse, accounts receivable balances of certain customers to financial institutions resulting in a nominal impact recorded in interest and sundry (income) expense. These transactions are accounted for as sales of the receivables resulting in the receivables being de-recognized from the Consolidated Condensed Balance Sheets. These transfers primarily do not require continuing involvement from the Company, however certain arrangements include servicing of transferred receivables by Whirlpool. Outstanding accounts receivable transferred under arrangements where the Company continues to service the transferred asset were $255$241 million and $161$348 million as of June 30, 2019March 31, 2020 and December 31, 2018,2019, respectively.
(8)(7) COMMITMENTS AND CONTINGENCIES
Embraco Antitrust Matters
Beginning in February 2009, our former Embraco compressor business headquartered in Brazil ("Embraco") was notified of antitrust investigations of the global compressor industry by government authorities in various jurisdictions. Embraco has resolved the government investigations and related claims in various jurisdictions and certain other claims remain pending.
Whirlpool has agreed to retain potential liabilities related to this matter following closing of the Embraco sale transaction. We continue to defend these actions. While it is currently not possible to reasonably estimate the aggregate amount of costs which we may incur in connection with these matters, such costs could have a material adverse effect on our financial statements in any particular reporting period.
BEFIEX Credits and Other Brazil Tax Matters
In previous years, our Brazilian operations earned tax credits under the Brazilian government's export incentive program (BEFIEX). These credits reduced Brazilian federal excise taxes on domestic sales. Prior to the adoption of Topic 606, the excise taxes in our Brazilian operations were reflected in revenue. In accordance with Topic 606, we made a policy election to exclude non-income taxes from the transaction price. As a result, these credits were reflected in interest and sundry (income) expense as they were monetized in 2017 and 2018.
In December 2013, the Brazilian government reinstituted the monetary adjustment index applicable to BEFIEX credits that existed prior to July 2009, when the Brazilian government required companies to apply a different monetary adjustment index to BEFIEX credits. Whether use of the reinstituted index should be given retroactive effect for the July 2009 to December 2013 period has beenwas subject to review by the Brazilian courts. In the third quarter of 2017, the Brazilian Supreme Court ruled that the reinstituted index should be given retroactive effect for the July 2009 to December 2013 period, which ruling has been appealedwas subsequently affirmed by the Brazilian government.Supreme Court, and is now final. Based on this ruling, we were entitled to recognize $72 million in additional credits, which were recognized in prior periods. As of June 30, 2019, noAt March 31, 2020, 0 BEFIEX credits remain to be monetized.
Our Brazilian operations have received tax assessments for income and social contribution taxes associated with certain monetized BEFIEX credits. We do not believe BEFIEX credits are subject to income or social contribution taxes. We believe these tax assessments are without merit and are vigorously defending our positions. We have not provided for income or social contribution taxes on these BEFIEX credits, and based on the opinions of tax and legal advisors, we have not accrued any amount related to these assessments as of June 30, 2019. at March 31, 2020. The total amount of outstanding tax assessments received for income and social contribution taxes relating to the BEFIEX credits, including interest and penalties, is approximately 1.9 2.0 billion Brazilian reais (approximately $499$377 million as of June 30, 2019)at March 31, 2020).
Relying on existing Brazilian legal precedent, in 2003 and 2004, we recognized tax credits in an aggregate amount of $26 million, adjusted for currency, on the purchase of raw materials used in production ("IPI tax credits"). The Brazilian tax authority subsequently challenged the recording of IPI tax credits. No such credits have been recognized since 2004. In 2009, we entered into a Brazilian government program ("IPI Amnesty") which provided extended payment terms and reduced penalties and interest to encourage tax payers to resolve this and certain other disputed tax credit amounts. As permitted by the program, we elected to settle certain debts through the use of other existing tax credits and recorded charges of approximately $34 million in 2009 associated with these matters. In July 2012, the Brazilian revenue authority notified us that a portion of our proposed settlement was rejected and we received tax assessments of 251255 million Brazilian reais (approximately $66$49 million as of June 30, 2019)at March 31, 2020), reflecting interest and penalties to date. We believe these tax assessments are without merit and we are vigorously defending our position. The government's assessment in this case relies heavily on its arguments regarding taxability of BEFIEX credits for certain years, which we are disputing in one of the BEFIEX government assessment cases cited in the prior paragraph. Because the IPI Amnesty case is moving faster than the BEFIEX taxability case, we could be required to pay the IPI Amnesty assessment before obtaining a final decision in the BEFIEX taxability case.
In 2001, Brazil adopted a law making the profits of controlled foreign corporations of Brazilian entities subject to income and social contribution tax regardless of whether the profits were repatriated ("CFC Tax"). Our Brazilian subsidiary, along with other corporations, challengedWe have received tax assessments on foreign profits on constitutionalityfrom the Brazilian federal tax authorities relating to amounts allegedly due regarding unemployment/social security insurance taxes (PIS/COFINS) for tax credits recognized since 2007. These credits were recognized for inputs to certain manufacturing and other grounds. In April 2013,business processes. These assessments are being challenged at the Brazilian Supreme Court ruled on one of our cases, finding thatadministrative and judicial levels in Brazil. We estimate the law is constitutional, but remanded the casepossible losses related to a lower court for consideration of other arguments raised in our appeal, including the existence of tax treaties with jurisdictions in which controlled foreign corporations are domiciled. As of June 30, 2019, our potential exposure for income and social contribution taxes relatingthese assessments to profits of controlled foreign corporations, including interest and penalties and net of expected foreign tax credits, isbe approximately 210293 million Brazilian reais
(approximately $55 (approximately $56 million as of June 30, 2019)at March 31, 2020). We believe these tax assessments are without merit and are vigorously defending our positions. Based on the opinion of our tax and legal advisors, we have not0t accrued any amount related to these assessments as of June 30, 2019.assessments.
In addition to the IPI tax credit and CFC TaxPIS/COFINS inputs matters noted above, other assessments issued to us by the Brazilian tax authorities related to non-incomeindirect and income tax matters, and other matters, are at various stages of review in numerous administrative and judicial proceedings. The amounts related to these assessments will continue to be increased by monetary adjustments at the Selic rate, which is the benchmark rate set by the Brazilian Central Bank. In accordance with our accounting policies, we routinely assess these matters and, when necessary, record our best estimate of a loss. We believe these tax assessments are without merit and are vigorously defending our positions.
Litigation is inherently unpredictable and the conclusion of these matters may take many years to ultimately resolve. We may experience additional delays in resolving these matters as a result of COVID-19-related administrative and judicial system temporary closures in Brazil. Amounts at issue in potential future litigation could increase as a result of interest and penalties in future periods. Accordingly, it is possible that an unfavorable outcome in these proceedings could have a material adverse effect on our financial statements in any particular reporting period.
ICMS Credits
We also filed legal actions in Brazil to recover certain social integration and social contribution taxes paid over gross sales including ICMS receipts, which is a form of Value Added Tax in Brazil. During 2017, we sold the rights to certain portions of this litigation to a third party for 90 million Brazilian reais (approximately $27 million at December 31, 2017). In the first quarter of 2019, we received a favorable decision in the largest of these ICMS legal actions. This decision is final and not subject to appeals. Based on the opinion of our tax and legal advisors, we recognized a gain of approximately $84 million, after related taxes and fees and based on exchange rates then in effect, during the first quarter of 2019 in connection with this decision. This amount reflects approximately $142 million in indirect tax credits ("credits") that we are entitled to monetize in future periods, offset by approximately $43 million and $15$58 million in taxes and fees, respectively, that we anticipate will be paid in 2019.
In the second quarter of 2019, we received favorable final, non-appealable decisions in two2 smaller ICMS legal actions. Based on the opinion of our tax and legal advisors, we recognized a gain of approximately $35 million, after related taxes and fees and based on exchange rates then in effect, during the second quarter of 2019 in connection with this decision. This amount reflects approximately $54 million in credits that we are entitled to monetize in future periods, offset by approximately $18 million in taxes, which have been paid, and $1 million in taxes and fees respectively, that we anticipate will be paid in 2019.2020.
The ICMS credits and related fees are recorded in interest and sundry (income) expense in our Consolidated Condensed Statements of Comprehensive Income.Income (Loss). The Brazilian tax authorities have sought clarification before the Brazilian Supreme Court (in a leading case involving another taxpayer) of certain matters, including the amount of these credits (i.e., the gross rate or net credit amount), and certain other matters that could affect the rights of Brazilian taxpayers regarding these credits. credits, and a scheduled hearing has been delayed and it is not known when such hearing will be rescheduled.
If the Brazilian tax authorities challenge our rights to these credits, we may become subject to new litigation related to credits already monetized and/or disallowance of further credit monetization. Based on the opinions of our tax and legal advisors, we have not accrued any amounts related to potential future litigation regarding these credits.
The Company has similar cases with other Brazilian subsidiaries related to approximately $15 million in potential ICMS credits for which we have yet to receive a ruling. There is substantial uncertainty about both the amount and timing of any recovery, and as such, no amounts have been recognized.
Competition Investigation
In 2013, the French Competition Authority ("FCA") commenced an investigation of appliance manufacturers and retailers in France. The investigation includes a number of manufacturers,France, including the Whirlpool and Indesit operationsIndesit. The FCA investigation was split into two parts, and in France.
On June 26,December 2018, Whirlpool France SAS, a subsidiary of the Company, reached an agreementwe finalized settlement with the staff of the FCA to settleon the first part of its investigation, which relates tofor a 14-month period during partstotal fine of 2006-07 and 2008-09. In the third quarter of 2018, we accrued €95 million after entering into a preliminary settlement agreement with the FCA. On December 6, 2018, the FCA's college issued its final decision, setting the final amount of the fine at €102 million, with €56 million attributable to Whirlpool's France business and €46 million attributable to Indesit's France business. Payment of the Indesit portion of the FCA fine (€46 million, or approximately $52 million at March 31, 2019) wasfinal amounts were made in the first quarter2019, including payment by Indesit's previous owners of 2019 and payment of the Whirlpool portion of the FCA fine (€56 million, or approximately $63 million) was made in April 2019. Under the terms of a settlement with Indesit's former owners, the former owners paid €17 million out of escrow to the Company in the second quarter of 2019.
Company. The second part of the FCA investigation, which is expected to focus primarily on manufacturer interactions with retailers, is ongoing. The Company is cooperating with this investigation.
Although it is currently not possible to assess the impact, if any, this matterthat matters related to the FCA investigation may have on our financial statements, the resolution of the second part ofmatters related to the FCA investigation could have a material adverse effect on our financial statements in any particular reporting period.
Trade Customer Insolvency
In 2017, Alno AG and certain affiliated companies filed for insolvency protection in Germany. Bauknecht Hausgeräte GmbH, a subsidiary of the Company, was a long-standing supplier to Alno and certain of its affiliated companies. The Company was also a former indirect minority shareholder of Alno. In August 2018, the insolvency trustee asserted €174.5 million in clawback and related claims against Bauknecht. We are reviewing theIn January 2020, we entered into an agreement to settle all potential claims made bythat the insolvency trustee. Based on our preliminary understanding of the facts and the applicable law, we expecttrustee may have related to vigorously defend against the claims. Although it is currently not possible to assess the impact this matter, may have on ourresulting in a one-time charge of €52.75 million (approximately $59 million as of December 31, 2019), which was recorded in interest and sundry (income) expense in the Consolidated Condensed Financial Statements of Income for the resolution of this matter could have a material adverse effect on our financial statements in any particular reporting period.
Other Litigation
We are currently defending against two2 lawsuits that have been certified for treatment as class action treatmentactions in U.S. federal court, relating to two2 top-load washing machine models. In December 2019, the court in one of these lawsuits entered summary judgment in Whirlpool's favor. That ruling remains subject to appeal, and the other lawsuit is ongoing. We believe the lawsuits are without merit and are vigorously defending them. Given the preliminary stage of the proceedings, we cannot reasonably estimate a range of loss, if any, at this time. The resolution of this matterthese matters could have a material adverse effect on our financial statements in any particular reporting period.
We are currently vigorously defending a number of other lawsuits related to the manufacture and sale of our products which include class action allegations, and may become involved in similar actions. These lawsuits allege claims which include negligence, breach of contract, breach of warranty, product liability and safety claims, false advertising, fraud, and violation of federal and state regulations, including consumer protection laws. In general, we do not have insurance coverage for class action lawsuits. We are also involved in various other legal actions arising in the normal course of business, for which insurance coverage may or may not be available depending on the nature of the action. We dispute the merits of these suits and actions, and intend to vigorously defend them. Management believes, based upon its current knowledge, after taking into consideration legal counsel's evaluation of such suits and actions, and after taking into account current litigation accruals, that the outcome of these matters currently pending against Whirlpool should not have a material adverse effect, if any, on our financial statements. We may experience additional delays in resolving these and other pending litigation matters as a result of COVID-19-related temporary court and administrative body closures and postponements.
Product Warranty and Legacy Product Corrective Action Reserves
Product warranty reserves are included in other current and other noncurrent liabilities in our Consolidated Condensed Balance Sheets. The following table summarizes the changes in total product warranty liability reserves for the periods presented:
| |
|
| Product Warranty |
| Product Warranty |
| Millions of dollars |
| 2019 |
| 2018 |
| 2020 |
| 2019 |
| Balance at January 1 |
| $ | 268 |
|
| $ | 277 |
|
| $ | 383 |
|
| $ | 268 |
|
| Issuances/accruals during the period |
| 128 |
|
| 145 |
|
| 47 |
|
| 67 |
|
| Settlements made during the period/other |
| (143 | ) |
| (147 | ) |
| (124 | ) |
| (80 | ) |
| Balance at June 30 |
| $ | 253 |
|
| $ | 275 |
| |
| Balance at March 31 | |
| $ | 306 |
|
| $ | 255 |
|
| | | | | | | | | |
| Current portion |
| $ | 178 |
|
| $ | 200 |
|
| $ | 179 |
|
| $ | 182 |
|
| Non-current portion |
| 75 |
|
| 75 |
|
| 127 |
|
| 73 |
|
| Total |
| $ | 253 |
|
| $ | 275 |
|
| $ | 306 |
|
| $ | 255 |
|
In the normal course of business, we engage in investigations of potential quality and safety issues. As part of our ongoing effort to deliver quality products to consumers, we are currently investigating certain potential quality and
safety issues globally. As necessary, we undertake to effect repair or replacement of appliances in the event that an investigation leads to the conclusion that such action is warranted.
As part of this process, we investigated incident reports associated with a particular component in certain Indesit-designed horizontal axis washers produced in EMEA. In January 2020, we commenced a product recall in the UK and Ireland for these EMEA-produced washers, for which the recall is ongoing. In the secondthird quarter of 2019, we accrued approximately $105 million in estimated product warranty expense related to this matter. This estimate is based on several assumptions which are inherently unpredictable and which we may need to materially revise in the future. For the three months ended March 31, 2020, settlements of approximately $38 million have been incurred related to this product recall.
For the twelve months ended December 31, 2019, we incurred approximately $12$26 million of additional product warranty expense related to our previously disclosed legacy Indesit dryer corrective action campaign in the UK. For the three months ended March 31, 2020, we incurred no additional product warranty expense related to this campaign. We continue to cooperate with the UK regulator, which continues to review the overall effectiveness of the modification program.
Guarantees
We have guarantee arrangements in a Brazilian subsidiary. For certain credit worthy customers, the subsidiary guarantees customer lines of credit at commercial banks to support purchases following its normal credit policies. If a customer were to default on its line of credit with the bank, our subsidiary would be required to assume the line of credit and satisfy the obligation with the bank. At June 30, 2019March 31, 2020 and December 31, 2018,2019, the guaranteed amounts totaled $107544 million Brazilian reais (approximately $105 million at March 31, 2020) and $146577 million Brazilian reais (approximately $143 million at December 31, 2019), respectively. The fair value of these guarantees were nominal at June 30, 2019March 31, 2020 and December 31, 2018.2019. Our subsidiary insures against a significant portion of this credit risk for these guarantees, under normal operating conditions, through policies purchased from high-quality underwriters.
We provide guarantees of indebtedness and lines of credit for various consolidated subsidiaries. The maximum contractual amount of indebtedness and credit facilities available under these lines for consolidated subsidiaries totaled $3.3 billion at March 31, 2020 and $2.6 billion and $3.5 billion at June 30, 2019 and December 31, 2018, respectively.2019. Our total short-term outstanding bank indebtedness under guarantees was nominal at June 30, 2019both March 31, 2020 and $21 million at December 31, 2018.2019.
(9)(8) PENSION AND OTHER POSTRETIREMENT BENEFIT PLANS
The following table summarizes the components of net periodic pension cost and the cost of other postretirement benefits for the periods presented:
| |
|
| Three Months Ended June 30, |
| Three Months Ended March 31, |
|
| United States
Pension Benefits |
| Foreign
Pension Benefits |
| Other Postretirement
Benefits |
| United States
Pension Benefits |
| Foreign
Pension Benefits |
| Other Postretirement
Benefits |
| Millions of dollars |
| 2019 |
| 2018 |
| 2019 |
| 2018 |
| 2019 |
| 2018 |
| 2020 |
| 2019 |
| 2020 |
| 2019 |
| 2020 |
| 2019 |
| Service cost |
| $ | — |
|
| $ | — |
|
| $ | 2 |
|
| $ | 2 |
|
| $ | 1 |
|
| $ | 1 |
|
| $ | 1 |
|
| $ | 1 |
|
| $ | 2 |
|
| $ | 1 |
|
| $ | 2 |
|
| $ | 2 |
|
| Interest cost |
| 31 |
|
| 29 |
|
| 6 |
|
| 6 |
|
| 4 |
|
| 3 |
|
| 25 |
|
| 31 |
|
| 4 |
|
| 6 |
|
| 3 |
|
| 4 |
|
| Expected return on plan assets |
| (45 | ) |
| (42 | ) |
| (8 | ) |
| (9 | ) |
| — |
|
| — |
|
| (41 | ) |
| (44 | ) |
| (8 | ) |
| (7 | ) |
| — |
|
| — |
|
| Amortization: |
|
|
|
|
|
|
|
|
|
|
|
|
|
|
|
|
|
|
|
|
|
|
|
|
| Actuarial loss |
| 12 |
|
| 13 |
|
| 2 |
|
| 2 |
|
| — |
|
| — |
|
| 15 |
|
| 12 |
|
| 3 |
|
| 2 |
|
| — |
|
| — |
|
| Prior service credit |
| — |
|
| — |
|
| — |
|
| — |
|
| (3 | ) |
| (2 | ) |
| — |
|
| (1 | ) |
| — |
|
| — |
|
| (2 | ) |
| (2 | ) |
| Settlement and curtailment (gain) loss |
| — |
|
| — |
|
| — |
|
| (3 | ) |
| — |
|
| — |
|
| — |
|
| — |
|
| — |
|
| 1 |
|
| — |
|
| (7 | ) |
| Net periodic benefit cost (credit) |
| $ | (2 | ) |
| $ | — |
|
| $ | 2 |
|
| $ | (2 | ) |
| $ | 2 |
|
| $ | 2 |
|
| $ | — |
|
| $ | (1 | ) |
| $ | 1 |
|
| $ | 3 |
|
| $ | 3 |
|
| $ | (3 | ) |
|
| | | | | | | | | | | | | | | | | | | | | | | | |
| | | | | | | | | | | | | |
| | | Six Months Ended June 30, |
| | | United States
Pension Benefits | | Foreign
Pension Benefits | | Other Postretirement
Benefits |
| Millions of dollars | | 2019 | | 2018 | | 2019 | | 2018 | | 2019 | | 2018 |
| Service cost | | $ | 1 |
| | $ | 1 |
| | $ | 3 |
| | $ | 3 |
| | $ | 3 |
| | $ | 3 |
|
| Interest cost | | 62 |
| | 59 |
| | 12 |
| | 12 |
| | 8 |
| | 7 |
|
| Expected return on plan assets | | (89 | ) | | (85 | ) | | (15 | ) | | (17 | ) | | — |
| | — |
|
| Amortization: | |
| | | | | | | | | | |
| Actuarial loss | | 24 |
| | 26 |
| | 4 |
| | 5 |
| | — |
| | — |
|
| Prior service credit | | (1 | ) | | (1 | ) | | — |
| | — |
| | (5 | ) | | 1 |
|
| Settlement and curtailment (gain) loss | | — |
| | — |
| | 1 |
| | (3 | ) | | (7 | ) | | — |
|
| Net periodic benefit cost (credit) | | $ | (3 | ) | | $ | — |
| | $ | 5 |
| | $ | — |
| | $ | (1 | ) | | $ | 11 |
|
The following table summarizes the net periodic cost recognized in operating profit and interest and sundry (income) expense for the periods presented:
|
| | | | | | | | | | | | | | | | | | | | | | | | |
| | | Three Months Ended June 30, |
| | | United States
Pension Benefits | | Foreign
Pension Benefits | | Other Postretirement
Benefits |
| Millions of dollars | | 2019 | | 2018 | | 2019 | | 2018 | | 2019 | | 2018 |
| Operating profit (loss) | | $ | — |
| | $ | — |
| | $ | 2 |
| | $ | 2 |
| | $ | 1 |
| | $ | 1 |
|
| Interest and sundry (income) expense | | (2 | ) | | — |
| | — |
| | (4 | ) | | 1 |
| | 1 |
|
| Net periodic benefit cost | | $ | (2 | ) | | $ | — |
| | $ | 2 |
| | $ | (2 | ) | | $ | 2 |
| | $ | 2 |
|
| | | | | | | | | | | | | | | | | | | | | | | | | | | | |
| | | Six Months Ended June 30, | | Three Months Ended March 31, |
| | | United States
Pension Benefits | | Foreign
Pension Benefits | | Other Postretirement
Benefits | | United States
Pension Benefits | | Foreign
Pension Benefits | | Other Postretirement
Benefits |
| Millions of dollars | | 2019 | | 2018 | | 2019 | | 2018 | | 2019 | | 2018 | | 2020 | | 2019 | | 2020 | | 2019 | | 2020 | | 2019 |
| Operating profit (loss) | | $ | 1 |
| | $ | 1 |
| | $ | 3 |
| | $ | 3 |
| | $ | 3 |
| | $ | 3 |
| | $ | 1 |
| | $ | 1 |
| | $ | 2 |
| | $ | 1 |
| | $ | 2 |
| | $ | 2 |
|
| Interest and sundry (income) expense | | (4 | ) | | (1 | ) | | 2 |
| | (3 | ) | | (4 | ) | | 8 |
| | (1 | ) | | (2 | ) | | (1 | ) | | 2 |
| | 1 |
| | (5 | ) |
| Net periodic benefit cost | | $ | (3 | ) | | $ | — |
| | $ | 5 |
| | $ | — |
| | $ | (1 | ) | | $ | 11 |
| | $ | — |
| | $ | (1 | ) | | $ | 1 |
| | $ | 3 |
| | $ | 3 |
| | $ | (3 | ) |
401(k) Defined Contribution Plan
During the second quarter 2011,March 2020, we modified retiree medical benefits for certain retirees to be consistent with those benefits provided by the Whirlpool Corporation Group Benefit Plan. We accounted for these changes as a plan amendment in 2011, resulting in a reduction in the postretirement benefit obligation of $138 million, of which approximately $89 million of benefit has been recognized in net earnings since 2011, with an offset to accumulated other comprehensive loss, net of tax. In response, a group of retirees initiated legal proceedings against Whirlpool asserting the above benefits are vested and changes to the plan are not permitted.
On February 15, 2019, we received a favorable decision from the United States Court of Appeals for the Sixth Circuit, which heldannounced that the benefits at issue are not vestedcompany matching contributions for life and mayour 401(k) defined contribution plan, equal to up to 7% of participants' eligible compensation, covering substantially all U.S. employees will be altered. On April 4, 2019, the Sixth Circuit Court issued a mandate to the district court, requiring it to take steps to implement this decision. The impact to the financial statementscontributed in 2019 related to this decision was not material and we do not expect a material financial impact in future periods.company stock starting from May 2020.
(10)(9) HEDGES AND DERIVATIVE FINANCIAL INSTRUMENTS
Derivative instruments are accounted for at fair value based on market rates. Derivatives where we elect hedge accounting are designated as either cash flow, fair value or net investment hedges. Derivatives that are not accounted for based on hedge accounting are marked to market through earnings. The accounting for changesIf the designated cash flow hedges are highly effective, the gains and losses are recorded in the fair value of a derivative depends on the intended useother comprehensive income (loss) and designation of the derivative instrument. Hedging ineffectiveness and a netsubsequently reclassified to earnings impact occur when the change in the fair value of the hedge does notto offset the change in the fair valueimpact of the hedged item. The ineffective portion ofitems when they occur. In the gain or loss isevent it becomes probable the forecasted transaction to which a cash flow hedge relates will not occur, the derivative would be terminated and the amount in accumulated other comprehensive income (loss) would be recognized in earnings. The fair value of the hedge asset or liability is presentedpresent in either other current assets/liabilities or other noncurrent assets/liabilities inon the Consolidated Condensed Balance Sheets and in other within cash used inprovided by (used in) operating activities in the Consolidated Condensed Statements of Cash Flows.
Using derivative instruments means assuming counterparty credit risk. Counterparty credit risk relates to the loss we could incur if a counterparty were to default on a derivative contract. We generally deal with investment grade counterparties and monitor the overall credit risk and exposure to individual counterparties. We do not anticipate nonperformance by any counterparties. The amount of counterparty credit exposure is limited to the unrealized gains, if any, on such derivative contracts. We do not require nor do we post collateral on such contracts.
Hedging Strategy
In the normal course of business, we manage risks relating to our ongoing business operations including those arising from changes in commodity prices, foreign exchange rates and interest rates and commodity prices.rates. Fluctuations in these rates and prices can affect our operating results and financial condition. We use a variety of strategies, including the use of derivative instruments, to manage these risks. We do not enter into derivative financial instruments for trading or speculative purposes.
Foreign Currency Exchangeand Interest Rate Risk
We incur expenses associated with the procurement and production of products in a limited number of countries, while we sell in the local currencies of a large number of countries. Our primary foreign currency exchange exposures result from cross-currency sales of products. As a result, we enter into foreign exchange contracts to hedge certain firm commitments and forecasted transactions to acquire products and services that are denominated in foreign currencies.
We enter into certain undesignated non-functional currency asset and liability hedges that relate primarily to short-term payables, receivables, and intercompany loans. These forecasted cross-currency cash flows relate primarily to foreign currency denominated expenditures and intercompany financing agreements, royalty agreementsloans and dividends. When we hedge a foreign currency denominated payable or receivable with a derivative, the effect of changes in the foreign exchange rates are reflected currently in interest and sundry (income) expense for both the payable/receivable and the derivative. Therefore, as a result of thisthe economic hedge, we do not elect hedge accounting.
Commodity Price RiskWe also enter into hedges to mitigate currency risk primarily related to forecasted foreign currency denominated expenditures, intercompany financing agreements and royalty agreements and designate them as cash flow hedges. Gains and losses on derivatives designated as cash flow hedges, to the extent they are included in the assessment of effectiveness, are recorded in other comprehensive income (loss) and subsequently reclassified to earnings to offset the impact of the hedged items when they occur.
We may enter into commodity derivative contracts on various commoditiescross-currency interest rate swaps to manage the price risk associated with forecasted purchasesour exposure relating to cross-currency debt. Notional amount of materials used in our manufacturing process. The objective of these hedges is to reduce the variability of cash flows associated with the forecasted purchase of commodities.
Interest Rate Riskoutstanding cross-currency interest rate swap agreements was $1,275 million at March 31, 2020 and December 31, 2019.
We may enter into interest rate swap agreements to manage interest rate risk exposure. Our interest rate swap agreements, if any, effectively modify our exposure to interest rate risk, primarily through converting certain floating rate debt to a fixed rate basis, and certain fixed rate debt to a floating rate basis. These agreements involve either the receipt or payment of floating rate amounts in exchange for fixed rate interest payments or receipts, respectively, over the life of the agreements without an exchange of the underlying principal amounts. We also may utilize a cross-currency interest rate swap agreement to manage our exposure relating to certain intercompany debt denominated in one foreign currency that will be repaid in another foreign currency. At June 30, 2019 there was $700 million notional amount of outstanding interest rate swap agreements. At December 31, 2018 there were no outstanding interest rate swap agreements.
We enter into swap rate lock agreements to effectively modifyreduce our exposure to interest rate risk by locking in interest rates on probable long-term debt issuances. There was a notional amount of $300 million of outstanding interest rate swap agreements at March 31, 2020 and December 31, 2019.
Net Investment Hedging
The following table summarizes our foreign currency denominated debt and foreign exchange forwards/options designated as net investment hedges at June 30, 2019March 31, 2020 and December 31, 2018:2019:
| | | | | Notional (Local) | | Notional (USD) | | Current Maturity | | Notional (Local) | | Notional (USD) | | Current Maturity |
| Instrument | | 2019 | | 2018 | | 2019 | | 2018 | | | 2020 | | 2019 | | 2020 | | 2019 | |
| Senior note - 0.625% | | € | 500 |
| | € | 500 |
| | $ | 569 |
| | $ | 573 |
| | March 2020 | | € | — |
| | € | 500 |
| | $ | — |
| | $ | 561 |
| | March 2020 |
| Commercial Paper | | € | 296 |
| | € | — |
| | $ | 337 |
| | $ | — |
| | July 2019 | |
| Foreign exchange forwards/options | | MXN 7,200 |
| | MXN 7,200 |
| | $ | 375 |
| | $ | 366 |
| | August 2022 | | MXN | 7,200 |
| | MXN | 7,200 |
| | $ | 307 |
| | $ | 382 |
| | August 2022 |
For instruments that are designated and qualify as a net investment hedge, the effective portion of the instruments' gain or loss is reported as a component of other comprehensive income (OCI)(loss) and recorded in accumulated other comprehensive loss. The gain or loss will be subsequently reclassified into net earnings when the hedged net investment is either sold or substantially liquidated. The remaining change in fair value of the hedge instruments represents the ineffective portion, which is immediately recognized in interest and sundry (income) expense inon our Consolidated
Condensed Statements of Comprehensive Income. As of June 30, 2019March 31, 2020 and December 31, 2018,2019, there was no0 ineffectiveness on hedges designated as net investment hedges.
The following table summarizes our outstanding derivative contracts and their effects in our Consolidated Condensed Balance Sheets at June 30, 2019March 31, 2020 and December 31, 2018:2019:
| | | |
| |
| Fair Value of |
| Type
of
Hedge(1) |
| |
| |
| Fair Value of |
|
|
| |
|
| Notional Amount |
| Hedge Assets |
| Hedge Liabilities |
| Maximum Term (Months) |
| Notional Amount |
| Hedge Assets |
| Hedge Liabilities |
| Maximum Term (Months) |
| Millions of dollars |
| 2019 |
| 2018 |
| 2019 |
| 2018 |
| 2019 |
| 2018 |
|
| 2019 |
| 2018 |
| 2020 | | 2019 |
| 2020 | | 2019 |
| 2020 | | 2019 |
|
| 2020 | | 2019 |
Derivatives accounted for as hedges |
|
|
|
|
|
|
|
|
|
|
|
|
|
|
|
|
|
|
|
|
|
|
|
|
|
|
| Commodity swaps/options | |
| $ | 237 |
| | $ | 174 |
| | $ | — |
| | $ | 4 |
| | $ | 55 |
| | $ | 10 |
| | (CF) | | 36 | | 21 |
| Foreign exchange forwards/options |
| $ | 3,108 |
|
| $ | 3,126 |
|
| $ | 43 |
|
| $ | 49 |
|
| $ | 44 |
|
| $ | 48 |
|
| (CF/NI) |
| 38 |
| 44 |
| 2,923 |
| | 3,177 |
| | 183 |
| | 94 |
| | 17 |
| | 84 |
| | (CF/NI) | | 143 | | 32 |
| Commodity swaps/options |
| 235 |
|
| 216 |
|
| 4 |
|
| 1 |
|
| 21 |
|
| 27 |
|
| (CF) |
| 24 |
| 30 | |
| Cross-currency swaps | | | 1,275 |
| | 1,275 |
| | 115 |
| | 25 |
| | — |
| | 23 |
| | (CF) | | 107 | | 110 |
| Interest rate derivatives | | 700 |
| | — |
| | 14 |
| | — |
| | 36 |
| | — |
| | (CF) | | 116 | | 0 | | 300 |
| | 300 |
| | — |
| | 6 |
| | 64 |
| | — |
| | (CF) | | 62 | | 65 |
| Total derivatives accounted for as hedges |
|
|
|
|
|
|
| $ | 61 |
|
| $ | 50 |
|
| $ | 101 |
|
| $ | 75 |
|
|
|
|
|
|
|
|
|
| $ | 298 |
|
| $ | 129 |
|
| $ | 136 |
|
| $ | 117 |
|
|
|
| Derivatives not accounted for as hedges |
|
|
|
|
|
|
|
|
|
|
|
|
|
|
|
|
|
|
|
|
|
|
|
|
|
|
| Commodity swaps/options | |
| 1 |
| | 1 |
| | — |
| | — |
| | — |
| | — |
| | N/A | | 4 | | 7 |
| Foreign exchange forwards/options |
| $ | 2,804 |
|
| $ | 4,382 |
|
| $ | 20 |
|
| $ | 27 |
|
| $ | 23 |
|
| $ | 69 |
|
| N/A |
| 15 |
| 21 |
| $ | 2,511 |
| | $ | 3,182 |
| | $ | 48 |
| | $ | 15 |
| | $ | 30 |
| | $ | 22 |
| | N/A | | 9 | | 12 |
| Commodity swaps/options |
| 4 |
|
| 3 |
|
| — |
|
| — |
|
| — |
|
| — |
|
| N/A |
| 24 |
| 0 | |
| Total derivatives not accounted for as hedges |
|
|
|
|
|
|
| 20 |
|
| 27 |
|
| 23 |
|
| 69 |
|
|
|
|
|
|
|
|
|
| 48 |
|
| 15 |
|
| 30 |
|
| 22 |
|
|
|
| Total derivatives |
|
|
|
|
| $ | 81 |
|
| $ | 77 |
|
| $ | 124 |
|
| $ | 144 |
|
|
|
|
|
|
|
| $ | 346 |
|
| $ | 144 |
|
| $ | 166 |
|
| $ | 139 |
|
|
|
| | Current |
|
|
|
|
| $ | 40 |
|
| $ | 60 |
|
| $ | 52 |
|
| $ | 95 |
|
|
|
|
|
|
|
| $ | 167 |
| | $ | 55 |
| | $ | 77 |
| | $ | 61 |
|
|
|
| Noncurrent |
|
|
|
|
|
|
| 41 |
|
| 17 |
|
| 72 |
|
| 49 |
|
|
|
|
|
|
|
|
|
| 179 |
| | 89 |
| | 89 |
| | 78 |
|
|
|
| Total derivatives |
|
|
|
|
| $ | 81 |
|
| $ | 77 |
|
| $ | 124 |
|
| $ | 144 |
|
|
|
|
|
|
|
| $ | 346 |
|
| $ | 144 |
|
| $ | 166 |
|
| $ | 139 |
|
|
|
| |
(1)Derivatives accounted for as hedges are considered either cash flow (CF) or net investment (NI) hedges.
| Derivatives accounted for as hedges are considered either cash flow (CF) or net investment (NI) hedges. |
The following tables summarize the effects of derivative instruments and foreign currency debt designated as net investment hedges in our Consolidated Condensed Statements of Comprehensive Income for the periods presented:
| | | | | | | Three Months Ended June 30, | | | | Three Months Ended March 31, |
| | | Gain (Loss)
Recognized in OCI
(Effective Portion ) (2) | | Gain (Loss)
Recognized in OCI
(Effective Portion ) (2) |
| Cash Flow Hedges - Millions of dollars | | 2019 | | 2018 | | 2020 | | 2019 |
| Commodity swaps/options | | Commodity swaps/options | | $ | (55 | ) | | $ | 22 |
|
| Foreign exchange forwards/options | Foreign exchange forwards/options | | $ | (4 | ) | | $ | 76 |
| Foreign exchange forwards/options | | 105 |
| | 28 |
|
| Commodity swaps/options | | (22 | ) | | — |
| |
| Cross-currency swaps | | Cross-currency swaps | | 120 |
| | (17 | ) |
| Interest rate derivatives | Interest rate derivatives | | (5 | ) | | — |
| Interest rate derivatives | | (71 | ) | | — |
|
| | | | | | |
| Net Investment Hedges | Net Investment Hedges | | | | | Net Investment Hedges | | | | |
| Foreign currency | Foreign currency | | (20 | ) | | 69 |
| Foreign currency | | 67 |
| | 1 |
|
| | | | $ | (51 | ) | | $ | 145 |
| | | 166 |
| | 34 |
|
| | | | | | | | | |
| | | Three Months Ended June 30, | | Three Months Ended March 31, |
| | | Location of Gain (Loss) Reclassified from OCI into Earnings (Effective Portion) | | Gain (Loss) Reclassified from OCI into Earnings (Effective Portion) | | Location of Gain (Loss) Reclassified from OCI into Earnings (Effective Portion) | | Gain (Loss) Reclassified from OCI into Earnings (Effective Portion) |
| Cash Flow Hedges - Millions of dollars | | 2019 | | 2018 | | 2020 | | 2019 |
Commodity swaps/options (3) | | | Cost of products sold | | $ | (7 | ) | | $ | (3 | ) |
| Foreign exchange forwards/options | | Net sales | | $ | (1 | ) | | $ | — |
| | Net sales | | — |
| | (1 | ) |
| Foreign exchange forwards/options | | Cost of products sold | | 6 |
| | (6 | ) | | Cost of products sold | | — |
| | 5 |
|
| Foreign exchange forwards/options | | Interest and sundry (income) expense | | (4 | ) | | 50 |
| | Interest and sundry (income) expense | | (32 | ) | | 37 |
|
Commodity swaps/options (3) | | Cost of products sold | | $ | (6 | ) | | $ | 10 |
| |
| Interest rate derivatives | | Interest expense | | $ | 3 |
| | $ | (1 | ) | |
| Cross-currency swaps | | | Interest and sundry (income) expense | | 27 |
| | 8 |
|
| Interest rate derivatives | | Interest and sundry (income) expense | | (8 | ) | | — |
| | Interest expense | | — |
| | 1 |
|
| | | | | $ | (10 | ) | | $ | 53 |
| | | | (12 | ) | | 47 |
|
| | | | | | | | | |
| | | Three Months Ended June 30, | | Three Months Ended March 31, |
| | | Location of Gain (Loss) Recognized on Derivatives not
Accounted for as Hedges | | Gain (Loss) Recognized on Derivatives not Accounted for as Hedges | | Location of Gain (Loss) Recognized on Derivatives not
Accounted for as Hedges | | Gain (Loss) Recognized on Derivatives not Accounted for as Hedges |
| Derivatives not Accounted for as Hedges - Millions of dollars | | 2019 | | 2018 | | 2020 | | 2019 |
| Foreign exchange forwards/options | | Interest and sundry (income) expense | | $ | (35 | ) | | $ | 134 |
| | Interest and sundry (income) expense | | $ | 42 |
| | $ | 29 |
|
| |
(2) The tax impact of the cash flow hedges was $5 million and $(5) million for the three months ended June 30, 2019 and 2018. The tax impact of the net investment hedges was $5 million and $(13) million for the three months ended June 30, 2019 and 2018, respectively. (3) Cost for commodity swaps/options are recognized in cost of sales as products are sold.
| Change in gain (loss) recognized in OCI (effective portion) for the three months ended March 31, 2020 is primarily driven by currency fluctuations and declines in commodity prices and interest rates compared to the prior year. The tax impact of the cash flow hedges was $(23) million and $5 million for the three months ended March 31, 2020 and 2019, respectively. The tax impact of the net investment hedges was $(24) million and $1 million for the three months ended March 31, 2020 and 2019, respectively. |
| |
(3) | Cost for commodity swaps/options are recognized in cost of sales as products are sold. |
|
| | | | | | | | | | | | |
| | | | | | | Six Months Ended June 30, |
| | | | | | | Gain (Loss)
Recognized in OCI
(Effective Portion)(4) |
| Cash Flow Hedges - Millions of dollars | | | | | | 2019 | | 2018 |
| Foreign exchange | | $ | 24 |
| | $ | 76 |
|
| Commodity swaps/options | | — |
| | (15 | ) |
| Interest rate derivatives | | (22 | ) | |
|
| | | | | |
| Net Investment Hedges | | | | |
| Foreign currency | | (19 | ) | | 6 |
|
| | | $ | (17 | ) | | $ | 67 |
|
| | | | | | | | | |
| | | | | | | Six Months Ended June 30, |
| | | Location of Gain (Loss) Reclassified from OCI into Earnings (Effective Portion) | | Gain (Loss) Reclassified from OCI into Earnings (Effective Portion) |
| Cash Flow Hedges - Millions of dollars | | | 2019 | | 2018 |
| Foreign exchange forwards/options | | Net sales | | $ | (2 | ) | | $ | (2 | ) |
| Foreign exchange forwards/options | | Cost of products sold | | 11 |
| | (12 | ) |
| Foreign exchange forwards/options | | Interest and sundry (income) expense | | 33 |
| | 56 |
|
Commodity swaps/options (3) | | Cost of products sold | | (9 | ) | | 23 |
|
| Interest rate derivatives | | Interest expense | | 4 |
| | (1 | ) |
| Interest rate derivatives | | Interest and sundry (income) expense | | — |
| |
|
| | | | | $ | 37 |
| | $ | 64 |
|
| | | | | | | | | |
| | | | | | | Six Months Ended June 30, |
| | | Location of Gain (Loss) Recognized on Derivatives not
Accounted for as Hedges | | Gain (Loss) Recognized on Derivatives not Accounted for as Hedges (2) |
| Derivatives not Accounted for as Hedges - Millions of dollars | | | 2019 | | 2018 |
| Foreign exchange forwards/options | | Interest and sundry (income) expense | | $ | (6 | ) | | $ | 63 |
|
(4) The tax impact of the cash flow hedges was $10 million and $0 million for the six months ended June 30, 2019 and 2018. The tax impact of the net investment hedges was $6 million and $(1) million for the six months ended June 30, 2019 and 2018, respectively.
For cash flow hedges, the amount of ineffectiveness recognized in interest and sundry (income) expense was nominal for the periods ended June 30, 2019March 31, 2020, and 2018.2019. There were no hedges designated as fair value for the periods ended June 30, 2019March 31, 2020, and 2018.2019. The net amount of unrealized gain or loss on derivative instruments included in accumulated OCI related to contracts maturing and expected to be realized during the next twelve months is nominal.a gain of $78 million at March 31, 2020.
(11)(10) FAIR VALUE MEASUREMENTS
Fair value is measured based on an exit price, representing the amount that would be received to sell an asset or paid to transfer a liability in an orderly transaction between market participants. As such, fair value is a market-based measurement that should be determined based on assumptions market participants would use in pricing an asset or liability. Assets and liabilities measured at fair value are based on a market valuation approach using prices and other relevant information generated by market transactions involving identical or comparable assets or liabilities. As a basis for considering such assumptions, a three-tiered fair value hierarchy is established, which prioritizes the inputs used
in measuring fair value as follows: (Level 1) observable inputs such as quoted prices in active markets; (Level 2) inputs, other than the quoted prices in active markets that are observable, either directly or indirectly; and (Level 3) unobservable inputs in which there is little or no market data, which require the reporting entity to develop its own assumptions.
The non-recurring fair values represent only those assets whose carrying values were adjusted to fair value during the reporting period. See Note 17 to the Consolidated Condensed Financial Statements for additional information on the goodwill and other intangible impairment during the second quarter of 2018.
The following table summarizes the valuation of our assets and liabilities measured at fair value on a recurring basis at June 30, 2019March 31, 2020 and December 31, 20182019 are as follows:
| |
|
|
|
|
|
| Fair Value |
|
|
|
|
| Fair Value |
| Millions of dollars |
| Total Cost Basis |
| Level 1 |
| Level 2 |
| Total |
| Total Cost Basis |
| Level 1(2) |
| Level 2 |
| Total |
| Measured at fair value on a recurring basis: |
| 2019 |
| 2018 |
| 2019 |
| 2018 |
| 2019 |
| 2018 |
| 2019 |
| 2018 |
| 2020 | | 2019 |
| 2020 | | 2019 |
| 2020 |
| 2019 |
| 2020 | | 2019 |
Money market funds(1) |
| $ | 634 |
|
| $ | 511 |
|
| $ | 3 |
|
| $ | 5 |
|
| $ | 631 |
|
| $ | 506 |
|
| $ | 634 |
|
| $ | 511 |
| |
Short-term investments (1) | |
| $ | 1,967 |
|
| $ | 1,308 |
|
| $ | 1,210 |
|
| $ | 398 |
|
| $ | 757 |
|
| $ | 910 |
|
| $ | 1,967 |
|
| $ | 1,308 |
|
| Net derivative contracts |
| — |
|
| — |
|
| — |
|
| — |
|
| (43 | ) |
| (67 | ) |
| (43 | ) |
| (67 | ) |
| — |
|
| — |
|
| — |
|
| — |
|
| 180 |
|
| 5 |
|
| 180 |
|
| 5 |
|
| Available for sale investments |
| 7 |
|
| 7 |
|
| 18 |
|
| 12 |
|
| — |
|
| — |
|
| 18 |
|
| 12 |
| |
| |
(1)Money market funds are comprised primarily of government obligations or time deposits with banks and other first tier obligations. The following table summarizes the valuation of our assets measured at fair value on a non-recurring basis as of June 30, 2018:
| | | | | | | | | Fair Value | | Millions of dollars | | Level 3 | | Measured at fair value on a non-recurring basis: | | 2018 | | Assets: | | | Goodwill (2) | | $ | 315 |
| Indefinite-lived intangible assets (3) | | 384 |
| Definite-lived intangible assets (4) | | — |
| | Total level 3 assets | | $ | 699 |
|
(2) Goodwill with a carrying amount of $894 million was written down to a fair value of $315 million resulting in a goodwill impairment charge of $579 million during the second quarter of 2018.
(3) Indefinite-lived intangible assets with a carrying amount of approximately $492 million were written down to a fair value of $384 million resulting in an impairment charge of $108 million during the second quarter of 2018.
(4) A definite-lived intangible asset with a carrying amount of approximately $60 million was written down to a fair value of $0 million resulting in an impairment charge of $60 million during the second quarter of 2018.
Goodwill
We have four reporting units for which we assess for impairment. We use a discounted cash flow analysis to determine fair value and consistent projected financial information in our analysis of goodwill and intangible assets. The discounted cash flow analysis for the quantitative impairment assessment for the EMEA reporting unit during the second quarter of 2018 utilized a discount rate of 12%. Based on the quantitative assessment performed, the carrying value of the EMEA reporting unit exceeded its fair value resulting in a goodwill impairment charge of $579 million during the second quarter of 2018.
Other Intangible Assets
The relief-from-royalty method for the quantitative impairment assessment for other intangible assets in the EMEA reporting unit during the second quarter of 2018 utilized discount rates ranging from 11.5% - 16% and royalty rates ranging from 1.5% - 3.5%. Based on the quantitative impairment assessment performed, the carrying value of certain other intangible assets, primarily the Indesit and Hotpoint* brands, exceeded their fair value, resulting in an impairment charge of $168 million during the second quarter of 2018.
See Note 17 to the Consolidated Condensed Financial Statements for additional information.
South Africa Disposal Group
During the second quarter of 2019, we entered into an agreement to sell our South Africa business. We classified this disposal group as held for sale and recorded it at fair value because it was lower than the carrying amount. Fair value was estimated based on the cash purchase price (Level 2 input) and we recorded an impairment charge of $35 million for the write-down of the assets to the fair value of $5 million.
*Whirlpool ownership of the Hotpoint brand in the EMEA and Asia Pacific regions is not affiliated with the Hotpoint brand sold in the Americas.
See Note 16 to the Consolidated Condensed Financial Statements for additional information.
| Short-term investments are primarily comprised of money market funds and highly liquid, low risk investments with initial maturities less than 90 days. |
| |
(2) | Increase in level 1 investments reflect invested proceeds from the borrowings due to banks, including the current portion outstanding under the Amended Long-Term Facility. |
Other Fair Value Measurements
The fair value of long-term debt (including current maturities) was $4.92$4.65 billion and $4.17$5.00 billion at June 30, 2019March 31, 2020 and December 31, 2018,2019, respectively, and was estimated using discounted cash flow analysis based on incremental borrowing rates for similar types of borrowing arrangements (Level 2 input).
(12)(11) STOCKHOLDERS' EQUITY
The following table summarizes the changes in stockholders' equity for the periods presented:
|
| | | | | | | | | | | | | | | | | | | | | | | | |
| | | | | Whirlpool Stockholders' Equity | | |
| | | Total | | Retained Earnings | | Accumulated Other Comprehensive Income (Loss) | | Treasury Stock/ Additional Paid- in-Capital | | Common Stock | | Non- Controlling Interests |
| Balances, December 31, 2019 | | $ | 4,118 |
| | $ | 7,870 |
| | $ | (2,618 | ) | | $ | (2,169 | ) | | $ | 112 |
| | $ | 923 |
|
| Comprehensive income | | | | | | | | | | | | |
| Net earnings | | 147 |
| | 152 |
| | — |
| | — |
| | — |
| | (5 | ) |
| Other comprehensive income | | (95 | ) | | — |
| | (97 | ) | | — |
| | — |
| | 2 |
|
| Comprehensive income | | 52 |
| | 152 |
| | (97 | ) | | — |
| | — |
| | (3 | ) |
| Stock issued (repurchased) | | (115 | ) | | — |
| | — |
| | (115 | ) | | — |
| | — |
|
| Dividends declared | | (75 | ) | | (75 | ) | | — |
| | — |
| | — |
| | — |
|
| Balances, March 31, 2020 | | 3,980 |
| | 7,947 |
| | (2,715 | ) | | (2,284 | ) | | 112 |
| | 920 |
|
|
| | | | | | | | | | | | | | | | | | | | | | | | |
| | | | | Whirlpool Stockholders' Equity | | |
| | | Total | | Retained Earnings | | Accumulated Other Comprehensive Income (Loss) | | Treasury Stock/ Additional Paid- in-Capital | | Common Stock | | Non- Controlling Interests |
| Balances, December 31, 2018 | | $ | 3,205 |
| | $ | 6,933 |
| | $ | (2,695 | ) | | $ | (2,059 | ) | | $ | 112 |
| | $ | 914 |
|
| Comprehensive income | | | | | | | | | | | | |
| Net earnings | | 474 |
| | 471 |
| | — |
| | — |
| | — |
| | 3 |
|
| Other comprehensive income | | 93 |
| | — |
| | 93 |
| | — |
| | — |
| | — |
|
| Comprehensive income | | 567 |
| | 471 |
| | 93 |
| | — |
| | — |
| | 3 |
|
Adjustment to beginning retained earnings (1) | | 61 |
| | 61 |
| | — |
| | — |
| | — |
| | — |
|
| Stock issued (repurchased) | | (40 | ) | | — |
| | — |
| | (40 | ) | | — |
| | — |
|
| Dividends declared | | (74 | ) | | (74 | ) | | — |
| | — |
| | — |
| | — |
|
| Balances, March 31, 2019 | | $ | 3,719 |
| | $ | 7,391 |
| | $ | (2,602 | ) | | $ | (2,099 | ) | | $ | 112 |
| | $ | 917 |
|
|
| | | | | | | | | | | | | | | | | | | | | | | | |
| | | | | Whirlpool Stockholders' Equity | | |
| | | Total | | Retained Earnings | | Accumulated Other Comprehensive Income (Loss) | | Treasury Stock/ Additional Paid- in-Capital | | Common Stock | | Non- Controlling Interests |
| Balances, December 31, 2018 | | $ | 3,205 |
| | $ | 6,933 |
| | $ | (2,695 | ) | | $ | (2,059 | ) | | $ | 112 |
| | $ | 914 |
|
| Comprehensive income | | | | | | | | | | | | |
| Net earnings | | 474 |
| | 471 |
| | — |
| | — |
| | — |
| | 3 |
|
| Other comprehensive income | | 93 |
| | — |
| | 93 |
| | — |
| | — |
| | — |
|
| Comprehensive income | | 567 |
| | 471 |
| | 93 |
| | — |
| | — |
| | 3 |
|
Adjustment to beginning retained earnings (1) | | 61 |
| | 61 |
| | — |
| | — |
| | — |
| | — |
|
| Stock issued (repurchased) | | (40 | ) | | — |
| | — |
| | (40 | ) | | — |
| | — |
|
| Dividends declared | | (74 | ) | | (74 | ) | | — |
| | — |
| | — |
| | — |
|
| Balances, March 31, 2019 | | 3,719 |
| | 7,391 |
| | (2,602 | ) | | (2,099 | ) | | 112 |
| | 917 |
|
| Comprehensive income | | | | | | | | | | | | |
| Net earnings | | 72 |
| | 67 |
| | — |
| | — |
| | — |
| | 5 |
|
| Other comprehensive income | | (56 | ) | | — |
| | (55 | ) | | — |
| | — |
| | (1 | ) |
| Comprehensive income | | 16 |
| | 67 |
| | (55 | ) | | — |
| | — |
| | 4 |
|
| Stock issued (repurchased) | | 13 |
| | — |
| | — |
| | 13 |
| | — |
| | — |
|
| Dividends declared | | (81 | ) | | (78 | ) | | — |
| | — |
| | — |
| | (3 | ) |
| Balances, June 30, 2019 | | 3,667 |
| | 7,380 |
| | (2,657 | ) | | (2,086 | ) | | 112 |
| | 918 |
|
(1) Increase to beginning retained earnings is due to the adoption of ASU 2016-02 [increase of approximately $61 million (net of tax)]. For additional information regarding the adoption of this accounting standard, see Notes 1 and 3 to the Consolidated Condensed Financial Statements. | |
(1) | Increase to beginning retained earnings is due to the adoption of ASU 2016-02 [increase of approximately $61 million (net of tax)]. |
|
| | | | | | | | | | | | | | | | | | | | | | | | |
| | | | | Whirlpool Stockholders' Equity | | |
| | | Total | | Retained Earnings | | Accumulated Other Comprehensive Income (Loss) | | Treasury Stock/ Additional Paid- in-Capital | | Common Stock | | Non- Controlling Interests |
| Balances, December 31, 2017 | | $ | 5,128 |
| | $ | 7,352 |
| | $ | (2,331 | ) | | $ | (935 | ) | | $ | 112 |
| | $ | 930 |
|
| Comprehensive income | | | | | | | | | | | | |
| Net earnings | | 94 |
| | 94 |
| | — |
| | — |
| | — |
| | — |
|
| Other comprehensive income | | 5 |
| | — |
| | 4 |
| | — |
| | — |
| | 1 |
|
| Comprehensive income | | 99 |
| | 94 |
| | 4 |
| | — |
| | — |
| | 1 |
|
Adjustment to beginning retained earnings (2) | | 72 |
| | 72 |
| | — |
| | — |
| | — |
| | — |
|
| Adjustment to beginning accumulated other comprehensive loss | | (17 | ) | | — |
| | (17 | ) | | — |
| | — |
| | — |
|
| Stock issued (repurchased) | | 16 |
| | — |
| | — |
| | 16 |
| | — |
| | — |
|
| Dividends declared | | (78 | ) | | (78 | ) | | — |
| | — |
| | — |
| | — |
|
| Balances, March 31, 2018 | | 5,220 |
| | 7,440 |
| | (2,344 | ) | | (919 | ) | | 112 |
| | 931 |
|
| Comprehensive income | | | | | | | | | | | | |
| Net earnings | | (639 | ) | | (657 | ) | | — |
| | — |
| | — |
| | 18 |
|
| Other comprehensive income | | (163 | ) | | $ | — |
| | (162 | ) | | $ | — |
| | $ | — |
| | $ | (1 | ) |
| Comprehensive income | | (802 | ) | | (657 | ) | | (162 | ) | | — |
| | — |
| | 17 |
|
| Stock issued (repurchased) | | (990 | ) | | $ | — |
| | — |
| | $ | (990 | ) | | $ | — |
| | $ | — |
|
| Dividends declared | | (84 | ) | | (82 | ) | | — |
| | — |
| | — |
| | (2 | ) |
| Balances, June 30, 2018 | | 3,344 |
| | 6,701 |
| | (2,506 | ) | | (1,909 | ) | | 112 |
| | 946 |
|
(2) Increase to beginning retained earnings is due to the following accounting standard adoptions: ASU 2014-09 [increase of approximately $0.4 million], ASU 2016-01 [increase of approximately $17 million] and ASU 2016-16 [increase of approximately $56 million].
Other Comprehensive Income (Loss)
The following table summarizes our other comprehensive income (loss) and related tax effects for the periods presented:
|
| | | | | | | | | | | | | | | | | | | | |
| | | Three Months Ended June 30, |
| | | 2019 | | 2018 |
| Millions of dollars | | Pre-tax | Tax Effect | Net | | Pre-tax | Tax Effect | Net |
Currency translation adjustments (3) | | $ | (54 | ) | $ | 5 |
| $ | (49 | ) | | $ | (177 | ) | $ | (13 | ) | $ | (190 | ) |
| Cash flow hedges | | (21 | ) | 5 |
| (16 | ) | | 23 |
| (5 | ) | 18 |
|
| Pension and other postretirement benefits plans | | 11 |
| (2 | ) | 9 |
| | 13 |
| (4 | ) | 9 |
|
| Other comprehensive income (loss) | | (64 | ) | 8 |
| (56 | ) | | (141 | ) | (22 | ) | (163 | ) |
| Less: Other comprehensive income (loss) available to noncontrolling interests | | (1 | ) | — |
| (1 | ) | | (1 | ) | — |
| (1 | ) |
| Other comprehensive income (loss) available to Whirlpool | | $ | (63 | ) | $ | 8 |
| $ | (55 | ) | | $ | (140 | ) | $ | (22 | ) | $ | (162 | ) |
|
| | | | | | | | | | | | | | | | | | | | |
| | | Three Months Ended March 31, |
| | | 2020 | | 2019 |
| Millions of dollars | | Pre-tax | Tax Effect | Net | | Pre-tax | Tax Effect | Net |
Currency translation adjustments (2) | | $ | (172 | ) | $ | (24 | ) | $ | (196 | ) | | $ | 92 |
| 1 |
| $ | 93 |
|
| Cash flow hedges | | 111 |
| (23 | ) | 88 |
| | (14 | ) | 5 |
| (9 | ) |
| Pension and other postretirement benefits plans | | 16 |
| (3 | ) | 13 |
| | 12 |
| (3 | ) | 9 |
|
| Other comprehensive income (loss) | | (45 | ) | (50 | ) | (95 | ) | | 90 |
| 3 |
| 93 |
|
| Less: Other comprehensive income (loss) available to noncontrolling interests | | 2 |
| — |
| 2 |
| | — |
| — |
| — |
|
| Other comprehensive income (loss) available to Whirlpool | | $ | (47 | ) | $ | (50 | ) | $ | (97 | ) | | $ | 90 |
| $ | 3 |
| $ | 93 |
|
| |
(2) | Currency translation adjustments includes net investment hedges. |
|
| | | | | | | | | | | | | | | | | | | | |
| | | | | | | | | |
| | | Six Months Ended June 30, |
| | | 2019 |
| 2018 |
| Millions of dollars | | Pre-tax | Tax Effect | Net | | Pre-tax | Tax Effect | Net |
Currency translation adjustments(3) | | $ | 38 |
| $ | 6 |
| $ | 44 |
| | $ | (189 | ) | $ | (1 | ) | $ | (190 | ) |
| Cash flow | | (35 | ) | 10 |
| (25 | ) | | (3 | ) | — |
| (3 | ) |
| Pension and other postretirement benefits plans | | 22 |
| (4 | ) | 18 |
| | 50 |
| (15 | ) | 35 |
|
| Other comprehensive income (loss) | | 25 |
| 12 |
| 37 |
| | (142 | ) | (16 | ) | (158 | ) |
| Less: Other comprehensive income (loss) available to noncontrolling interests | | (1 | ) |
| (1 | ) | | — |
| — |
| — |
|
| Other comprehensive income (loss) available to Whirlpool | | $ | 26 |
| $ | 12 |
| $ | 38 |
| | $ | (142 | ) | $ | (16 | ) | $ | (158 | ) |
`(3) Currency translation adjustments includes net investment hedges.Reclassifications Out of Accumulated Other Comprehensive Income (Loss)
The following table provides the reclassification adjustments out of accumulated other comprehensive income (loss), by component, which was included in net earnings for the three and six months ended June 30, 2019:March 31, 2020:
|
| | | | | | | | |
| | | Three Months Ended | | Six Months Ended | | |
| Millions of dollars | | (Gain) Loss Reclassified | | (Gain) Loss Reclassified | | Classification in Earnings |
| Pension and postretirement benefits, pre-tax | | 11 |
| | 22 |
| | Interest and sundry (income) expense |
|
| | | | |
| Three Months Ended | | |
| Millions of dollars | (Gain) Loss Reclassified | | Classification in Earnings |
| Pension and postretirement benefits, pre-tax | 16 |
| | Interest and sundry (income) expense |
Net Earnings per Share
Diluted net earnings per share of common stock include the dilutive effect of stock options and other share-based compensation plans. Basic and diluted net earnings per share of common stock for the periods presented were calculated as follows:
| | | | | Three Months Ended June 30, | | Six Months Ended June 30, | | Three Months Ended March 31, |
| Millions of dollars and shares | | 2019 |
| 2018 | | 2019 | | 2018 | | 2020 | | 2019 |
| Numerator for basic and diluted earnings per share - Net earnings (loss) available to Whirlpool | | $ | 67 |
| | $ | (657 | ) | | $ | 538 |
| | $ | (563 | ) | | $ | 152 |
| | $ | 471 |
|
| Denominator for basic earnings per share - weighted-average shares | | 63.8 |
| | 69.1 |
| | 63.9 |
| | 70.1 |
| | 62.8 |
| | 64.0 |
|
| Effect of dilutive securities - share-based compensation | | 0.5 |
| | — |
| | 0.5 |
| | — |
| | 0.5 |
| | 0.5 |
|
| Denominator for diluted earnings per share - adjusted weighted-average shares | | 64.3 |
| | 69.1 |
| | 64.4 |
| | 70.1 |
| | 63.3 |
| | 64.5 |
|
| Anti-dilutive stock options/awards excluded from earnings per share | | 1.5 |
| | 2.0 |
| | 1.5 |
| | 1.9 |
| | 2.0 |
| | 1.8 |
|
Share Repurchase Program
On July 25, 2017, our Board of Directors authorized a share repurchase program of up to $2 billion. During the sixthree months ended June 30, 2019,March 31, 2020, we repurchased 360,326902,000 shares under this share repurchase program at an aggregate price of approximately $50121 million. At June 30, 2019March 31, 2020, there were approximately $750531 million in remaining funds authorized under this program.
Share repurchases are made from time to time on the open market as conditions warrant. These programs doGiven the current level of uncertainty surrounding the COVID-19 pandemic, we've decided to temporarily suspend our share repurchase program to protect liquidity in the current environment. The program does not obligate us to repurchase any of our shares and they haveit has no expiration date.
(13)
(12) RESTRUCTURING CHARGES
We periodically take action to improve operating efficiencies, typically in connection with business acquisitions or changes in the economic environment. Our footprint and headcount reductions and organizational integration actions relate to discrete, unique restructuring events, primarily reflected in the following plans:
In 2015, we committed to a restructuring plan to integrate our Italian legacy operations with those of Indesit. The industrial restructuring plan which was approved by the relevant labor unions and signed by the Italian government in 2015, provided for the closure or repurposing of certain manufacturing facilities and headcount reductions at other facilities. In addition, the restructuring plan provided for headcount reductions in the salaried employee workforce. These actions are substantially complete.
In 2018, we announced actions in EMEA to reduce fixed costs by $50 million. The initiatives primarily include headcount reductions throughout the EMEA region. Additionally, we exited domestic sales operations in Turkey. We expect theseThese actions will beare substantially complete in 2019 with approximately $26 million expense remaining.
The following table summarizes the restructuring actions above for the six months ended June 30, 2019 and the total costs to date for each plan: |
| | | | | | |
| Millions of dollars | 2019 | Total |
| Indesit | $ | 8 |
| $ | 236 |
|
| EMEA fixed cost actions | $ | 38 |
| $ | 52 |
|
The following table summarizes the changes to our restructuring liability during the six months ended June 30, 2019:
|
| | | | | | | | | | | | | | | |
| Millions of dollars | December 31, 2018 | Charges to Earnings | Cash Paid | Non-Cash and Other | June 30, 2019 |
| Employee termination costs | $ | 84 |
| $ | 49 |
| $ | (80 | ) | $ | — |
| $ | 53 |
|
| Asset impairment costs | — |
| 28 |
| (7 | ) | (12 | ) | 9 |
|
| Facility exit costs | (9 | ) | 4 |
| (11 | ) | — |
| (16 | ) |
| Other exit costs | 21 |
| 5 |
| (3 | ) | — |
| 23 |
|
| Total | $ | 96 |
| $ | 86 |
| $ | (101 | ) | $ | (12 | ) | $ | 69 |
|
The following table summarizes the restructuring charges by operating segment for the period presented: |
| | | |
| | Six Months Ended |
| Millions of dollars | June 30, 2019 |
| North America | $ | — |
|
| EMEA | 77 |
|
| Latin America | 8 |
|
| Asia | 1 |
|
| Corporate / Other | — |
|
| Total | $ | 86 |
|
On May 31, 2019, we announced our intention to reconvert our Naples, Italy manufacturing plant and potentially sell the plant to a third party. Such actions are subjectOn September 16, 2019, we entered into a preliminary agreement to continued negotiationsell the plant to a third-party purchaser and discussionto support costs associated with the transition. In October 2019, we announced that, based on further discussions with unions and the Italian government, certain laborwe will continue production at the Naples manufacturing plant in the near-term and resume negotiations with unions and the Italian government related to our exit of the plant. Our preliminary agreement to sell the plant to a third-party purchaser terminated in accordance with its terms in March 2020. We intend to cease production in the plant and exit the facility in 2020 as previously disclosed.
In connection with this action, we have incurred approximately $43 million in asset impairment costs, $8 million in other associated costs and $4 million in employee-related costs through March 31, 2020. As of December 31, 2019, we estimated total costs of $145 million and cash expenditures of $98 million. Due to the termination of the preliminary agreement with a potential third-party purchasers,purchaser in March 2020, we revised our estimated total costs to approximately $135 million and are subjectcash expenditures to regulatory$87 million. We estimate that the remaining costs of approximately $80 million, including approximately $48 million in employee-related costs and legal review, as well as final approvalapproximately $32 million in other associated costs, will be substantially incurred in 2020. The Company also believes that substantially all of the relevant parties. As of June 30, 2019,$87 million in estimated cash expenditures will occur in 2020. We expect these actions to be substantially complete in 2020.
The following table summarizes the Company has not committedrestructuring actions above for the three months ended March 31, 2020 and the total costs to a specificdate for each plan: |
| | | | | | |
| Millions of dollars | 2020 | Total |
| EMEA fixed cost actions | $ | 2 |
| $ | 79 |
|
| Naples | $ | 1 |
| $ | 55 |
|
The following table summarizes the changes to our restructuring plan, therefore no liability has been incurred related to this matter.during the three months ended March 31, 2020:
|
| | | | | | | | | | | | | | | |
| Millions of dollars | December 31, 2019 | Charges to Earnings | Cash Paid | Non-Cash and Other | March 31, 2020 |
| Employee termination costs | $ | 57 |
| $ | 3 |
| $ | (12 | ) | $ | — |
| $ | 48 |
|
| Asset impairment costs | 8 |
| — |
| — |
| — |
| 8 |
|
| Facility exit costs | — |
| 2 |
| (2 | ) | — |
| — |
|
| Other exit costs | 12 |
| — |
| (3 | ) | (2 | ) | 7 |
|
| Total | $ | 77 |
| $ | 5 |
| $ | (17 | ) | $ | (2 | ) | $ | 63 |
|
The following table summarizes the restructuring charges by operating segment for the period presented: |
| | | |
| | Three Months Ended |
| Millions of dollars | March 31, 2020 |
| North America | $ | — |
|
| EMEA | 5 |
|
| Latin America | — |
|
| Asia | — |
|
| Corporate / Other | — |
|
| Total | $ | 5 |
|
(14)(13) INCOME TAXES
Income tax expense (benefit) was $130 million and $(2)72 million for the three and six months ended June 30, 2019, respectively,March 31, 2020, compared to income tax expensebenefit of $30 million and $45$132 million in the same periodsperiod of 2018.2019. For the three months ended June 30, 2019,March 31, 2020, the increase in the effective tax rateexpense from the prior period is due primarily to athe impact of valuation allowances releases in the prior period, partially offset by overall higher level of earnings and related tax expense and impact of changes in enacted tax rates. For the six months ended June 30, 2019, the decrease in the effective tax rate from the prior period is due to valuation allowance releases, partially offset by higher level of earnings and related tax expense, non-deductible impairments and government payments.expense.
The following table summarizes the difference between income tax expense (benefit) at the U.S. statutory rate of 21% and the income tax expense (benefit) at effective worldwide tax rates for the respective periods:
| |
|
| Three Months Ended June 30, |
| Six Months Ended June 30, | Three Months Ended March 31, |
| Millions of dollars |
| 2019 |
| 2018 |
| 2019 |
| 2018 | 2020 | | 2019 |
| Earnings (loss) before income taxes |
| $ | 202 |
|
| $ | (609 | ) |
| $ | 544 |
|
| $ | (500 | ) | $ | 219 |
|
| $ | 342 |
|
| | Income tax expense (benefit) computed at United States statutory tax rate |
| 42 |
|
| (128 | ) |
| 114 |
|
| (105 | ) | 46 |
| | 72 |
|
| Valuation allowances |
| 39 |
|
| 39 |
|
| (196 | ) |
| 39 |
| 1 |
| | (235 | ) |
| Audits and settlements | | (13 | ) | | (3 | ) | | (13 | ) | | (3 | ) | |
| U.S. foreign income items, net of credits |
| 4 |
|
| (34 | ) |
| 11 |
|
| (45 | ) | 3 |
| | 7 |
|
| Changes in enacted tax rates | | 25 |
| | — |
| | 25 |
| | — |
| |
| Non deductible impairments | | — |
| | 138 |
| | — |
| | 138 |
| |
| Non deductible government payments | | — |
| | 37 |
| | — |
| | 37 |
| |
| Other |
| 33 |
|
| (19 | ) |
| 57 |
|
| (16 | ) | 22 |
| | 24 |
|
| Income tax expense (benefit) computed at effective worldwide tax rates |
| $ | 130 |
|
| $ | 30 |
|
| $ | (2 | ) |
| $ | 45 |
| $ | 72 |
|
| $ | (132 | ) |
At the end of each interim period, we estimate the effective tax rate expected to be applicable for the full fiscal year and the impact of discrete items, if any, and adjust the quarterly rate as necessary.necessary.
Valuation Allowances
We routinely review the future realization of deferred tax assets based on projected future reversal of taxable temporary differences, available tax planning strategies and projected future taxable income. We have reduced the valuation allowance to reflect the estimated amount of certain deferred tax assets associated with net operating losses and other deferred tax assets we believe are now more-likely-than-not to be realized. During the first quarter of 2019, upon completion of ourwe completed a $700 million bond offering we usedfor which the proceeds were used to refinance and recapitalize various entities in the EMEA region. Based upon our existing transfer pricing policies, these actions are expectedprojected to provide sufficient future taxable income to realize the deferred tax assets. In addition, theseThese actions injectinjected additional internal capital into certain EMEA entities to meet local country capitalization requirements, repayas well as repaid all outstanding borrowings under the Whirlpool EMEA Finance Term Loan and prepare for the Embraco divestiture. Accordingly,Loan. As a result, we reduced the valuation allowance by $235 million during the first quarter of 2019. During the second quarter of 2019, we increased our total valuation allowance by $39 million related to disposals of businesses in Turkey and South Africa and tax planning strategies that are no longer prudent.
(15)(14) SEGMENT INFORMATION
Our reportable segments are based upon geographical region and are defined as North America, EMEA, Latin America and Asia. These regions also represent our operating segments. Each segment manufactures home appliances and related components, but serves strategically different marketplaces. The chief operating decision maker evaluates performance based on each segment's earnings (loss) before interest and taxes (EBIT), which we define as operating profit less interest and sundry (income) expense and excluding restructuring costs, asset impairment charges and certain other items that management believes are not indicative of the region's ongoing performance, if any. Total assets by segment are those assets directly associated with the respective operating activities. The "Other/Eliminations" column primarily includes corporate expenses, assets and eliminations, as well as restructuring costs, asset impairment charges and certain other items that management believes are not indicative of the region's ongoing performance, if any. Intersegment sales are eliminated within each region except compressor sales out of Latin America through June 30, 2019, which arewere included in Other/Eliminations.
The tables below summarize performance by operating segment for the periods presented: | |
|
| Three Months Ended June 30, |
| Three Months Ended March 31, |
| |
| OPERATING SEGMENTS |
| OPERATING SEGMENTS |
Millions of dollars |
| North
America |
| EMEA |
| Latin
America |
| Asia |
| Other/
Eliminations | Total
Whirlpool | |
| |
| North
America |
| EMEA |
| Latin
America |
| Asia |
| Other / Eliminations | Total
Whirlpool |
| Net sales |
|
|
|
|
|
|
|
|
|
|
|
|
|
|
|
|
|
|
|
|
| 2020 | |
| $ | 2,540 |
|
| $ | 879 |
|
| $ | 618 |
|
| $ | 288 |
|
| $ | — |
| $ | 4,325 |
|
| 2019 |
| $ | 2,858 |
|
| $ | 1,032 |
|
| $ | 888 |
|
| $ | 430 |
|
| $ | (22 | ) | $ | 5,186 |
|
| 2,535 |
| | 1,004 |
| | 875 |
| | 371 |
| | (25 | ) | 4,760 |
|
| 2018 |
| 2,782 |
|
| 1,096 |
|
| 852 |
|
| 428 |
|
| (18 | ) | 5,140 |
| |
| Intersegment sales |
|
|
|
|
|
|
|
|
|
|
| | | | | | | | | |
| 2020 | |
| $ | 72 |
| | $ | 20 |
| | $ | 285 |
| | $ | 63 |
| | $ | (440 | ) | $ | — |
|
| 2019 |
| $ | 45 |
|
| 22 |
|
| 342 |
|
| 87 |
|
| (496 | ) | — |
|
| 66 |
| | 21 |
| | 337 |
| | 84 |
| | (508 | ) | — |
|
| 2018 |
| 70 |
|
| 26 |
|
| 341 |
|
| 84 |
|
| (521 | ) | — |
| |
| Depreciation and amortization |
|
|
|
|
|
|
|
|
|
|
|
|
|
|
|
|
|
| | | | | | | | | |
| 2020 | |
| $ | 47 |
| | $ | 38 |
| | $ | 16 |
| | $ | 17 |
| | $ | 17 |
| $ | 135 |
|
| 2019 |
| $ | 55 |
|
| $ | 58 |
|
| $ | 13 |
|
| $ | 17 |
|
| $ | 17 |
| $ | 160 |
|
| 49 |
| | 43 |
| | 18 |
| | 17 |
| | 15 |
| 142 |
|
| 2018 |
| 47 |
|
| 57 |
|
| 26 |
|
| 16 |
|
| 16 |
| 162 |
| |
| EBIT |
|
|
|
|
|
|
|
|
|
|
| | | | | | | | | |
| 2020 | |
| $ | 303 |
| | $ | (15 | ) | | $ | 31 |
| | $ | (16 | ) | | $ | (42 | ) | $ | 261 |
|
| 2019 |
| $ | 353 |
|
| (16 | ) |
| 56 |
|
| 15 |
|
| (154 | ) | 254 |
|
| 312 |
| | (21 | ) | | 45 |
| | 7 |
| | 50 |
| 393 |
|
| 2018 |
| 331 |
|
| (25 | ) |
| 33 |
|
| 43 |
|
| (944 | ) | (562 | ) | |
| Total assets |
|
|
|
|
|
|
|
|
|
|
|
|
|
|
|
|
|
| | | | | | | | | |
| June 30, 2019 |
| $ | 7,988 |
|
| $ | 9,432 |
|
| $ | 5,119 |
|
| $ | 2,640 |
|
| $ | (5,324 | ) | $ | 19,855 |
| |
| December 31, 2018 |
| 7,161 |
|
| 7,299 |
|
| 4,745 |
|
| 2,636 |
|
| (3,494 | ) | 18,347 |
| |
| March 31, 2020 | |
| $ | 7,627 |
| | $ | 10,281 |
| | $ | 3,777 |
| | $ | 2,477 |
| | $ | (4,767 | ) | $ | 19,395 |
|
| December 31, 2019 | |
| 7,791 |
| | 9,450 |
| | 4,226 |
| | 2,581 |
| | (5,167 | ) | 18,881 |
|
| Capital expenditures |
|
|
|
|
|
|
|
|
|
|
| | | | | | | | | |
| 2020 | |
| $ | 28 |
| | $ | 14 |
| | $ | 14 |
| | $ | 14 |
| | $ | 12 |
| $ | 82 |
|
| 2019 |
| $ | 43 |
|
| 17 |
|
| 21 |
|
| 19 |
|
| 12 |
| 112 |
|
| 35 |
| | 10 |
| | 24 |
| | 10 |
| | 6 |
| 85 |
|
| 2018 |
| 41 |
|
| 34 |
|
| 18 |
|
| 16 |
|
| 19 |
| 128 |
| |
|
| | | | | | | | | | | | | | | | | | | | | | | |
| | | | | | | | | | | | |
|
| Six Months Ended June 30, |
| |
| OPERATING SEGMENTS |
Millions of dollars |
| North
America |
| EMEA |
| Latin
America |
| Asia |
| Other/
Eliminations | Total
Whirlpool |
| Net sales |
|
|
|
|
|
|
|
|
|
|
|
| 2019 |
| $ | 5,393 |
|
| $ | 2,036 |
|
| $ | 1,763 |
|
| $ | 801 |
|
| $ | (47 | ) | $ | 9,946 |
|
| 2018 |
| 5,298 |
|
| 2,164 |
|
| 1,750 |
|
| 876 |
|
| (37 | ) | 10,051 |
|
| Intersegment sales |
|
|
|
|
|
|
|
|
|
|
|
| 2019 |
| $ | 111 |
|
| 43 |
|
| 679 |
|
| 171 |
|
| (1,004 | ) | — |
|
| 2018 |
| 137 |
|
| 64 |
|
| 627 |
|
| 159 |
|
| (987 | ) | — |
|
| Depreciation and amortization |
|
|
|
|
|
|
|
|
|
|
|
|
|
|
|
|
|
| 2019 |
| $ | 104 |
|
| $ | 101 |
|
| $ | 31 |
|
| $ | 34 |
|
| $ | 32 |
| $ | 302 |
|
| 2018 |
| 96 |
|
| 114 |
|
| 64 |
|
| 34 |
|
| 31 |
| 339 |
|
| EBIT |
|
|
|
|
|
|
|
|
|
|
|
| 2019 |
| $ | 665 |
|
| (37 | ) |
| 101 |
|
| 22 |
|
| (104 | ) | 647 |
|
| 2018 |
| 619 |
|
| (52 | ) |
| 90 |
|
| 62 |
|
| (1,130 | ) | (411 | ) |
| Total assets |
|
|
|
|
|
|
|
|
|
|
|
|
|
|
|
|
|
| June 30, 2019 |
| $ | 7,988 |
|
| $ | 9,432 |
|
| $ | 5,119 |
|
| $ | 2,640 |
|
| $ | (5,324 | ) | $ | 19,855 |
|
| December 31, 2018 |
| 7,161 |
|
| 7,299 |
|
| 4,745 |
|
| 2,636 |
|
| (3,494 | ) | 18,347 |
|
| Capital expenditures |
|
|
|
|
|
|
|
|
|
|
|
| 2019 |
| $ | 78 |
|
| 27 |
|
| 45 |
|
| 29 |
|
| 18 |
| 197 |
|
| 2018 |
| 64 |
|
| 40 |
|
| 31 |
|
| 27 |
|
| 32 |
| 194 |
|
The following table summarizes the reconciling items in the Other/Eliminations column for total EBIT for the periods presented:
| | | | Three Months Ended June 30, | | Six Months Ended June 30, | Three Months Ended March 31, |
| in millions | 2019 | 2018 | | 2019 | 2018 | 2020 | 2019 |
| Items not allocated to segments: | | | | |
| Restructuring costs | $ | (60 | ) | $ | (44 | ) | | $ | (86 | ) | $ | (188 | ) | $ | (5 | ) | $ | (26 | ) |
| Divestiture related transition costs | (11 | ) | — |
| | (17 | ) | — |
| — |
| (6 | ) |
| Brazil indirect tax credit | 53 |
| — |
| | 180 |
| — |
| — |
| 127 |
|
| French antitrust settlement | — |
| (114 | ) | | — |
| (114 | ) | |
| Impairment of goodwill and intangibles | — |
| (747 | ) | | — |
| (747 | ) | |
Legacy product warranty and liability expense
| (12 | ) | — |
| | (12 | ) | — |
| |
| Loss on disposal of businesses | (79 | ) | — |
| | (79 | ) | — |
| |
| Corporate expenses and other | (45 | ) | (39 | ) | | (90 | ) | (81 | ) | (37 | ) | (45 | ) |
| Total other/eliminations | $ | (154 | ) | $ | (944 | ) | | $ | (104 | ) | $ | (1,130 | ) | $ | (42 | ) | $ | 50 |
|
A reconciliation of our segment information for total EBIT to the corresponding amounts in the Consolidated Condensed Statements of Comprehensive Income (Loss) is shown in the table below for the periods presented:
| | | | | Three Months Ended June 30, | | Six Months Ended June 30, | | Three Months Ended March 31, |
| in millions | | 2019 | 2018 | | 2019 | 2018 | | 2020 | 2019 |
| Operating profit | | $ | 191 |
| $ | (472 | ) | | $ | 454 |
| $ | (329 | ) | | $ | 260 |
| $ | 263 |
|
| Interest and sundry (income) expense | | (63 | ) | 90 |
| | (193 | ) | 82 |
| | (1 | ) | (130 | ) |
| Total EBIT | | $ | 254 |
| $ | (562 | ) | | $ | 647 |
| $ | (411 | ) | | $ | 261 |
| $ | 393 |
|
| Interest expense | | 52 |
| 47 |
| | 103 |
| 89 |
| | 42 |
| 51 |
|
| Income tax expense (benefit) | | 130 |
| 30 |
| | (2 | ) | 45 |
| |
| Income tax expense | | | 72 |
| (132 | ) |
| Net earnings (loss) | | $ | 72 |
| $ | (639 | ) | | $ | 546 |
| $ | (545 | ) | | $ | 147 |
| $ | 474 |
|
| Less: Net earnings available to noncontrolling interests | | 5 |
| 18 |
| | 8 |
| 18 |
| | (5 | ) | 3 |
|
| Net earnings available to Whirlpool | | $ | 67 |
| $ | (657 | ) | | $ | 538 |
| $ | (563 | ) | |
| Net earnings (loss) available to Whirlpool | | | $ | 152 |
| $ | 471 |
|
(16) DIVESTITURES AND HELD FOR SALE
Embraco Sale Transaction
On April 23, 2018, our Board of Directors approved the sale of Embraco and we subsequently entered into an agreement to sell the compressor business for a cash purchase price of $1.08 billion, subject to customary adjustments including for indebtedness, cash and working capital at closing.
On July 1, 2019, we closed the sale of Embraco. Based on the cash purchase price, we estimate a gain, net of taxes, in the range of approximately $375 to $425 million. With the proceeds from this transaction, we will repay the outstanding term loan amount recorded in notes payable of approximately $1 billion as required under the Term Loan Agreement. The recognition of the gain and repayment of the outstanding term loan will occur in the third quarter of 2019.
The estimated gain is subject to change based on the final transaction amounts, including the net book value of held for sale assets at the closing date and the finalization of the amounts for closing costs, taxes and customary adjustments for indebtedness, cash and working capital. Please see "Embraco Sale Transaction" in the Management's Discussion and Analysis section for additional information on the agreement.
Embraco is reported within our Latin America reportable segment and meets the criteria for held for sale accounting. The operations of Embraco do not meet the criteria to be presented as discontinued operations.
The carrying amounts of the major classes of Embraco's assets and liabilities at June 30, 2019 and December 31, 2018 include the following:
|
| | | | | | | |
Millions of dollars | June 30, 2019 |
| December 31, 2018 |
| Accounts receivable, net of allowance of $2 and $8, respectively | 232 |
| | 198 |
|
| Inventories | 234 |
| | 165 |
|
| Prepaid and other current assets | 30 |
| | 42 |
|
| Property, net of accumulated depreciation of $532 and $616, respectively | 386 |
| | 364 |
|
| Right of use assets | 43 |
| | — |
|
| Other noncurrent assets | 38 |
| | 49 |
|
| Total assets | $ | 963 |
| | $ | 818 |
|
| | | | |
| Accounts payable | $ | 394 |
| | $ | 361 |
|
| Accrued expenses | 15 |
| | 27 |
|
| Accrued advertising and promotion | 8 |
| | 12 |
|
| Other current liabilities | 56 |
| | 55 |
|
| Lease liabilities | 36 |
| | — |
|
| Other noncurrent liabilities | 15 |
| | 34 |
|
| Total liabilities | $ | 524 |
| | $ | 489 |
|
The following table summarizes Embraco's earnings before income taxes for the periods presented:
|
| | | | | | | | | | | | | | | |
| | Three Months Ended June 30, | | Six Months Ended June 30, |
| Millions of dollars | 2019 | | 2018 | | 2019 | | 2018 |
| Earnings before income taxes | $ | 24 |
| | $ | 9 |
| | $ | 47 |
| | $ | 16 |
|
South Africa Sale Transaction
On June 28, 2019, we entered into an agreement to sell our South Africa operations for a cash purchase price of $5 million, subject to customary adjustments at closing.
The South Africa business is reported within our EMEA reportable segment and meets the criteria for held for sale accounting. The operations of South Africa do not meet the criteria to be presented as discontinued operations.
We recorded a charge of $68 million in the Consolidated Condensed Statements of Comprehensive Income during the second quarter of 2019 associated with this transaction. The loss includes a charge of $35 million for the write-down of the assets of the disposal group to fair value and $33 million of cumulative foreign currency translation adjustments included in the carrying amount of the disposal group to calculate the impairment.
The carrying amount of held for sale assets and liabilities of South Africa as of June 30, 2019 is $6 million and $34 million, respectively. Held for sale liabilities primarily includes the cumulative foreign currency translation adjustments that will be released upon closing of the transaction which will result in substantial liquidation of this foreign entity.
Earnings before income taxes for South Africa were immaterial for the periods presented.
For additional information see Note 11 to the Consolidated Condensed Financial Statements.
Turkey Divestiture Costs
For the six months ended June 30, 2019, we incurred approximately $11 million of divestiture related costs, primarily inventory liquidation costs, related to the exit from our domestic sales operations in Turkey.
For additional information see Note 13 to the Consolidated Condensed Financial Statements.
(17) GOODWILL AND OTHER INTANGIBLES
Goodwill
In connection with the preparation of our Consolidated Condensed Financial Statements for three months ended June 30, 2018, we identified indicators of goodwill impairment for our EMEA reporting unit based on our qualitative assessment, which required us to complete an interim quantitative impairment assessment. The primary indicator of impairment for our EMEA reporting unit was the segment's continuing negative financial performance in 2018 that did not improve as anticipated, primarily driven by significant volume loss. The actual operating results for the three months ended June 30, 2018 were significantly lower than forecasted resulting in weak business performance. While the Indesit integration activities were substantially complete, as of the impairment date, the operating and macro-environment in the EMEA region continued to be very challenging and had not improved as anticipated. While our commercial transformation and supply chain initiatives were progressing, as of the impairment determination date, progress on market share recovery was slower than previously anticipated and the business had been impacted by raw material inflation and currency headwinds.
In performing our quantitative assessment of goodwill during the second quarter of 2018, we estimated the reporting unit's fair value under an income approach using a discounted cash flow model. The income approach used the reporting unit's projections of estimated operating results and cash flows that were discounted using a market participant discount rate based on the weighted-average cost of capital. The main assumptions supporting the cash flow projections included revenue growth, EBIT margins and the discount rate. The financial projections reflect management's best estimate of economic and market conditions over the projected period including forecasted revenue growth, EBIT margins, tax rate, capital expenditures, depreciation and amortization, changes in working capital requirements and the terminal growth rate.
Based on our interim quantitative impairment assessment as of June 30, 2018, the carrying value of the EMEA reporting unit exceeded its fair value by $579 million and we recorded a goodwill impairment charge in this amount in 2018.
Other Intangible Assets
In connection with the preparation of our Consolidated Condensed Financial Statements for three months ended June 30, 2018, we identified indicators of impairment associated with other intangible assets in our EMEA reporting unit based on our qualitative assessment, which required us to complete an interim quantitative impairment assessment. The primary indicator of impairment was the continuing decline in revenue from weaker volumes through the six months ended June 30, 2018 that did not improve as anticipated. The actual operating results for the three months ended June 30, 2018 were significantly lower than forecasted.
In performing our quantitative assessment of other intangible assets, primarily brands, we estimate the fair value using the relief-from-royalty method which requires assumptions related to projected revenues from our long-range plans; assumed royalty rates that could be payable if we did not own the brand; and a market participant discount rate based on a weighted-average cost of capital.
Based on our interim quantitative impairment assessment as of June 30, 2018, the carrying value of certain other intangible assets, including Indesit and Hotpoint*, exceeded their fair value, and we recorded an impairment charge of $168 million in 2018.
The estimated undiscounted cash flows for all other long-lived assets, excluding goodwill and indefinite-life intangibles, exceeded their carrying value as of June 30, 2018.
See Note 11 to the Consolidated Condensed Financial Statements for additional information on the fair value measurement and disclosure related to the goodwill and other intangibles impairment.
*Whirlpool ownership of the Hotpoint brand in the EMEA and Asia Pacific regions is not affiliated with the Hotpoint brand sold in the Americas.
The estimates of future cash flows used in determining the fair value of goodwill and intangible assets involve significant management judgment and are based upon assumptions about expected future operating performance, economic conditions, market conditions and cost of capital. Inherent in estimating the future cash flows are uncertainties beyond our control, such as changes in capital markets. The actual cash flows could differ materially from management's estimates due to changes in business conditions, operating performance and economic conditions.
|
| |
| ITEM 2. | MANAGEMENT'S DISCUSSION AND ANALYSIS OF FINANCIAL CONDITION AND RESULTS OF OPERATIONS |
ABOUT WHIRLPOOL
Whirlpool Corporation ("Whirlpool"), the world's leading major home appliance company, was incorporated in 1955 under the laws of Delaware and was founded in 1911. Whirlpool manufactures products in 1413 countries and markets products in nearly every country around the world. We have received worldwide recognition for accomplishments in a variety of business and social efforts, including leadership, diversity, innovative product design, business ethics, social responsibility and community involvement. We conduct our business through four operating segments, which we define based on geography. Whirlpool's operating segments consist of North America, Europe, Middle East and Africa ("EMEA"), Latin America and Asia. Whirlpool had approximately $21$20 billion in annual sales and 92,00077,000 employees in 2018.2019. The world's leading major home appliance company claim is based on most recently available publicly reported annual revenues among leading appliance manufacturers.
OVERVIEW
Whirlpool had strong second-quarterfirst-quarter GAAP net earnings available to Whirlpool of $67$152 million (net earnings margin of 3.5%), or $1.04 per$2.41per share, compared to a GAAP net lossearnings available to Whirlpool of $(657)$471 million (net earnings margin of 9.9%), or $7.31 per share, in the same prior-year period. Non-recurring items negatively impacted prior-year net loss available to Whirlpool by approximately $860 million.
Whirlpool delivered record second-quarterstrong and resilient global performance with ongoing (non-GAAP) earnings per share of $4.01 and EBIT margin expansion of approximately 30 basis points,6.1%,down slightly vs. the same prior-year period; the reduction in GAAP net earnings margin and ongoing EBIT margin were driven by strong results in North America, positivegrowing COVID-19 disruptions, unfavorable product price/mix, the divestiture of the Embraco compressor business and sustained fixed cost discipline.unfavorable foreign currency. These results were partially offset by the favorable impacts of cost reduction initiatives.
As mentioned, during the quarter, our business began to experience significant disruptions with the expanding COVID-19 pandemic, primarily in the Asia and EMEA regions. With the continued cost inflationspread of the pandemic into other regions and increased brand investments.
In addition,the subsequent macroeconomic uncertainty, the disruption and impacts are expected to expand as we completedmove throughout the saleyear. Whirlpool has taken aggressive actions to address the health and safety of our Embracoemployees, negative effect from demand disruptions and production impacts, including, but not limited to the following:
Executing business unit and will use the proceeds to pay down our outstanding term loan in the third quarter, making significant progress towards our long-term Gross Debt/EBITDA goal of 2.0.
Our second-quarter results strengthen our confidence in deliveringcontinuity actions focused on our full-year financial commitmentsemployee health and safety, such as travel bans, remote work policies, line distancing in our factories and enhanced cleaning and hygiene in our facilities, among other measures.
Proactively taking actions to mitigate volume deleverage, including rapidly implementing cost reduction actions to reduce our cost footprint to provide additional operational flexibility during the crisis.
Implementing rapid liquidity preservation actions, reduction of margin expansionsupply flows into our manufacturing facilities, disciplined inventory management, and improved free cash conversion.
Borrowing approximately $2.2 billion on our revolving credit facility and using certain of the proceeds to fund commercial paper repayment with the remainder being held to provide incremental financial flexibility during the crisis and in these volatile financial markets.
We believe that these aggressive cost reduction and liquidity preservation actions serve to position Whirlpool appropriately and provide additional operating and financial flexibility to successfully navigate this uncertain environment.
RESULTS OF OPERATIONS
The following table summarizes the consolidated results of operations for the periods presented:
|
| | | | | | | | | | | | | | | | | | | |
| | Three Months Ended June 30, | | Six Months Ended June 30, |
| Consolidated - Millions of dollars, except per share data | 2019 | | 2018 | | Better/(Worse) | | 2019 | | 2018 | | Better/(Worse) |
| Units (in thousands) | 16,249 |
| | 16,120 |
| | 0.8% | | 31,241 |
| | 31,413 |
| | (0.5)% |
| Net sales | $ | 5,186 |
| | $ | 5,140 |
| | 0.9 | | $ | 9,946 |
| | $ | 10,051 |
| | (1.0) |
| Gross margin | 932 |
| | 880 |
| | 5.9 | | 1,744 |
| | 1,692 |
| | 3.1 |
| Selling, general and administrative | 584 |
| | 541 |
| | (8.1) | | 1,089 |
| | 1,046 |
| | (4.3) |
| Restructuring costs | 60 |
| | 44 |
| | (37.0) | | 86 |
| | 188 |
| | 54.5 |
| Interest and sundry (income) expense | (63 | ) | | 90 |
| | nm | | (193 | ) | | 82 |
| | nm |
| Interest expense | 52 |
| | 47 |
| | (11.1) | | 103 |
| | 89 |
| | (16.0) |
| Income tax expense (benefit) | 130 |
| | 30 |
| | nm | | (2 | ) | | 45 |
| | nm |
| Net earnings (loss) available to Whirlpool | 67 |
| | (657 | ) | | nm | | 538 |
| | (563 | ) | | nm |
| Diluted net earnings available to Whirlpool per share | $ | 1.04 |
| | $ | (9.50 | ) | | nm | | $ | 8.35 |
| | $ | (8.03 | ) | | nm |
|
| | | | | | | | | | | |
| | | Three Months Ended March 31, |
| Consolidated - Millions of dollars, except per share data | | 2020 | | 2019 | | Better/(Worse) |
| Net sales | | $ | 4,325 |
| | $ | 4,760 |
| | (9.1)% |
| Gross margin | | 700 |
| | 812 |
| | (13.8) |
| Selling, general and administrative | | 420 |
| | 505 |
| | 16.8 |
| Restructuring costs | | 5 |
| | 26 |
| | 81.5 |
| Interest and sundry (income) expense | | (1 | ) | | (130 | ) | | (99.1) |
| Interest expense | | 42 |
| | 51 |
| | 18.6 |
| Income tax expense (benefit) | | 72 |
| | (132 | ) | | nm |
| Net earnings available to Whirlpool | | 152 |
| | 471 |
| | (67.7 | )% |
| Diluted net earnings available to Whirlpool per share | | $ | 2.41 |
| | $ | 7.31 |
| | (67.0)% |
nm = not meaningful
Consolidated net sales increased 0.9% and decreased 1.0%9.1% for the three and six months ended June 30, 2019, respectively,March 31, 2020, compared to the same periodsperiod in 2018.2019. The increasedecrease for the three months ended was primarily driven by favorablevolume declines, unfavorable product price/mix and unit volume growth, partially offset by unfavorable impacts from foreign currency. The decrease for the six months endedvolume decline was primarily driven by unfavorable impacts from foreign currencythe negative impact of COVID-19 disruptions, primarily in EMEA and unit volume declines, partially offset by favorable product price/mix. ExcludingAsia. Organic net sales, or net sales excluding the impact of foreign currency consolidated net sales increased 3.5% and 2.3%Embraco, decreased 0.3% for the three and six months ended June 30, 2019, respectively,March 31, 2020, compared to the same periodsperiod in 2018.2019.
For additional information regarding non-GAAP financial measures including organic net sales and net sales excluding the impact of foreign currency, see the Non-GAAP Financial Measures section of this Management's Discussion and Analysis.
The consolidated gross margin percentage increased to 18.0% and 17.5% for the three and six months ended June 30, 2019 , respectively, comparedMarch 31, 2020 decreased to 16.2% from 17.1% for the same periodsperiod in 2018,2019, which reflects favorablethe unfavorable impacts of volume declines, product price/mix and foreign currency, partially offset by lower unit volumes,the favorable impact of cost productivity and raw material inflation and impact of foreign currency.deflation.
Our reportable operating segments are based upon geographical region and are defined as North America, EMEA, Latin America and Asia. These regions also represent our reportable segments. The chief operating decision maker evaluates performance based on each segment's earnings (loss) before interest and taxes (EBIT), which we define as operating profit less interest and sundry (income) expense and excluding restructuring costs, asset impairment charges and certain other items that management believes are not indicative of the region's ongoing performance, if any. For additional information, see Note 1514 to the Consolidated Condensed Financial Statements.
The following is a discussion of results for each of our operating segments.
North AmericaNORTH AMERICA
Following are the results for the North America region:Net Sales
2019 compared to 2018
Units sold decreased 1.1% and 4.0%Net sales increased 0.2% for the three and six months ended June 30, 2019, respectively,March 31, 2020, compared to the same periodsperiod in 2018.
2019 compared to 2018
Net sales increased 2.8% and 1.8% for the three and six months ended June 30, 2019, respectively, compared to the same periods in 2018.2019. The increase for the three and six months ended June 30, 2019March 31, 2020 was primarily driven by favorable impacts from product price/mix,higher volumes, partially offset by lower unit volumes.unfavorable product price/mix. Excluding the impact from foreign currency, net sales increased 3.0% and 2.1%0.3% for the three and six months ended June 30, 2019, respectively,March 31, 2020, compared to the same periodsperiod in 2018.2019.
2019 compared to 2018EBIT
EBIT margin was 12.4% and11.9% for the three months ended March 31, 2020, compared to 12.3% for the three and six months ended June 30, 2019, respectively, compared to 11.9% and 11.7% for the same periodsperiod in 2018.2019. EBIT increaseddecreased for the three and six months ended June 30, 2019March 31, 2020 compared to the same periodsperiod in 20182019 primarily due to the favorableunfavorable impact of product price/mix, partially offset by cost inflation (raw materials, tariffsproductivity and freight) and lower unit volumes.raw material deflation.
EMEA
Net Sales
EMEA
Following are the results for the EMEA region:
2019 compared to 2018
Units sold increased 2.0% and 3.3%Net sales decreased 12.4% for the three and six months ended June 30, 2019, respectively,March 31, 2020, compared to the same periodsperiod in 2018.
2019 compared to 2018
Net sales decreased 5.8% and 5.9% for the three and six months ended June 30, 2019, respectively, compared to the same periods in 2018.2019. The decrease for the three months ended June 30, 2019March 31, 2020 was primarily driven by unfavorable impactslower volumes (primarily from COVID-19 disruptions) and foreign currency, and product price/mix, partially offset by unit volume growth. The decrease for the six months ended June 30, 2019 was primarily driven by unfavorable impacts from foreign currency andfavorable product price/mix, partially offset by unit volume growth.mix. Excluding the impact from foreign currency, net sales decreased 0.2% and increased 0.7%10.2% for the three and six months ended June 30, 2019, respectively,March 31, 2020, compared to the same periodsperiod in 2018.2019.
EBIT
EBIT margin was (1.7)% for the three months ended March 31, 2020, compared to (2.1)% and for the same period in 2019. EBIT increased for the three months ended March 31, 2020 compared to the same period in 2019 primarily due to the favorable impact of cost reduction initiatives, partially offset by the unfavorable volumes and cost productivity related to COVID-19 disruptions.
EBIT margin was (1.6)% and (1.8)%LATIN AMERICA
Net Sales
Net sales decreased 29.4% for the three and six months ended June 30, 2019, respectively, compared to (2.3)% and (2.4)% for the same periods in 2018. EBIT increased for the three and six months ended June 30, 2019March 31, 2020, compared to the same periodsperiod in 2018 primarily due to the favorable impacts of restructuring benefits.
Latin America
Following are the results for the Latin America region:
2019 compared to 2018
Units sold increased 1.7% and 3.8%2019. The decrease for the three and six months ended June 30, 2019, respectively, compared to the same periods in 2018.
2019 compared to 2018
Net sales increased 4.1% and 0.7% for the three and six months ended June 30, 2019, respectively, compared to the same periods in 2018. The increase for the three and six months ended June 30, 2019March 31, 2020 was primarily driven by favorable impacts from product price/mixthe divestiture of the Embraco compressor business and unit volume growth,the unfavorable impact of foreign currency, partially offset by unfavorable impacts from foreign currency.higher volumes. Excluding the impact from foreign currency and Embraco, net sales increased 9.6% and 8.1%23.3% for the three and six months ended June 30, 2019, respectively,March 31, 2020, compared to the same periodsperiod in 2018.2019.
2019 compared to 2018EBIT
EBIT margin was 6.3% and 5.7%5.1% for the three and six months ended June 30, 2019, respectively,March 31, 2020, compared to 3.8% and 5.1% for the same periodsperiod in 2018. The favorable impacts2019. EBIT decreased for the three months ended March 31, 2020 primarily due to the divestiture of product price/mix were partially offset bythe Embraco compressor business and the unfavorable impact of foreign currency. Prior period results were negatively impactedcurrency, offset by the Brazil truck drivers' strike.favorable impact of cost productivity.
Asia
Following are the results for the Asia region:
2019 compared to 2018
Units sold increased 2.3% andNet sales decreased 3.9%22.3% for the three and six months ended June 30, 2019, respectively,March 31, 2020, compared to the same periodsperiod in 2018.
2019 compared to 2018
Net sales increased 0.5% and decreased 8.6%2019. The decrease for the three and six months ended June 30, 2019, respectively, compared to the same periods in 2018. For the three months ended June 30, 2019 net sales was comparable to the prior year and includes the favorable impacts of unit volume growth in India and product price/mix offset by the unfavorable impact of foreign currency. The decrease for the six months ended June 30, 2019March 31, 2020 was primarily driven by lower volumes from COVID-19 disruptions and the unfavorable impacts from lower unit volumes in Chinaof product price/mix and foreign currency. Excluding the impact from foreign currency, net sales increased 4.7% and decreased 3.6%20.2% for the three and six months ended June 30, 2019, respectively,March 31, 2020, compared to the same periodsperiod in 2018.2019.
2019 compared to 2018EBIT
EBIT margin was 3.6% and 2.8%(5.6)% for the three and six months ended June 30, 2019March 31, 2020, compared to 10.1% and 7.1%1.9% for the same periodsperiod in 2018. The favorable impact of unit volume growth in India and product price/mix was offset by2019. EBIT decreased for the three months ended March 31, 2020 primarily due to unfavorable impact of lower unit volumes and brand investments in China. Prior period results were positively impacted by Chinese government incentives.
Selling, General and Administrative
The following table summarizes selling, general and administrative expenses as a percentage of net sales by region for the periods presented:
| | | | | Three Months Ended June 30, | | Six Months Ended June 30, | | Three Months Ended March 31, |
| Millions of dollars | | 2019 | | As a % of Net Sales | 2018 | | As a % of Net Sales | 2019 | | As a % of Net Sales | 2018 | | As a % of Net Sales | | 2020 | | As a % of Net Sales | | 2019 | | As a % of Net Sales |
| North America | | $227 | | 7.9% | | $206 | | 7.4% | | $403 | | 7.5% | | $367 | | 6.9% | | $ | 166 |
| | 6.5% | | $ | 176 |
| | 6.9% |
| EMEA | | 126 | | 12.2% | | 139 | | 12.7% | | 250 | | 12.3% | | 282 | | 13.0% | | 96 |
| | 10.9% | | 124 |
| | 12.4% |
| Latin America | | 90 | | 10.1% | | 84 | | 9.8% | | 168 | | 9.5% | | 170 | | 9.7% | | 62 |
| | 10.0% | | 78 |
| | 8.9% |
| Asia | | 75 | | 17.5% | | 64 | | 14.8% | | 136 | | 17.0% | | 127 | | 14.5% | | 58 |
| | 20.2% | | 61 |
| | 16.3% |
| Corporate/other | | 66 | | — | | 48 | | — | | 132 | | — | | 100 | | — | | 38 |
| | — | | 66 |
| | — |
| Consolidated | | $584 | | 11.3% | | $541 | | 10.5% | | $1,089 | | 11.0% | | $1,046 | | 10.4% | | $ | 420 |
| | 9.7% | | $ | 505 |
| | 10.6% |
Consolidated selling, general and administrative expenses for the three and six months ended June 30, 2019 increasedMarch 31, 2020 decreased compared to the same period in 20182019 primarily due to brand investments.the impact of cost reduction actions actions and the divestiture of the Embraco compressor business.
Restructuring
We incurred restructuring charges of $60 million and $86$5 million for the three and six months ended June 30, 2019, respectively,March 31, 2020, compared to $44 million and $188$26 million for the same periodsperiod in 2018.2019. For the full year 2019,2020, we expect to incur approximately $200up to $100 million of restructuring charges, as we reducedriven by previously announced fixed costs primarilycost reduction actions in the EMEA region.
For additional information, see Note 13 to the Consolidated Condensed Financial Statements.
Impairment of Goodwill and Other Intangibles
We recorded an impairment charge of $747 million related to goodwill ($579 million) and other intangibles ($168 million) for the three and six months ended June 30, 2018 related to the EMEA reporting unit.
For additional information, see Note 11 and Note 17 to the Consolidated Condensed Financial Statements.
Loss on Disposal of Businesses
We incurred a loss of $79 million for the three and six months ended June 30, 2019 related to charges on the pending sale of the South Africa business ($68 million) and costs associated with the exit of the Turkey domestic sales operations ($11 million).
For additional information, see Note 1612 to the Consolidated Condensed Financial Statements.
Interest and Sundry (Income) Expense
Interest and sundry (income) expenseincome decreased for the three and six months ended June 30, 2019 increasedMarch 31, 2020 compared to the same periods in 2018.2019. The increasedecrease in interest and sundry income for the three and six months ended March 31, 2020 was primarily due to the prior year impact of the Brazil indirect tax creditscredit recorded of $53$127 million and $180 million, respectively. These amounts reflect $54 million and $196which reflects $142 million of indirect tax credits, net of related fees.
For additional information, see Note 87 to the Consolidated Condensed Financial Statements.
Interest Expense
Interest expense for the three and six months ended June 30, 2019 increasedMarch 31, 2020 decreased compared to the same periodsperiod in 20182019 primarily due to higherlower average short-term debt balances.
Income Taxes
Income tax expense (benefit) was $130 million and $(2)$72 million for the three and six months ended June 30, 2019March 31, 2020 compared to income tax expensebenefit of $30 million and $45$132 million in the same periodsperiod of 2018.2019. For the three months ended June 30, 2019, the increase inMarch 31, 2020, the effective tax rate fromprimarily reflects the prior period is due primarily to a higher level of earnings and related tax expense and impact of changes in enacted tax rates. For the six months ended June 30, 2019, the decrease in theon earnings. The effective tax rate fromin the priorcomparable period is due toin 2019 primarily reflects the impact of valuation allowance releases, partially offset by higher level of earnings and related tax expense, non-deductible impairments and government payments.expense.
For additional information, see Note 1413 to the Consolidated Condensed Financial Statements.
Other Information
Goodwill and Indefinite-Lived Intangible Assets
Our Critical Accounting Policies and Estimates for goodwill and other indefinite-life intangibles are disclosed in Note 1 to the Consolidated Financial Statements and in Management's Discussion and Analysis of our annual report on Form 10-K for the fiscal year ended December 31, 2019.
We continue to monitor the significant global economic uncertainty as a result of COVID-19 to assess the outlook for demand for our products and the impact on our business and our overall financial performance. Our EMEA reporting
unit and our Indesit, Hotpoint* and Maytag trademarks continue to be at risk and none of our other reporting units or indefinite-lived intangible assets are at risk for future impairment.
For additional information, see Note 1 to the Consolidated Condensed Financial Statements.
FINANCIAL CONDITION AND LIQUIDITY
Background
Our objective is to finance our business through operating cash flow and the appropriate mix of long-term and short-term debt. By diversifying the maturity structure, we avoid concentrations of debt, reducing liquidity risk. We have varying needs for short-term working capital financing as a result of the nature of our business. We regularly review our capital structure and liquidity priorities, which include funding the business through capital and engineering spending to support innovation and productivity initiatives, funding our pension plan and term debt liabilities, providing return to shareholders, and funding potential acquisitions.
Our short-term potential uses of liquidity include funding our business operations, ongoing capital spending, restructuring activities, payments of short and long-term debt and returns to shareholders. We alsocurrently have $573 million ofno long-term debt maturing in the next twelve months, and are currently evaluating our options in connection with this maturing debt, which may include repayment through refinancing, free cash flow generation, or cash on hand.
At June 30, 2019, we have $2,157 million of notes payable which consist of short-term borrowings payable to banks and commercial paper, which are generally used to fund working capital requirements. For additional information, see Note 7 to the Consolidated Condensed Financial Statements.months.
We monitor the credit ratings and market indicators of credit risk of our lending, depository, derivative counterparty banks, and customers regularly, and take certain actions to manage credit risk. We diversify our deposits and investments in short-term cash equivalents to limit the concentration of exposure by counterparty.
At June 30, 2019,
COVID-19 pandemic
The COVID-19 pandemic has resulted in significant uncertainty in the macroeconomic environment and disruptions in global financial markets. We believe we had cash or cash equivalents greater than 1% of our consolidated assetshave a strong financial position and the liquidity required to withstand economic uncertainty during this volatile period in China and Brazil, which represented 2.2% and 1.4%, respectively. In addition, we did not have any third-party accounts receivable greater than 1% of our consolidated assets in any single country outsideconsideration of the United States,following:
Solid investment grade credit rating
No bond maturities for the remainder of 2020; $300 million due in June 2021
Ample buffers in our financial covenants to withstand additional debt or reduction to equity
$2.8 billion of cash at March 31, 2020
$1.3 billion remaining availability in the revolving long-term credit facility
$0.2 billion availability in other committed credit facilities
Boosted liquidity with the exceptionsincremental revolving 364-Day Credit Agreement of Italy, which represented 1.1%. We continue to monitor general financial instability$500 million in April 2020
Targeted working capital management
Focused cost takeout
Cash and uncertainty globally.cash equivalents
The Company had cash and cash equivalents of approximately $1.2$2.8 billion at June 30, 2019,March 31, 2020, of which substantially allthe majority was held by subsidiaries in foreign countries.countries with the remainder held in the United States. For each of its foreign subsidiaries, the Company makes an assertion regarding the amount of earnings intended for permanent reinvestment, with the balance available to be repatriated to the United States. The cash held by foreign subsidiaries for permanent reinvestment is generally used to finance the subsidiaries' operational activities and expected future foreign investments. Our intent is to permanently reinvest these funds outside of the United States and our current plans do not demonstrate a need to repatriate the cash to fund our U.S. operations. However, if these funds were repatriated, we would be required to accrue and pay applicable United States taxes (if any) and withholding taxes payable to various countries. It is not practicalpracticable to estimate the amount of the deferred tax liability associated with the repatriation of cash due to the complexity of its hypothetical calculation.
*Whirlpool ownership of the Hotpoint brand in EMEA and Asia Pacific regions is not affiliated with the Hotpoint brand sold in the Americas.
At March 31, 2020, we had cash or cash equivalents greater than 1% of our consolidated assets in the United States, China, Brazil and Switzerland, which represented 7.2%, 1.9%, 1.6% and 1.1%, respectively. In addition, we did not have any third-party accounts receivable greater than 1% of our consolidated assets in any single country outside of the United States. We continue to monitor general financial instability and uncertainty globally.
Revolving credit facility and other committed credit facilities
The Company maintains a $3.5 billion revolving credit facility, under which we borrowed approximately $2.2 billion during the three-months ended March 31, 2020. A portion of the proceeds from the borrowing were used to fund commercial paper repayment and the remainder is being held on the balance sheet as cash and may be used to fund additional commercial paper repayment, working capital, and for other general corporate purposes.
We were in compliance with both our debt to capitalization ratio and interest coverage ratio under the revolving credit facility as of March 31, 2020. We are closely monitoring our ability to meet these covenants in future periods and expect to continue to be in compliance.
At March 31, 2020, the Company also has approximately $200 million of additional availability from facilities in Brazil and India.
Notes payable
Notes payable consists of short-term borrowings payable to banks and commercial paper, which are generally used to fund working capital requirements. At March 31, 2020, we have $2,392 million of notes payable which includes the current portion of the outstanding amount under the revolving credit facility which is expected to be repaid in the next twelve months. For additional information, see Note 6 to the Consolidated Condensed Financial Statements.
Trade customers
We continue to review customer conditions globally. In light of the COVID-19 pandemic, there is a heightened risk of trade customer financial restructuring or insolvency situations and increases in our accounts receivable balances with these trade customers. While there was not an adverse effect from these events during the three months ended March 31, 2020, nor do we have immediate visibility into those situations materializing in the immediate future, we continue to monitor these situations and take appropriate risk mitigation steps in light of the current environment.
At June 30, 2019,March 31, 2020, we had 280272 million Brazilian reais (approximately $73 million)$52 million at March 31, 2020) in short and long-term receivables due to us from Maquina de Vendas S.A. In 2018, as part of their extrajudicial recovery plan, we agreed to receive payment of our outstanding receivable, plus interest, over eight years under a tiered payment schedule. At June 30, 2019,March 31, 2020, we have 129127 million Brazilian reais (approximately $34 million)$25 million at March 31, 2020) of insurance against this credit risk through policies purchased from high-quality underwriters. After consideration of insurance and the allowance for expected credit losses, we do not expect this matter to have a material impact on financial results in future periods.
In the past, when faced with a potential volume reduction from any one particular segment of our trade distribution network, we generally have been able to offset such declines through increased sales throughout our broad distribution network.
For additional information on guarantees, see Note 8 to the Consolidated Condensed Financial Statements.
Embraco Sale Transaction
On April 24, 2018, we and certain of our subsidiaries entered into a purchase agreement with Nidec Corporation, a leading manufacturer of electric motors incorporated under the laws of Japan, to sell our Embraco business unit (the "Transaction").
On June 26, 2019, Whirlpool and Nidec received the European Commission's final approval of the Transaction, and the parties closed the Transaction on July 1, 2019. At closing, pursuant to the purchase agreement and a subsequent agreement memorializing the purchase price adjustment, the Company received $1.08 billion, with final purchase price amounts subject to customary post-closing working capital and indebtedness adjustments. Whirlpool has agreed to retain certain liabilities relating to tax, environmental, labor and products following closing of the Transaction.
For additional information on the Transaction, see Note 167 to the Consolidated Condensed Financial Statements.
Share Repurchase Program
For additional information about our share repurchase program, see Note 1211 to the Consolidated Condensed Financial Statements.
Sources and Uses of Cash
The following table summarizes the net increase (decrease) in cash, cash equivalents and restricted cash for the periods presented:
| | | | | Six Months Ended June 30, | | Three Months Ended March 31, |
| Millions of dollars | | 2019 | | 2018 | | 2020 | | 2019 |
| Cash provided by (used in): | | | | | | | | |
| Operating activities | | $ | (821 | ) | | $ | (584 | ) | | $ | (814 | ) | | $ | (895 | ) |
| Investing activities | | (195 | ) | | (109 | ) | | (56 | ) | | (86 | ) |
| Financing activities | | 678 |
| | 569 |
| | 1,893 |
| | 627 |
|
| Effect of exchange rate changes | | 9 |
| | (42 | ) | | (138 | ) | | 11 |
|
| Net change in cash, cash equivalents and restricted cash | | $ | (329 | ) | | $ | (166 | ) | | $ | 885 |
| | $ | (343 | ) |
Cash Flows from Operating Activities
Cash used in operating activities during the sixthree months ended June 30, 2019 increasedMarch 31, 2020 decreased compared to the same period in 2018,2019, which primarily reflects the planned FCA settlement paymentimpact of changes in working capital, including sales volume and temporarily higher working capital.credit management activities, levels of seasonal inventory build and the divestiture of the Embraco compressor business.
The timing of cash flows from operations varies significantly throughout the year primarily due to changes in production levels, sales patterns, promotional programs, funding requirements, credit management, as well as receivable and payment terms. Depending on the timing of cash flows, the location of cash balances, as well as the liquidity requirements of each country, external sources of funding are used to support working capital requirements.
Cash Flows from Investing Activities
Cash used in investing activities during the sixthree months ended June 30, 2019 increasedMarch 31, 2020 decreased compared to the same period in 2018,2019, which primarily reflects cash proceeds related to held-to-maturity securitiesfrom a real estate sale-leaseback transaction (approximately $60$23 million) in 2018..
Cash Flows from Financing Activities
Cash provided by financing activities during the sixthree months ended June 30, 2019March 31, 2020 increased compared to the same period in 2018,2019, which primarily reflects higher repaymentsthe following:
Proceeds from borrowings under our revolving credit facility of $2.2 billion offset by lower commercial paper borrowings (increase of approximately $1.1 billion);
Repayments of long-term debt includes the repayment of the €500 million (approximately $570$565 million), lower proceeds senior notes in March 2020 and both the repayment of $250 million senior notes and €600 million (approximately $673 million) Whirlpool EMEA Finance Term Loan in the prior period (decrease of approximately $370 million);
Proceeds from borrowings of short-termlong-term debt includes the €500 million (approximately $540 million) senior notes debt offering in February 2020 and long-term debtthe $700 million senior notes offering in the prior period (decrease of approximately $280$150 million) ; and lower
Higher stock repurchases under our share repurchase program due to the 2018 modified Dutch auction tender offer (decrease(increase of approximately $950$70 million).
Dividends paid in financing activities during the sixthree months ended June 30, 2019March 31, 2020 was comparable to the same period in 2018.
Financing Arrangements
The Company had total committed credit facilities of approximately $3.6$3.7 billion at June 30, 2019.March 31, 2020. The facilities are geographically diverse and reflect the Company's growing global operations. The Company believes these facilities are sufficient to support its global operations. operations and, together with other liquidity tools, to navigate through the macroeconomic uncertainty related to the COVID-19 pandemic. We had $1.4 billion and €700 million (approximately
$770 million) outstanding under the committed credit facilities at March 31, 2020. We had no borrowings outstanding under the committed credit facilities at June 30, 2019 or December 31, 2018.
We anticipate amending the Amended Long-Term Facility in the near term to increase borrowing capacity and extend its duration.2019.
For additional information about our financing arrangements, see Note 76 to the Consolidated Condensed Financial Statements.
Embraco Sale Transaction
On April 24, 2018, we and certain of our subsidiaries entered into a purchase agreement with Nidec Corporation, a leading manufacturer of electric motors incorporated under the laws of Japan, to sell our Embraco business unit (the "Transaction").
On June 26, 2019, Whirlpool and Nidec received the European Commission's final approval of the Transaction, and the parties closed the Transaction on July 1, 2019. At closing, pursuant to the purchase agreement and a subsequent agreement memorializing the purchase price adjustment, the Company received $1.1 billion inclusive of anticipated cash on hand at the time of closing, with final purchase price amounts subject to working capital and other customary post-closing adjustments. Whirlpool has agreed to retain certain liabilities relating to tax, environmental, labor and products following closing of the Transaction.
On August 9, 2019, the Company repaid $1.0 billion pursuant to the Company's April 23, 2018 Term Loan Agreement by and among the Company, Citibank, N.A., as Administrative Agent, JPMorgan Chase Bank, N.A. as Syndication Agent, and certain other financial institutions, representing full repayment of amounts borrowed under the term loan. As previously disclosed, the Company agreed to repay this outstanding term loan amount with the net cash proceeds received from the sale of Embraco.
Dividends
In April 2019,2020, our Board of Directors approveddeclared a 4.3% increase in our quarterly dividend of $1.20 per share on our common stock to $1.20 per share from $1.15 per share.stock.
Off-Balance Sheet Arrangements
In the ordinary course of business, we enter into agreements with financial institutions to issue bank guarantees, letters of credit, and surety bonds. These agreements are primarily associated with unresolved tax matters in Brazil, as is customary under local regulations, and other governmental obligations and debt agreements. At June 30, 2019,March 31, 2020, we had approximately $333$279 million outstanding under these agreements.
For additional information about our off-balance sheet arrangements, see Notes 76 and 87 to the Consolidated Condensed Financial Statements.
NON-GAAP FINANCIAL MEASURES
We supplement the reporting of our financial information determined under U.S. generally accepted accounting principles (GAAP) with certain non-GAAP financial measures, some of which we refer to as "ongoing" measures, including:
Earnings before interest and taxes (EBIT)
EBIT margin
Ongoing EBIT
Ongoing EBIT margin
Sales excluding foreign currency
Organic net sales
Free cash flow
Non-GAAP measures exclude items that may not be indicative of, or are unrelated to, results from our ongoing operations and provide a better baseline for analyzing trends in our underlying businesses. EBIT margin is calculated by dividing EBIT by net sales for 2019 and 2018.sales. Ongoing EBIT margin is calculated by dividing ongoing EBIT by net sales for 2019 and 2018.sales. Sales excluding foreign currency is calculated by translating the current period net sales, in functional currency, to U.S. dollars using
the prior-year period's exchange rate compared to the prior-year period net sales. Management believes that sales excluding foreign currency provides stockholders with a clearer basis to assess our results over time, excluding the impact of exchange rate fluctuations. Organic net sales is calculated by excluding the Embraco divestiture and foreign currency. Management believes that organic net sales provides stockholders with a clearer basis to assess our results over time, excluding the revenue impact from our divested compressor business and exchange rate fluctuations. We also disclose segment EBIT, which we define as operating profit less interest and sundry (income) expense and excluding restructuring costs, asset impairment charges and certain other items that management believes are not indicative of the region's ongoing performance, if any, as the financial metric used by the Company's Chief Operating Decision Maker to evaluate performance and allocate resources in accordance with ASC 280, Segment Reporting.
We believe that these non-GAAP measures provide meaningful information to assist investors and stockholders in understanding our financial results and assessing our prospects for future performance, and reflect an additional way of viewing aspects of our operations that, when viewed with our GAAP financial measures, provide a more complete understanding of our business. Because non-GAAP financial measures are not standardized, it may not be possible to compare these financial measures with other companies' non-GAAP financial measures having the same or similar names. These non-GAAP financial measures should not be considered in isolation or as a substitute for reported net
sales, net earnings available to Whirlpool, net earnings as a percentage of net sales and cash provided by (used in) operating activities, the most directly comparable GAAP financial measures. We strongly encourage investors and stockholders to review our financial statements and publicly-filed reports in their entirety and not to rely on any single financial measure.
Please refer to a reconciliation of these non-GAAP financial measures to the most directly comparable GAAP financial measures below.
|
| | | | | | | | | | | | | |
Ongoing Earnings Before Interest & Taxes (EBIT) Reconciliation: in millions
| Three Months Ended | | Six Months Ended |
| 2019 | 2018 | | 2019 | 2018 |
| Net earnings (loss) available to Whirlpool | $ | 67 |
| $ | (657 | ) | | $ | 538 |
| $ | (563 | ) |
| Net earnings available to noncontrolling interests | 5 |
| 18 |
| | 8 |
| 18 |
|
| Income tax expense (benefit) | 130 |
| 30 |
| | (2 | ) | 45 |
|
| Interest expense | 52 |
| 47 |
| | 103 |
| 89 |
|
| Earnings (loss) before interest & taxes | $ | 254 |
| $ | (562 | ) | | $ | 647 |
| $ | (411 | ) |
| Restructuring expense | 60 |
| 44 |
| | 86 |
| 188 |
|
| Divestiture related transition costs | 11 |
| — |
| | 17 |
| — |
|
| Brazil indirect tax credit | (53 | ) | — |
| | (180 | ) | — |
|
| Loss on disposal of businesses | 79 |
| — |
| | 79 |
| — |
|
| Legacy product warranty and liability expense | 12 |
| — |
| | 12 |
| — |
|
| French antitrust settlement | — |
| 114 |
| | — |
| 114 |
|
| Impairment of goodwill and other intangibles | — |
| 747 |
| | — |
| 747 |
|
| Ongoing EBIT | $ | 363 |
| $ | 343 |
| | $ | 661 |
| $ | 638 |
|
|
| | | | | | | | |
Total Whirlpool Organic Net Sales Reconciliation: in millions
| Three Months Ended March 31, | |
| 2020 | 2019 | Change |
| Net sales | $ | 4,325 |
| $ | 4,760 |
| (9.1 | )% |
| Less: Embraco net sales | — |
| (312 | ) | |
| Add-Back: currency | 108 |
| — |
| |
| Organic net sales | $ | 4,433 |
| $ | 4,448 |
| (0.3 | )% |
|
| | | | | | |
Free Cash Flow (FCF) Reconciliation: in millions | Six Months Ended |
| 2019 | 2018 |
| Cash used in operating activities | $ | (821 | ) | $ | (584 | ) |
| Capital expenditures | (197 | ) | (194 | ) |
| Proceeds from sale of assets and business | 5 |
| 27 |
|
Change in restricted cash (1) | 16 |
| 26 |
|
| Free cash flow | $ | (997 | ) | $ | (725 | ) |
| | | |
| Cash used in investing activities | $ | (195 | ) | $ | (109 | ) |
| Cash provided by financing activities | $ | 678 |
| $ | 569 |
|
|
| | | | | | | | |
Latin America Organic Net Sales Reconciliation: in millions
| Three Months Ended March 31, | |
| 2020 | 2019 | Change |
| Net sales | $ | 618 |
| $ | 875 |
| (29.4 | )% |
| Less: Embraco net sales | — |
| (312 | ) | |
| Add-Back: currency | 76 |
| — |
| |
| Organic net sales | $ | 694 |
| $ | 563 |
| 23.3 | % |
(1)For additional information regarding restricted cash, see Note 4 to the Consolidated Condensed Financial Statements.
|
| | | | | | |
Ongoing Earnings Before Interest & Taxes (EBIT) Reconciliation: in millions
| Three Months Ended |
| 2020 | 2019 |
Net earnings available to Whirlpool (1) | $ | 152 |
| $ | 471 |
|
| Net earnings (loss) available to noncontrolling interests | (5 | ) | 3 |
|
| Income tax expense (benefit) | 72 |
| (132 | ) |
| Interest expense | 42 |
| 51 |
|
| Earnings before interest & taxes | $ | 261 |
| $ | 393 |
|
| Restructuring expense | 5 |
| 26 |
|
| Divestiture related transition costs | — |
| 6 |
|
| Brazil indirect tax credit | — |
| (127 | ) |
Ongoing EBIT(2) | $ | 266 |
| $ | 298 |
|
| |
(1) | Net earnings margin is approximately 3.5% and 9.9% for the three months ended March 31, 2020 and 2019, respectively, and is calculated by dividing net earnings (loss) available to Whirlpool by consolidated net sales for the three months ended March 31, 2020 and March 31, 2019 of $4,325 and $4,760, respectively. |
| |
(2) | Ongoing EBIT margin is approximately 6.1% and 6.3% for the three months ended March 31, 2020 and 2019, respectively, and is calculated by dividing Ongoing EBIT by consolidated net sales for the three months ended March 31, 2020 and March 31, 2019 of $4,325 and $4,760, respectively. |
|
| | | | | | |
Free Cash Flow (FCF) Reconciliation: in millions | Three Months Ended |
| 2020 | 2019 |
| Cash used in operating activities | (814 | ) | $ | (895 | ) |
| Capital expenditures | (82 | ) | (85 | ) |
| Proceeds from sale of assets and business | 26 |
| 2 |
|
Change in restricted cash (1) | — |
| 9 |
|
| Free cash flow | $ | (870 | ) | $ | (969 | ) |
| | | |
| Cash used in investing activities | $ | (56 | ) | $ | (86 | ) |
| Cash provided by financing activities | 1,893 |
| 627 |
|
| |
(1) | For additional information regarding restricted cash, see Note 3 to the Consolidated Condensed Financial Statements. |
FORWARD-LOOKING PERSPECTIVE
Earnings per diluted share presented below areOn March 24, 2020, Whirlpool withdrew its previously announced 2020 guidance for net of tax, while each adjustment is presented on a pre-tax basis. The aggregate income tax impact of the taxable components of each adjustment is presented in the income tax impact line item at our anticipated 2019 full-year adjusted tax rate between 15%sales, GAAP and 20%. We currently estimateongoing (non-GAAP) earnings per diluted share, andongoing EBIT margin, regional industry demand for 2019 to be within the following ranges:
|
| | | |
| | 2019 |
| | Current Outlook |
| Estimated earnings per diluted share, for the year ending December 31, 2019 | $17.80 | — | $18.55 |
| Including: | | | |
| Restructuring expense | $(3.11) |
| Brazil indirect tax credit | 2.79 |
| Divestiture related transition costs | (0.49) |
| Loss on disposal of businesses | (1.23) |
| Legacy product warranty and liability expense | (0.19) |
| Gain on sale of business | 7.76 |
| Income tax impact | (0.97) |
| Normalized tax adjustment | (1.52) |
| | |
| Industry demand | |
| North America | (2)% | — | —% |
| EMEA | (1)% | — | 1% |
| Latin America | ~ 5% |
| Asia | 1% | — | 2% |
For the full-year 2019, we continue to expect to generate cash from operating activities of approximately $1.4 billion and free cash flow of approximately $800 million, including restructuring cash outlays of up to $200 million and capital expenditures of approximately $625 million.
The table below reconciles projected 2019outlook, cash provided by operating activities determined in accordance with GAAP toand free cash flow a non-GAAP measure. Management believes that free cash flow provides stockholders with a relevant measure of liquidity and a useful basis for assessing Whirlpool's abilitydue to fund its activities and obligations. There are limitations to using non-GAAP financial measures, includinguncertainty around the difficulty associated with comparing companies that use similarly named non-GAAP measures whose calculations may differ from our calculations. We define free cash flow as cash provided by operating activities less capital expenditures and including proceeds from the sale of assets/businesses, and changes in restricted cash. The 2019 free cash flow outlook excludes the net proceeds from the salebusiness impact of the Embraco business. COVID-19 pandemic.
The
changeCompany expects COVID-19 driven demand disruptions and production impacts to continue to negatively affect results throughout 2020. We have taken aggressive cost reduction and cash protection actions to mitigate this impact as previously described in
restricted cash relatesthe Overview. However, the ultimate impact to
the private placement funds paid by Whirlpool to acquire majority controlour financial condition and results of
Whirlpool China (formerly Hefei Sanyo) in 2014 and operations depends on a number of factors which are used to fund capital and technical resources to enhance Whirlpool China's research and development and working capital,inherently unpredictable that could have a material adverse effect as required by the terms of the Hefei Sanyo acquisition completeddescribed in October 2014. For additional information regarding non-GAAP financial measures, see the Non-GAAP Financial Measures section of this Management's Discussion and Analysis. |
| | | |
| 2019 |
Millions of dollars | Current Outlook |
Cash provided by operating activities (1)Part II, Item 1A. Risk Factors.
| ~ 1,425 |
Capital expenditures, proceeds from sale of assets/businesses and changes in restricted cash | (625) |
Free cash flow | ~ 800 |
(1)Financial guidance on a GAAP basis for cash provided by (used in) financing activities and cash provided by (used in) investing activities has not been provided because in order to prepare any such estimate or projection, the company would need to rely on market factors and certain other conditions and assumptions that are outside of its control.The projections above are based on many estimates and are inherently subject to change based on future decisions made by management and the Board of Directors of Whirlpool, and significant economic, competitive and other uncertainties and contingencies.
OTHER MATTERS
For additional information regarding certain of our loss contingencies/litigation, see Note 87 to the Consolidated Condensed Financial Statements.
Grenfell Tower
On June 23, 2017, London's Metropolitan Police Service released a statement that it had identified a Hotpoint–branded refrigerator as the initial source of the Grenfell Tower fire in West London. U.K. authorities are conducting investigations, including regarding the cause and spread of the fire. The model in question was manufactured by Indesit Company between 2006 and 2009, prior to Whirlpool's acquisition of Indesit in 2014. We are fully cooperating with the investigating authorities. Whirlpool has been named as a defendant in a product liability suit related to this matter, which suit is currently pending in Pennsylvania federal court. As these matters are ongoing, we cannot speculate on
their eventual outcomes or potential impact on our financial statements; accordingly, we have not recorded any significant charges in 20182019 or the six months ended June 30, 2019.2020. Additional claims may be filed related to this incident.
Antidumping and Safeguard Petitions
As previously reported, Whirlpool filed petitions in 2011 and 2015 alleging that Samsung, LG and Electrolux violated U.S. and international trade laws by dumping washers into the U.S. Those petitions resulted in orders imposing antidumping duties on certain washers imported from South Korea, Mexico, and China, and countervailing duties on certain washers from South Korea. These orders could be subject to administrative reviews and possible appeals. In March 2019, the order covering certain washers from Mexico was extended for an additional five years, while the order covering certain washers from South Korea was revoked.
Whirlpool also filed a safeguard petition in May 2017 to address our concerns that Samsung and LG are evading U.S. trade laws by moving production from countries covered by antidumping orders. A safeguard remedy went into effect in February 2018, implementing tariffs on finished washers and certain covered parts for three years. During the secondthird year of the remedy, beginning February 7, 2019,2020, the remedy imposes an 18%a 16% tariff on the first 1.2 million large residential washing machines imported into the United States ("under tariff") and a 45%40% tariff on such imports in excess of 1.2 million, and also imposes a 45%40% tariff on washer tub, drum, and cabinet imports in excess of 70,00090,000 units. TheIn January 2020, the President modified the safeguard order to allocate the 1.2 million under tariff rates on washers and covered parts will decline slightlyby quarter during the third year of remedy (300,000 washing machines per quarter), beginning in February 2020. The President maintains discretion to modify the remedy. The safeguard remedy is subject to an interim review byWe cannot speculate on the International Trade Commission during 2019.modification's impact, which will depend on Samsung and LG's U.S. production capabilities and import plans.
U.S. Tariffs and Global Economy
The current domestic and international political environment, including existing and potential changes to U.S. policies related to global trade and tariffs, have resulted in uncertainty surrounding the future state of the global economy. The impact of previously-announced U.S. tariffs was a component of increased raw material costs during the quarter ended June 30, 2019.2019 and 2020. We expect these and other tariffs to impact material and freight costs in future quarters, which could require us to modify our current business practices and could have a material adverse effect on our financial statements in any particular reporting period.
Post-Retirement Benefit LitigationBrexit
For additional information regarding post-retirement benefit litigation, see Note 9In 2016, the UK held a referendum, the outcome of which was an expressed public desire to exit the European Union (“Brexit”), which has resulted in greater uncertainty related to the Consolidated Condensed Financial Statements.free movement of goods, services, people and capital between the UK and the EU. On January 31, 2020, the UK officially exited the European Union and entered into a transition period to negotiate the final terms of Brexit. Many potential future impacts of Brexit remain unclear and could adversely impact certain areas of our business, including, but not limited to, an increase in duties and delays in the delivery of products, and adverse impacts to our suppliers and financing institutions. In order to mitigate the risks associated with Brexit, we are preparing for potential adverse impacts by collaborating across Company functions and working with external partners to develop and revise the necessary contingency plans.
|
| |
| ITEM 3. | QUANTITATIVE AND QUALITATIVE DISCLOSURES ABOUT MARKET RISK |
There have been no material changes to our exposures to market risk since December 31, 2018.2019.
|
| |
| ITEM 4. | CONTROLS AND PROCEDURES |
(a)Evaluation of disclosure controls and procedures
Prior to filing this report, we completed an evaluation under the supervision and with the participation of our management, including our Chief Executive Officer and Chief Financial Officer, of the effectiveness of the design and operation of our disclosure controls and procedures (as defined in Rule 13a-15(e) of the Securities Exchange Act of 1934) as of June 30, 2019.March 31, 2020. Based on this evaluation, our Chief Executive Officer and Chief Financial Officer concluded that our disclosure controls and procedures were effective at the reasonable assurance level as of June 30, 2019.March 31, 2020.
(b)Changes in internal control over financial reporting
There were no changes in our internal control over financial reporting that occurred during the most recent quarter that have materially affected, or are reasonably likely to materially affect, our internal control over financial reporting.
|
|
| PART II. OTHER INFORMATION |
Information with respect to legal proceedings can be found under the heading "Commitments and Contingencies" in Note 87 to the Consolidated Condensed Financial Statements contained in Part I, Item 1 of this report.
There have been no material changes in our risk factors from those disclosed in Part I, Item 1A to our Annual Report on Form 10-K for the fiscal year ended December 31, 2018.2019, other than as set forth below.
Our financial condition and results of operations have been and are expected to continue to be adversely affected by the recent COVID-19 outbreak.
We are closely monitoring the impact of the global COVID-19 pandemic on all aspects of our operations and regions, including the effect on our consumers, employees, trade customers, suppliers and distribution channels. The pandemic has created significant business disruption and economic uncertainty which has adversely impacted our manufacturing operations, supply chain, distribution channels and consumer demand for our products. The adverse impact is expected to continue in future periods and may materially affect our financial statements in future periods.
The impacts of the pandemic include, but are not limited to, the following:
Production shutdowns, in individual or collective groups of factories in impacted countries, or production slowdowns due to social distancing guidelines or issues with absenteeism, which have and could in the future result in increased costs and decreased efficiency, and which could impact our ability to respond to rapid changes in demand;
Lack of availability of component materials in our supply chain and an increase in raw material and component costs;
Recent and potential future reductions in trade customer sales volume as a result of reduced consumer confidence and discretionary spending, potential trade customer financial restructuring or insolvency, and increases in accounts receivable balances with our trade customer base;
Potential future impairment in value of our tangible or intangible assets could be recorded as a result of weaker economic conditions;
Significant disruption of global financial markets, which could have a negative impact on our ability to access capital in the future, and which has, together with operational impacts noted above, necessitated certain recent liquidity creation and preservation actions as a precautionary measure;
Fluctuations in forecasted earnings before tax and corresponding volatility in our effective tax rate;
Uncertainty with respect to the application of recently enacted economic stimulus legislation in the U.S. and abroad, including uncertainty regarding impacts to our current global tax positions and future tax planning;
Operational risk, including but not limited to cybersecurity risks, as a result of extended salaried workforce remote work arrangements, and operational delays as a result of recent and potential future salaried employee furlough and collective vacation actions in certain countries, and restrictions on employee travel;
Operational disruption if key employees terminate their employment or become ill, as well as diversion of our management team's attention from non-COVID-19 related matters; and
Potential delays in resolving pending legal matters as a result of court, administrative and other closures in many of our regions.
Many of these impacts may not be covered by our existing insurance coverages. In addition, we cannot predict the impact that COVID-19 will have on our trade customers, suppliers, consumers, and each of their financial conditions;
however, any material effect on these parties could adversely impact us. The impact of COVID-19 may also exacerbate other risks discussed in Item 1A. Risk Factors in our Annual Report on Form 10-K for the year ended December 31, 2019, any of which could have a material adverse effect on our financial statements.
|
| |
| ITEM 2. | UNREGISTERED SALES OF EQUITY SECURITIES AND USE OF PROCEEDS |
On July 25, 2017, our Board of Directors authorized a share repurchase program of up to $2 billion. During the sixthree months ended June 30, 2019,March 31, 2020, we repurchased 360,326902,000 shares under this share repurchase program at an aggregate price of approximately $50121 million. At June 30, 2019March 31, 2020, there were approximately $750531 million in remaining funds authorized under this program.
The following table summarizes repurchases of Whirlpool's common stock in the three months ended June 30, 2019:March 31, 2020: |
| | | | | | | | | | | |
| Period (Millions of dollars, except number and price per share) | Total Number of Shares Purchased | Average Price Paid per Share | Total Number of Shares Purchased as Part of Publicly Announced Plans or Programs | Approximate Dollar Value of Shares that May Yet Be Purchased Under the Plans |
| April 1, 2019 through April 30, 2019 | — |
| $ | — |
| — |
| $ | 750 |
|
| May 1, 2019 through May 31, 2019 | — |
| $ | — |
| — |
| $ | 750 |
|
| June 1, 2019 through June 30, 2019 | — |
| $ | — |
| $ | — |
| $ | 750 |
|
| Total | — |
| $ | — |
| — |
| |
|
| | | | | | | | | | |
| Period (Millions of dollars, except number and price per share) | Total Number of Shares Purchased | Average Price Paid per Share | Total Number of Shares Purchased as Part of Publicly Announced Plans or Programs | Approximate Dollar Value of Shares that May Yet Be Purchased Under the Plans |
| January 1, 2020 through January 31, 2020 | 21,000 |
| $ | 155.41 |
| 21,000 |
| $ | 648 |
|
| February 1, 2020 through February 28, 2020 | 404,000 |
| $ | 148.42 |
| 404,000 |
| $ | 588 |
|
| March 1, 2020 through March 31, 2020 | 477,000 |
| $ | 120.97 |
| 477,000 |
| $ | 531 |
|
| Total | 902,000 |
| $ | 134.06 |
| 902,000 |
| |
Share repurchases are made from time to time on the open market as conditions warrant. These programs doGiven the current level of uncertainty surrounding the COVID-19 pandemic, we've decided to temporarily suspend our share repurchase program to protect liquidity in the current environment. The program does not obligate us to repurchase any of our shares and they haveit has no expiration date.
|
| |
| ITEM 3. | DEFAULTS UPON SENIOR SECURITIES |
None.
|
| |
| ITEM 4. | MINE SAFETY DISCLOSURES |
Not applicable.
None.
|
| |
Exhibit 2.1*4.1 | |
| |
| Exhibit 4.2 | |
| |
| Exhibit 10.1 | |
| | |
| Exhibit 31.1 | |
| | |
| Exhibit 31.2 | |
| | |
| Exhibit 32.1 | |
| | |
101.INS101.INS* | XBRL Instance Document - the instance document does not appear in the Interactive Data File because its XBRL tags are embedded within the Inline XBRL document |
| | |
101.SCH101.SCH* | Inline XBRL Taxonomy Extension Schema Document |
| | |
101.CAL101.CAL* | Inline XBRL Taxonomy Extension Calculation Linkbase Document |
| | |
101.LAB101.DEF* | Inline XBRL Taxonomy Extension Definition Linkbase Document |
| |
| 101.LAB* | Inline XBRL Taxonomy Extension Label Linkbase Document |
| | |
101.PRE101.PRE* | Inline XBRL Taxonomy Extension Presentation Linkbase Document |
| | |
101.DEFExhibit 104 | Cover Page Interactive Data File (formatted as Inline XBRL Taxonomy Extension Definition Linkbase Documentand contained in Exhibit 101) |
* Schedules (or similar attachments) to the Amendment to Purchase Agreement have been omitted from this filing pursuant to Item 601(a)(5) of Regulation S-K. The Company will furnish supplementally copies of such omitted schedules (or similar attachments) to the Securities and Exchange Commission upon request.
SIGNATURES
Pursuant to the requirements of the Securities Exchange Act of 1934, the Registrant has duly caused this report to be signed on its behalf by the undersigned, thereunto duly authorized.
|
| | | |
| | | | WHIRLPOOL CORPORATION |
| | | | (Registrant) |
| | By: | | /s/ JAMES W. PETERS |
| | Name: | | James W. Peters |
| | Title: | | Executive Vice President and Chief Financial Officer |
| | Date: | | July 23, 2019May 1, 2020 |