UNITED STATES SECURITIES AND EXCHANGE COMMISSION
WASHINGTON, D.C. 20549
________________________________________________________
FORM 10-Q
________________________________________________________
| | | | | | | | |
| ☒ | | QUARTERLY REPORT PURSUANT TO SECTION 13 OR 15(d) OF THE SECURITIES EXCHANGE ACT OF 1934 |
For the quarterly period ended June 30, 2023March 31, 2024
OR
| | | | | | | | |
| ☐ | | TRANSITION REPORT PURSUANT TO SECTION 13 OR 15(d) OF THE SECURITIES EXCHANGE ACT OF 1934 |
Commission file number 1-3932
WHIRLPOOL CORPORATION
(Exact name of registrant as specified in its charter)
| | | | | | | | | | | |
| Delaware | | 38-1490038 |
| (State of Incorporation) | | (I.R.S. Employer Identification No.) |
| | | |
| 2000 North M-63 | | |
| Benton Harbor, | Michigan | | 49022-2692 |
| (Address of principal executive offices) | | (Zip Code) |
Registrant's telephone number, including area code (269) 923-5000
Securities registered pursuant to Section 12(b) of the Act:
| | | | | | | | | | | | | | | | | | | | |
| Title of each class | | Trading symbol(s) | | Name of each exchange on which registered |
| Common stock, par value $1.00 per share | | WHR | | Chicago Stock Exchange | and | New York Stock Exchange |
Indicate by check mark whether the registrant (1) has filed all reports required to be filed by Section 13 or 15(d) of the Securities Exchange Act of 1934 during the preceding 12 months (or for such shorter period that the registrant was required to file such reports), and (2) has been subject to such filing requirements for the past 90 days. Yes ☒ No ☐
Indicate by check mark whether the registrant has submitted electronically every Interactive Data File required to be submitted pursuant to Rule 405 of Regulation S-T (§232.405 of this chapter) during the preceding 12 months (or for such shorter period that the registrant was required to submit such files). Yes ☒ No ☐
Indicate by check mark whether the registrant is a large accelerated filer, an accelerated filer, a non-accelerated filer, a smaller reporting company, or an emerging growth company. See the definitions of "large accelerated filer," "accelerated filer," "smaller reporting company," and "emerging growth company" in Rule 12b-2 of the Exchange Act.
| | | | | | | | | | | |
| Large accelerated filer | ☒ | Accelerated filer | ☐ |
| Non-accelerated filer | ☐ | Smaller reporting company | ☐ |
| | Emerging growth company | ☐ |
If an emerging growth company, indicate by check mark if the registrant has elected not to use the extended transition period for complying with any new or revised financial accounting standards provided pursuant to Section 13(a) of the Exchange Act. ☐
Indicate by check mark whether the registrant is a shell company (as defined in Rule 12b-2 of the Exchange Act). Yes ☐ No ☒
Number of shares outstanding of each of the issuer's classes of common stock, as of the latest practicable date:
| | | | | | | | |
| Class of common stock | | Shares outstanding at July 21, 2023April 19, 2024 |
| Common stock, par value $1.00 per share | | 54,817,77254,635,670 |
WHIRLPOOL CORPORATION
QUARTERLY REPORT ON FORM 10-Q
Three and Six Months Ended June 30, 2023March 31, 2024
TABLE OF CONTENTS
| | | | | | | | |
| | | PAGE |
| PART I | |
| Item 1. | | |
| | |
| | |
| | |
| | |
| Item 2. | | |
| Item 3. | | |
| Item 4. | | |
| | |
| |
| Item 1. | | |
| Item 1A. | | |
| Item 2. | | |
| Item 3. | | |
| Item 4. | | |
| Item 5. | | |
| Item 6. | | |
| | |
| |
FORWARD-LOOKING STATEMENTS
The Private Securities Litigation Reform Act of 1995 provides a safe harbor for forward-looking statements made by us or on our behalf. Certain statements contained in this quarterly report, including those within the forward-looking perspective section within the Management's Discussion and Analysis section, and other written and oral statements made from time to time by us or on our behalf do not relate strictly to historical or current facts and may contain forward-looking statements that reflect our current views with respect to future events and financial performance. As such, they are considered "forward-looking statements" which provide current expectations or forecasts of future events. Such statements can be identified by the use of terminology such as "may," "could," "will," "should," "possible," "plan," "predict," "forecast," "potential," "anticipate," "estimate," "expect," "project," "intend," "believe," "may impact," "on track," "guarantee," "seek," and the negative of these words and words and terms of similar substance. Our forward-looking statements generally relate to our growth strategies, financial results, product development, and sales efforts. These forward-looking statements should be considered with the understanding that such statements involve a variety of risks and uncertainties, known and unknown, and may be affected by inaccurate assumptions. Consequently, no forward-looking statement can be guaranteed and actual results may vary materially.
This document contains forward-looking statements about Whirlpool Corporation and its consolidated subsidiaries ("Whirlpool") that speak only as of this date. Whirlpool disclaims any obligation to update these statements. Forward-looking statements in this document may include, but are not limited to, statements regarding future financial results, long-term value creation goals, restructuring expectations, productivity, raw material prices and related costs, supply chain, transaction-related closing and synergiesportfolio transformation expectations, asset impairment, litigation, ESG efforts, debt repayment expectations, and the impact of COVID-19 and the Russia/Ukraine, conflictIsrael and Red Sea conflicts on our operations. Many risks, contingencies and uncertainties could cause actual results to differ materially from Whirlpool's forward-looking statements. Among these factors are: (1) intense competition in the home appliance industry, reflecting the impact of both new and established global competitors, including Asian and European manufacturers, and the impact of the changing retail environment, including direct-to-consumer sales; (2) Whirlpool's ability to maintain or increase sales to significant trade customers; (3) Whirlpool's ability to maintain its reputation and brand image; (4) the ability of Whirlpool to achieve its business objectives and leverage its global operating platform, and accelerate the rate of innovation; (5) Whirlpool’s ability to understand consumer preferences and successfully develop new products; (6) Whirlpool's ability to obtain and protect intellectual property rights; (7) acquisition, divestiture, and investment-related risks, including risks associated with our past acquisitions; (8) the ability of suppliers of critical parts, components and manufacturing equipment to deliver sufficient quantities to Whirlpool in a timely and cost-effective manner; (9) COVID-19 pandemic-relatedpandemic, other public health emergency-related business disruptions and economic uncertainty; (10) Whirlpool's ability to navigate risks associated with our presence in emerging markets; (11) risks related to our international operations, including changes in foreign regulations;operations; (12) Whirlpool's ability to respond to unanticipated social, political and/or economic events; (13) information technology system failures, data security breaches, data privacy compliance, network disruptions, and cybersecurity attacks; (14) product liability and product recall costs; (15) ourWhirlpool's ability to attract, develop and retain executives and other qualified employees; (16) the impact of labor relations; (17) fluctuations in the cost of key materials (including steel, resins, base metals) and components and the ability of Whirlpool to offset cost increases; (18) Whirlpool's ability to manage foreign currency fluctuations; (19) impacts from goodwill impairment and related charges; (20) triggering events or circumstances impacting the carrying value of our long-lived assets; (21) inventory and other asset risk; (22) health care cost trends, regulatory changes and variations between results and estimates that could increase future funding obligations for pension and postretirement benefit plans; (23) litigation, tax, and legal compliance risk and costs, especially if materially different from the amount we expect to incur or have accrued for, and any disruptions caused by the same;costs; (24) the effects and costs of governmental investigations or related actions by third parties; (25) changes in the legal and regulatory environment including environmental, health and safety regulations, data privacy, and taxes and tariffs; (26) Whirlpool's ability to respond to the impact of climate change and climate change regulation; and (27) the uncertain global economy and changes in economic conditions which affect demand for our products.conditions.
We undertake no obligation to update any forward-looking statement, and investors are advised to review disclosures in our filings with the SEC. It is not possible to foresee or identify all factors that could cause actual results to differ from expected or historic results. Therefore, investors should not consider the foregoing factors to be an exhaustive statement of all risks, uncertainties, or factors that could potentially cause actual results to differ from forward-looking statements.
Additional information concerning these and other factors can be found in the "Risk Factors" section of our Annual Report on Form 10-K, as updated in Part II, Item 1A of our Quarterly Reports on Form 10-Q.
Unless otherwise indicated, the terms "Whirlpool," "the Company," "we," "us," and "our" refer to Whirlpool Corporation and its consolidated subsidiaries.
Website Disclosure
We routinely post important information for investors on our website, whirlpoolcorp.com, in the "Investors" section. We also intend to update the Hot Topics Q&A portion of this webpage as a means of disclosing material, non-public information and for complying with our disclosure obligations under Regulation FD. Accordingly, investors should monitor the "Investors" section of our website, in addition to following our press releases, SEC filings, public conference calls, presentations and webcasts. The information contained on, or that may be accessed through, our webpage is not incorporated by reference into, and is not a part of, this document.
| | |
| PART I. FINANCIAL INFORMATION |
| | | | | |
| ITEM 1. | FINANCIAL STATEMENTS |
TABLE OF CONTENTS
| | | | | |
| PAGE |
| FINANCIAL STATEMENTS AND SUPPLEMENTARY DATA | |
| |
| |
| |
| | PAGE |
| | PAGE | | | | PAGE |
| NOTES TO THE CONSOLIDATED CONDENSED FINANCIAL STATEMENTS (UNAUDITED) | NOTES TO THE CONSOLIDATED CONDENSED FINANCIAL STATEMENTS (UNAUDITED) | NOTES TO THE CONSOLIDATED CONDENSED FINANCIAL STATEMENTS (UNAUDITED) |
| 1. | 1. | | | 1. | | |
| 2. | 2. | | | 2. | | |
| | 3. | |
| 3. | |
| 3. | 3. | | | | |
| 4. | 4. | | | 4. | | |
| 5. | 5. | | | 5. | | |
| 6. | 6. | | | 6. | | |
| 7. | 7. | | | 7. | | |
| 8. | 8. | | | 8. | | |
| 9. | 9. | | | 9. | | |
| 10. | 10. | | | 10. | | |
| | 11. | 11. | | | 11. | | |
| 12. | 12. | | | 12. | | |
| 13. | 13. | | | 13. | | |
| 14. | 14. | | | 14. | | |
| |
WHIRLPOOL CORPORATION
CONSOLIDATED CONDENSED STATEMENTS OF COMPREHENSIVE INCOME (LOSS) (UNAUDITED)
FOR THE PERIODS ENDED JUNE 30MARCH 31
(Millions of dollars, except per share data)
| | Three Months Ended | |
| Three Months Ended | |
| Three Months Ended | |
| 2024 | |
| 2024 | |
| 2024 | |
| | Three Months Ended | | Six Months Ended |
| Net sales | |
| | 2023 | | 2022 | | 2023 | | 2022 |
| Net sales | |
| | Net sales | Net sales | $ | 4,792 | | | $ | 5,097 | | | $ | 9,441 | | | $ | 10,017 | |
| Expenses | Expenses | |
| Expenses | |
| Expenses | |
| Cost of products sold | |
| Cost of products sold | |
| Cost of products sold | Cost of products sold | 3,976 | | | 4,200 | | | 7,862 | | | 8,269 | |
| Gross margin | Gross margin | 816 | | | 897 | | | 1,579 | | | 1,748 | |
| Gross margin | |
| Gross margin | |
| Selling, general and administrative | |
| Selling, general and administrative | |
| Selling, general and administrative | Selling, general and administrative | 476 | | | 461 | | | 963 | | | 837 | |
| Intangible amortization | Intangible amortization | 10 | | | 7 | | | 21 | | | 16 | |
| Intangible amortization | |
| Intangible amortization | |
| Restructuring costs | Restructuring costs | 9 | | | 5 | | | 9 | | | 10 | |
| Impairment of goodwill and other intangibles | — | | | 384 | | | — | | | 384 | |
| (Gain) loss on sale and disposal of businesses | 18 | | | 346 | | | 240 | | | 346 | |
| Operating profit (loss) | 303 | | | (306) | | | 346 | | | 155 | |
| Restructuring costs | |
| Restructuring costs | |
| | Loss (gain) on sale and disposal of businesses | |
| | Loss (gain) on sale and disposal of businesses | |
| | Loss (gain) on sale and disposal of businesses | |
| Operating (loss) profit | |
| Operating (loss) profit | |
| Operating (loss) profit | |
| Other (income) expense | |
| Other (income) expense | |
| Other (income) expense | Other (income) expense | | | |
| Interest and sundry (income) expense | Interest and sundry (income) expense | 10 | | | (19) | | | 87 | | | (26) | |
| Interest and sundry (income) expense | |
| Interest and sundry (income) expense | |
| Interest expense | |
| Interest expense | |
| Interest expense | Interest expense | 89 | | | 45 | | | 164 | | | 86 | |
| Earnings (loss) before income taxes | Earnings (loss) before income taxes | 204 | | | (332) | | | 95 | | | 95 | |
| Earnings (loss) before income taxes | |
| Earnings (loss) before income taxes | |
| Income tax expense (benefit) | |
| Income tax expense (benefit) | |
| Income tax expense (benefit) | Income tax expense (benefit) | 114 | | | 37 | | | 182 | | | 143 | |
| Equity method investment income (loss), net of tax | Equity method investment income (loss), net of tax | (3) | | | 1 | | | (2) | | | (4) | |
| Equity method investment income (loss), net of tax | |
| Equity method investment income (loss), net of tax | |
| Net earnings (loss) | |
| Net earnings (loss) | |
| Net earnings (loss) | Net earnings (loss) | 87 | | | (368) | | | (89) | | | (52) | |
| Less: Net earnings (loss) available to noncontrolling interests | Less: Net earnings (loss) available to noncontrolling interests | 2 | | | 3 | | | 5 | | | 6 | |
| Less: Net earnings (loss) available to noncontrolling interests | |
| Less: Net earnings (loss) available to noncontrolling interests | |
| Net earnings (loss) available to Whirlpool | |
| Net earnings (loss) available to Whirlpool | |
| Net earnings (loss) available to Whirlpool | Net earnings (loss) available to Whirlpool | $ | 85 | | | $ | (371) | | | $ | (94) | | | $ | (58) | |
| Per share of common stock | Per share of common stock | | | |
| Basic net earnings available to Whirlpool | $ | 1.56 | | | $ | (6.62) | | | $ | (1.71) | | | $ | (1.00) | |
| Diluted net earnings available to Whirlpool | $ | 1.55 | | | $ | (6.62) | | | $ | (1.71) | | | $ | (1.00) | |
| Per share of common stock | |
| Per share of common stock | |
| Basic net earnings (loss) available to Whirlpool | |
| Basic net earnings (loss) available to Whirlpool | |
| Basic net earnings (loss) available to Whirlpool | |
| Diluted net earnings (loss) available to Whirlpool | |
| Diluted net earnings (loss) available to Whirlpool | |
| Diluted net earnings (loss) available to Whirlpool | |
| Dividends declared | |
| Dividends declared | |
| Dividends declared | Dividends declared | $ | 1.75 | | | $ | 1.75 | | | $ | 3.50 | | | $ | 3.50 | |
| Weighted-average shares outstanding (in millions) | Weighted-average shares outstanding (in millions) | | | |
| Weighted-average shares outstanding (in millions) | |
| Weighted-average shares outstanding (in millions) | |
| Basic | Basic | 55.0 | | 56.0 | | 54.9 | | 57.1 |
| Basic | |
| Basic | |
| Diluted | |
| Diluted | |
| Diluted | Diluted | 55.2 | | 56.0 | | 54.9 | | 57.1 |
| | Comprehensive income (loss) | Comprehensive income (loss) | $ | 48 | | | $ | (159) | | | $ | (129) | | | $ | 215 | |
| | Comprehensive income (loss) | |
| | Comprehensive income (loss) | |
The accompanying notes are an integral part of these Consolidated Condensed Financial Statements.
WHIRLPOOL CORPORATION
CONSOLIDATED CONDENSED BALANCE SHEETS
(Millions of dollars, except share data)
| | (Unaudited) | |
| June 30, 2023 | | December 31, 2022 |
| (Unaudited) | |
| March 31, 2024 | |
| March 31, 2024 | |
| March 31, 2024 | | | December 31, 2023 |
| | Assets | Assets | |
| Assets | |
| Assets | |
| Current assets | |
| Current assets | |
| Current assets | Current assets | |
| Cash and cash equivalents | Cash and cash equivalents | $ | 1,309 | | | $ | 1,958 | |
| Accounts receivable, net of allowance of $52 and $49, respectively | 1,679 | | | 1,555 | |
| Cash and cash equivalents | |
| Cash and cash equivalents | |
| Accounts receivable, net of allowance of $49 and $47, respectively | |
| Inventories | Inventories | 2,484 | | | 2,089 | |
| | Prepaid and other current assets | Prepaid and other current assets | 578 | | | 653 | |
| Prepaid and other current assets | |
| Prepaid and other current assets | |
| Assets held for sale | Assets held for sale | 144 | | | 139 | |
| Total current assets | Total current assets | 6,194 | | | 6,394 | |
| Property, net of accumulated depreciation of $5,146 and $4,808, respectively | 2,134 | | | 2,102 | |
| Property, net of accumulated depreciation of $5,322 and $5,259, respectively | |
| Right of use assets | Right of use assets | 687 | | | 691 | |
| Goodwill | Goodwill | 3,331 | | | 3,314 | |
| Other intangibles, net of accumulated amortization of $420 and $400, respectively | 3,144 | | | 3,164 | |
| Other intangibles, net of accumulated amortization of $449 and $440, respectively | |
| Deferred income taxes | Deferred income taxes | 1,094 | | | 1,063 | |
| Other noncurrent assets | Other noncurrent assets | 397 | | | 396 | |
| Total assets | Total assets | $ | 16,981 | | | $ | 17,124 | |
| Liabilities and stockholders' equity | Liabilities and stockholders' equity | |
| Current liabilities | Current liabilities | |
| Current liabilities | |
| Current liabilities | |
| Accounts payable | |
| Accounts payable | |
| Accounts payable | Accounts payable | $ | 3,520 | | | $ | 3,376 | |
| Accrued expenses | Accrued expenses | 444 | | | 481 | |
| Accrued advertising and promotions | Accrued advertising and promotions | 457 | | | 623 | |
| Employee compensation | Employee compensation | 211 | | | 159 | |
| Notes payable | Notes payable | 27 | | | 4 | |
| Current maturities of long-term debt | Current maturities of long-term debt | 1,300 | | | 248 | |
| Other current liabilities | Other current liabilities | 660 | | | 550 | |
| Liabilities held for sale | Liabilities held for sale | 468 | | | 490 | |
| Total current liabilities | Total current liabilities | 7,087 | | | 5,931 | |
| Noncurrent liabilities | Noncurrent liabilities | |
| Long-term debt | Long-term debt | 6,393 | | | 7,363 | |
| Long-term debt | |
| Long-term debt | |
| Pension benefits | Pension benefits | 149 | | | 184 | |
| Postretirement benefits | Postretirement benefits | 91 | | | 96 | |
| Lease liabilities | Lease liabilities | 584 | | | 584 | |
| Other noncurrent liabilities | Other noncurrent liabilities | 484 | | | 460 | |
| Total noncurrent liabilities | Total noncurrent liabilities | 7,701 | | | 8,687 | |
| Stockholders' equity | Stockholders' equity | |
| Common stock, $1 par value, 250 million shares authorized, 114 million and 114 million shares issued, respectively, and 55 million and 54 million shares outstanding, respectively | 114 | | | 114 | |
Common stock, $1 par value, 250 million shares authorized, 114 million and 114 million shares issued, respectively, and 55 million and 55 million shares outstanding, respectively | |
Common stock, $1 par value, 250 million shares authorized, 114 million and 114 million shares issued, respectively, and 55 million and 55 million shares outstanding, respectively | |
Common stock, $1 par value, 250 million shares authorized, 114 million and 114 million shares issued, respectively, and 55 million and 55 million shares outstanding, respectively | |
| Additional paid-in capital | Additional paid-in capital | 3,070 | | | 3,061 | |
| Retained earnings | Retained earnings | 7,974 | | | 8,261 | |
| Accumulated other comprehensive loss | Accumulated other comprehensive loss | (2,130) | | | (2,090) | |
| Treasury stock, 60 million and 60 million shares, respectively | Treasury stock, 60 million and 60 million shares, respectively | (7,010) | | | (7,010) | |
| Total Whirlpool stockholders' equity | Total Whirlpool stockholders' equity | 2,018 | | | 2,336 | |
| Noncontrolling interests | Noncontrolling interests | 175 | | | 170 | |
| Total stockholders' equity | Total stockholders' equity | 2,193 | | | 2,506 | |
| Total liabilities and stockholders' equity | Total liabilities and stockholders' equity | $ | 16,981 | | | $ | 17,124 | |
The accompanying notes are an integral part of these Consolidated Condensed Financial Statements.
WHIRLPOOL CORPORATION
CONSOLIDATED CONDENSED STATEMENTS OF CASH FLOWS (UNAUDITED)
FOR THE PERIODS ENDED JUNE 30MARCH 31
(Millions of dollars)
| | Six Months Ended |
| 2023 | | 2022 |
| Three Months Ended | | | Three Months Ended |
| 2024 | | | 2024 | | 2023 |
| | Operating activities | Operating activities | |
| Operating activities | |
| Operating activities | |
| Net earnings (loss) | |
| Net earnings (loss) | |
| Net earnings (loss) | Net earnings (loss) | $ | (89) | | | $ | (52) | |
| Adjustments to reconcile net earnings to cash provided by (used in) operating activities: | Adjustments to reconcile net earnings to cash provided by (used in) operating activities: | |
| Depreciation and amortization | Depreciation and amortization | 178 | | | 226 | |
| Impairment of goodwill and other intangibles | — | | | 384 | |
| (Gain) loss on sale and disposal of businesses | 240 | | | 346 | |
| Depreciation and amortization | |
| Depreciation and amortization | |
| | Loss (gain) on sale and disposal of businesses | |
| Loss (gain) on sale and disposal of businesses | |
| Loss (gain) on sale and disposal of businesses | |
| | Changes in assets and liabilities: | Changes in assets and liabilities: | |
| Changes in assets and liabilities: | |
| Changes in assets and liabilities: | |
| Accounts receivable | |
| Accounts receivable | |
| Accounts receivable | Accounts receivable | (161) | | | 262 | |
| Inventories | Inventories | (384) | | | (626) | |
| Accounts payable | Accounts payable | (146) | | | (241) | |
| Accrued advertising and promotions | Accrued advertising and promotions | (182) | | | (177) | |
| Accrued expenses and current liabilities | Accrued expenses and current liabilities | 50 | | | (94) | |
| Taxes deferred and payable, net | Taxes deferred and payable, net | 113 | | | 14 | |
| Accrued pension and postretirement benefits | Accrued pension and postretirement benefits | (29) | | | (53) | |
| Employee compensation | Employee compensation | 47 | | | (261) | |
| Other | Other | (7) | | | 92 | |
| Cash provided by (used in) operating activities | Cash provided by (used in) operating activities | (370) | | | (180) | |
| Investing activities | Investing activities | |
| Capital expenditures | Capital expenditures | (217) | | | (217) | |
| Proceeds from sale of assets and businesses | 9 | | | 75 | |
| Capital expenditures | |
| Capital expenditures | |
| | Acquisition of businesses, net of cash acquired | |
| | Acquisition of businesses, net of cash acquired | |
| | Acquisition of businesses, net of cash acquired | Acquisition of businesses, net of cash acquired | (14) | | | — | |
| | Cash provided by (used in) investing activities | Cash provided by (used in) investing activities | (222) | | | (142) | |
| | Cash provided by (used in) investing activities | |
| | Cash provided by (used in) investing activities | |
| Financing activities | Financing activities | |
| Net proceeds from borrowings of long-term debt | |
| Net proceeds from borrowings of long-term debt | |
| Net proceeds from borrowings of long-term debt | Net proceeds from borrowings of long-term debt | 303 | | | 300 | |
| Net proceeds (repayments) of long-term debt | Net proceeds (repayments) of long-term debt | (250) | | | (300) | |
| Net proceeds (repayments) from short-term borrowings | Net proceeds (repayments) from short-term borrowings | 28 | | | 9 | |
| Dividends paid | Dividends paid | (193) | | | (200) | |
| Repurchase of common stock | Repurchase of common stock | — | | | (833) | |
| | Sale of minority interest in subsidiary | |
| Common stock issued | Common stock issued | 4 | | | 2 | |
| Other | Other | (2) | | | — | |
| Cash provided by (used in) financing activities | Cash provided by (used in) financing activities | (110) | | | (1,022) | |
| Effect of exchange rate changes on cash, cash equivalents and restricted cash | Effect of exchange rate changes on cash, cash equivalents and restricted cash | 55 | | | 12 | |
| Less: decrease in cash classified as held for sale | (2) | | | (70) | |
| Less: change in cash classified as held for sale | |
| Increase (decrease) in cash, cash equivalents and restricted cash | Increase (decrease) in cash, cash equivalents and restricted cash | (649) | | | (1,402) | |
| Cash, cash equivalents and restricted cash at beginning of year | Cash, cash equivalents and restricted cash at beginning of year | 1,958 | | | 3,044 | |
| Cash, cash equivalents and restricted cash at end of period | Cash, cash equivalents and restricted cash at end of period | $ | 1,309 | | | $ | 1,642 | |
The accompanying notes are an integral part of these Consolidated Condensed Financial Statements.
NOTES TO THE CONSOLIDATED CONDENSED FINANCIAL STATEMENTS (UNAUDITED)
(1) BASIS OF PRESENTATION
General Information
The accompanying unaudited Consolidated Condensed Financial Statements have been prepared in accordance with accounting principles generally accepted in the United States of America ("GAAP") for interim financial information, and with the instructions to Form 10-Q and Article 10 of Regulation S-X. Accordingly, they do not include all information or footnotes required by U.S. GAAP for complete financial statements. As a result, this Form 10-Q should be read in conjunction with the Consolidated Financial Statements and accompanying Notes in our Form 10-K for the year ended December 31, 2022.2023.
Management believes that the accompanying Consolidated Condensed Financial Statements reflect all adjustments, including normal recurring items, considered necessary for a fair presentation of the interim periods.
We are required to make estimates and assumptions that affect the amounts reported in the Consolidated Condensed Financial Statements and accompanying Notes. Actual results could differ materially from those estimates.
We have eliminated all material intercompany transactions in our Consolidated Condensed Financial Statements. We do not consolidate the financial statements of any company in which we have an ownership interest of 50% or less, unless that company is deemed to be a variable interest entity ("VIE") of which we are the primary beneficiary. VIEs are consolidated when the company is the primary beneficiary of these entities and has the ability to directly impact the activities of these entities.
Risks and Uncertainties
Macroeconomic volatility, as well as ongoing international conflicts, continues to impact countries across the world, and the duration and severity of the effects are currently unknown. During the first quarter, of 2022, Russia commenced a military invasion of Ukraine, and the ensuing conflict has created disruption in the EMEA region and around the world. While we continued experiencing some of this disruption duringfrom these conflicts, primarily in Europe due to the quarter, theconflict in Ukraine. The duration and severity of the effects on our business and the global economy are inherently unpredictable. We continue to closely monitor the ongoing conflict which could materially impact our financial results in the future. We have some sales and distribution operations in Ukraine,Ukraine; however, the revenues and net assets are not material to our EMEAMajor Domestic Appliances Europe ("MDA Europe") operating segment and consolidated results.
On June 27, 2022, our subsidiary Whirlpool EMEA SpA entered into a share purchase agreement with Arçelik A.Ş. (“Arcelik”) to sell our Russia Our Ukraine business to Arcelik for contingent consideration. The salewas part of the Russia businessmajor domestic appliance European transaction, which was completed on August 31, 2022. Furthermore, macroeconomic volatility continuesApril 1, 2024. For additional information, see Note 14 to impact countries across the world, and the duration and severity of the effects are currently unknown.Consolidated Condensed Financial Statements.
The Consolidated Condensed Financial Statements presented herein reflect estimates and assumptions made by management at June 30, 2023. March 31, 2024.
These estimates and assumptions affect, among other things, the Company’s goodwill, long-lived asset and indefinite-lived intangible asset valuation; inventory valuation; assessment of the annual effective tax rate; valuation of deferred income taxes and income tax contingencies; and the allowance for expected credit losses and bad debt. Events and changes in circumstances arising after JulyApril 25, 2023,2024, including those resulting from the impacts of macroeconomic volatility, as well as the ongoing conflict in Ukraine,international conflicts, will be reflected in management’s estimates for future periods.
Goodwill and Indefinite-lived Intangible Assets
We continue to monitor the significant global economic uncertainty to assess the outlook for demand for our products and the impact on our business and our overall financial performance. Our JennAirMaytag and MaytagInSinkErator trademarks continue to be at risk at June 30, 2023.March 31, 2024. The goodwill in our reporting units or other indefinite-lived intangible assets are not presently at risk for future impairment.
The potential impact of demand disruptions, production impacts or supply constraints along with a number of other factors could negatively effectaffect revenues for the JennAirMaytag and MaytagInSinkErator trademarks, but we remain committed to the strategic actions necessary to realize the long-term forecasted revenues and profitability of these trademarks.
A lack of recovery or further deterioration in market conditions, a sustained trend of
weaker than expected financial performance for our JennAir orMaytag Maytagand InSinkErator trademarks, among other factors, as a result of the macroeconomic factors or other unforeseen events could result in an impairment charge in future periods which could have a material adverse effect on our financial statements.
As a result of our analysis, and in consideration of the totality of events and circumstances, there were no triggering events of impairment identified during the secondfirst quarter of 2023.2024.
Income taxes
Under U.S. GAAP, the Company calculates its quarterly tax provision based on an estimated effective tax rate for the year and then adjusts this amount by certain discrete items each quarter. Potential changing and volatile macro-economic conditions could cause fluctuations in forecasted earnings before income taxes. As such, the Company's effective tax rate could be subject to volatility as forecasted earnings before income taxes are impacted by events which cannot be predicted.
In addition, potential future economic deterioration brought on by the pandemic, ongoing conflict in Ukraine,international conflicts, and related sanctions or other factors, such as potential sales of businesses and changes innew tax rateslegislation may negatively impact the realizability and/or valuation of certain deferred tax assets.
Other Accounting Matters
Synthetic Lease Arrangements
We have a number of synthetic lease arrangements with financial institutions for non-core properties. The leases contain provisions for options to purchase, extend the original term for additional periods or return the property. As of June 30, 2023March 31, 2024 and December 31, 2022,2023, these arrangements include residual value guarantees of up to approximately $334$378 million and $334$378 million, respectively, that could potentially come due in future periods. We do not believe it is probable that any material amounts will be owed under these guarantees. Therefore, no material amounts related to the residual value guarantees are included in the lease payments used to measure the right-of-use assets and lease liabilities.
The majority of these leases are classified as operating leases. We have assessed the reasonable certainty of these provisions to determine the appropriate lease term. The leases were measured using our incremental borrowing rate and are included in our right of use assets and lease liabilities in the Consolidated Condensed Balance Sheets. Rental payments are calculated at the applicable reference rate plus a margin.an additional amount based on the terms of the lease. The impact to the Consolidated Condensed Balance Sheets and Consolidated Condensed Statements of Comprehensive Income (Loss) is nominal.
Sale-leaseback Transaction
In the first quarter of 2022, the Company sold and leased back a group of non-core properties for net proceeds of approximately $52 million. The initial total annual rent for the properties is approximately $2 million per year over an initial 15 year lease term and is subject to annual rent increases. Under the terms of the lease agreement, the Company is responsible for all taxes, insurance and utilities and is required to adequately maintain the properties for the lease term. The Company has two sequential 5-year renewal options.
The transaction met the requirements for sale-leaseback accounting. Accordingly, the Company recorded the sale of the properties, which resulted in a gain of approximately $44 million ($36 million, net of tax) recorded in selling, general and administrative expense in the Consolidated Condensed Statements of Comprehensive Income (Loss). The related land and buildings were removed from property, plant and equipment, net and the appropriate right-of-use asset and lease liabilities of approximately $32 million were recorded in the Consolidated Condensed Balance Sheets.
Supply Chain Financing Arrangements
The Company has ongoing agreements globally with various third-parties to provide certain suppliers the opportunity to sell receivables due from us to participating financial institutions at the sole discretion of both the suppliers and the financial institutions. Under these agreements, the average payment terms range from 120 to 180 days and are based on industry standards and best practices within each of our global regions. Whirlpool has no assets pledged as part of our global programs.
We have no economic interest in the sale of these receivables and no direct financial relationship with the financial institutions concerning these services. For certain arrangements, the Company will guarantee receivables due from wholly-owned subsidiaries. Our obligations to suppliers, including amounts due and scheduled payment terms, are not impacted. All outstanding balances under these programs are recorded in accounts payable on our Consolidated Condensed Balance Sheets. Approximately $1.2 billion have been issued to participating financial institutions as of June 30,The following table summarizes the changes in outstanding obligations for the periods presented:
| | | | | |
| Millions of dollars | Outstanding Obligations |
| Confirmed obligations outstanding as of December 31, 2023 | $843 |
| Invoices confirmed during the period | 641 |
| Confirmed invoices paid during the period | (691) |
| Impact of foreign currency | (1) |
| Confirmed obligations outstanding as of March 31, 2024 | $792 |
Obligations outstanding and $1.1 billion as of December 31, 2022, respectively, of which $388 million and $368 million, respectively, ofactivities during the balance issued isperiod related to our European major domestic appliance business which was classifiedhave been excluded from the table above. The obligations outstanding amounted to $395 million and $393 million as held for sale in the fourth quarter of 2022.March 31, 2024 and December 31, 2023, respectively.
A downgrade in our credit rating or changes in the financial markets could limit the financial institutions’ willingness to commit funds to, and participate in, the programs. We do not believe such risk would have a material impact on our working capital or cash flows.
Equity Method Investments
Whirlpool holds an equity interest of 20% in Whirlpool (China) Co., Ltd. (Whirlpool China), an entity which was previously controlled by the Company. The following tables summarize balances and transactions with Whirlpool China and its subsidiaries during the periods presented.
| | Millions of dollars | Millions of dollars | | June 30, 2023 | | December 31, 2022 | Millions of dollars | | | March 31, 2024 | | December 31, 2023 |
| Other noncurrent assets | Other noncurrent assets | Carrying value of equity interest | | $ | 202 | | | $ | 201 | |
| Accounts payable | Accounts payable | Outstanding amounts due | | $ | 87 | | | $ | 75 | |
| | Millions of dollars | Millions of dollars | | Three Months Ended June 30, | Six Months Ended June 30, |
| | 2023 | | 2022 | 2023 | | 2022 |
| | 2024 | |
| | 2024 | |
| | 2024 | |
| Purchases from Whirlpool China | Purchases from Whirlpool China | | $ | 85 | | | $ | 112 | | $ | 144 | | | $ | 213 | |
| Purchases from Whirlpool China | |
| Purchases from Whirlpool China | |
The licensing revenue and outstanding accounts receivable from Whirlpool China and its subsidiaries are not material for the periods presented.
The market value of our 20% investment in Whirlpool China, based on the quoted market price, is $160$177 million as of June 30, 2023.March 31, 2024. Management has concluded that there are currently no indicators for an other-than-temporary impairment.
Related Party TransactionsParties
The Company has a controlling equity ownership of 87% in Elica PB India which is consolidated in Whirlpool Corporation's financial statements and is reported within our MDA Asia reportable segment. Elica PB India is a VIE for which the Company is the primary beneficiary. The carrying amount of customer relationships, which are included in Other intangible assets, net of accumulated amortization, amounts to $30$28 million as of June 30, 2023March 31, 2024 and $31$29 million as of December 31, 2022,2023, respectively. Other assets or liabilities of Elica PB India are not material to the Consolidated Condensed Financial Statements of the Company for the periods presented.
Both Whirlpool India and the non-controlling interest shareholders retain an option for Whirlpool India to purchase the remaining equity interest in Elica PB India for fair value, which could be material to the financial statements of the Company, depending on the performance of the business.
Adoption
Accounting Pronouncements Issued But Not Yet Effective
In November 2023, the FASB issued Update 2023-07, "Segment Reporting (Topic 280): Improvements to Reportable Segment Disclosures". This Update applies to all public entities that are required to report segment information in accordance with Topic 280. The amendments in this Update revise reportable segment disclosure requirements, primarily through enhanced disclosures about significant segment expenses. The amendments in this Update do not change how a public entity identifies its operating segments, aggregates those operating segments, or applies the quantitative thresholds to determine its reportable segments. The new standard is effective for fiscal years beginning after December 15, 2023, and interim periods within fiscal years beginning after December 15, 2024. Early adoption is permitted. The standard should be applied retrospectively to all prior periods presented in the financial statements. The Company is currently evaluating the impact of New Accounting Standardsadopting this new standard.
We adoptedIn December 2023, the followingFASB issued Update 2023-09, "Income Taxes (Topic 740): Improvements to Income Tax Disclosures". This Update applies to all entities that are subject to Topic 740. The amendments in this Update revise income tax disclosures primarily related to the rate reconciliation and income taxes paid information as well as the effectiveness of certain other income tax disclosures. The new standard asis effective for annual periods beginning after December 15, 2024. Early adoption is permitted. The standard should be applied on a prospective basis, but retrospective application is permitted. The Company is currently evaluating the impact of January 1, 2023:
| | | | | | | | |
Standard | | Effective Date |
2022-04 | Supplier Finance Programs (Subtopic 405-50): Disclosure of Supplier Finance Program Obligations | January 1, 2023 |
adopting this new standard.All other issued and not yet effective accounting standards are not relevant or material to the Company.
(2) REVENUE RECOGNITION
Disaggregation of Revenue
The following table presents our disaggregated revenues by revenue source. We sell products within all product categories in each operating segment. For additional information on the disaggregated revenues by geographic regions,operating segment, see Note 1213 to the Consolidated Condensed Financial Statements.
| | Three Months Ended June 30, | | Six Months Ended June 30, |
| Three Months Ended March 31, | |
| Three Months Ended March 31, | |
| Three Months Ended March 31, | |
| Millions of dollars | |
| Millions of dollars | |
| Millions of dollars | Millions of dollars | 2023 | | 2022 | | 2023 | | 2022 |
| Major product categories: | Major product categories: | |
| Major product categories: | |
| Major product categories: | |
| Laundry | |
| Laundry | |
| Laundry | Laundry | $ | 1,294 | | | $ | 1,287 | | | $ | 2,590 | | | $ | 2,620 | |
| Refrigeration | Refrigeration | 1,478 | | | 1,733 | | | 2,850 | | | 3,261 | |
| Refrigeration | |
| Refrigeration | |
| Cooking | |
| Cooking | |
| Cooking | Cooking | 1,101 | | | 1,247 | | | 2,193 | | | 2,528 | |
| Dishwashing | Dishwashing | 445 | | | 465 | | | 876 | | | 915 | |
| Dishwashing | |
| Dishwashing | |
| Total major product category net sales | |
| Total major product category net sales | |
| Total major product category net sales | Total major product category net sales | $ | 4,318 | | | $ | 4,732 | | | $ | 8,509 | | | $ | 9,324 | |
| Spare parts and warranties | Spare parts and warranties | 239 | | | 236 | | | 475 | | | 470 | |
| Spare parts and warranties | |
| Spare parts and warranties | |
| Other | |
| Other | |
| Other | Other | 235 | | | 129 | | | 457 | | | 223 | |
| Total net sales | Total net sales | $ | 4,792 | | | $ | 5,097 | | | $ | 9,441 | | | $ | 10,017 | |
| Total net sales | |
| Total net sales | |
Other revenue sources include primarily the revenues from the newly acquired InSinkErator business, subscription arrangements and licenses.
The impact to revenue related to prior period performance obligations is less than 1% of global consolidated revenues for the three and six months ended June 30, 2023.March 31, 2024.
Allowance for Expected Credit Losses and Bad Debt Expense
We estimate our expected credit losses and bad debt expense primarily by using an aging methodology and establish customer-specific reserves for higher risk trade customers. Our expected credit losses and bad debt expense are evaluated and controlled within each geographic region considering the unique credit risk specific to the country, marketplace and economic environment. We take into account past events, current conditions and reasonable and supportable forecasts in developing the reserve.
The following table summarizes our allowance for expected credit losses and bad debt expense by operating segment for the sixthree months ended June 30, 2023:March 31, 2024:
| | Millions of dollars | Millions of dollars | December 31, 2022 | | Charged to Earnings | Write-offs | Foreign Currency | Other (1) | June 30, 2023 |
| Millions of dollars | |
| Millions of dollars | | December 31, 2023 (1) | | | | Charged to Earnings | Write-offs | Foreign Currency | | March 31, 2024 |
| Accounts receivable allowance | Accounts receivable allowance | | | |
| North America | $ | 6 | | | $ | (1) | | $ | (1) | | $ | — | | $ | — | | $ | 4 | |
| EMEA | 2 | | | — | | — | | 1 | | (1) | | 2 | |
| Latin America | 38 | | | 3 | | (2) | | 4 | | — | | 43 | |
| Asia | 3 | | | — | | — | | — | | — | | 3 | |
| MDA North America | |
| MDA North America | |
| MDA North America | |
| MDA Latin America | |
| MDA Asia | |
| | SDA Global | |
| SDA Global | |
| SDA Global | |
| Consolidated | Consolidated | $ | 49 | | | $ | 2 | | $ | (3) | | $ | 5 | | $ | (1) | | $ | 52 | |
| Financing receivable allowance | Financing receivable allowance | | | |
| Latin America | $ | 27 | | | $ | — | | $ | — | | $ | 2 | | $ | — | | $ | 29 | |
| MDA Latin America | |
| MDA Latin America | |
| MDA Latin America | |
| | Consolidated | Consolidated | $ | 76 | | | $ | 2 | | $ | (3) | | $ | 7 | | $ | (1) | | $ | 81 | |
| | Consolidated | |
| | Consolidated | |
(1) Starting from the fourth quarter of 2022, accounts receivable allowance ofEffective January 1, 2024, we reorganized our European major domestic appliance business is transferredoperating segment structure. All prior period amounts have been reclassified to assets held for sale.conform with current period presentation. For additional information, see Note 13 to the Consolidated Condensed Financial Statements.
We recorded an immaterial amount of bad debt expense for the periods ended June 30, 2023 and December 31, 2022, respectively.
(3) INVENTORIES
The following table summarizes our inventories at June 30, 2023March 31, 2024 and December 31, 2022:2023:
| | Millions of dollars | Millions of dollars | | June 30, 2023 | | December 31, 2022 | Millions of dollars | | March 31, 2024 | | December 31, 2023 |
| | Finished products | Finished products | | $ | 1,940 | | | $ | 1,580 | |
| Finished products | |
| Finished products | |
| Raw materials and work in process | Raw materials and work in process | | 544 | | | 509 | |
| Total Inventories | Total Inventories | | $ | 2,484 | | | $ | 2,089 | |
(4) PROPERTY, PLANT AND EQUIPMENT
The following table summarizes our property, plant and equipment at June 30, 2023March 31, 2024 and December 31, 2022:2023:
| | Millions of dollars | Millions of dollars | | June 30, 2023 | | December 31, 2022 | Millions of dollars | | March 31, 2024 | | December 31, 2023 |
| Land | Land | | $ | 31 | | | $ | 32 | |
| Buildings | Buildings | | 875 | | | 862 | |
| Machinery and equipment | Machinery and equipment | | 6,374 | | | 6,016 | |
| Accumulated depreciation | Accumulated depreciation | | (5,146) | | | (4,808) | |
| Property, plant and equipment, net | Property, plant and equipment, net | | $ | 2,134 | | | $ | 2,102 | |
During the sixthree months ended June 30, 2023,March 31, 2024, we disposed of land, buildings, machinery and equipment with a net book value of $10$2 million, compared to $20$1 million in the same period of 2022.2023. The net gain on the disposals was not material for the sixthree months ended June 30, 2023. The net gain on the disposals of $56 million for the same period of 2022 was primarily driven by a sale-leaseback transaction in the first quarter of 2022.March 31, 2024 and 2023, respectively.
For additional information see Note 1 to the Consolidated Condensed Financial Statements.
(5) FINANCING ARRANGEMENTS
Debt Offering
On February 22, 2024, the Company entered into an Underwriting Agreement (the "Underwriting Agreement") with SMBC Nikko Securities America, Inc., BNP Paribas Securities Corp., ING Financial Markets LLC, Mizuho Securities USA LLC, Scotia Capital (USA) Inc. and SG Americas Securities, LLC, as representatives of the several underwriters named therein, relating to the offering by the Company of $300 million aggregate principal amount of 5.750% Senior Notes due 2034 (the "Notes"), in a public offering pursuant to a registration statement on Form S-3 (File No. 333-276169), and a preliminary prospectus supplement and prospectus
supplement related to the offering of the Notes, each as previously filed with the Securities and Exchange Commission (the "Commission"). On February 27, 2024, the Company closed its offering of the Notes. The Notes contain covenants that limit the Company's ability to incur certain liens or enter into certain sale and lease-back transactions. In addition, if we experience a specific kind of change of control, we are required to make an offer to purchase all of the notes at a purchase price of 101% of the principal amount thereof, plus accrued and unpaid interest. The Company used the net proceeds from the sale of the Notes, together with cash on hand, to repay, at maturity, all $300 million aggregate principal amount of the Company's 4.000% Notes due March 1, 2024.
On February 22, 2023, the Company completed its offering of $300 million aggregate principal amount of 5.5%5.500% Senior Notes due 2033 (the “2033 Notes”), in a public offering pursuant to a registration statement on Form S-3 (File No. 333-255372). The 2033 Notes were issued under an indenture (the “Indenture”), dated March 20, 2000, between the Company, as issuer, and U.S. Bank Trust Company, National Association (as successor to U.S. Bank, National Association and Citibank, N.A.), as trustee. The sale of the 2033 Notes was made pursuant to the terms of an Underwriting Agreement, dated February 14, 2023, with BNP Paribas Securities Corp., ING Financial Markets LLC, Mizuho Securities USA LLC, SMBC Nikko Securities America, Inc. and SG Americas Securities, LLC, as representatives of the several underwriters in connection with the offering and sales of the 2033 Notes. The 2033 Notes contain covenants that limit the Company's ability to incur certain liens or enter into certain sale and lease-back transactions. In addition, if we experience a specific kind of change of control, we are required to make an offer to purchase all of the notes at a purchase price of 101% of the principal amount thereof, plus accrued and unpaid interest. The Company used the net proceeds from the sale of the 2033 Notes to repay $250 million aggregate principal amount of 3.7%3.700% Notes which were paid on March 1, 2023, and for general corporate purposes.
On May 4, 2022, the Company completed its offering of $300 million in principal amount of 4.7% Senior Notes due 2032 (the “2032 Notes”), in a public offering pursuant to a registration statement on Form S-3 (File No. 333-255372). The 2032 Notes were issued under the Indenture. The sale of the 2032 Notes was made pursuant to the terms of an Underwriting Agreement, dated May 2, 2022, among the Company, as issuer, and BNP Paribas Securities Corp., Citigroup Global Markets Inc., Goldman Sachs & Co. LLC, Mizuho Securities USA LLC and Wells Fargo Securities, LLC, as representatives of the several underwriters in connection with the offering and sales of the 2032 Notes. The 2032 Notes contain covenants that limit the Company's ability to incur certain liens or enter into certain sale and lease-back transactions. In addition, if we experience a specific kind of change of control, we are required to make an offer to purchase all of the notes at a purchase price of
101% of the principal amount thereof, plus accrued and unpaid interest. The Company used the net proceeds from the sale of the 2032 Notes to redeem $300 million aggregate principal amount of 4.7% Notes which were paid on June 1, 2022.
Term Loan Agreement
On September 23, 2022, the Company entered into a Term Loan Agreement by and among the Company, Sumitomo Mitsui Banking Corporation (“SMBC”), as Administrative Agent and Syndication Agent and as lender, and certain other financial institutions as lenders. SMBC, BNP Paribas, ING Bank N.V., Dublin Branch, Mizuho Bank, Ltd., and Societe Generale acted as Joint Lead Arrangers and Syndication Agents; The Bank of Nova Scotia and Bank of China, Chicago Branch acted as Documentation Agents; and SMBC acted as Sole Bookrunner for the Term Loan Agreement. The Term Loan Agreement provides for an aggregate lender commitment of $2.5 billion. The Company utilized proceeds from the term loan facility on a delayed draw basis to fund a majority of the $3.0 billion purchase price consideration for the Company’s acquisition from Emerson Corporation (“Emerson”) of Emerson’s InSinkErator business, as set forth in the Asset and Stock Purchase Agreement between Whirlpool and Emerson dated as of August 7, 2022 (the “Acquisition Agreement”).
The outstanding amount for this term loan at March 31, 2024 is $2.0 billion, of which $500 million is classified in current liabilities on the Consolidated Condensed Balance Sheet. The term loan facility is divided into two tranches: a $1 billion tranche with a maturity date of April 30, 2024, of which $500 million was repaid in December 2023 and the remaining $500 million was repaid in April 2024; and a $1.5 billion tranche with a maturity date of October 31, 2025.
The interest and fee rates payable with respect to the term loan facility based on the Company's current debt rating are as follows: (1) the spread over secured overnight financing rate ("SOFR") for the 18-month tranche (fully repaid as of April 2024) is 0.75%0.975%; (2) the spread over SOFR for the 3-year tranche is 1.00%1.225%; (3) the spread over prime for both tranches is zero; and (4) the ticking fee for both tranches is 0.10%0.125%, as of the date hereof.
The Term Loan Agreement contains customary covenants and warranties including, among other things, a rolling twelve month interest coverage ratio required to be greater than or equal to 3.0 for each fiscal quarter. In addition, the covenants limit the Company's ability to (or to permit any subsidiaries to), subject to various exceptions and limitations: (i) merge with other companies; (ii) create liens on its property; and (iii) incur debt at the subsidiary level. We were in compliance with our interest coverage ratio under the term loan agreement as of June 30, 2023.March 31, 2024.
The outstanding amount for this term loan at June 30, 2023 was $2.5 billion of which approximately $1 billion is classified in current liabilities on the Consolidated Condensed Balance Sheet.
Credit Facilities
On May 3, 2022, the Company entered into a Fifth Amended and Restated Long-Term Credit Agreement (the “Amended Long-Term Facility”) by and among the Company, certain other borrowers, the lenders referred to therein, JPMorgan Chase Bank, N.A. as Administrative Agent, and Citibank, N.A., as Syndication Agent. BNP Paribas, Mizuho Bank, Ltd. and Wells Fargo Bank, National Association acted as Documentation Agents. JPMorgan Chase Bank, N.A., BNP Paribas Securities Corp., Citibank, N.A., Mizuho Bank, Ltd. and Wells Fargo Securities, LLC acted as Joint Lead Arrangers and Joint Bookrunners for the Amended Long-Term Facility. Consistent with the Company’s prior credit agreement, the Amended Long-Term Facility provides an aggregate borrowing capacity of $3.5 billion. The facility has a maturity date of May 3, 2027, unless earlier terminated.
The interest rate payable with respect to the Amended Long-Term Facility reflects a decrease of 0.125% in the interest rate margin from the Company’s prior credit facility, and is based on the Company’s current debt rating, Term SOFR (Secured Overnight Financing Rate) + 1.00%1.125% interest rate margin per annum (with a 0.10% SOFR spread adjustment) or the Alternate Base Rate + 0.00%0.125% per annum, at the Company’s election.
The Amended Long-Term Facility contains customary covenants and warranties, such as, among other things, a rolling four quarter interest coverage ratio required to be greater than or equal to 3.0 as of the end of each fiscal quarter. The Amended Long-Term Facility also includes limitations on the Company’s ability to (or to permit any subsidiaries to), subject to various exceptions and limitations: (i) merge with other companies; (ii) create liens on its property; and (iii) incur debt at the subsidiary level. We were in compliance with our interest coverage ratio under the Amended Long-Term Facility as of June 30, 2023.
In addition to the committed $3.5 billion Amended Long-Term Facility and the committed $2.5$2.0 billion term loan, we have committed credit facilities in Brazil and India. These committed credit facilities provide borrowings up to approximately $220$212 million at June 30, 2023March 31, 2024 and $204$218 million at December 31, 2022,2023, based on exchange rates then in effect, respectively. These committed credit facilities have maturities that run through 2025.
We had $2.5$2.0 billion and $2.0 billion drawn on the committed credit facilities (representing amounts outstanding on the term loan facility) at June 30, 2023March 31, 2024 and December 31, 2022,2023, respectively.
Notes Payable
Notes payable, which consist of short-term borrowings payable to banks or commercial paper, are generally used to fund working capital requirements. The fair value of our notes payable approximates the carrying amount due to the short maturity of these obligations.
The following table summarizes the carrying value of notes payable at June 30, 2023March 31, 2024 and December 31, 2022:2023:
| | Millions of dollars | Millions of dollars | | June 30, 2023 | | December 31, 2022 | Millions of dollars | | March 31, 2024 | | December 31, 2023 |
| | Commercial paper | |
| Short-term borrowings due to banks | Short-term borrowings due to banks | | 27 | | | 4 | |
| Total notes payable | Total notes payable | | $ | 27 | | | $ | 4 | |
Transfers and Servicing of Financial Assets
In an effort to manage economic and geographic trade customer risk, from time to time, the Company will transfer, primarily without recourse, accounts receivable balances of certain customers to financial institutions resulting in a nominal impact recorded in interest and sundry (income) expense. These transactions are accounted for as sales of the receivables resulting in the receivables being de-recognized from the Consolidated Condensed Balance Sheets. These transfers do not require continuing involvement from the Company.
Certain arrangements include servicing of transferred receivables by Whirlpool. The amount of cash proceeds received under these arrangements was $101 million for the six months ended June 30, 2023. No amounts were received under these arrangements for the six months ended June 30, 2022. Outstanding accounts receivable transferred under arrangements where the Company continues to service the transferred asset were $51$131 million as of June 30, 2023March 31, 2024 and $80$379 million as of December 31, 2022,2023, respectively. The amount of cash proceeds received under these arrangements was $131 million and $51 million for the three months ended March 31, 2024 and 2023, respectively.
(6) COMMITMENTS AND CONTINGENCIES
BEFIEX Credits and Other Brazil Tax Matters
In previous years, our Brazilian operations earned tax credits under the Brazilian government's export incentive program (BEFIEX). These credits reduced Brazilian federal excise taxes on domestic sales.
Our Brazilian operations have received tax assessments for income and social contribution taxes associated with certain monetized BEFIEX credits. We do not believe BEFIEX credits are subject to income or social contribution taxes. We believe these tax assessments are without merit and are vigorously defending our positions. We have not provided for income or social contribution taxes on these BEFIEX credits, and based on the opinions of tax and legal advisors, we have not accrued any amount related to these assessments at June 30, 2023.March 31, 2024. The total amount of outstanding tax assessments received for income and social contribution taxes relating to the BEFIEX credits, including interest and penalties, is approximately 2.22.3 billion Brazilian reais (approximately $458$461 million at June 30, 2023)March 31, 2024).
Relying on existing Brazilian legal precedent, in 2003 and 2004, we recognized tax credits in an aggregate amount of $26 million, adjusted for currency, on the purchase of raw materials used in production ("IPI tax credits"). The Brazilian tax authority subsequently challenged the recording of IPI tax credits. No such credits have been recognized since 2004. In 2009, we entered into a Brazilian government program ("IPI Amnesty") which provided extended payment terms and reduced penalties and interest to encourage taxpayers to resolve this and certain other disputed tax credit amounts. As permitted by the program, we elected to settle certain debts through the use of other existing tax credits and recorded charges of approximately $34 million in 2009 associated with these matters. In July 2012, the Brazilian revenue authority notified us that a portion of our proposed settlement was rejected and we received tax assessments of 279287 million Brazilian reais
(approximately (approximately $58 million at June 30, 2023)March 31, 2024), reflecting interest and penalties to date. We believe these tax assessments are without merit and we are vigorously defending our position. The government's assessment in this case relies heavily on its arguments regarding taxability of BEFIEX credits for certain years, which we are disputing in one of the BEFIEX government assessment cases cited in the prior paragraph. Because the IPI Amnesty case is moving faster than the BEFIEX taxability case, we could be required to pay the IPI Amnesty assessment before obtaining a final decision in the BEFIEX taxability case.
We have received tax assessments from the Brazilian federal tax authorities relating to amounts allegedly due regarding insurance taxes (PIS/COFINS) for tax credits recognized since 2007. These credits were recognized for inputs to certain manufacturing and other business processes. These assessments are being challenged at the administrative and judicial levels in Brazil. The total amount of outstanding tax assessments received for credits recognized for PIS/COFINS inputs is approximately $318338 million Brazilian reais (approximately $66$68 million at June 30, 2023)March 31, 2024). We believe these tax assessments are without merit and are vigorously defending our positions. Based on the opinion of our tax and legal advisors, we have not accrued any amount related to these assessments.
In addition to the BEFIEX, IPI tax credit and PIS/COFINS inputs matters noted above, other assessments issued by the Brazilian tax authorities related to indirect and income tax matters, and other matters, are at various stages of review in numerous administrative and judicial proceedings. We are vigorously defending our positions related to BEFIEX credits and other Brazil Tax Matters. The amounts related to these assessments will continue to be increased by monetary adjustments at the Selic rate, which is the benchmark rate set by the Brazilian Central Bank. In accordance with our accounting policies, we routinely assess these matters and, when necessary, record our best estimate of a loss. We believe these tax assessments are without merit and are vigorously defending our positions.
Litigation is inherently unpredictable and the conclusion of these matters may take many years to ultimately resolve. Amounts at issue in potential future litigation could increase as a result of interest and penalties in future periods. Accordingly, it is possible that an unfavorable outcome in these proceedings could have a material adverse effect on our financial statements in any particular reporting period.
Legacy EMEAMDA Europe Legal Matters
Competition Investigation
In 2013, the French Competition Authority ("FCA") commenced an investigation of appliance manufacturers and retailers in France, including Whirlpool and Indesit. The FCA investigation was split into two parts, and in December 2018, we finalized a settlement with the FCA on the first part of the investigation. The second part of the FCA investigation, which is focused primarily on manufacturer interactions with retailers, is ongoing. The Company has agreed to a preliminary settlement range with the FCA and has recorded a charge of approximately $69 million in the first half of 2023, including $41 million previously accrued in the first quarter of 2023. The Company expects the settlement amount to be finalized in the fourth quarterfirst half of 2023 or early 2024, and for payment to make paymentbe made to the FCA in 2024. The Company is fully cooperating with this investigation.
Although it is currently not possible to assess the impact, if any, that additional matters related to the FCA investigation may have on our financial statements, matters related to the FCA investigation could have a material adverse effect on our financial statements in any particular reporting period.
Trade Customer Insolvency
The Company was a former indirect minority shareholder of Alno AG, a longstanding trade customer that filed for insolvency protection in Germany. In 2020, we paid a settlement of €52.75 million (approximately $59 million at the time of payment) to resolve any potential claims the insolvency trustee might have against the Company. We have also resolved certain claims brought by a third party related to Alno's insolvency through a settlement which includes a full release of any and all claims by that third party, and accrued an immaterial incremental amount during the second quarter related to this resolution.
Latin America Tax Review
In the first quarter of 2023, we accrued an immaterial amount in our Consolidated Condensed Financial Statements related to prior-period Value Added Tax (VAT) remittances in our Latin America region. We resolved certain aspects of this matter in the second quarter of 2023 and the overall financial statement impact of such resolution was immaterial. We continue to review tax matters within the region for any potential additional impacts, if any; certain matters could have a material adverse effect on our financial statements in any particular reporting period.
Grenfell Tower
On June 23, 2017, London's Metropolitan Police Service released a statement that it had identified a Hotpoint–branded refrigerator as the initial source of the Grenfell Tower fire in West London. U.K. authorities are conducting investigations, including regarding the cause and spread of the fire. The model in question was manufactured by Indesit Company between 2006 and 2009, prior to Whirlpool's acquisition of Indesit in 2014. We are fully cooperating with the investigating authorities. Whirlpool was named as a defendant in a product liability suit in Pennsylvania federal court related to this matter. The federal court dismissed the case with prejudice in September 2020 and the dismissal was affirmed on appeal in July 2022. Plaintiffs filed a petition with the U.S. Supreme Court in January 2023 which was subsequently denied. In December 2020, lawsuits related to Grenfell Tower were filed in the U.K. against approximately 20 defendants, including Whirlpool Corporation and certain Whirlpool subsidiaries. In the fourth quarter of 2022, we accrued an immaterial amount related to these claims in our financial statements. Additional claims may be filed related to this incident.
Other LitigationLatin America Tax Review
See Note 11 for information onIn the first quarter of 2023, we accrued an immaterial amount in our Consolidated Condensed Financial Statements related to prior-period Value Added Tax (VAT) remittances in our Latin America region. We resolved certain U.S. income tax litigation. In addition, we are currently defending against two lawsuits that have been certified for treatment as class actionsaspects of this matter in U.S. federal court, relating to two top-load washing machine models. In December 2019, the court in onesecond quarter of these lawsuits entered summary judgment in Whirlpool's favor. That ruling remains subject to appeal,2023 and the other lawsuit is ongoing.overall financial statement impact of such resolution was immaterial. We believecontinue to review tax matters within the lawsuits are without merit and are vigorously defending them. Given the status of the proceedings, we cannot reasonably estimate a range of loss,region for any potential additional impacts, if any, at this time. The resolution of theseany; certain matters could have a material adverse effect on our financial statements in any particular reporting period.
Other Litigation
We are currently vigorously defending a number of other lawsuits related to the manufacture and sale of our products which include class action allegations, and may become involved in similar actions. These lawsuits allege claims which include negligence, breach of contract, breach of warranty, product liability and safety claims, false advertising, fraud, and violation of federal and state regulations, including consumer protection laws. In general, we do not have insurance coverage for class action lawsuits. We are also involved in various other legal actions arising in the normal course of business, for which insurance coverage may or may not be available depending on the nature of the action. We dispute the merits of these suits and actions, and intend to vigorously defend them. Management believes, based upon its current knowledge, after taking into consideration legal counsel's evaluation of such suits and actions, and after taking into account current litigation accruals, that the outcome of these matters currently pending against Whirlpool should not have a material adverse effect, if any, on our financial statements.
Product Warranty Reserves
Product warranty reserves are included in other current and other noncurrent liabilities in our Consolidated Condensed Balance Sheets. The following table summarizes the changes in total product warranty liability reserves for the periods presented:
| | | | | | | | | | | | | | |
| | Product Warranty |
| Millions of dollars | | 2023 | | 2022 |
Balance at January 1 (1) | | $ | 190 | | | $ | 286 | |
| Issuances/accruals during the period | | 109 | | | 119 | |
| Settlements made during the period/other | | (106) | | | (147) | |
| | | | |
| Balance at June 30 | | $ | 193 | | | $ | 258 | |
| | | | |
| Current portion | | $ | 129 | | | $ | 170 | |
| Non-current portion | | 64 | | | 88 | |
| Total | | $ | 193 | | | $ | 258 | |
| | | | | | | | | | | | | | |
| | Product Warranty |
| Millions of dollars | | 2024 | | 2023 |
Balance at January 1 (1) | | $ | 206 | | | $ | 190 | |
| Issuances/accruals during the period | | 72 | | | 58 |
| Settlements made during the period/other | | (80) | | | (56) | |
Liabilities classified to held for sale (1) | | 3 | | | — | |
| Balance at March 31 | | $ | 201 | | | $ | 192 | |
| Current portion | | $ | 128 | | | $ | 131 | |
| Non-current portion | | 73 | | | 61 | |
| Total | | $ | 201 | | | $ | 192 | |
| | | | |
| | | | |
| | | | |
| | | | |
| | | | |
| | | | |
(1) Starting from the fourth quarter of 2022Product, product warranty reserve, and subsequent movements of $59 millionthe reserve, of our European major domestic appliance business has been transferred to liabilities held for sale starting from the fourth quarter of 2022.sale.
In the normal course of business, we engage in investigations of potential quality and safety issues. As part of our ongoing effort to deliver quality products to consumers, we are currently investigating certain potential quality and safety issues globally. As necessary, we undertake to effect repair or replacement of appliances in the event that an investigation leads to the conclusion that such action is warranted.
Guarantees
We have guarantee arrangements in a Brazilian subsidiary. For certain creditworthy customers, the subsidiary guarantees customer lines of credit at commercial banks to support purchases following its normal credit policies. If a customer were to default on its line of credit with the bank, our subsidiary would be required to assume the line of credit and satisfy the obligation with the bank. At June 30, 2023March 31, 2024 and December 31, 2022,2023, the guaranteed amounts totaled 936 million1.2 billion Brazilian reais (approximately $194$246 million at June 30, 2023)March 31, 2024) and 1,122 million1.3 billion Brazilian reais (approximately $215$273 million at December 31, 2022)2023), respectively. The fair value of these guarantees were nominal at June 30, 2023March 31, 2024 and December 31, 2022.2023. Our subsidiary insures against a significant portion of this credit risk for these guarantees, under normal operating conditions, through policies purchased from high-quality underwriters.
We provide guarantees of indebtedness and lines of credit for various consolidated subsidiaries. The maximum contractual amount of indebtedness and lines of credit available under these lines for consolidated subsidiaries totaled approximately $3.0$2.9 billion at June 30, 2023March 31, 2024 and $2.9$3.0 billion at December 31, 2022,2023, respectively. Our total short-term outstanding bank indebtedness under guarantees (excluding those related to the European major domestic appliance business) was nominal$25 million and $17 million at both June 30, 2023March 31, 2024 and December 31, 2022.2023, respectively.
(7) PENSION AND OTHER POSTRETIREMENT BENEFIT PLANS
The following table summarizes the components of net periodic pension cost and the cost of other postretirement benefits for the periods presented:
| | | Three Months Ended June 30, |
| United States
Pension Benefits | | Foreign
Pension Benefits | | Other Postretirement
Benefits |
| | Three Months Ended March 31, | |
| | Three Months Ended March 31, | |
| | Three Months Ended March 31, | |
| | United States
Pension Benefits | | | | United States
Pension Benefits | | Foreign
Pension Benefits | | Other Postretirement
Benefits |
| Millions of dollars | Millions of dollars | | 2023 | | 2022 | | 2023 | | 2022 | | 2023 | | 2022 | Millions of dollars | | 2024 | | 2023 | | 2024 | | 2023 | | 2024 | | 2023 |
| Service cost | Service cost | | $ | 1 | | | $ | 1 | | | $ | 1 | | | $ | 1 | | | $ | — | | | $ | — | |
| Interest cost | Interest cost | | 29 | | | 20 | | | 7 | | | 4 | | | 2 | | | 2 | |
| Expected return on plan assets | Expected return on plan assets | | (35) | | | (36) | | | (6) | | | (8) | | | — | | | — | |
| Amortization: | Amortization: | |
| Actuarial loss | |
| Actuarial loss | |
| Actuarial loss | Actuarial loss | | 9 | | | 14 | | | 1 | | | 2 | | | — | | | — | |
| Prior service credit | Prior service credit | | — | | | — | | | — | | | — | | | (10) | | | (12) | |
| Settlement and curtailment (gain) loss | Settlement and curtailment (gain) loss | | — | | | — | | | — | | | — | | | — | | | — | |
| Net periodic benefit cost (credit) | Net periodic benefit cost (credit) | | $ | 4 | | | $ | (1) | | | $ | 3 | | | $ | (1) | | | $ | (8) | | | $ | (10) | |
|
| | | | | | | | | | | | | | | | | | | | | | | | | | | | | | | | | | | | | | |
| | | | | | | | | | | | |
| | Six Months Ended June 30, |
| | United States
Pension Benefits | | Foreign
Pension Benefits | | Other Postretirement
Benefits |
| Millions of dollars | | 2023 | | 2022 | | 2023 | | 2022 | | 2023 | | 2022 |
| Service cost | | $ | 1 | | | $ | 2 | | | $ | 2 | | | $ | 2 | | | $ | — | | | $ | — | |
| Interest cost | | 58 | | | 41 | | | 13 | | | 8 | | | 3 | | | 3 | |
| Expected return on plan assets | | (71) | | | (73) | | | (11) | | | (17) | | | — | | | — | |
| Amortization: | | | | | | | | | | | | |
| Actuarial loss | | 19 | | | 29 | | | 2 | | | 5 | | | — | | | — | |
| Prior service credit | | — | | | — | | | — | | | — | | | (21) | | | (23) | |
| Settlement and curtailment (gain) loss | | — | | | — | | | — | | | 1 | | | — | | | — | |
| Net periodic benefit cost (credit) | | $ | 7 | | | $ | (1) | | | $ | 6 | | | $ | (1) | | | $ | (18) | | | $ | (20) | |
| | | | | | | | | | | | |
| | | | | | | | | | | | |
| | | | | | | | | | | | |
| | | | | | | | | | | | |
| | | | | | | | | | | | |
| | | | | | | | | | | | |
| | | | | | | | | | | | |
| | | | | | | | | | | | |
| | | | | | | | | | | | |
| | | | | | | | | | | | |
| | | | | | | | | | | | |
| | | | | | | | | | | | |
The following table summarizes the net periodic cost recognized in operating profit and interest and sundry (income) expense for the periods presented:
| | | Three Months Ended June 30, |
| United States
Pension Benefits | | Foreign
Pension Benefits | | Other Postretirement
Benefits |
| | Three Months Ended March 31, | |
| | Three Months Ended March 31, | |
| | Three Months Ended March 31, | |
| | United States
Pension Benefits | | | | United States
Pension Benefits | | Foreign
Pension Benefits | | Other Postretirement
Benefits |
| Millions of dollars | Millions of dollars | | 2023 | | 2022 | | 2023 | | 2022 | | 2023 | | 2022 | Millions of dollars | | 2024 | | 2023 | | 2024 | | 2023 | | 2024 | | 2023 |
| Operating profit (loss) | Operating profit (loss) | | $ | 1 | | | $ | 1 | | | $ | 1 | | | $ | 1 | | | $ | — | | | $ | — | |
| Interest and sundry (income) expense | Interest and sundry (income) expense | | 3 | | | (2) | | | 2 | | | (2) | | | (8) | | | (10) | |
| Net periodic benefit cost | Net periodic benefit cost | | $ | 4 | | | $ | (1) | | | $ | 3 | | | $ | (1) | | | $ | (8) | | | $ | (10) | |
401(k) Defined Contribution Plan
During the first quarter of 2024, we announced that the Company matching contributions for our 401(k) defined contribution plan, equal to up to 7% of participants' eligible compensation, covering substantially all U.S. employees will be contributed in company stock starting from March 2024.
| | | | | | | | | | | | | | | | | | | | | | | | | | | | | | | | | | | | | | |
| | | | | | | | | | | | |
| | Six Months Ended June 30, |
| | United States
Pension Benefits | | Foreign
Pension Benefits | | Other Postretirement
Benefits |
| Millions of dollars | | 2023 | | 2022 | | 2023 | | 2022 | | 2023 | | 2022 |
| Operating profit (loss) | | $ | 1 | | | $ | 2 | | | $ | 2 | | | $ | 2 | | | $ | — | | | $ | — | |
| Interest and sundry (income) expense | | 6 | | | (3) | | | 4 | | | (3) | | | (18) | | | (20) | |
| Net periodic benefit cost | | $ | 7 | | | $ | (1) | | | $ | 6 | | | $ | (1) | | | $ | (18) | | | $ | (20) | |
(8) HEDGES AND DERIVATIVE FINANCIAL INSTRUMENTS
Derivative instruments are accounted for at fair value based on market rates. Derivatives where we elect hedge accounting are designated as either cash flow, fair value or net investment hedges. Derivatives that are not accounted for based on hedge accounting are marked to market through earnings. If the designated cash flow hedges are highly effective, the gains and losses are recorded in other comprehensive income (loss) and subsequently reclassified to earnings to offset the impact of the hedged items when they occur. In the event it becomes probable the forecasted transaction to which a cash flow hedge relates will not occur, the derivative would be terminated and the amount in accumulated other comprehensive income (loss) would be recognized in earnings. The fair value of the hedge asset or liability is presented in either other current assets / liabilities or other noncurrent assets / liabilities on the Consolidated Condensed Balance Sheets and in other within cash provided by (used in) operating activities in the Consolidated Condensed Statements of Cash Flows.
Using derivative instruments means assuming counterparty credit risk. Counterparty credit risk relates to the loss we could incur if a counterparty were to default on a derivative contract. We generally deal with investment grade counterparties and monitor the overall credit risk and exposure to individual counterparties. We do not anticipate nonperformance by any counterparties. The amount of counterparty credit exposure is limited to the unrealized gains, if any, on such derivative contracts. We do not require nor do we post collateral on such contracts.
Hedging Strategy
In the normal course of business, we manage risks relating to our ongoing business operations including those arising from changes in commodity prices, foreign exchange rates and interest rates. Fluctuations in these rates and prices can affect our operating results and financial condition. We use a variety of strategies, including the use of derivative instruments, to manage these risks. We do not enter into derivative financial instruments for trading or speculative purposes.
Commodity Price Risk
We enter into commodity derivative contracts on various commodities to manage the price risk associated with forecasted purchases and sales of material used in our manufacturing process. The objective of these hedges is to reduce the variability of cash flows associated with the forecasted purchases and sales of commodities.
Foreign Currency and Interest Rate Risk
We incur expenses associated with the procurement and production of products in a limited number of countries, while we sell in the local currencies of a large number of countries. Our primary foreign currency exchange exposures result from cross-currency sales of products. As a result, we enter into foreign exchange contracts to hedge certain firm commitments and forecasted transactions to acquire products and services that are denominated in foreign currencies. We enter into certain undesignated non-functional currency asset and liability hedges that relate primarily to short-term payables, receivables, intercompany loans and dividends. When we hedge a foreign currency denominated payable or receivable with a derivative, the effect of changes in the foreign exchange rates are reflected currently in interest and sundry (income) expense for both the payable/receivable and the derivative. Therefore, as a result of the economic hedge, we do not elect hedge accounting.
We also enter into hedges to mitigate currency risk primarily related to forecasted foreign currency denominated expenditures, intercompany financing agreements and royalty agreements and designate them as cash flow hedges. Gains and losses on derivatives designated as cash flow hedges, to the extent they are included in the assessment of effectiveness, are recorded in other comprehensive income (loss) and subsequently reclassified to earnings to offset the impact of the hedged items when they occur.
We may enter into cross-currency interest rate swaps to manage our exposure relating to cross-currency debt. Outstanding notional amounts of cross-currency interest rate swap agreements were $618 million at June 30, 2023March 31, 2024 and December 31, 2022,2023, respectively.
We may enter into interest rate swap agreements to manage interest rate risk exposure. Our interest rate swap agreements, if any, effectively modify our exposure to interest rate risk, primarily through converting certain floating rate debt to a fixed rate basis, or certain fixed rate debt to a floating rate basis. These agreements involve either the receipt or payment of floating rate amounts in exchange for fixed rate interest payments or receipts, respectively, over the life of the agreements without an exchange of the underlying principal amounts. We may enter into swap rate lock agreements to effectively reduce our exposure to interest rate risk by locking in interest rates on probable long-term debt issuances. There were no outstanding notional amounts of interest rate swap agreements at June 30, 2023March 31, 2024 and December 31, 2022.2023.
We may enter into instruments that are designated and qualify as a net investment hedge to manage our exposure related to foreign currency denominated investments. The effective portion of the instruments' gain or loss is reported as a component of other comprehensive income (loss) and recorded in accumulated other comprehensive loss. The gain or loss will be subsequently reclassified into net earnings when the underlying net investment is either sold or substantially liquidated. The remaining change in fair value of the hedge instruments represents the ineffective portion, which is immediately recognized in interest and sundry (income) expense on our Consolidated Condensed Statements of Comprehensive Income (Loss). There were no outstanding notional amounts of net investment hedges as of June 30, 2023March 31, 2024 and December 31, 2022.2023.
The following table summarizes our outstanding derivative contracts and their effects in our Consolidated Condensed Balance Sheets at June 30, 2023March 31, 2024 and December 31, 2022.2023. Hedge assets and liabilities of our European major domestic appliance business have been classified as held for sale and are excluded from the table below.
| | | | | | | Fair Value of | | | | | | | | | Fair Value of | | | | |
| Notional Amount | | Hedge Assets | | Hedge Liabilities | | Maximum Term (Months) |
| | Notional Amount | | | | Notional Amount | | Hedge Assets | | Hedge Liabilities | | Maximum Term (Months) |
| Millions of dollars | Millions of dollars | | 2023 | | 2022 | | 2023 | | 2022 | | 2023 | | 2022 | | | | 2023 | | 2022 | Millions of dollars | | 2024 | | 2023 | | 2024 | | 2023 | | 2024 | | 2023 | | | 2024 | | 2023 |
Derivatives accounted for as hedges(1) | Derivatives accounted for as hedges(1) | |
| Commodity swaps/options | |
| Commodity swaps/options | |
| Commodity swaps/options | Commodity swaps/options | | $ | 225 | | | $ | 170 | | | $ | 1 | | | $ | 7 | | | $ | 27 | | | $ | 17 | | | (CF) | | 22 | | 24 | | $ | 185 | | | $ | | $ | 193 | | | $ | | $ | 7 | | | $ | | $ | 4 | | | $ | | $ | 5 | | | $ | | $ | 9 | | | (CF) | | (CF) | | 21 | | 24 |
| Foreign exchange forwards/options | Foreign exchange forwards/options | | 1,131 | | | 998 | | | 4 | | | 24 | | | 49 | | | 20 | | | (CF/NI) | | 15 | | 15 | Foreign exchange forwards/options | | 981 | | | 952 | | 952 | | | 7 | | 7 | | | 1 | | 1 | | | 12 | | 12 | | | 31 | | 31 | | | (CF/NI) | | (CF/NI) | | 15 | | 15 |
| Cross-currency swaps | Cross-currency swaps | | 618 | | | 618 | | | 4 | | | 5 | | | 62 | | | 42 | | | (CF) | | 68 | | 74 | Cross-currency swaps | | 618 | | | 618 | | 618 | | | 5 | | 5 | | | 5 | | 5 | | | 69 | | 69 | | | 79 | | 79 | | | (CF) | | (CF) | | 59 | | 62 |
| | Total derivatives accounted for as hedges | Total derivatives accounted for as hedges | | $ | 9 | | | $ | 36 | | | $ | 138 | | | $ | 79 | | |
| Total derivatives accounted for as hedges | |
| Total derivatives accounted for as hedges | |
| Derivatives not accounted for as hedges | Derivatives not accounted for as hedges | | | | | | | | | |
| Derivatives not accounted for as hedges | |
| Derivatives not accounted for as hedges | |
| Commodity swaps/options | |
| Commodity swaps/options | |
| Commodity swaps/options | Commodity swaps/options | | $ | — | | | $ | 1 | | | $ | — | | | $ | — | | | $ | — | | | $ | — | | | N/A | | 0 | | 0 | | $ | — | | | $ | | $ | — | | | $ | | $ | — | | | $ | | $ | — | | | $ | | $ | — | | | $ | | $ | — | | | N/A | | N/A | | 0 | | 0 |
| Foreign exchange forwards/options | Foreign exchange forwards/options | | 394 | | | 439 | | | 1 | | | 5 | | | 1 | | | 6 | | | N/A | | 5 | | 5 | Foreign exchange forwards/options | | 318 | | | 1,569 | | 1,569 | | | — | | — | | | 13 | | 13 | | | 2 | | 2 | | | 9 | | 9 | | | N/A | | N/A | | 7 | | 10 |
| Total derivatives not accounted for as hedges | Total derivatives not accounted for as hedges | | 1 | | | 5 | | | 1 | | | 6 | | |
| Total derivatives | Total derivatives | | $ | 10 | | | $ | 41 | | | $ | 139 | | | $ | 85 | | |
| Total derivatives | |
| Total derivatives | |
| | Current | |
| | Current | |
| | Current | Current | | $ | 10 | | | $ | 40 | | | $ | 71 | | | $ | 41 | | |
| Noncurrent | Noncurrent | | — | | | 1 | | | 68 | | | 44 | | |
| Noncurrent | |
| Noncurrent | |
| Total derivatives | Total derivatives | | $ | 10 | | | $ | 41 | | | $ | 139 | | | $ | 85 | | | |
| Total derivatives | |
| Total derivatives | |
(1)Derivatives accounted for as hedges are considered cash flow (CF) hedges.
The following tables summarize the effects of derivative instruments on our Consolidated Condensed Statements of Comprehensive Income (Loss) for the periods presented:
| | | | | Three Months Ended June 30, |
| Gain (Loss)
Recognized in OCI
(Effective Portion ) (2) |
| | | | Three Months Ended March 31, | |
| | | | Three Months Ended March 31, | |
| | | | Three Months Ended March 31, | |
| | | Gain (Loss)
Recognized in OCI
(Effective Portion ) (2) | | | | | Gain (Loss)
Recognized in OCI
(Effective Portion ) (2) |
| Millions of dollars | Millions of dollars | | | | 2023 | | 2022 | Millions of dollars | | | 2024 | | 2023 |
| Cash flow hedges | Cash flow hedges | |
| Commodity swaps/options | |
| Commodity swaps/options | |
| Commodity swaps/options | Commodity swaps/options | | $ | (22) | | | $ | (37) | |
| Foreign exchange forwards/options | Foreign exchange forwards/options | | (43) | | | 123 | |
| Cross-currency swaps | Cross-currency swaps | | (19) | | | 89 | |
| Interest rate derivatives | Interest rate derivatives | | 1 | | | 29 | |
| Net Investment hedges | |
| Foreign currency | | — | | | (2) | |
| | | $ | (83) | | | $ | 202 | |
| | | $ | |
| | Three Months Ended June 30, |
| | $ | |
| | Location of Gain (Loss) Reclassified from
OCI into Earnings
(Effective Portion) | | Gain (Loss) Reclassified from OCI into Earnings (Effective Portion)(3) |
| | $ | |
| | | | | | | Three Months Ended March 31, | |
| | | | | | Three Months Ended March 31, | |
| | | | | | Three Months Ended March 31, | |
| | Location of Gain (Loss) Reclassified from
OCI into Earnings
(Effective Portion) | | | | Location of Gain (Loss) Reclassified from
OCI into Earnings
(Effective Portion) | | Gain (Loss) Reclassified from OCI into Earnings (Effective Portion)(3) |
| Cash Flow Hedges - Millions of dollars | Cash Flow Hedges - Millions of dollars | | Location of Gain (Loss) Reclassified from
OCI into Earnings
(Effective Portion) | | 2023 | | 2022 | Cash Flow Hedges - Millions of dollars | | | 2024 | | 2023 |
| Commodity swaps/options | Commodity swaps/options | | $ | (5) | | | $ | 16 | |
| Foreign exchange forwards/options | Foreign exchange forwards/options | | Net sales | | (1) | | | 1 | |
| Foreign exchange forwards/options | Foreign exchange forwards/options | | Cost of products sold | | (7) | | | (11) | |
| Foreign exchange forwards/options | Foreign exchange forwards/options | | Interest and sundry (income) expense | | 9 | | | 67 | |
| Cross-currency swaps | Cross-currency swaps | | Interest and sundry (income) expense | | (5) | | | 75 | |
| Interest rate derivatives | | Interest expense | | 1 | | | — | |
| | | | $ | (8) | | | $ | 148 | |
| | | | $ | |
| | | | $ | |
| | | | $ | |
| | Three Months Ended June 30, |
| Location of Gain (Loss) Recognized on Derivatives not
Accounted for as Hedges | | Gain (Loss) Recognized on Derivatives not
Accounted for as Hedges |
| | | | | | Three Months Ended March 31, | |
| | | | | | Three Months Ended March 31, | |
| | | | | | Three Months Ended March 31, | |
| | Location of Gain (Loss) Recognized on Derivatives not
Accounted for as Hedges | | | | Location of Gain (Loss) Recognized on Derivatives not
Accounted for as Hedges | | Gain (Loss) Recognized on Derivatives not
Accounted for as Hedges |
| Derivatives not Accounted for as Hedges - Millions of dollars | Derivatives not Accounted for as Hedges - Millions of dollars | | Location of Gain (Loss) Recognized on Derivatives not
Accounted for as Hedges | | 2023 | | 2022 | Derivatives not Accounted for as Hedges - Millions of dollars | | | 2024 | | 2023 |
| Foreign exchange forwards/options | Foreign exchange forwards/options | | $ | 14 | | | $ | 11 | |
|
(2)Change in gain (loss) recognized in OCI (effective portion) for the three months ended June 30, 2023March 31, 2024 is primarily driven by fluctuations in currency and commodity prices and interest rates compared to prior year. The tax impact of the cash flow hedges was $18$(9) million and $(18)$5 million for the three months ended June 30,March 31, 2024 and 2023, and 2022, respectively. The tax impact of the net investment hedges was $0 million and $1 million for the three months ended June 30, 2023 and 2022, respectively.
(3)Change in gain (loss) reclassified from OCI into earnings (effective portion) for the three months ended June 30, 2023March 31, 2024 was primarily driven by fluctuations in currency and commodity prices and interest rates compared to prior year.
| | | | | | | | | | | | | | | | | | | | | | | | | | |
| | | | | | | | |
| | | | Six Months Ended June 30, |
| | | Gain (Loss)
Recognized in OCI
(Effective Portion ) (4) |
| Millions of dollars | | | 2023 | | 2022 |
| Cash flow hedges | | | | | | | | |
| Commodity swaps/options | | $ | (22) | | | $ | 2 | |
| Foreign exchange forwards/options | | (63) | | | 80 | |
| Cross-currency swaps | | (20) | | | 98 | |
| Interest rate derivatives | | — | | | 52 | |
| Net Investment hedges | | | | | | | | |
| Foreign currency | | — | | | (18) | |
| | $ | (105) | | | $ | 214 | |
| | | | | | | | |
| | | | | | Six Months Ended June 30, |
| | Location of Gain (Loss) Reclassified from
OCI into Earnings
(Effective Portion) | | Gain (Loss) Reclassified from OCI into Earnings (Effective Portion)(5) |
| Cash Flow Hedges - Millions of dollars | | | 2023 | | 2022 |
| Commodity swaps/options | | Cost of products sold | | $ | (5) | | | $ | 34 | |
| Foreign exchange forwards/options | | Net sales | | (1) | | | 1 | |
| Foreign exchange forwards/options | | Cost of products sold | | (15) | | | (16) | |
| Foreign exchange forwards/options | | Interest and sundry (income) expense | | 18 | | | 96 | |
| Cross-currency swaps | | Interest and sundry (income) expense | | (12) | | | 116 | |
| Interest rate derivatives | | Interest expense | | 1 | | | — | |
| | | | $ | (14) | | | $ | 231 | |
| | | | | | | | |
| | | | | | Six Months Ended June 30, |
| | Location of Gain (Loss) Recognized on Derivatives not
Accounted for as Hedges | | Gain (Loss) Recognized on Derivatives not
Accounted for as Hedges |
| Derivatives not Accounted for as Hedges - Millions of dollars | | | 2023 | | 2022 |
| Foreign exchange forwards/options | | Interest and sundry (income) expense | | $ | 27 | | | $ | (5) | |
| | | | | | | | |
| | | | | | | | |
| | | | | | | | |
| | | | | | | | |
| | | | | | | | |
(4)Change in gain (loss) recognized in OCI (effective portion) for the six months ended June 30, 2023 is primarily driven by fluctuations in currency and commodity prices and interest rates compared to prior year. The tax impact of the cash flow hedges was $23 million and $1 million for the six months ended June 30, 2023 and 2022, respectively. The tax impact of the net investment hedges was $0 million and $4 million for the six months ended June 30, 2023 and 2022, respectively.
(5)Change in gain (loss) reclassified from OCI into earnings (effective portion) for the six months ended June 30, 2023 was primarily driven by fluctuations in currency and commodity prices and interest rates compared to prior year.
For cash flow hedges, the amount of ineffectiveness recognized in interest and sundry (income) expense was nominal for the periods ended June 30, 2023March 31, 2024 and 2022.2023. There were no hedges designated as fair value for the periods ended June 30, 2023March 31, 2024 and 2022.2023. The net amount of unrealized gain or loss on derivative instruments included in accumulated OCI related to contracts maturing and expected to be realized during the next twelve months is a loss of $73$7 million at June 30, 2023.March 31, 2024.
(9) FAIR VALUE MEASUREMENTS
Fair value is measured based on an exit price, representing the amount that would be received to sell an asset or paid to transfer a liability in an orderly transaction between market participants. As such, fair value is a market-based measurement that should be determined based on assumptions market participants would use in pricing an asset or liability. Assets and liabilities measured at fair value are based on a market valuation approach using prices and other relevant information generated by market transactions involving identical or comparable assets or liabilities. As a basis for considering such assumptions, a three-tiered fair value hierarchy is established, which prioritizes the inputs used in measuring fair value as follows: (Level 1)
observable inputs such as quoted prices in active markets; (Level 2) inputs, other than the quoted prices in active markets that are observable, either directly or indirectly; and (Level 3) unobservable inputs in which there is little or no market data, which require the reporting entity to develop its own assumptions.
The following table summarizes the valuation of our assets and liabilities measured at fair value on a recurring basis at June 30, 2023March 31, 2024 and December 31, 2022:2023:
| | Fair Value |
| | | | | | Fair Value | |
| | | | | | Fair Value | |
| | | | | | Fair Value | |
| Millions of dollars | Millions of dollars | | Total Cost Basis | | Level 1 | | Level 2 | | | Total | Millions of dollars | | Total Cost Basis | | Level 1 | | Level 2 | | | | Total |
| Measured at fair value on a recurring basis: | Measured at fair value on a recurring basis: | | 2023 | | 2022 | | 2023 | | 2022 | | 2023 | | 2022 | | | 2023 | | 2022 | Measured at fair value on a recurring basis: | | 2024 | | 2023 | | 2024 | | 2023 | | 2024 | | 2023 | | | | | | 2024 | | 2023 |
Short-term investments (1) | Short-term investments (1) | | $ | 935 | | | $ | 1,209 | | | $ | 693 | | | $ | 934 | | | $ | 242 | | | $ | 275 | | | | $ | 935 | | | $ | 1,209 | |
| Net derivative contracts | Net derivative contracts | | — | | | — | | | — | | | — | | | (129) | | | (44) | | | | (129) | | | (44) | |
|
(1)Short-term investments are primarily comprised of money market funds and highly liquid, low risk investments with initial maturities less than 90 days.
The non-recurring fair values represent only those assets whose carrying values were adjusted to fair value during the reporting period. See Note 14 to the Consolidated Condensed Financial Statements for additional information on the goodwill and other intangibles impairment.
Goodwill
We have four reporting units for which we assess for impairment. We use a discounted cash flow analysis to determine fair value (Level 3 input) and consistent projected financial information in our analysis of goodwill and intangible assets. The discounted cash flow analysis for the quantitative impairment assessment for the EMEA reporting unit utilized a discount rate of 15%. Based on the quantitative assessment performed as of May 31, 2022, the carrying value of the EMEA reporting unit exceeded its fair value resulting in a goodwill impairment loss for the full carrying amount of $278 million during the second quarter of 2022.
Other Intangible Assets
The relief-from-royalty method for the quantitative impairment assessment for the other intangible assets in the EMEA reporting unit utilized discount rates of 19% and royalty rates ranging from 1.5% - 3.5%. Based on the quantitative assessment performed as of May 31, 2022, the carrying value of the Indesit and Hotpoint* trademarks exceeded their fair value (Level 3 input), resulting in an impairment charge of $106 million during the second quarter of 2022.
Indefinite-lived intangible assets of Indesit and Hotpoint* with carrying amounts of approximately $201 million and $137 million were written down to fair values (Level 3 input) of $131 million and $101 million, resulting in impairment charges of $70 million and $36 million, respectively.
See Note 14 to the Consolidated Condensed Financial Statements for additional information.
European Major Domestic Appliance Business Held for Sale
On January 16, 2023, the Company entered into a contribution agreement with Arçelik A.Ş (“Arcelik”). Under the terms of the agreement, Whirlpool will contribute its European major domestic appliance business, and Arcelik will contribute its European major domestic appliance, consumer electronics, air conditioning, and small domestic appliance businesses into the newly formed entity of which Whirlpool will own 25% and Arcelik 75%.
On December 20, 2022, the Company's board authorized the transaction with Arcelik and the European major domestic appliance business was classified as held for sale during the fourth quarter of 2022. The disposal group was measured at fair value less cost to sell. We used a discounted cash flow analysis and multiple market data points in our analysis to determine fair value (Level 3 input) of the 25% interest retained, resulting in an estimated fair value of $143$139 million. The discounted cash flow analysis utilized a discount rate of 16.5%. at December 31, 2022.
*Whirlpool ownershipDuring the first quarter of 2024, the fair value of the Hotpoint branddisposal group was updated based on working capital adjustments, cash flow assumptions and changes in discount rates. This updated assessment resulted in an estimated fair value of $227 million at March 31, 2024. The discounted cash flow analysis utilized a discount rate of 15.5%.
During the EMEA and Asia Pacific regions is not affiliated with the Hotpoint brand sold in the Americas.
We recorded an adjustment of $240 million for the sixthree months ended June 30, 2023, of which $18 million wasMarch 31, 2024, we recorded during the second quarter, resulting in a total loss of $1,761$247 million forto the transaction. These adjustments reflect transaction costsloss on sale and disposal of businesses. The adjustment reflects ongoing reassessment of the fair value less costs to sell of the disposal group which will continueand transaction costs. The transaction closed on April 1, 2024 and no further fair value adjustments are expected in subsequent quarters related to be evaluated each reporting period until completionthe contribution of our European major domestic appliance business.
During the transaction.three months ended March 31, 2023, we recorded an increase of $222 million to the loss on sale and disposal of businesses.
See Note 1314 to the Consolidated Condensed Financial Statements for additional information.
InSinkErator Acquisition
On October 31, 2022, we completed the acquisition of the InSinkErator business pursuant to the terms of the Acquisition Agreement with Emerson. The acquisition has been accounted for as a business combination under the acquisition method of accounting. This requires allocation of the purchase price to the estimated fair values of the identifiable assets acquired and liabilities assumed, including goodwill and other intangible assets. The Company is in the process of finalizing third-party valuations for the purchase price allocation which are subject to change.
The estimated value of property, plant and equipment included adjustments totaling $36 million to increase the net book value to the preliminary fair value estimate of $174 million. The fair value of property, plant and equipment was determined using both a cost and market approach. The model used primarily included Level 2 and 3 inputs. This estimate is based on other comparable acquisitions and historical experience, and preliminary expectations as to the duration of time we expect to realize benefits from those assets.
The estimated value of inventory included adjustments totaling $10 million to step-up inventory to an estimated fair value of $93 million. The fair value of inventory was estimated using the comparative sales method. The model used primarily included Level 2 and 3 inputs. To estimate the fair value of inventory, we considered the components of InSinkErator’s inventory, as well as estimates of selling prices and selling and distribution costs that were based on InSinkErator’s historical experience.
The estimated fair values of identifiable intangible assets acquired were prepared using an income valuation approach, which requires a forecast of expected future revenues, future cash flows and discount rates (Level 3 inputs), either through the use of the relief-from-royalty method, the multi-period excess earnings method or the with and without method.
Purchase accounting adjustments during the period were not material. The Company expects to finalize any further purchase accounting adjustments as soon as practicable, but no later than one year from the acquisition date. See Note 13 to the Consolidated Condensed Financial Statements for additional information.
Russia Sale Transaction
During the second quarter of 2022, we entered into an agreement to sell our Russia business. We classified this disposal group as held for sale with a fair value of zero. Fair value, which is less than the carrying amount of the Russia business, was estimated based on purchase price which includes contingent consideration based on future business and other conditions (Level 2 input). We recorded an impairment charge of $333 million for the write-down of the net assets to their fair value.
See Note 13 to the Consolidated Condensed Financial Statements for additional information.
Other Fair Value Measurements
The fair value of long-term debt (including current maturities) was $7.2$6.8 billion and $7.0$6.9 billion at June 30, 2023March 31, 2024 and December 31, 2022,2023, respectively, and was estimated using discounted cash flow analysis based on incremental borrowing rates for similar types of borrowing arrangements (Level 2 input).
(10) STOCKHOLDERS' EQUITY
The following table summarizes the changes in stockholders' equity for the periods presented:
| | | | | | | Whirlpool Stockholders' Equity | | | | | | | Whirlpool Stockholders' Equity | | |
| | | | Total | | Retained
Earnings | | Accumulated Other Comprehensive Income (Loss) | | Treasury Stock / Additional Paid-In-Capital | | Common
Stock | | Non-Controlling Interest | | | Total | | Retained
Earnings | | Accumulated Other Comprehensive Income (Loss) | | Treasury Stock / Additional Paid-In-Capital | | Common
Stock | | Non-Controlling Interest |
| Balances, December 31, 2022 | | $ | 2,506 | | | $ | 8,261 | | | $ | (2,090) | | | $ | (3,949) | | | $ | 114 | | | $ | 170 | |
| Balances, December 31, 2023 | |
| Comprehensive income (loss) | Comprehensive income (loss) | |
| Net earnings (loss) | |
| Net earnings (loss) | |
| Net earnings (loss) | Net earnings (loss) | | (176) | | | (179) | | | — | | | — | | | — | | | 3 | |
| Other comprehensive income | Other comprehensive income | | (1) | | | — | | | (1) | | | — | | | — | | | — | |
| Comprehensive income (loss) | Comprehensive income (loss) | | (177) | | | (179) | | | (1) | | | — | | | — | | | 3 | |
| Stock issued (repurchased) | Stock issued (repurchased) | | 2 | | | — | | | — | | | 2 | | | — | | | — | |
| | Sale of minority interest in subsidiary | |
| Sale of minority interest in subsidiary | |
| Sale of minority interest in subsidiary | |
| Dividends declared | Dividends declared | | (97) | | | (97) | | | — | | | — | | | — | | | — | |
| Balances, March 31, 2023 | | $ | 2,234 | | | $ | 7,985 | | | $ | (2,091) | | | $ | (3,947) | | | $ | 114 | | | $ | 173 | |
| Comprehensive income (loss) | | | | | | | | | | | | |
| Net earnings (loss) | | 87 | | | 85 | | | — | | | — | | | — | | | 2 | |
| Other comprehensive income | | (39) | | | — | | | (39) | | | — | | | — | | |
| Comprehensive income (loss) | | 48 | | | 85 | | | (39) | | | — | | | — | | | 2 | |
| Stock issued (repurchased) | | 7 | | | — | | | — | | | 7 | | | — | |
| Dividends declared | | (96) | | | (96) | | | — | | | — | | | — | | | — | |
| | Balances, June 30, 2023 | | $ | 2,193 | | | $ | 7,974 | | | $ | (2,130) | | | $ | (3,940) | | | $ | 114 | | | $ | 175 | |
| Balances, March 31, 2024 | |
| |
| | | | | | | | | | | | | | | | | | | | | | | | | | | | | | | | | | | | | | |
| | | | | Whirlpool Stockholders' Equity | | |
| | | Total | | Retained
Earnings | | Accumulated Other Comprehensive Income (Loss) | | Treasury Stock / Additional Paid-In-Capital | | Common
Stock | | Non-Controlling Interest |
| Balances, December 31, 2021 | | $ | 5,013 | | | $ | 10,170 | | | $ | (2,357) | | | $ | (3,081) | | | $ | 114 | | | $ | 167 | |
| Comprehensive income (loss) | | | | | | | | | | | | |
| Net earnings (loss) | | 316 | | | 313 | | | — | | | — | | | — | | | 3 | |
| Other comprehensive income | | 58 | | | — | | | 58 | | | — | | | — | | | — | |
| Comprehensive income (loss) | | 374 | | | 313 | | | 58 | | | — | | | — | | | 3 | |
| | | | | | | | | | | | |
| Stock issued (repurchased) | | (539) | | | — | | | — | | | (539) | | | — | | | — | |
| Dividends declared | | (103) | | | (103) | | | — | | | — | | | — | | | — | |
| Balances, March 31, 2022 | | $ | 4,745 | | | $ | 10,380 | | | $ | (2,299) | | | $ | (3,620) | | | $ | 114 | | | $ | 170 | |
| Comprehensive income (loss) | | | | | | | | | | | | |
| Net earnings (loss) | | (368) | | | (371) | | | — | | | — | | | — | | | 3 | |
| Other comprehensive income | | 209 | | | — | | | 209 | | | — | | | — | | | — | |
| Comprehensive income (loss) | | (159) | | | (371) | | | 209 | | | — | | | — | | | 3 | |
| Stock issued (repurchased) | | (280) | | | — | | | — | | | (280) | | | — | | | — | |
| Dividends declared | | (97) | | | (97) | | | — | | | — | | | — | | | — | |
| | | | | | | | | | | | |
| Balances, June 30, 2022 | | $ | 4,209 | | | $ | 9,912 | | | $ | (2,090) | | | $ | (3,900) | | | $ | 114 | | | $ | 173 | |
| | | | | | | | | | | | |
| | | | | | | | | | | | |
| | | | | | | | | | | | |
| | | | | | | | | | | | |
| | | | | | | | | | | | |
| | | | | | | | | | | | |
| | | | | | | | | | | | |
| | | | | | | | | | | | |
| | | | | | | | | | | | |
| | | | | | | | | | | | |
| | | | | | | | | | | | |
| | | | | | | | | | | | |
| | | | | | | | | | | | |
| | | | | | | | | | | | |
| | | | | | | | | | | | |
| | | | | | | | | | | | |
| | | | | | | | | | | | | | | | | | | | | | | | | | | | | | | | | | | | | | |
| | | | | Whirlpool Stockholders' Equity | | |
| | | Total | | Retained
Earnings | | Accumulated Other Comprehensive Income (Loss) | | Treasury Stock / Additional Paid-In-Capital | | Common
Stock | | Non-Controlling Interest |
| Balances, December 31, 2022 | | $ | 2,506 | | | $ | 8,261 | | | $ | (2,090) | | | $ | (3,949) | | | $ | 114 | | | $ | 170 | |
| Comprehensive income (loss) | | | | | | | | | | | | |
| Net earnings (loss) | | (176) | | | (179) | | | — | | | — | | | — | | | 3 | |
| Other comprehensive income | | (1) | | | — | | | (1) | | | — | | | — | | | — | |
| Comprehensive income (loss) | | (177) | | | (179) | | | (1) | | | — | | | — | | | 3 | |
| | | | | | | | | | | | |
| Stock issued (repurchased) | | 2 | | | — | | | — | | | 2 | | | — | | | — | |
| Dividends declared | | (97) | | | (97) | | | — | | | — | | | — | | | — | |
| Balances, March 31, 2023 | | $ | 2,234 | | | $ | 7,985 | | | $ | (2,091) | | | $ | (3,947) | | | $ | 114 | | | $ | 173 | |
| | | | | | | | | | | | |
| | | | | | | | | | | | |
| | | | | | | | | | | | |
| | | | | | | | | | | | |
| | | | | | | | | | | | |
| | | | | | | | | | | | |
| | | | | | | | | | | | |
| | | | | | | | | | | | |
| | | | | | | | | | | | |
| | | | | | | | | | | | |
| | | | | | | | | | | | |
| | | | | | | | | | | | |
| | | | | | | | | | | | |
| | | | | | | | | | | | |
| | | | | | | | | | | | |
| | | | | | | | | | | | |
| | | | | | | | | | | | |
| | | | | | | | | | | | |
| | | | | | | | | | | | |
| | | | | | | | | | | | |
| | | | | | | | | | | | |
| | | | | | | | | | | | |
| | | | | | | | | | | | |
| | | | | | | | | | | | |
Other Comprehensive Income (Loss)
The following table summarizes our other comprehensive income (loss) and related tax effects for the periods presented: | | | | | | | | | | | | | | | | | | | | | | | | | | |
| | | | | | | | |
| | Three Months Ended March 31, |
| | 2024 | | 2023 |
| Millions of dollars | | Pre-tax | Tax Effect | Net | | Pre-tax | Tax Effect | Net |
| Currency translation adjustments | | $ | (29) | | $ | — | | $ | (29) | | | $ | (1) | | $ | — | | $ | (1) | |
| Cash flow hedges | | 33 | | (9) | | 24 | | | (16) | | 5 | | (11) | |
| Pension and other postretirement benefits plans | | 10 | | (2) | | 8 | | | 13 | | (2) | | 11 | |
| Other comprehensive income (loss) | | 14 | | (11) | | 3 | | | (4) | | 3 | | (1) | |
| Less: Other comprehensive income (loss) available to noncontrolling interests | | — | | — | | — | | | — | | — | | — | |
| Other comprehensive income (loss) available to Whirlpool | | $ | 14 | | $ | (11) | | $ | 3 | | | $ | (4) | | $ | 3 | | $ | (1) | |
| | | | | | | | | | | | | | | | | | | | | | | | | | |
| | | | | | | | |
| | Three Months Ended June 30, |
| | 2023 | | 2022 |
| Millions of dollars | | Pre-tax | Tax Effect | Net | | Pre-tax | Tax Effect | Net |
| Currency translation adjustments | | $ | 27 | | — | | $ | 27 | | | $ | 153 | | 1 | | $ | 154 | |
| Cash flow hedges | | (75) | | 18 | | (57) | | | 58 | | (18) | | 40 | |
| Pension and other postretirement benefits plans | | (11) | | 2 | | (9) | | | 21 | | (6) | | 15 | |
| Other comprehensive income (loss) | | (59) | | 20 | | (39) | | | 232 | | (23) | | 209 | |
| Less: Other comprehensive income (loss) available to noncontrolling interests | | — | | — | | — | | | — | | — | | — | |
| Other comprehensive income (loss) available to Whirlpool | | $ | (59) | | $ | 20 | | $ | (39) | | | $ | 232 | | $ | (23) | | $ | 209 | |
| | | | | | | | | | | | | | | | | | | | | | | | | | |
| | | | | | | | |
| | Six Months Ended June 30, |
| | 2023 | | 2022 |
| Millions of dollars | | Pre-tax | Tax Effect | Net | | Pre-tax | Tax Effect | Net |
| Currency translation adjustments | | $ | 26 | | — | | $ | 26 | | | $ | 258 | | 4 | | $ | 262 | |
| Cash flow hedges | | (91) | | 23 | | (68) | | | 1 | | 1 | | 2 | |
| Pension and other postretirement benefits plans | | 2 | | — | | 2 | | | 6 | | (4) | | 2 | |
| Other comprehensive income (loss) | | (63) | | 23 | | (40) | | | 265 | | 1 | | 266 | |
| Less: Other comprehensive income (loss) available to noncontrolling interests | | — | | — | | — | | | — | | — | | — | |
| Other comprehensive income (loss) available to Whirlpool | | $ | (63) | | $ | 23 | | $ | (40) | | | $ | 265 | | $ | 1 | | $ | 266 | |
Reclassifications Out of Accumulated Other Comprehensive Income (Loss)
There were no material net impacts of the reclassification adjustments out of accumulated other comprehensive income (loss) included in net earnings (loss) for the three and six months ended June 30, 2023:March 31, 2024.
Net earnings (loss) per Share
Diluted net earnings (loss) per share of common stock include the dilutive effect of stock options and other share-based compensation plans. Basic and diluted net earnings (loss) per share of common stock for the periods presented were calculated as follows:
| | | | | | | | | | | | | | | | | | | | | | | | | | |
| | Three Months Ended June 30, | | Six Months Ended June 30, |
| Millions of dollars and shares | | 2023 | | 2022 | | 2023 | | 2022 |
| Numerator for basic and diluted earnings per share - Net earnings (loss) available to Whirlpool | | $ | 85 | | | $ | (371) | | | $ | (94) | | | $ | (58) | |
| Denominator for basic earnings per share - weighted-average shares | | 55.0 | | | 56.0 | | | 54.9 | | | 57.1 | |
| Effect of dilutive securities - share-based compensation | | 0.2 | | | — | | | — | | | — | |
| Denominator for diluted earnings per share - adjusted weighted-average shares | | 55.2 | | | 56.0 | | | 54.9 | | | 57.1 | |
| Anti-dilutive stock options/awards excluded from earnings per share | | 1.2 | | | 0.6 | | | 1.0 | | | 0.5 | |
| | | | | | | | | | | | | | | | | | |
| | Three Months Ended March 31, | | |
| Millions of dollars and shares | | 2024 | | 2023 | | | | |
| Numerator for basic and diluted earnings per share - Net earnings (loss) available to Whirlpool | | $ | (259) | | | $ | (179) | | | | | |
| Denominator for basic earnings per share - weighted-average shares | | 54.9 | | | 54.8 | | | | | |
| | | | | | | | |
| Denominator for diluted earnings per share - adjusted weighted-average shares | | 54.9 | | | 54.8 | | | | | |
| Anti-dilutive stock options/awards excluded from earnings per share | | 1.2 | | | 0.9 | | | | | |
Share Repurchase Program
On April 19, 2021, our Board of Directors authorized a share repurchase program of up to $2 billion, which has no expiration date. On February 14, 2022, the Board of Directors authorized an additional $2 billion in share repurchases under the Company's ongoing share repurchase program. During the sixthree months ended June 30, 2023,March 31, 2024, we did not repurchase anyrepurchased 456 thousand shares under thesethe share repurchase programs.program at an aggregate price of approximately $50 million. At June 30, 2023,March 31, 2024, there were approximately $2.6$2.5 billion in remaining funds authorized under this program.
Share repurchases are made from time to time on the open market as conditions warrant. The programs doprogram does not obligate us to repurchase any of our shares and have no expiration date.
(11) RESTRUCTURING CHARGES
We periodically take action to improve operating efficiencies, typically in connection with business acquisitions or changes in the economic environment. Our footprint and headcount reductions and organizational integration actions relate to discrete, unique restructuring events, primarily reflected in the following plans.
In March 2024, the Company committed to workforce reduction plans in the United States and globally, in an effort to reduce complexity and simplify our organizational model after the European major domestic appliance transaction. The workforce reduction plans included involuntary severance actions as of the end of the first quarter of 2024. Total expected costs for these actions is $23 million, of which we have incurred $14 million in employee termination costs and $9 million other associated costs within the first quarter. All of these costs will result in cash settlements primarily in 2024. The Company is currently evaluating certain follow-on restructuring actions for the remainder of 2024.
The following table summarizes the changes to our restructuring liability during the three months ended March 31, 2024:
| | | | | | | | | | | | | | | | | |
| Millions of Dollars | December 31, 2023 | Charge to Earnings | Cash Paid | Non-Cash and Other | March 31, 2024 |
| Employee Termination | $ | 10 | | $ | 14 | | $ | (14) | | $ | — | | $ | 10 | |
| | | | | |
| | | | | |
| Other exit costs | — | | 9 | | — | | — | | 9 | |
| Total | $ | 10 | | $ | 23 | | $ | (14) | | $ | — | | $ | 19 | |
The following table summarizes the restructuring charges by operating segment and Corporate for the periods presented:
| | | | | | | | | | | |
| Millions of dollars | Three Months Ended March 31 | | |
| 2024 | 2023 | | | |
| MDA North America | $ | 4 | | $ | — | | | | |
| MDA Latin America | 3 | | — | | | | |
| MDA Asia | 1 | | — | | | | |
| | | | | |
| | | | | |
| Corporate/Other | 15 | | — | | | | |
| Total | $ | 23 | | $ | — | | | | |
(12) INCOME TAXES
Income tax expense was $114 million and $182$76 million for the three and six months ended June 30, 2023,March 31, 2024, compared to income tax expense of $37 million and $143$68 million for the same periodsperiod of 2022. For the three and six months ended June 30, 2023, the2023. The increase in income tax expense from the prior periods is primarily due to overall higher levelthe sale of earningsminority shares in Whirlpool of India and related capital gains, and legal entity restructuring tax expense, audits and settlements, and impacts of non-deductible impairments, including loss on sale and disposal and non-deductible fines and penalties.impacts.
The following table summarizes the difference between income tax expense (benefit) at the U.S. statutory rate of 21% and the income tax expense (benefit) at effective worldwide tax rates for the respective periods:
| | | | | | | | | | | | | | | | | | | | | | | |
| Three Months Ended June 30, | | Six Months Ended June 30, |
| Millions of dollars | 2023 | | 2022 | | 2023 | | 2022 |
| Earnings (Loss) before income taxes | $ | 204 | | | $ | (332) | | | $ | 95 | | | $ | 95 | |
| | | | | | | |
| Income tax expense (benefit) computed at United States statutory tax rate | 43 | | | (70) | | | 20 | | | 20 | |
| State and local taxes, net of federal tax benefit | 4 | | | 7 | | | 5 | | | 16 | |
| Valuation allowances | 17 | | | (1) | | | 21 | | | 6 | |
| Audit and Settlements | 34 | | | (29) | | | 54 | | | (26) | |
| U.S. foreign income items, net of credits | — | | | (2) | | | 2 | | | (10) | |
| | | | | | | |
| Non deductible impairments | 1 | | | 150 | | | 51 | | | 150 | |
| Non deductible fines and penalties | 10 | | | — | | | 20 | | | — | |
| | | | | | | |
| | | | | | | |
| Other | 5 | | | (18) | | | 9 | | | (13) | |
| Income tax expense (benefit) computed at effective worldwide tax rates | $ | 114 | | | $ | 37 | | | $ | 182 | | | $ | 143 | |
| | | | | | | |
(1) Prior year amounts on the table above have been reclassified to conform with current year presentation. | | | | | | | | | | | | | | | |
| Three Months Ended March 31, | | |
| Millions of dollars | 2024 | | 2023 | | | | |
| Earnings (Loss) before income taxes | $ | (177) | | | $ | (109) | | | | | |
| | | | | | | |
| Income tax expense (benefit) computed at United States statutory tax rate | (37) | | | (23) | | | | | |
| State and local taxes, net of federal tax benefit | (1) | | | 1 | | | | | |
| Valuation allowances | 19 | | | 4 | | | | | |
| Audit and Settlements | 2 | | | 20 | | | | | |
| U.S. foreign income items, net of credits | (13) | | | 2 | | | | | |
| | | | | | | |
| Sale of minority shares and capital gains | 79 | | | — | | | | | |
| Legal Entity restructuring tax impact | (35) | | | — | | | | | |
| Non deductible impairments | 49 | | | 50 | | | | | |
| Non deductible fines and penalties | — | | | 10 | | | | | |
| | | | | | | |
| | | | | | | |
| Other | 13 | | | 4 | | | | | |
| Income tax expense (benefit) computed at effective worldwide tax rates | $ | 76 | | | $ | 68 | | | | | |
| | | | | | | |
At the end of each interim period, we estimate the effective tax rate expected to be applicable for the full fiscal year and the impact of discrete items, if any, and adjust the quarterly rate as necessary.
Other Income Tax MattersSubsequent Events
DuringOn April 1, 2024, the Company completed its examination of Whirlpool’s 2009 U.S. federal income tax return, the IRS asserted that income earned by a Luxembourg subsidiary viatransaction with Arcelik related to its Mexican branch should be recognizedEuropean and MENA businesses. The disposal group has been classified as income on its 2009 U.S. federal income tax return. The Company believed the proposed assessment was without merit and contested the matter in United States Tax Court (US Tax Court). Both Whirlpool and the IRS movedheld for partial summary judgment on this issue. On May 5, 2020, the US Tax Court granted the IRS’s motion for partial summary judgment and denied Whirlpool’s.
The Company appealed the US Tax Court decision to the United States Court of Appeals for the Sixth Circuit, and, on December 6, 2021, the three-judge panel, in a divided decision, affirmed the U.S. Tax Court decision (the "Ruling"). The Company recorded a reserve of $98 million insale starting from the fourth quarter of 2021, which represents2022, resulting in a cumulative loss from disposal of businesses of approximately $1.9 billion through the expected increasefirst quarter of 2024. For income tax purposes, some of these losses were not realizable by the Company until the transaction closed in the Company’s netsecond quarter of 2024. In addition to income tax expense, plus interest, for 2009 through 2019, which represents all of the Company’s tax years that were affected by the Ruling. On January 20, 2022,recorded to date, the Company filedestimates that it will record additional deferred tax assets of between $100 and $300 million, net of applicable reserves and valuation allowances, in the second quarter of 2024, as a petition for rehearingresult of closing the transaction with Arcelik. For additional information, see Note 14 to the Sixth Circuit, which was denied on March 2, 2022. On June 30, 2022, theConsolidated Condensed Financial Statements.
(13) SEGMENT INFORMATION
Beginning January 1, 2024, we reorganized our operating segment structure to better represent the revised structure within our portfolio transformation, including a greater focus on our strong value creating small domestic appliance business. The Company filed a petition for certiorariimplemented this change to align with the U.S. Supreme Court, which was denied on November 21, 2022. The Company considers this tax dispute settledCompany's new operating structure, consistent with how the Company’s Chief Operating Decision Maker evaluates performance and no adjustments to the reserve have been recognized.
(12) SEGMENT INFORMATION
allocates resources in accordance with ASC 280, Segment Reporting. Our reportable segments are based upon geographical regionconsist of Major Domestic Appliances ("MDA") North America; MDA Europe, MDA Latin America; MDA Asia; and are defined as North America, EMEA, Latin America and Asia. These regions also represent our operating segments. Each segment manufactures home appliances and related components, but serves strategically different marketplaces. Small Domestic Appliances ("SDA") Global. All prior period amounts have been reclassified to conform with current period presentation.
The chief operating decision maker, who is the Company's Chairman and Chief Executive Officer, evaluates performance based on each segment's earnings (loss) before interest and taxes (EBIT), which we define as operating profit less interest and sundry (income) expense and excluding restructuring costs, asset impairment charges and certain other items that management believes are not indicative of the region's ongoing performance, if any. Total assets by segment are those assets directly associated with the respective operating activities. The "Other/Eliminations" column primarily includes corporate expenses, assets and eliminations, as well as restructuring costs, asset impairment charges and certain other items that management believes are not indicative of the region's ongoing performance, if any. Intersegment sales are eliminated within each region.segment.
The MDA Europe business was deconsolidated upon the completion of the European contribution agreement transaction with Arcelik as of April 1, 2024. For additional information see Note 14 to the Consolidated Condensed Financial Statements.
The tables below summarize performance by operating segment for the periods presented:
| | | | Three Months Ended March 31, | |
| | Three Months Ended March 31, | |
| | Three Months Ended March 31, | |
| | Three Months Ended June 30, | | | OPERATING SEGMENTS |
| | | OPERATING SEGMENTS |
| North
America | | EMEA | | Latin
America | | Asia | | Other / Eliminations | | Total
Whirlpool |
| | MDA North
America | | | | MDA North
America | | MDA Latin
America | | MDA Asia | | MDA Europe | | SDA Global | | Other / Eliminations | | Total
Whirlpool |
| Net sales | Net sales | |
| 2024 | |
| 2024 | |
| 2024 | |
| 2023 | 2023 | | $ | 2,824 | | | $ | 854 | | | $ | 819 | | | $ | 295 | | | $ | — | | | $ | 4,792 | |
| 2022 | | 2,964 | | | 1,008 | | | 787 | | | 338 | | | — | | | 5,097 | |
| Intersegment sales | Intersegment sales | |
| 2024 | |
| 2024 | |
| 2024 | |
| 2023 | 2023 | | $ | 50 | | | $ | 22 | | | $ | 376 | | | $ | 10 | | | $ | (458) | | | $ | — | |
| 2022 | | 92 | | | 24 | | | 404 | | | 11 | | | (531) | | | — | |
| Depreciation and amortization | Depreciation and amortization | |
| 2024 | |
| 2024 | |
| 2024 | |
| 2023 | 2023 | | $ | 51 | | | $ | — | | | $ | 17 | | | $ | 6 | | | $ | 15 | | | $ | 89 | |
| 2022 | | 42 | | | 35 | | | 16 | | | 5 | | | 16 | | | 114 | |
| EBIT | EBIT | |
| 2024 | |
| 2024 | |
| 2024 | |
| 2023 | 2023 | | $ | 290 | | | $ | 17 | | | $ | 53 | | | $ | 11 | | | $ | (81) | | | $ | 290 | |
| 2022 | | 417 | | | 2 | | | 57 | | | 23 | | | (785) | | | (286) | |
| Total assets | Total assets | |
| June 30, 2023 | | $ | 11,185 | | | $ | 2,151 | | | $ | 4,694 | | | $ | 1,588 | | | $ | (2,637) | | | $ | 16,981 | |
| December 31, 2022 | | 10,913 | | | 5,240 | | | 4,343 | | | 1,516 | | | (4,888) | | | 17,124 | |
| March 31, 2024 | |
| March 31, 2024 | |
| March 31, 2024 | |
| December 31, 2023 | |
| Capital expenditures | Capital expenditures | |
| 2024 | |
| 2024 | |
| 2024 | |
| 2023 | 2023 | | $ | 49 | | | $ | 22 | | | $ | 30 | | | $ | 1 | | | $ | 19 | | | $ | 121 | |
| 2022 | | 39 | | | 23 | | | 38 | | | 11 | | | 19 | | | 130 | |
| | | | | | | | | | | | | | | | | | | | | | | | | | | | | | | | | | | | | | |
| | | | | | | | | | | | |
| | Six Months Ended June 30, |
| | | OPERATING SEGMENTS |
| | North
America | | EMEA | | Latin
America | | Asia | | Other / Eliminations | | Total
Whirlpool |
| Net sales | | | | | | | | | | | | |
| 2023 | | $ | 5,571 | | | $ | 1,743 | | | $ | 1,576 | | | $ | 551 | | | $ | — | | | $ | 9,441 | |
| 2022 | | 5,755 | | | 2,092 | | | 1,547 | | | 623 | | | — | | | 10,017 | |
| Intersegment sales | | | | | | | | | | | | |
| 2023 | | $ | 108 | | | $ | 45 | | | $ | 753 | | | $ | 21 | | | $ | (927) | | | $ | — | |
| 2022 | | 164 | | | 48 | | | 763 | | | 22 | | | (997) | | | — | |
| Depreciation and amortization | | | | | | | | | | | | |
| 2023 | | $ | 103 | | | $ | — | | | $ | 34 | | | $ | 11 | | | $ | 30 | | | $ | 178 | |
| 2022 | | 85 | | | 70 | | | 32 | | | 10 | | | 29 | | | 226 | |
| EBIT | | | | | | | | | | | | |
| 2023 | | $ | 564 | | | $ | 22 | | | $ | 92 | | | $ | 19 | | | $ | (440) | | | $ | 257 | |
| 2022 | | 871 | | | (25) | | | 111 | | | 36 | | | (816) | | | 177 | |
| Total assets | | | | | | | | | | | | |
| June 30, 2023 | | $ | 11,185 | | | $ | 2,151 | | | $ | 4,694 | | | $ | 1,588 | | | $ | (2,637) | | | $ | 16,981 | |
| December 31, 2022 | | 10,913 | | | 5,240 | | | 4,343 | | | 1,516 | | | (4,888) | | | 17,124 | |
| Capital expenditures | | | | | | | | | | | | |
| 2023 | | $ | 96 | | | $ | 41 | | | $ | 45 | | | $ | 4 | | | $ | 31 | | | $ | 217 | |
| 2022 | | 69 | | | 35 | | | 61 | | | 17 | | | 35 | | | 217 | |
Assets of $3.6$3.5 billion and $3.4$3.3 billion associated with our European major domestic appliance business hashave been classified as assets held for sale and recorded at June 30, 2023fair value less costs to sell at March 31, 2024 and December 31, 2022,2023, respectively. Temporary fluctuations in regional assets are expected throughout the remainder of 2023 due to intercompany activity required by the expected contribution of the European major domestic appliance business. These changes are eliminated at the total entity level. See Note 1314 to the Consolidated Condensed Financial Statements for additional information on the transaction.
The following table summarizes the reconciling items in the Other/Eliminations column for total EBIT for the periods presented:
| | Three Months Ended June 30, | | Six Months Ended June 30, |
| Three Months Ended March 31, | |
| Three Months Ended March 31, | |
| Three Months Ended March 31, | |
| in millions | |
| in millions | |
| in millions | in millions | 2023 | 2022 | | 2023 | 2022 |
| Items not allocated to segments: | Items not allocated to segments: | |
| Items not allocated to segments: | |
| Items not allocated to segments: | |
| Restructuring charges | Restructuring charges | $ | (9) | | $ | (5) | | | $ | (9) | | $ | (10) | |
| Legacy EMEA legal matters | (36) | | — | | | (98) | | — | |
| Impairment of goodwill and other intangibles | — | | (384) | | | — | | (384) | |
| Gain (loss) on sale and disposal of businesses | (18) | | (346) | | | (240) | | (346) | |
| Restructuring charges | |
| Restructuring charges | |
| Legacy MDA Europe legal matters | |
| Legacy MDA Europe legal matters | |
| Legacy MDA Europe legal matters | |
| | (Loss) gain on sale and disposal of businesses | |
| | (Loss) gain on sale and disposal of businesses | |
| | (Loss) gain on sale and disposal of businesses | |
| | Corporate expenses and other | |
| | Corporate expenses and other | |
| | Corporate expenses and other | Corporate expenses and other | (18) | | (50) | | | (93) | | (76) | |
| Total other/eliminations | Total other/eliminations | $ | (81) | | $ | (785) | | | $ | (440) | | $ | (816) | |
| Total other/eliminations | |
| Total other/eliminations | |
|
A reconciliation of our segment information for total EBIT to the corresponding amounts in the Consolidated Condensed Statements of Comprehensive Income (Loss) is shown in the table below for the periods presented:
| | Three Months Ended June 30, | | Six Months Ended June 30, |
| | Three Months Ended March 31, | |
| | Three Months Ended March 31, | |
| | Three Months Ended March 31, | |
| in millions | in millions | | 2023 | 2022 | | 2023 | 2022 |
| Operating profit | | $ | 303 | | $ | (306) | | | $ | 346 | | $ | 155 | |
| in millions | |
| in millions | |
| Operating (loss) profit | |
| Operating (loss) profit | |
| Operating (loss) profit | |
| Interest and sundry (income) expense | |
| Interest and sundry (income) expense | |
| Interest and sundry (income) expense | Interest and sundry (income) expense | | 10 | | (19) | | | 87 | | (26) | |
| Equity method investment income (loss), net of tax | Equity method investment income (loss), net of tax | | (3) | | 1 | | | (2) | | (4) | |
| Equity method investment income (loss), net of tax | |
| Equity method investment income (loss), net of tax | |
| Total EBIT | |
| Total EBIT | |
| Total EBIT | Total EBIT | | $ | 290 | | $ | (286) | | | $ | 257 | | $ | 177 | |
| Interest expense | Interest expense | | 89 | | 45 | | | 164 | | 86 | |
| Interest expense | |
| Interest expense | |
| Income tax expense | |
| Income tax expense | |
| Income tax expense | Income tax expense | | 114 | | 37 | | | 182 | | 143 | |
| Net earnings (loss) | Net earnings (loss) | | $ | 87 | | $ | (368) | | | $ | (89) | | $ | (52) | |
| Net earnings (loss) | |
| Net earnings (loss) | |
| Less: Net earnings available to noncontrolling interests | |
| Less: Net earnings available to noncontrolling interests | |
| Less: Net earnings available to noncontrolling interests | Less: Net earnings available to noncontrolling interests | | 2 | | 3 | | | 5 | | 6 | |
| Net earnings (loss) available to Whirlpool | Net earnings (loss) available to Whirlpool | | $ | 85 | | $ | (371) | | | $ | (94) | | $ | (58) | |
| Net earnings (loss) available to Whirlpool | |
| Net earnings (loss) available to Whirlpool | |
(13)14) ACQUISITIONS AND DIVESTITURES
European Major Domestic Appliance Business Held for Sale
On January 16, 2023, Whirlpool entered into a contribution agreement with Arçelik B.V. (“Arcelik”) to carve out and contribute our major domestic appliance European business operations into a newly formed European appliance company which constitutes a combination of Arcelik’s and Whirlpool's European businesses. Whirlpool will own approximately 25% and Arcelik will own approximately 75% of the European appliance company.company ("Beko"). The sale includes the Company's major domestic appliance business in EMEA,Europe, including nine production sites.
On June 22, 2023, Whirlpool entered into a share purchase agreement with Arcelik for the sale of our Middle East and North Africa ("MENA") business. The sale was previously agreed upon in principle and announced on January 17, 2023, as part of the outcome of Whirlpool’s strategic review of the EMEA business. The financial impact of the MENA transaction has been included in the loss on sale and disposal of businesses related to the European major domestic appliance business transaction as discussed further below.
Our European major domestic appliance business, including the MENA business, is reported within our EMEA reportable segment andThe disposal group met the criteria for held for sale accounting during the fourth quarter of 2022. The operations of the European disposal group did not meet the criteria to be presented as discontinued operations.
Both transactions are subject to certainSubsequent Events
On April 1, 2024, the parties closed the aforementioned contribution transaction and MENA sale. Upon closing conditions and expected to be completed concurrently in the fourthsecond quarter of 2023.
Upon closing,2024, the transaction will resultresulted in the deconsolidation of the European major appliances business.and MENA businesses. In connection with the sale,transactions, we recorded a loss on disposal of $1,521 million$1.5 billion in the fourth quarter of 2022. The loss includes a write-down of the net assets of $1,151 million$1.2 billion of the disposal group to a fair value of $139 million and also includes $393 million of cumulative currency translation adjustments, $98 million release of other comprehensive loss on pension and $18 million of other transaction related costs. No goodwill is included in the disposal group.
We recorded an adjustment of $240$247 million for the sixthree months ended June 30, 2023, of which $18 million was recorded during the second quarter,March 31, 2024, resulting in a total loss of $1,761 million$1.9 billion for the transaction. These adjustments are recorded in the loss on sale and disposal of businesses and reflect transaction costs and ongoing reassessment of the fair value less costs to sell of the disposal group which will continue to behas been evaluated each reporting period until completion of the transaction. No further material adjustments are expected in subsequent periods.
Both Whirlpool and the post-closing controlling interest shareholderArcelik retain an option for Arcelik to purchase the remaining equity interest in a newly formed European appliance companyBeko for fair value, which could be material to the financial statements of the Company, depending on the performance of the business.
The European disposal group is classified as held for sale as of March 31, 2024 and the following table presents the carrying amounts of the major classes of the disposal group's assets and liabilities as of June 30, 2023March 31, 2024 and December 31, 2022,2023, respectively.
| | | | | | | | | | | | | | | | | | |
| | | | | | | |
| Millions of dollars | | | | | | | June 30, 2023 | December 31, 2022 |
| Carrying amounts of major classes of assets | | | | | | | | |
| Current Assets | | | | | | | | |
| Cash and cash equivalents | | | | | | | $ | 96 | | $ | 94 | |
| Accounts receivable, net of allowance of $31 and $32, respectively | | | | | | | 756 | | 667 | |
| Inventories | | | | | | | 655 | | 650 | |
| Prepaid and other current assets | | | | | | | 128 | | 145 | |
| Total current assets | | | | | | | 1,635 | | 1,556 | |
| Property, net of accumulated depreciation of $1,670 and $1,648, respectively | | | | | | | 877 | | 822 | |
| Right of use assets | | | | | | | 166 | | 163 | |
| | | | | | | | |
| Other intangibles, net of accumulated amortization of $146 and $141, respectively | | | | | | | 285 | | 279 | |
| Deferred income taxes | | | | | | | 608 | | 610 | |
| Other noncurrent assets | | | | | | | 16 | | 17 | |
| Total noncurrent assets | | | | | | | 1,952 | | 1,891 | |
| Total assets | | | | | | | $ | 3,587 | | $ | 3,447 | |
| Carrying amounts of major classes of liabilities | | | | | | | | |
| Current liabilities | | | | | | | | |
| Accounts payable | | | | | | | $ | 1,220 | | $ | 1,394 | |
| Accrued expenses | | | | | | | 245 | | 152 | |
| Accrued advertising and promotions | | | | | | | 170 | | 172 | |
| Employee compensation | | | | | | | 99 | | 107 | |
| Notes payable | | | | | | | 3 | | 3 | |
| Other current liabilities | | | | | | | 107 | | 125 | |
| Total current liabilities | | | | | | | 1,844 | | 1,953 | |
| Noncurrent liabilities | | | | | | | | |
| Long-term debt | | | | | | | 1 | | 2 | |
| Pension benefits | | | | | | | 114 | | 122 | |
| Lease liabilities | | | | | | | 136 | | 131 | |
| Other noncurrent liabilities | | | | | | | 100 | | 88 | |
| Total noncurrent liabilities | | | | | | | 351 | | 343 | |
| Total liabilities | | | | | | | $ | 2,195 | | $ | 2,296 | |
| | | | | | | | |
| Total net assets of the disposal group classified as held for sale | | | | | | | $ | 1,392 | | $ | 1,151 | |
| | | | | | | | | | | |
| Assets held for sale | Fair value of interest retained | $ | 144 | | $ | 139 | |
| Liabilities held for sale | Cumulative currency translation adjustment and Other comprehensive income on pension | $ | 468 | | $ | 490 | |
| | | | | | | | | | | | | | | | | | |
| | | | | | | |
| Millions of dollars | | | | | | | March 31, 2024 | December 31, 2023 |
| Carrying amounts of major classes of assets | | | | | | | | |
| Current Assets | | | | | | | | |
Cash and cash equivalents (1) | | | | | | | $ | 245 | | $ | 97 | |
| Accounts receivable, net of allowance of $28 and $28, respectively | | | | | | | 646 | | 578 | |
| Inventories | | | | | | | 555 | | 589 | |
| Prepaid and other current assets | | | | | | | 101 | | 94 | |
| Total current assets | | | | | | | 1,547 | | 1,358 | |
| Property, net of accumulated depreciation of $1,370 and $1,442, respectively | | | | | | | 952 | | 952 | |
| Right of use assets | | | | | | | 151 | | 162 | |
| | | | | | | | |
| Other intangibles, net of accumulated amortization of $146 and $149, respectively | | | | | | | 280 | | 286 | |
| Deferred income taxes | | | | | | | 553 | | 574 | |
| Other noncurrent assets | | | | | | | 34 | | 13 | |
| Total noncurrent assets | | | | | | | 1,970 | | 1,987 | |
| Total assets | | | | | | | $ | 3,517 | | $ | 3,345 | |
| Carrying amounts of major classes of liabilities | | | | | | | | |
| Current liabilities | | | | | | | | |
| Accounts payable | | | | | | | $ | 1,179 | | $ | 1,266 | |
| Accrued expenses | | | | | | | 208 | | 218 | |
| Accrued advertising and promotions | | | | | | | 122 | | 171 | |
| Employee compensation | | | | | | | 130 | | 120 | |
| Notes payable | | | | | | | 8 | | 4 | |
| Other current liabilities | | | | | | | 89 | | 97 | |
| Total current liabilities | | | | | | | 1,736 | | 1,876 | |
| Noncurrent liabilities | | | | | | | | |
| | | | | | | | |
| Pension benefits | | | | | | | 160 | | 168 | |
| Lease liabilities | | | | | | | 121 | | 132 | |
| Other noncurrent liabilities | | | | | | | 122 | | 87 | |
| Total noncurrent liabilities | | | | | | | 403 | | 387 | |
| Total liabilities | | | | | | | $ | 2,139 | | $ | 2,263 | |
| | | | | | | | |
| Total net assets of the disposal group classified as held for sale | | | | | | | $ | 1,378 | | $ | 1,082 | |
| | | | | | | | | | | |
| Assets held for sale | Fair value of consideration | $ | 227 | | $ | 144 | |
| Liabilities held for sale | Cumulative currency translation adjustment and Other comprehensive income on pension | $ | 577 | | $ | 587 | |
(1)Cash and cash equivalents of the disposal group increased due to cash retained in Europe for certain contingencies and other retained liabilities.
The following table summarizes European major appliances business'the MDA Europe's earnings (loss) available to Whirlpool before income taxes for the sixthree months ended June 30,March 31, 2024 and March 31, 2023 and June 30, 2022 respectively:
| | Six Months Ended June 30, | |
| | Three Months Ended March 31, | |
| | Three Months Ended March 31, | |
| | Three Months Ended March 31, | |
| in millions | |
| in millions | |
| in millions | in millions | | 2023 | 2022 | |
| Earnings (loss) before income taxes | Earnings (loss) before income taxes | | $ | 12 | | $ | (70) | | |
| Earnings (loss) before income taxes | |
| Earnings (loss) before income taxes | |
Earnings (loss) before income taxes excludesexclude intercompany other income and expense, which eliminatesis eliminated at the Total Whirlpool level. Additionally, the EMEA operating segment includes other businesses which are not classified as held for sale.
InSinkErator AcquisitionWhirlpool India share sale
On August 7, 2022,November 30, 2023, the Company enteredannounced its intention to enter into an Assetone or more transactions to sell up to 24% of the outstanding shares of its publicly listed Whirlpool of India Limited subsidiary (“Whirlpool India”) in 2024, and Stock Purchase Agreement (the “Purchase Agreement”) with Emerson Electric Co. (“Emerson”) to purchase Emerson’s InSinkErator business,retain a manufacturermajority interest following completion of food waste disposers and instant hot water dispensers for home and commercial use, for a purchase price of $3 billion in cash, subject to customary adjustments.the sale.
On October 31, 2022, we completedFebruary 20, 2024, the acquisitionCompany’s wholly-owned subsidiary, Whirlpool Mauritius Limited (“Seller”), executed the sale of the InSinkErator business pursuant to the terms30.4 million equity shares of the Purchase Agreement. We used the net proceeds from a $2.5 billion borrowing under our delayed draw term loan facility and $500 million of cash on hand to fund the acquisition. See Note 5 to the Consolidated Condensed Financial Statements for additional information about the term loan facility.
Purchase Price Allocation
Whirlpool India via an on-market trade. The acquisition has beensale, which was accounted for as aan equity transaction, reduced Seller’s ownership in Whirlpool India from 75% to 51%, and generated proceeds of $462 million on settlement.
Latin America sale of Brastemp water filtration subscription business combination under the acquisition method of accounting. This requires allocation of the purchase price to the estimated fair values of the identifiable assets acquired and liabilities assumed, including goodwill and other intangible assets. The Company is in the process of finalizing third-party valuations for the preliminary purchase price allocation which are subject to change. Purchase accounting adjustments during the period were not material. The Company expects to finalize any further purchase accounting adjustments as soon as practicable, but no later than one year from the acquisition date.
The following table presents the preliminary allocation of purchase price related to the InSinkErator acquisition as of June 30, 2023. Purchase accounting adjustments recorded during the second quarter of 2023 were not material.
| | | | | |
(in millions) | Amount |
Cash and cash equivalents | $ | 7 | |
Receivables, net | 74 | |
Inventories | 93 | |
Other current assets | 1 | |
Property, plant and equipment, net | 173 | |
Goodwill | 1,152 | |
Other intangible assets | 1,630 | |
Other assets | 11 | |
Accounts payable | 49 | |
Accrued expenses | 26 | |
Other current liabilities | 34 | |
Deferred income taxes | 1 | |
Other long-term liabilities | 10 | |
Total Estimated Purchase Consideration | $ | 3,021 | |
Russia Sale Transaction
On June 27, 2022, Whirlpool EMEA SpA, a subsidiary of Whirlpool Corporation (the “Company”),January 16, 2024, the Company entered into a share purchase agreement with a third-party buyer to sell the Company’s RussiaCompany's Brastemp-branded water filtration subscription business to Arçelik A.Ş. (“Arcelik”), subject to customary conditions at closing.in the Latin America region. The sale included the entiretycompletion of the Company’s operations in Russia, including the Company’s manufacturing facility in Lipetsk, Russia, and the sales organization in Moscow, Russia, as well as sales operations in Kazakhstantransaction is contingent upon regulatory approvals and other select CIS countries.
On August 31, 2022, we completed the salecustomary closing conditions, and is anticipated to Arcelik.occur in 2024. The consideration includes contingent consideration based on future business and other conditions of the Russia operations. We will recognize the benefit of the contingent consideration when received due to the uncertainty in the Russia marketplace. Additionally, the contingent consideration is subject to a cap based on the agreed net asset value of the Russia business of €261 million at closing (approximately $262 million at August 31, 2022).
The Russia business was reported within our EMEA reportable segment anddisposal group met the criteria forof held for sale accounting.at December 31, 2023. The operations of Russia did not meet the criteria to be presented as discontinued operations.
In connection with the sale, we recorded a loss on disposal of $346 million in the second quarter of 2022. The loss includes a charge of $333 million for the write-down of the net assetscarrying amounts of the disposal groupgroup's assets and liabilities as of December 31, 2023 are immaterial. The disposal group's earnings (loss) available to fair value and $13 million of cumulative currency translation adjustments. On the closing date of August 31, 2022, we recorded an immaterial adjustment to the final loss amount, resulting in a total loss of $348 million for the nine months ended September 30, 2022.
EarningsWhirlpool before income taxes for Russia were immaterial to the Consolidated Condensed Financial Statements for the periods presented.
For additional information see Note 9 to the Consolidated Condensed Financial Statements.
(14) GOODWILL AND OTHER INTANGIBLES
Goodwill
The following table summarizes goodwill attributable to our reporting units for the periods presented:
| | | | | | | | | | | | | | | |
| Millions of dollars | North America | | Latin America | Asia | Total Whirlpool |
| Beginning balance December 31, 2022 | $ | 2,829 | | | $ | 33 | | $ | 452 | | $ | 3,314 | |
| | | | | |
| | | | | |
| | | | | |
Acquisitions(1) | 16 | | | — | | — | | 16 | |
| Currency translation | 2 | | | — | | (1) | | 1 | |
| | | | | |
| Ending net balance June 30, 2023 | $ | 2,847 | | | $ | 33 | | $ | 451 | | $ | 3,331 | |
(1)Increase in goodwill is related to the purchase of InSinkErator business. For additional information, see Notes 9and 13 to the Consolidated Condensed Financial Statements.
For the sixthree months ended June 30,March 31, 2024, and 2023, there no indicators of goodwill impairment for any of our reporting units based on our qualitative assessment.
In the second quarter of 2022, we identified indicators of goodwill impairment for our EMEA reporting unit, which required us to complete an interim impairment assessment. The primary indicators of impairment were the adverse impacts from the continuation of the Russia and Ukraine conflict, including the impact on demand, the pending divestiture of our Russian operations and other ongoing adverse macroeconomic impacts such as raw material inflation, supply chain disruption and unfavorable demand. As a result of these factors, the operating results for the three-months ended June 30, 2022 were significantly lower than expected and our expectations of attaining our long term plans for the region have been delayed.
In performing our quantitative assessment of goodwill, we estimated the reporting unit's fair value under an income approach using a discounted cash flow model. The income approach used the reporting unit's projections of estimated operating results and cash flows that were discounted using a market participant discount rate based on the weighted-average cost of capital. The main assumptions supporting the cash flow
projections include revenue growth, EBIT margins and the discount rate. The financial projections reflect management's best estimate of economic and market conditions over the projected period including forecasted revenue growth, EBIT margins, tax rate, capital expenditures, depreciation and amortization, changes in working capital requirements and the terminal growth rate.
Based on our interim quantitative impairment assessment as of June 30, 2022, the carrying value of the EMEA reporting unit exceeded its fair value and we recorded a goodwill impairment charge for the full amount of the goodwill's carrying value of $278 million during the second quarter of 2022.
See Note 9 to the Consolidated Condensed Financial Statements for additional information.
Other Intangible Assets
The following table summarizes other intangible assets for the periods presented:
| | | | | | | | | | | | | | | | | | | | | | | |
| June 30, 2023 | | December 31, 2022 |
| Millions of dollars | Gross Carrying Amount | Accumulated Amortization | Net | | Gross Carrying Amount | Accumulated Amortization | Net |
| Other intangible assets, finite lives | | | | | | | |
Customer relationships (1) | $ | 668 | | $ | (306) | | $ | 362 | | | $ | 668 | | $ | (287) | | $ | 381 | |
Patents and other (2) | 116 | | (114) | | 2 | | | 116 | | (113) | 3 | |
| Total other intangible assets, finite lives | $ | 784 | | $ | (420) | | $ | 364 | | | $ | 784 | | $ | (400) | | $ | 384 | |
| Trademarks, indefinite lives | 2,780 | | — | | 2,780 | | | 2,780 | | — | 2,780 | |
| Total other intangible assets | $ | 3,564 | | $ | (420) | | $ | 3,144 | | | $ | 3,564 | | $ | (400) | | $ | 3,164 | |
(1) Customer relationships have an estimated useful life of 5 to 19 years.
(2) Patents and other intangibles have an estimated useful life of 3 to 43 years.
For the six months ended June 30, 2023, there were no indicators of impairment associated with other intangible assets based on our qualitative assessment.
In the second quarter of 2022, we identified indicators of impairment associated with other intangible assets in our EMEA reporting unit, which required us to complete an interim impairment assessment. The primary indicators of impairment were the same as those identified for EMEA reporting unit and resulted in the actual revenues for the three-months ended June 30, 2022 being significantly lower than forecasted for Indesit and Hotpoint* trademarks.
In performing our quantitative assessment of other intangible assets, primarily trademarks, we estimate the fair value using the relief-from-royalty method which requires assumptions related to projected revenues from our long-range plans; assumed royalty rates that could be payable if we did not own the trademark; and a discount rate using a market-based weighted-average cost of capital. Based on our interim quantitative impairment assessment as of June 30, 2022, the carrying value of certain other intangible assets, including Indesit and Hotpoint*, exceeded their fair value, and we recorded an impairment charge of $106 million during the second quarter of 2022. See Note 9 to the Consolidated Condensed Financial Statements for additional information.
The estimates of future cash flows used in determining the fair value of goodwill and intangible assets involve significant management judgment andrespectively, are based upon assumptions about expected future operating performance, economic conditions, market conditions and cost of capital. Inherent in estimating the future cash flows are uncertainties beyond our control, such as changes in capital markets. The actual cash flows could differ materially from management's estimates due to changes in business conditions, operating performance and economic conditions.
*Whirlpool ownership of the Hotpoint brand in the EMEA and Asia Pacific regions is not affiliated with the Hotpoint brand sold in the Americas.also immaterial.
| | | | | |
| ITEM 2. | MANAGEMENT'S DISCUSSION AND ANALYSIS OF FINANCIAL CONDITION AND RESULTS OF OPERATIONS |
The following Management's Discussion and Analysis of Financial Condition and Results of Operations (MD&A) is intended to promote understanding of the results of operations and financial condition of the Company and generally discusses the results of operations for the current quarterthree months ended period compared to the same prior yearprior-year period. MD&A is provided as a supplement to, and should be read in connection with, the Consolidated Condensed Financial Statements and Notes to the Consolidated Condensed Financial Statements included in this Form 10-Q.
Certain references to particular information in the Notes to the Consolidated Condensed Financial Statements are made to assist readers.
ABOUT WHIRLPOOL
Whirlpool Corporation ("Whirlpool"), committed to being the best global is a leading kitchen and laundry appliance company, in constant pursuit of improving life at home was incorporatedand inspiring generations with our brands. The company is driving meaningful innovation to meet the evolving needs of consumers through its iconic brand portfolio, including Whirlpool, KitchenAid, JennAir, Maytag, Amana, Brastemp, Consul, and InSinkErator. In 2023, the Company reported approximately $19 billion in 1955 under the laws of Delawareannual sales, 59,000 employees, and was founded in 1911. Whirlpool manufactures products in ten countries55 manufacturing and markets products in nearly every country around the world. We have received worldwide recognition for accomplishments in a variety of business and social efforts, including leadership, diversity, innovative product design, business ethics, social responsibility and community involvement. We conducttechnology research centers. Beginning January 1, 2024, we are conducting our business through fourfive operating segments, which we define based on geography. Whirlpool's operating segments consist of Major Domestic Appliances ("MDA") North America,America; MDA Europe, Middle EastMDA Latin America; MDA Asia; and AfricaSmall Domestic Appliances ("EMEA"SDA"), Latin America and Asia. Whirlpool had approximately $20 billion in annual net sales and 61,000 employees in 2022. Global.
OVERVIEW
Whirlpool delivered second-quarterfirst-quarter GAAP net earnings (loss) available to Whirlpool of $85$(259) million (net earnings (loss) margin of 1.8%(5.8)%), or $1.55$(4.72) per share, compared to GAAP net earnings (loss) available to Whirlpool of $(371)$(179) million (net earnings margin of (7.3)(3.9)%), or $(6.62)$(3.27) per share in the same prior-year period. Whirlpool delivered cash provided by (used in) operating activities of $(370)$(873) million for the sixthree months ended June 30, 2023,March 31, 2024, compared to $(180)$(477) million in the same prior year period and free cash flow (non-GAAP) of $(587)$(988) million, compared to free cash flow of $(397)$(573) million in the same prior year period.
Whirlpool delivered second-quarterfirst-quarter ongoing (non-GAAP) earningsearnings per share of $4.21$1.78 and ongoing EBIT margin of 7.3%4.3%, compared to $5.97$2.66 and 9.0% in5.4% in the same prior-year period.period.
On a GAAP basis, net earnings margins were impacted by charges associated with legacy EMEA legal matters (see Note 6 for further information) and a non-cash charge related to the held for sale treatment for EMEA (see Note 1314 for further information). and other EMEA transaction costs. On a GAAP and ongoing basis, quarterly results were impacted by unfavorable productnegative price/mix, and unfavorable industry demand in EMEA, partially offset by cost takeout actions. On a GAAP basis net earnings were also impacted by higher income tax expense primarily due to the sale of minority shares in Whirlpool of India and related capital gains, and legal entity restructuring tax impacts. Ongoing earnings per share gains in North America and Latin America along withresults were also impacted from tax benefits related to the favorable impacts of strong cost take out actions and the benefitsclosure of the InSinkErator acquisition.Europe transaction.
We continue to take actions to deliver shareholder value as we navigate through a challenging macro environment, demonstrated by market share gains ina strong cadence of new product introductions, and previously announced increase of MDA North America and increased distributionpromotional program prices alongside $300 to eight$400 million of the top ten national home builders.2024 cost take out actions. We are also advancingcompleted a major milestone of our portfolio transformation, with the integrationclosing of InSinkErator and we continue to progress towards completing the European major domestic applianceEurope transaction which is expected to close in the fourth quarter of 2023.on April 1, 2024.
For additional information regarding non-GAAP financial measures, see the Non-GAAP Financial Measures section of this Management's Discussion and Analysis.
RESULTS OF OPERATIONS
The following table summarizes the consolidated results of operations for the periods presented:
| | | |
| | | | Three Months Ended June 30, | Six Months Ended June 30, |
| Consolidated - Millions of dollars, except per share data | Consolidated - Millions of dollars, except per share data | 2023 | 2022 | Better/(Worse) % | 2023 | 2022 | Better/(Worse) % |
| Consolidated - Millions of dollars, except per share data | |
| Consolidated - Millions of dollars, except per share data | |
| Net sales | |
| Net sales | |
| Net sales | Net sales | $ | 4,792 | | $ | 5,097 | | (6.0)% | $ | 9,441 | | $ | 10,017 | | (5.8)% |
| Gross margin | Gross margin | 816 | | 897 | | (9.0) | 1,579 | | 1,748 | | (9.7) |
| Gross margin | |
| Gross margin | |
| Selling, general and administrative | |
| Selling, general and administrative | |
| Selling, general and administrative | Selling, general and administrative | 476 | | 461 | | (3.3) | 963 | | 837 | | (15.1) |
| Restructuring costs | Restructuring costs | 9 | | 5 | | (80.0) | % | 9 | | 10 | | 10.0 |
| Impairment of goodwill and other intangibles | — | | 384 | | nm | — | | 384 | | 100.0 |
| (Gain) loss on sale and disposal of businesses | 18 | | 346 | | 94.8 | 240 | | 346 | | (30.6) |
| Restructuring costs | |
| Restructuring costs | |
| | Loss (gain) on sale and disposal of businesses | |
| | Loss (gain) on sale and disposal of businesses | |
| | Loss (gain) on sale and disposal of businesses | |
| Interest and sundry (income) expense | |
| Interest and sundry (income) expense | |
| Interest and sundry (income) expense | Interest and sundry (income) expense | 10 | | (19) | | nm | 87 | | (26) | | nm |
| Interest expense | Interest expense | 89 | | 45 | | (97.8) | 164 | | 86 | | (90.7) |
| Interest expense | |
| Interest expense | |
| Income tax expense (benefit) | |
| Income tax expense (benefit) | |
| Income tax expense (benefit) | Income tax expense (benefit) | 114 | | 37 | | (208.1) | 182 | | 143 | | (27.3) |
| Net earnings (loss) available to Whirlpool | Net earnings (loss) available to Whirlpool | $ | 85 | | $ | (371) | | nm | $ | (94) | | $ | (58) | | (62.1) |
| Diluted net earnings (loss) available to Whirlpool per share | $ | 1.55 | | $ | (6.62) | | nm | $ | (1.71) | | $ | (1.00) | | (71.0)% |
| Net earnings (loss) available to Whirlpool | |
| Net earnings (loss) available to Whirlpool | |
Diluted net earnings (loss) available to Whirlpool per share (2) | |
Diluted net earnings (loss) available to Whirlpool per share (2) | |
Diluted net earnings (loss) available to Whirlpool per share (2) | |
(1) Not meaningful ("nm")
(2) As a result of the GAAP earnings loss for the three months ended March 31, 2023, and March 31, 2024, respectively, the impact of antidilutive shares was excluded from the loss per share calculation on a GAAP basis.
Consolidated net sales decreased 6.0% and 5.8%3.4% for the three and six months ended June 30, 2023, respectively,March 31, 2024 compared to the same periodsperiod in 2022.2023. The decrease for the three and six months ended June 30, 2023March 31, 2024 was primarily driven by unfavorable product price/mix, and unfavorable industry demand in EMEA, partially offset by share gains in North Americafavorable impacts of foreign currency and Latin America and increased volume from the acquisition of the InSInkErator business.higher volume. Excluding the impact of foreign currency, net sales decreased 5.6% and 4.7%, respectively,4.4% for the three and six months ended June 30, 2023,March 31, 2024, compared to the same periodsperiod in 2022.2023.
The consolidated gross margin percentage for the three and six months ended June 30, 2023March 31, 2024 decreased to 17.0% and 16.7%, respectively,14.3% compared to 17.6% and 17.5%16.4% in the same prior-year periods.period. The decrease was primarily driven by unfavorable product price/mix, partially offset by favorable cost take out actions.productivity.
OurBeginning January 1, 2024, we are conducting our business through five operating segments, are based upon geographical regionwhich consist of Major Domestic Appliances ("MDA") North America; MDA Europe, MDA Latin America; MDA Asia; and are defined as North America, EMEA, Latin America and Asia. These regions also represent our reportable segments.Small Domestic Appliances ("SDA") Global. The chief operating decision maker evaluates performance based on each segment's earnings (loss) before interest and taxes (EBIT), which we define as operating profit less interest and sundry (income) expense and excluding restructuring costs, asset impairment charges and certain other items that management believes are not indicative of the region's ongoing performance, if any. For additional information, see Note 1213 to the Consolidated Condensed Financial Statements.
The following is a discussion of results for each of our operating segments. Each of our operating segments have been impacted by some disruptions in supply chains and distribution channels, which largely stabilized in the first quarter of 2023, among other macroeconomic impacts.
MDA NORTH AMERICA
Net Sales
Net sales decreased 4.7% and 3.2%8.1% for the three and six months ended June 30, 2023March 31, 2024 compared to the same periodsperiod in 2022,2023. The decrease was primarily driven by unfavorable impactimpacts of product/price product price/mix partially offset by increased volume related to the acquisition of the InSinkErator business.and lower industry demand. Excluding the impact from foreign currency, net sales decreased 4.4% and 2.8%8.1% for the three and six months ended June 30, 2023,March 31, 2024, compared to the same periodsperiod in 2022.2023.
EBIT
EBIT decreased for the three and six months ended June 30, 2023March 31, 2024 compared to the same periodsperiod in 20222023. The decrease for the three months ended was primarily due to unfavorable impact of product price/mix, partially offset by favorable impact of the InSinkErator acquisition and cost take outtakeout actions. EBIT margin was 10.3% and5.6% for the three months ended March 31, 2024, compared to 10.1% for the three and six months ended June 30, 2023, compared to 14.1% and 15.1% for the same periodsperiod in 2022.2023.
EMEAMDA LATIN AMERICA
Net Sales
Net sales decreased 15.3% and 16.7%increased 12.0% for the three and six months ended June 30, 2023,March 31, 2024, compared to the same periodsperiod in 2022.2023. The decrease isincrease was primarily due to increased volume, partially offset by unfavorable impacts of product price/mix. Excluding the impact from foreign currency, net sales increased 8.4% for the three months ended March 31, 2024, respectively, compared to the same period in 2023.
EBIT
EBIT increased for the three months ended March 31, 2024 compared to the same period in 2023. The increase for the three months ended was primarily driven by lower volumecost take out actions, impact of foreign currency, raw material inflation and the Russia divestiture,indirect tax benefit, partially offset by favorableunfavorable product price/mix. EBIT margin was 7.8% for the three months ended March 31, 2024, compared to 4.8% for the same period in 2023.
MDA ASIA
Net Sales
Net sales decreased 2.4% for the three months ended March 31, 2024 compared to the same period in 2023. The decrease was primarily due to unfavorable impacts of product price/mix. Excluding the impact from foreign currency, net sales decreased 16.3% and 14.7%1.7% for the three and six months ended June 30, 2023,March 31, 2024 compared to the same periodsperiod in 2022.
EBIT
EBIT increased for the three and six months ended June 30, 2023March 31, 2024 compared to the same periodsperiod in 2022,2023. The increase was primarily due to thedriven by favorable benefitsimpacts of held-for-sale treatment and cost take out actions, partially offset by reduced volume.unfavorable product price/mix. EBIT margin was 2.0% and 1.3%4.6% for the three and six months ended June 30, 2023,March 31, 2024 compared to 0.2% and (1.2)%3.3% for the same periodsperiod in 2022.2023.
LATIN AMERICA
Net Sales
Net sales Increased 4.1% and 1.9%decreased 5.0% for the three and six months ended June 30, 2023,March 31, 2024, compared to the same periodsperiod in 2022.2023. The sales were impacteddecrease was driven by increasedlower volume, and favorable product price/mix, partially offset by impactfavorable impacts of foreign currency. Excluding the impact from foreign currency, net sales increased 4.6% and 2.3%decreased 6.9% for the three and six months ended June 30, 2023, respectively,March 31, 2024, compared to the same periodsperiod in 2022.
EBIT
EBIT decreased for the three and six months ended June 30, 2023March 31, 2024 compared to the same periodsperiod in 2022 primarily due to2023. The decrease for the three months ended is driven by reduced volumes, increased infrastructure costs and unfavorable impact of costproduct price/mix, partially offset by decreased raw material inflation. EBIT margin was 6.5% and 5.8% (1.1)%for the three and six months ended June 30, 2023,March 31, 2024, compared to 7.2% and 7.2%(0.6)% for the same periodsperiod in 2022.2023.
ASIA
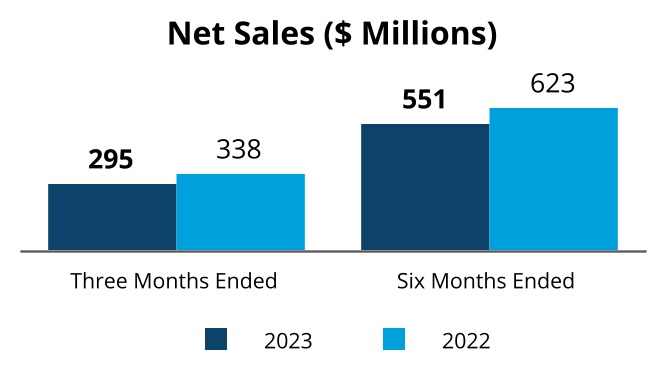
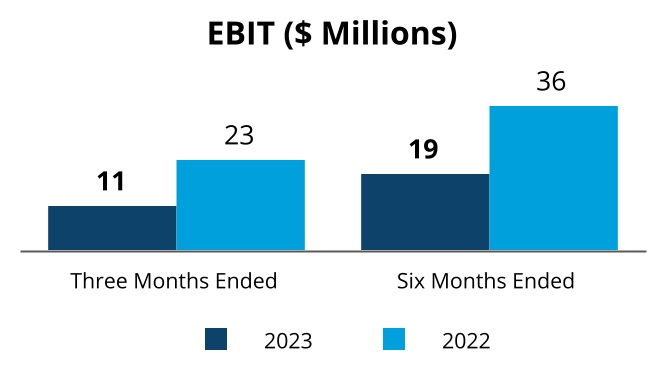
SDA GLOBAL
Net Sales
Net sales decreased 12.7% and 11.6%increased 7.1% for the three and six months ended June 30, 2023March 31, 2024 compared to the same periodsperiod in 2022.2023. The decrease is primarily drivenincrease reflects higher volumes, partially offset by unfavorable impacts of foreign currency, product price/mix and decreased volume.mix. Excluding the impact from foreign currency, net sales decreased 8% and 5.9%increased 6.5% for the three and six months ended June 30, 2023 compared to the same periods in 2022.
EBIT
EBIT decreased for the three and six months ended June 30, 2023March 31, 2024 compared to the same period in 2022.2023.
EBIT
EBIT increased for the three months ended March 31, 2024 compared to the same period in 2023. The decreaseincrease was primarily due todriven by increased cost take out actions and decreased marketing spend, partially offset by unfavorable product price/mix, partially offset by favorable cost take out.mix. EBIT margin was 3.7% and 3.4%18.1% for the three and six months ended June 30, 2023March 31, 2024 compared to 6.8% and 5.8%11.2% for the same periodsperiod in 2022.2023.
Selling, General and Administrative
The following table summarizes selling, general and administrative expenses as a percentage of net sales by region for the periods presented:
| | | | | | | | | | | | | | | | | | | | | | | | | | | | | | | | | | | | | | | | | | | | | | | | | | |
| | | Three Months Ended June 30, | | Six Months Ended June 30, |
| Millions of dollars | | 2023 | | As a % of Net Sales | | 2022 | | As a % of Net Sales | | 2023 | | As a % of Net Sales | | 2022 | | As a % of Net Sales |
| North America | | $ | 244 | | | 8.6 | % | | $ | 209 | | | 7.1 | % | | $ | 463 | | | 8.3 | % | | $ | 369 | | | 6.4 | % |
| EMEA | | 90 | | | 10.5 | | | 98 | | | 9.7 | | | 177 | | | 10.2 | | | 193 | | | 9.2 | |
| Latin America | | 75 | | | 9.2 | | | 68 | | | 8.6 | | | 155 | | | 9.8 | | | 132 | | | 8.5 | |
| Asia | | 30 | | | 10.2 | | | 33 | | | 9.7 | | | 59 | | | 10.7 | | | 65 | | | 10.4 | |
| Corporate/other | | 37 | | | — | | | 53 | | | — | | | 109 | | | — | | | 78 | | | — | |
| Consolidated | | $ | 476 | | | 9.9 | % | | $ | 461 | | | 9.0 | % | | $ | 963 | | | 10.2 | % | | $ | 837 | | | 8.4 | % |
| | | | | | | | | | | | | | | | | | | | | | | | | | | | | | | | | | |
| | | Three Months Ended March 31, | | |
| Millions of dollars | | 2024 | | As a % of Net Sales | | 2023 (1) | | As a % of Net Sales | | | | | | | | |
| MDA North America | | $ | 186 | | | 7.6 | % | | $ | 192 | | | 7.3 | % | | | | | | | | |
| MDA Latin America | | 74 | | | 8.8 | | | 78 | | | 10.4 | | | | | | | | | |
| MDA Asia | | 25 | | | 10.4 | | | 26 | | | 10.6 | | | | | | | | | |
| MDA Europe | | 90 | | | 11.1 | | | 79 | | | 9.3 | | | | | | | | | |
| SDA Global | | 37 | | | 20.1 | | | 43 | | | 25.3 | | | | | | | | | |
| Corporate/other | | 65 | | | — | | | 69 | | | — | | | | | | | | | |
| Consolidated | | $ | 477 | | | 10.6 | % | | $ | 487 | | | 10.5 | % | | | | | | | | |
(1) Effective January 1st, 2024, we reorganized our operating segment structure. All prior period amounts have been reclassified to conform with current period presentation. For additional information, see Note 13 to the Consolidated Condensed Financial Statements.
Consolidated selling, general and administrative expenses increasedwere flat for the three and six months ended June 30, 2023March 31, 2024 compared to the same periodsperiod in 2022 and is primarily driven by impacts of portfolio transformation and increased marketing investments, in addition to a gain from the sale-leaseback transaction in the first quarter of 2022.2023.
For additional information, see Note 1 to the Consolidated Condensed Financial Statements.
Restructuring
We incurred restructuring charges of $9 million and $9$23 million for the three and six months ended June 30, 2023, respectivelyMarch 31, 2024 compared to $5 million and $10 millionnone for the same periodsperiod in 2022. 2023. For additional information, see Note 11 to the Consolidated Condensed Financial Statements.
For the full year 2023,2024, we expect to incur less thanapproximately $50 million of restructuring charges, similar to the past two years.
Impairment of Goodwill and Other Intangibles
We recorded an impairment loss of $384 million related to goodwill ($278 million) and other intangibles ($106 million) for the three and six months ended June 30, 2022 related to the EMEA reporting unit, Indesit and Hotpoint* trademarks, respectively.
The primary indicators of impairment were the adverse impacts from the continuation of the Russia and Ukraine conflict resultingwhich substantially all will result in economic uncertainty in the EMEA region, the pending divestiture of our Russia operations and other macroeconomic factors.
For additional information, see Note 9 and 14 of the Consolidated Condensed Financial Statements and the Other Information section below.cash settlement.
(Gain) Loss on Sale and Disposal of Businesses
In the fourthfirst quarter of 2022,2024, we incurred a loss on sale and disposal of $1,521$247 million compared to $222 million in the same period of 2023. Both amounts were related to the planned divestiture of our European major domestic appliance business. During the second quarter of 2023, we recorded an additional $18 million for the loss on disposal,business and were primarily due to fair value fluctuations driven by seasonality of net working capital, and transaction costs, resulting in ancosts. The aggregate loss on disposal of $240 millionrecorded for the six months ending June 30, 2023 and a total lossEuropean major domestic appliance transaction since the fourth quarter of $1,761 million for the transaction. This adjustment2022 is recorded in the loss on sale and disposal of businesses and reflects transaction costs and ongoing reassessment of the fair value less costs to sell of the disposal group which will continue to be evaluated each reporting period until completion of the transaction.
We incurred a loss of $346 million for the three and six months ended June 30, 2022 related to charges on the pending sale of the Russia business.$1.9 billion.
For additional information, see Note 1314 to the Consolidated Condensed Financial Statements.
Interest and Sundry (Income) Expense
Net interest and sundry expense increaseddecreased for the three and six months ended June 30, 2023March 31, 2024 compared to the same period in 20222023. The decrease is primarily due to reserves related tofor legacy EMEA legal matters. For additional information, see Note 6 tomatters recorded in the Consolidated Condensed Financial Statements.prior year.
Interest Expense
Interest expense was $89 million and $164$90 million for the three and six months ended June 30, 2023March 31, 2024 compared to $45 million and $86$75 million in the same periods in 2022.period of 2023. The increase is primarily due to an increase in short-term debt driven by the InSinkErator acquisition.and higher interest rates.
Income Taxes
Income tax expense was $114 million and $182$76 million for the three and six months ended June 30, 2023March 31, 2024 compared to income tax expense of $37 million and $143$68 million in the same periodsperiod of 2022.2023. The increase wasfor the three months ended March 31, 2024 is primarily driven by overall higher leveldue to the sale of earnings24% of the shares of Whirlpool of India and related capital gains, and legal entity restructuring tax expense, audits and settlements, and impacts of non-deductible impairments, including loss on sale and disposal and non-deductible fines and penalties.
impacts. For additionalmore information, see Note 1112 to the Consolidated Condensed Financial Statements.
Other Information
Our Critical Accounting Policies and Estimates for goodwill and other indefinite-lived intangibles are disclosed in Note 1 to the Consolidated Financial Statements and in Management's Discussion and Analysis of our annual report on Form 10-K for the fiscal year ended December 31, 2022.2023.
We continue to monitor the significant global economic uncertainty to assess the outlook for demand for our products and the impact on our business and our overall financial performance. Our Maytag and JennAirInSinkErator trademarks continue to be at risk at June 30, 2023.March 31, 2024. None of our reporting units or other indefinite-lived intangible assets are presently at risk for future impairment.
For additional information, see Note 1 to the Consolidated Condensed Financial Statements.
FINANCIAL CONDITION AND LIQUIDITY
Background
Our objective is to finance our business through operating cash flow and the appropriate mix of long-term and short-term debt. By diversifying the maturity structure, we avoid concentrations of debt, reducing liquidity risk. We have varying needs for short-term working capital financing as a result of the nature of our business. We regularly review our capital structure and liquidity priorities, which include funding innovation and growth through capital expenditures and research and development expenditures as well as opportunistic mergers and acquisitions; and providing returns to shareholders through dividends, share repurchases and maintaining our strong investment grade rating.
The Company believes that free cash flow provides stockholders with a relevant measure of liquidity and a useful basis for assessing Whirlpool's ability to fund its activities and obligations. Whirlpool has historically been able to leverage its strong free cash flow generation to fund our operations, pay for any debt servicing costs and allocate capital for reinvestment in our business, funding share repurchases and dividend payments.
Our short-term potential uses of liquidity include funding our business operations, ongoing capital spending, debt repayment, and returns to shareholders. We currently have $1.3 billionAs of March 31, 2024, we had $500 million of debt maturing inwithin the next twelve months related to the first tranche of our term loan, which we repaid in April 2024.
On February 20, 2024, Whirlpool’s wholly-owned subsidiary, Whirlpool Mauritius Limited, executed the sale of 30.4 million equity shares of Whirlpool India via an on-market trade. The transaction reduced Whirlpool’s ownership in Whirlpool India from 75% to 51%, and are currently evaluating our options in connection with this maturing debt, which may include repayment through refinancing, free cash flow generation or cashgenerated sales proceeds of approximately $462 million on hand.settlement. The Company used transaction proceeds to reduce debt.
We monitor the credit ratings and market indicators of credit risk of our lending, depository, derivative counterparty banks, and customers regularly, and take certain actions to manage credit risk. We diversify our deposits and investments in short-term cash equivalents to limit the concentration of exposure by counterparty.
Cash and cash equivalents
The Company had cash and cash equivalents of approximately $1.3$1.2 billion at June 30, 2023.March 31, 2024. For cash in each of its foreign subsidiaries, the Company makes an assertion regarding the amount of earnings intended for permanent reinvestment, with the balance available to be repatriated to the United States. The cash held by foreign subsidiaries for permanent reinvestment is generally used to finance the subsidiaries' operational activities and expected future foreign investments. Our intent is to permanently reinvest these funds outside of the United States and our current plans do not demonstrate a need to repatriate the cash to fund our U.S. operations. However, if these funds were repatriated, we would be required to accrue and pay applicable United States taxes (if any) and withholding taxes payable to various countries. It is not practicable to estimate the amount of the deferred tax liability associated with the repatriation of cash due to the complexity of its hypothetical calculation.
At June 30, 2023,March 31, 2024, we had cash or cash equivalents greater than 1% of our consolidated assets in Brazil (2.2%), United States (1.7%(2.0%), India (1.4%(1.6%) and Mexicothe United States (1.2%). In addition, we had third-party accounts receivable outside of the United States greater than 1% of our consolidated assets in Brazil and Mexico, which represented 1.8%.1.5% and 1.1%, respectively. We continue to monitor general financial instability and uncertainty globally.
Revolving credit facility and other committed credit facilities
The Company maintains a $3.5 billion revolving credit facility and a committed $2.5 billion term loan. There was $2.5$2.0 billion drawn on the committed credit facilities at June 30, 2023.March 31, 2024. In addition to these facilities, we have committed credit facilities in Brazil and India that provide borrowings up to approximately $220$212 million at June 30, 2023.March 31, 2024.
We were in compliance with our interest coverage ratio under the revolving credit facility and term loan as of June 30, 2023.March 31, 2024. For additional information, see Note 5 to the Consolidated Condensed Financial Statements.
Notes payable
Notes payable consists of short-term borrowings payable to banks and commercial paper, which are generally used to fund working capital requirements. At June 30, 2023,March 31, 2024, we have no$500 million of notes payable outstanding primarily under the revolving credit facility or commercial paper programs. For additional information, see Note 5 to the Consolidated Condensed Financial Statements.
Trade customers
We continue to review customer conditions globally. We had no material impacts from customer insolvencies during the three months ended June 30, 2023,March 31, 2024, nor do we have immediate visibility into material customer insolvency situations occurring in the future. We continue to monitor these situations, considering each geographic region, the unique credit risk specific to the country, marketplace and economic environment, and take appropriate risk mitigation steps.
For additional information on guarantees, see Note 6 to the Consolidated Condensed Financial Statements.
Share Repurchase Program
For additional information about our share repurchase program, see Note 10 to the Consolidated Condensed Financial Statements.
Sources and Uses of Cash
The following table summarizes the net increase (decrease) in cash, cash equivalents and restricted cash for the periods presented:
| | Six Months Ended June 30, |
| | Three Months Ended March 31, | | | | Three Months Ended March 31, |
| Millions of dollars | Millions of dollars | | 2023 | | 2022 | Millions of dollars | | 2024 | | 2023 |
| Cash provided by (used in): | Cash provided by (used in): | |
| Operating activities | |
| Operating activities | |
| Operating activities | Operating activities | | $ | (370) | | | $ | (180) | |
| Investing activities | Investing activities | | (222) | | | (142) | |
| Financing activities | Financing activities | | (110) | | | (1,022) | |
| Effect of exchange rate changes | Effect of exchange rate changes | | 55 | | | 12 | |
| Less: decrease in cash classified as held for sale | | (2) | | | (70) | |
| Less: (decrease) increase in cash classified as held for sale | |
| Net change in cash, cash equivalents and restricted cash | Net change in cash, cash equivalents and restricted cash | | $ | (649) | | | $ | (1,402) | |
|
Cash Flows from Operating Activities
More cash was used in operating activities during the sixthree months ended June 30, 2023March 31, 2024 compared to the same period in 2022.2023. The increase in cash used in operating activities was primarily driven by lower cash earnings and unfavorable changesfluctuations in working capital partially offset by a decrease in employee payments. The working capital change was primarily impacted by a decrease in volume.due to higher accounts receivable due to timing of shipments within the quarter and customer mix along with lower accounts payable due to reduced production volumes.
The timing of cash flows from operations varies significantly throughout the year primarily due to changes in production levels, sales patterns, promotional programs, funding requirements, credit management, as well as receivable and payment terms. Depending on the timing of cash flows, the location of cash balances, as well as the liquidity requirements of each country, external sources of funding are used to support working capital requirements.
Cash Flows from Investing Activities
Cash used in investing activities during the sixthree months ended June 30, 2023 increased compared toMarch 31, 2024 was comparable in each period and primarily reflects the same prior year period primarily due to impactsimpact of proceeds from the sale of assets and businesses in the prior year period.capital expenditures.
Cash Flows from Financing Activities
Cash used inprovided by financing activities during the sixthree months ended June 30, 2023 decreasedMarch 31, 2024 increased compared to the same period in 20222023 primarily due to lower share repurchases.increased short-term borrowings and the sale of minority interest shares in Whirlpool India.
Financing Arrangements
The Company had total committed credit facilities of approximately $6.2$5.7 billion at June 30, 2023.March 31, 2024. These facilities are geographically reflective of the Company's global operations. The Company is confident that the committed credit facilities are sufficient to support its global operations. We had $2.5$2.0 billion drawn on the committed credit facilities (representing amounts drawn on the term loan) at June 30, 2023March 31, 2024 and December 31, 2022,2023, respectively, which were used to fund the InSinkErator acquisition in the fourth quarter of 2022.
For additional information about our financing arrangements, see Note 5 to the Consolidated Condensed Financial Statements.
Dividends
On April 18, 2023,February 19, 2024, our Board of Directors approved a quarterly dividend on our common stock of $1.75 per share.
Off-Balance Sheet Arrangements
In the ordinary course of business, we enter into agreements with financial institutions to issue bank guarantees, letters of credit, and surety bonds. These agreements are primarily associated with unresolved tax matters in Brazil, as is customary under local regulations, and other governmental obligations and debt agreements. At June 30, 2023,March 31, 2024, we had approximately $446$407 million outstanding under these agreements.
For additional information about our off-balance sheet arrangements, see Notes 5 and 6 to the Consolidated Condensed Financial Statements.
NON-GAAP FINANCIAL MEASURES
We supplement the reporting of our financial information determined under U.S. generally accepted accounting principles (GAAP) with certain non-GAAP financial measures, some of which we refer to as "ongoing" measures, including:
•Earnings before interest and taxes (EBIT)
•EBIT margin
•Ongoing EBIT
•Ongoing earnings per diluted share
•Ongoing EBIT margin
•Sales excluding foreign currency
•Free cash flow
•GrossNet debt leverage
Ongoing measures, including ongoing earnings per diluted share and ongoing EBIT, exclude items that may not be indicative of, or are unrelated to, results from our ongoing operations and provide a better baseline for analyzing trends in our underlying businesses. EBIT margin is calculated by dividing EBIT by net sales. Ongoing EBIT margin is calculated by dividing ongoing EBIT by net sales. Sales excluding foreign currency is calculated by translating the current period net sales, in functional currency, to U.S. dollars using the prior-year period's exchange rate compared to the prior-year period net sales. Management believes that sales excluding foreign currency provides stockholders with a clearer basis to assess our results over time, excluding the impact of exchange rate fluctuations. Management believes that GrossNet Debt Leverage (Gross(Net Debt/Ongoing EBITDA) provides stockholders with a clearer basis to assess the Company's ability to pay off its incurred debt. We also disclose segment EBIT, which we define as operating profit less interest and sundry (income) expense and excluding restructuring costs, asset impairment charges and certain other items, if any, that management believes are not indicative of the region's ongoing performance, as the financial metric used by the Company's Chief Operating Decision Maker to evaluate performance and allocate resources in accordance with ASC 280, Segment Reporting. We have begun a process of reassessing our current operating segment structure as part of the expected completion of the European major domestic appliance transaction.
Management believes that free cash flow provides stockholders with a relevant measure of liquidity and a useful basis for assessing Whirlpool's ability to fund its activities and obligations. The Company provides free cash flow related metrics, such as free cash flow as a percentage of net sales, as long-term management goals, not an element of its annual financial guidance, and as such does not provide a reconciliation of free cash flow to cash provided by (used in) operating activities, the most directly comparable GAAP measure, for these long-term goal metrics. Any such reconciliation would rely on market factors and certain other conditions and assumptions that are outside of the Company's control. Whirlpool does not provide a non-GAAP reconciliation for its other forward-looking long-term value creation and other goals, such as organic net sales, EBIT, and grossNet debt/Ongoing EBITDA, as such reconciliation would rely on market factors and certain other conditions and assumptions that are outside of the company’s control.
We believe that these non-GAAP measures provide meaningful information to assist investors and stockholders in understanding our financial results and assessing our prospects for future performance, and reflect an additional way of viewing aspects of our operations that, when viewed with our GAAP financial
measures, provide a more complete understanding of our business. Because non-GAAP financial measures are not standardized, it may not be possible to compare these financial measures with other companies' non-GAAP financial measures having the same or similar names. These non-GAAP financial measures should not be considered in isolation or as a substitute for reported net earnings (loss) available to Whirlpool, net sales, net earnings (loss) as a percentage of net sales (net earnings margin), net earnings (loss) per diluted share and cash provided by (used in) operating activities, the most directly comparable GAAP financial measures. We strongly encourage investors and stockholders to review our financial statements and publicly-filed reports in their entirety and not to rely on any single financial measure.
Please refer to a reconciliation of these non-GAAP financial measures to the most directly comparable GAAP financial measures below.
| Ongoing Earnings Before Interest & Taxes (EBIT) Reconciliation: in millions
| Ongoing Earnings Before Interest & Taxes (EBIT) Reconciliation: in millions
| Three Months Ended June 30, | | Six Months Ended June 30, |
| 2023 | 2022 | | 2023 | 2022 |
Ongoing Earnings Before Interest & Taxes (EBIT) Reconciliation: in millions
| |
| | 2024 | |
| 2024 | |
Net earnings (loss) available to Whirlpool (1) | |
Net earnings (loss) available to Whirlpool (1) | |
Net earnings (loss) available to Whirlpool (1) | Net earnings (loss) available to Whirlpool (1) | $ | 85 | | $ | (371) | | | $ | (94) | | $ | (58) | |
| Net earnings (loss) available to noncontrolling interests | Net earnings (loss) available to noncontrolling interests | 2 | | 3 | | | 5 | | 6 | |
| Net earnings (loss) available to noncontrolling interests | |
| Net earnings (loss) available to noncontrolling interests | |
| Income tax expense (benefit) | |
| Income tax expense (benefit) | |
| Income tax expense (benefit) | Income tax expense (benefit) | 114 | | 37 | | | 182 | | 143 | |
| Interest expense | Interest expense | 89 | | 45 | | | 164 | | 86 | |
| Earnings before interest & taxes | $ | 290 | | $ | (286) | | | $ | 257 | | $ | 177 | |
Impairment of goodwill and other intangibles (a) | — | | 384 | | | — | | 384 | |
| Interest expense | |
| Interest expense | |
| Earnings (loss) before interest & taxes | |
| Earnings (loss) before interest & taxes | |
| Earnings (loss) before interest & taxes | |
| Restructuring expense (a) | |
| Restructuring expense (a) | |
| Restructuring expense (a) | |
Impact of M&A transactions (b) | Impact of M&A transactions (b) | 26 | | 363 | | | 248 | | 363 | |
Legacy EMEA legal matters (c) | 36 | | — | | | 98 | | — | |
Impact of M&A transactions (b) | |
Impact of M&A transactions (b) | |
Legacy MDA Europe legal matters (c) | |
Legacy MDA Europe legal matters (c) | |
Legacy MDA Europe legal matters (c) | |
| Ongoing EBIT (2) | |
| Ongoing EBIT (2) | |
| Ongoing EBIT (2) | Ongoing EBIT (2) | $ | 352 | | $ | 461 | | | $ | 603 | | $ | 924 | |
|
(1)Net earnings (loss) margin is approximately 1.8% and (1.0)(5.8)% for the three and six months ended June 30, 2023March 31, 2024 compared to (7.3)% and (0.6)(3.9)% in the same prior year periods.period. Net earnings margin is calculated by dividing net earnings (loss) available to Whirlpool by consolidated net sales for the three and six months ended June 30,March 31, 2024 and March 31, 2023, and June 30, 2022, respectively.
(2)Ongoing EBIT margin is approximately 7.3%4.3% and 6.4%for the three and six months ended June 30, 2023March 31, 2024 compared to 9.0% and 9.2%5.4% in the same prior year periods.period. Ongoing EBIT margin is calculated by dividing Ongoing EBIT by consolidated net sales for the three and six months ended June 30,March 31, 2024 and March 31, 2023, and June 30, 2022, respectively.
| | Earnings Per Diluted Share | Three Months Ended June 30, | |
| 2023 | 2022 | |
| Ongoing Earnings Per Diluted Share Reconciliation | |
| | Ongoing Earnings Per Diluted Share Reconciliation | |
| | 2024 | |
| 2024 | |
| Earnings (loss) per diluted share | |
| Earnings (loss) per diluted share | |
| Earnings (loss) per diluted share | Earnings (loss) per diluted share | $ | 1.55 | | $ | (6.62) | | |
| Impairment of goodwill and other intangibles (a) | — | | 6.86 | | |
| Impact of M&A transactions (b) | Impact of M&A transactions (b) | 0.47 | | 6.49 | | |
| Legacy EMEA legal matters (c) | 0.65 | | — | | |
| Impact of M&A transactions (b) | |
| Impact of M&A transactions (b) | |
| Legacy MDA Europe legal matters (c) | |
| Legacy MDA Europe legal matters (c) | |
| Legacy MDA Europe legal matters (c) | |
Restructuring expense (a) | |
Restructuring expense (a) | |
Restructuring expense (a) | |
| Income tax impact | |
| Income tax impact | |
| Income tax impact | Income tax impact | (0.12) | | (2.51) | | |
Normalized tax rate adjustment (d) | Normalized tax rate adjustment (d) | 1.66 | | 1.78 | | |
Normalized tax rate adjustment (d) | |
Normalized tax rate adjustment (d) | |
Share count adjustment (e) | |
Share count adjustment (e) | |
Share count adjustment (e) | Share count adjustment (e) | — | | (0.03) | | |
| Ongoing earnings per diluted share | Ongoing earnings per diluted share | $ | 4.21 | | $ | 5.97 | | |
| Ongoing earnings per diluted share | |
| Ongoing earnings per diluted share | |
| | | | | | | | | | | |
Free Cash Flow (FCF) Reconciliation: in millions | Six Months Ended June 30, | | Six Months Ended June 30, |
| 2023 | | 2022 |
| Cash provided by (used in) operating activities | $ | (370) | | | $ | (180) | |
| Capital expenditures | (217) | | | (217) | |
| Free cash flow | $ | (587) | | | $ | (397) | |
| | | |
| Cash provided by (used in) investing activities | $ | (222) | | | $ | (142) | |
| Cash provided by (used in) financing activities | $ | (110) | | | $ | (1,022) | |
| | | | | | | | | | | |
Free Cash Flow (FCF) Reconciliation: in millions | Three Months Ended March 31, | | Three Months Ended March 31, |
| 2024 | | 2023 |
| Cash provided by (used in) operating activities | $ | (873) | | | $ | (477) | |
| Capital expenditures | (115) | | | (96) | |
| Free cash flow | $ | (988) | | | $ | (573) | |
| | | |
| Cash provided by (used in) investing activities | $ | (115) | | | $ | (110) | |
| Cash provided by (used in) financing activities | $ | 818 | | | $ | (38) | |
Footnotes
(a) IMPAIRMENT OF GOODWILL AND OTHER INTANGIBLESRESTRUCTURING EXPENSE - The carrying value ofIn March 2024, the EMEA reporting unit and Indesit and Hotpoint* trademarks exceeded their fair values resulting in an impairment charge of $384Company committed to workforce reduction plans. $23 million was recorded during the secondfirst quarter, of 2022.which $14 million was employee termination costs and $9 million was other associated exit costs. For additional information see Note 14the full year 2024, we expect to the Consolidated Condensed Financial Statements.incur approximately $50 million of restructuring charges.
(b) IMPACT OF M&A TRANSACTIONS - On January 16, 2023, we signed a contribution agreement to contribute our European major domestic appliance business into a newly formed entity with Arçelik. In connection with the transaction, we recorded a non-cash loss on disposal of $240$247 million for the sixthree months ended June 30, 2023, of which $18 million was recorded during the second quarter, resulting in a total loss of $1,761 million for the transaction.
March 31, 2024. Additionally, we have incurred other unique transaction related costs related to portfolio transformation for a total of $8$12 million for the three and six months ended June 30, 2023.March 31, 2024. These transaction costs are recorded in Selling, General and Administrative expenses on our Consolidated Condensed Statements of Comprehensive Income (Loss).
During the secondfirst quarter of 2022,2023 we entered into an agreement to sell our Russia business. We classified this disposal group as held for sale and recorded an impairment lossadjustment of $346 million for the write-down of the net assets to their fair value. For additional information, see Note 13 to the Consolidated Condensed Financial Statements. Additionally, we incurred unique transaction related costs of $17$222 million related to portfolio transformation and EMEA strategic assessment expenses.the loss on disposal for the European major domestic appliance business transaction.
(c)LEGACY MDA EUROPE LEGAL MATTERS LEGACY EMEA LEGAL MATTERS - The aggregate amount During the first quarter of 2023, the Company accrued by the Company$62 million related to the Competition Investigation and other legacy legalTrade Customer Insolvency matters of our European major domestic appliance business was $36 million and $98 million, for the three and six months ended June 30, 2023, respectively. For additional information, see Note 6 to the Consolidated Condensed Financial Statements.business.
(d) NORMALIZED TAX RATE ADJUSTMENT - During the secondfirst quarter of 2023,2024, the Company calculated ongoinga GAAP tax rate of 42.9%. Ongoing earnings per share was calculated using an adjusted tax rate of 10.9%0%, which excludes the non-tax deductible impact of M&A transactions of approximately $26$205 million recorded in the secondfirst quarter of 2024 The Company expects a full-year GAAP tax rate of approximately 25% and adjusted effective tax rate of approximately 0%.
During the first quarter of 2023, to reconcile to our anticipated full-year ongoing effectivethe Company calculated a GAAP tax rate between 10.0%14.0% and 15.0%16.0%. During the second quarter of 2022, the Company calculated ongoingOngoing earnings per share was calculated using an adjusted tax rate of 18.8% to reconcile to our anticipated full-year ongoing 2022 effective tax rate between 21% and 23%.15.0%
(e) SHARE COUNT ADJUSTMENT -During the first quarter of 2024 and 2023, respectively, the net earnings (loss) available to Whirlpool was a loss. Consequently any increases in the number of shares within the denominator results in a lower loss per share and is therefore antidilutive. As a result, of our GAAP earnings lossthe shares are not included in the second quarter of 2022, the impact of antidilutive shares was excluded from the loss per share calculation on a GAAP basis. The share count adjustment used in the calculation of the second-quarter of 2022Company's ongoing earnings per diluted share includes basic shares outstanding of 56.0 million plus the impact of antidilutive shares of 0.3 million which were excluded on a GAAP basis.calculation.
FORWARD-LOOKING PERSPECTIVE
Earnings per diluted share presented below are net of tax. We currently estimate at our anticipated 20232024 full-year GAAP tax rate of approximately 25% and adjusted tax rate between 10.0% and 15.0%of approximately 0%. We currently estimate earnings per diluted share for 2023 to be within the following ranges:2024 as follows:
| | | | | |
| 20232024 |
| Current Outlook |
Estimated GAAP earnings per diluted share, for the year ending December 31, 20232024 | $13.005.00 - $15.00$7.00 |
| Including: | |
| |
| Impact of M&A transactions | $2.265.00 |
| |
Legacy EMEA legal mattersRestructuring expense | $1.781.00 |
| Income tax impact | $(0.51)
| Normalized tax rate adjustment | $0.392.00 |
| |
| |
| Industry Demand | |
| MDA North America | (6)0 - (4)%2% |
EMEAMDA Latin America | (6)0 - (4)%3% |
Latin AmericaMDA Asia | (3)4 - (1)%6% |
AsiaSDA Global | 2 - 4% |
| MDA Europe (Q1 Actuals) | (1)% |
For the full-year 2023,2024, we expect to generate cash from operating activities of approximately $1,400$1,150 - $1,250 million and free cash flow of approximately $800$550 - $650 million, including restructuring cash outlays of approximately $25$50 million and capital expenditures of approximately $600 million.
The table below reconciles projected 20232024 cash provided by operating activities determined in accordance with GAAP to free cash flow, a non-GAAP measure. Management believes that free cash flow provides stockholders with a relevant measure of liquidity and a useful basis for assessing Whirlpool's ability to fund its activities and obligations. There are limitations to using non-GAAP financial measures, including the difficulty associated with comparing companies that use similarly named non-GAAP measures whose calculations may differ from our calculations. We define free cash flow as cash provided by operating activities less capital expenditures. For additional information regarding non-GAAP financial measures, see the Non-GAAP Financial Measures section of this Management's Discussion and Analysis.
| | | | | | | | |
| Millions of dollars | 20232024 |
| Current Outlook |
Cash provided by (used in) operating activities (1) | ~1,4001,150 - $1,250 |
| Capital expenditures | ~600 |
| Free cash flow | ~800550 - $650 |
(1)Financial guidance on a GAAP basis for cash provided by (used in) financing activities and cash provided by (used in) investing activities has not been provided because in order to prepare any such estimate or projection, the Company would need to rely on market factors and certain other conditions and assumptions that are outside of its control.
The projections above are based on many estimates and are inherently subject to change based on future decisions made by management and the Board of Directors of Whirlpool, and significant economic, competitive and other uncertainties and contingencies. Additional information concerning these and other factors can be found in the "Risk Factors" section of our Annual Report on Form 10-K, as updated in Part II, Item 1A of our Quarterly Reports on Form 10-Q.
OTHER MATTERS
For additional information regarding certain of our loss contingencies/litigation, see Note 6 to the Consolidated Condensed Financial Statements. Unfavorable outcomes in these proceedings could have a material adverse effect on our financial statements in any particular reporting period.
Antidumping Petitions
As previously reported, Whirlpool filed petitions in 2011 and 2015 alleging that Samsung, LG and Electrolux violated U.S. and international trade laws by dumping large residential washers into the U.S. Those petitions resulted in orders imposing antidumping duties on certain large residential washers imported from South Korea, Mexico, and China, and countervailing duties on certain large residential washers from South Korea. In March 2019, the order covering certain large residential washers from Mexico was extended for an additional five years, while the order covering certain large residential washers from South Korea was revoked.and is subject to an extension proceeding in 2024. In August 2022, the order covering certain large residential washers from China was extended for an additional five years.
Raw Materials and Global Economy
The current domestic and international political environment have contributed to uncertainty surrounding the future state of the global economy. We have experienced raw material inflation in certain prior years based on the impact of U.S. tariffs and other global macroeconomic factors. Due to many factors beyond our control, including the conflict in Ukraine and related sanctions, COVID-related shutdownsthe Israel-Palestinian conflict, the Red Sea conflict and its impact on shipping and logistics and government actions in China, among other factors, we expect to continue to be impacted by the following factors: a global shortage of certain components, such as semiconductors, a strain on raw material and input cost inflation, and fluctuations in logistics availability, timing and costs, all of which are expected to ease throughout 2023.began easing in 2023 but remain volatile. This could require us to modify our current business practices, and could have a material adverse effect on our financial statements in any particular reporting period. In addition, we are pursuing a business interruption insurance claim related to the 2021 Texas freeze, amounts related to which could be a material gain in a future period.
| | | | | |
| ITEM 3. | QUANTITATIVE AND QUALITATIVE DISCLOSURES ABOUT MARKET RISK |
There have been no material changes to our exposures to market risk since December 31, 2022.2023.
| | | | | |
| ITEM 4. | CONTROLS AND PROCEDURES |
(a)Evaluation of disclosure controls and procedures
Prior to filing this report, we completed an evaluation under the supervision and with the participation of our management, including our Chief Executive Officer and Chief Financial Officer, of the effectiveness of the design and operation of our disclosure controls and procedures (as defined in Rule 13a-15(e) of the Securities Exchange Act of 1934) as of June 30, 2023.March 31, 2024. Based on this evaluation, our Chief Executive Officer and Chief Financial Officer concluded that our disclosure controls and procedures were effective at the reasonable assurance level as of June 30, 2023.March 31, 2024.
(b)Changes in internal control over financial reporting
There were no changes in our internal control over financial reporting that occurred during the most recent quarter that have materially affected, or are reasonably likely to materially affect, our internal control over financial reporting.
| | |
| PART II. OTHER INFORMATION |
Information with respect to legal proceedings can be found under the heading "Commitments and Contingencies" in Note 6 and “Other Income Tax Matters” in Note 11 to the Consolidated Condensed Financial Statements contained in Part I, Item 1 of this report. Pursuant to SEC regulation, the Company will use a threshold of $1 million for purposes of determining whether disclosure of certain environmental proceedings covered by the regulation is required.
There have been no material changes in our risk factors from those disclosed in Part I, Item 1A to our Annual Report on Form 10-K for the fiscal year ended December 31, 2022.2023.
| | | | | |
| ITEM 2. | UNREGISTERED SALES OF EQUITY SECURITIES AND USE OF PROCEEDS |
On April 19, 2021, our Board of Directors authorized a share repurchase program of up to $2 billion, which has no expiration date. On February 14, 2022, the Board of Directors authorized an additional $2 billion in share repurchases under the Company's ongoing share repurchase program. During the sixthree months ended June 30, 2023,March 31, 2024, we did not repurchase anyrepurchased 455,952 shares under these programs.programs at an aggregate price of approximately $50 million. At June 30, 2023,March 31, 2024, there were approximately $2.6$2.5 billion in remaining funds authorized under this program.
The following table summarizes repurchases of Whirlpool's common stock in the three months ended June 30, 2023:March 31, 2024:
| | | | | | | | | | | | | | |
Period (Millions of dollars, except number and price per share) | Total Number of Shares Purchased | Average Price Paid per Share | Total Number of Shares Purchased as Part of Publicly Announced Plans or Programs | Approximate Dollar Value of Shares that May Yet Be Purchased Under the Plans |
| | | | |
| | | | |
| | | | |
| | | | |
April 1, 2023 through April 30, 2023 | | | — | | $ | 2,587 | |
May 1, 2023 through May 31, 2023 | | | — | | 2,587 | |
June 1, 2023 through June 30, 2023 | | | — | | 2,587 | |
Total | — | | | — | | |
| | | | |
| | | | |
| | | | |
| | | | |
| | | | |
| | | | |
| | | | |
| | | | |
| | | | | | | | | | | | | | | | | |
| Period (Millions of dollars, except number and price per share) | Total Number of Shares Purchased | Average Price Paid per Share | Total Number of Shares Purchased as Part of Publicly Announced Plans or Programs | Approximate Dollar Value of Shares that May Yet Be Purchased Under the Plans | | | |
| January 1, 2024 through January 31, 2024 | — | | | — | | $ | 2,587 | | | | |
| February 1, 2024 through February 29, 2024 | 455,952 | | $ | 109.66 | | 455,952 | | $ | 2,537 | | | | |
| March 1, 2024 through March 31, 2024 | — | | | — | | $ | 2,537 | | | | |
| Total | 455,952 | | $ | 109.66 | | 455,952 | | | | | |
| | | | | | | |
| | | | | | | |
| | | | | | | |
| | | | | | | |
| | | | | | | |
| | | | | | | |
| | | | | | | |
| | | | | | | |
| | | | | | | |
| | | | | | | |
| | | | | | | |
| | | | | | | |
Share repurchases are made from time to time on the open market as conditions warrant. The programs doprogram does not obligate us to repurchase any of our shares and have no expiration date.
| | | | | |
| ITEM 3. | DEFAULTS UPON SENIOR SECURITIES |
None.
| | | | | |
| ITEM 4. | MINE SAFETY DISCLOSURES |
Not applicable.
None.
| | | | | |
| Exhibit 2.1** | |
| | | |
Exhibit 10.1*4.1 | |
| |
| Exhibit 10.1* | |
| |
| Exhibit 31.1 | |
| |
| Exhibit 31.2 | |
| |
| Exhibit 32.1 | |
| |
| 101.INS | XBRL Instance Document - the instance document does not appear in the Interactive Data File because its XBRL tags are embedded within the Inline XBRL document |
| |
| 101.SCH | Inline XBRL Taxonomy Extension Schema Document |
| |
| 101.CAL | Inline XBRL Taxonomy Extension Calculation Linkbase Document |
| |
| 101.DEF | Inline XBRL Taxonomy Extension Definition Linkbase Document |
| |
| 101.LAB | Inline XBRL Taxonomy Extension Label Linkbase Document |
| |
| 101.PRE | Inline XBRL Taxonomy Extension Presentation Linkbase Document |
| |
| Exhibit 104 | Cover Page Interactive Data File (formatted as Inline XBRL and contained in Exhibit 101) |
*Management contract or compensatory plan or arrangement
** Amendments to certain schedules have been omitted pursuant to Item 601(a)(5) of Regulation S-K. The Company will furnish supplemental copies of such omitted schedule amendments to the Securities and Exchange Commission upon request.
SIGNATURES
Pursuant to the requirements of the Securities Exchange Act of 1934, the Registrant has duly caused this report to be signed on its behalf by the undersigned, thereunto duly authorized.
| | | | | | | | | | | |
| | | WHIRLPOOL CORPORATION |
| | | (Registrant) |
| By: | | /s/ JAMES W. PETERS |
| Name: | | James W. Peters |
| Title: | | Executive Vice President
and Chief Financial and Administrative Officer |
| Date: | | JulyApril 25, 20232024 |