UNITED STATES
SECURITIES AND EXCHANGE COMMISSION
Washington, D.C. 20549
FORM 10-Q
| | | | | | | | |
| | | |
| ☑ | | Quarterly Report Pursuant to Section 13 or 15(d) of the Securities Exchange Act of 1934 |
for the quarterly period ended July 2, 2023March 31, 2024
or
| | | | | | | | |
| | | |
| ☐ | | Transition Report Pursuant to Section 13 or 15(d) of the Securities Exchange Act of 1934
for the transition period from to |
Commission file number 1-3215
Johnson & Johnson
(Exact name of registrant as specified in its charter)
| | | | | | | | |
| New Jersey | | 22-1024240 |
(State or other jurisdiction of
incorporation or organization) | | (I.R.S. Employer
Identification No.) |
One Johnson & Johnson Plaza
New Brunswick, New Jersey 08933
(Address of principal executive offices)
Registrant’s telephone number, including area code (732) 524-0400
Indicate by check mark whether the registrant (1) has filed all reports required to be filed by Section 13 or 15(d) of the Securities Exchange Act of 1934 during the preceding 12 months (or for such shorter period that the registrant was required to file such reports), and (2) has been subject to such filing requirements for the past 90 days. ☑ Yes ☐ No
Indicate by check mark whether the registrant has submitted electronically every Interactive Data File required to be submitted pursuant to Rule 405 of Regulation S-T during the preceding 12 months (or for such shorter period that the registrant was required to submit such files). ☑ Yes ☐ No
Indicate by check mark whether the registrant is a large accelerated filer, an accelerated filer, a non-accelerated filer, a smaller reporting company, or an emerging growth company. See the definitions of “large accelerated filer,” “accelerated filer,” “smaller reporting company,” and “emerging growth company” in Rule 12b-2 of the Exchange Act.
| | | | | | | | | | | | | | |
| Large accelerated filer | ☑ | Accelerated filer | ☐ |
| Non-accelerated filer | ☐ | Smaller reporting company | ☐ |
| Emerging growth company | ☐ | | |
If an emerging growth company, indicated by check mark if the registrant has elected not to use the extended transition period for complying with any new or revised financial accounting standards provided pursuant to Section 13(a) of the Exchange Act. ☐
Indicate by check mark whether the registrant is a shell company (as defined in Rule 12b-2 of the Exchange Act). ☐ Yes ☑ No
SECURITIES REGISTERED PURSUANT TO SECTION 12(b) OF THE ACT
| | | | | | | | |
| Title of each class | Trading Symbol | Name of each exchange on which registered |
| Common Stock, Par Value $1.00 | JNJ | New York Stock Exchange |
| 0.650% Notes Due May 2024 | JNJ24C | New York Stock Exchange |
| 5.50% Notes Due November 2024 | JNJ24BP | New York Stock Exchange |
| 1.150% Notes Due November 2028 | JNJ28 | New York Stock Exchange |
| 1.650% Notes Due May 2035 | JNJ35 | New York Stock Exchange |
Indicate the number of shares outstanding of each of the issuer’s classes of common stock, as of the latest practicable date.
On July 24, 2023, 2,598,969,594April 25, 2024, 2,406,679,183 shares of Common Stock, $1.00 par value, were outstanding.
JOHNSON & JOHNSON AND SUBSIDIARIES
TABLE OF CONTENTSTable of contents
CAUTIONARY NOTE REGARDING FORWARD-LOOKING STATEMENTSCautionary note regarding forward-looking statements
This Quarterly Report on Form 10-Q and Johnson & Johnson’sJohnson’s other publicly available documents contain “forward-looking statements”“forward-looking statements” within the meaning of the safe harbor provisions of the United States Private Securities Litigation Reform Act of 1995. Management and representatives of Johnson & Johnson and its subsidiaries (the Company) also may from time to time make forward-looking statements. Forward-looking statements do not relate strictly to historical or current facts and reflect management’s assumptions, views, plans, objectives and projections about the future. Forward-looking statements may be identified by the use of words such as “plans,” “expects,” “will,” “anticipates,” “estimates,” and other words of similar meaning in conjunction with, among other things: discussions of future operations, expected operating results, financial performance; impact of planned acquisitions and dispositions; impact and timing of restructuring initiatives including associated cost savings and other benefits; the Company’s strategy for growth; product development activities; regulatory approvals; market position and expenditures.
Because forward-looking statements are based on current beliefs, expectations and assumptions regarding future events, they are subject to uncertainties, risks and changes that are difficult to predict and many of which are outside of the Company’s control. Investors should realize that if underlying assumptions prove inaccurate, or known or unknown risks or uncertainties materialize, the Company’s actual results and financial condition could vary materially from expectations and projections expressed or implied in its forward-looking statements. Investors are therefore cautioned not to rely on these forward-looking statements. Risks and uncertainties include, but are not limited to:
Risks Relatedrelated to Product Development, Market Successproduct development, market success and Competitioncompetition
•Challenges and uncertainties inherent in innovation and development of new and improved products and technologies on which the Company’s continued growth and success depend, including uncertainty of clinical outcomes, additional analysis of existing clinical data, obtaining regulatory approvals, health plan coverage and customer access, and initial and continued commercial success;
•Challenges to the Company’s ability to obtain and protect adequate patent and other intellectual property rights for new and existing products and technologies in the United States and other important markets;
•The impact of patent expirations, typically followed by the introduction of competing generic, biosimilar or other products and resulting revenue and market share losses;
•Increasingly aggressive and frequent challenges to the Company’s patents by competitors and others seeking to launch competing generic, biosimilar or other products and increased receptivity of courts, the United States Patent and Trademark Office and other decision makers to such challenges, potentially resulting in loss of market exclusivity and rapid decline in sales for the relevant product sooner than expected;
•Competition in research and development of new and improved products, processes and technologies, which can result in product and process obsolescence;
•Competition to reach agreement with third parties for collaboration, licensing, development and marketing agreements for products and technologies;
•Competition based on cost-effectiveness, product performance, technological advances and patents attained by competitors; and
•Allegations that the Company’s products infringe the patents and other intellectual property rights of third parties, which could adversely affect the Company’s ability to sell the products in question and require the payment of money damages and future royalties.
Risks Relatedrelated to Product Liability, Litigationproduct liability, litigation and Regulatory Activityregulatory activity
•Product efficacy or safety concerns, whether or not based on scientific evidence, potentially resulting in product withdrawals, recalls, regulatory action on the part of the United States Food and Drug Administration (U.S. FDA) (or international counterparts), declining sales, reputational damage, increased litigation expense and share price impact;
•The impact, including declining sales and reputational damage, of significant litigation or government action adverse to the Company, including product liability claims and allegations related to pharmaceutical marketing practices and contracting strategies;
•The impact of an adverse judgment or settlement and the adequacy of reserves related to legal proceedings, including patent litigation, product liability, personal injury claims, securities class actions, government investigations, employment and other legal proceedings;
•Increased scrutiny of the healthcare industry by government agencies and state attorneys general resulting in investigations and prosecutions, which carry the risk of significant civil and criminal penalties, including, but not limited to, debarment from government business;
•Failure to meet compliance obligations in compliance agreements with governments or government agencies, which could result in significant sanctions;
•Potential changes to applicable laws and regulations affecting United States and international operations, including relating to: approval of new products; licensing and patent rights; sales and promotion of healthcare products; access to, and reimbursement and pricing for, healthcare products and services; environmental protection; and sourcing of raw materials;
•Compliance with local regulations and laws that may restrict the Company’s ability to manufacture or sell its products in relevant markets, including requirements to comply with medical device reporting regulations and other requirements such as the European Union’s Medical Devices Regulation;
•Changes in domestic and international tax laws and regulations, increasing audit scrutiny by tax authorities around the world and exposures to additional tax liabilities potentially in excess of existing reserves; and
•The issuance of new or revised accounting standards by the Financial Accounting Standards Board and regulations by the Securities and Exchange Commission.
Risks Relatedrelated to the Company’s Strategic Initiatives, Healthcare Market Trendshealthcare market trends and the Planned Separationrealization of benefits from the Company’s Consumer Health BusinessCompany's strategic initiatives
•Pricing pressures resulting from trends toward healthcare cost containment, including the continued consolidation among healthcare providers and other market participants, trends toward managed care, the shift toward governments increasingly becoming the primary payerspayors of healthcare expenses, significant new entrants to the healthcare markets seeking to reduce costs and government pressure on companies to voluntarily reduce costs and price increases;
•Restricted spending patterns of individual, institutional and governmental purchasers of healthcare products and services due to economic hardship and budgetary constraints;
•Challenges to the Company’s ability to realize its strategy for growth including through externally sourced innovations, such as development collaborations, strategic acquisitions, licensing and marketing agreements, and the potential heightened costs of any such external arrangements due to competitive pressures;
•The potential that the expected strategic benefits and opportunities from any planned or completed acquisition or divestiture by the Company may not be realized or may take longer to realize than expected;
•The potential that the expected benefits and opportunities related to past and ongoing restructuring actions may not be realized or may take longer to realize than expected;
•The Company’s ability to consummate the planned full separation ofdivest the Company’s Consumer Health business on a timely basis or at all;
•The Company’s ability to successfully separate the Company’s Consumer Health businessremaining ownership interest in Kenvue Inc. (Kenvue) and realize the anticipated benefits from the planned full separation; and
•Kenvue, Inc.'s (Kenvue)Kenvue's ability to succeed as a standalone publicly traded company.
Risks Relatedrelated to Economic Conditions, Financial Marketseconomic conditions, financial markets and Operating Internationallyoperating internationally
•The risks associated with global operations on the Company and its customers and suppliers, including foreign governments in countries in which the Company operates;
•The impact of inflation and fluctuations in interest rates and currency exchange rates and the potential effect of such fluctuations on revenues, expenses and resulting margins;
•Potential changes in export/import and trade laws, regulations and policies of the United States and other countries, including any increased trade restrictions or tariffs and potential drug reimportation legislation;
•The impact on international operations from financial instability in international economies, sovereign risk, possible imposition of governmental controls and restrictive economic policies, and unstable international governments and legal systems;
•The impact of global public health crises and pandemics;
•Changes to global climate, extreme weather and natural disasters that could affect demand for the Company’s products and services, cause disruptions in manufacturing and distribution networks, alter the availability of goods and services within the supply chain, and affect the overall design and integrity of the Company’s products and operations; and
•The impact of armed conflicts and terrorist attacks in the United States and other parts of the world, including social and economic disruptions and instability of financial and other markets.
Risks Relatedrelated to Supply Chainsupply chain and Operationsoperations
•Difficulties and delays in manufacturing, internally, through third-party providers or otherwise within the supply chain, that may lead to voluntary or involuntary business interruptions or shutdowns, product shortages, withdrawals or suspensions of products from the market, and potential regulatory action;
•Interruptions and breaches of the Company’s information technology systems or those of the Company’s vendors, which could result in reputational, competitive, operational or other business harm as well as financial costs and regulatory action;
•Reliance on global supply chains and production and distribution processes that are complex and subject to increasing regulatory requirements that may adversely affect supply, sourcing and pricing of materials used in the Company’s products; and
•The potential that the expected benefits and opportunities related to restructuring actions may not be realized or may take longer to realize than expected, including due to any required approvals from applicable regulatory authorities.
Investors also should carefully read the Risk Factors described in Item 1A of the Company's Annual Report on Form 10-K for the fiscal year ended January 1,December 31, 2023, for a description of certain risks that could, among other things, cause the Company’s actual results to differ materially from those expressed in its forward-looking statements. Investors should understand that it is not possible to predict or identify all such factors and should not consider the risks described above to be a complete statement of all potential risks and uncertainties. The Company does not undertake to publicly update any forward-looking statement that may be made from time to time, whether as a result of new information or future events or developments.
Part I — FINANCIAL INFORMATION
Item 1 — FINANCIAL STATEMENTS
JOHNSONJohnson & JOHNSON AND SUBSIDIARIES
CONSOLIDATED BALANCE SHEETSJohnson and subsidiaries consolidated balance sheets
(Unaudited; Dollars in Millions Except Share and Per Share Data)
| | July 2, 2023 | | January 1, 2023 |
ASSETS | | | March 31, 2024 | | | | March 31, 2024 | | December 31, 2023 |
| Assets | | Assets |
| Current assets: | Current assets: | | | | | Current assets: | | |
| Cash and cash equivalents (Note 4) | Cash and cash equivalents (Note 4) | | $ | 21,183 | | | 14,127 | | Cash and cash equivalents (Note 4) | | $25,473 | | 21,859 |
| | Marketable securities | Marketable securities | | 7,322 | | | 9,392 | |
| Accounts receivable, trade, less allowances $205 (2022, $203) | | 16,777 | | | 16,160 | |
| Marketable securities | |
| Marketable securities | | | 745 | | 1,068 |
| Accounts receivable, trade, less allowances $162 (2023, $166) | | Accounts receivable, trade, less allowances $162 (2023, $166) | | 14,946 | | 14,873 |
| Inventories (Note 2) | Inventories (Note 2) | | 12,888 | | | 12,483 | | Inventories (Note 2) | | 11,383 | | 11,181 |
| Prepaid expenses and other | Prepaid expenses and other | | 2,397 | | | 3,132 | | Prepaid expenses and other | | 4,455 | | 4,514 |
| | Total current assets | |
| Total current assets | |
| Total current assets | Total current assets | | 60,567 | | | 55,294 | | | 57,002 | | 53,495 |
| Property, plant and equipment at cost | Property, plant and equipment at cost | | 51,218 | | | 49,253 | | Property, plant and equipment at cost | | 47,585 | | 47,776 |
| Less: accumulated depreciation | Less: accumulated depreciation | | (30,642) | | | (29,450) | | Less: accumulated depreciation | | (27,953) | | (27,878) |
| Property, plant and equipment, net | Property, plant and equipment, net | | 20,576 | | | 19,803 | | Property, plant and equipment, net | | 19,632 | | 19,898 |
| Intangible assets, net (Note 3) | Intangible assets, net (Note 3) | | 46,246 | | | 48,325 | | Intangible assets, net (Note 3) | | 34,286 | | 34,175 |
| Goodwill (Note 3) | Goodwill (Note 3) | | 45,440 | | | 45,231 | | Goodwill (Note 3) | | 36,616 | | 36,558 |
| Deferred taxes on income (Note 5) | Deferred taxes on income (Note 5) | | 8,779 | | | 9,123 | | Deferred taxes on income (Note 5) | | 10,305 | | 9,279 |
| Other assets | Other assets | | 10,078 | | | 9,602 | | Other assets | | 14,125 | | 14,153 |
| | Total assets | Total assets | | $ | 191,686 | | | 187,378 | |
LIABILITIES AND SHAREHOLDERS’ EQUITY | | Total assets | |
| Total assets | | | $171,966 | | 167,558 |
| Liabilities and shareholders’ equity | | Liabilities and shareholders’ equity |
| Current liabilities: | Current liabilities: | | | | | Current liabilities: | | |
| Loans and notes payable | Loans and notes payable | | $ | 11,701 | | | 12,771 | | Loans and notes payable | | $8,550 | | 3,451 |
| Accounts payable | Accounts payable | | 10,443 | | | 11,703 | | Accounts payable | | 8,174 | | 9,632 |
| Accrued liabilities | Accrued liabilities | | 10,605 | | | 11,456 | | Accrued liabilities | | 10,323 | | 10,212 |
| Accrued rebates, returns and promotions | Accrued rebates, returns and promotions | | 15,672 | | | 14,417 | | Accrued rebates, returns and promotions | | 16,182 | | 16,001 |
| Accrued compensation and employee related obligations | Accrued compensation and employee related obligations | | 3,062 | | | 3,328 | | Accrued compensation and employee related obligations | | 2,178 | | 3,993 |
| Accrued taxes on income (Note 5) | Accrued taxes on income (Note 5) | | 2,687 | | | 2,127 | | Accrued taxes on income (Note 5) | | 3,318 | | 2,993 |
| | Total current liabilities | |
| Total current liabilities | |
| Total current liabilities | Total current liabilities | | 54,170 | | | 55,802 | | | 48,725 | | 46,282 |
| Long-term debt (Note 4) | Long-term debt (Note 4) | | 33,901 | | | 26,888 | | Long-term debt (Note 4) | | 25,082 | | 25,881 |
| Deferred taxes on income (Note 5) | Deferred taxes on income (Note 5) | | 3,627 | | | 6,374 | | Deferred taxes on income (Note 5) | | 3,172 | | 3,193 |
| Employee related obligations (Note 6) | Employee related obligations (Note 6) | | 6,461 | | | 6,767 | | Employee related obligations (Note 6) | | 7,019 | | 7,149 |
| Long-term taxes payable (Note 5) | Long-term taxes payable (Note 5) | | 2,536 | | | 4,306 | | Long-term taxes payable (Note 5) | | 2,881 |
| Other liabilities | Other liabilities | | 14,582 | | | 10,437 | | Other liabilities | | 15,067 | | 13,398 |
| | Total liabilities | |
| Total liabilities | |
| Total liabilities | Total liabilities | | $ | 115,277 | | | 110,574 | | | $101,946 | | 98,784 |
| Commitments and Contingencies (Note 11) | Commitments and Contingencies (Note 11) | | Commitments and Contingencies (Note 11) | | |
| Shareholders’ equity: | Shareholders’ equity: | | | | | Shareholders’ equity: | | |
| Common stock — par value $1.00 per share (authorized 4,320,000,000 shares; issued 3,119,843,000 shares) | Common stock — par value $1.00 per share (authorized 4,320,000,000 shares; issued 3,119,843,000 shares) | | $ | 3,120 | | | 3,120 | | Common stock — par value $1.00 per share (authorized 4,320,000,000 shares; issued 3,119,843,000 shares) | | $3,120 | | 3,120 |
| Accumulated other comprehensive income (loss) (Note 7) | Accumulated other comprehensive income (loss) (Note 7) | | (13,135) | | | (12,967) | | Accumulated other comprehensive income (loss) (Note 7) | | (10,768) | | (12,527) |
| Retained earnings and Additional paid-in capital | Retained earnings and Additional paid-in capital | | 129,381 | | | 128,345 | | Retained earnings and Additional paid-in capital | | 153,378 | | 153,843 |
| Less: common stock held in treasury, at cost (521,700,000 and 506,246,000 shares) | | 44,217 | | | 41,694 | |
| Total Johnson & Johnson shareholders’ equity | | 75,149 | | | 76,804 | |
| Equity attributable to non-controlling interest (Note 12) | | 1,260 | | | — | |
| Total equity | | $ | 76,409 | | | 76,804 | |
| Less: common stock held in treasury, at cost (713,120,000 and 712,765,000 shares) | | Less: common stock held in treasury, at cost (713,120,000 and 712,765,000 shares) | | 75,710 | | 75,662 |
| Total shareholders’ equity | | Total shareholders’ equity | | $70,020 | | 68,774 |
| Total liabilities and shareholders’ equity | Total liabilities and shareholders’ equity | | $ | 191,686 | | | 187,378 | | Total liabilities and shareholders’ equity | | $171,966 | | 167,558 |
See Notes to Consolidated Financial Statements
JOHNSONJohnson & JOHNSON AND SUBSIDIARIES
CONSOLIDATED STATEMENTS OF EARNINGSJohnson and subsidiaries consolidated statements of earnings
(Unaudited; Dollars & Shares in Millions Except Per Share Amounts)
| | | | | Fiscal Second Quarter Ended | | | Fiscal First Quarter Ended |
| July 2,
2023 | | Percent
to Sales | | July 3,
2022 | | Percent
to Sales |
| | March 31,
2024 | | | | March 31,
2024 | | Percent
to Sales | | April 2,
2023 | | Percent
to Sales |
| Sales to customers (Note 9) | Sales to customers (Note 9) | | $ | 25,530 | | | 100.0 | % | | $ | 24,020 | | | 100.0 | % | Sales to customers (Note 9) | | $21,383 | | 100.0 | % | | $20,894 | | 100.0 | % |
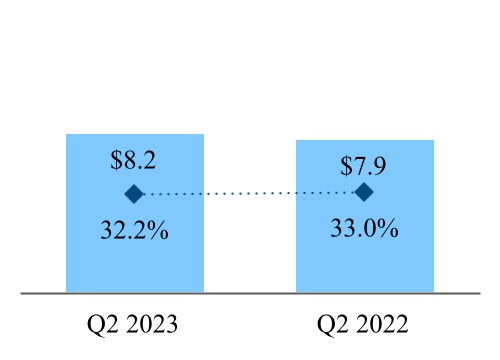
| Cost of products sold | Cost of products sold | | 8,212 | | | 32.2 | | | 7,919 | | | 33.0 | |
| Gross profit | Gross profit | | 17,318 | | | 67.8 | | | 16,101 | | | 67.0 | |
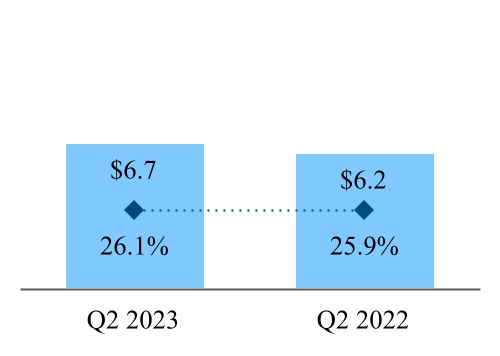
| Selling, marketing and administrative expenses | Selling, marketing and administrative expenses | | 6,665 | | | 26.1 | | | 6,226 | | | 25.9 | |
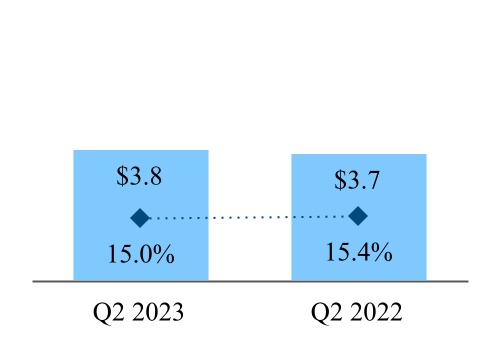
| Research and development expense | Research and development expense | | 3,829 | | | 15.0 | | | 3,703 | | | 15.4 | |
| | In-process research and development impairments | |
| Interest income | Interest income | | (369) | | | (1.5) | | | (64) | | | (0.3) | |
| Interest expense, net of portion capitalized | Interest expense, net of portion capitalized | | 346 | | | 1.4 | | | 38 | | | 0.2 | |
| Other (income) expense, net* | | (60) | | | (0.2) | | | 273 | | | 1.1 | |
| Restructuring | | 145 | | | 0.5 | | | 85 | | | 0.4 | |
| Earnings before provision for taxes on income | | 6,762 | | | 26.5 | | | 5,840 | | | 24.3 | |
| Provision for taxes on income (Note 5) | | 1,618 | | | 6.4 | | | 1,026 | | | 4.3 | |
| | NET EARNINGS | | $ | 5,144 | | | 20.1 | % | | $ | 4,814 | | | 20.0 | % |
| | NET EARNINGS PER SHARE (Note 8) | | | | | | | | |
| Other (income) expense, net | |
| Restructuring (Note 12) | |
| Earnings (loss) before provision for taxes on income | |
| Provision for (benefit from) taxes on income (Note 5) | |
| Net earnings (loss) from continuing operations | | Net earnings (loss) from continuing operations | | 3,255 | | | 15.2 | % | | (491) | | (2.3) | % |
| Net earnings from discontinued operations, net of tax | |
| Net earnings (loss) | |
| Net earnings (loss) | |
| Net earnings (loss) | |
| Net earnings (loss) per share (Note 8) | |
| Net earnings (loss) per share (Note 8) | |
| Net earnings (loss) per share (Note 8) | | | |
| Continuing operations - basic | | Continuing operations - basic | | $1.35 | | | | | $(0.19) | | |
| Discontinued operations - basic | |
| Total net earnings (loss) per share - basic | |
| Total net earnings (loss) per share - basic | |
| Total net earnings (loss) per share - basic | |
| Continuing operations - diluted | |
| Continuing operations - diluted | |
| Continuing operations - diluted | | | $1.34 | | | | | $(0.19) | | |
| Discontinued operations - diluted | |
| Total net earnings (loss) per share - diluted | |
| Total net earnings (loss) per share - diluted | |
| Total net earnings (loss) per share - diluted | |
| Avg. shares outstanding | |
| Avg. shares outstanding | |
| Avg. shares outstanding | | | |
| Basic | Basic | | $ | 1.98 | | | | | $ | 1.83 | | | | Basic | | 2,408.2 | | | | | | | 2,605.5 | | |
| Diluted | Diluted | | $ | 1.96 | | | | | $ | 1.80 | | | | Diluted | | 2,430.1 | | | | | | | 2,605.5 | * | |
| | AVG. SHARES OUTSTANDING | | | | | | | | |
| Basic | | 2,598.4 | | | | | 2,629.6 | | | |
| Diluted | | 2,625.7 | | | | | 2,667.9 | | | |
*Fiscal second quarter Basic shares used when in a loss position from continuing operations
Prior year results have been recast to reflect the continuing operations of 2023 Other (income) expense, net includes $37 million related to the 10.4% non-controlling interestJohnson & Johnson
Johnson & Johnson and subsidiaries consolidated statements of comprehensive income
(Unaudited; Dollars in Kenvue from the time of the initial public offering on May 8, 2023 through the end of the fiscal second quarter.Millions)
| | | | | | | | | | | | | | | | | |
| | | Fiscal First Quarter Ended |
| | | | | March 31, 2024 | | April 2, 2023 |
| | | | | | | |
| Net earnings / (Loss) | | | | | $3,255 | | (68) |
| | | | | | | |
| Other comprehensive income (loss), net of tax | | | | | | | |
| Foreign currency translation | | | | | 2,123 | | (181) |
| | | | | | | |
| Securities: | | | | | | | |
| Unrealized holding gain (loss) arising during period | | | | | 2 | | 17 |
| Reclassifications to earnings | | | | | — | | — |
| | | | | | | |
| Net change | | | | | 2 | | 17 |
| | | | | | | |
| Employee benefit plans: | | | | | | | |
| Prior service cost amortization during period | | | | | (238) | | (35) |
| Gain (loss) amortization during period | | | | | 290 | | (33) |
| | | | | | | |
| Net change | | | | | 52 | | (68) |
| | | | | | | |
| Derivatives & hedges: | | | | | | | |
| Unrealized gain (loss) arising during period | | | | | (167) | | 570 |
| Reclassifications to earnings | | | | | (251) | | 3 |
| Net change | | | | | (418) | | 573 |
| | | | | | | |
| Other comprehensive income (loss) | | | | | 1,759 | | 341 |
| | | | | | | |
| | | | | | | |
| | | | | | | |
| | | | | | | |
| | | | | | | |
| Comprehensive income | | | | | $5,014 | | 273 |
| | | | | | | |
See Notes to Consolidated Financial Statements
JOHNSON & JOHNSON AND SUBSIDIARIES
CONSOLIDATED STATEMENTS OF EARNINGS
(Unaudited; Dollars & Shares in Millions Except Per Share Amounts)
| | | | | | | | | | | | | | | | | | | | | | | | | | |
| | Fiscal Six Months Ended |
| | July 2,
2023 | | Percent
to Sales | | July 3,
2022 | | Percent
to Sales |
| Sales to customers (Note 9) | | $ | 50,276 | | | 100.0 | % | | $ | 47,446 | | | 100.0 | % |
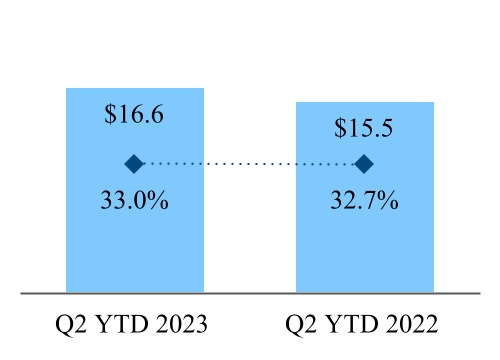
| Cost of products sold | | 16,607 | | | 33.0 | | | 15,517 | | | 32.7 | |
| Gross profit | | 33,669 | | | 67.0 | | | 31,929 | | | 67.3 | |
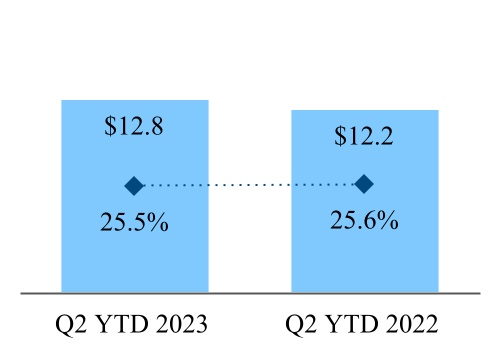
| Selling, marketing and administrative expenses | | 12,803 | | | 25.5 | | | 12,164 | | | 25.6 | |
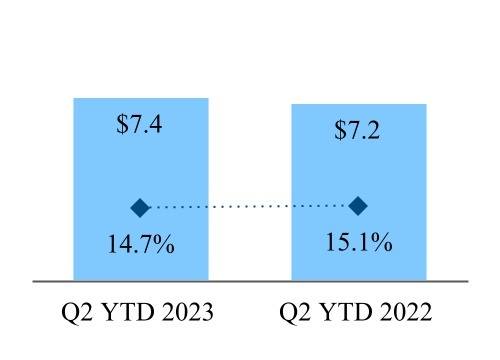
| Research and development expense | | 7,392 | | | 14.7 | | | 7,165 | | | 15.1 | |
| In-process research and development impairments | | 49 | | | 0.1 | | | 610 | | 1.3 | |
| Interest income | | (604) | | | (1.2) | | | (86) | | | (0.2) | |
| Interest expense, net of portion capitalized | | 561 | | | 1.1 | | | 48 | | | 0.1 | |
| Other (income) expense, net* | | 7,168 | | | 14.3 | | | 171 | | | 0.4 | |
| Restructuring | | 275 | | | 0.5 | | | 155 | | | 0.3 | |
| Earnings before provision for taxes on income | | 6,025 | | | 12.0 | | | 11,702 | | | 24.7 | |
| Provision for taxes on income (Note 5) | | 949 | | | 1.9 | | | 1,739 | | | 3.7 | |
| | | | | | | | |
| | | | | | | | |
| NET EARNINGS | | $ | 5,076 | | | 10.1 | % | | $ | 9,963 | | | 21.0 | % |
| | | | | | | | |
| NET EARNINGS PER SHARE (Note 8) | | | | | | | | |
| Basic | | $ | 1.95 | | | | | $ | 3.79 | | | |
| Diluted | | $ | 1.93 | | | | | $ | 3.73 | | | |
| | | | | | | | |
| AVG. SHARES OUTSTANDING | | | | | | | | |
| Basic | | 2,601.9 | | | | | 2,629.4 | | | |
| Diluted | | 2,630.7 | | | | | 2,669.2 | | | |
| | | | | | | | |
|
* Fiscal six months of 2023 Other (income) expense, net includes $37 million relatedAmounts presented have not been recast to the 10.4% non-controlling interest in Kenvue from the time of the initial public offering on May 8, 2023 through the end of the fiscal second quarter.
See Notes to Consolidated Financial Statements
JOHNSON & JOHNSON AND SUBSIDIARIES
CONSOLIDATED STATEMENTS OF COMPREHENSIVE INCOME
(Unaudited; Dollars in Millions)
| | | | | | | | | | | | | | | | | | | | | | | |
| Fiscal Second Quarter Ended | | Fiscal Six Months Ended |
| July 2, 2023 | | July 3, 2022 | | July 2, 2023 | | July 3, 2022 |
| | | | | | | |
| Net earnings | $ | 5,144 | | | 4,814 | | | $ | 5,076 | | | 9,963 | |
| | | | | | | |
| Other comprehensive income (loss), net of tax | | | | | | | |
| Foreign currency translation | (715) | | | (151) | | | (896) | | | (705) | |
| | | | | | | |
| Securities: | | | | | | | |
| Unrealized holding gain (loss) arising during period | 4 | | | (20) | | | 21 | | | (33) | |
| Reclassifications to earnings | — | | | — | | | — | | | — | |
| | | | | | | |
| Net change | 4 | | | (20) | | | 21 | | | (33) | |
| | | | | | | |
| Employee benefit plans: | | | | | | | |
| Prior service cost amortization during period | (36) | | | (20) | | | (71) | | | (73) | |
| Gain (loss) amortization during period | (34) | | | 86 | | | (67) | | | 303 | |
| | | | | | | |
| Net change | (70) | | | 66 | | | (138) | | | 230 | |
| | | | | | | |
| Derivatives & hedges: | | | | | | | |
| Unrealized gain (loss) arising during period | (137) | | | 145 | | | 433 | | | (50) | |
| Reclassifications to earnings | (139) | | | (126) | | | (136) | | | (227) | |
| Net change | (276) | | | 19 | | | 297 | | | (277) | |
| | | | | | | |
| Other comprehensive income (loss) | (1,057) | | | (86) | | | (716) | | | (785) | |
| | | | | | | |
| | | | | | | |
| | | | | | | |
| | | | | | | |
| | | | | | | |
| Comprehensive income | $ | 4,087 | | | 4,728 | | | $ | 4,360 | | | 9,178 | |
| | | | | | | |
See Notes to Consolidated Financial Statements
| | |
|
|
The tax effects in other comprehensive income/(loss) for the fiscal secondfirst quarter were as follows for 20232024 and 2022,2023, respectively: Foreign Currency Translation: $32$619 million and $533$234 million; Securities: $1 million and $6$5 million; Employee Benefit Plans: $21$42 million and $84$22 million; Derivatives & Hedges: $74$111 million and $5 million. |
|
The tax effects in other comprehensive income/(loss) for the fiscal six months were as follows for 2023 and 2022, respectively: Foreign Currency Translation: $266 million and $678 million; Securities: $6 million and $9 million; Employee Benefit Plans: $43 million and $65 million; Derivatives & Hedges: $80 million and $73$154 million. |
JOHNSONJohnson & JOHNSON AND SUBSIDIARIES
CONSOLIDATED STATEMENTS OF EQUITYJohnson and subsidiaries consolidated statements of equity
(Unaudited; Dollars in Millions)
Fiscal Second Quarter Ended July 2, 2023 | | | | | | | | | | | | | | | | | | | | | | | | | | | | | | | | | | |
| | | | | | | | | | | | |
| Total | | Retained Earnings and Additional Paid-in Capital | | Accumulated
Other
Comprehensive
Income (AOCI) | | Common Stock
Issued Amount | | Treasury
Stock
Amount | | | |
| Balance, December 31, 2023 | $68,774 | | 153,843 | | (12,527) | | 3,120 | | (75,662) | | | |
| Net earnings | 3,255 | | 3,255 | | — | | — | | — | | | |
| Cash dividends paid ($1.19 per share) | (2,869) | | (2,869) | | — | | — | | — | | | |
| Employee compensation and stock option plans | 577 | | (851) | | — | | — | | 1,428 | | | |
| Repurchase of common stock | (1,475) | | — | | — | | — | | (1,475) | | | |
| Other | (1) | | — | | — | | — | | (1) | | | |
| | | | | | | | | | | | |
| | | | | | | | | | | | |
| Other comprehensive income (loss), net of tax | 1,759 | | — | | 1,759 | | — | | — | | | |
| Balance, March 31, 2024 | $70,020 | | 153,378 | | (10,768) | | 3,120 | | (75,710) | | | |
| | | | | | | | | | | | |
| | | | | | | | | | | | | | | | | | | | | | | | | | | | | | | | | | | | | | |
| Total | | Retained
Earnings and Additional paid-in capital | | Accumulated
Other
Comprehensive
Income | | Common Stock
Issued Amount | | Treasury
Stock
Amount | | Non-controlling interest (NCI) | |
| Balance, April 2, 2023 | $ | 70,869 | | | 124,558 | | | (12,626) | | | 3,120 | | | (44,183) | | | — | | |
| Net earnings | 5,144 | | | 5,144 | | | — | | | — | | | — | | | — | | |
| Cash dividends paid ($1.19 per share) | (3,092) | | | (3,092) | | | — | | | — | | | — | | | — | | |
| Employee compensation and stock option plans | 649 | | | 301 | | | — | | | — | | | 348 | | | | |
| Repurchase of common stock | (381) | | | | | — | | | — | | | (381) | | | | |
| Other | (1) | | | — | | | — | | | — | | | (1) | | | — | | |
| Kenvue IPO | 4,278 | | | 2,470 | | | 548 | | | | | | | 1,260 | | * |
| Other comprehensive income (loss), net of tax | (1,057) | | | — | | | (1,057) | | | — | | | — | | | — | | |
| Balance, July 2, 2023 | $ | 76,409 | | | 129,381 | | | (13,135) | | | 3,120 | | | (44,217) | | | 1,260 | | |
| | | | | | | | | | | | |
Fiscal Six Months Ended July 2, 2023
| | | | | | | | | | | | | | | | | | | | | | | | | | | | | | | | | | | | | | |
| | | | | | | | | | | | |
| Total | | Retained
Earnings and Additional paid-in capital | | Accumulated
Other
Comprehensive
Income | | Common Stock
Issued Amount | | Treasury
Stock
Amount | | Non-controlling interest (NCI) | |
| Balance, January 1, 2023 | $ | 76,804 | | | 128,345 | | | (12,967) | | | 3,120 | | | (41,694) | | | — | | |
| Net earnings | 5,076 | | | 5,076 | | | — | | | — | | | — | | | — | | |
| Cash dividends paid ($2.32 per share) | (6,034) | | | (6,034) | | | — | | | — | | | — | | | — | | |
| Employee compensation and stock option plans | 944 | | | (476) | | | — | | | — | | | 1,420 | | | — | | |
| Repurchase of common stock | (3,918) | | | — | | | — | | | — | | | (3,918) | | | — | | |
| Other | (25) | | | — | | | — | | | — | | | (25) | | | — | | |
| Kenvue IPO | 4,278 | | | 2,470 | | | 548 | | | — | | | — | | | 1,260 | | * |
| Other comprehensive income (loss), net of tax | (716) | | | — | | | (716) | | | — | | | — | | | — | | |
| Balance, July 2, 2023 | $ | 76,409 | | | 129,381 | | | (13,135) | | | 3,120 | | | (44,217) | | | 1,260 | | |
| | | | | | | | | | | | |
*Includes $37 million recorded in net earnings related to the 10.4% non-controlling interest of Kenvue.
Fiscal SecondFirst Quarter Ended July 3, 2022April 2, 2023
| | | | | | | | | | | | | | | | | | | | | | | | | | | | | |
| Total | | Retained
Earnings and Additional paid-in capital | | Accumulated
Other
Comprehensive
Income | | Common Stock
Issued Amount | | Treasury
Stock
Amount |
| Balance, April 3, 2022 | $ | 74,709 | | | 124,380 | | | (13,757) | | | 3,120 | | | (39,034) | |
| | | | | | | | | |
| Net earnings | 4,814 | | | 4,814 | | | — | | | — | | | — | |
| Cash dividends paid ($1.13 per share) | (2,971) | | | (2,971) | | | — | | | — | | | — | |
| Employee compensation and stock option plans | 864 | | | (7) | | | — | | | — | | | 871 | |
| Repurchase of common stock | (973) | | | — | | | — | | | — | | | (973) | |
| | | | | | | | | |
| Other comprehensive income (loss), net of tax | (86) | | | — | | | (86) | | | — | | | — | |
| Balance, July 3, 2022 | $ | 76,357 | | | 126,216 | | | (13,843) | | | 3,120 | | | (39,136) | |
| | | | | | | | | |
| | | | | | | | | | | | | | | | | | | | | | | | | | | | | |
| | | | | | | | | |
| Fiscal Six Months Ended July 3, 2022 |
| Total | | Retained
Earnings | | Accumulated
Other
Comprehensive
Income | | Common Stock
Issued Amount | | Treasury
Stock
Amount |
| Balance, January 2, 2022 | $ | 74,023 | | | 123,060 | | | (13,058) | | | 3,120 | | | (39,099) | |
| | | | | | | | | |
| Net earnings | 9,963 | | | 9,963 | | | — | | | — | | | — | |
| Cash dividends paid ($2.19 per share) | (5,758) | | | (5,758) | | | — | | | — | | | — | |
| Employee compensation and stock option plans | 1,464 | | | (1,049) | | | — | | | — | | | 2,513 | |
| Repurchase of common stock | (2,550) | | | — | | | — | | | — | | | (2,550) | |
| | | | | | | | | |
| Other comprehensive income (loss), net of tax | (785) | | | — | | | (785) | | | — | | | — | |
| Balance, July 3, 2022 | $ | 76,357 | | | 126,216 | | | (13,843) | | | 3,120 | | | (39,136) | |
| | | | | | | | | |
| | | | | | | | | | | | | | | | | | | | | | | | | | | | | |
| | | | | | | | | |
|
| Total | | Retained Earnings and Additional Paid-in Capital | | Accumulated
Other
Comprehensive
Income | | Common Stock
Issued Amount | | Treasury
Stock
Amount |
| Balance, January 1, 2023 | $76,804 | | 128,345 | | (12,967) | | 3,120 | | (41,694) |
| | | | | | | | | |
| Net earnings | (68) | | (68) | | — | | — | | — |
| Cash dividends paid ($1.13 per share) | (2,942) | | (2,942) | | — | | — | | — |
| Employee compensation and stock option plans | 295 | | (777) | | — | | — | | 1,072 |
| Repurchase of common stock | (3,537) | | — | | — | | — | | (3,537) |
| Other | (24) | | — | | — | | — | | (24) |
| Other comprehensive income (loss), net of tax | 341 | | — | | 341 | | — | | — |
| Balance, April 2, 2023 | $70,869 | | 124,558 | | (12,626) | | 3,120 | | (44,183) |
| | | | | | | | | |
See Notes to Consolidated Financial Statements
JOHNSONJohnson & JOHNSON AND SUBSIDIARIES
CONSOLIDATED STATEMENTS OF CASH FLOWSJohnson and subsidiaries consolidated statements of cash flows
(Unaudited; Dollars in Millions)
| | | | | | | | | | | | | | |
| | | Fiscal Six Months Ended |
| | July 2,
2023 | | July 3,
2022 |
| CASH FLOWS FROM OPERATING ACTIVITIES | | | | |
| Net earnings | | $ | 5,076 | | | 9,963 | |
| Adjustments to reconcile net earnings to cash flows from operating activities: | | | | |
| Depreciation and amortization of property and intangibles | | 3,814 | | | 3,513 | |
| Stock based compensation | | 688 | | | 644 | |
| | | | |
| | | | |
| Asset write-downs | | 388 | | | 747 | |
| | | | |
| Net gain on sale of assets/businesses | | (47) | | | (213) | |
| | | | |
| Deferred tax provision | | (2,342) | | | (2,349) | |
| Credit losses and accounts receivable allowances | | — | | | (3) | |
| Changes in assets and liabilities, net of effects from acquisitions and divestitures: | | | | |
| Increase in accounts receivable | | (599) | | | (1,386) | |
| Increase in inventories | | (741) | | | (1,257) | |
| Decrease in accounts payable and accrued liabilities | | (1,061) | | | (1,170) | |
| (Increase)/Decrease in other current and non-current assets | | (1,144) | | | 3,527 | |
| Increase/(Decrease) in other current and non-current liabilities | | 3,407 | | | (2,456) | |
| | | | |
| NET CASH FLOWS FROM OPERATING ACTIVITIES | | 7,439 | | | 9,560 | |
| | | | |
| CASH FLOWS FROM INVESTING ACTIVITIES | | | | |
| Additions to property, plant and equipment | | (1,987) | | | (1,470) | |
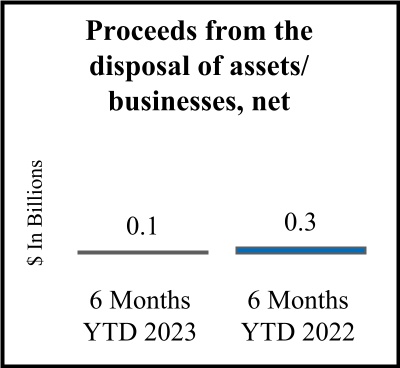
| Proceeds from the disposal of assets/businesses, net (Note 10) | | 116 | | | 314 | |
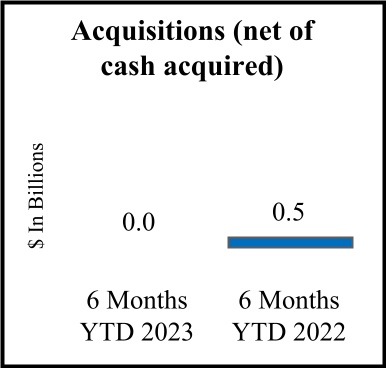
| Acquisitions, net of cash acquired (Note 10) | | — | | | (523) | |
| Purchases of investments | | (9,688) | | | (22,048) | |
| Sales of investments | | 11,877 | | | 17,634 | |
| Credit support agreements activity, net | | (798) | | | (10) | |
| Other (primarily licenses and milestones) | | 19 | | | (170) | |
| | | | |
| NET CASH USED BY INVESTING ACTIVITIES | | (461) | | | (6,273) | |
| | | | |
| CASH FLOWS FROM FINANCING ACTIVITIES | | | | |
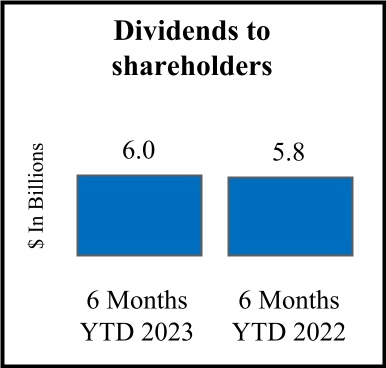
| Dividends to shareholders | | (6,034) | | | (5,758) | |
| Repurchase of common stock | | (3,918) | | | (2,550) | |
| Proceeds from short-term debt (Note 4) | | 12,221 | | | 4,371 | |
| Repayment of short-term debt | | (13,611) | | | (2,201) | |
| Proceeds from long-term debt, net of issuance costs (Note 4) | | 7,674 | | | 2 | |
| Repayment of long-term debt | | (501) | | | (2,132) | |
| Proceeds from the exercise of stock options/employee withholding tax on stock awards, net | | 254 | | | 820 | |
| Credit support agreements activity, net | | (126) | | | 813 | |
| Proceeds from Kenvue initial public offering (Note 12) | | 4,241 | | | — | |
| Other | | (53) | | | (11) | |
| | | | |
| NET CASH FROM/(USED BY) FINANCING ACTIVITIES | | 147 | | | (6,646) | |
| | | | |
| Effect of exchange rate changes on cash and cash equivalents | | (69) | | | (145) | |
| Increase/(Decrease) in cash and cash equivalents | | 7,056 | | | (3,504) | |
| Cash and Cash equivalents beginning of period | | 14,127 | | | 14,487 | |
| CASH AND CASH EQUIVALENTS, END OF PERIOD | | $ | 21,183 | | | 10,983 | |
| | | | |
| | | | |
| | | | |
| | | | |
| | | | |
| Acquisitions | | | | |
| Fair value of assets acquired | | $ | — | | | 621 | |
| Fair value of liabilities assumed | | — | | | (98) | |
| Net cash paid for acquisitions | | $ | — | | | 523 | |
| | | | |
| | | | |
| | | | | | | | | | | | | | |
| | | Fiscal Three Months Ended |
| | March 31,
2024 | | April 2,
2023 |
| Cash flows from operating activities | | | | |
| Net earnings/(Loss) | | $3,255 | | (68) |
| Adjustments to reconcile net earnings to cash flows from operating activities: | | | | |
| Depreciation and amortization of property and intangibles | | 1,815 | | 1,880 |
| Stock based compensation | | 302 | | 306 |
| | | | |
| | | | |
| Asset write-downs | | 185 | | 426 |
| | | | |
| | | | |
| | | | |
| Net gain on sale of assets/businesses | | — | | (8) |
| | | | |
| Deferred tax provision | | (1,562) | | (1,543) |
| Credit losses and accounts receivable allowances | | — | | 1 |
| Changes in assets and liabilities, net of effects from acquisitions and divestitures: | | | | |
| Increase in accounts receivable | | (279) | | (54) |
| Increase in inventories | | (348) | | (524) |
| Decrease in accounts payable and accrued liabilities | | (2,483) | | (2,572) |
| Decrease/(Increase) in other current and non-current assets | | 3,199 | | (915) |
| (Decrease)/Increase in other current and non-current liabilities | | (427) | | 6,328 |
| | | | |
| Net cash flows from operating activities | | 3,657 | | 3,257 |
| | | | |
| Cash flows from investing activities | | | | |
| Additions to property, plant and equipment | | (807) | | (863) |
| Proceeds from the disposal of assets/businesses, net (Note 10) | | 210 | | 40 |
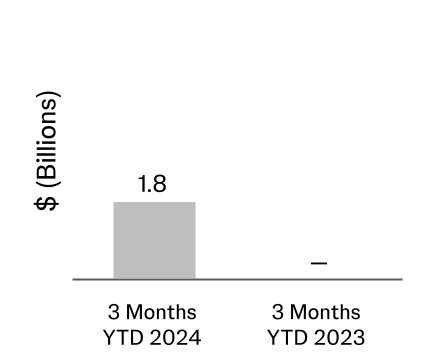
| Acquisitions, net of cash acquired (Note 10) | | (1,811) | | — |
| Purchases of investments | | (630) | | (3,774) |
| Sales of investments | | 979 | | 7,766 |
| Credit support agreements activity, net | | 1,600 | | 158 |
| Other (including capitalized licenses and milestones) | | (5) | | (12) |
| | | | |
| Net cash (used by)/ from investing activities | | (464) | | 3,315 |
| | | | |
| Cash flows from financing activities | | | | |
| Dividends to shareholders | | (2,869) | | (2,942) |
| Repurchase of common stock | | (1,475) | | (3,537) |
| Proceeds from short-term debt | | 5,263 | | 11,094 |
| Repayment of short-term debt | | (890) | | (5,388) |
| Proceeds from long-term debt, net of issuance costs | | 2 | | 7,674 |
| Repayment of long-term debt | | (1) | | (500) |
| Proceeds from the exercise of stock options/employee withholding tax on stock awards, net | | 195 | | (11) |
| Credit support agreements activity, net | | 228 | | (13) |
| | | | |
| | | | |
| | | | |
| Other | | 93 | | (239) |
| | | | |
| Net cash flows from financing activities | | 546 | | 6,138 |
| | | | |
| | | | | | | | | | | | | | |
| | | Fiscal Three Months Ended |
| | March 31,
2024 | | April 2,
2023 |
| | | | |
| Effect of exchange rate changes on cash and cash equivalents | | (125) | | 28 |
| Increase in cash, cash equivalents and restricted cash | | 3,614 | | 12,738 |
| Cash and cash equivalents from continuing operations, beginning of period | | 21,859 | | 12,889 |
| Cash and cash equivalents from discontinued operations, beginning of period | | — | | 1,238 |
| Cash and Cash equivalents beginning of period | | 21,859 | | 14,127 |
| | | | |
| Cash and cash equivalents from continuing operations, end of period | | 25,473 | | 25,188 |
| Cash and cash equivalents from discontinued operations, end of period | | — | | 1,677 |
| Cash, cash equivalents and restricted cash, end of period | | $25,473 | | 26,865 |
| | | | |
| | | | |
| | | | |
| | | | |
| | | | |
| Acquisitions | | | | |
| Fair value of assets acquired | | $1,899 | | — |
| Fair value of liabilities assumed | | (88) | | — |
| Net cash paid for acquisitions | | $1,811 | | — |
| | | | |
| | | | |
See Notes to Consolidated Financial Statements
Amounts presented have not been recast to exclude discontinued operations.
NOTES TO CONSOLIDATED FINANCIAL STATEMENTS
NOTENote 1 — The accompanying unaudited interim consolidated financial statements and related notes should be read in conjunction with the audited Consolidated Financial Statements of Johnson & Johnson and its subsidiaries (the Company) and related notes as contained in the Company’s Annual Report on Form 10-K for the fiscal year ended January 1,December 31, 2023. The unaudited interim financial statements include all adjustments (consisting only of normal recurring adjustments) and accruals necessary in the judgment of management for a fair statement of the results for the periods presented.
For details regarding the Kenvue separation see Note 12 to the Consolidated Financial Statements.
Columns and rows within tables may not add due to rounding. Percentages have been calculated using actual, non-rounded figures.
New Accounting Standardsaccounting standards
The Company assesses the adoption impacts of recently issued accounting standards by the Financial Accounting Standards Board on the Company's financial statements as well as material updates to previous assessments, if any, from the Company’s Annual Report on Form 10-K for the fiscal year ended January 1,December 31, 2023.
Recently adopted accounting standards
There were no new material accounting standards adopted in the fiscal first quarter of 2024.
Recently issued accounting standards
Not adopted as of March 31, 2024
ASU 2023-07: Segment Reporting (Topic 280) – Improvements to Reportable Segment Disclosures
This update requires expanded annual and interim disclosures for significant segment expenses that are regularly provided to the chief operating decision maker and included within each reported measure of segment profit or loss. This update will be effective for fiscal years beginning after December 15, 2023, and interim periods within fiscal years beginning after December 15, 2024. This standard is to be applied retrospectively to all periods presented in the financial statements. Early adoption is permitted. As this accounting standard only impacts disclosures, it will not have a material impact on the Company’s Consolidated Financial Statements.
Recently Adopted Accounting StandardsASU 2023-09: Income Taxes (Topic 740) - Improvements to Income Tax Disclosures
This update standardizes categories for the effective tax rate reconciliation, requires disaggregation of income taxes and additional income tax-related disclosures. This update is required to be effective for the Company for fiscal periods beginning after December 15, 2024. As this accounting standard only impacts disclosures, it will not have a material impact on the Company’s Consolidated Financial Statements.
ASU 2022-04: Liabilities-Supplier Finance Programs (Topic 405-50)
– Disclosure
There were no new material accounting standards issued in the fiscal first quarter of Supplier Finance Program Obligations2024.
The Company adopted the standard as of the beginning of fiscal year 2023, which requires that a buyer in a supplierSupplier finance program disclose additional information about the program for financial statement users.
The Company has agreements for supplier finance programs with third-party financial institutions. These programs provide participating suppliers the ability to finance payment obligations from the Company with the third-party financial institutions. The Company is not a party to the arrangements between the suppliers and the third-party financial institutions. The Company’s obligations to its suppliers, including amounts due, and scheduled payment dates (which have general payment terms of 90 days), are not affected by a participating supplier’s decision to participate in the program.
As of July 2,March 31, 2024, and December 31, 2023, and January 1, 2023, $0.9$0.6 billion and $1.0$0.7 billion, respectively, were valid obligations under the program. The obligations are presented as Accounts payable on the Consolidated Balance Sheets.
Recently Issued Accounting Standards
Not Adopted as of July 2, 2023
There were no new material accounting standards issued in the fiscal six months of 2023.
Reclassification
Certain prior period amounts have been reclassified to conform to current year presentation.
NOTE 2 — INVENTORIES
| | | | | | | | | | | | | | |
| (Dollars in Millions) | | July 2, 2023 | | January 1, 2023 |
| Raw materials and supplies | | $ | 2,419 | | | 2,070 | |
| Goods in process | | 1,944 | | | 1,700 | |
| Finished goods | | 8,525 | | | 8,713 | |
| Total inventories | | $ | 12,888 | | | 12,483 | |
NOTE
Note 2 — Inventories
| | | | | | | | | | | |
| (Dollars in Millions) | March 31, 2024 | | December 31, 2023 |
| Raw materials and supplies | $2,331 | | 2,355 |
| Goods in process | 2,172 | | 1,952 |
| Finished goods | 6,880 | | 6,874 |
| Total inventories | $11,383 | | 11,181 |
Note 3 — INTANGIBLE ASSETS AND GOODWILL
Intangible assets that have finite useful lives are amortized over their estimated useful lives. The latest annual impairment assessment of goodwill and indefinite lived intangible assets was completed in the fiscal fourth quarter of 2022.2023. Future impairment tests for goodwill and indefinite lived intangible assets will be performed annually in the fiscal fourth quarter, or sooner, if warranted.
| | (Dollars in Millions) | (Dollars in Millions) | | July 2, 2023 | | January 1, 2023 | (Dollars in Millions) | March 31, 2024 | | December 31, 2023 |
| Intangible assets with definite lives: | Intangible assets with definite lives: | | | | | Intangible assets with definite lives: | | | |
| Patents and trademarks — gross | Patents and trademarks — gross | | $ | 44,637 | | | 44,012 | | Patents and trademarks — gross | $39,198 | | 40,417 |
| Less accumulated amortization | Less accumulated amortization | | (24,460) | | | (22,266) | | Less accumulated amortization | (24,826) | | (24,808) |
| Patents and trademarks — net | Patents and trademarks — net | | 20,177 | | | 21,746 | | Patents and trademarks — net | 14,372 | | 15,609 |
| Customer relationships and other intangibles — gross | Customer relationships and other intangibles — gross | | 23,055 | | | 22,987 | | Customer relationships and other intangibles — gross | 19,930 | | 20,322 |
| Less accumulated amortization | Less accumulated amortization | | (13,516) | | | (12,901) | | Less accumulated amortization | (12,742) | | (12,685) |
Customer relationships and other intangibles — net(1) | Customer relationships and other intangibles — net(1) | | 9,539 | | | 10,086 | | Customer relationships and other intangibles — net(1) | 7,188 | | 7,637 |
| Intangible assets with indefinite lives: | Intangible assets with indefinite lives: | | | | | Intangible assets with indefinite lives: | | | |
| Trademarks | Trademarks | | 6,834 | | | 6,807 | | Trademarks | 1,649 | | 1,714 |
| Purchased in-process research and development | Purchased in-process research and development | | 9,696 | | | 9,686 | | Purchased in-process research and development | 11,077 | | 9,215 |
| Total intangible assets with indefinite lives | Total intangible assets with indefinite lives | | 16,530 | | | 16,493 | | Total intangible assets with indefinite lives | 12,726 | | 10,929 |
| Total intangible assets — net | Total intangible assets — net | | $ | 46,246 | | | 48,325 | | Total intangible assets — net | $34,286 | | 34,175 |
(1)The majority is comprised of customer relationships
Goodwill as of July 2, 2023March 31, 2024 was allocated by segment of business as follows:
| | (Dollars in Millions) | (Dollars in Millions) | | Consumer Health | | Pharmaceutical | | MedTech | | Total |
| Goodwill at January 1, 2023 | | $ | 9,184 | | | 10,184 | | | 25,863 | | | 45,231 | |
| (Dollars in Millions) | |
| (Dollars in Millions) | | | | Innovative Medicine | | MedTech | | Total |
| Goodwill at December 31, 2023 | | Goodwill at December 31, 2023 | | | $10,407 | | 26,151 | | 36,558 |
| Goodwill, related to acquisitions | Goodwill, related to acquisitions | | — | | | — | | | — | | | — | | Goodwill, related to acquisitions | | | 290 | | — | | 290 |
| Goodwill, related to divestitures | Goodwill, related to divestitures | | — | | | — | | | — | | | — | | Goodwill, related to divestitures | | | — | | — |
| Currency translation/Other | Currency translation/Other | | (103) | | | 137 | | | 175 | | * | 209 | | Currency translation/Other | | | (145) | | (87) | | (232) |
| Goodwill at July 2, 2023 | | $ | 9,081 | | | 10,321 | | | 26,038 | | | 45,440 | |
| Goodwill at March 31, 2024 | | Goodwill at March 31, 2024 | | | $10,552 | | 26,064 | | 36,616 |
*Includes purchase price allocation adjustment for Abiomed
The weighted average amortization period for patents and trademarks is 12approximately 11 years. The weighted average amortization period for customer relationships and other intangible assets is 21approximately 18 years. The amortization expense of amortizable intangible assets included in the cost of products sold was $1.2$1.1 billion and $1.1 billion for the fiscal secondfirst quarters ended JulyMarch 31, 2024 and April 2, 2023, and July 3, 2022, respectively. The amortization expense of amortizable intangible assets included in cost of products sold was $2.4 billion and $2.2 billion for the fiscal six months ended July 2, 2023 and July 3, 2022, respectively. Intangible asset write-downs are included in Other (income) expense, net, with the exceptionnet.
The estimated amortization expense for approved products, before tax, for the five succeeding years is approximately:
| | | | | | | | | | | | | | | | | | | | | | | | | | |
| (Dollars in Millions) | | | | | | |
| 2023 | | 2024 | | 2025 | | 2026 | | 2027 |
| $4,800 | | 4,600 | | 3,800 | | 3,200 | | 2,600 |
| | | | | | | | | | | | | | | | | | | | | | | | | | |
| (Dollars in Millions) | | | | | | |
| 2024 | | 2025 | | 2026 | | 2027 | | 2028 |
| $4,300 | | 3,500 | | 2,900 | | 2,300 | | 1,600 |
See Note 10 to the Consolidated Financial Statements for additional details related to acquisitions and divestitures.
NOTENote 4 — FAIR VALUE MEASUREMENTS
The Company uses forward foreign exchange contracts to manage its exposure to the variability of cash flows, primarily related to the foreign exchange rate changes of future intercompany product and third-party purchases of materials denominated in a foreign currency. The Company uses cross currency interest rate swaps to manage currency risk primarily related to borrowings. Both types of derivatives are designated as cash flow hedges.
Additionally, the Company uses interest rate swaps as an instrument to manage interest rate risk related to fixed rate borrowings. These derivatives are designated as fair value hedges. The Company uses cross currency interest rate swaps and forward foreign exchange contracts designated as net investment hedges. Additionally, the Company uses forward foreign exchange contracts to offset its exposure to certain foreign currency assets and liabilities. These forward foreign exchange contracts are not designated as hedges, and therefore, changes in the fair values of these derivatives are recognized in earnings, thereby offsetting the current earnings effect of the related foreign currency assets and liabilities.
The Company does not enter into derivative financial instruments for trading or speculative purposes, or that contain credit risk related contingent features. The Company maintains credit support agreements (CSA) with certain derivative counterparties establishing collateral thresholds based on respective credit ratings and netting agreements. As of July 2, 2023,March 31, 2024, the cumulative amount of cash collateral paid by the Company under the CSA amounted to $1.8$2.2 billion net, related to net investment and cash flow hedges. On an ongoing basis, the Company monitors counter-party credit ratings. The Company considers credit non-performance risk to be low, because the Company primarily enters into agreements with commercial institutions that have at least an investment grade credit rating. Refer to the table on significant financial assets and liabilities measured at fair value contained in this footnote for receivables and payables with these commercial institutions. As of July 2,March 31, 2024, the Company had notional amounts outstanding for forward foreign exchange contracts, cross currency interest rate swaps and interest rate swaps of $43.2 billion, $39.6 billion and $10.0 billion, respectively. As of December 31, 2023, the Company had notional amounts outstanding for forward foreign exchange contracts, cross currency interest rate swaps and interest rate swaps of $46.9$42.9 billion, $39.5$39.7 billion and $10.0 billion, respectively. As of January 1, 2023, the Company had notional amounts outstanding for forward foreign exchange contracts, cross currency interest rate swaps and interest rate swaps of $43.3 billion, $36.2 billion and $12.4 billion, respectively.
All derivative instruments are recorded on the balance sheet at fair value. Changes in the fair value of derivatives are recorded each period in current earnings or other comprehensive income, depending on whether the derivative is designated as part of a hedge transaction, and if so, the type of hedge transaction.
The designation as a cash flow hedge is made at the entrance date of the derivative contract. At inception, all derivatives are expected to be highly effective. Foreign exchange contracts designated as cash flow hedges are accounted for under the forward method and all gains/losses associated with these contracts will be recognized in the income statement when the hedged item impacts earnings. Changes in the fair value of these derivatives are recorded in accumulated other comprehensive income until the underlying transaction affects earnings and are then reclassified to earnings in the same account as the hedged transaction.
Gains and losses associated with interest rate swaps and changes in fair value of hedged debt attributable to changes in interest rates are recorded to interest expense in the period in which they occur. Gains and losses on net investment hedges are accounted for through the currency translation account within accumulated other comprehensive income. The portion excluded from effectiveness testing is recorded through interest (income) expense using the spot method. On an ongoing basis, the Company assesses whether each derivative continues to be highly effective in offsetting changes of hedged items. If and when a derivative is no longer expected to be highly effective, hedge accounting is discontinued.
The Company designated its Euro denominated notes issued in May 2016 with due dates ranging from 20222024 to 2035 as a net investment hedge of the Company's investments in certain of its international subsidiaries that use the Euro as their functional currency in order to reduce the volatility caused by changes in exchange rates.
As of July 2, 2023,March 31, 2024, the balance of deferred net gainloss on derivatives included in accumulated other comprehensive income was $67$795 million after-tax. For additional information, see the Consolidated Statements of Comprehensive Income and Note 7. The Company expects that substantially all of the amounts related to forward foreign exchange contracts will be reclassified into earnings over the next 12 months as a result of transactions that are expected to occur over that period. The maximum length of time over which the Company is hedging transaction exposure is 18 months, excluding interest rate contracts and net investment hedge contracts. The amount ultimately realized in earnings may differ as foreign exchange rates change. Realized gains and losses are ultimately determined by actual exchange rates at maturity of the derivative.
The following table is a summary of the activity related to derivatives and hedges for the fiscal second quarters ended July 2, 2023 and July 3, 2022, net of tax:
| | | | | | | | | | | | | | | | | | | | | | | | | | | | | | | | |
| July 2, 2023 | July 3, 2022 |
| (Dollars in Millions) | Sales | Cost of Products Sold | R&D Expense | Interest (Income) Expense | Other (Income) Expense | Sales | Cost of Products Sold | R&D Expense | Interest (Income) Expense | Other (Income) Expense |
| | | | | | | | | | |
| | | | | | | | | | |
| The effects of fair value, net investment and cash flow hedging: | | | | | | | | | | |
| Gain (Loss) on fair value hedging relationship: | | | | | | | | | | |
| Interest rate swaps contracts: | | | | | | | | | | |
| Hedged items | $ | — | | — | | — | | (175) | | — | | — | | — | | — | | (241) | | — | |
| Derivatives designated as hedging instruments | — | | — | | — | | 175 | | — | | — | | — | | — | | 241 | | — | |
| | | | | | | | | | |
| Gain (Loss) on net investment hedging relationship: | | | | | | | | | | |
| Cross currency interest rate swaps contracts: | | | | | | | | | | |
| Amount of gain or (loss) recognized in income on derivative amount excluded from effectiveness testing | — | | — | | — | | 33 | | — | | — | | — | | — | | 44 | | — | |
| Amount of gain or (loss) recognized in AOCI | — | | — | | — | | 33 | | — | | — | | — | | — | | 44 | | — | |
| | | | | | | | | | |
| Gain (Loss) on cash flow hedging relationship: | | | | | | | | | | |
| Forward foreign exchange contracts: | | | | | | | | | | |
| Amount of gain or (loss) reclassified from AOCI into income | (15) | | 56 | | (12) | | — | | 3 | | (17) | | (6) | | 42 | | — | | (39) | |
| | | | | | | | | | |
| | | | | | | | | | |
| | | | | | | | | | |
| Amount of gain or (loss) recognized in AOCI | (14) | | 251 | | 7 | | — | | 18 | | (25) | | 35 | | 69 | | — | | (38) | |
| | | | | | | | | | |
| Cross currency interest rate swaps contracts: | | | | | | | | | | |
| Amount of gain or (loss) reclassified from AOCI into income | — | | — | | — | | 74 | | — | | — | | — | | — | | 102 | | — | |
| | | | | | | | | | |
| Amount of gain or (loss) recognized in AOCI | $ | — | | — | | — | | (432) | | — | | — | | — | | — | | 60 | | — | |
| | | | | | | | | | |
The following table is a summary of the activity related to derivatives and hedges for the fiscal six monthsfirst quarters ended JulyMarch 31, 2024 and April 2, 2023, and July 3, 2022, net of tax:
| | | | | | | | | | | | | | | | | | | | | | | | | | | | | | | | |
| July 2, 2023 | July 3, 2022 |
| (Dollars in Millions) | Sales | Cost of Products Sold | R&D Expense | Interest (Income) Expense | Other (Income) Expense | Sales | Cost of Products Sold | R&D Expense | Interest (Income) Expense | Other (Income) Expense |
| | | | | | | | | | |
| | | | | | | | | | |
| The effects of fair value, net investment and cash flow hedging: | | | | | | | | | | |
| Gain (Loss) on fair value hedging relationship: | | | | | | | | | | |
| Interest rate swaps contracts: | | | | | | | | | | |
| Hedged items | $ | — | | — | | — | | (1,104) | | — | | — | | — | | — | | (772) | | — | |
| Derivatives designated as hedging instruments | — | | — | | — | | 1,104 | | — | | — | | — | | — | | 772 | | — | |
| | | | | | | | | | |
| Gain (Loss) on net investment hedging relationship: | | | | | | | | | | |
| Cross currency interest rate swaps contracts: | | | | | | | | | | |
| Amount of gain or (loss) recognized in income on derivative amount excluded from effectiveness testing | — | | — | | — | | 67 | | — | | — | | — | | — | | 89 | | — | |
| Amount of gain or (loss) recognized in AOCI | — | | — | | — | | 67 | | — | | — | | — | | — | | 89 | | — | |
| | | | | | | | | | |
| Gain (Loss) on cash flow hedging relationship: | | | | | | | | | | |
| Forward foreign exchange contracts: | | | | | | | | | | |
| Amount of gain or (loss) reclassified from AOCI into income | (3) | | (90) | | (25) | | — | | 5 | | (34) | | (58) | | 65 | | — | | (57) | |
| | | | | | | | | | |
| | | | | | | | | | |
| | | | | | | | | | |
| Amount of gain or (loss) recognized in AOCI | 10 | | 396 | | (29) | | — | | 4 | | (3) | | (59) | | 102 | | — | | (111) | |
| | | | | | | | | | |
| Cross currency interest rate swaps contracts: | | | | | | | | | | |
| Amount of gain or (loss) reclassified from AOCI into income | — | | — | | — | | 182 | | — | | — | | — | | — | | 222 | | — | |
| | | | | | | | | | |
| Amount of gain or (loss) recognized in AOCI | $ | — | | — | | — | | (15) | | — | | — | | — | | — | | (68) | | — | |
| | | | | | | | | | |
| | | | | | | | | | | | | | | | | | | | | | | | | | | | | | | | | | | |
| March 31, 2024 | | April 2, 2023 |
| (Dollars in Millions) | Sales | Cost of Products Sold | R&D Expense | Interest (Income) Expense | Other (Income) Expense | | Sales | Cost of Products Sold | R&D Expense | Interest (Income) Expense | Other (Income) Expense |
| | | | | | | | | | | |
| | | | | | | | | | | |
| The effects of fair value, net investment and cash flow hedging: | | | | | | | | | | | |
| Gain (Loss) on fair value hedging relationship: | | | | | | | | | | | |
| Interest rate swaps contracts: | | | | | | | | | | | |
| Hedged items | $— | — | — | 8 | — | | — | — | — | 169 | — |
| Derivatives designated as hedging instruments | — | — | — | (8) | — | | — | — | — | (169) | — |
| | | | | | | | | | | |
| Gain (Loss) on net investment hedging relationship: | | | | | | | | | | | |
| Cross currency interest rate swaps contracts: | | | | | | | | | | | |
| Amount of gain or (loss) recognized in income on derivative amount excluded from effectiveness testing | — | — | — | 34 | — | | — | — | — | 34 | — |
| Amount of gain or (loss) recognized in AOCI | — | — | — | 34 | — | | — | — | — | 34 | — |
| | | | | | | | | | | |
| Gain (Loss) on cash flow hedging relationship: | | | | | | | | | | | |
| Forward foreign exchange contracts: | | | | | | | | | | | |
| Amount of gain or (loss) reclassified from AOCI into income | 1 | 165 | 4 | — | (2) | | 12 | (146) | (13) | — | 2 |
| | | | | | | | | | | |
| | | | | | | | | | | |
| | | | | | | | | | | |
| Amount of gain or (loss) recognized in AOCI | (3) | (19) | 22 | — | 4 | | 24 | 145 | (36) | — | (14) |
| | | | | | | | | | | |
| Cross currency interest rate swaps contracts: | | | | | | | | | | | |
| Amount of gain or (loss) reclassified from AOCI into income | — | — | — | 49 | — | | — | — | — | 108 | — |
| | | | | | | | | | | |
| Amount of gain or (loss) recognized in AOCI | $— | — | — | (205) | — | | — | — | — | 417 | — |
| | | | | | | | | | | |
As of July 2, 2023,March 31, 2024, and January 1,December 31, 2023, the following amounts were recorded on the Consolidated Balance Sheet related to cumulative basis adjustment for fair value hedgeshedges:
| | | | | | | | | | | | | | | | | | | | | | | | | | |
| Line item in the Consolidated Balance Sheet in which the hedged item is included | | Carrying Amount of the Hedged Liability
| | Cumulative Amount of Fair Value Hedging Gain/ (Loss) Included in the Carrying Amount of the Hedged Liability |
| | |
| (Dollars in Millions) | | July 2, 2023 | | January 1, 2023 | | July 2, 2023 | | January 1, 2023 |
| | | | | | | | |
| Long-term Debt | | $ | 8,662 | | | 8,665 | | | (1,443) | | | (1,435) | |
| | | | | | | | |
| | | | | | | | | | | | | | | | | | | | | | | | | | |
| Line item in the Consolidated Balance Sheet in which the hedged item is included | | Carrying Amount of the Hedged Liability
| | Cumulative Amount of Fair Value Hedging Gain/ (Loss) Included in the Carrying Amount of the Hedged Liability |
| | |
| (Dollars in Millions) | | March 31, 2024 | | December 31, 2023 | | March 31, 2024 | | December 31, 2023 |
| | | | | | | | |
| Long-term Debt | | $8,871 | | 8,862 | | (1,205) | | (1,216) |
| | | | | | | | |
The following table is the effect of derivatives not designated as hedging instruments for the fiscal secondfirst quarters ended 20232024 and 2022:2023:
| | | | | | | | Gain/(Loss)
Recognized In
Income on Derivative | |
| | Gain/(Loss)
Recognized In
Income on Derivative | Gain/(Loss)
Recognized In
Income on Derivative | |
| | | | | | Gain/(Loss)
Recognized In
Income on Derivative | |
| | | | | | | Gain/(Loss)
Recognized In
Income on Derivative | |
| (Dollars in Millions) | |
| (Dollars in Millions) | |
| (Dollars in Millions) | (Dollars in Millions) | | Location of Gain /(Loss) Recognized in Income on Derivative | | Fiscal Second Quarter Ended | Fiscal Six Months Ended | |
| Derivatives Not Designated as Hedging Instruments | Derivatives Not Designated as Hedging Instruments | | July 2, 2023 | | July 3, 2022 | July 2, 2023 | | July 3, 2022 | |
| Derivatives Not Designated as Hedging Instruments | |
| Derivatives Not Designated as Hedging Instruments | |
| Foreign Exchange Contracts | Foreign Exchange Contracts | | Other (income) expense | | $ | 33 | | | 73 | | 2 | | | 102 | | |
| Foreign Exchange Contracts | |
| Foreign Exchange Contracts | |
The following table is the effect of net investment hedges for the fiscal secondfirst quarters ended in 20232024 and 2022:2023:
| | | Gain/(Loss)
Recognized In
Accumulated
OCI | | Location of Gain or (Loss) Reclassified from Accumulated Other Comprehensive Income Into Income | | Gain/(Loss) Reclassified From
Accumulated OCI
Into Income |
| | Gain/(Loss)
Recognized In
Accumulated OCI | |
| | Gain/(Loss)
Recognized In
Accumulated OCI | |
| | Gain/(Loss)
Recognized In
Accumulated OCI | |
| | Gain/(Loss)
Recognized In
Accumulated OCI | |
| | Gain/(Loss)
Recognized In
Accumulated OCI | |
| | Gain/(Loss)
Recognized In
Accumulated OCI | |
| | Gain/(Loss)
Recognized In
Accumulated OCI | |
| | Gain/(Loss)
Recognized In
Accumulated OCI | |
| | Gain/(Loss)
Recognized In
Accumulated OCI | |
| | Gain/(Loss)
Recognized In
Accumulated OCI | |
| | Gain/(Loss)
Recognized In
Accumulated OCI | |
| | Gain/(Loss)
Recognized In
Accumulated OCI | |
| | Gain/(Loss)
Recognized In
Accumulated OCI | |
| | Gain/(Loss)
Recognized In
Accumulated OCI | |
| | Gain/(Loss)
Recognized In
Accumulated OCI | |
| | Gain/(Loss)
Recognized In
Accumulated OCI | |
| | Gain/(Loss)
Recognized In
Accumulated OCI | |
| | Gain/(Loss)
Recognized In
Accumulated OCI | |
| | Gain/(Loss)
Recognized In
Accumulated OCI | |
| | Gain/(Loss)
Recognized In
Accumulated OCI | |
| | Gain/(Loss)
Recognized In
Accumulated OCI | |
| | Gain/(Loss)
Recognized In
Accumulated OCI | |
| | Gain/(Loss)
Recognized In
Accumulated OCI | |
| | Gain/(Loss)
Recognized In
Accumulated OCI | |
| | Gain/(Loss)
Recognized In
Accumulated OCI | |
| | Gain/(Loss)
Recognized In
Accumulated OCI | |
| | Gain/(Loss)
Recognized In
Accumulated OCI | |
| | Gain/(Loss)
Recognized In
Accumulated OCI | |
| | Gain/(Loss)
Recognized In
Accumulated OCI | |
| | Gain/(Loss)
Recognized In
Accumulated OCI | |
| | Gain/(Loss)
Recognized In
Accumulated OCI | |
| | Gain/(Loss)
Recognized In
Accumulated OCI | |
| | Gain/(Loss)
Recognized In
Accumulated OCI | | | Location of Gain or (Loss) Reclassified from Accumulated Other Comprehensive Income Into Income | | Gain/(Loss) Reclassified From
Accumulated OCI
Into Income |
| (Dollars in Millions) | (Dollars in Millions) | | July 2, 2023 | | July 3, 2022 | | July 2, 2023 | | July 3, 2022 | (Dollars in Millions) | | March 31, 2024 | | April 2, 2023 | | | | March 31, 2024 | | April 2, 2023 |
| Debt | Debt | | $ | 11 | | | 202 | | | Interest (income) expense | | — | | | — | | Debt | | $84 | | (77) | | Interest (income) expense | | — |
| Cross Currency interest rate swaps | Cross Currency interest rate swaps | | $ | (24) | | | 313 | | | Interest (income) expense | | — | | | — | | Cross Currency interest rate swaps | | $728 | | 690 | | Interest (income) expense | | — |
|
The following table is the effect of net investment hedges for the fiscal six months ended in 2023 and 2022
| | | | | | | | | | | | | | | | | | | | | | | | | | | | | | | | |
|
| | Gain/(Loss)
Recognized In
Accumulated OCI | | Location of Gain or (Loss) Reclassified from Accumulated Other Comprehensive Income Into Income | | Gain/(Loss) Reclassified From
Accumulated OCI
Into Income |
| (Dollars in Millions) | | July 2, 2023 | | July 3, 2022 | | | | July 2, 2023 | | July 3, 2022 |
| Debt | | $ | (66) | | | 270 | | | Interest (income) expense | | — | | | — | |
| Cross Currency interest rate swaps | | $ | 666 | | | 873 | | | Interest (income) expense | | — | | | — | |
The Company holds equity investments with readily determinable fair values and equity investments without readily determinable fair values. The Company has elected to measure equity investments that do not have readily determinable fair
values at cost minus impairment, if any, plus or minus changes resulting from observable price changes in orderly transactions for the identical or a similar investment of the same issuer.
The following table is a summary of the activity related to equity investments:
| | | December 31, 2023 | | | | December 31, 2023 | | | | | | March 31, 2024 |
| (Dollars in Millions) | (Dollars in Millions) | | January 1, 2023 | | July 2, 2023 | | (Dollars in Millions) | | Carrying Value | | Changes in Fair Value Reflected in Net Income (1) | | Sales/ Purchases/Other (2) | | Carrying Value | | Non Current Other Assets |
| | Carrying Value | | Changes in Fair Value Reflected in Net Income (1) | | Sales/ Purchases/Other (2) | | Carrying Value | | Non Current Other Assets |
| Equity Investments with readily determinable value | | $ | 576 | | | (30) | | | (53) | | | 493 | | | 493 | |
| Equity Investments with readily determinable value* | | Equity Investments with readily determinable value* | | $4,473 | | 30 | | (17) | | 4,486 |
| | Equity Investments without readily determinable value | Equity Investments without readily determinable value | | $ | 698 | | | (26) | | | 75 | | | 747 | | | 747 | |
| Equity Investments without readily determinable value | |
| Equity Investments without readily determinable value | | | $696 | | 23 | | (12) | | 707 |
(1)Recorded in Other Income/Expense(income)/expense, net
(2)Other includes impact of currency
Fair value is the exit price that would be received to sell an asset or paid to transfer a liability. Fair value is a market-based measurement determined using assumptions that market participants would use in pricing an asset or liability. In accordance with ASC 820, a three-level hierarchy was established to prioritize the inputs used in measuring fair value. The levels within the hierarchy are described below with Level 1 inputs having the highest priority and Level 3 inputs having the lowest.
The fair value of a derivative financial instrument (i.e., forward foreign exchange contracts, interest rate contracts) is the aggregation by currency of all future cash flows discounted to its present value at the prevailing market interest rates and subsequently converted to the U.S. Dollar at the current spot foreign exchange rate. The Company does not believe that fair values of these derivative instruments materially differ from the amounts that could be realized upon settlement or maturity, or that the changes in fair value will have a material effect on the Company’s results of operations, cash flows or financial position. The Company also holds equity investments which are classified as Level 1 and debt securities which are classified as Level 2. The Company holds acquisition related contingent liabilities based upon certain regulatory and commercial events, which are classified as Level 3, whose values are determined using discounted cash flow methodologies or similar techniques for which the determination of fair value requires significant judgment or estimations.
The following three levels of inputs are used to measure fair value:
Level 1 — Quoted prices in active markets for identical assets and liabilities.
Level 2 — Significant other observable inputs.
Level 3 — Significant unobservable inputs.
The Company’s significant financial assets and liabilities measured at fair value as of July 2, 2023March 31, 2024 and January 1,December 31, 2023 were as follows:
| | | | | July 2, 2023 | | | | January 1, 2023 | | | March 31, 2024 | | | | December 31, 2023 |
| (Dollars in Millions) | (Dollars in Millions) | | Level 1 | | Level 2 | | Level 3 | | Total | | Total(1) | (Dollars in Millions) | | Level 1 | | Level 2 | | Level 3 | | Total | | Total(1) |
| Derivatives designated as hedging instruments: | Derivatives designated as hedging instruments: | | | | | | | | | | | Derivatives designated as hedging instruments: | | |
| Assets: | Assets: | | | | | | | | | | | Assets: | | |
| Forward foreign exchange contracts | Forward foreign exchange contracts | | $ | — | | | 893 | | | — | | | 893 | | | 629 | | Forward foreign exchange contracts | | $— | | 499 | | — | | 499 | | 539 |
Interest rate contracts (2) | Interest rate contracts (2) | | — | | | 1,310 | | | — | | | 1,310 | | | 1,534 | | Interest rate contracts(2) | | — | | 1,202 | | — | | 1,202 | | 988 |
| | Total | Total | | — | | | 2,203 | | | — | | | 2,203 | | | 2,163 | |
| Total | |
| Total | | | — | | 1,701 | | — | | 1,701 | | 1,527 |
| Liabilities: | Liabilities: | | | | | | | | | | | Liabilities: | | |
| Forward foreign exchange contracts | Forward foreign exchange contracts | | — | | | 446 | | | — | | | 446 | | | 511 | | Forward foreign exchange contracts | | — | | 401 | | — | | 401 | | 624 |
Interest rate contracts (2) | Interest rate contracts (2) | | — | | | 3,691 | | | — | | | 3,691 | | | 2,778 | | Interest rate contracts(2) | | — | | 3,543 | | — | | 3,543 | | 5,338 |
| | Total | |
| Total | |
| Total | Total | | — | | | 4,137 | | | — | | | 4,137 | | | 3,289 | | | — | | 3,944 | | — | | 3,944 | | 5,962 |
| Derivatives not designated as hedging instruments: | Derivatives not designated as hedging instruments: | | | | | | | | | | | Derivatives not designated as hedging instruments: | | |
| Assets: | Assets: | | | | | | | | | | | Assets: | | |
| Forward foreign exchange contracts | Forward foreign exchange contracts | | — | | | 55 | | | — | | | 55 | | | 38 | | Forward foreign exchange contracts | | — | | 21 | | — | | 21 | | 64 |
| Liabilities: | Liabilities: | | | | | | | | | | | Liabilities: | | |
| Forward foreign exchange contracts | Forward foreign exchange contracts | | — | | | 22 | | | — | | | 22 | | | 68 | | Forward foreign exchange contracts | | — | | 36 | | — | | 36 | | 75 |
| Other Investments: | Other Investments: | |
Equity investments (3) | Equity investments (3) | | 493 | | | — | | | — | | | 493 | | | 576 | |
Equity investments(3) | |
Equity investments(3) | | | 4,486 | | — | | 4,486 | | 4,473 |
Debt securities (4) | Debt securities (4) | | — | | | 9,831 | | | — | | | 9,831 | | | 10,487 | | Debt securities(4) | | — | | 9,346 | | — | | 9,346 | | 8,874 |
| Other Liabilities | Other Liabilities | |
Contingent consideration (5) | Contingent consideration (5) | | $ | — | | | — | | | 1,142 | | | 1,142 | | | 1,120 | |
Contingent consideration(5) | |
Contingent consideration(5) | | | $— | | — | | 1,114 | | 1,092 |
| | | | | | | | | | | | | | |
| Gross to Net Derivative Reconciliation | | July 2, 2023 | | January 1, 2023 |
| (Dollars in Millions) | | | | |
| Total Gross Assets | | $ | 2,258 | | | 2,201 | |
| Credit Support Agreement (CSA) | | (2,119) | | | (2,176) | |
| Total Net Asset | | 139 | | | 25 | |
| | | | |
| Total Gross Liabilities | | 4,159 | | | 3,357 | |
| Credit Support Agreement (CSA) | | (3,890) | | | (3,023) | |
| Total Net Liabilities | | $ | 269 | | | 334 | |
| | | | |
| | | | | | | | | | | | | | |
| Gross to Net Derivative Reconciliation | | March 31, 2024 | | December 31, 2023 |
| (Dollars in Millions) | | | | |
| Total Gross Assets | | $1,722 | | 1,591 |
| Credit Support Agreement (CSA) | | (1,681) | | (1,575) |
| Total Net Asset | | 41 | | 16 |
| | | | |
| Total Gross Liabilities | | 3,980 | | 6,037 |
| Credit Support Agreement (CSA) | | (3,882) | | (5,604) |
| Total Net Liabilities | | $98 | | 433 |
| | | | |
Summarized information about changes in liabilities for contingent consideration for the fiscal secondfirst quarters ended JulyMarch 31, 2024 and April 2, 2023 and July 3, 2022 is as follows:
| | | | | | | | | | | | | | |
| | |
| | July 2, 2023 | | July 3, 2022 |
| (Dollars in Millions) | | | | |
| Beginning Balance | | $ | 1,120 | | | 533 | |
Changes in estimated fair value (6) | | 25 | | | (88) | |
| Additions | | — | | | 91 | |
| Payments | | (3) | | | — | |
| Ending Balance | | $ | 1,142 | | | 536 | |
| | | | | | | | | | | | | | |
| | |
| | March 31, 2024 | | April 2, 2023 |
| (Dollars in Millions) | | | | |
| Beginning Balance | | $1,092 | | 1,120 |
Changes in estimated fair value(6) | | 22 | | 23 |
| Additions | | — | | — |
| Payments | | — | | (1) |
| Ending Balance | | $1,114 | | 1,142 |
(1)20222023 assets and liabilities are all classified as Level 2 with the exception of equity investments of $576$4,473 million, which are classified as Level 1 and contingent consideration of $1,120$1,092 million, classified as Level 3.
(2)Includes cross currency interest rate swaps and interest rate swaps.
(3)Classified as non-current other assets.
(4)Classified within cash equivalents and current marketable securities.
(5) Includes $1,137 million and $1,116 million, classifiedClassified as non-current other liabilities as of July 2, 2023March 31, 2024 and January 1,December 31, 2023, respectively.
(6)Ongoing fair value adjustment amounts are primarily recorded in Research and Development expense.
The Company's cash, cash equivalents and current marketable securities as of July 2, 2023March 31, 2024 comprised:
| | (Dollars in Millions) | (Dollars in Millions) | Carrying Amount | | | Gain/(Loss) | | Estimated Fair Value | | Cash & Cash Equivalents | | Current Marketable Securities |
| (Dollars in Millions) | |
| (Dollars in Millions) | | Carrying Amount | | Unrealized Gain | | | | Estimated Fair Value | | Cash & Cash Equivalents | | Current Marketable Securities |
| Cash | Cash | $ | 4,430 | | | | — | | | 4,430 | | | 4,430 | | | — | | Cash | $3,410 | | — | | | | 3,410 | | 3,410 | | — |
| | U.S. Gov't securities | | U.S. Gov't securities | 96 | | — | | | | 96 | | 96 | | — |
| Non-U.S. sovereign securities | Non-U.S. sovereign securities | 423 | | | | — | | | 423 | | | 423 | | | — | | Non-U.S. sovereign securities | 324 | | — | | | | 324 | | 324 | | — |
| U.S. reverse repurchase agreements | U.S. reverse repurchase agreements | 8,991 | | | | — | | | 8,991 | | | 8,991 | | | — | | U.S. reverse repurchase agreements | 7,892 | | — | | | | 7,892 | | 7,892 | | — |
| Corporate debt securities(1) | |
Corporate debt securities(1) | |
Corporate debt securities(1) | Corporate debt securities(1) | 641 | | | | — | | | 641 | | | 368 | | | 273 | | 702 | | — | | | | 702 | | 588 | | 114 |
| Money market funds | Money market funds | 3,570 | | | | — | | | 3,570 | | | 3,570 | | | — | | Money market funds | 3,822 | | — | | | | 3,822 | | 3,822 | | — |
Time deposits(1) | Time deposits(1) | 619 | | | | — | | | 619 | | | 619 | | | — | | Time deposits(1) | 626 | | — | | | | 626 | | 626 | | — |
| Subtotal | Subtotal | 18,674 | | | | — | | | 18,674 | | | 18,401 | | | 273 | | Subtotal | 16,872 | | — | | | | 16,872 | | 16,758 | | 114 |
| | | | Unrealized Loss | |
| U.S. Gov’t securities | U.S. Gov’t securities | 9,416 | | | | (5) | | | 9,411 | | | 2,729 | | | 6,682 | |
| | U.S. Gov’t securities | |
| | U.S. Gov’t securities | | 9,064 | | — | | | | 9,064 | | 8,665 | | 399 |
| U.S. Gov’t Agencies | U.S. Gov’t Agencies | 123 | | | | (2) | | | 121 | | | — | | | 121 | | U.S. Gov’t Agencies | 41 | | 2 | | | | 43 | | — | | 43 |
| Other sovereign securities | Other sovereign securities | 9 | | | | — | | | 9 | | | 7 | | | 2 | | Other sovereign securities | 2 | | — | | | | 2 | | — | | 2 |
| Corporate debt securities | Corporate debt securities | 291 | | | | (1) | | | 290 | | | 46 | | | 244 | | Corporate debt securities | 237 | | — | | | | 237 | | 50 | | 187 |
Subtotal available for sale debt(2) | Subtotal available for sale debt(2) | $ | 9,839 | | | | (8) | | | 9,831 | | | 2,782 | | | 7,049 | | Subtotal available for sale debt(2) | $9,344 | | 2 | | | | 9,346 | | 8,715 | | 631 |
| Total cash, cash equivalents and current marketable securities | Total cash, cash equivalents and current marketable securities | $ | 28,513 | | | | (8) | | | 28,505 | | | 21,183 | | | 7,322 | | Total cash, cash equivalents and current marketable securities | $26,216 | | 2 | | | | 26,218 | | 25,473 | | 745 |
(1)Held to maturity investments are reported at amortized cost and gains or losses are reported in earnings.
(2)Available for sale debt securities are reported at fair value with unrealized gains and losses reported net of taxes in other comprehensive income.
As of the fiscal year ended January 1,December 31, 2023, the carrying amount was approximately the same as the estimated fair value.
Fair value of government securities and obligations and corporate debt securities was estimated using quoted broker prices and significant other observable inputs.
The Company classifies all highly liquid investments with stated maturities of three months or less from date of purchase as cash equivalents and all highly liquid investments with stated maturities of greater than three months from the date of purchase as current marketable securities. Available for sale securities with stated maturities of greater than one year from the date of purchase are available to fund current operations and are classified as either cash equivalents or current marketable securities.
The contractual maturities of the available for sale securities as of July 2, 2023March 31, 2024 are as follows:
| | (Dollars in Millions) | (Dollars in Millions) | | Cost Basis | | Fair Value | (Dollars in Millions) | | Cost Basis | | Fair Value |
| Due within one year | Due within one year | | $ | 9,823 | | | 9,815 | | Due within one year | | $9,331 | | 9,333 |
| Due after one year through five years | Due after one year through five years | | 16 | | | 16 | | Due after one year through five years | | 13 |
| Due after five years through ten years | Due after five years through ten years | | — | | | — | | Due after five years through ten years | | — |
| Total debt securities | Total debt securities | | $ | 9,839 | | | 9,831 | | Total debt securities | | $9,344 | | 9,346 |
Financial Instrumentsinstruments not measured at Fair Value:fair value
The following financial liabilities are held at carrying amount on the consolidated balance sheet as of July 2, 2023:March 31, 2024:
| | | | | | | | | | | | | | |
| (Dollars in Millions) | | Carrying Amount | | Estimated Fair Value |
| | | | |
| Financial Liabilities | | | | |
| | | | |
| Current Debt | | $ | 11,701 | | | 11,676 | |
| | | | |
| Non-Current Debt | | | | |
| | | | |
| | | | |
| 5.50% Notes due 2024 (500MM GBP 1.2605) | | 629 | | | 627 | |
| 2.625% Notes due 2025 | | 749 | | | 726 | |
| 0.55% Notes due 2025 | | 926 | | | 914 | |
| | | | |
| 2.45% Notes due 2026 | | 1,997 | | | 1,890 | |
| 2.95% Notes due 2027 | | 875 | | | 954 | |
| | | | |
| 0.95% Notes due 2027 | | 1,394 | | | 1,313 | |
| 2.90% Notes due 2028 | | 1,497 | | | 1,411 | |
| 1.150% Notes due 2028 (750MM Euro 1.0873) | | 811 | | | 728 | |
| 6.95% Notes due 2029 | | 298 | | | 347 | |
| 1.30% Notes due 2030 | | 1,605 | | | 1,435 | |
| 4.95% Debentures due 2033 | | 498 | | | 525 | |
| 4.375% Notes due 2033 | | 854 | | | 857 | |
| 1.650% Notes due 2035 (1.5B Euro 1.0873) | | 1,619 | | | 1,400 | |
| 3.55% Notes due 2036 | | 840 | | | 901 | |
| 5.95% Notes due 2037 | | 993 | | | 1,126 | |
| 3.625% Notes due 2037 | | 1,334 | | | 1,355 | |
| 3.40% Notes due 2038 | | 992 | | | 889 | |
| 5.85% Debentures due 2038 | | 697 | | | 783 | |
| 4.50% Debentures due 2040 | | 541 | | | 539 | |
| 2.10% Notes due 2040 | | 826 | | | 704 | |
| 4.85% Notes due 2041 | | 297 | | | 299 | |
| 4.50% Notes due 2043 | | 496 | | | 499 | |
| 3.70% Notes due 2046 | | 1,977 | | | 1,758 | |
| 3.75% Notes due 2047 | | 811 | | | 871 | |
| 3.50% Notes due 2048 | | 743 | | | 640 | |
| 2.25% Notes due 2050 | | 807 | | | 666 | |
| 2.45% Notes due 2060 | | 1,053 | | | 811 | |
| 5.50% Debentures due 2025* | | 748 | | | 752 | |
| 5.35% Debentures due 2026* | | 747 | | | 756 | |
| 5.05% Debentures due 2028* | | 994 | | | 1,006 | |
| 5.00% Debentures due 2030* | | 992 | | | 1,006 | |
| 4.90% Debentures due 2033* | | 1,240 | | | 1,264 | |
| 5.10% Debentures due 2043* | | 741 | | | 763 | |
| 5.05% Debentures due 2053* | | 1,476 | | | 1,531 | |
| 5.20% Debentures due 2063* | | 738 | | | 765 | |
| Other | | 66 | | | 66 | |
| Total Non-Current Debt | | $ | 33,901 | | | 32,877 | |
*Tranches related to Kenvue
| | | | | | | | | | | | | | |
| (Dollars in Millions) | | Carrying Amount | | Estimated Fair Value |
| | | | |
| Financial Liabilities | | | | |
| | | | |
| Current Debt | | $8,550 | | 8,533 |
| | | | |
| Non-Current Debt | | | | |
| | | | |
| | | | |
| | | | |
| | | | |
| 0.55% Notes due 2025 | | 974 | | 940 |
| | | | |
| 2.46% Notes due 2026 | | 1,998 | | 1,917 |
| 2.95% Notes due 2027 | | 907 | | 958 |
| | | | |
| 0.95% Notes due 2027 | | 1,434 | | 1,337 |
| 2.90% Notes due 2028 | | 1,497 | | 1,422 |
| 1.150% Notes due 2028 (750MM Euro 1.0809) | | 807 | | 751 |
| 6.95% Notes due 2029 | | 298 | | 339 |
| 1.30% Notes due 2030 | | 1,633 | | 1,466 |
| 4.95% Debentures due 2033 | | 499 | | 523 |
| 4.375% Notes due 2033 | | 854 | | 848 |
| 1.650% Notes due 2035 (1.5B Euro 1.0809) | | 1,610 | | 1,430 |
| 3.587% Notes due 2036 | | 862 | | 893 |
| 5.95% Notes due 2037 | | 994 | | 1,110 |
| 3.625% Notes due 2037 | | 1,354 | | 1,333 |
| 3.40% Notes due 2038 | | 993 | | 858 |
| 5.85% Debentures due 2038 | | 697 | | 772 |
| 4.50% Debentures due 2040 | | 541 | | 530 |
| 2.10% Notes due 2040 | | 844 | | 688 |
| 4.85% Notes due 2041 | | 297 | | 301 |
| 4.50% Notes due 2043 | | 496 | | 481 |
| 3.73% Notes due 2046 | | 1,978 | | 1,675 |
| 3.75% Notes due 2047 | | 825 | | 829 |
| 3.50% Notes due 2048 | | 743 | | 598 |
| 2.25% Notes due 2050 | | 816 | | 629 |
| 2.45% Notes due 2060 | | 1,064 | | 743 |
| Other | | 67 | | 67 |
| Total Non-Current Debt | | $25,082 | | 23,438 |
The weighted average effective interest rate on non-current debt is 3.54%2.99%.
The excess of the carrying value over the estimated fair value of debt was $1.6$1.0 billion at January 1,December 31, 2023.
Fair value of the non-current debt was estimated using market prices, which were corroborated by quoted broker prices and significant other observable inputs.
In March 2023, Kenvue priced an offering of senior unsecured notes (the Notes) in an aggregate principal amount of $7.75 billion (tranches with an * in the above table). The Notes were initially fully and unconditionally guaranteed (the Guarantees) on a senior unsecured basis by the Company. The Guarantees terminated on April 5, 2023, upon completion of the Consumer Health Business transfer.
The current debt balance as of July 2, 2023March 31, 2024 includes $9.8$6.3 billion of commercial paper ($0.7 billion of which relates to Kenvue) which has a weighted average interest rate of 4.99%5.25% and a weighted average maturity of approximately forty days.
Note 5 — INCOME TAXES
The worldwide effective income tax rates for the fiscal six monthsfirst quarters of 2024 and 2023 were 12.4% and 2022 were 15.8% and 14.9%61.8%, respectively. The increasechange in the consolidated tax rate as compared to the prior year fiscal first quarter is primarily due to the planned separationa charge of the Company’s Consumer Health business. The Company has recognized approximately $0.6$6.9 billion in incremental international tax costs due to the reorganization of certain international subsidiaries which was recorded in the fiscal second quarter. The Company also had more incomefirst quarter of 2023 and a charge of $2.7 billion in lower tax jurisdictions relative to higher tax jurisdictions versus the prior year, due primarily to the approximately $7 billion charge related tofiscal first quarter of 2024, both for the talc settlement proposal in the United Statesproposal. Both charges were recorded at an effective U.S. federal and state tax rate of 23.5% in the fiscal six months of 2023approximately 23% (for further information see Note 11 to the Consolidated Financial Statements).
Additionally in the prior year’sfiscal first quarter of 2024, the effective tax rate benefited from the impact of certain provisionswas impacted by legislative changes that went into effect for Pillar Two in some of the Tax Cuts and Jobs Act of 2017 that became effective in 2022, which were partially offset by one-time tax costs in the fiscal six months of 2022.
On July 21, 2023, the IRS issued Notice 2023-55 which provides guidance to taxpayers in determining whether aCompany's foreign tax is eligible for a U.S. foreign tax credit for tax years 2022 and 2023, specifically delaying until 2024 the application of unfavorable foreign tax credit regulations that were originally issued late last year. As a result of this new guidance, the Company has concluded that it is applicable to certain of its tax positions and therefore will record a tax benefit of approximately $0.5 billion in the fiscal third quarter of 2023.
jurisdictions. The Company also receivedhad tax benefits received from stock-based compensation that were either exercised or vested during each of the fiscal six months ended.
As of July 2, 2023,March 31, 2024, the Company had approximately $3.0$2.5 billion of liabilities from unrecognized tax benefits. The Company conducts business and files tax returns in numerous countries and currently has tax audits in progress in a number of jurisdictions. With respect to the United States, the IRSInternal Revenue Service has completed its audit for the tax years through 20122016 and is currently auditing tax years 2013 through 2016. The Company currently expects completion of this audit and settlement of the related tax liabilities in the next 12 months. As a result, the Company has classified approximately $0.5 billion of unrecognized tax benefits and associated interest as a current liability on the “Accrued taxes on Income” line of the Consolidated Balance Sheet as of the end of the second fiscal quarter of 2023 in anticipation of final settlement. The Company made a payment in the fiscal secondfirst quarter of 2024 has commenced the audit for approximately $1.4 billion to the U.S. Treasury for the previously reserved estimated liability of the 2013-2016 IRS Audit. The completion of this tax audit may result in additional adjustments to the Company’s unrecognized tax benefit liability. years 2017 through 2020.
In other major jurisdictions where the Company conducts business, the years that remain open to tax audit go back to the year 2008.2013. The Company believes it is possible that some tax audits may be completed over the next twelve months by taxing authorities in some jurisdictions.jurisdictions outside of the United States. However, the Company is not able to provide a reasonably reliable estimate of the timing of any other future tax payments relating to uncertain tax positions.
NOTENote 6 — PENSIONS AND OTHER BENEFIT PLANS
Components of Net Periodic Benefit Costnet periodic benefit cost
Net periodic benefit costs for the Company’s defined benefit retirement plans and other benefit plans include the following components:
| | | | | | | | | | | | | | | | | | | | | | | | | | | | | | | | | | | | | | | | | | | | | | | | | | |
| | Fiscal Second Quarter Ended | | Fiscal Six Months Ended |
| | | Retirement Plans | | Other Benefit Plans | | Retirement Plans | | Other Benefit Plans |
| (Dollars in Millions) | | July 2, 2023 | | July 3, 2022 | | July 2, 2023 | | July 3, 2022 | | July 2, 2023 | | July 3, 2022 | | July 2, 2023 | | July 3, 2022 |
| Service cost | | $ | 216 | | | 319 | | | 69 | | | 80 | | | 428 | | | 640 | | | 137 | | | 160 | |
| Interest cost | | 373 | | | 229 | | | 55 | | | 27 | | | 727 | | | 459 | | | 109 | | | 53 | |
| Expected return on plan assets | | (694) | | | (693) | | | (2) | | | (2) | | | (1,362) | | | (1,392) | | | (3) | | | (4) | |
| Amortization of prior service cost/(credit) | | (46) | | | (46) | | | (1) | | | (2) | | | (92) | | | (92) | | | (1) | | | (3) | |
| | | | | | | | | | | | | | | | |
| Recognized actuarial (gains) losses | | (50) | | | 167 | | | 7 | | | 31 | | | (100) | | | 329 | | | 13 | | | 61 | |
| Curtailments and settlements | | — | | | — | | | — | | | — | | | — | | | 1 | | | — | | | — | |
| Net periodic benefit cost/(credit) | | $ | (201) | | | (24) | | | 128 | | | 134 | | | (399) | | | (55) | | | 255 | | | 267 | |
| | | | | | | | | | | | | | | | | | | | | | | | | | | | | | | | | | | | |
| | Fiscal First Quarter Ended | | |
| | | Retirement Plans | | Other Benefit Plans | | | | |
| (Dollars in Millions) | | March 31, 2024 | | April 2, 2023 | | March 31, 2024 | | April 2, 2023 | | | | | | | | |
| Service cost | | $224 | | 210 | | 69 | | 68 | | | | | | | | |
| Interest cost | | 352 | | 352 | | 52 | | 54 | | | | | | | | |
| Expected return on plan assets | | (642) | | (668) | | (2) | | (1) | | | | | | | | |
Amortization of prior service cost/(credit) | | (46) | | (46) | | — | | — | | | | | | | | |
| | | | | | | | | | | | | | | | |
| Recognized actuarial (gains)/losses | | 43 | | (50) | | 13 | | 6 | | | | | | | | |
| Curtailments and settlements | | — | | — | | — | | — | | | | | | | | |
| Net periodic benefit cost/(credit) | | $(69) | | (202) | | 132 | | 127 | | | | | | | | |
The service cost component of net periodic benefit cost is presented in the same line items on the Consolidated Statement of Earnings where other employee compensation costs are reported, including Cost of products sold, Research and development expense, and Selling, marketing and administrative expenses.expenses, and in the fiscal first quarter of 2023, Net earnings from discontinued operations, net of taxes if related to the separation of Kenvue. All other components of net periodic benefit cost are presented as part of Other (income) expense, net on the Consolidated Statement of Earnings.
Company Contributionscontributions
For the fiscal sixthree months ended July 2, 2023,March 31, 2024, the Company contributed $58$29 million and $12$3 million to its U.S. and international retirement plans, respectively. The Company plans to continue to fund its U.S. defined benefit plans to comply with the Pension Protection Act of 2006. International plans are funded in accordance with local regulations.
NOTENote 7 — ACCUMULATED OTHER COMPREHENSIVE INCOME
Components of other comprehensive income income/(loss) consist of the following:
| | | | | | | | | | | | | | | | | | | | | | | | | | | | | | | | |
| | | | | | | | | | |
| | | Foreign | | Gain/(Loss) | | Employee | | Gain/(Loss) | | Total Accumulated |
| | Currency | | On | | Benefit | | On Derivatives | | Other Comprehensive |
| (Dollars in Millions) | | Translation | | Securities | | Plans | | & Hedges | | Income (Loss) |
| January 1, 2023 | | $ | (11,813) | | | (27) | | | (897) | | | (230) | | | (12,967) | |
| Net change | | (896) | | | 21 | | | (138) | | | 297 | | | (716) | |
| Amount attributable to non-controlling interest | | 548 | | | | | | | | | 548 | |
| July 2, 2023 | | $ | (12,161) | | | (6) | | | (1,035) | | | 67 | | | (13,135) | |
| | | | | | | | | | | | | | | | | | | | | | | | | | | | | | | | |
| | | | | | | | | | |
| (Dollars in Millions) | | Foreign Currency Translation | | Gain/ (Loss) On Securities | | Employee Benefit Plans | | Gain/ (Loss) On Derivatives & Hedges | | Total Accumulated Other Comprehensive Income/(Loss) |
| | | | |
| December 31, 2023 | | $(10,149) | | (1) | | (2,000) | | (377) | | (12,527) |
| | | | | | | | | | |
| | | | | | | | | | |
| | | | | | | | | | |
| Net change | | 2,123 | | 2 | | 52 | | (418) | | 1,759 |
| March 31, 2024 | | (8,026) | | 1 | | (1,948) | | (795) | | | (10,768) |
Amounts in accumulated other comprehensive income are presented net of the related tax impact. Foreign currency translation is not adjusted for income taxes where it relates to permanent investments in international subsidiaries. For additional details on comprehensive income see the Consolidated Statements of Comprehensive Income.
Details on reclassifications out of Accumulated Other Comprehensive Income:
Gain/(Loss) On Securities - reclassifications released to Other (income) expense, net.
Employee Benefit Plans - reclassifications are included in net periodic benefit cost. See Note 6 for additional details.
Gain/(Loss) On Derivatives & Hedges - reclassifications to earnings are recorded in the same account as the underlying transaction. See Note 4 for additional details.
NOTENote 8 — EARNINGS PER SHARE
The following is a reconciliation of basic net earnings per share to diluted net earnings per share:
| | | | | | | | | | | | | | | | | | | | | | | | | | |
| | | Fiscal Second Quarter Ended | | Fiscal Six Months Ended |
| (Shares in Millions) | | July 2, 2023 | | July 3, 2022 | | July 2, 2023 | | July 3, 2022 |
| Basic net earnings per share | | $ | 1.98 | | | 1.83 | | | 1.95 | | | 3.79 | |
| Average shares outstanding — basic | | 2,598.4 | | | 2,629.6 | | | 2,601.9 | | | 2,629.4 | |
| Potential shares exercisable under stock option plans | | 95.2 | | | 143.7 | | | 96.9 | | | 141.8 | |
| Less: shares which could be repurchased under treasury stock method | | (67.9) | | | (105.4) | | | (68.1) | | | (102.0) | |
| | | | | | | | |
| Average shares outstanding — diluted | | 2,625.7 | | | 2,667.9 | | | 2,630.7 | | | 2,669.2 | |
| Diluted net earnings per share | | $ | 1.96 | | | 1.80 | | | 1.93 | | | 3.73 | |
| | | | | | | | | | | | | | | | | | | | |
| | | Fiscal First Quarter Ended | | |
| (Shares in Millions) | | March 31, 2024 | | April 2, 2023 | | | | |
| Basic net earnings (loss) per share from continuing operations | | $1.35 | | (0.19) | | | | |
| Basic net earnings per share from discontinued operations | | — | | | 0.16 | | | | |
| Total net earnings (loss) per share - basic | | 1.35 | | (0.03) | | | | |
| Average shares outstanding — basic | | 2,408.2 | | 2,605.5 | | | | |
| Potential shares exercisable under stock option plans | | 87.6 | | — | | | | |
| Less: shares which could be repurchased under treasury stock method | | (65.7) | | — | | | | |
| | | | | | | | |
| Average shares outstanding — diluted/basic* | | 2,430.1 | | 2,605.5 | | | | |
| Diluted net earnings (loss) per share from continuing operations | | 1.34 | | (0.19) | | | | |
| Diluted net earnings per share from discontinuing operations | | — | | | 0.16 | | | | |
| Total net earnings (loss) per share - diluted | | $1.34 | | (0.03) | | | | |
The diluted net earnings per share calculation for the fiscal secondfirst quarter ended July 2, 2023March 31, 2024 excluded 50.844.2 million shares related to stock options, as the exercise price of these options was greater than the average market value of the Company’s stock. The diluted net earnings
* Basic shares are used to calculate loss per share calculation for the fiscal second quarter ended July 3, 2022 included allas use of diluted shares related to stock options, as the exercise price of all options was less than the average market value of the Company’s stock.when in a loss position would be anti-dilutive.
The diluted net earnings per share calculation for the fiscal six months ended July 2, 2023 excluded 46.8 million shares related to stock options, as the exercise price of these options was greater than the average market value of the Company’s stock. The diluted net earnings per share calculation for the fiscal six months ended July 3, 2022 included all shares related to stock options, as the exercise price of all options was less than the average market value of the Company’s stock.
NOTE.Note 9 — SEGMENTS OF BUSINESS AND GEOGRAPHIC AREASSegments of business and geographic areas
SALES BY SEGMENT OF BUSINESSSales by segment of business
| | | |
| | | | | Fiscal Second Quarter Ended | | Fiscal Six Months Ended |
| (Dollars in Millions) | (Dollars in Millions) | | July 2,
2023 | | July 3,
2022 | | Percent
Change | | July 2,
2023 | | July 3,
2022 | | Percent Change |
| (Dollars in Millions) | |
| (Dollars in Millions) | |
| | CONSUMER HEALTH | | | | | | | |
| OTC | |
| | INNOVATIVE MEDICINE | |
| | INNOVATIVE MEDICINE | |
| | INNOVATIVE MEDICINE | |
| Immunology | |
| Immunology | |
| Immunology | |
| U.S. | |
| U.S. | |
| U.S. | U.S. | | $ | 712 | | | 663 | | | 7.5 | % | | $ | 1,457 | | | 1,333 | | | 9.3 | % |
| International | International | | 947 | | | 818 | | | 15.7 | | | 1,844 | | | 1,609 | | | 14.6 | |
| International | |
| International | |
| Worldwide | Worldwide | | 1,659 | | | 1,482 | | | 12.0 | | | 3,301 | | | 2,943 | | | 12.2 | |
| Skin Health/Beauty | |
| Worldwide | |
| Worldwide | |
| REMICADE | |
| REMICADE | |
| REMICADE | |
| U.S. | |
| U.S. | |
| U.S. | |
| U.S. Exports | |
| U.S. Exports | |
| U.S. Exports | |
| International | |
| International | |
| International | |
| Worldwide | |
| Worldwide | |
| Worldwide | |
| SIMPONI / SIMPONI ARIA | |
| SIMPONI / SIMPONI ARIA | |
| SIMPONI / SIMPONI ARIA | |
| U.S. | |
| U.S. | |
| U.S. | U.S. | | 650 | | | 629 | | | 3.4 | | | 1,267 | | | 1,173 | | | 8.0 | |
| International | International | | 498 | | | 497 | | | 0.3 | | | 991 | | | 965 | | | 2.7 | |
| International | |
| International | |
| Worldwide | Worldwide | | 1,148 | | | 1,126 | | | 2.0 | | | 2,258 | | | 2,138 | | | 5.6 | |
| Oral Care | |
| Worldwide | |
| Worldwide | |
| STELARA | |
| STELARA | |
| STELARA | |
| U.S. | |
| U.S. | |
| U.S. | U.S. | | 173 | | | 170 | | | 1.7 | | | 332 | | | 313 | | | 6.2 | |
| International | International | | 225 | | | 224 | | | 0.3 | | | 427 | | | 447 | | | (4.7) | |
| International | |
| International | |
| Worldwide | Worldwide | | 398 | | | 394 | | | 0.9 | | | 759 | | | 760 | | | (0.2) | |
| Baby Care | |
| Worldwide | |
| Worldwide | |
| TREMFYA | |
| TREMFYA | |
| TREMFYA | |
| U.S. | |
| U.S. | |
| U.S. | U.S. | | 99 | | | 88 | | | 12.5 | | | 195 | | | 173 | | | 12.7 | |
| International | International | | 261 | | | 287 | | | (9.1) | | | 524 | | | 557 | | | (6.0) | |
| International | |
| International | |
| Worldwide | Worldwide | | 360 | | | 375 | | | (4.0) | | | 719 | | | 730 | | | (1.6) | |
| Women’s Health | |
| Worldwide | |
| Worldwide | |
| OTHER IMMUNOLOGY | |
| OTHER IMMUNOLOGY | |
| OTHER IMMUNOLOGY | |
| U.S. | |
| U.S. | |
| U.S. | U.S. | | 4 | | | 3 | | | (2.1) | | | 7 | | | 7 | | | (0.1) | |
| International | International | | 235 | | | 228 | | | 3.5 | | | 449 | | | 452 | | | (0.7) | |
| International | |
| International | |
| Worldwide | Worldwide | | 238 | | | 230 | | | 3.4 | | | 455 | | | 458 | | | (0.6) | |
| Wound Care/Other | |
| Worldwide | |
| Worldwide | |
| | Infectious Diseases | |
| | Infectious Diseases | |
| | Infectious Diseases | |
| U.S. | |
| U.S. | |
| U.S. | U.S. | | 149 | | | 133 | | | 12.3 | | | 264 | | | 245 | | | 7.9 | |
| International | International | | 58 | | | 65 | | | (10.3) | | | 107 | | | 117 | | | (8.4) | |
| International | |
| International | |
| Worldwide | Worldwide | | 207 | | | 197 | | | 4.9 | | | 371 | | | 361 | | | 2.6 | |
| TOTAL CONSUMER HEALTH | |
| Worldwide | |
| Worldwide | |
| COVID-19 VACCINE | |
| COVID-19 VACCINE | |
| COVID-19 VACCINE | |
| U.S. | |
| U.S. | |
| U.S. | U.S. | | 1,787 | | | 1,687 | | | 6.0 | | | 3,522 | | | 3,244 | | | 8.6 | |
| International | International | | 2,224 | | | 2,118 | | | 5.0 | | | 4,341 | | | 4,147 | | | 4.7 | |
| International | |
| International | |
| Worldwide | Worldwide | | 4,011 | | | 3,805 | | | 5.4 | | | 7,863 | | | 7,391 | | | 6.4 | |
| | | Worldwide | |
| Worldwide | |
| EDURANT / rilpivirine | |
| EDURANT / rilpivirine | |
| EDURANT / rilpivirine | |
| U.S. | |
| U.S. | |
| U.S. | |
| | PHARMACEUTICAL | |
| Immunology | |
| | |
| | |
| | |
| (Dollars in Millions) | |
| (Dollars in Millions) | |
| (Dollars in Millions) | |
| International | |
| International | |
| International | |
| Worldwide | |
| Worldwide | |
| Worldwide | |
| PREZISTA / PREZCOBIX / REZOLSTA / SYMTUZA | |
| PREZISTA / PREZCOBIX / REZOLSTA / SYMTUZA | |
| PREZISTA / PREZCOBIX / REZOLSTA / SYMTUZA | |
| U.S. | |
| U.S. | |
| U.S. | U.S. | | 2,865 | | | 2,853 | | | 0.4 | | | 5,313 | | | 5,354 | | | (0.8) | |
| International | International | | 1,631 | | | 1,559 | | | 4.7 | | | 3,295 | | | 3,176 | | | 3.8 | |
| Worldwide | | 4,496 | | | 4,411 | | | 1.9 | | | 8,608 | | | 8,530 | | | 0.9 | |
REMICADE | |
| U.S. | | 277 | | | 391 | | | (29.3) | | | 553 | | | 749 | | | (26.2) | |
| U.S. Exports | | 33 | | | 44 | | | (24.9) | | | 74 | | | 124 | | | (40.3) | |
| International | |
| International | International | | 152 | | | 212 | | | (28.2) | | | 322 | | | 437 | | | (26.2) | |
| Worldwide | Worldwide | | 462 | | | 647 | | | (28.6) | | | 949 | | | 1,310 | | | (27.5) | |
SIMPONI / SIMPONI ARIA | |
| Worldwide | |
| Worldwide | |
| OTHER INFECTIOUS DISEASES | |
| OTHER INFECTIOUS DISEASES | |
| OTHER INFECTIOUS DISEASES | |
| U.S. | |
| U.S. | |
| U.S. | U.S. | | 285 | | | 301 | | | (5.1) | | | 556 | | | 588 | | | (5.4) | |
| International | International | | 244 | | | 266 | | | (8.2) | | | 510 | | | 549 | | | (7.1) | |
| International | |
| International | |
| Worldwide | Worldwide | | 529 | | | 566 | | | (6.6) | | | 1,066 | | | 1,137 | | | (6.2) | |
STELARA | |
| Worldwide | |
| Worldwide | |
| | Neuroscience | |
| | Neuroscience | |
| | Neuroscience | |
| U.S. | |
| U.S. | |
| U.S. | U.S. | | 1,817 | | | 1,731 | | | 4.9 | | | 3,268 | | | 3,110 | | | 5.1 | |
| International | International | | 981 | | | 868 | | | 13.0 | | | 1,974 | | | 1,777 | | | 11.1 | |
| International | |
| International | |
| Worldwide | Worldwide | | 2,797 | | | 2,599 | | | 7.6 | | | 5,241 | | | 4,887 | | | 7.2 | |
TREMFYA | |
| Worldwide | |
| Worldwide | |
| CONCERTA / methylphenidate | |
| CONCERTA / methylphenidate | |
| CONCERTA / methylphenidate | |
| U.S. | |
| U.S. | |
| U.S. | U.S. | | 450 | | | 382 | | | 17.8 | | | 856 | | | 773 | | | 10.7 | |
| International | International | | 255 | | | 214 | | | 19.4 | | | 489 | | | 413 | | | 18.4 | |
| International | |
| International | |
| Worldwide | Worldwide | | 706 | | | 597 | | | 18.3 | | | 1,346 | | | 1,187 | | | 13.4 | |
OTHER IMMUNOLOGY | |
| Worldwide | |
| Worldwide | |
| INVEGA SUSTENNA / XEPLION / INVEGA TRINZA / TREVICTA | |
| INVEGA SUSTENNA / XEPLION / INVEGA TRINZA / TREVICTA | |
| INVEGA SUSTENNA / XEPLION / INVEGA TRINZA / TREVICTA | |
| U.S. | |
| U.S. | |
| U.S. | U.S. | | 4 | | | 3 | | | 17.8 | | | 7 | | | 9 | | | (30.2) | |
| International | International | | 0 | | 0 | | — | | | 0 | | 0 | | — |
| International | |
| International | |
| Worldwide | |
| Worldwide | |
| Worldwide | |
| SPRAVATO | |
| SPRAVATO | |
| SPRAVATO | |
| U.S. | |
| U.S. | |
| U.S. | |
| International | |
| International | |
| International | |
| Worldwide | |
| Worldwide | |
| Worldwide | |
| OTHER NEUROSCIENCE | |
| OTHER NEUROSCIENCE | |
| OTHER NEUROSCIENCE | |
| U.S. | |
| U.S. | |
| U.S. | |
| International | |
| International | |
| International | |
| Worldwide | |
| Worldwide | |
| Worldwide | Worldwide | | 4 | | | 3 | | | 17.8 | | | 7 | | | 9 | | | (30.2) | |
| | Infectious Diseases | |
| Oncology | |
| | Oncology | |
| | Oncology | |
| U.S. | |
| U.S. | |
| U.S. | U.S. | | 395 | | | 415 | | | (4.9) | | | 787 | | | 876 | | | (10.2) | |
| International | International | | 727 | | | 901 | | | (19.4) | | | 1,920 | | | 1,737 | | | 10.5 | |
| International | |
| International | |
| Worldwide | Worldwide | | 1,121 | | | 1,316 | | | (14.8) | | | 2,707 | | | 2,613 | | | 3.6 | |
COVID-19 VACCINE | |
| Worldwide | |
| Worldwide | |
| CARVYKTI | |
| CARVYKTI | |
| CARVYKTI | |
| U.S. | |
| U.S. | |
| U.S. | U.S. | | — | | | 45 | | | * | | — | | | 120 | | | * |
| International | International | | 285 | | | 499 | | | (43.0) | | | 1,032 | | | 881 | | | 17.1 |
| Worldwide | | 285 | | | 544 | | | (47.7) | | | 1,032 | | | 1,001 | | | 3.0 |
EDURANT / rilpivirine | |
| U.S. | | 8 | | | 9 | | | (9.0) | | | 17 | | | 18 | | | (5.3) | |
| International | |
| International | International | | 258 | | | 215 | | | 19.9 | | | 529 | | | 454 | | | 16.4 | |
| Worldwide | Worldwide | | 266 | | | 225 | | | 18.6 | | | 546 | | | 473 | | | 15.6 | |
PREZISTA / PREZCOBIX / REZOLSTA / SYMTUZA | |
| Worldwide | |
| Worldwide | |
| DARZALEX | |
| DARZALEX | |
| DARZALEX | |
| U.S. | U.S. | | 382 | | | 355 | | | 7.6 | | | 760 | | | 724 | | | 5.0 | |
| International | | 109 | | | 110 | | | (0.2) | | | 208 | | | 242 | | | (13.9) | |
| Worldwide | | 491 | | | 464 | | | 5.8 | | | 968 | | | 965 | | | 0.3 | |
| | | U.S. | |
| U.S. | |
| OTHER INFECTIOUS DISEASES | |
| | |
| | |
| | |
| (Dollars in Millions) | |
| (Dollars in Millions) | |
| (Dollars in Millions) | |
| International | |
| International | |
| International | |
| Worldwide | |
| Worldwide | |
| Worldwide | |
| ERLEADA | |
| ERLEADA | |
| ERLEADA | |
| U.S. | |
| U.S. | |
| U.S. | U.S. | | 5 | | | 6 | | | (27.2) | | | 10 | | | 14 | | | (30.6) | |
| International | International | | 74 | | | 77 | | | (3.5) | | | 151 | | | 160 | | | (5.6) | |
| International | |
| International | |
| Worldwide | |
| Worldwide | |
| Worldwide | |
| IMBRUVICA | |
| IMBRUVICA | |
| IMBRUVICA | |
| U.S. | |
| U.S. | |
| U.S. | |
| International | |
| International | |
| International | |
| Worldwide | |
| Worldwide | |
| Worldwide | |
TECVAYLI(1) | |
TECVAYLI(1) | |
TECVAYLI(1) | |
| U.S. | |
| U.S. | |
| U.S. | |
| International | |
| International | |
| International | |
| Worldwide | |
| Worldwide | |
| Worldwide | |
ZYTIGA / abiraterone acetate | |
ZYTIGA / abiraterone acetate | |
ZYTIGA / abiraterone acetate | |
| U.S. | |
| U.S. | |
| U.S. | |
| International | |
| International | |
| International | |
| Worldwide | |
| Worldwide | |
| Worldwide | |
| OTHER ONCOLOGY | |
| OTHER ONCOLOGY | |
| OTHER ONCOLOGY | |
| U.S. | |
| U.S. | |
| U.S. | |
| International | |
| International | |
| International | |
| Worldwide | |
| Worldwide | |
| Worldwide | Worldwide | | 79 | | | 83 | | | (5.2) | | | 161 | | | 174 | | | (7.6) | |
| | Neuroscience | |
| Pulmonary Hypertension | |
| | Pulmonary Hypertension | |
| | Pulmonary Hypertension | |
| U.S. | |
| U.S. | |
| U.S. | U.S. | | 1,029 | | | 896 | | | 14.9 | | | 2,007 | | | 1,739 | | | 15.4 | |
| International | International | | 764 | | | 837 | | | (8.8) | | | 1,590 | | | 1,735 | | | (8.4) | |
| International | |
| International | |
| Worldwide | Worldwide | | 1,793 | | | 1,734 | | | 3.5 | | | 3,597 | | | 3,475 | | | 3.5 | |
CONCERTA / methylphenidate | |
| Worldwide | |
| Worldwide | |
| OPSUMIT | |
| OPSUMIT | |
| OPSUMIT | |
| U.S. | |
| U.S. | |
| U.S. | U.S. | | 64 | | | 38 | | | 68.2 | | | 134 | | | 73 | | | 84.0 | |
| International | International | | 143 | | | 123 | | | 16.3 | | | 279 | | | 245 | | | 13.9 | |
| International | |
| International | |
| Worldwide | Worldwide | | 208 | | | 161 | | | 28.6 | | | 414 | | | 318 | | | 30.0 | |
INVEGA SUSTENNA / XEPLION / INVEGA TRINZA / TREVICTA | |
| Worldwide | |
| Worldwide | |
| UPTRAVI | |
| UPTRAVI | |
| UPTRAVI | |
| U.S. | |
| U.S. | |
| U.S. | U.S. | | 721 | | | 691 | | | 4.3 | | | 1,434 | | | 1,352 | | | 6.0 | |
| International | International | | 310 | | | 362 | | | (14.4) | | | 641 | | | 749 | | | (14.5) | |
| International | |
| International | |
| Worldwide | Worldwide | | 1,031 | | | 1,054 | | | (2.1) | | | 2,075 | | | 2,102 | | | (1.3) | |
SPRAVATO | |
| Worldwide | |
| Worldwide | |
| OTHER PULMONARY HYPERTENSION | |
| OTHER PULMONARY HYPERTENSION | |
| OTHER PULMONARY HYPERTENSION | |
| U.S. | |
| U.S. | |
| U.S. | U.S. | | 144 | | | 74 | | | 93.2 | | | 255 | | | 135 | | | 88.3 | |
| International | International | | 25 | | | 11 | | | * | | 45 | | | 20 | | | * |
| International | |
| International | |
| Worldwide | Worldwide | | 169 | | | 85 | | | 98.2 | | | 300 | | | 155 | | | 93.1 | |
OTHER NEUROSCIENCE(1) | |
| Worldwide | |
| Worldwide | |
| | Cardiovascular / Metabolism / Other | |
| | Cardiovascular / Metabolism / Other | |
| | Cardiovascular / Metabolism / Other | |
| U.S. | |
| U.S. | |
| U.S. | U.S. | | 100 | | | 93 | | | 9.3 | | | 184 | | | 179 | | | 3.1 | |
| International | International | | 286 | | | 341 | | | (16.4) | | | 625 | | | 721 | | | (13.4) | |
| Worldwide | | 386 | | | 433 | | | (10.9) | | | 809 | | | 900 | | | (10.1) | |
| | Oncology | |
| U.S. | | 2,069 | | | 1,679 | | | 23.2 | | | 3,958 | | | 3,261 | | | 21.4 | |
| International | |
| International | International | | 2,329 | | | 2,362 | | | (1.4) | | | 4,552 | | | 4,731 | | | (3.8) | |
| Worldwide | Worldwide | | 4,398 | | | 4,042 | | | 8.8 | | | 8,510 | | | 7,992 | | | 6.5 | |
CARVYKTI | |
| U.S. | | 114 | | | 24 | | | * | | 184 | | | 24 | | | * |
| International | | 3 | | | — | | | * | | 5 | | | — | | | * |
| Worldwide | Worldwide | | 117 | | | 24 | | | * | | 189 | | | 24 | | | * |
DARZALEX | |
| U.S. | | 1,322 | | | 1,021 | | | 29.5 | | | 2,513 | | | 1,974 | | | 27.3 | |
| International | | 1,110 | | | 965 | | | 15.0 | | | 2,182 | | | 1,868 | | | 16.8 | |
| Worldwide | Worldwide | | 2,431 | | | 1,986 | | | 22.4 | | | 4,695 | | | 3,842 | | | 22.2 | |
ERLEADA | |
| U.S. | | 241 | | | 233 | | | 3.6 | | | 490 | | 439 | | 11.8 | |
| International | | 326 | | | 218 | | | 49.7 | | | 619 | | 412 | | 50.3 | |
| Worldwide | | 567 | | | 450 | | | 25.9 | | | 1,109 | | | 850 | | 30.4 | |
IMBRUVICA | |
| U.S. | | 262 | | | 349 | | | (24.9) | | | 532 | | | 719 | | | (26.0) | |
| International | | 579 | | | 620 | | | (6.7) | | | 1,136 | | | 1,288 | | | (11.8) | |
| Worldwide | | 841 | | | 970 | | | (13.2) | | | 1,668 | | | 2,008 | | | (16.9) | |
ZYTIGA / abiraterone acetate | |
| | | |
| | |
| | |
| (Dollars in Millions) | |
| (Dollars in Millions) | |
| (Dollars in Millions) | |
| XARELTO | |
| XARELTO | |
| XARELTO | |
| U.S. | |
| U.S. | |
| U.S. | U.S. | | 9 | | | 19 | | | (55.2) | | | 25 | | | 38 | | | (34.7) | |
| International | International | | 218 | | | 486 | | | (55.1) | | | 447 | | | 1,006 | | | (55.6) | |
| Worldwide | | 227 | | | 505 | | | (55.1) | | | 472 | | | 1,044 | | | (54.8) | |
OTHER ONCOLOGY | |
| U.S. | | 122 | | | 33 | | | * | | 214 | | | 67 | | | * |
| International | |
| International | International | | 92 | | | 72 | | | 27.8 | | | 162 | | | 156 | | | 3.6 | |
| Worldwide | Worldwide | | 214 | | | 106 | | | * | | 376 | | | 224 | | | 68.0 | |
| | Pulmonary Hypertension | |
| U.S. | | 684 | | | 560 | | | 22.0 | | | 1,284 | | | 1,132 | | | 13.4 | |
| International | | 289 | | | 284 | | | 2.0 | | | 561 | | | 563 | | | (0.4) | |
| Worldwide | Worldwide | | 972 | | | 843 | | | 15.3 | | | 1,844 | | | 1,695 | | | 8.8 | |
OPSUMIT | |
| U.S. | | 328 | | | 265 | | | 23.7 | | | 601 | | | 538 | | | 11.6 | |
| International | | 179 | | | 173 | | | 3.4 | | | 346 | | | 343 | | | 0.9 | |
| Worldwide | | 507 | | | 438 | | | 15.7 | | | 947 | | | 881 | | | 7.5 | |
UPTRAVI | |
| U.S. | | 338 | | | 272 | | | 24.2 | | | 642 | | | 541 | | | 18.7 | |
| International | | 61 | | | 56 | | | 10.0 | | | 119 | | | 112 | | | 6.6 | |
| Worldwide | | 399 | | | 328 | | | 21.8 | | | 761 | | | 653 | | | 16.6 | |
OTHER PULMONARY HYPERTENSION | |
| U.S. | | 18 | | | 23 | | | (23.8) | | | 41 | | | 53 | | | (23.0) | |
| International | | 48 | | | 55 | | | (10.9) | | | 95 | | | 108 | | | (11.7) | |
| Worldwide | | 66 | | | 78 | | | (14.7) | | | 136 | | | 161 | | | (15.5) | |
| | Cardiovascular / Metabolism / Other | |
| U.S. | | 776 | | | 757 | | | 2.6 | | | 1,491 | | | 1,429 | | | 4.3 | |
| International | | 174 | | | 215 | | | (19.0) | | | 386 | | | 453 | | | (14.7) | |
| Worldwide | | 950 | | | 972 | | | (2.2) | | | 1,877 | | | 1,882 | | | (0.3) | |
XARELTO | |
| U.S. | | 637 | | | 609 | | | 4.7 | | | 1,215 | | | 1,117 | | | 8.8 | |
| International | | — | | | — | | | — | | | — | | | — | | | — | |
| Worldwide | Worldwide | | 637 | | | 609 | | | 4.7 | | | 1,215 | | | 1,117 | | | 8.8 | |
| OTHER(2) | |
| OTHER | |
| | OTHER | |
| | OTHER | |
| U.S. | |
| U.S. | |
| U.S. | U.S. | | 138 | | | 148 | | | (6.3) | | | 275 | | | 312 | | | (11.8) | |
| International | International | | 174 | | | 215 | | | (19.0) | | | 386 | | | 453 | | | (14.7) | |
| International | |
| International | |
| Worldwide | |
| Worldwide | |
| Worldwide | Worldwide | | 313 | | | 363 | | | (13.8) | | | 662 | | | 765 | | | (13.5) | |
| | TOTAL PHARMACEUTICAL | | | | | |
| TOTAL INNOVATIVE MEDICINE | |
| | TOTAL INNOVATIVE MEDICINE | |
| | TOTAL INNOVATIVE MEDICINE | |
| U.S. | |
| U.S. | |
| U.S. | U.S. | | 7,818 | | | 7,159 | | | 9.2 | | | 14,841 | | | 13,791 | | | 7.6 | |
| International | International | | 5,913 | | | 6,158 | | | (4.0) | | | 12,303 | | | 12,395 | | | (0.7) | |
| International | |
| International | |
| Worldwide | |
| Worldwide | |
| Worldwide | Worldwide | | 13,731 | | | 13,317 | | | 3.1 | | | 27,144 | | | 26,186 | | | 3.7 | |
| | MEDTECH | |
| | MEDTECH | |
| | MEDTECH | |
| Cardiovascular(2) | |
| Cardiovascular(2) | |
| Cardiovascular(2) | |
| U.S. | |
| U.S. | |
| U.S. | |
| International | |
| International | |
| International | |
| Worldwide | |
| Worldwide | |
| Worldwide | |
| ELECTROPHYSIOLOGY | |
| ELECTROPHYSIOLOGY | |
| ELECTROPHYSIOLOGY | |
| U.S. | |
| U.S. | |
| U.S. | |
| International | |
| International | |
| International | |
| Worldwide | |
| Worldwide | |
| Worldwide | |
| ABIOMED | |
| ABIOMED | |
| ABIOMED | |
| U.S. | |
| U.S. | |
| U.S. | |
| International | |
| International | |
| International | |
| Worldwide | |
| Worldwide | |
| Worldwide | |
OTHER CARDIOVASCULAR(2) | |
OTHER CARDIOVASCULAR(2) | |
OTHER CARDIOVASCULAR(2) | |
| U.S. | |
| U.S. | |
| U.S. | |
| International | |
| International | |
| International | |
| Worldwide | |
| Worldwide | |
| Worldwide | |
| Orthopaedics | |
| Orthopaedics | |
| Orthopaedics | |
| U.S. | |
| U.S. | |
| U.S. | |
| International | |
| International | |
| International | |
| Worldwide | |
| Worldwide | |
| Worldwide | |
| HIPS | |
| HIPS | |
| HIPS | |
| U.S. | |
| U.S. | |
| U.S. | |
| International | |
| International | |
| International | |
| Worldwide | |
| Worldwide | |
| Worldwide | |
| KNEES | |
| KNEES | |
| KNEES | |
| U.S. | |
| U.S. | |
| U.S. | |
| International | |
| International | |
| International | |
| Worldwide | |
| Worldwide | |
| Worldwide | |
| | | | | | | | | | | | | | | | | | | | | | | | | | | | | | | | | | | | | | |
| MEDTECH | | | | | | | | | | | | |
| | | | | | | | | | | | |
| | | | | | | | | | | | |
| | | | | | | | | | | | |
| | | | | | | | | | | | |
| | | | | | | | | | | | |
| | | | | | | | | | | | |
| | | | | | | | | | | | |
| | | | | | | | | | | | |
| Interventional Solutions | | | | | | | | | | | | |
| U.S. | | 908 | | | 525 | | | 73.1 | | | 1,771 | | | 1,019 | | | 73.8 | |
| International | | 712 | | | 525 | | | 35.7 | | | 1,352 | | | 1,123 | | | 20.5 | |
| Worldwide | | 1,620 | | | 1,049 | | | 54.4 | | | 3,123 | | | 2,141 | | | 45.8 | |
ELECTROPHYSIOLOGY | | | | | | | | | | | | |
| U.S. | | 609 | | | 499 | | | 22.0 | | | 1,180 | | | 969 | | | 21.7 | |
| International | | 587 | | | 469 | | | 25.1 | | | 1,109 | | | 1,001 | | | 10.8 | |
| Worldwide | | 1,196 | | | 968 | | | 23.5 | | | 2,288 | | | 1,970 | | | 16.2 | |
ABIOMED(3) | | | | | | | | | | | | |
| U.S. | | 272 | | | — | | | * | | 536 | | | — | | | * |
| International | | 59 | | | — | | | * | | 119 | | | — | | | * |
| Worldwide | | 331 | | | — | | | * | | 655 | | | — | | | * |
OTHER INTERVENTIONAL SOLUTIONS | | | | | | | | | | | | |
| U.S. | | 27 | | | 26 | | | 4.5 | | | 55 | | | 51 | | | 10.8 | |
| International | | 67 | | | 56 | | | 20.0 | | | 125 | | | 121 | | | 2.8 | |
| Worldwide | | 93 | | | 81 | | | 15.1 | | | 180 | | | 171 | | | 5.1 | |
| Orthopaedics | | | | | | | | | | | | |
| U.S. | | 1,388 | | | 1,338 | | | 3.7 | | | 2,751 | | | 2,627 | | | 4.7 | |
| International | | 878 | | | 820 | | | 7.0 | | | 1,759 | | | 1,719 | | | 2.3 | |
| Worldwide | | 2,265 | | | 2,157 | | | 5.0 | | | 4,510 | | | 4,345 | | | 3.8 | |
HIPS | | | | | | | | | | | | |
| U.S. | | 250 | | | 240 | | | 4.1 | | | 491 | | | 465 | | | 5.6 | |
| International | | 147 | | | 148 | | | (0.8) | | | 296 | | | 312 | | | (5.1) | |
| Worldwide | | 397 | | | 388 | | | 2.2 | | | 787 | | | 777 | | | 1.3 | |
KNEES | | | | | | | | | | | | |
| U.S. | | 221 | | | 216 | | | 2.4 | | | 447 | | | 417 | | | 7.2 | |
| International | | 142 | | | 133 | | | 6.3 | | | 284 | | | 271 | | | 4.8 | |
| Worldwide | | 363 | | | 349 | | | 3.9 | | | 731 | | | 688 | | | 6.3 | |
TRAUMA | | | | | | | | | | | | |
| U.S. | | 483 | | | 464 | | | 4.3 | | | 974 | | | 939 | | | 3.7 | |
| International | | 255 | | | 232 | | | 9.9 | | | 522 | | | 505 | | | 3.2 | |
| Worldwide | | 739 | | | 696 | | | 6.1 | | | 1,496 | | | 1,444 | | | 3.6 | |
SPINE, SPORTS & OTHER | | | | | | | | | | | | |
| U.S. | | 433 | | | 418 | | | 3.5 | | | 839 | | | 805 | | | 4.1 | |
| International | | 334 | | | 306 | | | 9.0 | | | 657 | | | 630 | | | 4.2 | |
| Worldwide | | 766 | | | 724 | | | 5.8 | | | 1,495 | | | 1,436 | | | 4.2 | |
| Surgery | | | | | | | | | | | | |
| U.S. | | 1,015 | | | 992 | | | 2.2 | | | 1,990 | | | 1,913 | | | 4.0 | |
| International | | 1,580 | | | 1,458 | | | 8.4 | | | 3,039 | | | 2,971 | | | 2.3 | |
| Worldwide | | 2,594 | | | 2,450 | | | 5.9 | | | 5,028 | | | 4,884 | | | 3.0 | |
ADVANCED | | | | | | | | | | | | |
| U.S. | | 466 | | | 454 | | | 2.7 | | | 910 | | | 871 | | | 4.5 | |
| International | | 757 | | | 702 | | | 7.8 | | | 1,430 | | | 1,431 | | | 0.0 |
| Worldwide | | 1,222 | | | 1,156 | | | 5.8 | | | 2,340 | | | 2,302 | | | 1.7 | |
GENERAL | | | | | | | | | | | | |
| U.S. | | 548 | | | 538 | | | 1.9 | | | 1,079 | | | 1,042 | | | 3.6 | |
| | | |
| | |
| | |
| (Dollars in Millions) | |
| (Dollars in Millions) | |
| (Dollars in Millions) | |
| TRAUMA | |
| TRAUMA | |
| TRAUMA | |
| U.S. | |
| U.S. | |
| U.S. | |
| International | |
| International | |
| International | International | | 823 | | | 756 | | | 8.9 | | | 1,608 | | | 1,540 | | | 4.5 | |
| Worldwide | Worldwide | | 1,372 | | | 1,294 | | | 6.0 | | | 2,688 | | | 2,582 | | | 4.1 | |
| Worldwide | |
| Worldwide | |
| SPINE, SPORTS & OTHER | |
| SPINE, SPORTS & OTHER | |
| SPINE, SPORTS & OTHER | |
| U.S. | |
| U.S. | |
| U.S. | |
| International | |
| International | |
| International | |
| Worldwide | |
| Worldwide | |
| Worldwide | |
| Surgery | |
| Surgery | |
| Surgery | |
| U.S. | |
| U.S. | |
| U.S. | |
| International | |
| International | |
| International | |
| Worldwide | |
| Worldwide | |
| Worldwide | |
| ADVANCED | |
| ADVANCED | |
| ADVANCED | |
| U.S. | |
| U.S. | |
| U.S. | |
| International | |
| International | |
| International | |
| Worldwide | |
| Worldwide | |
| Worldwide | |
| GENERAL | |
| GENERAL | |
| GENERAL | |
| U.S. | |
| U.S. | |
| U.S. | |
| International | |
| International | |
| International | |
| Worldwide | |
| Worldwide | |
| Worldwide | |
| Vision | |
| Vision | |
| Vision | Vision | |
| U.S. | U.S. | | 529 | | | 496 | | | 6.6 | | | 1,087 | | | 1,017 | | | 6.9 | |
| U.S. | |
| U.S. | |
| International | |
| International | |
| International | International | | 778 | | | 745 | | | 4.6 | | | 1,521 | | | 1,481 | | | 2.7 | |
| Worldwide | Worldwide | | 1,308 | | | 1,241 | | | 5.4 | | | 2,608 | | | 2,498 | | | 4.4 | |
| Worldwide | |
| Worldwide | |
| CONTACT LENSES / OTHER | |
| CONTACT LENSES / OTHER | |
CONTACT LENSES / OTHER | CONTACT LENSES / OTHER | |
| U.S. | U.S. | | 409 | | | 374 | | | 9.1 | | | 853 | | | 774 | | | 10.1 | |
| U.S. | |
| U.S. | |
| International | |
| International | |
| International | International | | 530 | | | 519 | | | 2.2 | | | 1,039 | | | 1,030 | | | 0.9 | |
| Worldwide | Worldwide | | 939 | | | 894 | | | 5.1 | | | 1,892 | | | 1,804 | | | 4.9 | |
| Worldwide | |
| Worldwide | |
| SURGICAL | |
| SURGICAL | |
SURGICAL | SURGICAL | |
| U.S. | U.S. | | 120 | | | 122 | | | (1.1) | | | 234 | | | 243 | | | (3.6) | |
| U.S. | |
| U.S. | |
| International | International | | 249 | | | 225 | | | 10.1 | | | 482 | | | 451 | | | 6.7 | |
| International | |
| International | |
| Worldwide | |
| Worldwide | |
| Worldwide | Worldwide | | 369 | | | 347 | | | 6.2 | | | 716 | | | 694 | | | 3.1 | |
| | TOTAL MEDTECH | TOTAL MEDTECH | | | | | | | | | |
| | TOTAL MEDTECH | |
| | TOTAL MEDTECH | |
| U.S. | |
| U.S. | |
| U.S. | U.S. | | 3,839 | | | 3,351 | | | 14.6 | | | 7,598 | | | 6,576 | | | 15.5 | |
| International | International | | 3,949 | | | 3,547 | | | 11.3 | | | 7,671 | | | 7,293 | | | 5.2 | |
| International | |
| International | |
| Worldwide | |
| Worldwide | |
| Worldwide | Worldwide | | 7,788 | | | 6,898 | | | 12.9 | | | 15,269 | | | 13,869 | | | 10.1 | |
| | WORLDWIDE | WORLDWIDE | | | | | | | | | | | | |
| | WORLDWIDE | |
| | WORLDWIDE | |
| U.S. | |
| U.S. | |
| U.S. | U.S. | | 13,444 | | | 12,197 | | | 10.2 | | | 25,961 | | | 23,611 | | | 10.0 | |
| International | International | | 12,086 | | | 11,823 | | | 2.2 | | | 24,315 | | | 23,835 | | | 2.0 | |
| International | |
| International | |
| Worldwide | Worldwide | | $ | 25,530 | | | 24,020 | | | 6.3 | % | | $ | 50,276 | | | 47,446 | | | 6.0 | % |
| Worldwide | |
| Worldwide | |
*Percentage greater than 100% or not meaningful
(1) Inclusive of RISPERDAL CONSTA which was previously disclosed separately
(2)Inclusive of INVOKANAwhich was previously disclosed separately
(3)Acquired on December 22, 2022
EARNINGS BEFORE PROVISION FOR TAXES BY SEGMENT
| | | | | | | | | | | | | | | | | | | | | | | | | | | | | | | | | | | | | | | | | | | |
| | | Fiscal Second Quarter Ended | | Fiscal Six Months Ended | |
| (Dollars in Millions) | | July 2,
2023 | | July 3,
2022 | | Percent
Change | | July 2,
2023 | | July 3,
2022 | | Percent
Change | | | | | |
Consumer Health(1) | | $ | 860 | | | 784 | | | 9.7 | % | | $ | 1,636 | | | 1,470 | | | 11.3% | | | | | |
Pharmaceutical(2) | | 4,862 | | | 4,420 | | | 10.0 | | | 9,306 | | | 8,344 | | | 11.5 | | | | | | |
MedTech(3) | | 1,699 | | | 1,141 | | | 48.9 | | 3,144 | | | 2,618 | | | 20.1 | | | | | | |
| Segment earnings before provision for taxes | | 7,421 | | | 6,345 | | | 17.0 | | | 14,086 | | | 12,432 | | | 13.3 | | | | | | |
Less: Expense not allocated to segments (4) | | 377 | | | 237 | | | | | 7,479 | | | 360 | | | | | | | | |
| Less: Consumer Health separation costs | | 282 | | | 268 | | | | | 582 | | | 370 | | | | | | | | |
| Worldwide income before tax | | $ | 6,762 | | | 5,840 | | | 15.8% | | $ | 6,025 | | | 11,702 | | | (48.5) | % | | | | | |
*Percentage greater than 100% or not meaningful
(1) Consumer Health includes:Previously included in Other Oncology (2) Previously referred to as Interventional Solutions
Intangible amortization expense of $0.2 billion in both the fiscal six months of 2023 and 2022.Earnings before provision for taxes by segment
| | | | | | | | | | | | | | | | | | | | | | | | | | | | | | | |
| | | Fiscal First Quarter Ended | | | |
| (Dollars in Millions) | | March 31,
2024 | | April 2,
2023 | | Percent
Change | | | | | | | | | | | |
| | | | | | | | | | | | | | | | | |
Innovative Medicine(1) | | $4,969 | | 4,402 | | 12.9 | % | | | | | | | | | | | |
MedTech(2) | | 1,520 | | 1,409 | | 7.9 | | | | | | | | | | | | |
| Segment earnings before provision for taxes | | 6,489 | | 5,811 | | 11.7 | | | | | | | | | | | | |
Less: Expense not allocated to segments (3) | | 2,775 | | 7,098 | | | | | | | | | | | | | |
| Worldwide income (loss) before tax | | $3,714 | | (1,287) | | | | | | | | | | | | | |
(2)(1) PharmaceuticalInnovative Medicine includes:
•Intangible amortization expense of $0.7 billion in both the fiscal secondfirst quarter of 20232024 and 2022.2023.
Intangible amortization expense of $1.5 billion in both the fiscal six months of 2023 and 2022.
•One-time COVID-19 Vaccine related exit costs of $0.2 billion and $0.3$0.4 billion in the fiscal secondfirst quarter of 2023 and 2022, respectively. One-time COVID-19 Vaccine related exit costs of $0.6 billion and $0.3 billion in the fiscal six months of 2023 and 2022, respectively.
•A restructuring related charge of $0.1 billion and $0.3 billion in the fiscal second quarter and fiscal six months of 2023, respectively.
•In the fiscal six months of 2022, the Company recorded an intangible asset impairment charge of approximately $0.6 billion related to an in-process research and development asset, bermekimab (JnJ-77474462), an investigational drug for the treatment of Atopic Dermatitis (AD) and Hidradenitis Suppurativa (HS).
•Unfavorable changes in the fair value of securities of $0.1 billion in the fiscal second quarter of 2022. Unfavorable changes in the fair value of securities of $0.1 billion and $0.5 billion in the fiscal six months of 2023 and 2022, respectively.
•Favorable litigation related items of $0.1 billion in both the fiscal second quarter and fiscal six months of 2023.
(3) MedTech includes:
•Intangible amortization expense of $0.4 billion and $0.3 billion in the fiscal second quarter of 2023 and 2022, respectively. Intangible amortization expense of $0.8 billion and $0.5 billion in the fiscal six months of 2023 and 2022, respectively.
•Net favorable litigation matters of $0.2 billion in both the fiscal second quarter and fiscal six months of 2023 and $0.3 billion of expense in both the fiscal second quarter and fiscal six months of 2022.
•Acquisition and integration related expense of $0.1 billion in the fiscal six months of 2023.
•A restructuring related charge of $0.1 billion in both the fiscal secondfirst quarter of 20222024 and $0.22023.
(2) MedTech includes:
•Intangible amortization expense of $0.4 billion in both the fiscal six monthsfirst quarter of 2022.2024 and 2023.
(4)) Amounts not allocated to segments include interest income/(income)/expense and general corporate income/(income)/expense. The fiscal six monthsfirst quarters of 2024 and 2023 includes an approximately $7include charges for talc matters of $2.7 billion incremental charge primarily related to the talc settlement proposal. Seeand $6.9 billion, respectively (See Note 11, Legal Proceedings, for additional details.details).
Sales by geographic area
| | | | | | | | | | | | | | | | | | | | | | | | | | |
| | | Fiscal First Quarter Ended | | |
| (Dollars in Millions) | | March 31, 2024 | | April 2, 2023 | | Percent
Change | | | | | | |
| United States | | $11,620 | | 10,782 | | 7.8 | % | | | | | | |
| Europe | | 5,163 | | 5,590 | | (7.6) | | | | | | | |
| Western Hemisphere, excluding U.S. | | 1,194 | | 1,076 | | 11.0 | | | | | | | |
| Asia-Pacific, Africa | | 3,406 | | 3,446 | | (1.1) | | | | | | | |
| Total | | $21,383 | | 20,894 | | 2.3 | % | | | | | | |
Note 10 — Acquisitions and divestitures
SALES BY GEOGRAPHIC AREA
| | | | | | | | | | | | | | | | | | | | | | | | | | | | | | | | | | | | | | |
| | | Fiscal Second Quarter Ended | | Fiscal Six Months Ended |
| (Dollars in Millions) | | July 2, 2023 | | July 3, 2022 | | Percent
Change | | July 2, 2023 | | July 3, 2022 | | Percent Change |
| United States | | $ | 13,444 | | | 12,197 | | | 10.2 | % | | $ | 25,961 | | | 23,611 | | | 10.0 | % |
| Europe | | 5,894 | | | 6,085 | | | (3.1) | | | 12,226 | | | 12,109 | | | 1.0 | |
| Western Hemisphere, excluding U.S. | | 1,713 | | | 1,536 | | | 11.5 | | | 3,300 | | | 3,018 | | | 9.3 | |
| Asia-Pacific, Africa | | 4,479 | | | 4,202 | | | 6.6 | | | 8,789 | | | 8,708 | | | 0.9 | |
| Total | | $ | 25,530 | | | 24,020 | | | 6.3 | % | | $ | 50,276 | | | 47,446 | | | 6.0 | % |
NOTE 10— ACQUISITIONS AND DIVESTITURES
There were no material acquisitions or divestitures inSubsequent to the fiscal first quarter or fiscal second quarter of 2023.2024, the Company announced that it has entered into a definitive agreement to acquire all outstanding shares of Shockwave Medical, Inc. (Shockwave) (Nasdaq: SWAV), a leading, first-to-market provider of innovative intravascular lithotripsy (IVL) technology for the treatment of calcified coronary artery disease (CAD) and peripheral artery disease (PAD), for $335.00 per share in cash, corresponding to an enterprise value of approximately $13.1 billion including cash acquired. The results of operations will be included in the MedTech segment as of the acquisition date. The closing of the transaction is expected to occur by mid–year 2024.
On December 22, 2022,March 7, 2024, the Company completed the acquisition of Abiomed,Ambrx Biopharma, Inc., (Ambrx), a leading, first-to-market provider of cardiovascular medical technologyclinical-stage biopharmaceutical company with a first-in-kind portfolioproprietary synthetic biology technology platform to design and develop next-generation antibody drug conjugates (ADCs), in an all-cash merger transaction for a total equity value of approximately $2.0 billion, or $1.8 billion net of cash acquired. The Company acquired all of the treatmentoutstanding shares of coronary artery disease and heart failure which also has an extensive innovation pipelineAmbrx’s common stock for $28.00 per share through a merger of life-saving technologies. The transaction broadensAmbrx with a subsidiary of the Company’s position as a growing cardiovascular innovator, advancing the standard of care in heart failure and recovery, one of healthcare’s largest areas of unmet need.Company. The transaction was accounted for as a business combination and the results of operations were included in the MedTechInnovative Medicine segment as of the date of the acquisition. The acquisition was completed through a tender offer for all outstanding shares. The consideration paid in the acquisition consisted of an upfront payment of $380.00 per share in cash, amounting to $17.1 billion, net of cash acquired, as well as a non-tradeable contingent value right (CVR) entitling the holder to receive up to $35.00 per share in cash (which with respect to the CVRs total approximately $1.6 billion in the aggregate) if certain commercial and clinical milestones are achieved. The corresponding enterprise value (without taking into account the CVRs) of approximately $16.5 billion includes cash, cash equivalents and marketable securities acquired.
The milestones of the CVR consist of:
a.$17.50 per share, payable if net sales for Abiomed products exceeds $3.7 billion during Johnson & Johnson’s fiscal second quarter of 2027 through fiscal first quarter of 2028, or if this threshold is not met during this period and is
subsequently met during any rolling four quarter period up to the end of Johnson & Johnson’s fiscal first quarter of 2029, $8.75per share;
b.$7.50 per share payable upon FDA premarket application approval of the use of Impella products in ST-elevated myocardial infarction (STEMI) patients without cardiogenic shock by January 1, 2028; and
c.$10.00 per share payable upon the first publication of a Class I recommendation for the use of Impella products in high risk PCI or STEMI with or without cardiogenic shock within four years from their respective clinical endpoint publication dates, but in all cases no later than December 31, 2029.
date. The fair value of the acquisition was initially allocated to assets acquired of $19.9$2.3 billion, (netprimarily non-amortizable intangible assets, inclusive of $0.3purchased IPR&D, for $1.9 billion, cash acquired), primarily to goodwill for $10.9 billion, amortizable intangible assets for $6.6 billion, IPR&D for $1.1 billion, marketable securities of $0.6$0.3 billion and liabilities assumed of $2.8$0.5 billion, which includes deferred taxes of $0.4 billion. The preliminary purchase price allocation is subject to any subsequent valuation adjustments within the measurement period. A probability of success factor ranging from 40% to 70% was used in the fair value calculation to reflect inherent regulatory and commercial risk of the contingent consideration mentioned above for $0.7 billion and deferred taxes of $1.8 billion.IPR&D. The discount rate applied was approximately 17%. The goodwill is primarily attributable to synergies expected to arise from the commercial acceleration and expansion of the portfoliobusiness acquisition and is not expected to be deductible for tax purposes. The contingent consideration was recorded in Other Liabilities onAcquisition related costs before tax for the Consolidated Balance Sheet.fiscal first quarter of 2024 were not material.
As the acquisition occurred in December 2022, the Company is still finalizing the allocation of the purchase price to the individual assets acquired and liabilities assumed. The allocation of the purchase price included in the current period balance sheet is based on the best estimate of management and is preliminary and subject to change. To assist management in the allocation, the Company engaged valuation specialists to prepare appraisals. The Company will finalize the amounts recognized as the information necessary to complete the analysis is obtained. The Company expects to finalize these amounts as soon as possible but no later than one year from the acquisition date. Divestitures
In the fiscal first quarter of 2023, there were purchase price allocation adjustments netting to approximately $0.1 billion with an offsetting increase to goodwill. In the fiscal second quarter of 2023, there were no purchase price allocation adjustments.
The amortizable intangible assets were primarily comprised of already in-market products of the Impella platform with an average weighted life of 14 years. The IPR&D assets were valued for technology programs for unapproved products. The value of the IPR&D was calculated using probability-adjusted cash flow projections discounted for the risk inherent in such projects. The probability of success factor ranged from 52% to 70%. The discount rate applied was 9.5%.
In 2022,2024, the Company recorded acquisition related costs before taxcompleted the divestiture of Ponvory resulting in approximately $0.3$0.2 billion which was recorded in Other (income)/expense. In the fiscal six months of 2023, the Company recorded acquisition related costs before tax of approximately $0.1 billion, which was primarily recorded in Other (income)/expense.
There were no material acquisitions or divestitures in the fiscal first quarter or fiscal second quarter of 2022.
NOTENote 11 — LEGAL PROCEEDINGS
Johnson & Johnson and certain of its subsidiaries are involved in various lawsuits and claims regarding product liability; intellectual property; commercial; indemnification and other matters; governmental investigations; and other legal proceedings that arise from time to time in the ordinary course of their business.
The Company records accruals for loss contingencies associated with these legal matters when it is probable that a liability will be incurred, and the amount of the loss can be reasonably estimated. As of July 2, 2023,March 31, 2024, the Company has determined that the liabilities associated with certain litigation matters are probable and can be reasonably estimated. The Company has accrued for these matters and will continue to monitor each related legal issue and adjust accruals as might be warranted based on new information and further developments in accordance with ASC 450-20-25. For these and other litigation and regulatory matters discussed below for which a loss is probable or reasonably possible, the Company is unable to estimate the possible loss or range of loss beyond the amounts accrued. Amounts accrued for legal contingencies often result from a complex series of judgments about future events and uncertainties that rely heavily on estimates and assumptions including timing of related payments. The ability to make such estimates and judgments can be affected by various factors including, among other things, whether damages sought in the proceedings are unsubstantiated or indeterminate; scientific and legal discovery has not commenced or is not complete; proceedings are in early stages; matters present legal uncertainties; there are significant facts in dispute; procedural or jurisdictional issues; the uncertainty and unpredictability of the number of potential claims; ability to achieve comprehensive multi-party settlements; complexity of related cross-claims and counterclaims; and/or there are numerous parties involved. To the extent adverse awards, judgments or verdicts have been rendered against the Company, the Company does not record an accrual until a loss is determined to be probable and can be reasonably estimated.
In the Company’s opinion, based on its examination of these matters, its experience to date and discussions with counsel, the ultimate outcome of legal proceedings, net of liabilities accrued in the Company’s balance sheet, is not expected to have a material adverse effect on the Company’s financial position. However, the resolution of, or increase in accruals for, one or more of these matters in any reporting period may have a material adverse effect on the Company’s results of operations and cash flows for that period.
MATTERS CONCERNING TALC
A significant number of personal injury claims alleging that talc causes cancer were madehave been asserted against Johnson & Johnson Consumer Inc., its successor LTL Management LLC (now known as LLT Management LLC) and the Company arising out of the use of body powders containing talc, primarily JOHNSON’S Baby Powder. The number
In talc cases that previously have gone to trial, the Company has obtained a number of defense verdicts, but there also have been verdicts against the Company, many of which have been reversed on appeal. In June 2020, the Missouri Court of Appeals reversed in part and affirmed in part a July 2018 verdict of $4.7 billion in Ingham v. Johnson & Johnson, et al., No. ED 207476 (Mo. App.), reducing the overall award to $2.1 billion. An application for transfer of the case to the Missouri Supreme Court was subsequently denied and in June 2021, a petition for certiorari, seeking a review of the Ingham decision by the United States Supreme Court, was denied. In June 2021, the Company paid the award, which, including interest, totaled approximately $2.5 billion. The facts and circumstances, including the terms of the award, were unique to the Ingham decision and not representative of other claims brought against the Company. The Company continues to believe that it has strong legal grounds to contest the other talc verdicts that it has appealed. Notwithstanding the Company’s confidence in the safety of its talc products, in certain circumstances the Company has settled cases.
In October 2021, Johnson & Johnson Consumer Inc. (Old JJCI) implemented a corporate restructuring (the 2021 Corporate Restructuring). As a result of that restructuring, Old JJCI ceased to exist and three new entities were created: (a) LTL Management LLC, a North Carolina limited liability company (LTL or Debtor); (b) Royalty A&M LLC, a North Carolina limited liability company and a direct subsidiary of LTL (RAM); and (c) the Debtor’s direct parent, Johnson & Johnson Consumer Inc., a New Jersey company (New JJCI). The Debtor received certain of Old JJCI’s assets and became solely responsible for the talc-related liabilities of Old JJCI, including all liabilities related in any way to injury or damage, or alleged injury or damage, sustained or incurred in the purchase or use of, or exposure to, talc, including talc contained in any product, or to the risk of, or responsibility for, any such damage or injury, except for any liabilities for which the exclusive remedy is provided under a workers’ compensation statute or act (the Talc-Related Liabilities).
In October 2021, notwithstanding the Company’s confidence in the safety of its talc products, the Debtor filed a voluntary petition with the United States Bankruptcy Court for the Western District of North Carolina, Charlotte Division, seeking relief under chapter 11 of the Bankruptcy Code (the LTL Bankruptcy Case). All litigation against LTL, Old JJCI, New JJCI, the Company, other of their corporate affiliates, identified retailers, insurance companies, and certain other parties (the Protected Parties) was stayed, although LTL did agree to lift the stay on a small number of appeals where appeal bonds had been filed.stayed. The LTL Bankruptcy Case was transferred to the United States Bankruptcy Court for the District of New Jersey. Claimants filed motions to dismiss the LTL Bankruptcy Case and, following a multiple day hearing, the New Jersey Bankruptcy Court denied those motions in March 2022.
The claimants subsequently filed notices of appeal as to the denial of the motions to dismiss the LTL Bankruptcy Case and the extension of the stay to the Protected Parties. On January 30, 2023, the Third Circuit reversed the Bankruptcy Court’s ruling and remanded to the Bankruptcy Court to dismiss the LTL bankruptcy.
LTL filed a petition for rehearing of the Third Circuit’s decision, which was denied in March 2023.LTL subsequently filed a motion in the Third Circuit to stay the mandate directing the New Jersey Bankruptcy Court to dismiss the LTL bankruptcy pending filing and disposition of a petition for writ of certiorari to the United States Supreme Court. The Third Circuit denied the motion to stay the mandate and issued the mandate.
In April 2023, the New Jersey Bankruptcy Court dismissed the LTL Bankruptcy Case, effectively lifting the stay as to all parties and returning the talc litigation to the tort system. LTL re-filed in the United States Bankruptcy Court for the District of New Jersey seeking relief under chapter 11 of the Bankruptcy Code (the LTL 2 Bankruptcy Case).As a result of the new filing, all talc claims against LTL were again automatically stayed pursuant to section 362 of the Bankruptcy Code.Additionally, the New Jersey Bankruptcy Court issued a temporary restraining order staying all litigation as to LTL, Old JJCI, New JJCI, the Company, identified retailers, and certain other parties (the New Protected Parties).
Also in April 2023, the New Jersey Bankruptcy Court issued a decision that granted limited injunctive relief to the Company and the New Protected Parties (the LTL 2 Preliminary Injunction).The LTL 2 Preliminary Injunction remainsremained in force until late August 2023, following the Bankruptcy Court’s extension of the initial LTL 2 Preliminary Injunction in June 2023. Under the LTL 2 Preliminary Injunction, except for in those cases filed in the federal court ovarian cancer multi-district litigation, discovery in all personal injury and wrongful death matters iswas permitted to proceed. No trials may occur in any of the personal injury and wrongful death matters except for the Valadez trial after the Bankruptcy Court partially lifted the stay for Valadez and allowed it to proceed to trial.In July 2023, the jury returned a verdict in favor of Valadez for $18.8 million in
compensatory damages but declined to award punitive damages.The Company will appeal.The terms of the court’s lifting of the automatic stay will prevent any collection of judgment.
Furthermore, in April 2023, the Talc Claimants' Committee filed a motion to dismiss the LTL 2 Bankruptcy followed by similar motions from other claimants. Hearings on the motions to dismiss occurred in June 2023. OnIn July 28, 2023, the court dismissed the LTL 2 Bankruptcy case and, the same day, the Company stated its intent to appeal the decision and to continue its efforts to obtain a resolution of the talc claims.
In October 2023, the originalCompany stated that it was pursuing the following four parallel and alternative pathways to achieve a comprehensive and final resolution of the talc claims: (i) the appeal of the LTL 2 dismissal decision; (ii) pursuing a consensual “prepackaged” bankruptcy case, as “strongly encouraged” by the Bankruptcy Court in its dismissal decision; (iii) aggressively litigating the talc claims in the tort system; and (iv) pursuing affirmative claims against experts for false and defamatory narratives regarding the Company’s talc powder products.
Following the dismissal of LTL 2, new lawsuits were filed, cases across the country that had been stayed were reactivated, and trials have commenced. The majority of the cases are pending in federal court, organized in a multi-district litigation (MDL) in the United States District Court for the District of New Jersey. In the MDL, case-specific discovery is proceeding with an expectation that a trial will occur in early 2025. In March 2024, the court granted the Company's motion for a renewed Daubert hearing and set a briefing schedule.
On May 1, 2024, the Company agreedcommenced a three-month solicitation period of its proposed consensual “prepackaged” chapter 11 bankruptcy plan (the “Proposed Plan”) for the comprehensive and final resolution of all current and future claims related to provide funding
cosmetic talc in the United States, excluding claims related to LTLmesothelioma or State consumer protection claims, in exchange for the payment of amountsby the New Jersey Bankruptcy Court determines are owed by LTL and the establishment of a $2 billion trust in furtherance of this purpose. The Company established a reserve for approximately $2 billion in connection with the aforementioned trust. After and as a result of the filing of the LTL Bankruptcy Case, the Company de-consolidated LTL through the second fiscal quarter, which is a related party. The impact of the de-consolidation is not material to the Company. In the LTL 2 Bankruptcy Case, the Company had agreed to contribute an additional amount which, when added to the prior $2 billion, would be a total reserve of present value of approximately $9$6.475 billion payable over 25 years (nominal value of approximately $12$8.4 billion, discounted at a rate of 4.41%4.4%),. The claims encompassed by the Proposed Plan constitute 99.75% of pending lawsuits against the Company relating to its talc powder products. Mesothelioma and State consumer protection claims are being addressed outside the Proposed Plan. The Company separately has resolved 95% of the mesothelioma lawsuits filed to date, and has agreements in principle to resolve all the State claims.
To account for these settlements and the contemplated comprehensive resolution through the Proposed Plan, the Company recorded an incremental charge of approximately $2.7 billion, for a total reserve as of the first fiscal quarter 2024 at a present value of approximately $11 billion (or nominal value of approximately $13.7 billion). Approximately one-third of the reserve is recorded as a current and future talc claims.liability. The approximate $9 billion reserverecorded amount remains the Company’sCompany's best estimate of probable loss afterloss.
During the dismissal.
The parties have not yet reached a resolutionpendency of all talc matters andthe solicitation period, the Company is unablewill continue to estimatepursue in parallel the possible loss or range of loss beyondother three previously-announced pathways to resolve the amount accrued.
A class action advancingtalc claims, relating to industrial talc was filed againstincluding proceeding with the Company and others in New Jersey state court in May 2022 (the Edley Class Action). The Edley Class Action asserts, among other things, that the Company fraudulently defended past asbestos personal injury lawsuits arising from exposure to industrial talc mined, milled, and manufactured before January 6, 1989 by the Company’s then wholly owned subsidiary, Windsor Minerals, Inc., which is currently a debtorDaubert motions in the Imerys Bankruptcy described hereafter. The Company removed the Edley Class Action to federal court in the District of New Jersey. In October 2022, the Company filed motions to dismiss and to deny certification of a class to pursue the Edley Class Action in the New Jersey District Court.
In February 2019, the Company’s talc supplier, Imerys Talc America, Inc. and two of its affiliates, Imerys Talc Vermont, Inc. and Imerys Talc Canada, Inc. (collectively, Imerys) filed a voluntary petition for relief under chapter 11 of the United States Code (the Bankruptcy Code) in the United States Bankruptcy Court for the District of Delaware (Imerys Bankruptcy). The Imerys Bankruptcy relates to Imerys’s potential liability for personal injury from exposure to talcum powder sold by Imerys. In its bankruptcy, Imerys alleges it has claims against the Company for indemnification and rights to joint insurance proceeds.
In June 2020,February 2021, Cyprus Mines Corporation and its parent, Cyprus Amax Minerals Company (CAMC) (together, Cyprus)(Cyprus), which had owned certain Imerys talc mines, filed an adversary proceeding against the Company and Imerys in the Imerys Bankruptcy seeking a declaration of indemnity rights under certain contractual agreements (the Cyprus Adversary Proceeding). The Company denies such indemnification is owed and filed a motion to dismiss the adversary complaint. In February 2021, Cyprus filed a voluntary petition for relief under chapter 11 of the Bankruptcy Code and filed its Disclosure Statement and Plan (the Cyprus Plan). The Cyprus Plan contemplates a settlement with Imerys and talc claimants where Cyprus would make a monetary contribution to a trust established under the Imerys Plan in exchange for an injunction against talc claims asserted against it and certain protectedaffiliated parties. Cyprus has
The Imerys Plan proceeded to solicitation in early 2021. However, the Imerys Plan did not yet sought approvalreceive the requisite number of votes to be confirmed after the Bankruptcy Court ruled certain votes cast in favor of the Imerys Plan should be disregarded. Imerys subsequently canceled its Disclosure Statement and Plan. Cyprus, along withconfirmation hearing.
After the confirmation hearing was canceled, Imerys, the Imerys Tort Claimants’ Committee, (TCC) and the Imerys Future Claimants’ Representative, (FCR) appointed inalong with Cyprus, the Cyprus chapter 11 case, have agreedTort Claimants’ Committee, and the Cyprus Future Claimants’ Representative engaged in mediation. The Bankruptcy Court also authorized Imerys and Cyprus to participate in theproceed with mediation with certain of their insurers.
In September 2023, Imerys and Cyprus filed amended plans of reorganization. The amended plans contemplate a similar construct as the Mediation Parties.prior Imerys and Cyprus Plans, including all talc claims against Imerys and Cyprus (and certain other protected parties) being channeled to a trust along with Imerys’s and Cyprus’s alleged indemnification rights against the Company. In October 2021,January 2024, Imerys and Cyprus each filed a disclosure statement for its respective Chapter 11 plans. On April 29, 2024, the Company, filed a Notice of Bankruptcy FilingImerys and Stay of Proceedings clarifying that the automatic stay arising upon the filing of the LTL Bankruptcy Case should applyCyprus reached an agreement in principle on monetary and non-monetary terms to the Cyprus Adversary Proceeding. In June 2022, Cyprus commenced an Adversary Proceeding in its chapter 11 case seeking an order enforcing the automatic stay by enjoining parties from commencing or continuing “talc-related claims” against CAMC. In June 2022, the court entered a preliminary injunction order enjoining claimants from pursuing talc-related claims against CAMC through January 2023. The court subsequently extended the preliminary injunction through the end of July 2023. In June 2023, Cyprus filed a motion seeking to further extend the preliminary injunction through the end of February 2024.
Imerys, the TCC, the FCR, certain of Imerys’s insurers, and certain parties in the Cyprus Mines chapter 11 case (collectively the Mediation Parties) have been engaged in mediation since October 2021. In June 2023, the bankruptcy court entered an order extending the term of the mediation through the end of July 2023.
In July 2021, Imerys commenced an adversary proceeding against the Companyresolve their ongoing disputes, including disputes raised in the Imerys Bankruptcy (the Imerys Adversary Proceeding). The Imerys Adversary Proceeding sought, among other things, certain declarations with respect to the indemnification obligations allegedly owed by the Company to Imerys. The Company filed a motion to dismiss the adversary proceeding.
In February 2021, several of the Company’s insurers involved in coverage litigation in New Jersey State Court (the Coverage Action) filed a motion in the Imerys Bankruptcy Court proceeding seeking a determination that the automatic stay does not apply to the Coverage Action and in the alternative, seeking relief from the automatic stay to allow them to continue to litigate their claims in the Coverage Action. The Court entered an agreed order modifying the stay to allow the litigation in the Coverage Action to continue.
In February 2018, a securities class action lawsuit was filed against the Company and certain named officers in the United States District Court for the District of New Jersey, alleging that the Company violated the federal securities laws by failing to disclose alleged asbestos contamination in body powders containing talc, primarily JOHNSON’S Baby Powder, and that purchasers of the Company’s shares suffered losses as a result. In April 2019, the Company moved to dismiss the complaint. In December 2019, the Court denied, in part, the motion to dismiss. In April 2021, briefing on Plaintiff’s motion for class certification was completed. The case was stayed in May 2022 pursuant to the LTL Bankruptcy Case and was reopened in May 2023. Defendants have requested that further fact discovery be stayed untilIn December 2023, the Court rules ongranted Plaintiff’s motion for class certification.
A lawsuit was brought against the Company in the Superior Court of California for the County of San Diego alleging violations of California’s Consumer Legal Remedies Act (CLRA) relating to JOHNSON’S Baby Powder. In that lawsuit, the plaintiffs allege that the Company violated the CLRA by failing to provide required Proposition 65 warnings. In July 2019, the Company filed a notice of removal to the United States District Court for the Southern District of California and plaintiffs filed a second amended complaint shortly thereafter. In October 2019, the Company moved to dismiss the second amended complaint for failure to state a claim upon which relief may be granted. In response to those motions, plaintiffs filed a third amended complaint. In December 2019, the Company moved to dismiss the third amended complaint for failure to state a claim upon which relief may be granted. In April 2020, the Court granted the motion to dismiss but granted leave to amend. In May 2020, plaintiffs filed a Fourth Amended Complaint but indicated that they would be filing a motion for leave to file a fifth amended complaint. Plaintiffs filed a Fifth Amended Complaint in August 2020. The Company moved to dismiss the Fifth Amended Complaint for failure to state a claim upon which relief may be granted. In January 2021, the Court issued an Order and opinion ruling in the Company’s favor and granting the motion to dismiss
with prejudice. In February 2021, Plaintiffs filed a Notice of Appeal with the Ninth Circuit. Plaintiffs filed their opening brief in July 2021. The company filed its responsive brief in October 2021. After the Notice of Suggestion of Bankruptcy was filed with the Ninth Circuit, a stay was imposed, and the Court held the reply deadline in abeyance. The appeal continues to be held in abeyance,In September 2023, the stay lifted. On April 29, 2024, the Ninth Circuit affirmed the District Court's order dismissing the case with the Company being required to file periodic status updates.prejudice.
In June 2014, the Mississippi Attorney General filed a complaint in Chancery Court of The First Judicial District of Hinds County, Mississippi against the Company and Johnson & Johnson Consumer Companies, Inc. (now known as Johnson & Johnson Consumer Inc.) (collectively, JJCI). The complaint alleges that JJCI violated the Mississippi Consumer Protection Act by failing to disclose alleged health risks associated with female consumers’ use of talc contained in JOHNSON’S Baby Powder and JOHNSON’S Shower to Shower (a product divested in 2012) and seeks injunctive and monetary relief. In February 2022, the trial court set the case for trial to begin in February 2023. However, in October 2022, the LTL bankruptcy court issued an order staying the case. In March 2023, the Third Circuit issued the mandate to dismiss the LTL Bankruptcy Case and in April 2023, the New Jersey Bankruptcy Court dismissed the LTL Bankruptcy Case, effectively lifting the stay as to this matter. The State requested a new trial setting. Later in April 2023, the trial court set a new trial date infor April 2024. The Company filed summary judgment and Daubert motions. The State filed a limited Daubert motion. The parties are currently engaged in expert work, extensive discovery, and preparationsagreed to the Court's request for the upcoming trial.
In January 2020, the State of New Mexico filed a consumer protection case alleging that the Company deceptively marketed and sold its talcum powder products by making misrepresentations about the safety of the products and the presence of carcinogens, including asbestos. In March 2022, the New Mexico court denied the Company’s motion to compel the State of New Mexico to engage in discovery of state agencies and denied the Company’s request for interlocutory appeal of that decision. The Company then filed a Petition for Writ of Superintending Control and a Request for a Stay to the New Mexico Supreme Court on the issue of the State of New Mexico’s discovery obligations. In April 2022, in view of the efforts to resolve talc-related claims in the LTL Bankruptcy Case, the Company and the State agreed to a 60-day stay of all matters except for the pending writ before the New Mexico Supreme Court, which expired in June 2022. Thereafter, the Company moved to enjoin prosecution of the case in the LTL Bankruptcy Case. In October 2022, the bankruptcy court issued an order staying the case. In December 2022, the State filed an appeal to the Third Circuit concerning the stay order. Separately, in September 2022, the New Mexico Supreme Court granted the Company's request for a stay pending further briefing on the scope of the State of New Mexico’s discovery obligations. In March 2023, the Third Circuit issued the mandate to dismiss the LTL Bankruptcy Case and in April 2023, the New Jersey Bankruptcy Court dismissed the LTL Bankruptcy Case, effectively lifting the stay as to this matter. However, this case remains stayed as a result ofWhile the State notified the New Mexico Supreme Court’sCourt of the lifted stay until such time asof litigation in April 2023, the Supreme Court issueshas not taken any action since being notified of the lifting of the stay and it remains in effect. The Company has reached an order concerning the State of New Mexico’s discovery obligations.
Forty-two states and the District of Columbia (including Mississippi and New Mexico) have commenced a joint investigation into the Company’s marketing of its talcum powder products. At this time, the multi-state group has not asserted any claims against the Company. Five states have issued Civil Investigative Demands seeking documents and other information. The Company has produced documents to Arizona, North Carolina, Texas, and Washington and entered into confidentiality
agreements. The Company has not received any follow up requests from those states. In March 2022, each of the forty-two states agreed to mediation of their claims in the LTL Bankruptcy Case. In July 2022, New Mexico and Mississippi indicated they would no longer voluntarily submit to further mediation in the LTL Bankruptcy and would proceed with their respective cases in state court. In March 2023, the mediation was terminated. In January 2024, the Company reached an agreement in principle with the multi-state group of state Attorneys General, subject to ongoing negotiation of non-monetary terms. The unique procedural history and status of the New Mexico and Mississippi matters specifically have been discussed above.
In addition, the Company has received inquiries, subpoenas, and requests to produce documents regarding talc matters and the LTL Bankruptcy Case from various governmental authorities. The Company has produced documents and responded to inquiries, and will continue to cooperate with government inquiries.
MATTERS CONCERNING OPIOIDS
Beginning in 2014 and continuing to the present, the Company and Janssen Pharmaceuticals, Inc. (JPI), along with other pharmaceutical companies, have been named in close to 3,500 lawsuits related to the marketing of opioids, including DURAGESIC, NUCYNTA and NUCYNTA ER. The majority of the cases have beenwere filed by state and local governments.governments, which were subject to a final settlement in 2021. As of January 2024, the Company and JPI have settled or otherwise resolved the opioid claims advanced by all government entity claimants except the City of Baltimore, a number of school districts, and other claimants. Similar lawsuits have also been filed by private plaintiffs and organizations, including but not limited to the following: individual plaintiffs on behalf of children born with Neonatal Abstinence Syndrome (NAS); hospitals; and health insurers/payors.
To date, the Company and JPI have litigated two of the cases to judgment and have prevailed in both, either at trial or on appeal.
In October 2019, the Company announced a proposed agreement in principle with a negotiating committee of state Attorneys General to settle all remaining government opioid litigation claims nationwide. Under the final national settlement agreement, which was announced in July 2021, the Company agreed to pay up to $5.0 billion to resolve all opioid lawsuits and future opioid claims by states, cities, counties, local school districts and other special districts, and tribal governments, contingent on sufficient participation by eligible government entities, and with credits back for entities that declined or were ineligible to participate. In July 2021, the Company announced that the termsfinalization of thean agreement to settle theall remaining state and subdivision claims had been finalized and approximatelyfor up to $5.0 billion. Approximately 60% of the all-in settlement was paid by the second fiscal quarter of 2023. The expected payment schedule provides that approximately $0.6 billion of payments are to be paid by the end of the second fiscal first quarter 2024, and will increase to approximately 75% by fiscal year end 2024.
The Company and JPI continue to defend the cases brought by the remaining government entity litigants as well as the cases brought by private litigants, including NAS claimants, hospitals, and health insurers/payors. Counting the private litigant cases, there are approximately 35 remaining opioid cases against the Company and JPI in various state courts, 475435 remaining cases in the Ohio MDL, and 24 additional cases in other federal courts. Some of these cases have been dismissed and are being appealed by the plaintiffs; severalplaintiffs and certain others including a case brought by DCH Health Systems in Alabama state court, are scheduled for trial in 2023, 2024, 2025, or 2025.
In addition, the Province of British Columbia filed suit against the Company and its Canadian affiliate Janssen Inc., and many other industry members, in Canada, and is seeking to have that action certified as an opt in class action on behalf of other provincial/territorial and the federal governments in Canada. Additional proposed class actions have been filed in Canada against the Company and Janssen Inc., and many other industry members, by and on behalf of people who used opioids (for personal injuries), municipalities and First Nations bands. These actions allege a variety of claims related to opioid marketing practices, including false advertising, unfair competition, public nuisance, consumer fraud violations, deceptive acts and practices, false claims and unjust enrichment. An adverse judgment in any of these lawsuits could result in the imposition of large monetary penalties and significant damages including, punitive damages, cost of abatement, substantial fines, equitable remedies and other sanctions.
From June 2017 through December 2019, the Company’s Board of Directors received a series of shareholder demand letters alleging breaches of fiduciary duties related to the marketing of opioids. The Board retained independent counsel to investigate the allegations in the demands, and in April 2020, independent counsel delivered a report to the Board recommending that the Company reject the shareholder demands and take the steps that are necessary or appropriate to secure dismissal of related derivative litigation. The Board unanimously adopted the recommendations of the independent counsel’s report.
In November 2019, one of the shareholders who sent a demandshareholder filed a derivative complaint against the Company as the nominal defendant and certain current and former directors and officers as defendants in the Superior Court of New Jersey. The complaint alleges breaches of fiduciary duties related to the marketing of opioids, and that the Company has suffered damages as a result of those alleged breaches. A series of additional derivative complaints making similar allegations against the same
and similar defendants were filed in New Jersey state and federal courts in 2019 and 2020. By 2022, all but two state court cases had been voluntarily dismissed. In February 2022, the state court granted the Company’s motion to dismiss one of the two cases, and the shareholder that brought the second case filed a notice of dismissal. The shareholder whose complaint was dismissed filed a motion for reconsideration. In May 2022, the state court held oral argument on the motion for reconsideration and subsequently denied the motion. The shareholder has appealed the state court’s dismissal order.order, and briefing on the appeal concluded in October 2022. In February 2024, the appellate court affirmed the dismissal of the shareholder's amended complaint. In March 2024, the shareholder filed a notice of petition for certification with the Supreme Court of New Jersey seeking review of the appellate court's decision.
PRODUCT LIABILITY
The Company and certain of its subsidiaries are involved in numerous product liability claims and lawsuits involving multiple products. Claimants in these cases seek substantial compensatory and, where available, punitive damages. While the Company believes it has substantial defenses, it is not feasible to predict the ultimate outcome of litigation. From time to time, even if it has substantial defenses, the Company considers isolated settlements based on a variety of circumstances. The Company has accrued for these matters and will continue to monitor each related legal issue and adjust accruals as might be warranted based on new information and further developments in accordance with ASC 450-20-25.450-20-25, Contingencies. The Company accrues an estimate of the legal defense costs needed to defend each matter when those costs are probable and can be reasonably estimated. For certain of these matters, the Company has accrued additional amounts such as estimated costs associated with settlements, damages and other losses. Product liability accruals can represent projected product liability for thousands of claims around the world, each in different litigation environments and with different fact patterns. Changes to the accruals may be required in the future as additional information becomes available.
The table below contains the most significant of these cases and provides the approximate number of plaintiffs in the United States with direct claims in pending lawsuits regarding injuries allegedly due to the relevant product or product category as of July 2, 2023:
| | | | | | | | |
| Product or product category | | Number of Plaintiffsplaintiffs |
| Body powders containing talc, primarily JOHNSON’S Baby Powder | | 40,480 61,490 | |
| DePuy ASR XL Acetabular System and DePuy ASR Hip Resurfacing System | | 160 | |
| PINNACLE Acetabular Cup System | | 940 920 | |
| Pelvic meshes | | 7,160 6,440 | |
| ETHICON PHYSIOMESH Flexible Composite Mesh | | 910 230 | |
| RISPERDAL | | 240 50 | |
| ELMIRON | | 2,130 2,150 | |
TYLENOL | | 520 | |
The number of pending lawsuits is expected to fluctuate as certain lawsuits are settled or dismissed and additional lawsuits are filed. There may be additional claims that have not yet been filed.
MedTech
MedTech
DePuy ASR XL Acetabular Systemacetabular system and ASR Hip Resurfacing Systemresurfacing system
In August 2010, DePuy Orthopaedics, Inc. (DePuy) announced a worldwide voluntary recall of its ASR XL Acetabular System and DePuy ASR Hip Resurfacing System (ASR Hip) used in hip replacement surgery. Claims for personal injury have been made against DePuy and the Company. Cases filed in federal courts in the United States have been organized as a multi-district litigation in the United States District Court for the Northern District of Ohio. Litigation has also been filed in countries outside of the United States, primarily in the United Kingdom, Canada, Australia, Ireland, Germany, India and Italy. In November 2013, DePuy reached an agreement with a Court-appointed committee of lawyers representing ASR Hip plaintiffs to establish a program to settle claims with eligible ASR Hip patients in the United States who had surgery to replace their ASR Hips, known as revision surgery, as of August 2013. DePuy reached additional agreements in February 2015 and March 2017, which further extended the settlement program to include ASR Hip patients who had revision surgeries after August 2013 and prior to February 15, 2017. This settlement program has resolved more than 10,000 claims, thereby bringing to resolution significant ASR Hip litigation activity in the United States. However, lawsuits in the United States remain, and the settlement program does not address litigation outside of the United States. In Australia, a class action settlement was reached that resolved the claims of the majority of ASR Hip patients in that country. In Canada, the Company has reached agreements to settle the class actions filed in that country. The Company continues to receive information with respect to potential additional costs associated with this recall on a worldwide basis. The Company has established accruals for the costs associated with the United States settlement program and ASR Hip-related product liability litigation.
DePuy PINNACLE Acetabular Cup System
Claims for personal injury have also been made against DePuy Orthopaedics, Inc. and the Company (collectively, DePuy) relating to the PINNACLE Acetabular Cup System used in hip replacement surgery. Product liability lawsuits continue to be filed, and the Company continues to receive information with respect to potential costs and the anticipated number of cases. Most cases filed in federal courts in the United States have been organized as a multi-district litigation in the United States District Court for the Northern District of Texas (Texas MDL). Beginning on June 1, 2022, the Judicial Panel on Multidistrict Litigation ceased transfer of new cases into the Texas MDL, and there are now cases pending in federal court outside the Texas MDL. Litigation also has been filed in state courts and in countries outside of the United States. During the first quarter of 2019, DePuy established a United States settlement program to resolve these cases. As part of the settlement program, adverse verdicts have been settled. The Company has established an accrual for product liability litigation associated with the PINNACLE Acetabular Cup System and the related settlement program.
Ethicon Pelvic Mesh
Claims for personal injury have been made against Ethicon, Inc. (Ethicon) and the Company arising out of Ethicon’s pelvic mesh devices used to treat stress urinary incontinence and pelvic organ prolapse. The Company continues to receive information with respect to potential costs and additional cases. Cases filed in federal courts in the United States had been organized as a multi-district litigation (MDL) in the United States District Court for the Southern District of West Virginia. In March 2021, the MDL Court entered an order closing the MDL. The MDL Court has remanded cases for trial to the jurisdictions where the case was originally filed and additional pelvic mesh lawsuits have been filed, and remain, outside of the MDL. The Company has settled or otherwise resolved the majority of the United States cases and the estimated costs associated with these settlements and the remaining cases are reflected in the Company’s accruals. In addition, class actions and individual personal injury cases or claims seeking damages for alleged injury resulting from Ethicon’s pelvic mesh devices have been commenced in various countries outside of the United States, including claims and cases in the United Kingdom, the Netherlands, Belgium, France, Ireland, Italy, Spain and Slovenia and class actions in Israel, Australia, Canada and South Africa. In November 2019, the Federal CourtThe vast majority of Australia issued a judgment regarding its findings with respect to liability in relation to the three Lead Applicants and generally in relation to the design, manufacture, pre- and post-market assessments and testing, and supply and promotion of the devices in Australia used to treat stress urinary incontinence and pelvic organ prolapse. In September 2022, after exhausting its appeals, the Company reached an in-principle agreement to resolve the two pelvic mesh classthese actions in Australia and in March 2023 the Federal Court approved the settlement. The class actions in Canada were discontinued in 2020 as a result of a settlement of a group of cases and an agreement to resolve the Israeli class action was reached in May 2021. The parties in the Israeli class action are currently finalizing the terms of the settlement. A motion to approve the settlement was filed with the Court.now resolved. The Company has established accruals with respect to product liability litigation associated with Ethicon’s pelvic mesh products.
Ethicon Physiomesh
Following a June 2016 worldwide market withdrawal of Ethicon Physiomesh Flexible Composite Mesh (Physiomesh), claims for personal injury have been made against Ethicon, Inc. (Ethicon) and the Company alleging personal injury arising out of the use of this hernia mesh device. Cases filed in federal courts in the United States have been organized as a multi-district litigation (MDL) in the United States District Court for the Northern District of Georgia. A multi-county litigation (MCL) also has been formed in New Jersey state court and assigned to Atlantic County for cases pending in New Jersey. In addition to the matters in the MDL and MCL, there are additional lawsuits pending in the United States District Court for the Southern District of Ohio, which are part of the MDL for polypropylene mesh devices manufactured by C.R. Bard, Inc., and lawsuits pending in two New Jersey MCLs formed for Proceed/Proceed Ventral Patch and Prolene Hernia systems, and lawsuits pending outside the United States. In May 2021, Ethicon
and lead counsel for the plaintiffs entered into a term sheet to resolve approximately 3,600 Physiomesh cases (covering approximately 4,300 plaintiffs) pending in the MDL and MCL at that time. A master settlement agreement (MSA) was entered into in September 2021 and includes 3,729 cases in the MDL and MCL. All deadlines and trial settings in those proceedings are currently stayedOther than a small number of cases still pending the completion of the settlement agreement. Of the cases subject to the MSA, 3,244 have been dismissed with prejudice. Ethicon has received releases from 3,559 plaintiffs, and releases continue to be submitted as part of the settlement process. Post-settlement cases in the Physiomesh MDL and MCL are subject to docket control orders requiring early expert reports and discovery requirements. In May 2023, Ethicon entered an additional settlement to resolve the claims of 292 Physiomesh claimants. That settlement is proceeding, and releases are being returned.There are two cases in the MDL, and twoall Physiomesh matters in the MCL whichUnited States have been resolved or are not included in either settlement and which remain subject to the docket control orders.undergoing formal review for purposes of settlement.
Claims have also been filed against Ethicon and the Company alleging personal injuries arising from the PROCEED Mesh and PROCEED Ventral Patch hernia mesh products. In March 2019, the New Jersey Supreme Court entered an order consolidating these cases pending in New Jersey as an MCL in Atlantic County Superior Court. Additional cases have been filed in various federal and state courts in the United States, and in jurisdictions outside the United States.
Ethicon and the Company also have been subject to claims for personal injuries arising from the PROLENE Polypropylene Hernia System. In January 2020, the New Jersey Supreme Court created an MCL in Atlantic County Superior Court to handle such cases. Cases involving this product have also been filed in other federal and state courts in the United States.
In October 2022, an agreement in principle, subject to various conditions, was reached to settle the majority of the pending cases involving Proceed, Proceed Ventral Patch, Prolene Hernia System and related multi-layered mesh products, as well as a number of unfiled claims. All litigation activities in the two New Jersey MCLs are stayed pending effectuation of the proposed settlement. Future cases that are filed in the New Jersey MCLs will be subject to docket control orders requiring early expert reports and discovery requirements.
The Company has established accruals with respect to product liability litigation associated with Ethicon Physiomesh Flexible Composite Mesh, PROCEED Mesh and PROCEED Ventral Patch, and PROLENE Polypropylene Hernia System products.
Pharmaceuticals
RISPERDAL
Claims for personal injury have been made against Janssen Pharmaceuticals, Inc. and the Company arising out of the use of RISPERDAL, and related compounds, indicated for the treatment of schizophrenia, acute manic or mixed episodes associated with bipolar I disorder and irritability associated with autism. Lawsuits primarily have been filed in state courts in Pennsylvania, California, and Missouri. Other actions are pending in various courts in the United States and Canada. Product liability lawsuits continue to be filed, and theThe Company continues to receive information with respectdefend RISPERDAL product liability lawsuits, and continues to evaluate potential costs and the anticipated number of cases.related to those claims. The Company has successfully defended a number of these cases but there have been verdicts against the Company, including a verdict in October 2019 of $8.0 billion of punitive damages related to one plaintiff, which the trial judge reduced to $6.8 million in January 2020. In September 2021, the Company entered into a settlement in principle with the counsel representing plaintiffs in this matter and in substantially all of the outstanding cases in the United States. The costs associated with this and other settlements are reflected in the Company’s accruals.
ELMIRON
Claims for personal injury have been made against a number of Johnson & Johnson companies, including Janssen Pharmaceuticals, Inc. and the Company, arising out of the use of ELMIRON, a prescription medication indicated for the relief of bladder pain or discomfort associated with interstitial cystitis. These lawsuits, which allege that ELMIRONcontributes to the development of permanent retinal injury and vision loss, have been filed in both state and federal courts across the United States. In December 2020, lawsuits filed in federal courts in the United States, including putative class action cases seeking medical monitoring, were organized as a multi-district litigation in the United States District Court for the District of New Jersey.Jersey (MDL). In addition, cases have been filed in various state courts of New Jersey, which have been coordinated in a multi-county litigation in Bergen County, as well as the Court of Common Pleas in Philadelphia, which have been coordinated and granted mass tort designation. In addition, three class action lawsuits have been filed in Canada. Product liability lawsuits continue to be filed, and theThe Company continues to receive information with respectdefend ELMIRON product liability lawsuits and continues to evaluate potential costs and the anticipatedrelated to those claims. Other than a small number of cases.cases in the MDL filed by one law firm, all U.S. based ELMIRON matters have been resolved or are undergoing formal review for purposes of settlement. The Company has established accruals for defense and indemnity costs associated with ELMIRON related product liability litigation.
Consumer Health
TYLENOL
Claims for personal injury have been made against Johnson and Johnson Consumer Inc. (JJCI) in federal court, arising out of the use of TYLENOL, an over-the-counter pain medication, alleging that prenatal exposure to acetaminophen is associated with the development of autism spectrum disorder and/or attention-deficit/hyperactivity disorder. In October 2022, lawsuits filed in federal courts in the United States were organized as a multi-district litigation in the United States District Court for the Southern District of New York. In addition, a lawsuit has been filed in state court against JJCI, Kenvue and the Company, and lawsuits have been filed in Canada against Johnson & Johnson Inc. and the Company. Product liability lawsuits continue to be filed, and the Company continues to receive information with respect to potential costs and the anticipated number of cases. The Company has established accruals for defense costs associated with TYLENOL related product liability litigation.
INTELLECTUAL PROPERTY
Certain subsidiaries of the Company are subject, from time to time, to legal proceedings and claims related to patent, trademark and other intellectual property matters arising out of their businesses. Many of these matters involve challenges to the coveragescope and/or validity of the patents onthat relate to various products and allegations that certain of the Company’s products infringe the patentsintellectual property rights of third parties. Although these subsidiaries believe that they have substantial defenses to these challenges and allegations with respect to all significant patents, there can be no assurance as to the outcome of these matters. A loss in any of these cases could adversely affect the ability of these subsidiaries to sell their products, result in loss of sales due to loss of market
exclusivity, require the payment of past damages and future royalties, and may result in a non-cash impairment charge for any associated intangible asset.
PharmaceuticalsInnovative Medicine - Litigation Against Filerslitigation against filers of Abbreviated New Drug Applicationsabbreviated new drug applications (ANDAs)
The Company’s subsidiaries have brought lawsuits against generic companies that have filed ANDAs with the U.S. FDA (or similar lawsuits outside of the United States) seeking to market generic versions of products sold by various subsidiaries of the Company prior to expiration of the applicable patents covering those products. These lawsuits typically include allegations of non-infringement and/or invalidity of patents listed in FDA’s publication “Approved Drug Products with Therapeutic Equivalence Evaluations” (commonly known as the Orange Book). In each of these lawsuits, the Company’s subsidiaries are seeking an order enjoining the defendant from marketing a generic version of a product before the expiration of the relevant patents (Orange Book Listed Patents). In the event the Company’s subsidiaries are not successful in an action, or any automatic statutory stay expires before the court rulings are obtained, the generic companies involved would have the ability, upon regulatory approval, to introduce generic versions of their products to the market, resulting in the potential for substantial market share and revenue losses for the applicable products, and which may result in a non-cash impairment charge in any associated intangible asset. In addition, from time to time, the Company’s subsidiaries may settle these types of actions and such settlements can involve the introduction of generic versions of the products at issue to the market prior to the expiration of the relevant patents.
The Inter Partes Review (IPR) process with the United States Patent and Trademark Office (USPTO), created under the 2011 America Invents Act, is also being used at times by generic companies in conjunction with ANDAs and lawsuits to challenge the applicable patents.
XARELTO
Beginning in March 2021, Janssen Pharmaceuticals, Inc.; Bayer Pharma AG; Bayer AG; and Bayer Intellectual Property GmbH filed patent infringement lawsuits in United States district courts against generic manufacturers who have filed ANDAs seeking approval to market generic versions of XARELTO before expiration of certain Orange Book Listed Patents. The following entities are named defendants: Dr. Reddy’s Laboratories, Inc.; Dr. Reddy’s Laboratories, Ltd.; Lupin Limited; Lupin Pharmaceuticals, Inc.; Taro Pharmaceutical Industries Ltd.; Taro Pharmaceuticals U.S.A., Inc.; Teva Pharmaceuticals USA, Inc.; Mylan Pharmaceuticals Inc.; Mylan Inc.; USV Private Limited; Mankind Pharma Limited; Apotex Inc.; Apotex Corp.; Biocon Pharma Limited; Biocon Limited; Biocon Pharma, Inc.; ScieGenAuson Pharmaceuticals Inc.; Auson Pharmaceuticals Inc.Co. Ltd.; Macleods Pharmaceuticals Ltd; Macleods Pharma USA, Inc.; Indoco Remedies Limited; and FPP Holding Company LLC.LLC; Umedica Laboratories Pvt. Ltd.; Aurobindo Pharma Limited; Aurobindo Pharma USA, Inc.; Cipla Ltd.; Cipla USA Inc.; InvaGen Pharmaceuticals, Inc.; and Prinston Pharmaceuticals, Inc. The following U.S. patents are included in one or more cases: 9,539,218;9,539,218 and 10,828,310. In April 2023,January 2024, the Company entered into a confidential settlement agreement with ScieGenMacleods Pharmaceuticals Ltd. and Macleods Pharma USA, Inc.In June 2023,February 2024, the Company entered into a confidential settlement agreementagreements with USV Private Limited.
U.S. Patent No. 10,828,310 iswas also under consideration by the USPTO in an IPR proceeding.
OPSUMIT
Beginning in January 2023 Actelion Pharmaceuticals Ltd and Actelion Pharmaceuticals US, Inc. filed patent infringement lawsuits in United States district courts against generic manufacturers who have filed ANDAs seeking approval to market generic versions of OPSUMIT before expiration of certain Orange Book Listed Patents. The following entities are named defendants: Sun Pharmaceutical Industries Limited; Sun Pharmaceutical Industries,Mylan Pharmaceuticals Inc.; AlembicTorrent Pharmaceuticals Ltd.; Alembic Pharmaceuticals,and Torrent Pharma Inc.; MSN Laboratories Private Limited; MSN Pharmaceuticals Inc.; Apotex Inc.; and Apotex Corp. The following U.S. patents are included in one or more cases: 7,094,781; and 10,946,015.
INVEGA SUSTENNA
Beginning in January 2018, Janssen Pharmaceutica NV and Janssen Pharmaceuticals, Inc. filed patent infringement lawsuits in United States district courts against generic manufacturers who have filed ANDAs seeking approval to market generic versions of INVEGA SUSTENNA before expiration of the Orange Book Listed Patent. The following entities are named defendants: Teva Pharmaceuticals USA, Inc.; Mylan Laboratories Limited; Pharmascience Inc.; Mallinckrodt PLC; Specgx LLC; Tolmar, Inc.; and Accord Healthcare, Inc. The following U.S. patent is included in one or more cases: 9,439,906.
Beginning in February 2018, Janssen Inc. and Janssen Pharmaceutica NV initiated a Statement of Claim under Section 6 of the Patented Medicines (Notice of Compliance) Regulations against generic manufacturers who have filed ANDSs seeking approval to market generic versions of INVEGA SUSTENNA before expiration of the listed patent. The following entities are named defendants: Teva Canada Limited; Pharmascience Inc.; and Apotex Inc. The following Canadian patent is included in one or more cases: 2,655,335. In March 2023, the Federal Appeals Court dismissed Teva Canada Limited’s appeal of the Federal Court’s decision finding that its proposed generic product infringes the asserted patent and that the patent is not invalid.
INVEGA TRINZA
Beginning in September 2020, Janssen Pharmaceuticals, Inc., Janssen Pharmaceutica NV, and Janssen Research & Development, LLC filed patent infringement lawsuits in United States district courts against generic manufacturers who have filed ANDAs seeking approval to market generic versions of INVEGA TRINZA before expiration of the Orange Book Listed Patent. The following entities are named defendants: Mylan Laboratories Limited; Mylan Pharmaceuticals Inc.; and Mylan Institutional LLC. The following U.S. patent is included in one or more cases: 10,143,693. In May 2023, the District Court
issued a decision finding that Mylan’s proposed generic product infringes the asserted patent and that the patent is not invalid.Mylan has appealed the verdict.
IMBRUVICA
Beginning in September 2021, Pharmacyclics LLC and Janssen Inc. initiated a Statement of Claim under Section 6 of the Patented Medicines (Notice of Compliance) Regulations against generic manufacturers who have filed ANDSs seeking approval to market generic versions of IMBRUVICA before expiration of certain listed patents. The following entities are named defendants: Natco Pharma (Canada) Inc. (Natco); and Sandoz Canada Inc. (Sandoz). The following patents are included in one or more cases: 2,663,116; 2,928,721; 2,800,913; 3,007,787; 3,007,788; 2,875,986; and 3,022,256. In July 2023, the Company entered into confidential settlement agreements with Natco and Sandoz.
SYMTUZA
Beginning in November 2021, Janssen Products, L.P., Janssen Sciences Ireland Unlimited Company, Gilead Sciences, Inc. and Gilead Sciences Ireland UC filed patent infringement lawsuits in United States district courts against generic manufacturers who have filed ANDAs seeking approval to market generic versions of SYMTUZA before expiration of certain Orange Book Listed Patents. The following entities are named defendants: Lupin Limited; Lupin Pharmaceuticals, Inc.; MSN Laboratories Private Ltd.; MSN Life Sciences Private Ltd.; MSN Pharmaceuticals Inc.; Apotex Inc.; and Apotex Corp. The following U.S. patents are included in one or more cases: 10,039,718 and 10,786,518.
ERLEADA
Beginning in May 2022, Aragon Pharmaceuticals, Inc., Janssen Biotech, Inc. (collectively, Janssen), Sloan Kettering Institute for Cancer Research (SKI) and The Regents of the University of California filed patent infringement lawsuits in United States district courts against generic manufacturers who have filed ANDAs seeking approval to market generic versions of ERLEADA before expiration of certain Orange Book Listed Patents. The following entities are named defendants: Lupin Limited; Lupin Pharmaceuticals, Inc.; Zydus Worldwide DMCC; Zydus Pharmaceuticals (USA), Inc.; Zydus Lifesciences Limited; Sandoz Inc.; Eugia Pharma Specialities Limited; Aurobindo Pharma USA, Inc.; Auromedics Pharma LLC; Hetero Labs Limited Unit V; and Hetero USA, Inc. The following U.S. patents are included in one or more cases: 9,481,663; 9,884,054; 10,052,314;10,052,314 (which reissued as RE49,353); 10,702,508; 10,849,888; 8,445,507; 8,802,689; 9,388,159; 9,987,261; and RE49,353.
UPTRAVI
Beginning in November 2022, Actelion Pharmaceuticals US Inc., Actelion Pharmaceuticals Ltd and Nippon Shinyaku Co., Ltd. filed patent infringement lawsuits in United States district courts against generic manufacturers who have filed ANDAs seeking approval to market generic versions of UPTRAVI intravenous before expiration of certain Orange Book Listed Patents. The following entities are named defendants: Alembic Pharmaceuticals Limited, Alembic Pharmaceuticals Inc.; Lupin Ltd.; Lupin Pharmaceuticals, Inc.; Cipla Limited; Cipla USA Inc.; MSN Laboratories Private Ltd.; and MSN Pharmaceuticals Inc. The following U.S. patents are included in one or more cases: 8,791,122; 9,284,280;8,791,122 and 7,205,302 (‘302 patent).9,284,280. In June 2023,February 2024, the Company reachedentered into a confidential settlement agreement with respect to the ’302 patent with AlembicLupin Ltd. and Lupin Pharmaceuticals, Limited and Alembic Pharmaceuticals Inc.
SPRAVATO
Beginning in May 2023, Janssen Pharmaceuticals, Inc. and Janssen Pharmaceutica NV filed patent infringement lawsuits in United States district courts against generic manufacturers who have filed ANDAs seeking approval to market generic versions of SPRAVATO before expiration of certain Orange Book Listed Patents. The following entities are named defendants: Sandoz Inc.; Hikma Pharmaceuticals Inc. USA; Hikma Pharmaceuticals PLC; Westward Columbus Inc.;and Alkem Laboratories Ltd; and Ascend Laboratories, LLC.Ltd. The following U.S. patents are included in one or more cases: 10,869,844; 11,173,134; 11,311,500; and 11,446,26011,446,260.
STELARA
In November 2023, Biocon Biologics Inc. filed a Petition for Inter Partes Review (IPR) with the USPTO seeking review of U.S. Patent No. 10,961,307 related to methods of treating ulcerative colitis with ustekinumab. In February 2024, the parties entered into a confidential settlement agreement, and the IPR was terminated.
INVOKANA
Beginning in January 2024, Janssen Inc. and Mitsubishi Tanabe Pharma Corporation initiated Statements of Claim under Section 6 of the Patented Medicines (Notice of Compliance) Regulations against a generic manufacturer who filed an ANDS seeking approval to market generic versions of INVOKANA before expiration of the listed patents. The following entity is a named defendant: Jamp Pharma Corporation. The following Canadian patents are included in one ore more cases: 2,534,024 and 2,671,357.
MedTech
In March 2016, Abiomed, Inc. (Abiomed) filed a declaratory judgment action against Maquet Cardiovascular LLC (Maquet) in U.S. District Court for the District of Massachusetts seeking a declaration that the Impella does not infringe certain Maquet patents, currently U.S. Patent Nos. 7,022,100 (’100); 8,888,728; 9,327,068; 9,545,468; 9,561,314; and 9,597,437. Maquet counterclaimed for infringement of each of those patents. After claim construction, Maquet alleged infringement of only the ’100 patent. In
GOVERNMENT PROCEEDINGSSeptember 2021, the court granted Abiomed’s motion for summary judgment of non-infringement of the ’100 patent, and in September 2023, the district court entered final judgment in favor of Abiomed on all patents-in-suit. Maquet appealed.
Like other companies in the pharmaceutical consumer health and medical devicestechnologies industries, the Company and certain of its subsidiaries are subject to extensive regulation by national, state and local government agencies in the United States and other countries in which they operate. Such regulation has been the basis of government investigations and litigations. The most significant litigation brought by, and investigations conducted by, government agencies are listed below. It is possible that criminal charges and substantial fines and/or civil penalties or damages could result from government investigations or litigation.
MedTech
In August 2012, DePuy Orthopaedics, Inc., DePuy, Inc. (now known as DePuy Synthes, Inc.), and Johnson & Johnson Services, Inc. (collectively DePuy) received an informal request from the United States Attorney’s Office for the District of Massachusetts and the Civil Division of the United States Department of Justice (the United States) for the production of materials relating to the DePuy ASR XL Hip device. In July 2014, the United States notified the United States District Court for
the District of Massachusetts that it had declined to intervene in a qui tam case filed pursuant to the False Claims Act against the companies concerning the hip devices. In February 2016, the District Court granted the companies’ motion to dismiss with prejudice, unsealed the qui tam complaint, and denied the qui tam relators’ request for leave to file a further amended complaint. The qui tam relators appealed the case to the United States Court of Appeals for the First Circuit. In July 2017, the First Circuit affirmed the District Court’s dismissal in part, reversed in part, and affirmed the decision to deny the relators’ request to file a third amended complaint. In March 2021, DePuy filed its motion to strike and dismiss the relators’ second amended complaint; the District Court denied DePuy’s motion to strike and dismiss in July 2021. DePuy filed a motion for reconsideration of the District Court’s July 2021 ruling. In November 2021, the District Court granted DePuy’s motion for reconsideration and dismissed the case with prejudice. The District Court’s order was unsealed in December 2021. The relators filed several post-dismissal motions, including a January 2022 omnibus motion for reconsideration, which the District Court denied. Following the District Court’s order dismissing the case with prejudice, DePuy filed a December 2021 motion seeking the recovery of attorneys’ fees and costs, which the District Court denied except as to costs. The Relators appealed the District Court’s dismissal of the case to the First Circuit.On May 18, 2023, the First Circuit affirmed the District Court’s dismissal of the case.
In October 2012, the Company was contacted by the California Attorney General’s office regarding a multi-state Attorney General investigation of the marketing of surgical mesh products for hernia and urogynecological purposes by the Company’s subsidiary, Ethicon, Inc. (Ethicon). In May 2016, California and Washington filed civil complaints against the Company, Ethicon and Ethicon US, LLC alleging violations of their consumer protection statutes. Similar complaints were filed against the companies by the following states:Kentucky, Mississippi, West Virginia and Oregon. In October 2019, the Company and Ethicon settled the multi-state investigation with 41 other states and the District of Columbia. Between April 2019 and February 2023, the Company settled with Washington, West Virginia, Oregon, Mississippi and Kentucky. After a trial in California and various appeals, the Company satisfied the judgment of penalties in California.
In July 2018, the Public Prosecution Service in Rio de Janeiro and representatives from the Brazilian antitrust authority CADE inspected the offices of more than 30 companies including Johnson & Johnson do Brasil Indústria e Comércio de Produtos para Saúde Ltda. The authorities appear to be investigating allegations of possible anti-competitive behavior and possible improper payments in the medical device industry. The Company continues to respond to inquiries regarding the Foreign Corrupt Practices Act from the United States Department of Justice and the United States Securities and Exchange Commission.
Pharmaceuticals
TheIn July 2023, the U.S. Department of Justice (DOJ) issued Civil Investigative Demands to the Company, Johnson & Johnson Surgical Vision, Inc., and several of its pharmaceutical subsidiaries (theJohnson & Johnson Vision Care, Inc. (collectively, J&J AWP Defendants), alongVision) in connection with numerous other pharmaceutical companies, were nameda civil investigation under the False Claims Act relating to free or discounted intraocular lenses and equipment used in eye surgery, such as defendantsphacoemulsification and laser systems. J&J Vision has begun producing documents and information responsive to the Civil Investigative Demands. J&J Vision is in a series of lawsuits in state and federal courts involving allegations thatongoing discussions with the pricing and marketing of certain pharmaceutical products amounted to fraudulent and otherwise actionable conduct because, among other things, the companies allegedly reported an inflated Average Wholesale Price (AWP) for the drugs at issue. Payors alleged that they used those AWPs in calculating provider reimbursement levels. The plaintiffs in these cases included three classes of private persons or entities that paid for any portion of the purchase of the drugs at issue based on AWP, and state government entities that made Medicaid payments for the drugs at issue based on AWP. Many of these cases, both federal actions and state actions removed to federal court, were consolidated for pre-trial purposes in a multi-district litigation in the United States District Court for the District of Massachusetts, where all claims against the J&J AWP Defendants were ultimately dismissed. The J&J AWP Defendants also prevailed in a case brought by the Commonwealth of Pennsylvania. Other AWP cases have been resolved through court order or settlement. The case brought by Illinois was settled after trial. In New Jersey, a putative class action based upon AWP allegations is pending against Centocor, Inc. and Ortho Biotech Inc. (both now Janssen Biotech, Inc.), the Company and ALZA Corporation. In June 2023, an action alleging AWP-related claims was filed in a Pennsylvania state court against the same Company subsidiaries by a putative class of payors.DOJ regarding its inquiry.
In July 2016, the Company and Janssen Products, LP were served with a qui tam complaint pursuant to the False Claims Act filed in the United States District Court for the District of New Jersey alleging the off-label promotion of two HIV products, PREZISTA and INTELENCE, and anti-kickback violations in connection with the promotion of these products. The complaint was filed under seal in December 2012. The federal and state governments have declined to intervene, and the lawsuit is being prosecuted by the relators. The Court denied summary judgment on all claims in December 2021. Daubert motions were granted in part and denied in part in January 2022, and the case is proceeding to trial.
In March 2017, Janssen Biotech, Inc. (JBI) received a Civil Investigative Demand from the United States Department of Justice regarding a False Claims Act investigation concerning management and advisory services provided to rheumatology and gastroenterology practices that purchased REMICADE or SIMPONI ARIA. In August 2019, the United States Department of Justice notified JBI that it was closing the investigation. Subsequently, the United States District Court for the District of Massachusetts unsealed a qui tam False Claims Act complaint, which was served on the Company. The Department of Justice had declined to intervene in the qui tam lawsuit in August 2019. The Company filed a motion to dismiss, which was granted in part and denied in part. Discovery is underway.
From time to time, the Company has received requests from a variety of United States Congressional Committees to produce information relevant to ongoing congressional inquiries. It is the policy of Johnson & Johnson to cooperate with these inquiries by producing the requested information.
GENERAL LITIGATION
The Company (subsequently substituted by Johnson & Johnson Consumer Inc. (JJCI)) along with more than 120 other companies, is a defendant in a cost recovery and contribution action brought by Occidental Chemical Corporation in June 2018 in the United States District Court for the District of New Jersey, related to the clean-up of a section of the Lower Passaic River in New Jersey.
The Company or its subsidiaries are also parties to various proceedings brought under the Comprehensive Environmental Response, Compensation, and Liability Act, commonly known as Superfund, and comparable state, local or foreign laws in which the primary relief sought is the Company’s agreement to implement remediation activities at designated hazardous waste sites or to reimburse the government or third parties for the costs they have incurred in performing remediation as such sites.
In October 2017, certain United States service members and their families brought a complaint against a number of pharmaceutical and medical devices companies, including Johnson & Johnson and certain of its subsidiaries in United States District Court for the District of Columbia, alleging that the defendants violated the United States Anti-Terrorism Act. The complaint alleges that the defendants provided funding for terrorist organizations through their sales practices pursuant to pharmaceutical and medical device contracts with the Iraqi Ministry of Health. In July 2020, the District Court dismissed the complaint. In January 2022, the United States Court of Appeals for the District of Columbia Circuit reversed the District Court’s decision. In June 2023, defendants filed a petition for a writ of certiorari to the United States Supreme Court.
In February 2024, a putative class action was filed against the Company, the Pension & Benefits Committee of Johnson & Johnson, and certain named officers and employees, in United States District Court for the District of New Jersey. The complaint alleges that defendants breached fiduciary duties under the Employee Retirement Income Security Act (ERISA) by allegedly mismanaging the Company’s prescription-drug benefits program. The complaint seeks damages and other relief.
MedTech
In October 2020, Fortis Advisors LLC (Fortis), in its capacity as representative of the former stockholders of Auris Health Inc. (Auris), filed a complaint against the Company, Ethicon Inc., and certain named officers and employees (collectively, Ethicon) in the Court of Chancery of the State of Delaware. The complaint alleges breach of contract, fraud, and other causes of action against Ethicon in connection with Ethicon’s acquisition of Auris in 2019. The complaint seeks damages and other relief. In December 2021, the Court granted in part and denied in part defendants’ motion to dismiss certain causes of action. All claims against the individual defendants were dismissed. The trial was held in January 2024 and the decision is scheduled for January 2024.pending.
Pharmaceuticals
In June 2019, the United States Federal Trade Commission (FTC) issued a Civil Investigative Demand to the Company and Janssen Biotech, Inc. (collectively, Janssen) in connection with its investigation of whether Janssen’s REMICADE contracting practices violate federal antitrust laws. The Company has produced documents and information responsive to the Civil Investigative Demand. Janssen is in ongoing discussions with the FTC staff regarding its inquiry.
In February 2022, the United States Federal Trade Commission (FTC) issued Civil Investigative Demands to Johnson & Johnson and Janssen Biotech, Inc. (collectively, Janssen) in connection with its investigation of whether advertising practices for REMICADE violate federal law. Janssen has produced documents and information responsive to the Civil Investigative Demands. Janssen is in ongoing discussions with the FTC staff regarding the inquiry.
In June 2022, Genmab A/S filed a Notice for Arbitration with International Institute for Conflict Prevention and Resolution (CPR) against Janssen Biotech, Inc. seeking milestones and an extended royalty term for Darzalex FASPRO. In April 2023, the Arbitration Panel ruled in Janssen's favor and dismissed Genmab's claims. In May 2023, Genmab appealed that award.
In October 2018, two separate putative class actions were filed against Actelion Pharmaceutical Ltd., Actelion Pharmaceuticals U.S., Inc., and Actelion Clinical Research, Inc. (collectively Actelion) in United States District Court for the District of Maryland and United States District Court for the District of Columbia. The complaints allege that Actelion violated state and federal antitrust and unfair competition laws by allegedly refusing to supply generic pharmaceutical manufacturers with samples of TRACLEER. TRACLEER is subject to a Risk Evaluation and Mitigation Strategy required by the U.S. Food and Drug Administration, which imposes restrictions on distribution of the product. In January 2019, the plaintiffs dismissed the District of Columbia case and filed a consolidated complaint in the United States District Court for the District of Maryland. In September 2019, the district court granted Actelion's motion to dismiss the complaint. In April 2024, the Fourth Circuit reversed the decision of the district court. Plaintiff's motion for class certification and Actelion's motion for summary judgment currently are pending before the district court.
In June 2022, Janssen Pharmaceuticals, Inc. filed a Demand for Arbitration against Emergent Biosolutions Inc. et al (EBSI) with the American Arbitration Association, alleging that EBSI breached the parties’ Manufacturing Services Agreement for the Company’s COVID-19 vaccine. In July 2022, Emergent filed its answering statement and counterclaims. The hearing is scheduled for MarchJuly 2024.
Note 12 — Restructuring
In October 2022, Janssen Pharmaceuticals, Inc. (Janssen) filedfiscal 2023, the Company completed a Demand for Arbitration against Merck Sharp & Dohme Corp. (Merck)prioritization of its research and development (R&D) investment within its Innovative Medicine segment to focus on the most promising medicines with the American Arbitration Association pursuantgreatest benefit to patients. This resulted in the Parties’ agreements relating to productionexit of drug substancecertain programs within certain therapeutic areas. The R&D program exits are primarily in infectious diseases and drug product forvaccines including the Company’s COVID-19 vaccine. Janssendiscontinuation of its respiratory syncytial virus (RSV) adult vaccine program, hepatitis and Merck settledHIV development. Pre-tax Restructuring expenses of $144 million in the matterfiscal first quarter of 2024, included the termination of partnered and non-partnered development program costs and asset impairments. The pre-tax restructuring charge of approximately $0.1 billion in May 2023.
Consumer Health
In November 2019,fiscal 2023, the Company receivedinitiated a demand for indemnification from Pfizer Inc. (Pfizer), pursuantrestructuring program of its Orthopaedics franchise within its MedTech segment to streamline operations by exiting certain markets, product lines and distribution network arrangements. The pre-tax restructuring expense of $27 million in the 2006 Stock and Asset Purchase Agreement between the Company and Pfizer. Also in November 2019, Johnson & Johnson Inc. received notice reserving rights to claim indemnification from Sanofi Consumer Health, Inc. (Sanofi), pursuant to the 2016 Asset Purchase Agreement between Johnson & Johnson Inc. and Sanofi. In January 2020, Johnson & Johnson received a demand for indemnification from Boehringer Ingelheim Pharmaceuticals, Inc. (Boehringer Ingelheim), pursuant to the 2006 Asset Purchase Agreement among the Company, Pfizer, and Boehringer Ingelheim. In November 2022, Johnson & Johnson received a demand for indemnification from GlaxoSmithKline LLC (GSK), pursuant to the 2006 Stock and Asset Purchase Agreement between the Company and Pfizer, and certain 1993, 1998, and 2002 agreements between Glaxo Wellcome and Warner-Lambert entities. The notices seek indemnification for legal claimsfiscal first quarter of 2024, primarily included costs related to over-the-counter ZANTAC (ranitidine) products. Plaintiffs inmarket and product exits. Total project costs of approximately $0.3 billion have been recorded since the underlying actions allege that ZANTAC and other over-the-counter ranitidine medications contain unsafe levels of NDMA (N-nitrosodimethylamine) and can cause and/or have caused various cancers in patients using the products, and seek injunctive and monetary relief.restructuring was announced. The Company and Johnson & Johnson Inc. have also been named in putative class actions filed in Canada with similar allegations regarding ZANTAC or ranitidine use. Johnson & Johnson Inc. was also named as a defendant along with other manufacturers in various personal injury actions in Canada related to ZANTAC products. Johnson & Johnson Inc. has provided Sanofi notice reserving rights to claim indemnification pursuant to the 2016 Asset Purchase Agreement related to the class actions and personal injury actions.
Beginning in May 2021, multiple putative class actions were filed in state and federal courts (California, Florida, New York, and New Jersey) against various Johnson & Johnson entities alleging violations of state consumer fraud statutes based on nondisclosure of alleged benzene contamination of certain Neutrogena and Aveeno sunscreen products and the affirmative promotion of those products as “safe”; and, in at least one case, alleging a strict liability manufacturing defect and failure to warn claims, asserting that the named plaintiffs suffered unspecified injuries as a result of alleged exposure to benzene. The Judicial Panel on Multi-District Litigation has consolidated all pending actions, except one product liability case and one case pending in New Jersey state court, in the United States District Court for the Southern District of Florida, Fort Lauderdale Division. In October 2021, the Company reached an agreement in principle for the settlement of a nationwide class, encompassing the claimsestimated costs of the consolidated actions, subjecttotal program are between $0.7 billion - $0.8 billion and is expected to approvalbe completed by the Florida federal Court. Inend of fiscal year 2025.
The following table summarizes the restructuring expenses for 2024:
| | | | | | | | | | |
| (Pre-tax Dollars in Millions) | | Fiscal First Quarter Ended | | |
Innovative Medicine Segment(1) | | $144 | | |
MedTech Segment(2) | | 27 | | |
| Total Programs | | $171 | | |
(1)Included in Restructuring on the Consolidated Statement of Earnings
(2)Included $20 million in Restructuring and $7 million in Cost of products sold on the Consolidated Statement of Earnings
Restructuring reserves as of March 31, 2024 and December 2021, plaintiffs in the consolidated actions filed a motion for preliminary approval of a nationwide class settlement. The court issued an order granting final approval of the settlement in February 2023. A Notice of Appeal was filed in April 2023.
NOTE 12— KENVUE SEPARATION
During the fiscal six months of 2023 the financial statements and accompanying footnotes continue to reflect the Company's consolidation of Kenvue.
On May 8, 2023, Kenvue, completed an initial public offering (the IPO) of 198,734,444 shares of its common stock, par value $0.01 per share (the “Kenvue Common Stock”), including the underwriters’ full exercise of their option to purchase 25,921,884 shares to cover over-allotments, at an initial public offering price of $22.00 per share for net proceeds of $4.2 billion. Kenvue shares began trading on the New York Stock Exchange under the symbol “KVUE”. Additionally, on May 8, 2023, as partial consideration for the transferThe results of the Consumer Health business Kenvue paid $13.2 billion to Johnson & Johnson from the net proceeds of the initial public offering and debt financing transactions (approximately $7.7 billion of unsecured notes and $1.2 billion of commercial paper) in connection with the separation (See Note 4 to the Consolidated Financial Statements for additional details). The excess of the net proceeds from the IPO over the net book value of the Johnson & Johnson divested interest was $2.5 billion and was recorded in additional paid-in capital.
As of the closing of the IPO, Johnson & Johnson owns 1,716,160,000 shares of Kenvue Common Stock, or approximately 89.6% of the total outstanding shares of Kenvue Common Stock, and continues to consolidate the financial results of Kenvue. As of July 2, 2023, the non-controlling interest of $1.3 billion associated with Kenvue is(previously reported as a separate business segment) have been reflected in equity attributable to non-controlling interestsas discontinued operations in the Company’s consolidated balance sheet. Other (income) expense, net on the consolidated statementstatements of earnings for the fiscal second quarter and fiscal six months ended July 2, 2023, includes $37 million related to the 10.4% non-controlling interest in Kenvueas Net earnings from the time of the initial public offering on May 8, 2023 through the end of the fiscal second quarter.
Subsequent to the fiscal second quarter on July 24, 2023, the Company announced its intention to split-off at least 80.1% of the shares of Kenvue through an exchange offer. Through the planned exchange offer, Johnson & Johnson shareholders can exchange all, some or none of their shares of Johnson & Johnson Common Stock for shares of Kenvue Common Stock, subject to the terms of the offer. The exchange offer will permit Johnson & Johnson shareholders to exchange some, all or none of their shares of Johnson & Johnson Common Stock for shares of Kenvue Common Stock at a 7% discount, subject to an upper limit of 8.0549 shares of Kenvue Common Stock per share of Johnson & Johnson Common Stock tendered and accepted in the exchange offer. If the upper limit is not in effect, tendering shareholders are expected to receive approximately $107.53 of Kenvue Common Stock for every $100 of Johnson & Johnson Common Stock tendered. Once the exchange offer is consummated (including all related transactions), the Company will no longer be the majority shareholder of Kenvue, and Kenvue will be a separate and independent company. The shares of Johnson & Johnson Common Stock acquired by the Company in the exchange offer will be recorded as an acquisition of treasury stock at a cost equal to the market value of the shares of Johnson & Johnson Common Stock accepted in the exchange offer at its expiration. Any difference between the net book value of Kenvue attributable to Johnson & Johnson and the market value of the shares of Johnson & Johnson Common Stock acquired at that date will be recognized by the Company as a gain on disposal of discontinued operations, net of any direct and incremental expensestaxes through August 23, 2023, the date of the exchange offer on the disposaloffer. Prior periods have been recast to reflect this presentation.
Details of its Kenvue Common Stock. Upon completionNet Earnings from Discontinued Operations, net of taxes are as follows:
| | | | | | | | | | | | | | | | |
| | | | Fiscal First Quarter Ended | | |
| (Dollars in Millions) | | | | April 2, 2023 | | | | |
| Sales to customers | | | | $3,852 | | | | |
| Cost of products sold | | | | 1,708 | | | | |
| Gross profit | | | | 2,144 | | | | |
| Selling, marketing and administrative expenses | | | | 1,232 | | | | |
| Research and development expense | | | | 108 | | | | |
| Interest Income | | | | (37) | | | | |
| Interest expense, net of portion capitalized | | | | 3 | | | | |
| Other (income) expense, net | | | | 288 | | | | |
| | | | | | | | |
| | | | | | | | |
| Earnings from Discontinued Operations Before Provision for Taxes on Income | | | | 550 | | | | |
| Provision for taxes on income | | | | 127 | | | | |
| Net earnings from Discontinued Operations | | | | $423 | | | | |
The following table presents depreciation, amortization and capital expenditures of the exchange offer, and assuming the Company no longer has a controlling financial interest in Kenvue, Kenvue’s historical results will be shown in the Company's financial statements as discontinued operations and, in subsequent periods, the Company's financial statements will no longer reflect the assets, liabilities, results of operations or cash flows attributablerelated to Kenvue.Kenvue:
| | | | | | | | | | |
| | | Fiscal First Quarter Ended |
| (Dollars in Millions) | | | | April 2, 2023 |
| Depreciation and Amortization | | | | $153 |
| | | | |
| Capital expenditures | | | | $47 |
Item 2 — MANAGEMENT’S DISCUSSION AND ANALYSIS OF FINANCIAL CONDITION AND RESULTS OF OPERATIONSManagement’s discussion and analysis of financial condition and results of operations
RESULTS OF OPERATIONS
Sales to Customers
Analysis of Consolidated Sales
For the fiscal six monthsfirst quarter of 2023,2024, worldwide sales were $50.3$21.4 billion, a total increase of 6.0%2.3%, including anwhich included operational increasegrowth of 8.2%3.9% and a negative currency impact of 1.6% as compared to 20222023 fiscal six monthsfirst quarter sales of $47.4$20.9 billion. Currency fluctuations had a negative impact of 2.2% for the fiscal six months of 2023. In the fiscal six monthsfirst quarter of 2023,2024, the net impact of acquisitions and divestitures on worldwide operational sales growth was a positive 1.3%negative 0.1%.
Sales by U.S. companies were $26.0$11.6 billion in the fiscal six monthsfirst quarter of 2023,2024, which represented an increase of 10.0%7.8% as compared to the prior year. In the fiscal six monthsfirst quarter of 2023,2024, the net impact of acquisitions and divestitures on the U.S. operational sales growth was a positive 2.3%negative 0.1%. Sales by international companies were $24.3$9.8 billion, an increasea total decrease of 2.0%3.4%, includingwhich included an operational increasedecline of 6.5%,0.3% and a negative currency impact of 4.5% as compared to the fiscal six months sales of 2022.3.1%. In the fiscal six monthsfirst quarter of 2023,2024, acquisitions and divestitures had no impact on international operational sales. In the netfiscal first quarter of 2024, the impact of acquisitions and divestituresthe Covid-19 Vaccine sales decline on the international operational sales growth was a positive 0.3%.
In the fiscal six monthsfirst quarter of 2023,2024, sales by companies in Europe achieved growthexperienced a decline of 1.0%7.6%, which included an operational increasedecline of 3.0%7.7% and a negativepositive currency impact of 2.0%0.1%. In the fiscal first quarter of 2024, the impact of the Covid-19 Vaccine sales decline on the European region operational sales was a negative 13.7%. Sales by companies in the Western Hemisphere, excluding the U.S., achieved growth of 9.3%11.0%, which included anincluding operational increasegrowth of 16.1%,21.3% and a negative currency impact of 6.8%10.3%. Sales by companies in the Asia-Pacific, Africa region achievedexperienced a decline of 1.1%, which included operational growth of 0.9%, including an operational increase of 8.2% and5.0% offset by a negative currency impact of 7.3%6.1%.
Q1 2024
Sales by Geographic Region (in billions)
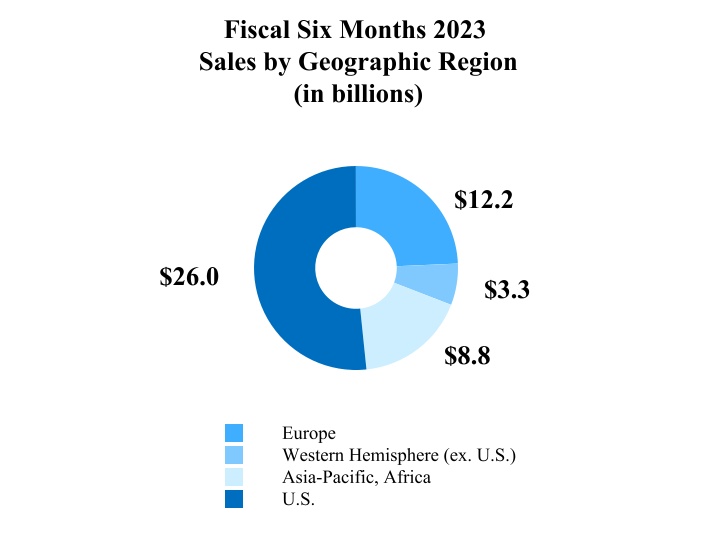
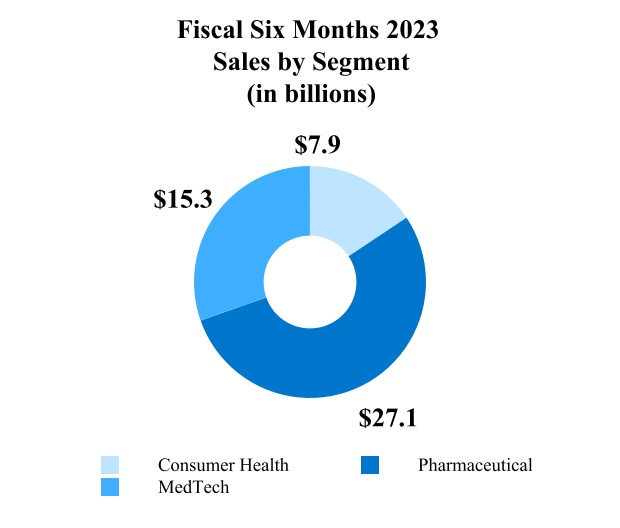
Q1 2024
Sales by Segment (in billions)
Note: values may have been rounded
For the fiscal second quarter of 2023, worldwide sales were $25.5 billion, a total increase of 6.3%, which included operational growth of 7.5% and a negative currency impact of 1.2% as compared to 2022 fiscal second quarter sales of $24.0 billion. In the fiscal second quarter of 2023, the net impact of acquisitions and divestitures on worldwide operational sales growth was a positive 1.3%.
Sales by U.S. companies were $13.4 billion in the fiscal second quarter of 2023, which represented an increase of 10.2% as compared to the prior year. In the fiscal second quarter of 2023, the net impact of acquisitions and divestitures on the U.S. operational sales growth was a positive 2.2%. Sales by international companies were $12.1 billion, a total increase of 2.2%, which included operational growth of 4.7% and a negative currency impact of 2.5%. In the fiscal second quarter of 2023, the net impact of acquisitions and divestitures on the international operational sales growth was a positive 0.3%.
In the fiscal second quarter of 2023, sales by companies in Europe experienced a decline of 3.1%, which included an operational decline of 3.9% and a positive currency impact of 0.8%. Sales by companies in the Western Hemisphere, excluding the U.S., achieved growth of 11.5%, including operational growth of 17.7% and a negative currency impact of 6.2%. Sales by companies in the Asia-Pacific, Africa region achieved growth of 6.6%, including operational growth of 12.5% and a negative currency impact of 5.9%.
Note: values may have been rounded
Analysis of Salessales by Business Segmentsbusiness segments
Consumer Health
Consumer HealthInnovative Medicine segment sales in the fiscal six monthsfirst quarter of 20232024 were $7.9$13.6 billion, an increase of 6.4% as compared to the same period a year ago, including operational growth of 9.5% and a negative currency impact of 3.1%. U.S. Consumer Health segment sales increased by 8.6%. International Consumer Health segment sales increased by 4.7%, including operational growth of 10.1% and a negative currency impact of 5.4%. In the fiscal six months of 2023, the net impact of acquisitions and divestitures on the Consumer Health segment operational sales growth was negligible.
Major Consumer Health Franchise Sales — Fiscal Six Months Ended
| | | | | | | | | | | | | | | | | | | | | | | | | | | | | | | | |
| | | | | | | | | | |
| (Dollars in Millions) | | July 2, 2023 | | July 3, 2022 | | Total
Change | | Operations
Change | | Currency
Change |
| OTC | | $ | 3,301 | | | $ | 2,943 | | | 12.2 | % | | 14.8 | % | | (2.6) | % |
| Skin Health/Beauty | | 2,258 | | | 2,138 | | | 5.6 | | | 8.0 | | | (2.4) | |
| Oral Care | | 759 | | | 760 | | | (0.2) | | | 2.4 | | | (2.6) | |
| Baby Care | | 719 | | | 730 | | | (1.6) | | | 3.1 | | | (4.7) | |
| Women’s Health | | 455 | | | 458 | | | (0.6) | | | 7.1 | | | (7.7) | |
| Wound Care/Other | | 371 | | | 361 | | | 2.6 | | | 4.9 | | | (2.3) | |
| Total Consumer Health Sales | | $ | 7,863 | | | $ | 7,391 | | | 6.4 | % | | 9.5 | % | | (3.1) | % |
Consumer Health segment sales in the fiscal second quarter of 2023 were $4.0 billion, an increase of 5.4% as compared to the same period a year ago, including operational growth of 7.7% and a negative currency impact of 2.3%. U.S. Consumer Health segment sales increased by 6.0%. International Consumer Health segment sales increased by 5.0% including operational growth of 9.0% and a negative currency impact of 4.0%. In the fiscal second quarter of 2023, the net impact of acquisitions and divestitures on the Consumer Health segment operational sales growth was negligible.
Major Consumer Health Franchise Sales — Fiscal Second Quarter Ended
| | | | | | | | | | | | | | | | | | | | | | | | | | | | | | | | |
| (Dollars in Millions) | | July 2, 2023 | | July 3, 2022 | | Total
Change | | Operations
Change | | Currency
Change |
| OTC | | $ | 1,659 | | | $ | 1,482 | | | 12.0 | % | | 13.9 | % | | (1.9) | % |
| Skin Health/Beauty | | 1,148 | | | 1,126 | | | 2.0 | | | 3.5 | | | (1.5) | |
| Oral Care | | 398 | | | 394 | | | 0.9 | | | 2.7 | | | (1.8) | |
| Baby Care | | 360 | | | 375 | | | (4.0) | | | (0.2) | | | (3.8) | |
| Women’s Health | | 238 | | | 230 | | | 3.4 | | | 10.0 | | | (6.6) | |
| Wound Care/Other | | 207 | | | 197 | | | 4.9 | | | 6.8 | | | (1.9) | |
| Total Consumer Health Sales | | $ | 4,011 | | | $ | 3,805 | | | 5.4 | % | | 7.7 | % | | (2.3) | % |
The OTC franchise achieved operational growth of 13.9% as compared to the prior year fiscal second quarter. The growth was driven by price actions and strong TYLENOL and MOTRIN performance due to increased global Cough/Cold/Flu incidences.
The Skin Health/Beauty franchise achieved operational growth of 3.5% as compared to the prior year fiscal second quarter. The growth was driven by price actions and strength in NEUTROGENA particularly in Sun Care, driven by innovation and supply repositioning.
The Oral Care franchise achieved operational growth of 2.7% as compared to the prior year fiscal second quarter. The growth was driven by price actions, partially offset by category deceleration in Asia and the negative impact from the suspension of personal care sales in Russia.
The Baby Care franchise experienced an operational decline of 0.2% as compared to the prior year fiscal second quarter. The decline was driven by competitive pressures in Asia and the negative impact from the suspension of personal care sales in Russia.
The Women’s Health franchise achieved operational growth of 10.0% as compared to the prior year fiscal second quarter primarily driven by price actions and continued strong growth in India partially offset by the negative impact from the suspension of personal care sales in Russia.
The Wound Care/Other franchise achieved operational growth of 6.8% as compared to the prior year fiscal second quarter primarily driven by price actions and innovation.
In November 2021, the Company announced its intention to separate the Company’s Consumer Health business (Kenvue, the New Consumer Health Company), with the intention to create a new, publicly traded company by the end of the fiscal year 2023, pending market conditions. On May 8, 2023, Kenvue completed an initial public offering (the IPO). As of the closing of the IPO, the Company owns approximately 89.6% of the total outstanding shares of Kenvue Common Stock, and has continued to consolidate the financial results of Kenvue (See Note 12 to the Consolidated Financial Statements for additional details).
Pharmaceutical
Pharmaceutical segment sales in the fiscal six months of 2023 were $27.1 billion, an increase of 3.7% as compared to the same period a year ago, with an operational increase of 5.5% and a negative currency impact of 1.8%. U.S. Pharmaceutical sales increased 7.6% as compared to the same period a year ago. International Pharmaceutical sales decreased by 0.7%, including operational growth of 3.1% offset by a negative currency impact of 3.8%. In the fiscal six months of 2023, the net impact of acquisitions and divestitures on the Pharmaceutical segment operational sales growth was a negative 0.1%.
Major Pharmaceutical Therapeutic Area Sales** — Fiscal Six Months Ended
| | | | | | | | | | | | | | | | | | | | | | | | | | | | | | | | |
| | | | | | | | | | |
| (Dollars in Millions) | | July 2, 2023 | | July 3, 2022 | | Total
Change | | Operations
Change | | Currency
Change |
| Immunology | | $ | 8,608 | | | $ | 8,530 | | | 0.9 | % | | 2.6 | % | | (1.7) | % |
| REMICADE | | 949 | | | 1,310 | | | (27.5) | | | (26.3) | | | (1.2) | |
| SIMPONI/ SIMPONI ARIA | | 1,066 | | | 1,137 | | | (6.2) | | | (3.3) | | | (2.9) | |
| STELARA | | 5,241 | | | 4,887 | | | 7.2 | | | 8.7 | | | (1.5) | |
| TREMFYA | | 1,346 | | | 1,187 | | | 13.4 | | | 15.0 | | | (1.6) | |
| Other Immunology | | 7 | | | 9 | | | (30.2) | | | (30.2) | | | — | |
| Infectious Diseases | | 2,707 | | | 2,613 | | | 3.6 | | | 4.7 | | | (1.1) | |
| COVID-19 VACCINE | | 1,032 | | | 1,001 | | | 3.0 | | 4.2 | | (1.2) |
| EDURANT/rilpivirine | | 546 | | | 473 | | | 15.6 | | | 17.1 | | | (1.5) | |
| PREZISTA/ PREZCOBIX/ REZOLSTA/ SYMTUZA | | 968 | | | 965 | | | 0.3 | | | 0.7 | | | (0.4) | |
| Other Infectious Diseases | | 161 | | | 174 | | | (7.6) | | | (3.6) | | | (4.0) | |
| Neuroscience | | 3,597 | | | 3,475 | | | 3.5 | | | 5.8 | | | (2.3) | |
| CONCERTA/methylphenidate | | 414 | | | 318 | | | 30.0 | | | 35.3 | | | (5.3) | |
| INVEGA SUSTENNA/ XEPLION/ INVEGA TRINZA/ TREVICTA | | 2,075 | | | 2,102 | | | (1.3) | | | 0.1 | | | (1.4) | |
| SPRAVATO | | 300 | | | 155 | | | 93.1 | | | 93.8 | | | (0.7) | |
Other Neuroscience(1) | | 809 | | | 900 | | | (10.1) | | | (6.4) | | | (3.7) | |
| Oncology | | 8,510 | | | 7,992 | | | 6.5 | | | 8.8 | | | (2.3) | |
| CARVYKTI | | 189 | | | 24 | | | * | | * | | * |
| DARZALEX | | 4,695 | | | 3,842 | | | 22.2 | | | 24.5 | | | (2.3) | |
| ERLEADA | | 1,109 | | | 850 | | 30.4 | | | 33.2 | | | (2.8) | |
| IMBRUVICA | | 1,668 | | | 2,008 | | | (16.9) | | | (15.0) | | | (1.9) | |
| ZYTIGA/ abiraterone acetate | | 472 | | | 1,044 | | | (54.8) | | | (52.3) | | | (2.5) | |
| Other Oncology | | 376 | | | 224 | | | 68.0 | | | 70.4 | | | (2.4) | |
| Pulmonary Hypertension | | 1,844 | | | 1,695 | | | 8.8 | | | 10.8 | | | (2.0) | |
| OPSUMIT | | 947 | | | 881 | | | 7.5 | | | 9.5 | | | (2.0) | |
| UPTRAVI | | 761 | | | 653 | | | 16.6 | | | 17.5 | | | (0.9) | |
| Other Pulmonary Hypertension | | 136 | | | 161 | | | (15.5) | | | (9.5) | | | (6.0) | |
| Cardiovascular / Metabolism / Other | | 1,877 | | | 1,882 | | | (0.3) | | | 0.4 | | | (0.7) | |
| XARELTO | | 1,215 | | | 1,117 | | | 8.8 | | | 8.8 | | | — | |
| | | | | | | | | | |
| | | | | | | | | | |
Other(2) | | 662 | | | 765 | | | (13.5) | | | (11.9) | | | (1.6) | |
| Total Pharmaceutical Sales | | $ | 27,144 | | | $ | 26,186 | | | 3.7 | % | | 5.5 | % | | (1.8) | % |
* Percentage greater than 100% or not meaningful
**Certain prior year amounts have been reclassified to conform to current year presentation
(1)Inclusive of RISPERDAL CONSTA which was previously disclosed separately
(2)Inclusive of INVOKANA which was previously disclosed separately
Pharmaceutical segment sales in the fiscal second quarter of 2023 were $13.7 billion, an increase of 3.1%1.1% as compared to the same period a year ago, including an operational increase of 3.8%2.5% and a negative currency impact of 0.7%1.4%. In the fiscal first quarter of 2024, the impact of the Covid-19 Vaccine sales decline on the Innovative Medicine segment operational sales was a negative 5.8%. U.S. PharmaceuticalInnovative Medicine sales increased 9.2%8.4% as compared to the same period a year ago. International PharmaceuticalInnovative Medicine sales decreased by 4.0%6.9%, including an operational decline of 2.5%4.0% and a negative currency impact of 1.5%2.9%. In the fiscal secondfirst quarter of 2023,2024, the net impact of the Covid-19 Vaccine sales decline on the international Innovative Medicine operational sales was a negative 12.3%. In the fiscal first quarter of 2024, acquisitions and divestitures had no impact on the PharmaceuticalInnovative Medicine segment operational sales growth was a negative 0.1%.
Major Pharmaceutical Therapeutic Area Sales**Innovative Medicine therapeutic area sales — Fiscal SecondFirst Quarter Ended
| | (Dollars in Millions) | (Dollars in Millions) | | July 2, 2023 | | July 3, 2022 | | Total
Change | | Operations
Change | | Currency
Change | (Dollars in Millions) | March 31, 2024 | | April 2, 2023 | | Total
Change | Operations
Change | Currency
Change |
| Immunology | Immunology | | $ | 4,496 | | | $ | 4,411 | | | 1.9 | % | | 2.6 | % | | (0.7) | % | Immunology | $4,247 | | $4,112 | | 3.3 | % | 4.6 | % | (1.3) | % |
| REMICADE | REMICADE | | 462 | | | 647 | | | (28.6) | | | (27.6) | | | (1.0) | |
| SIMPONI/ SIMPONI ARIA | SIMPONI/ SIMPONI ARIA | | 529 | | | 566 | | | (6.6) | | | (4.7) | | | (1.9) | |
| STELARA | STELARA | | 2,797 | | | 2,599 | | | 7.6 | | | 8.0 | | | (0.4) | |
| TREMFYA | TREMFYA | | 706 | | | 597 | | | 18.3 | | | 18.9 | | | (0.6) | |
| Other Immunology | Other Immunology | | 4 | | | 3 | | | 17.8 | | 17.8 | | — |
| Infectious Diseases | Infectious Diseases | | 1,121 | | | 1,316 | | | (14.8) | | | (16.6) | | | 1.8 | | Infectious Diseases | 821 | | 1,586 | | (48.3) | | (48.3) | (48.3) | | 0.0 | 0.0 |
| COVID-19 VACCINE | COVID-19 VACCINE | | 285 | | | 544 | | | (47.7) | | | (51.8) | | | 4.1 | |
| EDURANT/rilpivirine | EDURANT/rilpivirine | | 266 | | | 225 | | | 18.6 | | | 16.2 | | | 2.4 | |
PREZISTA/ PREZCOBIX/ REZOLSTA/ SYMTUZA | PREZISTA/ PREZCOBIX/ REZOLSTA/ SYMTUZA | | 491 | | | 464 | | | 5.8 | | | 5.6 | | | 0.2 | | PREZISTA/ PREZCOBIX/ REZOLSTA/ SYMTUZA | 418 | | 477 | | (12.3) | | (12.3) | (12.3) | | 0.0 | 0.0 |
| Other Infectious Diseases | Other Infectious Diseases | | 79 | | | 83 | | | (5.2) | | | 1.3 | | | (6.5) | |
| Neuroscience | Neuroscience | | 1,793 | | | 1,734 | | | 3.5 | | 5.5 | | | (2.0) | |
| CONCERTA/ methylphenidate | CONCERTA/ methylphenidate | | 208 | | | 161 | | | 28.6 | | | 32.4 | | | (3.8) | |
INVEGA SUSTENNA/ XEPLION/ INVEGA TRINZA/ TREVICTA | INVEGA SUSTENNA/ XEPLION/ INVEGA TRINZA/ TREVICTA | | 1,031 | | | 1,054 | | | (2.1) | | | (1.5) | | | (0.6) | |
| SPRAVATO | SPRAVATO | | 169 | | | 85 | | | 98.2 | | | 98.5 | | | (0.3) | |
Other Neuroscience(1) | | 386 | | | 433 | | | (10.9) | | | (5.8) | | | (5.1) | |
| Other Neuroscience | |
| Oncology | Oncology | | 4,398 | | | 4,042 | | | 8.8 | | | 9.7 | | | (0.9) | |
| CARVYKTI | CARVYKTI | | 117 | | | 24 | | | * | | * | | * | CARVYKTI | 157 | | 72 | | * | * |
| DARZALEX | DARZALEX | | 2,431 | | | 1,986 | | | 22.4 | | | 23.4 | | | (1.0) | |
| ERLEADA | ERLEADA | | 567 | | | 450 | | | 25.9 | | | 26.9 | | | (1.0) | |
| IMBRUVICA | IMBRUVICA | | 841 | | | 970 | | | (13.2) | | | (12.6) | | | (0.6) | |
TECVAYLI (1) | | TECVAYLI (1) | 133 | | 63 | | * | * |
| ZYTIGA/ abiraterone acetate | ZYTIGA/ abiraterone acetate | | 227 | | | 505 | | | (55.1) | | | (53.8) | | | (1.3) | |
| Other Oncology | Other Oncology | | 214 | | | 106 | | | * | | * | | * |
| Pulmonary Hypertension | Pulmonary Hypertension | | 972 | | | 843 | | | 15.3 | | | 16.5 | | | (1.2) | |
| OPSUMIT | OPSUMIT | | 507 | | | 438 | | | 15.7 | | | 16.7 | | | (1.0) | |
| UPTRAVI | UPTRAVI | | 399 | | | 328 | | | 21.8 | | | 22.5 | | | (0.7) | |
| Other Pulmonary Hypertension | Other Pulmonary Hypertension | | 66 | | | 78 | | | (14.7) | | | (9.7) | | | (5.0) | |
| Cardiovascular / Metabolism / Other | Cardiovascular / Metabolism / Other | | 950 | | | 972 | | | (2.2) | | | (2.0) | | | (0.2) | |
| XARELTO | XARELTO | | 637 | | | 609 | | | 4.7 | | | 4.7 | | | — | |
| Other(2) | | 313 | | | 363 | | | (13.8) | | | (13.4) | | | (0.4) | |
| Total Pharmaceutical Sales | | $ | 13,731 | | | $ | 13,317 | | | 3.1 | % | | 3.8 | % | | (0.7) | % |
| Other | |
| Other | |
| Other | |
| Total Innovative Medicine Sales | | Total Innovative Medicine Sales | $13,562 | | $13,413 | | 1.1 | % | 2.5 | % | (1.4) | % |
* Percentage greater than 100% or not meaningful
**Certain prior year amounts have been reclassified to conform to current year presentation(1) Inclusive of RISPERDAL CONSTA which was previously disclosed separately
(2)Inclusive of INVOKANA which was previously disclosed separately
(1)Previously in Other Oncology
Immunology products achieved operational growth of 2.6%4.6% as compared to the same period a year agoago. Sales of STELARA (ustekinumab) were driven by market growth of STELARA (ustekinumab) partially offset by unfavorable patient mix and rebates. Additionally, growth of TREMFYA(guselkumab) was due to share gains and market growthin Inflammatory Bowel Disease partially offset by unfavorable patient mix. Growth of TREMFYA (guselkumab) was due to market growth and share gains. Additionally, SIMPONI/SIMPONI ARIA growth was driven by growth outside the U.S. Lower sales of REMICADE(infliximab) were due to biosimilar competition.
Biosimilar versions of REMICADE have been introduced in the United States and certain markets outside the United States and additional competitors continue to enter the market. Continued infliximab biosimilar competition will result in a further reduction in sales of REMICADE.
The latest expiring United States composition of matter patent for STELARA (ustekinumab) expires in September 2023. STELARA (ustekinumab) U.S. sales in fiscal 2022 were approximately $6.4 billion. Third parties have filed abbreviated Biologics License Applications with the FDA seeking approval to market biosimilar versions of STELARA. In May 2023, the Company settled litigation with Amgen under the Biosimilar Price Competition and Innovation Act of 2009. As a result of the settlement and other agreements with separate third parties, the Company does not anticipate the launch of a biosimilar version of STELARA until January 1, 2025.
Infectious disease products experienced an operational decline of 16.6%48.3% as compared to the same period a year ago primarily driven by a decline in COVID-19 vaccine revenue.
Neuroscience products achieved operational sales growth of 5.5%2.2% as compared to the same period a year ago. The growth of SPRAVATO (esketamine) was driven by ongoing launches in the U.S.increased physician and Europe.patient demand. Growth was partially offset by declines from the paliperidone long-acting injectables, due to the XEPLION loss of exclusivity in the European Union.
RISPERDAL CONSTA.
Oncology products achieved operational sales growth of 9.7%18.8% as compared to the same period a year ago. Strong sales of DARZALEX (daratumumab) were driven by continued share gains in all regions and continued market growth.regions. Growth of ERLEADA (apalutamide) was due to continued strong share gains and market growth, and increased penetration from new launches. Salesgrowth. Increased sales of CARVYKTI (ciltacabtagene autoleucel) were driven by continued market share gains, from the ongoing launch.capacity expansion and manufacturing efficiencies. Additionally, sales from the ongoing launch of TECVAYLI (teclistamab-cqyv), included and the launch of TALVEY (talquetamab) and RYBREVANT (amivantamab) in Other Oncology contributed to the growth. Growth was partially offset by ZYTIGA (abiraterone acetate) due to loss of exclusivity and IMBRUVICA (ibrutinib) declines due to global competitive pressures.
Pulmonary Hypertension achieved operational sales growth of 16.5%22.4% as compared to the same period a year ago. Sales growth was due to favorable patient mix, market growth and share gains and market growth from UPTRAVI (selexipag) and OPSUMIT (macitentan) partially offset by declines in Other Pulmonary Hypertension.
Cardiovascular / Metabolism / Other products experienced an operational decline of 2.0%10.5% as compared to the same period a year ago. The growthdecline of XARELTO (rivaroxaban) sales was primarily driven by favorableunfavorable patient mix and market growth partially offset by share loss.
The Company maintains a policy that no end customer will be permitted direct delivery of product to a location other than the billing location. This policy impacts contract pharmacy transactions involving non-grantee 340B covered entities for most of the Company’s drugs, subject to multiple exceptions. Both grantee and non-grantee covered entities can maintain certain contract pharmacy arrangements under policy exceptions. The Company has been and will continue to offer 340B discounts to covered entities on all of its covered outpatient drugs, and it believes its policy will improve its ability to identify inappropriate duplicate discounts and diversion prohibited by the 340B statute. The 340B Drug Pricing Program is a U.S. federal government program requiring drug manufacturers to provide significant discounts on covered outpatient drugs to covered entities. This policy had discount implications which positively impacted sales to customers in fiscal 2023.
MedTech
The MedTech segment sales in the fiscal six monthsfirst quarter of 20232024 were $15.3$7.8 billion, an increase of 10.1%4.5% as compared to the same period a year ago, with anwhich included operational increasegrowth of 12.8%6.3% and a negative currency impact of 2.7%1.8%. U.S. MedTech sales increased 15.5%6.6%. International MedTech sales increased by 5.2%2.4%, including an operational increasegrowth of 10.3%6.1% and a negative currency impact of 5.1%3.7%. In the fiscal six monthsfirst quarter of 2023,2024, the net impact of acquisitions and divestitures on the MedTech segment operational sales growth was a positive 4.7% related to the Abiomed acquisition on December 22, 2022.
Major MedTech Franchise Sales**franchise sales — Fiscal Six MonthsFirst Quarter Ended
| | | (Dollars in Millions) | (Dollars in Millions) | | July 2, 2023 | | July 3, 2022 | | Total
Change | | Operations
Change | | Currency
Change | (Dollars in Millions) | March 31, 2024 | | April 2, 2023 | | Total
Change | Operations
Change | Currency
Change |
| Surgery | Surgery | | $ | 5,028 | | | $ | 4,884 | | | 3.0 | % | | 6.3 | % | | (3.3) | % | Surgery | $2,416 | | $2,434 | | (0.7) | % | 1.9 | % | (2.6) | % |
| Advanced | Advanced | | 2,340 | | | 2,302 | | | 1.7 | | | 5.0 | | | (3.3) | |
| General | General | | 2,688 | | | 2,582 | | | 4.1 | | | 7.4 | | | (3.3) | |
| Orthopaedics | Orthopaedics | | 4,510 | | | 4,345 | | | 3.8 | | | 5.4 | | | (1.6) | |
| Hips | Hips | | 787 | | | 777 | | | 1.3 | | | 2.8 | | | (1.5) | |
| Knees | Knees | | 731 | | | 688 | | | 6.3 | | | 7.9 | | | (1.6) | |
| Trauma | Trauma | | 1,496 | | | 1,444 | | | 3.6 | | | 4.9 | | | (1.3) | |
| Spine, Sports & Other | Spine, Sports & Other | | 1,495 | | | 1,436 | | | 4.2 | | | 6.1 | | | (1.9) | |
| Interventional Solutions | | 3,123 | | | 2,141 | | | 45.8 | | | 49.3 | | | (3.5) | |
Cardiovascular(1) | |
| Electrophysiology | Electrophysiology | | 2,288 | | | 1,970 | | | 16.2 | | | 19.5 | | | (3.3) | |
Abiomed | Abiomed | | 655 | | | — | | | * | | * | | * |
Other Interventional Solutions | | 180 | | | 171 | | | 5.1 | | | 9.5 | | | (4.4) | |
Other Cardiovascular(1) | |
| Vision | Vision | | 2,608 | | | 2,498 | | | 4.4 | | | 7.2 | | | (2.8) | |
| Contact Lenses/Other | Contact Lenses/Other | | 1,892 | | | 1,804 | | | 4.9 | | | 8.0 | | | (3.1) | |
| Surgical | Surgical | | 716 | | | 694 | | | 3.1 | | | 5.4 | | | (2.3) | |
| Total MedTech Sales | Total MedTech Sales | | $ | 15,269 | | | $ | 13,869 | | | 10.1 | % | | 12.8 | % | | (2.7) | % | Total MedTech Sales | $7,821 | | $7,481 | | 4.5 | % | 6.3 | % | (1.8) | % |
* Percentage greater than 100% or not meaningful
**Certain prior year amounts have been reclassified(1) Previously referred to conform to current year presentation
The MedTech segment sales in the fiscal second quarter of 2023 were $7.8 billion, an increase of 12.9% as compared to the same period a year ago, which included operational growth of 14.7% and a negative currency impact of 1.8%. U.S. MedTech sales increased 14.6%. International MedTech sales increased by 11.3%, including operational growth of 14.7% partially offset by a negative currency impact of 3.4%. In the fiscal second quarter of 2023, the net impact of acquisitions and divestitures on the MedTech segment operational sales growth was a positive 4.8%, related to the Abiomed acquisition.
Major MedTech Franchise Sales** — Fiscal Second Quarter Ended
| | | | | | | | | | | | | | | | | | | | | | | | | | | | | | | | |
| (Dollars in Millions) | | July 2, 2023 | | July 3, 2022 | | Total
Change | | Operations
Change | | Currency
Change |
| Surgery | | $ | 2,594 | | | $ | 2,450 | | | 5.9 | % | | 8.4 | % | | (2.5) | % |
| Advanced | | 1,222 | | | 1,156 | | | 5.8 | | | 8.4 | | | (2.6) | |
| General | | 1,372 | | | 1,294 | | | 6.0 | | | 8.4 | | | (2.4) | |
| Orthopaedics | | 2,265 | | | 2,157 | | | 5.0 | | | 5.7 | | | (0.7) | |
| Hips | | 397 | | | 388 | | | 2.2 | | | 3.0 | | | (0.8) | |
| Knees | | 363 | | | 349 | | | 3.9 | | | 4.5 | | | (0.6) | |
| Trauma | | 739 | | | 696 | | | 6.1 | | | 6.5 | | | (0.4) | |
| Spine, Sports & Other | | 766 | | | 724 | | | 5.8 | | | 7.0 | | | (1.2) | |
| Interventional Solutions | | 1,620 | | | 1,049 | | | 54.4 | | | 56.9 | | | (2.5) | |
| Electrophysiology | | 1,196 | | | 968 | | | 23.5 | | | 25.9 | | | (2.4) | |
Abiomed | | 331 | | | — | | | * | | * | | * |
Other Interventional Solutions | | 93 | | | 81 | | | 15.1 | | | 18.8 | | | (3.7) | |
| Vision | | 1,308 | | | 1,241 | | | 5.4 | | | 6.9 | | | (1.5) | |
| Contact Lenses/Other | | 939 | | | 894 | | | 5.1 | | | 6.6 | | | (1.5) | |
| Surgical | | 369 | | | 347 | | | 6.2 | | | 7.6 | | | (1.4) | |
| Total MedTech Sales | | $ | 7,788 | | | $ | 6,898 | | | 12.9 | % | | 14.7 | % | | (1.8) | % |
* Percentage greater than 100% or not meaningful
**Certain prior year amounts have been reclassified to conform to current year presentation
The Surgery franchise achieved operational sales growth of 8.4%1.9% as compared to the prior year fiscal secondfirst quarter. The operational growthdecline in Advanced Surgery was primarily driven by the following:competitive pressures and volume-based procurement impacts in Endocutters and Energy partially offset by Biosurgery global procedure growth, and strength of the portfolio; Endocutter procedure recovery outside the U.S.portfolio and commercial execution as well as uptake of recently launched products partially offset by volume-based procurement impacts in China, competitive pressures predominantly in the U.S. and supply challenges; and Energy products procedure recovery outside the U.S. and strength of new products partially offset by volume-based procurement impacts in ChinaEndocutters and supply challenges.Energy. The operational growth in General Surgery was primarily driven by procedure recovery outside the U.S.increased procedures coupled with technology penetration and benefits fromupgrades within the differentiated Wound Closure portfolio.
The Orthopaedics franchise achieved operational sales growth of 5.7%4.8% as compared to the prior year fiscal secondfirst quarter. The fiscal first quarter of 2024, includes a one-time revenue recognition timing change related to certain products across all Orthopaedic platforms in the U.S. which positively impacted the worldwide Orthopaedics franchise growth by approximately 3.0%. The operational growth in hipsHips reflects global procedure growth, and continued strength of the portfolio. This wasportfolio and the aforementioned revenue recognition timing change partially offset by supply challenges.Russia Sanctions and one less selling day. The operational growth in kneesKnees was primarily driven by global procedure recovery, benefits from launches inprocedures, continued strength of the ATTUNE portfolio, and pull through related to the VELYS Robotic assisted solution. This wassolution, the aforementioned revenue recognition timing change and timing of tenders outside the U.S. partially offset by supply constraints.one less selling day. The operational growth in Trauma was driven by procedure recoverythe aforementioned revenue recognition timing change and the continued adoption of recently launched products. This was partially offset by U.S. competitive challenges, one less selling day, weather-related softness in core trauma and volume-based procurement impacts in China.impacts. The operational growth in Spine, Sports & Other was primarily driven by procedure growth, positive uptake from new products and growth in VELYS Digital Solutions. This wasSolutions, Craniomaxillofacial, Shoulders, and the aforementioned revenue recognition timing change partially offset by volume-based procurement impacts in China and continuedSpine competitive pressures in Spine.
The Cardiovascular franchise (previously referred to as Interventional Solutions franchiseSolutions) achieved operational sales growth of 56.9%22.5% as compared to the prior year fiscal second quarter which includes sales from Abiomed acquired on December 22, 2022.first quarter. Electrophysiology grew by double digits due to global procedure growth, new product performanceuptake, commercial execution and commercial execution. This wasAsia Pacific distributor inventory dynamics partially offset by the impacts of volume-basedvolume-
based procurement in China.China and fewer selling days. Abiomed sales reflect the strength of all major commercialized regions anddriven by continued strong adoption of Impella 5.5 and Impella RP.
The Vision franchise achievedexperienced an operational sales growthdecline of 6.9%1.4% as compared to the prior year fiscal secondfirst quarter. The Contact Lenses/Other operational growthdecline was primarily driven by U.S. stocking dynamics, the impact of the Blink divestiture in the fiscal third quarter of 2023 and economic pressures in Asia Pacific partially offset by the continued strong performance in the ACUVUE OASYS 1-Day family of products (including recent launches) and commercial execution. This was partially offset by impacts from strategic portfolio decisions and supply challenges.price actions. The Surgical operational growth was primarily driven by cataract procedure growth andthe continued strength of recent innovations. This wasinnovations and commercial execution partially offset by softer Refractivepreparation for volume-based procurement implementation in China and premium IOL markets challenges.refractive softness in the U.S.
ANALYSIS OF CONSOLIDATED EARNINGS BEFORE PROVISION FOR TAXES ON INCOME
Consolidated earnings before provision for taxes on income for the fiscal six monthsfirst quarter of 20232024 was $6.0$3.7 billion representing 12.0%17.4% of sales as compared to $11.7a loss of $1.3 billion in the fiscal six months of 2022, representing 24.7% of sales. The decline was primarily related to the talc settlement proposal in the fiscal first quarter.
Consolidated earnings before provision for taxes on income for the fiscal second quarter of 2023, was $6.8 billion representing 26.5% of sales as compared to $5.8 billion in the fiscal second quarter of 2022, representing 24.3%(6.2)% of sales.
Cost of Products Soldproducts sold
(Dollars in billions. Percentages in chart are as a percent to total sales)
Fiscal six months Q2Q1 2024 versus Q1 2023 versus Fiscal six months Q2 2022
Cost of products sold increased as a percent to sales driven by:
•Commodity inflation and Abiomed amortization in the MedTech business
•Commodity inflation in the Consumer Health business
The intangible asset amortization expense included in cost of products sold for the fiscal six months of 2023 and 2022 was $2.4 billion and $2.2 billion, respectively.
Q2 2023 versus Q2 2022
Cost of products sold decreased as a percent to sales primarily driven by:
•Favorable mix and lowerLower one-time COVID-19 vaccine manufacturingsupply network related exit costs in 20232024 ($0 in 2024 versus $0.2 billion 2023) and favorable patient mix in the PharmaceuticalInnovative Medicine business
partially offset by
•Commodity inflationMacroeconomic factors and Abiomed amortizationunfavorable currency in the MedTech business
•Commodity inflation in the Consumer Health business
The intangible asset amortization expense included in cost of products sold for the fiscal secondfirst quarters of 2024 and 2023 and 2022 was $1.2 billion and $1.1 billion respectively.in both periods.
Selling, Marketingmarketing and Administrative Expensesadministrative expenses
(Dollars in billions. Percentages in chart are as a percent to total sales)
Fiscal six months Q2Q1 2024 versus Q1 2023 versus Fiscal six months Q2 2022
Selling, Marketing and Administrative Expenses decreased slightly as a percent to sales driven by:
•Leveraging in the Pharmaceutical and MedTech businesses
partially offset by
•An increase in Kenvue standalone start-up costs
Q2 2023 versus Q2 2022
Selling, Marketing and Administrative Expenses increased as a percent to sales primarily driven by:
•An increase in Kenvue standalone start-upTiming of brand marketing investment and administrative costs
partially offset by
•Leveraging in the PharmaceuticalInnovative Medicine business
Research and MedTech businessesdevelopment expense
| | | | | | | | | | | | | | | | | | | | | |
| | Q1 2024 | | Q1 2023 | | |
| (Dollars in Millions) | Amount | % of Sales* | | Amount | % of Sales* | | | | |
| Innovative Medicine | $2,896 | | 21.4 | % | | $2,778 | | 20.7 | % | | | | |
| MedTech | 646 | | 8.3 | | | 677 | | 9.1 | | | | | |
| Total research and development expense | $3,542 | | 16.6 | % | | $3,455 | | 16.6 | % | | | | |
| Percent increase/(decrease) over the prior year | 2.5 | % | | | | | | | | |
| *As a percent to segment sales | | | | | | | | | |
Research and Development Expense
(Dollars in billions. Percentages in chart are as a percent to total sales)
Fiscal six months Q2 2023 versus Fiscal six months Q2 2022
Research and Development decreasedwas flat as a percent to sales driven by:
•Cost management initiativesIncreased investments in the Innovative Medicine business
offset by
•Phasing of expenses in the MedTech business
•Portfolio prioritization in the Pharmaceutical business
partially offset by
•acquired in-processIn-process research &and development costs in the Pharmaceutical business
Q2 2023 versus Q2 2022
Research and Development decreased as a percent to sales driven by:
•Cost management initiatives in the MedTech business
•Portfolio prioritization in the Pharmaceutical business
partially offset by
•acquired in-process research & development costs in the Pharmaceutical business
In-Process Research and Development (IPR&D) Impairments
In the fiscal first quarter of 2023, the Company recorded a charge of approximately $0.1 billion associated with the IPR&D acquired with Pulsar Vascular in 2016. In the first fiscal six months of 2022, the Company recorded an intangible asset impairment charge of approximately $0.6 billion related to an in-process research and development asset, bermekimab (JnJ-77474462), an investigational drug for the treatment of Atopic Dermatitis (AD) and Hidradenitis Suppurativa (HS). The Company acquired all rights to bermekimab from XBiotech, Inc. in the fiscal year 2020.
Interest (Income) Expense
Interest income in the fiscal first fiscal six monthsquarter of 20232024 was $604$364 million as compared to $86 million in the same period a year ago primarily due to higher rates of interest earned on cash balances. Interest income in the fiscal second quarter of 2023 was $369 million as compared to $64$198 million in the fiscal secondfirst quarter of 20222023 primarily due to higher rates of interest earned on cash balances. Interest expense in the fiscal first fiscal six monthsquarter of 20232024 was $561$155 million as compared to $48$212 million in the same period a year ago primarily due to a higherlower average debt balance at higher interest rates. Interest expense in the fiscal second quarter of 2023 was $346 million as compared to $38 million in the same period a year ago primarily due to a higher debt balance at higher
interest rates.balance. The balance of cash, cash equivalents and current marketable securities was $28.5$26.2 billion at the end of the fiscal secondfirst quarter of 20232024 as compared to $32.6$32.3 billion (including $7.7 billion of restricted cash related to Kenvue) at the end of the fiscal secondfirst quarter of 2022.2023. The Company’s debt position was $45.6$33.6 billion as of July 2, 2023,March 31, 2024, as compared to $32.6$52.9 billion the same period a year ago.ago (including $7.7 billion related to Kenvue debt).
Other (Income) Expense, Net*(income) expense, net*
Fiscal six months Q2Q1 2024 versus Q1 2023 versus Fiscal six months Q2 2022
Other (income) expense, net for the fiscal six monthsfirst quarter of 2023 was unfavorable by $7.0 billion2024 reflected less expense as compared to the prior year primarily due to the following:
| | Fiscal Six Months | |
| Fiscal First Quarter | |
| (Dollars in Billions)(Income)/Expense | (Dollars in Billions)(Income)/Expense | | 2023 | | 2022 | | Change |
| (Dollars in Billions)(Income)/Expense | |
| (Dollars in Billions)(Income)/Expense | | | March 31, 2024 | | April 2, 2023 | | Change |
| | Acquisition, Integration and Divestiture related | |
| Acquisition, Integration and Divestiture related | |
| Acquisition, Integration and Divestiture related | | | $ | 0.1 | | | — | | 0.1 |
| Employee benefit plan related | | Employee benefit plan related | | (0.2) | | (0.4) | | 0.2 |
Litigation related(1) | Litigation related(1) | | $ | 6.8 | | | 0.4 | | | 6.4 | | Litigation related(1) | | 2.7 | | | 6.9 | | 6.9 | | (4.2) |
| | Consumer Health separation costs | | 0.5 | | | 0.4 | | | 0.1 | |
| COVID-19 Vaccine related exit costs | | 0.4 | | | 0.0 | | | 0.4 | |
| Changes in the fair value of securities | Changes in the fair value of securities | | 0.1 | | | 0.5 | | | (0.4) | | Changes in the fair value of securities | | — | | 0.1 | | (0.1) |
| Employee benefit plan related | | (0.7) | | | (0.6) | | | (0.1) | |
Other(2) | | 0.1 | | | (0.5) | | | 0.6 | |
| COVID-19 Vaccine manufacturing related exit costs | | COVID-19 Vaccine manufacturing related exit costs | | — | | 0.2 | | (0.2) |
| Other | | Other | | (0.2) | | 0.1 | | (0.3) |
| | Total Other (Income) Expense, Net | Total Other (Income) Expense, Net | | $ | 7.2 | | | 0.2 | | | 7.0 | |
| | Total Other (Income) Expense, Net | |
| | Total Other (Income) Expense, Net | | | $ | 2.4 | | | 6.9 | | (4.5) |
(1) Primarily related to the talc settlement proposal. The fiscal six monthsfirst quarters of 2024 and 2023 includes favorable intellectual property related litigation settlements of approximately $0.3 billion.
(2) Fiscal 2023 includes $37 million related to the 10.4% non-controlling interest in Kenvue from the time of the initial public offering on May 8, 2023 through the end of the fiscal second quarter
Q2 2023 versus Q2 2022
Other (income) expense, netinclude charges for the fiscal second quarter of 2023 was favorable by $0.3 billion as compared to the prior year primarily due to the following:
| | | | | | | | | | | | | | | | | | | | |
| Fiscal Second Quarter | | | | | | |
| (Dollars in Billions)(Income)/Expense | | 2023 | | 2022 | | Change |
| | | | | | |
| Consumer Health separation costs | | $ | 0.2 | | | 0.3 | | | (0.1) | |
| COVID-19 Vaccine related exit costs | | 0.2 | | | 0.0 | | | 0.2 | |
| Employee benefit plan related | | (0.4) | | | (0.3) | | | (0.1) | |
Litigation related(1) | | (0.1) | | | 0.4 | | | (0.5) | |
| Changes in the fair value of securities | | 0.0 | | 0.1 | | | (0.1) | |
Other(2) | | 0.0 | | (0.2) | | | 0.2 | |
| | | | | | |
| | | | | | |
| Total Other (Income) Expense, Net | | $ | (0.1) | | | 0.3 | | | (0.4) | |
(1) The fiscal second quarter of 2023 includes favorable intellectual property related litigation settlements of approximately $0.3 billion.
(2) Fiscal 2023 includes $37 million related to the 10.4% non-controlling interest in Kenvue from the time of the initial public offering on May 8, 2023 through the end of the fiscal second quarter
*Other (income) expense, net is the account where the Company records gains and losses related to the sale and write-down of certain investments in equity securities held by Johnson & Johnson Innovation - JJDC, Inc. (JJDC), changes in the fair value of securities, gains and losses on divestitures, gains and losses on sale of assets, certain transactional currency gains and losses, acquisition-related costs, litigation accruals and settlements, investment (income)/loss related to employee benefit plans, as well as royalty income.
EARNINGS BEFORE PROVISION FOR TAXES BY SEGMENTEarnings before provision for taxes by segment
Income (loss) before tax by segment of business for the fiscal six monthsfirst quarters were as follows:
| | | | | | | | | | | | | | | | | | | | | | | | | | | | | | | | | | | | | | |
| | | Income Before Tax | | Segment Sales | | Percent of Segment Sales |
| (Dollars in Millions) | | July 2, 2023 | | July 3, 2022 | | July 2, 2023 | | July 3, 2022 | | July 2, 2023 | | July 3, 2022 |
| Consumer Health | | $ | 1,636 | | | $ | 1,470 | | | $ | 7,863 | | | $ | 7,391 | | | 20.8 | % | | 19.9 | % |
| Pharmaceutical | | 9,306 | | | 8,344 | | | 27,144 | | | 26,186 | | | 34.3 | | | 31.9 | |
| MedTech | | 3,144 | | | 2,618 | | | 15,269 | | | 13,869 | | | 20.6 | | | 18.9 | |
| Segment earnings before tax | | 14,086 | | | 12,432 | | | 50,276 | | | 47,446 | | | 28.0 | | | 26.2 | |
Less: Expenses not allocated to segments(1) | | 7,479 | | | 360 | | | | | | | | | |
| Less: Consumer Health separation costs | | 582 | | | 370 | | | | | | | | | |
| Worldwide income before tax | | $ | 6,025 | | | $ | 11,702 | | | $ | 50,276 | | | $ | 47,446 | | | 12.0 | % | | 24.7 | % |
| | | | | | | | | | | | | | | | | | | | | | | | | | | | | | | | | | | | | | |
| | Income Before Tax | | Segment Sales | | Percent of Segment Sales |
| (Dollars in Millions) | | March 31, 2024 | | April 2, 2023 | | March 31, 2024 | | April 2, 2023 | | March 31, 2024 | | April 2, 2023 |
| Innovative Medicine | | $4,969 | | $4,402 | | $13,562 | | $13,413 | | 36.6 | % | | 32.8 | % |
| MedTech | | 1,520 | | 1,409 | | 7,821 | | 7,481 | | 19.4 | | | 18.8 | |
| Segment earnings before tax | | 6,489 | | 5,811 | | 21,383 | | 20,894 | | 30.3 | | | 27.8 | |
Less: Expenses not allocated to segments(1) | | 2,775 | | 7,098 | | | | | | | | |
| Worldwide income (loss) before tax | | $3,714 | | $(1,287) | | $21,383 | | $20,894 | | 17.4 | % | | (6.2) | % |
(1)Amounts not allocated to segments include interest (income) expense, certain litigation expenses and general corporate (income) expense. The fiscal six monthsfirst quarters of 2024 and 2023 includes an approximately $7include charges for talc matters of $2.7 billion incremental charge primarily related to the talc settlement proposal.and $6.9 billion, respectively.
Consumer Health SegmentInnovative Medicine segment
The Consumer HealthInnovative Medicine segment income before tax as a percent of sales in the fiscal six monthsfirst quarter of 20232024 was 20.8%36.6% versus 19.9% for the same period a year ago. The increase in the income before tax as a percent of sales in the fiscal six months of 2023 as compared to the prior year was primarily driven by the following:
•Pricing actions
partially offset by
•Commodity inflation
•Increased Kenvue standalone start-up costs
Pharmaceutical Segment
The Pharmaceutical segment income before tax as a percent of sales in the fiscal six months of 2023 was 34.3% versus 31.9%32.8% for the same period a year ago. The increase in the income before tax as a percent of sales for the fiscal six monthsfirst quarter of 20232024 as compared to the prior year was primarily driven by the following:
•An IPR&D chargeOne-time COVID-19 Vaccine related exit costs of $0.6$0.4 billion in 2022 related to bermekimab (JnJ-77474462), an investigational drug for the treatment of AD and Hidradenitis Suppurativa (HS)2023
•Favorable changespatient mix in the fair valueCost of securities in 2023 of $0.4 billion as compared to 2022
•Leveraging in selling, marketing and administrative expenses
•Portfolio prioritizationproducts sold
partially offset by
•One-time COVID-19 Vaccine related exit costs of $0.6 billionAn increase in 2023 as compared to $0.3 billion in 2022brand marketing investment
•Restructuring charges of $0.3 billion in 2023Higher administrative costs
•Acquired in-processHigher investments in research &and development costs of $0.2 billion
MedTech Segmentsegment
The MedTech segment income before tax as a percent of sales in the fiscal six monthsfirst quarter of 20232024 was 20.6%19.4% versus 18.9%18.8% for the same period a year ago. The increase in the income before tax as a percent of sales for the fiscal six monthsfirst quarter of 20232024 as compared to the prior year was primarily driven by the following:
•Net favorable litigation matters of $0.2 billion in 2023 as compared to expense of $0.3 billion in 2022
•No Restructuring charges in 2023 versus $0.2 billion in 2022
•Leveraging in selling and marketing expenses
partially offset by
•Higher amortization expense of $0.3 billion in 2023 related to Abiomed
•An IPR&D charge in 2023 of approximately $0.1 billion related to the Pulsar Vascular acquisition in the fiscal year 2016
•Acquisition costs related to Abiomed of $0.1 billion
•Commodity inflation in 2023
Income before tax by segment of business for the fiscal second quarters were as follows:
| | | | | | | | | | | | | | | | | | | | | | | | | | | | | | | | | | | | | | |
| | | Income Before Tax | | Segment Sales | | Percent of Segment Sales |
| (Dollars in Millions) | | July 2, 2023 | | July 3, 2022 | | July 2, 2023 | | July 3, 2022 | | July 2, 2023 | | July 3, 2022 |
| Consumer Health | | $ | 860 | | | $ | 784 | | | $ | 4,011 | | | $ | 3,805 | | | 21.4 | % | | 20.6 | % |
| Pharmaceutical | | 4,862 | | | 4,420 | | | 13,731 | | | 13,317 | | | 35.4 | | | 33.2 | |
| MedTech | | 1,699 | | | 1,141 | | | 7,788 | | | 6,898 | | | 21.8 | | | 16.5 | |
| Segment earnings before tax | | 7,421 | | | 6,345 | | | 25,530 | | | 24,020 | | | 29.1 | | | 26.4 | |
Less: Expenses not allocated to segments(1) | | 377 | | | 237 | | | | | | | | | |
| Less: Consumer Health separation costs | | 282 | | | 268 | | | | | | | | | |
| Worldwide income before tax | | $ | 6,762 | | | $ | 5,840 | | | $ | 25,530 | | | $ | 24,020 | | | 26.5 | % | | 24.3 | % |
(1)Amounts not allocated to segments include interest (income)Research and development expense certain litigation expenses and general corporate (income) expense.
Consumer Health Segment
The Consumer Health segment income before tax as a percent of sales in the fiscal second quarter of 2023 was 21.4% versus 20.6% for the same period a year ago. The increase in the income before tax as a percent of sales in the fiscal second quarter of 2023 as compared to the prior year was primarily driven by the following:
•Pricing actions
•Supply chain efficienciesphasing
partially offset by
•Commodity inflationMacroeconomic factors and unfavorable currency in Cost of products sold
•Increased Kenvue standalone start-up costs
Pharmaceutical Segment
The Pharmaceutical segment income before tax as a percent of sales in the fiscal second quarter of 2023 was 35.4% versus 33.2% for the same period a year ago. The increase in the income before tax as a percent of sales for the fiscal second quarter as compared to the prior year was primarily driven by the following:
•Favorable litigation related items of $0.1 billion in 2023
•Favorable changes in the fair value of securities in 2023 of $0.1 billion as compared to 2022
•One-time COVID-19 Vaccine related exit costs of $0.2 billion in 2023 as compared to $0.3 billion in 2022
•Favorable mix
•Leveraging in selling, marketing and administrative expenses
•Portfolio prioritization
partially offset by
•Restructuring charges of $0.1 billion in 2023
•Acquired in-process research & development costs of $0.2 billion
MedTech Segment
The MedTech segment income before tax as a percent of sales in the fiscal second quarter of 2023 was 21.8% versus 16.5% for the same period a year ago. The increase in the income before tax as a percent of sales for the fiscal second quarter was primarily driven by the following:
•Net favorable litigation matters of $0.2 billion in 2023 as compared to expense of $0.3 billion in 2022
•No Restructuring charges in 2023 versus $0.1 billion in 2022
•Leveraging in selling, marketing and administrative expenses
partially offset by
•Higher amortization expense of $0.1 billion in 2023 related to Abiomed
•Commodity inflation in 2023
Restructuring
In the fiscal first and second quarters ofyear 2023, the Company completed a prioritization of its research and development (R&D) investment within the PharmaceuticalInnovative Medicine segment to focus on the most promising medicines with the greatest benefit to patients. This resulted in the exit of certain programs within therapeutic areas. The R&D program exits are primarily in infectious diseases and vaccines including the discontinuation of its respiratory syncytial virus (RSV) adult vaccine program, hepatitis and
HIV development. The pre-tax restructuring charge of approximately $0.1 billion and $0.3 billion in both the fiscal second quarterfirst quarters of 2024 and fiscal six months of 2023, respectively, includesincluded the termination of partnered and non-partnered program costs and asset impairments. The CompanyTotal project costs of approximately $0.6 billion have been recorded a pre-tax charge of $0.1 billion insince the restructuring was announced.
In the fiscal second quarter and $0.2 billion inyear 2023, the first fiscal six months of 2022, related toCompany initiated a restructuring program of its Global Supply Chain.Orthopaedics franchise within its MedTech segment to streamline operations by exiting certain markets, product lines and distribution network arrangements. The Global Supply Chain program was announced in the second quarterpre-tax restructuring expense of 2018 and was completed$27 million in the fiscal fourthfirst quarter of 2022.2024, of which $20 million was recorded in Restructuring and $7 million was recorded in Cost of products sold on the Consolidated Statement of Earnings, primarily included costs related to market and product exits. Total project costs of approximately $0.3 billion have been recorded since the restructuring was announced.
Provision for Taxestaxes on Income
The worldwide effective income tax rate for the first fiscal sixthree months of 2023 was 15.8%12.4% in 20232024 and 14.9%61.8% in 2022.
On December 15, 2022, the European Union (EU) Member States formally adopted the EU’s Pillar Two Directive, which generally provides for a minimum effective tax rate of 15%, as established by the Organization for Economic Co-operation and Development (OECD) Pillar Two Framework that was supported by over 130 countries worldwide. The EU’sSeveral EU and non-EU countries have enacted Pillar Two Directivelegislation with an initial effective dates aredate of January 1, 2024, and January 1, 2025, for differentwith other aspects of the directive. On July 17, 2023, the OECD published Administrative Guidance proposing certain safe harbor rules that effectively extend certainlaw effective dates to January 1, 2027. EU Member States will still need to adopt the OECD Administrative Guidance in their local Pillar Two legislation for such safe harbor rules to apply. A significant number of other countries are also considering implementing similar legislation.2025 or later. The Company is continuing to evaluate the potential impact on future periods of the Pillar Two Framework, pending legislative adoption by additional individual countries, including those within the European Union.
On July 21, 2023, the IRS issued Notice 2023-55 which provides guidance to taxpayers in determining whether a foreign tax is eligible for a U.S. foreign tax credit for tax years 2022 and 2023, specifically delaying until 2024 the application of unfavorable foreign tax credit regulationsestimating that were originally issued late last year. As aas result of this newlegislation the 2024 effective tax rate will increase by 1.5% (150 basis points) compared to fiscal 2023. Further legislation, guidance the Company has concludedand regulations that it is applicable to certain of its tax positions and therefore will record a tax benefit of approximately $0.5 billionmay be issued in the fiscal third quarter of 2023.
For discussionfurther details related to the 20232024 provision for taxes refer to Note 5 to the Consolidated Financial Statements.
LIQUIDITY AND CAPITAL RESOURCESAcquisitions
(net of cash acquired)
Proceeds from the disposal of assets/businesses, net
Dividends to shareholders
Cash Flows
Cash and cash equivalents were $21.2$25.5 billion at the end of the fiscal secondfirst quarter of 20232024 as compared with $14.1$21.9 billion at the end of fiscal year 2022.2023. The primary sources and uses of cash that contributed to the $7.1$3.6 billion increase were:
| | | | | | | | |
| (Dollars In Billions) | |
$21.9 | | 14.1 | Q4 20222023 Cash and cash equivalents balance |
7.43.7 | | | net cash generated from operating activities |
| (0.5) | | | net cash used by investing activities |
0.10.5 | | | net cash generated from financing activities |
0.1 (0.1) | | | roundingeffect of exchange rate changes on cash and cash equivalents |
| | |
| | |
| $ | 21.225.5 | | | Q2 2023Q1 2024 Cash and cash equivalents |
In addition, the Company had $7.3$0.7 billion in marketable securities at the end of the fiscal secondfirst quarter of 20232024 and $9.4$1.1 billion at the end of fiscal year 2022.2023.
Cash flow from operations of $7.4$3.7 billion was the result of:
| | | | | | | | |
| (Dollars In Billions) | |
| $ | 5.13.3 | | | Net earnings |
2.50.7 | | | non-cash expenses and other adjustments primarily for depreciation and amortization, stock-based compensation and asset write-downs partially offset by the deferred tax provision and net gain on sale of assets/businesses |
| |
(1.3)(0.6) | | | an increase in accounts receivable and inventories |
| |
(1.1)(2.9) | | | a decrease in accounts payable and accrued liabilities and other current and non-current liabilities |
(1.1)3.2 | | | an increasea decrease in other current and non-current assets |
| 3.4 | | an increase in other current and non-current liabilities
(0.1) | | Rounding |
| $ | 7.43.7 | | | Cash FlowNet cash flows from operations |
Cash flow used by investing activities of $0.5 billion was primarily from:
| | | | | | | | |
| (Dollars In Billions) | |
(2.0)(0.8) | | | additions to property, plant and equipment |
0.10.2 | | | proceeds from the disposal of assets/businesses, net |
| (1.8) | | | acquisitions, net of cash acquired |
2.20.3 | | | net sales of investments |
(0.8)1.6 | | | credit support agreements activity, net and other |
| | |
| | |
| $ | (0.5) | | | Net cash used by investing activities |
Cash flow from financing activities of $0.1$0.5 billion was primarily from:
| | | | | | | | |
| (Dollars In Billions) | |
| $ | (6.0)(2.9) | | | dividends to shareholders |
(3.9)(1.5) | | | repurchase of common stock |
(1.9)4.4 | | | net repayment ofproceeds from short and long term debt and other |
| | |
| | |
| | |
| 0.2 | | | proceeds from stock options exercised/employee withholding tax on stock awards, net |
7.70.2 | | | proceeds from Kenvue long term debt,credit support agreements activity, net of issuance cost |
| |
| |
4.20.1 | | | proceeds from Kenvue initial public offeringother and rounding |
| |
| $ | 0.10.5 | | | Net cash from financing activities |
The Company has access to substantial sources of funds at numerous banks worldwide. Inworldwide and has the ability to issue up to $20 billion in Commercial Paper. Furthermore, in September 2022,2023, the Company secured a new 364-day Credit Facility of $10 billion which expires(expiration on September 7, 2023. In November 2022, the Company secured an additional 364-day revolving Credit Facility of $10 billion,5, 2024) which has an expiration of November 21, 2023.may be used for general corporate purposes including to support our commercial paper borrowings. Interest charged on borrowings under the credit line agreement is based on either Secured Overnight Financing Rate (SOFR) Reference Rate or other applicable market rate as allowed plus applicable margins. Commitment fees under the agreement are not material.
In March 2023, Kenvue, priced an offering of senior unsecured notes (the Notes) in an aggregate principal amount of $7.75 billion (See Note 4 to the Consolidated Financial Statements for additional details). The Notes were initially fully and unconditionally guaranteed (the Guarantees) on a senior unsecured basis by the Company. The Guarantees terminated on April 5, 2023, upon completion of the Consumer Health Business transfer.
Further, in March 2023, Kenvue entered into a credit agreement providing for a five-year senior unsecured revolving credit facility (the Revolving Credit Facility) in an aggregate principal amount of $4.0 billion to be made available in U.S. dollars and Euros. The Revolving Credit Facility contains representations and warranties, covenants and events of default that are customary for this type of financing, including covenants restricting the incurrence of liens and the entry into certain merger transactions. In addition, Kenvue entered into a commercial paper program (the Commercial Paper Program) of up to $4.0
billion in aggregate principal amount of commercial paper under the Commercial Paper Program. The Commercial Paper Program contains representations and warranties, covenants and default that are customary for this type of financing.
On May 8, 2023, Kenvue completed an initial public offering (the IPO) of 198,734,444 shares of its common stock, par value $0.01 per share (the “Kenvue Common Stock”), including the underwriters’ full exercise of their option to purchase 25,921,884 shares to cover over-allotments, at an initial public offering price of $22.00 per share for net proceeds of $4.2 billion. Kenvue shares began trading on the New York Stock Exchange under the symbol “KVUE”. Additionally, on May 8,2023, as partial consideration for the transfer of the Consumer Health business, Kenvue paid $13.2 billion to Johnson & Johnson from the net proceeds of the initial public offering and debt financing transactions (approximately $7.7 billion of unsecured notes and $1.2 billion of commercial paper) in connection with the separation. The excess of the net proceeds from the IPO over the net book value of the Johnson & Johnson divested interest was 2.5 billion and was recorded in additional paid-in capital.
As of the closing of the IPO, Johnson & Johnson owns 1,716,160,000 shares of Kenvue Common Stock, or approximately 89.6% of the total outstanding shares of Kenvue Common Stock, and continues to consolidate the financial results of Kenvue. As of July 2, 2023, the non-controlling interest of $1.3 billion associated with Kenvue is reflected in equity attributable to non-controlling interests in the consolidated balance sheet. Other (income) expense, net on the consolidated statement of earnings for the fiscal second quarter and fiscal six months ended July 2, 2023, includes $37 million related to the 10.4% non-controlling interest in Kenvue from the time of the initial public offering on May 8, 2023 through the end of the fiscal second quarter.
Subsequent to the fiscal second quarter on July 24, 2023, the Company announced its intention to split-off at least 80.1% of the shares of Kenvue through an exchange offer. Through the planned exchange offer, Johnson & Johnson shareholders can exchange all, some or none of their shares of Johnson & Johnson Common Stock for shares of Kenvue Common Stock, subject to the terms of the offer. (See Note 12 to the Consolidated Financial Statements for additional details). The shares of Johnson & Johnson Common Stock acquired by the Company in the exchange offer will be recorded as an acquisition of treasury stock at a cost equal to the market value of the shares of Johnson & Johnson Common Stock accepted in the exchange offer at its expiration. Any difference between the net book value of Kenvue attributable to Johnson & Johnson and the market value of the shares of Johnson & Johnson Common Stock acquired at that date will be recognized by the Company as a gain on disposal of discontinued operations net of any direct and incremental expenses of the exchange offer on the disposal of its Kenvue Common Stock. Upon completion of the exchange offer, and assuming the Company no longer has a controlling financial interest in Kenvue, Kenvue’s historical results will be shown in the Company's financial statements as discontinued operations, and, in subsequent periods, the Company's financial statements will no longer reflect the assets, liabilities, results of operations or cash flows attributable to Kenvue.
As of July 2, 2023,March 31, 2024, the Company's cash, cash equivalents and marketable securities was approximately $28.5$26.2 billion and had approximately $45.6$33.6 billion of notes payable and long-term debt for a net debt position of $17.1$7.4 billion as compared to the prior year fiscal first quarter net neutral position.debt position of $20.6 billion (which included cash of $1.7 billion and debt of $7.7 billion related to Kenvue). The Company anticipates that operating cash flows, the ability to raise funds from external sources, borrowing capacity from existing committed credit facilities and access to the commercial paper markets will continue to provide sufficient resources to fund operating needs, including the Company’s remaining balance to be paid on the agreement to settle opioid litigation for approximately $2.2$2.1 billion and the establishment of the approximately $9$11.0 billion ($13.7 billion nominal) reserve (present value)remaining for the talc settlement proposal (See Note 11 to the Consolidated Financial Statements for additional details). In addition, the Company monitors the global capital markets on an ongoing basis and from time to time may raise capital when market conditions are favorable.
In the fiscal second quarter of 2023,Subsequent to March 31, 2024, the Company paid approximately $4.3$2.6 billion to the U.S. Treasury, including $1.5$2.0 billion related to the current installment due on foreign undistributed earnings as part of the TCJA charge (see Note 1 to the Consolidated Financial Statements in the Company’s Annual Report on Form 10-K for the fiscal year ended January 1,December 31, 2023), $1.4 billion in pre-payments to resolve certain items previously reserved for and under examination in its 2013 through 2016 U.S. IRS audit, and $1.4$0.6 billion primarily related to the normal estimated paymentspayment for the fiscal first six monthsquarter of fiscal 2023.
On September 14, 2022, the Company announced that its Board of Directors approved a share repurchase program, authorizing the Company to purchase up to $5.0 billion of the Company’s Common Stock. As of April 2, 2023, $5.0 billion has been repurchased and the repurchase program was completed.
Dividends
On April 18, 2023,January 2, 2024, the Board of Directors declared a regular cash dividend of $1.19 per share, payable on June 6, 2023,March 5, 2024, to shareholders of record as of May 23, 2023.
On July 20, 2023,April 16, 2024, the Board of Directors declared a regular cash dividend of $1.19$1.24 per share, payable on September 7, 2023,June 4, 2024, to shareholders of record as of August 28, 2023.May 21, 2024. The Company expects to continue the practice of paying regular quarterly cash dividends.
OTHER INFORMATION
New Accounting Pronouncements
Refer to Note 1 to the Consolidated Financial Statements for new accounting pronouncements.
Economic and Market Factorsmarket factors
In July 2023, Janssen Pharmaceuticals, Inc. (Janssen) filed litigation against the U.S. Department of Health and Human Services as well as the Centers for Medicare and Medicaid Services challenging the constitutionality of the Inflation Reduction Act’s (IRA) Medicare Drug Price Negotiation Program. The litigation requests a declaration that the IRA violates Janssen’s rights under the First Amendment and the Fifth Amendment to the Constitution and therefore that Janssen is not subject to the IRA’s mandatory pricing scheme. In April 2024, Janssen appealed the district court’s denial of its summary judgment motion to the Third Circuit.
Russia-Ukraine Warwar
Although the long-term implications of Russia’s invasion of Ukraine are difficult to predict at this time, the financial impact of the conflict in the fiscal secondfirst quarter and fiscal six months of 2023,2024, including accounts receivable or inventory reserves, was not material. As of both the fiscal secondfirst quarter ending July 2, 2023,March 31, 2024, and the 2022 fiscal year ending January 1, 2023, the business of the Company’s Ukraine subsidiaries represented less than 1% of the Company’s consolidated assets and revenues. As of both the fiscal second quarter ending July 2, 2023, and the 2022 fiscal year ending January 1,December 31, 2023, the business of the Company’s Russian subsidiaries represented less than 1% of theboth Company’s consolidated assets and represented 1% of revenues.
In early March of 2022, the Company took steps to suspend all advertising, enrollment in clinical trials, and any additional investment in Russia. Additionally, at the end of March 2022, the Company made the decision to suspend supply of personal care products in Russia. The Company continues to supply its other products asrelied upon by patients rely on many of the products for healthcare purposes.
Although the long-term implications of the conflict in the Middle East are difficult to predict at this time, the financial impact of the conflict in the fiscal first quarter of 2024, including accounts receivable or inventory reserves, was not material. As of the fiscal three months ending March 31, 2024, and the fiscal year ending December 31, 2023, the business of the Company’s Israel subsidiaries represented approximately 1% of the Company’s consolidated assets and represented less than 1% of revenues.
Other Macroeconomic Considerations
The Company operates in certain countries where the economic conditions continue to present significant challenges. The Company continues to monitor these situations and take appropriate actions. Inflation rates and currency exchange rates continue to have an effect on worldwide economies and, consequently, on the way the Company operates. The Company has accounted for operations in Venezuela, Argentina and Turkey (beginning in the fiscal second quarter of 2022) as highly inflationary, as the prior three-year cumulative inflation rate surpassed 100%. In the face of increasing costs, the Company strives to maintain its profit margins through cost reduction programs, productivity improvements and periodic price increases.
Governments around the world consider various proposals to make changes to tax laws, which may include increasing or decreasing existing statutory tax rates. In connection with various government initiatives, companies are required to disclose more information to tax authorities on operations around the world, which may lead to greater audit scrutiny of profits earned in other countries. A change in statutory tax rate in any country would result in the revaluation of the Company’s deferred tax assets and liabilities related to that particular jurisdiction in the period in which the new tax law is enacted. This change would result in an expense or benefit recorded to the Company’s Consolidated Statement of Earnings. The Company closely monitors these proposals as they arise in the countries where it operates. Changes to the statutory tax rate may occur at any time, and any related expense or benefit recorded may be material to the fiscal quarter and year in which the law change is enacted.
The Company faces various worldwide health care changes that may continue to result in pricing pressures that include health care cost containment and government legislation relating to sales, promotions and reimbursement of health care products.
Changes in the behavior and spending patterns of purchasers of healthcare products and services, including delaying medical procedures, rationing prescription medications, reducing the frequency of physician visits and foregoing healthcare insurance coverage, as a result of the current global economic downturn, may continue to impact the Company’s businesses.
The Company faces regular intellectual property challenges from third parties, including generic and biosimilar manufacturers, seeking to manufacture and market generic and biosimilar versions of key pharmaceutical products prior to the expiration of the applicable patents. These challengers file Abbreviated New Drug Applications or abbreviated Biologics License Applications with the FDA or otherwise challenged the coverage and/or validity of the Company’s patents. In the event the Company is not successful in defending the patent claims challenged in the resulting lawsuits, generic or biosimilar versions of the products at issue may be introduced to the market, resulting in the potential for substantial market share and revenue losses for those products, and which may result in a non-cash impairment charge in any associated intangible asset. There is also risk that one or more competitors could launch a generic or biosimilar version of the product at issue following regulatory approval even though one or more valid patents are in place.
Item 3 — QUANTITATIVE AND QUALITATIVE DISCLOSURES ABOUT MARKET RISK
There has been no material change in the Company’s assessment of its sensitivity to market risk since its presentation set forth in Item 7A, “Quantitative and Qualitative Disclosures About Market Risk,” in its Annual Report on Form 10-K for the fiscal year ended January 1,December 31, 2023.
Item 4 — CONTROLS AND PROCEDURES
Disclosure controls and procedures. At the end of the period covered by this report, the Company evaluated the effectiveness of the design and operation of its disclosure controls and procedures. The Company’s disclosure controls and procedures are designed to ensure that information required to be disclosed by the Company in the reports that it files or submits under the Securities Exchange Act is recorded, processed, summarized and reported, within the time periods specified in the SEC’s rules and forms. Disclosure controls and procedures include, without limitation, controls and procedures designed to ensure that information required to be disclosed by the Company in the reports that it files or submits under the Securities Exchange Act is accumulated and communicated to the Company’s management, including its principal executive and principal financial officers, or persons performing similar functions, as appropriate, to allow timely decisions regarding required disclosure. Joaquin Duato, Chief Executive Officer; Chairman, Executive Committee and Joseph J. Wolk, Executive Vice President, Chief Financial Officer, reviewed and participated in this evaluation. Based on this evaluation, Messrs. Duato and Wolk concluded that, as of the end of the period covered by this report, the Company’s disclosure controls and procedures were effective.
Internal control. During the period covered by this report, there were no changes in the Company’s internal control over financial reporting that have materially affected, or are reasonably likely to materially affect, the Company’s internal control over financial reporting. The Company continues to monitor and assess the effectiveness of the design and operation of its disclosure controls and procedures.
The Company is implementing a multi-year, enterprise-wide initiative to integrate, simplify and standardize processes and
systems for the human resources, information technology, procurement, supply chain and finance functions. These are
enhancements to support the growth of the Company’s financial shared service capabilities and standardize financial systems.
This initiative is not in response to any identified deficiency or weakness in the Company’s internal control over financial
reporting. In response to this initiative, the Company has and will continue to align and streamline the design and operation of
its financial control environment.
Part II — OTHER INFORMATION
Item 1 — LEGAL PROCEEDINGS
The information called for by this item is incorporated herein by reference to Note 11 included in Part I, Item 1, Financial Statements (unaudited) — Notes to Consolidated Financial Statements.
Item 2 — UNREGISTERED SALES OF EQUITY SECURITIES AND USE OF PROCEEDS
(c) Purchases of Equity Securities by the Issuer and Affiliated Purchasers.
On September 14, 2022, the Company announced that its Board of Directors approved a share repurchase program, authorizing the Company to purchase up to $5.0 billion of the Company's Common Stock. The repurchase program was completed during the fiscal first quarter of 2023.
The following table provides information with respect to Common Stock purchases by the Company during the fiscal secondfirst quarter of 2023.2024. Common stock purchases on the open market are made as part of a systematic plan to meet the needs of the Company's compensation programs. The repurchases below also include the stock-for-stock option exercises that settled in the fiscal secondfirst quarter.
| | | | | | | | | | | | | | | | | | | | | | | | | | |
| Fiscal Month Period | | Total Number of Shares Purchased(1) | | Avg. Price
Per Share | | Total Number of Shares Purchased as Part of Publicly Announced Plans or Programs (2) | | Maximum Number of Shares that May Yet Be Purchased Under the Plans or Programs |
| April 3, 2023 through April 30, 2023 | | 1,011,500 | | | 162.35 | | | — | | | — |
| May 1, 2023 through May 28, 2023 | | 383,500 | | | 161.73 | | | — | | | — |
| May 29, 2023 through July 2, 2023 | | 962,825 | | | 160.35 | | | — | | | — |
| Total | | 2,357,825 | | | 161.44 | | | — | | | — |
| | | | | | | | | | | | | | | | | | | | | | | | | | |
| Fiscal Month Period | | Total Number of Shares Purchased(1) | | Avg. Price
Per Share | | Total Number of Shares Purchased as Part of Publicly Announced Plans or Programs | | Maximum Number of Shares that May Yet Be Purchased Under the Plans or Programs |
| January 1, 2024 through January 28, 2024 | | — | | — | | — | | — |
| January 29, 2024 through February 25, 2024 | | 5,531,362 | | 156.78 | | — | | — |
| February 26, 2024 through March 31, 2024 | | 3,793,074 | | 160.35 | | — | | — |
| Total | | 9,324,436 | | 158.23 | | — | | — |
(1)During the fiscal secondfirst quarter of 2023,2024, the Company repurchased an aggregate of 2,357,8259,324,436 shares of Johnson & Johnson Common Stock in open-market transactions, all of which were purchased pursuant as part of a systematic plan to meet the needs of the Company’s compensation programs.
(2)
Item 5 — Other information
Securities trading plans of Directors and Executive OfficersAs. During the fiscal first quarter of April 2, 2023, an aggregate2024, none of 30,546,218 shares were purchased for a total of $5.0 billion since the inceptionour directors or officers (as defined in Rule 16a-1(f) of the repurchase program announced on September 14, 2022.
Item 6 — EXHIBITS
Exhibit 31.1 Certification of Chief Executive Officer under Rule 13a-14(a) of the Securities Exchange Act pursuant to Section 302 of the Sarbanes-Oxley Act of 2002 — Filed with this document.
Exhibit 31.2 Certification of Chief Financial Officer under Rule 13a-14(a) of the Securities Exchange Act pursuant to Section 302 of the Sarbanes-Oxley Act of 2002 — Filed with this document.
Exhibit 32.1 Certification of Chief Executive Officer pursuant to Section 906 of the Sarbanes-Oxley Act of 2002 — Furnished with this document.
Exhibit 32.2 Certification of Chief Financial Officer pursuant to Section 906 of the Sarbanes-Oxley Act of 2002 — Furnished with this document.
Exhibit 101:
| | | | | | | | |
| EX-101.INS | | Instance Document - the instance document does not appear in the Interactive Data File because its XBRL tags are embedded within the Inline XBRL document |
| EX-101.SCH | | Inline XBRL Taxonomy Extension Schema |
| EX-101.CAL | | Inline XBRL Taxonomy Extension Calculation Linkbase |
| EX-101.LAB | | Inline XBRL Taxonomy Extension Label Linkbase |
| EX-101.PRE | | Inline XBRL Taxonomy Extension Presentation Linkbase |
| EX-101.DEF | | Inline XBRL Taxonomy Extension Definition Document |
| | |
| Exhibit 104: | | Cover Page Interactive Data File––the cover page interactive data file does not appear in the Interactive Data File because its XBRL tags are embedded within the Inline XBRL document. |
| | |
SIGNATURES
Pursuant to the requirements of the Securities Exchange Act of 1934, the registrant has duly caused this report to be signed on its behalf by the undersigned thereunto duly authorized.
| | |
JOHNSON & JOHNSON
(Registrant) |
| |
Date: July 31, 2023 | By /s/ J. J. WOLK |
| J. J. WOLK |
| (Registrant) |
| | | | | |
| By | /s/ J. J. Wolk |
| J. J. Wolk, Executive Vice President, Chief Financial Officer (Principal Financial Officer) |
| | | | | |
| By | /s/ |
Date: July 31, 2023 | By /s/ R. J. DECKER Jr. |
| R. J. DECKERDecker Jr. |
| R. J. Decker Jr., | Controller (Principal Accounting Officer) |