UNITED STATES
SECURITIES AND EXCHANGE COMMISSION
WASHINGTON, D.C. 20549
FORM 10-Q
| |
| (X) | QUARTERLY REPORT PURSUANT TO SECTION 13 OR 15(d) OF THE SECURITIES EXCHANGE ACT OF 1934 |
For the quarterly period ended September 23, 2016March 31, 2017
OR
( ) TRANSITION REPORT PURSUANT TO SECTION 13 OR 15(d) OF THE SECURITIES EXCHANGE ACT OF 1934
For the transition period from __________ to __________
|
| | | | |
| Commission File Number 1-8022 |
|
| | | | | | | | | | |
| CSX CORPORATION |
| (Exact name of registrant as specified in its charter) |
| Virginia | | | | | | | | 62-1051971 | | |
| (State or other jurisdiction of incorporation or organization) | | | | | | | | (I.R.S. Employer Identification No.) | | |
| | | | | | | | | | | |
| 500 Water Street, 15th Floor, Jacksonville, FL | | | | | | 32202 | | (904) 359-3200 | | |
| (Address of principal executive offices) | | | | | | (Zip Code) | | (Telephone number, including area code) | | |
| | | | | | | | | | | |
| | | | | No Change | | | | | | |
| (Former name, former address and former fiscal year, if changed since last report.) |
Indicate by check mark whether the registrant (1) has filed all reports required to be filed by Section 13 or 15(d) of the Securities Exchange Act of 1934 during the preceding 12 months (or for such shorter period that the registrant was required to file such reports), and (2) has been subject to such filing requirements for the past 90 days.
Yes (X) No ( )
Indicate by check mark whether the registrant has submitted electronically and posted on its corporate Web site, if any, every Interactive Data File required to be submitted and posted pursuant to Rule 405 of Regulation S-T (§232.405 of this chapter) during the preceding 12 months (or for such shorter period that the registrant was required to submit and post such files).
Yes (X) No ( )
Indicate by check mark whether the registrant is a large accelerated filer, an accelerated filer, a non-accelerated filer, or a smaller reporting company. See the definitions of “large accelerated filer", "accelerated filer” and "smaller reporting company" in Rule 12b-2 of the Exchange Act. (check one)
|
| | |
| Large Accelerated Filer (X) | | Accelerated Filer ( ) |
| Non-accelerated Filer ( ) | | Smaller Reporting Company ( ) |
Indicate by a check mark whether the registrant is a shell company (as defined in Rule 12b-2 of the Exchange Act).
Yes ( ) No (X)
There were 936,661,112922,687,144 shares of common stock outstanding on September 23, 2016March 31, 2017 (the latest practicable date that is closest to the filing date).
|
| | |
| | CSX Q3 2016Q1 2017 Form 10-Q p.1
|
|
CSX CORPORATION
FORM 10-Q
FOR THE QUARTERLY PERIOD ENDED SEPTEMBER 23, 2016MARCH 31, 2017
INDEX
|
| | | |
| | | | Page |
| PART I. | FINANCIAL INFORMATION | | |
| Item 1. | | | |
| | | | |
| | Quarters Ended September 23,March 31, 2017 and March 25, 2016 and September 25, 2015 | | |
| | | | |
| | Quarters Ended September 23,March 31, 2017 and March 25, 2016 and September 25, 2015 | | |
| | | | |
| | At September 23, 2016March 31, 2017 (Unaudited) and December 25, 201530, 2016 | | |
| | | | |
| | NineThree Months Ended September 23,March 31, 2017 and March 25, 2016 and September 25, 2015
| | |
| | | | |
| | | | |
| | | | |
| Item 2. | | | |
| | | | |
| Item 3. | | | |
| | | | |
| Item 4. | | | |
| | | | |
| PART II. | OTHER INFORMATION | | |
| Item 1. | | | |
| | | | |
| Item 1A. | | | |
| | | | |
| Item 2. | | | |
| | | | |
| Item 3. | | | |
| | | | |
| Item 4. | | | |
| | | | |
| Item 5. | | | |
| | | | |
| Item 6. | | | |
| | | | |
| | | |
|
| | |
| | CSX Q3 2016Q1 2017 Form 10-Q p.2
|
|
CSX CORPORATION
PART I - FINANCIAL INFORMATION
ITEM 1. FINANCIAL STATEMENTS
CONSOLIDATED INCOME STATEMENTS (Unaudited)
(Dollars in millions, except per share amounts)
| | | | Third Quarters | | Nine Months | First Quarters |
| | 2016 | 2015 | | 2016 | 2015 | 2017 | 2016 |
| | | | | |
| Revenue | $ | 2,710 |
| $ | 2,939 |
| | $ | 8,032 |
| $ | 9,030 |
| $ | 2,869 |
| $ | 2,618 |
|
| Expense | | | | |
| Labor and Fringe | 762 |
| 787 |
| | 2,307 |
| 2,491 |
| 789 |
| 796 |
|
| Materials, Supplies and Other | 507 |
| 580 |
| | 1,576 |
| 1,766 |
| 567 |
| 550 |
|
| Fuel | 174 |
| 223 |
| | 496 |
| 756 |
| 218 |
| 150 |
|
| Depreciation | 321 |
| 302 |
| | 953 |
| 896 |
| 320 |
| 313 |
|
| Equipment and Other Rents | 105 |
| 114 |
| | 315 |
| 328 |
| 90 |
| 105 |
|
| Restructuring Charge (Note 1) | | 173 |
| — |
|
| Total Expense | 1,869 |
| 2,006 |
| | 5,647 |
| 6,237 |
| 2,157 |
| 1,914 |
|
| | | | | |
| Operating Income | 841 |
| 933 |
| | 2,385 |
| 2,793 |
| 712 |
| 704 |
|
| | | | | |
| Interest Expense | (139 | ) | (136 | ) | | (423 | ) | (404 | ) | (137 | ) | (143 | ) |
| Other Income - Net | 13 |
| 2 |
| | 28 |
| 8 |
| 7 |
| 7 |
|
| Earnings Before Income Taxes | 715 |
| 799 |
| | 1,990 |
| 2,397 |
| 582 |
| 568 |
|
| | | | | |
| Income Tax Expense | (260 | ) | (292 | ) | | (734 | ) | (895 | ) | (220 | ) | (212 | ) |
| Net Earnings | $ | 455 |
| $ | 507 |
| | $ | 1,256 |
| $ | 1,502 |
| $ | 362 |
| $ | 356 |
|
| | | | | |
| Per Common Share (Note 2) | | | | |
| Net Earnings Per Share, Basic | $ | 0.48 |
| $ | 0.52 |
| | $ | 1.32 |
| $ | 1.52 |
| $ | 0.39 |
| $ | 0.37 |
|
| Net Earnings Per Share, Assuming Dilution | $ | 0.48 |
| $ | 0.52 |
| | $ | 1.32 |
| $ | 1.52 |
| $ | 0.39 |
| $ | 0.37 |
|
| | | | | |
| | | | | |
Average Shares Outstanding (In millions) | 942 |
| 981 |
| | 952 |
| 986 |
| 927 |
| 962 |
|
Average Shares Outstanding, Assuming Dilution (In millions) | 943 |
| 982 |
| | 953 |
| 987 |
| 929 |
| 963 |
|
| | | | | |
| | | | | |
| Cash Dividends Paid Per Common Share | $ | 0.18 |
| $ | 0.18 |
| | $ | 0.54 |
| $ | 0.52 |
| $ | 0.18 |
| $ | 0.18 |
|
CONSOLIDATED COMPREHENSIVE INCOME STATEMENTS (Unaudited)
(Dollars in millions, except per share amounts)
|
| | | | | | | | | | | | | |
| | Third Quarters | | Nine Months |
| | 2016 | 2015 | | 2016 | 2015 |
| Total Comprehensive Earnings (Note 10) | $ | 465 |
| $ | 518 |
| | $ | 1,282 |
| $ | 1,523 |
|
|
| | | | | | |
| | First Quarters |
| | 2017 | 2016 |
| Total Comprehensive Earnings (Note 10) | $ | 368 |
| $ | 363 |
|
See accompanying notes to consolidated financial statements.
|
| | |
| | CSX Q3 2016Q1 2017 Form 10-Q p.3
|
|
CSX CORPORATION
ITEM 1. FINANCIAL STATEMENTS
CONSOLIDATED BALANCE SHEETS
| | | | (Unaudited) | | (Unaudited) | |
| | September 23,
2016 | December 25,
2015 | March 31,
2017 | December 30,
2016 |
ASSETS | | Current Assets: | | |
| Cash and Cash Equivalents | $ | 603 |
| $ | 628 |
| $ | 930 |
| $ | 603 |
|
| Short-term Investments | 152 |
| 810 |
| 287 |
| 417 |
|
| Accounts Receivable - Net (Note 1) | 925 |
| 982 |
| 943 |
| 938 |
|
| Materials and Supplies | 397 |
| 350 |
| 415 |
| 407 |
|
| Other Current Assets | 86 |
| 70 |
| 85 |
| 122 |
|
| Total Current Assets | 2,163 |
| 2,840 |
| 2,660 |
| 2,487 |
|
| | | |
| Properties | 42,720 |
| 41,574 |
| 43,399 |
| 43,227 |
|
| Accumulated Depreciation | (11,938 | ) | (11,400 | ) | (12,140 | ) | (12,077 | ) |
| Properties - Net | 30,782 |
| 30,174 |
| 31,259 |
| 31,150 |
|
| | | |
| Investment in Conrail | 830 |
| 803 |
| 847 |
| 840 |
|
| Affiliates and Other Companies | 603 |
| 591 |
| 622 |
| 619 |
|
| Other Long-term Assets | 303 |
| 337 |
| 324 |
| 318 |
|
| Total Assets | $ | 34,681 |
| $ | 34,745 |
| $ | 35,712 |
| $ | 35,414 |
|
| | | |
LIABILITIES AND SHAREHOLDERS' EQUITY | | Current Liabilities: | | |
| Accounts Payable | $ | 859 |
| $ | 764 |
| $ | 898 |
| $ | 806 |
|
| Labor and Fringe Benefits Payable | 450 |
| 490 |
| 445 |
| 545 |
|
| Casualty, Environmental and Other Reserves (Note 4) | 124 |
| 131 |
| 114 |
| 115 |
|
| Current Maturities of Long-term Debt (Note 7) | 631 |
| 20 |
| 331 |
| 331 |
|
| Income and Other Taxes Payable | 90 |
| 108 |
| 302 |
| 129 |
|
| Other Current Liabilities | 109 |
| 439 |
| 187 |
| 114 |
|
| Total Current Liabilities | 2,263 |
| 1,952 |
| 2,277 |
| 2,040 |
|
| | | |
| Casualty, Environmental and Other Reserves (Note 4) | 250 |
| 269 |
| 252 |
| 259 |
|
| Long-term Debt (Note 7) | 9,888 |
| 10,515 |
| 10,963 |
| 10,962 |
|
| Deferred Income Taxes - Net | 9,505 |
| 9,179 |
| 9,648 |
| 9,596 |
|
| Other Long-term Liabilities | 1,105 |
| 1,162 |
| 903 |
| 863 |
|
| Total Liabilities | 23,011 |
| 23,077 |
| 24,043 |
| 23,720 |
|
| | | |
| Shareholders' Equity: | | |
| Common Stock, $1 Par Value | 937 |
| 966 |
| 923 |
| 928 |
|
| Other Capital | 125 |
| 113 |
| 170 |
| 138 |
|
| Retained Earnings | 11,233 |
| 11,238 |
| 11,197 |
| 11,253 |
|
| Accumulated Other Comprehensive Loss (Note 10) | (639 | ) | (665 | ) | (634 | ) | (640 | ) |
| Noncontrolling Interest | 14 |
| 16 |
| 13 |
| 15 |
|
| Total Shareholders' Equity | 11,670 |
| 11,668 |
| 11,669 |
| 11,694 |
|
| Total Liabilities and Shareholders' Equity | $ | 34,681 |
| $ | 34,745 |
| $ | 35,712 |
| $ | 35,414 |
|
Certain prior year data has been reclassified to conform to the current presentation.
See accompanying notes to consolidated financial statements.
|
| | |
| | CSX Q3 2016Q1 2017 Form 10-Q p.4
|
|
CSX CORPORATION
ITEM 1. FINANCIAL STATEMENTS
CONSOLIDATED CASH FLOW STATEMENTS (Unaudited)
(Dollars in millions)
| | | | Nine Months | Three Months |
| | 2016 | 2015 | 2017 | 2016 |
| | | |
| OPERATING ACTIVITIES | | |
| Net Earnings | $ | 1,256 |
| $ | 1,502 |
| $ | 362 |
| $ | 356 |
|
| Adjustments to Reconcile Net Earnings to Net Cash Provided by Operating Activities: | | |
| Depreciation | 953 |
| 896 |
| 320 |
| 313 |
|
| Restructuring Charge | | 161 |
| — |
|
| Deferred Income Taxes | 312 |
| 82 |
| 59 |
| 80 |
|
| Gain on Property Dispositions | (4 | ) | (20 | ) | |
| Other Operating Activities | (47 | ) | 47 |
| 2 |
| (29 | ) |
| Changes in Operating Assets and Liabilities: | | |
| Accounts Receivable | 68 |
| 126 |
| (30 | ) | 57 |
|
| Other Current Assets | (58 | ) | (61 | ) | 33 |
| (30 | ) |
| Accounts Payable | 94 |
| 3 |
| 91 |
| 50 |
|
| Income and Other Taxes Payable | (25 | ) | 110 |
| 162 |
| 59 |
|
| Other Current Liabilities | (61 | ) | (173 | ) | (117 | ) | (102 | ) |
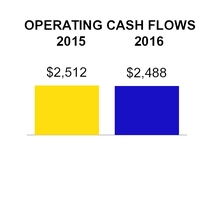
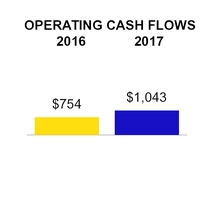
| Net Cash Provided by Operating Activities | 2,488 |
| 2,512 |
| 1,043 |
| 754 |
|
| | | |
| INVESTING ACTIVITIES | | |
| Property Additions | (1,590 | ) | (1,909 | ) | (441 | ) | (425 | ) |
| Purchase of Short-term Investments | (410 | ) | (1,170 | ) | (75 | ) | (235 | ) |
| Proceeds from Sales of Short-term Investments | 1,070 |
| 1,040 |
| 205 |
| 670 |
|
| Proceeds from Property Dispositions | 11 |
| 46 |
| |
| Other Investing Activities | 26 |
| 42 |
| 25 |
| 31 |
|
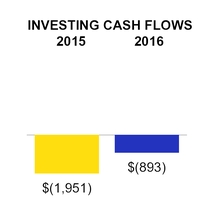
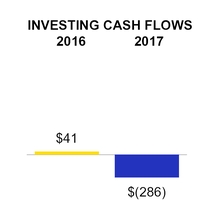
| Net Cash Used in Investing Activities | (893 | ) | (1,951 | ) | |
| Net Cash (Used in) Provided by Investing Activities | | (286 | ) | 41 |
|
| | | |
| FINANCING ACTIVITIES | | |
| Long-term Debt Issued (Note 7) | — |
| 600 |
| |
| Long-term Debt Repaid (Note 7) | (19 | ) | (228 | ) | |
| Dividends Paid | (513 | ) | (512 | ) | (166 | ) | (173 | ) |
| Shares Repurchased | (778 | ) | (546 | ) | (258 | ) | (249 | ) |
| Other Financing Activities | (310 | ) | (3 | ) | (6 | ) | (270 | ) |
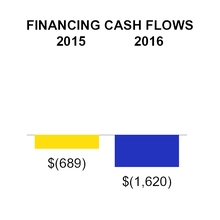
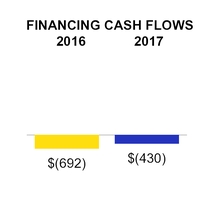
| Net Cash Used in Financing Activities | (1,620 | ) | (689 | ) | (430 | ) | (692 | ) |
| | | |
| Net Decrease in Cash and Cash Equivalents | (25 | ) | (128 | ) | |
| Net Increase in Cash and Cash Equivalents | | 327 |
| 103 |
|
| | | |
| CASH AND CASH EQUIVALENTS | | |
| Cash and Cash Equivalents at Beginning of Period | 628 |
| 669 |
| 603 |
| 628 |
|
| Cash and Cash Equivalents at End of Period | $ | 603 |
| $ | 541 |
| $ | 930 |
| $ | 731 |
|
| | | |
See accompanying notes to consolidated financial statements.
|
| | |
| | CSX Q3 2016Q1 2017 Form 10-Q p.5
|
|
CSX CORPORATION
NOTES TO CONSOLIDATED FINANCIAL STATEMENTS
(Unaudited)
| |
| NOTE 1. | Nature of Operations and Significant Accounting Policies |
Background
CSX Corporation (“CSX”), together with its subsidiaries (the “Company”), based in Jacksonville, Florida, is one of the nation's leading transportation companies. The Company provides rail-based transportation services including traditional rail service and the transport of intermodal containers and trailers.
CSX's principal operating subsidiary, CSX Transportation, Inc. (“CSXT”), provides an important link to the transportation supply chain through its approximately 21,000 route mile rail network, which serves major population centers in 23 states east of the Mississippi River, the District of Columbia and the Canadian provinces of Ontario and Quebec. The Company's intermodal business links customers to railroads via trucks and terminals.
Other entities
In addition to CSXT, the Company’s subsidiaries include CSX Intermodal Terminals, Inc. (“CSX Intermodal Terminals”), Total Distribution Services, Inc. (“TDSI”), Transflo Terminal Services, Inc. (“Transflo”), CSX Technology, Inc. (“CSX Technology”) and other subsidiaries. CSX Intermodal Terminals owns and operates a system of intermodal terminals, predominantly in the eastern United States and also performs drayage services (the pickup and delivery of intermodal shipments) for certain customers and trucking dispatch operations. TDSI serves the automotive industry with distribution centers and storage locations. Transflo connects non-rail served customers to the many benefits of rail by transferring products from rail to trucks. The biggest Transflo markets are chemicals and agriculture, which include shipments of plastics and ethanol. CSX Technology and other subsidiaries provide support services for the Company.
CSX’s other holdings include CSX Real Property, Inc. ("CSX Real Property"), a subsidiary responsible for the Company’s operating and non-operating real estate sales, leasing, acquisition and management and development activities. TheseAs substantially all of CSX Real Property's remaining activities are focused on supporting railroad operations, beginning in first quarter 2017, all results of these activities are included in operating income. Previously, these activities were classified in eitheras operating income or other income - net depending uponnon-operating based on the nature of the activity. Results of these activities fluctuate with the timing of real estate transactions.activity and were not material for any periods presented.
Basis of Presentation
In the opinion of management, the accompanying consolidated financial statements contain all normal, recurring adjustments necessary to fairly present the following:
Consolidated income statements for the ninethree months ended September 23, 2016March 31, 2017 and SeptemberMarch 25, 2015;2016;
Consolidated comprehensive income statements for the ninethree months ended September 23, 2016March 31, 2017 and SeptemberMarch 25, 2015;2016;
Consolidated balance sheets at September 23, 2016March 31, 2017 and December 25, 2015;30, 2016; and
Consolidated cash flow statements for the ninethree months ended September 23, 2016March 31, 2017 and SeptemberMarch 25, 2015.2016.
Pursuant to the rules and regulations of the Securities and Exchange Commission (“SEC”), certain information and disclosures normally included in the notes to the annual financial statements prepared in accordance with U.S. generally accepted accounting principles (“GAAP”) have been omitted from these interim financial statements. CSX suggests that these financial statements be read in conjunction with the audited financial statements and the notes included in CSX's most recent annual report on Form 10-K and any subsequently filed current reports on Form 8-K.
|
| | |
| | CSX Q3 2016Q1 2017 Form 10-Q p.6
|
|
CSX CORPORATION
NOTES TO CONSOLIDATED FINANCIAL STATEMENTS
(Unaudited)
NOTE 1. Nature of Operations and Significant Accounting Policies, continued
Fiscal Year
CSX follows a 52/52/53 week fiscal reporting calendar with the last day of each reporting period ending on a Friday:
The thirdfirst fiscal quarters of 20162017 and 20152016 consisted of 13 weeks ending on September 23,March 31, 2017 and March 25, 2016, and September 25, 2015, respectively.
Fiscal year 20162017 will consist of 52 weeks ending on December 29, 2017.
Fiscal year 2016 consisted of 53 weeks ending on December 30, 2016.
Fiscal year 2015 consisted of 52 weeks ending on December 25, 2015.
Except as otherwise specified, references to “thirdfirst quarter(s)” or “ninethree months” indicate CSX's fiscal periods ending September 23, 2016March 31, 2017 and SeptemberMarch 25, 20152016, and references to "year-end" indicate the fiscal year ended December 25, 201530, 2016.
Allowance for Doubtful Accounts
The Company maintains an allowance for doubtful accounts on uncollectible amounts related to freight receivables, government reimbursement receivables, claims for damages and other various receivables. The allowance is based upon the creditworthiness of customers, historical experience, the age of the receivable and current market and economic conditions. Uncollectible amounts are charged against the allowance account. Allowance for doubtful accounts of $29$23 million and $3733 million is included in the consolidated balance sheets as of the end of thirdfirst quarter 20162017 and December 25, 2015,30, 2016, respectively.
New Accounting Pronouncements
In March 2016,2017, the Financial Accounting Standards Board ("FASB") issued Accounting Standards Update ("ASU"), Improvements to Employee Share-based Payment AccountingImproving the Presentation of Net Periodic Pension Cost and Net Periodic Postretirement Benefit Cost, whichrequires excess tax benefits and deficiencies tothat only the service cost component of net periodic benefit costs be recorded as income tax expense or benefitcompensation cost in the operating expense section of the income statement rather than being recordedstatement. All other components of net periodic benefit cost (interest cost, expected return on plan assets and amortization of net loss) will be presented in additional paid-in capital.other income - net. This standard update is effective beginning with the first quarter 2018 and must be applied retrospectively. The Company adopted the provisions ofdoes not believe this rule during the second quarter of 2016 which did notstandard update will have a material effect on the Company'sits financial condition, results of operations or liquidity.
In November 2015,March 2017, the FASB issued ASU Balance Sheet ClassificationSimplifying the Test for Goodwill Impairment, which eliminates step two, the calculation of Deferred Taxes,the implied fair value of goodwill, from the goodwill impairment test. Impairment will be quantified in step one of the test as the amount by which requires that all deferred income taxesthe carrying amount exceeds the fair value. This standard update is effective beginning first quarter 2020 and must be classified as noncurrent in the balance sheet, rather than being separated into current and noncurrent amounts.applied prospectively. The Company adopted the provisions ofdoes not believe this rule during second quarter 2016 and applied them retrospectively. Current deferred income tax assets of $126 million as of December 25, 2015 have been reclassified and reported as a reduction of deferred income tax liabilities on the balance sheet. Adoption did notstandard will have a material effect on the Company'sits financial condition, results of operations or liquidity.
In May 2014, the FASB issued ASU Revenue from Contracts with Customers, which supersedes previous revenue recognition guidance. The new standard requires that a company recognize revenue when it transfers promised goods or services to customers in an amount that reflects the consideration the company expects to receive in exchange for those goods or services. Companies will need to use more judgment and estimates than under the guidance currently in effect, including estimating the amount of variable revenue to recognize over each identified performance obligation. Additional disclosures will be required to help users of financial statements understand the nature, amount and timing of revenue and cash flows arising from contracts. This standard update is effective for CSX beginning with the first quarter 2018 and can be adopted either retrospectively to each prior reporting period presented or as a cumulative effect adjustment as of the date of adoption.
|
| | |
| CSX Q1 2017 Form 10-Q p.7
|
|
CSX CORPORATION
NOTES TO CONSOLIDATED FINANCIAL STATEMENTS
(Unaudited)
NOTE 1. Nature of Operations and Significant Accounting Policies, continued
The FASB has recently issued several amendments to the revenue standard, including clarification
on accounting for principal versus agent considerations (i.e., reporting gross versus net), licenses of intellectual property and identifying performance obligations. These amendments do not change the core
principle of the standard, but provide clarity and implementation guidance.
The Company is currently finalizing its review of the impact of adopting this new guidance and developing a comprehensive implementation plan. In-depth reviews of a significant portion of commercial
contracts have been completed, additional contracts are presently being reviewed and changes to processes and internal controls have been identified to meet the standard’s reporting and disclosure requirements. At this time, the Company does not believe this standard update will have a material effect on its financial condition, results of operations or liquidity.
In February 2016, the FASB issued ASU, Leases, which will require lessees to recognize most leases
on their balance sheets as a right-of-use asset with a corresponding lease liability, and lessors to recognize a net lease investment. Additional qualitative and quantitative disclosures will also be required. This standard update is effective for fiscal yearsCSX beginning after December 15, 2018. Whilewith the first quarter 2019 and will be adopted using a modified retrospective method. Changes to processes and internal controls to meet the standard’s reporting and disclosure requirements have been identified and continue to be implemented. For example, software has been implemented that will assist in recognition of additional assets and liabilities to be included on the balance sheet related to operating leases with durations greater than twelve months, with certain allowable exceptions. The Company is still assessingcontinues to evaluate the expected financial impact of this standard CSX does not believe this standard will have a material effect on the Company's financial condition, results of operations or liquidity.update.
Other Items
Restructuring charge
In March 2017, the Company reduced its management workforce by 765 employees through an involuntary separation program with enhanced benefits. The majority of separation benefits will be paid from general corporate funds while certain benefits will be paid through CSX’s qualified pension plans. Cash expenditures, most of which will take place in second quarter 2017, will total approximately $90 million primarily related to one-time severance costs. Additionally, the terms of unvested equity awards for the outgoing CEO and President were modified prior to their retirements on March 6, 2017 to permit prorated vesting through May 31, 2018.
The restructuring charge includes costs related to the management workforce reduction, the proration of equity awards and other advisory costs related to the leadership transition. The majority of the costs for restructuring activities for these 765 employees were recognized in first quarter 2017 as shown in the table below. The Company expects to incur additional costs as reductions continue until the program is completed.
|
| | | | | | |
| | First Quarters |
| (Dollars in millions) | 2017 | 2016 |
| Severance and Pension | $ | 131 |
| $ | — |
|
| Other Post-retirement Benefits Curtailment | 13 |
| — |
|
| Employee Equity Awards Proration and Other | 11 |
| — |
|
| Subtotal Management Workforce Reduction | $ | 155 |
| — |
|
| Executive Equity Awards Proration | 8 |
| — |
|
| Advisory Fees Related to Shareholder Matters | 10 |
| — |
|
| Total Restructuring Charge | $ | 173 |
| — |
|
|
| | |
| | CSX Q3 2016Q1 2017 Form 10-Q p.7p.8
|
|
CSX CORPORATION
NOTES TO CONSOLIDATED FINANCIAL STATEMENTS
(Unaudited)
NOTE 2. Earnings Per Share
The following table sets forth the computation of basic earnings per share and earnings per share, assuming dilution:
| | | | Third Quarters | | Nine Months | First Quarters |
| | 2016 | 2015 | | 2016 | 2015 | 2017 | 2016 |
Numerator (Dollars in millions): | | | | |
| Net Earnings | $ | 455 |
| $ | 507 |
| | $ | 1,256 |
| $ | 1,502 |
| $ | 362 |
| $ | 356 |
|
| Dividend Equivalents on Restricted Stock | — |
| — |
| | (1 | ) | (1 | ) | |
| Net Earnings, Attributable to Common Shareholders | $ | 455 |
| 507 |
| | $ | 1,255 |
| 1,501 |
| |
| | | | | |
Denominator (Units in millions): | | | | |
| Average Common Shares Outstanding | 942 |
| 981 |
| | 952 |
| 986 |
| 927 |
| 962 |
|
| Other Potentially Dilutive Common Shares | 1 |
| 1 |
| | 1 |
| 1 |
| 2 |
| 1 |
|
Average Common Shares Outstanding, Assuming Dilution | 943 |
| 982 |
| | 953 |
| 987 |
| 929 |
| 963 |
|
| | | | | |
| Net Earnings Per Share, Basic | $ | 0.48 |
| $ | 0.52 |
| | $ | 1.32 |
| $ | 1.52 |
| $ | 0.39 |
| $ | 0.37 |
|
| Net Earnings Per Share, Assuming Dilution | $ | 0.48 |
| $ | 0.52 |
| | $ | 1.32 |
| $ | 1.52 |
| $ | 0.39 |
| $ | 0.37 |
|
Basic earnings per share is based on the weighted-average number of shares of common stock outstanding. Earnings per share, assuming dilution, is based on the weighted-average number of shares of common stock equivalents outstanding adjusted for the effects of common stock that may be issued as a result of potentially dilutive instruments. CSX's potentially dilutive instruments are made up of equity awards, which include long-term incentive awards, and employee stock options.
The Earnings Per Share Topic in the FASB's Accounting Standards Codification ("ASC")ASC requires CSX to include additional shares in the computation of earnings per share, assuming dilution. The additional shares included in diluted earnings per share represent the number of shares that would be issued if all of the above potentially dilutive instruments were converted into CSX common stock.
When calculating diluted earnings per share, this rule requires CSX to include the potential shares that would be outstanding if all outstanding stock options were exercised. This number is different from outstanding stock options, which is included in Note 3, Share-Based Compensation, because it is offset by shares CSX could repurchase using the proceeds from these hypothetical exercises to obtain the common stock equivalent. Approximately 2.4three millionand 3.8four million of total average outstanding stock options for the third quarterfirst quarters ended March 31, 2017 and nine months endedMarch 25, 2016, respectively, were excluded from the diluted earnings per share calculation because their effect was antidilutive. There were no stock options outstanding for third quarter 2015.
Dividend Increase and Share Repurchases
On April 20, 2017, the Company announced an 11 percent increase in the quarterly dividend to $0.20 per common share, payable on June 15, 2017 to shareholders of record at the close of business on May 31, 2017. Also, on April 20, 2017, the Company announced a new $1 billion share repurchase program, which is expected to be completed over the next 12 months.
During the first quartersof 2017 and 2016, the Company repurchased approximately $258 million, or six million shares, and $249 million, or ten million shares, respectively under the $2 billion share repurchase program announced in April 2015. As of April 5, 2017, the Company had completed all share repurchases under this program.
|
| | |
| | CSX Q3 2016Q1 2017 Form 10-Q p.8p.9
|
|
CSX CORPORATION
NOTES TO CONSOLIDATED FINANCIAL STATEMENTS
(Unaudited)
NOTE 2. Earnings Per Share, continued
Share Repurchases
In April 2015, the Company announced a new $2 billion share repurchase program, which is expected to be completed by April 2017. During the third quartersof 2016 and 2015, the Company repurchased approximately $263 million, or ten million shares, and $262 million, or nine million shares, respectively. During the nine months of 2016 and 2015, the Company repurchased $778 million, or 30 million shares, and $546 million, or 17 million shares, respectively. Shares are retired immediately upon repurchase. Management's assessment of market conditions and other factors guides the timing and volume of repurchases. Future share repurchases are expected to be funded by cash on hand, cash generated from operations and debt issuances. Shares are retired immediately upon repurchase. In accordance with the Equity Topicin the ASC, the excess of repurchase price over par value is recorded in retained earnings. Generally, retained earnings is only impacted by net earnings and dividends.
NOTE 3. Share-Based Compensation
Under CSX's share-based compensation plans, awards consist of performance units, restricted stock awards, restricted stock units and stock options for management and stock grants for directors. Awards granted under the various programs are determined and approved by the Compensation Committee of the Board of Directors or, in certain circumstances, by the Chief Executive Officer for awards to management employees other than senior executives. The Board of Directors approves awards granted to the Company's non-management directors upon recommendation of the Governance Committee.
In February 2016,Share-based compensation expense is measured using the Company grantedfair value of the award on the grant date and is recognized on a straight-line basis over the service period of the respective award. Total pre-tax expense associated with share-based compensation and its related income tax benefit is shown in the table below. The year over year increase in expense related to performance units, restricted stock units and stock options as partis primarily due to modifications to the terms of the Company's long-term share-based compensation plans.awards (see Equity Award Modificationsbelow) and higher expected award payouts.
|
| | | | | | |
| | First Quarters |
| (Dollars in millions) | 2017 | 2016 |
| | | |
| Share-Based Compensation Expense | | |
| Performance Units | $ | 20 |
| $ | 1 |
|
| Stock Options | 12 |
| 2 |
|
| Restricted Stock Units and Awards | 4 |
| 3 |
|
| Stock Awards for Directors | 2 |
| 2 |
|
| Total Share-Based Compensation Expense | $ | 38 |
| $ | 8 |
|
| Income Tax Benefit | 13 |
| 3 |
|
Long-term Incentive Plan
Approximately 839On February 22, 2017, the Company granted approximately 600 thousand performance units were granted to certain employees under a new long-term incentive plan ("2016-20182017-2019 LTIP"). The 2016-2018 LTIP, which was adopted under the CSX Stock and Incentive Award Plan. Payouts of performance units for the cycle ending with fiscal year 20182019 will be based on the achievement of goals related to both operating ratio and return on assets in each case excluding non-recurring items as disclosed in the Company's financial statements. The cumulative operating ratio and average return on assets over the plan period will each comprise 50% of the payout and will be measured independently of the other.
Grants were made in performance units, with each unit representing the right to receive one share of CSX common stock, and payouts will be made in CSX common stock. The payout range for participants will be between 0% and 200% of the target awards depending on Company performance against predetermined goals. Payouts for certain executive officers are subject to downward adjustment by up to 30% based upon total shareholder return relative to specified comparable groups.
Restricted Stock Units
The Company granted approximately 419 thousand restricted stock units. The restricted stock units vest three years after the date of grant. Participants receive cash dividend equivalents on the unvested shares during the restriction period. These awards are time-based and are not based upon attainment of performance goals.
|
| | |
| | CSX Q3 2016Q1 2017 Form 10-Q p.9p.10
|
|
CSX CORPORATION
NOTES TO CONSOLIDATED FINANCIAL STATEMENTS
(Unaudited)
NOTE 3. Share-Based Compensation, continued
Stock Options
TheAlso, on February 22, 2017, the Company granted approximately 2.41.3 million stock options.options along with the corresponding LTIP plan. The fair value of stock options on the date of grant was $4.68$12.54 per shareoption which was estimatedcalculated using the Black-Scholes valuation model. Stock options have been granted with ten-year terms and vest three years after the date of grant. The exercise price for stock options granted equals the closing market price of the underlying stock on the date of grant. These awards are time-based and are not based upon attainment of performance goals.
Restricted Stock Units
Finally, on February 22, 2017, the Company granted approximately 300 thousand restricted stock units along with the corresponding LTIP plan. The restricted stock units vest three years after the date of grant. Participants receive cash dividend equivalents on the unvested shares during the restriction period. These awards are time-based and are not based upon attainment of performance goals. For information related to the Company's other outstanding long-term incentive compensation, see CSX's most recent annual report on Form 10-K.
CEO Stock Option Award
On March 6, 2017, the Company granted 9 million stock options to the incoming CEO at a fair value of $12.88 per option calculated using the Black-Scholes valuation model. These options were granted with a ten-year term and an exercise price equal to the closing market price of the underlying stock on the date of grant. Half of the options, or 4.5 million, will vest on the CEO's service anniversary in equal annual installments over 4 years. The other half will vest based on achievement of performance targets related to both operating ratio and earnings before interest, taxes, depreciation and amortization adjusted for certain items.
Fair Value of All Stock Option Awards
The fair value of all stock option awards during the quarter, including those granted along with 2017-2019 LTIP and the CEO stock option award, was estimated at the grant date with the following weighted average assumptions:
|
| | | | | | |
| | First Quarters |
| | 2017 | 2016 |
| Weighted-average grant date fair value | $ | 12.83 |
| $ | 4.68 |
|
| | | |
| Stock options valuation assumptions: | | |
| Annual dividend yield | 1.5 | % | 3.0 | % |
| Risk-free interest rate | 2.2 | % | 1.4 | % |
| Annualized volatility | 27.1 | % | 27.3 | % |
| Expected life (in years) | 6.3 |
| 6.5 |
|
| | | |
| Other pricing model inputs: | | |
| Weighted-average grant-date market price of CSX stock (strike price) | $ | 49.61 |
| $ | 24.13 |
|
|
| | |
| CSX Q1 2017 Form 10-Q p.11
|
|
CSX CORPORATION
NOTES TO CONSOLIDATED FINANCIAL STATEMENTS
(Unaudited)
NOTE 3. Share-Based Compensation, continued
Equity Award Modifications
The terms of performance units, restricted stock units and stock options allgranted as part of the Company's long-term share-based compensation plans typically require participants to be employed through the final day of the respective performance or vesting period as applicable, except in the case of death, disability or retirement. For information relatedAs part of an enhanced severance benefit under the management streamlining and realignment initiative discussed in Note 1, unvested performance units, restricted stock units and stock options for separated employees not eligible for retirement were permitted to the Company's other outstanding long-term incentive compensation, see CSX's most recent annual reportvest on Form 10-K.a pro-rata basis.
Total pre-tax expense associated Additionally, the terms of unvested equity awards for the outgoing CEO and President were modified prior to their retirements on March 6, 2017 to permit prorated vesting through May 31, 2018. The terms were modified in exchange for each agreeing to serve in an advisory capacity upon request until May 31, 2017, and waiving various rights and claims, including the cancellation of their respective change of control agreements with allthe Company.
Together, these two award modifications impacted a total of 58 employees. The resulting increase to share-based compensation andexpense for revaluation of the related income tax benefit are as follows:
|
| | | | | | | | | | | | | |
| | Third Quarters | | Nine Months |
| (Dollars in millions) | 2016 | 2015 | | 2016 | 2015 |
| | | | | | |
| Share-Based Compensation Expense | $ | 9 |
| $ | 2 |
| | $ | 24 |
| $ | 20 |
|
| Income Tax Benefit | 3 |
| 1 |
| | 9 |
| 8 |
|
| |
| NOTE 4. | Casualty, Environmental and Other Reserves |
Casualty, environmental and other reserves are considered critical accounting estimates due to the need for significant management judgment. They are provided for in the consolidated balance sheets as shown in the table below:
| | | | September 23,
2016 | | December 25,
2015 | March 31,
2017 | | December 30,
2016 |
| (Dollars in millions) | Current | Long-term | Total | | Current | Long-term | Total | Current | Long-term | Total | | Current | Long-term | Total |
| | | | | | | |
| Casualty: | | | | | | |
| Personal Injury | $ | 57 |
| $ | 135 |
| $ | 192 |
| | $ | 57 |
| $ | 147 |
| $ | 204 |
| $ | 46 |
| $ | 122 |
| $ | 168 |
| | $ | 46 |
| $ | 124 |
| $ | 170 |
|
| Asbestos | 4 |
| 42 |
| 46 |
| | 9 |
| 44 |
| 53 |
| |
| Occupational | 4 |
| 5 |
| 9 |
| | 3 |
| 9 |
| 12 |
| |
Occupational(a) | | 7 |
| 51 |
| 58 |
| | 7 |
| 52 |
| 59 |
|
| Total Casualty | 65 |
| 182 |
| 247 |
| | 69 |
| 200 |
| 269 |
| 53 |
| 173 |
| 226 |
| | 53 |
| 176 |
| 229 |
|
| Environmental | 41 |
| 38 |
| 79 |
| | 42 |
| 40 |
| 82 |
| 42 |
| 51 |
| 93 |
| | 42 |
| 53 |
| 95 |
|
| Other | 18 |
| 30 |
| 48 |
| | 20 |
| 29 |
| 49 |
| 19 |
| 28 |
| 47 |
| | 20 |
| 30 |
| 50 |
|
| Total | $ | 124 |
| $ | 250 |
| $ | 374 |
| | $ | 131 |
| $ | 269 |
| $ | 400 |
| $ | 114 |
| $ | 252 |
| $ | 366 |
| | $ | 115 |
| $ | 259 |
| $ | 374 |
|
| |
(a) | Occupational reserves include asbestos-related diseases and occupational injuries. |
These liabilities are accrued when reasonably estimable and probable in accordance with the Contingencies Topic in the ASC. Actual settlements and claims received could differ, and final outcomes of these matters cannot be predicted with certainty. Considering the legal defenses currently available, the liabilities that have been recorded and other factors, it is the opinion of management that none of these items individually, when finally resolved, will have a material adverse effect on the Company's financial condition, results of operations or liquidity. Should a number of these items occur in the same period, however, theytheir combined effect could have abe material effect on the Company's financial condition, results of operations or liquidity in that particular period.
|
| | |
| | CSX Q3 2016Q1 2017 Form 10-Q p.10p.12
|
|
CSX CORPORATION
NOTES TO CONSOLIDATED FINANCIAL STATEMENTS
(Unaudited)
NOTE 4. Casualty, Environmental and Other Reserves, continued
Casualty
Casualty reserves of $247$226 million and $269$229 million as of September 23, 2016March 31, 2017 and December 25, 2015,30, 2016, respectively, represent accruals for personal injury, asbestosoccupational disease and occupational injury claims. The Company's self-insured retention amount for these claims is $50 million per occurrence. Currently, no individual claim is expected to exceed the self-insured retention amount. In accordance with the Contingencies Topic in the ASC, to the extent the value of an individual claim exceeds the self-insured retention amount, the Company would present the liability on a gross basis with a corresponding receivable for insurance recoveries. These reserves fluctuate based upon the timing of payments as well as changes in estimate. Actual results may vary from estimates due to the number, type and severity of the injury, costs of medical treatments and uncertainties in litigation. Most of the Company's casualty claims relate to CSXT unless otherwise noted below. Defense and processing costs, which historically have been insignificant and are anticipated to be insignificant in the future, are not included in the recorded liabilities.
Personal Injury
Personal injury reserves represent liabilities for employee work-related and third-party injuries. Work-related injuries for CSXT employees are primarily subject to the Federal Employers’ Liability Act (“FELA”). In addition to FELA liabilities, employees of other current or former CSX subsidiaries are covered by various state workers’ compensation laws, the Federal Longshore and Harbor Workers’ Compensation Program or the Maritime Jones Act.
CSXT retains an independent actuary to assist management in assessing the value of personal injury claims. An analysis is performed by the actuary quarterly and is reviewed by management. This analysis for the quarter resulted in an immaterial adjustment to the personal injury reserve. The methodology used by the actuary includes a development factor to reflect growth or reduction in the value of these personal injury claims. It is based largely on CSXT's historical claims and settlement experience.
Asbestos & Occupational
The Company is party to a numberOccupational reserves represent liabilities for occupational disease and injury claims. Occupational disease claims arise primarily from allegations of asbestos claims by employees alleging exposure to asbestos in the workplace. Occupational injury claims arise from allegations of exposure to certain other materials in the workplace, such as solvents, soaps, chemicals (collectively referred to as “irritants”) and diesel fuels (like exhaust fumes) or allegations of chronic physical injuries resulting from work conditions, such as repetitive stress injuries.
The greatest possible exposure to asbestos for employees resulted from work conducted in and around steam locomotive engines that were largely phased out beginning around the 1950s. Other types of exposures, however, including exposure from locomotive component parts and building materials, continued until these exposures were substantially eliminated by 1985. Diseases associated with asbestos typically have long latency periods (amount of time between exposure to asbestos and the onset of the disease) which can range from 10 to 40 years after exposure.
Management reviews asserted asbestos claims quarterly. Unasserted or incurred but not reported ("IBNR") asbestos claims are analyzed by a third-party specialist and reviewed by management annually.
CSXT’s historical claim filings, settlement amounts, and dismissal rates are analyzed to determine future anticipated claim filing rates and average settlement values for asbestos claims reserves. The potentially exposed population is estimated by using CSXT’s employment records and industry data. From this analysis, the specialist estimates the IBNR claims liabilities.
Occupational claims arise from allegations of exposure to certain materials in the workplace, such as solvents, soaps, chemicals (collectively referred to as “irritants”) and diesel fuels (like exhaust fumes) or allegations of chronic physical injuries resulting from work conditions, such as repetitive stress injuries, carpal tunnel syndrome and hearing loss.
|
| | |
| | CSX Q3 2016Q1 2017 Form 10-Q p.11p.13
|
|
CSX CORPORATION
NOTES TO CONSOLIDATED FINANCIAL STATEMENTS
(Unaudited)
NOTE 4. Casualty, Environmental and Other Reserves, continued
Environmental
Environmental reserves were $79$93 million and $82$95 million as of September 23, 2016March 31, 2017 and December 25, 2015,30, 2016, respectively. The Company is a party to various proceedings related to environmental issues, including administrative and judicial proceedings involving private parties and regulatory agencies. The Company has been identified as a potentially responsible party at approximately 225222 environmentally impaired sites. Many of these are, or may be, subject to remedial action under the federal Comprehensive Environmental Response, Compensation and Liability Act of 1980 ("CERCLA"), also known as the Superfund Law, or similar state statutes. Most of these proceedings arose from environmental conditions on properties used for ongoing or discontinued railroad operations. A number of these proceedings, however, are based on allegations that the Company, or its predecessors, sent hazardous substances to facilities owned or operated by others for treatment, recycling or disposal. In addition, some of the Company's land holdings were leased to others for commercial or industrial uses that may have resulted in releases of hazardous substances or other regulated materials onto the property and could give rise to proceedings against the Company.
In any such proceedings, the Company is subject to environmental clean-up and enforcement actions under the Superfund Law, as well as similar state laws that may impose joint and several liability for clean-up and enforcement costs on current and former owners and operators of a site without regard to fault or the legality of the original conduct. These costs could be substantial.
In accordance with the Asset Retirement and Environmental Obligations Topic in the ASC, the Company reviews its role with respect to each site identified at least quarterly, giving consideration to a number of factors such as:
type of clean-up required;
nature of the Company's alleged connection to the location (e.g., generator of waste sent to the site or owner or operator of the site);
extent of the Company's alleged connection (e.g., volume of waste sent to the location and other relevant factors); and
number, connection and financial viability of other named and unnamed potentially responsible parties at the location.
Based on the review process, the Company has recorded amounts to cover contingent anticipated future environmental remediation costs with respect to each site to the extent such costs are reasonably estimable and probable. The recorded liabilities for estimated future environmental costs are undiscounted. The liability includes future costs for remediation and restoration of sites as well as any significant ongoing monitoring costs, but excludes any anticipated insurance recoveries. Payments related to these liabilities are expected to be made over the next several years. Environmental remediation costs are included in materials, supplies and other on the consolidated income statement.
Currently, the Company does not possess sufficient information to reasonably estimate the amounts of additional liabilities, if any, on some sites until completion of future environmental studies. In addition, conditions that are currently unknown could, at any given location, result in additional exposure, the amount and materiality of which cannot presently be reasonably estimated. Based upon information currently available, however, the Company believes its environmental reserves accurately reflect the estimated cost of remedial actions currently required.
|
| | |
| | CSX Q3 2016Q1 2017 Form 10-Q p.12p.14
|
|
CSX CORPORATION
NOTES TO CONSOLIDATED FINANCIAL STATEMENTS
(Unaudited)
NOTE 4. Casualty, Environmental and Other Reserves, continued
Other
Other reserves of $48$47 million and $49$50 million as of September 23, 2016March 31, 2017 and December 25, 2015,30, 2016, respectively, include liabilities for various claims, such as property, automobile and general liability. Also included in other reserves are longshoremen disability claims related to a previously owned international shipping business (these claims are in runoff) as well as claims for current port employees.
NOTE 5. Commitments and Contingencies
Insurance
The Company maintains numerous insurance programs with substantial limits for property damage (which includes business interruption) and third-party liability. A certain amount of risk is retained by the Company on each of the property and liability programs. The Company has a $25 million retention per occurrence for the non-catastrophic property program (such as a derailment) and a $50 million retention per occurrence for the liability and catastrophic property programs (such as hurricanes and floods). While the Company believes its insurance coverage is adequate, future claims could exceed existing insurance coverage or insurance may not continue to be available at commercially reasonable rates.
Legal
The Company is involved in litigation incidental to its business and is a party to a number of legal actions and claims, various governmental proceedings and private civil lawsuits, including, but not limited to, those related to fuel surcharge practices, tax matters, environmental and hazardous material exposure matters, FELA and labor claims by current or former employees, other personal injury or property claims and disputes and complaints involving certain transportation rates and charges. Some of the legal proceedings include claims for compensatory as well as punitive damages and others are, or are purported to be, class actions. While the final outcome of these matters cannot be reasonably determined, considering, among other things, the legal defenses available and liabilities that have been recorded along with applicable insurance, it is currently the opinion of management that none of these pending items is likely to have a material adverse effect on the Company's financial condition, results of operations or liquidity. An unexpected adverse resolution of one or more of these items, however, could have a material adverse effect on the Company's financial condition, results of operations or liquidity in that particular period.
The Company is able to estimate a range of possible loss for certain legal proceedings for which a loss is reasonably possible in excess of reserves established. The Company has estimated this range to be $6 million to $115$129 million in aggregate at September 23, 2016.March 31, 2017. This estimated aggregate range is based upon currently available information and is subject to significant judgment and a variety of assumptions. Accordingly, the Company's estimate will change from time to time, and actual losses may vary significantly from the current estimate.
|
| | |
| CSX Q3 2016 Form 10-Q p.13
|
|
CSX CORPORATION
NOTES TO CONSOLIDATED FINANCIAL STATEMENTS
(Unaudited)
NOTE 5. Commitments and Contingencies, continued
Fuel Surcharge Antitrust Litigation
In May 2007, class action lawsuits were filed against CSXT and three other U.S.-based Class I railroads alleging that the defendants' fuel surcharge practices relating to contract and unregulated traffic resulted from an illegal conspiracy in violation of antitrust laws. In November 2007, the class action lawsuits were consolidated in federal court in the District of Columbia, where they are now pending. The suit seeks treble damages allegedly sustained by purported class members as well as attorneys' fees and other relief. Plaintiffs are expected to allege damages at least equal to the fuel surcharges at issue.
|
| | |
| CSX Q1 2017 Form 10-Q p.15
|
|
CSX CORPORATION
NOTES TO CONSOLIDATED FINANCIAL STATEMENTS
(Unaudited)
NOTE 5. Commitments and Contingencies, continued
In June 2012, the District Court certified the case as a class action. The decision was not a ruling on the merits of plaintiffs' claims, but rather a decision to allow the plaintiffs to seek to prove the case as a class. The defendant railroads petitioned the U.S. Court of Appeals for the D.C. Circuit for permission to appeal the District Court's class certification decision. In August 2013, the D.C. Circuit issued a decision vacating the class certification decision and remanded the case to the District Court to reconsider its class certification decision. The District Court remand proceedings are underway and the class certification hearing was held in September 2016. The District Court has delayed proceedings on the merits of the case pending the outcome of the class certification remand proceedings. The court has given no indication of timing on its ruling regarding class certification.
CSXT believes that its fuel surcharge practices were arrived at and applied lawfully and that the case is without merit. Accordingly, the Company intends to defend itself vigorously. However, penalties for violating antitrust laws can be severe, and resolution of this matter or an unexpected adverse decision on the merits could have a material adverse effect on the Company's financial condition, results of operations or liquidity in that particular period.
Environmental
CSXT is indemnifying Pharmacia LLC (formerly known as Monsanto Company) for certain liabilities associated with real estate located in Kearny, New Jersey along the Lower Passaic River (the “Property”). The Property, which was formerly owned by Pharmacia, is now owned by CSXT. CSXT's indemnification and defense duties arise with respect to several matters. The U.S. Environmental Protection Agency ("EPA"), using its CERCLA authority, seeks cleanup and removal costs and other damages associated with the presence of hazardous substances in the 17-mile Lower Passaic River Study Area (the "Study Area”). CSXT, on behalf of Pharmacia, and a significant number of other potentially responsible parties are together conducting a Remedial Investigation and Feasibility Study of the Study Area pursuant to an Administrative Settlement Agreement and Order on Consent with the EPA.
In March 2016, EPA issued its Record of Decision detailing the agency’s mandated remedial process for the lower 8 miles of the Study Area, which was based on a Focused Feasibility Study. EPA has estimated that it will take the potentially responsible parties approximately ten years to complete the work. At a later date, EPA will select a remedy for the remainder of the Study Area and is expected to again seek the participation of private parties to implement the selected remedy using EPA’s CERCLA authority to compel such participation, if necessary.
CSXT is also defending and indemnifying Pharmacia in a cooperative natural resource damages assessment process related to the Property. Based on currently available information, the Company does not believe any indemnification or remediation costs potentially allocable to CSXT with respect to the Property and the Study Area would be material to the Company's financial condition, results of operations or liquidity.
|
| | |
| | CSX Q3 2016Q1 2017 Form 10-Q p.14p.16
|
|
CSX CORPORATION
NOTES TO CONSOLIDATED FINANCIAL STATEMENTS
(Unaudited)
NOTE 6. Employee Benefit Plans
The Company sponsors defined benefit pension plans principally for salaried, management personnel. For employees hired prior to January 1, 2003, the plans provide eligible employees with retirement benefits based predominantly on years of service and compensation rates near retirement. For employees hired in 2003 or thereafter, benefits are determined based on a cash balance formula, which provides benefits by utilizing interest and pay credits based upon age, service and compensation.
In addition to these plans, the Company sponsors a post-retirement medical plan and a life insurance plan that provide certain benefits to full-time, salaried, management employees, hired prior to January 1, 2003, upon their retirement if certain eligibility requirements are met. Eligible retirees who are age 65 years or older (Medicare-eligible) are covered by a health reimbursement arrangement, which is an employer-funded account that can be used for reimbursement of eligible medical expenses. Eligible retirees younger than 65 years (non-Medicare eligible) are covered by a self-insured program partially funded by participating retirees. The life insurance plan is non-contributory.
As a result of the management streamlining and realignment program initiated in the first quarter 2017, the Company remeasured other post-retirement benefits as of March 1, 2017 (the remeasurement date) and recorded a curtailment loss of $13 million included in restructuring charge on the income statement. In connection with this remeasurement, the Company updated the effective discount rate assumption from 3.71% to 3.59%.
The Company engages independent actuaries to compute the amounts of liabilities and expenses relating to these plans subject to the assumptions that the Company determines are appropriate based on historical trends, current market rates and future projections. These amounts are reviewed by management. The following table describes the components of expense / (income) related to net benefit expense recorded in labor and fringe on the income statement.
| | | | Pension Benefits | Pension Benefits |
| (Dollars in millions) | Third Quarters | | Nine Months | First Quarters |
| | 2016 | 2015 | | 2016 | 2015 | 2017 | 2016 |
| Service Cost | $ | 12 |
| $ | 12 |
| | $ | 36 |
| $ | 34 |
| $ | 11 |
| $ | 12 |
|
| Interest Cost | 29 |
| 29 |
| | 89 |
| 87 |
| 23 |
| 30 |
|
| Expected Return on Plan Assets | (39 | ) | (41 | ) | | (118 | ) | (122 | ) | (42 | ) | (39 | ) |
| Amortization of Net Loss | 12 |
| 17 |
| | 36 |
| 52 |
| 11 |
| 12 |
|
| Net Periodic Benefit Cost | 14 |
| 17 |
| | 43 |
| 51 |
| 3 |
| 15 |
|
Special Termination Benefits – Workforce Reduction Program(a) | — |
| — |
| | — |
| 7 |
| |
Special Termination Benefits - Management Workforce Reduction(a) | | 50 |
| — |
|
| Total Expense | $ | 14 |
| $ | 17 |
| | $ | 43 |
| $ | 58 |
| $ | 53 |
| $ | 15 |
|
| | | | | |
| | Other Post-retirement Benefits | Other Post-retirement Benefits |
| (Dollars in millions) | Third Quarters | | Nine Months | First Quarters |
| | 2016 | 2015 | | 2016 | 2015 | 2017 | 2016 |
| Service Cost | $ | — |
| $ | 2 |
| | $ | 1 |
| $ | 3 |
| |
| Interest Cost | 3 |
| 3 |
| | 9 |
| 10 |
| $ | 2 |
| 3 |
|
| Amortization of Net Loss | 1 |
| 1 |
| | 2 |
| 3 |
| — |
| 1 |
|
| Amortization of Prior Service Costs | — |
| (1 | ) | | — |
| (1 | ) | |
| Net Periodic Benefit Cost | | 2 |
| 4 |
|
Special Termination Benefits - Management Workforce Reduction Curtailment(a) | | 13 |
| — |
|
| Total Expense | $ | 4 |
| $ | 5 |
| | $ | 12 |
| $ | 15 |
| $ | 15 |
| $ | 4 |
|
(a) Special termination benefits were charges in 2015the first quarter 2017 that resulted from athe management workforce reduction program initiated in 2014.reduction. For further information regarding the plan, see Note 1. Nature of Operations and Significant Accounting Policies.
|
| | |
| | CSX Q3 2016Q1 2017 Form 10-Q p.15p.17
|
|
CSX CORPORATION
NOTES TO CONSOLIDATED FINANCIAL STATEMENTS
(Unaudited)
NOTE 6. Employee Benefit Plans, continued
Qualified pension plan obligations are funded in accordance with regulatory requirements and with an objective of meeting or exceeding minimum funding requirements necessary to avoid restrictions on flexibility of plan operation and benefit payments. Although noNo contributions to the Company's qualified pension plans were required, CSX made a $30 million voluntary contribution during September 2016. The Company may make an additional voluntary contributionare expected in 2016.2017.
NOTE 7. Debt and Credit Agreements
Total activity related to long-term debt as of the end of thirdfirst quarter 20162017 is shown in the table below. For fair value information related to the Company's long-term debt, see Note 9, Fair Value Measurements.
|
| | | | | | | | | |
| (Dollars in millions) | Current Portion | Long-term Portion | Total |
Long-term debt as of December 2015 (a) | $ | 20 |
| $ | 10,515 |
| $ | 10,535 |
|
| 2016 activity: | | | |
| Long-term debt repaid | (19 | ) | — |
| (19 | ) |
| Reclassifications | 631 |
| (631 | ) | — |
|
| Discount, premium and other activity | (1 | ) | (2 | ) | (3 | ) |
| Debt issue cost activity | — |
| 6 |
| 6 |
|
| Long-term debt as of September 2016 | $ | 631 |
| $ | 9,888 |
| $ | 10,519 |
|
(a) Long-term debt as of December 2015 includes debt issue costs of $168 million that were reclassified from long-term assets to long-term debt on the consolidated balance sheet as a result of ASU, Interest - Imputation of Interest, which became effective for CSX during first quarter 2016. |
| | | | | | | | | |
| (Dollars in millions) | Current Portion | Long-term Portion | Total |
| Long-term debt as of December 30, 2016 | $ | 331 |
| $ | 10,962 |
| $ | 11,293 |
|
| 2017 activity: | | | |
| Discount, premium and other activity | — |
| (1 | ) | (1 | ) |
| Debt issue cost activity | — |
| 2 |
| 2 |
|
| Long-term debt as of March 31, 2017 | $ | 331 |
| $ | 10,963 |
| $ | 11,294 |
|
Credit Facility
CSX has a $1 billion unsecured, revolving credit facility backed by a diverse syndicate of banks. This facility expires in May 2020, and as of the date of this filing, the Company has no outstanding balances under this facility. The facility allows borrowings at floating (LIBOR-based) interest rates, plus a spread, depending upon CSX's senior unsecured debt ratings. LIBOR is the London Interbank Offered Rate which is a daily reference rate based on the interest rates at which banks offer to lend unsecured funds.
Commitment fees and interest rates payable under the facility were similar to fees and rates available to comparably rated investment-grade borrowers. As of thirdfirst quarter 2016,2017, CSX was in compliance with all covenant requirements under this facility.
Receivables Securitization Facility
Subsequent to the third quarter, on September 28, 2016, theThe Company renewed and modified its existinghas a receivables securitization facility. The facility was to expire in June 2017 and is now extended with a similar three-year term scheduled to expire in September 2019. It was also modified to provide liquidity of up to $200 million, changed from $250 million, along with modifications to other terms. The purpose of this facility is to provide an alternative to commercial paper and a low cost source of short-term liquidity.liquidity of up to $200 million, depending on eligible receivables balances. As of the date of this filing, the Company has no outstanding balances under this facility.
NOTE 8. Income Taxes
There have been no material changes to the balance of unrecognized tax benefits reported at December 25, 2015.30, 2016.
|
| | |
| | CSX Q3 2016Q1 2017 Form 10-Q p.16p.18
|
|
CSX CORPORATION
NOTES TO CONSOLIDATED FINANCIAL STATEMENTS
(Unaudited)
NOTE 9. Fair Value Measurements
The Financial Instruments Topic in the ASC requires disclosures about fair value of financial instruments in annual reports as well as in quarterly reports. For CSX, this statement applies to certain investments and long-term debt. Disclosure of the fair value of pension plan assets is only required annually. Also, this rule clarifies the definition of fair value for financial reporting, establishes a framework for measuring fair value and requires additional disclosures about the use of fair value measurements.
Various inputs are considered when determining the value of the Company's investments, pension plan assets and long-term debt. The inputs or methodologies used for valuing securities are not necessarily an indication of the risk associated with investing in these securities. These inputs are summarized in the three broad levels listed below.
Level 1 - observable market inputs that are unadjusted quoted prices for identical assets or liabilities in active markets;
Level 2 - other significant observable inputs (including quoted prices for similar securities, interest rates, credit risk, etc.); and
Level 3 - significant unobservable inputs (including the Company's own assumptions about the assumptions market participants would use in determining the fair value of investments).
The valuation methods described below may produce a fair value calculation that may not be indicative of net realizable value or reflective of future fair values. Furthermore, while the Company believes its valuation methods are appropriate and consistent with other market participants, the use of different methodologies or assumptions to determine the fair value of certain financial instruments could result in a different fair value measurement at the reporting date.
Investments
The Company's investment assets, valued with assistance from a third-party trustee, consist of certificates of deposits, commercial paper, corporate bonds government securities and auction rategovernment securities and are carried at fair value on the consolidated balance sheet per the Fair Value Measurements and Disclosures Topic in the ASC. There are several valuation methodologies used for those assets as described below.
Certificates of Deposit and Commercial Paper (Level 2): Valued at amortized cost, which approximates fair value; and
Corporate Bonds and Government Securities (Level 2): Valued using broker quotes that utilize observable market inputs; and
Auction Rate Securities (Level 3): Valued using pricing models for which the assumptions utilize management’s estimates of market participant assumptions, because there is currently no active market for trading.inputs.
The Company's investment assets are carried at fair value on the consolidated balance sheets as summarized in the table below. Additionally,All of the inputs used to determine the fair value of the Company's investments are Level 2 inputs. The amortized cost basis of these investments was $223$369 million and $920$500 million as of September 23, 2016March 31, 2017 and December 25, 2015,30, 2016, respectively.
|
| | |
| | CSX Q3 2016Q1 2017 Form 10-Q p.17p.19
|
|
CSX CORPORATION
NOTES TO CONSOLIDATED FINANCIAL STATEMENTS
(Unaudited)
NOTE 9. Fair Value Measurements, continued
| | | | September 23,
2016 | | December 25,
2015 | | | | | |
| (Dollars in Millions) | Level 1 | Level 2 | Level 3 | Total | | Level 1 | Level 2 | Level 3 | Total | March 31,
2017 | | December 30,
2016 |
| Certificates of Deposit and Commercial Paper | $ | — |
| $ | 150 |
| $ | — |
| $ | 150 |
| | $ | — |
| $ | 810 |
| $ | — |
| $ | 810 |
| $ | 285 |
| | $ | 415 |
|
| Corporate Bonds | — |
| 62 |
| — |
| 62 |
| | — |
| 73 |
| — |
| 73 |
| 64 |
| | 63 |
|
| Government Securities | — |
| 14 |
| — |
| 14 |
| | — |
| 32 |
| — |
| 32 |
| 22 |
| | 22 |
|
| Auction Rate Securities | — |
| — |
| — |
| — |
| | — |
| — |
| 4 |
| 4 |
| |
| Total investments at fair value | $ | — |
| $ | 226 |
| $ | — |
| $ | 226 |
| | $ | — |
| $ | 915 |
| $ | 4 |
| $ | 919 |
| $ | 371 |
| | $ | 500 |
|
These investments have the following maturities:
| | | (Dollars in millions) | September 23,
2016 | | December 25,
2015 | March 31,
2017 | | December 30,
2016 |
| Less than 1 year | $ | 152 |
| | $ | 810 |
| $ | 287 |
| | $ | 417 |
|
| 1 - 2 years | 7 |
| | 9 |
| 12 |
| | 12 |
|
| 2 - 5 years | 2 |
| | 27 |
| 6 |
| | 4 |
|
| Greater than 5 years | 65 |
| | 73 |
| 66 |
| | 67 |
|
| Total | $ | 226 |
| | $ | 919 |
| |
| Total investments at fair value | | $ | 371 |
| | $ | 500 |
|
Long-term Debt
Long-term debt is reported at carrying amount on the consolidated balance sheets and is the Company's only financial instrument with fair values significantly different from their carrying amounts. The majority of the Company's long-term debt is valued with assistance from an independent third party adviser that utilizes closing transactions, market quotes or market values of comparable debt. For those instruments not valued by the independent adviser, the fair value has been estimated by applying market rates of similar instruments to the scheduled contractual debt payments and maturities. These market rates are provided by the same independent adviser. All of the inputs used to determine the fair value of the Company's long-term debt are Level 2 inputs.
The fair value of outstanding debt fluctuates with changes in a number of factors. Such factors include, but are not limited to, interest rates, market conditions, credit ratings, values of similar financial instruments, size of the transaction, cash flow projections and comparable trades. Fair value will exceed carrying value when the current market interest rate is lower than the interest rate at which the debt was originally issued. The fair value of a company's debt is a measure of its current value under present market conditions. It does not impact the financial statements under current accounting rules.
The fair value and carrying value of the Company's long-term debt is as follows:
| | | (Dollars in millions) | September 23,
2016 | | December 25, 2015 | March 31,
2017 | | December 30, 2016 |
| Long-term Debt (Including Current Maturities): | | | | | | |
| Fair Value | $ | 12,235 |
| | $ | 11,340 |
| $ | 12,055 |
| | $ | 12,096 |
|
| Carrying Value | 10,519 |
| | 10,535 |
| 11,294 |
| | 11,293 |
|
|
| | |
| | CSX Q3 2016Q1 2017 Form 10-Q p.18p.20
|
|
CSX CORPORATION
NOTES TO CONSOLIDATED FINANCIAL STATEMENTS
(Unaudited)
NOTE 10. Other Comprehensive Income (Loss)
CSX reports comprehensive earnings or loss in accordance with the Comprehensive Income Topic in the ASC in the Consolidated Comprehensive Income Statement. Total comprehensive earnings are defined as all changes in shareholders' equity during a period, other than those resulting from investments by and distributions to shareholders (e.g. issuance of equity securities and dividends). Generally, for CSX, total comprehensive earnings equal net earnings plus or minus adjustments for pension and other post-retirement liabilities. Total comprehensive earnings represent the activity for a period net of tax and were $465$368 million and $518$363 million for thirdfirst quarters2017 and $1,282 million and $1,523 million for nine months 2016, and 2015, respectively.
While total comprehensive earnings is the activity in a period and is largely driven by net earnings in that period, accumulated other comprehensive income or loss (“AOCI”) represents the cumulative balance of other comprehensive income, net of tax, as of the balance sheet date. For CSX, AOCI is primarily the cumulative balance related to pension and other post-retirement benefit adjustments and CSX's share of AOCI of equity method investees.
Changes in the AOCI balance by component are shown in the table below. Amounts reclassified in pension and other post-employment benefits to net earnings relate to the amortization of actuarial losses and are included in labor and fringe on the consolidated income statements. See Note 6. Employee Benefit Plans for further information. Other primarily represents CSX's share of AOCI of equity method investees. Amounts reclassified in other to net earnings are included in materials, supplies and other on the consolidated income statements.
| | | | Pension and Other Post-Employment Benefits | Other | Accumulated Other Comprehensive Income (Loss) | Pension and Other Post-Employment Benefits | Other | Accumulated Other Comprehensive Income (Loss) |
| (Dollars in millions) | | |
| Balance December 25, 2015, Net of Tax | $ | (601 | ) | $ | (64 | ) | $ | (665 | ) | |
| Balance December 30, 2016, Net of Tax | | $ | (580 | ) | $ | (60 | ) | $ | (640 | ) |
| Other Comprehensive Income (Loss) | | |
| Loss Before Reclassifications | | — |
| (1 | ) | (1 | ) |
| Amounts Reclassified to Net Earnings | 38 |
| 4 |
| 42 |
| 11 |
| — |
| 11 |
|
| Tax Expense | (14 | ) | (2 | ) | (16 | ) | (4 | ) | — |
| (4 | ) |
| Total Other Comprehensive Income (Loss) | 24 |
| 2 |
| 26 |
| 7 |
| (1 | ) | 6 |
|
| Balance September 23, 2016, Net of Tax | $ | (577 | ) | $ | (62 | ) | $ | (639 | ) | |
| Balance March 31, 2017, Net of Tax | | $ | (573 | ) | $ | (61 | ) | $ | (634 | ) |
NOTE 11. Summarized Consolidating Financial Data
In 2007, CSXT, a wholly-owned subsidiary of CSX Corporation, sold secured equipment notes maturing in 2023 in a registered public offering. CSX has fully and unconditionally guaranteed the notes. In connection with the notes, the Company is providing the following condensed consolidating financial information in accordance with SEC disclosure requirements. Each entity in the consolidating financial information follows the same accounting policies as described in the consolidated financial statements, except for the use of the equity method of accounting to reflect ownership interests in subsidiaries which are eliminated upon consolidation and the allocation of certain expenses of CSX incurred for the benefit of its subsidiaries. Condensed consolidating financial information for the obligor, CSXT, and parent guarantor, CSX, is shown in the tables below.
|
| | |
| CSX Q3 2016 Form 10-Q p.19
|
|
CSX CORPORATION
NOTES TO CONSOLIDATED FINANCIAL STATEMENTS
(Unaudited)
NOTE 11.Summarized Consolidating Financial Data, continued
|
| | | | | | | | | | | | |
| Consolidating Income Statements |
| (Dollars in millions) |
| Third Quarter 2016 | CSX Corporation | CSX Transportation | Eliminations and Other | Consolidated |
| Revenue | $ | — |
| $ | 2,691 |
| $ | 19 |
| $ | 2,710 |
|
| Expense | (63 | ) | 1,960 |
| (28 | ) | 1,869 |
|
| Operating Income | 63 |
| 731 |
| 47 |
| 841 |
|
| | | | | |
| Equity in Earnings of Subsidiaries | 505 |
| 1 |
| (506 | ) | — |
|
| Interest (Expense) / Benefit | (141 | ) | (7 | ) | 9 |
| (139 | ) |
| Other Income / (Expense) - Net | — |
| 9 |
| 4 |
| 13 |
|
| | | | | |
| Earnings Before Income Taxes | 427 |
| 734 |
| (446 | ) | 715 |
|
| Income Tax Benefit / (Expense) | 28 |
| (268 | ) | (20 | ) | (260 | ) |
| Net Earnings | $ | 455 |
| $ | 466 |
| $ | (466 | ) | $ | 455 |
|
| | | | | |
| Total Comprehensive Earnings | $ | 465 |
| $ | 467 |
| $ | (467 | ) | $ | 465 |
|
| | | | | |
| Third Quarter 2015 | CSX Corporation | CSX Transportation | Eliminations and Other | Consolidated |
| Revenue | $ | — |
| $ | 2,920 |
| $ | 19 |
| $ | 2,939 |
|
| Expense | (154 | ) | 2,182 |
| (22 | ) | 2,006 |
|
| Operating Income | 154 |
| 738 |
| 41 |
| 933 |
|
| | | | | |
| Equity in Earnings of Subsidiaries | 496 |
| — |
| (496 | ) | — |
|
| Interest (Expense) / Benefit | (134 | ) | (8 | ) | 6 |
| (136 | ) |
| Other Income / (Expense) - Net | (1 | ) | 5 |
| (2 | ) | 2 |
|
| | | | | |
| Earnings Before Income Taxes | 515 |
| 735 |
| (451 | ) | 799 |
|
| Income Tax (Expense) / Benefit | (8 | ) | (273 | ) | (11 | ) | (292 | ) |
| Net Earnings | $ | 507 |
| $ | 462 |
| $ | (462 | ) | $ | 507 |
|
| | | | | |
| Total Comprehensive Earnings | $ | 518 |
| $ | 462 |
| $ | (462 | ) | $ | 518 |
|
|
| | |
| | CSX Q3 2016Q1 2017 Form 10-Q p.20p.21
|
|
CSX CORPORATION
NOTES TO CONSOLIDATED FINANCIAL STATEMENTS
(Unaudited)
NOTE 11. Summarized Consolidating Financial Data, continued
| | Consolidating Income Statements | (Dollars in millions) | | Nine Months 2016 | CSX Corporation | CSX Transportation | Eliminations and Other | Consolidated | |
| First Quarter 2017 | | CSX Corporation | CSX Transportation | Eliminations and Other | Consolidated |
| Revenue | | $ | — |
| $ | 2,851 |
| $ | 18 |
| $ | 2,869 |
|
| Expense | | (48 | ) | 2,228 |
| (23 | ) | 2,157 |
|
| Operating Income | | 48 |
| 623 |
| 41 |
| 712 |
|
| | | |
| Equity in Earnings of Subsidiaries | | 422 |
| — |
| (422 | ) | — |
|
| Interest (Expense) / Benefit | | (142 | ) | (10 | ) | 15 |
| (137 | ) |
| Other Income / (Expense) - Net | | 3 |
| 11 |
| (7 | ) | 7 |
|
| | | |
| Earnings Before Income Taxes | | 331 |
| 624 |
| (373 | ) | 582 |
|
| Income Tax Benefit / (Expense) | | 31 |
| (235 | ) | (16 | ) | (220 | ) |
| Net Earnings | | $ | 362 |
| $ | 389 |
| $ | (389 | ) | $ | 362 |
|
| | | |
| Total Comprehensive Earnings | | $ | 368 |
| $ | 387 |
| $ | (387 | ) | $ | 368 |
|
| | | |
| First Quarter 2016 | | CSX Corporation | CSX Transportation | Eliminations and Other | Consolidated |
| Revenue | $ | — |
| $ | 7,974 |
| $ | 58 |
| $ | 8,032 |
| $ | — |
| $ | 2,598 |
| $ | 20 |
| $ | 2,618 |
|
| Expense | (202 | ) | 5,985 |
| (136 | ) | 5,647 |
| (72 | ) | 2,064 |
| (78 | ) | 1,914 |
|
| Operating Income | 202 |
| 1,989 |
| 194 |
| 2,385 |
| 72 |
| 534 |
| 98 |
| 704 |
|
| | | |
| Equity in Earnings of Subsidiaries | 1,399 |
| 1 |
| (1,400 | ) | — |
| 401 |
| — |
| (401 | ) | — |
|
| Interest (Expense) / Benefit | (425 | ) | (27 | ) | 29 |
| (423 | ) | (143 | ) | (10 | ) | 10 |
| (143 | ) |
| Other Income / (Expense) - Net | 1 |
| 24 |
| 3 |
| 28 |
| 1 |
| 7 |
| (1 | ) | 7 |
|
| | | |
| Earnings Before Income Taxes | 1,177 |
| 1,987 |
| (1,174 | ) | 1,990 |
| 331 |
| 531 |
| (294 | ) | 568 |
|
| Income Tax (Expense) / Benefit | 79 |
| (735 | ) | (78 | ) | (734 | ) | 25 |
| (198 | ) | (39 | ) | (212 | ) |
| Net Earnings | $ | 1,256 |
| $ | 1,252 |
| $ | (1,252 | ) | $ | 1,256 |
| $ | 356 |
| $ | 333 |
| $ | (333 | ) | $ | 356 |
|
| | | |
| Total Comprehensive Earnings | $ | 1,282 |
| $ | 1,253 |
| $ | (1,253 | ) | $ | 1,282 |
| $ | 363 |
| $ | 332 |
| $ | (332 | ) | $ | 363 |
|
| | | |
| Nine Months 2015 | CSX Corporation | CSX Transportation | Eliminations and Other | Consolidated | |
| Revenue | $ | — |
| $ | 8,972 |
| $ | 58 |
| $ | 9,030 |
| |
| Expense | (448 | ) | 6,765 |
| (80 | ) | 6,237 |
| |
| Operating Income | 448 |
| 2,207 |
| 138 |
| 2,793 |
| |
| | | |
| Equity in Earnings of Subsidiaries | 1,482 |
| — |
| (1,482 | ) | — |
| |
| Interest (Expense) / Benefit | (399 | ) | (24 | ) | 19 |
| (404 | ) | |
| Other Income / (Expense) - Net | (4 | ) | 18 |
| (6 | ) | 8 |
| |
| | | |
| Earnings Before Income Taxes | 1,527 |
| 2,201 |
| (1,331 | ) | 2,397 |
| |
| Income Tax (Expense) / Benefit | (25 | ) | (824 | ) | (46 | ) | (895 | ) | |
| Net Earnings | $ | 1,502 |
| $ | 1,377 |
| $ | (1,377 | ) | $ | 1,502 |
| |
| | | |
| Total Comprehensive Earnings | $ | 1,523 |
| $ | 1,374 |
| $ | (1,374 | ) | $ | 1,523 |
| |
| | | |
Certain prior year data has been reclassified to conform to the current presentation.
|
| | |
| | CSX Q3 2016 Form 10-Q p.21
|
|
CSX CORPORATION
NOTES TO CONSOLIDATED FINANCIAL STATEMENTS
(Unaudited)
NOTE 11.Summarized Consolidating Financial Data, continued
|
| | | | | | | | | | | | |
| Consolidating Balance Sheet |
| (Dollars in millions) |
| September 23, 2016 | CSX Corporation | CSX Transportation | Eliminations and Other | Consolidated |
| | | | | |
| ASSETS |
| Current Assets | | | | |
| Cash and Cash Equivalents | $ | 448 |
| $ | 130 |
| $ | 25 |
| $ | 603 |
|
| Short-term Investments | 150 |
| — |
| 2 |
| 152 |
|
| Accounts Receivable - Net | (3 | ) | 197 |
| 731 |
| 925 |
|
| Receivable from Affiliates | 1,158 |
| 2,504 |
| (3,662 | ) | — |
|
| Materials and Supplies | — |
| 397 |
| — |
| 397 |
|
| Other Current Assets | 11 |
| 56 |
| 19 |
| 86 |
|
| Total Current Assets | 1,764 |
| 3,284 |
| (2,885 | ) | 2,163 |
|
| | | | | |
| Properties | 1 |
| 40,052 |
| 2,667 |
| 42,720 |
|
| Accumulated Depreciation | (1 | ) | (10,508 | ) | (1,429 | ) | (11,938 | ) |
| Properties - Net | — |
| 29,544 |
| 1,238 |
| 30,782 |
|
| | | | | |
| Investments in Conrail | — |
| — |
| 830 |
| 830 |
|
| Affiliates and Other Companies | (39 | ) | 628 |
| 14 |
| 603 |
|
| Investments in Consolidated Subsidiaries | 23,678 |
| — |
| (23,678 | ) | — |
|
| Other Long-term Assets | 3 |
| 403 |
| (103 | ) | 303 |
|
| Total Assets | $ | 25,406 |
| $ | 33,859 |
| $ | (24,584 | ) | $ | 34,681 |
|
| | | | | |
| LIABILITIES AND SHAREHOLDERS' EQUITY | | |
| Current Liabilities | | | | |
| Accounts Payable | $ | 150 |
| $ | 679 |
| $ | 30 |
| $ | 859 |
|
| Labor and Fringe Benefits Payable | 36 |
| 371 |
| 43 |
| 450 |
|
| Payable to Affiliates | 3,601 |
| 445 |
| (4,046 | ) | — |
|
| Casualty, Environmental and Other Reserves | — |
| 109 |
| 15 |
| 124 |
|
| Current Maturities of Long-term Debt | 613 |
| 19 |
| (1 | ) | 631 |
|
| Income and Other Taxes Payable | (334 | ) | 394 |
| 30 |
| 90 |
|
| Other Current Liabilities | — |
| 107 |
| 2 |
| 109 |
|
| Total Current Liabilities | 4,066 |
| 2,124 |
| (3,927 | ) | 2,263 |
|
| | | | | |
| Casualty, Environmental and Other Reserves | — |
| 202 |
| 48 |
| 250 |
|
| Long-term Debt | 9,127 |
| 761 |
| — |
| 9,888 |
|
| Deferred Income Taxes - Net | (206 | ) | 9,470 |
| 241 |
| 9,505 |
|
| Other Long-term Liabilities | 763 |
| 468 |
| (126 | ) | 1,105 |
|
| Total Liabilities | $ | 13,750 |
| $ | 13,025 |
| $ | (3,764 | ) | $ | 23,011 |
|
| | | | | |
| Shareholders' Equity | | | | |
| Common Stock, $1 Par Value | $ | 937 |
| $ | 181 |
| $ | (181 | ) | $ | 937 |
|
| Other Capital | 125 |
| 5,094 |
| (5,094 | ) | 125 |
|
| Retained Earnings | 11,233 |
| 15,575 |
| (15,575 | ) | 11,233 |
|
| Accumulated Other Comprehensive Loss | (639 | ) | (30 | ) | 30 |
| (639 | ) |
| Noncontrolling Interest | — |
| 14 |
| — |
| 14 |
|
| Total Shareholders' Equity | $ | 11,656 |
| $ | 20,834 |
| $ | (20,820 | ) | $ | 11,670 |
|
| Total Liabilities and Shareholders' Equity | $ | 25,406 |
| $ | 33,859 |
| $ | (24,584 | ) | $ | 34,681 |
|
Certain prior year data has been reclassified to conform to the current presentation.
|
| | |
| CSX Q3 2016Q1 2017 Form 10-Q p.22
|
|
CSX CORPORATION
NOTES TO CONSOLIDATED FINANCIAL STATEMENTS
(Unaudited)
NOTE 11. Summarized Consolidating Financial Data, continued
| | Consolidating Balance Sheet (Dollars in millions) | |
| December 25, 2015 | CSX Corporation | CSX Transportation | Eliminations and Other | Consolidated | |
| Consolidating Balance Sheet | | Consolidating Balance Sheet |
| (Dollars in millions) | | (Dollars in millions) |
| March 31, 2017 | | CSX Corporation | CSX Transportation | Eliminations and Other | Consolidated |
| | | |
ASSETS | | Current Assets | | |
| Cash and Cash Equivalents | $ | 444 |
| $ | 175 |
| $ | 9 |
| $ | 628 |
| $ | 648 |
| $ | 272 |
| $ | 10 |
| $ | 930 |
|
| Short-term Investments | 810 |
| — |
| — |
| 810 |
| 285 |
| — |
| 2 |
| 287 |
|
| Accounts Receivable - Net | 1 |
| 198 |
| 783 |
| 982 |
| 2 |
| 198 |
| 743 |
| 943 |
|
| Receivable from Affiliates | 1,092 |
| 2,038 |
| (3,130 | ) | — |
| 1,122 |
| 2,397 |
| (3,519 | ) | — |
|
| Materials and Supplies | — |
| 350 |
| — |
| 350 |
| — |
| 415 |
| — |
| 415 |
|
| Other Current Assets | (59 | ) | 120 |
| 9 |
| 70 |
| — |
| 74 |
| 11 |
| 85 |
|
| Total Current Assets | 2,288 |
| 2,881 |
| (2,329 | ) | 2,840 |
| 2,057 |
| 3,356 |
| (2,753 | ) | 2,660 |
|
| | | |
| Properties | 1 |
| 38,964 |
| 2,609 |
| 41,574 |
| 1 |
| 40,670 |
| 2,728 |
| 43,399 |
|
| Accumulated Depreciation | (1 | ) | (10,016 | ) | (1,383 | ) | (11,400 | ) | (1 | ) | (10,662 | ) | (1,477 | ) | (12,140 | ) |
| Properties - Net | — |
| 28,948 |
| 1,226 |
| 30,174 |
| — |
| 30,008 |
| 1,251 |
| 31,259 |
|
| | | |
| Investments in Conrail | — |
| — |
| 803 |
| 803 |
| — |
| — |
| 847 |
| 847 |
|
| Affiliates and Other Companies | (39 | ) | 658 |
| (28 | ) | 591 |
| (39 | ) | 646 |
| 15 |
| 622 |
|
| Investment in Consolidated Subsidiaries | 22,755 |
| — |
| (22,755 | ) | — |
| |
| Investments in Consolidated Subsidiaries | | 24,434 |
| — |
| (24,434 | ) | — |
|
| Other Long-term Assets | 8 |
| 399 |
| (70 | ) | 337 |
| 2 |
| 603 |
| (281 | ) | 324 |
|
| Total Assets | $ | 25,012 |
| $ | 32,886 |
| $ | (23,153 | ) | $ | 34,745 |
| $ | 26,454 |
| $ | 34,613 |
| $ | (25,355 | ) | $ | 35,712 |
|
| | | |
| LIABILITIES AND SHAREHOLDERS' EQUITY | LIABILITIES AND SHAREHOLDERS' EQUITY | | LIABILITIES AND SHAREHOLDERS' EQUITY | |
| Current Liabilities | | |
| Accounts Payable | $ | 108 |
| $ | 626 |
| $ | 30 |
| $ | 764 |
| $ | 171 |
| $ | 698 |
| $ | 29 |
| $ | 898 |
|
| Labor and Fringe Benefits Payable | 36 |
| 407 |
| 47 |
| 490 |
| 34 |
| 383 |
| 28 |
| 445 |
|
| Payable to Affiliates | 2,954 |
| 437 |
| (3,391 | ) | — |
| 3,478 |
| 475 |
| (3,953 | ) | — |
|
| Casualty, Environmental and Other Reserves | — |
| 115 |
| 16 |
| 131 |
| — |
| 102 |
| 12 |
| 114 |
|
| Current Maturities of Long-term Debt | 1 |
| 19 |
| — |
| 20 |
| 313 |
| 19 |
| (1 | ) | 331 |
|
| Income and Other Taxes Payable | (87 | ) | 183 |
| 12 |
| 108 |
| (29 | ) | 310 |
| 21 |
| 302 |
|
| Other Current Liabilities | — |
| 437 |
| 2 |
| 439 |
| — |
| 178 |
| 9 |
| 187 |
|
| Total Current Liabilities | 3,012 |
| 2,224 |
| (3,284 | ) | 1,952 |
| 3,967 |
| 2,165 |
| (3,855 | ) | 2,277 |
|
| | | |
| Casualty, Environmental and Other Reserves | — |
| 219 |
| 50 |
| 269 |
| — |
| 203 |
| 49 |
| 252 |
|
| Long-term Debt | 9,732 |
| 783 |
| — |
| 10,515 |
| 10,206 |
| 757 |
| — |
| 10,963 |
|
| Deferred Income Taxes - Net | (188 | ) | 9,141 |
| 226 |
| 9,179 |
| (207 | ) | 9,592 |
| 263 |
| 9,648 |
|
| Other Long-term Liabilities | 804 |
| 484 |
| (126 | ) | 1,162 |
| 832 |
| 396 |
| (325 | ) | 903 |
|
| Total Liabilities | $ | 13,360 |
| $ | 12,851 |
| $ | (3,134 | ) | $ | 23,077 |
| $ | 14,798 |
| $ | 13,113 |
| $ | (3,868 | ) | $ | 24,043 |
|
| | | |
| Shareholders' Equity | | |
| Common Stock, $1 Par Value | $ | 966 |
| $ | 181 |
| $ | (181 | ) | $ | 966 |
| $ | 923 |
| $ | 181 |
| $ | (181 | ) | $ | 923 |
|
| Other Capital | 113 |
| 5,091 |
| (5,091 | ) | 113 |
| 170 |
| 5,095 |
| (5,095 | ) | 170 |
|
| Retained Earnings | 11,238 |
| 14,774 |
| (14,774 | ) | 11,238 |
| 11,197 |
| 16,232 |
| (16,232 | ) | 11,197 |
|
| Accumulated Other Comprehensive Loss | (665 | ) | (31 | ) | 31 |
| (665 | ) | (634 | ) | (21 | ) | 21 |
| (634 | ) |
| Noncontrolling Minority Interest | — |
| 20 |
| (4 | ) | 16 |
| |
| Noncontrolling Interest | | — |
| 13 |
| — |
| 13 |
|
| Total Shareholders' Equity | $ | 11,652 |
| $ | 20,035 |
| $ | (20,019 | ) | $ | 11,668 |
| $ | 11,656 |
| $ | 21,500 |
| $ | (21,487 | ) | $ | 11,669 |
|
| Total Liabilities and Shareholders' Equity | $ | 25,012 |
| $ | 32,886 |
| $ | (23,153 | ) | $ | 34,745 |
| $ | 26,454 |
| $ | 34,613 |
| $ | (25,355 | ) | $ | 35,712 |
|
Certain prior year data has been reclassified to conform to the current presentation.
|
| | |
| | CSX Q3 2016Q1 2017 Form 10-Q p.23
|
|
CSX CORPORATION
NOTES TO CONSOLIDATED FINANCIAL STATEMENTS
(Unaudited)
NOTE 11. Summarized Consolidating Financial Data, continued
|
| | | | | | | | | | | | |
| Consolidating Cash Flow Statements |
| (Dollars in millions) |
| Nine Months 2016 | CSX Corporation | CSX Transportation | Eliminations and Other | Consolidated |
| Operating Activities | | | | |
| Net Cash Provided by (Used in) Operating Activities | $ | 644 |
| $ | 2,089 |
| $ | (245 | ) | $ | 2,488 |
|
| Investing Activities | |
| | |
| Property Additions | — |
| (1,469 | ) | (121 | ) | (1,590 | ) |
| Purchases of Short-term Investments | (410 | ) | — |
| — |
| (410 | ) |
| Proceeds from Sales of Short-term Investments | 1,070 |
| — |
| — |
| 1,070 |
|
| Proceeds from Property Dispositions | — |
| 11 |
| — |
| 11 |
|
| Other Investing Activities | (3 | ) | 96 |
| (67 | ) | 26 |
|
| Net Cash Provided by (Used in) Investing Activities | 657 |
| (1,362 | ) | (188 | ) | (893 | ) |
| Financing Activities | | | | |
| Long-term Debt Issued | — |
| — |
| — |
| — |
|
| Long-term Debt Repaid | — |
| (18 | ) | (1 | ) | (19 | ) |
| Dividends Paid | (513 | ) | (450 | ) | 450 |
| (513 | ) |
| Stock Options Exercised | — |
| — |
| — |
| — |
|
| Shares Repurchased | (778 | ) | — |
| — |
| (778 | ) |
| Other Financing Activities | (6 | ) | (304 | ) | — |
| (310 | ) |
| Net Cash Provided by (Used in) Financing Activities | (1,297 | ) | (772 | ) | 449 |
| (1,620 | ) |
| Net Increase (Decrease) in Cash and Cash Equivalents | 4 |
| (45 | ) | 16 |
| (25 | ) |
| Cash and Cash Equivalents at Beginning of Period | 444 |
| 175 |
| 9 |
| 628 |
|
| Cash and Cash Equivalents at End of Period | $ | 448 |
| $ | 130 |
| $ | 25 |
| $ | 603 |
|
|
| | | | | | | | | | | | |
Consolidating Balance Sheet (Dollars in millions) |
| December 30, 2016 | CSX Corporation | CSX Transportation | Eliminations and Other | Consolidated |
| ASSETS |
| Current Assets | | | | |
| Cash and Cash Equivalents | $ | 305 |
| $ | 281 |
| $ | 17 |
| $ | 603 |
|
| Short-term Investments | 415 |
| — |
| 2 |
| 417 |
|
| Accounts Receivable - Net | 2 |
| 215 |
| 721 |
| 938 |
|
| Receivable from Affiliates | 1,157 |
| 2,351 |
| (3,508 | ) | — |
|
| Materials and Supplies | — |
| 407 |
| — |
| 407 |
|
| Other Current Assets | — |
| 106 |
| 16 |
| 122 |
|
| Total Current Assets | 1,879 |
| 3,360 |
| (2,752 | ) | 2,487 |
|
| | | | | |
| Properties | 1 |
| 40,518 |
| 2,708 |
| 43,227 |
|
| Accumulated Depreciation | (1 | ) | (10,634 | ) | (1,442 | ) | (12,077 | ) |
| Properties - Net | — |
| 29,884 |
| 1,266 |
| 31,150 |
|
| | | | | |
| Investments in Conrail | — |
| — |
| 840 |
| 840 |
|
| Affiliates and Other Companies | (39 | ) | 643 |
| 15 |
| 619 |
|
| Investment in Consolidated Subsidiaries | 24,179 |
| — |
| (24,179 | ) | — |
|
| Other Long-term Assets | 2 |
| 607 |
| (291 | ) | 318 |
|
| Total Assets | $ | 26,021 |
| $ | 34,494 |
| $ | (25,101 | ) | $ | 35,414 |
|
| | | | | |
| LIABILITIES AND SHAREHOLDERS' EQUITY | | |
| Current Liabilities | | | | |
| Accounts Payable | $ | 95 |
| $ | 678 |
| $ | 33 |
| $ | 806 |
|
| Labor and Fringe Benefits Payable | 40 |
| 440 |
| 65 |
| 545 |
|
| Payable to Affiliates | 3,457 |
| 500 |
| (3,957 | ) | — |
|
| Casualty, Environmental and Other Reserves | — |
| 102 |
| 13 |
| 115 |
|
| Current Maturities of Long-term Debt | 313 |
| 19 |
| (1 | ) | 331 |
|
| Income and Other Taxes Payable | (346 | ) | 459 |
| 16 |
| 129 |
|
| Other Current Liabilities | — |
| 112 |
| 2 |
| 114 |
|
| Total Current Liabilities | 3,559 |
| 2,310 |
| (3,829 | ) | 2,040 |
|
| | | | | |
| Casualty, Environmental and Other Reserves | — |
| 208 |
| 51 |
| 259 |
|
| Long-term Debt | 10,203 |
| 759 |
| — |
| 10,962 |
|
| Deferred Income Taxes - Net | (203 | ) | 9,541 |
| 258 |
| 9,596 |
|
| Other Long-term Liabilities | 783 |
| 410 |
| (330 | ) | 863 |
|
| Total Liabilities | $ | 14,342 |
| $ | 13,228 |
| $ | (3,850 | ) | $ | 23,720 |
|
| | | | | |
| Shareholders' Equity | | | | |
| Common Stock, $1 Par Value | $ | 928 |
| $ | 181 |
| $ | (181 | ) | $ | 928 |
|
| Other Capital | 138 |
| 5,095 |
| (5,095 | ) | 138 |
|
| Retained Earnings | 11,253 |
| 15,994 |
| (15,994 | ) | 11,253 |
|
| Accumulated Other Comprehensive Loss | (640 | ) | (19 | ) | 19 |
| (640 | ) |
| Noncontrolling Minority Interest | — |
| 15 |
| — |
| 15 |
|
| Total Shareholders' Equity | $ | 11,679 |
| $ | 21,266 |
| $ | (21,251 | ) | $ | 11,694 |
|
| Total Liabilities and Shareholders' Equity | $ | 26,021 |
| $ | 34,494 |
| $ | (25,101 | ) | $ | 35,414 |
|
|
| | |
| CSX Q1 2017 Form 10-Q p.24
|
|
CSX CORPORATION
NOTES TO CONSOLIDATED FINANCIAL STATEMENTS
(Unaudited)
NOTE 11.Summarized Consolidating Financial Data, continued
|
| | | | | | | | | | | | |
| Consolidating Cash Flow Statements |
| (Dollars in millions) |
| Three Months 2017 | CSX Corporation | CSX Transportation | Eliminations and Other | Consolidated |
| Operating Activities | | | | |
| Net Cash Provided by (Used in) Operating Activities | $ | 644 |
| $ | 566 |
| $ | (167 | ) | $ | 1,043 |
|
| Investing Activities | |
| | |
| Property Additions | — |
| (397 | ) | (44 | ) | (441 | ) |
| Purchases of Short-term Investments | (75 | ) | — |
| — |
| (75 | ) |
| Proceeds from Sales of Short-term Investments | 205 |
| — |
| — |
| 205 |
|
| Other Investing Activities | (1 | ) | (24 | ) | 50 |
| 25 |
|
| Net Cash Provided by (Used in) Investing Activities | 129 |
| (421 | ) | 6 |
| (286 | ) |
| Financing Activities | | | | |
| Dividends Paid | (166 | ) | (150 | ) | 150 |
| (166 | ) |
| Shares Repurchased | (258 | ) | — |
| — |
| (258 | ) |
| Other Financing Activities | (6 | ) | (4 | ) | 4 |
| (6 | ) |
| Net Cash Provided by (Used in) Financing Activities | (430 | ) | (154 | ) | 154 |
| (430 | ) |
| Net Increase (Decrease) in Cash and Cash Equivalents | 343 |
| (9 | ) | (7 | ) | 327 |
|
| Cash and Cash Equivalents at Beginning of Period | 305 |
| 281 |
| 17 |
| 603 |
|
| Cash and Cash Equivalents at End of Period | $ | 648 |
| $ | 272 |
| $ | 10 |
| $ | 930 |
|
|
| | |
| | CSX Q3 2016Q1 2017 Form 10-Q p.24p.25
|
|
CSX CORPORATION
NOTES TO CONSOLIDATED FINANCIAL STATEMENTS
(Unaudited)
NOTE 11. Summarized Consolidating Financial Data, continued
| | Consolidating Cash Flow Statements | (Dollars in millions) | | Nine Months 2015 | CSX Corporation | CSX Transportation | Eliminations and Other | Consolidated | |
| Three Months 2016 | | CSX Corporation | CSX Transportation | Eliminations and Other | Consolidated |
| Operating Activities | | |
| Net Cash Provided by (Used in) Operating Activities | $ | 637 |
| $ | 2,313 |
| $ | (438 | ) | $ | 2,512 |
| $ | 36 |
| $ | 834 |
| $ | (116 | ) | $ | 754 |
|
| Investing Activities | | |
| Property Additions | — |
| (1,794 | ) | (115 | ) | (1,909 | ) | — |
| (391 | ) | (34 | ) | (425 | ) |
| Purchases of Short-term Investments | (1,170 | ) | — |
| — |
| (1,170 | ) | (235 | ) | — |
| — |
| (235 | ) |
| Proceeds from Sales of Short-term Investments | 995 |
| — |
| 45 |
| 1,040 |
| 670 |
| — |
| — |
| 670 |
|
| Proceeds from Property Dispositions | — |
| 46 |
| — |
| 46 |
| |
| Other Investing Activities | (11 | ) | 93 |
| (40 | ) | 42 |
| (1 | ) | 26 |
| 6 |
| 31 |
|
| Net Cash Provided by (Used in) Investing Activities | (186 | ) | (1,655 | ) | (110 | ) | (1,951 | ) | 434 |
| (365 | ) | (28 | ) | 41 |
|
| Financing Activities | | |
| Long-term Debt Issued | 600 |
| — |
| — |
| 600 |
| |
| Long-term Debt Repaid | (200 | ) | (28 | ) | — |
| (228 | ) | |
| Dividends Paid | (512 | ) | (563 | ) | 563 |
| (512 | ) | (173 | ) | (150 | ) | 150 |
| (173 | ) |
| Stock Options Exercised | — |
| — |
| — |
| — |
| |
| Shares Repurchased | (546 | ) | — |
| — |
| (546 | ) | (249 | ) | — |
| — |
| (249 | ) |
| Other Financing Activities | 8 |
| 1 |
| (12 | ) | (3 | ) | 1 |
| (271 | ) | — |
| (270 | ) |
| Net Cash Provided by (Used in) Financing Activities | (650 | ) | (590 | ) | 551 |
| (689 | ) | (421 | ) | (421 | ) | 150 |
| (692 | ) |
| Net Increase (Decrease) in Cash and Cash Equivalents | (199 | ) | 68 |
| 3 |
| (128 | ) | 49 |
| 48 |
| 6 |
| 103 |
|
| Cash and Cash Equivalents at Beginning of Period | 510 |
| 100 |
| 59 |
| 669 |
| 444 |
| 175 |
| 9 |
| 628 |
|
| Cash and Cash Equivalents at End of Period | $ | 311 |
| $ | 168 |
| $ | 62 |
| $ | 541 |
| $ | 493 |
| $ | 223 |
| $ | 15 |
| $ | 731 |
|
|
| | |
| | CSX Q3 2016Q1 2017 Form 10-Q p.25p.26
|
|
CSX CORPORATION
ITEM 2. MANAGEMENT'S DISCUSSION AND ANALYSIS OF FINANCIAL CONDITION AND RESULTS OF OPERATIONS
THIRDFIRST QUARTER 20162017 HIGHLIGHTS
Revenue declined $229 million to $2.7 billion or 8 percent from a year ago.The Company named E. Hunter Harrison CEO and began implementing Precision Scheduled Railroading.
ExpensesThe Company reduced the management workforce and completed other restructuring activities that resulted in a restructuring charge of $1.9 billion improved $137 million or 7 percent year over year.
Operating income of $841 million decreased $92 million or 10 percent year over year.
Operating ratio of 69.0% increased 70 basis points versus last year's quarter.
Earnings per share of $0.48 decreased $0.04 or 8 percent year over year.$173 million.
| | | | Third Quarters | | Nine Months | First Quarters |
| | 2016 | 2015 | Fav / (Unfav) | % Change | | 2016 | 2015 | Fav /
(Unfav) | % Change | 2017 | 2016 | Fav / (Unfav) | % Change |
Volume (in thousands) | 1,574 |
| 1,712 |
| (138 | ) | (8)% | | 4,720 |
| 5,106 |
| (386 | ) | (8)% | 1,592 |
| 1,551 |
| 41 |
| 3% |
| | | | | | | |
| (in millions) | | | | | | |
| Revenue | $ | 2,710 |
| $ | 2,939 |
| $ | (229 | ) | (8)% | | $ | 8,032 |
| $ | 9,030 |
| $ | (998 | ) | (11)% | $ | 2,869 |
| $ | 2,618 |
| $ | 251 |
| 10% |
| Expense | 1,869 |
| 2,006 |
| 137 |
| 7% | | 5,647 |
| 6,237 |
| 590 |
| 9% | 2,157 |
| 1,914 |
| (243 | ) | (13)% |
| Operating Income | $ | 841 |
| $ | 933 |
| $ | (92 | ) | (10)% | | $ | 2,385 |
| $ | 2,793 |
| $ | (408 | ) | (15)% | $ | 712 |
| $ | 704 |
| $ | 8 |
| 1% |
| | | | | | | |
| Operating Ratio | 69.0 | % | 68.3 | % | (70 | ) | bps | | 70.3 | % | 69.1 | % | (120 | ) | bps | 75.2 | % | 73.1 | % | (210 | ) | bps |
| | | | | | | |
| Earnings Per Diluted Share | $ | 0.48 |
| $ | 0.52 |
| $ | (0.04 | ) | (8)% | | $ | 1.32 |
| $ | 1.52 |
| $ | (0.20 | ) | (13)% | $ | 0.39 |
| $ | 0.37 |
| $ | 0.02 |
| 5% |
For additional information, referOn March 6, 2017, the Company named E. Hunter Harrison as its new CEO and began implementing Precision Scheduled Railroading. As a result, CSX is adjusting its strategy to Results of Operations discussedsuccessfully execute this new model, relentlessly focusing on pages 27 through 30.providing customer service, controlling costs, operating safely, developing people and optimizing assets.
|
| | |
| | CSX Q3 2016Q1 2017 Form 10-Q p.26p.27
|
|
CSX CORPORATION
ITEM 2. MANAGEMENT'S DISCUSSION AND ANALYSIS OF FINANCIAL CONDITION AND RESULTS OF OPERATIONS
RESULTS OF OPERATIONS
| | Volume and Revenue (Unaudited) | Volume and Revenue (Unaudited) | Volume and Revenue (Unaudited) |
Volume (Thousands of units); Revenue (Dollars in Millions); Revenue Per Unit (Dollars) | | Third Quarters | |
| First Quarters | | First Quarters |
| | Volume | | Revenue | | Revenue Per Unit | Volume | | Revenue | | Revenue Per Unit |
| | 2016 | | 2015 | | % Change | | 2016 | | 2015 | | % Change | | 2016 | | 2015 | | % Change | 2017 | | 2016 | | % Change | | 2017 | | 2016 | | % Change | | 2017 | | 2016 | | % Change |
| Agricultural | | | | | | | | | | | | | | | | | | |
Agricultural and Food Products (a) | 109 |
| | 121 |
| | (10 | )% | | $ | 295 |
| | $ | 321 |
| | (8 | )% | | $ | 2,706 |
| | $ | 2,653 |
| | 2 | % | 121 |
| | 121 |
| | — | % | | $ | 332 |
| | $ | 323 |
| | 3 | % | | $ | 2,744 |
| | $ | 2,669 |
| | 3 | % |
Fertilizers (a) | 72 |
| | 71 |
| | 1 |
| | 104 |
| | 111 |
| | (6 | ) | | 1,444 |
| | 1,563 |
| | (8 | ) | 77 |
| | 76 |
| | 1 |
| | 129 |
| | 127 |
| | 2 |
| | 1,675 |
| | 1,671 |
| | — |
|
| Industrial | | | | | | | | | | | | | | | | | | | | | | | | | | | | | | | | | | |
Chemicals (a) | 173 |
| | 187 |
| | (7 | ) | | 542 |
| | 582 |
| | (7 | ) | | 3,133 |
| | 3,112 |
| | 1 |
| 175 |
| | 175 |
| | — |
| | 566 |
| | 546 |
| | 4 |
| | 3,234 |
| | 3,120 |
| | 4 |
|
| Automotive | 115 |
| | 109 |
| | 6 |
| | 304 |
| | 287 |
| | 6 |
| | 2,643 |
| | 2,633 |
| | — |
| 119 |
| | 113 |
| | 5 |
| | 316 |
| | 290 |
| | 9 |
| | 2,655 |
| | 2,566 |
| | 3 |
|
Metals and Equipment (a) | 63 |
| | 72 |
| | (13 | ) | | 180 |
| | 190 |
| | (5 | ) | | 2,857 |
| | 2,639 |
| | 8 |
| 70 |
| | 62 |
| | 13 |
| | 190 |
| | 165 |
| | 15 |
| | 2,714 |
| | 2,661 |
| | 2 |
|
| Housing and Construction | | | | | | | | | | | | | | | | | | | | | | | | | | | | | | | | | | |
Minerals (a) | 86 |
| | 87 |
| | (1 | ) | | 125 |
| | 125 |
| | — |
| | 1,453 |
| | 1,437 |
| | 1 |
| 70 |
| | 58 |
| | 21 |
| | 114 |
| | 94 |
| | 21 |
| | 1,629 |
| | 1,621 |
| | — |
|
| Forest Products | 68 |
| | 73 |
| | (7 | ) | | 191 |
| | 203 |
| | (6 | ) | | 2,809 |
| | 2,781 |
| | 1 |
| 67 |
| | 68 |
| | (1 | ) | | 192 |
| | 189 |
| | 2 |
| | 2,866 |
| | 2,779 |
| | 3 |
|
| Total Merchandise | 686 |
| | 720 |
| | (5 | ) | | 1,741 |
| | 1,819 |
| | (4 | ) | | 2,538 |
| | 2,526 |
| | — |
| 699 |
| | 673 |
| | 4 |
| | 1,839 |
| | 1,734 |
| | 6 |
| | 2,631 |
| | 2,577 |
| | 2 |
|
| Coal | 207 |
| | 261 |
| | (21 | ) | | 467 |
| | 583 |
| | (20 | ) | | 2,256 |
| | 2,234 |
| | 1 |
| 205 |
| | 200 |
| | 3 |
| | 522 |
| | 399 |
| | 31 |
| | 2,546 |
| | 1,995 |
| | 28 |
|
| Intermodal | 681 |
| | 731 |
| | (7 | ) | | 425 |
| | 451 |
| | (6 | ) | | 624 |
| | 617 |
| | 1 |
| 688 |
| | 678 |
| | 1 |
| | 434 |
| | 405 |
| | 7 |
| | 631 |
| | 597 |
| | 6 |
|
| Other |
|
| |
|
| | — |
| | 77 |
| | 86 |
| | (10 | ) | | — |
| | — |
| | — |
| — |
| |
|
| | — |
| | 74 |
| | 80 |
| | (8 | ) | | — |
| | — |
| | — |
|
| Total | 1,574 |
| | 1,712 |
| | (8 | )% | | $ | 2,710 |
| | $ | 2,939 |
| | (8 | )% | | $ | 1,722 |
| | $ | 1,717 |
| | — | % | 1,592 |
| | 1,551 |
| | 3 | % | | $ | 2,869 |
| | $ | 2,618 |
| | 10 | % | | $ | 1,802 |
| | $ | 1,688 |
| | 7 | % |
| | | | | | | | | | | | | | | | | | | | | | | | | | | | | | | | | | | |
| Nine Months | |
| | Volume | | Revenue | | Revenue Per Unit | |
| | 2016 | | 2015 | | % Change | | 2016 | | 2015 | | % Change | | 2016 | | 2015 | | % Change | |
| Agricultural | | | | | | | | | | |
Agricultural and Food Products (a) | 346 |
| | 378 |
| | (8 | )% | | $ | 925 |
| | $ | 1,010 |
| | (8 | )% | | $ | 2,673 |
| | $ | 2,672 |
| | — | % | |
Fertilizers (a) | 220 |
| | 227 |
| | (3 | ) | | 345 |
| | 369 |
| | (7 | ) | | 1,568 |
| | 1,626 |
| | (4 | ) | |
| Industrial | | | | | | | | | | | | | | | | | | |
Chemicals (a) | 520 |
| | 550 |
| | (5 | ) | | 1,622 |
| | 1,736 |
| | (7 | ) | | 3,119 |
| | 3,156 |
| | (1 | ) | |
| Automotive | 349 |
| | 330 |
| | 6 |
| | 907 |
| | 867 |
| | 5 |
| | 2,599 |
| | 2,627 |
| | (1 | ) | |
Metals and Equipment (a) | 196 |
| | 219 |
| | (11 | ) | | 531 |
| | 555 |
| | (4 | ) | | 2,709 |
| | 2,534 |
| | 7 |
| |
| Housing and Construction | | | | | | | | | | | | | | | | | | |
Minerals (a) | 230 |
| | 228 |
| | 1 |
| | 345 |
| | 346 |
| | — |
| | 1,500 |
| | 1,518 |
| | (1 | ) | |
| Forest Products | 204 |
| | 220 |
| | (7 | ) | | 572 |
| | 603 |
| | (5 | ) | | 2,804 |
| | 2,741 |
| | 2 |
| |
| Total Merchandise | 2,065 |
| | 2,152 |
| | (4 | ) | | 5,247 |
| | 5,486 |
| | (4 | ) | | 2,541 |
| | 2,549 |
| | — |
| |
| Coal | 602 |
| | 845 |
| | (29 | ) | | 1,282 |
| | 1,851 |
| | (31 | ) | | 2,130 |
| | 2,191 |
| | (3 | ) | |
| Intermodal | 2,053 |
| | 2,109 |
| | (3 | ) | | 1,249 |
| | 1,316 |
| | (5 | ) | | 608 |
| | 624 |
| | (3 | ) | |
| Other | — |
| | — |
| | — |
| | 254 |
| | 377 |
| | (33 | ) | | — |
| | — |
| | — |
| |
| Total | 4,720 |
| | 5,106 |
| | (8 | )% | | $ | 8,032 |
| | $ | 9,030 |
| | (11 | )% | | $ | 1,702 |
| | $ | 1,769 |
| | (4 | )% | |
(a) At the beginning of the third quarter 2016, in order to better align markets with the Company's business strategy, changes were made in the categorization of certain lines of business. Prior periods have been reclassified to conform to the current presentation and are posted on the Company's website at csx.com under the investors section.
Agricultural and Food Products includes the combination of the previous Agricultural Products and Food and Consumer markets.
Fertilizers was previously named Phosphates and Fertilizers.
Metals and Equipment includes the Equipment portion of the previous Waste and Equipment market.
Chemicals includes the Waste portion of the previous Waste and Equipment market. Chemicals also includes fly ash for remediation purposes (a form of waste) which was previously included within the Minerals market.
|
| | |
| | CSX Q3 2016Q1 2017 Form 10-Q p.27p.28
|
|
CSX CORPORATION
ITEM 2. MANAGEMENT'S DISCUSSION AND ANALYSIS OF FINANCIAL CONDITION AND RESULTS OF OPERATIONS
ThirdFirst Quarter 20162017
Revenue
Revenue was down $229increased $251 million to $2.7$2.9 billion from the prior year's thirdfirst quarter as pricedue to volume growth, pricing gains were more than offset by volume declines, lowerand increased fuel surcharge revenue and negative business mix.surcharge.
Merchandise
Agricultural Sector
Agricultural and Food Products - Volume decline, primarilywas flat as gains in ethanol driven by higher production levels were offset by declines in the export grain products, reflected additional local truck sourcing to feed mills in lieu of longer-haul rail moves, spurred by a large southeastern crop. In addition,market as the strong U.S. dollar continued to support import grain as a supplement to domestic, rail-sourced grain.South American harvest and low barge rates negatively impacted rail volumes.
Fertilizers - Volume increased modestly as robust demand in Brazil drove strength in export phosphates.due to rail conversion of phosphate rock traffic that would otherwise move by truck. This growth was partially offset as oversupply hamperedby reduced demand for nitrogen shipments leadingreflecting the anticipated shift of acres planted from corn to declines in domestic fertilizer.soybeans.
Industrial Sector
Chemicals - Lower volume reflected ongoing difficultiesVolume was flat as fly ash shipments, which began moving a year ago, ramped up over several quarters to current levels. Growth was also driven by soil remediation projects and frac sand due to an increase in energy markets, specificallydrilling activity. These gains were offset by lower crude oil in whichshipments as crude by rail economics are increasingly challenged for crude-by-rail to the East Coast. The continued ramp up of shipments of fly ash, a by-product of burning coal that requires environmental remediation and is now included in the realigned chemicals market, partially offset overall volume decline.remained challenged.
Automotive - Volume increased, driven by SUV and truck shipments, as North American light vehicle production continuedincreased versus the prior year at a high level and CSX experienced growth across several key customers. Movement of trucks and SUV’s continued to outpace passenger cars, which was consistent with consumer buying patterns.CSX-served plants.
Metals and Equipment - Volume declined as CSX continuedgrew due to cycle mill closures and lowerimproved domestic steel production, levels at remaining mills brought on by persistent, above-averagewhich reflected moderating import steel levels resulting from the strong U.S. dollar.pressure and increased construction-related activity.
Housing and Construction Sector
Forest ProductsMinerals - Volume declinedgrew as shipments of aggregates increased, reflecting construction project activity and periods of mild winter weather, which allowed for additional production and movement. In addition, salt demand improved after a few significant snow storms depleted stockpiles in paper products due to continued industry consolidation, electronic substitution and near-term losses to truck as a result of excess capacity and low prices. Further, a strong U.S. dollar challenged exports and increased imports that do not generally move by rail.the northeast.
MineralsForest Products - Volume was down modestly primarily as a result of reduced steel production, which hampered demand for lime, an inputtruck competition from excess capacity continued to steel making. However, aggregates movement continued at high levels, reflecting road and non-residential constructionconstrain growth despite positive momentum particularly in the south.housing market and rail shipments of building products. In addition, headwinds from electronic substitution continued to negatively impact shipments of paper products.
|
| | |
| | CSX Q3 2016Q1 2017 Form 10-Q p.28p.29
|
|
CSX CORPORATION
ITEM 2. MANAGEMENT'S DISCUSSION AND ANALYSIS OF FINANCIAL CONDITION AND RESULTS OF OPERATIONS
Coal
Domestic Utility Coal - Volume declines, though still significant, begandeclined due to moderatemild winter weather and a competitive loss of short-haul interchange traffic as hot summer weather drove additional demand despite high coal inventories and low natural gas prices.previously conveyed.
Domestic Coke, Iron Ore and Other - Volumes remained weak in the face of an oversupplied coke market driven by continued softness in domestic integrated steelIron ore shipments were down as a large customer retooled its production, and the idling of a customer facility.but overall demand was stable.
Export Coal - Volume was down due to oversupply inincreased as global supply levels and pricing conditions extended the world market and a strong demand environment for U.S. dollar that continued to hinder U.S. producer competitiveness. However, both metallurgical and thermal benchmarks improved during the quarter such that the rate of volume decline became considerably less when compared to previous quarters.coal exports.
Intermodal
Domestic - Volume decreased threedeclined one percent driven byas the impact of a short-haul competitive loss in the third quarter of some short-haul interchange traffic. Despite ample over-the-road truck capacity, the balance of the domestic portfolio remained near historic highs, reflecting success withlast year was partially offset by continued growth in CSX’s highway-to-rail conversion program and improved network service offerings and service levels.initiative.
International - Volume was down 12increased five percent, reflecting the continued cycling of a prior account lossimproving demand in international freight flows and the weaker global freight environment.strong performance in several large customer accounts.
Expenses
Expenses decreased $137increased $243 million to $1.9$2.2 billion year over year, primarily driven by a restructuring charge and a fuel price increase, partially offset by efficiency savings and lower volume-related costs.savings. Variances versus the prior year's thirdfirst quarter are described below.
Labor and Fringe expense decreased $25$7 million due to the following:
Inflation of $36 million was driven primarily by increased health and welfare costs.
Incentive compensation was $37$30 million higher reflecting the expected award payouts on existing plans.
Inflation resulted in $28Volume-related costs were $21 million of additional cost driven primarily by increased health and welfare costs.higher.
Efficiency savings of $53$74 million were driven by lower T&E and operating support costs as a result of structural changes and reduced crew training.
Volume-related costs were $35 million lower.costs.
Other costs decreased $2 million.by $20 million primarily due to a $14 million decrease in pension expense.
Materials, Supplies and Other expense decreased $73increased $17 million due to the following:
Inflation resulted in $9 million of additional cost.
Volume-related costs were $15 million higher.
Efficiency savings of $38$41 million were primarily related to lower operating support costs.
Other costs driven by structural changes, and lower non-operating support costs, driven by broad cost containment.
Train accidents, casualty and freight loss were $22increased $34 million lower, primarily due to $14 million in prior year train accidents costsfavorable adjustments that were higher thandid not repeat in the current period.quarter and several other items.
Volume-related costs were $7 million lower.
Various other costs decreased $15 million.
Fuel expense decreased $49increased $68 million due to the following:
An 11A 45 percent price decline was the primary driver for $20increase drove $67 million in additional fuel expense savings.expense.
Volume-related costs were $6 million higher due to a five percent year-over-year increase in gross ton miles.
Efficiency savings of $15$5 million were primarily related to process improvement and locomotive fuel reduction technology and process improvement.
Volume-related costs were $14 million lower.initiatives.
Depreciation expense increased $19$7 million primarily due to a larger asset base.
|
| | |
| | CSX Q3 2016Q1 2017 Form 10-Q p.29p.30
|
|
CSX CORPORATION
ITEM 2. MANAGEMENT'S DISCUSSION AND ANALYSIS OF FINANCIAL CONDITION AND RESULTS OF OPERATIONS
Equipment and Other Rents expense decreased $9$15 million due to the following:
Inflation resulted in $3 million of additional cost due to higher rates on automotive freight cars.
Volume-related costs were $3decreased by $4 million, higherdespite an overall year-over-year volume increase, due to increaseslower rents on certain boxcars primarily attributable to demand decreases in automotive volume.
paper products.Efficiency savings of $6$3 million were due to improved car cycle times.
miles per car.Other costs decreased $9$11 million primarily due to lower intermodalrental income that was previously classified as other income in the prior years being reclassified to operating expense in the current year.
Restructuring charge includes costs related to the management workforce reduction, the proration of equity awards and other equipment rents.advisory costs related to the leadership transition.
Interest expense increased $3decreased $6 million primarily due to lower average interest rates, partially offset by higher average debt balances partially offset by lower average interest rates.balances.
Other income - net increased $11 million primarily due to a prior year environmental cleanup cost related to non-operating activities that did not repeat in the current year, as well as miscellaneous income items.change versus prior year's first quarter.
Income tax expense decreased $32increased $8 million primarily due to lower earnings.increased earnings before income taxes.
Nine Months Results of Operations
Revenue decreased $998 million reflecting significant volume declines, lower fuel recoveries and a $99 million year-over-year decline in other revenue related to payments received in 2015 from customers that did not meet volume commitments. These impacts more than offset any pricing gains.
Expenses were lower by $590 million driven by efficiency savings of $341 million and lower volume-related costs of $202 million as a result of structural changes and broad cost containment in the face of the dynamic market environment. In addition, the reduction in the price of fuel resulted in an expense decline of $154 million year-to-date.
Operating income decreased$408 million primarily due to volume declines, partially offset by efficiency savings.
Interest expense increased $19 million primarily due to higher average debt balances partially offset by lower average interest rates associated with newer debt.
Other income - net increased$20 million due to several non-operating items, none of which were individually significant.
Income tax expense decreased $161 million primarily due to lower earnings.
|
| | |
| | CSX Q3 2016Q1 2017 Form 10-Q p.30p.31
|
|
CSX CORPORATION
ITEM 2. MANAGEMENT'S DISCUSSION AND ANALYSIS OF FINANCIAL CONDITION AND RESULTS OF OPERATIONS
Non-GAAP Measures - Unaudited
CSX reports its financial results in accordance with accounting principles generally accepted in the United States of America (U.S. GAAP). CSX also uses certain non-GAAP measures that fall within the meaning of Securities and Exchange Commission Regulation G and Regulation S-K Item 10(e), which may provide users of the financial information with additional meaningful comparison to prior reported results. Non-GAAP measures do not have standardized definitions and are not defined by U.S. GAAP. Therefore, CSX’s non-GAAP measures are unlikely to be comparable to similar measures presented by other companies. The presentation of these non-GAAP measures should not be considered in isolation from, as a substitute for, or as superior to the financial information presented in accordance with GAAP. Reconciliations of non-GAAP measures to corresponding GAAP measures are below.
Adjusted Operating Results
Management believes that adjusted operating income, adjusted operating ratio, adjusted net earnings and adjusted net earnings per share, assuming dilution are important in evaluating the Company’s operating performance and for planning and forecasting future business operations and future profitability. These non-GAAP measures provide meaningful supplemental information regarding operating results because they exclude certain significant items that are not considered indicative of future financial trends. The $173 million restructuring charge impact to net earnings and net earnings per share, assuming dilution was tax effected using a tax rate of 37.8%.
|
| | | | | | | | | | | | | | |
| | For the Quarter ended March 31, 2017 |
| (in millions, except operating ratio and net earnings per share, assuming dilution) | Operating Income | | Operating Ratio | | Net Earnings | | Net Earnings Per Share, Assuming Dilution |
| | | | | | | | |
| GAAP Operating Results | $ | 712 |
| | 75.2 | % | | $ | 362 |
| | $ | 0.39 |
|
| Restructuring Charge | 173 |
| | (6.0 | )% | | 108 |
| | 0.12 |
|
| Adjusted Operating Results (non-GAAP) | $ | 885 |
| | 69.2 | % | | $ | 470 |
| | $ | 0.51 |
|
| | | | | | | | |
Free Cash Flow
Management believes that free cash flow is useful to investors as it is important in evaluating the Company’s financial performance. More specifically, free cash flow measures cash generated by the business after reinvestment. This measure represents cash available for both equity and bond investors to be used for dividends, share repurchases or principal reduction on outstanding debt. Free cash flow should be considered in addition to, rather than a substitute for, cash provided by operating activities. Free cash flow is calculated by using net cash from operations and adjusting for property additions and certain other investing activities. The following table reconciles cash provided by operating activities (GAAP measure) to adjusted free cash flow after restructuring, before dividends (non-GAAP measure). The restructuring charge impact to free cash flow was tax effected using a tax rate of 37.8%.
|
| | | | | | |
| | Quarter Ended |
| (Dollars in millions) | March 31, 2017 | March 25, 2016 |
| Net cash provided by operating activities | 1,043 |
| 754 |
|
| Property additions | (441 | ) | (425 | ) |
| Other investing activities | 25 |
| 31 |
|
| Free Cash Flow (before payment of dividends) | 627 |
| 360 |
|
| Add back: Cash paid related to Restructuring Charge (after-tax) | 7 |
| — |
|
| Adjusted Free Cash Flow Before Dividends (non-GAAP) | $ | 634 |
| $ | 360 |
|
|
| | |
| CSX Q1 2017 Form 10-Q p.32
|
|
CSX CORPORATION
ITEM 2. MANAGEMENT'S DISCUSSION AND ANALYSIS OF FINANCIAL CONDITION AND RESULTS OF OPERATIONS
Operating Statistics (Estimated) | |
| Third Quarters | | Nine Months | First Quarters |
| | 2016 | 2015 | Improvement/ (Deterioration) | | 2016 | 2015 | Improvement/
(Deterioration) | 2017 | 2016 | Improvement/ (Deterioration) |
| Safety and Service Measurements | | | | |
| FRA Personal Injury Frequency Index | 1.23 |
| 1.06 |
| (16 | )% | | 1.02 |
| 0.88 |
| (16 | )% | 0.99 |
| 0.91 |
| (9 | )% |
| FRA Train Accident Rate | 2.22 |
| 2.88 |
| 23 | % | | 2.38 |
| 2.52 |
| 6 | % | 2.37 |
| 3.14 |
| 25 | % |
| | | | | |
| On-Time Originations | 84 | % | 76 | % | 11 | % | | 84 | % | 64 | % | 31 | % | 81 | % | 81 | % | — | % |
| On-Time Arrivals | 64 | % | 54 | % | 19 | % | | 66 | % | 48 | % | 38 | % | 61 | % | 64 | % | (5 | )% |
| | | | | |
| Train Velocity | 20.8 |
| 20.5 |
| 1 | % | | 21.0 |
| 20.3 |
| 3 | % | 20.2 |
| 21.1 |
| (4 | )% |
| Dwell | 25.6 |
| 25.2 |
| (2 | )% | | 25.6 |
| 25.9 |
| 1 | % | 26.1 |
| 26.0 |
| — | % |
| | | | | |
| Cars-On-Line | 207,964 |
| 204,082 |
| (2 | )% | | 207,092 |
| 206,075 |
| — | % | 210,589 |
| 207,357 |
| (2 | )% |
Certain operating statistics are estimated and can continue to be updated as actuals settle.
Key Performance Measures Definitions
FRA Personal Injury Frequency Index - Number of FRA-reportable injuries per 200,000 man-hours.
FRA Train Accident Rate - Number of FRA-reportable train accidents per million train-miles.
On-Time Originations - Percent of scheduled road trains that depart the origin yard on-time or ahead of schedule.
On-Time Arrivals - Percent of scheduled road trains that arrive at the destination yard on-time to two hours late (30 minutes for intermodal trains).
Train Velocity - Average train speed between terminals in miles per hour (does not include locals, yard jobs, work trains or passenger trains).
Dwell - Average amount of time in hours between car arrival at and departure from the yard. It does not include cars moving through the yard on the same train.
Cars-On-Line - An average count of all cars on the network (does not include locomotives, cabooses, trailers, containers or maintenance equipment).
The Company measures and reports safety and service performance. The Company strives for continuous improvement in these measures through training, innovation and investment. CSX's safety and train accident prevention programs rely on the latest tools, programs and employee participation that are designed to continuously strengthen the safety culture. Increased investment in training and technology also is designed to allow CSX employees to have an additional layer of protection that can detect and avoid many types of human factor incidents. The Company's safety programs are designed to prevent incidents that can adversely impact employees, customers and communities.
Continued capital investment in the Company's assets, including track, bridges, signals, equipment and detection technology also supports safety performance. CSX has established formal relationships with industry groups, leading universities and suppliers
CSX’s FRA reportable personal injury frequency index of 0.99 for the quarter was nine percent unfavorable, despite a slight reduction in the number of injuries, due to develop, implement and deploya significant decline in man-hours from fewer employees. The FRA train accident frequency rate of 2.37 for the latest technology that can detect infrastructure problems before they happen. To illustrate, throughquarter improved 25 percent from the prior year due to a waiver granted bysubstantial reduction in the Federal Railroad Administration ("FRA"), CSX is using advanced continuous rail testing methods that are being adopted by other railroads asnumber of accident occurrences in comparison to the system’s value is proven.
prior year. The Company constantly collaboratesremains committed to ongoing improvement, with a focus on avoiding catastrophic events.
CSX’s operating performance remained stable in the first quarter. On-time originations were 81 percent, which were consistent with the FRAprevious year, and industry organizations as well as federal, stateon-time arrivals decreased to 61 percent, a five percent decline year-over-year. Average train velocity experienced a four percent decline to 20.2 miles per hour and local governments on safety innovations and initiatives. For example, CSX and other freight railroads have actively worked withterminal dwell of 26.1 hours remained relatively constant when compared to the U.S. Department of Transportation and other key stakeholders to evaluate and implement far-reaching safety enhancements for transportation of certain flammable materials, including essential energy products, on the nation’s freight railroad network.prior year.
|
| | |
| | CSX Q3 2016Q1 2017 Form 10-Q p.31p.33
|
|
CSX CORPORATION
ITEM 2. MANAGEMENT'S DISCUSSION AND ANALYSIS OF FINANCIAL CONDITION AND RESULTS OF OPERATIONS
CSX’s FRA reportable personal injury frequency index of 1.23 for the quarter was 16 percent unfavorable as a reduction in the number of injuries was more than offset by a significant decline in man-hours due to fewer employees. The FRA train accident frequency rate of 2.22 for the quarter improved 23 percent from the prior year. The Company remains committed to ongoing improvement, with a focus on avoiding catastrophic events.
CSX’s operating performance in the third quarter was improved versus last year and stable sequentially. On-time originations were 84 percent, an 11 percent improvement year-over-year, and on-time arrivals increased 19 percent, to 64 percent. Average train velocity of 20.8 miles per hour and terminal dwell of 25.6 hours remained stable when compared to the prior year. The Company expects to sustain or improve this level of performance while continuing to drive productivity and resource efficiency.
LIQUIDITY AND CAPITAL RESOURCES
The following are material changes in the consolidated balance sheets and sources of liquidity and capital, which provide an update to the discussion included in CSX's most recent annual report on Form 10-K.
Material Changes in Consolidated Balance Sheets and Significant Cash Flows
Consolidated Balance Sheets
Total assets decreased $64increased $298 million from prior year primarily due to netan increase in cash, outflows, including short-term investment activity of $683approximately $200 million partially offset by theand an increase in net properties of $608approximately $110 million. Total liabilities and shareholders' equity combined decreased $64increased $298 million from year end primarily due to $307the net increase in income taxes payable of approximately $170 million repaymentand a restructure charge of seller-financed assets and lower pension and other post-retirement benefit liabilities of $36$173 million, partially offset by an increasea $100 million reduction in deferred income taxesLabor and Fringe primarily due to the payout of $326 million.incentive compensation.
Significant Cash Flows
The following chart highlights net cash activity of $25$327 million as compared to $128$103 million for operating, investing and financing activities for ninethree months ended 20162017 and 2015.2016.
Cash provided by operating activities decreased $24increased $289 million primarily driven by voluntary contributions tohigher collections of freight accounts receivable and the Company's qualified pension planstiming of tax, payroll and working capital activities, partially offset by lower incentive compensationinterest payments.
Cash used in investing activities declined $1,058increased $327 million primarily driven by lower purchasesnet sales of short-term investments and lower property additions.investments.
Cash used in financing activities increased $931decreased $262 million due to lower net debt issued, theas a repayment of seller-financed assets and higher share repurchases.that occurred in the prior year did not repeat in the current year.
|
| | |
| | CSX Q3 2016Q1 2017 Form 10-Q p.32p.34
|
|
CSX CORPORATION
ITEM 2. MANAGEMENT'S DISCUSSION AND ANALYSIS OF FINANCIAL CONDITION AND RESULTS OF OPERATIONS
Projected capital investments for 20162017 are now expected to be $2.7$2.1 billion, including approximately $300$270 million for Positive Train Control ("PTC"). This $2.7 billion excludes investments related to partially or wholly reimbursable public-private partnerships where reimbursements may not be fully received in the year the reimbursement obligation arises. Of the 20162017 investment, approximately 40 percentover half will be used to sustain the core infrastructure. The remaining amounts will be allocated to locomotives, freight cars and high return projects supporting long-term profitable growth, productivity initiatives and service improvements. CSX intends to fund capital investments through cash generated from operations.
The Company has incurred significant capital costs in connection with the implementation of PTC and has substantial work ahead. CSX estimates that the total multi-year cost of PTC implementation will be approximately $2.2$2.4 billion. This estimate includes costs for installing the new system along tracks, upgrading locomotives, adding communication equipment and developing new technologies. Total PTC spending through September 2016March 2017 was $1.7$1.8 billion.
Liquidity and Working Capital
As of the end of thirdfirst quarter 2016,2017, CSX had $755 million$1.2 billion of cash, cash equivalents and short-term investments. CSX has a $1$1.0 billion unsecured revolving credit facility backed by a diverse syndicate of banks. This facility expires in May 2020 and as of the date of this filing, the Company has no outstanding balances under this facility. CSX uses current cash balances for general corporate purposes, which may include reduction or refinancing of outstanding indebtedness, capital expenditures, working capital requirements, contributions to the Company's qualified pension plan, redemptions and repurchases of CSX common stock and dividends to shareholders. See Note 7, Debt and Credit Agreements.
Subsequent to the third quarter, on September 28, 2016, theThe Company renewed and modified its existinghas a receivables securitization facility. The facility was to expire in June 2017 and is now extended with a similar three-year term scheduled to expire in September 2019. It was also modified to provide liquidity of up to $200 million, changed from $250 million, along with modifications to other terms. The purpose of this facility is to provide an alternative to commercial paper and a low cost source of short-term liquidity.liquidity of up to $200 million, depending on eligible receivables balances. As of the date of this filing, the Company has no outstanding balances under this facility.
Working capital can also be considered a measure of a company's ability to meet its short-term needs. CSX had a working capital deficitsurplus of $100$383 million and surplus of $888$447 million as of September 23, 2016March 31, 2017 and December 25, 2015,30, 2016, respectively. This large changeThe decline since year-end in working capital of $988$64 million relatesis primarily due to cash used for property additionsan increase in current income taxes payable of $1,590 million, share repurchases of $778$173 million and dividendsa current restructuring severance liability of $513approximately $80 million, more than offsettingpartially offset by an increase of $178 million in net cash generated from operations of $2,488 million. Also, debt due in the next 12 months increased $611 million.and short-term investments.
The Company's working capital balance varies due to factors such as the timing of scheduled debt payments and changes in cash and cash equivalent balances as discussed above. The Company continues to maintain adequate liquidity to satisfy current liabilities and maturing obligations when they come due. Furthermore, CSX has sufficient financial capacity, including its revolving credit facility, trade receivable facility and shelf registration statement to manage its day-to-day cash requirements and any anticipated obligations. The Company from time to time accesses the credit markets for additional liquidity.
|
| | |
| | CSX Q3 2016Q1 2017 Form 10-Q p.33p.35
|
|
CSX CORPORATION
ITEM 2. MANAGEMENT'S DISCUSSION AND ANALYSIS OF FINANCIAL CONDITION AND RESULTS OF OPERATIONS
CRITICAL ACCOUNTING ESTIMATES
The preparation of financial statements in conformity with accounting principles generally accepted in the United States requires that management make estimates in reporting the amounts of certain assets and liabilities, the disclosure of contingent assets and liabilities at the date of the financial statements and certain revenues and expenses during the reporting period. Actual results may differ from those estimates. These estimates and assumptions are discussed with the Audit Committee of the Board of Directors on a regular basis. Consistent with the prior year, significant estimates using management judgment are made for the areas below. For further discussion of CSX's critical accounting estimates, see the Company's most recent annual report on Form 10-K.
casualty, environmental and legal reserves;
pension and post-retirement medical plan accounting;
depreciation policies for assets under the group-life method; and
income taxes.
FORWARD-LOOKING STATEMENTS
Certain statements in this report and in other materials filed with the SEC, as well as information included in oral statements or other written statements made by the Company, are forward-looking statements. The Company intends for all such forward-looking statements to be covered by the safe harbor provisions for forward-looking statements within the meaning of the Private Securities Litigation Reform Act of 1995 and the provisions of Section 27A of the Securities Act of 1933 and Section 21E of the Securities Exchange Act of 1934. These forward-looking statements within the meaning of the Private Securities Litigation Reform Act may contain, among others, statements regarding:
projections and estimates of earnings, revenues, margins, volumes, rates, cost-savings, expenses, taxes or other financial items;
expectations as to results of operations and operational initiatives;
expectations as to the effect of claims, lawsuits, environmental costs, commitments, contingent liabilities, labor negotiations or agreements on the Company's financial condition, results of operations or liquidity;
management's plans, strategies and objectives for future operations, capital expenditures, dividends, share repurchases, safety and service performance, proposed new services and other matters that are not historical facts, and management's expectations as to future performance and operations and the time by which objectives will be achieved; and
future economic, industry or market conditions or performance and their effect on the Company's financial condition, results of operations or liquidity.
Forward-looking statements are typically identified by words or phrases such as "will," "should," “believe,” “expect,” “anticipate,” “project,” “estimate,” “preliminary” and similar expressions. The Company cautions against placing undue reliance on forward-looking statements, which reflect its good faith beliefs with respect to future events and are based on information currently available to it as of the date the forward-looking statement is made. Forward-looking statements should not be read as a guarantee of future performance or results and will not necessarily be accurate indications of the timing when, or by which, such performance or results will be achieved.
|
| | |
| | CSX Q3 2016Q1 2017 Form 10-Q p.34p.36
|
|
CSX CORPORATION
ITEM 2. MANAGEMENT'S DISCUSSION AND ANALYSIS OF FINANCIAL CONDITION AND RESULTS OF OPERATIONS
Forward-looking statements are subject to a number of risks and uncertainties and actual performance or results could differ materially from those anticipated by any forward-looking statements. The Company undertakes no obligation to update or revise any forward-looking statement. If the Company does update any forward-looking statement, no inference should be drawn that the Company will make additional updates with respect to that statement or any other forward-looking statements. The following important factors, in addition to those discussed in Part II, Item 1A (Risk Factors) of CSX's most recent annual report on Form 10-K and elsewhere in this report, may cause actual results to differ materially from those contemplated by any forward-looking statements:
legislative, regulatory or legal developments involving transportation, including rail or intermodal transportation, the environment, hazardous materials, taxation and initiatives to further regulate the rail industry;
the outcome of litigation, claims and other contingent liabilities, including, but not limited to, those related to fuel surcharge, environmental matters, taxes, shipper and rate claims subject to adjudication, personal injuries and occupational illnesses;
changes in domestic or international economic, political or business conditions, including those affecting the transportation industry (such as the impact of industry competition, conditions, performance and consolidation) and the level of demand for products carried by CSXT;
natural events such as severe weather conditions, including floods, fire, hurricanes and earthquakes, a pandemic crisis affecting the health of the Company's employees, its shippers or the consumers of goods, or other unforeseen disruptions of the Company's operations, systems, property or equipment;
competition from other modes of freight transportation, such as trucking and competition and consolidation or financial distress within the transportation industry generally;
the cost of compliance with laws and regulations that differ from expectations (including those associated with PTC implementation), as well as costs, penalties and operational and liquidity impacts associated with noncompliance with applicable laws or regulations;
the impact of increased passenger activities in capacity-constrained areas, including potential effects of high speed rail initiatives, or regulatory changes affecting when CSXT can transport freight or service routes;
unanticipated conditions in the financial markets that may affect timely access to capital markets and the cost of capital, as well as management's decisions regarding share repurchases;
changes in fuel prices, surcharges for fuel and the availability of fuel;
the impact of natural gas prices on coal-fired electricity generation;
availability of insurance coverage at commercially reasonable rates or insufficient insurance coverage to cover claims or damages;
the inherent business risks associated with safety and security, including the transportation of hazardous materials or a cybersecurity attack which would threaten the availability and vulnerability of information technology;
|
| | |
| | CSX Q3 2016Q1 2017 Form 10-Q p.35p.37
|
|
CSX CORPORATION
ITEM 2. MANAGEMENT'S DISCUSSION AND ANALYSIS OF FINANCIAL CONDITION AND RESULTS OF OPERATIONS
adverse economic or operational effects from actual or threatened war or terrorist activities and any governmental response;
labor and benefit costs and labor difficulties, including stoppages affecting either the Company's operations or customers' ability to deliver goods to the Company for shipment;
the Company's success in implementing its strategic, financial and operational initiatives;
changes in operating conditions and costs or commodity concentrations; and
the inherent uncertainty associated with projecting economic and business conditions.
Other important assumptions and factors that could cause actual results to differ materially from those in the forward-looking statements are specified elsewhere in this report and in CSX's other SEC reports, which are accessible on the SEC's website at www.sec.gov and the Company's website at www.csx.com. The information on the CSX website is not part of this quarterly report on Form 10-Q.
ITEM 3. QUANTITATIVE AND QUALITATIVE DISCLOSURES ABOUT MARKET RISK
There have been no material changes in market risk from the information provided under Part II, Item 7A (Quantitative and Qualitative Disclosures about Market Risk) of CSX's most recent annual report on Form 10-K.
ITEM 4. CONTROLS AND PROCEDURES
As of September 23, 2016March 31, 2017, under the supervision and with the participation of CSX's Chief Executive Officer (“CEO”) and Chief Financial Officer (“CFO”), management has evaluated the effectiveness of the design and operation of the Company's disclosure controls and procedures. Based on that evaluation, the CEO and CFO concluded that, as of September 23, 2016March 31, 2017, the Company's disclosure controls and procedures were effective at the reasonable assurance level in timely alerting them to material information required to be included in CSX's periodic SEC reports. There were no changes in the Company's internal controls over financial reporting during the thirdfirst quarter of 20162017 that have materially affected or are reasonably likely to materially affect the Company's internal control over financial reporting.
PART II - OTHER INFORMATION
Item 1. Legal Proceedings
For further details, please refer to Note 5. Commitments and Contingencies of this quarterly report on Form 10-Q. Also refer to Part I, Item 3. Legal Proceedings in CSX's most recent annual report on Form 10-K.
Environmental Proceedings That Could Result in Fines Above $100,000
In connection with a CSXT train derailment in Mount Carbon, West Virginia in February 2015, the Company has entered into discussions with the U.S. Department of Justice and the U.S. Environmental Protection Agency concerning a regulatory penalty related to a release of product into the environment. Although final resolution of this matter is subject to further discussions and potential litigation, the Company does not believe that the outcome will have a material effect on its financial position, results of operations or liquidity.
Item 1A. Risk Factors
For information regarding factors that could affect the Company's results of operations, financial condition and liquidity, see the risk factors discussed under Part II, Item 7 (Management's Discussion and Analysis of Financial Condition and Results of Operations) of CSX's most recent annual report on Form 10-K. See also Part I, Item 2 (Forward-Looking Statements) of this quarterly report on Form 10-Q.
|
| | |
| | CSX Q3 2016Q1 2017 Form 10-Q p.36p.38
|
|
Item 2. CSX Purchases of Equity Securities
CSX purchases its own shares for two primary reasons: (1) to further its goals under its share repurchase program and (2) to fund the Company’s contribution required to be paid in CSX common stock under a 401(k) plan that covers certain union employees.
InDuring the first quartersof 2017 and 2016, the Company repurchased approximately $258 million, or six million shares, and $249 million, or ten million shares, respectively under the $2 billion share repurchase program announced in April 2015,2015. As of April 5, 2017, the Company had completed all share repurchases under this program.
On April 20, 2017, the Company announced a new $2$1 billion share repurchase program, which is expected to be completed by April 2017. Duringover the third quarter of 2016 , the Company repurchased approximately $263 million, or ten million shares. Shares are retired immediately upon repurchase. next 12 months.
Management's assessment of market conditions and other factors guides the timing and volume of repurchases. Future share repurchases are expected to be funded by cash on hand, cash generated from operations and debt issuances. Shares are retired immediately upon repurchase. In accordance with the Equity Topicin the ASC, the excess of repurchase price over par value is recorded in retained earnings. Generally, retained earnings areis only impacted by net earnings and dividends.
Share repurchase activity for the thirdfirst quarter 20162017 was as follows:
|
| | | | | | | | | | |
| | CSX Purchases of Equity Securities for the Quarter | |
Third Quarter (a) | Total Number of Shares Purchased | Average Price Paid per Share | Total Number of Shares Purchased as Part of Publicly Announced Plans or Programs (b) | Approximate Dollar Value of Shares that May Yet Be Purchased Under the Plans or Programs |
| Beginning Balance | | | | $ | 810,810,259 |
|
| July | 3,078,740 |
| $ | 26.65 |
| 2,972,000 |
| 731,808,366 |
|
| August | 2,940,485 |
| 28.28 |
| 2,940,100 |
| 648,648,448 |
|
| September | 3,492,370 |
| 28.58 |
| 3,492,100 |
| 548,855,151 |
|
| Ending Balance | 9,511,595 |
| $ | 27.86 |
| 9,404,200 |
| $ | 548,855,151 |
|
|
| | | | | | | | | | |
| | CSX Purchases of Equity Securities for the Quarter | |
First Quarter (a) | Total Number of Shares Purchased | Average Price Paid per Share | Total Number of Shares Purchased as Part of Publicly Announced Plans or Programs (b) | Approximate Dollar Value of Shares that May Yet Be Purchased Under the Plans or Programs |
| Beginning Balance | | | | $ | 270,270,134 |
|
| January | 2,044,818 |
| $ | 38.93 |
| 1,938,768 |
| 195,428,197 |
|
| February | 1,660,565 |
| 47.58 |
| 1,660,500 |
| 116,424,432 |
|
| March | 2,175,500 |
| 47.78 |
| 2,175,500 |
| 12,474,350 |
|
| Ending Balance | 5,880,883 |
| $ | 44.65 |
| 5,774,768 |
| $ | 12,474,350 |
|
(a) ThirdFirst quarter 20162017 consisted of the following fiscal periods: July (June 25,January (December 31, 2016 - July 22, 2016)January 27, 2017), August (July 23, 2016February (January 28, 2017 - August 19, 2016)February 24, 2017), September (August 20, 2016March (February 25, 2017 - September 23, 2016)March 31, 2017).
(b) The difference of 107,395106,115 shares between the "Total Number of Shares Purchased" and the "Total Number of Shares Purchased as Part of Publicly Announced Plans or Programs" for the quarter represents shares purchased to fund the Company's contribution to a 401(k) plan that covers certain union employees.
Item 3. Defaults Upon Senior Securities
None
Item 4. Mine Safety Disclosures
Not Applicable
Item 5. Other Information
None
|
| | |
| | CSX Q3 2016Q1 2017 Form 10-Q p.37p.39
|
|
Item 6. Exhibits
|
| | |
| Exhibit designation | Nature of exhibit | Previously filed as exhibit to |
10.13.01 | Amended and Restated Bylaws of the Registrant, effective as of March 6, 2017 | March 7, 2017 Exhibit 3.1, Form 8-K |
| Material Contracts: |
| 10.01 | CSX Executives' Deferred Compensation2017-2019 Long Term Incentive Plan, Effective January 1, 2017*effective as of February 22, 2017 | February 27, 2017 Exhibit 10.1, Form 8-K |
| 10.02 | Separation Agreement, effective February 27, 2017, between Michael J. Ward and CSX Corporation | February 27, 2017 Exhibit 10.2, Form 8-K |
| 10.03 | Separation Agreement, effective February 27, 2017, between Clarence W. Gooden and CSX Corporation | February 27, 2017 Exhibit 10.3, Form 8-K |
| 10.04 | CSX Section 16 Officer Severance Benefit Plan, effective as of February 22, 2017 | February 27, 2017 Exhibit 10.4, Form 8-K |
| 10.05 | Letter Agreement, dated as of March 6, 2017, between CSX Corporation and MR Argent Advisor LLC | March 7, 2017 Exhibit 10.1, Form 8-K |
| 10.06 | Registration Rights Agreement, dated as of March 30, 2017, between CSX Corporation and MR Argent Advisor LLC | April 3, 2017 Exhibit 10.1, Form 8-K |
| 10.07* | Employment Agreement, effective as of March 6, 2017, between CSX Corporation and E. Hunter Harrison | |
| 10.08* | Inducement Non-Qualified Stock Option Agreement Under the CSX 2010 Stock and Incentive Award Plan between CSX Corporation and E. Hunter Harrison | |
| 10.09* | Inducement Non-Qualified Stock Option Agreement Under the CSX Special Executive Equity Award Program between CSX Corporation and E. Hunter Harrison | |
| | |
| | |
| Officer certifications: |
| 31* | Rule13a-14(a) Certifications | |
| 32* | Section 1350 Certifications | |
| Interactive data files: |
| 101* | The following financial information from CSX Corporation's Quarterly Report on Form 10-Q for the quarter ended September 23, 2016March 31, 2017 filed with the SEC on October 12, 2016,April 19, 2017, formatted in XBRL includes: (i) consolidated income statements for the fiscal periods ended September 23,March 31, 2017 and March 25, 2016, and September 25, 2015, (ii) consolidated comprehensive income statements for the fiscal periods ended September 23,March 31, 2017 and March 25, 2016 and September 25, 2015, (iii) consolidated balance sheets at September 23, 2016March 31, 2017 and December 25, 2015,30, 2016, (iv) consolidated cash flow statements for the fiscal periods ended September 23,March 31, 2017 and March 25, 2016, and September 25, 2015, and (v) the notes to consolidated financial statements.
| |
| | | |
| * Filed herewith | | |
|
| | |
| | CSX Q3 2016Q1 2017 Form 10-Q p.38p.40
|
|
SIGNATURE
Pursuant to the requirements of the Securities Exchange Act of 1934, the registrant has duly caused this report to be signed on its behalf by the undersigned thereunto duly authorized.
CSX CORPORATION
(Registrant)
By: /s/ Carolyn T. Sizemore
Carolyn T. Sizemore
Vice President and Controller
(Principal Accounting Officer)
Dated: October 12, 2016April 20, 2017
|
| | |
| | CSX Q3 2016Q1 2017 Form 10-Q p.39p.41
|
|