UNITED STATES
SECURITIES AND EXCHANGE COMMISSION
WASHINGTON, D.C. 20549
FORM 10-Q
| |
| (X) | QUARTERLY REPORT PURSUANT TO SECTION 13 OR 15(d) OF THE SECURITIES EXCHANGE ACT OF 1934 |
For the quarterly period ended June 30, 2017March 31, 2018
OR
( ) TRANSITION REPORT PURSUANT TO SECTION 13 OR 15(d) OF THE SECURITIES EXCHANGE ACT OF 1934
For the transition period from __________ to __________
|
| | | | |
| Commission File Number 1-8022 |
|
| | | | | | | | | | |
| CSX CORPORATION |
| (Exact name of registrant as specified in its charter) |
| Virginia | | | | | | | | 62-1051971 | | |
| (State or other jurisdiction of incorporation or organization) | | | | | | | | (I.R.S. Employer Identification No.) | | |
| | | | | | | | | | | |
| 500 Water Street, 15th Floor, Jacksonville, FL | | | | | | 32202 | | (904) 359-3200 | | |
| (Address of principal executive offices) | | | | | | (Zip Code) | | (Telephone number, including area code) | | |
| | | | | | | | | | | |
| | | | | No Change | | | | | | |
| (Former name, former address and former fiscal year, if changed since last report.) |
Indicate by check mark whether the registrant (1) has filed all reports required to be filed by Section 13 or 15(d) of the Securities Exchange Act of 1934 during the preceding 12 months (or for such shorter period that the registrant was required to file such reports), and (2) has been subject to such filing requirements for the past 90 days.
Yes (X) No ( )
Indicate by check mark whether the registrant has submitted electronically and posted on its corporate Web site, if any, every Interactive Data File required to be submitted and posted pursuant to Rule 405 of Regulation S-T (§232.405 of this chapter) during the preceding 12 months (or for such shorter period that the registrant was required to submit and post such files).
Yes (X) No ( )
Indicate by check mark whether the registrant is a large accelerated filer, an accelerated filer, a non-accelerated filer, or a smaller reporting company. See the definitions of “large accelerated filer", "accelerated filer” and "smaller reporting company" in Rule 12b-2 of the Exchange Act. (check one)
Large Accelerated Filer (X) Accelerated Filer ( ) Non-accelerated Filer ( ) Smaller Reporting Company ( ) Emerging growth company ( )
If an emerging growth company, indicate by check mark if the registrant has elected not to use the extended transition period for complying with any new or revised financial accounting standards provided pursuant to Section 13(a) of the Exchange Act. ( )
Indicate by a check mark whether the registrant is a shell company (as defined in Rule 12b-2 of the Exchange Act).
Yes ( ) No (X)
There were 913,313,010875,353,546 shares of common stock outstanding on June 30, 2017March 31, 2018 (the latest practicable date that is closest to the filing date).
|
| | |
| | CSX Q2 2017Q1 2018 Form 10-Q p.1
|
|
CSX CORPORATION
FORM 10-Q
FOR THE QUARTERLY PERIOD ENDED JUNE 30, 2017MARCH 31, 2018
INDEX
|
| | | |
| | | | Page |
| PART I. | FINANCIAL INFORMATION | | |
| Item 1. | | | |
| | | | |
| | Quarters Ended June 30,March 31, 2018 and March 31, 2017 and June 24, 2016 | | |
| | | | |
| | Quarters Ended June 30,March 31, 2018 and March 31, 2017 and June 24, 2016 | | |
| | | | |
| | At June 30, 2017March 31, 2018 (Unaudited) and December 30, 201631, 2017 | | |
| | | | |
| | SixThree Months Ended June 30,March 31, 2018 and March 31, 2017 and June 24, 2016
| | |
| | | | |
| | | | |
| | | | |
| Item 2. | | | |
| | | | |
| Item 3. | | | |
| | | | |
| Item 4. | | | |
| | | | |
| PART II. | OTHER INFORMATION | | |
| Item 1. | | | |
| | | | |
| Item 1A. | | | |
| | | | |
| Item 2. | | | |
| | | | |
| Item 3. | | | |
| | | | |
| Item 4. | | | |
| | | | |
| Item 5. | | | |
| | | | |
| Item 6. | | | |
| | | | |
| | | |
|
| | |
| | CSX Q2 2017Q1 2018 Form 10-Q p.2
|
|
CSX CORPORATION
PART I - FINANCIAL INFORMATION
ITEM 1. FINANCIAL STATEMENTS
CONSOLIDATED INCOME STATEMENTS (Unaudited)
(Dollars in millions, except per share amounts)
| | | | Second Quarters | | Six Months | First Quarters |
| | 2017 | 2016 | | 2017 | 2016 | 2018 | 2017 |
| | | | | |
| Revenue | $ | 2,933 |
| $ | 2,704 |
| | $ | 5,802 |
| $ | 5,322 |
| $ | 2,876 |
| $ | 2,869 |
|
| Expense | | | | |
| Labor and Fringe | 743 |
| 749 |
| | 1,532 |
| 1,545 |
| 696 |
| 795 |
|
| Materials, Supplies and Other | 490 |
| 519 |
| | 1,057 |
| 1,069 |
| 482 |
| 571 |
|
| Depreciation | | 323 |
| 320 |
|
| Fuel | 198 |
| 172 |
| | 416 |
| 322 |
| 255 |
| 218 |
|
| Depreciation | 327 |
| 319 |
| | 647 |
| 632 |
| |
| Equipment and Other Rents | 95 |
| 105 |
| | 185 |
| 210 |
| 101 |
| 99 |
|
| Restructuring Charge (Note 1) | 122 |
| — |
| | 295 |
| — |
| — |
| 110 |
|
| Equity Earnings of Affiliates | | (25 | ) | (13 | ) |
| Total Expense | 1,975 |
| 1,864 |
| | 4,132 |
| 3,778 |
| 1,832 |
| 2,100 |
|
| | | | | |
| Operating Income | 958 |
| 840 |
| | 1,670 |
| 1,544 |
| 1,044 |
| 769 |
|
| | | | | |
| Interest Expense | (137 | ) | (141 | ) | | (274 | ) | (284 | ) | (149 | ) | (137 | ) |
| Restructuring Charge - Non-Operating (Note 1) | | — |
| (63 | ) |
| Other Income - Net | 6 |
| 8 |
| | 13 |
| 15 |
| 17 |
| 13 |
|
| Earnings Before Income Taxes | 827 |
| 707 |
| | 1,409 |
| 1,275 |
| 912 |
| 582 |
|
| | | | | |
| Income Tax Expense | (317 | ) | (262 | ) | | (537 | ) | (474 | ) | (217 | ) | (220 | ) |
| Net Earnings | $ | 510 |
| $ | 445 |
| | $ | 872 |
| $ | 801 |
| $ | 695 |
| $ | 362 |
|
| | | | | |
| Per Common Share (Note 2) | | | | |
| Net Earnings Per Share, Basic | $ | 0.55 |
| $ | 0.47 |
| | $ | 0.94 |
| $ | 0.84 |
| $ | 0.78 |
| $ | 0.39 |
|
| Net Earnings Per Share, Assuming Dilution | $ | 0.55 |
| $ | 0.47 |
| | $ | 0.94 |
| $ | 0.84 |
| $ | 0.78 |
| $ | 0.39 |
|
| | | | | |
| | | | | |
Average Shares Outstanding (In millions) | 920 |
| 952 |
| | 923 |
| 957 |
| 885 |
| 927 |
|
Average Shares Outstanding, Assuming Dilution (In millions) | 924 |
| 952 |
| | 926 |
| 958 |
| 888 |
| 929 |
|
| | | | | |
| | | | | |
| Cash Dividends Paid Per Common Share | $ | 0.20 |
| $ | 0.18 |
| | $ | 0.38 |
| $ | 0.36 |
| $ | 0.22 |
| $ | 0.18 |
|
Certain prior year data has been reclassified to conform to the current presentation
CONSOLIDATED COMPREHENSIVE INCOME STATEMENTS (Unaudited)
(Dollars in millions, except per share amounts)
|
| | | | | | | | | | | | | |
| | Second Quarters | | Six Months |
| | 2017 | 2016 | | 2017 | 2016 |
| Total Comprehensive Earnings (Note 10) | $ | 575 |
| $ | 454 |
| | $ | 943 |
| $ | 817 |
|
|
| | | | | | |
| | First Quarters |
| | 2018 | 2017 |
| Total Comprehensive Earnings (Note 10) | $ | 596 |
| $ | 368 |
|
See accompanying notes to consolidated financial statements.
|
| | |
| | CSX Q2 2017Q1 2018 Form 10-Q p.3
|
|
CSX CORPORATION
ITEM 1. FINANCIAL STATEMENTS
CONSOLIDATED BALANCE SHEETS
| | | | (Unaudited) | | (Unaudited) | |
| | June 30,
2017 | December 30,
2016 | March 31,
2018 | December 31,
2017 |
ASSETS | | Current Assets: | | |
| Cash and Cash Equivalents | $ | 620 |
| $ | 603 |
| $ | 1,980 |
| $ | 401 |
|
| Short-term Investments | 477 |
| 417 |
| 10 |
| 18 |
|
| Accounts Receivable - Net (Note 1) | 1,015 |
| 938 |
| |
| Accounts Receivable - Net (Note 11) | | 1,045 |
| 970 |
|
| Materials and Supplies | 428 |
| 407 |
| 369 |
| 372 |
|
| Other Current Assets | 90 |
| 122 |
| 138 |
| 154 |
|
| Total Current Assets | 2,630 |
| 2,487 |
| 3,542 |
| 1,915 |
|
| | | |
| Properties | 43,751 |
| 43,227 |
| 44,103 |
| 44,324 |
|
| Accumulated Depreciation | (12,324 | ) | (12,077 | ) | (12,355 | ) | (12,560 | ) |
| Properties - Net | 31,427 |
| 31,150 |
| 31,748 |
| 31,764 |
|
| | | |
| Investment in Conrail | 856 |
| 840 |
| 918 |
| 907 |
|
| Affiliates and Other Companies | 631 |
| 619 |
| 796 |
| 779 |
|
| Other Long-term Assets | 317 |
| 318 |
| 435 |
| 374 |
|
| Total Assets | $ | 35,861 |
| $ | 35,414 |
| $ | 37,439 |
| $ | 35,739 |
|
| | | |
LIABILITIES AND SHAREHOLDERS' EQUITY | | Current Liabilities: | | |
| Accounts Payable | $ | 810 |
| $ | 806 |
| $ | 905 |
| $ | 847 |
|
| Labor and Fringe Benefits Payable | 506 |
| 545 |
| 443 |
| 602 |
|
| Casualty, Environmental and Other Reserves (Note 4) | 115 |
| 115 |
| 106 |
| 108 |
|
| Current Maturities of Long-term Debt (Note 7) | 19 |
| 331 |
| 19 |
| 19 |
|
| Income and Other Taxes Payable | 95 |
| 129 |
| 274 |
| 157 |
|
| Other Current Liabilities | 127 |
| 114 |
| 144 |
| 161 |
|
| Total Current Liabilities | 1,672 |
| 2,040 |
| 1,891 |
| 1,894 |
|
| | | |
| Casualty, Environmental and Other Reserves (Note 4) | 248 |
| 259 |
| 258 |
| 266 |
|
| Long-term Debt (Note 7) | 11,806 |
| 10,962 |
| 13,768 |
| 11,790 |
|
| Deferred Income Taxes - Net | 9,737 |
| 9,596 |
| 6,485 |
| 6,418 |
|
| Other Long-term Liabilities | 797 |
| 863 |
| 646 |
| 650 |
|
| Total Liabilities | 24,260 |
| 23,720 |
| 23,048 |
| 21,018 |
|
| | | |
| Shareholders' Equity: | | |
| Common Stock, $1 Par Value | 913 |
| 928 |
| 875 |
| 890 |
|
| Other Capital | 210 |
| 138 |
| 215 |
| 217 |
|
| Retained Earnings | 11,033 |
| 11,253 |
| 13,873 |
| 14,084 |
|
| Accumulated Other Comprehensive Loss (Note 10) | (569 | ) | (640 | ) | (585 | ) | (486 | ) |
| Noncontrolling Interest | 14 |
| 15 |
| 13 |
| 16 |
|
| Total Shareholders' Equity | 11,601 |
| 11,694 |
| 14,391 |
| 14,721 |
|
| Total Liabilities and Shareholders' Equity | $ | 35,861 |
| $ | 35,414 |
| $ | 37,439 |
| $ | 35,739 |
|
See accompanying notes to consolidated financial statements.
|
| | |
| | CSX Q2 2017Q1 2018 Form 10-Q p.4
|
|
CSX CORPORATION
ITEM 1. FINANCIAL STATEMENTS
CONSOLIDATED CASH FLOW STATEMENTS (Unaudited)
(Dollars in millions)
| | | | Six Months | Three Months |
| | 2017 | 2016 | 2018 | 2017 |
| | | |
| OPERATING ACTIVITIES | | |
| Net Earnings | $ | 872 |
| $ | 801 |
| $ | 695 |
| $ | 362 |
|
| Adjustments to Reconcile Net Earnings to Net Cash Provided by Operating Activities: | | |
| Depreciation | 647 |
| 632 |
| 323 |
| 320 |
|
| Deferred Income Taxes | | 54 |
| 59 |
|
| Gain on Property Dispositions | | (32 | ) | (2 | ) |
| Equity Earnings of Affiliates | | (25 | ) | (13 | ) |
| Restructuring Charge | 166 |
| — |
| — |
| 173 |
|
| Deferred Income Taxes | 112 |
| 165 |
| |
| Cash Payments for Restructuring Charge | | (12 | ) | (12 | ) |
| Other Operating Activities | (15 | ) | (27 | ) | 6 |
| 17 |
|
| Changes in Operating Assets and Liabilities: | | |
| Accounts Receivable | (103 | ) | 66 |
| (50 | ) | (30 | ) |
| Other Current Assets | 12 |
| (61 | ) | (19 | ) | 33 |
|
| Accounts Payable | 6 |
| — |
| 64 |
| 91 |
|
| Income and Other Taxes Payable | (46 | ) | 27 |
| 127 |
| 162 |
|
| Other Current Liabilities | (85 | ) | (11 | ) | (165 | ) | (117 | ) |
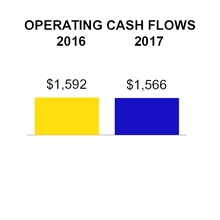
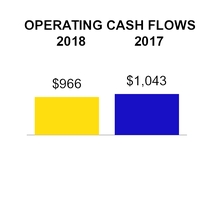
| Net Cash Provided by Operating Activities | 1,566 |
| 1,592 |
| 966 |
| 1,043 |
|
| | | |
| INVESTING ACTIVITIES | | |
| Property Additions | (955 | ) | (1,066 | ) | (368 | ) | (441 | ) |
| Proceeds from Property Dispositions | | 52 |
| 13 |
|
| Purchase of Short-term Investments | (545 | ) | (260 | ) | — |
| (75 | ) |
| Proceeds from Sales of Short-term Investments | 492 |
| 810 |
| 8 |
| 205 |
|
| Other Investing Activities | 41 |
| 35 |
| (8 | ) | 12 |
|
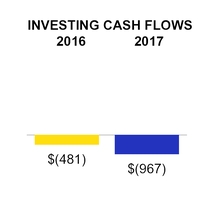
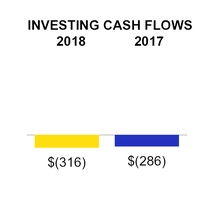
| Net Cash Used In Investing Activities | (967 | ) | (481 | ) | (316 | ) | (286 | ) |
| | | |
| FINANCING ACTIVITIES | | |
| Long-term Debt Issued (Note 7) | 850 |
| — |
| 2,000 |
| — |
|
| Long-term Debt Repaid (Note 7) | (313 | ) | — |
| |
| Dividends Paid | (350 | ) | (344 | ) | (194 | ) | (166 | ) |
| Shares Repurchased | (757 | ) | (515 | ) | (836 | ) | (258 | ) |
| Other Financing Activities | (12 | ) | (314 | ) | (41 | ) | (6 | ) |
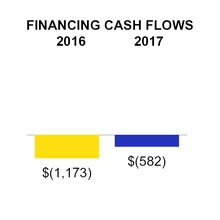
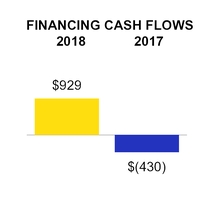
| Net Cash Used in Financing Activities | (582 | ) | (1,173 | ) | |
| Net Cash Provided By (Used in) Financing Activities | | 929 |
| (430 | ) |
| | | |
| Net Increase (Decrease) in Cash and Cash Equivalents | 17 |
| (62 | ) | |
| Net Increase in Cash and Cash Equivalents | | 1,579 |
| 327 |
|
| | | |
| CASH AND CASH EQUIVALENTS | | |
| Cash and Cash Equivalents at Beginning of Period | 603 |
| 628 |
| 401 |
| 603 |
|
| Cash and Cash Equivalents at End of Period | $ | 620 |
| $ | 566 |
| $ | 1,980 |
| $ | 930 |
|
| | | |
See accompanying notes to consolidated financial statements.
|
| | |
| | CSX Q2 2017Q1 2018 Form 10-Q p.5
|
|
CSX CORPORATION
NOTES TO CONSOLIDATED FINANCIAL STATEMENTS
(Unaudited)
| |
NOTE 1. | Nature of Operations and Significant Accounting Policies |
NOTE 1.Nature of Operations and Significant Accounting Policies
Background
CSX Corporation (“CSX”), together with its subsidiaries (the “Company”), based in Jacksonville, Florida, is one of the nation's leading transportation companies. The Company provides rail-based transportation services including traditional rail service and the transport of intermodal containers and trailers.
CSX's principal operating subsidiary, CSX Transportation, Inc. (“CSXT”), provides an important link to the transportation supply chain through its approximately 21,000 route mile rail network, which serves major population centers in 23 states east of the Mississippi River, the District of Columbia and the Canadian provinces of Ontario and Quebec. The Company's intermodal business links customers to railroads via trucks and terminals.
After a merger on July 1, 2017 with CSX Real Property, Inc., a former wholly-owned CSX subsidiary, CSXT is now responsible for the Company's real estate sales, leasing, acquisition and management and development activities. In addition, as substantially all real estate sales, leasing, acquisition and management and development activities are focused on supporting railroad operations, all results of these activities are included in operating income beginning in 2017. Previously, the results of these activities were classified as operating or non-operating based on the nature of the activity and were not material for any periods presented.
Other entities
In addition to CSXT, the Company’s subsidiaries include CSX Intermodal Terminals, Inc. (“CSX Intermodal Terminals”), Total Distribution Services, Inc. (“TDSI”), Transflo Terminal Services, Inc. (“Transflo”), CSX Technology, Inc. (“CSX Technology”) and other subsidiaries. CSX Intermodal Terminals owns and operates a system of intermodal terminals, predominantly in the eastern United States and also performs drayage services (the pickup and delivery of intermodal shipments) for certain customers and trucking dispatch operations. TDSI serves the automotive industry with distribution centers and storage locations. Transflo connects non-rail served customers to the many benefits of rail by transferring products from rail to trucks. The biggest Transflo markets are chemicals and agriculture, which include shipments of plastics and ethanol. CSX Technology and other subsidiaries provide support services for the Company.
CSX’s other holdings include CSX Real Property, Inc. ("CSX Real Property"), a subsidiary responsible for the Company’s real estate sales, leasing, acquisition and management and development activities. As substantially all of CSX Real Property's remaining activities are focused on supporting railroad operations, beginning in first quarter 2017, all results of these activities are included in operating income. Previously, these activities were classified as operating or non-operating based on the nature of the activity and were not material for any periods presented.
Basis of Presentation
In the opinion of management, the accompanying consolidated financial statements contain all normal, recurring adjustments necessary to fairly present the following:
Consolidated income statements for the sixthree months ended June 30, 2017March 31, 2018 and June 24, 2016;March 31, 2017;
Consolidated comprehensive income statements for the sixthree months ended June 30, 2017March 31, 2018 and June 24, 2016;March 31, 2017;
Consolidated balance sheets at June 30, 2017March 31, 2018 and December 30, 2016;31, 2017; and
Consolidated cash flow statements for the sixthree months ended June 30, 2017March 31, 2018 and June 24, 2016.March 31, 2017.
Pursuant to the rules and regulations of the Securities and Exchange Commission (“SEC”), certain information and disclosures normally included in the notes to the annual financial statements prepared in accordance with U.S. generally accepted accounting principles (“GAAP”) have been omitted from these interim financial statements. CSX suggests that these financial statements be read in conjunction with the audited financial statements and the notes included in CSX's most recent annual report on Form 10-K and any subsequently filed current reports on Form 8-K.
|
| | |
| | CSX Q2 2017Q1 2018 Form 10-Q p.6
|
|
CSX CORPORATION
NOTES TO CONSOLIDATED FINANCIAL STATEMENTS
(Unaudited)
NOTE 1. Nature of Operations and Significant Accounting Policies, continued
Fiscal Year
Through the second quarter 2017, CSX followed a 52/53 week fiscal reporting calendar with the last day of each reporting period ending on a Friday:
The second fiscal quarters of 2017 and 2016 consisted of 13 weeks ending on June 30, 2017 and June 24, 2016, respectively.
Fiscal year 2016 consisted of 53 weeks ending on December 30, 2016.
Friday. On July 7, 2017 the Board of Directors of CSX approved a change in the fiscal reporting calendar from a 52/53 week year ending on the last Friday of December to a calendar year ending on December 31 each year, effective beginning with fiscal third quarter 2017. Related to the change in the fiscal calendar:
Fiscal year 2017 commenced on2018 (January 1, 2018 through December 31, 2016, as the2018) will contain 365 days, and fiscal year 2017 (December 31, 2016 ended onthrough December 30, 2016 under the 52/53 week31, 2017) contained 366 days
Fiscal first quarter 2018 (January 1, 2018 through March 31, 2018) contained 90 days, and fiscal calendar.
The thirdfirst quarter 2017 commenced on July 1, 2017, as the second quarter 2017 ended on June 30, 2017 under the 52/53 week fiscal calendar, and will include one additional day in order to end on September 30, 2017. Third quarter 2017 will include one more day of business results than third quarter 2016.
The fourth quarter 2017 will commence on October 1, 2017, and include one additional day in order to end on December(December 31, 2017. Fourth quarter 2017 will include six fewer2016 through March 31, 2017) contained 91 days of business results than fourth quarter 2016, which contained 14 weeks under the 52/53 week fiscal calendar.
Fiscal year 2017 will include 366 days of activity, five fewer days than fiscal year 2016, which was a 53 week fiscal year that began on December 26, 2015 and ended December 30, 2016.
The Company doesThis change did not expect that this change will materially impact the comparability of the Company’s financial results for fiscal year 2016 and fiscal year 2017.results. Accordingly, the change to a calendar fiscal year will bewas made on a prospective basis and operating results for prior periods willwere not be adjusted. The Company willwas not be required to file a transition report because this change iswas not deemed a change in fiscal year for purposes of reporting subject to Rule 13a-10 or Rule 15d-10 of the Securities Exchange Act of 1934 as the new fiscal year commencescommenced with the end of the prior fiscal year end and within seven days of the prior fiscal year end.
Except as otherwise specified, references to “second“first quarter(s)” or “six“three months” indicate CSX's fiscal periods ending June 30,March 31, 2018 and March 31, 2017, and June 24, 2016, and references to "year-end" indicate the fiscal year ended December 30, 2016.31, 2017.
AllowanceNew Accounting Pronouncements
In February 2018, the FASB issued Accounting Standard Update ("ASU") Reclassification of Certain Tax Effects from Accumulated Other Comprehensive Income, which permits entities to reclassify tax effects stranded in accumulated other comprehensive income as a result of tax reform to retained earnings. Companies that elect to reclassify these amounts must reclassify stranded tax effects for Doubtful Accounts
all items accounted for in accumulated other comprehensive income. The Company maintains an allowance for doubtful accounts on uncollectible amountsadopted this standard update in first quarter 2018 and applied it prospectively. Adoption resulted in the reclassification of $107 million in tax effects related to freight receivables, government reimbursement receivables, claims for damages andemployee benefit plans from accumulated other various receivables. The allowance is based uponcomprehensive loss, increasing retained earnings by the creditworthiness of customers, historical experience, the age of the receivable and current market and economic conditions. Uncollectible amounts are charged against the allowance account. Allowance for doubtful accounts of $24 million and $33 million is included in the consolidated balance sheets as of June 30, 2017 and December 30, 2016, respectively.same amount.
In January 2018, the FASB issued ASU Leases - Land Easement Practical Expedient, which permits entities to forgo the evaluation of existing land easement arrangements to determine if they contain a lease as part of the adoption of the Leases ASU issued in February 2016. Accordingly, the Company’s accounting treatment of existing land easements will not change. CSX will adopt this standard update concurrently with the Leases ASU issued in February 2016. New land easement arrangements, or modifications to existing arrangements, after the adoption of the standard update will still be evaluated to determine if they meet the definition of a lease.
|
| | |
| | CSX Q2 2017Q1 2018 Form 10-Q p.7
|
|
CSX CORPORATION
NOTES TO CONSOLIDATED FINANCIAL STATEMENTS
(Unaudited)
NOTE 1. Nature of Operations and Significant Accounting Policies, continued
New Accounting Pronouncements
In May 2017, the Financial Accounting Standards Board ("FASB") issued Accounting Standards Update ("ASU") Compensation - Stock Compensation: Scope of Modification Accounting, which provides clarity on what changes to share-based awards are considered substantive and require modification accounting to be applied. This update is required beginning with first quarter 2018 and should be applied prospectively to award modifications after the effective date. The Company has early adopted this standard update in second quarter 2017 and will apply it prospectively to award modifications after the adoption date. The Company does not regularly modify the terms and conditions of share-based awards and does not believe this standard update will have a material effect on its financial condition, results of operations or liquidity.
In March 2017, the FASB issued ASU Improving the Presentation of Net Periodic Pension Cost and Net Periodic Postretirement Benefit Cost, which requires that only the service cost component of net periodic benefit costs be recorded as compensation cost in the operating expense section ofon the consolidated income statement. All other components of net periodic benefit cost (interest cost, expected return on plan assets, and amortization of net loss) willloss, special termination benefits and settlement and curtailment effects) should be presented inas non-operating charges on the consolidated income statement. These non-operating charges are presented as restructuring charge - non-operating, if related to prior year restructuring activities, or as other income - net. Thisnet as appropriate. The Company adopted the provisions of this standard update is effective beginning with theduring first quarter 2018 and must be applied them retrospectively. The retrospective impact of adoption for first quarter 2017 is shown in the following table.
|
| | | | | | | | | |
| | First Quarter 2017 |
| (Dollars in millions) | As Previously Reported | Reclassification | As Reclassified |
| Operating Expense: | | | |
| Labor and Fringe | $ | 789 |
| $ | 6 |
| $ | 795 |
|
| Restructuring Charge | 173 |
| (63 | ) | 110 |
|
| Non-Operating Income (Expense): | | | |
| Restructuring Charge - Non-Operating | $ | — |
| $ | (63 | ) | $ | (63 | ) |
| Other Income - Net | 7 |
| 6 |
| 13 |
|
In May 2014, the FASB issued ASU Revenue from Contracts with Customers, which supersedes previous revenue recognition guidance. The new standard requires that a company recognize revenue when it transfers promised goods or services to customers in an amount that reflects the consideration the company expects to receive in exchange for those goods or services. In-depth reviews of commercial contracts were completed and changes to processes and internal controls to meet the standard’s reporting and disclosure requirements were implemented. The Company doesadopted the guidance effective January 1, 2018 using the modified retrospective approach. The adoption did not believe this standard update will have a material effect on itsaffect the Company’s financial condition, results of operations or liquidity. Disclosures related to the nature, amount and timing of revenue and cash flows arising from contracts with customers are included in Note 11, Revenues.
In February 2016, the FASB issued ASU, Leases, which will require lessees to recognize most leases on their balance sheets as a right-of-use asset with a corresponding lease liability, and lessors to recognize a net lease investment. Additional qualitative and quantitative disclosures will also be required. This standard update is effective for CSX beginning with the first quarter 2019 and will be adopted using a modified retrospective method. Changes to processes and internal controls to meet the standard’s reporting and disclosure requirements have been identified and are being implemented. Software has been implemented that will assist in the recognition of additional assets and liabilities to be included on the balance sheet related to leases currently classified as operating leases with durations greater than twelve months, with certain allowable exceptions. The Company continues to evaluate the expected impact of this standard update on disclosures, but does not anticipate any material changes to operating results or liquidity.
|
| | |
| CSX Q1 2018 Form 10-Q p.8
|
|
CSX CORPORATION
NOTES TO CONSOLIDATED FINANCIAL STATEMENTS
(Unaudited)
NOTE 1. Nature of Operations and Significant Accounting Policies, continued
In March 2017, the FASB issued ASU Simplifying the Test for Goodwill Impairment, which eliminates step two, the calculation of the implied fair value of goodwill, from the goodwill impairment test. Impairment will be quantified in step one of the test as the amount by which the carrying amount exceeds the fair value. This standard update is effective beginning first quarter 2020 and must be applied prospectively. The Company does not believe this standard update will have a material effect on its financial condition, results of operations or liquidity.
In May 2014, the FASB issued ASU Revenue from Contracts with Customers, which supersedes previous revenue recognition guidance. The new standard requires that a company recognize revenue when it transfers promised goods or services to customers in an amount that reflects the consideration the company expects to receive in exchange for those goods or services. Companies will need to use more judgment and estimates than under the guidance currently in effect, including estimating the amount of variable revenue to recognize over each identified performance obligation. Additional disclosures will be required to help users of financial statements understand the nature, amount and timing of revenue and cash flows arising from contracts. This standard update is effective for CSX beginning with the first quarter 2018 and can be adopted either retrospectively to each prior reporting period presented or as a cumulative effect adjustment as of the date of adoption. The Company does not intend to adopt this standard update early.
The FASB has recently issued several amendments to the revenue standard, including clarification on accounting for principal versus agent considerations (i.e., reporting gross versus net), licenses of intellectual property and identifying performance obligations. These amendments do not change the core principle of the standard, but provide clarity and implementation guidance.
|
| | |
| CSX Q2 2017 Form 10-Q p.8
|
|
CSX CORPORATION
NOTES TO CONSOLIDATED FINANCIAL STATEMENTS
(Unaudited)
NOTE 1. Nature of Operations and Significant Accounting Policies, continued
The Company is currently finalizing its review of the impact of adopting this new guidance and developing a comprehensive implementation plan. In-depth reviews of a significant portion of commercial contracts have been completed, additional contracts are presently being reviewed and changes to processes and internal controls have been identified to meet the standard’s reporting and disclosure requirements. At this time, the Company does not believe this standard update will have a material effect on its financial condition, results of operations or liquidity. Freight revenue will continue to be recognized ratably over transit time. Additionally, the disaggregated revenue information required to be disclosed under this standard update is similar to the information currently included in the Results of Operations section of Item 2, “Management’s Discussion and Analysis of Financial Condition and Results of Operations.”
In February 2016, the FASB issued ASU, Leases, which will require lessees to recognize most leases on their balance sheets as a right-of-use asset with a corresponding lease liability, and lessors to recognize a net lease investment. Additional qualitative and quantitative disclosures will also be required. This standard update is effective for CSX beginning with the first quarter 2019 and will be adopted using a modified retrospective method. Changes to processes and internal controls to meet the standard’s reporting and disclosure requirements have been identified and continue to be implemented. For example, software has been implemented that will assist in recognition of additional assets and liabilities to be included on the balance sheet related to operating leases with durations greater than twelve months, with certain allowable exceptions. The Company continues to evaluate the expected financial impact of this standard update.
Other Items
Management Workforce Reduction
Through an involuntary separation program with enhanced benefits to further its strategic objectives, CSX reduced its management workforce by 951 employees, 765 employees during first quarter 2017 and 186 employees during second quarter 2017. The Company has been focused on driving efficiencies through process improvement and responding to business mix shifts. These management reductions were designed to further streamline general and administrative and operating support functions to speed decision making and further control costs. In April 2017, the involuntary separation program was completed. The majority of separation benefits are being paid from general corporate funds while certain benefits will be paid through CSX’s qualified pension plans.
Reimbursement Arrangements
In June 2017, the Company and the Company's President and Chief Executive Officer, E. Hunter Harrison, executed a letter agreement providing for certain reimbursement arrangements. Pursuant to the letter agreement, the Company made a reimbursement payment to MR Argent Advisor LLC ("Mantle Ridge") of $55 million for funds previously paid to Mr. Harrison by Mantle Ridge. Further, the Company assumed Mantle Ridge’s obligation to pay Mr. Harrison, prior to March 15, 2018, a lump sum cash amount of $29 million in respect of other forfeited compensation from his previous employer, Canadian Pacific Railway Limited (“CP”). The Company also assumed Mantle Ridge’s tax indemnification obligations to Mr. Harrison, which enables him to remain in the same after-tax position as if he had not: (i) forfeited such compensation and benefits earned from CP; and (ii) received $55 million from Mantle Ridge. The ownership position of Mantle Ridge, a CSX shareholder, is detailed in the Company's Proxy Statement filed on April 20, 2017. The Vice-Chairman of CSX's Board of Directors, Paul C. Hilal, founded and controls Mantle Ridge and each of its related entities. At the Company's 2017 annual meeting of shareholders held on June 5, 2017, the Company's shareholders approved, on an advisory basis, with 93 percent of the vote, the Company undertaking such reimbursement arrangements.
|
| | |
| CSX Q2 2017 Form 10-Q p.9
|
|
CSX CORPORATION
NOTES TO CONSOLIDATED FINANCIAL STATEMENTS
(Unaudited)
NOTE 1. Nature of Operations and Significant Accounting Policies, continued
Restructuring Charge
In first quarter 2017, the former CEO and President of the Company announced their retirements, and the terms of their unvested equity awards were modified to permit prorated vesting through May 31, 2018. The totalprior year restructuring charge includes costs related to the management workforce reduction program completed in 2017, reimbursement arrangements with MR Argent Advisor LLC (“Mantle Ridge”) and the Company’s former President and Chief Executive Officer, E. Hunter Harrison, the proration of equity awards and other advisory costs related to the leadership transition. Future chargesPayments related to thisthe 2017 restructuring are not expected to be material.charge were substantially complete as of March 31, 2018. For further details on the charge, see the Company's most recent annual report on Form 10-K. Expenses related to the management workforce reduction and other costs are shown in the following table.
|
| | | | | | | | | |
| | 2017 |
| (Dollars in millions) | First Quarter | Second Quarter | Year-to-Date |
| Severance | $ | 81 |
| $ | 10 |
| $ | 91 |
|
| Pension, Other Post-retirement Benefit and Other Non-cash Charges | 68 |
| 10 |
| 78 |
|
| Relocation | 6 |
| 2 |
| 8 |
|
| Subtotal Management Workforce Reduction | $ | 155 |
| $ | 22 |
| $ | 177 |
|
| Reimbursement Arrangements | — |
| 84 |
| 84 |
|
| Non-cash Executive Equity Awards Proration | 8 |
| 16 |
| 24 |
|
| Advisory Fees Related to Shareholder Matters | 10 |
| — |
| 10 |
|
| Total Restructuring Charge | $ | 173 |
| $ | 122 |
| $ | 295 |
|
Charges and payments related to the management workforce reduction and other costs are shown in the following table.
|
| | | | | | | | | | | | |
| (Dollars in millions) | 2017 Charges | 2017 Payments | Non-cash Items | Liability 6/30/2017 |
| Severance | $ | 91 |
| $ | (62 | ) | | $ | 29 |
|
Pension, Other Post-retirement Benefit and Other Non-cash Charges (a) | 78 |
| — |
| (78 | ) | — |
|
| Relocation | 8 |
| (2 | ) | | 6 |
|
| Subtotal Management Workforce Reduction | $ | 177 |
| $ | (64 | ) | $ | (78 | ) | $ | 35 |
|
| Reimbursement Arrangements | 84 |
| (55 | ) | | 29 |
|
| Non-cash Executive Equity Awards Proration | 24 |
| — |
| (24 | ) |
|
|
| Advisory Fees Related to Shareholder Matters | 10 |
| (10 | ) | | — |
|
| Total Restructuring Charge | $ | 295 |
| $ | (129 | ) | $ | (102 | ) | $ | 64 |
|
(a)The majority of non-cash items are related to certain benefits paid through CSX's qualified pension plans.
|
| | | | | | | | | | | |
| | First Quarter 2017 |
| (Dollars in millions) | As Previously Reported | | Operating Restructuring Charge | | Non-Operating Restructuring Charge |
| Severance and Pension | $ | 131 |
| | $ | 81 |
| | $ | 50 |
|
| Other Post-Retirement Benefits Curtailment | 13 |
| | — |
| | 13 |
|
| Employee Equity Awards Proration and Other | 11 |
| | 11 |
| | — |
|
| Subtotal Management Workforce Reduction | $ | 155 |
| | $ | 92 |
| | $ | 63 |
|
| Executive Equity Awards Proration | 8 |
| | 8 |
| | — |
|
| Advisory Fees Related to Shareholder Matters | 10 |
| | 10 |
| | — |
|
| Total Restructuring Charge | $ | 173 |
| | $ | 110 |
| | $ | 63 |
|
|
| | |
| | CSX Q2 2017Q1 2018 Form 10-Q p.10p.9
|
|
CSX CORPORATION
NOTES TO CONSOLIDATED FINANCIAL STATEMENTS
(Unaudited)
NOTE 2. Earnings Per Share
The following table sets forth the computation of basic earnings per share and earnings per share, assuming dilution:
| | | | Second Quarters | | Six Months | First Quarters |
| | 2017 | 2016 | | 2017 | 2016 | 2018 | 2017 |
Numerator (Dollars in millions): | | | | |
| Net Earnings | $ | 510 |
| $ | 445 |
| | $ | 872 |
| $ | 801 |
| $ | 695 |
| $ | 362 |
|
| Dividend Equivalents on Restricted Stock | — |
| — |
| | — |
| (1 | ) | |
| Net Earnings, Attributable to Common Shareholders | $ | 510 |
| 445 |
| | $ | 872 |
| 800 |
| |
| | | | | |
Denominator (Units in millions): | | | | |
| Average Common Shares Outstanding | 920 |
| 952 |
| | 923 |
| 957 |
| 885 |
| 927 |
|
| Other Potentially Dilutive Common Shares | 4 |
| — |
| | 3 |
| 1 |
| 3 |
| 2 |
|
| Average Common Shares Outstanding, Assuming Dilution | 924 |
| 952 |
| | 926 |
| 958 |
| 888 |
| 929 |
|
| | | | | |
| Net Earnings Per Share, Basic | $ | 0.55 |
| $ | 0.47 |
| | $ | 0.94 |
| $ | 0.84 |
| $ | 0.78 |
| $ | 0.39 |
|
| Net Earnings Per Share, Assuming Dilution | $ | 0.55 |
| $ | 0.47 |
| | $ | 0.94 |
| $ | 0.84 |
| $ | 0.78 |
| $ | 0.39 |
|
Basic earnings per share is based on the weighted-average number of shares of common stock outstanding. Earnings per share, assuming dilution, is based on the weighted-average number of shares of common stock equivalents outstanding adjusted for the effects of common stock that may be issued as a result of potentially dilutive instruments. CSX's potentially dilutive instruments are made up of equity awards, which include long-term incentive awards and employee stock options.
The Earnings Per Share Topic in the FASB's ASC requires CSX to include additional shares in the computation of earnings per share, assuming dilution. The additional shares included in diluted earnings per share represent the number of shares that would be issued if all of the above potentially dilutive instruments were converted into CSX common stock.
When calculating diluted earnings per share, this rule requires CSX to include the potential shares that would be outstanding if all outstanding stock options were exercised. This number is different from outstanding stock options which is included in Note 3, Share-Based Compensation, because it is offset by shares CSX could repurchase using the proceeds from these hypothetical exercises to obtain the common stock equivalent. Approximately 10 million800 thousand and 53.4 million of total average outstanding stock options for the secondfirst quarters ended June 30,March 31, 2018 and March 31, 2017, and June 24, 2016, respectively, were excluded from the diluted earnings per share calculation because their effect was antidilutive.
Share Repurchases and Dividend Increase
TheOn January 19, 2018, the Company continuesentered into an accelerated share repurchase agreement to repurchase shares under its $1 billion program announced on April 20, 2017. On July 18, 2017,of the Company’s common stock. Under this agreement, the Company announced thatmade a prepayment of $150 million to a financial institution and received an initial delivery of shares valued at $120 million. The remaining balance of $30 million was settled through receipt of additional $500 millionshares on February 22, 2018 with the final net number of share repurchase authority had been approved byshares calculated based on the Boardvolume-weighted average price of Directors, bringing the total program size to $1.5 billion.
DuringCompany's common stock over the second quartersterm of 2017 and 2016, the Companyagreement, less a discount. Total shares repurchased under the agreement were approximately $499 million, or 92.7 million shares, and $266 million, or 10 million shares, respectively. During the six monthsat an average purchase price of 2017 and 2016, the Company repurchased $757 million, or 15 million shares, and $515 million, or 20 million shares, respectively.$55.02 per share.
|
| | |
| | CSX Q2 2017Q1 2018 Form 10-Q p.11p.10
|
|
CSX CORPORATION
NOTES TO CONSOLIDATED FINANCIAL STATEMENTS
(Unaudited)
NOTE 2. Earnings Per Share, continued
On February 12, 2018, the Company announced an increase to the $1.5 billion share repurchase program first announced in October 2017, bringing the total authorized to $5 billion. This program is expected to be completed by the end of first quarter 2019. During the first quartersof 2018 and 2017, the Company repurchased approximately $836 million, or 15 million shares, and $258 million, or 6 million shares, respectively.
Management's assessment of market conditions and other factors guides the timing and volume of repurchases. Future share repurchases are expected to be funded by cash on hand, cash generated from operations and debt issuances. Shares are retired immediately upon repurchase. In accordance with the Equity Topic in the ASC, the excess of repurchase price over par value is recorded in retained earnings. Generally, retained earnings is only impacted by net earnings and dividends.
On February 12, 2018, the Company also announced a 10 percent increase in the quarterly dividend from $0.20 per share of common stock to $0.22 per share of common stock, payable on March 15, 2018 to shareholders of record at the close of business on March 1, 2018.
NOTE 3. Share-Based Compensation
Under CSX's share-based compensation plans, awards consist of performance units, restricted stock awards, restricted stock units and stock options for management and stock grants for directors. Awards granted under the various programs are determined and approved by the Compensation Committee of the Board of Directors or, in certain circumstances, by the Chief Executive Officer for awards to management employees other than senior executives. The Board of Directors approves awards granted to the Company'sCSX's non-management directors upon recommendation of the Governance Committee.
Share-based compensation expense is measured using the fair value of the award on the grant date and is recognized on a straight-line basis over the service period of the respective award. Total pre-tax expense associated with share-based compensation and its related income tax benefit is shown in the table below. The year over year increasedecrease in expense related to performance units, and stock options and restricted stock units and awards is primarily due to modifications to the terms of awards in 2017 (see Equity Award Modificationsbelow), the reduction of management headcount in 2017 and higheradjustments to reflect changes in the expected award payouts.payouts on existing plans for each year. Additionally, the 9 million stock options granted in February 2017 to former President and CEO E. Hunter Harrison were forfeited upon his death in December 2017.
| | | | Second Quarters | | Six Months | First Quarters |
| (Dollars in millions) | 2017 | 2016 | | 2017 | 2016 | 2018 | 2017 |
| | | | | |
| Share-Based Compensation Expense | | | | |
| Share-Based Compensation Expense: | | |
| Performance Units | $ | 18 |
| $ | 3 |
| | $ | 39 |
| $ | 4 |
| $ | 6 |
| $ | 20 |
|
| Stock Options | 21 |
| 1 |
| | 32 |
| 3 |
| 4 |
| 12 |
|
| Restricted Stock Units and Awards | 5 |
| 3 |
| | 9 |
| 6 |
| 1 |
| 4 |
|
| Stock Awards for Directors | — |
| — |
| | 2 |
| 2 |
| 2 |
| 2 |
|
| Total Share-Based Compensation Expense | $ | 44 |
| $ | 7 |
| | $ | 82 |
| $ | 15 |
| $ | 13 |
| $ | 38 |
|
| Income Tax Benefit | $ | 12 |
| $ | 3 |
| | $ | 25 |
| $ | 6 |
| $ | 3 |
| $ | 13 |
|
|
| | |
| CSX Q1 2018 Form 10-Q p.11
|
|
CSX CORPORATION
NOTES TO CONSOLIDATED FINANCIAL STATEMENTS
(Unaudited)
NOTE 3. Share-Based Compensation, continued
Long-term Incentive Plan
InOn February 2017,6, 2018, the Company granted approximately 600350 thousand performance units to certain employees under a new long-term incentive plan ("LTIP") for the years 20172018 through 2019,2020, which was adopted under the CSX Stock and Incentive Award Plan. Payouts of performance units for the cycle ending with fiscal year 20192020 will be based on the achievement of goals related to both operating ratio and return on assetsfree cash flow, in each case excluding non-recurring items as disclosed in the Company's financial statements. The cumulativefinal year operating ratio and average return on assetscumulative free cash flow over the plan period will each comprise 50% of the payout and will be measured independently of the other.
Grants were made in performance units, with each unit representing the right to receive one share of CSX common stock, and payouts will be made in CSX common stock. The payout range for participants will be between 0% and 200% of the target awards depending on Company performance against predetermined goals. Payouts for certain executive officers are subject to upward or downward adjustment by up to 30%25%, capped at an overall payout of 200%, based upon the Company's total shareholder return relative to specified comparable groups.groups over the performance period. The fair value of these performance units was calculated using a Monte-Carlo simulation model.
The following weighted-average assumptions were used in the Monte-Carlo simulation for this award:
|
| | |
| | CSX Q2 2017 Form 10-Q p.12
First Quarter |
| 2018 |
| Weighted-average assumptions used: | |
| Annual dividend yield | 1.6 | % |
| Risk-free interest rate | 2.3 | % |
| Annualized volatility | 29.15 | % |
| Expected life (in years) | 2.9 |
|
CSX CORPORATION
NOTES TO CONSOLIDATED FINANCIAL STATEMENTS
(Unaudited)
NOTE 3. Share-Based Compensation, continued
Stock Options
Also, inon February 2017,6, 2018, the Company granted approximately 1.3 million950 thousand stock options along with the corresponding LTIP. The fair value of stock options on the date of grant was $12.54$14.55 per option which was calculated using the Black-Scholes valuation model. Stock options have been granted with ten-year terms and vest three years after the date of grant. The exercise price for stock options granted equals the closing market price of the underlying stock on the date of grant. These awards are time-based and are not based upon attainment of performance goals. During second quarter
|
| | |
| CSX Q1 2018 Form 10-Q p.12
|
|
CSX CORPORATION
NOTES TO CONSOLIDATED FINANCIAL STATEMENTS
(Unaudited)
NOTE 3. Share-Based Compensation, continued
The fair values of all stock option awards during the first quarters ended March 31, 2018 and March 31, 2017 there were immaterial grants of stock options to certain members of management.estimated at the grant date with the following weighted average assumptions:
|
| | |
| | First Quarters |
| | 2018 | 2017 |
| Weighted-average grant date fair value | $14.62 | $12.83 |
| | | |
| Stock options valuation assumptions: | | |
| Annual dividend yield | 1.5% | 1.5% |
| Risk-free interest rate | 2.6% | 2.2% |
| Annualized volatility | 27.0% | 27.1% |
| Expected life (in years) | 6.5 | 6.3 |
| | | |
| Other pricing model inputs: | | |
| Weighted-average grant-date market price of CSX stock (strike price) | $54.07 | $49.61 |
Restricted Stock Units
Finally, inon February 2017,6, 2018, the Company granted approximately 30085 thousand restricted stock units along with the corresponding LTIP. The restricted stock units vest three years after the date of grant. Participants receive cash dividend equivalents on the unvested shares during the restriction period. These awards are time-based and are not based upon attainment of performance goals. Restricted stock units were not granted to certain executive officers under the new LTIP. For information related to the Company's other outstanding long-term incentive compensation, see CSX's most recent annual report on Form 10-K.
CEO Stock Option Award
In March 2017, the Company granted 9 million stock options to the incoming CEO at a fair value of $12.88 per option calculated using the Black-Scholes valuation model. These options were granted with a ten-year term and an exercise price equal to the closing market price of the underlying stock on the date of grant. Half of the options, or 4.5 million, will vest on the CEO's service anniversary in equal annual installments over four years. The other half will vest based on achievement of performance targets related to both operating ratio and earnings before interest, taxes, depreciation and amortization adjusted for certain items.
Fair Value of All Stock Option Awards
The fair values of all stock option awards during the quarter and six months ended June 30, 2017, including those granted along with 2017 - 2019 LTIP and the CEO stock option award, were estimated at the grant date with the following weighted average assumptions:
|
| | | | | | | | | | | | | |
| | Second Quarters | | Six Months |
| | 2017 | 2016 | | 2017 | 2016 |
| Weighted-average grant date fair value | $ | 12.27 |
| $ | — |
| | $ | 12.83 |
| $ | 4.68 |
|
| | | | | | |
| Stock options valuation assumptions: | | | | | |
| Annual dividend yield | 1.5 | % | — |
| | 1.5 | % | 3.0 | % |
| Risk-free interest rate | 2.1 | % | — |
| | 2.2 | % | 1.4 | % |
| Annualized volatility | 27.0 | % | — |
| | 27.1 | % | 27.3 | % |
| Expected life (in years) | 6.5 |
| — |
| | 6.3 |
| 6.5 |
|
| | | | | | |
| Other pricing model inputs: | | | | | |
| Weighted-average grant-date market price of CSX stock (strike price) | $ | 47.80 |
| $ | — |
| | $ | 49.60 |
| $ | 24.13 |
|
|
| | |
| CSX Q2 2017 Form 10-Q p.13
|
|
CSX CORPORATION
NOTES TO CONSOLIDATED FINANCIAL STATEMENTS
(Unaudited)
NOTE 3. Share-Based Compensation, continued
Equity Award Modifications
The terms of performance units, restricted stock units and stock options grantedIn 2017, as part of the Company's long-term share-based compensation plans typically require participants to be employed through the final day of the respective performance or vesting period as applicable, except in the case of death, disability or retirement. As part of an enhanced severance benefit under the management streamlining and realignment initiative discussed in Note 1, unvested performance units, restricted stock units and stock options for separated employees not eligible for retirement were permitted to vest on a pro-rata basis.
Additionally, the terms of unvested equity awards for the former CEOChief Executive Officer, Michael J. Ward, and President, Clarence W. Gooden, were modified prior to their retirements on March 6, 2017 to permit prorated vesting through May 31, 2018. The terms were modified in exchange for each agreeing to serve in an advisory capacity upon request until May 31, 2017, and waiving various rights and claims, including the cancellation of their respective change of control agreements with the Company.
Together, these twoThe award modifications noted above impacted a total of 73 employees. The resulting58 employees and resulted in an increase to share-based compensation expense for revaluation of the affected awards was $19of $12 million for the second quarter, and $31 million for the sixthree months ended June 30,March 31, 2017. No significant award modifications took place in first quarter 2018.
|
| | |
| CSX Q1 2018 Form 10-Q p.13
|
|
CSX CORPORATION
NOTES TO CONSOLIDATED FINANCIAL STATEMENTS
(Unaudited)
NOTE 4. Casualty, Environmental and Other Reserves
Casualty,Personal injury and environmental and other reserves are considered critical accounting estimates due to the need for significant management judgment. TheyCasualty, environmental and other reserves are provided for in the consolidated balance sheets as shown in the table below:below.
| | | | June 30,
2017 | | December 30,
2016 | March 31,
2018 | | December 31,
2017 |
| (Dollars in millions) | Current | Long-term | Total | | Current | Long-term | Total | Current | Long-term | Total | | Current | Long-term | Total |
| | | | | | | |
| Casualty: | | | | | | |
| Personal Injury | $ | 45 |
| $ | 118 |
| $ | 163 |
| | $ | 46 |
| $ | 124 |
| $ | 170 |
| $ | 42 |
| $ | 120 |
| $ | 162 |
| | $ | 43 |
| $ | 125 |
| $ | 168 |
|
Occupational(a) | 4 |
| 56 |
| 60 |
| | 7 |
| 52 |
| 59 |
| 7 |
| 53 |
| 60 |
| | 6 |
| 54 |
| 60 |
|
| Total Casualty | 49 |
| 174 |
| 223 |
| | 53 |
| 176 |
| 229 |
| 49 |
| 173 |
| 222 |
| | 49 |
| 179 |
| 228 |
|
| Environmental | 43 |
| 44 |
| 87 |
| | 42 |
| 53 |
| 95 |
| 31 |
| 58 |
| 89 |
| | 31 |
| 59 |
| 90 |
|
| Other | 23 |
| 30 |
| 53 |
| | 20 |
| 30 |
| 50 |
| 26 |
| 27 |
| 53 |
| | 28 |
| 28 |
| 56 |
|
| Total | $ | 115 |
| $ | 248 |
| $ | 363 |
| | $ | 115 |
| $ | 259 |
| $ | 374 |
| $ | 106 |
| $ | 258 |
| $ | 364 |
| | $ | 108 |
| $ | 266 |
| $ | 374 |
|
| |
(a)
| Occupational reserves include asbestos-related diseases and occupational injuries. |
These liabilities are accrued when reasonably estimable and probable in accordance with the Contingencies Topic in the ASC. Actual settlements and claims received could differ, and final outcomes of these matters cannot be predicted with certainty. Considering the legal defenses currently available, the liabilities that have been recorded and other factors, it is the opinion of management that none of these items individually, when finally resolved, will have a material adverse effect on the Company's financial condition, results of operations or liquidity. Should a number of these items occur in the same period, however, their combined effect could be material in that particular period.
|
| | |
| CSX Q2 2017 Form 10-Q p.14
|
|
CSX CORPORATION
NOTES TO CONSOLIDATED FINANCIAL STATEMENTS
(Unaudited)
NOTE 4. Casualty, Environmental and Other Reserves, continued
Casualty
Casualty reserves of $223$222 million and $229$228 million as of June 30, 2017March 31, 2018 and December 30, 2016,31, 2017, respectively, represent accruals for personal injury, occupational disease and occupational injury claims. The Company's self-insured retention amount for these claims is $50 million per occurrence. Currently, no individual claim is expected to exceed the self-insured retention amount. In accordance with the Contingencies Topic in the ASC, to the extent the value of an individual claim exceeds the self-insured retention amount, the Company would present the liability on a gross basis with a corresponding receivable for insurance recoveries. These reserves fluctuate based upon the timing of payments as well as changes in estimate. Actual results may vary from estimates due to the number, type and severity of the injury, costs of medical treatments and uncertainties in litigation. Most of the Company's casualty claims relate to CSXT unless otherwise noted below. Defense and processing costs, which historically have been insignificant and are anticipated to be insignificant in the future, are not included in the recorded liabilities.
Personal Injury
Personal injury reserves represent liabilities for employee work-related and third-party injuries. Work-related injuries for CSXT employees are primarily subject to the Federal Employers’ Liability Act (“FELA”). In addition to FELA liabilities, employees of other current or former CSX subsidiaries are covered by various state workers’ compensation laws, the Federal Longshore and Harbor Workers’ Compensation Program or the Maritime Jones Act.
CSXT retains an independent actuary to assist management in assessing the value of personal injury claims. An analysis is performed by the actuary quarterly and is reviewed by management. This analysis for the quarter resulted in an immaterial adjustment to the personal injury reserve. The methodology used by the actuary includes a development factor to reflect growth or reduction in the value of these personal injury claims. It is based largely on CSXT's historical claims and settlement experience.
|
| | |
| CSX Q1 2018 Form 10-Q p.14
|
|
CSX CORPORATION
NOTES TO CONSOLIDATED FINANCIAL STATEMENTS
(Unaudited)
NOTE 4. Casualty, Environmental and Other Reserves, continued
Occupational
Occupational reserves represent liabilities for occupational disease and injury claims. Occupational disease claims arise primarily from allegations of exposure to asbestos in the workplace. Occupational injury claims arise from allegations of exposure to certain other materials in the workplace, such as solvents, soaps, chemicals (collectively referred to as “irritants”) and diesel fuels (like exhaust fumes) or allegations of chronic physical injuries resulting from work conditions, such as repetitive stress injuries.
The greatest possible exposure to asbestos for employees resulted from work conducted in and around steam locomotive engines that were largely phased out beginning around the 1950s. Other types of exposures, however, including exposure from locomotive component parts and building materials, continued until these exposures were substantially eliminated by 1985. Diseases associated with asbestos typically have long latency periods (amount of time between exposure to asbestos and the onset of the disease) which can range from 10 to 40 years after exposure.
Management reviews asserted asbestos claims quarterly. Unasserted or incurred but not reported ("IBNR") asbestos claims are analyzed by a third-party specialist and reviewed by management annually. CSXT’s historical claim filings, settlement amounts, and dismissal rates are analyzed to determine future anticipated claim filing rates and average settlement values for asbestos claims reserves. The potentially exposed population is estimated by using CSXT’s employment records and industry data. From this analysis, the specialist estimates the IBNR claims liabilities.
|
| | |
| CSX Q2 2017 Form 10-Q p.15
|
|
CSX CORPORATION
NOTES TO CONSOLIDATED FINANCIAL STATEMENTS
(Unaudited)
NOTE 4. Casualty, Environmental and Other Reserves, continued
Environmental
Environmental reserves were $87$89 million and $95$90 million as of June 30, 2017March 31, 2018 and December 30, 2016,31, 2017, respectively. The Company is a party to various proceedings related to environmental issues, including administrative and judicial proceedings involving private parties and regulatory agencies. The Company has been identified as a potentially responsible party at approximately 229221 environmentally impaired sites. Many of these are, or may be, subject to remedial action under the federal Comprehensive Environmental Response, Compensation and Liability Act of 1980 ("CERCLA"), also known as the Superfund Law, or similar state statutes. Most of these proceedings arose from environmental conditions on properties used for ongoing or discontinued railroad operations. A number of these proceedings, however, are based on allegations that the Company, or its predecessors, sent hazardous substances to facilities owned or operated by others for treatment, recycling or disposal. In addition, some of the Company's land holdings were leased to others for commercial or industrial uses that may have resulted in releases of hazardous substances or other regulated materials onto the property and could give rise to proceedings against the Company.
In any such proceedings, the Company is subject to environmental clean-up and enforcement actions under the Superfund Law, as well as similar state laws that may impose joint and several liability for clean-up and enforcement costs on current and former owners and operators of a site without regard to fault or the legality of the original conduct. These costs could be substantial.
In accordance with the Asset Retirement and Environmental Obligations Topic in the ASC, the Company reviews its role with respect to each site identified at least quarterly, giving consideration to a number of factors such as:
type of clean-up required;
nature of the Company's alleged connection to the location (e.g., generator of waste sent to the site or owner or operator of the site);
extent of the Company's alleged connection (e.g., volume of waste sent to the location and other relevant factors); and
number, connection and financial viability of other named and unnamed potentially responsible parties at the location.
Based on the review process, the Company has recorded amounts to cover contingent anticipated future environmental remediation costs with respect to each site to the extent such costs are reasonably estimable and probable. The recorded liabilities for estimated future environmental costs are undiscounted. The liability includes future costs for remediation and restoration of sites as well as any significant ongoing monitoring costs, but excludes any anticipated insurance recoveries. Payments related to these liabilities are expected to be made over the next several years. Environmental remediation costs are included in materials, supplies and other on the consolidated income statement.statements.
|
| | |
| CSX Q1 2018 Form 10-Q p.15
|
|
CSX CORPORATION
NOTES TO CONSOLIDATED FINANCIAL STATEMENTS
(Unaudited)
NOTE 4. Casualty, Environmental and Other Reserves, continued
Currently, the Company does not possess sufficient information to reasonably estimate the amounts of additional liabilities, if any, on some sites until completion of future environmental studies. In addition, conditions that are currently unknown could, at any given location, result in additional exposure, the amount and materiality of which cannot presently be reasonably estimated. Based upon information currently available, however, the Company believes its environmental reserves accurately reflect the estimated cost of remedial actions currently required.
|
| | |
| CSX Q2 2017 Form 10-Q p.16
|
|
CSX CORPORATION
NOTES TO CONSOLIDATED FINANCIAL STATEMENTS
(Unaudited)
NOTE 4. Casualty, Environmental and Other Reserves, continued
Other
Other reserves of $53 million and $50$56 million as of June 30, 2017March 31, 2018 and December 30, 2016,31, 2017, respectively, include liabilities for various claims, such as property, automobile and general liability. Also included in other reserves are longshoremen disability claims related to a previously owned international shipping business (these claims are in runoff) as well as claims for current port employees.
NOTE 5. Commitments and Contingencies
Insurance
The Company maintains numerous insurance programs with substantial limits for property damage (which includes business interruption) and third-party liability. A certain amount of risk is retained by the Company on each of the property and liability programs. The Company has a $25 million retention per occurrence for the non-catastrophic property program (such as a derailment) and a $50 million retention per occurrence for the liability and catastrophic property programs (such as hurricanes and floods). While the Company believes its insurance coverage is adequate, future claims could exceed existing insurance coverage or insurance may not continue to be available at commercially reasonable rates.
Legal
The Company is involved in litigation incidental to its business and is a party to a number of legal actions and claims, various governmental proceedings and private civil lawsuits, including, but not limited to, those related to fuel surcharge practices, tax matters, environmental and hazardous material exposure matters, FELA and labor claims by current or former employees, other personal injury or property claims and disputes and complaints involving certain transportation rates and charges. Some of the legal proceedings include claims for compensatory as well as punitive damages and others are, or are purported to be, class actions. While the final outcome of these matters cannot be reasonably determined, considering, among other things, the legal defenses available and liabilities that have been recorded along with applicable insurance, it is currently the opinion of management that none of these pending items is likely to have a material adverse effect on the Company's financial condition, results of operations or liquidity. An unexpected adverse resolution of one or more of these items, however, could have a material adverse effect on the Company's financial condition, results of operations or liquidity in that particular period.
The Company is able to estimate a range of possible loss for certain legal proceedings for which a loss is reasonably possible in excess of reserves established. The Company has estimated this range to be $3$2 million to $128$115 million in aggregate at June 30, 2017.March 31, 2018. This estimated aggregate range is based upon currently available information and is subject to significant judgment and a variety of assumptions. Accordingly, the Company's estimate will change from time to time, and actual losses may vary significantly from the current estimate.
|
| | |
| CSX Q1 2018 Form 10-Q p.16
|
|
CSX CORPORATION
NOTES TO CONSOLIDATED FINANCIAL STATEMENTS
(Unaudited)
NOTE 5. Commitments and Contingencies, continued
Fuel Surcharge Antitrust Litigation
In May 2007, class action lawsuits were filed against CSXT and three other U.S.-based Class I railroads alleging that the defendants' fuel surcharge practices relating to contract and unregulated traffic resulted from an illegal conspiracy in violation of antitrust laws. In November 2007, the class action lawsuits were consolidated in federal court in the District of Columbia, where they are now pending. The suit seeks treble damages allegedly sustained by purported class members as well as attorneys' fees and other relief. Plaintiffs are expected to allege damages at least equal to the fuel surcharges at issue.
|
| | |
| CSX Q2 2017 Form 10-Q p.17
|
|
CSX CORPORATION
NOTES TO CONSOLIDATED FINANCIAL STATEMENTS
(Unaudited)
NOTE 5. Commitments and Contingencies, continued
In June 2012, the District Court certified the case as a class action. The decision was not a ruling on the merits of plaintiffs' claims, but rather a decision to allow the plaintiffs to seek to prove the case as a class. The defendant railroads petitioned the U.S. Court of Appeals for the D.C. Circuit for permission to appeal the District Court's class certification decision. In August 2013, the D.C. Circuit issued a decision vacating the class certification decision and remanded the case to the District Court to reconsider its class certification decision. On October 10, 2017, the District Court issued an order denying class certification. The D.C. Circuit is reviewing the court's denial of class certification. The District Court remand proceedings are underway and the class certification hearing was held in September 2016. The District Court hashad delayed proceedings on the merits of the case pending the outcome of the class certification remand proceedings. The courtproceedings, and has given no indicationnot yet issued a further schedule in light of timing on its ruling regardingthe order denying class certification.certification and the related appeal.
CSXT believes that its fuel surcharge practices were arrived at and applied lawfully and that the case is without merit. Accordingly, the Company intends to defend itself vigorously. However, penalties for violating antitrust laws can be severe, and resolution of this matter or an unexpected adverse decision on the merits could have a material adverse effect on the Company's financial condition, results of operations or liquidity in that particular period.
Environmental
CSXT is indemnifying Pharmacia LLC (formerly known as Monsanto Company) for certain liabilities associated with real estate located in Kearny, New Jersey along the Lower Passaic River (the “Property”). The Property, which was formerly owned by Pharmacia, is now owned by CSXT. CSXT's indemnification and defense duties arise with respect to several matters. The U.S. Environmental Protection Agency ("EPA"), using its CERCLA authority, seeks cleanup and removal costs and other damages associated with the presence of hazardous substances in the 17-mile Lower Passaic River Study Area (the "Study Area”). CSXT, on behalf of Pharmacia, and a significant number of other potentially responsible parties are together conducting a Remedial Investigation and Feasibility Study of the Study Area pursuant to an Administrative Settlement Agreement and Order on Consent with the EPA.
In March 2016, EPA issued its Record of Decision detailing the agency’s mandated remedial process for the lower 8 miles of the Study Area, which was basedArea. Approximately 80 parties, including Pharmacia, are participating in an EPA-directed allocation process to assign responsibility for costs to be incurred implementing the remedy selected for the lower 8 miles of the Study Area. CSXT is participating in the allocation process on a Focused Feasibility Study. EPA has estimated that it will take the potentially responsible parties approximately ten years to complete the work.behalf of Pharmacia. At a later date, EPA will select a remedy for the remainder of the Study Area and is expected to again seek the participation of private parties to implement the selected remedy using EPA’s CERCLA authority to compel such participation, if necessary.
CSXT is also defending and indemnifying Pharmacia in a cooperative natural resource damages assessment process related to the Property. Based on currently available information, the Company does not believe any indemnification or remediation costs potentially allocable to CSXT with respect to the Property and the Study Area would be material to the Company's financial condition, results of operations or liquidity.
|
| | |
| | CSX Q2 2017Q1 2018 Form 10-Q p.18p.17
|
|
CSX CORPORATION
NOTES TO CONSOLIDATED FINANCIAL STATEMENTS
(Unaudited)
NOTE 6. Employee Benefit Plans
The Company sponsors defined benefit pension plans principally for salaried, management personnel. For employees hired prior to January 1, 2003, the plans provide eligible employees with retirement benefits based predominantly on years of service and compensation rates near retirement. For employees hired in 2003 or thereafter, benefits are determined based on a cash balance formula, which provides benefits by utilizing interest and pay credits based upon age, service and compensation.
In addition to these plans, the CompanyCSX also sponsors a post-retirement medical plan and a life insurance plan that provide certain benefits to full-time, salaried, managementeligible employees hired prior to January 1, 2003, upon their retirement if certain eligibility requirements are met. Eligible retirees who are age 65 years or older (Medicare-eligible) are covered by a health reimbursement arrangement, which is an employer-funded account that can be used for reimbursement of eligible medical expenses. Eligible retirees younger than 65 years (non-Medicare eligible) are covered by a self-insured program partially funded by participating retirees. The life insurance plan is non-contributory.
The Company engages independent2003. Independent actuaries to compute the amounts of liabilities and expenses relating to these plans subject to the assumptions that the Company determines are appropriate based on historical trends, current market rates and future projections. These amounts are reviewed by management. The following table describes
Only the componentsservice cost component of expense / (income) related to net periodic benefit expense recordedcosts is included in labor and fringe expense on the consolidated income statement. All other components of net periodic benefit cost are included in other income - net or, if related to prior year restructuring activities, as restructuring charge - non-operating.
| | | | Pension Benefits | Pension Benefits |
| (Dollars in millions) | Second Quarters | | Six Months | First Quarters |
| | 2017 | 2016 | | 2017 | 2016 | 2018 | 2017 |
| Service Cost | $ | 9 |
| $ | 12 |
| | $ | 20 |
| $ | 24 |
| |
| Service Cost Included in Labor and Fringe | | $ | 9 |
| $ | 11 |
|
| | | |
| Interest Cost | 23 |
| 30 |
| | 46 |
| 60 |
| 23 |
| 23 |
|
| Expected Return on Plan Assets | (43 | ) | (40 | ) | | (85 | ) | (79 | ) | (44 | ) | (42 | ) |
| Amortization of Net Loss | 10 |
| 12 |
| | 21 |
| 24 |
| 10 |
| 11 |
|
| Total Income Included in Other Income - Net | | $ | (11 | ) | $ | (8 | ) |
| | | |
| Net Periodic Benefit Cost | $ | (1 | ) | $ | 14 |
| | $ | 2 |
| $ | 29 |
| $ | (2 | ) | $ | 3 |
|
| Special Termination Benefits - Management Workforce Reduction/Curtailment | 7 |
| — |
| | 57 |
| — |
| |
| Total Expense | $ | 6 |
| $ | 14 |
| | $ | 59 |
| $ | 29 |
| |
| | | |
Restructuring Charges - Non Operating (a) | | — |
| 50 |
|
| Total (Income) Expense | | $ | (2 | ) | $ | 53 |
|
| | | | | |
| | Other Post-retirement Benefits | Other Post-retirement Benefits |
| (Dollars in millions) | Second Quarters | | Six Months | First Quarters |
| | 2017 | 2016 | | 2017 | 2016 | 2018 | 2017 |
| Service Cost | $ | 1 |
| $ | 1 |
| | $ | 1 |
| $ | 1 |
| |
| Interest Cost | 2 |
| 3 |
| | 4 |
| 6 |
| $ | 2 |
| $ | 2 |
|
| Amortization of Net Loss | — |
| — |
| | — |
| 1 |
| — |
| — |
|
| Total Expense Included in Other Income - Net | | $ | 2 |
| $ | 2 |
|
| | | |
| Net Periodic Benefit Cost | $ | 3 |
| $ | 4 |
| | $ | 5 |
| $ | 8 |
| $ | 2 |
| $ | 2 |
|
| Special Termination Benefits - Management Workforce Reduction/Curtailment | — |
| — |
| | 13 |
| — |
| |
| | | |
Restructuring Charges - Non Operating (a) | | — |
| 13 |
|
| Total Expense | $ | 3 |
| $ | 4 |
| | $ | 18 |
| $ | 8 |
| $ | 2 |
| $ | 15 |
|
|
| | |
| CSX Q2 2017 Form 10-Q p.19
|
|
CSX CORPORATION
NOTES TO CONSOLIDATED FINANCIAL STATEMENTS
(Unaudited)
NOTE 6. Employee Benefit Plans, continued
As a(a) Charges related to special termination benefits and curtailment costs were the result of the management workforce reductions in first and second quarters 2017, charges were incurred related to special termination benefits and curtailment costs. (For additional information regarding the management workforce reductions, seequarter 2017. See Management Workforce Reductions in Note 1,1. Nature of Operations and Significant Accounting Policies.) In first quarter 2017, the Company remeasured the other post-retirement benefits obligation and recorded a curtailment loss of $13 million in restructuring charge on the income statement. The remeasurement did not have a material impact on the other post-retirement benefits obligation. In connection with this remeasurement, the effective discount rate assumption was updated to 3.59% from 3.71%.
In the second quarter of 2017, the Company remeasured the pension benefits obligation and pension plan assets and recorded a curtailment loss of $4 million in restructuring charge on the income statement. This remeasurement resulted in a decrease to the liabilities for pension benefits of approximately $86 million and a corresponding decrease to accumulated other comprehensive loss. In connection with this remeasurement, the effective discount rate assumption was updated to 3.94% from 4.08%. There were no other changes to assumptions used to value pension benefits obligation and expense.
Qualified pension plan obligations are funded in accordance with regulatory requirements and with an objective of meeting or exceeding minimum funding requirements necessary to avoid restrictions on flexibility of plan operation and benefit payments. No contributions to the Company's qualified pension plans are expected in 2017.2018.
|
| | |
| CSX Q1 2018 Form 10-Q p.18
|
|
CSX CORPORATION
NOTES TO CONSOLIDATED FINANCIAL STATEMENTS
(Unaudited)
NOTE 7. Debt and Credit Agreements
Total activity related to long-term debt as of the end of secondfirst quarter 20172018 is shown in the table below. For fair value information related to the Company's long-term debt, see Note 9, Fair Value Measurements.
|
| | | | | | | | | |
| (Dollars in millions) | Current Portion | Long-term Portion | Total |
| Long-term debt as of December 30, 2016 | $ | 331 |
| $ | 10,962 |
| $ | 11,293 |
|
| 2017 activity: | | | |
| Long-term debt issued | — |
| 850 |
| 850 |
|
| Long-term debt repaid | (313 | ) | — |
| (313 | ) |
| Discount, premium and other activity | 1 |
| (3 | ) | (2 | ) |
| Debt issue cost activity | — |
| (3 | ) | (3 | ) |
| Long-term debt as of June 30, 2017 | $ | 19 |
| $ | 11,806 |
| $ | 11,825 |
|
|
| | | | | | | | | |
| (Dollars in millions) | Current Portion | Long-term Portion | Total |
| Long-term debt as of December 31, 2017 | $ | 19 |
| $ | 11,790 |
| $ | 11,809 |
|
| 2018 activity: | | | |
| Long-term debt issued | — |
| 2,000 |
| 2,000 |
|
| Discount, premium and other activity |
| (22 | ) | (22 | ) |
| Long-term debt as of March 31, 2018 | $ | 19 |
| $ | 13,768 |
| $ | 13,787 |
|
Debt Issuance
On May 1, 2017,February 20, 2018, CSX issued $800 million of 3.80% notes due 2028, $850 million of 3.25%4.30% notes due 2027.2048, and $350 million of 4.65% notes due 2068. These notes are included in the consolidated balance sheets under long-term debt and may be redeemed by the Company at any time. The net proceeds will be used for general corporate purposes, which may include repurchases of CSX's common stock, capital investment, working capital requirements, improvementimprovements in productivity and other cost reductions at CSX’sthe Company’s major transportation units.
|
| | |
| CSX Q2 2017 Form 10-Q p.20
|
|
CSX CORPORATION
NOTES TO CONSOLIDATED FINANCIAL STATEMENTS
(Unaudited)
NOTE 7. Debt and Credit Agreements, continued
Credit Facility
CSX has a $1 billion unsecured, revolving credit facility backed by a diverse syndicate of banks. This facility expires in May 2020, and as of the date of this filing, the Company has no outstanding balances under this facility. The facility allows borrowings at floating (LIBOR-based) interest rates, plus a spread, depending upon CSX's senior unsecured debt ratings. LIBOR is the London Interbank Offered Rate which is a daily reference rate based on the interest rates at which banks offer to lend unsecured funds.
Commitment fees and interest rates payable under the facility were similar to fees and rates available to comparably rated investment-grade borrowers. As of secondfirst quarter 2017,2018, CSX was in compliance with all covenant requirements under this facility.
Receivables Securitization Facility
The Company has a receivables securitization facility with a three-year term scheduled to expire in September 2019. The purpose of this facility is to provide an alternative to commercial paper and a low cost source of short-term liquidity of up to $200 million, depending on eligible receivables balances. As of the date of this filing, the Company has no outstanding balances under this facility.
|
| | |
| CSX Q1 2018 Form 10-Q p.19
|
|
CSX CORPORATION
NOTES TO CONSOLIDATED FINANCIAL STATEMENTS
(Unaudited)
NOTE 8. Income Taxes
The effective tax rate decreased to 23.8% from 37.8% for the first quarters ended March 31, 2018 and March 31, 2017, respectively, primarily as a result of the significant reduction in the federal corporate income tax rate effective January 1, 2018. In its initial analysis of the impacts of the Tax Cuts and Job Act (the “Act” or “tax reform”), the Company made certain estimates that may be adjusted in future periods as required. The Act has significant complexity and implementation guidance from the Internal Revenue Service, clarifications of state tax law and the completion of the Company’s 2017 tax return filings could all impact these estimates. The Company does not believe potential adjustments in future periods would materially impact the Company's financial condition or results of operations.
There have been no material changes to the balance of unrecognized tax benefits reported at December 30, 2016.31, 2017.
NOTE 9. Fair Value Measurements
The Financial Instruments Topic in the ASC requires disclosures about fair value of financial instruments in annual reports as well as in quarterly reports. For CSX, this statement applies to certain investments and long-term debt. Disclosure of the fair value of pension plan assets is only required annually. Also, this rule clarifies the definition of fair value for financial reporting, establishes a framework for measuring fair value and requires additional disclosures about the use of fair value measurements.
Various inputs are considered when determining the value of the Company's investments, pension plan assets and long-term debt. The inputs or methodologies used for valuing securities are not necessarily an indication of the risk associated with investing in these securities. These inputs are summarized in the three broad levels listed below.
Level 1 - observable market inputs that are unadjusted quoted prices for identical assets or liabilities in active markets;
Level 2 - other significant observable inputs (including quoted prices for similar securities, interest rates, credit risk, etc.); and
Level 3 - significant unobservable inputs (including the Company's own assumptions about the assumptions market participants would use in determining the fair value of investments).
|
| | |
| CSX Q2 2017 Form 10-Q p.21
|
|
CSX CORPORATION
NOTES TO CONSOLIDATED FINANCIAL STATEMENTS
(Unaudited)
NOTE 9. Fair Value Measurements, continued
The valuation methods described below may produce a fair value calculation that may not be indicative of net realizable value or reflective of future fair values. Furthermore, while the Company believes its valuation methods are appropriate and consistent with other market participants, the use of different methodologies or assumptions to determine the fair value of certain financial instruments could result in a different fair value measurement at the reporting date.
Investments
The Company's investment assets, valued with assistance from a third-party trustee, consist of certificates of deposits, commercial paper, corporate bonds and government securities and are carried at fair value on the consolidated balance sheet per the Fair Value Measurements and Disclosures Topic in the ASC. There are several valuation methodologies used for those assets as described below.
Certificates of Deposit and Commercial Paper (Level 2): Valued at amortized cost, which approximates fair value; and
Corporate Bonds and Government Securities (Level 2): Valued using broker quotes that utilize observable market inputs.
|
| | |
| CSX Q1 2018 Form 10-Q p.20
|
|
CSX CORPORATION
NOTES TO CONSOLIDATED FINANCIAL STATEMENTS
(Unaudited)
NOTE 9. Fair Value Measurements, continued
The Company's investment assets are carried at fair value on the consolidated balance sheets as summarized in the following table. All of the inputs used to determine the fair value of the Company's investments are Level 2 inputs. The amortized cost basis of these investments was $551$92 million and $500$95 million as of June 30, 2017March 31, 2018 and December 30, 2016,31, 2017, respectively.
| | | (Dollars in Millions) | June 30,
2017 | | December 30,
2016 | March 31,
2018 | | December 31,
2017 |
| | | Level 2 | | Level 2 |
| Certificates of Deposit and Commercial Paper | $ | 465 |
| | $ | 415 |
| $ | — |
| | $ | — |
|
| Corporate Bonds | 60 |
| | 63 |
| 58 |
| | 61 |
|
| Government Securities | 29 |
| | 22 |
| 36 |
| | 34 |
|
| Auction Rate Securities | | — |
| | — |
|
| Total investments at fair value | $ | 554 |
| | $ | 500 |
| $ | 94 |
| | $ | 95 |
|
These investments have the following maturities:
|
| | | | | | | |
| (Dollars in millions) | June 30,
2017 | | December 30,
2016 |
| Less than 1 year | $ | 477 |
| | $ | 417 |
|
| 1 - 2 years | 6 |
| | 12 |
|
| 2 - 5 years | 7 |
| | 4 |
|
| Greater than 5 years | 64 |
| | 67 |
|
| Total investments at fair value | $ | 554 |
| | $ | 500 |
|
|
| | |
| CSX Q2 2017 Form 10-Q p.22
|
|
CSX CORPORATION
NOTES TO CONSOLIDATED FINANCIAL STATEMENTS
(Unaudited)
NOTE 9. Fair Value Measurements, continued |
| | | | | | | |
| (Dollars in millions) | March 31,
2018 | | December 31,
2017 |
| Less than 1 year | $ | 10 |
| | $ | 18 |
|
| 1 - 5 years | 17 |
| | 11 |
|
| 5 - 10 years | 25 |
| | 26 |
|
| Greater than 10 years | 42 |
| | 40 |
|
| Total investments at fair value | $ | 94 |
| | $ | 95 |
|
Long-term Debt
Long-term debt is reported at carrying amount on the consolidated balance sheets and is the Company's only financial instrument with fair values significantly different from their carrying amounts. The majority of the Company's long-term debt is valued with assistance from an independent third party adviser that utilizes closing transactions, market quotes or market values of comparable debt. For those instruments not valued by the independent adviser, the fair value has been estimated by applying market rates of similar instruments to the scheduled contractual debt payments and maturities. These market rates are provided by the same independent adviser. All of the inputs used to determine the fair value of the Company's long-term debt are Level 2 inputs.
The fair value of outstanding debt fluctuates with changes in a number of factors. Such factors include, but are not limited to, interest rates, market conditions, credit ratings, values of similar financial instruments, size of the transaction, cash flow projections and comparable trades. Fair value will exceed carrying value when the current market interest rate is lower than the interest rate at which the debt was originally issued. The fair value of a company's debt is a measure of its current value under present market conditions. It does not impact the financial statements under current accounting rules.
|
| | |
| CSX Q1 2018 Form 10-Q p.21
|
|
CSX CORPORATION
NOTES TO CONSOLIDATED FINANCIAL STATEMENTS
(Unaudited)
NOTE 9. Fair Value Measurements, continued
The fair value and carrying value of the Company's long-term debt is as follows:
| | | (Dollars in millions) | June 30,
2017 | | December 30, 2016 | March 31,
2018 | | December 31, 2017 |
| Long-term Debt (Including Current Maturities): | | | | | | |
| Fair Value | $ | 13,168 |
| | $ | 12,096 |
| $ | 14,487 |
| | $ | 13,220 |
|
| Carrying Value | 11,825 |
| | 11,293 |
| 13,787 |
| | 11,809 |
|
NOTE 10. Other Comprehensive Income (Loss)
CSX reports comprehensive earnings or loss in accordance with the Comprehensive Income Topic in the ASC in the Consolidated Comprehensive Income Statement. Total comprehensive earnings are defined as all changes in shareholders' equity during a period, other than those resulting from investments by and distributions to shareholders (e.g. issuance of equity securities and dividends). Generally, for CSX, total comprehensive earnings equal net earnings plus or minus adjustments for pension and other post-retirement liabilities. Total comprehensive earnings represent the activity for a period net of tax and were $575$596 million and $454$368 million for secondfirst quarters 2018 and $943 million and $817 million for six months 2017, and 2016, respectively.
While total comprehensive earnings is the activity in a period and is largely driven by net earnings in that period, accumulated other comprehensive income or loss (“AOCI”) represents the cumulative balance of other comprehensive income, net of tax, as of the balance sheet date. For CSX, AOCI is primarily the cumulative balance related to pension and other post-retirement benefit adjustments and CSX's share of AOCI of equity method investees.
|
| | |
| CSX Q2 2017 Form 10-Q p.23
|
|
CSX CORPORATION
NOTES TO CONSOLIDATED FINANCIAL STATEMENTS
(Unaudited)
NOTE 10. Other Comprehensive Income (Loss), continued
Changes in the AOCI balance by component are shown in the table below. Amounts reclassified in pension and other post-employment benefits to net earnings relate to the amortization of actuarial losses and are included in labor and fringe on the consolidated income statements. See Note 6.6, Employee Benefit Plans, for further information. Other primarily represents CSX's share of AOCI of equity method investees. Amounts reclassified in other to net earnings are included in materials, supplies and otherequity earnings of affiliates on the consolidated income statements.
| | | | Pension and Other Post-Employment Benefits | Other | Accumulated Other Comprehensive Income (Loss) | Pension and Other Post-Employment Benefits | Other | Accumulated Other Comprehensive Income (Loss) |
| (Dollars in millions) | | |
| Balance December 30, 2016, Net of Tax | $ | (580 | ) | $ | (60 | ) | $ | (640 | ) | |
| Balance December 31, 2017, Net of Tax | | $ | (440 | ) | $ | (46 | ) | $ | (486 | ) |
| Other Comprehensive Income (Loss) | | |
| Income Before Reclassifications | 86 |
| — |
| 86 |
| — |
| 1 |
| 1 |
|
| Amounts Reclassified to Net Earnings | 24 |
| 2 |
| 26 |
| 10 |
| (2 | ) | 8 |
|
| Tax Expense | (40 | ) | (1 | ) | (41 | ) | |
| Total Other Comprehensive Income (Loss) | 70 |
| 1 |
| 71 |
| |
| Balance June 30, 2017, Net of Tax | $ | (510 | ) | $ | (59 | ) | $ | (569 | ) | |
| Tax (Expense) Benefit | | (2 | ) | 1 |
| (1 | ) |
| Reclassification of Stranded Tax Effects | | (108 | ) | 1 |
| (107 | ) |
| Total Other Comprehensive Income | | (100 | ) | 1 |
| (99 | ) |
| Balance March 31, 2018, Net of Tax | | $ | (540 | ) | $ | (45 | ) | $ | (585 | ) |
|
| | |
| CSX Q1 2018 Form 10-Q p.22
|
|
CSX CORPORATION
NOTES TO CONSOLIDATED FINANCIAL STATEMENTS
(Unaudited)
NOTE 11. Revenues
The Company’s revenues are primarily derived from the transportation of freight as performance obligations that arise from its contracts with customers are satisfied. The following table presents the Company’s revenues disaggregated by lines of business as they best depict how the nature, amount, timing and uncertainty of revenue and cash flows are affected by economic factors:
|
| | | | | | |
| | First Quarters |
| (Dollars in millions) | 2018 | 2017 |
| | | |
| Chemicals | $ | 557 |
| $ | 566 |
|
| Agricultural and Food Products | 307 |
| 332 |
|
| Automotive | 304 |
| 316 |
|
| Forest Products | 195 |
| 192 |
|
| Metals and Equipment | 186 |
| 190 |
|
| Fertilizers | 116 |
| 129 |
|
| Minerals | 114 |
| 114 |
|
| Total Merchandise | 1,779 |
| 1,839 |
|
| | | |
| Domestic Coal | 272 |
| 330 |
|
| Export Coal | 231 |
| 192 |
|
| Total Coal | 503 |
| 522 |
|
| | | |
| Domestic Intermodal | 294 |
| 291 |
|
| International Intermodal | 155 |
| 143 |
|
| Total Intermodal | 449 |
| 434 |
|
| | | |
| Other | 145 |
| 74 |
|
| | | |
| Total | $ | 2,876 |
| $ | 2,869 |
|
Revenue Recognition
The Company generates revenue from freight billings under contracts with customers generally on a rate per carload, container or ton-basis based on origin to destination and commodities carried. The Company’s performance obligation arises when it receives a bill of lading (“BOL”) to transport a customer's commodities based on a negotiated price contained in a transportation services agreement or a publicly disclosed tariff rate. Once a BOL is received, a contract is formed whereby the parties are committed to perform, collectability of consideration is probable and the rights of the parties, shipping terms and conditions, and payment terms are identified. A customer may submit several BOLs for transportation services at various times throughout a service agreement term but each shipment represents a distinct service that is a separately identified performance obligation. The average transit time to complete a shipment is between 3 to 8 days and payments for transportation services are normally billed once a BOL is received and are generally due within 15 days after the invoice date. The Company recognizes revenue over transit time of freight as it moves from origin to destination. Revenue for services started but not completed at the reporting date is allocated based on the relative transit time in each reporting period, with the portion allocated for services subsequent to the reporting date considered remaining performance obligations.
|
| | |
| CSX Q1 2018 Form 10-Q p.23
|
|
CSX CORPORATION
NOTES TO CONSOLIDATED FINANCIAL STATEMENTS
(Unaudited)
NOTE 11. Revenues, continued
The certain key estimates included in the recognition and measurement of revenue and related accounts receivable are as follows:
Revenue associated with shipments in transit is recognized ratably over transit time and is based on average cycle times to move commodities and products from their origin to their final destination or interchange;
Adjustments to revenue for billing corrections and billing discounts;
Adjustments to revenue for overcharge claims filed by customers, which are based on historical payments to customers for rate overcharges as a percentage of total billing;
Incentive-based refunds to customers, which are primarily volume-related, are recorded as a reduction to revenue on the basis of the projected liability (this estimate is based on historical activity, current volume levels and forecasted future volume).
Revenue related to interline transportation services that involve the services of another party, such as another railroad, is reported on a net basis. The portion of the gross amount billed to customers that is remitted by the Company to another party is not reflected as revenue.
Other revenue, which includes revenue from regional subsidiary railroads, demurrage, switching and other incidental charges, is recorded upon completion of the service and accounted for 5%of the Company’s total revenue in the first quarter of 2018. Revenue from regional railroads includes shipments by railroads that the Company does not directly operate. Demurrage represents charges assessed when freight cars are held beyond a specified period of time. Switching revenue is primarily generated when the Company switches cars for a customer or another railroad.
During the first quarters of 2018 and 2017, revenue recognized from performance obligations related to prior periods (for example, due to changes in transaction price), was not material.
Remaining Performance Obligations
Remaining performance obligations represent the transaction price allocated to future reporting periods for freight services started but not completed at the reporting date. This includes the unearned portion of billed and unbilled amounts for cancellable freight shipments in transit that the Company expects to recognize as revenue in the period subsequent to the reporting date, which is on average less than one week. As of March 31, 2018, the Company had no material remaining performance obligations.
Contract Balances and Accounts Receivable
The timing of revenue recognition, billings and cash collections results in accounts receivable and customer advances and deposits (contract liabilities) on the consolidated balance sheets. The Company had no material contract assets, contract liabilities or deferred contract costs recorded on the consolidated balance sheets as of March 31, 2018.
|
| | |
| CSX Q1 2018 Form 10-Q p.24
|
|
CSX CORPORATION
NOTES TO CONSOLIDATED FINANCIAL STATEMENTS
(Unaudited)
NOTE 11. Revenues, continued
The Company’s accounts receivable - net consists of freight and non-freight receivables, reduced by an allowance for doubtful accounts.
|
| | | | | | |
| (Dollars in millions) | March 31, 2018 | December 31, 2017 |
| | | |
| Freight Receivables | $ | 855 |
| $ | 810 |
|
| Freight Allowance for Doubtful Accounts | (18 | ) | (17 | ) |
| Freight Receivables, net | 837 |
| 793 |
|
| | | |
| Non-Freight Receivables | 218 |
| 186 |
|
| Non-Freight Allowance for Doubtful Accounts | (10 | ) | (9 | ) |
| Non-Freight Receivables, net | 208 |
| 177 |
|
| | | |
| Total Accounts Receivable, net | $ | 1,045 |
| $ | 970 |
|
Freight receivables include amounts earned, billed and unbilled, and currently due from customersfor transportation-related services. Non-freight receivables include amounts billed and unbilled and currently due related to government reimbursement receivables and other non-revenue receivables. The Company maintains an allowance for doubtful accounts to provide for the estimated amount of receivables that will not be collected. The allowance is based upon an assessment of customer creditworthiness, historical payment experience, the age of outstanding receivables and economic conditions.Impairment losses recognized on the Company’s accounts receivable were not material in the first quarters of 2018 and 2017.
NOTE 11.12. Summarized Consolidating Financial Data
In 2007, CSXT, a wholly-owned subsidiary of CSX Corporation, sold secured equipment notes maturing in 2023 in a registered public offering. CSX has fully and unconditionally guaranteed the notes. In connection with the notes, the Company is providing the following condensed consolidating financial information in accordance with SEC disclosure requirements. Each entity in the consolidating financial information follows the same accounting policies as described in the consolidated financial statements, except for the use of the equity method of accounting to reflect ownership interests in subsidiaries which are eliminated upon consolidation and the allocation of certain expenses of CSX incurred for the benefit of its subsidiaries. Condensed consolidating financial information for the obligor, CSXT, and parent guarantor, CSX, is shown in the following tables.
|
| | |
| | CSX Q2 2017 Form 10-Q p.24
|
|
CSX CORPORATION
NOTES TO CONSOLIDATED FINANCIAL STATEMENTS
(Unaudited)
NOTE 11.Summarized Consolidating Financial Data, continued
|
| | | | | | | | | | | | |
| Consolidating Income Statements |
| (Dollars in millions) |
| Second Quarter 2017 | CSX Corporation | CSX Transportation | Eliminations and Other | Consolidated |
| Revenue | $ | — |
| $ | 2,914 |
| $ | 19 |
| $ | 2,933 |
|
| Expense | 6 |
| 2,025 |
| (56 | ) | 1,975 |
|
| Operating Income | (6 | ) | 889 |
| 75 |
| 958 |
|
| | | | | |
| Equity in Earnings of Subsidiaries | 612 |
| — |
| (612 | ) | — |
|
| Interest (Expense) / Benefit | (143 | ) | (8 | ) | 14 |
| (137 | ) |
| Other Income / (Expense) - Net | 2 |
| 8 |
| (4 | ) | 6 |
|
| | | | | |
| Earnings Before Income Taxes | 465 |
| 889 |
| (527 | ) | 827 |
|
| Income Tax Benefit / (Expense) | 45 |
| (332 | ) | (30 | ) | (317 | ) |
| Net Earnings | $ | 510 |
| $ | 557 |
| $ | (557 | ) | $ | 510 |
|
| | | | | |
| Total Comprehensive Earnings | $ | 575 |
| $ | 558 |
| $ | (558 | ) | $ | 575 |
|
| | | | | |
| Second Quarter 2016 | CSX Corporation | CSX Transportation | Eliminations and Other | Consolidated |
| Revenue | $ | — |
| $ | 2,685 |
| $ | 19 |
| $ | 2,704 |
|
| Expense | (67 | ) | 1,961 |
| (30 | ) | 1,864 |
|
| Operating Income | 67 |
| 724 |
| 49 |
| 840 |
|
| | | | | |
| Equity in Earnings of Subsidiaries | 493 |
| — |
| (493 | ) | — |
|
| Interest (Expense) / Benefit | (141 | ) | (10 | ) | 10 |
| (141 | ) |
| Other Income / (Expense) - Net | — |
| 8 |
| — |
| 8 |
|
| | | | | |
| Earnings Before Income Taxes | 419 |
| 722 |
| (434 | ) | 707 |
|
| Income Tax (Expense) / Benefit | 26 |
| (269 | ) | (19 | ) | (262 | ) |
| Net Earnings | $ | 445 |
| $ | 453 |
| $ | (453 | ) | $ | 445 |
|
| | | | | |
| Total Comprehensive Earnings | $ | 454 |
| $ | 454 |
| $ | (454 | ) | $ | 454 |
|
|
| | |
| CSX Q2 2017Q1 2018 Form 10-Q p.25
|
|
CSX CORPORATION
NOTES TO CONSOLIDATED FINANCIAL STATEMENTS
(Unaudited)
NOTE 11.12. Summarized Consolidating Financial Data, continued
| | Consolidating Income Statements | (Dollars in millions) | | Six Months 2017 | CSX Corporation | CSX Transportation | Eliminations and Other | Consolidated | |
| First Quarter 2018 | | CSX Corporation | CSX Transportation | Eliminations and Other | Consolidated |
| Revenue | $ | — |
| $ | 5,765 |
| $ | 37 |
| $ | 5,802 |
| $ | — |
| $ | 2,857 |
| $ | 19 |
| $ | 2,876 |
|
| Expense | (42 | ) | 4,253 |
| (79 | ) | 4,132 |
| (78 | ) | 1,943 |
| (33 | ) | 1,832 |
|
| Operating Income | 42 |
| 1,512 |
| 116 |
| 1,670 |
| 78 |
| 914 |
| 52 |
| 1,044 |
|
| | | |
| Equity in Earnings of Subsidiaries | 1,034 |
| — |
| (1,034 | ) | — |
| 758 |
| — |
| (758 | ) | — |
|
| Interest (Expense) / Benefit | (285 | ) | (18 | ) | 29 |
| (274 | ) | (164 | ) | (9 | ) | 24 |
| (149 | ) |
| Other Income / (Expense) - Net | 5 |
| 19 |
| (11 | ) | 13 |
| 4 |
| 23 |
| (10 | ) | 17 |
|
| | | |
| Earnings Before Income Taxes | 796 |
| 1,513 |
| (900 | ) | 1,409 |
| 676 |
| 928 |
| (692 | ) | 912 |
|
| Income Tax (Expense) / Benefit | 76 |
| (567 | ) | (46 | ) | (537 | ) | |
| Income Tax Benefit / (Expense) | | 19 |
| (224 | ) | (12 | ) | (217 | ) |
| Net Earnings | $ | 872 |
| $ | 946 |
| $ | (946 | ) | $ | 872 |
| $ | 695 |
| $ | 704 |
| $ | (704 | ) | $ | 695 |
|
| | | |
| Total Comprehensive Earnings | $ | 943 |
| $ | 945 |
| $ | (945 | ) | $ | 943 |
| $ | 596 |
| $ | 700 |
| $ | (700 | ) | $ | 596 |
|
| | | |
| Six Months 2016 | CSX Corporation | CSX Transportation | Eliminations and Other | Consolidated | |
| First Quarter 2017 | | CSX Corporation | CSX Transportation | Eliminations and Other | Consolidated |
| Revenue | $ | — |
| $ | 5,283 |
| $ | 39 |
| $ | 5,322 |
| $ | — |
| $ | 2,851 |
| $ | 18 |
| $ | 2,869 |
|
| Expense | (139 | ) | 4,025 |
| (108 | ) | 3,778 |
| (48 | ) | 2,228 |
| (80 | ) | 2,100 |
|
| Operating Income | 139 |
| 1,258 |
| 147 |
| 1,544 |
| 48 |
| 623 |
| 98 |
| 769 |
|
| | | |
| Equity in Earnings of Subsidiaries | 894 |
| — |
| (894 | ) | — |
| 422 |
| — |
| (422 | ) | — |
|
| Interest (Expense) / Benefit | (284 | ) | (20 | ) | 20 |
| (284 | ) | (142 | ) | (10 | ) | 15 |
| (137 | ) |
| Other Income / (Expense) - Net | 1 |
| 15 |
| (1 | ) | 15 |
| 3 |
| 11 |
| (64 | ) | (50 | ) |
| | | |
| Earnings Before Income Taxes | 750 |
| 1,253 |
| (728 | ) | 1,275 |
| 331 |
| 624 |
| (373 | ) | 582 |
|
| Income Tax (Expense) / Benefit | 51 |
| (467 | ) | (58 | ) | (474 | ) | |
| Income Tax Benefit / (Expense) | | 31 |
| (235 | ) | (16 | ) | (220 | ) |
| Net Earnings | $ | 801 |
| $ | 786 |
| $ | (786 | ) | $ | 801 |
| $ | 362 |
| $ | 389 |
| $ | (389 | ) | $ | 362 |
|
| | | |
| Total Comprehensive Earnings | $ | 817 |
| $ | 786 |
| $ | (786 | ) | $ | 817 |
| $ | 368 |
| $ | 387 |
| $ | (387 | ) | $ | 368 |
|
| | | |
|
| | |
| | CSX Q2 2017Q1 2018 Form 10-Q p.26
|
|
CSX CORPORATION
NOTES TO CONSOLIDATED FINANCIAL STATEMENTS
(Unaudited)
NOTE 11.12. Summarized Consolidating Financial Data, continued
| | Consolidating Balance Sheet | (Dollars in millions) | | June 30, 2017 | CSX Corporation | CSX Transportation | Eliminations and Other | Consolidated | |
| March 31, 2018 | | CSX Corporation | CSX Transportation | Eliminations and Other | Consolidated |
| | | |
ASSETS | | Current Assets | | |
| Cash and Cash Equivalents | $ | 483 |
| $ | 128 |
| $ | 9 |
| $ | 620 |
| $ | 1,894 |
| $ | 81 |
| $ | 5 |
| $ | 1,980 |
|
| Short-term Investments | 465 |
| — |
| 12 |
| 477 |
| — |
| — |
| 10 |
| 10 |
|
| Accounts Receivable - Net | 1 |
| 292 |
| 722 |
| 1,015 |
| 2 |
| 253 |
| 790 |
| 1,045 |
|
| Receivable from Affiliates | 1,158 |
| 2,811 |
| (3,969 | ) | — |
| 991 |
| 3,647 |
| (4,638 | ) | — |
|
| Materials and Supplies | — |
| 428 |
| — |
| 428 |
| — |
| 369 |
| — |
| 369 |
|
| Other Current Assets | 2 |
| 72 |
| 16 |
| 90 |
| (1 | ) | 127 |
| 12 |
| 138 |
|
| Total Current Assets | 2,109 |
| 3,731 |
| (3,210 | ) | 2,630 |
| 2,886 |
| 4,477 |
| (3,821 | ) | 3,542 |
|
| | | |
| Properties | 1 |
| 40,979 |
| 2,771 |
| 43,751 |
| 1 |
| 41,230 |
| 2,872 |
| 44,103 |
|
| Accumulated Depreciation | (1 | ) | (10,824 | ) | (1,499 | ) | (12,324 | ) | (1 | ) | (10,772 | ) | (1,582 | ) | (12,355 | ) |
| Properties - Net | — |
| 30,155 |
| 1,272 |
| 31,427 |
| — |
| 30,458 |
| 1,290 |
| 31,748 |
|
| | | |
| Investments in Conrail | — |
| — |
| 856 |
| 856 |
| — |
| — |
| 918 |
| 918 |
|
| Affiliates and Other Companies | (39 | ) | 655 |
| 15 |
| 631 |
| (39 | ) | 817 |
| 18 |
| 796 |
|
| Investments in Consolidated Subsidiaries | 24,899 |
| — |
| (24,899 | ) | — |
| 29,915 |
| — |
| (29,915 | ) | — |
|
| Other Long-term Assets | 9 |
| 596 |
| (288 | ) | 317 |
| 52 |
| 629 |
| (246 | ) | 435 |
|
| Total Assets | $ | 26,978 |
| $ | 35,137 |
| $ | (26,254 | ) | $ | 35,861 |
| $ | 32,814 |
| $ | 36,381 |
| $ | (31,756 | ) | $ | 37,439 |
|
| | | |
| LIABILITIES AND SHAREHOLDERS' EQUITY | LIABILITIES AND SHAREHOLDERS' EQUITY | | LIABILITIES AND SHAREHOLDERS' EQUITY | |
| Current Liabilities | | |
| Accounts Payable | $ | 100 |
| $ | 669 |
| $ | 41 |
| $ | 810 |
| $ | 195 |
| $ | 674 |
| $ | 36 |
| $ | 905 |
|
| Labor and Fringe Benefits Payable | 70 |
| 396 |
| 40 |
| 506 |
| 37 |
| 384 |
| 22 |
| 443 |
|
| Payable to Affiliates | 3,998 |
| 495 |
| (4,493 | ) | — |
| 4,763 |
| 366 |
| (5,129 | ) | — |
|
| Casualty, Environmental and Other Reserves | — |
| 102 |
| 13 |
| 115 |
| — |
| 93 |
| 13 |
| 106 |
|
| Current Maturities of Long-term Debt | — |
| 19 |
| — |
| 19 |
| — |
| 18 |
| 1 |
| 19 |
|
| Income and Other Taxes Payable | (387 | ) | 449 |
| 33 |
| 95 |
| (126 | ) | 381 |
| 19 |
| 274 |
|
| Other Current Liabilities | (1 | ) | 123 |
| 5 |
| 127 |
| 2 |
| 142 |
| — |
| 144 |
|
| Total Current Liabilities | 3,780 |
| 2,253 |
| (4,361 | ) | 1,672 |
| 4,871 |
| 2,058 |
| (5,038 | ) | 1,891 |
|
| | | |
| Casualty, Environmental and Other Reserves | — |
| 200 |
| 48 |
| 248 |
| — |
| 215 |
| 43 |
| 258 |
|
| Long-term Debt | 11,050 |
| 756 |
| — |
| 11,806 |
| 13,036 |
| 732 |
| — |
| 13,768 |
|
| Deferred Income Taxes - Net | (169 | ) | 9,633 |
| 273 |
| 9,737 |
| (113 | ) | 6,389 |
| 209 |
| 6,485 |
|
| Other Long-term Liabilities | 730 |
| 386 |
| (319 | ) | 797 |
| 642 |
| 313 |
| (309 | ) | 646 |
|
| Total Liabilities | $ | 15,391 |
| $ | 13,228 |
| $ | (4,359 | ) | $ | 24,260 |
| $ | 18,436 |
| $ | 9,707 |
| $ | (5,095 | ) | $ | 23,048 |
|
| | | |
| Shareholders' Equity | | |
| Common Stock, $1 Par Value | $ | 913 |
| $ | 181 |
| $ | (181 | ) | $ | 913 |
| $ | 875 |
| $ | 181 |
| $ | (181 | ) | $ | 875 |
|
| Other Capital | 210 |
| 5,095 |
| (5,095 | ) | 210 |
| 215 |
| 5,097 |
| (5,097 | ) | 215 |
|
| Retained Earnings | 11,033 |
| 16,639 |
| (16,639 | ) | 11,033 |
| 13,873 |
| 21,392 |
| (21,392 | ) | 13,873 |
|
| Accumulated Other Comprehensive Loss | (569 | ) | (20 | ) | 20 |
| (569 | ) | (585 | ) | (9 | ) | 9 |
| (585 | ) |
| Noncontrolling Interest | — |
| 14 |
| — |
| 14 |
| — |
| 13 |
| — |
| 13 |
|
| Total Shareholders' Equity | $ | 11,587 |
| $ | 21,909 |
| $ | (21,895 | ) | $ | 11,601 |
| $ | 14,378 |
| $ | 26,674 |
| $ | (26,661 | ) | $ | 14,391 |
|
| Total Liabilities and Shareholders' Equity | $ | 26,978 |
| $ | 35,137 |
| $ | (26,254 | ) | $ | 35,861 |
| $ | 32,814 |
| $ | 36,381 |
| $ | (31,756 | ) | $ | 37,439 |
|
|
| | |
| | CSX Q2 2017Q1 2018 Form 10-Q p.27
|
|
CSX CORPORATION
NOTES TO CONSOLIDATED FINANCIAL STATEMENTS
(Unaudited)
NOTE 11.12. Summarized Consolidating Financial Data, continued
| | Consolidating Balance Sheet (Dollars in millions) | Consolidating Balance Sheet (Dollars in millions) | Consolidating Balance Sheet (Dollars in millions) |
| December 30, 2016 | CSX Corporation | CSX Transportation | Eliminations and Other | Consolidated | |
| December 31, 2017 | | CSX Corporation | CSX Transportation | Eliminations and Other | Consolidated |
ASSETS | | Current Assets | | |
| Cash and Cash Equivalents | $ | 305 |
| $ | 281 |
| $ | 17 |
| $ | 603 |
| $ | 274 |
| $ | 121 |
| $ | 6 |
| $ | 401 |
|
| Short-term Investments | 415 |
| — |
| 2 |
| 417 |
| — |
| — |
| 18 |
| 18 |
|
| Accounts Receivable - Net | 2 |
| 215 |
| 721 |
| 938 |
| (1 | ) | 301 |
| 670 |
| 970 |
|
| Receivable from Affiliates | 1,157 |
| 2,351 |
| (3,508 | ) | — |
| 1,226 |
| 3,517 |
| (4,743 | ) | — |
|
| Materials and Supplies | — |
| 407 |
| — |
| 407 |
| — |
| 372 |
| — |
| 372 |
|
| Other Current Assets | — |
| 106 |
| 16 |
| 122 |
| (1 | ) | 145 |
| 10 |
| 154 |
|
| Total Current Assets | 1,879 |
| 3,360 |
| (2,752 | ) | 2,487 |
| 1,498 |
| 4,456 |
| (4,039 | ) | 1,915 |
|
| | | |
| Properties | 1 |
| 40,518 |
| 2,708 |
| 43,227 |
| 1 |
| 41,479 |
| 2,844 |
| 44,324 |
|
| Accumulated Depreciation | (1 | ) | (10,634 | ) | (1,442 | ) | (12,077 | ) | (1 | ) | (11,017 | ) | (1,542 | ) | (12,560 | ) |
| Properties - Net | — |
| 29,884 |
| 1,266 |
| 31,150 |
| — |
| 30,462 |
| 1,302 |
| 31,764 |
|
| | | |
| Investments in Conrail | — |
| — |
| 840 |
| 840 |
| — |
| — |
| 907 |
| 907 |
|
| Affiliates and Other Companies | (39 | ) | 643 |
| 15 |
| 619 |
| (39 | ) | 800 |
| 18 |
| 779 |
|
| Investment in Consolidated Subsidiaries | 24,179 |
| — |
| (24,179 | ) | — |
| 29,405 |
| — |
| (29,405 | ) | — |
|
| Other Long-term Assets | 2 |
| 607 |
| (291 | ) | 318 |
| 39 |
| 596 |
| (261 | ) | 374 |
|
| Total Assets | $ | 26,021 |
| $ | 34,494 |
| $ | (25,101 | ) | $ | 35,414 |
| $ | 30,903 |
| $ | 36,314 |
| $ | (31,478 | ) | $ | 35,739 |
|
| | | |
| LIABILITIES AND SHAREHOLDERS' EQUITY | LIABILITIES AND SHAREHOLDERS' EQUITY | | LIABILITIES AND SHAREHOLDERS' EQUITY | |
| Current Liabilities | | |
| Accounts Payable | $ | 95 |
| $ | 678 |
| $ | 33 |
| $ | 806 |
| $ | 105 |
| $ | 708 |
| $ | 34 |
| $ | 847 |
|
| Labor and Fringe Benefits Payable | 40 |
| 440 |
| 65 |
| 545 |
| 52 |
| 494 |
| 56 |
| 602 |
|
| Payable to Affiliates | 3,457 |
| 500 |
| (3,957 | ) | — |
| 4,792 |
| 552 |
| (5,344 | ) | — |
|
| Casualty, Environmental and Other Reserves | — |
| 102 |
| 13 |
| 115 |
| — |
| 95 |
| 13 |
| 108 |
|
| Current Maturities of Long-term Debt | 313 |
| 19 |
| (1 | ) | 331 |
| — |
| 19 |
| — |
| 19 |
|
| Income and Other Taxes Payable | (346 | ) | 459 |
| 16 |
| 129 |
| (326 | ) | 455 |
| 28 |
| 157 |
|
| Other Current Liabilities | — |
| 112 |
| 2 |
| 114 |
| 5 |
| 153 |
| 3 |
| 161 |
|
| Total Current Liabilities | 3,559 |
| 2,310 |
| (3,829 | ) | 2,040 |
| 4,628 |
| 2,476 |
| (5,210 | ) | 1,894 |
|
| | | |
| Casualty, Environmental and Other Reserves | — |
| 208 |
| 51 |
| 259 |
| — |
| 222 |
| 44 |
| 266 |
|
| Long-term Debt | 10,203 |
| 759 |
| — |
| 10,962 |
| 11,056 |
| 733 |
| 1 |
| 11,790 |
|
| Deferred Income Taxes - Net | (203 | ) | 9,541 |
| 258 |
| 9,596 |
| (130 | ) | 6,342 |
| 206 |
| 6,418 |
|
| Other Long-term Liabilities | 783 |
| 410 |
| (330 | ) | 863 |
| 644 |
| 320 |
| (314 | ) | 650 |
|
| Total Liabilities | $ | 14,342 |
| $ | 13,228 |
| $ | (3,850 | ) | $ | 23,720 |
| $ | 16,198 |
| $ | 10,093 |
| $ | (5,273 | ) | $ | 21,018 |
|
| | | |
| Shareholders' Equity | | |
| Common Stock, $1 Par Value | $ | 928 |
| $ | 181 |
| $ | (181 | ) | $ | 928 |
| $ | 890 |
| $ | 181 |
| $ | (181 | ) | $ | 890 |
|
| Other Capital | 138 |
| 5,095 |
| (5,095 | ) | 138 |
| 217 |
| 5,096 |
| (5,096 | ) | 217 |
|
| Retained Earnings | 11,253 |
| 15,994 |
| (15,994 | ) | 11,253 |
| 14,084 |
| 20,933 |
| (20,933 | ) | 14,084 |
|
| Accumulated Other Comprehensive Loss | (640 | ) | (19 | ) | 19 |
| (640 | ) | (486 | ) | (5 | ) | 5 |
| (486 | ) |
| Noncontrolling Minority Interest | — |
| 15 |
| — |
| 15 |
| — |
| 16 |
| — |
| 16 |
|
| Total Shareholders' Equity | $ | 11,679 |
| $ | 21,266 |
| $ | (21,251 | ) | $ | 11,694 |
| $ | 14,705 |
| $ | 26,221 |
| $ | (26,205 | ) | $ | 14,721 |
|
| Total Liabilities and Shareholders' Equity | $ | 26,021 |
| $ | 34,494 |
| $ | (25,101 | ) | $ | 35,414 |
| $ | 30,903 |
| $ | 36,314 |
| $ | (31,478 | ) | $ | 35,739 |
|
|
| | |
| | CSX Q2 2017Q1 2018 Form 10-Q p.28
|
|
CSX CORPORATION
NOTES TO CONSOLIDATED FINANCIAL STATEMENTS
(Unaudited)
NOTE 11.12. Summarized Consolidating Financial Data, continued
| | Consolidating Cash Flow Statements | (Dollars in millions) | | Six Months 2017 | CSX Corporation | CSX Transportation | Eliminations and Other | Consolidated | |
| Three Months 2018 | | CSX Corporation | CSX Transportation | Eliminations and Other | Consolidated |
| Operating Activities | | |
| Net Cash Provided by (Used in) Operating Activities | $ | 814 |
| $ | 973 |
| $ | (221 | ) | $ | 1,566 |
| $ | 691 |
| $ | 621 |
| $ | (346 | ) | $ | 966 |
|
| Investing Activities | |
| | |
| |
| Property Additions | — |
| (873 | ) | (82 | ) | (955 | ) | — |
| (339 | ) | (29 | ) | (368 | ) |
| Proceeds from Property Dispositions | | — |
| 52 |
| — |
| 52 |
|
| Purchases of Short-term Investments | (539 | ) | — |
| (6 | ) | (545 | ) | — |
| — |
| — |
| — |
|
| Proceeds from Sales of Short-term Investments | 490 |
| — |
| 2 |
| 492 |
| — |
| — |
| 8 |
| 8 |
|
| Other Investing Activities | (2 | ) | 51 |
| (8 | ) | 41 |
| (1 | ) | (120 | ) | 113 |
| (8 | ) |
| Net Cash Provided by (Used in) Investing Activities | (51 | ) | (822 | ) | (94 | ) | (967 | ) | (1 | ) | (407 | ) | 92 |
| (316 | ) |
| Financing Activities | | |
| Long-term Debt Issued | 850 |
| — |
| — |
| 850 |
| 2,000 |
| — |
| — |
| 2,000 |
|
| Long-term Debt Repaid | (313 | ) | — |
| — |
| (313 | ) | — |
| — |
| — |
| — |
|
| Dividends Paid | (350 | ) | (300 | ) | 300 |
| (350 | ) | (194 | ) | (250 | ) | 250 |
| (194 | ) |
| Shares Repurchased | (757 | ) | — |
| — |
| (757 | ) | (836 | ) | — |
| — |
| (836 | ) |
| Other Financing Activities | (15 | ) | (4 | ) | 7 |
| (12 | ) | (40 | ) | (4 | ) | 3 |
| (41 | ) |
| Net Cash Provided by (Used in) Financing Activities | (585 | ) | (304 | ) | 307 |
| (582 | ) | 930 |
| (254 | ) | 253 |
| 929 |
|
| Net Increase (Decrease) in Cash and Cash Equivalents | 178 |
| (153 | ) | (8 | ) | 17 |
| 1,620 |
| (40 | ) | (1 | ) | 1,579 |
|
| Cash and Cash Equivalents at Beginning of Period | 305 |
| 281 |
| 17 |
| 603 |
| 274 |
| 121 |
| 6 |
| 401 |
|
| Cash and Cash Equivalents at End of Period | $ | 483 |
| $ | 128 |
| $ | 9 |
| $ | 620 |
| $ | 1,894 |
| $ | 81 |
| $ | 5 |
| $ | 1,980 |
|
|
| | |
| | CSX Q2 2017Q1 2018 Form 10-Q p.29
|
|
CSX CORPORATION
NOTES TO CONSOLIDATED FINANCIAL STATEMENTS
(Unaudited)
NOTE 11.12. Summarized Consolidating Financial Data, continued
| | Consolidating Cash Flow Statements | (Dollars in millions) | | Six Months 2016 | CSX Corporation | CSX Transportation | Eliminations and Other | Consolidated | |
| Three Months 2017 | | CSX Corporation | CSX Transportation | Eliminations and Other | Consolidated |
| Operating Activities | | |
| Net Cash Provided by (Used in) Operating Activities | $ | 295 |
| $ | 1,449 |
| $ | (152 | ) | $ | 1,592 |
| $ | 644 |
| $ | 566 |
| $ | (167 | ) | $ | 1,043 |
|
| Investing Activities | | |
| Property Additions | — |
| (994 | ) | (72 | ) | (1,066 | ) | — |
| (397 | ) | (44 | ) | (441 | ) |
| Proceeds from Property Dispositions | | — |
| 5 |
| 8 |
| 13 |
|
| Purchases of Short-term Investments | (260 | ) | — |
| — |
| (260 | ) | (75 | ) | — |
| — |
| (75 | ) |
| Proceeds from Sales of Short-term Investments | 810 |
| — |
| — |
| 810 |
| 205 |
| — |
| — |
| 205 |
|
| Other Investing Activities | (2 | ) | 104 |
| (67 | ) | 35 |
| (1 | ) | (29 | ) | 42 |
| 12 |
|
| Net Cash Provided by (Used in) Investing Activities | 548 |
| (890 | ) | (139 | ) | (481 | ) | 129 |
| (421 | ) | 6 |
| (286 | ) |
| Financing Activities | | |
| Dividends Paid | (344 | ) | (300 | ) | 300 |
| (344 | ) | (166 | ) | (150 | ) | 150 |
| (166 | ) |
| Shares Repurchased | (515 | ) | — |
| — |
| (515 | ) | (258 | ) | — |
| — |
| (258 | ) |
| Other Financing Activities | (8 | ) | (307 | ) | 1 |
| (314 | ) | (6 | ) | (4 | ) | 4 |
| (6 | ) |
| Net Cash Provided by (Used in) Financing Activities | (867 | ) | (607 | ) | 301 |
| (1,173 | ) | (430 | ) | (154 | ) | 154 |
| (430 | ) |
| Net Increase (Decrease) in Cash and Cash Equivalents | (24 | ) | (48 | ) | 10 |
| (62 | ) | 343 |
| (9 | ) | (7 | ) | 327 |
|
| Cash and Cash Equivalents at Beginning of Period | 444 |
| 175 |
| 9 |
| 628 |
| 305 |
| 281 |
| 17 |
| 603 |
|
| Cash and Cash Equivalents at End of Period | $ | 420 |
| $ | 127 |
| $ | 19 |
| $ | 566 |
| $ | 648 |
| $ | 272 |
| $ | 10 |
| $ | 930 |
|
|
| | |
| | CSX Q2 2017Q1 2018 Form 10-Q p.30
|
|
CSX CORPORATION
ITEM 2. MANAGEMENT'S DISCUSSION AND ANALYSIS OF FINANCIAL CONDITION AND RESULTS OF OPERATIONS
SECONDFIRST QUARTER 20172018 HIGHLIGHTS
Revenue increased $229$7 million to $2.9 billion or 8 percent year over year.billion.
Expenses of $2.0 billionincreaseddecreased $111268 million to $1.8 billion, or 6 percent13% year over year.
Operating income of $958$1,044 million increased $118$275 million, or 14 percent36% year over year.
Operating ratio of 67.4%63.7% improved150 950 basis points versus last year's quarter.
Earnings per share of $0.55$0.78 increased $0.080.39, or 17100 percent year over year.
| | | | Second Quarters | | Six Months | First Quarters |
| | 2017 | 2016 | Fav / (Unfav) | % Change | | 2017 | 2016 | Fav /
(Unfav) | % Change | 2018 | 2017 | Fav / (Unfav) | % Change |
Volume (in thousands) | 1,620 |
| 1,595 |
| 25 |
| 2% | | 3,212 |
| 3,146 |
| 66 |
| 2% | 1,532 |
| 1,592 |
| (60 | ) | (4)% |
| | | | | | | |
| (in millions) | | | | | | |
| Revenue | $ | 2,933 |
| $ | 2,704 |
| $ | 229 |
| 8% | | $ | 5,802 |
| $ | 5,322 |
| $ | 480 |
| 9% | $ | 2,876 |
| $ | 2,869 |
| $ | 7 |
| —% |
| Expense | 1,975 |
| 1,864 |
| (111 | ) | (6)% | | 4,132 |
| 3,778 |
| (354 | ) | (9)% | 1,832 |
| 2,100 |
| 268 |
| 13% |
| Operating Income | $ | 958 |
| $ | 840 |
| $ | 118 |
| 14% | | $ | 1,670 |
| $ | 1,544 |
| $ | 126 |
| 8% | $ | 1,044 |
| $ | 769 |
| $ | 275 |
| 36% |
| | | | | | | |
| Operating Ratio | 67.4 | % | 68.9 | % | 150 |
| bps | | 71.2 | % | 71.0 | % | (20 | ) | bps | 63.7 | % | 73.2 | % | 950 |
| bps |
| | | | | | | |
| Earnings Per Diluted Share | $ | 0.55 |
| $ | 0.47 |
| $ | 0.08 |
| 17% | | $ | 0.94 |
| $ | 0.84 |
| $ | 0.10 |
| 12% | $ | 0.78 |
| $ | 0.39 |
| $ | 0.39 |
| 100% |
In second quarter 2017, the Company continued implementation of Precision Scheduled Railroading. As a result, CSX is adjusting its strategy to successfully execute this new model, relentlessly focusing on providing customer service, controlling costs, operating safely, developing people and optimizing assets.
Also in second quarter 2017, the Company continued restructuring activities, which resulted in a restructuring charge of $122 million for the quarter and $295 million year-to-date. The Company expects estimated pre-tax savings on both future earnings and cash flows resulting from the management workforce reduction to be approximately $200 million per year.
|
| | |
| | CSX Q2 2017Q1 2018 Form 10-Q p.31
|
|
CSX CORPORATION
ITEM 2. MANAGEMENT'S DISCUSSION AND ANALYSIS OF FINANCIAL CONDITION AND RESULTS OF OPERATIONS
|
| | | | | | | | | | | | | | | | | | | | | | | | | | | | | | |
Volume and Revenue (Unaudited) |
| Volume (Thousands of units); Revenue (Dollars in Millions); Revenue Per Unit (Dollars) |
| Second Quarters |
| | Volume | | Revenue | | Revenue Per Unit |
| | 2017 | | 2016 | | % Change | | 2017 | | 2016 | | % Change | | 2017 | | 2016 | | % Change |
| Agricultural | | | | | | | | | |
Agricultural and Food Products (a) | 114 |
| | 116 |
| | (2 | )% | | $ | 321 |
| | $ | 307 |
| | 5 | % | | $ | 2,816 |
| | $ | 2,647 |
| | 6 | % |
Fertilizers (a) | 78 |
| | 72 |
| | 8 |
| | 118 |
| | 114 |
| | 4 |
| | 1,513 |
| | 1,583 |
| | (4 | ) |
| Industrial | | | | | | | | | | | | | | | | | |
Chemicals (a) | 169 |
| | 172 |
| | (2 | ) | | 552 |
| | 534 |
| | 3 |
| | 3,266 |
| | 3,105 |
| | 5 |
|
| Automotive | 116 |
| | 121 |
| | (4 | ) | | 307 |
| | 313 |
| | (2 | ) | | 2,647 |
| | 2,587 |
| | 2 |
|
Metals and Equipment (a) | 67 |
| | 71 |
| | (6 | ) | | 178 |
| | 186 |
| | (4 | ) | | 2,657 |
| | 2,620 |
| | 1 |
|
| Housing and Construction | | | | | | | | | | | | | | | | | |
Minerals (a) | 83 |
| | 86 |
| | (3 | ) | | 128 |
| | 126 |
| | 2 |
| | 1,542 |
| | 1,465 |
| | 5 |
|
| Forest Products | 67 |
| | 68 |
| | (1 | ) | | 194 |
| | 192 |
| | 1 |
| | 2,896 |
| | 2,824 |
| | 3 |
|
| Total Merchandise | 694 |
| | 706 |
| | (2 | ) | | 1,798 |
| | 1,772 |
| | 1 |
| | 2,591 |
| | 2,510 |
| | 3 |
|
| Coal | 208 |
| | 195 |
| | 7 |
| | 530 |
| | 416 |
| | 27 |
| | 2,548 |
| | 2,133 |
| | 19 |
|
| Intermodal | 718 |
| | 694 |
| | 3 |
| | 448 |
| | 419 |
| | 7 |
| | 624 |
| | 604 |
| | 3 |
|
| Other | — |
| | — |
| | — |
| | 157 |
| | 97 |
| | 62 |
| | — |
| | — |
| | — |
|
| Total | 1,620 |
| | 1,595 |
| | 2 | % | | $ | 2,933 |
| | $ | 2,704 |
| | 8 | % | | $ | 1,810 |
| | $ | 1,695 |
| | 7 | % |
| | | | | | | | | | | | | | | | | | |
| Six Months |
| | Volume | | Revenue | | Revenue Per Unit |
| | 2017 | | 2016 | | % Change | | 2017 | | 2016 | | % Change | | 2017 | | 2016 | | % Change |
| Agricultural | | | | | | | | | | | | | | | | | |
Agricultural and Food Products (a) | 235 |
| | 237 |
| | (1 | )% | | $ | 653 |
| | $ | 630 |
| | 4 | % | | $ | 2,779 |
| | $ | 2,658 |
| | 5 | % |
Fertilizers (a) | 155 |
| | 148 |
| | 5 |
| | 247 |
| | 241 |
| | 2 |
| | 1,594 |
| | 1,628 |
| | (2 | ) |
| Industrial | | | | | | | | | | | | | | | | | |
Chemicals (a) | 344 |
| | 347 |
| | (1 | ) | | 1,118 |
| | 1,080 |
| | 4 |
| | 3,250 |
| | 3,112 |
| | 4 |
|
| Automotive | 235 |
| | 234 |
| | — |
| | 623 |
| | 603 |
| | 3 |
| | 2,651 |
| | 2,577 |
| | 3 |
|
Metals and Equipment(a) | 137 |
| | 133 |
| | 3 |
| | 368 |
| | 351 |
| | 5 |
| | 2,686 |
| | 2,639 |
| | 2 |
|
| Housing and Construction | | | | | | | | | | | | | | | | | |
Minerals (a) | 153 |
| | 144 |
| | 6 |
| | 242 |
| | 220 |
| | 10 |
| | 1,582 |
| | 1,528 |
| | 4 |
|
| Forest Products | 134 |
| | 136 |
| | (1 | ) | | 386 |
| | 381 |
| | 1 |
| | 2,881 |
| | 2,801 |
| | 3 |
|
| Total Merchandise | 1,393 |
| | 1,379 |
| | 1 |
| | 3,637 |
| | 3,506 |
| | 4 |
| | 2,611 |
| | 2,542 |
| | 3 |
|
| Coal | 413 |
| | 395 |
| | 5 |
| | 1,052 |
| | 815 |
| | 29 |
| | 2,547 |
| | 2,063 |
| | 23 |
|
| Intermodal | 1,406 |
| | 1,372 |
| | 2 |
| | 882 |
| | 824 |
| | 7 |
| | 627 |
| | 601 |
| | 4 |
|
| Other | — |
| | — |
| | — |
| | 231 |
| | 177 |
| | 31 |
| | — |
| | — |
| | — |
|
| Total | 3,212 |
| | 3,146 |
| | 2 | % | | $ | 5,802 |
| | $ | 5,322 |
| | 9 | % | | $ | 1,806 |
| | $ | 1,692 |
| | 7 | % |
|
| | | | | | | | | | | | | | | | | | | | | | | | | | | | | | |
Volume and Revenue (Unaudited) |
| Volume (Thousands of units); Revenue (Dollars in Millions); Revenue Per Unit (Dollars) |
| First Quarters |
| | Volume | | Revenue | | Revenue Per Unit |
| | 2018 | | 2017 | | % Change | | 2018 | | 2017 | | % Change | | 2018 | | 2017 | | % Change |
| Chemicals | 162 |
| | 175 |
| | (7 | )% | | $ | 557 |
| | $ | 566 |
| | (2 | )% | | $ | 3,438 |
| | $ | 3,234 |
| | 6 | % |
| Automotive | 112 |
| | 119 |
| | (6 | ) | | 304 |
| | 316 |
| | (4 | ) | | 2,714 |
| | 2,655 |
| | 2 |
|
| Agricultural and Food Products | 107 |
| | 121 |
| | (12 | ) | | 307 |
| | 332 |
| | (8 | ) | | 2,869 |
| | 2,744 |
| | 5 |
|
| Forest Products | 67 |
| | 67 |
| | — |
| | 195 |
| | 192 |
| | 2 |
| | 2,910 |
| | 2,866 |
| | 2 |
|
| Minerals | 66 |
| | 70 |
| | (6 | ) | | 114 |
| | 114 |
| | — |
| | 1,727 |
| | 1,629 |
| | 6 |
|
| Metals and Equipment | 64 |
| | 70 |
| | (9 | ) | | 186 |
| | 190 |
| | (2 | ) | | 2,906 |
| | 2,714 |
| | 7 |
|
| Fertilizers | 64 |
| | 77 |
| | (17 | ) | | 116 |
| | 129 |
| | (10 | ) | | 1,813 |
| | 1,675 |
| | 8 |
|
| Total Merchandise | 642 |
| | 699 |
| | (8 | ) | | 1,779 |
| | 1,839 |
| | (3 | ) | | 2,771 |
| | 2,631 |
| | 5 |
|
| Coal | 201 |
| | 205 |
| | (2 | ) | | 503 |
| | 522 |
| | (4 | ) | | 2,502 |
| | 2,546 |
| | (2 | ) |
| Intermodal | 689 |
| | 688 |
| | — |
| | 449 |
| | 434 |
| | 3 |
| | 652 |
| | 631 |
| | 3 |
|
| Other | — |
| | — |
| | — |
| | 145 |
| | 74 |
| | 96 |
| | — |
| | — |
| | — |
|
| Total | 1,532 |
| | 1,592 |
| | (4 | )% | | $ | 2,876 |
| | $ | 2,869 |
| | — | % | | $ | 1,877 |
| | $ | 1,802 |
| | 4 | % |
(a) At the beginning of the third quarter 2016, in order to better align markets with the Company's business strategy, changes were made in the categorization of certain lines of business. Prior periods have been reclassified to conform to the current presentation and are posted on the Company's website at csx.com under the investors section.
Agricultural and Food Products includes the combination of the previous Agricultural Products and Food and Consumer markets.
Fertilizers was previously named Phosphates and Fertilizers.
Metals and Equipment includes the Equipment portion of the previous Waste and Equipment market.
Chemicals includes the Waste portion of the previous Waste and Equipment market. Chemicals also includes fly ash for remediation purposes (a form of waste) which was previously included within the Minerals market.
|
| | |
| | CSX Q2 2017Q1 2018 Form 10-Q p.32
|
|
CSX CORPORATION
ITEM 2. MANAGEMENT'S DISCUSSION AND ANALYSIS OF FINANCIAL CONDITION AND RESULTS OF OPERATIONS
SecondFirst Quarter 20172018
Revenue
RevenueTotal revenue was relatively flat and revenue per unit increased 4% for the secondfirst quarter increased $229 million or 8 percent2018 when compared to the previous year, with growthfirst quarter 2017, primarily due to increases in other revenue, fuel recovery and price increases across nearly all markets. This growth was primarily drivenmost markets, mostly offset by coal-related gains, strength in core pricing and volume across the other markets, and increased fuel recovery.declines.
Merchandise
Agricultural SectorChemicals - Volume declined as a result of reduced fly ash shipments, sustained challenges in energy markets and inventory shortages caused by plant outages reducing plastic shipments.
Automotive - Volume declined primarily due to a reduction in North American vehicle production and the industry's strained autorack fleet.
Agricultural and Food Products - Volume declined due to losses in the ethanol market as a large southeasternwell as challenges in the domestic and export grain crop led to local truck sourcing to feed mills in lieu of longer-haul rail moves. This decline was partially offset by gains in ethanol reflecting higher production levels and new business wins.markets.
FertilizersForest Products - Volume increased as operational efficiency moving phosphate rock allowedwas flat due to gains for additional rail conversion of traffic that would otherwise movepanel products from southeastern origins, which were offset by truck.
Industrial Sector
Chemicals - Volume fell, primarily reflecting sustained challengesa decline in the Eastern crude-by-rail market. This decline offset strength in non-energy related chemicals as well as increased shipments of frac sand and petroleum gases, as higher natural gas prices spurred additional drilling activity.lumber shipments.
AutomotiveMinerals - Volume declined on lower production, consistent with slowing North American vehicle sales and rising inventory levels.due to prior year’s mild winter weather which allowed producers to ship ahead of the typical shipping season.
Metals and Equipment - Volume was down as cycling of prior year large pipe projects and one-time equipment movesdeclines were completeddriven by a decrease in the quarter. Additionally, scrap metal shipments were negatively impacted by local sourceresulting from shifts to truck.
Housingin the global marketplace and Construction Sector
Minerals - Volume was down modestly despite strong demand for aggregates to support construction projects, as the Company transitioned various customers to a new operating plan.declines in transportation equipment moves.
Forest ProductsFertilizers - Volume declined as industry consolidation and truck competition negatively impacted shipmentsprimarily due to the closure of paper products. These headwinds were partially offset by positive momentum from e-commerce growth in pulpboarda customer facility impacting short-haul rail shipments.
Coal
Domestic Utility Coal - VolumeUtility coal volume declined as the competitive loss of short-haul interchange traffic more than offset underlying growth at existing utilities.
Domesticreflecting strong competition from natural gas. Coke, Iron Ore and Other - Volume was down, primarily in iron ore and other volume declined, primarily driven by sourcing shifts as producers focused shipments as a large customer has temporarily halted its production.towards the export market.
Export Coal - Volume increased as global supply levels and pricing conditions extended the strongelevated global benchmark prices supported continued demand environment for U.S. coal exports, particularly in the metallurgical portfolio.exports.
Intermodal
Domestic - Volume declined as rationalization of low-density lanes in late 2017 more than offset growth with existing customers due to tightening truck capacity.
International - Volume increased driven by new customers and strong performance with existing customers, which more than offset losses from the rationalization of low-density lanes in late 2017.
Other
Other revenue increased $71 million versus prior year primarily due to increases in incidental charges and payments from customers that did not meet volume commitments of $23 million in 2018 compared to $4 million in 2017.
|
| | |
| | CSX Q2 2017Q1 2018 Form 10-Q p.33
|
|
CSX CORPORATION
ITEM 2. MANAGEMENT'S DISCUSSION AND ANALYSIS OF FINANCIAL CONDITION AND RESULTS OF OPERATIONS
Intermodal
Domestic - Volume increased two percent as growth with existing customers and ongoing success of CSX’s highway-to-rail conversion initiative more than offset the continued cycling of a short-haul competitive loss.
International - Volume was up seven percent, driven by strong performance with existing customers and the addition of a new customer, which began ramping-up late in the quarter.
Other
Other revenue increased versus the prior year primarily due to a $58 million settlement in 2017 related to a customer that did not meet historical volume commitments.
Expenses
Expenses of approximately $2$1.8 billion increased $111decreased $268 million, or 613 percent, year over year primarily driven by efficiency and volume savings of $157 million and a restructuring charge of $122$110 million inflation and fuel price increases of $80 million and volume-related increases of $20 million,in 2017, partially offset by efficiency savings of $90 million and a favorable judgment related to a previously condemned property of $55 million.inflation.
Labor and Fringe expense decreased $6$99 million due to the following:
InflationEfficiency and volume savings of $40$97 million waswere driven primarily by increased healthreduced headcount from 2017, the effects of implementing scheduled railroading, lower operating costs and welfare and wage increases.lower volume-related costs.
Incentive compensation was $28decreased $15 million higher reflectingdriven primarily by the reduction of management headcount in 2017 and adjustments to reflect changes in the expected award payouts.
Volume-related costs were $9 million higher.
Efficiency savings of $62 million were primarily driven by reduced management headcount as a result of the 2017 restructuring initiative, as well as lower T&E and operating support costs.payouts on existing plans for each year.
Other costs decreased by $21 million primarilyincreased due to a $15 million decrease in pension expense.inflation, which was driven by increased wages for both management and union employees.
Materials, Supplies and Other expense decreased $29$89 million due to the following:
PTCEfficiency and other technology-related asset impairments resulted in $10 million of additional cost.
Inflation resulted in $9 million of additional cost.
Volume-related costs were $6 million higher.
Efficiencyvolume savings of $21$48 million were primarily related to a reduction in contingent workers, lower maintenance costs from the reduction in the active locomotive fleet, less operating support costs.costs and lower volumes.
A favorable judgment resultedReal estate gains were $32 million in compensation2018 compared to CSX for a previously condemned property, reflecting a $55$2 million gain.in 2017.
Other costs increased $22 milliondecreased due to severala reduction in personal injury expense resulting from a decline in the severity of injuries and other non-significant items, including higher prior year favorable adjustments and current year reclassifications, none of which were individually significant.partially offset by inflation.
Depreciation expense increased slightly primarily due to impacts from changes in the asset base.
Fuel expense increased $26$37 million due to the following:
A 1524 percent price increase drove $28$48 million in additional fuel expense.
Volume-related costs were $5 million higher.
Efficiency savings of $7 million were related tofrom locomotive fuel reduction initiatives and a reductiondecline in volume partially offset the active locomotive fleet.
Depreciation expense increased $8 million primarily due to a larger asset base.
|
| | |
| CSX Q2 2017 Form 10-Q p.34
|
|
CSX CORPORATION
ITEM 2. MANAGEMENT'S DISCUSSION AND ANALYSIS OF FINANCIAL CONDITION AND RESULTS OF OPERATIONS
price increase.
Equipment and Other Rents expense decreased $10 million due to the following:
Inflation resulted in $3 million of additional costincreased slightly due to higher rates on automotive freight cars.
Other costs decreased $13 million primarily due to rental income that was previously classified as other income in the prior years being reclassified to operating expense in the current year.incidental rent, partially offset by efficiency savings.
Restructuring chargeCharge includes costs relateddecreased $110 million due to restructuring activities in first quarter 2017 that did not recur in the management workforce reduction, reimbursement arrangements, the prorationcurrent period.
Equity Earnings of equity awardsAffiliates increased $12 million due to additional earnings from affiliates (primarily TTX and Conrail) and other advisory costs related to the leadership transition.non-significant items.
Interest expense decreased $4increased $12 million primarily due to higher average debt balances partially offset by lower average interest rates, partially offset by higher average debt balances.rates.
Restructuring Charge - Non-Operating decreased $63 million due to restructuring activities in first quarter 2017 that did not recur in the current period.
Other income - net decreasedincreased $24 million primarily due to several non-operating items, none of which were individually significant.
Income tax expense increased $55decreased $3 million primarily due to the reduction of the federal income tax rate mostly offset by increased earnings before income taxes.
Six Months Results The effective tax rate decreased to 23.8% from 37.8% year over year primarily as a result of Operations
Revenue increased $480 million reflecting pricing gains, volume growth, higher fuel recoveries and a $58 million settlementthe significant reduction in 2017 related to a customer that did not meet historical volume commitments.
Expenses were higher by $354 million driven primarily by a restructuring charge of $295 million, inflation of $100 million and fuel price increases of $95 million, partially offset by efficiency savings of $213 million.
Operatingthe federal corporate income increased $126 million primarily tax rate due to pricing gains and volume growth, partially offset by restructuring charges.
Interest expense decreased $10 million primarily due to lower average interest rates partially offset by higher average debt balances.
Other income - net decreased $2 million due to several non-operating items, none of which were individually
significant.
Income tax expensereform effective January 1, 2018. increased $63 million primarily due to increased earnings before income taxes.
|
| | |
| | CSX Q2 2017Q1 2018 Form 10-Q p.35p.34
|
|
CSX CORPORATION
ITEM 2. MANAGEMENT'S DISCUSSION AND ANALYSIS OF FINANCIAL CONDITION AND RESULTS OF OPERATIONS
Non-GAAP Measures - Unaudited
CSX reports its financial results in accordance with accounting principles generally accepted in the United States of America (U.S. GAAP). CSX also uses certain non-GAAP measures that fall within the meaning of Securities and Exchange Commission Regulation G and Regulation S-K Item 10(e), which may provide users of the financial information with additional meaningful comparison to prior reported results. Non-GAAP measures do not have standardized definitions and are not defined by U.S. GAAP. Therefore, CSX’s non-GAAP measures are unlikely to be comparable to similar measures presented by other companies. The presentation of these non-GAAP measures should not be considered in isolation from, as a substitute for, or as superior to the financial information presented in accordance with GAAP. Reconciliations of non-GAAP measures to corresponding GAAP measures are below.
Prior Year Adjusted Operating Results
Management believes that adjusted operating income, adjusted operating ratio, adjusted net earnings and adjusted net earnings per share, assuming dilution are important in evaluating the Company’s operating performance and for planning and forecasting future business operations and future profitability. These non-GAAP measures provide meaningful supplemental information regarding operating results because they exclude certain significant items that are not considered indicative of future financial trends. For
As noted in Note 1. Nature of Operations and Significant Accounting Policies, the Company adopted the provisions of an accounting standard related to the presentation of net pension and other post-retirement benefit costs during the first quarter 2018 and six months ended June 30,applied them retrospectively. The retrospective impact of adoption for the first quarter of 2017 is shown in the following table. As a result of this change, $63 million of the $173 million restructuring charge and $6 million of net pension benefits were reclassified to non-operating income (expense) for first quarter 2017. In addition, the restructuring charge was tax effected using a raterates reflective of 33.4 percent and 35.9 percent, respectively. These rates reflect the applicable tax amounts for each component of the restructuring charge, including an adjustment for the non-deductibility of executive compensation.
|
| | | | | | | | | | | | | | | |
| | | For the Quarter ended June 30, 2017 |
| (in millions, except operating ratio and net earnings per share, assuming dilution) | | Operating Income | | Operating Ratio | | Net Earnings | | Net Earnings Per Share, Assuming Dilution |
| | | | | | | | | |
| GAAP Operating Results | | $ | 958 |
| | 67.4 | % | | $ | 510 |
| | $ | 0.55 |
|
Restructuring Charge (a) | | 122 |
| | (4.2 | )% | | 81 |
| | 0.09 |
|
| Adjusted Operating Results (non-GAAP) | | $ | 1,080 |
| | 63.2 | % | | $ | 591 |
| | $ | 0.64 |
|
| | | | | | | | | |
| | | | | For the Six Months Ended June 30, 2017 | | First Quarter 2017 |
| (in millions, except operating ratio and net earnings per share, assuming dilution) | | Operating Income | | Operating Ratio | | Net Earnings | | Net Earnings Per Share, Assuming Dilution | | Operating Income | | Operating Ratio | | Net Earnings | | Net Earnings Per Share, Assuming Dilution |
| | | | | | | | | | |
| GAAP Operating Results | | $ | 1,670 |
| | 71.2 | % | | $ | 872 |
| | $ | 0.94 |
| |
Restructuring Charge (a) | | 295 |
| | (5.1 | )% | | 189 |
| | 0.21 |
| |
| As Previously Reported - GAAP | | | $ | 712 |
| | 75.2 | % | | $ | 362 |
| | $ | 0.39 |
|
| Reclassification of Net Pension and Other Post-Retirement Benefit (Expense) | | | 57 |
| | (2.0 | )% | | — |
| | — |
|
| As Reclassified - GAAP | | | $ | 769 |
| | 73.2 | % | | $ | 362 |
| | $ | 0.39 |
|
| Restructuring Charge | | | 110 |
| | (3.8 | )% | | 108 |
| | 0.12 |
|
| Adjusted Operating Results (non-GAAP) | | $ | 1,965 |
| | 66.1 | % | | $ | 1,061 |
| | $ | 1.15 |
| | $ | 879 |
| | 69.4 | % | | $ | 470 |
| | $ | 0.51 |
|
(a) See Note. 1 Nature of Operations and Significant Accounting Policies - Other Items - Restructuring Charge, for additional information.
|
| | |
| | CSX Q2 2017Q1 2018 Form 10-Q p.36p.35
|
|
CSX CORPORATION
ITEM 2. MANAGEMENT'S DISCUSSION AND ANALYSIS OF FINANCIAL CONDITION AND RESULTS OF OPERATIONS
Adjusted Free Cash Flow
Management believes that free cash flow is supplemental information useful to investors as it is important in evaluating the Company’s financial performance. More specifically, free cash flow measures cash generated by the business after reinvestment. This measure represents cash available for both equity and bond investors to be used for dividends, share repurchases or principal reduction on outstanding debt. Free cash flow should be considered in addition to, rather than a substitute for, cash provided by operating activities. Free cash flow is calculated by using net cash from operations and adjusting for property additions and certain other investing activities. The following table reconciles cash provided by operating activities (GAAP measure) to adjusted free cash flow after restructuring, before dividends (non-GAAP measure). The restructuring charge impact to free cash flow was tax effected using the Company's applicable tax rate of the charge.rate.
| | | | Six Months | Three Months |
| (Dollars in millions) | 2017 | 2016 | 2018 | 2017 |
| Net cash provided by operating activities | $ | 1,566 |
| $ | 1,592 |
| $ | 966 |
| $ | 1,043 |
|
| Property additions | (955 | ) | (1,066 | ) | (368 | ) | (441 | ) |
| Other investing activities | 41 |
| 35 |
| 44 |
| 25 |
|
| Free Cash Flow (before payment of dividends) | 652 |
| 561 |
| 642 |
| 627 |
|
Add back: Cash paid related to Restructuring (after-tax) (a) | 85 |
| — |
| |
| Add back: Cash Payments for Restructuring Charge (after-tax) | | 9 |
| 7 |
|
| Adjusted Free Cash Flow Before Dividends (non-GAAP) | $ | 737 |
| $ | 561 |
| $ | 651 |
| $ | 634 |
|
(a) During the second quarter 2017, the Company made cash payments of $129 million related to the restructuring charge. The Company also made a $7 million payment to the former CEO and President for previously accrued non-qualified pension benefits that is not included in the restructuring charge.
Operating Statistics (Estimated) |
| | | | | | | | | | | | | |
| Second Quarters | | Six Months |
| | 2017 | 2016 | Improvement/ (Deterioration) | | 2017 | 2016 | Improvement/
(Deterioration) |
| Safety and Service Measurements | | | | | | | |
| FRA Personal Injury Frequency Index | 1.14 |
| 0.96 |
| (19 | )% | | 1.05 |
| 0.94 |
| (12 | )% |
| FRA Train Accident Rate | 2.14 |
| 2.16 |
| 1 | % | | 2.43 |
| 2.65 |
| 8 | % |
| | | | | | | | |
| On-Time Originations | 88 | % | 88 | % | — | % | | 85 | % | 84 | % | 1 | % |
| On-Time Arrivals | 79 | % | 69 | % | 14 | % | | 70 | % | 67 | % | 4 | % |
| | | | | | | | |
| Train Velocity | 21.7 |
| 21.1 |
| 3 | % | | 20.9 |
| 21.1 |
| (1 | )% |
| Dwell | 24.4 |
| 25.0 |
| 2 | % | | 25.2 |
| 25.5 |
| 1 | % |
| | | | | | | | |
| Cars-On-Line | 205,416 |
| 205,945 |
| — | % | | 207,988 |
| 206,651 |
| (1 | )% |
Certain operating statistics are estimated and can continue to be updated as actuals settle.
Key Performance Measures Definitions
FRA Personal Injury Frequency Index - Number of FRA-reportable injuries per 200,000 man-hours.
FRA Train Accident Rate - Number of FRA-reportable train accidents per million train-miles.
On-Time Originations - Percent of scheduled road trains that depart the origin yard on-time or ahead of schedule.
On-Time Arrivals - Percent of scheduled road trains that arrive at the destination yard on-time to two hours late (30 minutes for intermodal trains).
Train Velocity - Average train speed between terminals in miles per hour (does not include locals, yard jobs, work trains or passenger trains).
Dwell - Average amount of time in hours between car arrival at and departure from the yard. It does not include cars moving through the yard on the same train.
Cars-On-Line - An average count of all cars on the network (does not include locomotives, cabooses, trailers, containers or maintenance equipment).
|
| | |
| CSX Q2 2017 Form 10-Q p.37
|
|
CSX CORPORATION
ITEM 2. MANAGEMENT'S DISCUSSION AND ANALYSIS OF FINANCIAL CONDITION AND RESULTS OF OPERATIONS
The Company measures and reports safety and service performance. The Company strives for continuous improvement in these measures through training, innovation and investment. Investment in training and technology also is designed to allow CSXthe Company's employees to have an additional layer of protection that can detect and avoid many types of human factor incidents. The Company's safety programs are designed to prevent incidents that can adversely impact employees, customers and communities. Continued capital investment in the Company's assets, including track, bridges, signals, equipment and detection technology also supports safety performance.
CSX’s FRA reportable personal injury frequency index of 1.14 for the second quarter of 2017 was 19 percent unfavorable, as overall injuries were up slightly and man-hours declined significantly from fewer employees. The FRA train accident frequency rate of 2.14 for the quarter improved one percent versus the prior year. CSX remains committedIn order to ongoing safety improvement, with a focus on avoiding catastrophic events.
CSX’smore accurately represent operating performance, CSXT has improved inrevised the secondway it calculates train velocity and terminal dwell effective third quarter of 2017 compared to 2016. On-time originations were 88 percent,2017. These revisions are consistent with the previous year. On-time arrivals increasedprinciples of scheduled railroading. Updated definitions for each key performance measure are included beneath the Operating Statistics table. Prior periods have been restated to 79 percent, a 14 percent increase year-over-year. Averageconform to the current methodology. These revisions differ from the methodology prescribed by the Surface Transportation Board ("STB") for reporting train velocity experienced a three percent increaseand dwell. CSXT will continue to 21.7 miles per hourreport train velocity and terminal dwell, of 24.4 hours improved slightly when comparedusing the prescribed methodology, to the prior year. These improvements indicate the increasing fluidity of the network asSTB on a result of the ongoing implementation of Precision Scheduled Railroading. The Company expects to improve this level of performance while continuing to drive asset utilization and controlling costs. weekly basis.
|
| | |
| | CSX Q2 2017Q1 2018 Form 10-Q p.38p.36
|
|
CSX CORPORATION
ITEM 2. MANAGEMENT'S DISCUSSION AND ANALYSIS OF FINANCIAL CONDITION AND RESULTS OF OPERATIONS
While the number of personal injuries at CSXT slightly declined in first quarter 2018, a reduction in man hours outpaced that improvement as CSXT continued streamlining operations and reducing overall headcount. This resulted in an FRA reportable personal injury frequency index of 1.11 for the first quarter or a 14 percent unfavorable decline year over year. Train accidents slightly increased in first quarter 2018, while train miles declined considerably as a result of consolidated train profiles and more direct routing. This unfavorably impacted CSXT’s FRA train accident frequency rate, which rose 19 percent year over year to 3.66 in the first quarter. With signs of improvement in the first quarter, CSXT is committed to building on that progress and intensifying its focus on injury and accident prevention.
CSXT’s operating performance continued to improve in first quarter 2018 despite experiencing prolonged winter weather conditions across the network. Operations remained fluid, as train velocity and car dwell improved 22 percent and 10 percent, respectively, in the quarter. CSXT remains focused on executing the operational plan to deliver further service gains, improve transit times and drive asset utilization while controlling costs.
|
| | | | | | |
| First Quarters |
| | 2018 | 2017 | Improvement/ (Deterioration) |
| Operations Performance | | | |
Train Velocity (Miles per hour)(a) | 17.3 |
| 14.2 |
| 22 | % |
Dwell (Hours)(a) | 10.4 |
| 11.5 |
| 10 | % |
| | | | |
| Revenue Ton-Miles (Billions) | | | |
| Merchandise | 31.4 |
| 31.8 |
| (1 | )% |
| Coal | 10.3 |
| 10.6 |
| (3 | )% |
| Intermodal | 7.1 |
| 7.0 |
| 1 | % |
| Total Revenue Ton-Miles | 48.8 |
| 49.4 |
| (1 | )% |
| | | | |
Total Gross Ton-Miles (Billions) | 96.3 |
| 101.6 |
| (5 | )% |
| On-Time Originations | 81 | % | 81 | % | — | % |
On-Time Arrivals | 57 | % | 52 | % | 10 | % |
| | | | |
| Safety | | | |
| FRA Personal Injury Frequency Index | 1.11 |
| 0.97 |
| (14 | )% |
| FRA Train Accident Rate | 3.66 |
| 3.08 |
| (19 | )% |
(a) The methodology for calculating train velocity and dwell differ from that prescribed by the STB. CSXT will continue to report train velocity and dwell, using the prescribed methodology, to the STB on a weekly basis. This information is available on the Company's website.
Certain operating statistics are estimated and can continue to be updated as actuals settle.
Key Performance Measures Definitions
Train Velocity - Average train speed between origin and destination in miles per hour (does not include locals, yard jobs, work trains or passenger trains). Train velocity measures the profiled schedule of trains (from departure to arrival and all interim time), and train profiles are periodically updated to align with a changing operation.
Dwell - Average amount of time in hours between car arrival to and departure from the yard.
Revenue Ton-Miles (RTM's) - The movement of one revenue-producing ton of freight over a distance of one mile.
Gross Ton-Miles (GTM's) - The movement of one ton of train weight over one mile. GTM's are calculated by multiplying total train weight by distance the train moved. Total train weight is comprised of the weight of the freight cars and their contents.
On-Time Originations - Percent of scheduled road trains that depart the origin yard on-time or ahead of schedule.
On-Time Arrivals - Percent of scheduled road trains that arrive at the destination yard on-time.
FRA Personal Injury Frequency Index - Number of FRA-reportable injuries per 200,000 man-hours.
FRA Train Accident Rate - Number of FRA-reportable train accidents per million train-miles.
|
| | |
| CSX Q1 2018 Form 10-Q p.37
|
|
CSX CORPORATION
ITEM 2. MANAGEMENT'S DISCUSSION AND ANALYSIS OF FINANCIAL CONDITION AND RESULTS OF OPERATIONS
LIQUIDITY AND CAPITAL RESOURCES
The following are material changes in the consolidated balance sheets and sources of liquidity and capital, which provide an update to the discussion included in CSX's most recent annual report on Form 10-K.
Material Changes in Consolidated Balance Sheets and Significant Cash Flows
Consolidated Balance Sheets
Total assets increased $447 million$1.7 billion from year end primarily due to an increase in net propertiescash and cash equivalents of $277$1.6 billion as a result of the issuance of $2.0 billion in long-term debt and cash from operations of $966 million, partially offset by share repurchases of $836 million, property additions of $368 million and an increase in cash, including short-term investment activity,dividends paid of $77$194 million. Total liabilities and shareholders' equity combined increased $447 million$1.7 billion from year end primarily due to the issuance of $2.0 billion in long-term debt, partially offset by the net decrease in shareholders equity due to share repurchases of $836 million, dividends paid of $194 million and net earnings of $872 million and an increase in net debt of $537 million, partially offset by share repurchases of $757 million and dividends paid of $350$695 million.
Significant Cash Flows
The following chart highlights the net increase in cash and cash equivalents of $17 million$1.6 billion as compared to a net decreaseincrease of $62$327 million for operating, investing and financing activities for sixthree months ended 20172018 and 2016,2017, respectively.
Cash provided by operating activities decreased $26$77 million primarily driven by payments related to restructuring activities, partially offset byincreased working capital activitiesrequirements for various items including labor-related and other items.tax payments.
Cash used in investing activities increased $486$30 million primarily driven by higherlower net purchasessales of short-term investments.investments partially offset by lower property additions.
Cash used inprovided by financing activities decreased $591 million driven by cash received fromincreased $1.4 billion primarily due to debt issued during the quarter, partially offset by debt repayments.increased share repurchases.
ProjectedUnder the currently approved capital plan, capital investments for 20172018 are expectedprojected to be $2.1$1.6 billion, including approximately $270$200 million for Positive Train Control ("PTC"). Of the 20172018 investment, over halfthe majority will be used to sustain the core infrastructure. The remaining amounts will be allocated to projects supporting profitable growth, productivity initiatives, service enhancements and service improvements.profitable growth. CSX intends to fund capital investments through cash generated from operations.
|
| | |
| CSX Q1 2018 Form 10-Q p.38
|
|
CSX CORPORATION
ITEM 2. MANAGEMENT'S DISCUSSION AND ANALYSIS OF FINANCIAL CONDITION AND RESULTS OF OPERATIONS
The Company has incurredexpects to continue incurring significant capital costs in connection with the implementation of PTC and has substantial work ahead.PTC. CSX estimates that the total multi-year cost of PTC implementation will be approximately $2.4 billion. This estimate includes costs for installing the new system along tracks, upgrading locomotives, adding communication equipment and developing new technologies. Total PTC spending through June 2017March 2018 was $1.9$2.1 billion.
|
| | |
| CSX Q2 2017 Form 10-Q p.39
|
|
CSX CORPORATION
ITEM 2. MANAGEMENT'S DISCUSSION AND ANALYSIS OF FINANCIAL CONDITION AND RESULTS OF OPERATIONS
Liquidity and Working Capital
As of the end of secondfirst quarter 2017,2018, CSX had $1.1$2.0 billion of cash, cash equivalents and short-term investments. CSX has a $1.0 billion unsecured revolving credit facility backed by a diverse syndicate of banks. This facility expires in May 2020 and as of the date of this filing, the Company has no outstanding balances under this facility. CSX uses current cash balances for general corporate purposes, which may include reduction or refinancing of outstanding indebtedness, capital expenditures, working capital requirements, contributions to the Company's qualified pension plan, redemptions and repurchases of CSX common stock and dividends to shareholders. See Note 7, Debt and Credit Agreements.
The Company has a receivables securitization facility with a three-year term scheduled to expire in September 2019. The purpose of this facility is to provide an alternative to commercial paper and a low cost source of short-term liquidity of up to $200 million, depending on eligible receivables balances. As of the date of this filing, the Company has no outstanding balances under this facility.
Working capital can also be considered a measure of a company's ability to meet its short-term needs. CSX had a working capital surplus of $958 million$1.7 billion and $447$21 million as of June 30, 2017March 31, 2018 and December 30, 2016,31, 2017, respectively. The increase since year-end in working capital since year end of $511 million$1.7 billion is primarily the result of the net increase in cash due to repaymentsa debt issuance of the current portion$2.0 billion, cash from operations of long-term debt of $313 million, an increase in accounts receivable of $77$966 million and an increase in net cashproceeds from property sales of $52 million. These increases were partially offset by share repurchases of $836 million, property additions of $368 million and short-term investmentsdividends paid of $77$194 million.
The Company's working capital balance varies due to factors such as the timing of scheduled debt payments and changes in cash and cash equivalent balances as discussed above. The Company continues to maintain adequate liquidity to satisfy current liabilities and maturing obligations when they come due. CSX has sufficient financial capacity, including its revolving credit facility, trade receivable facility and shelf registration statement to manage its day-to-day cash requirements and any anticipated obligations. The Company from time to time accesses the credit markets for additional liquidity. CSX is currently reviewing its cash deployment strategy with respectcommitted to capital structure andongoing shareholder distributions, and is committed tosupported by an investment grade credit profile. Management's assessment of market conditions and other factors guides the timing and volume of repurchases. Future share repurchases are expected to be funded by cash on hand, cash generated from operations and debt issuances. Of the $5 billion total share repurchases authorized, the remaining $4.0 billion is expected to be completed by the end of first quarter 2019.
|
| | |
| | CSX Q2 2017Q1 2018 Form 10-Q p.40p.39
|
|
CSX CORPORATION
ITEM 2. MANAGEMENT'S DISCUSSION AND ANALYSIS OF FINANCIAL CONDITION AND RESULTS OF OPERATIONS
CRITICAL ACCOUNTING ESTIMATES
The preparation of financial statements in conformity with accounting principles generally accepted in the United States requires that management make estimates in reporting the amounts of certain assets and liabilities, the disclosure of contingent assets and liabilities at the date of the financial statements and certain revenues and expenses during the reporting period. Actual results may differ from those estimates. These estimates and assumptions are discussed with the Audit Committee of the Board of Directors on a regular basis. Consistent with the prior year, significant estimates using management judgment are made for the areas below. For further discussion of CSX's critical accounting estimates, see the Company's most recent annual report on Form 10-K.
casualty,personal injury, environmental and legal reserves;
pension and post-retirement medical plan accounting;
depreciation policies for assets under the group-life method; and
income taxes.
FORWARD-LOOKING STATEMENTS
Certain statements in this report and in other materials filed with the SEC,Securities and Exchange Commission, as well as information included in oral statements or other written statements made by the Company, are forward-looking statements. The Company intends for all such forward-looking statements to be covered by the safe harbor provisions for forward-looking statements within the meaning of the Private Securities Litigation Reform Act of 1995 and the provisions of Section 27A of the Securities Act of 1933 and Section 21E of the Securities Exchange Act of 1934. These forward-looking statements within the meaning of the Private Securities Litigation Reform Act may contain, among others, statements regarding:
projections and estimates of earnings, revenues, margins, volumes, rates, cost-savings, expenses, taxes or other financial items;
expectations as to results of operations and operational initiatives;
expectations as to the effect of claims, lawsuits, environmental costs, commitments, contingent liabilities, labor negotiations or agreements on the Company's financial condition, results of operations or liquidity;
management's plans, strategies and objectives for future operations, capital expenditures, workforce levels, dividends, share repurchases, safety and service performance, proposed new services and other matters that are not historical facts, and management's expectations as to future performance and operations and the time by which objectives will be achieved; and
future economic, industry or market conditions or performance and their effect on the Company's financial condition, results of operations or liquidity.
Forward-looking statements are typically identified by words or phrases such as "will," "should," “believe,” “expect,” “anticipate,” “project,” “estimate,” “preliminary” and similar expressions. The Company cautions against placing undue reliance on forward-looking statements, which reflect its good faith beliefs with respect to future events and are based on information currently available to it as of the date the forward-looking statement is made. Forward-looking statements should not be read as a guarantee of future performance or results and will not necessarily be accurate indications of the timing when, or by which, such performance or results will be achieved.
|
| | |
| | CSX Q2 2017Q1 2018 Form 10-Q p.41p.40
|
|
CSX CORPORATION
ITEM 2. MANAGEMENT'S DISCUSSION AND ANALYSIS OF FINANCIAL CONDITION AND RESULTS OF OPERATIONS
Forward-looking statements are subject to a number of risks and uncertainties and actual performance or results could differ materially from those anticipated by any forward-looking statements. The Company undertakes no obligation to update or revise any forward-looking statement. If the Company does update any forward-looking statement, no inference should be drawn that the Company will make additional updates with respect to that statement or any other forward-looking statements. The following important factors, in addition to those discussed in Part II,I, Item 1A (Risk Factors)Risk Factors of CSX's most recent annual report on Form 10-K and elsewhere in this report, may cause actual results to differ materially from those contemplated by any forward-looking statements:
legislative, regulatory or legal developments involving transportation, including rail or intermodal transportation, the environment, hazardous materials, taxation, international trade and initiatives to further regulate the rail industry;
the outcome of litigation, claims and other contingent liabilities, including, but not limited to, those related to fuel surcharge, environmental matters, taxes, shipper and rate claims subject to adjudication, personal injuries and occupational illnesses;
changes in domestic or international economic, political or business conditions, including those affecting the transportation industry (such as the impact of industry competition, conditions, performance and consolidation) and the level of demand for products carried by CSXT;
natural events such as severe weather conditions, including floods, fire, hurricanes and earthquakes, a pandemic crisis affecting the health of the Company's employees, its shippers or the consumers of goods, or other unforeseen disruptions of the Company's operations, systems, property or equipment;
competition from other modes of freight transportation, such as trucking and competition and consolidation or financial distress within the transportation industry generally;
the cost of compliance with laws and regulations that differ from expectations (including those associated with PTC implementation), as well as costs, penalties and operational and liquidity impacts associated with noncompliance with applicable laws or regulations;
the impact of increased passenger activities in capacity-constrained areas, including potential effects of high speed rail initiatives, or regulatory changes affecting when CSXT can transport freight or service routes;
unanticipated conditions in the financial markets that may affect timely access to capital markets and the cost of capital, as well as management's decisions regarding share repurchases;
changes in fuel prices, surcharges for fuel and the availability of fuel;
the impact of natural gas prices on coal-fired electricity generation;
the impact of global supply and price of seaborne coal on CSXT's export coal market;
availability of insurance coverage at commercially reasonable rates or insufficient insurance coverage to cover claims or damages;
the inherent business risks associated with safety and security, including the transportation of hazardous materials or a cybersecurity attack which would threaten the availability and vulnerability of information technology;
|
| | |
| | CSX Q2 2017Q1 2018 Form 10-Q p.42p.41
|
|
CSX CORPORATION
ITEM 2. MANAGEMENT'S DISCUSSION AND ANALYSIS OF FINANCIAL CONDITION AND RESULTS OF OPERATIONS
adverse economic or operational effects from actual or threatened war or terrorist activities and any governmental response;
loss of key personnel or the inability to hire and retain qualified employees;
labor and benefit costs and labor difficulties, including stoppages affecting either the Company's operations or customers' ability to deliver goods to the Company for shipment;
the Company's success in implementing its strategic, financial and operational initiatives, including Precision Scheduled Railroading;initiatives;
the impact of conditions in the real estate market on the Company's ability to sell assets;
changes in operating conditions and costs or commodity concentrations; and
the inherent uncertainty associated with projecting economic and business conditions.
Other important assumptions and factors that could cause actual results to differ materially from those in the forward-looking statements are specified elsewhere in this report and in CSX's other SEC reports, which are accessible on the SEC's website at www.sec.gov and the Company's website at www.csx.com. The information on the CSX website is not part of this quarterly report on Form 10-Q.
ITEM 3. QUANTITATIVE AND QUALITATIVE DISCLOSURES ABOUT MARKET RISK
There have been no material changes in market risk from the information provided under Part II, Item 7A (Quantitative and Qualitative Disclosures about Market Risk) of CSX's most recent annual report on Form 10-K.
ITEM 4. CONTROLS AND PROCEDURES
As of June 30, 2017March 31, 2018, under the supervision and with the participation of CSX's Chief Executive Officer (“CEO”) and Chief Financial Officer (“CFO”), management has evaluated the effectiveness of the design and operation of the Company's disclosure controls and procedures. Based on that evaluation, the CEO and CFO concluded that, as of June 30, 2017March 31, 2018, the Company's disclosure controls and procedures were effective at the reasonable assurance level in timely alerting them to material information required to be included in CSX's periodic SEC reports. There were no changes in the Company's internal controls over financial reporting during the secondfirst quarter of 20172018 that have materially affected or are reasonably likely to materially affect the Company's internal control over financial reporting.
PART II - OTHER INFORMATION
Item 1. Legal Proceedings
For further details, please refer to Note 5. Commitments and Contingencies of this quarterly report on Form 10-Q. Also refer to Part I, Item 3. Legal Proceedings in CSX's most recent annual report on Form 10-K.
Item 1A. Risk Factors
For information regarding factors that could affect the Company's results of operations, financial condition and liquidity, see the risk factors discussed under Part II, Item 7 (Management's Discussion and Analysis of Financial Condition and Results of Operations) of CSX's most recent annual report on Form 10-K. See also Part I, Item 2 (Forward-Looking Statements) of this quarterly report on Form 10-Q.
|
| | |
| | CSX Q2 2017Q1 2018 Form 10-Q p.43p.42
|
|
Item 2. CSX Purchases of Equity Securities
CSX purchases its own shares for two primary reasons: (1) to further its goals under its share repurchase program and (2) to fund the Company’s contribution required to be paid in CSX common stock under a 401(k) plan that covers certain union employees.
TheOn January 19, 2018, the Company continuesentered into an accelerated share repurchase agreement to repurchase shares of the Company’s common stock. Under this agreement, the Company made a prepayment of $150 million to a financial institution and received an initial delivery of shares valued at $120 million. The remaining balance of $30 million was settled through receipt of additional shares on February 22, 2018 with the final net number of shares calculated based on the volume-weighted average price of the Company's common stock over the term of the agreement, less a discount. Total shares repurchased under its $1 billion program announced on April 20, 2017. the agreement were approximately 2.7 million shares, at an average purchase price of $55.02 per share.
On July 18, 2017,February 12, 2018, the Company announced that an additional $500 million ofincrease to the $1.5 billion share repurchase authority had been approved by the Board of Directors,program first announced in October 2017, bringing the total authorized to $5 billion. This program sizeis expected to $1.5 billion.be completed by the end of first quarter 2019. During the secondfirst quarters of 20172018 and 2016,2017, the Company repurchased approximately $499$836 million, or 915 million shares, and $266$258 million, or 106 million shares, respectively.
Management's assessment of market conditions and other factors guides the timing and volume of repurchases. Future share repurchases are expected to be funded by cash on hand, cash generated from operations and debt issuances. Shares are retired immediately upon repurchase. In accordance with the Equity Topic in the ASC, the excess of repurchase price over par value is recorded in retained earnings. Generally, retained earnings is only impacted by net earnings and dividends.
Share repurchase activity for the secondfirst quarter 20172018 was as follows:
|
| | | | | | | | | | |
| | CSX Purchases of Equity Securities for the Quarter | |
Second Quarter (a) | Total Number of Shares Purchased | Average Price Paid per Share | Total Number of Shares Purchased as Part of Publicly Announced Plans or Programs (b) | Approximate Dollar Value of Shares that May Yet Be Purchased Under the Plans or Programs |
| Beginning Balance | | | | $ | 12,474,350 |
|
| April | 264,605 |
| $ | 47.15 |
| 264,605 |
| 1,000,000,000 |
|
| May | 3,954,680 |
| 51.38 |
| 3,932,600 |
| 797,933,762 |
|
| June | 5,342,810 |
| 53.39 |
| 5,342,800 |
| 512,661,389 |
|
| Ending Balance | 9,562,095 |
| $ | 52.39 |
| 9,540,005 |
| $ | 512,661,389 |
|
|
| | | | | | | | | | |
| | CSX Purchases of Equity Securities for the Quarter | |
| First Quarter | Total Number of Shares Purchased | Average Price Paid per Share | Total Number of Shares Purchased as Part of Publicly Announced Plans or Programs (a) | Approximate Dollar Value of Shares that May Yet Be Purchased Under the Plans or Programs |
| Beginning Balance | | | | $ | 1,299,953,624 |
|
| January 1 - January 31, 2018 | 3,017,177 |
| $ | 57.51 |
| 2,913,747 |
| 1,132,347,581 |
|
| February 1 - February 28, 2018 | 3,878,499 |
| 53.97 |
| 3,878,499 |
| 923,025,248 |
|
| March 1 - March 31, 2018 | 8,173,489 |
| 56.11 |
| 8,173,489 |
| 3,964,406,369 |
|
| Ending Balance | 15,069,165 |
| $ | 55.84 |
| 14,965,735 |
| $ | 3,964,406,369 |
|
(a) Second quarter 2017 consisted of the following fiscal periods: April (April 1, 2017 - April 28, 2017), May (April 29, 2017 - May 26, 2017), June (May 27, 2017 - June 30,2017).
(b) The difference of 22,090103,430 shares between the "Total Number of Shares Purchased" and the "Total Number of Shares Purchased as Part of Publicly Announced Plans or Programs" for the quarter represents shares purchased to fund the Company's contribution to a 401(k) plan that covers certain union employees.
Item 3. Defaults Upon Senior Securities
None
Item 4. Mine Safety Disclosures
Not Applicable
Item 5. Other Information
None
|
| | |
| | CSX Q2 2017Q1 2018 Form 10-Q p.44p.43
|
|
Item 6. Exhibits
|
| | |
| Exhibit designation | Nature of exhibit | Previously filed as exhibit to |
3.01 | Amended and Restated Bylaws of CSX Corporation, effective as of July 7, 2017 | July 11, 2017
Exhibit 3.1, Form 8-K
|
| Material Contracts: |
| 10.01 |
2018-2020 Long-Term Incentive Plan
| April 3, 2017February 12, 2018
Exhibit 10.1, Form 8-K |
| 10.02 | | February 12, 2018 Exhibit 10.2, Form 8-K |
| 10.03 |
Angela C. Williams
| June 16, 2017April 5, 2018
Exhibit 10.1, Form 8-K8-K/A |
| | | |
| Officer certifications: |
| 31* | | |
| 32* | | |
| | |
| Interactive data files: |
| 101* | The following financial information from CSX Corporation's Quarterly Report on Form 10-Q for the quarter ended June 30, 2017March 31, 2018 filed with the SEC on July 19, 2017,April 18, 2018, formatted in XBRL includes: (i) consolidated income statements for the fiscal periods ended June 30,March 31, 2018 and March 31, 2017, and June 24, 2016, (ii) consolidated comprehensive income statements for the fiscal periods ended June 30,March 31, 2018 and March 31, 2017 and June 24, 2016 (iii) consolidated balance sheets at June 30, 2017March 31, 2018 and December 30, 2016,31, 2017, (iv) consolidated cash flow statements for the fiscal periods ended June 30,March 31, 2018 and March 31, 2017, and June 24, 2016, and (v) the notes to consolidated financial statements.
| |
| | | |
| * Filed herewith | | |
|
| | |
| | CSX Q2 2017Q1 2018 Form 10-Q p.45p.44
|
|
SIGNATURE
Pursuant to the requirements of the Securities Exchange Act of 1934, the registrant has duly caused this report to be signed on its behalf by the undersigned thereunto duly authorized.
CSX CORPORATION
(Registrant)
By: /s/ Andrew L. GlassmanANGELA C. WILLIAMS
Andrew L. GlassmanAngela C. Williams
Vice President and Controller
(Principal Accounting Officer)
Dated: July 19, 2017April 18, 2018
��
|
| | |
| | CSX Q2 2017Q1 2018 Form 10-Q p.46p.45
|
|