0000310522 us-gaap:LongTermDebtMemberAvailableforsaleSecuritiesMember us-gaap:VariableInterestEntityPrimaryBeneficiaryMember 2017-12-31MortgageBackedSecuritiesOtherMember 2018-07-01 2018-09-30
UNITED STATES SECURITIES AND EXCHANGE COMMISSION
Washington, D.C. 20549
Form 10-Q
| |
þ | QUARTERLY REPORT PURSUANT TO SECTION 13 OR 15(d) OF THE SECURITIES EXCHANGE ACT OF 1934 |
☑QUARTERLY REPORT PURSUANT TO SECTION 13 OR 15(d) OF THE SECURITIES EXCHANGE ACT OF 1934
For the quarterly period ended September 30, 20182019
OR
| |
o | TRANSITION REPORT PURSUANT TO SECTION 13 OR 15(d) OF THE SECURITIES EXCHANGE ACT OF 1934 |
☐TRANSITION REPORT PURSUANT TO SECTION 13 OR 15(d) OF THE SECURITIES EXCHANGE ACT OF 1934
For the transition period from to
Commission File No.: file number: 0-50231
Federal National Mortgage Association
(Exact name of registrant as specified in its charter)
Fannie Mae
|
| | | | | | | | | |
| Federally chartered corporation | 52-0883107 | 1100 15th Street, NW Washington, DC 20005
| 3900 Wisconsin Avenue, NW
Washington, DC 20016
| (800) 2FANNIE
(800-232-6643)
800 | | 232-6643 |
| | | Washington, | DC | 20005 | | | | |
(State or other jurisdiction of incorporation or organization) | (I.R.S. Employer Identification No.) | | (Address of principal executive offices, including zip code) | (Former address, if changed since last report) | (Registrant’s telephone number, including area code) |
Securities registered pursuant to Section 12(b) of the Act:
|
| | |
| Title of each class | Trading Symbol(s) | Name of each exchange on which registered |
| None | N/A | N/A |
Indicate by check mark whether the registrant (1) has filed all reports required to be filed by Section 13 or 15(d) of the Securities Exchange Act of 1934 during the preceding 12 months (or for such shorter period that the registrant was required to file such reports), and (2) has been subject to such filing requirements for the past 90 days. Yes þYes☑ No o☐
Indicate by check mark whether the registrant has submitted electronically every Interactive Data File required to be submitted pursuant to Rule 405 of Regulation S-T (§ 232.405 of this chapter) during the preceding 12 months (or for such shorter period that the registrant was required to submit such files). Yes þYes☑ No o☐
Indicate by check mark whether the registrant is a large accelerated filer, an accelerated filer, a non-accelerated filer, a smaller reporting company, or an emerging growth company. See the definitions of “large accelerated filer,” “accelerated filer,” “smaller reporting company,” and “emerging growth company” in Rule 12b-2 of the Exchange Act.
|
| | | | |
Large accelerated filerþ | ☑ | | Accelerated filero | ☐ |
Non-accelerated filero | ☐ | | Smaller reporting companyo | ☐ |
| | | Emerging growth companyo | ☐ |
If an emerging growth company, indicate by check mark if the registrant has elected not to use the extended transition period for complying with any new or revised financial accounting standards provided pursuant to Section 13(a) of the Exchange Act. o☐
Indicate by check mark whether the registrant is a shell company (as defined in Rule 12b-2 of the Exchange Act). Yes o☐ No þ☑
As of September 30, 2018,2019, there were 1,158,087,567 shares of common stock of the registrant outstanding.
TABLE OF CONTENTS
|
| | |
| TABLE OF CONTENTS |
| | | Page |
| PART I—Financial Information | |
| Item 1. | | |
| | | |
| | | |
| | | |
| | | |
| | |
| | | |
| | | |
| | | |
| | | |
| | | |
| | | |
| | | |
| | | |
| | | |
| | | |
| | | |
| | | |
| | |
| Item 2. | | |
| | | |
| | | |
| | | |
| Uniform Mortgage-Backed Securities | |
| | | |
| | | |
| | | |
| Retained Mortgage Portfolio | |
| | | |
| | |
| | | |
| | |
| | |
| | | |
| | | |
| | | |
| | | |
| | | |
| | | |
| Item 3. | | |
| Item 4. | | |
| PART II—Other Information | |
| Item 1. | | |
| Item 1A. | | |
| Item 2. | | |
| Item 3. | | |
| Item 4. | | |
| Item 5. | | |
| Item 6. | | |
|
| | |
Fannie Mae Third Quarter 20182019 Form 10-Q | i |
PART I—FINANCIAL INFORMATION
Item 2. Management’s Discussion and Analysis of Financial Condition and Results of Operations
|
| | |
| | | |
| | We have been under conservatorship, with the Federal Housing Finance Agency (“FHFA”) acting as conservator, since September 6, 2008. As conservator, FHFA succeeded to all rights, titles, powers and privileges of the company, and of any shareholder, officer or director of the company with respect to the company and its assets. The conservator has since provided for the exercise of certain functionsauthorities by our Board of Directors. Our directors do not have any fiduciary duties to any person or entity except to the conservator and, accordingly, are not obligated to consider the interests of the company, the holders of our equity or debt securities, or the holders of Fannie Mae MBS unless specifically directed to do so by the conservator.
| |
| | Our conservatorship has no specified termination date. We do not know when or how the conservatorship will terminate, what further changes to our business will be made during or following conservatorship, what form we will have and what ownership interest, if any, our current common and preferred stockholders will hold in us after the conservatorship is terminated or whether we will continue to exist following conservatorship. Congress continuesand the Administration continue to consider options for reform of the housing finance system, including Fannie Mae. As a result of our agreements with the U.S. Department of the Treasury (“Treasury”) and directives from our conservator, weWe are not permitted to retain more than $3.0$25 billion in capital reserves or to pay dividends or other distributions to stockholders other than Treasury.the U.S. Department of the Treasury (“Treasury”). Our agreements with Treasury also include covenants that significantly restrict our business activities. For additional information on the conservatorship, the uncertainty of our future, our agreements with Treasury, and recent actions and statementsdevelopments relating to housing finance reform, by the Administration, Congress and FHFA, see “Business—Conservatorship, and Treasury Agreements” and Housing Finance Reform” and “Business—LegislationCharter Act and Regulation” and “Risk Factors” in our Form 10-K for the year ended December 31, 20172018 (“20172018 Form 10-K”) and, “Legislation and Regulation” in this report, and “Risk Factors” in both this report and our Form 10-Q for the quarter ended March 31, 2018 (“First Quarter 2018 Form 10-Q”), our Form 10-Q for the quarter ended June 30, 2018 (“Second Quarter 2018 Form 10-Q”), and in this report.10-K. | |
| | | |
You should read this Management’s Discussion and Analysis of Financial Condition and Results of Operations (“MD&A”) in conjunction with our unaudited condensed consolidated financial statements and related notes in this report and the more detailed information in our 20172018 Form 10-K. You can find a “Glossary of Terms Used in This Report” in the MD&A of our 20172018 Form 10-K.
ThisForward-looking statements in this report contains forward-looking statements that are based on management’s current expectations and are subject to significant uncertainties and changes in circumstances. Please reviewcircumstances, as we describe in “Forward-Looking Statements” for more information on theseforward-looking statements.Our actualStatements.” Future events and our future results may differ materially from those reflected in our forward-looking statements due to a variety of factors, including but not limited to, those discussed in “Risk Factors” and elsewhere in this report and in our 20172018 Form 10-K.
Introduction
Fannie Mae providesMae’s mission is to provide a stable source of liquidity to the mortgage marketsupport housing for low- and increases the availability and affordability of housing in the United States.moderate-income Americans. We operate in the secondary mortgage market, primarily working with lenders.lenders, who originate loans to borrowers. We do not originate loans or lend money directly to consumersborrowers in the primary mortgage market. Instead, we securitize mortgage loans originated by lenders into Fannie Mae mortgage-backed securities that we guarantee (which we refer to as Fannie Mae MBS or our MBS); purchase mortgage loans and mortgage-related securities, primarily for securitization and sale at a later date; manage mortgage credit risk; and engage in other activities that increasesupport access to credit and the supply of affordable housing. Our common stock is traded in the OTCQBover-the-counter market and quoted on the OTCQB, operated by OTC Markets Group, Inc., under the ticker symbol “FNMA.”
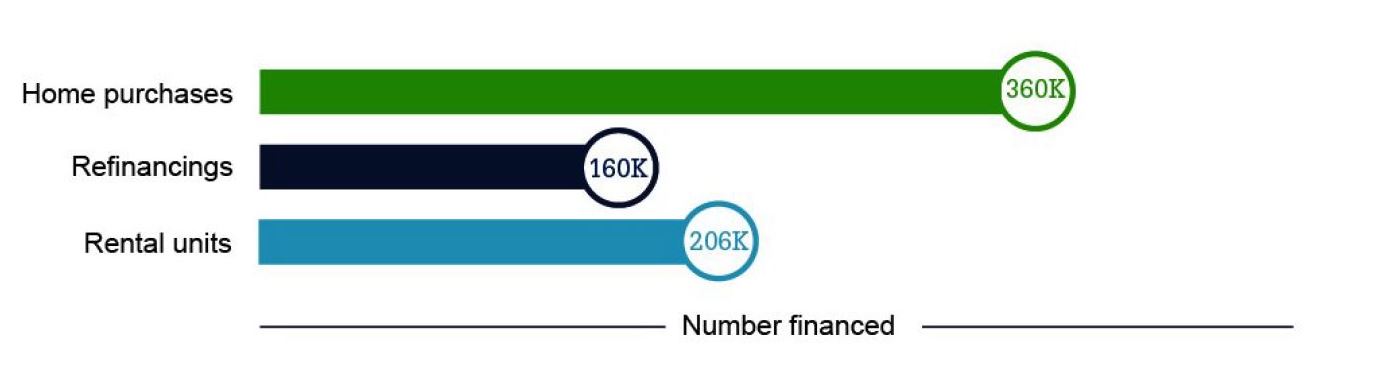
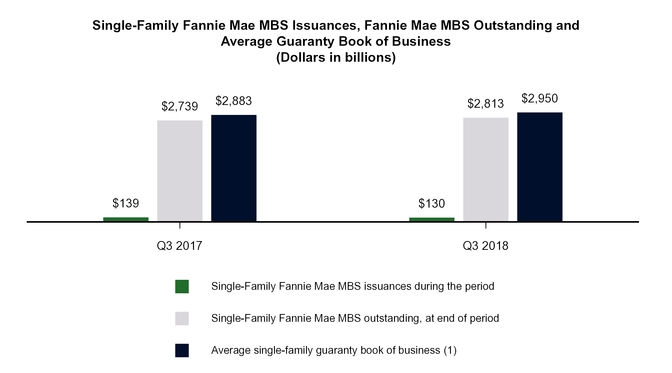
Through our single-family and multifamily business segments, we provided $140$460 billion in liquidity to the mortgage market in the third quarterfirst nine months of 2018,2019, which enabled the financing of 726,000approximately 2.1 million home purchases, refinancings or rental units.
Fannie Mae Provided $460 Billion in Liquidity in the First Nine Months of 2019
|
| | | | | |
| Unpaid Principal Balance | | Units |
| | | | | |
| $240.1B | | 942K
Single-Family Home Purchases |
|
|
| | | | | |
| $167.3B | | 649K
Single-Family Refinancings |
|
|
| | | | | |
| $52.1B | | 548K
Multifamily Rental Units |
|
|
|
| | |
Fannie Mae Third Quarter 20182019 Form 10-Q | 1 |
Fannie Mae Provided $140 Billion in Liquidity in the Third Quarter of 2018
Summary of Our Financial Performance
|
|
|
Quarterly Results |
|
|
The increase in our net income in the third quarter of 2018, compared with the third quarter of 2017, was primarily driven by:
•
a shift to a benefit for credit losses from a provision for credit losses;
•
a shift to fair value gains from fair value losses; and•
a lower provision for federal income taxes;
•
partially offset by a decrease in fee and other income.
See “Consolidated Results of Operations” for more information on our quarterly financial results.
|
|
|
| | |
Fannie Mae Third Quarter 2018 Form 10-Q | 2 |
|
|
Year-to-Date Results |
|
|
The increase in our net income in the first nine months of 2018, compared with the first nine months of 2017, was primarily driven by:
•
a shift to fair value gains from fair value losses;
•
a lower provision for federal income taxes; and
•
a higher benefit for credit losses;
•
partially offset by a decrease in fee and other income.
See “Consolidated Results of Operations” for more information on our year-to-date financial results.
|
|
Net Worth
Our net worth of $7.0 billion as of September 30, 2018 reflects our comprehensive income of $4.0 billion for the third quarter of 2018 and $3.0 billion in retained capital reserves.
Financial Performance Outlook
We expect to remain profitable on an annual basis for the foreseeable future; however, certain factors could result in significant volatility in our financial results from quarter to quarter or year to year. We expect volatility from quarter to quarter in our financial results due to a number of factors, particularly changes in market conditions that result in fluctuations in the estimated fair value of the financial instruments that we mark to market through our earnings. Other factors that may result in volatility in our quarterly financial results include developments that affect our loss reserves, such as changes in interest rates, home prices or accounting standards, or events such as natural disasters.
The potential for significant volatility in our financial results could result in a net loss in a future quarter. We are permitted to retain up to $3.0 billion in capital reserves as a buffer in the event of a net loss in a future quarter. However, any net loss we experience in the future could be greater than the amount of our capital reserves, resulting in a net worth deficit for that quarter. See “Risk Factors” in our 2017 Form 10-K for a discussion of the risks associated with the limitations on our ability to rebuild our capital reserves, including factors that could result in a net loss or net worth deficit in a future quarter.
|
| | |
Fannie Mae Third Quarter 2018 Form 10-Q | 3 |
Executive Summary
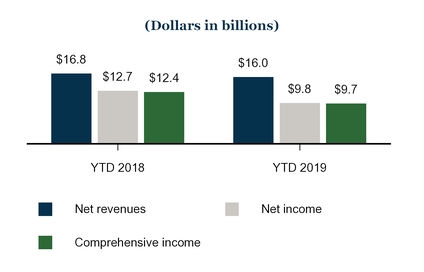
Summary of Our Financial Performance
|
|
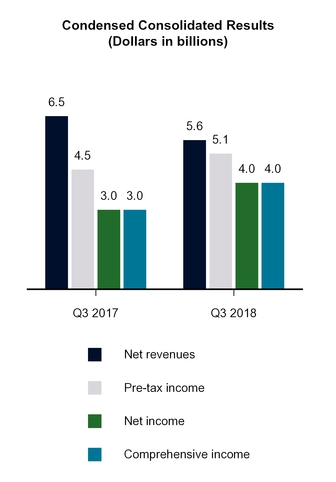
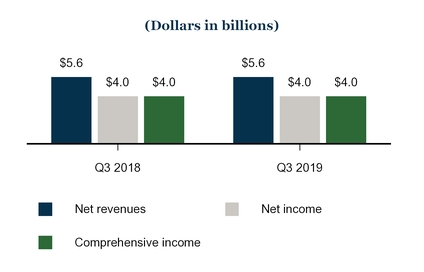
Quarterly Condensed Consolidated Results
|
|
|
|
|
Our net income in the third quarter of 2019 remained flat compared with the third quarter of 2018 primarily due to: • an increase in our credit-related income;• offset by a shift from fair value gains to fair value losses.See “Consolidated Results of Operations” for more information on our financial results.
|
|
|
|
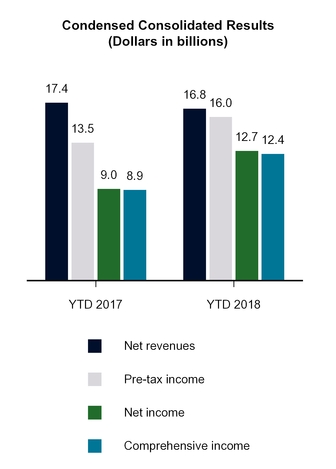
Year-to-Date Condensed Consolidated Results
|
|
|
|
|
The decrease in our net income in the first nine months of 2019, compared with the first nine months of 2018, was primarily driven by: • a shift from fair value gains to fair value losses; and• a decrease in net interest income;• partially offset by an increase in our credit-related income.See “Consolidated Results of Operations” for more information on our financial results.
|
|
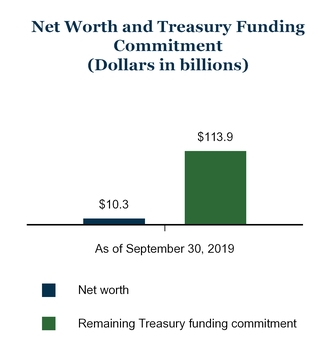
Net worth. Our net worth was $10.3 billion as of September 30, 2019. This amount reflects:
our net worth of $6.4 billion as of June 30, 2019, of which we previously expected to pay Treasury Draws$3.4 billion as a third-quarter 2019 dividend; and Dividend Payments
our comprehensive income of $4.0 billion for the third quarter of 2019.
As we describe in “Legislation and Regulation—Letter Agreement with Treasury,” the dividend provisions of our senior preferred stock were modified on September 27, 2019. As a result, no dividends were payable on the senior preferred stock for the third quarter of 2019, as our net worth of $6.4 billion as of June 30, 2019 was lower than the $25 billion capital reserve amount. Additionally, no dividends will be payable on the senior preferred stock for the fourth quarter of 2019, as our net worth of $10.3 billion as of September 30, 2019 was lower than $25 billion.
|
| | |
| Fannie Mae Third Quarter 2019 Form 10-Q | 2 |
Net Worth, Treasury Funding and Senior Preferred Stock Dividends
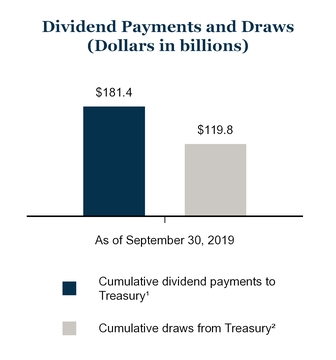
Treasury has made a commitment under a senior preferred stock purchase agreement to provide funding to us under certain circumstances if we have a net worth deficit. Pursuant to the senior preferred stock purchase agreement, we issued shares of senior preferred stock to Treasury in 2008. Acting as successor to the rights, titles, powers and privileges of the Board, the conservator has declared and directed us to payWe have paid dividends to Treasury on the senior preferred stock on a quarterly basis for every dividend period for which dividends were payable since we entered into conservatorship in 2008.
Under the modified dividend provisions of the senior preferred stock described in “Legislation and Regulation—Letter Agreement with Treasury,” effective with the third quarter 2019 dividend period, we are not required to pay further dividends to Treasury until we have accumulated over $25 billion in net worth. Accordingly, no dividends were payable to Treasury for the third quarter of 2019, and none will be payable for the fourth quarter of 2019. Changes in our net worth can be significantly impacted by market conditions that affect our net interest income, fluctuations in the estimated fair value of our derivatives and other financial instruments that we mark to market through our earnings, developments that affect our loss reserves such as changes in interest rates, home prices or accounting standards, or events such as natural disasters, and other factors, as we discuss in “Risk Factors” and “Consolidated Results of Operations” in our 2018 Form 10-K and in this report.
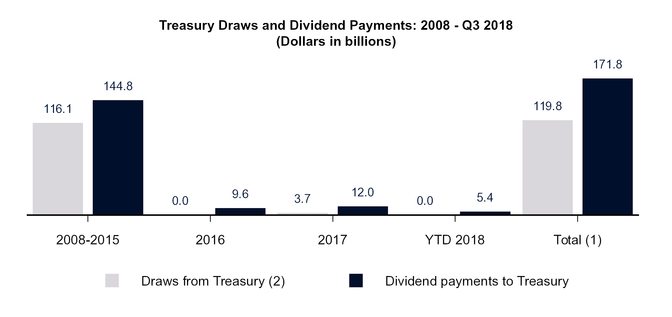
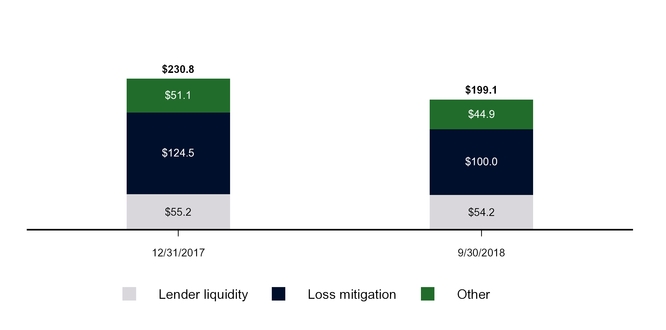
The chartcharts below showsshow information about our net worth, the remaining amount of Treasury’s funding commitment to us, senior preferred stock dividends we have paid Treasury and funds we have drawn from Treasury pursuant to the senior preferred stock purchase agreement, as well as the dividend payments we have made to Treasury on the senior preferred stock, since entering into conservatorship.its funding commitment.
__________
| |
(1) | Aggregate amount of dividends we have paid to Treasury on the senior preferred stock from 2008 through September 30, 2019. Under the terms of the senior preferred stock purchase agreement, dividend payments we make to Treasury do not offset our prior draws of funds from Treasury, and we are not permitted to pay down draws we have made under the agreement except in limited circumstances. Amounts may not sum due to rounding.Treasury. |
| |
(2) | Aggregate amount of funds we have drawn from Treasury draws are shown inpursuant to the period for which requested, not when the funds were received by us. Draw requests have been funded in the quarter following a net worth deficit.senior preferred stock purchase agreement from 2008 through September 30, 2019. |
We expect to pay Treasury a fourth quarter 2018 dividend of $4.0 billion by December 31, 2018. The current dividendUnder the modified liquidation preference provisions of the senior preferred stock provide for quarterly dividends consistingdescribed in “Legislation and Regulation—Letter Agreement with Treasury,” the aggregate liquidation preference of the amount, if any, by which our net worthsenior preferred stock increased from $123.8 billion as of the end of the immediately preceding fiscal quarter exceeds a $3.0 billion capital reserve amount. We referJune 30, 2019 to this as a “net worth sweep” dividend. As noted above, our net worth was $7.0$127.2 billion as of September 30, 2018.
If we experience a2019 due to the $3.4 billion increase in our net worth deficit in a futureduring the second quarter we will be required to draw additional funds from Treasury underof 2019. The aggregate liquidation preference of the senior preferred stock purchase agreementwill further increase to avoid being placed into receivership. As$131.2 billion as of December 31, 2019 due to the date$4.0 billion increase in our net worth during the third quarter of this filing, the maximum amount of remaining funding under the agreement is $113.9 billion. If we were to draw additional funds from Treasury under the agreement with respect to a future period, the amount of remaining funding under the agreement would be reduced by the amount of our draw. Dividend payments we make to Treasury do not restore or increase the amount of funding available to us under the agreement. 2019.
For a description of the terms of the senior preferred stock purchase agreement and the senior preferred stock, see “Business—Conservatorship, Treasury Agreements and Treasury Agreements—Treasury Agreements”Housing Finance Reform” in our 20172018 Form 10-K.10-K and “Legislation and Regulation—Letter Agreement with Treasury” in this report.
Although Treasury owns our senior preferred stock and a warrant to purchase 79.9% of our common stock and has made a commitment under athe senior preferred stock purchase agreement to provide us with funds to maintain a positive net worth under specified conditions, the U.S. government does not guarantee our securities or other obligations.
|
| | |
Fannie Mae Third Quarter 20182019 Form 10-Q | 43 |
|
| | |
| | MD&A | Legislation and Regulation |
Legislation and Regulation
|
| | | | |
Legislation and Regulation |
The information in this section updates and supplements information regarding legislationlegislative and regulationregulatory developments affecting our business set forth in “Business—LegislationConservatorship, Treasury Agreements and Housing Finance Reform” and “Business—Charter Act and Regulation” in our 20172018 Form 10-K, andas well as in “MD&A—Legislation and Regulation” in our Form 10-Q for the quarter ended March 31, 2019 (“First Quarter 20182019 Form 10-Q”) and our Form 10-Q and for the quarter ended June 30, 2019 (“Second Quarter 20182019 Form 10-Q.10-Q”). Also see “Risk Factors” in this report and in our 20172018 Form 10-K for discussions of risks relating to legislative and regulatory matters.
Housing Finance Reform
We expectIn March 2019, President Trump issued a memorandum directing the Secretary of the Treasury to develop a plan for administrative and legislative reforms relating to Fannie Mae and Freddie Mac (collectively referred to as the “government-sponsored enterprises” or the “GSEs”), as described in our First Quarter 2019 Form 10-Q.
On September 5, 2019, Treasury released its plan to reform the housing finance system. The Treasury Housing Reform Plan (the “Treasury plan”) is far-reaching in scope and could have a significant impact on our structure, our role in the secondary mortgage market, our capitalization, our business and our competitive environment. The Treasury plan includes 49 recommended reforms—31 proposed administrative reforms and 18 proposed legislative reforms—to define a limited role for the federal government in the housing finance system, enhance taxpayer protections against future bailouts, and promote competition in the housing finance system. The Treasury plan includes recommendations relating to ending our conservatorship, amending our senior preferred stock purchase agreement with Treasury, considering additional restrictions and requirements on our business, and many other matters. While the Treasury plan states that it is Treasury’s preference and recommendation that Congress the Administration and FHFA to continue consideringenact comprehensive housing finance reform legislation, the plan also states that “reform should not and need not wait on Congress. . . . Pending legislation, Treasury will continue to support FHFA’s administrative actions to enhance regulation of the GSEs, promote private sector competition, and satisfy the preconditions set forth in this plan for ending the GSEs’ conservatorships.”
The Treasury plan contemplates FHFA ending the conservatorships of each of Fannie Mae and Freddie Mac when the GSE has met specified preconditions, which the plan recommends should include, at a minimum, that:
FHFA has prescribed regulatory capital requirements for both GSEs;
FHFA has approved the GSE’s capital restoration plan, and the GSE has retained or raised sufficient capital and other loss-absorbing capacity to operate in a safe and sound manner;
the senior preferred stock purchase agreement between Treasury and the GSE has been amended to:
| |
| ◦ | require the GSE to fully compensate the federal government in the form of an ongoing payment for the ongoing support provided to the GSE under the senior preferred stock purchase agreement; |
| |
| ◦ | focus the GSE’s activities on its core statutory mission and otherwise tailor government support to the underlying rationale for that support; |
| |
| ◦ | further limit the size of the GSE’s retained mortgage portfolio; |
| |
| ◦ | subject the GSE to heightened prudential requirements and safety and soundness standards, including increased capital requirements, designed to prevent a future taxpayer bailout and minimize risks to financial stability; and |
| |
| ◦ | ensure that the risk posed by the GSE’s activities is calibrated to the amount of the remaining commitment under the senior preferred stock purchase agreement; |
appropriate provision has been made to ensure there is no disruption to the market for the GSE’s MBS, including its previously-issued MBS;
FHFA, after consulting with the Financial Stability Oversight Council, has determined that the heightened prudential requirements incorporated into the amended senior preferred stock purchase agreements are, together with the requirements and restrictions imposed by FHFA in its capacity as regulator, appropriate to minimize risks to financial stability; and
any other conditions that FHFA, in its discretion, determines are necessary to ensure that the GSE would operate in a safe and sound manner after the conservatorship, including as to the GSE’s compliance with FHFA’s directives or other requirements and also as to the build out of FHFA’s supervisory function.
|
| | |
| Fannie Mae Third Quarter 2019 Form 10-Q | 4 |
|
| | |
| MD&A | Legislation and Regulation |
The Treasury plan also contemplates Treasury and FHFA adjusting Fannie Mae’s and Freddie Mac’s senior preferred stock purchase agreements with Treasury to allow each company to retain and raise capital. The Treasury plan does not specify how Fannie Mae or Freddie Mac would recapitalize but states that potential approaches to recapitalization could include one or more of the following, among other options:
eliminating all or a portion of the liquidation preference of Treasury’s senior preferred stock or exchanging all or a portion of that interest for common stock or other interests in the GSE;
adjusting the net worth sweep dividend on the senior preferred stock to allow the GSE to retain earnings in excess of the $3 billion capital reserve in effect when the Treasury plan was released, with appropriate compensation to Treasury for any deferred or forgone dividends;
issuing shares of common or preferred stock, and perhaps also convertible debt or other loss-absorbing instruments, through private or public offerings, perhaps in connection with the exercise of Treasury’s warrants for 79.9% of the GSE’s common stock;
negotiating exchange offers for one or more classes of the GSE’s existing junior preferred stock; and
placing the GSE in receivership to facilitate a restructuring of the capital structure.
The Treasury plan recommends that Treasury’s commitment to provide funding under the senior preferred stock purchase agreement should be replaced with legislation that authorizes an explicit, paid-for guarantee backed by the full faith and credit of the Federal Government that is limited to the timely payment of principal and interest on qualifying MBS. The Treasury plan further recommends that, pending legislation, even after conservatorship Treasury should maintain its ongoing commitment to support each GSE’s single-family and multifamily mortgage-backed securities through the senior preferred stock purchase agreements, as amended as contemplated by the plan.
The Treasury plan contains recommendations for legislative and administrative reforms to limit our single-family activities and restrict our multifamily footprint. For example, the plan recommends that FHFA assess whether each of our current single-family products, services and other activities, including our support for cash-out refinancings, investor loans, and higher principal balance loans, should continue to benefit from support under our senior preferred stock purchase agreement. It also recommends that FHFA and Treasury consider amendments to the senior preferred stock purchase agreement to further limit the type and volume of multifamily loans we guarantee. The Treasury plan also contains a number of other recommendations that could resultsignificantly affect our business and competitive environment if implemented. For example, the Treasury plan recommends that: FHFA conduct assessments of our single-family and multifamily underwriting criteria; FHFA and the U.S. Department of Housing and Urban Development (“HUD”) coordinate to identify and mitigate areas of duplication in significant changes in our structuregovernment support for affordable housing; and role in the future. AsConsumer Financial Protection Bureau (the “CFPB”) amend its ability-to-repay rule to establish a result, therebright-line safe harbor that replaces the “qualified mortgage” patch for GSE-eligible loans.
There continues to be significant uncertainty regarding the timing, content and impact of future legislative and regulatory actions affecting us, including the enactment of our company.housing finance reform legislation and the implementation of all or any portion of the Treasury plan. See “Risk Factors” in this report and in our 20172018 Form 10-K for a discussiondescription of the risks toassociated with our business relatinguncertain future and potential housing finance reform.
Letter Agreement with Treasury
On September 27, 2019, we, through FHFA acting on our behalf in its capacity as our conservator, and Treasury entered into a letter agreement modifying the dividend and liquidation preference provisions of the senior preferred stock held by Treasury. These modifications and other specified provisions of the letter agreement are described below.
| |
| • | Modification to Dividend Provisions—Increase in Applicable Capital Reserve Amount. The terms of the senior preferred stock provide for dividends each quarter in the amount, if any, by which our net worth as of the end of the immediately preceding fiscal quarter exceeds the applicable capital reserve amount. The letter agreement modified the dividend provisions of the senior preferred stock to increase the applicable capital reserve amount from $3 billion to $25 billion, effective for dividend periods beginning July 1, 2019. |
As a result of this change to the senior preferred stock dividend provisions:
| |
| ◦ | No dividends were payable on the senior preferred stock for the third quarter of 2019, as our net worth of $6.4 billion as of June 30, 2019 was lower than the $25 billion capital reserve amount. |
| |
| ◦ | No dividends will be payable on the senior preferred stock for the fourth quarter of 2019, as our net worth of $10.3 billion as of September 30, 2019 is lower than the $25 billion capital reserve amount. |
| |
| • | Modification to Liquidation Preference Provisions—Increase in Liquidation Preference. The letter agreement provides that, on September 30, 2019, and at the end of each fiscal quarter thereafter, the liquidation preference of the senior preferred stock will increase by an amount equal to the increase in our net worth, if any, during the immediately prior fiscal quarter, until such time as the liquidation preference has increased by $22 billion. |
|
| | |
| Fannie Mae Third Quarter 2019 Form 10-Q | 5 |
|
| | |
| MD&A | Legislation and Regulation |
As a result of this change to the senior preferred stock liquidation preference provisions:
| |
| ◦ | The aggregate liquidation preference of the senior preferred stock increased from $123.8 billion as of June 30, 2019 to $127.2 billion as of September 30, 2019, due to the $3.4 billion increase in our net worth during the second quarter of 2019. |
| |
| ◦ | The aggregate liquidation preference of the senior preferred stock will increase from $127.2 billion as of September 30, 2019 to $131.2 billion as of December 31, 2019, due to the $4.0 billion increase in our net worth during the third quarter of 2019. |
| |
| • | New Certificate of Designation. Pursuant to the letter agreement, Fannie Mae replaced the Certificate of Designation for the senior preferred stock to reflect the revised dividend provisions, effective September 30, 2019. The new Certificate of Designation is filed as Exhibit 4.1 to this report. |
| |
| • | Agreement to Amend Senior Preferred Stock Purchase Agreement to Enhance Taxpayer Protections. The letter agreement provides that we and Treasury agree to negotiate and execute an additional amendment to the senior preferred stock purchase agreement that further enhances taxpayer protections by adopting covenants broadly consistent with recommendations for administrative reform contained in the Treasury plan. |
As described in “Housing Finance Reform,” the Treasury plan recommends that the GSEs have a capital restoration plan that provides for sufficient capital and other loss-absorbing capacity to operate in a safe and sound manner. In announcing the letter agreement, Treasury noted that subsequent amendments to the senior preferred stock purchase agreement may be appropriate to facilitate the implementation of any eventual recapitalization plan.
We describe the terms of the senior preferred stock and the related senior preferred stock purchase agreement with Treasury, prior to the modifications described above, in our 2018 Form 10-K under the heading “Business—Conservatorship, Treasury Agreements and Housing Finance Reform—Treasury Agreements.”
New FHFA Strategic Plan for Conservatorships and 2020 Scorecard
On October 28, 2019, FHFA released its 2019 Strategic Plan for the Conservatorships of Fannie Mae and Freddie Mac (the “2019 strategic plan”), along with its 2020 Scorecard for Fannie Mae, Freddie Mac, and Common Securitization Solutions (the “2020 scorecard”), which is a set of corporate performance objectives that define our key priorities for 2020 and align with the 2019 strategic plan. According to the plan, “[FHFA’s] end-state vision is for the [GSEs] to return to operating as fully-private companies within a competitive, liquid, efficient, and resilient housing finance system, while a strengthened and independent FHFA ensures they have the capital reserves, risk management capabilities, corporate governance, and regulatory oversight that are appropriate for their size, risk, and systemic importance outside of conservatorship.” FHFA indicated that implementing the 2019 strategic plan and 2020 scorecard, combined with the framework for reform put forward in the Treasury plan, will “reduce the role of government in the mortgage market, protect taxpayers, support sustainable homeownership and affordable rental housing, and foster a mortgage finance market that is stable and liquid through the cycle.”
The new strategic plan, which replaces FHFA’s 2014 strategic plan, and the 2020 scorecard identify three broad objectives to ensure that Fannie Mae and Freddie Mac:
| |
| 1. | Focus on their core mission responsibilities to foster competitive, liquid, efficient, and resilient (“CLEAR”) national housing finance markets that support sustainable homeownership and affordable rental housing; |
| |
| 2. | Operate in a safe and sound manner appropriate for entities in conservatorship; and |
| |
| 3. | Prepare for their eventual exits from conservatorship. |
See “Risk Factors” in this report and in our 2018 Form 10-K for a description of the risks associated with our uncertain future and potential housing finance reform. For information on the objectives in the 2020 scorecard, see our Current Report on Form 8-K filed with the Securities and Exchange Commission (‘‘SEC’’) on October 29, 2019.
Revised Multifamily Business Volume Cap
On September 13, 2019, FHFA announced revisions to the structure of our company.the loan acquisition volume caps applicable to Fannie Mae’s and Freddie Mac’s multifamily loan purchases. Previously, FHFA’s 2019 conservatorship scorecard included an objective to maintain the dollar volume of new multifamily business for each company at or below $35 billion for the year, excluding certain targeted affordable and underserved market business segments such as loans financing energy or water efficiency improvements. The new multifamily loan purchase caps, which replaced the prior caps effective October 1, 2019, are $100 billion for all new multifamily business, with no exclusions, for each of Fannie Mae and Freddie Mac for the five-quarter period beginning in the fourth quarter of 2019 through the fourth quarter of 2020. In addition, FHFA directed that at least 37.5% of each company’s multifamily business during that period must be mission-driven, affordable housing, pursuant to FHFA’s guidelines for mission-driven loans.
2017
|
| | |
| Fannie Mae Third Quarter 2019 Form 10-Q | 6 |
|
| | |
| MD&A | Legislation and Regulation |
2018 Housing Goals Performance
We are subject to housing goals, which establish specified requirements for our mortgage acquisitions relating to affordability or location. In October 2018,September 2019, FHFA notified us that it had preliminarily determined that we met all of our single-family and multifamily housing goals for 2017.2018. See “Business—LegislationCharter Act and Regulation—GSE Act and Other Regulation of Our Business—Regulation—Housing Goals” in our 20172018 Form 10-K and “MD&A—Legislation and Regulation—2018 Housing Goals”Goals Performance” in our First Quarter 20182019 Form 10-Q for more information regarding our housing goals.
ProposedFinal Rule on MBS Prepayment RatesCredit Score Models
The Economic Growth, Regulatory Relief, and Consumer Protection Act of 2018 (the “Economic Growth Act”) provides that, if we condition the purchase of a mortgage loan on a borrower's credit score, that credit score must be produced by a model that has been validated and approved by us based on the standards and criteria in the Economic Growth Act and FHFA regulations.On September 12, 2018,August 16, 2019, FHFA issuedpublished a proposedfinal rule to require Fannie Maeon the validation and approval of credit score models, which became effective in October 2019. The final rule establishes standards and criteria, and outlines a four-phase process by which we and Freddie Mac to align their programs, policiesshould validate and practices that affect the prepayment rates of “To-Be-Announced” (“TBA”)-eligible MBS.approve third-party credit score models. The rule would apply to both Fannie Mae’scredit score models will be evaluated for factors such as accuracy, reliability and Freddie Mac’s current offerings of TBA-eligible MBS and to the new Uniform Mortgage-Backed Security (“UMBS”) scheduled to be implemented in June 2019. The objective of the Single Security Initiativeintegrity, as well as impacts on fair lending and the mortgage industry. Once our evaluation is complete, we must submit the proposed rule isthird-party credit score models to enhance the overall liquidity of Fannie Mae and Freddie Mac TBA-eligible MBS by supporting their fungibility without regard to which company is the issuer. The proposed rule notes that “[t]he industry has expressed concerns that Fannie Mae and Freddie Mac UMBS may not be truly fungible because differences in Fannie Mae and Freddie Mac policies could result in materially differing cash flows (as a result of, e.g., differing prepayment speeds).” FHFA as conservator, has previously responded to industry input by imposing alignment mandates on Fannie Mae and Freddie Mac, and publishing a Prepayment Monitoring Report. The proposed rule would codify FHFA’s previous mandates, and is intended to ensure that Fannie Mae and Freddie Mac programs, policies and practices that individually have a material effect on cash flows (including policies that affect prepayment speeds) are aligned and will continue to be aligned. See “Risk Factors” for a discussion of the risks to our business associated with the new UMBS and the Single Security Initiative.
Amended FHFA Corporate Governance Regulation: New Strategic Business Plan Requirement
On October 19, 2018, FHFA published in the Federal Register afinal decision. The final rule amending its corporate governance regulation applicable to Fannie Mae, Freddie Macdoes not address the time frame for industry adoption and the Federal Home Loan Banks. The amended regulation requires our Board of Directors to adopt and have in effect at all times a strategic business plan that describes our strategy for achieving our mission and public purposes. Among other things, this plan must articulate measurable goals and objectives for each significant activity, describe any significant changes to business strategy or approach we are planning to undertake, and identify current and emerging risks associated with our significant activities. The amended regulation requires our Board of Directors to review the strategic business plan at least annually, to re-adopt the plan at least every three years, and to establish management reporting requirements and monitor the implementation of the plan. The final rule will become effective on December 18, 2018. Our Board of Directors has previously adopted a strategic business plan and we are currently assessing whether any changes to this plan may be required as a result of FHFA’s amended regulation.new credit score models.
|
| | |
Fannie Mae Third Quarter 20182019 Form 10-Q | 57 |
|
| | |
| MD&A | Uniform Mortgage-Backed Securities |
Uniform Mortgage-Backed Securities
Overview
On June 3, 2019, we and Freddie Mac began issuing single-family uniform mortgage-backed securities, or “UMBSTM.” We also began using the common securitization platform operated by Common Securitization Solutions, LLC (“CSS”), a limited liability company we own jointly with Freddie Mac, to perform certain aspects of the securitization process for our single-family Fannie Mae MBS issuances beginning in May 2019. This represented the final implementation of the Single Security Initiative that we, Freddie Mac and FHFA began working on in 2014 to develop a single common mortgage-backed security issued by both Fannie Mae and Freddie Mac to finance fixed-rate mortgage loans backed by single-family properties. The issuance of UMBS and use of the common securitization platform represent significant changes for the mortgage market and for our securitization operations and business.
UMBS and Structured Securities
Each of Fannie Mae and Freddie Mac issues and guarantees UMBS and structured securities backed by UMBS and other securities, as described below.
| |
| • | UMBS. Each of Fannie Mae and Freddie Mac issues and guarantees UMBS that are directly backed by the mortgage loans it has acquired, referred to as “first-level securities.” UMBS issued by Fannie Mae are backed only by mortgage loans that Fannie Mae has acquired, and similarly UMBS issued by Freddie Mac are backed only by mortgage loans that Freddie Mac has acquired. There is no commingling of Fannie Mae- and Freddie Mac-acquired loans within UMBS. |
Mortgage loans backing UMBS are limited to fixed-rate mortgage loans eligible for financing through the to-be-announced (“TBA”) market. We continue to issue some types of Fannie Mae MBS that are not TBA-eligible and therefore are not issued as UMBS, such as single-family Fannie Mae MBS backed by adjustable-rate mortgages and all multifamily Fannie Mae MBS.
| |
| • | Structured Securities. Each of Fannie Mae and Freddie Mac also issues and guarantees structured mortgage-backed securities, referred to as “second-level securities,” that are resecuritizations of UMBS or previously-issued structured securities. In contrast to UMBS, second-level securities can be commingled—that is, they can include both Fannie Mae securities and Freddie Mac securities as the underlying collateral for the security. These structured securities include SupersTM, which are single-class resecuritizations, and real estate mortgage investment conduit securities (“REMICs”), which are multi-class resecuritizations. While Supers are backed only by TBA-eligible securities, REMICs can be backed by TBA-eligible or non-TBA-eligible securities. |
The key features of UMBS are the same as those of legacy single-family Fannie Mae MBS. Accordingly, all single-family Fannie Mae MBS that are directly backed by fixed-rate loans and generally eligible for trading in the TBA market are UMBS, whether issued before or after the June 3, 2019 Single Security Initiative implementation date. In this report, we use the term “Fannie Mae-issued UMBS” to refer to single-family Fannie Mae MBS that are directly backed by fixed-rate mortgage loans and generally eligible for trading in the TBA market. We use the term “Fannie Mae MBS” or “our MBS” to refer to any type of mortgage-backed security that we issue, including UMBS, Supers, REMICs and other types of single-family or multifamily mortgage-backed securities. References to our single-family guaranty book of business in this report exclude Freddie Mac-acquired mortgage loans underlying Freddie Mac mortgage-related securities that we have resecuritized.
When we issue a structured security backed in whole or part by Freddie Mac securities, we provide a new and separate guaranty of principal and interest on the newly-formed structured security. If Freddie Mac were to fail to make a payment due on its securities underlying a Fannie Mae-issued structured security, we would be obligated under our guaranty to fund any shortfall.
See “Risk Factors” in this report and in our 2018 Form 10-K, “MD&A—Single Security Initiative & Common Securitization Platform” in our Second Quarter 2019 Form 10-Q, and “Risk Management—Institutional Counterparty Credit Risk Management—Counterparty Credit Risk Exposure arising from the Resecuritization of Freddie Mac-issued securities” in this report for a discussion of the risks to our business associated with the Single Security Initiative, the resecuritization of Freddie Mac-issued securities, and the common securitization platform.
|
| | |
| Fannie Mae Third Quarter 2019 Form 10-Q | 8 |
|
| | |
| | MD&A | Key Market Economic Indicators |
Key Market Economic Indicators
|
| | | | |
Key Market Economic Indicators |
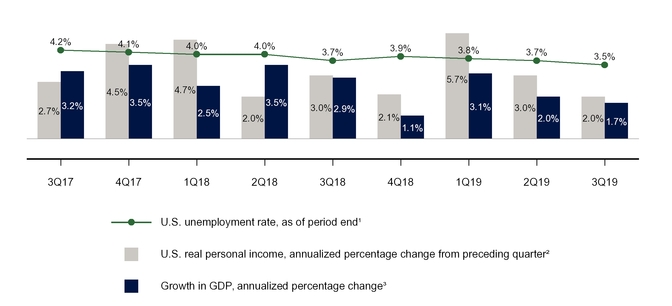
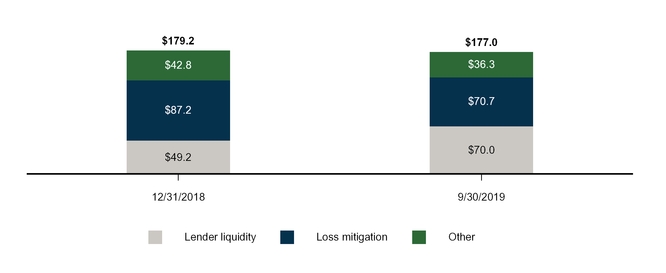
The tablegraphs below displaysdisplay certain macroeconomic indicators that can significantly influence our business and financial results. We expect home prices on a national basis to continue to grow in 2018 at a similar rate as in 2017. We also expect significant regional variation in the timing and rate of home price growth.
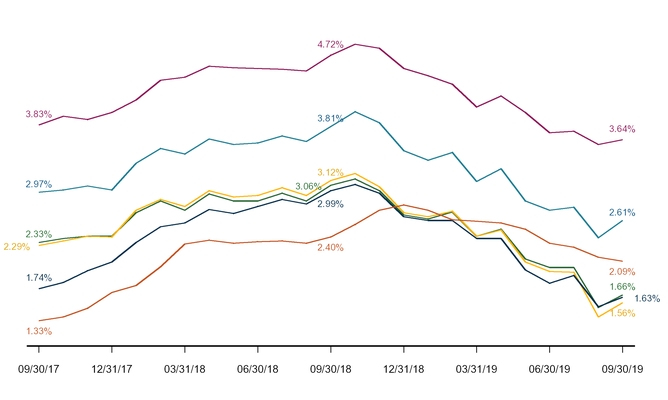
Selected Benchmark Interest Rates
|
| | | | | | | | | | | | |
| Selected Key Market Economic Indicators | | | | |
| | For the Three Months | | For the Nine Months |
| | Ended September 30, | Ended September 30, |
| | 2018 | | 2017 | | 2018 | | 2017 | |
Home price change based on Fannie Mae national home price index(1) | 1.2 | % | | 1.2 | % | | 5.7 | % | | 5.4 | % | |
Growth in U.S. gross domestic product ("GDP"), annualized percentage change(2) | 3.5 | % | | 2.8 | % | |
|
| | |
———3-month LIBOR(1) | ———2-year swap rate(1) | ———10-year swap rate(1) |
———10-year Treasury rate(1) | ———30-year Fannie Mae MBS par coupon rate(1) | ———30-year FRM rate(2)
|
| |
(1) | According to Bloomberg. |
| |
(2) | Refers to the U.S. weekly average fixed-rate mortgage rate according to Freddie Mac's Primary Mortgage Market Survey®. These rates are reported using the latest available data for a given period. |
How Interest Rates Can Affect Our Financial Results
| |
| • | Net interest income. In a rising interest rate environment, our mortgage loans tend to prepay more slowly, which typically results in lower net amortization income from cost basis adjustments on mortgage loans and related debt. Conversely, in a declining interest rate environment, our mortgage loans tend to prepay faster, typically resulting in higher net amortization income from cost basis adjustments on mortgage loans and related debt. |
| |
| • | Fair value gains (losses). We have exposure to fair value gains and losses resulting from changes in interest rates, primarily through our risk management derivatives and mortgage commitment derivatives, which we mark to market. Generally, we experience fair value losses when swap rates decrease and fair value gains when swap rates increase; however, because the composition of our derivative position varies across the yield curve, different yield curve changes (for example, parallel, steepening or flattening) will generate different gains and losses. |
| |
| • | Credit-related income (expense). Increases in mortgage interest rates tend to lengthen the expected lives of our modified loans, which generally increases the impairment and provision for credit losses on such loans. Decreases in mortgage interest rates tend to shorten the expected lives of our modified loans, which reduces the impairment and provision for credit losses on such loans. |
|
| | |
| Fannie Mae Third Quarter 2019 Form 10-Q | 9 |
|
| | |
| MD&A | Key Market Economic Indicators |
|
| | | | | | | | |
| | As of |
| | September 30, 2018 | | December 31, 2017 | | September 30, 2017 |
U.S. unemployment rate(3) | 3.7 | % | | 4.1 | % | | 4.2 | % |
2-year swap rate(4) | 2.99 |
| | 2.08 |
| | 1.74 |
|
10-year swap rate(4) | 3.12 |
| | 2.40 |
| | 2.29 |
|
10-year Treasury rate(4) | 3.06 |
| | 2.41 |
| | 2.33 |
|
30-year Fannie Mae MBS par coupon rate(4) | 3.81 |
| | 3.00 |
| | 2.97 |
|
_______ |
|
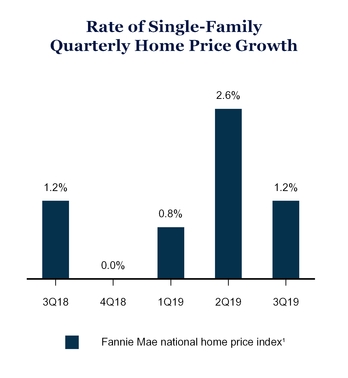
| Home prices and how they can affect our financial results |
• We expect home price appreciation on a national basis to moderate in the remainder of this year and 2020, as compared with 2018. We also expect significant regional variation in the timing and rate of home price growth. For further discussion on housing activity, see “Single-Family Business—Single-Family Mortgage Market” and “Multifamily Business—Multifamily Mortgage Market.”• Actual and forecasted home prices impact our provision or benefit for credit losses.• Changes in home prices affect the amount of equity that borrowers have in their homes. Borrowers with less equity typically have higher delinquency and default rates.• As home prices increase, the severity of losses we incur on defaulted loans that we hold or guarantee decreases because the amount we can recover from the properties securing the loans increases. Decreases in home prices increase the losses we incur on defaulted loans.
|
| |
(1) | Calculated internally using property data information on loans purchased by Fannie Mae, or Freddie Mac, and property data information obtained from other third-party data providers.home sales data. Fannie Mae’s home price index is a weighted repeat transactions index, measuring average price changes in repeat transactionssales on the same properties. Fannie Mae’s home price index excludes prices on properties sold in foreclosure. Fannie Mae’s home price estimates are based on preliminary data and are subject to change as additional data becomesbecome available. |
|
|
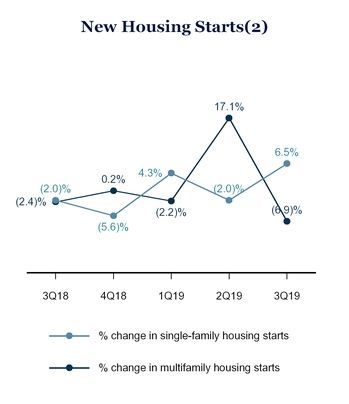
| How housing activity can affect our financial results |
• Homebuilding has typically been a leading indicator of broader economic indicators, such as the U.S. Gross Domestic Product, or GDP, and the unemployment rate. Residential construction activity tends to soften prior to a weakness in the economy and can improve prior to a recovery in economic activity. Broader economic indicators can affect several mortgage market factors including the demand for both single-family and multifamily housing and the level of loan delinquencies.• Fewer housing starts results in fewer properties being available for purchase, which can lower the volume of originations in the mortgage market.• Construction activity can also affect credit losses. When the pace of construction does not meet demand, the resulting growth in home prices can increase the risk profile of newly acquired home purchase loans and increase the risk of default if home prices subsequently decline. Reduced construction may also coincide with a broader deterioration in housing conditions, which may result in higher levels of delinquencies and greater losses on defaulted loans. |
| |
(2) | According to the U.S. Census Bureau of Economic Analysis and subject to revision. |
|
| | |
| Fannie Mae Third Quarter 2019 Form 10-Q | 10 |
|
| | |
| MD&A | Key Market Economic Indicators |
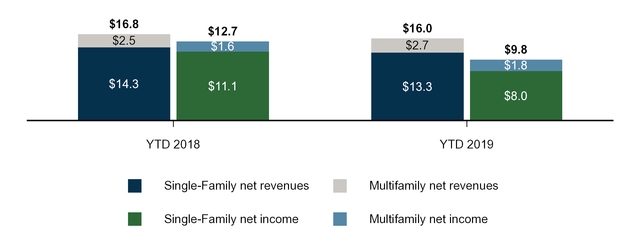
GDP, Unemployment Rate and Personal Income
| |
(3)(1)
| According to the U.S. Bureau of Labor Statistics and subject to revision. |
| |
(4)(2)
| According to Bloomberg.the U.S. Bureau of Economic Analysis, calculated by the Federal Reserve Bank of St. Louis and subject to revision. |
| |
(3) | GDP growth for periods prior to the third quarter of 2019 is based on the quarterly series calculated by the Bureau of Economic Analysis and is subject to revision. GDP growth for the third quarter of 2019 is based on Fannie Mae’s forecast. |
See “Key Market Economic Indicators” in our 2017 Form 10-K for a description of how changes inHow GDP, the unemployment rates, home pricesrate and interest ratespersonal income can affect our financial results.results
Decreases in the unemployment rate typically result in lower levels of delinquencies, which often correlate to a decrease in credit losses.
Slower growth or outright declines in personal income heightens the risk of delinquency by reducing homeowners’ ability to pay their mortgages. Slower income growth could also negatively impact affordability, constraining home sales and mortgage originations.
See “Risk Factors” in our 2018 Form 10-K and this report for further discussion of risks to our business and financial results associated with interest rates, home prices, housing activity and economic conditions.
|
| | |
Fannie Mae Third Quarter 20182019 Form 10-Q | 611 |
|
| | |
| | MD&A | Consolidated Results of Operations |
Consolidated Results of Operations
|
| | | | |
Consolidated Results of Operations |
This section provides a discussion of our condensed consolidated results of operations and should be read together with our condensed consolidated financial statements, including the accompanying notes.
Our long-term financial performance will depend on many factors, including:
the size of and our share of the U.S. mortgage market, which in turn will depend upon such factors as population growth, household formation and home price appreciation;
borrower performance and interest rate movements; and
actions by FHFA, the Administration and Congress relating to our business and housing finance reform, including the capital requirements that will be applicable to us, our ongoing financial obligations to Treasury and our competitive environment.
Quarterly fluctuations in acquisition volumes, market share, guaranty fees, or acquisition credit characteristics in any one period have limited impact on the size and stability of our conventional guaranty book of business and the associated revenue, profitability, and credit quality.
| | Summary of Condensed Consolidated Results of Operations | | | For the Three Months | | For the Nine Months | | For the Three Months Ended September 30, | | | | For the Nine Months Ended September 30, | | |
| | Ended September 30, | | Ended September 30, | | | | |
| | 2018 | | 2017 | | Variance | | 2018 | | 2017 | | Variance | | 2019 | | 2018 | | Variance | | 2019 | | 2018 | | Variance |
| | (Dollars in millions) | | (Dollars in millions) |
| Net interest income | $ | 5,369 |
| | $ | 5,274 |
| | $ | 95 |
| | $ | 15,978 |
| | $ | 15,622 |
| | $ | 356 |
| | $ | 5,229 |
| | $ | 5,369 |
| | $ | (140 | ) | | $ | 15,112 |
| | $ | 15,978 |
| | $ | (866 | ) |
| Fee and other income | 271 |
| | 1,194 |
| | (923 | ) | | 830 |
| | 1,796 |
| | (966 | ) | | 402 |
| | 271 |
| | 131 |
| | 875 |
| | 830 |
| | 45 |
|
| Net revenues | 5,640 |
| | 6,468 |
| | (828 | ) | | 16,808 |
| | 17,418 |
| | (610 | ) | | 5,631 |
| | 5,640 |
| | (9 | ) | | 15,987 |
| | 16,808 |
| | (821 | ) |
| Investment gains, net | 166 |
| | 313 |
| | (147 | ) | | 693 |
| | 689 |
| | 4 |
| | 253 |
| | 166 |
| | 87 |
| | 847 |
| | 693 |
| | 154 |
|
| Fair value gains (losses), net | 386 |
| | (289 | ) | | 675 |
| | 1,660 |
| | (1,020 | ) | | 2,680 |
| | (713 | ) | | 386 |
| | (1,099 | ) | | (2,298 | ) | | 1,660 |
| | (3,958 | ) |
| Administrative expenses | (740 | ) | | (664 | ) | | (76 | ) | | (2,245 | ) | | (2,034 | ) | | (211 | ) | | (749 | ) | | (740 | ) | | (9 | ) | | (2,237 | ) | | (2,245 | ) | | 8 |
|
| Credit-related income (expense): | | | | | | | | | | | | |
| Benefit (provision) for credit losses | 716 |
| | (182 | ) | | 898 |
| | 2,229 |
| | 1,481 |
| | 748 |
| |
| Credit-related income: | | | | | | | | | | | | | |
| Benefit for credit losses | | | 1,857 |
| | 716 |
| | 1,141 |
| | 3,732 |
| | 2,229 |
| | 1,503 |
|
| Foreclosed property expense | (159 | ) | | (140 | ) | | (19 | ) | | (460 | ) | | (391 | ) | | (69 | ) | | (96 | ) | | (159 | ) | | 63 |
| | (364 | ) | | (460 | ) | | 96 |
|
| Total credit-related income (expense) | 557 |
| | (322 | ) | | 879 |
| | 1,769 |
| | 1,090 |
| | 679 |
| |
| Total credit-related income | | | 1,761 |
| | 557 |
| | 1,204 |
| | 3,368 |
| | 1,769 |
| | 1,599 |
|
| Temporary Payroll Tax Cut Continuation Act of 2011 (“TCCA”) fees | (576 | ) | | (531 | ) | | (45 | ) | | (1,698 | ) | | (1,552 | ) | | (146 | ) | | (613 | ) | | (576 | ) | | (37 | ) | | (1,806 | ) | | (1,698 | ) | | (108 | ) |
| Other expenses, net | (377 | ) | | (427 | ) | | 50 |
| | (946 | ) | | (1,100 | ) | | 154 |
| | (571 | ) | | (377 | ) | | (194 | ) | | (1,514 | ) | | (946 | ) | | (568 | ) |
| Income before federal income taxes | 5,056 |
| | 4,548 |
| | 508 |
| | 16,041 |
| | 13,491 |
| | 2,550 |
| | 4,999 |
| | 5,056 |
| | (57 | ) | | 12,347 |
| | 16,041 |
| | (3,694 | ) |
| Provision for federal income taxes | (1,045 | ) | | (1,525 | ) | | 480 |
| | (3,312 | ) | | (4,495 | ) | | 1,183 |
| | (1,036 | ) | | (1,045 | ) | | 9 |
| | (2,552 | ) | | (3,312 | ) | | 760 |
|
| Net income | $ | 4,011 |
| | $ | 3,023 |
| | $ | 988 |
| | $ | 12,729 |
| | $ | 8,996 |
| | $ | 3,733 |
| | $ | 3,963 |
| | $ | 4,011 |
| | $ | (48 | ) | | $ | 9,795 |
| | $ | 12,729 |
| | $ | (2,934 | ) |
| Total comprehensive income | $ | 3,975 |
| | $ | 3,048 |
| | $ | 927 |
| | $ | 12,372 |
| | $ | 8,944 |
| | $ | 3,428 |
| | $ | 3,977 |
| | $ | 3,975 |
| | $ | 2 |
| | $ | 9,703 |
| | $ | 12,372 |
| | $ | (2,669 | ) |
Net Interest Income
We have two primary sources of net interest income:
guaranty fees we receive for managing the credit risk on loans underlying Fannie Mae MBS held by third parties; and
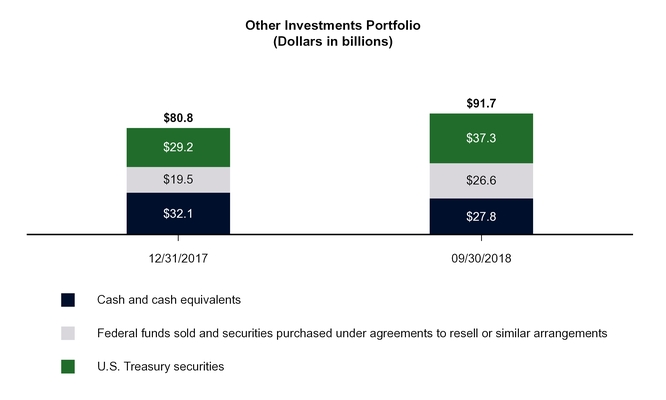
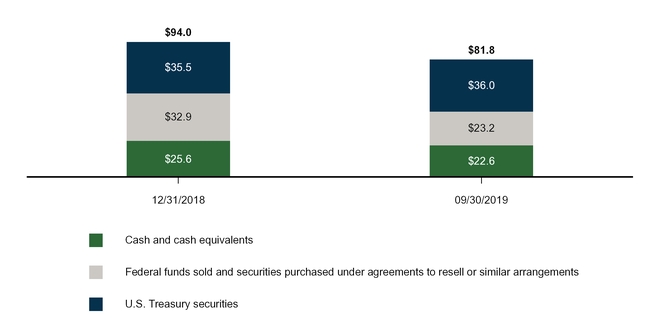
the difference between interest income earned on the assets in our retained mortgage portfolio and our other investments portfolio (collectively, our “portfolios”) and the interest expense associated with the debt that funds those assets. See “Retained Mortgage Portfolio” and “Liquidity and Capital Management—Liquidity Management—Other Investments Portfolio” for more information about our portfolios.
Guaranty fees consist of two primary components:
base guaranty fees that we receive over the life of the loan; and
upfront fees that we receive at the time of loan acquisition primarily related to single-family loan levelloan-level pricing adjustments and other fees we receive from lenders, which are amortized into net interest income as cost basis adjustments over the contractual life of the loan. We refer to this as amortization income.
|
| | |
Fannie Mae Third Quarter 20182019 Form 10-Q | 712 |
|
| | |
| | MD&A | Consolidated Results of Operations |
the primary component of the difference between the interest income on loans in consolidated trusts and the interest expense on the debt of consolidated trusts.
The table below displays the components of our net interest income from our portfolios and our guaranty book of business.business, which we discuss in “Guaranty Book of Business,” and from our portfolios.
|
| | | | | | | | | | | | | | | | | | | | | | | | |
| Components of Net Interest Income |
| | For the Three Months Ended September 30, | | For the Nine Months Ended September 30, | |
| | 2018 | | 2017 | | Variance | | 2018 | | 2017 | | Variance | |
| | (Dollars in millions) |
Net interest income from portfolios(1) | $ | 1,132 |
| | $ | 1,109 |
| | $ | 23 |
| | $ | 3,425 |
| | $ | 3,318 |
| | $ | 107 |
| |
| Net interest income from guaranty book of business: | | | | | | | | | | | | |
| Base guaranty fee income, net of TCCA | 2,153 |
| | 2,050 |
| | 103 |
| | 6,352 |
| | 6,060 |
| | 292 |
| |
Base guaranty fee income related to TCCA(2) | 576 |
| | 531 |
| | 45 |
| | 1,698 |
| | 1,552 |
| | 146 |
| |
| Net amortization income | 1,508 |
| | 1,584 |
| | (76 | ) | | 4,503 |
| | 4,692 |
| | (189 | ) | |
| Total net interest income from guaranty book of business | 4,237 |
| | 4,165 |
| | 72 |
| | 12,553 |
| | 12,304 |
| | 249 |
| |
| Total net interest income | $ | 5,369 |
| | $ | 5,274 |
| | $ | 95 |
| | $ | 15,978 |
| | $ | 15,622 |
| | $ | 356 |
| |
__________ |
| | | | | | | | | | | | | | | | | | | | | | | | | |
| Components of Net Interest Income |
| | | For the Three Months Ended September 30, | | | | For the Nine Months Ended September 30, | | | |
| | | 2019 | | 2018 | | Variance | | 2019 | | 2018 | | Variance | |
| | | (Dollars in millions) |
| Net interest income from guaranty book of business: | | | | | | | | | | | | | |
| Base guaranty fee income, net of TCCA | | $ | 2,371 |
| | $ | 2,153 |
| | $ | 218 |
| | $ | 6,942 |
| | $ | 6,352 |
| | $ | 590 |
| |
Base guaranty fee income related to TCCA(1) | | 613 |
| | 576 |
| | 37 |
| | 1,806 |
| | 1,698 |
| | 108 |
| |
| Net amortization income | | 1,475 |
| | 1,508 |
| | (33 | ) | | 3,828 |
| | 4,503 |
| | (675 | ) | |
| Total net interest income from guaranty book of business | | 4,459 |
| | 4,237 |
| | 222 |
| | 12,576 |
| | 12,553 |
| | 23 |
| |
Net interest income from portfolios(2) | | 770 |
| | 1,132 |
| | (362 | ) | | 2,536 |
| | 3,425 |
| | (889 | ) | |
| Total net interest income | | $ | 5,229 |
| | $ | 5,369 |
| | $ | (140 | ) | | $ | 15,112 |
| | $ | 15,978 |
| | $ | (866 | ) | |
| |
(1) | Revenues generated by the 10 basis point guaranty fee increase we implemented pursuant to the TCCA, the incremental revenue from which is remitted to Treasury and not retained by us. |
| |
(2) | Includes interest income from assets held in our retained mortgage portfolio and our other investments portfolio, as well as other assets used to generate lender liquidity. Also includes interest expense on our outstanding Connecticut Avenue Securities®of $366$356 million and $274$366 million for the three months ended September 30, 2019 and 2018, respectively, and 2017, respectively,$1.1 billion and $1.0 billion and $723 million for the first nine months ended September 30,of 2019 and 2018, and 2017, respectively. |
| |
(2)
| Revenues generated by the 10 basis point guaranty fee increase we implemented pursuant to the TCCA, the incremental revenue from which is remitted to Treasury and not retained by us. |
Net interest income increased slightlydeclined in the third quarter and first nine months of 20182019 compared with the third quarter and first nine months of 2017 due to:
An increase2018, driven by lower net interest income from portfolios and a decline in net amortization income, partially offset by higher base guaranty fee income.
Net interest income as the size of our guaranty book of business increased and loans with higher base guaranty fees comprised a larger part of our guaranty book of businessfrom portfolios decreased in the third quarter and first nine months of 20182019 compared with the third quarter and first nine months of 2017.
An increase2018 primarily due to sales of reperforming loans in our loss mitigation portfolio as well as liquidations, which reduced the average balance of our retained mortgage portfolio. This was partially offset by increased interest income fromon our other investments portfolio primarily due to higher short-term interest rates on our federal funds sold and securities purchased under agreements to resell or similar arrangements, and a higher average balance of non-mortgage securities. See “Retained Mortgage Portfolio” for more information on our loss mitigation portfolio.
Net interest income from base guaranty fees increased in the third quarter and first nine months of 20182019 compared with the third quarter and first nine months of 2017.2018 due to an increase in the size of our guaranty book of business and loans with higher base guaranty fees comprising a larger part of our guaranty book of business.
These increases were partially offset by a decline in netNet amortization income as higher interest ratesdecreased in the third quarter andfirst nine months of 2019 compared with the first nine months of 2018 compared withprimarily due to a sharp decline in prepayment volumes in the thirdfirst quarter and first nine months of 2017 slowed down loan prepayments, resulting2019, which resulted in lower amortization of cost basis adjustments on mortgage loans of consolidated trusts and the related debt.
Analysis of Deferred Amortization of Cost Basis AdjustmentsIncome
We initially recognize mortgage loans and debt of consolidated trusts in our condensed consolidated balance sheet at fair value. We recognize theThe difference between the initial fair value and the carrying value of these mortgage loans and debtinstruments is recorded as cost basis adjustments, in our consolidated balance sheet. We amortize theseeither as premiums or discounts. These cost basis adjustments are amortized as a yield adjustmentadjustments over the contractual lives of thesethe loans or debt. On a net basis, for mortgage loans and debt of consolidated trusts, we are in a premium position with respect to debt of consolidated trusts, which represents deferred income we will recognize in our condensed consolidated statements of operations and comprehensive income as a component of net interest income.amortization income in future periods.
|
| | |
Fannie Mae Third Quarter 20182019 Form 10-Q | 813 |
|
| | |
| | MD&A | Consolidated Results of Operations |
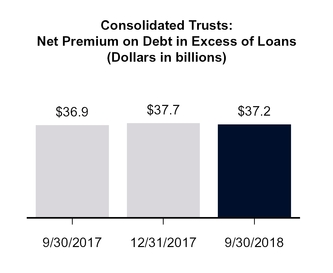
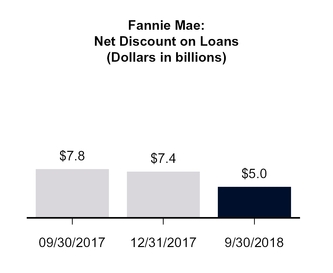
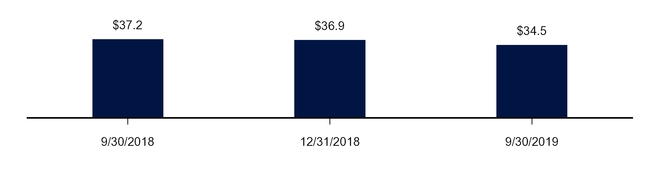
The following charts display information about the outstanding net premiumDeferred Income Represented by Net Premium Position on debt
Debt of Consolidated Trusts
(Dollars in excess of loans of consolidated trusts and net discount positions on loans of Fannie Mae.billions)
The net premium position of our consolidated debt will amortize as income over time. The timing of when thiswe recognize amortization income is recognized in our consolidated statements of income can vary based on a number of factors, the most significant of which is interest rates. In a rising interest rate environment, our mortgage loans tend to prepay more slowly, which typically results in lower net amortization income from cost basis adjustments on our net consolidated debt.income. Conversely, in a declining interest rate environment, our mortgage loans tend to prepay faster, typically resulting in higher net amortization income from cost basis adjustments on our net consolidated debt.
The net discount position on our mortgage loans of Fannie Mae was primarily recorded upon the acquisition of credit-impaired loans. The extent to which we may record income in future periods as we amortize this discount will be based on the actual performance of the loans.
|
| | |
Fannie Mae Third Quarter 2018 Form 10-Q | 9 |
|
| | |
| MD&A | Consolidated Results of Operations |
Analysis of Net Interest Income and Yield
The table below displays an analysis of our net interest income, average balances, and related yields earned on assets and incurred on liabilities for the periods indicated.liabilities. For most components of the average balances, we use a daily weighted average of amortized cost. When daily average balance information is not available, such as for mortgage loans, we use monthly averages.
|
| | | | | | | | | | | | | | | | | | | | | |
| Analysis of Net Interest Income and Yield |
| For the Three Months Ended September 30, |
| 2018 |
| 2017 |
| Average
Balance |
| Interest
Income/
Expense |
| Average
Rates
Earned/Paid |
| Average
Balance |
| Interest
Income/
Expense |
| Average
Rates
Earned/Paid |
| (Dollars in millions) |
| Interest-earning assets: |
|
|
|
|
|
|
|
|
|
|
|
|
|
| Mortgage loans of Fannie Mae | $ | 149,859 |
|
| $ | 1,665 |
|
| 4.44 | % |
| $ | 181,445 |
| | $ | 1,879 |
| | 4.14 | % |
| Mortgage loans of consolidated trusts | 3,090,212 |
|
| 27,058 |
|
| 3.50 |
|
| 2,979,153 |
| | 25,168 |
| | 3.38 |
|
Total mortgage loans(1) | 3,240,071 |
|
| 28,723 |
|
| 3.55 |
|
| 3,160,598 |
| | 27,047 |
| | 3.42 |
|
| Mortgage-related securities | 10,513 |
|
| 115 |
|
| 4.38 |
|
| 12,132 |
| | 99 |
| | 3.30 |
|
Non-mortgage-related securities(2) | 57,271 |
|
| 302 |
|
| 2.06 |
|
| 57,880 |
| | 173 |
| | 1.17 |
|
| Federal funds sold and securities purchased under agreements to resell or similar arrangements | 32,208 |
|
| 166 |
|
| 2.02 |
|
| 37,094 |
| | 109 |
| | 1.15 |
|
| Advances to lenders | 4,459 |
|
| 38 |
|
| 3.34 |
|
| 4,634 |
| | 33 |
| | 2.78 |
|
| Total interest-earning assets | $ | 3,344,522 |
|
| $ | 29,344 |
|
| 3.51 | % |
| $ | 3,272,338 |
| | $ | 27,461 |
| | 3.36 | % |
| Interest-bearing liabilities: |
|
|
|
|
|
|
| | | | | |
| Short-term funding debt | $ | 22,837 |
|
| $ | (114 | ) |
| 1.95 | % |
| $ | 27,967 |
| | $ | (71 | ) | | 0.99 | % |
| Long-term funding debt | 196,266 |
|
| (1,133 | ) |
| 2.31 |
|
| 247,334 |
| | (1,232 | ) | | 1.99 |
|
Connecticut Avenue Securities® (“CAS”) | 25,100 |
|
| (366 | ) |
| 5.83 |
|
| 20,978 |
| | (274 | ) | | 5.22 |
|
| Total debt of Fannie Mae | 244,203 |
|
| (1,613 | ) |
| 2.64 |
|
| 296,279 |
| | (1,577 | ) | | 2.13 |
|
| Debt securities of consolidated trusts held by third parties | 3,090,509 |
|
| (22,362 | ) |
| 2.89 |
|
| 2,984,811 |
| | (20,610 | ) | | 2.76 |
|
| Total interest-bearing liabilities | $ | 3,334,712 |
|
| $ | (23,975 | ) |
| 2.88 | % |
| $ | 3,281,090 |
| | $ | (22,187 | ) | | 2.70 | % |
| Net interest income/net interest yield |
|
| $ | 5,369 |
|
| 0.64 | % |
| | | $ | 5,274 |
| | 0.64 | % |
|
| | | | | | | | | | | | | | | | | | | | | | |
| Analysis of Net Interest Income and Yield |
| | | For the Three Months Ended September 30, |
| | | 2019 | | 2018 |
| | | Average
Balance | | Interest
Income/
(Expense) | | Average
Rates
Earned/Paid | | Average
Balance | | Interest
Income/
(Expense) | | Average
Rates
Earned/Paid |
| | | (Dollars in millions) |
| Interest-earning assets: | | | | | | | | | | | | |
| Mortgage loans of Fannie Mae | | $ | 119,887 |
| | $ | 1,248 |
| | 4.16 | % | | $ | 149,859 |
| | $ | 1,665 |
| | 4.44 | % |
| Mortgage loans of consolidated trusts | | 3,185,389 |
| | 27,610 |
| | 3.47 |
| | 3,090,212 |
| | 27,058 |
| | 3.50 |
|
Total mortgage loans(1) | | 3,305,276 |
| | 28,858 |
| | 3.49 |
| | 3,240,071 |
| | 28,723 |
| | 3.55 |
|
| Mortgage-related securities | | 10,859 |
| | 111 |
| | 4.09 |
| | 10,513 |
| | 115 |
| | 4.38 |
|
Non-mortgage-related securities(2) | | 62,294 |
| | 347 |
| | 2.18 |
| | 57,271 |
| | 302 |
| | 2.06 |
|
| Federal funds sold and securities purchased under agreements to resell or similar arrangements | | 29,792 |
| | 178 |
| | 2.34 |
| | 32,208 |
| | 166 |
| | 2.02 |
|
| Advances to lenders | | 6,287 |
| | 47 |
| | 2.93 |
| | 4,459 |
| | 38 |
| | 3.34 |
|
| Total interest-earning assets | | $ | 3,414,508 |
| | $ | 29,541 |
| | 3.46 | % | | $ | 3,344,522 |
| | $ | 29,344 |
| | 3.51 | % |
| Interest-bearing liabilities: | | | | | | | | | | | | |
| Short-term funding debt | | $ | 23,064 |
| | $ | (125 | ) | | 2.12 | % | | $ | 22,837 |
| | $ | (114 | ) | | 1.95 | % |
| Long-term funding debt | | 163,996 |
| | (1,056 | ) | | 2.58 |
| | 196,266 |
| | (1,133 | ) | | 2.31 |
|
Connecticut Avenue Securities® (“CAS”) | | 23,364 |
| | (356 | ) | | 6.09 |
| | 25,100 |
| | (366 | ) | | 5.83 |
|
| Total debt of Fannie Mae | | 210,424 |
| | (1,537 | ) | | 2.92 |
| | 244,203 |
| | (1,613 | ) | | 2.64 |
|
| Debt securities of consolidated trusts held by third parties | | 3,196,503 |
| | (22,775 | ) | | 2.85 |
| | 3,090,509 |
| | (22,362 | ) | | 2.89 |
|
| Total interest-bearing liabilities | | $ | 3,406,927 |
| | $ | (24,312 | ) | | 2.85 | % | | $ | 3,334,712 |
| | $ | (23,975 | ) | | 2.88 | % |
| Net interest income/net interest yield | | | | $ | 5,229 |
| | 0.61 | % | | | | $ | 5,369 |
| | 0.64 | % |
|
| | |
Fannie Mae Third Quarter 20182019 Form 10-Q | 1014 |
|
| | |
| | MD&A | Consolidated Results of Operations |
|
| | | | | | | | | | | | | | | | | | | | | |
| | For the Nine Months Ended September 30, |
| | 2018 | | 2017 |
| | Average
Balance | | Interest
Income/
Expense | | Average
Rates
Earned/Paid | | Average
Balance | | Interest
Income/
Expense | | Average
Rates
Earned/Paid |
| | (Dollars in millions) |
| Interest-earning assets: | | | | | | | | | | | |
| Mortgage loans of Fannie Mae | $ | 156,168 |
| | $ | 5,187 |
| | 4.43 | % | | $ | 190,552 |
| | $ | 5,950 |
| | 4.16 | % |
| Mortgage loans of consolidated trusts | 3,068,521 |
| | 79,877 |
| | 3.47 |
| | 2,951,478 |
| | 75,155 |
| | 3.40 |
|
Total mortgage loans(1) | 3,224,689 |
| | 85,064 |
| | 3.52 |
| | 3,142,030 |
| | 81,105 |
| | 3.44 |
|
| Mortgage-related securities | 10,670 |
| | 321 |
| | 4.01 |
| | 13,796 |
| | 368 |
| | 3.55 |
|
Non-mortgage-related securities(2) | 54,572 |
| | 771 |
| | 1.86 |
| | 56,145 |
| | 414 |
| | 0.97 |
|
| Federal funds sold and securities purchased under agreements to resell or similar arrangements | 33,826 |
| | 457 |
| | 1.78 |
| | 38,260 |
| | 262 |
| | 0.90 |
|
| Advances to lenders | 4,171 |
| | 102 |
| | 3.22 |
| | 4,445 |
| | 89 |
| | 2.63 |
|
| Total interest-earning assets | $ | 3,327,928 |
| | $ | 86,715 |
| | 3.47 | % | | $ | 3,254,676 |
| | $ | 82,238 |
| | 3.37 | % |
| Interest-bearing liabilities: | | | | | | | | | | | |
| Short-term funding debt | $ | 26,395 |
| | $ | (328 | ) | | 1.64 | % | | $ | 30,231 |
| | $ | (170 | ) | | 0.74 | % |
| Long-term funding debt | 204,543 |
| | (3,426 | ) | | 2.23 |
| | 261,090 |
| | (4,098 | ) | | 2.09 |
|
Connecticut Avenue Securities® (“CAS”) | 23,830 |
| | (1,007 | ) | | 5.63 |
| | 18,940 |
| | (723 | ) | | 5.09 |
|
| Total debt of Fannie Mae | 254,768 |
| | (4,761 | ) | | 2.49 |
| | 310,261 |
| | (4,991 | ) | | 2.14 |
|
| Debt securities of consolidated trusts held by third parties | 3,068,839 |
| | (65,976 | ) | | 2.87 |
| | 2,953,203 |
| | (61,625 | ) | | 2.78 |
|
| Total interest-bearing liabilities | $ | 3,323,607 |
| | $ | (70,737 | ) | | 2.84 | % | | $ | 3,263,464 |
| | $ | (66,616 | ) | | 2.72 | % |
| Net interest income/net interest yield | | | $ | 15,978 |
| | 0.64 | % | | | | $ | 15,622 |
| | 0.64 | % |
__________ |
| | | | | | | | | | | | | | | | | | | | | | |
| | For the Nine Months Ended September 30, |
| | 2019 |
| 2018 |
| | Average
Balance |
| Interest
Income/
(Expense) |
| Average
Rates
Earned/Paid |
| Average
Balance |
| Interest
Income/
(Expense) |
| Average
Rates
Earned/Paid |
| | (Dollars in millions) |
| Interest-earning assets: | |
|
|
|
|
|
|
|
|
|
|
|
|
|
| Mortgage loans of Fannie Mae | | $ | 119,180 |
|
| $ | 3,848 |
|
| 4.30 | % |
| $ | 156,168 |
| | $ | 5,187 |
| | 4.43 | % |
| Mortgage loans of consolidated trusts | | 3,167,172 |
|
| 84,157 |
|
| 3.54 |
|
| 3,068,521 |
| | 79,877 |
| | 3.47 |
|
Total mortgage loans(1) | | 3,286,352 |
|
| 88,005 |
|
| 3.57 |
|
| 3,224,689 |
| | 85,064 |
| | 3.52 |
|
| Mortgage-related securities | | 9,904 |
|
| 320 |
|
| 4.31 |
|
| 10,670 |
| | 321 |
| | 4.01 |
|
Non-mortgage-related securities(2) | | 61,109 |
|
| 1,095 |
|
| 2.36 |
|
| 54,572 |
| | 771 |
| | 1.86 |
|
| Federal funds sold and securities purchased under agreements to resell or similar arrangements | | 37,349 |
|
| 698 |
|
| 2.46 |
|
| 33,826 |
| | 457 |
| | 1.78 |
|
| Advances to lenders | | 4,975 |
|
| 120 |
|
| 3.18 |
|
| 4,171 |
| | 102 |
| | 3.22 |
|
| Total interest-earning assets | | $ | 3,399,689 |
|
| $ | 90,238 |
|
| 3.54 | % |
| $ | 3,327,928 |
| | $ | 86,715 |
| | 3.47 | % |
| Interest-bearing liabilities: | |
|
|
|
|
|
| | | | | |
| Short-term funding debt | | $ | 21,138 |
|
| $ | (369 | ) |
| 2.30 | % |
| $ | 26,395 |
| | $ | (328 | ) | | 1.64 | % |
| Long-term funding debt | | 172,284 |
|
| (3,272 | ) |
| 2.53 |
|
| 204,543 |
| | (3,426 | ) | | 2.23 |
|
| Connecticut Avenue Securities | | 24,170 |
|
| (1,114 | ) |
| 6.15 |
|
| 23,830 |
| | (1,007 | ) | | 5.63 |
|
| Total debt of Fannie Mae | | 217,592 |
|
| (4,755 | ) |
| 2.91 |
|
| 254,768 |
| | (4,761 | ) | | 2.49 |
|
| Debt securities of consolidated trusts held by third parties | | 3,173,700 |
|
| (70,371 | ) |
| 2.96 |
|
| 3,068,839 |
| | (65,976 | ) | | 2.87 |
|
| Total interest-bearing liabilities | | $ | 3,391,292 |
|
| $ | (75,126 | ) |
| 2.95 | % |
| $ | 3,323,607 |
| | $ | (70,737 | ) | | 2.84 | % |
| Net interest income/net interest yield | |
|
| $ | 15,112 |
|
| 0.59 | % |
| | | $ | 15,978 |
| | 0.64 | % |
| |
(1) | Average balance includes mortgage loans on nonaccrual status. A single-family loan is placed on nonaccrual status when the payment of principal or interest on the loan is 60 days or more past due. A multifamily loan is placed on nonaccrual status when the loan becomes 90 days or more past due according to its contractual terms or is deemed individually impaired. Typically, interest income on nonaccrual mortgage loans is recognized when cash is received. Interest income not recognized for loans on nonaccrual status was $110 million and $301 million, respectively, for the third quarter and first nine months of 2019, compared with $86 million and $351 million, respectively, for the third quarter and first nine months of 2018, compared with $209 million and $611 million, respectively, for the third quarter and first nine months of 2017.2018. |
| |
(2) | IncludesConsists of cash, equivalents.cash equivalents and U.S Treasury securities. |
Fee and Other Income
Fee and other income includes transaction fees, multifamily fees technology fees and other miscellaneous income. Fee and other income declinedincreased in the third quarter of 2019 compared with the third quarter of 2018, primarily due to an increase in yield maintenance fees due to increased prepayments on multifamily loans as interest rates decreased.
Investment Gains, Net
Investment gains, net primarily includes gains and losses recognized from the sale of loans and available-for-sale securities, gains and losses recognized on the consolidation and deconsolidation of securities, the lower of cost or fair value adjustments on held for sale (“HFS”) loans, and net other-than-temporary impairments recognized on our investments. Investment gains, net increased in the third quarter and the first nine months of 2018,2019 compared with the third quarter and first nine months of 2017,2018, primarily due to $975 milliondriven by an increase in gains on sales of income in the third quarter of 2017 resulting from a settlement agreement resolving legal claims related to private-label securities we purchased.single-family loans.
Fair Value Gains (Losses), Net
The estimated fair value of our derivatives, trading securities and other financial instruments carried at fair value may fluctuate substantially from period to period because of changes in interest rates, the yield curve, mortgage and credit spreads and implied volatility, as well as activity related to these financial instruments. While the estimated fair value of our derivatives that serve to mitigate certain risk exposures may fluctuate, some of the financial instruments that generate these exposures are not recorded at fair value in our condensed consolidated financial statements. We are developing capabilities to implement hedge accounting to reduce interest rate volatility in our consolidated statements of operations and comprehensive income.
|
| | |
Fannie Mae Third Quarter 20182019 Form 10-Q | 1115 |
|
| | |
| | MD&A | Consolidated Results of Operations |
The table below displays the components of our fair value gains and losses.
| | Fair Value Gains (Losses), Net | | | For the Three Months Ended September 30, | | For the Nine Months Ended September 30, | | For the Three Months Ended September 30, | | For the Nine Months Ended September 30, |
| | 2018 | | 2017 | | 2018 | | 2017 | | 2019 | | 2018 | | 2019 | | 2018 |
| | (Dollars in millions) | | (Dollars in millions) |
| Risk management derivatives fair value gains (losses) attributable to: | | | | | | | | | | | | | | | |
| Net contractual interest expense accruals on interest rate swaps | $ | (285 | ) | | $ | (223 | ) | | $ | (786 | ) | | $ | (702 | ) | | $ | (190 | ) | | $ | (285 | ) | | $ | (698 | ) | | $ | (786 | ) |
| Net change in fair value during the period | 527 |
| | 75 |
| | 1,365 |
| | 364 |
| | (294 | ) | | 528 |
| | (541 | ) | | 1,367 |
|
| Total risk management derivatives fair value gains (losses), net | 242 |
| | (148 | ) | | 579 |
| | (338 | ) | | (484 | ) | | 243 |
| | (1,239 | ) | | 581 |
|
| Mortgage commitment derivatives fair value gains (losses), net | 118 |
| | (248 | ) | | 606 |
| | (520 | ) | | (177 | ) | | 118 |
| | (946 | ) | | 606 |
|
| Credit enhancement derivatives fair value losses, net | | | (7 | ) | | (1 | ) | | (31 | ) | | (2 | ) |
| Total derivatives fair value gains (losses), net | 360 |
| | (396 | ) | | 1,185 |
| | (858 | ) | | (668 | ) | | 360 |
| | (2,216 | ) | | 1,185 |
|
| Trading securities gains (losses), net | (40 | ) | | 59 |
| | 79 |
| | 145 |
| | 95 |
| | (40 | ) | | 370 |
| | 79 |
|
| CAS fair value gains (losses), net | 16 |
| | 113 |
| | 35 |
| | (218 | ) | |
| Other, net | 50 |
| | (65 | ) | | 361 |
| | (89 | ) | |
| CAS debt fair value gains, net | | | 59 |
| | 16 |
| | 156 |
| | 35 |
|
Other, net(1) | | | (199 | ) | | 50 |
| | (608 | ) | | 361 |
|
| Fair value gains (losses), net | $ | 386 |
| | $ | (289 | ) | | $ | 1,660 |
| | $ | (1,020 | ) | | $ | (713 | ) | | $ | 386 |
| | $ | (2,298 | ) | | $ | 1,660 |
|
| |
(1) | Consists of fair value gains and losses on non-CAS debt and mortgage loans held at fair value. |
Fair value losses in the third quarter and first nine months of 2019 were primarily driven by:
net interest expense accruals on risk management derivatives combined with decreases in the fair value of pay-fixed risk management derivatives due to declines in medium- to longer-term swap rates, which were partially offset by increases in the fair value of receive-fixed risk management derivatives;
decreases in the fair value of mortgage commitment derivatives due to losses on commitments to sell mortgage-related securities as a result of increases in the prices of securities as interest rates declined during the commitment periods, partially offset by gains on commitments to buy mortgage-related securities; and
increases in the fair value of long-term debt of consolidated trusts held at fair value, which are included in “Other, net,” due to declines in interest rates.
Fair value gains in the third quarter and first nine months of 2018 were primarily driven by:
increases in the fair value of our mortgage commitment derivatives due to gains on commitments to sell mortgage-related securities as a result of decreases in the prices of securities as interest rates rose during the commitment periods; and
increases in the fair value of our pay-fixed risk management derivatives due to an increase in longer-term swap rates during the periods.
Credit-Related Income
Our credit-related income or expense can vary substantially from period to period based on a number of factors, such as changes in actual and expected home prices, fluctuations in interest rates, borrower payment behavior, events such as natural disasters, the types and volume of our loss mitigation activities, the volume of foreclosures completed, and the redesignation of loans from held for investment (“HFI”) to HFS. In addition, our credit-related income or expense and our loss reserves can be impacted by updates to the models, assumptions and data used in determining our allowance for loan losses.
While the redesignation of certain reperforming and nonperforming single-family loans from HFI to HFS has been a significant driver of credit-related income in recent periods, we may see a reduced impact from this activity in the third quarterfuture to the extent the population of loans we are considering for redesignation declines. Further, our implementation of Accounting Standards Update 2016-13, Financial Instruments—Credit Losses, Measurement of Credit Losses on Financial Instruments and first nine months of 2017 were primarily driven by:
decreasesrelated amendments (the “CECL standard”) on January 1, 2020 will likely introduce additional volatility in our results as credit-related income or expense will include expected lifetime losses on our loans and other financial instruments subject to the standard and thus become more sensitive to fluctuations in the fair value of our mortgage commitments due to losses on commitments to sell mortgage-related securities due to an increase in prices as interest rates decreased during most of the commitment periods; and
decreases in the fair value of our pay-fixed risk management derivatives due to declines in longer-term swap rates during the second quarter and most of the third quarter.
Administrative Expenses
Administrative expenses include salaries and employee benefits, professional services, occupancy and other miscellaneous expenses. Administrative expenses increased in the third quarter and first nine months of 2018, compared with the third quarter and first nine months of 2017, primarily due to an increase in salaries and professional services expense in support of our business resiliency activities and from severance expenses.factors detailed above.
|
| | |
Fannie Mae Third Quarter 20182019 Form 10-Q | 1216 |
|
| | |
| | MD&A | Consolidated Results of Operations |
Credit-Related Income (Expense)
Benefit (Provision) for Credit Losses
The table below provides quantitative analysisdisplays components of the drivers of our single-family benefit or provision for credit losses for the periods presented. Many of the drivers that contribute to our benefit or provision for credit losses overlap or are interdependent. The attribution shown below is based on internal allocation estimates. The table does not display our multifamily benefit or provision for credit losses as the amounts for all periods presented were less than $50 million.
|
| | | | | | | | | | | | | | | |
| Components of Benefit (Provision) for Credit Losses |
| | For the Three Months Ended September 30, | | For the Nine Months Ended September 30, |
| | 2018 | | 2017 | | 2018 | | 2017 |
| | (Dollars in billions) |
| Single-family benefit (provision) for credit losses: | | | | | | | |
Changes in loan activity(1) | $ | 0.4 |
| | $ | (0.9 | ) | | $ | 0.7 |
| | $ | (0.8 | ) |
| Redesignation of held for investment (“HFI”) loans to held for sale (“HFS”) loans | 0.4 |
| | 0.5 |
| | 1.4 |
| | 1.0 |
|
| Actual and forecasted home prices | 0.2 |
| | 0.1 |
| | 0.9 |
| | 1.3 |
|
| Actual and projected interest rates | (0.3 | ) | | (0.1 | ) | | (1.0 | ) | | (0.2 | ) |
Other(2) | * |
| | 0.2 |
| | 0.2 |
| | 0.2 |
|
| Single-family benefit (provision) for credit losses | 0.7 |
| | (0.2 | ) | | 2.2 |
| | 1.5 |
|
| Total benefit (provision) for credit losses | $ | 0.7 |
| | $ | (0.2 | ) | | $ | 2.2 |
| | $ | 1.5 |
|
_________ |
| | | | | | | | | | | | | | | | | |
| Components of Benefit for Credit Losses | | |
| | | For the Three Months Ended September 30, | | | For the Nine Months Ended September 30, |
| | | 2019 | | 2018 | | | 2019 | | 2018 |
| | | (Dollars in billions) |
| Single-family benefit for credit losses: | | | | | | | | | |
Changes in loan activity(1) | | $ | 0.2 |
| | $ | 0.4 |
| | | $ | 0.4 |
| | $ | 0.7 |
|
| Redesignation of loans from HFI to HFS | | 0.5 |
| | 0.4 |
| | | 1.2 |
| | 1.4 |
|
| Actual and forecasted home prices | | 0.2 |
| | 0.2 |
| | | 0.7 |
| | 0.9 |
|
| Actual and projected interest rates | | 0.1 |
| | (0.3 | ) | | | 0.5 |
| | (1.0 | ) |
Other(2) | | 0.9 |
| | * |
| | | 1.0 |
| | 0.2 |
|
| Total single-family benefit for credit losses | | $ | 1.9 |
| | $ | 0.7 |
| | | $ | 3.8 |
| | $ | 2.2 |
|
| |
| * | Represents less than $50 million. |
| |
(1) | Primarily consists of changes in the allowance due to loan delinquency, loan liquidations, new troubled debt restructurings, amortization of concessions granted to borrowers and the impact of FHFA’s Advisory Bulletin 2012-02, “Framework for Adversely Classifying Loans, Other Real Estate Owned, and Other Assets and Listing Assets for Special Mention” (the “Advisory Bulletin”). The 2017 amounts include our estimate as of September 30, 2017 of incurred losses resulting from Hurricanes Harvey, Irma and Maria (the “2017 hurricanes”), which is revised quarterly. |
| |
(2) | Primarily consists of the impact of model and assumption changes and changes in the reserve for guaranty losses that are not separately included in the other components. |
The primary factors that impactedcontributed to our benefit for credit losses in the third quarter and first nine months of 20182019 were:
The redesignation of certain reperforming and nonperforming single-family loans from HFI to HFS as we no longer intend to hold them for the foreseeable future or to maturity. Upon redesignation of these loans, we recorded the loans at the lower of cost or fair value with a charge-off to the allowance for loan losses. Amounts recorded in the allowance related to thethese loans exceeded the amounts charged off, which contributed to the benefit for credit losses.
In the third quarter of 2019, we enhanced the model used to estimate cash flows for individually impaired single-family loans within our allowance for loan losses. This enhancement was performed as a part of management’s routine model performance review process. In addition to incorporating recent loan performance data, this model enhancement better captures recent prepayment activity, default rates, and loss severity in the event of default. The enhancement resulted in a decrease to our allowance for loan losses and an incremental benefit for credit losses of approximately $850 million and is included in “Other” in the table above.
An increase in actual and forecasted home prices, which contributed to the benefit for credit losses.prices. Higher home prices decrease the likelihood that loans will default and reduce the amount of credit loss on loans that do default, which impacts our estimate of losses and ultimately reduces our loss reserves and provision for credit losses.
Lower actual and projected mortgage interest rates. As mortgage interest rates decline, we expect an increase in future prepayments on single-family individually impaired loans, including modified loans. Higher expected prepayments shorten the expected lives of modified loans, which decreases the impairment relating to term and interest rate concessions provided on these loans and results in a decrease in the provision for credit losses.
Changes in loan activity. Higher loan liquidation activity generally occurs during a lower interest rate environment as loans prepay, and during the peak home buying season of the second and third quarters of each year. When mortgage loans prepay, we reverse any remaining allowance related to these loans, which contributed to the benefit for credit losses.
The primary factors that impacted our benefit for credit losses wasin the third quarter and first nine months of 2018 were:
We recognized a benefit from the redesignation of certain reperforming and nonperforming single-family loans from HFI to HFS during the periods.
An increase in actual home prices, which contributed to the benefit for credit losses.
These factors were partially offset by the impact of higher actual and projected mortgage interest rates. As mortgage interest rates rise, we expect a decrease in future prepayments on single-family individually impaired loans, including modified loans. Lower expected prepayments lengthen the expected lives of modified loans, which increases the impairment relating to term and interest rate concessions provided on these loans and results in an increase in the provision for credit losses.
|
| | |
Fannie Mae Third Quarter 20182019 Form 10-Q | 1317 |
|
| | |
| | MD&A | Consolidated Results of Operations |
The following factors impacted our provision for credit lossesimpairment relating to term and interest rate concessions provided on these loans and results in the third quarter of 2017:
The estimate of incurred losses from the 2017 hurricanes contributed toan increase in the provision for credit losses.
This was partially offset by a benefit primarily due to higher actual home prices.
In addition, we recognized a benefit from the redesignation of certain reperforming single-family loans from HFI to HFS during the period.
The following factors impacted our benefit for credit losses in the first nine months of 2017:
We recognized a benefit for credit losses due to higher actual and forecasted home prices in the period.
In addition, we recognized a benefit from the redesignation of certain reperforming and nonperforming single-family loans from HFI to HFS during the period.
This was partially offset by the estimate of incurred losses from the 2017 hurricanes.
Temporary Payroll Tax Cut Continuation Act of 2011 (“TCCA”)TCCA Fees
Pursuant to the TCCA, in 2012 FHFA directed us to increase our single-family guaranty fees by 10 basis points and remit this increase to Treasury. This TCCA-related revenue is included in “Net interest income” and the expense is recognized as “TCCA fees” in our condensed consolidated financial statements. TCCA fees increased in the third quarter and first nine months of 20182019 compared with the third quarter and first nine months of 20172018 as our book of business subject to the TCCA continued to grow. We expect the guaranty fees collected and expenses incurred under the TCCA to continue to increase.
Federal Income Taxes
The decrease in our provision for federal income taxesOther expenses, net primarily consist of credit enhancement and mortgage insurance expenses, debt extinguishment gains and losses, housing trust fund expenses, loan subservicing costs and multifamily fees. Other expenses, net increased in the third quarter and first nine months of 2018 as2019 compared towith the third quarter and first nine months of 2017 was the result of the Tax Cuts and Jobs Act of 2017, which reduced the federal statutory corporate income tax rate from 35% to 21% effective January 1, 2018. This decline was the primary driver of the reduction in our effective tax rate to 20.7% for the third quarter of 2018 and 20.6% for the first nine months of 2018, compared with 33.5% for the third quarter of 2017 and 33.3% for the first nine months of 2017. Our effective tax rates for all the periods presented were different from the prevailing federal statutory rate primarily due to an increase in credit enhancement costs resulting from higher outstanding volumes of credit risk transfer transactions. We expect our credit enhancement expenses to continue to rise as the benefitspercentage of our investmentsguaranty book of business on which we have transferred a portion of credit risk continues to increase. We discuss transfer of mortgage credit risk in housing projects eligible for low-income housing tax credits.“MD&A—Single-Family Business—Single-Family Mortgage Credit Risk Management—Single-Family Credit Enhancement and Transfer of Mortgage Credit Risk” and “MD&A—Multifamily Business—Multifamily Mortgage Credit Risk Management—Transfer of Multifamily Mortgage Credit Risk.”
|
| | |
Fannie Mae Third Quarter 20182019 Form 10-Q | 1418 |
|
| | |
| | MD&A | Consolidated Balance Sheet Analysis |
Consolidated Balance Sheet Analysis
|
| | | | |
Consolidated Balance Sheet Analysis |
This section provides a discussion of our condensed consolidated balance sheets and should be read together with our condensed consolidated financial statements, including the accompanying notes.
| | Summary of Condensed Consolidated Balance Sheets | | | As of | | | | As of | | |
| | September 30, 2018 | | December 31, 2017 | | Variance | | September 30, 2019 | | December 31, 2018 | | Variance |
| | (Dollars in millions) | | (Dollars in millions) |
Assets | | | | | | | | | | | |
| Cash and cash equivalents and federal funds sold and securities purchased under agreements to resell or similar arrangements | $ | 54,387 |
| | $ | 51,580 |
| | $ | 2,807 |
| | $ | 45,768 |
| | $ | 58,495 |
| | $ | (12,727 | ) |
| Restricted cash | 23,242 |
| | 28,150 |
| | (4,908 | ) | | 41,906 |
| | 23,866 |
| | 18,040 |
|
Investments in securities(1) | 47,438 |
| | 39,522 |
| | 7,916 |
| | 46,896 |
| | 45,296 |
| | 1,600 |
|
| Mortgage loans: | | | | | | | | | | | |
| Of Fannie Mae | 137,227 |
| | 167,793 |
| | (30,566 | ) | | 116,639 |
| | 120,717 |
| | (4,078 | ) |
| Of consolidated trusts | 3,111,570 |
| | 3,029,816 |
| | 81,754 |
| | 3,206,873 |
| | 3,142,881 |
| | 63,992 |
|
| Allowance for loan losses | (15,663 | ) | | (19,084 | ) | | 3,421 |
| | (9,376 | ) | | (14,203 | ) | | 4,827 |
|
| Mortgage loans, net of allowance for loan losses | 3,233,134 |
| | 3,178,525 |
| | 54,609 |
| | 3,314,136 |
| | 3,249,395 |
| | 64,741 |
|
| Deferred tax assets, net | 14,368 |
| | 17,350 |
| | (2,982 | ) | | 11,994 |
| | 13,188 |
| | (1,194 | ) |
| Other assets | 28,536 |
| | 30,402 |
| | (1,866 | ) | | 33,736 |
| | 28,078 |
| | 5,658 |
|
| Total assets | $ | 3,401,105 |
| | $ | 3,345,529 |
| | $ | 55,576 |
| | $ | 3,494,436 |
| | $ | 3,418,318 |
| | $ | 76,118 |
|
| Liabilities and equity (deficit) | | | | | | |
| Liabilities and equity | | | | | | | |
| Debt: | | | | | | | | | | | |
| Of Fannie Mae | $ | 246,682 |
| | $ | 276,752 |
| | $ | (30,070 | ) | | $ | 213,522 |
| | $ | 232,074 |
| | $ | (18,552 | ) |
| Of consolidated trusts | 3,127,688 |
| | 3,053,302 |
| | 74,386 |
| | 3,248,336 |
| | 3,159,846 |
| | 88,490 |
|
| Other liabilities | 19,760 |
| | 19,161 |
| | 599 |
| | 22,236 |
| | 20,158 |
| | 2,078 |
|
| Total liabilities | 3,394,130 |
| | 3,349,215 |
| | 44,915 |
| | 3,484,094 |
| | 3,412,078 |
| | 72,016 |
|
| Fannie Mae stockholders’ equity (deficit): | | | | | | |
| Fannie Mae stockholders’ equity: | | | | | | | |
| Senior preferred stock | 120,836 |
| | 117,149 |
| | 3,687 |
| | 120,836 |
| | 120,836 |
| | — |
|
| Other net deficit | (113,861 | ) | | (120,835 | ) | | 6,974 |
| | (110,494 | ) | | (114,596 | ) | | 4,102 |
|
| Total equity (deficit) | 6,975 |
| | (3,686 | ) | | 10,661 |
| |
| Total liabilities and equity (deficit) | $ | 3,401,105 |
| | $ | 3,345,529 |
| | $ | 55,576 |
| |
| Total equity | | | 10,342 |
| | 6,240 |
| | 4,102 |
|
| Total liabilities and equity | | | $ | 3,494,436 |
| | $ | 3,418,318 |
| | $ | 76,118 |
|
__________
| |
(1)
| Includes $37.4 billion as of September 30, 2018 and $29.2 billion as of December 31, 2017 of non-mortgage-related securities. |
Mortgage Loans, Net of Allowance for Loan Losses
The mortgage loans reported in our condensed consolidated balance sheetsheets are classified as either HFS or HFI and include loans owned by Fannie Mae and loans held in consolidated trusts.
Mortgage loans, net of allowance for loan losses increased as of September 30, 20182019 compared with December 31, 20172018 primarily driven by:
an increase in mortgage loans due to acquisitions outpacing liquidations and sales; and
a decrease in our allowance for loan losses primarily driven by the redesignation of certain nonperforming and reperforming single-family loans from HFI to HFS.HFS and as a result of an enhancement to the model, including the incorporation of recent loan performance data, used to estimate cash flows for individually impaired single-family loans.
For additional information on our mortgage loans, see “Note 3, Mortgage Loans,” and for additional information on changes in our allowance for loan losses, see “Note 4, Allowance for Loan Losses.”
|
| | |
Fannie Mae Third Quarter 20182019 Form 10-Q | 1519 |
|
| | |
| | MD&A | Consolidated Balance Sheet Analysis |
Other Assets
The increase in other assets from December 31, 2018 to September 30, 2019 was primarily driven by an increase in advances to lenders. As interest rates declined during the first nine months of 2019, mortgage origination activity increased, resulting in higher funding needs by lenders. For information on our accounting policy for advances to lenders, refer to “Note 1, Summary of Significant Accounting Policies” in our 2018 Form 10-K.
Debt
The decrease in debt of Fannie Mae from December 31, 20172018 to September 30, 20182019 was primarily driven by lower funding needs asthe decline in the size of our retained mortgage portfolio continuedportfolio. We did not issue new debt to decreasereplace all of our debt of Fannie Mae that paid off during the first nine months of 2018.2019. The increase in debt of consolidated trusts from December 31, 20172018 to September 30, 20182019 was primarily driven by sales of Fannie Mae MBS, which are accounted for as issuances of debt of consolidated trusts in our condensed consolidated balance sheets, since the MBS certificate ownership is transferred from us to a third party. See “Liquidity“MD&A—Liquidity and Capital Management—Liquidity Management—Debt Funding” for a summary of the activity of the debt of Fannie Mae and a comparison of the mix between our outstanding short-term and long-term debt. Also see “Note 7, Short-Term and Long-Term Debt” for additional information on our outstanding debt.
Stockholders’ Equity (Deficit)
The shiftOur net equity increased as of September 30, 2019 compared with December 31, 2018 by the amount of our comprehensive income recognized during the first nine months of 2019, partially offset by our payments of senior preferred stock dividends to Treasury during the first two quarters of 2019.
Under the modified liquidation preference provisions of the senior preferred stock described in “Legislation and Regulation—Letter Agreement with Treasury,” the aggregate liquidation preference of the senior preferred stock increased from a net deficit$123.8 billion as of $3.7June 30, 2019 to $127.2 billion as of September 30, 2019, and will further increase to $131.2 billion as of December 31, 2017 to net equity of $7.0 billion as of September 30, 2018 reflects:2019.
our comprehensive income of $12.4 billion for the first nine months of 2018;
our receipt of $3.7 billion from Treasury during the first quarter of 2018 pursuant to the senior preferred stock purchase agreement, which eliminated our net worth deficit as of December 31, 2017; and
our dividend payments to Treasury of $5.4 billion during the year.
|
| | |
Fannie Mae Third Quarter 2018 Form 10-Q | 16 |
|
| | |
| MD&A | Retained Mortgage Portfolio |
|
| | | | |
Retained Mortgage Portfolio |
Our retained mortgage portfolio consists of mortgage loans and mortgage-related securities that we own, including Fannie Mae MBS and non-Fannie Mae mortgage-related securities. Assets held by consolidated MBS trusts that back mortgage-related securities owned by third parties are not included in our retained mortgage portfolio.
We use our retained mortgage portfolio primarily to provide liquidity to the mortgage market and support our loss mitigation activities. Previously, we also used our retained mortgage portfolio for investment purposes.
The chart below separates the instruments within our retained mortgage portfolio, measured by unpaid principal balance, into three categories based on each instrument’s use:
| |
| • | Lender liquidity, which includes balances related to our whole loan conduit activity, supports our efforts to provide liquidity to the single-family and multifamily mortgage markets. |
| |
| • | Loss mitigation supports our loss mitigation efforts through the purchase of delinquent loans from our MBS trusts. |
| |
| • | Other represents assets that were previously purchased for investment purposes. More than half of the balance of “Other” consisted of reverse mortgage loans and Fannie Mae-wrapped reverse mortgage securities as of September 30, 2018.2019 consisted of Fannie Mae reverse mortgage securities and reverse mortgage loans. We expect the amount of assets in “Other” will continue to decline over time as they liquidate, mature or are sold. |
|
|
Retained Mortgage Portfolio
(Dollars in billions)
|
|
| | |
Fannie Mae Third Quarter 20182019 Form 10-Q | 1720 |
|
| | |
| | MD&A | Retained Mortgage Portfolio |
Retained Mortgage Portfolio
(Dollars in billions)
The table below displays the components of our retained mortgage portfolio, measured by unpaid principal balance.
|
| | | | | | | | | | | |
| Retained Mortgage Portfolio |
| | As of |
| | September 30, 2018 | | December 31, 2017 |
| | (Dollars in millions) |
| Single-family: | | | | | | | |
Mortgage loans(1) | | $ | 118,118 |
| | | | $ | 146,316 |
| |
| Reverse mortgages | | 22,943 |
| | | | 26,458 |
| |
| Mortgage-related securities: | | | | | | | |
Agency securities(2) | | 34,688 |
| | | | 31,719 |
| |
| Fannie Mae-wrapped reverse mortgage securities | | 6,171 |
| | | | 6,689 |
| |
| Ginnie Mae reverse mortgage securities | | 1,882 |
| | | | 527 |
| |
Other Fannie Mae-wrapped securities(3) | | 664 |
| | | | 3,414 |
| |
Private-label and other securities(3) | | 3,107 |
| | | | 2,588 |
| |
Total single-family mortgage-related securities(4) | | 46,512 |
| | | | 44,937 |
| |
| Total single-family mortgage loans and mortgage-related securities | | 187,573 |
| | | | 217,711 |
| |
| Multifamily: | | | | | | | |
Mortgage loans(5) | | 3,430 |
| | | | 4,591 |
| |
| Mortgage-related securities: | | | | | | | |
Agency securities(2) | | 7,709 |
| | | | 7,860 |
| |
| Commercial mortgage-backed securities (“CMBS”) | | — |
| | | | 24 |
| |
| Mortgage revenue bonds | | 402 |
| | | | 597 |
| |
Total multifamily mortgage-related securities(6) | | 8,111 |
| | | | 8,481 |
| |
| Total multifamily mortgage loans and mortgage-related securities | | 11,541 |
| | | | 13,072 |
| |
| Total retained mortgage portfolio | | $ | 199,114 |
| | | | $ | 230,783 |
| |
__________ |
| | | | | | | | | | | |
| Retained Mortgage Portfolio |
| | As of |
| | September 30, 2019 | | December 31, 2018 |
| | (Dollars in millions) |
| Lender liquidity: | | | | | | | |
Agency securities(1) | | $ | 45,178 |
| | | | $ | 40,528 |
| |
| Mortgage loans | | 24,808 |
| | | | 8,640 |
| |
| Total lender liquidity | | 69,986 |
| | | | 49,168 |
| |
Loss mitigation mortgage loans(2) | | 70,729 |
| | | | 87,220 |
| |
| Other: | | | | | | | |
| Reverse mortgage loans | | 18,488 |
| | | | 21,856 |
| |
Mortgage loans
| | 7,495 |
| | | | 8,959 |
| |
Reverse mortgage securities(3) | | 7,723 |
| | | | 7,883 |
| |
| Private-label and other securities | | 1,679 |
| | | | 3,042 |
| |
| Fannie Mae-wrapped private-label securities | | 595 |
| | | | 650 |
| |
| Mortgage revenue bonds | | 294 |
| | | | 375 |
| |
| Total other | | 36,274 |
| | | | 42,765 |
| |
| Total retained mortgage portfolio | | $ | 176,989 |
| | | | $ | 179,153 |
| |
| | | | | | | | |
Retained mortgage portfolio by segment:
| | | | | | | |
| Single-family mortgage loans and mortgage-related securities | | $ | 167,305 |
| | | | $ | 168,338 |
| |
| Multifamily mortgage loans and mortgage-related securities | | $ | 9,684 |
| | | | $ | 10,815 |
| |
| |
(1) | Consists of Fannie Mae, Freddie Mac, and Ginnie Mae mortgage-related securities, including Freddie Mac securities guaranteed by Fannie Mae. Excludes Fannie Mae and Ginnie Mae reverse mortgage securities and Fannie Mae-wrapped private-label securities. |
| |
(2) | Includes single-family loans classified as troubled debt restructurings (“TDRs”) that were on accrual status of $68.4$46.2 billion and $86.3$58.5 billion as of September 30, 20182019 and December 31, 2017,2018, respectively, and single-family loans on nonaccrual status of $26.5$21.0 billion and $33.1$24.4 billion as of September 30, 20182019 and December 31, 2017,2018, respectively. |
| |
(2)
| Includes Fannie Mae, Freddie Mac and Ginnie Mae mortgage-related securities, excluding Fannie Mae-wrapped securities and Ginnie Mae reverse mortgage securities. |
| |
(3)
| The increase in private-label and other securities from December 31, 2017 to September 30, 2018 was due to the dissolution in the first quarter of 2018 of a Fannie Mae-wrapped private-label securities trust. The Fannie Mae-wrapped private-label securities had been classified as other Fannie Mae-wrapped securities prior to the dissolution. |
| |
(4)
| The fair value of these single-family mortgage-related securities was $47.5 billion and $46.7 billion as of September 30, 2018 and December 31, 2017, respectively. |
| |
(5)
| Includes multifamily loans classified as TDRs that were on accrual status of $64$35 million and $84$57 million as of September 30, 20182019 and December 31, 2017,2018, respectively, and multifamily loans on nonaccrual status of $163$260 million and $122$150 million as of September 30, 20182019 and December 31, 2017,2018, respectively. |
| |
(6)(3)
| The fair valueConsists of these multifamily mortgage-related securities was $8.3 billionFannie Mae and $9.0 billion as of September 30, 2018 and December 31, 2017, respectively.Ginnie Mae reverse mortgage securities. |
|
| | |
| Fannie Mae Third Quarter 2019 Form 10-Q | 21 |
|
| | |
| MD&A | Retained Mortgage Portfolio |
The amount of mortgage assets that we may own is restrictedcapped at $250 billion by our senior preferred stock purchase agreement with Treasury, and FHFA has directed that we further cap our mortgage assets at $225 billion, as described in “Business—Conservatorship, Treasury Agreements and Treasury Agreements—Housing Finance Reform—Treasury Agreements” in our 20172018 Form 10-K. OurWe expect our retained mortgage portfolio isto remain below the final $250current $225 billion cap under thedirected by FHFA. The September 2019 Treasury plan includes a recommendation that Treasury and FHFA amend our senior preferred stock purchase agreement that becomes effectiveto further reduce the cap on December 31, 2018. We expect the size ofour investments in mortgage-related assets, and also to restrict our retained mortgage portfolio will continue to decrease in 2018.solely supporting the business of securitizing MBS.
We have the option or, in some instances, the obligation, to purchase mortgage loans that meet specific criteria from an MBS trust. In support of our loss mitigation strategy, we purchased $13.6$7.8 billion of loans from our single-family MBS trusts in the first nine months of 2018,2019, the substantial majority of which were delinquent. In deciding whether and when to exercise our option to purchase a loan from a single-family MBS trust, we consider a variety of factors, including, but not limited to, the cost of funds, general market conditions, and relevant market yields. The weight we give to these factors, among others, changes depending on market circumstances and other factors. See “MD&A—Retained Mortgage Portfolio—Purchases of Loans from Our MBS Trusts” in our 20172018 Form 10-K for more information relating to our purchases of loans from MBS trusts.
|
| | |
Fannie Mae Third Quarter 20182019 Form 10-Q | 1822 |
|
| | |
| | MD&A | TotalGuaranty Book of Business |
Guaranty Book of Business
Our “guaranty book of business” consists of:
Fannie Mae MBS outstanding, excluding the portions of any structured securities we issue that are backed by Freddie Mac securities;
mortgage loans of Fannie Mae held in our retained mortgage portfolio; and
other credit enhancements that we provide on mortgage assets.
“Total Fannie Mae guarantees” consists of:
our guaranty book of business; and
the portions of any structured securities we issue that are backed by Freddie Mac securities.
When we resecuritize Freddie Mac securities into Fannie Mae-issued structured securities, our guaranty of principal and interest extends to the underlying Freddie Mac securities. However, Freddie Mac continues to guaranty the payment of principal and interest on the underlying Freddie Mac securities that we have resecuritized. We do not charge an incremental guaranty fee to include Freddie Mac securities in the structured securities that we issue.
The table below displays the composition of our totalguaranty book of business based on unpaid principal balance. Our single-family guaranty book of business accounted for 91%90% of our totalguaranty book of business as of September 30, 20182019 and December 31, 2017. While our total book91% of business includes all of our mortgage-related assets, both on- and off-balance sheet, our guaranty book of business excludes non-Fannie Mae mortgage-related securities held in our retained mortgage portfolio for which we do not provide a guaranty.as of December 31, 2018.
|
| | | | | | | | | | | | | | | | | | | | | | | |
| Composition of Total Book of Business |
| | As of |
| | September 30, 2018 | | December 31, 2017 |
| | Single-Family | | Multifamily | | Total | | Single-Family | | Multifamily | | Total |
| | (Dollars in millions) |
Guaranty book of business(1) | $ | 2,955,925 |
| | $ | 299,817 |
| | $ | 3,255,742 |
| | $ | 2,931,356 |
| | $ | 280,502 |
| | $ | 3,211,858 |
|
Non-Fannie Mae mortgage securities(2) | 6,924 |
| | 402 |
| | 7,326 |
| | 4,005 |
| | 621 |
| | 4,626 |
|
| Total book of business | $ | 2,962,849 |
| | $ | 300,219 |
| | $ | 3,263,068 |
| | $ | 2,935,361 |
| | $ | 281,123 |
| | $ | 3,216,484 |
|
| Guaranty Book of Business Detail: | | | | | | | | | | | |
Conventional guaranty book of business(3) | $ | 2,920,132 |
| | $ | 298,589 |
| | $ | 3,218,721 |
| | $ | 2,890,908 |
| | $ | 279,235 |
| | $ | 3,170,143 |
|
Government guaranty book of business(4) | $ | 35,793 |
| | $ | 1,228 |
| | $ | 37,021 |
| | $ | 40,448 |
| | $ | 1,267 |
| | $ | 41,715 |
|
__________ |
| | | | | | | | | | | | | | | | | | | | | | | | |
Composition of Fannie Mae Guaranty Book of Business(1)
|
| | | As of |
| | | September 30, 2019 | | December 31, 2018 |
| | | Single-Family | | Multifamily | | Total | | Single-Family | | Multifamily | | Total |
| | | (Dollars in millions) |
Conventional guaranty book of business(2) | | $ | 2,989,312 |
| | $ | 333,030 |
| | $ | 3,322,342 |
| | $ | 2,925,246 |
| | $ | 308,543 |
| | $ | 3,233,789 |
|
Government guaranty book of business(3) | | 29,311 |
| | 1,157 |
| | 30,468 |
| | 34,158 |
| | 1,205 |
| | 35,363 |
|
| Guaranty book of business | | 3,018,623 |
| | 334,187 |
| | 3,352,810 |
| | 2,959,404 |
| | 309,748 |
| | 3,269,152 |
|
| | | | | | | | | | | | | |
Freddie Mac securities guaranteed by Fannie Mae(4) | | 28,942 |
| | — |
| | 28,942 |
| | — |
| | — |
| | — |
|
| Total Fannie Mae guarantees | | $ | 3,047,565 |
| | $ | 334,187 |
| | $ | 3,381,752 |
| | $ | 2,959,404 |
| | $ | 309,748 |
| | $ | 3,269,152 |
|
| |
(1) | Includes other single-family Fannie Mae guaranty arrangements of $1.6$1.4 billion and $1.8$1.6 billion as of September 30, 20182019 and December 31, 2017,2018, respectively, and other multifamily Fannie Mae guaranty arrangements of $12.4$11.6 billion and $12.3 billion as of September 30, 20182019 and December 31, 2017.2018, respectively. The unpaid principal balance of resecuritized Fannie Mae MBS is included only once in the reported amount. |
| |
(2) | Includes mortgage-related securities issued by Freddie Mac and Ginnie Mae, mortgage revenue bonds, Alt-A and subprime private-label securities, and CMBS. |
| |
(3)
| Refers to mortgage loans and mortgage-related securities that are not guaranteed or insured, in whole or in part, by the U.S. government or one of its agencies.government. |
| |
(4)(3)
| Refers to mortgage loans and mortgage-related securities guaranteed or insured, in whole or in part, by the U.S. governmentgovernment. |
| |
(4) | Consists of approximately (i) $23.0 billion in unpaid principal balance of Freddie Mac-issued UMBS backing Fannie Mae-issued Supers; and (ii) $5.9 billion in unpaid principal balance of Freddie Mac securities backing Fannie Mae-issued REMICs, a portion of which may be backed in whole or one of its agencies.in part by Fannie Mae MBS. Therefore, our total exposure to Freddie Mac securities included in Fannie Mae REMIC collateral may be lower. |
The Federal Housing Enterprises Financial Safety and Soundness Act of 1992, as amended, including by the Federal Housing Finance Regulatory Reform Act of 2008 (together, the “GSE Act”), requires us to set aside each year an amount equal to 4.2 basis points for each dollar of the unpaid principal balance of our total new business purchases and to pay this amount to specified U.S. Department of Housing and Urban Development (“HUD”)HUD and Treasury funds. New business purchases consist of single-family and multifamily mortgage loans purchased during the period and single-family and multifamily mortgage loans underlying Fannie Mae MBS issued during the period pursuant to lender swaps. In February 2018,April 2019, we paid $239$215 million to the funds based on our new business purchases in 2017. Our new business purchases were $389.5 billion for2018. For the first nine months of 2018. Accordingly,2019, we recognized an expense of $163$193 million related to this obligation forbased on our $460.0 billion in new business purchases during the first nine months of 2018.period. We expect to pay this amount to the funds in 2020, plus additional amounts to be accrued based on our new business purchases in the fourth quarter of 2018, to the funds on or before March 1, 2019. See “Business—“MD&A—Legislation and Regulation—GSE Act and Other Regulation of Our Business—Affordable Housing Allocations” in our 2017First Quarter 2019 Form 10-K10-Q for more information regarding this obligation.
|
| | |
Fannie Mae Third Quarter 20182019 Form 10-Q | 1923 |
Business Segments
We have two reportable business segments: Single-Family and Multifamily. The Single-Family business operates in the secondary mortgage market relating to single-family mortgage loans, which are secured by properties containing four or fewer residential dwelling units, which are referred to as single-family mortgage loans.units. The Multifamily business operates in the secondary mortgage market relating primarily to multifamily mortgage loans, which are secured by properties containing five or more residential units, which are referred to as multifamily mortgage loans.units.
The chart below displays the net revenues and net income for each of our business segments for the first nine months of 2018 compared with the first nine months of 2017.2019. Net revenues consist of net interest income and fee and other income.
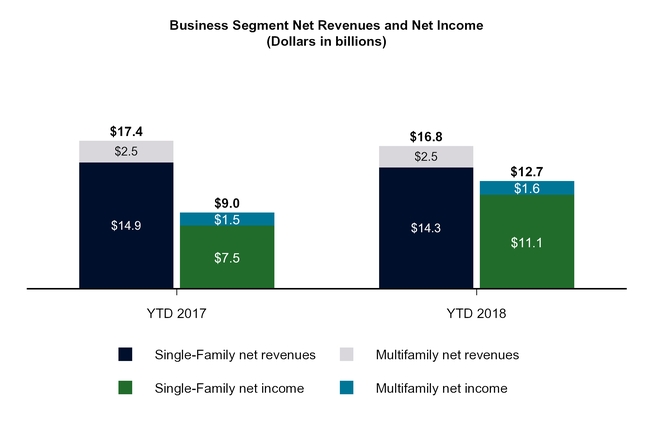
This section describes(Dollars in billions)
Segment Allocation Methodology
The majority of our revenues and expenses are directly associated with either our single-family or our multifamily business segment and are included in determining that segment’s operating results. Other revenues and expenses, including administrative expenses, that are not directly attributable to a particular business segment are allocated based on the size of each segment’s guaranty book of business. The substantial majority of the gains and losses associated with our risk management derivatives are allocated to our single-family business and creditsegment.
In the following sections, we describe each segment’s business metrics and financial results. For further discussion of our Single-FamilyWe also describe how each segment manages mortgage credit risk and Multifamily business segments, including each segment’s primary business activities and customers, see “MD&A—Business Segments” in our 2017 Form 10-K.its credit metrics.
Single-Family Business
Working with our lender customers, our Single-Family Mortgage Marketbusiness provides liquidity to the mortgage market primarily by acquiring single-family loans from lenders and securitizing those loans into Fannie Mae MBS, which are either delivered to the lenders or sold to investors or dealers. A single-family loan is secured by a property with four or fewer residential units.
Housing activity declinedThis section supplements and updates information regarding our Single-Family business segment in our 2018 Form 10-K. See “MD&A—Single-Family Business” in our 2018 Form 10-K for additional information regarding the primary business activities, customers and competition of our Single-Family business.
Presentation of our single-family guaranty book of business
For purposes of the information reported in this “Single-Family Business” section, we measure the single-family guaranty book of business by using the unpaid principal balance of our mortgage loans underlying Fannie Mae MBS outstanding. By contrast, the single-family guaranty book of business presented in the third quarter“Composition of 2018 compared with the second quarterFannie Mae Guaranty Book of 2018. Total existing home sales averaged 5.3 million units annualizedBusiness” table in the third quarter“Guaranty Book of 2018, compared with 5.4 million units inBusiness” section is based on the second quarterunpaid principal balance of 2018, according to data from the National AssociationFannie Mae MBS outstanding, rather than the unpaid principal balance of REALTORS®. Accordingthe underlying mortgage loans. These amounts differ primarily as a result of payments we receive on underlying loans that have not yet been remitted to the U.S. Census Bureau, newMBS holders. As measured for purposes of the information reported below, our single-family home sales decreased during the third quarterconventional guaranty book of 2018, averaging an annualized ratebusiness was $2,940 billion as of 580,000 units, compared with 633,000 units in the second quarterSeptember 30, 2019 and $2,903 billion as of December 31, 2018.
The 30-year fixed mortgage rate averaged 4.72% during the week ended September 28, 2018, compared with 4.55% during the week ended June 30, 2018, according to Freddie Mac’s Primary Mortgage Market Survey®. The single-family mortgage market continued to experience a shift to a purchase mortgage market, as the share of refinance originations in the third quarter of 2018 fell to the lowest level since the third quarter of 2000.
We forecast that total originations in the U.S. single-family mortgage market in 2018 will decrease from 2017 levels by approximately 10.5%, from an estimated $1.83 trillion in 2017 to $1.64 trillion in 2018, and that the
|
| | |
Fannie Mae Third Quarter 20182019 Form 10-Q | 20 |
amount of originations in the U.S. single-family mortgage market that are refinancings will decrease from an estimated $650 billion in 2017 to $454 billion in 2018.
Single-Family Market Share
The chart below displays our estimated market share of single-family mortgage-related securities issuances in the third quarter of 2018 as compared with that of our primary competitors for the issuance of single-family mortgage-related securities.
We estimate our market share of single-family mortgage-related securities issuances was 40% in the third quarter of 2018, compared with 36% in the second quarter of 2018 and 39% in the third quarter of 2017.
|
| | |
Fannie Mae Third Quarter 2018 Form 10-Q | 2124 |
|
| | |
| | MD&A | Single-Family Business Segments |
Single-Family Business MetricsMarket Share
Single-familySingle-Family Mortgage Acquisition Market Share
Our share of the single-family acquisition market, including loans held on lenders’ books, may fluctuate from period to period. We currently estimate our single-family acquisition market share in the last three years remained within the range of 24% to 30%, supporting approximately one in four single-family mortgage loans. Our market share estimate is based on publicly available data regarding the amount of single-family first-lien mortgage loans originated and our competitors’ acquisitions. Our single-family acquisitions were $194.3 billion for the third quarter of 2019, compared with $122.3 billion for the third quarter of 2018.
Single-Family Mortgage-Related Securities Issuances Market Share
Our single-family Fannie Mae MBS outstanding increasedissuances were $188.5 billion for the third quarter of 2019, compared with $129.9 billion for the third quarter of 2018. The chart below displays our market share, using data available as of September 30, 2018 compared to September 30, 2017 because acquisitions during the past twelve months outpaced liquidations, which slowed as a resultpublication, of a decline in prepayments due to the rising interest rate environment.
__________
| |
(1)
| Our single-family guaranty book of business consists of (a) single-family mortgage loans of Fannie Mae, (b) single-family mortgage loans underlying Fannie Mae MBS, and (c) other credit enhancements that we provide on single-family mortgage assets, such as long-term standby commitments. It excludes non-Fannie Mae single-family mortgage-related securities held in our retained mortgage portfolio for which we do not provide a guaranty. |
Our average charged guaranty fee on newly acquired single-family loans, net of TCCA fees, increased from 47.1 basis pointsmortgage-related securities issuances in the third quarter of 2017 to 51.2 basis points2019 as compared with that of our primary competitors for the issuance of single-family mortgage-related securities.
New Single-Family Mortgage-Related Securities Issuances
Third Quarter 2019 Market Share
We estimate our market share of single-family mortgage-related securities issuances was 39% in the third quarter of 2018, primarily driven by an increase2019, compared with 35% in the total base guaranty fees charged on our 2018 acquisitions.second quarter of 2019 and 40% in the third quarter of 2018.
Average Charged Guaranty Fee on Single-Family Guaranty Book of Business andMortgage Market
Average Charged Guaranty Fee on New Single-Family AcquisitionsHousing activity rose slightly in the third quarter of 2019 compared with the second quarter of 2019. Total existing home sales averaged 5.4 million units annualized in the third quarter of 2019, compared with 5.3 million units in the second quarter of 2019, according to data from the National Association of REALTORS(1)®. According to the U.S. Census Bureau, new single-family home sales increased during the third quarter of 2019, averaging an annualized rate of 691,000 units, compared with 661,000 units in the second quarter of 2019.
__________We forecast that total originations in the U.S. single-family mortgage market in 2019 will increase from 2018 levels by approximately 15%, from an estimated $1.77 trillion in 2018 to $2.04 trillion in 2019, and that the amount of originations in the U.S. single-family mortgage market that are refinancings will increase from an estimated $532 billion in 2018 to $761 billion in 2019, as mortgage rates have declined in 2019.
|
| | |
Fannie Mae Third Quarter 20182019 Form 10-Q | 2225 |
|
| | |
| | MD&A | Single-Family Business Segments |
Single-Family Business Metrics
Net interest income from guaranty fees for our Single-Family business is driven by the guaranty fees we charge on our single-family conventional guaranty book of business and the size of our single-family conventional guaranty book of business. The guaranty fees we charge are based on the characteristics of the loans we acquire. We adjust our guaranty fees in light of market conditions and to achieve return targets, which are based on FHFA’s proposed capital framework. As a result, the average charged guaranty fee on new acquisitions may fluctuate based on the credit quality and product mix of loans acquired, as well as market conditions and other factors.
Single-Family Guaranty Fee and Book of Business Metrics
| |
(1) | Calculated based onRepresents the sum of the average guaranty fee rate for our single-family conventional guaranty arrangements during the period plus the recognition of any upfront cash payments relating to these guaranty arrangements over an estimated average life.life at the time of acquisition. For the prior period, the methodology used to estimate average life at the time of acquisition has been updated. Excludes the impact of a 10 basis point guaranty fee increase implemented pursuant to the TCCA, the incremental revenue from which is remitted to Treasury and not retained by us. |
| |
(2) | Our single-family conventional guaranty book of business consists primarily of single-family conventional mortgage loans underlying Fannie Mae MBS outstanding. It also includes single-family conventional mortgage loans of Fannie Mae held in our retained mortgage portfolio, and other credit enhancements that we provide on single-family conventional mortgage assets. Our single-family conventional guaranty book of business does not include: (a) non-Fannie Mae single-family mortgage-related securities held in our retained mortgage portfolio for which we do not provide a guaranty; (b) mortgage loans guaranteed or insured, in whole or in part, by the U.S. government; or (c) Freddie Mac-acquired mortgage loans underlying Freddie Mac-issued UMBS that we have resecuritized. |
Our average charged guaranty fee on newly acquired conventional single-family loans, net of TCCA fees, decreased from 49.7 basis points in the third quarter of 2018 to 45.9 basis points in the third quarter of 2019, primarily driven by the stronger credit profile of our newly acquired single-family loans. Under FHFA’s proposed capital requirements, loans with stronger credit profiles typically require less capital.
|
| | |
| Fannie Mae Third Quarter 2019 Form 10-Q | 26 |
|
| | |
| MD&A | Single-Family Business |
Single-Family Business Financial Results
|
| | | | | | | | | | | | | | | | | | | | | | | |
| Single-Family Business Financial Results |
| | For the Three Months Ended September 30, | | For the Nine Months Ended September 30, |
| | 2018 | | 2017 | | Variance | | 2018 | | 2017 | | Variance |
| | (Dollars in millions) |
Net interest income(1) | $ | 4,670 |
| | $ | 4,627 |
| | $ | 43 |
| | $ | 13,954 |
| | $ | 13,749 |
| | $ | 205 |
|
| Fee and other income | 79 |
| | 1,005 |
| | (926 | ) | | 306 |
| | 1,192 |
| | (886 | ) |
| Net revenues | 4,749 |
| | 5,632 |
| | (883 | ) | | 14,260 |
| | 14,941 |
| | (681 | ) |
| Investment gains, net | 146 |
| | 286 |
| | (140 | ) | | 640 |
| | 557 |
| | 83 |
|
| Fair value gains (losses), net | 417 |
| | (300 | ) | | 717 |
| | 1,729 |
| | (997 | ) | | 2,726 |
|
| Administrative expenses | (636 | ) | | (580 | ) | | (56 | ) | | (1,928 | ) | | (1,781 | ) | �� | (147 | ) |
Credit-related income (expense)(2) | 582 |
| | (294 | ) | | 876 |
| | 1,775 |
| | 1,113 |
| | 662 |
|
TCCA fees(1) | (576 | ) | | (531 | ) | | (45 | ) | | (1,698 | ) | | (1,552 | ) | | (146 | ) |
| Other expenses, net | (282 | ) | | (320 | ) | | 38 |
| | (684 | ) | | (731 | ) | | 47 |
|
| Income before federal income taxes | 4,400 |
| | 3,893 |
| | 507 |
| | 14,094 |
| | 11,550 |
| | 2,544 |
|
| Provision for federal income taxes | (938 | ) | | (1,361 | ) | | 423 |
| | (2,998 | ) | | (4,014 | ) | | 1,016 |
|
| Net income | $ | 3,462 |
| | $ | 2,532 |
| | $ | 930 |
| | $ | 11,096 |
| | $ | 7,536 |
| | $ | 3,560 |
|
__________ |
| | | | | | | | | | | | | | | | | | | | | | | | |
| | | For the Three Months Ended September 30, | | | | For the Nine Months Ended September 30, | | |
| | | 2019 | | 2018 | | Variance | | 2019 | | 2018 | | Variance |
| | | (Dollars in millions) |
Net interest income(1) | | $ | 4,484 |
| | $ | 4,670 |
| | $ | (186 | ) | | $ | 12,942 |
| | $ | 13,954 |
| | $ | (1,012 | ) |
| Fee and other income | | 156 |
| | 79 |
| | 77 |
| | 350 |
| | 306 |
| | 44 |
|
| Net revenues | | 4,640 |
| | 4,749 |
| | (109 | ) | | 13,292 |
| | 14,260 |
| | (968 | ) |
| Investment gains, net | | 198 |
| | 146 |
| | 52 |
| | 709 |
| | 640 |
| | 69 |
|
| Fair value gains (losses), net | | (719 | ) | | 417 |
| | (1,136 | ) | | (2,364 | ) | | 1,729 |
| | (4,093 | ) |
| Administrative expenses | | (634 | ) | | (636 | ) | | 2 |
| | (1,899 | ) | | (1,928 | ) | | 29 |
|
Credit-related income(2) | | 1,747 |
| | 582 |
| | 1,165 |
| | 3,391 |
| | 1,775 |
| | 1,616 |
|
TCCA fees(1) | | (613 | ) | | (576 | ) | | (37 | ) | | (1,806 | ) | | (1,698 | ) | | (108 | ) |
| Other expenses, net | | (424 | ) | | (282 | ) | | (142 | ) | | (1,179 | ) | | (684 | ) | | (495 | ) |
| Income before federal income taxes | | 4,195 |
| | 4,400 |
| | (205 | ) | | 10,144 |
| | 14,094 |
| | (3,950 | ) |
| Provision for federal income taxes | | (872 | ) | | (938 | ) | | 66 |
| | (2,125 | ) | | (2,998 | ) | | 873 |
|
| Net income | | $ | 3,323 |
| | $ | 3,462 |
| | $ | (139 | ) | | $ | 8,019 |
| | $ | 11,096 |
| | $ | (3,077 | ) |
| |
(1) | Reflects the impact of a 10 basis point guaranty fee increase implemented pursuant to the TCCA, the incremental revenue from which is remitted to Treasury. The resulting revenue is included in net interest income and the expense is recognized as “TCCA fees.” |
| |
(2) | Consists of the benefit (provision)or provision for credit losses and foreclosed property income or expense. |
Net interest income
Single-family net interest income increaseddecreased in the third quarter and first nine months of 2019 compared with the third quarter and first nine months of 2018, primarily due to a decline in net interest income from portfolios and a decline in net amortization income, partially offset by an increase in single-family base guaranty fee income. The drivers of net interest income for the single-family segment for the third quarter and first nine months of 2019 are consistent with the drivers of net interest income in our condensed consolidated statements of operations and comprehensive income, which we discuss in “Consolidated Results of Operations—Net Interest Income.”
Fair value gains (losses), net
Fair value losses in the third quarter and first nine months of 2019 were primarily driven by decreases in the fair value of our pay-fixed risk management derivatives, partially offset by increases in the fair value of our receive-fixed risk management derivatives, and decreases in the fair value of our mortgage commitments. In addition, increases in the fair value of our debt also resulted in fair value losses for the third quarter and first nine months of 2019. Conversely, fair value gains in the third quarter and first nine months of 2018 compared withwere primarily driven by increases in the third quarterfair value of our mortgage commitments derivatives and first nine months of 2017. our pay-fixed risk management derivatives.
The drivers of our fair value gains (losses), net interest income for the single-family segment for all periods presented are consistent with the drivers of fair value gains (losses), net interest income reported in our condensed consolidated statements of operations and comprehensive income, for the same periods, which we discuss in “Consolidated Results of Operations—Net Interest Income.Fair Value Gains (Losses), Net.”
FeeCredit-related income
Credit-related income in the third quarter and otherfirst nine months of 2019 was primarily driven by the redesignation of certain single-family loans from HFI to HFS; the enhancement to the model, including the incorporation of recent loan performance data used to estimate cash flows for individually impaired single-family loans; an increase in actual and forecasted home prices; lower actual and projected mortgage interest rates; and changes in loan activity related to loan liquidations.
Credit-related income
Fee and other income decreased in the third quarter and first nine months of 2018 compared withwas primarily driven by the third quarterredesignation of certain reperforming and first nine monthsnonperforming single-family loans from HFI to HFS and an increase in actual home prices. These factors were partially offset by the impact of 2017 primarily due to $975 million of incomehigher actual and projected mortgage interest rates in the third quarter of 2017 resulting from a settlement agreement resolving legal claims related to private-label securities we purchased.periods.
Fair value gains (losses), net
We recognized fair value gains in the third quarter and first nine months of 2018, a shift from fair value losses recognized in the third quarter and first nine months of 2017. The drivers of fair value gains and losses for the single-family segment for all the periods presented are consistent with the drivers of fair value gains and losses reported in our condensed consolidated statements of operations and comprehensive income for the same periods, which we discuss inSee “Consolidated Results of Operations—Fair Value Gains (Losses), Net.”
Credit-related income (expense)
We recognizedCredit-Related Income” in this report for more information on our credit-related income in the third quarter of 2018, a shift from credit-related expense in the third quarter of 2017. We recognized higher credit-related income in the first nine months of 2018 compared with the first nine months of 2017. The drivers of credit-related income and expense for the single-family segment for allincome.
|
| | |
Fannie Mae Third Quarter 20182019 Form 10-Q | 2327 |
|
| | |
| | MD&A | Single-Family Business Segments |
periods presentedOther expenses, net
Other expenses, net increased in the third quarter and first nine months of 2019 compared with the third quarter and first nine months of 2018, primarily due to an increase in credit enhancement costs resulting from higher outstanding volumes of loans covered by a credit risk transfer transaction. The drivers of other expenses, net for the single-family segment for the third quarter and first nine months of 2019 are consistent with the drivers of credit-related income and expense reporteddiscussed in our condensed consolidated statements of operations and comprehensive income, for the same periods. Wewhich we discuss our credit-related income and expense in “Consolidated Results of Operations—Credit-Related Income (Expense).Other Expenses, Net.”
Single-Family Mortgage Credit Risk Management
This section updates our discussion of single-family mortgage credit risk management in our 20172018 Form 10-K in “MD&A—Business Segments—Single-Family Business—Single-Family Mortgage Credit Risk Management.”
Single-Family Acquisition and Servicing Policies and Underwriting and Servicing Standards
10-K. For information on our acquisition and servicing policies, underwriting and servicing standards, quality control process, repurchase requests, and representation and warranty framework, see “MD&A—Business Segments—Single-Family Business—Single-Family Mortgage Credit Risk Management—Single-Family Acquisition and Servicing Policies and Underwriting and Servicing Standards”Management” in our 20172018 Form 10-K.
|
| | |
Fannie Mae Third Quarter 2018 Form 10-Q | 24 |
Single-Family Portfolio Diversification and Monitoring
For information onThe profile of our single-family conventional guaranty book of business includes the following key loan attributes, see “MD&A—Business Segments—Single-Family Business—Single-Family Mortgage Credit Risk Management—Single-Family Portfolio Diversification and Monitoring” in our 2017 Form 10-K. risk characteristics:
| |
| • | Loan-to-value ratio. Loan-to-value (“LTV”) ratio is a strong predictor of credit performance. The likelihood of default and the gross severity of a loss in the event of default are typically lower as the LTV ratio decreases. This also applies to the estimated mark-to-market LTV ratios, particularly those over 100%, as this indicates that the borrower’s mortgage balance exceeds the property value. |
| |
| • | Product type. Certain loan product types have features that may result in increased risk. Generally, intermediate-term, fixed-rate mortgages exhibit the lowest default rates, followed by long-term, fixed-rate mortgages. Historically, adjustable-rate mortgages (“ARMs”), including negative-amortizing and interest-only loans, and balloon/reset mortgages have exhibited higher default rates than fixed-rate mortgages, partly because the borrower’s payments rose, within limits, as interest rates changed. |
| |
| • | Number of units. Mortgages on one-unit properties tend to have lower credit risk than mortgages on two-, three- or four-unit properties. |
| |
| • | Property type. Certain property types have a higher risk of default. For example, condominiums generally are considered to have higher credit risk than single-family detached properties. |
| |
| • | Occupancy type. Mortgages on properties occupied by the borrower as a primary or secondary residence tend to have lower credit risk than mortgages on investment properties. |
| |
| • | Credit score. Credit score is a measure often used by the financial services industry, including us, to assess borrower credit quality and the likelihood that a borrower will repay future obligations as expected. A higher credit score typically indicates lower credit risk. |
| |
| • | Debt-to-income ratio. Debt-to-income (“DTI”) ratio refers to the ratio of a borrower’s outstanding debt obligations (including both mortgage debt and certain other long-term and significant short-term debts) to that borrower’s reported or calculated monthly income, to the extent the income is used to qualify for the mortgage. As a borrower’s DTI ratio increases, the associated risk of default on the loan generally increases, especially if other higher-risk factors are present. From time to time, we revise our guidelines for determining a borrower’s DTI ratio. The amount of income reported by a borrower and used to qualify for a mortgage may not represent the borrower’s total income; therefore, the DTI ratios we report may be higher than borrowers’ actual DTI ratios. |
| |
| • | Loan purpose. Loan purpose refers to how the borrower intends to use the funds from a mortgage loan—either for a home purchase or refinancing of an existing mortgage. Cash-out refinancings have a higher risk of default than either mortgage loans used for the purchase of a property or other refinancings that restrict the amount of cash returned to the borrower. |
| |
| • | Geographic concentration. Local economic conditions affect borrowers’ ability to repay loans and the value of collateral underlying loans. Geographic diversification reduces mortgage credit risk. |
| |
| • | Loan age. We monitor year of origination and loan age, which is defined as the number of years since origination. Credit losses on mortgage loans typically do not peak until the third through sixth year following origination; however, this range can vary based on many factors, including changes in macroeconomic conditions and foreclosure timelines. |
The table below displays our single-family conventional business volumes and our single-family conventional guaranty book of business, based on certain key risk characteristics that we use to evaluate the risk profile and credit quality of our single-family loans.
|
| | | | | | | | | | | | | | | | | | | | | | | | | | | |
Risk Characteristics of Single-Family Conventional Business Volume and Guaranty Book of Business(1) |
| | Percent of Single-Family Conventional Business Volume at Acquisition(2) | Percent of Single-Family Conventional Guaranty Book of Business(3) As of |
| | For the Three Months Ended September 30, | | For the Nine Months Ended September 30, | |
| | 2018 | | 2017 | | 2018 | | 2017 | | September 30, 2018 | | December 31, 2017 |
Original loan-to-value (“LTV”) ratio:(4) | | | | | | | | | | | | | | | |
| <= 60% | 14 |
| % | 16 |
| % | 16 |
| % | 18 |
| % | | 20 |
| % | | | 20 |
| % |
| 60.01% to 70% | 11 |
| | 12 |
| | 12 |
| | 13 |
| | | 13 |
| | | | 14 |
| |
| 70.01% to 80% | 37 |
| | 39 |
| | 37 |
| | 39 |
| | | 38 |
| | | | 38 |
| |
| 80.01% to 90% | 14 |
| | 13 |
| | 13 |
| | 12 |
| | | 11 |
| | | | 11 |
| |
| 90.01% to 95% | 16 |
| | 15 |
| | 15 |
| | 14 |
| | | 11 |
| | | | 10 |
| |
| 95.01% to 100% | 8 |
| | 5 |
| | 7 |
| | 4 |
| | | 4 |
| | | | 4 |
| |
| Greater than 100% | * |
| | * |
| | * |
| | * |
| | | 3 |
| | | | 3 |
| |
| Total | 100 |
| % | 100 |
| % | 100 |
| % | 100 |
| % | | 100 |
| % | | | 100 |
| % |
| Weighted average | 78 |
| % | 76 |
| % | 77 |
| % | 75 |
| % | | 75 |
| % | | | 75 |
| % |
| Average loan amount | $ | 235,125 |
| | $ | 228,445 |
| | $ | 233,027 |
| | $ | 225,123 |
| | | $ | 169,600 |
| | | | $ | 166,643 |
| |
Estimated mark-to-market LTV ratio:(5) | | | | | | | | | | | | | | | |
| <= 60% | | | | | | | | | | 56 |
| % | | | 52 |
| % |
| 60.01% to 70% | | | | | | | | | | 18 |
| | | | 18 |
| |
| 70.01% to 80% | | | | | | | | | | 15 |
| | | | 17 |
| |
| 80.01% to 90% | | | | | | | | | | 7 |
| | | | 8 |
| |
| 90.01% to 100% | | | | | | | | | | 3 |
| | | | 4 |
| |
| Greater than 100% | | | | | | | | | | 1 |
| | | | 1 |
| |
| Total | | | | | | | | | | 100 |
| % | | | 100 |
| % |
| Weighted average | | | | | | | | | | 56 |
| % | | | 58 |
| % |
| Product type: | | | | | | | | | | | | | | | |
Fixed-rate:(6) | | | | | | | | | | | | | | | |
| Long-term | 91 |
| % | 85 |
| % | 89 |
| % | 83 |
| % | | 82 |
| % | | | 80 |
| % |
| Intermediate-term | 7 |
| | 12 |
| | 9 |
| | 14 |
| | | 14 |
| | | | 15 |
| |
| Total fixed-rate | 98 |
| | 97 |
| | 98 |
| | 97 |
| | | 96 |
| | | | 95 |
| |
| Adjustable-rate | 2 |
| | 3 |
| | 2 |
| | 3 |
| | | 4 |
| | | | 5 |
| |
| Total | 100 |
| % | 100 |
| % | 100 |
| % | 100 |
| % | | 100 |
| % | | | 100 |
| % |
| Number of property units: | | | | | | | | | | | | | | | |
| 1 unit | 98 |
| % | 98 |
| % | 98 |
| % | 97 |
| % | | 97 |
| % | | | 97 |
| % |
| 2 to 4 units | 2 |
| | 2 |
| | 2 |
| | 3 |
| | | 3 |
| | | | 3 |
| |
| Total | 100 |
| % | 100 |
| % | 100 |
| % | 100 |
| % | | 100 |
| % | | | 100 |
| % |
|
| | |
Fannie Mae Third Quarter 20182019 Form 10-Q | 2528 |
|
| | |
| | MD&A | Single-Family Business Segments |
We provide additional information on the credit characteristics of our single-family loans in quarterly financial supplements, which we submit to the SEC with current reports on Form 8-K. Information in our quarterly financial supplements is not incorporated by reference into this report. |
| | | | | | | | | | | | | | | | | | | | | | | | | | | |
Key Risk Characteristics of Single-Family Conventional Business Volume and Guaranty Book of Business(1) |
| | | Percent of Single-Family Conventional Business Volume at Acquisition(2) | Percent of Single-Family Conventional Guaranty Book of Business(3) As of |
| | | For the Three Months Ended September 30, | | For the Nine Months Ended September 30, | |
| | | 2019 | | 2018 | | 2019 | | 2018 | | | September 30, 2019 | | | December 31, 2018 | |
Original LTV ratio:(4) | | | | | | | | | | | | | | | |
| <= 60% | | 16 |
| % | 14 |
| % | 16 |
| % | 16 |
| % | | 19 |
| % | | 19 |
| % |
| 60.01% to 70% | | 12 |
| | 11 |
| | 12 |
| | 12 |
| | | 13 |
| | | 13 |
| |
| 70.01% to 80% | | 38 |
| | 37 |
| | 37 |
| | 37 |
| | | 37 |
| | | 38 |
| |
| 80.01% to 90% | | 13 |
| | 14 |
| | 13 |
| | 13 |
| | | 12 |
| | | 12 |
| |
| 90.01% to 95% | | 14 |
| | 16 |
| | 14 |
| | 15 |
| | | 12 |
| | | 11 |
| |
| 95.01% to 100% | | 7 |
| | 8 |
| | 8 |
| | 7 |
| | | 5 |
| | | 4 |
| |
| Greater than 100% | | — |
| | * |
| | * |
| | * |
| | | 2 |
| | | 3 |
| |
| Total | | 100 |
| % | 100 |
| % | 100 |
| % | 100 |
| % | | 100 |
| % | | 100 |
| % |
| Weighted average | | 77 |
| % | 78 |
| % | 77 |
| % | 77 |
| % | | 76 |
| % | | 75 |
| % |
| Average loan amount | | $ | 269,204 |
| | $ | 235,125 |
| | $ | 255,909 |
| | $ | 233,027 |
| | | $ | 172,566 |
| | | $ | 170,076 |
| |
Estimated mark-to-market LTV ratio:(5) | | | | | | | | | | | | | | | |
| <= 60% | | | | | | | | | | | 55 |
| % | | 54 |
| % |
| 60.01% to 70% | | | | | | | | | | | 17 |
| | | 18 |
| |
| 70.01% to 80% | | | | | | | | | | | 16 |
| | | 16 |
| |
| 80.01% to 90% | | | | | | | | | | | 8 |
| | | 8 |
| |
| 90.01% to 100% | | | | | | | | | | | 4 |
| | | 4 |
| |
| Greater than 100% | | | | | | | | | | | * |
| | | * |
| |
| Total | | | | | | | | | | | 100 |
| % | | 100 |
| % |
| Weighted average | | | | | | | | | | | 56 |
| % | | 57 |
| % |
| Product type: | | | | | | | | | | | | | | | |
Fixed-rate:(6) | | | | | | | | | | | | | | | |
| Long-term | | 90 |
| % | 91 |
| % | 90 |
| % | 89 |
| % | | 85 |
| % | | 84 |
| % |
| Intermediate-term | | 10 |
| | 7 |
| | 9 |
| | 9 |
| | | 13 |
| | | 14 |
| |
| Total fixed-rate | | 100 |
| | 98 |
| | 99 |
| | 98 |
| | | 98 |
| | | 98 |
| |
| Adjustable-rate | | * |
| | 2 |
| | 1 |
| | 2 |
| | | 2 |
| | | 2 |
| |
| Total | | 100 |
| % | 100 |
| % | 100 |
| % | 100 |
| % | | 100 |
| % | | 100 |
| % |
| Number of property units: | | | | | | | | | | | | | | | |
| 1 unit | | 98 |
| % | 98 |
| % | 98 |
| % | 98 |
| % | | 97 |
| % | | 97 |
| % |
| 2 to 4 units | | 2 |
| | 2 |
| | 2 |
| | 2 |
| | | 3 |
| | | 3 |
| |
| Total | | 100 |
| % | 100 |
| % | 100 |
| % | 100 |
| % | | 100 |
| % | | 100 |
| % |
| Property type: | | | | | | | | | | | | | | | |
| Single-family homes | | 91 |
| % | 90 |
| % | 91 |
| % | 90 |
| % | | 91 |
| % | | 91 |
| % |
| Condo/Co-op | | 9 |
| | 10 |
| | 9 |
| | 10 |
| | | 9 |
| | | 9 |
| |
| Total | | 100 |
| % | 100 |
| % | 100 |
| % | 100 |
| % | | 100 |
| % | | 100 |
| % |
|
| | |
| Fannie Mae Third Quarter 2019 Form 10-Q | 29 |
|
| | |
| MD&A | Single-Family Business |
|
| | | | | | | | | | | | | | | | | | | | | |
| | Percent of Single-Family Conventional Business Volume at Acquisition(2) | Percent of Single-Family Conventional Guaranty Book of Business(3) As of |
| | For the Three Months Ended September 30, | | For the Nine Months Ended September 30, | |
| | 2018 | | 2017 | | 2018 | | 2017 | | September 30, 2018 | | December 31, 2017 |
| Property type: | | | | | | | | | | | | | | | |
| Single-family homes | 90 |
| % | 90 |
| % | 90 |
| % | 90 |
| % | | 91 |
| % | | | 91 |
| % |
| Condo/Co-op | 10 |
| | 10 |
| | 10 |
| | 10 |
| | | 9 |
| | | | 9 |
| |
| Total | 100 |
| % | 100 |
| % | 100 |
| % | 100 |
| % | | 100 |
| % | | | 100 |
| % |
| Occupancy type: | | | | | | | | | | | | | | | |
| Primary residence | 89 |
| % | 89 |
| % | 89 |
| % | 89 |
| % | | 89 |
| % | | | 89 |
| % |
| Second/vacation home | 4 |
| | 4 |
| | 4 |
| | 4 |
| | | 4 |
| | | | 4 |
| |
| Investor | 7 |
| | 7 |
| | 7 |
| | 7 |
| | | 7 |
| | | | 7 |
| |
| Total | 100 |
| % | 100 |
| % | 100 |
| % | 100 |
| % | | 100 |
| % | | | 100 |
| % |
| FICO credit score at origination: | | | | | | | | | | | | | | | |
| < 620 | * |
| % | * |
| % | * |
| % | * |
| % | | 2 |
| % | | | 2 |
| % |
| 620 to < 660 | 6 |
| | 5 |
| | 6 |
| | 5 |
| | | 5 |
| | | | 5 |
| |
| 660 to < 700 | 14 |
| | 13 |
| | 14 |
| | 13 |
| | | 12 |
| | | | 12 |
| |
| 700 to < 740 | 23 |
| | 23 |
| | 23 |
| | 23 |
| | | 20 |
| | | | 20 |
| |
| >= 740 | 57 |
| | 59 |
| | 57 |
| | 59 |
| | | 61 |
| | | | 61 |
| |
| Total | 100 |
| % | 100 |
| % | 100 |
| % | 100 |
| % | | 100 |
| % | | | 100 |
| % |
| Weighted average | 743 |
| | 745 |
| | 743 |
| | 745 |
| | | 745 |
| | | | 745 |
| |
Loan purpose: | | | | | | | | | | | | | | | |
| Purchase | 72 |
| % | 63 |
| % | 64 |
| % | 56 |
| % | | 42 |
| % | | | 39 |
| % |
| Cash-out refinance | 19 |
| | 19 |
| | 22 |
| | 21 |
| | | 20 |
| | | | 20 |
| |
| Other refinance | 9 |
| | 18 |
| | 14 |
| | 23 |
| | | 38 |
| | | | 41 |
| |
| Total | 100 |
| % | 100 |
| % | 100 |
| % | 100 |
| % | | 100 |
| % | | | 100 |
| % |
Geographic concentration:(7) | | | | | | | | | | | | | | | |
| Midwest | 15 |
| % | 15 |
| % | 14 |
| % | 14 |
| % | | 15 |
| % | | | 15 |
| % |
| Northeast | 14 |
| | 14 |
| | 13 |
| | 14 |
| | | 17 |
| | | | 18 |
| |
| Southeast | 23 |
| | 23 |
| | 23 |
| | 23 |
| | | 22 |
| | | | 22 |
| |
| Southwest | 21 |
| | 20 |
| | 21 |
| | 20 |
| | | 18 |
| | | | 17 |
| |
| West | 27 |
| | 28 |
| | 29 |
| | 29 |
| | | 28 |
| | | | 28 |
| |
| Total | 100 |
| % | 100 |
| % | 100 |
| % | 100 |
| % | | 100 |
| % | | | 100 |
| % |
| Origination year: | | | | | | | | | | | | | | | |
| 2012 and prior | | | | | | | | | | 31 |
| % | | | 36 |
| % |
| 2013 | | | | | | | | | | 11 |
| | | | 12 |
| |
| 2014 | | | | | | | | | | 6 |
| | | | 7 |
| |
| 2015 | | | | | | | | | | 10 |
| | | | 12 |
| |
| 2016 | | | | | | | | | | 17 |
| | | | 18 |
| |
| 2017 | | | | | | | | | | 15 |
| | | | 15 |
| |
| 2018 | | | | | | | | | | 10 |
| | | | — |
| |
| Total | | | | | | | | | | 100 |
| % | | | 100 |
| % |
__________ |
| | | | | | | | | | | | | | | | | | | | | |
| | | Percent of Single-Family Conventional Business Volume at Acquisition(2) | Percent of Single-Family Conventional Guaranty Book of Business(3) As of |
| | | For the Three Months Ended September 30, | | For the Nine Months Ended September 30, | |
| | | 2019 | | 2018 | | 2019 | | 2018 | | | September 30, 2019 | | | December 31, 2018 | |
| Occupancy type: | | | | | | | | | | | | | | | |
| Primary residence | | 93 |
| % | 89 |
| % | 91 |
| % | 89 |
| % | | 89 |
| % | | 89 |
| % |
| Second/vacation home | | 3 |
| | 4 |
| | 4 |
| | 4 |
| | | 4 |
| | | 4 |
| |
| Investor | | 4 |
| | 7 |
| | 5 |
| | 7 |
| | | 7 |
| | | 7 |
| |
| Total | | 100 |
| % | 100 |
| % | 100 |
| % | 100 |
| % | | 100 |
| % | | 100 |
| % |
| FICO credit score at origination: | | | | | | | | | | | | | | | |
| < 620 | | * |
| % | * |
| % | * |
| % | * |
| % | | 1 |
| % | | 2 |
| % |
| 620 to < 660 | | 3 |
| | 6 |
| | 4 |
| | 6 |
| | | 5 |
| | | 5 |
| |
| 660 to < 680 | | 3 |
| | 5 |
| | 4 |
| | 5 |
| | | 5 |
| | | 5 |
| |
| 680 to < 700 | | 7 |
| | 9 |
| | 8 |
| | 9 |
| | | 7 |
| | | 7 |
| |
| 700 to < 740 | | 22 |
| | 23 |
| | 23 |
| | 23 |
| | | 21 |
| | | 20 |
| |
| >= 740 | | 65 |
| | 57 |
| | 61 |
| | 57 |
| | | 61 |
| | | 61 |
| |
| Total | | 100 |
| % | 100 |
| % | 100 |
| % | 100 |
| % | | 100 |
| % | | 100 |
| % |
| Weighted average | | 751 |
| | 743 |
| | 747 |
| | 743 |
| | | 746 |
| | | 746 |
| |
DTI ratio at origination:(7) | | | | | | | | | | | | | | | |
| <= 43% | | 74 |
| % | 66 |
| % | 71 |
| % | 66 |
| % | | 76 |
| % | | 77 |
| % |
| 43.01% to 45% | | 9 |
| | 9 |
| | 9 |
| | 9 |
| | | 9 |
| | | 9 |
| |
| Greater than 45% | | 17 |
| | 25 |
| | 20 |
| | 25 |
| | | 15 |
| | | 14 |
| |
| Total | | 100 |
| % | 100 |
| % | 100 |
| % | 100 |
| % | | 100 |
| % | | 100 |
| % |
| Weighted average | | 36 |
| % | 38 |
| % | 36 |
| % | 37 |
| % | | 35 |
| % | | 35 |
| % |
Loan purpose: | | | | | | | | | | | | | | | |
| Purchase | | 54 |
| % | 72 |
| % | 59 |
| % | 64 |
| % | | 45 |
| % | | 43 |
| % |
| Cash-out refinance | | 18 |
| | 19 |
| | 19 |
| | 22 |
| | | 19 |
| | | 20 |
| |
| Other refinance | | 28 |
| | 9 |
| | 22 |
| | 14 |
| | | 36 |
| | | 37 |
| |
| Total | | 100 |
| % | 100 |
| % | 100 |
| % | 100 |
| % | | 100 |
| % | | 100 |
| % |
Geographic concentration:(8) | | | | | | | | | | | | | | | |
| Midwest | | 14 |
| % | 15 |
| % | 14 |
| % | 14 |
| % | | 15 |
| % | | 15 |
| % |
| Northeast | | 14 |
| | 14 |
| | 14 |
| | 13 |
| | | 17 |
| | | 17 |
| |
| Southeast | | 21 |
| | 23 |
| | 22 |
| | 23 |
| | | 22 |
| | | 22 |
| |
| Southwest | | 20 |
| | 21 |
| | 21 |
| | 21 |
| | | 18 |
| | | 18 |
| |
| West | | 31 |
| | 27 |
| | 29 |
| | 29 |
| | | 28 |
| | | 28 |
| |
| Total | | 100 |
| % | 100 |
| % | 100 |
| % | 100 |
| % | | 100 |
| % | | 100 |
| % |
| Origination year: | | | | | | | | | | | | | | | |
| 2013 and prior | | | | | | | | | | | 35 |
| % | | 40 |
| % |
| 2014 | | | | | | | | | | | 5 |
| | | 6 |
| |
| 2015 | | | | | | | | | | | 9 |
| | | 10 |
| |
| 2016 | | | | | | | | | | | 14 |
| | | 16 |
| |
| 2017 | | | | | | | | | | | 13 |
| | | 15 |
| |
| 2018 | | | | | | | | | | | 12 |
| | | 13 |
| |
| 2019 | | | | | | | | | | | 12 |
| | | — |
| |
| Total | | | | | | | | | | | 100 |
| % | | 100 |
| % |
| |
| * | Represents less than 0.5% of single-family conventional business volume or book of business. |
|
| | |
Fannie Mae Third Quarter 20182019 Form 10-Q | 2630 |
|
| | |
| | MD&A | Single-Family Business Segments |
| |
(1) | Second lienSecond-lien mortgage loans held by third parties are not reflected in the original LTV or the estimated mark-to-market LTV ratios in this table. |
| |
(2) | Calculated based on the unpaid principal balance of single-family loans for each category at time of acquisition. |
| |
(3) | Calculated based on the aggregate unpaid principal balance of single-family loans for each category divided by the aggregate unpaid principal balance of loans in our single-family conventional guaranty book of business as of the end of each period. |
| |
(4) | The original LTV ratio generally is based on the original unpaid principal balance of the loan divided by the appraised property value reported to us at the time of acquisition of the loan. Excludes loans for which this information is not readily available. |
| |
(5) | The aggregate estimated mark-to-market LTV ratio is based on the unpaid principal balance of the loan as of the end of each reported period divided by the estimated current value of the property, which we calculate using an internal valuation model that estimates periodic changes in home value. Excludes loans for which this information is not readily available. |
| |
(6) | Long-term fixed-rate consists of mortgage loans with maturities greater than 15 years, while intermediate-term fixed-rate loans have maturities equal to or less than 15 years. |
| |
(7) | Excludes loans for which this information is not readily available. |
| |
(8) | Midwest consists of IL, IN, IA, MI, MN, NE, ND, OH, SD and WI. Northeast consists of CT, DE, ME, MA, NH, NJ, NY, PA, PR, RI, VT and VI. Southeast consists of AL, DC, FL, GA, KY, MD, MS, NC, SC, TN, VA and WV. Southwest consists of AZ, AR, CO, KS, LA, MO, NM, OK, TX and UT. West consists of AK, CA, GU, HI, ID, MT, NV, OR, WA and WY. |
Characteristics of our New Single-Family Loan Acquisitions
The share of our single-family loan acquisitions consisting of refinance loans rather than home purchase loans rather than refinances increased in the first nine monthsthird quarter of 20182019 compared with the first nine monthsthird quarter of 2017,2018, primarily driven by higher mortgage rates in 2018. In addition, our acquisitions ofdue to a lower interest rate environment, which encouraged refinance activity. Typically, refinance loans from first-time home buyers increased from 23% of our single-family loan acquisitions in the first nine months of 2017 to 27% in the first nine months of 2018. Typically, home purchase loans—particularly those to first-time home buyers—have significantly higherlower LTV ratios than refinances.home purchase loans. This trend contributed to an increasea decrease in the percentage of our single-family loan acquisitions with LTV ratios over 95%90%—from 4%24% in the first nine monthsthird quarter of 20172018 to 7%21% in the first nine monthsthird quarter of 2018. The increased2019.
Our share of home purchase loan acquisitions has increased the percentage of home purchase loans in our single-family conventional guaranty book of business.
In July 2017, we implemented Desktop Underwriter® (“DU®”) Version 10.1, which included a change that enabled loans with debt-to-incomeDTI ratios above 45% (up to 50%) to rely on DU’s comprehensive risk assessment, and removed specific policy rules that had previously set maximum LTV ratio and minimum reserves requirements for those loans. Duedecreased in the third quarter of 2019 compared with the third quarter of 2018. This decrease was driven in part toby changes in our implementation of this change, acquisitions associated with borrower debt-to-income ratios above 45% increased to 25% of our non-Refi Plus single-family acquisitions in the first nine months of 2018, compared with 7% in the first nine months of 2017. After assessing the profile of loans delivered to us using DU Version 10.1, in March 2018 weeligibility guidelines implemented DU Version 10.2, which revised DU’s risk assessment to limit risk layering. Risk layering refers to the acquisition of loans with multiple higher-risk characteristics (such as high LTV ratio, credit profile with a history of delinquencies, debt-to-income ratio above 45% and no or low levels of reserves). In October 2018, we announced our plan to implement DU Version 10.3 in December 2018. DU Version 10.3 will revise DU’s risk assessment2018 and July 2019 to further limit risk layering, particularly with respect to loans with debt-to-incomeDTI ratios above 45%. We expect to continue to acquire, as well as a higher proportionvolume of loans with debt-to-income ratios above 45% thanrefinance loan acquisitions.
Desktop Underwriter Update
As part of our comprehensive risk management approach, we acquired in periods priorperiodically update our proprietary automated underwriting system, Desktop Underwriter® (“DU®”), to reflect changes to our underwriting and eligibility guidelines. In July 2017 implementation of DU Version 10.1. 2019, we implemented the following changes to DU:
| |
| • | HomeReady® income limits. To better align with our housing goals, we changed the income limit requirement for HomeReady loans, our flagship affordable product, to set a maximum borrower income limit of 80% of area median income for the property’s location. Previously, a borrower could be eligible for a HomeReady loan if the borrower’s total annual income did not exceed 100% of area median income or if the property was located in a low-income census tract. We expect this change will reduce the proportion of our loan acquisitions consisting of HomeReady loans, which we also expect may reduce the proportion of our loan acquisitions with LTV ratios over 90%. Approximately 7% of our single-family conventional loan acquisitions in the third quarter of 2019 consisted of HomeReady loans, compared with approximately 9% in the second quarter of 2019. |
| |
| • | DU eligibility assessment. As part of normal business operations, we regularly review DU to determine whether its risk analysis and eligibility assessment are appropriate based on the current market environment and loan performance information. As a result of our most recent review, we updated the DU eligibility assessment to better align the mix of business delivered to us with the composition of business in the overall market. We expect this change will result in fewer acquisitions of loans with multiple higher-risk characteristics. |
We will continue to closely monitor loan acquisitions and market conditions and, as appropriate, make changes in our eligibility criteria so that the loans we acquire are consistent with our risk appetite.
For further information regarding Desktop Underwriter, please see “MD&A—Single-Family Business—Single-Family Mortgage Credit Risk Management—Single-Family Acquisition and Servicing Policies and Underwriting and Servicing Standards” in our 2018 Form 10-K.
For a discussion of factors that may impact the credit characteristics of loans we acquire in the future, see “MD&A—Business Segments—Single-Family Business—Single-Family Mortgage Credit Risk Management—Single-Family Portfolio Diversification and Monitoring” in our 20172018 Form 10-K. In this section of our 20172018 Form 10-K, we also provide more information on the credit characteristics of loans in our single-family conventional guaranty book of business, including Home Affordable Refinance Program® (“HARP®”) and Refi PlusTM loans, jumbo-conforming and high-balance loans, reverse mortgages and mortgage products with rate resets.
|
| | |
Fannie Mae Third Quarter 20182019 Form 10-Q | 2731 |
|
| | |
| | MD&A | Single-Family Business Segments |
Single-Family Credit Enhancement and Transfer of Mortgage Credit Risk
Single-Family Credit EnhancementsEnhancement
Our charter generally requires credit enhancement on any single-family conventional mortgage loan that we purchase or securitize if it has an LTV ratio over 80% at the time of purchase. We generally achieve this charter requirement through primary mortgage insurance. We also enter into various other types of transactions in which we transfer mortgage credit risk to third parties.
The table below displays information on the outstanding unpaid principal balance ofabout loans in our single-family loans, as well as the percentage of our total single-family conventional guaranty book of business measured by unpaid principal balance, that were covered by one or more forms of credit enhancement, as of the dates specified.including mortgage insurance or a credit risk transfer transaction. For a description of primary mortgage insurance and the other types of credit enhancements specified in the table, see “MD&A—Business Segments—Single-Family Business—Single-Family Mortgage Credit Risk Management—Single-Family Credit Enhancement and Transfer of Mortgage Credit Risk” in our 20172018 Form 10-K. For a discussion of our exposure to and management of the institutional counterparty credit risk associated with the providers of these credit enhancements, see “Risk Management—Credit “MD&A—Risk Management—Institutional Counterparty Credit Risk Management” and "Note 13, Concentrations of Credit Risk" in our 20172018 Form 10-K and “Note 11,10, Concentrations of Credit Risk” in this report.
| | Single-Family Loans with Credit Enhancement | | | As of | As of |
| | September 30, 2018 | | December 31, 2017 | | September 30, 2019 | | December 31, 2018 |
| | | Unpaid Principal Balance | | Percentage of Single-Family Conventional Guaranty Book of Business | | Unpaid Principal Balance | | Percentage of Single-Family Conventional Guaranty Book of Business | | Unpaid Principal Balance | | Percentage of Single-Family Conventional Guaranty Book of Business | | Unpaid Principal Balance | | Percentage of Single-Family Conventional Guaranty Book of Business |
| | (Dollars in billions) | (Dollars in billions) |
| Primary mortgage insurance and other | | $ | 601 |
| | 21 | % | | $ | 566 |
| | 20 | % | | $ | 644 |
| | 22 | % | | $ | 618 |
| | 21 | % |
| Connecticut Avenue Securities | | 768 |
| | 27 |
| | 681 |
| | 24 |
| | 816 |
| | 28 |
| | 798 |
| | 27 |
|
Credit Insurance Risk TransferTM (“CIRTTM”) | | 231 |
| | 8 |
| | 181 |
| | 6 |
| |
Credit Insurance Risk TransferTM (“CIRTTM”) | | | 263 |
| | 9 |
| | 243 |
| | 8 |
|
| Lender risk sharing | | 94 |
| | 3 |
| | 65 |
| | 2 |
| | 135 |
| | 4 |
| | 102 |
| | 4 |
|
| Less: Loans covered by multiple credit enhancements | | (379 | ) | | (14 | ) | | (335 | ) | | (12 | ) | | (413 | ) | | (14 | ) | | (394 | ) | | (13 | ) |
| Total unpaid principal balance of single-family loans with credit enhancement | | $ | 1,315 |
| | 45 | % | | $ | 1,158 |
| | 40 | % | |
| Total single-family loans with credit enhancement | | | $ | 1,445 |
| | 49 | % | | $ | 1,367 |
| | 47 | % |
Transfer of Mortgage Credit Risk Transfer Transactions
OurIn addition to primary mortgage insurance, our Single-Family business has developed other risk-sharing capabilities to transfer portions of our single-family mortgage credit risk to the private market. Our primary method of achieving this objective has been through our CAS and CIRT transactions. In most of our credit risk transfer transactions weare designed to transfer a small portion of the expected credit losses, and a significant portion of the losses we expect would be incurred in a stressed credit environment, such as a severe or prolonged economic downturn. We continually evaluate our credit risk transfer transactions which, in addition to managing our credit risk, also affect our returns on capital and may impact the amount of capital we would be required to hold under FHFA’s proposed capital requirements. We discuss FHFA’s proposed capital rule in “Business—Charter Act and Regulation—GSE Act and Other Regulation” in our 2018 Form 10-K.
During the first nine months of 2019, pursuant to our credit risk transfer transactions, we transferred a portion of the mortgage credit risk on single-family mortgages with an unpaid principal balance of $223 billion at the time of the transactions. As of September 30, 2019, approximately 41% of the loans in our single-family conventional guaranty book of business, measured by unpaid principal balance, were included in a reference pool for a credit risk transfer transaction.
|
| | |
Fannie Mae Third Quarter 20182019 Form 10-Q | 2832 |
|
| | |
| | MD&A | Single-Family Business Segments |
The tablestable below displaydisplays the mortgage credit risk transferred to third parties and retained by Fannie Mae pursuant to our single-family credit risk transfer transactions.
|
| | | | | | | | | | | | | | | | |
| Single-Family Credit Risk Transfer Transactions |
Issuances from Inception to September 30, 2018(1) |
(Dollars in billions)
|
| Senior | | Fannie Mae(2) | | Initial Reference Pool(5) |
| $1,427 | |
| | | | | | | | | | |
| Mezzanine | | Fannie Mae(2) | | CIRT(3)(4) | | CAS(3) | | Lender Risk-Sharing(3) | |
| $2 | | $7 | | $31 | | $2 | | $1,481 |
| | | | | | | | | | |
| First Loss | | Fannie Mae(2) | | CAS(3)(6) | | Lender Risk-Sharing(3) | |
| $8 | | $3 | | $1 | |
|
| | | | | | | | | | | | | | | | |
| Single-Family Credit Risk Transfer Transactions |
| Issuances from Inception to September 30, 2019 |
(Dollars in billions)
|
| Senior | | Fannie Mae(1) | | Initial Reference Pool(5) |
| $1,744 | |
| | | | | | | | | | |
| Mezzanine | | Fannie Mae(1) | | CIRT(2)(3) | | CAS(2) | | Lender Risk-Sharing(2)(4) | |
| $2 | | $10 | | $36 | | $3 | | $1,811 |
| | | | | | | | | | |
| First Loss | | Fannie Mae(1) | | CAS(2)(6) | | Lender Risk-Sharing(2)(4) | |
| $9 | | $4 | | $3 | |
|
| | | | | | | | | | | | | | | | |
Outstanding as of September 30, 2018(1) |
(Dollars in billions)
|
| Senior | | Fannie Mae(2) | | Outstanding Reference Pool(5)(7) |
| $1,041 | |
| | | | | | | | | | |
| Mezzanine | | Fannie Mae(2) | | CIRT(3)(4) | | CAS(3) | | Lender Risk-Sharing(3) | |
| $1 | | $7 | | $22 | | $2 | | $1,085 |
| | | | | | | | | | |
| First Loss | | Fannie Mae(2) | | CAS(3)(6) | | Lender Risk-Sharing(3) | |
| $8 | | $3 | | $1 | |
__________ |
| | | | | | | | | | | | | | | | |
| Outstanding as of September 30, 2019 |
(Dollars in billions)
|
| Senior | | Fannie Mae(1) | | Outstanding Reference Pool(5)(7) |
| $1,199 | |
| | | | | | | | | | |
| Mezzanine | | Fannie Mae(1) | | CIRT(2)(3) | | CAS(2) | | Lender Risk-Sharing(2)(4) | |
| $2 | | $8 | | $24 | | $3 | | $1,252 |
| | | | | | | | | | |
| First Loss | | Fannie Mae(1) | | CAS(2)(6) | | Lender Risk-Sharing(2)(4) | |
| $9 | | $4 | | $3 | |
| |
(1) | For some lender risk-sharing transactions, does not reflect completed transfers of risk prior to settlement. |
| |
(2)
| Credit risk retained by Fannie Mae in CAS, CIRT and lender risk-sharing transactions. Tranche sizes vary across programs. |
| |
(3)(2)
| Credit risk transferred to third parties. Tranche sizes vary across programs. |
| |
(4)(3)
| Includes mortgage pool insurance transactions covering loans with an unpaid principal balance of approximately $7 billion at issuance and approximately $4$3 billion outstanding as of September 30, 2018.2019. |
| |
(4) | For some lender risk-sharing transactions, does not reflect completed transfers of risk prior to settlement. |
| |
(5) | For CIRT and some lender risk-sharing transactions, “Reference Pool” reflects a pool of covered loans. |
| |
(6) | For CAS transactions, “First Loss” represents all B tranche balances. |
| |
(7) | For CAS and some lender risk-sharing transactions, represents outstanding reference pools, not the outstanding unpaid principal balance of the underlying loans. The outstanding unpaid principal balance for all loans covered by credit risk transfer programs, including all loans on which risk has been transferred in lender risk-sharing transactions, was $1,093$1,213 billion as of September 30, 2018.2019. |
|
| | |
Fannie Mae Third Quarter 20182019 Form 10-Q | 2933 |
|
| | |
| | MD&A | Single-Family Business Segments |
DuringThe following table displays the approximate cash paid or transferred to investors for these credit risk transfer transactions. The cash represents the portion of the guaranty fee paid to investors as compensation for taking on a share of the credit risk. These expenses increased from the first nine months of 2018 pursuant to our credit risk transfer transactions, we transferred a portion of the mortgage credit risk on single-family mortgages with an unpaid principal balance of over $250 billion at the time of the transactions.
Because a larger portion of our single-family book of business was covered by CAS and CIRT transactions in the first nine months of 2018 than in2019. We expect these expenses will continue to increase as the first nine months of 2017, the expenses related to these transactions increased:
For the first nine months of 2018, we paid approximately $655 million in interest expense, net of LIBOR, on our outstanding CAS and approximately $205 million in CIRT premiums.
Comparatively, we paid approximately $568 million in interest expense, net of LIBOR, on our outstanding CAS and approximately $127 million in CIRT premiums for the first nine months of 2017.
As a partpercentage of our continued effort to innovate and improve oursingle-family conventional guaranty book of business that is covered by a credit risk transfer programs,transaction increases.
|
| | | | | | | | |
| Credit Risk Transfer Transactions |
| | | For the Nine Months Ended September 30, |
| | | 2019 | | 2018 |
| Cash paid or transferred for: | | (Dollars in millions) |
CAS transactions(1) | | $ | 724 |
| | $ | 655 |
|
| CIRT transactions | | 264 |
| | 205 |
|
| Lender risk-sharing transactions | | 207 |
| | 97 |
|
| |
(1) | Consists of cash paid for interest expense net of LIBOR on outstanding CAS debt and amounts paid for CAS REMICTM transactions. “CAS REMICs” are Connecticut Avenue Securities that are structured as notes issued by trusts that qualify as REMICs. |
With our July 2019 CAS REMICTM transaction, we areupdated the following terms of our CAS REMIC transactions compared with our prior CAS REMIC transactions: extended the term from 12.5 years to 20 years; shortened the call option from 10 years to 7 years; and retained a smaller first-loss position (that is, investors purchased a larger portion of the risk that we refer to as the first-loss tranche). These updates were primarily designed to further reduce the amount of capital we would be required to hold for the associated loans in the process of executing an enhancement to our credit risk transfer securities that will structure our CAS offerings as notes issued by a trust that qualifies as a Real Estate Mortgage Investment Conduit (“REMIC”), enabling expanded participation by real estate investment trusts and international investors. The new REMIC structure will differ from the prior CAS notes that were issued as Fannie Mae corporate debt. Under the prior CAS structure, there can be a significant lag between the time when we recognize a provision for credit losses and when we recognize the related recovery from the CAS transaction. Under current accounting rules, while a credit expense on a loan in a reference pool for aunder FHFA’s proposed capital framework. Our subsequent CAS transaction is recorded when it is probableREMIC transactions included these updated terms, and we currently expect that we have incurred a loss, for our future CAS issued beginning in 2016, a recovery is recorded only when an actual loss event occurs, which is typically several months after the collateral has been liquidated. The new CAS structureREMIC transactions will eliminate this timing mismatch, allowing us to recognize the expected credit loss protection benefit at the same time the credit loss is recognized in our consolidated financial statements. We will continue to record the expected benefit and the loss in the same period upon our adoption of Accounting Standards Update 2016-13, Financial Instruments—Credit Losses, in January 2020.
The enhancement to our CAS program is designed to promote the continued growth of the market by expanding the potential investor base for these securities and limiting investor exposure to Fannie Mae counterparty risk, without disrupting the TBA MBS market. We expect to issue CAS under the new REMIC structure in November 2018.contain similar terms.
|
| | |
Fannie Mae Third Quarter 20182019 Form 10-Q | 3034 |
|
| | |
| | MD&A | Single-Family Business Segments |
Single-Family Problem Loan Management
Our problem loan management strategies are primarily focused on reducing defaults to avoid losses that would otherwise occur and pursuing foreclosure alternatives to attempt to minimizemitigate the severity of the losses we incur. See “MD&A—Business Segments—Single-Family Business—Single-Family Mortgage Credit Risk Management—Problem Loan Management” in our 20172018 Form 10-K for a discussion of delinquency statistics on our problem loans, efforts undertaken to manage our problem loans, metrics regarding our loan workout activities, real estate owned (“REO”) management and other single-family credit-related disclosures. The discussion below updates some of that information.
Delinquency
The tablestable below displaydisplays the delinquency status of loans and changes in the balance of seriously delinquent loans in our single-family conventional guaranty book of business, based on the number of loans. We include single-family conventional loans that we own and those that back Fannie Mae MBS in the calculation of the single-family delinquency rate. SeriouslySingle-family seriously delinquent loans are loans that are 90 days or more past due or in the foreclosure process.
| | Delinquency Status and Activity of Single-Family Conventional Loans | | | As of | As of |
| | September 30, 2018 | | December 31, 2017 | | September 30,
2017 | September 30,
2019 | | December 31, 2018 | | September 30,
2018 |
| Delinquency status: | | | | | | | | | | |
| 30 to 59 days delinquent | 1.52 | % | | 1.63 | % | | 1.63 | % | 1.28 | % | | 1.37 | % | | 1.52 | % |
| 60 to 89 days delinquent | 0.37 |
| | 0.50 |
| | 0.40 |
| 0.35 |
| | 0.38 |
| | 0.37 |
|
| Seriously delinquent (“SDQ”) | 0.82 |
| | 1.24 |
| | 1.01 |
| 0.68 |
| | 0.76 |
| | 0.82 |
|
| Percentage of SDQ loans that have been delinquent for more than 180 days | 53 | % | | 43 | % | | 57 | % | 50 | % | | 49 | % | | 53 | % |
| Percentage of SDQ loans that have been delinquent for more than two years | 13 |
| | 13 |
| | 18 |
| 11 |
| | 12 |
| | 13 |
|
| | | | For the Nine Months Ended September 30, | | For the Nine Months Ended September 30, |
| | 2018 | | 2017 | | 2019 | | 2018 |
| Single-family SDQ loans (number of loans): | | | | | | | |
| Beginning balance | 212,183 |
| | 206,549 |
| | 130,440 |
| | 212,183 |
|
| Additions | 171,516 |
| | 177,449 |
| | 150,288 |
| | 171,516 |
|
| Removals: | | | | | | | |
| Modifications and other loan workouts | (83,567 | ) | | (56,048 | ) | | (35,242 | ) | | (83,567 | ) |
| Liquidations and sales | (58,912 | ) | | (63,854 | ) | | (39,066 | ) | | (58,912 | ) |
| Cured or less than 90 days delinquent | (101,524 | ) | | (91,545 | ) | | (91,255 | ) | | (101,524 | ) |
| Total removals | (244,003 | ) | | (211,447 | ) | | (165,563 | ) | | (244,003 | ) |
| Ending balance | 139,696 |
| | 172,551 |
| | 115,165 |
| | 139,696 |
|
Our single-family serious delinquency rate was 0.82%decreased as of September 30, 2018,2019 compared with 1.24% as of December 31, 20172018 and 1.01% as of September 30, 2017. Our2018. The decrease in our single-family serious delinquency rate increased in the latter partfirst nine months of 2017 due to2019 was primarily driven by improved loan payment performance and the impactsale of nonperforming loans. The decline through the 2017 hurricanes, but has since resumed its prior downward trend because many first nine months of 2018 was driven primarily by delinquent borrowers in the regions affected areas have resolvedby Hurricanes Harvey, Irma and Maria (collectively, the “2017 hurricanes”) continuing to resolve their loan delinquencies by obtaining loan modifications or through resuming payments and becoming current on their loans. Our single-family serious delinquency rate may be negatively impacted in the near term as a result of the hurricanes that occurred late in the third quarter of 2018 and early in the fourth quarter of 2018, which may cause some borrowers in the affected regions to miss their payments, including through forbearance arrangements that may be extended. We are still evaluating the impact, but we do not believe that the hurricanes to date in 2018, individually or in aggregate, will have a material impact on our credit losses or loss reserves. In the longer term, we expect our single-familydelinquencies.
|
| | |
Fannie Mae Third Quarter 2018 Form 10-Q | 31 |
serious delinquency rate to continue to decline, but at a more modest pace than in the past several years, and to experience period-to-period fluctuations.
Certain higher-risk loan categories, such as Alt-A loans, loans with higher estimated mark-to-market LTV ratios greater than 100%, and our 2005 through 2008 loan vintages, continue to exhibit higher than averagehigher-than-average delinquency rates and/or account for a higher share of our credit losses. Single-family loans originated in 2005 through 2008 constituted 5%4% of our single-family book of business as of September 30, 2018,2019, but constituted 41%36% of our seriously delinquent single-family loans as of September 30, 2018. In addition, single-family loans originated in 2005 through 20082019 and drove 58%64% of our single-family credit losses in the third quarter of 2018 and 65% in the first nine months of 2018. Loans2019. In addition, loans in certain judicial foreclosure states such as Florida, New Jersey and New York with historically long foreclosure timelines have exhibited higher than averagehigher-than-average delinquency rates and/or account for a higher share of our credit losses.
|
| | |
| Fannie Mae Third Quarter 2019 Form 10-Q | 35 |
|
| | |
| MD&A | Single-Family Business |
The table below displays the serious delinquency rates for, and the percentage of our total seriously delinquent single-family conventional loans represented by, the specified loan categories. Percentage of book outstanding calculations are based on the unpaid principal balance of loans for each category divided by the unpaid principal balance of our total single-family conventional guaranty book of business for which we have detailed loan-level information. We also include information for our loans in California, as this state accounts for a large share of our single-family conventional guaranty book of business. The reported categories are not mutually exclusive. Percentage of book outstanding calculations are based on the unpaid principal balance of loans for each category divided by the unpaid principal balance of our total single-family guaranty book of business for which we have detailed loan level information.
| | Single-Family Conventional Seriously Delinquent Loan Concentration Analysis | | | As of | As of |
| | September 30, 2018 | December 31, 2017 | September 30, 2017 | September 30, 2019 | December 31, 2018 | September 30, 2018 |
| | | Percentage of Book Outstanding | | Percentage of Seriously Delinquent Loans(1) | | Serious Delinquency Rate | | Percentage of Book Outstanding | | Percentage of Seriously Delinquent Loans(1) | | Serious Delinquency Rate | | Percentage of Book Outstanding | | Percentage of Seriously Delinquent Loans(1) | | Serious Delinquency Rate | | Percentage of Book Outstanding | | Percentage of Seriously Delinquent Loans(1) | | Serious Delinquency Rate | | Percentage of Book Outstanding | | Percentage of Seriously Delinquent Loans(1) | | Serious Delinquency Rate | | Percentage of Book Outstanding | | Percentage of Seriously Delinquent Loans(1) | | Serious Delinquency Rate |
| States: | | | | | | | | | | | | | | | | | | | | | | | | | | | | | | | | | | | | |
| California | | 19 | % | | 6 | % | | 0.34 | % | | 19 | % | | 5 | % | | 0.42 | % | | 19 | % | | 6 | % | | 0.43 | % | | 19 | % | | 7 | % | | 0.32 | % | | 19 | % | | 6 | % | | 0.34 | % | | 19 | % | | 6 | % | | 0.34 | % |
| Florida | | 6 |
| | 12 |
| | 1.51 |
| | 6 |
| | 19 |
| | 3.71 |
| | 6 |
| | 10 |
| | 1.50 |
| | 6 |
| | 8 |
| | 0.87 |
| | 6 |
| | 10 |
| | 1.16 |
| | 6 |
| | 12 |
| | 1.51 |
|
| New Jersey | | 4 |
| | 6 |
| | 1.51 |
| | 4 |
| | 5 |
| | 2.15 |
| | 4 |
| | 7 |
| | 2.36 |
| | 3 |
| | 5 |
| | 1.21 |
| | 4 |
| | 5 |
| | 1.38 |
| | 4 |
| | 6 |
| | 1.51 |
|
| New York | | 5 |
| | 8 |
| | 1.55 |
| | 5 |
| | 7 |
| | 2.02 |
| | 5 |
| | 9 |
| | 2.13 |
| | 5 |
| | 8 |
| | 1.24 |
| | 5 |
| | 8 |
| | 1.40 |
| | 5 |
| | 8 |
| | 1.55 |
|
| All other states | | 66 |
| | 68 |
| | 0.77 |
| | 66 |
| | 64 |
| | 1.09 |
| | 66 |
| | 68 |
| | 0.94 |
| | 67 |
| | 72 |
| | 0.67 |
| | 66 |
| | 71 |
| | 0.75 |
| | 66 |
| | 68 |
| | 0.77 |
|
| Product type: | | | | | | | | | | | | | | | | | | | | | | | | | | | | | | | | | | | | |
Alt-A(2) | | 2 |
| | 12 |
| | 3.68 |
| | 2 |
| | 12 |
| | 4.95 |
| | 3 |
| | 14 |
| | 4.54 |
| | 2 |
| | 10 |
| | 3.09 |
| | 2 |
| | 11 |
| | 3.35 |
| | 2 |
| | 12 |
| | 3.68 |
|
| Vintages: | | | | | | | | | | | | | | | | | | | | | | | | | | | | | | | | | | | | |
| 2004 and prior | | 3 |
| | 23 |
| | 2.77 |
| | 4 |
| | 23 |
| | 3.28 |
| | 4 |
| | 25 |
| | 2.75 |
| | 2 |
| | 21 |
| | 2.53 |
| | 3 |
| | 23 |
| | 2.69 |
| | 3 |
| | 23 |
| | 2.77 |
|
| 2005-2008 | | 5 |
| | 41 |
| | 4.90 |
| | 6 |
| | 42 |
| | 6.55 |
| | 7 |
| | 48 |
| | 5.83 |
| | 4 |
| | 36 |
| | 4.24 |
| | 5 |
| | 39 |
| | 4.61 |
| | 5 |
| | 41 |
| | 4.90 |
|
| 2009-2018 | | 92 |
| | 36 |
| | 0.34 |
| | 90 |
| | 35 |
| | 0.53 |
| | 89 |
| | 27 |
| | 0.33 |
| |
| 2009-2019 | | | 94 |
| | 43 |
| | 0.33 |
| | 92 |
| | 38 |
| | 0.34 |
| | 92 |
| | 36 |
| | 0.34 |
|
| Estimated mark-to-market LTV ratio: | | | | | | | | | | | | | | | | | | | | | | | | | | | | | | | | | | | | |
| <= 60% | | 56 |
| | 47 |
| | 0.61 |
| | 52 |
| | 41 |
| | 0.84 |
| | 53 |
| | 40 |
| | 0.66 |
| | 55 |
| | 52 |
| | 0.54 |
| | 54 |
| | 48 |
| | 0.58 |
| | 56 |
| | 47 |
| | 0.61 |
|
| 60.01% to 70% | | 18 |
| | 17 |
| | 0.91 |
| | 18 |
| | 18 |
| | 1.34 |
| | 19 |
| | 17 |
| | 1.05 |
| | 17 |
| | 17 |
| | 0.81 |
| | 18 |
| | 17 |
| | 0.87 |
| | 18 |
| | 17 |
| | 0.91 |
|
| 70.01% to 80% | | 15 |
| | 15 |
| | 0.99 |
| | 17 |
| | 16 |
| | 1.48 |
| | 16 |
| | 15 |
| | 1.17 |
| | 16 |
| | 14 |
| | 0.79 |
| | 16 |
| | 14 |
| | 0.90 |
| | 15 |
| | 15 |
| | 0.99 |
|
80.01% to 90% | | 7 |
| | 10 |
| | 1.38 |
| | 8 |
| | 11 |
| | 2.09 |
| | 8 |
| | 11 |
| | 1.77 |
| | 8 |
| | 9 |
| | 1.04 |
| | 8 |
| | 10 |
| | 1.24 |
| | 7 |
| | 10 |
| | 1.38 |
|
| 90.01% to 100% | | 3 |
| | 5 |
| | 1.74 |
| | 4 |
| | 6 |
| | 2.62 |
| | 3 |
| | 7 |
| | 2.72 |
| | 4 |
| | 4 |
| | 0.97 |
| | 4 |
| | 5 |
| | 1.33 |
| | 3 |
| | 5 |
| | 1.74 |
|
| Greater than 100% | | 1 |
| | 6 |
| | 10.65 |
| | 1 |
| | 8 |
| | 11.70 |
| | 1 |
| | 10 |
| | 10.73 |
| | * |
| | 4 |
| | 10.62 |
| | * |
| | 6 |
| | 9.85 |
| | 1 |
| | 6 |
| | 10.65 |
|
Credit enhanced:(3) | | | | | | | | | | | | | | | | | | | | | | | | | | | | | | | | | | | | |
Primary MI & other(4) | | 21 |
| | 25 |
| | 1.19 |
| | 20 |
| | 26 |
| | 1.95 |
| | 19 |
| | 26 |
| | 1.62 |
| | 22 |
| | 26 |
| | 0.97 |
| | 21 |
| | 26 |
| | 1.11 |
| | 21 |
| | 25 |
| | 1.19 |
|
Credit risk transfer(5) | | 38 |
| | 8 |
| | 0.23 |
| | 32 |
| | 8 |
| | 0.42 |
| | 31 |
| | 4 |
| | 0.16 |
| | 41 |
| | 13 |
| | 0.27 |
| | 39 |
| | 10 |
| | 0.24 |
| | 38 |
| | 8 |
| | 0.23 |
|
| Non-credit enhanced | | 55 |
| | 70 |
| | 0.90 |
| | 60 |
| | 69 |
| | 1.27 |
| | 60 |
| | 72 |
| | 1.05 |
| | 51 |
| | 67 |
| | 0.75 |
| | 53 |
| | 69 |
| | 0.85 |
| | 55 |
| | 70 |
| | 0.90 |
|
__________
| |
| * | Represents less than 0.5% of single-family conventional business volume or book of business. |
| |
(1) | Calculated based on the number of single-family loans that were seriously delinquent for each category divided by the total number of single-family conventional loans that were seriously delinquent. |
|
| | |
Fannie Mae Third Quarter 2018 Form 10-Q | 32 |
| |
(2) | For a description of our Alt-A loan classification criteria, see “Glossary“MD&A—Glossary of Terms Used in Thisthis Report” in our 20172018 Form 10-K. |
| |
(3) | The credit-enhanced categories are not mutually exclusive. A loan with primary mortgage insurance that is also covered by a credit risk transfer transaction will be included in both the “Primary MI & other” category and the “Credit risk transfer” category. As a result, the “Credit enhanced” and “Non-credit enhanced” categories do not sum to 100%. The total percentage of our single-family conventional guaranty book of business with some form of credit enhancement as of September 30, 20182019 was 45%49%. |
| |
(4) | Refers to loans included in an agreement used to reduce credit risk by requiring primary mortgage insurance, collateral, letters of credit, corporate guarantees, or other agreements to provide an entity with some assurance that it will be compensated to some degree in the event of a financial loss. Excludes loans covered by credit risk transfer transactions unless such loans are also covered by primary mortgage insurance. |
| |
(5) | Refers to loans included in reference pools for credit risk transfer transactions, including loans in these transactions that are also covered by primary mortgage insurance. For CAS and some lender risk-sharing transactions, this represents outstanding unpaid principal balance of the underlying loans on the single-family mortgage credit book, not the outstanding reference pool, as of the specified date. Loans included in our credit risk transfer transactions have all been acquired since 2012 and newer2012. Newer vintages typically have significantly lower delinquency rates than more seasoned loans. |
|
| | |
| Fannie Mae Third Quarter 2019 Form 10-Q | 36 |
|
| | |
| MD&A | Single-Family Business |
Loan Workout Metrics
Our loan workouts reflect reflect:
our home retention solutions, including loan modifications, repayment plans and forbearances,forbearances; and
foreclosure alternatives, including short sales and deeds-in-lieu of foreclosure.
The chart below displays the unpaid principal balance of our completed single-family loan workouts by type for the first nine months of 2018 compared with the first nine months of 2019, as well as the number of loan workouts.workouts for each period.
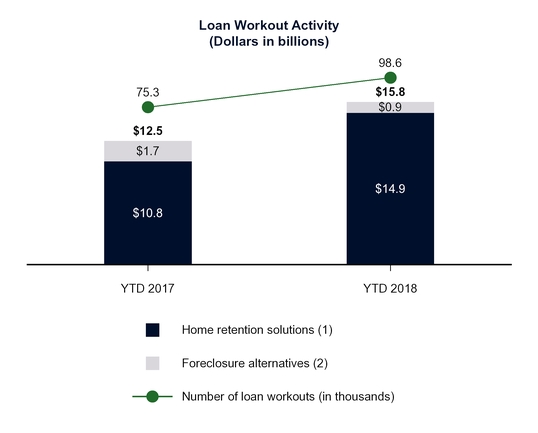
__________(Dollars in billions)
| |
(1)(1)
| Consists of loan modifications and completed repayment plans and forbearances. Repayment plans reflect only those plans associated with loans that were 60 days or more delinquent. Forbearances reflect loans that were 90 days or more delinquent. Excludes trial modifications, loans to certain borrowers who have received bankruptcy relief that are classified as troubled debt restructurings, and repayment and forbearance plans that have been initiated but not completed. There were approximately 22,70013,200 loans in a trial modification period as of September 30, 2018.2019. |
| |
(2) | Consists of short sales and deeds-in-lieu of foreclosure. |
The decrease in home retention solutions in the first nine months of 2019 compared with the first nine months of 2018 was primarily driven by improved loan performance and a decrease in the volume of modifications and forbearances granted, which was elevated in 2018 due to the number of borrowers affected by the 2017 hurricanes.
|
| | |
Fannie Mae Third Quarter 20182019 Form 10-Q | 3337 |
|
| | |
| | MD&A | Single-Family Business Segments |
The increase in home retention solutions in the first nine months of 2018 compared with the first nine months of 2017 was primarily driven by modifications and forbearances granted during the first nine months of 2018 to borrowers in areas affected by the 2017 hurricanes.
REO Management
If a loan defaults, we acquire the home through foreclosure or a deed-in-lieu of foreclosure. The table below displays our foreclosure activity by region. Regional REO acquisition trends generally follow a pattern that is similar to, but lags, that of regional delinquency trends.
|
| | | | | | | | | |
| Single-Family REO Properties |
| | For the Nine Months |
| | Ended September 30, |
| | 2018 | | 2017 |
| Single-family REO properties (number of properties): | | | | | |
Beginning of period inventory of single-family REO properties(1) | 26,311 |
| | | 38,093 |
| |
Acquisitions by geographic area:(2) | | | | | |
| Midwest | 4,675 |
| | | 6,716 |
| |
| Northeast | 5,023 |
| | | 7,496 |
| |
| Southeast | 6,190 |
| | | 8,966 |
| |
| Southwest | 2,864 |
| | | 4,083 |
| |
| West | 1,518 |
| | | 2,156 |
| |
Total REO acquisitions(1) | 20,270 |
| | | 29,417 |
| |
| Dispositions of REO | (25,549 | ) | | | (38,497 | ) | |
End of period inventory of single-family REO properties(1) | 21,032 |
| | | 29,013 |
| |
| Carrying value of single-family REO properties (dollars in millions) | $ | 2,606 |
| | | $ | 3,448 |
| |
Single-family foreclosure rate(3) | 0.16 |
| % | | 0.23 |
| % |
REO net sales prices to unpaid principal balance(4) | 77 |
| % | | 75 |
| % |
Short sales net sales prices to unpaid principal balance(5) | 77 |
| % | | 75 |
| % |
__________ |
| | | | | | | | | | |
| Single-Family REO Properties |
| | | For the Nine Months Ended September 30, |
| | |
| | | 2019 | | 2018 |
| Single-family REO properties (number of properties): | | | | | | |
Beginning of period inventory of single-family REO properties(1) | | 20,156 |
| | | 26,311 |
| |
Acquisitions by geographic area:(2) | | | | | | |
| Midwest | | 3,734 |
| | | 4,675 |
| |
| Northeast | | 3,858 |
| | | 5,023 |
| |
| Southeast | | 5,001 |
| | | 6,190 |
| |
| Southwest | | 2,256 |
| | | 2,864 |
| |
| West | | 1,334 |
| | | 1,518 |
| |
Total REO acquisitions(1) | | 16,183 |
| | | 20,270 |
| |
| Dispositions of REO | | (18,468 | ) | | | (25,549 | ) | |
End of period inventory of single-family REO properties(1) | | 17,871 |
| | | 21,032 |
| |
| Carrying value of single-family REO properties (dollars in millions) | | $ | 2,349 |
| | | $ | 2,606 |
| |
Single-family foreclosure rate(3) | | 0.13 |
| % | | 0.16 |
| % |
REO net sales price to unpaid principal balance(4) | | 78 |
| % | | 77 |
| % |
Short sales net sales price to unpaid principal balance(5) | | 78 |
| % | | 77 |
| % |
| |
(1) | Includes acquisitions through foreclosure and deeds-in-lieu of foreclosure. Also includes held for useheld-for-use properties, which are reported in our condensed consolidated balance sheets as a component of “Other assets.” |
| |
(2) | See footnote 78 to the “Key Risk Characteristics of Single-Family Conventional Business Volume and Guaranty Book of BusinessBusiness” table for states included in each geographic region. |
| |
(3) | Estimated based on the annualized total number of properties acquired through foreclosure or deeds-in-lieu of foreclosure as a percentage of the total number of loans in our single-family conventional guaranty book of business as of the end of each respective period. |
| |
(4) | Calculated as the amount of sale proceeds received on disposition of REO properties during the respective periods, excluding those subject to repurchase requests made to our sellers or servicers, divided by the aggregate unpaid principal balance of the related loans at the time of foreclosure. Net sales price represents the contract sales price less selling costs for the property and other charges paid by the seller at closing. |
| |
(5) | Calculated as the amount of sale proceeds received on properties sold in short sale transactions during the respective periods divided by the aggregate unpaid principal balance of the related loans. Net sales price represents the contract sales price less the selling costs for the property and other charges paid by the seller at the closing, includingincludes borrower relocation incentive payments and subordinate lien(s) negotiated payoffs. |
The decrease in single-familySingle-family REO properties from December 31, 2017 to September 30,declined in the first nine months of 2019 compared with the first nine months of 2018 was primarily due to a reduction in REO acquisitions from serious delinquencies aged greater than 180 days, driven by improved loan performance and the continued sale of nonperforming loans in 2018.loan sales.
|
| | |
Fannie Mae Third Quarter 2018 Form 10-Q | 34 |
Other Single-Family Credit Information
Single-Family Credit Loss Performance and Concentration Metrics
The amount of credit lossesloss or income we realize in a given period areis driven by foreclosures, pre-foreclosure sales, REO activity, mortgage loan redesignations and charge-offs, pursuant to the provisionsnet of the Advisory Bulletin in the period.recoveries. The table below displays the components of our single-family credit loss performance metrics, as well as our single-family initial charge-off severity rate.
Our credit loss performance metrics are not defined terms within generally accepted accounting principles in the United States of America (“GAAP”) and may not be calculated in the same manner as similarly titled measures reported by other companies. We believe thatthese credit loss performance metrics may be useful to investors as the lossesbecause they are presented as a percentage of our guaranty book of business and have historically been used by analysts, investors and other companies within the financial services industry.
|
| | | | | | | | | | | | | | | | | | | | | | | | | | | | | | | | | |
| Single-Family Credit Loss Performance Metrics |
| | For the Three Months Ended September 30, | | For the Nine Months Ended September 30, |
| | 2018 | | 2017 | | 2018 | | 2017 |
| | Amount | | Ratio(1) | | Amount | | Ratio(1) | | Amount | | Ratio(1) | | Amount | | Ratio(1) |
| | (Dollars in millions) |
| Charge-offs, net of recoveries | | $ | (430 | ) | | 5.8 |
| bps | | | $ | (382 | ) | | 5.2 |
| bps | | $ | (1,473 | ) | | 6.7 |
| bps | | $ | (1,851 | ) | | 8.5 |
| bps |
| Foreclosed property expense | | (150 | ) | | 2.1 |
| | | | (157 | ) | | 2.2 |
| | | (448 | ) | | 2.0 |
| | | (405 | ) | | 1.9 |
| |
Credit losses and credit loss ratio | | $ | (580 | ) | | 7.9 |
| bps | | | $ | (539 | ) | | 7.4 |
| bps | | $ | (1,921 | ) | | 8.7 |
| bps | | $ | (2,256 | ) | | 10.4 |
| bps |
Single-family initial charge-off severity rate(2) | | | | 10.34 | % | | | | | 13.82 | % | | | | 11.56 | % | | | | 15.44 | % |
___________ |
| | | | | | | | | | | | | | | | | | | | | | | | | | | | | | | | | | | | | | | |
| Single-Family Credit Loss Performance Metrics |
| | For the Three Months Ended September 30, | | For the Nine Months Ended September 30, |
| | 2019 | | 2018 | | 2019 | | 2018 |
| | Amount | | Ratio(1) | | Amount | | Ratio(1) | | Amount | | Ratio(1) | | Amount | | Ratio(1) |
| | (Dollars in millions) |
| Charge-offs, net of recoveries | | $ | (255 | ) | | | 3.5 |
| bps | | | $ | (430 | ) | | | 5.8 |
| bps | | | $ | (1,115 | ) | | | 5.1 |
| bps | | | $ | (1,473 | ) | | | 6.7 |
| bps |
| Foreclosed property expense | | (93 | ) | | | 1.3 |
| | | | (150 | ) | | | 2.1 |
| | | | (362 | ) | | | 1.7 |
| | | | (448 | ) | | | 2.0 |
| |
Credit losses and credit loss ratio | | $ | (348 | ) | | | 4.8 |
| bps | | | $ | (580 | ) | | | 7.9 |
| bps | | | $ | (1,477 | ) | | | 6.8 |
| bps | | | $ | (1,921 | ) | | | 8.7 |
| bps |
Single-family initial charge-off severity rate(2) | | | | | 7.43 | % | | | | | | 10.34 | % | | | | | | 8.11 |
| % | | | | | | 11.56 | % |
| |
(1) | Basis points are calculated based on the amount forof each line item presented divided by the average single-family conventional guaranty book of business during the period. |
| |
(2) | Credit losses on single-family loans initially charged off during the period divided by the average defaulted unpaid principal balance of those loans. The rate excludes any costs, gains or losses associated with REO after initial acquisition through final disposition. The rate includes charge-offscharge-off event is defined as the earliest of (1) when the loan is charged off pursuant to the provisions of the Advisory Bulletin, and charge-offsor (2) when there is a short sale, deed-in-lieu of property tax and insurance receivables.foreclosure, or foreclosure of the underlying collateral. This severity rate does not reflect any gains or losses associated with subsequent events, such as REO transactions that occur after we acquire the property. |
Our single-family credit losses and credit loss ratio increased in the third quarter of 2018 compared with the third quarter of 2017, primarily due to higher charge-offs related to the redesignation of single-family loans from HFI to HFS, partially offset by lower charge-off expenses from reduced foreclosures and foreclosure alternatives and higher home prices in the third quarter of 2018.
Our single-family credit losses and credit loss ratio decreased in the first nine months of 2018 compared with the first nine months of 2017 primarily due to lower charge-off expenses from reduced foreclosures and foreclosure alternatives and higher home prices in 2018, as well as an expansion at the beginning of 2017 of the charge-off criteria for non-liquidated loans pursuant to the provisions of the Advisory Bulletin. The decline in single-family credit losses and credit loss ratio in the first nine months of 2018 was partially offset by higher charge-offs related to the redesignation of single-family loans from HFI to HFS.
Our single-family initial charge-off severity rates declined in the third quarter and first nine months of 20182019 compared with the third quarter and first nine months of 20172018 primarily as a result of higherdue to reduced foreclosures and foreclosure alternatives, lower charge-off expenses on the loans we redesignated from HFI to HFS, and lower charge-off severity rates due to continued home pricesprice appreciation.
For information on our credit-related income or expense, which includes changes in 2018.
|
| | |
Fannie Mae Third Quarter 2018 Form 10-Q | 35 |
Single-Family Loss Reserves
Our single-family loss reserves, which include our allowance for loan losses and reserve for guaranty losses, provide for an estimate of credit losses incurred in our single-family guaranty book of business, including concessions we granted borrowers upon modification of their loans. The table below summarizes the changes in our single-family loss reserves.
| | Single-Family Loss Reserves | | | For the Three Months Ended September 30, | | For the Nine Months Ended September 30, | | For the Three Months Ended September 30, | | | For the Nine Months Ended September 30, |
| | 2018 | | 2017 | | 2018 | | 2017 | | 2019 | | 2018 | | | 2019 | | 2018 |
| | (Dollars in millions) | | (Dollars in millions) |
| Changes in loss reserves: | | | | | | | | | | | | | | | |
| Beginning balance | $ | (16,638 | ) | | $ | (20,553 | ) | | $ | (19,155 | ) | | $ | (23,639 | ) | | $ | (11,239 | ) | | $ | (16,638 | ) | | $ | (14,007 | ) | | $ | (19,155 | ) |
| Benefit (provision) for credit losses | 732 |
| | (137 | ) | | 2,223 |
| | 1,518 |
| |
| Benefit for credit losses | | | 1,840 |
| | 732 |
| | 3,753 |
| | 2,223 |
|
| Charge-offs | 514 |
| | 455 |
| | 1,728 |
| | 2,221 |
| | 274 |
| | 514 |
| | 1,221 |
| | 1,728 |
|
| Recoveries | (84 | ) | | (73 | ) | | (255 | ) | | (370 | ) | | (19 | ) | | (84 | ) | | (106 | ) | | (255 | ) |
Other(1) | (2 | ) | | 17 |
| | (19 | ) | | (21 | ) | | (1 | ) | | (2 | ) | | (6 | ) | | (19 | ) |
| Ending balance | $ | (15,478 | ) | | $ | (20,291 | ) | | $ | (15,478 | ) | | $ | (20,291 | ) | | $ | (9,145 | ) | | $ | (15,478 | ) | | $ | (9,145 | ) | | $ | (15,478 | ) |
| | | | | | | | | | | | | | | | |
| | | | | | As of | | | | | | | As of |
| | | | | | September 30, 2018 | | December 31, 2017 | | | | | | | September 30, 2019 | | December 31, 2018 |
| Loss reserves as a percentage of single-family: | | | | | | | | |
| Guaranty book of business | | | | | 0.52 | % | | 0.65 | % | |
| Loss reserves as a percentage of: | | | | | | | | | |
| Single-family guaranty book of business | | | | | | | 0.31 | % | | 0.49 | % |
| Recorded investment in nonaccrual loans | | | | | 47.52 |
| | 40.80 |
| | | | | | 31.48 |
| | 44.24 |
|
__________
|
| | |
(1)
Fannie Mae Third Quarter 2019 Form 10-Q | Amounts represent the portion of single-family benefit (provision) for credit losses, charge-offs and recoveries that are not a part of loss reserves.38 |
|
| | |
| MD&A | Single-Family Business |
Troubled Debt Restructurings and Nonaccrual Loans
The table below displays the single-family loans classified as TDRs that arewere on accrual status and single-family loans on nonaccrual status. The table includes our recorded investment in HFI and HFS single-family mortgage loans. For information on the impact of TDRs and other individually impaired loans on our allowance for loan losses, see “Note 3, Mortgage Loans.”
| | | Single-Family Troubled Debt Restructurings on Accrual Status and Nonaccrual Loans | |
| Single-Family TDRs on Accrual Status and Nonaccrual Loans | | Single-Family TDRs on Accrual Status and Nonaccrual Loans | |
| | As of | As of |
| | September 30, 2018 | | December 31, 2017 | September 30, 2019 | | December 31, 2018 |
| | (Dollars in millions) | (Dollars in millions) |
| TDRs on accrual status | | $ | 104,569 |
| | $ | 110,043 |
| | | $ | 89,083 |
| | $ | 98,320 |
| |
| Nonaccrual loans | | 32,571 |
| | | | 46,945 |
| | | 29,051 |
| | 31,658 |
| |
| Total TDRs on accrual status and nonaccrual loans | | $ | 137,140 |
| | | | $ | 156,988 |
| | | $ | 118,134 |
| | $ | 129,978 |
| |
Accruing on-balance sheet loans past due 90 days or more(1) | | $ | 243 |
| | $ | 353 |
| | | $ | 198 |
| | $ | 228 |
| |
|
| | | | | | | | | | | |
| | | For the Nine Months | |
| | | Ended September 30, | |
| | | 2018 | | | | 2017 | |
| | | (Dollars in millions) | |
| Interest related to on-balance sheet TDRs on accrual status and nonaccrual loans: | | | | | | | |
Interest income forgone(2) | | $ | 1,680 |
| | | | $ | 2,616 |
| |
Interest income recognized(3) | | 4,141 |
| | | | 4,247 |
| |
|
| | |
Fannie Mae Third Quarter 2018 Form 10-Q | 36 |
__________ |
| | | | | | | | | | | |
| | | For the Nine Months Ended September 30, | |
| | | |
| | | 2019 | | | | 2018 | |
| | | (Dollars in millions) | |
| Interest related to on-balance sheet TDRs on accrual status and nonaccrual loans: | | | | | | | |
Interest income forgone(2) | | $ | 1,280 |
| | | | $ | 1,680 |
| |
Interest income recognized(3) | | 3,614 |
| | | | 4,141 |
| |
| |
(1) | Includes loans that, as of the end of each period, are 90 days or more past due and continuing to accrue interest. The majority of these amounts consistsconsist of loans insured or guaranteed by the U.S. government and loans for which we have recourse against the seller in the event of a default. |
| |
(2) | Represents the amount of interest income we did not recognize, but would have recognized during the period for nonaccrual loans and TDRs on accrual status as of the end of each period had the loans performed according to their original contractual terms. |
| |
(3) | Includes primarily amounts accrued while the loans were performing and cash payments received on nonaccrual loans. |
The post-modification unpaid principal balance of single-family HFI and HFS loans classified as TDRs as of September 30, 2018 was Multifamily Business$134.8 billion, compared with $146.4 billion as of December 31, 2017. This decrease in loans classified as TDRs was primarily attributable to HFS loan sales in the first nine months of 2018, in addition to other removals, and was partially offset by a higher volume of single-family loan modifications and other forms of loss mitigation in the areas affected by the 2017 hurricanes that resulted in a restructuring of the terms of these loans.
|
| | |
Fannie Mae Third Quarter 2018 Form 10-Q | 37 |
Multifamily Business
Our Multifamily business provides mortgage market liquidity primarily for properties with five or more residential units, which may be apartment communities, cooperative properties, seniors housing, dedicated student housing or manufactured housing communities.
This section supplements and updates information regarding our Multifamily business segment in our 2018 Form 10-K. See “MD&A—Multifamily Business” in our 2018 Form 10-K for additional information regarding the primary business activities, customers, competition and market share of our Multifamily business.
Presentation of our multifamily guaranty book of business
For purposes of the information reported in this “Multifamily Business” section, we measure our multifamily guaranty book of business by using the unpaid principal balance of mortgage loans underlying Fannie Mae MBS. By contrast, the multifamily guaranty book of business presented in the “Composition of Fannie Mae Guaranty Book of Business” table in the “Guaranty Book of Business” section is based on the unpaid principal balance of the Fannie Mae MBS outstanding, rather than the unpaid principal balance of the underlying mortgage loans. These amounts differ primarily as a result of payments we receive on underlying loans that have not yet been remitted to the MBS holders. As measured for purposes of the information reported below, the unpaid principal balance of our multifamily guaranty book of business was $329.6 billion as of September 30, 2019 and $305.9 billion as of December 31, 2018.
Multifamily Mortgage Market
National multifamily market fundamentals, which include factors such as vacancy rates and rents, showed improvementremained steady during the third quarter of 2018 despite an increase in new apartment supply. As a result of continued multifamily demand, the national estimated vacancy level decreased during the third quarter of 2018, remaining near historic lows.2019, most likely due to ongoing job growth, favorable demographic trends, and renter household formations.
| |
| • | Vacancy rates. According toBased on preliminary third-party data, the national multifamily vacancy rate for institutional investment-type apartment properties was anis estimated to have remained at 5.3% as ofat September 30, 2018, compared with 5.5%2019, which was the same as of June 30, 2018.2019. |
| |
| • | Rents. Rents continuedEffective rents are estimated to increasehave increased during the third quarter of 2018. National2019, with national asking rents increasedincreasing by an estimated 0.8%, in the third quarter of 2019, compared with 1.5%1.0% during the second quarter of 2018.2019. |
|
| | |
| Fannie Mae Third Quarter 2019 Form 10-Q | 39 |
|
| | |
| MD&A | Multifamily Business |
Continued demand for multifamily rental units during the third quarter of 20182019 was reflected in the estimated positive net absorption (that is, the net change in the number of occupied rental units during the time period) of approximately 36,00033,000 units, according to preliminary data from Reis, Inc., compared with approximately 40,00049,000 units during the second quarter of 2018.2019.
Vacancy rates and rents are important to loan performance because multifamily loans are generally repaid from the cash flows generated by the underlying property. Several years of improvement in these fundamentals hashave helped to increase property values in most metropolitan areas. It is estimated that approximately 423,000424,000 new multifamily units will be completed in 2018.2019. The bulk of this new supply is concentrated in a limited number of metropolitan areas. Although multifamily fundamentals remain positive, we believe increasing supply will result in a continuing slowdown in national net absorption rates and effective rents for the remainder of 2019 compared with recent years.
Multifamily Business Metrics
WeThrough the secondary mortgage market, we support affordability inrental housing for the multifamily rental market. We enabledworkforce population, for senior citizens and students and for families with the financing of 206,000 multifamily units from new business volume in the third quarter of 2018, compared with 189,000 units in the third quarter of 2017.greatest economic need. Over 90% of the multifamily units we financed in the third quarter of 20182019 were affordable to families earning at or below 120% of the median income in their area, providing support for both workforce housing and affordable housing.
Multifamily New Business Volume(1)
(Dollars in billions)
__________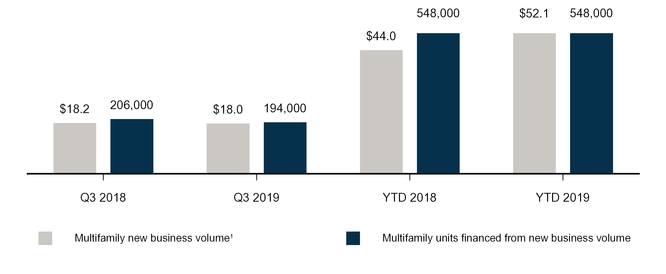
| |
(1) | Reflects unpaid principal balance of multifamily Fannie Mae MBS issued, multifamily loans purchased, and credit enhancements provided on multifamily mortgage assets during the period. |
|
| | |
Fannie Mae Third Quarter 2018 Form 10-Q | 38 |
FHFA’s 20182019 conservatorship scorecard includesincluded an objective to maintain the dollar volume of new multifamily business at or below $35 billion for the year, excluding certain targeted affordable and underserved market business segments.segments such as loans financing energy or water efficiency improvements. Approximately 42%44% of our multifamily new business volume of $44.0$52.1 billion for the first nine months of 20182019 counted toward FHFA’s 20182019 multifamily volume cap.
On September 13, 2019, FHFA announced a revised multifamily business volume cap structure. The chart below displaysnew multifamily volume cap, which replaced the prior cap effective October 1, 2019, is $100 billion for the five-quarter period ending December 31, 2020. The new cap applies with no exclusions. In addition, FHFA directed that 37.5% of our multifamily MBS outstanding as of September 30, 2018 compared with December 31, 2017.business during that time period must be mission-driven, affordable housing, pursuant to FHFA’s guidelines for mission-driven loans.
Multifamily Fannie Mae MBS Outstanding
(Dollars in billions) |
| | |
| Fannie Mae Third Quarter 2019 Form 10-Q | 40 |
|
| | |
| MD&A | Multifamily Business |
Multifamily Business Financial Results
|
| | | | | | | | | | | | | | | | | | | | | | | |
| Multifamily Business Financial Results |
| | For the Three Months Ended September 30, | | For the Nine Months Ended September 30, |
| | 2018 | | 2017 | | Variance | | 2018 | | 2017 | | Variance |
| | (Dollars in millions) |
| Net interest income | $ | 699 |
| | $ | 647 |
| | $ | 52 |
| | $ | 2,024 |
| | $ | 1,873 |
| | $ | 151 |
|
| Fee and other income | 192 |
| | 189 |
| | 3 |
| | 524 |
| | 604 |
| | (80 | ) |
| Net revenues | 891 |
| | 836 |
| | 55 |
| | 2,548 |
| | 2,477 |
| | 71 |
|
| Fair value gains (losses), net | (31 | ) | | 11 |
| | (42 | ) | | (69 | ) | | (23 | ) | | (46 | ) |
| Administrative expenses | (104 | ) | | (84 | ) | | (20 | ) | | (317 | ) | | (253 | ) | | (64 | ) |
Credit-related expense(1) | (25 | ) | | (28 | ) | | 3 |
| | (6 | ) | | (23 | ) | | 17 |
|
Other expenses, net(2) | (75 | ) | | (80 | ) | | 5 |
| | (209 | ) | | (237 | ) | | 28 |
|
| Income before federal income taxes | 656 |
| | 655 |
| | 1 |
| | 1,947 |
| | 1,941 |
| | 6 |
|
| Provision for federal income taxes | (107 | ) | | (164 | ) | | 57 |
| | (314 | ) | | (481 | ) | | 167 |
|
| Net income | $ | 549 |
| | $ | 491 |
| | $ | 58 |
| | $ | 1,633 |
| | $ | 1,460 |
| | $ | 173 |
|
__________ |
| | | | | | | | | | | | | | | | | | | | | | | | |
| | | For the Three Months Ended September 30, | | | | For the Nine Months Ended September 30, | | |
| | | 2019 | | 2018 | | Variance | | 2019 | | 2018 | | Variance |
| | | (Dollars in millions) |
| Net interest income | | $ | 745 |
| | $ | 699 |
| | $ | 46 |
| | $ | 2,170 |
| | $ | 2,024 |
| | $ | 146 |
|
| Fee and other income | | 246 |
| | 192 |
| | 54 |
| | 525 |
| | 524 |
| | 1 |
|
| Net revenues | | 991 |
| | 891 |
| | 100 |
| | 2,695 |
| | 2,548 |
| | 147 |
|
| Fair value gains (losses), net | | 6 |
| | (31 | ) | | 37 |
| | 66 |
| | (69 | ) | | 135 |
|
| Administrative expenses | | (115 | ) | | (104 | ) | | (11 | ) | | (338 | ) | | (317 | ) | | (21 | ) |
Credit-related income (expense)(1) | | 14 |
| | (25 | ) | | 39 |
| | (23 | ) | | (6 | ) | | (17 | ) |
Other expenses, net(2) | | (92 | ) | | (75 | ) | | (17 | ) | | (197 | ) | | (209 | ) | | 12 |
|
| Income before federal income taxes | | 804 |
| | 656 |
| | 148 |
| | 2,203 |
| | 1,947 |
| | 256 |
|
| Provision for federal income taxes | | (164 | ) | | (107 | ) | | (57 | ) | | (427 | ) | | (314 | ) | | (113 | ) |
| Net income | | $ | 640 |
| | $ | 549 |
| | $ | 91 |
| | $ | 1,776 |
| | $ | 1,633 |
| | $ | 143 |
|
| |
(1) | Consists of the benefit or provision for credit losses and foreclosed property income (expense).or expense. |
| |
(2) | Consists of investment gains, gains (losses) onor losses from partnership investments and other income (expenses).or expenses. |
Net interest income
Multifamily net interest income is primarily driven by guaranty fee income. Guaranty fee income increased in the third quarter and first nine months of 20182019 as compared with the third quarter and first nine months of 2017, primarily due to continued2018 as a result of growth ofin our multifamily guaranty book of business.business, partially offset by a decrease in charged guaranty fees on the guaranty book.
|
| | |
Fannie Mae Third Quarter 2018 Form 10-Q | 39 |
__________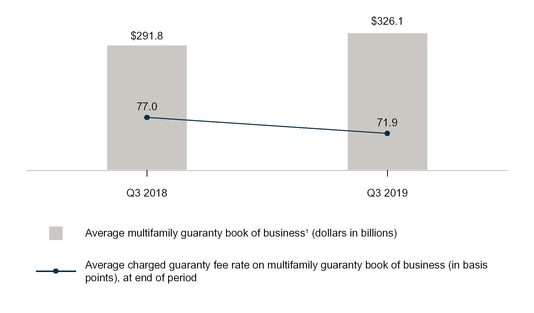
| |
(1) | Our multifamily guaranty book of business consists of: (a) multifamily mortgage loans of Fannie Mae; (b) multifamily mortgage loans underlying Fannie Mae MBS;MBS outstanding, multifamily mortgage loans of Fannie Mae held in our retained mortgage portfolio, and (c) other credit enhancements that we provide on multifamily mortgage assets. It excludes non-Fannie Mae multifamily mortgage-related securities held in our retained mortgage portfolio for which we do not provide a guaranty. |
Our average charged guaranty fee has trended downward from 2018 to 2019, driven by competitive market pressure on guaranty fees charged on newly acquired multifamily loans and liquidations of loans with higher guaranty fees.
Fee and Other Incomeother income
Fee and other income decreasedin all periods presented was primarily driven by yield maintenance fees resulting from prepayment activity.
|
| | |
| Fannie Mae Third Quarter 2019 Form 10-Q | 41 |
|
| | |
| MD&A | Multifamily Business |
Fair value gains (losses), net
Depending on portfolio activity, our Multifamily business may be in a net buy or net sell position during any given period. Fair value gains in the first nine months of 2018 compared with the first nine months of 20172019 were primarily driven by lower yield maintenance feesgains on commitments to buy multifamily mortgage-related securities as a result of increases in prices as interest rates declined during the first nine months of 2018.
Fair value gains (losses), netcommitment periods.
Fair value losses in the third quarter and first nine months of 2018 were primarily driven by losses on commitments to buy multifamily mortgage-related securities due to increasingas a result of decreases in prices as interest rates resulting in decreasing pricesrose during the commitment periods.
Fair value losses in the first nine months of 2017 were primarily driven by losses on commitments to sell multifamily mortgage-related securities as a result of increases in prices during the commitment periods.
Credit-related expense
Credit-related expense in the third quarter and first nine months of 2018 was due to an increase in the allowance for loan losses primarily driven by a slight increase in downgrades in loan risk ratings.
Credit-related expense in the third quarter and first nine months of 2017 was primarily driven by an increase in our allowance for loan losses, which included estimated losses from the 2017 hurricanes.
Multifamily Mortgage Credit Risk Management
This section updates our discussion of multifamily mortgage credit risk management in our 20172018 Form 10-K in “MD&A—Business Segments—Multifamily Business—Multifamily Mortgage Credit Risk Management.”
Multifamily Acquisition Policy and Underwriting Standards
Our standards for multifamily loans specify maximum original LTV ratio and Portfolio Monitoringminimum original debt service coverage ratio (“DSCR”) values that vary based on loan characteristics. Our experience has been that original LTV ratio and DSCR values have been reliable indicators of future credit performance.
At underwriting, we evaluate the DSCR based on both actual and underwritten debt service payments. Underwritten debt service payments are based on debt service calculations that include both principal and interest payments. The original DSCR for the loan is calculated using these underwritten debt service payments rather than the actual debt service payments, which, depending on the interest rate of the loan and loan structure, may result in a more conservative estimate of the debt service payments. This approach is used for all loans, including those with full and partial interest-only terms.
The following table displays key risk characteristics of our multifamily guaranty book of business.
|
| | | | | | | | | | | |
| Key Risk Characteristics of Multifamily Guaranty Book of Business |
| | As of |
| | September 30,
2019 | | December 31, 2018 | | September 30,
2018 |
| Weighted average original LTV ratio | | 66 | % | | | 66 | % | | | 67 | % |
| Original LTV ratio greater than 80% | | 1 | | | | 1 | | | | 1 | |
| Original DSCR less than or equal to 1.10 | | 11 |
|
|
| 12 |
|
|
| 13 | |
| Full interest-only loans | | 26 | | | | 24 | | | | 23 | |
Partial interest-only loans(1) | | 50 | | | | 49 | | | | 48 | |
| |
(1) | Consists of mortgage loans that were underwritten with an interest-only term, regardless of whether the loan is currently in its interest-only period. |
We provide additional information on the credit characteristics of our multifamily loans in quarterly financial supplements, which we submit to the SEC with current reports on Form 8-K. Information in our quarterly financial supplements is not incorporated by reference into this report.
Transfer of Multifamily Mortgage Credit Risk
Lender risk-sharing is a cornerstone of our Multifamily business. We primarily transfer risk through our Delegated Underwriting and Servicing (“DUS®”) program, which delegates to DUS lenders the ability to underwrite and service multifamily loans, in accordance with our standards and requirements. DUS lenders receive credit risk-related revenues for their respective portion of credit risk retained, and, in turn, are required to fulfill any loss
|
| | |
Fannie Mae Third Quarter 2018 Form 10-Q | 40 |
sharing obligation. This aligns the interests of the lender and Fannie Mae from day one and throughout the life of the loan.
Our DUS model typically results in our lenders sharing on a pro-rata or tiered basis approximately one-third of the credit risk on our multifamily loans. In the first nine months of 2018,2019, nearly 100% of our new multifamily business volume had lender risk-sharing. As of September 30, 2019 and December 31, 2018, 97%98% of the unpaid principal balance of loans in our multifamily guaranty book of business had lender risk-sharing, compared with 96% as of December 31, 2017.risk-sharing.
To complement our lender-risk sharinglender risk-sharing program through our DUS model, we engage in multifamily CIRT transactions, pursuant to which we transfer a portion of the mortgage credit risk on multifamily loans in our multifamily guaranty book of business to insurers or reinsurers. In August 2018,As of September 30, 2019, we have completed our thirdsix multifamily CIRT transactiontransactions since the inception of the program, which covered multifamily loans with an unpaid principal balance of approximately $11.1 billion.$62.0 billion at the time of the transactions. As of September 30, 2019, 18% of the loans in our multifamily guaranty book of business, measured by unpaid principal balance, were covered by a CIRT transaction. We plan to continue to transfersupport the growth of the credit risk throughtransfer market and expand the types of loans covered in our credit risk transfer programs.
|
| | |
| Fannie Mae Third Quarter 2019 Form 10-Q | 42 |
|
| | |
| MD&A | Multifamily Business |
Multifamily Portfolio Diversification and Monitoring
Diversification within our multifamily CIRT transactions in the future.book of business by geographic concentration, term to maturity, interest rate structure, borrower concentration, loan size and credit enhancement coverage, are important factors that influence credit performance and help reduce our credit risk.
WeAs part of our ongoing credit risk management process, we and our lenders monitor the performance and risk characteristics of our multifamily loans and the underlying properties on an ongoing basis throughout the loan term at the asset and portfolio level. Our standardsWe require lenders to provide quarterly and annual financial updates for multifamilythe loans specify maximum original LTV ratio and minimum original debt service coverage ratio (“DSCR”) values that vary based on loan characteristics.for which we are contractually entitled to receive such information. We closely monitor loans with an estimated current DSCR below 1.0, as that is an indicator of heightened default risk. The table below displays original LTV ratio and DSCR metrics forpercentage of loans in our multifamily guaranty book of business.business, calculated based on unpaid principal balance, with a current DSCR less than 1.0 was approximately 2% as of September 30, 2019 and December 31, 2018. Our estimates of current DSCRs are based on the latest available income information for these properties and exclude co-op loans. Although we use the most recently available results from our multifamily borrowers, there is a lag in reporting, which typically can range from three to six months, but in some cases may be longer. |
| | | | | | | | | | | | | | |
| Multifamily Guaranty Book of Business Key Risk Characteristics |
| | As of |
| | September 30, 2018 | | December 31, 2017 | | September 30,
2017 |
| Weighted average original LTV ratio | | 67 | % | | | | 67 | % | | | | 67 | % | |
| Original LTV ratio greater than 80% | | 1 |
| | | | 2 |
| | | | 2 |
| |
| Original DSCR less than or equal to 1.10 | | 13 |
| | | | 14 |
| | | | 14 |
| |
| Current DSCR less than 1.0 | | 2 |
| | | | 2 |
| | | | 1 |
| |
the physical condition of the property;
the relevant local market and economic conditions that may signal changing risk or return profiles; and
other risk factors.
The percentage of our multifamily loans categorized as substandard based on these characteristics increased throughout 2018, but decreased as of September 30, 2019 as compared with December 31, 2018 and remains at historically low levels. Substandard loans are loans that have a well-defined weakness that could impact the timely full repayment. While the vast majority of the substandard loans in our multifamily guaranty book of business are currently making timely payments, we continue to monitor the performance of the full substandard loan population.
Multifamily Problem Loan Management and Foreclosure Prevention
The multifamily serious delinquency rate was 0.06% as of September 30, 2019 and December 31, 2018 and 0.07% as of September 30, 2018, compared with 0.11% as of December 31, 2017 and 0.03% as of September 30, 2017.2018. We classify multifamily loans as seriously delinquent when payment is 60 days or more past due. The decrease in the multifamily serious delinquency rate since December 31, 2017 resulted mostly from a decrease in delinquent loans subject to forbearance agreements granted to borrowers in the areas affected by the 2017 hurricanes.
REO Management
The number of multifamily foreclosed properties held for sale increased to 13 properties with a carrying value of $79 million as of September 30, 2018, compared with 11 properties with a carrying value of $66 million as of December 31, 2017.
Other Multifamily Credit Information
Multifamily Credit LossesLoss Performance Metrics
The amount of credit loss or income we realize in a given period is driven by foreclosures, pre-foreclosure sales, REO activity and charge-offs, net of recoveries. Our credit loss performance metrics are not defined terms within GAAP and may not be calculated in the same manner as similarly titled measures reported by other companies. We believe our credit loss performance metrics may be useful to investors because they have historically been used by analysts, investors and other companies within the financial services industry.
We had $7$5 million in multifamily credit losses in the third quarter of 20182019 compared with a benefit for credit losses of $16$7 million in the third quarter of 2017.2018. We had $15$6 million in multifamily credit losses in the first nine months of 20182019 compared with a benefit for credit losses of $14$15 million in the first nine months of 2017. The benefit for credit2018.
Credit losses for both 2017 periods wasin the resultthird quarter of recoveries2019 were primarily driven by foreclosed property expenses. Credit losses in the first nine months of previously charged-off amounts.
|
| | |
Fannie Mae Third Quarter 2018 Form 10-Q | 41 |
Multifamily Loss Reserves
The table below summarizes the changes in our multifamily loss reserves.reserves, which includes our allowance for loan losses and our reserve for guaranty losses for multifamily loans.
| | | Multifamily Loss Reserves | | | | | | | | Multifamily Loss Reserves | |
| | For the Three Months Ended September 30, | | For the Nine Months Ended September 30, | | For the Three Months Ended September 30, | | For the Nine Months Ended September 30, | |
| | 2018 | | 2017 | | 2018 | | 2017 | | 2019 | | 2018 | | 2019 | | 2018 | |
| | (Dollars in millions) | | (Dollars in millions) | |
| Changes in loss reserves: | | | | | | | | | | | | | | | | |
| Beginning balance | $ | (218 | ) | | $ | (189 | ) | | $ | (245 | ) | | $ | (196 | ) | | $ | (281 | ) | | $ | (218 | ) | | $ | (245 | ) | | $ | (245 | ) | |
| Benefit (provision) for credit losses | (16 | ) | | (45 | ) | | 6 |
| | (37 | ) | | 17 |
| | (16 | ) | | (21 | ) | | 6 |
| |
| Charge-offs | 1 |
| | 3 |
| | 6 |
| | 3 |
| | 3 |
| | 1 |
| | 7 |
| | 6 |
| |
| Recoveries | (3 | ) | | (2 | ) | | (3 | ) | | (3 | ) | | (1 | ) | | (3 | ) | | (3 | ) | | (3 | ) | |
| Ending balance | $ | (236 | ) | | $ | (233 | ) | | $ | (236 | ) | | $ | (233 | ) | | $ | (262 | ) | | $ | (236 | ) | | $ | (262 | ) | | $ | (236 | ) | |
| | | | | | | | | | | | | | | | | |
| | | | As of | | | | As of | |
| | | September 30, 2018 | | December 31, 2017 | | | September 30, 2019 | | December 31, 2018 | |
| Loss reserves as a percentage of multifamily guaranty book of business | Loss reserves as a percentage of multifamily guaranty book of business | | 0.08 | % | | 0.09 | % | Loss reserves as a percentage of multifamily guaranty book of business | | 0.08 | % | | 0.08 | % | |
Troubled Debt Restructurings and Nonaccrual Loans
The table below displays the composition of multifamily loans classified as TDRs that arewere on accrual status and multifamily loans on nonaccrual status. The table includes our recorded investment in HFI and HFS multifamily mortgage loans. For information on the impact of TDRs and other individually impaired loans on our allowance for loan losses, see “Note 3, Mortgage Loans.”
| | | Multifamily Troubled Debt Restructurings on Accrual Status and Nonaccrual Loans | | | | |
| Multifamily TDRs on Accrual Status and Nonaccrual Loans | | Multifamily TDRs on Accrual Status and Nonaccrual Loans |
| | As of | | As of |
| | September 30, 2018 | | December 31, 2017 | | | September 30, 2019 | | December 31, 2018 | |
| | (Dollars in millions) | | (Dollars in millions) |
| TDRs on accrual status | $ | 63 |
| | $ | 87 |
| | | $ | 33 |
| | $ | 55 |
| |
| Nonaccrual loans | 554 |
| | 424 |
| | | 608 |
| | 492 |
| |
| Total TDRs on accrual status and nonaccrual loans | $ | 617 |
| | $ | 511 |
| | | $ | 641 |
| | $ | 547 |
| |
|
| | | | | | | | |
| | For the Nine Months | |
| | Ended September 30, | |
| | 2018 | | 2017 | |
| | (Dollars in millions) | |
| Interest related to on-balance sheet TDRs on accrual status and nonaccrual loans: | | | | |
Interest income forgone(1) | $ | 20 |
| | $ | 12 |
| |
Interest income recognized(2) | 2 |
| | 6 |
| |
__________ |
| | | | | | | | | |
| | | For the Nine Months Ended September 30, | |
| | | |
| | | 2019 | | 2018 | |
| | | (Dollars in millions) | |
| Interest related to on-balance sheet TDRs on accrual status and nonaccrual loans: | | | | | |
Interest income forgone(1) | | $ | 18 |
| | $ | 20 |
| |
Interest income recognized(2) | | 5 |
| | 2 |
| |
| |
(1) | Represents the amount of interest income we did not recognize, but would have recognized during the period for nonaccrual loans and TDRs on accrual status as of the end of each period had the loans performed according to their original contractual terms. |
| |
(2) | Represents interest income recognized during the period, including the amortization of any deferred cost basis adjustments, for loans classified as either nonaccrual loans or TDRs on accrual status as of the end of each period. Includes primarilyPrimarily includes amounts accrued while the loans were performing and cash payments received on nonaccrual loans.performing. |
REO Management
The number of multifamily foreclosed properties held for sale was 16 properties with a carrying value of $88 million as of September 30, 2019, compared with 16 properties with a carrying value of $81 million as of December 31, 2018.
|
| | |
Fannie Mae Third Quarter 20182019 Form 10-Q | 4243 |
|
| | |
| | MD&A | Liquidity and Capital Management |
Liquidity and Capital Management
|
| | | | |
Liquidity and Capital Management | | | | |
Liquidity Management
This section supplements and updates information regarding liquidity risk management in our 20172018 Form 10-K. See “MD&A—Liquidity and Capital Management—Liquidity Management” and “Risk Factors” in our 20172018 Form 10-K for additional information, including discussions of our primary sources and uses of funds, our liquidity and funding risk management practices and liquidity contingency planning, factors that influence our debt funding activity, factors that may impact our access to or the cost of our debt funding and factors that could adversely affect our liquidity.liquidity and funding.
Debt Funding
Outstanding Debt
Total outstanding debt of Fannie Mae includes short-term and long-term debt and excludes debt of consolidated trusts. Short-term debt of Fannie Mae consists of borrowings with an original contractual maturity of one year or less and, therefore, does not include the current portion of long-term debt. Long-term debt of Fannie Mae consists of borrowings with an original contractual maturity of greater than one year.
The chart and table below display information on our outstanding short-term and long-term debt of Fannie Mae based on original contractual maturity. The total amount ofincrease in our outstandingshort-term debt of Fannie Mae decreased as offrom December 31, 2018 to September 30, 2018 compared with2019 was primarily driven by an increase in our acquisition of mortgage loans through our whole loan conduit as mortgage refinance activity increased during the third quarter of 2019. The decrease in our long-term debt from December 31, 20172018 to September 30, 2019 was primarily due to lower funding needs asdriven by the decline in the size of our retained mortgage portfolio continuedportfolio. We did not issue new debt to decreasereplace all of our debt that paid off during the first nine months of 2018.
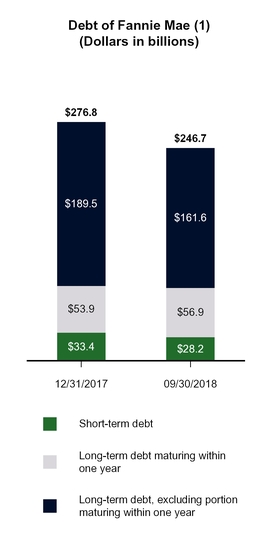
|
| | | | | | | | |
| Selected Debt Information |
| | | As of |
| | | December 31, 2017 | | September 30, 2018 |
| | | (Dollars in billions) |
Selected Weighted-Average Interest Rates(1) | | | | |
| Interest rate on short-term debt | | 1.18 | % | | 2.06 | % |
| Interest rate on long-term debt, including portion maturing within one year | | 2.40 | % | | 2.75 | % |
| Interest rate on callable long-term debt | | 2.31 | % | | 2.82 | % |
| Selected Maturity Data | | | | |
| Weighted-average maturity of debt maturing within one year (in days) | | 123 |
| | 149 |
|
| Weighted-average maturity of debt maturing in more than one year (in months) | | 57 |
| | 61 |
|
| Other Data | | | | |
| Outstanding callable debt | | $ | 72.3 |
| | $ | 67.1 |
|
Connecticut Avenue Securities(2) | | $ | 22.5 |
| | $ | 25.7 |
|
| | | | | |
| | | | | |
| | | | | |
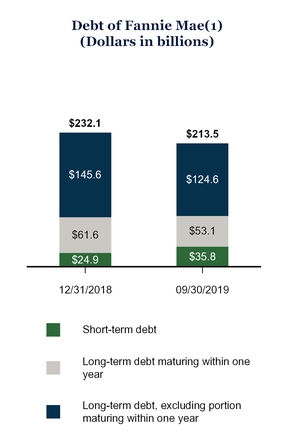
|
| | |
Fannie Mae Third Quarter 2018 Form 10-Q | 43 |
|
| | |
| MD&A | Liquidity and Capital Management |
__________ |
| | | | | | | | |
| Selected Debt Information |
| | | As of |
| | | December 31, 2018 | | September 30, 2019 |
| | | (Dollars in billions) |
Selected Weighted-Average Interest Rates(1) | | | | |
| Interest rate on short-term debt | | 2.29 | % | | 2.04 | % |
| Interest rate on long-term debt, including portion maturing within one year | | 2.83 | % | | 3.14 | % |
| Interest rate on callable long-term debt | | 2.95 | % | | 3.39 | % |
| Selected Maturity Data | | | | |
| Weighted-average maturity of debt maturing within one year (in days) | | 163 |
| | 110 |
|
| Weighted-average maturity of debt maturing in more than one year (in months) | | 63 |
| | 63 |
|
| Other Data | | | | |
| Outstanding callable long-term debt | | $ | 64.3 |
| | $ | 45.7 |
|
Connecticut Avenue Securities debt(2) | | $ | 25.6 |
| | $ | 23.0 |
|
| | | | | |
| | | | | |
| | | | | |
| |
(1) | Outstanding debt amounts and weighted-average interest rates reported in this chart and table include the effects of discounts, premiums, other cost basis adjustments and fair value gains and losses associated with debt that we elected to carry at fair value. Reported amounts for total debt of Fannie Mae include unamortized cost basis adjustments and fair value adjustments of $433$74 million and $788$432 million as of September 30, 20182019 and December 31, 2017,2018, respectively. |
| |
(2) | Represents CAS debt issued prior to the implementation of our CAS REMIC structure in November 2018. See “Business Segments—“MD&A—Single-Family Business—Single-Family Mortgage Credit Risk Management—Single-Family Credit Enhancement and Transfer of Mortgage Credit Risk—Credit Risk Transfer Transactions” in our 20172018 Form 10-K and in this report for information regarding our Connecticut Avenue Securities. |
We intend to repay our short-term and long-term debt obligations as they become due primarily through proceeds from the issuance of additional debt securities. We also may use proceeds from our mortgage assets to pay our debt obligations.
For more information on the maturity profile of our outstanding short-term and long-term debt, see “Note 7, Short-Term and Long-Term Debt.”
Debt Funding Activity
The table below displays the activity in debt of Fannie Mae. This activity excludes the debt of consolidated trusts and intraday loans. Activity for short-term debt of Fannie Mae relates to borrowings with an original contractual maturity of one year or less while activity for long-term debt of Fannie Mae relates to borrowings with an original contractual maturity of greater than one year. The reported amounts of debt issued and paid off during theeach period represent the face amount of the debt at issuance and redemption.
The increase in our debt issued and paid off during the third quarter of 2019 compared with the third quarter of 2018 was primarily driven by an increase in our acquisition of mortgage loans through our whole loan conduit as mortgage refinance activity increased during the third quarter of 2019. The decrease in debt issued and paid off during the first nine months of 2019 compared with the first nine months of 2018 was primarily driven by the decline in the size of our retained mortgage portfolio. We did not issue new debt to replace all of our debt that paid off during the first nine months of 2019.
|
| | | | | | | | | | | | | | | |
| Activity in Debt of Fannie Mae | | | | |
| | For the Three Months | | For the Nine Months |
| | Ended September 30, | | Ended September 30, |
| | 2018 | | 2017 | | 2018 | | 2017 |
| | (Dollars in millions) |
| Issued during the period: | | | | | | | |
| Short-term: | | | | | | | |
| Amount | $ | 106,520 |
| | $ | 199,940 |
| | $ | 446,914 |
| | $ | 513,635 |
|
| Weighted-average interest rate | 1.90 | % | | 0.97 | % | | 1.52 | % | | 0.78 | % |
Long-term:(1) | | | | | | | |
| Amount | $ | 6,032 |
| | $ | 6,435 |
| | $ | 17,595 |
| | $ | 25,457 |
|
| Weighted-average interest rate | 3.26 | % | | 2.44 | % | | 3.08 | % | | 2.44 | % |
| Total issued: | | | | | | | |
| Amount | $ | 112,552 |
| | $ | 206,375 |
| | $ | 464,509 |
| | $ | 539,092 |
|
| Weighted-average interest rate | 1.97 | % | | 1.02 | % | | 1.58 | % | | 0.85 | % |
Paid off during the period:(2) | | | | | | | |
| Short-term: | | | | | | | |
| Amount | $ | 103,256 |
| | $ | 197,034 |
| | $ | 451,295 |
| | $ | 515,220 |
|
| Weighted-average interest rate | 1.82 | % | | 0.93 | % | | 1.42 | % | | 0.71 | % |
Long-term:(1) | | | | | | | |
| Amount | $ | 12,668 |
| | $ | 21,123 |
| | $ | 42,854 |
| | $ | 60,419 |
|
| Weighted-average interest rate | 1.62 | % | | 1.35 | % | | 1.47 | % | | 2.81 | % |
| Total paid off: | | | | | | | |
| Amount | $ | 115,924 |
| | $ | 218,157 |
| | $ | 494,149 |
| | $ | 575,639 |
|
| Weighted-average interest rate | 1.79 | % | | 0.97 | % | | 1.43 | % | | 0.93 | % |
__________ |
| | | | | | | | | | | | | | | |
| Activity in Debt of Fannie Mae |
| | For the Three Months Ended September 30, | | For the Nine Months Ended September 30, |
| | |
| | 2019 | | 2018 | | 2019 | | 2018 |
| | (Dollars in millions) |
| Issued during the period: | | | | | | | |
| Short-term: | | | | | | | |
| Amount | $ | 161,434 |
| | $ | 106,520 |
| | $ | 418,202 |
| | $ | 446,914 |
|
| Weighted-average interest rate | 2.13 | % | | 1.90 | % | | 2.27 | % | | 1.52 | % |
Long-term:(1) | | | | | | | |
| Amount | $ | 6,940 |
| | $ | 6,032 |
| | $ | 18,335 |
| | $ | 17,595 |
|
| Weighted-average interest rate | 1.95 | % | | 3.26 | % | | 2.32 | % | | 3.08 | % |
| Total issued: | | | | | | | |
| Amount | $ | 168,374 |
| | $ | 112,552 |
| | $ | 436,537 |
| | $ | 464,509 |
|
| Weighted-average interest rate | 2.12 | % | | 1.97 | % | | 2.27 | % | | 1.58 | % |
Paid off during the period:(2) | | | | | | | |
| Short-term: | | | | | | | |
| Amount | $ | 147,507 |
| | $ | 103,256 |
| | $ | 406,135 |
| | $ | 451,295 |
|
| Weighted-average interest rate | 1.99 | % | | 1.82 | % | | 2.11 | % | | 1.42 | % |
Long-term:(1) | | | | | | | |
| Amount | $ | 23,246 |
| | $ | 12,668 |
| | $ | 48,156 |
| | $ | 42,854 |
|
| Weighted-average interest rate | 1.55 | % | | 1.62 | % | | 1.67 | % | | 1.47 | % |
| Total paid off: | | | | | | | |
| Amount | $ | 170,753 |
| | $ | 115,924 |
| | $ | 454,291 |
| | $ | 494,149 |
|
| Weighted-average interest rate | 1.93 | % | | 1.79 | % | | 2.06 | % | | 1.43 | % |
| |
(1) | Includes Connecticut Avenue Securities.credit risk-sharing securities issued as CAS debt prior to the implementation of our CAS REMIC structure in November 2018. For information on our credit risk transfer transactions, see “MD&A—Single Family Business—Single-Family Mortgage Credit Risk Management—Single-Family Credit Enhancement and Transfer of Mortgage Credit Risk—Credit Risk Transfer Transactions” in our 2018 Form 10-K and in this report. |
| |
(2) | Consists of all payments on debt, including regularly scheduled principal payments, payments at maturity, payments resulting from calls and payments for any other repurchases. Repurchases of debt and early retirements of zero-coupon debt are reported at original face value, which does not equal the amount of actual cash payment. |
|
| | |
Fannie Mae Third Quarter 20182019 Form 10-Q | 44 |
|
| | |
| | MD&A | Liquidity and Capital Management |
Other Investments Portfolio
The chart below displays information on the composition of our other investments portfolio. The balance of our other investments portfolio fluctuates based onas a result of changes in our cash flows, liquidity in the fixed incomefixed-income markets, and our liquidity risk management framework and practices.
Other Investments Portfolio
(Dollars in billions)
Cash Flows
Nine Months EndedSeptember 30, 2019. Cash, Flowscash equivalents and restricted cash increased from $49.4 billion as of December 31, 2018 to $64.5 billion as of September 30, 2019. The increase was primarily driven by cash inflows from (1) proceeds from repayments and sales of loans, (2) the sale of Fannie Mae MBS to third parties, and (3) the net decrease in federal funds sold and securities purchased under agreements to resell or similar agreements.
Partially offsetting these cash inflows were cash outflows primarily from (1) payments on outstanding debt of consolidated trusts, (2) purchases of loans held for investment, and (3) the redemption of funding debt, which outpaced issuances, due to lower funding needs.
Nine Months Ended September 30, 2018.Cash, cash equivalents and restricted cash decreased by $9.2from $60.3 billion in the nine months endedas of December 31, 2017 to $51.0 billion as of September 30, 2018. The decrease was primarily driven by cash outflows from (1) the purchase of Fannie Mae MBS from third parties, (2) the redemption of funding debt, which outpaced issuances, due to lower funding needs, (2) the purchase of Fannie Mae MBS from third parties, and (3) the acquisition of delinquent loans out of MBS trusts.
Partially offsetting these cash outflows were primarily cash inflows from, (1) the sale of Fannie Mae MBS to third parties and (2) proceeds from repayments and sales of loans of Fannie Mae.
Nine Months EndedSeptember 30, 2017. Cash, cash equivalents and restricted cash decreased by $10.1 billion in the nine months ended September 30, 2017. The decrease was primarily driven by cash outflows from (1) the purchase of Fannie Mae MBS from third parties, (2) the redemption of funding debt, which outpaced issuances, due to lower funding needs, and (3) the payment of dividends to Treasury under our senior preferred stock purchase agreement.
Partially offsetting these cash outflows were primarily cash inflows fromamong other things, (1) the sale of Fannie Mae MBS to third parties and (2) proceeds from repayments and sales of loans of Fannie Mae.
Credit Ratings
In June 2018, upon reexamining the termsAs of our subordinated debt, Standard & Poor’s Ratings Services (“S&P”) both revised its rating on our outstanding rated subordinated debt from "AA-" to "AA" and announced that it was withdrawing its rating on our subordinated debt program due to our program no longer being active. There have been no other changes inSeptember 30, 2019, our credit ratings have not changed since we filed our 20172018 Form 10-K.10-K. For information on our credit ratings, see “MD&A—&A—Liquidity and Capital Management—Management—Liquidity Management—Management—Credit Ratings” in our 20172018 Form 10-K.
Capital Management
Regulatory Capital
The deficit of our core capital over statutory minimum capital was $133.8 billion as of September 30, 2019 and $137.1 billion as of December 31, 2018. For information on our current and proposed capital requirements, see “Business—Charter Act and
|
| | |
Fannie Mae Third Quarter 20182019 Form 10-Q | 45 |
|
| | |
| | MD&A | Liquidity and Capital Management |
Capital Management
Regulatory Capital
The deficit of our core capital over statutory minimum capital was $136.7 billion as of September 30, 2018Regulation—GSE Act and $144.4 billion as of December 31, 2017. For information on our minimum capital requirements, seeOther Regulation” and “Note 12, Regulatory Capital Requirements” and “Business—Legislation and Regulation—GSE Act and Other Regulation of Our Business—Capital” in our 20172018 Form 10-K and “MD&A—Legislation“Legislation and Regulation”Regulation—Housing Finance Reform” in our Second Quarter 2018 Form 10-Q.this report.
Capital Activity
The currentUnder the modified dividend provisions of the senior preferred stock providedescribed in “Legislation and Regulation—Letter Agreement with Treasury,” effective with the third quarter 2019 dividend period, we are not required to pay further dividends to Treasury until we have accumulated over $25 billion in net worth. Accordingly, no dividends were payable to Treasury for quarterly dividends consistingthe third quarter of 2019 and none are payable for the amount, if any, by whichfourth quarter of 2019. As of September 30, 2019, our net worth aswas $10.3 billion.
Under the modified liquidation preference provisions of the endsenior preferred stock described in “Legislation and Regulation—Letter Agreement with Treasury,” the aggregate liquidation preference of the immediately preceding fiscal quarter exceeds a $3.0 billion capital reserve amount. Because we had a net worth of $7.5senior preferred stock increased from $123.8 billion as of June 30, 2018, we paid Treasury a third quarter 2018 dividend of $4.5 billion. We expect2019 to pay Treasury a fourth quarter 2018 dividend of $4.0 billion by December 31, 2018 based on our net worth of $7.0$127.2 billion as of September 30, 2018.
See “Business—Conservatorship2019, and Treasury Agreements—Treasury Agreements” and “Business—Legislative and Regulation—GSE Act and Other Regulationwill further increase to $131.2 billion as of Our Business—Conservatorship Capital Framework” in our 2017 Form 10-K for more information on the terms of our senior preferred stock, our senior preferred stock purchase agreement with Treasury and our conservatorship capital framework. See “Risk Factors” in our 2017 Form 10-K for a discussion of the risks associated with the limit on our capital reserves.December 31, 2019.
Off-Balance Sheet Arrangements
|
| | | | |
Off-Balance Sheet Arrangements |
Our off-balance sheet arrangements result primarily from the following:
our guaranty of mortgage loan securitization and resecuritization transactions, and other guaranty commitments, over which we do not have control;
liquidity support transactions; and
partnership interests.
Since we began issuing UMBS in June 2019, some of the securities we issue are structured securities backed, in whole or in part, by Freddie Mac securities. When we issue a structured security, we provide a guaranty that we will supplement amounts received from the underlying mortgage-related security as required to permit timely payment of principal and interest on the certificates related to the resecuritization trust. Accordingly, when we issue structured securities backed in whole or in part by Freddie Mac securities, we extend our guaranty to the underlying Freddie Mac security included in the structured security. Our issuance of structured securities backed in whole or in part by Freddie Mac securities creates additional off-balance sheet exposure as we do not have control over the Freddie Mac mortgage loan securitizations. Because we do not have the power to direct matters (primarily the servicing of mortgage loans) that impact the credit losses is primarilyrisk to which we are exposed, which constitute control of these securitization trusts, we do not consolidate these trusts in our condensed consolidated balance sheet, giving rise to off-balance sheet exposure.
The total amount of our off-balance sheet exposure related to unconsolidated Fannie Mae MBS net of any beneficial interest that we retain, and other financial guarantees was $48.5 billion as of September 30, 2019. Approximately $23.0 billion of this amount consisted of the unpaid principal balance of Freddie Mac-issued UMBS backing Fannie Mae-issued Supers. Additionally, off-balance sheet exposure includes approximately $5.9 billion of the unpaid principal balance of Freddie Mac securities backing Fannie Mae-issued REMICs; however, a portion of these Freddie Mac securities may be backed in whole or in part by Fannie Mae MBS. Therefore, our total exposure to Freddie Mac securities included in Fannie Mae REMIC collateral may be lower. We expect our off-balance sheet exposure to Freddie Mac securities to increase as we issue more structured securities backed by Freddie Mac securities in the future. The total amount of our off-balance sheet exposure related to unconsolidated Fannie Mae MBS and other financial guarantees. This exposureguarantees was $21.5 billion as of September 30, 2018 and $25.1$21.1 billion as of December 31, 2017.2018. We did not have any Freddie Mac-issued UMBS backing Fannie Mae structured securities as of December 31, 2018.
We also have off-balance sheet exposure to losses from liquidity support transactions and partnership interests.
Our total outstanding liquidity commitments to advance funds for securities backed by multifamily housing revenue bonds totaled $8.7$7.4 billion as of September 30, 20182019 and $9.2$8.3 billion as of December 31, 2017.2018. These commitments require us to advance funds to third parties that enable them to repurchase tendered bonds or securities that are unable to be remarketed. We hold cash and cash equivalents in our other investments portfolio in excess of these commitments to advance funds.
We make investments in various limited partnerships and similar legal entities, which consist of low-income housing tax credit investments, community investments and other entities. When we do not have a controlling financial interest in those entities, our condensed consolidated balance sheets reflect only our investment rather than the full amount of the partnership’s assets and liabilities.
|
| | |
Fannie Mae Third Quarter 20182019 Form 10-Q | 46 |
Risk Management
Our business activities expose us to the following three major categories of risk: credit risk (including mortgage credit risk and institutional counterparty credit risk), market risk (including interest rate riskrisk), liquidity and liquidity risk)funding risk, and operational risk (including cybersecurity,cyber/information security risk, third-party risk and model risk)., as well as strategic risk, compliance risk and reputational risk. See “MD&A—Risk Management” and “MD&A—Business Segments” in our 20172018 Form 10-K for a discussion of our management of these risks.
In this This section we provide an update onsupplements and updates that discussion but does not repeat all of the risk management categories described in our management of institutional counterparty credit risk and interest rate risk. We provide an update on our management of mortgage credit risk in this report in ��Business Segments—Single-Family Business—Single-Family Mortgage Credit Risk Management” and “Business Segments—Multifamily Business—Multifamily Mortgage Credit Risk Management.”2018 Form 10-K.
Institutional Counterparty Credit Risk Management
This section supplements and updates our discussion of institutional counterparty credit risk management in our 20172018 Form 10-K. See “MD&A—Risk Management—Institutional Counterparty Credit Risk Management” and “Risk Factors”Factors—Credit Risk” in our 20172018 Form 10-K for additional information, including our exposure to institutional counterparty credit risk and our strategy for managing this risk.
Mortgage Insurers
For information on our mortgage insurers, see “MD&A—Risk Management—Institutional Counterparty Credit Risk Management—Mortgage Insurers”Exposure arising from the Resecuritization of Freddie Mac-issued Securities
We began resecuritizing Freddie Mac-issued securities in connection with the implementation of the Single Security Initiative in June 2019, which has increased our 2017 Form 10-K. The discussion below updates somecredit risk exposure and operational risk exposure to Freddie Mac, and our risk exposure to Freddie Mac is expected to increase as we issue more structured securities backed by Freddie Mac securities going forward. Our inclusion of Freddie Mac securities as collateral for the structured securities that information.
Recent Changes
FHFA’s 2018 conservatorship scorecard directswe issue increases our counterparty credit risk exposure to Freddie Mac. In the event Freddie Mac were to fail (for credit or operational reasons) to make a payment on a payment date on Freddie Mac securities that we had resecuritized in a Fannie Mae-issued structured security, we would be responsible for making the entire payment on the Freddie Mac securities included in that structured security in order to make payments on any of our outstanding single-family Fannie Mae andMBS to be paid on that payment date. Accordingly, as the amount of structured securities we issue that are backed by Freddie Mac to evaluate the companies’ existing private mortgage insurer eligibility requirements (“PMIERs”) and consider whether changes or updates are appropriate. The PMIERs set the standards and guidelines that a private mortgage insurer must meet and maintain to be an approved insurer eligible to write mortgage insurance on loans acquired by Fannie Mae. The PMIERs are designed to ensure that mortgage insurers have sufficient liquid assets to pay all claims under a hypothetical future stress scenario. At FHFA’s direction, we andsecurities grows, if Freddie Mac completedwere to fail to meet its obligations to us under the terms of these securities, it could have a material adverse effect on our analysisearnings and financial condition. We believe the risk of default by Freddie Mac is negligible because of the PMIERsfunding commitment available to Freddie Mac through its senior preferred stock purchase agreement with Treasury.
As of September 30, 2019, approximately $28.9 billion in Freddie Mac securities were backing Fannie Mae-issued structured securities. We had no such transactions or activity in 2018. See “Uniform Mortgage-Backed Securities” and after consulting with our mortgage insurer counterparties, published revised PMIERs“Risk Factors” in September 2018. The revised PMIERs include certain changes tothis report for more information on UMBS and the risk-based asset requirements, enhancements to the treatment of approved risk transfer transactions, and adjustments to risk transfer credit arising from counterparty riskrisks associated with reinsurance transactions. Many of the changes contained in the update were previously announced through guidance. The revised PMIERs will become effective on March 31, 2019 for existing approved private mortgage insurers and are effective immediately for any new mortgage insurer applicant.Single Security Initiative.
Market Risk Management, Including Interest Rate Risk Management
This section supplements and updates information regarding market risk management in our 20172018 Form 10-K. See “MD&A—Risk Management—Market Risk Management, Including Interest Rate Risk Management” and “Risk Factors” in our 20172018 Form 10-K for additional information, including our sources of interest rate risk exposure, business risks posed by changes in interest rates, and our strategy for managing interest rate risk.
Measurement of Interest Rate Risk
The table below displays the pre-tax market value sensitivity of our net portfolio to changes in the level of interest rates and the slope of the yield curve as measured on the last day of each period presented. The table below also provides the daily average, minimum, maximum and standard deviation values for duration gap and for the most adverse market value impact on the net portfolio to changes in the level of interest rates and the slope of the yield curve for the three months ended September 30, 20182019 and 2017.2018.
During the second quarter of 2018,For information on how we revised the presentation ofmeasure our interest rate risk, measures to show the market value sensitivitysee our 2018 Form 10-K in millions, rather than billions, and to show effective duration gap in years, rather than in months. We have revised all prior period interest rate risk measures to correspond to the current period presentation.“MD&A—Risk Management—Market Risk Management, Including Interest Rate Risk Management.”
|
| | |
Fannie Mae Third Quarter 20182019 Form 10-Q | 47 |
For information on how we measure our interest rate risk, see our 2017 Form 10-K in “MD&A—Risk Management—Market Risk Management, Including Interest Rate Risk Management.” |
| | | | | | | | | | | |
| Interest Rate Sensitivity of Net Portfolio to Changes in Interest Rate Level and Slope of Yield Curve |
| | As of (1)(2) |
| | September 30, 2019 | | December 31, 2018 |
| | (Dollars in millions) |
| Rate level shock: | | | | | | | |
| -100 basis points | | $ | 99 |
| | | | $ | (286 | ) | |
| -50 basis points | | 24 |
| | | | (119 | ) | |
| +50 basis points | | 38 |
| | | | 48 |
| |
| +100 basis points | | 124 |
| | | | 29 |
| |
| Rate slope shock: | | | | | | | |
| -25 basis points (flattening) | | (13 | ) | | | | (7 | ) | |
| +25 basis points (steepening) | | 12 |
| | | | 6 |
| |
|
| | | | | | | | | | | |
| Interest Rate Sensitivity of Net Portfolio to Changes in Interest Rate Level and Slope of Yield Curve |
| | As of (1)(2) |
| | September 30, 2018 | | December 31, 2017 |
| | (Dollars in millions) |
| Rate level shock: | | | | | | | |
| -100 basis points | | $ | (193 | ) | | | | $ | (44 | ) | |
| -50 basis points | | (53 | ) | | | | (21 | ) | |
| +50 basis points | | (30 | ) | | | | (29 | ) | |
| +100 basis points | | (113 | ) | | | | (122 | ) | |
| Rate slope shock: | | | | | | | |
| -25 basis points (flattening) | | 3 |
| | | | (17 | ) | |
| +25 basis points (steepening) | | (6 | ) | | | | 17 |
| |
|
| | | | | | | | | | | | | | | | | | | | | | | | | | | |
| | For the Three Months Ended September 30,(1)(3) |
| | 2018 | | 2017 |
| | Duration Gap | | Rate Slope Shock 25 bps | | Rate Level Shock 50 bps | | Duration Gap | | Rate Slope Shock 25 bps | | Rate Level Shock 50 bps |
| | | | Market Value Sensitivity | | | | Market Value Sensitivity
|
| | (In years) | | (Dollars in millions) | | (In years) | | (Dollars in millions) |
| Average | 0.01 | | | $ | (13 | ) | | | | $ | (51 | ) | | | 0.00 | | | $ | (16 | ) | | | | $ | (26 | ) | |
| Minimum | (0.01) | | | (22 | ) | | | | (119 | ) | | | (0.04) | | | (46 | ) | | | | (64 | ) | |
| Maximum | 0.07 | | | (1 | ) | | | | (30 | ) | | | 0.02 | | | (4 | ) | | | | 1 |
| |
| Standard deviation | 0.02 | | | 6 |
| | | | 17 |
| | | 0.02 | | | 8 |
| | | | 15 |
| |
__________ |
| | | | | | | | | | | | | | | | | | | | | | | | | | | | |
| | | For the Three Months Ended September 30,(1)(3) |
| | | 2019 | | 2018 |
| | | Duration Gap | | Rate Slope Shock 25 bps | | Rate Level Shock 50 bps | | Duration Gap | | Rate Slope Shock 25 bps | | Rate Level Shock 50 bps |
| | | | | Market Value Sensitivity | | | | Market Value Sensitivity
|
| | | (In years) | | (Dollars in millions) | | (In years) | | (Dollars in millions) |
| Average | | 0.01 | | | $ | (8 | ) | | | | $ | (24 | ) | | | 0.01 | | | $ | (13 | ) | | | | $ | (51 | ) | |
| Minimum | | (0.09) | | | (21 | ) | | | | (100 | ) | | | (0.01) | | | (22 | ) | | | | (119 | ) | |
| Maximum | | 0.09 | | | (2 | ) | | | | 26 |
| | | 0.07 | | | (1 | ) | | | | (30 | ) | |
| Standard deviation | | 0.04 | | | 6 |
| | | | 28 |
| | | 0.02 | | | 6 |
| | | | 17 |
| |
| |
(1) | Computed based on changes in U.S. LIBOR interest rates swap curve. Changes in the level of interest rates assume a parallel shift in all maturities of the U.S. LIBOR interest rate swap curve. Changes in the slope of the yield curve assume a constant 7-year rate, a shift of 16.7 basis points for the 1-year rate (and shorter tenors) and an opposite shift of 8.3 basis points for the 30-year rate. Rate shocks for remaining maturity points are interpolated. |
| |
(2) | Measured on the last business day of each period presented. |
| |
(3) | Computed based on daily values during the period presented. |
The market value sensitivity of our net portfolio varies across a range of interest rate shocks depending upon the duration and convexity profile of our net portfolio. Because the effective duration gap of our net portfolio was close to zero years in the periods presented, the convexity exposure was the primary driver of the market value sensitivity of our net portfolio as of September 30, 2018.2019. In addition, the convexity exposure may result in similar market value sensitivities for positive and negative interest rate shocks of the same magnitude.
We use derivatives to help manage the residual interest rate risk exposure between our assets and liabilities. Derivatives have enabled us to keep our interest rate risk exposure at consistently low levels in a wide range of interest-rate environments. The table below displays an example of how derivatives impacted the net market value exposure for a 50 basis point parallel interest rate shock.
|
| | | | | | | | | | | |
| Derivative Impact on Interest Rate Risk (50 Basis Points) |
| | As of (1) |
| | September 30, 2018 | | December 31, 2017 |
| | (Dollars in millions) |
| Before derivatives | | $ | (600 | ) | | | | $ | (520 | ) | |
| After derivatives | | (30 | ) | | | | (29 | ) | |
| Effect of derivatives | | 570 |
| | | | 491 |
| |
__________ |
| | | | | | | | | | | |
| Derivative Impact on Interest Rate Risk (50 Basis Points) |
| | As of (1) |
| | September 30, 2019 | | December 31, 2018 |
| | (Dollars in millions) |
| Before derivatives | | $ | (201 | ) | | | | $ | (535 | ) | |
| After derivatives | | 38 |
| | | | 48 |
| |
| Effect of derivatives | | 239 |
| | | | 583 |
| |
| |
(1) | Measured on the last business day of each period presented. |
|
| | |
Fannie Mae Third Quarter 20182019 Form 10-Q | 48 |
|
| | |
| | MD&A | Critical Accounting Policies and Estimates |
Critical Accounting Policies and Estimates |
| | | | |
Critical Accounting Policies and Estimates |
The preparation of financial statements in accordance with GAAP requires management to make a number of judgments, estimates and assumptions that affect the reported amount of assets, liabilities, income and expenses in theour condensed consolidated financial statements. Understanding our accounting policies and the extent to which we use management judgment and estimates in applying these policies is integral to understanding our financial statements. We describe our most significant accounting policies in “Note 1, Summary of Significant Accounting Policies” in this report and in our 20172018 Form 10-K.
We evaluate our critical accounting estimates and judgments required by our policies on an ongoing basis and update them as necessary based on changing conditions. ManagementWe previously identified our fair value measurement as a critical accounting estimate due to the subjectivity of the unobservable inputs used to measure Level 3 assets and liabilities recorded at fair value. However, because the amount of Level 3 assets and liabilities that we report at fair value has discussed any significant changes in judgmentscontinued to decline, using reasonably different estimates and assumptions in applyingvaluing these assets and liabilities would not have a material impact on our reported results of operations or financial condition. Consequently, we no longer consider our fair value measurement a critical accounting policies withestimate.
We continue to identify the Audit Committee of our Board of Directors. See “Risk Factors” in our 2017 Form 10-Kallowance for a discussion of the risks associated with the need for management to make judgments and estimates in applying our accounting policies and methods. We have identified two of our accounting policiesloan losses as critical because they involveit involves significant judgments and assumptions about highly complex and inherently uncertain matters, and the use of reasonably different estimates and assumptions could have a material impact on our reported results of operations or financial condition: fair value measurement and allowance for loan losses.condition. See “MD&A—Critical Accounting Policies and Estimates” in our 20172018 Form 10-K for more discussion of our allowance for loan losses. See “Risk Factors” in our 2018 Form 10-K for a discussion of these criticalthe risks associated with the need for management to make judgments and estimates in applying our accounting policies and estimates.methods.
Impact of Future Adoption of New Accounting Guidance
|
| | | | |
Impact of Future Adoption of New Accounting Guidance |
We identify and discuss the expected impact on our condensed consolidated financial statements of recently issued accounting guidance in “Note 1, Summary of Significant Accounting Policies.”
|
| | |
Fannie Mae Third Quarter 2018 Form 10-Q | 49 |
|
| | |
| MD&A | Forward-Looking Statements |
|
| | | | |
Forward-Looking Statements |
This report includes statements that constitute forward-looking statements within the meaning of Section 21E of the Securities Exchange Act of 1934 (the “Exchange Act”). In addition, we and our senior management may from time to time make forward-looking statements in our other filings with the SEC, our other publicly available written statements, and orally to analysts, investors, the news media and others. Forward-looking statements often include words such as “expect,” “anticipate,” “intend,” “plan,” “believe,” “seek,” “estimate,” “forecast,” “project,” “would,” “should,” “could,” “likely,” “may,” “will” or similar words. Examples of forward-looking statements in this report include, but are not limited to,among others, statements relating to our expectations regarding the following matters:
factors that will affect our profitability,future net worth;
our future financial condition and results of operations, and the factors that will affect them;
factors that will affect our profitability,long-term financial conditionperformance;
trends and resultsthe impact of operations;fluctuations in our acquisition volumes, market share, guaranty fees, or acquisition credit characteristics;
our business plans and strategies and the impact of such plans and strategies;
continued consideration of housing finance reform by the Administration, FHFA and Congress, including the recommended administrative and legislative reforms in the Treasury plan, efforts and plans to implement such reforms; and the impact of housing finance reform on our conservatorship, our structure, our role in the secondary mortgage market, our capitalization, our business and our competitive environment;
our dividend payments to Treasury;Treasury and the liquidation preference of the senior preferred stock;
volatility in our future financial results and efforts we may make to address volatility;
the size or composition of our retained mortgage portfolio;
the impact of legislation and regulation on our business or financial results;
our payments to HUD and Treasury funds under the GSE Act;
our plans relating to and the effects of our credit risk transfer transactions;
the impact of accounting guidance and accounting changes onfactors that could affect or mitigate our business or financial results, including the impact of impairment accounting guidance;credit risk exposure;
|
| | |
| Fannie Mae Third Quarter 2019 Form 10-Q | 49 |
|
| | |
| MD&A | Forward-Looking Statements |
mortgage market and economic conditions (including home price appreciation rates) and the impact of such conditions on our business or financial results;
the effects on our business, risk profile and financial condition of our issuance of UMBS and of structured securities backed by Freddie Mac-issued UMBS, including the level and impact of our credit and operational risk exposure to Freddie Mac;
the risks to our business;
our loan acquisitions, the impactcredit risk profile of the 2018 hurricanes on our credit losses and loss reserves;
our serious delinquency ratesuch acquisitions, and the factors that will affect them;
our serious delinquency rate;response to legal and regulatory proceedings and their impact on our business or financial condition; and
the impact of our single-family loan acquisitionsadoption of the CECL standard on our financial condition and the credit risk profileresults of such acquisitions.operations.
Forward-looking statements reflect our management’s current expectations, forecasts or predictions of future conditions, events or results based on various assumptions and management’s estimates of trends and economic factors in the markets in which we are active as well asand that otherwise impact our business plans. TheyForward-looking statements are not guaranteesguaranties of future performance. By their nature, forward-looking statements are subject to significant risks and uncertainties.uncertainties and changes in circumstances. Our actual results and financial condition may differ, possibly materially, from the anticipated results and financial condition indicated in these forward-looking statements.
There are a number of factors that could cause actual conditions, events or results to differ materially from those described in theour forward-looking statements, contained in this report, including, but not limited to,among others, the following:
the uncertainty of our future;
future legislative and regulatory requirements or changes affecting us, such as the enactment of housing finance reform legislation;legislation (including all or any portion of the Treasury plan), including changes that limit our business activities or our footprint;
actions by FHFA, Treasury, HUD, the CFPB or other regulators, or Congress, that affect our business;business, including new capital requirements that become applicable to us or changes in the ability-to-repay rule to replace the qualified mortgage patch for GSE-eligible loans;
changes in the structure and regulation of the financial services industry;
the timing and level of, as well as regional variation in, home price changes;
changes in interest rates and credit spreads;
developments that may be difficult to predict, including market conditions that result in changes in unemployment ratesour net amortization income from our guaranty book of business, fluctuations in the estimated fair value of our derivatives and other macroeconomic and housingfinancial instruments that we mark to market conditions;through our earnings, developments that affect our loss reserves such as changes in interest rates, home prices or accounting standards, or events such as natural disasters;
uncertainties relating to the potential discontinuance of LIBOR, or other market changes that could impact the loans we own or guarantee or our MBS;
credit availability;
disruptions or instability in the housing and credit markets;
the size and our share of the U.S. mortgage market and the factors that affect them, including population growth and household formation;
growth, deterioration and the overall health and stability of the U.S. economy, including the U.S. GDP, unemployment rates, personal income and other indicators thereof;
changes in the fiscal and monetary policies of the Federal Reserve, including implementation of the Federal Reserve’s balance sheet normalization program;Reserve;
our and our competitors’ future guaranty fee pricing and the impact of that pricing on our competitive environment and guaranty fee revenues;
|
| | |
Fannie Mae Third Quarter 2018 Form 10-Q | 50 |
|
| | |
| MD&A | Forward-Looking Statements |
the volume of mortgage originations;
the size, composition and quality of our guaranty book of business and retained mortgage portfolio;
the competitive environment in which we operate, including the impact of legislative or other developments on levels of competition in our industry and other factors affecting our market share;
the life of the loans in our guaranty book of business;
challenges we face in retaining and hiring qualified executives and other employees;
our future serious delinquency rates;
the deteriorated credit performance of many loans in our guaranty book of business;
|
| | |
| Fannie Mae Third Quarter 2019 Form 10-Q | 50 |
|
| | |
| MD&A | Forward-Looking Statements |
changes in the demand for Fannie Mae MBS, in general or from one or more major groups of investors;
our conservatorship, including any changes to or termination (by receivership or otherwise) of the conservatorship and its effect on our business;
the investment by Treasury, including potential changes to the terms of the senior preferred stock purchase agreement or senior preferred stock, and its effect on our business;business, including restrictions imposed on us by the terms of the senior preferred stock purchase agreement, the senior preferred stock, and Treasury’s warrant, as well as the possibility that these or other restrictions on our business and activities may be applied to us through other mechanisms even if we cease to be subject to these agreements and instruments;
adverse effects from activities we undertake to support the mortgage market and help borrowers;
actions we may be required to take by FHFA, in its role as our conservator or as our regulator, such as changes in the type of business we do or implementationactions relating to UMBS or our resecuritization of the Single Security Initiative;Freddie Mac-issued securities;
limitations on our business imposed by FHFA, in its role as our conservator or as our regulator;
our future objectives and activities in support of those objectives, including actions we may take to reach additional underserved creditworthy borrowers;
the possibility that future changes in leadership at FHFA or the Administration may result in changes in FHFA’s or Treasury’s willingness to pursue the administrative reform recommendations in the Treasury plan;
a decrease in our credit ratings;
limitations on our ability to access the debt capital markets;
significant changes in modification and foreclosure activity;
the volume and pace of future nonperforming and reperforming loan sales and their impact on our results and serious delinquency rates;
changes in borrower behavior;
the effectiveness of our loss mitigation strategies, management of our REO inventory and pursuit of contractual remedies;
defaults by one or more institutional counterparties;
resolution or settlement agreements we may enter into with our counterparties;
our need to rely on third parties to fully achieve some of our corporate objectives;
our reliance on mortgage servicers;
changes in GAAP, guidance by the Financial Accounting Standards Board and changes to our accounting policies;
changes in the fair value of our assets and liabilities;
the stability and adequacy of the systems and infrastructure that impact our operations, including ours and those of CSS, our other counterparties and other third parties;
the impact of increasing interdependence between the single-family mortgage securitization programs of Fannie Mae and Freddie Mac in connection with uniform mortgage-backed securities;
operational control weaknesses;
our reliance on models and future updates we make to our models, including the assumptions used by these models;
domestic and global political risks;risks and uncertainties;
natural disasters, environmental disasters, terrorist attacks, pandemics or other major disruptive events;
cyber attacks or other information security breaches or threats; and
thosethe other factors described in “Risk Factors” in this report and in our 20172018 Form 10-K.
Readers are cautioned not to unduly rely on the forward-looking statements we make and to place these forward-looking statements in this report or that we make from time to time into proper context by carefully considering the factors discussed in “Risk Factors” in this reportour 2018 Form 10-K and in our 2017 Form 10-K.this report. These forward-looking statements are representative only as of the date they are made, and we undertake no obligation to update any forward-looking statement as a result of new information, future events or otherwise, except as required under the federal securities laws.
|
| | |
Fannie Mae Third Quarter 20182019 Form 10-Q | 51 |
|
| | |
| | Financial Statements | Condensed Consolidated Balance Sheets |
Item 1. Financial Statements
FANNIE MAE
(In conservatorship)
Condensed Consolidated Balance Sheets — (Unaudited)
(Dollars in millions, except share amounts)millions)
|
| | | | | | | | | | | |
| | As of |
| | September 30, | | December 31, |
| | 2018 | | 2017 |
| ASSETS |
| Cash and cash equivalents | | $ | 27,789 |
| | | | $ | 32,110 |
| |
| Restricted cash (includes $17,835 and $22,132, respectively, related to consolidated trusts) | | 23,242 |
| | | | 28,150 |
| |
| Federal funds sold and securities purchased under agreements to resell or similar arrangements | | 26,598 |
| | | | 19,470 |
| |
| Investments in securities: | | | | | | | |
| Trading, at fair value (includes $3,734 and $747, respectively, pledged as collateral) | | 43,901 |
| | | | 34,679 |
| |
| Available-for-sale, at fair value | | 3,537 |
| | | | 4,843 |
| |
| Total investments in securities | | 47,438 |
| | | | 39,522 |
| |
| Mortgage loans: | | | | | | | |
| Loans held for sale, at lower of cost or fair value | | 10,572 |
| | | | 4,988 |
| |
| Loans held for investment, at amortized cost: | | | | | | | |
| Of Fannie Mae | | 126,674 |
| | | | 162,809 |
| |
| Of consolidated trusts | | 3,111,551 |
| | | | 3,029,812 |
| |
| Total loans held for investment (includes $9,153 and $10,596, respectively, at fair value) | | 3,238,225 |
| | | | 3,192,621 |
| |
| Allowance for loan losses | | (15,663 | ) | | | | (19,084 | ) | |
| Total loans held for investment, net of allowance | | 3,222,562 |
| | | | 3,173,537 |
| |
| Total mortgage loans | | 3,233,134 |
| | | | 3,178,525 |
| |
| Deferred tax assets, net | | 14,368 |
| | | | 17,350 |
| |
| Accrued interest receivable, net (includes $8,234 and $7,560, respectively, related to consolidated trusts) | | 8,792 |
| | | | 8,133 |
| |
| Acquired property, net | | 2,722 |
| | | | 3,220 |
| |
| Other assets | | 17,022 |
| | | | 19,049 |
| |
| Total assets | | $ | 3,401,105 |
| | | | $ | 3,345,529 |
| |
| LIABILITIES AND EQUITY (DEFICIT) |
| Liabilities: | | | | | | | |
| Accrued interest payable (includes $8,942 and $8,598, respectively, related to consolidated trusts) | | $ | 10,105 |
| | | | $ | 9,682 |
| |
| Debt: | | | | | | | |
| Of Fannie Mae (includes $7,251 and $8,186, respectively, at fair value) | | 246,682 |
| | | | 276,752 |
| |
| Of consolidated trusts (includes $24,948 and $30,493, respectively, at fair value) | | 3,127,688 |
| | | | 3,053,302 |
| |
| Other liabilities (includes $322 and $492, respectively, related to consolidated trusts) | | 9,655 |
| | | | 9,479 |
| |
| Total liabilities | | 3,394,130 |
| | | | 3,349,215 |
| |
| Commitments and contingencies (Note 14) | | — |
| | | | — |
| |
| Fannie Mae stockholders’ equity (deficit): | | | | | | | |
| Senior preferred stock, 1,000,000 shares issued and outstanding | | 120,836 |
| | | | 117,149 |
| |
| Preferred stock, 700,000,000 shares are authorized—555,374,922 shares issued and outstanding | | 19,130 |
| | | | 19,130 |
| |
| Common stock, no par value, no maximum authorization—1,308,762,703 shares issued and 1,158,087,567 shares outstanding | | 687 |
| | | | 687 |
| |
| Accumulated deficit | | (126,591 | ) | | | | (133,805 | ) | |
| Accumulated other comprehensive income | | 313 |
| | | | 553 |
| |
| Treasury stock, at cost, 150,675,136 shares | | (7,400 | ) | | | | (7,400 | ) | |
| Total stockholders’ equity (deficit) (See Note 1: Senior Preferred Stock Purchase Agreement and Senior Preferred Stock for information on our dividend obligation to Treasury) | | 6,975 |
| | | | (3,686 | ) | |
| Total liabilities and equity (deficit) | | $ | 3,401,105 |
| | | | $ | 3,345,529 |
| |
|
| | | | | | | | | | | |
| | As of |
| | September 30, 2019 | | December 31, 2018 |
| | |
| ASSETS |
| Cash and cash equivalents | | $ | 22,592 |
| | | | $ | 25,557 |
| |
| Restricted cash (includes $35,496 and $17,849, respectively, related to consolidated trusts) | | 41,906 |
| | | | 23,866 |
| |
| Federal funds sold and securities purchased under agreements to resell or similar arrangements | | 23,176 |
| | | | 32,938 |
| |
| Investments in securities: | | | | | | | |
| Trading, at fair value (includes $4,304 and $3,061, respectively, pledged as collateral) | | 44,206 |
| | | | 41,867 |
| |
| Available-for-sale, at fair value | | 2,690 |
| | | | 3,429 |
| |
| Total investments in securities | | 46,896 |
| | | | 45,296 |
| |
| Mortgage loans: | | | | | | | |
| Loans held for sale, at lower of cost or fair value | | 12,289 |
| | | | 7,701 |
| |
| Loans held for investment, at amortized cost: | | | | | | | |
| Of Fannie Mae | | 104,367 |
| | | | 113,039 |
| |
| Of consolidated trusts | | 3,206,856 |
| | | | 3,142,858 |
| |
| Total loans held for investment (includes $8,183 and $8,922, respectively, at fair value) | | 3,311,223 |
| | | | 3,255,897 |
| |
| Allowance for loan losses | | (9,376 | ) | | | | (14,203 | ) | |
| Total loans held for investment, net of allowance | | 3,301,847 |
| | | | 3,241,694 |
| |
| Total mortgage loans | | 3,314,136 |
| | | | 3,249,395 |
| |
| Deferred tax assets, net | | 11,994 |
| | | | 13,188 |
| |
| Accrued interest receivable, net (includes $8,450 and $7,928, respectively, related to consolidated trusts) | | 8,923 |
| | | | 8,490 |
| |
| Acquired property, net | | 2,452 |
| | | | 2,584 |
| |
| Other assets | | 22,361 |
| | | | 17,004 |
| |
| Total assets | | $ | 3,494,436 |
| | | | $ | 3,418,318 |
| |
| LIABILITIES AND EQUITY |
| Liabilities: | | | | | | | |
| Accrued interest payable (includes $9,348 and $9,133, respectively, related to consolidated trusts) | | $ | 10,400 |
| | | | $ | 10,211 |
| |
| Debt: | | | | | | | |
| Of Fannie Mae (includes $6,041 and $6,826, respectively, at fair value) | | 213,522 |
| | | | 232,074 |
| |
| Of consolidated trusts (includes $22,719 and $23,753, respectively, at fair value) | | 3,248,336 |
| | | | 3,159,846 |
| |
| Other liabilities (includes $359 and $356, respectively, related to consolidated trusts) | | 11,836 |
| | | | 9,947 |
| |
| Total liabilities | | 3,484,094 |
| | | | 3,412,078 |
| |
| Commitments and contingencies (Note 13) | | — |
| | | | — |
| |
| Fannie Mae stockholders’ equity: | | | | | | | |
| Senior preferred stock (liquidation preference of $127,201 and $123,836, respectively) | | 120,836 |
| | | | 120,836 |
| |
| Preferred stock, 700,000,000 shares are authorized—555,374,922 shares issued and outstanding | | 19,130 |
| | | | 19,130 |
| |
| Common stock, no par value, no maximum authorization—1,308,762,703 shares issued and 1,158,087,567 shares outstanding | | 687 |
| | | | 687 |
| |
| Accumulated deficit | | (123,141 | ) | | | | (127,335 | ) | |
| Accumulated other comprehensive income | | 230 |
| | | | 322 |
| |
| Treasury stock, at cost, 150,675,136 shares | | (7,400 | ) | | | | (7,400 | ) | |
| Total stockholders’ equity (See Note 1: Senior Preferred Stock Purchase Agreement and Senior Preferred Stock for information on the related dividend obligation and liquidation preference) | | 10,342 |
| | | | 6,240 |
| |
| Total liabilities and equity | | $ | 3,494,436 |
| | | | $ | 3,418,318 |
| |
See Notes to Condensed Consolidated Financial Statements
|
| | |
Fannie Mae (In conservatorship) Third Quarter 20182019 Form 10-Q | 52 |
|
| | |
| | Financial Statements | Condensed Consolidated Statements of Operations and Comprehensive Income |
FANNIE MAE
(In conservatorship)
Condensed Consolidated Statements of Operations and Comprehensive Income — (Unaudited)
(Dollars and shares in millions, except per share amounts) |
| | | | | | | | | | | | | | | | | | | | | | | |
| | For the Three Months Ended September 30, | | For the Nine Months Ended September 30, |
| | |
| | 2019 | | 2018 | | 2019 | | 2018 |
| Interest income: | | | | | | | | | | | | | | | |
| Trading securities | | $ | 418 |
| | | | $ | 363 |
| | | | $ | 1,277 |
| | | | $ | 917 |
| |
| Available-for-sale securities | | 40 |
| | | | 54 |
| | | | 138 |
| | | | 175 |
| |
| Mortgage loans (includes $27,610 and $27,058, respectively, for the three months ended and $84,157 and $79,877, respectively, for the nine months ended related to consolidated trusts) | | 28,858 |
| | | | 28,723 |
| | | | 88,005 |
| | | | 85,064 |
| |
| Federal funds sold and securities purchased under agreements to resell or similar arrangements | | 178 |
| | | | 166 |
| | | | 698 |
| | | | 457 |
| |
| Other | | 47 |
| | | | 38 |
| | | | 120 |
| | | | 102 |
| |
| Total interest income | | 29,541 |
| | | | 29,344 |
| | | | 90,238 |
| | | | 86,715 |
| |
| Interest expense: | | | | | | | | | | | | | | | |
| Short-term debt | | (125 | ) | | | | (114 | ) | | | | (369 | ) | | | | (331 | ) | |
| Long-term debt (includes $22,775 and $22,361, respectively, for the three months ended and $70,371 and $65,972, respectively, for the nine months ended related to consolidated trusts) | | (24,187 | ) | | | | (23,861 | ) | | | | (74,757 | ) | | | | (70,406 | ) | |
| Total interest expense | | (24,312 | ) | | | | (23,975 | ) | | | | (75,126 | ) | | | | (70,737 | ) | |
| Net interest income | | 5,229 |
| | | | 5,369 |
| | | | 15,112 |
| | | | 15,978 |
| |
| Benefit for credit losses | | 1,857 |
| | | | 716 |
| | | | 3,732 |
| | | | 2,229 |
| |
| Net interest income after benefit for credit losses | | 7,086 |
| | | | 6,085 |
| | | | 18,844 |
| | | | 18,207 |
| |
| Investment gains, net | | 253 |
| | | | 166 |
| | | | 847 |
| | | | 693 |
| |
| Fair value gains (losses), net | | (713 | ) | | | | 386 |
| | | | (2,298 | ) | | | | 1,660 |
| |
| Fee and other income | | 402 |
| | | | 271 |
| | | | 875 |
| | | | 830 |
| |
| Non-interest income (loss) | | (58 | ) | | | | 823 |
| | | | (576 | ) | | | | 3,183 |
| |
| Administrative expenses: | | | | | | | | | | | | | | | |
| Salaries and employee benefits | | (361 | ) | | | | (355 | ) | | | | (1,123 | ) | | | | (1,101 | ) | |
| Professional services | | (241 | ) | | | | (247 | ) | | | | (699 | ) | | | | (744 | ) | |
| Other administrative expenses | | (147 | ) | | | | (138 | ) | | | | (415 | ) | | | | (400 | ) | |
| Total administrative expenses | | (749 | ) | | | | (740 | ) | | | | (2,237 | ) | | | | (2,245 | ) | |
| Foreclosed property expense | | (96 | ) | | | | (159 | ) | | | | (364 | ) | | | | (460 | ) | |
| Temporary Payroll Tax Cut Continuation Act of 2011 (“TCCA”) fees | | (613 | ) | | | | (576 | ) | | | | (1,806 | ) | | | | (1,698 | ) | |
| Other expenses, net | | (571 | ) | | | | (377 | ) | | | | (1,514 | ) | | | | (946 | ) | |
| Total expenses | | (2,029 | ) | | | | (1,852 | ) | | | | (5,921 | ) | | | | (5,349 | ) | |
| Income before federal income taxes | | 4,999 |
| | | | 5,056 |
| | | | 12,347 |
| | | | 16,041 |
| |
| Provision for federal income taxes | | (1,036 | ) | | | | (1,045 | ) | | | | (2,552 | ) | | | | (3,312 | ) | |
| Net income | | 3,963 |
| | | | 4,011 |
| | | | 9,795 |
| | | | 12,729 |
| |
| Other comprehensive income (loss): | | | | | | | | | | | | | | | |
| Changes in unrealized gains on available-for-sale securities, net of reclassification adjustments and taxes | | 16 |
| | | | (33 | ) | | | | (85 | ) | | | | (349 | ) | |
| Other, net of taxes | | (2 | ) | | | | (3 | ) | | | | (7 | ) | | | | (8 | ) | |
| Total other comprehensive income (loss) | | 14 |
| | | | (36 | ) | | | | (92 | ) | | | | (357 | ) | |
| Total comprehensive income | | $ | 3,977 |
| | | | $ | 3,975 |
| | | | $ | 9,703 |
| | | | $ | 12,372 |
| |
| Net income | | $ | 3,963 |
| | | | $ | 4,011 |
| | | | $ | 9,795 |
| | | | $ | 12,729 |
| |
| Dividends distributed or amounts attributable to senior preferred stock | | (3,977 | ) | | | | (3,975 | ) | | | | (9,703 | ) | | | | (9,372 | ) | |
| Net income (loss) attributable to common stockholders | | $ | (14 | ) | | | | $ | 36 |
| | | | $ | 92 |
| | | | $ | 3,357 |
| |
| Earnings per share: | | | | | | | | | | | | | | | |
| Basic | | $ | 0.00 |
| | | | $ | 0.01 |
| | | | $ | 0.02 |
| | | | $ | 0.58 |
| |
| Diluted | | 0.00 |
| | | | 0.01 |
| | | | 0.02 |
| | | | 0.57 |
| |
| Weighted-average common shares outstanding: | | | | | | | | | | | | | | | |
| Basic | | 5,762 |
| | | | 5,762 |
| | | | 5,762 |
| | | | 5,762 |
| |
| Diluted | | 5,762 |
| | | | 5,893 |
| | | | 5,893 |
| | | | 5,893 |
| |
See Notes to Condensed Consolidated Financial Statements
|
| | |
| Fannie Mae (In conservatorship) Third Quarter 2019 Form 10-Q | 53 |
|
| | |
| Financial Statements | Condensed Consolidated Statements of Cash Flows |
FANNIE MAE
(In conservatorship)
Condensed Consolidated Statements of Cash Flows — (Unaudited)
(Dollars in millions)
|
| | | | | | | | | | | | | | | | | | | | | | | |
| | For the Three Months | | For the Nine Months |
| | Ended September 30, | | Ended September 30, |
| | 2018 | | 2017 | | 2018 | | 2017 |
| Interest income: | | | | | | | | | | | | | | | |
| Trading securities | | $ | 363 |
| | | | $ | 195 |
| | | | $ | 917 |
| | | | $ | 513 |
| |
| Available-for-sale securities | | 54 |
| | | | 77 |
| | | | 175 |
| | | | 269 |
| |
| Mortgage loans (includes $27,058 and $25,168, respectively, for the three months ended and $79,877 and $75,155, respectively, for the nine months ended related to consolidated trusts) | | 28,723 |
| | | | 27,047 |
| | | | 85,064 |
| | | | 81,105 |
| |
| Other | | 204 |
| | | | 142 |
| | | | 559 |
| | | | 351 |
| |
| Total interest income | | 29,344 |
| | | | 27,461 |
| | | | 86,715 |
| | | | 82,238 |
| |
| Interest expense: | | | | | | | | | | | | | | | |
| Short-term debt | | (114 | ) | | | | (72 | ) | | | | (331 | ) | | | | (173 | ) | |
| Long-term debt (includes $22,361 and $20,609, respectively, for the three months ended and $65,972 and $61,622, respectively, for the nine months ended related to consolidated trusts) | | (23,861 | ) | | | | (22,115 | ) | | | | (70,406 | ) | | | | (66,443 | ) | |
| Total interest expense | | (23,975 | ) | | | | (22,187 | ) | | | | (70,737 | ) | | | | (66,616 | ) | |
| Net interest income | | 5,369 |
| | | | 5,274 |
| | | | 15,978 |
| | | | 15,622 |
| |
| Benefit (provision) for credit losses | | 716 |
| | | | (182 | ) | | | | 2,229 |
| | | | 1,481 |
| |
| Net interest income after benefit (provision) for credit losses | | 6,085 |
| | | | 5,092 |
| | | | 18,207 |
| | | | 17,103 |
| |
| Investment gains, net | | 166 |
| | | | 313 |
| | | | 693 |
| | | | 689 |
| |
| Fair value gains (losses), net | | 386 |
| | | | (289 | ) | | | | 1,660 |
| | | | (1,020 | ) | |
| Fee and other income | | 271 |
| | | | 1,194 |
| | | | 830 |
| | | | 1,796 |
| |
| Non-interest income | | 823 |
| | | | 1,218 |
| | | | 3,183 |
| | | | 1,465 |
| |
| Administrative expenses: | | | | | | | | | | | | | | | |
| Salaries and employee benefits | | (355 | ) | | | | (331 | ) | | | | (1,101 | ) | | | | (1,007 | ) | |
| Professional services | | (247 | ) | | | | (218 | ) | | | | (744 | ) | | | | (681 | ) | |
| Other administrative expenses | | (138 | ) | | | | (115 | ) | | | | (400 | ) | | | | (346 | ) | |
| Total administrative expenses | | (740 | ) | | | | (664 | ) | | | | (2,245 | ) | | | | (2,034 | ) | |
| Foreclosed property expense | | (159 | ) | | | | (140 | ) | | | | (460 | ) | | | | (391 | ) | |
| Temporary Payroll Tax Cut Continuation Act of 2011 (“TCCA”) fees | | (576 | ) | | | | (531 | ) | | | | (1,698 | ) | | | | (1,552 | ) | |
| Other expenses, net | | (377 | ) | | | | (427 | ) | | | | (946 | ) | | | | (1,100 | ) | |
| Total expenses | | (1,852 | ) | | | | (1,762 | ) | | | | (5,349 | ) | | | | (5,077 | ) | |
| Income before federal income taxes | | 5,056 |
| | | | 4,548 |
| | | | 16,041 |
| | | | 13,491 |
| |
| Provision for federal income taxes | | (1,045 | ) | | | | (1,525 | ) | | | | (3,312 | ) | | | | (4,495 | ) | |
| Net income | | 4,011 |
| | | | 3,023 |
| | | | 12,729 |
| | | | 8,996 |
| |
| Other comprehensive income (loss): | | | | | | | | | | | | | | | |
| Changes in unrealized gains on available-for-sale securities, net of reclassification adjustments and taxes | | (33 | ) | | | | 27 |
| | | | (349 | ) | | | | (46 | ) | |
| Other | | (3 | ) | | | | (2 | ) | | | | (8 | ) | | | | (6 | ) | |
| Total other comprehensive income (loss) | | (36 | ) | | | | 25 |
| | | | (357 | ) | | | | (52 | ) | |
| Total comprehensive income | | $ | 3,975 |
| | | | $ | 3,048 |
| | | | $ | 12,372 |
| | | | $ | 8,944 |
| |
| Net income | | $ | 4,011 |
| | | | $ | 3,023 |
| | | | $ | 12,729 |
| | | | $ | 8,996 |
| |
| Dividends distributed or available for distribution to senior preferred stockholder | | (3,975 | ) | | | | (3,048 | ) | | | | (9,372 | ) | | | | (8,944 | ) | |
| Net income (loss) attributable to common stockholders | | $ | 36 |
| | | | $ | (25 | ) | | | | $ | 3,357 |
| | | | $ | 52 |
| |
| Earnings (loss) per share: | | | | | | | | | | | | | | | |
| Basic | | $ | 0.01 |
| | | | $ | 0.00 |
| | | | $ | 0.58 |
| | | | $ | 0.01 |
| |
| Diluted | | 0.01 |
| | | | 0.00 |
| | | | 0.57 |
| | | | 0.01 |
| |
| Weighted-average common shares outstanding: | | | | | | | | | | | | | | | |
| Basic | | 5,762 |
| | | | 5,762 |
| | | | 5,762 |
| | | | 5,762 |
| |
| Diluted | | 5,893 |
| | | | 5,762 |
| | | | 5,893 |
| | | | 5,893 |
| |
|
| | | | | | | | | | | |
| | For the Nine Months Ended September 30, |
| | 2019 | | 2018 |
| Net cash provided by (used in) operating activities | | $ | 3,176 |
| | | | $ | (1,796 | ) | |
| Cash flows provided by investing activities: | | | | | | | |
| Proceeds from maturities and paydowns of trading securities held for investment | | 46 |
| | | | 163 |
| |
| Proceeds from sales of trading securities held for investment | | 49 |
| | | | 96 |
| |
| Proceeds from maturities and paydowns of available-for-sale securities | | 364 |
| | | | 564 |
| |
| Proceeds from sales of available-for-sale securities | | 376 |
| | | | 729 |
| |
| Purchases of loans held for investment | | (181,898 | ) | | | | (135,913 | ) | |
| Proceeds from repayments of loans acquired as held for investment of Fannie Mae | | 9,338 |
| | | | 11,651 |
| |
| Proceeds from sales of loans acquired as held for investment of Fannie Mae | | 8,987 |
| | | | 10,637 |
| |
| Proceeds from repayments and sales of loans acquired as held for investment of consolidated trusts | | 377,789 |
| | | | 306,374 |
| |
| Advances to lenders | | (95,636 | ) | | | | (83,643 | ) | |
| Proceeds from disposition of acquired property and preforeclosure sales | | 5,644 |
| | | | 7,090 |
| |
| Net change in federal funds sold and securities purchased under agreements to resell or similar arrangements | | 9,762 |
| | | | (7,128 | ) | |
| Other, net | | (74 | ) | | | | (56 | ) | |
| Net cash provided by investing activities | | 134,747 |
| | | | 110,564 |
| |
| Cash flows used in financing activities: | | | | | | | |
| Proceeds from issuance of debt of Fannie Mae | | 587,659 |
| | | | 636,466 |
| |
| Payments to redeem debt of Fannie Mae | | (606,665 | ) | | | | (666,888 | ) | |
| Proceeds from issuance of debt of consolidated trusts | | 286,126 |
| | | | 278,357 |
| |
| Payments to redeem debt of consolidated trusts | | (385,496 | ) | | | | (364,942 | ) | |
| Payments of cash dividends on senior preferred stock to Treasury | | (5,601 | ) | | | | (5,397 | ) | |
| Proceeds from senior preferred stock purchase agreement with Treasury | | — |
| | | | 3,687 |
| |
| Other, net | | 1,129 |
| | | | 720 |
| |
| Net cash used in financing activities | | (122,848 | ) | | | | (117,997 | ) | |
| Net increase (decrease) in cash, cash equivalents and restricted cash | | 15,075 |
| | | | (9,229 | ) | |
| Cash, cash equivalents and restricted cash at beginning of period | | 49,423 |
| | | | 60,260 |
| |
| Cash, cash equivalents and restricted cash at end of period | | $ | 64,498 |
| | | | $ | 51,031 |
| |
| Cash paid during the period for: | | | | | | | |
| Interest | | $ | 86,699 |
| | | | $ | 82,010 |
| |
| Income taxes | | 1,250 |
| | | | 460 |
| |
See Notes to Condensed Consolidated Financial Statements
|
| | |
Fannie Mae (In conservatorship) Third Quarter 20182019 Form 10-Q | 5354 |
|
| | |
| | Financial Statements | Condensed Consolidated Statements of Cash FlowsChanges in Equity (Deficit) |
FANNIE MAE
(In conservatorship)
CondensedConsolidated Statements of Cash Flows Changes in Equity (Deficit) —(Unaudited)
(Dollars and shares in millions)
|
| | | | | | | | | | | |
| | For the Nine Months Ended September 30, |
| | 2018 | | 2017 |
| Net cash provided by (used in) operating activities | | $ | (1,796 | ) | | | | $ | 172 |
| |
| Cash flows provided by investing activities: | | | | | | | |
| Proceeds from maturities and paydowns of trading securities held for investment | | 163 |
| | | | 1,088 |
| |
| Proceeds from sales of trading securities held for investment | | 96 |
| | | | 149 |
| |
| Proceeds from maturities and paydowns of available-for-sale securities | | 564 |
| | | | 1,671 |
| |
| Proceeds from sales of available-for-sale securities | | 729 |
| | | | 1,207 |
| |
| Purchases of loans held for investment | | (135,913 | ) | | | | (142,565 | ) | |
| Proceeds from repayments of loans acquired as held for investment of Fannie Mae | | 11,651 |
| | | | 17,721 |
| |
| Proceeds from sales of loans acquired as held for investment of Fannie Mae | | 10,637 |
| | | | 5,399 |
| |
| Proceeds from repayments and sales of loans acquired as held for investment of consolidated trusts | | 306,374 |
| | | | 323,424 |
| |
| Advances to lenders | | (83,643 | ) | | | | (89,348 | ) | |
| Proceeds from disposition of acquired property and preforeclosure sales | | 7,090 |
| | | | 9,671 |
| |
| Net change in federal funds sold and securities purchased under agreements to resell or similar arrangements | | (7,128 | ) | | | | 6,675 |
| |
| Other, net | | (56 | ) | | | | 344 |
| |
| Net cash provided by investing activities | | 110,564 |
| | | | 135,436 |
| |
| Cash flows used in financing activities: | | | | | | | |
| Proceeds from issuance of debt of Fannie Mae | | 636,466 |
| | | | 776,380 |
| |
| Payments to redeem debt of Fannie Mae | | (666,888 | ) | | | | (809,299 | ) | |
| Proceeds from issuance of debt of consolidated trusts | | 278,357 |
| | | | 282,433 |
| |
| Payments to redeem debt of consolidated trusts | | (364,942 | ) | | | | (383,969 | ) | |
| Payments of cash dividends on senior preferred stock to Treasury | | (5,397 | ) | | | | (11,367 | ) | |
| Proceeds from senior preferred stock purchase agreement with Treasury | | 3,687 |
| | | | — |
| |
| Other, net | | 720 |
| | | | 88 |
| |
| Net cash used in financing activities | | (117,997 | ) | | | | (145,734 | ) | |
| Net decrease in cash, cash equivalents and restricted cash | | (9,229 | ) | | | | (10,126 | ) | |
| Cash, cash equivalents and restricted cash at beginning of period | | 60,260 |
| | | | 62,177 |
| |
| Cash, cash equivalents and restricted cash at end of period | | $ | 51,031 |
| | | | $ | 52,051 |
| |
| Cash paid during the period for: | | | | | | | |
| Interest | | $ | 82,010 |
| | | | $ | 82,652 |
| |
| Income taxes | | 460 |
| | | | 1,670 |
| |
|
| | | | | | | | | | | | | | | | | | | | | | | | | | | | | | | | | | | | | |
| | | Fannie Mae Stockholders’ Equity (Deficit) |
| | | Shares Outstanding | | Senior
Preferred Stock | | Preferred
Stock | | Common
Stock | |
Accumulated
Deficit | | Accumulated
Other
Comprehensive
Income | | Treasury
Stock | | Total
Equity |
| | Senior
Preferred | | Preferred | | Common | |
| Balance as of June 30, 2019 | | 1 |
| | 556 |
| | 1,158 |
| | $ | 120,836 |
| | $ | 19,130 |
| | $ | 687 |
| | $ | (127,104 | ) | | $ | 216 |
| | $ | (7,400 | ) | | $ | 6,365 |
|
| Senior preferred stock dividends paid | | — |
| | — |
| | — |
| | — |
| | — |
| | — |
| | — |
| | — |
| | — |
| | — |
|
| Comprehensive income: | | | | | | | | | | | | | | | | | | | | |
| Net income | | — |
| | — |
| | — |
| | — |
| | — |
| | — |
| | 3,963 |
| | — |
| | — |
| | 3,963 |
|
| Other comprehensive income, net of tax effect: | | | | | | | | | | | | | | | | | | | | |
| Changes in net unrealized gains on available-for-sale securities (net of taxes of $2) | | — |
| | — |
| | — |
| | — |
| | — |
| | — |
| | — |
| | 10 |
| | — |
| | 10 |
|
| Reclassification adjustment for gains included in net income (net of taxes of $1) | | — |
| | — |
| | — |
| | — |
| | — |
| | — |
| | — |
| | 6 |
| | — |
| | 6 |
|
| Other (net of taxes of $1) | | — |
| | — |
| | — |
| | — |
| | — |
| | — |
| | — |
| | (2 | ) | | — |
| | (2 | ) |
| Total comprehensive income | | | | | | | | | | | | | | | | | | | | 3,977 |
|
| Balance as of September 30, 2019 | | 1 |
| | 556 |
| | 1,158 |
| | $ | 120,836 |
| | $ | 19,130 |
| | $ | 687 |
| | $ | (123,141 | ) | | $ | 230 |
| | $ | (7,400 | ) | | $ | 10,342 |
|
|
| | | | | | | | | | | | | | | | | | | | | | | | | | | | | | | | | | | | | |
| | | Fannie Mae Stockholders’ Equity (Deficit) |
| | | Shares Outstanding | | Senior
Preferred Stock | | Preferred
Stock | | Common
Stock | |
Accumulated
Deficit | | Accumulated
Other
Comprehensive
Income | | Treasury
Stock | | Total
Equity |
| | Senior
Preferred | | Preferred | | Common | |
| Balance as of December 31, 2018 | | 1 |
| | 556 |
| | 1,158 |
| | $ | 120,836 |
| | $ | 19,130 |
| | $ | 687 |
| | $ | (127,335 | ) | | $ | 322 |
| | $ | (7,400 | ) | | $ | 6,240 |
|
| Senior preferred stock dividends paid | | — |
| | — |
| | — |
| | — |
| | — |
| | — |
| | (5,601 | ) | | — |
| | — |
| | (5,601 | ) |
| Comprehensive income: | | | | | | | | | | | | | | | | | | | | |
| Net income | | — |
| | — |
| | — |
| | — |
| | — |
| | — |
| | 9,795 |
| | — |
| | — |
| | 9,795 |
|
| Other comprehensive income, net of tax effect: | | | | | | | | | | | | | | | | | | | | |
| Changes in net unrealized gains on available-for-sale securities (net of taxes of $7) | | — |
| | — |
| | — |
| | — |
| | — |
| | — |
| | — |
| | 27 |
| | — |
| | 27 |
|
| Reclassification adjustment for gains included in net income (net of taxes of $30) | | — |
| | — |
| | — |
| | — |
| | — |
| | — |
| | — |
| | (112 | ) | | — |
| | (112 | ) |
| Other (net of taxes of $2) | | — |
| | — |
| | — |
| | — |
| | — |
| | — |
| | — |
| | (7 | ) | | — |
| | (7 | ) |
| Total comprehensive income | | | | | | | | | | | | | | | | | | | | 9,703 |
|
| Balance as of September 30, 2019 | | 1 |
| | 556 |
| | 1,158 |
| | $ | 120,836 |
| | $ | 19,130 |
| | $ | 687 |
| | $ | (123,141 | ) | | $ | 230 |
| | $ | (7,400 | ) | | $ | 10,342 |
|
See Notes to Condensed Consolidated Financial Statements
|
| | |
Fannie Mae (In conservatorship) Third Quarter 20182019 Form 10-Q | 5455 |
|
| | |
| Financial Statements | Condensed Consolidated Statements of Changes in Equity (Deficit) |
FANNIE MAE
(In conservatorship)
CondensedConsolidated Statements of Changes in Equity (Deficit) —(Unaudited)
(Dollars and shares in millions)
|
| | | | | | | | | | | | | | | | | | | | | | | | | | | | | | | | | | | | | |
| | | Fannie Mae Stockholders’ Equity (Deficit) |
| | | Shares Outstanding | | Senior
Preferred Stock | | Preferred
Stock | | Common
Stock | |
Accumulated
Deficit | | Accumulated
Other
Comprehensive
Income | | Treasury
Stock | | Total
Equity
(Deficit) |
| | | Senior
Preferred | | Preferred | | Common | |
| Balance as of June 30, 2018 | | 1 |
| | 556 |
| | 1,158 |
| | $ | 120,836 |
| | $ | 19,130 |
| | $ | 687 |
| | $ | (126,143 | ) | | $ | 349 |
| | $ | (7,400 | ) | | $ | 7,459 |
|
| Senior preferred stock dividends paid | | — |
| | — |
| | — |
| | — |
| | — |
| | — |
| | (4,459 | ) | | — |
| | — |
| | (4,459 | ) |
| Increase to senior preferred stock | | — |
| | — |
| | — |
| | — |
| | — |
| | — |
| | — |
| | — |
| | — |
| | — |
|
| Comprehensive income: | | | | | | | | | | | | | | | | | | | | |
| Net income | | — |
| | — |
| | — |
| | — |
| | — |
| | — |
| | 4,011 |
| | — |
| | — |
| | 4,011 |
|
| Other comprehensive income, net of tax effect: | | | | | | | | | | | | | | | | | | | | |
| Changes in net unrealized gains on available-for-sale securities (net of taxes of $8) | | — |
| | — |
| | — |
| | — |
| | — |
| | — |
| | — |
| | (31 | ) | | — |
| | (31 | ) |
| Reclassification adjustment for gains included in net income (net of taxes of $1) | | — |
| | — |
| | — |
| | — |
| | — |
| | — |
| | — |
| | (2 | ) | | — |
| | (2 | ) |
| Other | | — |
| | — |
| | — |
| | — |
| | — |
| | — |
| | — |
| | (3 | ) | | — |
| | (3 | ) |
| Total comprehensive income | | | | | | | | | | | | | | | | | | | | 3,975 |
|
Reclassification related to Tax Cuts
and Jobs Act | | — |
| | — |
| | — |
| | — |
| | — |
| | — |
| | — |
| | — |
| | — |
| | — |
|
| Other | | — |
| | — |
| | — |
| | — |
| | — |
| | — |
| | — |
| | — |
| | — |
| | — |
|
| Balance as of September 30, 2018 | | 1 |
| | 556 |
| | 1,158 |
| | $ | 120,836 |
| | $ | 19,130 |
| | $ | 687 |
| | $ | (126,591 | ) | | $ | 313 |
| | $ | (7,400 | ) | | $ | 6,975 |
|
|
| | | | | | | | | | | | | | | | | | | | | | | | | | | | | | | | | | | | | |
| | | Fannie Mae Stockholders’ Equity (Deficit) |
| | | Shares Outstanding | | Senior
Preferred Stock | | Preferred
Stock | | Common
Stock | |
Accumulated
Deficit | | Accumulated
Other
Comprehensive
Income | | Treasury
Stock | | Total
Equity (Deficit) |
| | | Senior
Preferred | | Preferred | | Common | |
| Balance as of December 31, 2017 | | 1 |
| | 556 |
| | 1,158 |
| | $ | 117,149 |
| | $ | 19,130 |
| | $ | 687 |
| | $ | (133,805 | ) | | $ | 553 |
| | $ | (7,400 | ) | | $ | (3,686 | ) |
| Senior preferred stock dividends paid | | — |
| | — |
| | — |
| | — |
| | — |
| | — |
| | (5,397 | ) | | — |
| | — |
| | (5,397 | ) |
| Increase to senior preferred stock | | — |
| | — |
| | — |
| | 3,687 |
| | — |
| | — |
| | — |
| | — |
| | — |
| | 3,687 |
|
| Comprehensive income: | |
| |
| |
| | | | | | | | | | | | | |
|
| Net income | | — |
| | — |
| | — |
| | — |
| | — |
| | — |
| | 12,729 |
| | — |
| | — |
| | 12,729 |
|
| Other comprehensive income, net of tax effect: | |
| |
| |
| |
| |
| |
| |
| |
| |
| |
|
| Changes in net unrealized gains on available-for-sale securities (net of taxes of $22) | | — |
| | — |
| | — |
| | — |
| | — |
| | — |
| | — |
| | (84 | ) | | — |
| | (84 | ) |
| Reclassification adjustment for gains included in net income (net of taxes of $71) | | — |
| | — |
| | — |
| | — |
| | — |
| | — |
| | — |
| | (265 | ) | | — |
| | (265 | ) |
| Other | | — |
| | — |
| | — |
| | — |
| | — |
| | — |
| | — |
| | (8 | ) | | — |
| | (8 | ) |
| Total comprehensive income | |
| |
| |
| | | | | | | | | | | | | | 12,372 |
|
Reclassification related to Tax Cuts
and Jobs Act | | — |
| | — |
| | — |
| | — |
| | — |
| | — |
| | (117 | ) | | 117 |
| | — |
| | — |
|
| Other | | — |
| | — |
| | — |
| | — |
| | — |
| | — |
| | (1 | ) | | — |
| | — |
| | (1 | ) |
| Balance as of September 30, 2018 | | 1 |
| | 556 |
| | 1,158 |
| | $ | 120,836 |
| | $ | 19,130 |
| | $ | 687 |
| | $ | (126,591 | ) | | $ | 313 |
| | $ | (7,400 | ) | | $ | 6,975 |
|
See Notes to Condensed Consolidated Financial Statements
|
| | |
| Fannie Mae (In conservatorship) Third Quarter 2019 Form 10-Q | 56 |
|
| | |
| | Notes to Condensed Consolidated Financial Statements | Summary of Significant Accounting Policies |
FANNIE MAE
(In conservatorship)
Notes to Condensed Consolidated Financial Statements
(Unaudited)
1. Summary of Significant Accounting Policies
We are a stockholder-owned corporation organized and existing under the Federal National Mortgage Association Charter Act (the “Charter Act” or our “charter”). We are a government-sponsored enterprise (“GSE”), and we are subject to government oversight and regulation. Our regulators include the Federal Housing Finance Agency (“FHFA”), the U.S. Department of Housing and Urban Development (“HUD”), the U.S. Securities and Exchange Commission (“SEC”), and the U.S. Department of the Treasury (“Treasury”). The U.S. government does not guarantee our securities or other obligations.
We have been under conservatorship, with FHFA acting as conservator, since September 6, 2008. See below and “Note 1, Summary of Significant Accounting Policies” in our annual report on Form 10-K for the year ended December 31, 20172018 (“20172018 Form 10-K”) for additional information on our conservatorship and the impact of U.S. government support of our business.
The unaudited interim condensed consolidated financial statements as of and for the three and nine months ended September 30, 2018,2019 and related notes, should be read in conjunction with our audited consolidated financial statements and related notes included in our 20172018 Form 10-K.
Basis of Presentation
The accompanying unaudited interim condensed consolidated financial statements have been prepared in accordance with generally accepted accounting principles in the United States of America (“GAAP”) for interim financial information and with the SEC’s instructions to Form 10-Q and Article 10 of Regulation S-X. Accordingly, they do not include all of the information and note disclosures required by GAAP for complete consolidated financial statements. In the opinion of management, all adjustments of a normal recurring nature considered necessary for a fair presentation have been included. The accompanying condensed consolidated financial statements include our accounts as well as the accounts of other entities in which we have a controlling financial interest. All intercompany accounts and transactions have been eliminated. To conform to our current period presentation, we have reclassified certain amounts reported in our prior periods’period condensed consolidated financial statements. Results for the three and nine months ended September 30, 20182019 may not necessarily be indicative of the results for the year ending December 31, 2018.2019.
Use of Estimates
Preparing condensed consolidated financial statements in accordance with GAAP requires management to make estimates and assumptions that affect our reported amounts of assets and liabilities, and disclosure of contingent assets and liabilities as of the dates of our condensed consolidated financial statements, as well as our reported amounts of revenues and expenses during the reporting periods. Management has made significant estimates in a variety of areas including, but not limited to, valuation of certain financial instruments andthe allowance for loan losses. Actual results could be different from these estimates.
Senior Preferred Stock Purchase AgreementOn September 7, 2008, the Secretary of the Treasury and Senior Preferred Stock
the Director of FHFA announced several actions taken by Treasury has made a commitment underand FHFA regarding Fannie Mae, which included: (1) placing us in conservatorship and (2) the execution of a senior preferred stock purchase agreement by our conservator, on our behalf, and Treasury, pursuant to which we issued to Treasury both senior preferred stock and a warrant to purchase common stock.
On September 5, 2019, Treasury released its plan to reform the housing finance system. The Treasury Housing Reform Plan (the “Treasury plan”) is far-reaching in scope and could have a significant impact on our structure, our role in the secondary mortgage market, our capitalization, our business and our competitive environment. The Treasury plan includes recommendations relating to ending our conservatorship, amending our senior preferred stock purchase agreement with Treasury, considering additional restrictions and requirements on our business, and many other matters. The Treasury plan recommends that Treasury’s commitment to provide funding to us under certain circumstances if we have a net worth deficit. In the first quarter of 2018, we received $3.7 billion from Treasury to eliminate our net worth deficit as of December 31, 2017. Pursuant to the senior preferred stock purchase agreement we have received a totalshould be replaced with legislation that authorizes an explicit, paid-for guarantee backed by the full faith and credit of $119.8 billion fromthe Federal Government that is limited to the timely payment of principal and interest on qualifying MBS. The Treasury as of September 30, 2018,plan further recommends that, pending legislation, even after conservatorship Treasury should maintain its ongoing commitment to support our single-family and the amount of remaining funding available to us under the agreement was $113.9 billion.
Pursuant tomultifamily mortgage-backed securities through the senior preferred stock purchase agreement, as amended as contemplated by the plan.
There continues to be significant uncertainty regarding our future, including how long we issued shareswill continue to exist in our current form, the extent of senior preferred stock to Treasuryour role in 2008. Acting as successor to the rights, titles, powersmarket, how long we will be in conservatorship, what form we will have and privileges of the Board, our conservator has declared and directed us to pay dividends to Treasury on the senior preferred stock on a quarterly basis for every dividend period for which dividends were payable since we entered into conservatorship in 2008. Effective January 1, 2018, the dividend provisions of the senior preferred stock provide for quarterly dividends consisting of the amount, if any, by which our net worth as of the end of the immediately preceding fiscal quarter exceeds a $3.0 billion capital reserve amount. We refer to this as a “net worth sweep” dividend. On September 28, 2018, wewhat ownership
|
| | |
Fannie Mae (In conservatorship) Third Quarter 20182019 Form 10-Q | 5557 |
|
| | |
| | Notes to Condensed Consolidated Financial Statements | Summary of Significant Accounting Policies |
paidinterest, if any, our current common and preferred stockholders will hold in us after the conservatorship is terminated and whether we will continue to exist following conservatorship. Treasury has made a dividend of $4.5 billion based on our net worth of $7.5 billion as of June 30, 2018, lesscommitment under the applicable capital reserve amount of $3.0 billion. Becausesenior preferred stock purchase agreement to provide funding to us under certain circumstances if we hadhave a net worth deficit. We are not aware of $7.0any plans of FHFA (1) to fundamentally change our business model, other than changes that might result from recommendations in the Treasury plan, if implemented, or (2) to reduce the aggregate amount available to or held by the company under our capital structure, which includes the senior preferred stock purchase agreement.
Senior Preferred Stock Purchase Agreement and Senior Preferred Stock
Treasury has made a commitment under the senior preferred stock purchase agreement to provide funding to us under certain circumstances if we have a net worth deficit. Pursuant to the senior preferred stock purchase agreement, we have received a total of $119.8 billion from Treasury as of September 30, 2018,2019, and the amount of remaining funding available to us under the agreement was $113.9 billion.
Pursuant to the senior preferred stock purchase agreement, we expect to payissued shares of senior preferred stock in 2008. On September 27, 2019, we, through FHFA acting on our behalf in its capacity as our conservator, and Treasury entered into a letter agreement modifying the dividend of $4.0 billion for the fourth quarter of 2018 by December 31, 2018.
Theand liquidation preference provisions of the senior preferred stock is subject. These modifications and other specified provisions of the letter agreement are described below.
| |
| • | Modification to Dividend Provisions—Increase in Applicable Capital Reserve Amount. The terms of the senior preferred stock provide for dividends each quarter in the amount, if any, by which our net worth as of the end of the immediately preceding fiscal quarter exceeds the applicable capital reserve amount. The letter agreement modified the dividend provisions of the senior preferred stock to increase the applicable capital reserve amount from $3 billion to $25 billion, effective for dividend periods beginning July 1, 2019. |
As a result of this change to adjustment. The aggregate liquidation preference of the senior preferred stock was $123.8dividend provisions:
| |
| ◦ | No dividends were payable on the senior preferred stock for the third quarter of 2019, as our net worth of $6.4 billion as of June 30, 2019 was lower than the $25 billion capital reserve amount. |
| |
| ◦ | No dividends will be payable on the senior preferred stock for the fourth quarter of 2019, as our net worth of $10.3 billion as of September 30, 2019 is lower than the $25 billion capital reserve amount. |
| |
| • | Modification to Liquidation Preference Provisions—Increase in Liquidation Preference. The letter agreement provides that, on September 30, 2019, and at the end of each fiscal quarter thereafter, the liquidation preference of the senior preferred stock will increase by an amount equal to the increase in our net worth, if any, during the immediately prior fiscal quarter, until such time as the liquidation preference has increased by $22 billion. |
As a result of September 30, 2018.this change to the senior preferred stock liquidation preference provisions:
| |
| ◦ | The aggregate liquidation preference of the senior preferred stock increased from $123.8 billion as of June 30, 2019 to $127.2 billion as of September 30, 2019, due to the $3.4 billion increase in our net worth during the second quarter of 2019. |
| |
| ◦ | The aggregate liquidation preference of the senior preferred stock will increase from $127.2 billion as of September 30, 2019 to $131.2 billion as of December 31, 2019, due to the $4.0 billion increase in our net worth during the third quarter of 2019. |
| |
| • | Agreement to Amend Senior Preferred Stock Purchase Agreement to Enhance Taxpayer Protections. The letter agreement provides that we and Treasury agree to negotiate and execute an additional amendment to the senior preferred stock purchase agreement that further enhances taxpayer protections by adopting covenants broadly consistent with recommendations for administrative reform contained in the Treasury plan. |
See “Note 11, Equity (Deficit)” in our 20172018 Form 10-K for additional information about the senior preferred stock purchase agreement and the senior preferred stock.
Principles of Consolidation
Our condensed consolidated financial statements include our accounts as well as the accounts of the other entities in which we have a controlling financial interest. All intercompany balances and transactions have been eliminated. The typical condition for a controlling financial interest is ownership of a majority of the voting interests of an entity. A controlling financial interest may also exist in entities through arrangements that do not involve voting interests, such as a variable interest entity (“VIE”).
|
| | |
| Fannie Mae (In conservatorship) Third Quarter 2019 Form 10-Q | 58 |
|
| | |
| Notes to Condensed Consolidated Financial Statements | Summary of Significant Accounting Policies |
Single Security Initiative and UMBS
The Single Security Initiative was a joint initiative among Fannie Mae, Freddie Mac, and our jointly owned limited liability company, Common Securitization Solutions, LLC (“CSS”), under the direction of FHFA, to develop a single common mortgage-backed security issued by both Fannie Mae and Freddie Mac to finance fixed-rate mortgage loans backed by one- to four-unit single-family properties. We and Freddie Mac began issuing uniform mortgage-backed securities (“UMBS”) pursuant to the Single Security Initiative in June 2019. We and Freddie Mac also began resecuritizing UMBS certificates into structured securities in June 2019. The structured securities backed by UMBS that we may issue include Supers, which are single-class resecuritization transactions, and Real Estate Mortgage Investment Conduit securities (“REMICs”) and interest-only and principal-only strip securities (“SMBS”), which are multi-class resecuritization transactions.
Since the implementation of the Single Security Initiative in June 2019, we have been able to include UMBS, Supers and other structured securities issued by Freddie Mac in some of our resecuritization trusts. The mortgage loans that serve as collateral for Freddie Mac-issued UMBS are not held in trusts that are consolidated by Fannie Mae. When we include Freddie Mac securities in our structured securities, we are subject to additional credit risk because we guarantee securities that were not previously guaranteed by Fannie Mae. However, Freddie Mac continues to guarantee the payment of principal and interest on the underlying Freddie Mac securities that we have resecuritized. We have concluded that this additional credit risk is negligible because of the funding commitment available to Freddie Mac through its senior preferred stock purchase agreement with Treasury. Prior to the implementation of the Single Security Initiative, the vast majority of underlying assets of our resecuritization trusts were limited to Fannie Mae securities that were collateralized by mortgage loans held in consolidated trusts.
Single-Class Resecuritization Trusts
Fannie Mae single-class resecuritization trusts are created by depositing mortgage-backed securities (“MBS”) into a new securitization trust for the purpose of aggregating multiple mortgage-related securities into a single security. Single-class resecuritization securities pass through directly to the holders of the securities all of the cash flows of the underlying mortgage-backed securities held in the resecuritization trust. With the implementation of the Single Security Initiative, these securities can now be collateralized directly or indirectly by cash flows from underlying securities issued by Fannie Mae, Freddie Mac, or a combination of both. Resecuritization trusts backed directly or indirectly only by Fannie Mae MBS are non-commingled resecuritization trusts. Resecuritization trusts collateralized directly or indirectly by cash flows either in part or in whole from Freddie Mac securities are commingled resecuritization trusts.
Securities issued by our non-commingled single-class resecuritization trusts are backed solely by Fannie Mae MBS and the guarantee we provide on the trust does not subject us to additional credit risk because we have already provided a guarantee on the underlying securities. Further, the securities issued by our non-commingled single-class resecuritization trusts pass through all of the cash flows of the underlying Fannie Mae MBS directly to the holders of the securities. Accordingly, these securities are deemed to be substantially the same as the underlying Fannie Mae MBS collateral. Additionally, our involvement with these trusts does not provide us with any incremental rights or powers that would enable us to direct any activities of the trusts. As a result, we have concluded that we are not the primary beneficiaries of, and as a result, we do not consolidate, our non-commingled single-class resecuritization trusts. Therefore, we account for purchases and sales of securities issued by non-commingled single-class resecuritization trusts as extinguishments and issuances of the underlying MBS debt, respectively.
Securities issued by our commingled single-class resecuritization trusts are backed in whole or in part by Freddie Mac securities. The guaranty we provide to the commingled single-class resecuritization trust subjects us to additional credit risk because we are providing a guaranty for the timely payment of principal and interest on the underlying Freddie Mac securities that we have not previously guaranteed. Accordingly, securities issued by our commingled resecuritization trusts are not deemed to be substantially the same as the underlying collateral. We do not have any incremental rights or powers related to commingled single-class resecuritization trusts that would enable us to direct any activities of the underlying trusts. As a result, we have concluded that we are not the primary beneficiary of, and therefore do not consolidate, our commingled single-class resecuritization trusts unless we have the unilateral right to dissolve the trust. We have this right when we hold 100% of the beneficial interests issued by the resecuritization trust. Therefore, we account for purchases and sales of these securities as purchases and sales of investment securities.
Multi-Class Resecuritization Trusts
Multi-class resecuritization trusts are trusts we create to issue multi-class Fannie Mae structured securities, including REMICs and SMBS, in which the cash flows of the underlying mortgage assets are divided, creating several classes of securities, each of which represents a beneficial ownership interest in a separate portion of cash flows. We guarantee to each multi-class resecuritization trust that we will supplement amounts received by the trusts as required to permit timely payments of principal and interest, as applicable, on the related Fannie Mae structured securities. With the implementation of the Single Security Initiative, these multi-class structured securities can now be collateralized, directly or indirectly, by securities issued by Fannie Mae, Freddie Mac, or a combination of both.
|
| | |
| Fannie Mae (In conservatorship) Third Quarter 2019 Form 10-Q | 59 |
|
| | |
| Notes to Condensed Consolidated Financial Statements | Summary of Significant Accounting Policies |
The guaranty we provide to our non-commingled multi-class resecuritization trusts does not subject us to additional credit risk, because the underlying assets are Fannie Mae-issued securities for which we have already provided a guaranty. However, for commingled multi-class structured securities, we are subject to additional credit risk because we are providing a guaranty for the timely payment of principal and interest on the underlying Freddie Mac securities that we have not previously guaranteed. For both commingled and non-commingled multi-class resecuritization trusts, we may also be exposed to prepayment risk via our ownership of securities issued by these trusts. We do not have the ability via our involvement with a multi-class resecuritization trust to impact either the credit risk or prepayment risk to which we are exposed. Therefore, we have concluded that we do not have the characteristics of a controlling financial interest and do not consolidate multi-class resecuritization trusts unless we have the unilateral right to dissolve the trust as noted below.
Securities issued by multi-class resecuritization trusts do not directly pass through all of the cash flows of the underlying securities and therefore the issued and underlying securities are not considered substantially the same. Accordingly, if a multi-class resecuritization trust is not consolidated, we account for purchases and sales of securities issued by the trust as purchases and sales of investment securities.
Since the implementation of the Single Security Initiative in June 2019, we may now include UMBS, Supers and other structured securities backed by securities issued by Freddie Mac in our resecuritization trusts. As a result, we adopted a consolidation threshold for multi-class resecuritization trusts that is based on our ability to unilaterally dissolve the resecuritization trust. This ability exists only when we hold 100% of the outstanding beneficial interests issued by the resecuritization trust. This new consolidation threshold was applied prospectively upon implementation of the Single Security Initiative in the second quarter of 2019 and prior period amounts were not recast. Prior to the implementation of the Single Security Initiative, we consolidated multi-class resecuritization trusts when we held a substantial portion of the outstanding beneficial interests issued by the trust. Our adoption of the new consolidation threshold did not have a material impact on our condensed consolidated financial statements.
Regulatory Capital
We submit capital reports to FHFA, which monitors our capital levels. The deficit of core capital over statutory minimum capital was $136.7$133.8 billion as of September 30, 20182019 and $144.4$137.1 billion as of December 31, 2017. Due to the terms of our senior preferred stock described above, we do not expect to eliminate our deficit of core capital over statutory minimum capital.2018.
Related Parties
As a result of our issuance toBecause Treasury ofholds a warrant to purchase shares of Fannie Mae common stock equal to 79.9% of the total number of shares of Fannie Mae common stock, we and Treasury are deemed related parties. As of September 30, 2018,2019, Treasury held an investment in our senior preferred stock with an aggregate liquidation preference of $123.8$127.2 billion. See “Senior Preferred Stock Purchase Agreement and Senior Preferred Stock” above for additional information on transactions under this agreement.
FHFA’s control of both Fannie Mae and Freddie Mac has caused Fannie Mae, FHFA and Freddie Mac to be deemed related parties. In 2013,Additionally, Fannie Mae and Freddie Mac established Common Securitization Solutions, LLC (“CSS”),jointly own CSS, a jointly owned limited liability company created to operate a common securitization platform; therefore,as such, CSS is deemed a related party.
In the ordinary course of business, Fannie Mae may purchase and sell securities issued by Treasury and Freddie Mac. These transactions occur on the same terms as those prevailing at the time for comparable transactions with unrelated parties. With our implementation of the Single Security Initiative in June 2019, some of the structured securities we issue are backed in whole or in part by Freddie Mac securities. Additionally, we make regular income tax payments to and receive tax refunds from the Internal Revenue Service (“IRS”), a bureau of Treasury.
Transactions with Treasury
Our administrative expenses were reduced by $6$5 million and $9$6 million for the three months ended September 30, 20182019 and 2017,2018, respectively, and $19$15 million and $32$19 million for the nine months ended September 30, 20182019 and 2017,2018, respectively, due to reimbursements from Treasury and Freddie Mac for expenses incurred as program administrator for Treasury’s Home Affordable Modification Program and other initiatives under Treasury’s Making Home Affordable Program.
DuringIn December 2011, Congress enacted the three months ended September 30, 2018,Temporary Payroll Cut Continuation Act of 2011 (“TCCA”) which, among other provisions, required that we did not make any paymentsincrease our single-family guaranty fees by at least 10 basis points and remit this increase to Treasury. Effective April 1, 2012, we increased the Internal Revenue Service (“IRS”), a bureau of Treasury. We made tax payments of $460 million during the nine months ended September 30, 2018. We made tax payments of $600 million and $1.7 billion during the three and nine months ended September 30, 2017, respectively.
In 2009, we entered into a memorandum of understanding with Treasury,guaranty fee on all single-family residential mortgages delivered to us by 10 basis points. FHFA and Freddie Mac pursuantTreasury advised us to whichremit this fee increase to Treasury with respect to all loans acquired by us on or after April 1, 2012 and before January 1, 2022, and to continue to remit these amounts to Treasury on and after January 1, 2022 with respect to loans we agreed to provide assistance to state and local housing finance agencies (“HFAs”) through certain programs, including a new issue bond (“NIB”) program. As of September 30, 2018, under the NIB program, Fannie Mae and Freddie Mac had $4.6 billion outstanding of pass-through securities backed by single-family and multifamily housing bonds issued by HFAs, which is less than 35% of the total original principal under the program, the amount of losses that Treasury would bear. Accordingly, we do not have a potential risk of loss under the NIB program.
acquired before this date until those loans are paid off or otherwise liquidated. The resulting fee revenue and expense related to the TCCA are recorded in “Mortgage loans interest income” and “TCCA fees,” respectively, in our condensed consolidated statements of operations and comprehensive income. We recognized $576$613 million and $531$576 million in TCCA fees forduring the three months ended September 30, 20182019 and 2017,2018, respectively, and $1.7$1.8 billion and $1.6$1.7 billion for the nine months ended September 30, 20182019 and 2017,2018, respectively, of which $576$613 million had not been remitted to Treasury as of September 30, 2018.
We incurred expenses in connection with certain funding obligations under the Federal Housing Enterprises Financial Safety and Soundness Act of 1992, as amended by the Federal Housing Finance Regulatory Reform Act of 2008 (the “GSE Act”), a portion of which is attributable to Treasury’s Capital Magnet Fund. These expenses, recognized in “Other expenses, net” in our condensed consolidated statements of operations and comprehensive income, were measured as the product of 4.2 basis points and the unpaid principal balance of our total new business purchases for the respective period. We recognized $20 million and $16 million in “Other expenses, net” in connection with Treasury’s Capital Magnet Fund for the three months ended September 30,2019.
|
| | |
Fannie Mae (In conservatorship) Third Quarter 20182019 Form 10-Q | 5660 |
|
| | |
| | Notes to Condensed Consolidated Financial Statements | Summary of Significant Accounting Policies |
2018Under the Federal Housing Enterprises Financial Safety and 2017,Soundness Act of 1992, as amended, including by the Federal Housing Finance Regulatory Reform Act of 2008 (together, the “GSE Act”), we are required to set aside certain funding obligations, a portion of which is attributable to Treasury’s Capital Magnet Fund. These funding obligations, recognized in “Other expenses, net” in our condensed consolidated statements of operations and comprehensive income, are measured as the product of 4.2 basis points and the unpaid principal balance of our total new business purchases for the respective period, and 35% of this amount is payable to Treasury’s Capital Magnet Fund. We recognized a total of $32 million and $20 million in “Other expenses, net” for the three months ended September 30, 2019 and 2018, respectively, and $57$68 million and $46$57 million for the nine months ended September 30, 2019 and 2018, and 2017, respectively, of which $57relating to amounts payable to Treasury’s Capital Magnet Fund. In 2020, we expect to pay the $68 million had not been remitted as of September 30, 2018.
In addition to the transactions with Treasury mentioned above, we purchase and sell Treasury securities in the normal course of business. As of September 30, 2018 and December 31, 2017, we held Treasury securities with a fair value of $37.6 billion and $29.2 billion, respectively, and accrued interest receivable of $124 million and $77 million, respectively. We recognized interest income on these securities held by us of $192 million and $95 million for the three months ended September 30, 2018 and 2017, respectively, and $485 million and $244 million for the nine months ended September 30, 20182019 to Treasury’s Capital Magnet Fund, along with additional amounts based on our new business purchases in the fourth quarter of 2019. In April 2019, we paid $75 million to Treasury’s Capital Magnet Fund based on our new business purchases in 2018.
On September 27, 2019, we, through FHFA acting on our behalf in its capacity as our conservator, and 2017, respectively.
Transactions with Freddie Mac
AsTreasury entered into a letter agreement modifying the dividend and liquidation preference provisions of September 30, 2018 and December 31, 2017, we held Freddie Mac mortgage-related securities with a fair value of $497 million and $613 million, respectively, and accrued interest receivable of $2 million and $2 million, respectively. We recognized interest income on these securitiesthe senior preferred stock held by usTreasury. These modifications and other specified provisions of $6 millionthe letter agreement are described under “Senior Preferred Stock Purchase Agreement and $8 million for the three months ended September 30, 2018 and 2017, respectively, and $19 million and $31 million for the nine months ended September 30, 2018 and 2017, respectively. In addition, Freddie Mac may be an investor in variable interest entities (“VIEs”) that we have consolidated, and we may be an investor in VIEs that Freddie Mac has consolidated. Freddie Mac may also be an investor in our debt securities.Senior Preferred Stock” above.
Transactions with FHFA
The GSE Act authorizes FHFA to establish an annual assessment for regulated entities, including Fannie Mae, which is payable on a semi-annual basis (April and October), for FHFA’s costs and expenses, as well as to maintain FHFA’s working capital. We recognized FHFA assessment fees, which are recorded in “Administrative expenses” in our condensed consolidated statements of operations and comprehensive income, of $30 million and $26 million for the three months ended September 30, 2019 and 2018, respectively, and 2017,$89 million and $81 million and $82 million for the nine months ended September 30, 20182019 and 2017,2018, respectively.
Transactions with CSS and Freddie Mac
We contributed capital to CSS, the company we jointly own with Freddie Mac, of $33$22 million and $25$33 million for the three months ended September 30, 20182019 and 2017,2018, respectively, and $109$84 million and $78$109 million for the nine months ended September 30, 2019 and 2018, respectively. In the second quarter of 2019, Fannie Mae, Freddie Mac and 2017, respectively. No other transactions outside of normal business activities have occurred betweenCSS entered into an amendment to the customer services agreement that sets forth the terms under which CSS provides mortgage securitization services to us and CSS during the three and nine months ended September 30, 2018 and 2017.
Income Taxes
The decrease in our provision for federal income taxes for the three and nine months ended September 30, 2018 as comparedFreddie Mac. In June 2019, we entered into an indemnification agreement with Freddie Mac relating to the threecommingled structured securities that we and nine months ended September 30, 2017 wasFreddie Mac issue. Under the resultindemnification agreement, Fannie Mae and Freddie Mac each have agreed to indemnify the other party for losses caused by: its failure to meet its payment or other specified obligations under the trust agreements pursuant to which the underlying resecuritized securities were issued; its failure to meet its obligations under the customer services agreement; its violations of the Tax Cutslaws; or with respect to material misstatements or omissions in offering documents, ongoing disclosures and Jobs Act of 2017, which reduced the federal statutory corporate income tax rate from 35% to 21% effective January 1, 2018. This decline was the primary driver of the reduction in our effective tax rate to 20.7% for the three months ended September 30, 2018 and 20.6% for the nine months ended September 30, 2018, compared with 33.5% for the three months ended September 30, 2017 and 33.3% for the nine months ended September 30, 2017. Our effective tax rates for all the periods presented were different from the prevailing federal statutory rate primarily duerelated materials relating to the benefits of our investments in housing projects eligible for low-income housing tax credits.underlying resecuritized securities.
Earnings (Loss) per Share
Earnings (loss) per share (“EPS”) is presented for basic and diluted EPS. We compute basic EPS by dividing net income (loss) attributable to common stockholders by the weighted-average number of shares of common stock outstanding during the period. However, as a result of our conservatorship status and the terms of the senior preferred stock, no amounts arewould be available to distribute as dividends to common or preferred stockholders (other than to Treasury as the holder of the senior preferred stock). Net income (loss) attributable to common stockholders excludes amounts attributable to the senior preferred stock, which increase the liquidation preference as described above in “Senior Preferred Stock Purchase Agreement and Senior Preferred Stock.” Weighted average common shares includes 4.6 billion shares for the periods ended September 30, 20182019 and 20172018 that would be issued upon the full exercise of the warrant issued to Treasury from the date the warrant was issued.issued through September 30, 2019 and 2018.
The calculation of diluted EPS includes all the components of basic earnings per share, plus the dilutive effect of common stock equivalents such as convertible securities and stock options. Weighted average shares outstanding is increased to include the number of additional common shares that would have been outstanding if the dilutive potential common shares had been issued. For the three and nine months ended September 30, 2019 convertible preferred stock is not included in the calculation because a net loss attributable to common shareholders was incurred and it would have an anti-dilutive effect. For the nine months ended September 30, 2019 and 2018 and the three months ended September 30, 2018, our diluted EPS weighted average shares outstanding includes shares of common stock that would be issuable upon the conversion of 131 million shares of convertible preferred stock.
|
| | |
Fannie Mae (In conservatorship) Third Quarter 20182019 Form 10-Q | 5761 |
|
| | |
| | Notes to Condensed Consolidated Financial Statements | Summary of Significant Accounting Policies |
and the nine months ended September 30, 2017, our diluted EPS weighted average shares outstanding includes shares of common stock that would be issuable upon the conversion of 131 million shares of convertible preferred stock. For the three months ended September 30, 2017, convertible preferred stock is not included in the calculation because a net loss attributable to common stockholders was incurred and it would have an anti-dilutive effect.
New Accounting Guidance
TheThe following table updates information about our significant accounting policies that have recently been adopted or are yet to be adopted from the information included in “Note 1, Summary of Significant Accounting Policies” in our 20172018 Form 10-K.
|
| | | |
Standard | Description | Effective Date | Impact on Consolidated Financial Statements |
Accounting Standards Update (“ASU”) 2016-01, Recognition and Measurement of Financial Assets and Financial Liabilities (Subtopic 825-10)
| The amendment addresses certain aspects of recognition, measurement, presentation and disclosure of financial instruments. | January 1, 2018 | The adoption of the amendments did not have a material impact on our consolidated financial statements. |
ASU 2016-15,
Statement of Cash Flows (Topic 230), Classification of Certain Cash Receipts and Cash Payments (a consensus of the Emerging Issues Task Force)
| The main objective of this update is to address the diversity in practice that currently exists in regards to how certain cash receipts and cash payments are presented and classified in the statement of cash flows under Topic 230, Statement of Cash Flows, and other Topics. | January 1, 2018 | This guidance was applied retrospectively to the statement of cash flows for the prior period presented. The adoption of the amendments did not have a material impact on our consolidated financial statements. |
ASU 2016-18,
Statement of Cash Flows(Topic 230), Restricted Cash (a consensus of the Financial Accounting Standards Board (“FASB”) Emerging Issues Task Force)
| The amendments in this update address the diversity in the classification and presentation of changes in restricted cash on the statement of cash flows under Topic 230, Statement of Cash Flows. Specifically, this amendment dictates that the statement of cash flows should explain the change in the period of the total of cash, cash equivalents and restricted cash balances. | January 1, 2018 | This guidance was applied retrospectively to the statements of cash flows for the prior period presented. As a result of this adoption, the net change in restricted cash that results from transfers between cash, cash equivalents, and restricted cash is no longer presented as an investing activity in our consolidated statement of cash flows. The adoption of the amendments did not have a material impact on our consolidated financial statements. |
ASU 2018-02,
Income Statement (Topic 220): Reclassification of Certain Tax Effects from Accumulated Other Comprehensive Income
| The amendments in this update allow a reclassification from accumulated other comprehensive income to retained earnings for stranded tax effects resulting from the Tax Cuts and Jobs Act. | January 1, 2019 | The early adoption of this guidance on January 1, 2018 resulted in the reclassification of $117 million in stranded tax amounts from accumulated other comprehensive income to retained earnings. |
ASU 2018-13,
Fair Value Measurement (Topic 820), Disclosure Framework—Changes to the Disclosure
Requirements for Fair Value Measurement
| The amendments in this update streamline, clarify and enhance certain disclosures related to Level 3 recurring and nonrecurring fair value measurements. | January 1, 2020 | We do not expect the adoption of this guidance to have a material impact on our consolidated financial statements. Adoption is required for periods beginning January 1, 2020 with early adoption permitted. We are considering adopting this guidance for our 2018 Form 10-K. |
ASU 2016-13,
Financial Instruments-Credit Losses (Topic 326): Measurement of Credit Losses on Financial Instruments
| The amendments in this update replace the incurred loss impairment methodology in current GAAP with a methodology that reflects lifetime expected credit losses and requires consideration of a broader range of reasonable and supportable information to inform credit loss estimates. | January 1, 2020 | We are continuing to evaluate the impact of this guidance on our consolidated financial statements. We expect the greater impact of the guidance to relate to our accounting for credit losses for loans that are not individually impaired. The adoption of this guidance may increase our allowance for loan losses and decrease, perhaps substantially, our retained earnings. |
The CECL standard will become effective for our fiscal year beginning January 1, 2020. We are currently performing full integrated testing across all models, accounting systems and processes that will be used to estimate credit losses and record accounting impacts under the CECL standard. All updates to our credit loss models are subject to our model oversight and review governance process. We are managing the implementation of this guidance in accordance with our change management governance standards, which are designed to ensure compliance with GAAP as well as operational readiness at adoption. Senior management and the Audit Committee receive regular updates regarding the status of our implementation plan, results of modeled impacts and any identified key risks.
We will use a discounted cash flow method to measure expected credit losses on our single-family mortgage loans and an undiscounted loss method to measure expected credit losses on our multifamily mortgage loans. The models we will use to estimate credit losses will incorporate our historical credit loss experience, adjusted for current economic forecasts and the current credit profile of our loan book of business. The models will use reasonable and supportable forecasts for key economic drivers, such as home prices (Single-Family), rental income (Multifamily) and capitalization rates (Multifamily).
Based on the composition of the loans in our book of business as of September 30, 2019 and our current expectations of future economic conditions, we estimate that our adoption of the CECL standard will result in a reduction in our retained earnings of up to $2 billion on an after-tax basis in the first quarter of 2020. Our estimated impact upon adoption has been
refined over the last quarter to incorporate updated economic conditions and the resolution of various implementation items, including the exclusion of certain pre-foreclosure costs from our estimated allowance for credit losses. We continue to monitor and will assess the impact of further implementation guidance that may be issued. In addition, we continue to evaluate our modeled loss estimates and may make refinements to our approach and assumptions as a part of our overall integrated testing efforts. The impact of our adoption of the CECL standard on our retained earnings will be further influenced by the credit risk profile of the loans in our book of business as of the January 1, 2020 adoption date, as well as changes in economic conditions and our forecasts of future economic conditions at that time.
|
| | |
Fannie Mae (In conservatorship) Third Quarter 20182019 Form 10-Q | 5862 |
|
| | |
| | Notes to Condensed Consolidated Financial Statements | Consolidations and Transfers of Financial Assets |
2. Consolidations and Transfers of Financial Assets
We have interests in various entities that are considered to be VIEs.variable interest entities (“VIEs”). The primary types of entities are securitization and resecuritization trusts, limited partnerships and limited partnerships.special purpose vehicles (“SPVs”). These interests include investments in securities issued by VIEs, such as Fannie Mae MBS created pursuant to our securitization transactions and our guaranty to the entity. We consolidate the substantial majority of our single-class securitization trusts because our role as guarantor and master servicer provides us with the power to direct matters (primarily the servicing of mortgage loans) that impact the credit risk to which we are exposed. In contrast, we do not consolidate single-class securitization trusts when other organizations have the power to direct these activities. Historically, the vast majority of underlying assets of our resecuritization trusts were limited to Fannie Mae securities that were collateralized by mortgage loans held in consolidated trusts. However, beginning with the implementation of the Single Security Initiative in June 2019, we include securities issued by Freddie Mac in some of our resecuritization trusts. The mortgage loans that serve as collateral for Freddie Mac-issued UMBS are not held in trusts that are consolidated by Fannie Mae.
Unconsolidated VIEs
We do not consolidate VIEs when we are not deemed to be the primary beneficiary. Our unconsolidated VIEs include securitization trusts, limited partnerships, and limited partnerships.certain SPVs designed to transfer credit risk. The following table displays the carrying amount and classification of our assets and liabilities that relate to our involvement with unconsolidated securitization and resecuritization trusts.
| | | | As of | As of |
| | September 30, 2018 | | December 31, 2017 | September 30, 2019 | | December 31, 2018 |
| | (Dollars in millions) | |
Assets and liabilities recorded in our condensed consolidated balance sheets related to unconsolidated mortgage-backed trusts:
| | (Dollars in millions) |
| Assets: | | | | | | | | | | |
| Trading securities: | | | | | | | | | | |
| Fannie Mae | | $ | 1,420 |
| | $ | 3,809 |
| | | $ | 2,733 |
| | $ | 1,422 |
| |
| Non-Fannie Mae | | 5,009 |
| | 1,580 |
| | | 4,445 |
| | 4,809 |
| |
| Total trading securities | | 6,429 |
| | 5,389 |
| | | 7,178 |
| | 6,231 |
| |
| Available-for-sale securities: | | | |
|
| | | | | | |
| Fannie Mae | | 1,754 |
| | 2,032 |
| | | 1,581 |
| | 1,704 |
| |
| Non-Fannie Mae | | 1,254 |
| | 2,062 |
| | | 771 |
| | 1,207 |
| |
| Total available-for-sale securities | | 3,008 |
| | 4,094 |
| | | 2,352 |
| | 2,911 |
| |
| Other assets | | 69 |
| | 74 |
| | | 57 |
| | 66 |
| |
| Other liabilities | | (108 | ) | | (467 | ) | | | (82 | ) | | (101 | ) | |
| Net carrying amount | | $ | 9,398 |
| | $ | 9,090 |
| | | $ | 9,505 |
| | $ | 9,107 |
| |
Our maximum exposure to loss generally represents the greater of our recorded investment in the entity or the unpaid principal balance of the assets covered by our guaranty. However,Our involvement in unconsolidated resecuritization trusts may give rise to additional exposure to loss depending on the type of resecuritization trust. Fannie Mae non-commingled resecuritization trusts refers to our securities issuedresecuritization trusts that are backed entirely by Fannie Mae MBS. These non-commingled single-class and multi-class resecuritization trusts that are not consolidated do not give rise to any additional exposure to loss as we already consolidate the underlying collateral.
Fannie Mae commingled resecuritization trusts refers to our resecuritization trusts that are backed in whole or in part by Freddie Mac securities. The guaranty that we provide to these commingled resecuritization trusts increases our exposure to loss relating to the Freddie Mac securities that serve as the underlying collateral. Our maximum exposure to loss for these unconsolidated trusts is measured by the amount of Freddie Mac securities that back these resecuritization trusts. However, a portion of these Freddie Mac securities may be backed in whole or in part by Fannie Mae MBS. Therefore, to the extent that these Freddie Mac securities are backed by Fannie Mae MBS, it would not give rise to any additional exposure and our total exposure to collateral that is ultimately guaranteed by Freddie Mac may be lower than the disclosed maximum exposure to loss. Our maximum exposure to loss related to unconsolidated mortgage-backedsecuritization and resecuritization trusts was approximately $14$41 billion and $15$14 billion as of September 30, 20182019 and December 31, 2017,2018, respectively. The total assets of our unconsolidated securitization and resecuritization trusts were approximately $90$100 billion and $70$80 billion as of September 30, 20182019 and December 31, 2017,2018, respectively.
The maximum exposure to loss for our unconsolidated limited partnerships and similar legal entities, which consist of low-income housing tax credit investments (“LIHTC”), community investments and other entities, was $105$93 million and the related carrying value was $83$70 million as of September 30, 2018.2019. As of December 31, 2017,2018, the maximum exposure to loss was $105 $111
|
| | |
| Fannie Mae (In conservatorship) Third Quarter 2019 Form 10-Q | 63 |
|
| | |
| Notes to Condensed Consolidated Financial Statements | Consolidations and Transfers of Financial Assets |
million and the related carrying value was $82$89 million. The total assets of these limited partnership investments were $2.4 billion and $3.2$2.3 billion as of September 30, 20182019 and December 31, 2017,2018.
The maximum exposure to loss related to our involvement with unconsolidated SPVs that transfer credit risk represents the unpaid principal balance and accrued interest payable of obligations issued by the Connecticut Avenue Securities (“CAS”) SPVs. The maximum exposure to loss related to these unconsolidated SPVs was $6.5 billion and $920 million as of September 30, 2019 and December 31, 2018, respectively. The total assets related to these unconsolidated SPVs were $6.5 billion and $931 million as of September 30, 2019 and December 31, 2018, respectively.
The unpaid principal balance of our multifamily loan portfolio was $284.3$318.1 billion as of September 30, 2018.2019. As our lending relationship does not provide us with a controlling financial interest in the borrower entity, we do not consolidate these borrowers regardless of their status as either a VIE or a voting interest entity. We have excluded these entities from our VIE disclosures. However, the disclosures we have provided in “Note 3, Mortgage Loans,” “Note 4, Allowance for Loan Losses” and “Note 6, Financial Guarantees” with respect to this population are consistent with the FASB’s stated objectives for the disclosures related to unconsolidated VIEs.
Transfers of Financial Assets
We issue Fannie Mae MBS through portfolio securitization transactions by transferring pools of mortgage loans or mortgage-related securities to one or more trusts or special purpose entities. We are considered to be the
|
| | |
Fannie Mae (In conservatorship) Third Quarter 2018 Form 10-Q | 59 |
|
| | |
| Notes to Condensed Consolidated Financial Statements | Consolidations and Transfers of Financial Assets |
transferor when we transfer assets from our own retained mortgage portfolio in a portfolio securitization transaction. For the three months ended September 30, 20182019 and 2017,2018, the unpaid principal balance of portfolio securitizations was $64.9$89.0 billion and $68.1$64.9 billion, respectively. For the nine months ended September 30, 20182019 and 2017,2018, the unpaid principal balance of portfolio securitizations was $180.8$187.7 billion and $194.5$180.8 billion, respectively.
We retain interests from the transfer and sale of mortgage-related securities to unconsolidated single-class and multi-class portfolio securitization trusts. As of September 30, 2019, the unpaid principal balance of retained interests was $3.1 billion and its related fair value was $4.2 billion. As of December 31, 2018, the unpaid principal balance of retained interests was $1.5 billion and its related fair value was $2.2 billion. The unpaid principal balance of retained interests was $3.9 billion and its related fair value was $4.7 billion as of December 31, 2017. For the three months ended September 30, 20182019 and 2017,2018, the principal, interest and interestother fees received on retained interests was $114$187 million and $294$114 million, respectively. For the nine months ended September 30, 20182019 and 2017,2018, the principal, interest and interestother fees received on retained interests was $468$425 million and $854$468 million, respectively.
Managed Loans
Managed loans are on-balance sheet mortgage loans, as well as mortgage loans that we have securitized in unconsolidated portfolio securitization trusts. The unpaid principal balance of securitized loans in unconsolidated portfolio securitization trusts, which are primarily include loans that are guaranteed or insured, in whole or in part, by the U.S. government,government. For those loans that we have securitized in unconsolidated portfolio securitization trusts, the outstanding unpaid principal balance was $1.2 billion and $1.3$1.1 billion as of September 30, 20182019 and $1.2 billion as of December 31, 2017, respectively.2018. For information on ourregarding on-balance sheet mortgagemanaged loans, see “Note 3, Mortgage Loans.”
|
| | |
Fannie Mae (In conservatorship) Third Quarter 20182019 Form 10-Q | 6064 |
|
| | |
| | Notes to Condensed Consolidated Financial Statements | Mortgage Loans |
3. Mortgage Loans
We own single-family mortgage loans, which are secured by four or fewer residential dwelling units, and multifamily mortgage loans, which are secured by five or more residential dwelling units. We classify these loans as either held for investment (“HFI”) or held for sale (“HFS”). We report the carrying value of HFI loans at the unpaid principal balance, net of unamortized premiums and discounts, other cost basis adjustments, and an allowance for loan losses. We report the carrying value of HFS loans at the lower of cost or fair value and record valuation changes in “Investment gains, net” in our condensed consolidated statements of operations and comprehensive income. We define the recorded investment of HFI loans as unpaid principal balance, net of unamortized premiums and discounts, other cost basis adjustments, and accrued interest receivable.
For purposes of the single-family mortgage loan disclosures in this footnote,below, we define “primary” class as mortgage loans that are not included in other loan classes; “government” class as mortgage loans that are guaranteed or insured, in whole or in part, by the U.S. government, or one of its agencies, and that are not Alt-A; and “other” class as loans with certain higher-risk characteristics, such as interest-only loans and negative-amortizing loans, that are neither government nor Alt-A.
The following table displays the carrying value of our mortgage loans.
| | | | As of | | As of |
| | September 30, 2018 | | December 31, 2017 | | September 30, 2019 | | December 31, 2018 |
| | (Dollars in millions) | | (Dollars in millions) |
| Single-family | $ | 2,924,857 |
| | $ | 2,890,634 |
| | $ | 2,962,083 |
| | $ | 2,929,925 |
|
| Multifamily | 284,298 |
| | 265,069 |
| | 318,106 |
| | 293,858 |
|
| Total unpaid principal balance of mortgage loans | 3,209,155 |
| | 3,155,703 |
| | 3,280,189 |
| | 3,223,783 |
|
| Cost basis and fair value adjustments, net | 39,642 |
| | 41,906 |
| | 43,323 |
| | 39,815 |
|
| Allowance for loan losses for loans held for investment | (15,663 | ) | | (19,084 | ) | | (9,376 | ) | | (14,203 | ) |
| Total mortgage loans | $ | 3,233,134 |
| | $ | 3,178,525 |
| | $ | 3,314,136 |
| | $ | 3,249,395 |
|
The following table displays information about our redesignated mortgage loans.
| | | | For the Three Months Ended September 30, | | For the Nine Months Ended September 30, | For the Three Months Ended September 30, | | For the Nine Months Ended September 30, |
| | | |
| | 2018 | | 2017 | | 2018 | | 2017 | 2019 | | 2018 | | 2019 | | 2018 |
| | (Dollars in millions) | (Dollars in millions) |
Carrying value of loans redesignated from HFI to HFS | $ | 4,249 |
| | $ | 2,077 |
| | $ | 17,851 |
| | $ | 7,499 |
| $ | 4,882 |
| | $ | 4,249 |
| | $ | 14,252 |
| | $ | 17,851 |
|
Carrying value of loans redesignated from HFS to HFI | 6 |
| | 59 |
| | 36 |
| | 111 |
| 10 |
| | 6 |
| | 22 |
| | 36 |
|
| Loans sold - unpaid principal balance | 9,373 |
| | 3,433 |
| | 13,831 |
| | 6,473 |
| 3,941 |
| | 9,373 |
| | 10,497 |
| | 13,831 |
|
| Realized gains on sale of mortgage loans | 93 |
| | 158 |
| | 301 |
| | 211 |
| 184 |
| | 93 |
| | 504 |
| | 301 |
|
| |
(1) | Represents the carrying value of the loans after redesignation, excluding allowance. |
The recorded investment of single-family mortgage loans for which formal foreclosure proceedings are in process was $10.6$8.2 billion and $13.0$10.1 billion as of September 30, 20182019 and December 31, 2017,2018, respectively. As a result of our various loss mitigation and foreclosure prevention efforts, we expect that a portion of the loans in the process of formal foreclosure proceedings will not ultimately foreclose.
Nonaccrual Loans
We discontinue accruing interest on loans when we believe collectibility of principal or interest is not reasonably assured, which for a single-family loan we have determined, based on our historical experience, to be when the loan becomes two months or more past due according to its contractual terms. Interest previously accrued but not collected is reversed through interest income at the date a loan is placed on nonaccrual status. We return a non-modified single-family loan to accrual status at the point that the borrower brings the loan current. We return a modified single-family loan to accrual status at the point that the borrower successfully makes all required payments during the trial period (generally three to four months) and the modification is made permanent. We place a multifamily loan on nonaccrual status when the loan becomes three months or more past due according to its contractual terms or is deemed to be individually impaired, unless the loan is well secured such that collectibility of principal and accrued interest is reasonably assured. We return a multifamily loan to accrual stat
|
| | |
Fannie Mae (In conservatorship) Third Quarter 2018 Form 10-Q | 61 |
|
| | |
| Notes to Condensed Consolidated Financial Statements | Mortgage Loans |
usstatus when the borrower cures the delinquency of the loan or we otherwise determine that the loan is well secured such that collectibility is reasonably assured.
|
| | |
| Fannie Mae (In conservatorship) Third Quarter 2019 Form 10-Q | 65 |
|
| | |
| Notes to Condensed Consolidated Financial Statements | Mortgage Loans |
Aging Analysis
The following tables display an aging analysis of the total recorded investment in our HFI mortgage loans by portfolio segment and class, excluding loans for which we have elected the fair value option.
| | | | As of September 30, 2018 | | As of September 30, 2019 |
| | 30 - 59 Days Delinquent | | 60 - 89 Days Delinquent | | Seriously Delinquent(1) | | Total Delinquent | | Current | | Total | | Recorded Investment in Loans 90 Days or More Delinquent and Accruing Interest | | Recorded Investment in Nonaccrual Loans | | 30 - 59 Days Delinquent | | 60 - 89 Days Delinquent | | Seriously Delinquent(1) | | Total Delinquent | | Current | | Total | | Recorded Investment in Loans 90 Days or More Delinquent and Accruing Interest | | Recorded Investment in Nonaccrual Loans |
| | (Dollars in millions) | | (Dollars in millions) |
| Single-family: | | | | | | | | | | | | | | | | | | | | | | | | | | | | | | | |
| Primary | $ | 33,519 |
| | $ | 7,506 |
| | $ | 14,932 |
| | $ | 55,957 |
| | $ | 2,799,358 |
| | $ | 2,855,315 |
| | $ | 25 |
| | $ | 25,697 |
| | $ | 29,211 |
| | $ | 7,188 |
| | $ | 13,291 |
| | $ | 49,690 |
| | $ | 2,867,330 |
| | $ | 2,917,020 |
| | $ | 26 |
| | $ | 23,840 |
|
Government(2) | 54 |
| | 18 |
| | 175 |
| | 247 |
| | 23,132 |
| | 23,379 |
| | 175 |
| | — |
| | 44 |
| | 20 |
| | 144 |
| | 208 |
| | 17,881 |
| | 18,089 |
| | 144 |
| | — |
|
| Alt-A | 2,725 |
| | 875 |
| | 1,908 |
| | 5,508 |
| | 50,900 |
| | 56,408 |
| | 2 |
| | 3,212 |
| | 1,717 |
| | 591 |
| | 1,316 |
| | 3,624 |
| | 40,663 |
| | 44,287 |
| | 1 |
| | 2,228 |
|
| Other | 978 |
| | 319 |
| | 761 |
| | 2,058 |
| | 14,502 |
| | 16,560 |
| | 5 |
| | 1,216 |
| | 572 |
| | 212 |
| | 485 |
| | 1,269 |
| | 9,836 |
| | 11,105 |
| | 2 |
| | 800 |
|
| Total single-family | 37,276 |
| | 8,718 |
| | 17,776 |
| | 63,770 |
| | 2,887,892 |
| | 2,951,662 |
| | 207 |
| | 30,125 |
| | 31,544 |
| | 8,011 |
| | 15,236 |
| | 54,791 |
| | 2,935,710 |
| | 2,990,501 |
| | 173 |
| | 26,868 |
|
Multifamily(3) | 20 |
| | N/A |
| | 198 |
| | 218 |
| | 285,736 |
| | 285,954 |
| | — |
| | 554 |
| | 32 |
| | N/A |
| | 181 |
| | 213 |
| | 320,984 |
| | 321,197 |
| | — |
| | 604 |
|
| Total | $ | 37,296 |
| | $ | 8,718 |
| | $ | 17,974 |
| | $ | 63,988 |
| | $ | 3,173,628 |
| | $ | 3,237,616 |
| | $ | 207 |
| | $ | 30,679 |
| | $ | 31,576 |
| | $ | 8,011 |
| | $ | 15,417 |
| | $ | 55,004 |
| | $ | 3,256,694 |
| | $ | 3,311,698 |
| | $ | 173 |
| | $ | 27,472 |
|
|
| | | | | | | | | | | | | | | | | | | | | | | | | | | | | | | | |
| | | As of December 31, 2018 |
| | | 30 - 59 Days Delinquent | | 60 - 89 Days Delinquent | | Seriously Delinquent(1) | | Total Delinquent | | Current | | Total | | Recorded Investment in Loans 90 Days or More Delinquent and Accruing Interest | | Recorded Investment in Nonaccrual Loans |
| | | (Dollars in millions) |
| Single-family: | | | | | | | | | | | | | | | | |
| Primary | | $ | 30,471 |
| | $ | 7,881 |
| | $ | 14,866 |
| | $ | 53,218 |
| | $ | 2,816,047 |
| | $ | 2,869,265 |
| | $ | 22 |
| | $ | 26,170 |
|
Government(2) | | 57 |
| | 17 |
| | 169 |
| | 243 |
| | 21,887 |
| | 22,130 |
| | 169 |
| | — |
|
| Alt-A | | 2,332 |
| | 821 |
| | 1,844 |
| | 4,997 |
| | 48,274 |
| | 53,271 |
| | 2 |
| | 3,082 |
|
| Other | | 804 |
| | 283 |
| | 713 |
| | 1,800 |
| | 13,038 |
| | 14,838 |
| | 2 |
| | 1,128 |
|
| Total single-family | | 33,664 |
| | 9,002 |
| | 17,592 |
| | 60,258 |
| | 2,899,246 |
| | 2,959,504 |
| | 195 |
| | 30,380 |
|
Multifamily(3) | | 56 |
| | N/A |
| | 171 |
| | 227 |
| | 295,437 |
| | 295,664 |
| | — |
| | 492 |
|
| Total | | $ | 33,720 |
| | $ | 9,002 |
| | $ | 17,763 |
| | $ | 60,485 |
| | $ | 3,194,683 |
| | $ | 3,255,168 |
| | $ | 195 |
| | $ | 30,872 |
|
|
| | | | | | | | | | | | | | | | | | | | | | | | | | | | | | | |
| | As of December 31, 2017 |
| | 30 - 59 Days Delinquent | | 60 - 89 Days Delinquent | | Seriously Delinquent(1) | | Total Delinquent | | Current | | Total | | Recorded Investment in Loans 90 Days or More Delinquent and Accruing Interest | | Recorded Investment in Nonaccrual Loans |
| | (Dollars in millions) |
| Single-family: | | | | | | | | | | | | | | | |
| Primary | $ | 35,582 |
| | $ | 10,396 |
| | $ | 23,999 |
| | $ | 69,977 |
| | $ | 2,732,818 |
| | $ | 2,802,795 |
| | $ | 87 |
| | $ | 37,971 |
|
Government(2) | 55 |
| | 21 |
| | 206 |
| | 282 |
| | 30,807 |
| | 31,089 |
| | 206 |
| | — |
|
| Alt-A | 3,186 |
| | 1,147 |
| | 3,418 |
| | 7,751 |
| | 59,475 |
| | 67,226 |
| | 5 |
| | 5,094 |
|
| Other | 1,185 |
| | 411 |
| | 1,252 |
| | 2,848 |
| | 19,016 |
| | 21,864 |
| | 5 |
| | 1,834 |
|
| Total single-family | 40,008 |
| | 11,975 |
| | 28,875 |
| | 80,858 |
| | 2,842,116 |
| | 2,922,974 |
| | 303 |
| | 44,899 |
|
Multifamily(3) | 26 |
| | N/A |
| | 276 |
| | 302 |
| | 266,699 |
| | 267,001 |
| | — |
| | 424 |
|
| Total | $ | 40,034 |
| | $ | 11,975 |
| | $ | 29,151 |
| | $ | 81,160 |
| | $ | 3,108,815 |
| | $ | 3,189,975 |
| | $ | 303 |
| | $ | 45,323 |
|
__________
| |
(1) | Single-family seriously delinquent loans are loans that are 90 days or more past due or in the foreclosure process. Multifamily seriously delinquent loans are loans that are 60 days or more past due. |
| |
(2) | Primarily consists of reverse mortgages, which due to their nature, are not aged and are included in the current column. |
| |
(3) | Multifamily loans 60-89 days delinquent are included in the seriously delinquent column. |
|
| | |
Fannie Mae (In conservatorship) Third Quarter 20182019 Form 10-Q | 6266 |
|
| | |
| | Notes to Condensed Consolidated Financial Statements | Mortgage Loans |
Credit Quality Indicators
The following table displays the total recorded investment in our single-family HFI loans by class and credit quality indicator, excluding loans for which we have elected the fair value option.
|
| | | | | | | | | | | | | | | | | | | | | | | | |
| | | As of |
| | | September 30, 2019(1) | | December 31, 2018(1) |
| | | Primary | | Alt-A | | Other | | Primary | | Alt-A | | Other |
| | | (Dollars in millions) |
Estimated mark-to-market loan-to-value (“LTV”) ratio:(2) | | | | | | | | | | | | |
| Less than or equal to 80% | | $ | 2,569,771 |
| | $ | 39,710 |
| | $ | 9,694 |
| | $ | 2,521,766 |
| | $ | 45,476 |
| | $ | 12,291 |
|
Greater than 80% and less than or equal to 90% | | 228,868 |
| | 2,365 |
| | 709 |
| | 228,614 |
| | 3,804 |
| | 1,195 |
|
Greater than 90% and less than or equal to 100% | | 113,424 |
| | 1,131 |
| | 337 |
| | 109,548 |
| | 1,997 |
| | 645 |
|
| Greater than 100% | | 4,957 |
| | 1,081 |
| | 365 |
| | 9,337 |
| | 1,994 |
| | 707 |
|
| Total | | $ | 2,917,020 |
| | $ | 44,287 |
| | $ | 11,105 |
| | $ | 2,869,265 |
| | $ | 53,271 |
| | $ | 14,838 |
|
|
| | | | | | | | | | | | | | | | | | | | | | | |
| | As of |
| | September 30, 2018(1) | | December 31, 2017(1) |
| | Primary | | Alt-A | | Other | | Primary | | Alt-A | | Other |
| | (Dollars in millions) |
Estimated mark-to-market loan-to-value (“LTV”) ratio:(2) | | | | | | | | | | | |
| Less than or equal to 80% | $ | 2,541,859 |
| | $ | 47,773 |
| | $ | 13,642 |
| | $ | 2,439,858 |
| | $ | 51,903 |
| | $ | 16,428 |
|
Greater than 80% and less than or equal to 90% | 215,622 |
| | 4,151 |
| | 1,353 |
| | 238,038 |
| | 6,680 |
| | 2,277 |
|
Greater than 90% and less than or equal to 100% | 87,660 |
| | 2,230 |
| | 757 |
| | 106,076 |
| | 4,044 |
| | 1,443 |
|
| Greater than 100% | 10,174 |
| | 2,254 |
| | 808 |
| | 18,823 |
| | 4,599 |
| | 1,716 |
|
| Total | $ | 2,855,315 |
| | $ | 56,408 |
| | $ | 16,560 |
| | $ | 2,802,795 |
| | $ | 67,226 |
| | $ | 21,864 |
|
__________
| |
(1) | Excludes $23.4$18.1 billion and $31.1$22.1 billion as of September 30, 20182019 and December 31, 2017,2018, respectively, of mortgage loans guaranteed or insured, in whole or in part, by the U.S. government or one of its agencies, that are not Alt-A loans. The segment class is primarily reverse mortgages for which we do not calculate an estimated mark-to-market LTV ratio. |
| |
(2) | The aggregate estimated mark-to-market LTV ratio is based on the unpaid principal balance of the loan as of the end of each reported period divided by the estimated current value of the property as of the end of each reported period, which we calculate using an internal valuation model that estimates periodic changes in home value. |
The following table displays the total recorded investment in our multifamily HFI loans by credit quality indicator, excluding loans for which we have elected the fair value option.
|
| | | | | | | | | | | |
| | As of |
| | September 30, | | December 31, |
| | 2019 | | 2018 |
| | (Dollars in millions) |
| Credit risk profile by internally assigned grade: | | | | | | | |
| Non-classified | | $ | 314,458 |
| | | | $ | 289,231 |
| |
Classified(1) | | 6,739 |
| | | | 6,433 |
| |
| Total | | $ | 321,197 |
| | | | $ | 295,664 |
| |
|
| | | | | | | | | | | |
| | As of |
| | September 30, | | December 31, |
| | 2018 | | 2017 |
| | (Dollars in millions) |
| Credit risk profile by internally assigned grade: | | | | | | | |
| Non-classified | | $ | 280,952 |
| | | | $ | 263,416 |
| |
Classified(1) | | 5,002 |
| | | | 3,585 |
| |
| Total | | $ | 285,954 |
| | | | $ | 267,001 |
| |
_________
| |
(1) | RepresentsIncludes loans classified as “Substandard,“Substandard” or “Doubtful.” whichLoans classified as “Substandard” have a well-defined weakness that jeopardizes the timely full repayment. Loans with aclassified as “Doubtful” have weakness that makes collection or liquidation in full highly questionable and improbable based on existing conditions and values are referred to as “Doubtful.” Wevalues. As of September 30, 2019, we had no loans with recorded investment of less than $0.1 million classified as doubtful, for the periods indicated.compared with $1 million as of December 31, 2018. |
|
| | |
| Fannie Mae (In conservatorship) Third Quarter 2019 Form 10-Q | 67 |
|
| | |
| Notes to Condensed Consolidated Financial Statements | Mortgage Loans |
Individually Impaired Loans
Individually impaired loans include troubled debt restructurings (“TDRs”), acquired credit-impaired loans and multifamily loans that we have assessed as probable that we will not collect all contractual amounts due, regardless of whether we are currently accruing interest;interest, excluding loans classified as HFS.HFS and loans for which we have elected the fair value option. The following tables display the total unpaid principal balance, recorded investment, related allowance, average recorded investment and interest income recognized for individually impaired loans.
|
| | |
Fannie Mae (In conservatorship) Third Quarter 2018 Form 10-Q | 63 |
|
| | |
| Notes to Condensed Consolidated Financial Statements | Mortgage Loans |
|
| | | | | | | | | | | | | | | | | | | | | | | | | | | | | | | | | | |
| | As of |
| | September 30, 2018 | | December 31, 2017 |
| | Unpaid Principal Balance | | Total Recorded Investment | | Related Allowance for Loan Losses | | Unpaid Principal Balance | | Total Recorded Investment | | Related Allowance for Loan Losses |
| | (Dollars in millions) |
| Individually impaired loans: | | | | | | | | | | | | | | | | | | | | | | |
| With related allowance recorded: | | | | | | |
| | | | | | | | | | | |
| | | | | |
| Single-family: | | | | | | |
| | | | | | | | | | | |
| | | | | |
| Primary | | $ | 85,297 |
| | | | $ | 81,905 |
| | | | $ | (10,348 | ) | | | $ | 91,194 |
| | | | $ | 86,864 |
| | | | $ | (11,652 | ) | |
| Government | | 269 |
| | | | 274 |
| | | | (58 | ) | | | 276 |
| | | | 279 |
| | | | (56 | ) | |
| Alt-A | | 18,058 |
| | | | 16,505 |
| | | | (3,153 | ) | | | 23,077 |
| | | | 21,045 |
| | | | (4,046 | ) | |
| Other | | 6,334 |
| | | | 5,972 |
| | | | (1,176 | ) | | | 8,488 |
| | | | 8,006 |
| | | | (1,493 | ) | |
| Total single-family | | 109,958 |
| | | | 104,656 |
| | | | (14,735 | ) | | | 123,035 |
| | | | 116,194 |
| | | | (17,247 | ) | |
| Multifamily | | 231 |
| | | | 232 |
| | | | (44 | ) | | | 279 |
| | | | 280 |
| | | | (42 | ) | |
| Total individually impaired loans with related allowance recorded | | 110,189 |
| | | | 104,888 |
| | | | (14,779 | ) | | | 123,314 |
| | | | 116,474 |
| | | | (17,289 | ) | |
With no related allowance recorded:(1) | | | | | | | | | | | | | | | | | | | | | | |
| Single-family: | | | | | | | | | | | | | | | | | | | | | | |
| Primary | | 15,656 |
| | | | 14,916 |
| | | | — |
| | | 16,027 |
| | | | 15,158 |
| | | | — |
| |
| Government | | 60 |
| | | | 55 |
| | | | — |
| | | 66 |
| | | | 60 |
| | | | — |
| |
| Alt-A | | 2,730 |
| | | | 2,461 |
| | | | — |
| | | 3,253 |
| | | | 2,870 |
| | | | — |
| |
| Other | | 815 |
| | | | 759 |
| | | | — |
| | | 988 |
| | | | 909 |
| | | | — |
| |
| Total single-family | | 19,261 |
| | | | 18,191 |
| | | | — |
| | | 20,334 |
| | | | 18,997 |
| | | | — |
| |
| Multifamily | | 312 |
| | | | 312 |
| | | | — |
| | | 308 |
| | | | 310 |
| | | | — |
| |
| Total individually impaired loans with no related allowance recorded | | 19,573 |
| | | | 18,503 |
| | | | — |
| | | 20,642 |
| | | | 19,307 |
| | | | — |
| |
Total individually impaired loans(2) | | $ | 129,762 |
| | | | $ | 123,391 |
| | | | $ | (14,779 | ) | | | $ | 143,956 |
| | | | $ | 135,781 |
| | | | $ | (17,289 | ) | |
|
| | |
Fannie Mae (In conservatorship) Third Quarter 2018 Form 10-Q | 64 |
|
| | |
| Notes to Condensed Consolidated Financial Statements | Mortgage Loans |
|
| | | | | | | | | | | | | | | | | | | | | | | | | | | | | | | | | | | |
| | For the Three Months Ended September 30, |
| | 2018 | | 2017 |
| | Average Recorded Investment | | Total Interest Income Recognized | | Interest Income Recognized on a Cash Basis | | Average Recorded Investment | | Total Interest Income Recognized | | Interest Income Recognized on a Cash Basis |
| | (Dollars in millions) |
| Individually impaired loans: | | | | | | | | | | | | | | | | | | | | | | | |
| With related allowance recorded: | | | | | | |
| | | | | | | | | | | | |
| | | | | |
| Single-family: | | | | | | |
| | | | | | | | | | | | |
| | | | | |
| Primary | | $ | 84,043 |
| | | | $ | 871 |
| | | | $ | 86 |
| | | | $ | 90,941 |
| | | | $ | 912 |
| | | | $ | 75 |
| |
| Government | | 276 |
| | | | 3 |
| | | | — |
| | | | 289 |
| | | | 2 |
| | | | — |
| |
| Alt-A | | 17,034 |
| | | | 179 |
| | | | 13 |
| | | | 22,904 |
| | | | 228 |
| | | | 13 |
| |
| Other | | 6,254 |
| | | | 57 |
| | | | 4 |
| | | | 8,817 |
| | | | 78 |
| | | | 4 |
| |
| Total single-family | | 107,607 |
| | | | 1,110 |
| | | | 103 |
| | | | 122,951 |
| | | | 1,220 |
| | | | 92 |
| |
| Multifamily | | 231 |
| | | | 1 |
| | | | — |
| | | | 232 |
| | | | 1 |
| | | | — |
| |
| Total individually impaired loans with related allowance recorded | | 107,838 |
| | | | 1,111 |
| | | | 103 |
| | | | 123,183 |
| | | | 1,221 |
| | | | 92 |
| |
With no related allowance recorded:(1) | | | | | | | | | | | | | | | | | | | | | | | |
| Single-family: | | | | | | | | | | | | | | | | | | | | | | | |
| Primary | | 15,140 |
| | | | 254 |
| | | | 30 |
| | | | 15,402 |
| | | | 273 |
| | | | 24 |
| |
| Government | | 57 |
| | | | 1 |
| | | | — |
| | | | 61 |
| | | | — |
| | | | — |
| |
| Alt-A | | 2,562 |
| | | | 54 |
| | | | 4 |
| | | | 3,008 |
| | | | 65 |
| | | | 5 |
| |
| Other | | 784 |
| | | | 13 |
| | | | 2 |
| | | | 983 |
| | | | 21 |
| | | | 1 |
| |
| Total single-family | | 18,543 |
| | | | 322 |
| | | | 36 |
| | | | 19,454 |
| | | | 359 |
| | | | 30 |
| |
| Multifamily | | 335 |
| | | | 8 |
| | | | — |
| | | | 304 |
| | | | 6 |
| | | | — |
| |
| Total individually impaired loans with no related allowance recorded | | 18,878 |
| | | | 330 |
| | | | 36 |
| | | | 19,758 |
| | | | 365 |
| | | | 30 |
| |
| Total individually impaired loans | | $ | 126,716 |
| | | | $ | 1,441 |
| | | | $ | 139 |
| | | | $ | 142,941 |
| | | | $ | 1,586 |
| | | | $ | 122 |
| |
|
| | |
Fannie Mae (In conservatorship) Third Quarter 2018 Form 10-Q | 65 |
|
| | |
| Notes to Condensed Consolidated Financial Statements | Mortgage Loans |
|
| | | | | | | | | | | | | | | | | | | | | | | | | | | | | | | | | | | |
| | For the Nine Months Ended September 30, |
| | 2018 | | 2017 |
| | Average Recorded Investment | | Total Interest Income Recognized | | Interest Income Recognized on a Cash Basis | | Average Recorded Investment | | Total Interest Income Recognized | | Interest Income Recognized on a Cash Basis |
| | (Dollars in millions) |
| Individually impaired loans: | | | | | | | | | | | | | | | | | | | | | | | |
| With related allowance recorded: | | | | | | |
| | | | | | | | | | | | |
| | | | | |
| Single-family: | | | | | | |
| | | | | | | | | | | | |
| | | | | |
| Primary | | $ | 86,842 |
| | | | $ | 2,697 |
| | | | $ | 302 |
| | | | $ | 94,594 |
| | | | $ | 2,853 |
| | | | $ | 240 |
| |
| Government | | 277 |
| | | | 15 |
| | | | — |
| | | | 295 |
| | | | 7 |
| | | | — |
| |
| Alt-A | | 19,081 |
| | | | 610 |
| | | | 45 |
| | | | 24,233 |
| | | | 717 |
| | | | 42 |
| |
| Other | | 7,140 |
| | | | 201 |
| | | | 15 |
| | | | 9,480 |
| | | | 247 |
| | | | 14 |
| |
| Total single-family | | 113,340 |
| | | | 3,523 |
| | | | 362 |
| | | | 128,602 |
| | | | 3,824 |
| | | | 296 |
| |
| Multifamily | | 244 |
| | | | 2 |
| | | | — |
| | | | 271 |
| | | | 7 |
| | | | — |
| |
| Total individually impaired loans with related allowance recorded | | 113,584 |
| | | | 3,525 |
| | | | 362 |
| | | | 128,873 |
| | | | 3,831 |
| | | | 296 |
| |
With no related allowance recorded:(1) | | | | | | | | | | | | | | | | | | | | | | | |
| Single-family: | | | | | | | | | | | | | | | | | | | | | | | |
| Primary | | 15,039 |
| | | | 740 |
| | | | 88 |
| | | | 15,173 |
| | | | 835 |
| | | | 71 |
| |
| Government | | 58 |
| | | | 3 |
| | | | — |
| | | | 61 |
| | | | 2 |
| | | | — |
| |
| Alt-A | | 2,710 |
| | | | 173 |
| | | | 13 |
| | | | 3,041 |
| | | | 205 |
| | | | 10 |
| |
| Other | | 848 |
| | | | 44 |
| | | | 4 |
| | | | 1,023 |
| | | | 65 |
| | | | 3 |
| |
| Total single-family | | 18,655 |
| | | | 960 |
| | | | 105 |
| | | | 19,298 |
| | | | 1,107 |
| | | | 84 |
| |
| Multifamily | | 333 |
| | | | 11 |
| | | | — |
| | | | 294 |
| | | | 16 |
| | | | — |
| |
| Total individually impaired loans with no related allowance recorded | | 18,988 |
| | | | 971 |
| | | | 105 |
| | | | 19,592 |
| | | | 1,123 |
| | | | 84 |
| |
| Total individually impaired loans | | $ | 132,572 |
| | | | $ | 4,496 |
| | | | $ | 467 |
| | | | $ | 148,465 |
| | | | $ | 4,954 |
| | | | $ | 380 |
| |
__________ |
| | | | | | | | | | | | | | | | | | | | | | | | | | | | | | | | | | |
| | As of |
| | September 30, 2019 | | December 31, 2018 |
| | Unpaid Principal Balance | | Total Recorded Investment | | Related Allowance for Loan Losses | | Unpaid Principal Balance | | Total Recorded Investment | | Related Allowance for Loan Losses |
| | (Dollars in millions) |
| Individually impaired loans: | | | | | | | | | | | | | | | | | | | | | | |
| With related allowance recorded: | | | | | | | | | | | | | | | | | | | | | | |
| Single-family: | | | | | | | | | | | | | | | | | | | | | | |
| Primary | | $ | 67,175 |
| | | | $ | 64,987 |
| | | | $ | (6,141 | ) | | | $ | 81,791 |
| | | | $ | 78,688 |
| | | | $ | (9,406 | ) | |
| Government | | 250 |
| | | | 255 |
| | | | (50 | ) | | | 264 |
| | | | 270 |
| | | | (55 | ) | |
| Alt-A | | 11,956 |
| | | | 11,008 |
| | | | (1,726 | ) | | | 16,576 |
| | | | 15,158 |
| | | | (2,793 | ) | |
| Other | | 3,703 |
| | | | 3,505 |
| | | | (590 | ) | | | 5,482 |
| | | | 5,169 |
| | | | (1,001 | ) | |
| Total single-family | | 83,084 |
| | | | 79,755 |
| | | | (8,507 | ) | | | 104,113 |
| | | | 99,285 |
| | | | (13,255 | ) | |
| Multifamily | | 281 |
| | | | 283 |
| | | | (45 | ) | | | 197 |
| | | | 196 |
| | | | (40 | ) | |
| Total individually impaired loans with related allowance recorded | | 83,365 |
| | | | 80,038 |
| | | | (8,552 | ) | | | 104,310 |
| | | | 99,481 |
| | | | (13,295 | ) | |
With no related allowance recorded:(1) | | | | | | | | | | | | | | | | | | | | | | |
| Single-family: | | | | | | | | | | | | | | | | | | | | | | |
| Primary | | 19,326 |
| | | | 18,463 |
| | | | — |
| | | 15,939 |
| | | | 15,191 |
| | | | — |
| |
| Government | | 65 |
| | | | 61 |
| | | | — |
| | | 61 |
| | | | 56 |
| | | | — |
| |
| Alt-A | | 2,391 |
| | | | 2,141 |
| | | | — |
| | | 2,628 |
| | | | 2,363 |
| | | | — |
| |
| Other | | 624 |
| | | | 571 |
| | | | — |
| | | 718 |
| | | | 666 |
| | | | — |
| |
| Total single-family | | 22,406 |
| | | | 21,236 |
| | | | — |
| | | 19,346 |
| | | | 18,276 |
| | | | — |
| |
| Multifamily | | 368 |
| | | | 369 |
| | | | — |
| | | 343 |
| | | | 346 |
| | | | — |
| |
| Total individually impaired loans with no related allowance recorded | | 22,774 |
| | | | 21,605 |
| | | | — |
| | | 19,689 |
| | | | 18,622 |
| | | | — |
| |
Total individually impaired loans(2) | | $ | 106,139 |
| | | | $ | 101,643 |
| | | | $ | (8,552 | ) | | | $ | 123,999 |
| | | | $ | 118,103 |
| | | | $ | (13,295 | ) | |
| |
(1) | The discounted cash flows or collateral value equals or exceeds the carrying value of the loan and, as such, no valuation allowance is required. |
| |
(2) | Includes single-family loans classified as TDRsrestructured in a TDR with a recorded investment of $122.4$100.7 billion and $134.7$117.2 billion as of September 30, 20182019 and December 31, 2017,2018, respectively. Includes multifamily loans classified as TDRsrestructured in a TDR with a recorded investment of $210$126 million and $185$187 million as of September 30, 20182019 and December 31, 2017,2018, respectively. |
|
| | |
| Fannie Mae (In conservatorship) Third Quarter 2019 Form 10-Q | 68 |
|
| | |
| Notes to Condensed Consolidated Financial Statements | Mortgage Loans |
|
| | | | | | | | | | | | | | | | | | | | | | | | | | | | | | | | | | | |
| | For the Three Months Ended September 30, |
| | 2019 | | 2018 |
| | Average Recorded Investment | | Total Interest Income Recognized | | Interest Income Recognized on a Cash Basis | | Average Recorded Investment | | Total Interest Income Recognized | | Interest Income Recognized on a Cash Basis |
| | (Dollars in millions) |
| Individually impaired loans: | | | | | | | | | | | | | | | | | | | | | | | |
| With related allowance recorded: | | | | | | | | | | | | | | | | | | | | | | | |
| Single-family: | | | | | | | | | | | | | | | | | | | | | | | |
| Primary | | $ | 69,084 |
| | | | $ | 713 |
| | | | $ | 62 |
| | | | $ | 84,043 |
| | | | $ | 871 |
| | | | $ | 86 |
| |
| Government | | 262 |
| | | | 2 |
| | | | — |
| | | | 276 |
| | | | 3 |
| | | | — |
| |
| Alt-A | | 11,845 |
| | | | 125 |
| | | | 8 |
| | | | 17,034 |
| | | | 179 |
| | | | 13 |
| |
| Other | | 3,904 |
| | | | 37 |
| | | | 4 |
| | | | 6,254 |
| | | | 57 |
| | | | 4 |
| |
| Total single-family | | 85,095 |
| | | | 877 |
| | | | 74 |
| | | | 107,607 |
| | | | 1,110 |
| | | | 103 |
| |
| Multifamily | | 313 |
| | | | 2 |
| | | | — |
| | | | 231 |
| | | | 1 |
| | | | — |
| |
| Total individually impaired loans with related allowance recorded | | 85,408 |
| | | | 879 |
| | | | 74 |
| | | | 107,838 |
| | | | 1,111 |
| | | | 103 |
| |
With no related allowance recorded:(1) | | | | | |
| | | |
| | | | | | | | | | | | | |
| Single-family: | | | | | |
| | | |
| | | | | | | | | | | | | |
| Primary | | 16,422 |
| | | | 262 |
| | | | 39 |
| | | | 15,140 |
| | | | 254 |
| | | | 30 |
| |
| Government | | 56 |
| | | | 1 |
| | | | — |
| | | | 57 |
| | | | 1 |
| | | | — |
| |
| Alt-A | | 2,130 |
| | | | 44 |
| | | | 4 |
| | | | 2,562 |
| | | | 54 |
| | | | 4 |
| |
| Other | | 575 |
| | | | 10 |
| | | | 1 |
| | | | 784 |
| | | | 13 |
| | | | 2 |
| |
| Total single-family | | 19,183 |
| | | | 317 |
| | | | 44 |
| | | | 18,543 |
| | | | 322 |
| | | | 36 |
| |
| Multifamily | | 401 |
| | | | 8 |
| | | | — |
| | | | 335 |
| | | | 8 |
| | | | — |
| |
| Total individually impaired loans with no related allowance recorded | | 19,584 |
| | | | 325 |
| | | | 44 |
| | | | 18,878 |
| | | | 330 |
| | | | 36 |
| |
| Total individually impaired loans | | $ | 104,992 |
| | | | $ | 1,204 |
| | | | $ | 118 |
| | | | $ | 126,716 |
| | | | $ | 1,441 |
| | | | $ | 139 |
| |
|
| | |
| Fannie Mae (In conservatorship) Third Quarter 2019 Form 10-Q | 69 |
|
| | |
| Notes to Condensed Consolidated Financial Statements | Mortgage Loans |
|
| | | | | | | | | | | | | | | | | | | | | | | | | | | | | | | | | | | |
| | For the Nine Months Ended September 30, |
| | 2019 | | 2018 |
| | Average Recorded Investment | | Total Interest Income Recognized | | Interest Income Recognized on a Cash Basis | | Average Recorded Investment | | Total Interest Income Recognized | | Interest Income Recognized on a Cash Basis |
| | (Dollars in millions) |
| Individually impaired loans: | | | | | | | | | | | | | | | | | | | | | | | |
| With related allowance recorded: | | | | | | | | | | | | | | | | | | | | | | | |
| Single-family: | | | | | | | | | | | | | | | | | | | | | | | |
| Primary | | $ | 73,601 |
| | | | $ | 2,304 |
| | | | $ | 214 |
| | | | $ | 86,842 |
| | | | $ | 2,697 |
| | | | $ | 302 |
| |
| Government | | 267 |
| | | | 8 |
| | | | — |
| | | | 277 |
| | | | 15 |
| | | | — |
| |
| Alt-A | | 13,299 |
| | | | 426 |
| | | | 30 |
| | | | 19,081 |
| | | | 610 |
| | | | 45 |
| |
| Other | | 4,429 |
| | | | 123 |
| | | | 11 |
| | | | 7,140 |
| | | | 201 |
| | | | 15 |
| |
| Total single-family | | 91,596 |
| | | | 2,861 |
| | | | 255 |
| | | | 113,340 |
| | | | 3,523 |
| | | | 362 |
| |
| Multifamily | | 280 |
| | | | 7 |
| | | | — |
| | | | 244 |
| | | | 2 |
| | | | — |
| |
| Total individually impaired loans with related allowance recorded | | 91,876 |
| | | | 2,868 |
| | | | 255 |
| | | | 113,584 |
| | | | 3,525 |
| | | | 362 |
| |
With no related allowance recorded:(1) | | | | | | | | | | | | | | | | | | | | | | | |
| Single-family: | | | | | | | | | | | | | | | | | | | | | | | |
| Primary | | 15,718 |
| | | | 731 |
| | | | 103 |
| | | | 15,039 |
| | | | 740 |
| | | | 88 |
| |
| Government | | 56 |
| | | | 3 |
| | | | — |
| | | | 58 |
| | | | 3 |
| | | | — |
| |
| Alt-A | | 2,203 |
| | | | 127 |
| | | | 11 |
| | | | 2,710 |
| | | | 173 |
| | | | 13 |
| |
| Other | | 611 |
| | | | 28 |
| | | | 3 |
| | | | 848 |
| | | | 44 |
| | | | 4 |
| |
| Total single-family | | 18,588 |
| | | | 889 |
| | | | 117 |
| | | | 18,655 |
| | | | 960 |
| | | | 105 |
| |
| Multifamily | | 377 |
| | | | 16 |
| | | | — |
| | | | 333 |
| | | | 11 |
| | | | — |
| |
| Total individually impaired loans with no related allowance recorded | | 18,965 |
| | | | 905 |
| | | | 117 |
| | | | 18,988 |
| | | | 971 |
| | | | 105 |
| |
| Total individually impaired loans | | $ | 110,841 |
| | | | $ | 3,773 |
| | | | $ | 372 |
| | | | $ | 132,572 |
| | | | $ | 4,496 |
| | | | $ | 467 |
| |
| |
(1) | The discounted cash flows or collateral value equals or exceeds the carrying value of the loan and, as such, no valuation allowance is required. |
Troubled Debt Restructurings
A modification to the contractual terms of a loan that results in granting a concession to a borrower experiencing financial difficulties is considered a TDR. In addition to formal loan modifications, including those modifications in a trial period, we also engage in other loss mitigation activities with troubled borrowers, which include repayment plans and forbearance arrangements, both of which represent informal agreements with the borrower that do not result in the legal modification of the loan’s contractual terms. We account for these informal restructurings as a TDR if we defer more than three missed payments. We also classify loans to certain borrowers who have received bankruptcy relief as TDRs.
The substantial majority of the loan modifications we complete result in term extensions, interest rate reductions or a combination of both. DuringThe average term extension of a single-family modified loan was 164 months and 98 months for the three months ended September 30, 2019 and 2018, respectively. The average interest rate reduction was 0.15 and 0.14 percentage points, for the three months ended September 30, 2019 and 2018, respectively. During the nine months ended September 30, 2019 and 2018, the average term extension of a single-family modified loan was 98160 months and 104 months, respectively, and the average interest rate reduction was 0.140.11 and 0.23 percentage points, respectively. During the three and nine months ended September 30, 2017, the average term extension of a single-family modified loan was 156 months and 155 months, respectively, and the average interest rate reduction was 0.35 and 0.66 percentage points, respectively.
|
| | |
Fannie Mae (In conservatorship) Third Quarter 20182019 Form 10-Q | 6670 |
|
| | |
| | Notes to Condensed Consolidated Financial Statements | Mortgage Loans |
The following tables display the number of loans and recorded investment in loans classified as a TDR.
| | | | For the Three Months Ended September 30, | For the Three Months Ended September 30, |
| | 2018 | | 2017 | 2019 | | 2018 |
| | Number of Loans | | Recorded Investment | | Number of Loans | | Recorded Investment | Number of Loans | | Recorded Investment(1) | | Number of Loans | | Recorded Investment(1) |
| | (Dollars in millions) | (Dollars in millions) |
| Single-family: | | | | | | | | | | | | | | | | | | |
| Primary | | 12,291 |
| | $ | 1,797 |
| | 13,323 |
| | $ | 1,847 |
| | | 11,373 |
| | $ | 1,819 |
| | 12,291 |
| | $ | 1,797 |
| |
| Government | | 21 |
| | 3 |
| | 32 |
| | 5 |
| | | 16 |
| | 1 |
| | 21 |
| | 3 |
| |
| Alt-A | | 779 |
| | 100 |
| | 1,229 |
| | 182 |
| | | 543 |
| | 70 |
| | 779 |
| | 100 |
| |
| Other | | 207 |
| | 37 |
| | 264 |
| | 50 |
| | | 89 |
| | 16 |
| | 207 |
| | 37 |
| |
| Total single-family | | 13,298 |
| | 1,937 |
| | 14,848 |
| | 2,084 |
| | | 12,021 |
| | 1,906 |
| | 13,298 |
| | 1,937 |
| |
| Multifamily | | 2 |
| | 7 |
| | 5 |
| | 82 |
| | | 3 |
| | 4 |
| | 2 |
| | 7 |
| |
| Total TDRs | | 13,300 |
| | $ | 1,944 |
| | 14,853 |
| | $ | 2,166 |
| | | 12,024 |
| | $ | 1,910 |
| | 13,300 |
| | $ | 1,944 |
| |
| | | | For the Nine Months Ended September 30, | For the Nine Months Ended September 30, |
| | 2018 | | 2017 | 2019 | | 2018 |
| | Number of Loans | | Recorded Investment | | Number of Loans | | Recorded Investment | Number of Loans | | Recorded Investment(1) | | Number of Loans | | Recorded Investment(1) |
| | (Dollars in millions) | (Dollars in millions) |
| Single-family: | | | | | | | | | | | | | | | | | | |
| Primary | | 75,790 |
| | $ | 11,469 |
| | 44,706 |
| | $ | 6,155 |
| | | 36,126 |
| | $ | 5,634 |
| | 75,790 |
| | $ | 11,469 |
| |
| Government | | 95 |
| | 9 |
| | 138 |
| | 15 |
| | | 61 |
| | 7 |
| | 95 |
| | 9 |
| |
| Alt-A | | 4,499 |
| | 583 |
| | 4,122 |
| | 600 |
| | | 1,948 |
| | 248 |
| | 4,499 |
| | 583 |
| |
| Other | | 937 |
| | 173 |
| | 844 |
| | 149 |
| | | 374 |
| | 68 |
| | 937 |
| | 173 |
| |
| Total single-family | | 81,321 |
| | 12,234 |
| | 49,810 |
| | 6,919 |
| | | 38,509 |
| | 5,957 |
| | 81,321 |
| | 12,234 |
| |
| Multifamily | | 12 |
| | 68 |
| | 8 |
| | 99 |
| | | 9 |
| | 37 |
| | 12 |
| | 68 |
| |
| Total TDRs | | 81,333 |
| | $ | 12,302 |
| | 49,818 |
| | $ | 7,018 |
| | | 38,518 |
| | $ | 5,994 |
| | 81,333 |
| | $ | 12,302 |
| |
| |
(1) | Based on the nature of our modification programs, which do not include principal or past-due interest forgiveness, there is not a material difference between the recorded investment in our loans pre- and post- modification. Therefore, these amounts represent recorded investment post-modification. |
The increasedecrease in loans classified as TDRsa TDR for the three and nine months ended September 30, 2019 compared with the three and nine months ended September 30, 2018 compared with the nine months ended September 30, 2017 was primarily attributable to a significantly higher number of single-family loan modifications and other forms of loss mitigation in the areas affected by Hurricanes Harvey, Irma and Maria that resulted in a restructuring of the terms of these loans.those loans during the first nine months of 2018.
|
| | |
Fannie Mae (In conservatorship) Third Quarter 20182019 Form 10-Q | 6771 |
|
| | |
| | Notes to Condensed Consolidated Financial Statements | Mortgage Loans |
For loans that had a payment default in the period presented and that were classified as a TDR in the twelve months prior to the payment default, the following tables display the number of loans and our recorded investment in these loans at the time of payment default. For the purposes of this disclosure, we define loans that had a payment default as: single-family and multifamily loans with completed TDRs that liquidated during the period, either through foreclosure, deed-in-lieu of foreclosure, or a short sale; single-family loans with completed modifications that are two or more months delinquent during the period; or multifamily loans with completed modifications that are one or more months delinquent during the period.
|
| | | | | | | | | | | | | | | | | | | | | |
| | For the Three Months Ended September 30, |
| | 2018 | | 2017 |
| | Number of Loans | | Recorded Investment | | Number of Loans | | Recorded Investment |
| | (Dollars in millions) |
| Single-family: | | | | | | | | | | | | | | | |
| Primary | | 3,720 |
| | | | $ | 519 |
| | | | 4,900 |
| | | | $ | 684 |
| |
| Government | | 8 |
| | | | — |
| | | | 25 |
| | | | 3 |
| |
| Alt-A | | 438 |
| | | | 74 |
| | | | 627 |
| | | | 95 |
| |
| Other | | 143 |
| | | | 29 |
| | | | 178 |
| | | | 34 |
| |
| Total single-family | | 4,309 |
| | | | 622 |
| | | | 5,730 |
| | | | 816 |
| |
| Multifamily | | 1 |
| | | | 2 |
| | | | — |
| | | | — |
| |
| Total TDRs that subsequently defaulted | | 4,310 |
| | | | $ | 624 |
| | | | 5,730 |
| | | | $ | 816 |
| |
| | | | For the Nine Months Ended September 30, | For the Three Months Ended September 30, |
| | 2018 | | 2017 | 2019 | | 2018 |
| | Number of Loans | | Recorded Investment | | Number of Loans | | Recorded Investment | Number of Loans | | Recorded Investment | | Number of Loans | | Recorded Investment |
| | (Dollars in millions) | (Dollars in millions) |
| Single-family: | | | | | | | | | | | | | | | | | | |
| Primary | | 12,372 |
| | $ | 1,774 |
| | 13,617 |
| | $ | 1,894 |
| | | 3,780 |
| | $ | 585 |
| | 3,720 |
| | $ | 519 |
| |
| Government | | 37 |
| | 4 |
| | 69 |
| | 8 |
| | | 28 |
| | 2 |
| | 8 |
| | — |
| |
| Alt-A | | 1,703 |
| | 275 |
| | 1,857 |
| | 288 |
| | | 307 |
| | 43 |
| | 438 |
| | 74 |
| |
| Other | | 469 |
| | 93 |
| | 529 |
| | 102 |
| | | 87 |
| | 16 |
| | 143 |
| | 29 |
| |
| Total single-family | | 14,581 |
| | 2,146 |
| | 16,072 |
| | 2,292 |
| | | 4,202 |
| | 646 |
| | 4,309 |
| | 622 |
| |
| Multifamily | | 2 |
| | 4 |
| | 1 |
| | 4 |
| | | 1 |
| | 13 |
| | 1 |
| | 2 |
| |
| Total TDRs that subsequently defaulted | | 14,583 |
| | $ | 2,150 |
| | 16,073 |
| | $ | 2,296 |
| | | 4,203 |
| | $ | 659 |
| | 4,310 |
| | $ | 624 |
| |
|
| | | | | | | | | | | | | | | | | | | | | |
| | For the Nine Months Ended September 30, |
| | 2019 | | 2018 |
| | Number of Loans | | Recorded Investment | | Number of Loans | | Recorded Investment |
| | (Dollars in millions) |
| Single-family: | | | | | | | | | | | | | | | |
| Primary | | 12,343 |
| | | | $ | 1,864 |
| | | | 12,372 |
| | | | $ | 1,774 |
| |
| Government | | 56 |
| | | | 7 |
| | | | 37 |
| | | | 4 |
| |
| Alt-A | | 1,157 |
| | | | 174 |
| | | | 1,703 |
| | | | 275 |
| |
| Other | | 351 |
| | | | 65 |
| | | | 469 |
| | | | 93 |
| |
| Total single-family | | 13,907 |
| | | | 2,110 |
| | | | 14,581 |
| | | | 2,146 |
| |
| Multifamily | | 2 |
| | | | 19 |
| | | | 2 |
| | | | 4 |
| |
| Total TDRs that subsequently defaulted | | 13,909 |
| | | | $ | 2,129 |
| | | | 14,583 |
| | | | $ | 2,150 |
| |
|
| | |
Fannie Mae (In conservatorship) Third Quarter 2018 Form 10-Q | 68 |
|
| | |
| Notes to Condensed Consolidated Financial Statements | Allowance for Loan Losses |
4. Allowance for Loan Losses
We maintain an allowance for loan losses for HFI loans held by Fannie Mae and loans backingby consolidated Fannie Mae MBS issued from consolidated trusts.trusts, excluding loans for which we have elected the fair value option. When calculating our allowance for loan losses, we consider the unpaid principal balance, net of amortized premiums and discounts, and other cost basis adjustments of HFI loans at the balance sheet date. We record charge-offs as a reduction to our allowance for loan losses at the point of foreclosure, completion of a short sale, upon the redesignation of loans from HFI to HFS or when a loan is determined to be uncollectible.
We aggregate single-family HFI loans that are not individually impaired based on similar risk characteristics, for purposes of estimating incurred credit losses and establishing a collective single-family loss reserve using an econometric model that derives an overall loss reserve estimate. We base our allowance methodology on historical events and trends, such as loss severity (in event of default), default rates, and recoveries from mortgage insurance contracts and other credit enhancements that provide loan levelloan-level loss coverage and are either contractually attached to a loan or that were entered into contemporaneously with and in contemplation of a guaranty or loan purchase transaction. We use recent regional historical sales and appraisal information, including the sales of our own foreclosed properties, to develop our loss severity estimates for all loan categories. Our allowance calculation also incorporates a loss confirmation period (the anticipated time lag between a credit loss event and the confirmation of the credit loss resulting from that event) to ensure our allowance estimate captures credit losses that have been incurred as of the balance sheet date but have not been confirmed. In addition, management performs a review of the observable data used in its estimate to ensure it is representative of prevailing economic conditions and other events existing as of the balance sheet date.
Individually impaired single-family loans currently include those classified as a TDR and acquired credit-impaired loans. We consider a loan to be impaired when, based on current information, it is probable that we will not receive all amounts due,
|
| | |
| Fannie Mae (In conservatorship) Third Quarter 2019 Form 10-Q | 72 |
|
| | |
| Notes to Condensed Consolidated Financial Statements | Allowance for Loan Losses |
including interest, in accordance with the contractual terms of the loan agreement. When a loan has been restructured, we measure impairment using a cash flow analysis discounted at the loan’s original effective interest rate. If we expect to recover our recorded investment in an individually impaired loan through probable foreclosure of the underlying collateral, we measure impairment based on the difference between our recorded investment in the loan and the fair value of the collateral, reduced by estimated disposal costs andunderlying property, adjusted for the estimated proceeds from mortgage, flood, or hazardcosts to sell the property and estimated insurance or similar sources.other proceeds we expect to receive. During the three months ended September 30, 2019, we enhanced the model used to estimate cash flows for individually impaired single-family loans within our allowance for loan losses. This enhancement was performed as a part of management’s routine model performance review process. In addition to incorporating recent loan performance data, this model enhancement better captures recent prepayment activity, default rates, and loss severity in the event of default. The enhancement resulted in a decrease to our allowance for loan losses and an incremental benefit for credit losses of approximately $850 million and is included in “Benefit (provision) for loan losses” in the table below.
We establish a collective allowance for all loans in our multifamily guaranty book of business that are not individually measured for impairment using an internal model that applies loss factors to loans in similar risk categories. Our loss factors are developed based on our historical default and loss severity experience. We identify multifamily loans for evaluation for impairment through a credit risk assessment process. If we determine that a multifamily loan is individually impaired, we generally measure impairment on that loan based on the fair value of the underlying collateral less estimated costs to sell the property, as we have concluded that such loans are collateral dependent. We evaluate collectively for impairment smaller-balance homogeneous multifamily loans.
|
| | |
Fannie Mae (In conservatorship) Third Quarter 2018 Form 10-Q | 69 |
|
| | |
| Notes to Condensed Consolidated Financial Statements | Allowance for Loan Losses |
The following table displays changes in single-family, multifamily and total allowance for loan losses. | | | | For the Three Months Ended September 30, | | For the Nine Months Ended September 30, | | For the Three Months Ended September 30, | | For the Nine Months Ended September 30, |
| | 2018 | | 2017 | | 2018 | | 2017 | | 2019 | | 2018 | | 2019 | | 2018 |
| | (Dollars in millions) | | (Dollars in millions) |
| Single-family allowance for loan losses: | | | | | | | | | | | | | | | |
| Beginning balance | $ | (16,602 | ) | | $ | (20,218 | ) | | $ | (18,849 | ) | | $ | (23,283 | ) | | $ | (11,210 | ) | | $ | (16,602 | ) | | $ | (13,969 | ) | | $ | (18,849 | ) |
Benefit (provision) for loan losses(1) | 724 |
| | (163 | ) | | 1,916 |
| | 1,442 |
| | 1,826 |
| | 724 |
| | 3,712 |
| | 1,916 |
|
| Charge-offs | 509 |
| | 434 |
| | 1,705 |
| | 2,163 |
| | 270 |
| | 509 |
| | 1,209 |
| | 1,705 |
|
| Recoveries | (65 | ) | | (42 | ) | | (189 | ) | | (273 | ) | | (8 | ) | | (65 | ) | | (68 | ) | | (189 | ) |
Other(2) | (2 | ) | | 17 |
| | (19 | ) | | (21 | ) | |
| Other | | | — |
| | (2 | ) | | (6 | ) | | (19 | ) |
| Ending balance | $ | (15,436 | ) | | $ | (19,972 | ) | | $ | (15,436 | ) | | $ | (19,972 | ) | | $ | (9,122 | ) | | $ | (15,436 | ) | | $ | (9,122 | ) | | $ | (15,436 | ) |
| Multifamily allowance for loan losses: | | | | | | | | | | | | | | | |
| Beginning balance | $ | (210 | ) | | $ | (181 | ) | | $ | (235 | ) | | $ | (182 | ) | | $ | (272 | ) | | $ | (210 | ) | | $ | (234 | ) | | $ | (235 | ) |
Benefit (provision) for loan losses(1) | (14 | ) | | (42 | ) | | 6 |
| | (40 | ) | | 17 |
| | (14 | ) | | (23 | ) | | 6 |
|
| Charge-offs | — |
| | 3 |
| | 5 |
| | 3 |
| | 2 |
| | — |
| | 6 |
| | 5 |
|
| Recoveries | (3 | ) | | (2 | ) | | (3 | ) | | (3 | ) | | (1 | ) | | (3 | ) | | (3 | ) | | (3 | ) |
| Ending balance | $ | (227 | ) | | $ | (222 | ) | | $ | (227 | ) | | $ | (222 | ) | | $ | (254 | ) | | $ | (227 | ) | | $ | (254 | ) | | $ | (227 | ) |
| Total allowance for loan losses: | | | | | | | | | | | | | | | |
| Beginning balance | $ | (16,812 | ) | | $ | (20,399 | ) | | $ | (19,084 | ) | | $ | (23,465 | ) | | $ | (11,482 | ) | | $ | (16,812 | ) | | $ | (14,203 | ) | | $ | (19,084 | ) |
Benefit (provision) for loan losses(1) | 710 |
| | (205 | ) | | 1,922 |
| | 1,402 |
| | 1,843 |
| | 710 |
| | 3,689 |
| | 1,922 |
|
| Charge-offs | 509 |
| | 437 |
| | 1,710 |
| | 2,166 |
| | 272 |
| | 509 |
| | 1,215 |
| | 1,710 |
|
| Recoveries | (68 | ) | | (44 | ) | | (192 | ) | | (276 | ) | | (9 | ) | | (68 | ) | | (71 | ) | | (192 | ) |
Other(2) | (2 | ) | | 17 |
| | (19 | ) | | (21 | ) | |
| Other | | | — |
| | (2 | ) | | (6 | ) | | (19 | ) |
| Ending balance | $ | (15,663 | ) | | $ | (20,194 | ) | | $ | (15,663 | ) | | $ | (20,194 | ) | | $ | (9,376 | ) | | $ | (15,663 | ) | | $ | (9,376 | ) | | $ | (15,663 | ) |
__________
| |
(1) | Benefit (provision) for loan losses is included in “Benefit (provision) for credit losses” in our condensed consolidated statements of operations and comprehensive income. |
| |
(2)
| Amounts represent the portion of benefit (provision) for loan losses, charge-offs and recoveries that are not a part of the allowance for loan losses. |
|
| | |
Fannie Mae (In conservatorship) Third Quarter 20182019 Form 10-Q | 7073 |
|
| | |
| | Notes to Condensed Consolidated Financial Statements | Allowance for Loan Losses |
The following table displays the allowance for loan losses and recorded investment in our HFI loans by impairment or allowance methodology and portfolio segment, excluding loans for which we have elected the fair value option.
|
| | | | | | | | | | | | | | | | | | | | | | | | |
| | | As of |
| | | September 30, 2019 | | December 31, 2018 |
| | | Single-Family | | Multifamily | | Total | | Single-Family | | Multifamily | | Total |
| | | (Dollars in millions) |
| Allowance for loan losses by segment: | | | | | | | | | | | | |
Individually impaired loans(1) | | $ | (8,507 | ) | | $ | (45 | ) | | $ | (8,552 | ) | | $ | (13,255 | ) | | $ | (40 | ) | | $ | (13,295 | ) |
| Collectively reserved loans | | (615 | ) | | (209 | ) | | (824 | ) | | (714 | ) | | (194 | ) | | (908 | ) |
| Total allowance for loan losses | | $ | (9,122 | ) | | $ | (254 | ) | | $ | (9,376 | ) | | $ | (13,969 | ) | | $ | (234 | ) | | $ | (14,203 | ) |
| | | | | | | | | | | | | |
| Recorded investment in loans by segment: | | | | | | | | | | | | |
Individually impaired loans(1) | | $ | 100,991 |
| | $ | 652 |
| | $ | 101,643 |
| | $ | 117,561 |
| | $ | 542 |
| | $ | 118,103 |
|
| Collectively reserved loans | | 2,889,510 |
| | 320,545 |
| | 3,210,055 |
| | 2,841,943 |
| | 295,122 |
| | 3,137,065 |
|
| Total recorded investment in loans | | $ | 2,990,501 |
| | $ | 321,197 |
| | $ | 3,311,698 |
| | $ | 2,959,504 |
| | $ | 295,664 |
| | $ | 3,255,168 |
|
|
| | | | | | | | | | | | | | | | | | | | | | | |
| | As of |
| | September 30, 2018 | | December 31, 2017 |
| | Single-Family | | Multifamily | | Total | | Single-Family | | Multifamily | | Total |
| | (Dollars in millions) |
| Allowance for loan losses by segment: | | | | | | | | | | | |
Individually impaired loans(1) | $ | (14,735 | ) | | $ | (44 | ) | | $ | (14,779 | ) | | $ | (17,247 | ) | | $ | (42 | ) | | $ | (17,289 | ) |
| Collectively reserved loans | (701 | ) | | (183 | ) | | (884 | ) | | (1,602 | ) | | (193 | ) | | (1,795 | ) |
| Total allowance for loan losses | $ | (15,436 | ) | | $ | (227 | ) | | $ | (15,663 | ) | | $ | (18,849 | ) | | $ | (235 | ) | | $ | (19,084 | ) |
| | | | | | | | | | | | |
| Recorded investment in loans by segment: | | | | | | | | | | | |
Individually impaired loans(1) | $ | 122,847 |
| | $ | 544 |
| | $ | 123,391 |
| | $ | 135,191 |
| | $ | 590 |
| | $ | 135,781 |
|
| Collectively reserved loans | 2,828,815 |
| | 285,410 |
| | 3,114,225 |
| | 2,787,783 |
| | 266,411 |
| | 3,054,194 |
|
| Total recorded investment in loans | $ | 2,951,662 |
| | $ | 285,954 |
| | $ | 3,237,616 |
| | $ | 2,922,974 |
| | $ | 267,001 |
| | $ | 3,189,975 |
|
__________
| |
(1) | Includes acquired credit-impaired loans. |
5. Investments in Securities
Trading Securities
Trading securities are recorded at fair value with subsequent changes in fair value recorded as “Fair value gains (losses), net” in our condensed consolidated statements of operations and comprehensive income. The following table displays our investments in trading securities.
|
| | | | | | | | | | | |
| | As of |
| | September 30, 2018 | | December 31, 2017 |
| | (Dollars in millions) | |
| Mortgage-related securities: | | | | | | | |
Fannie Mae(1) | | $ | 1,469 |
| | | | $ | 3,876 |
| |
| Other agency | | 3,642 |
| | | | 1,118 |
| |
Alt-A and subprime private-label securities(1) | | 1,367 |
| | | | 453 |
| |
| Commercial mortgage-backed securities (“CMBS”) | | — |
| | | | 9 |
| |
| Mortgage revenue bonds | | 1 |
| | | | 1 |
| |
| Total mortgage-related securities | | 6,479 |
| | | | 5,457 |
| |
| Non-mortgage-related securities: | | | | | | | |
| U.S. Treasury securities | | 37,328 |
| | | | 29,222 |
| |
| Other securities | | 94 |
| | | | — |
| |
| Total non-mortgage-related securities | | 37,422 |
| | | | 29,222 |
| |
| Total trading securities | | $ | 43,901 |
| | | | $ | 34,679 |
| |
__________ |
| | | | | | | | | | | |
| | As of |
| | September 30, 2019 | | December 31, 2018 |
| | (Dollars in millions) | |
| Mortgage-related securities: | | | | | | | |
Fannie Mae(1) | | $ | 3,661 |
| | | | $ | 1,467 |
| |
Other agency(2) | | 3,704 |
| | | | 3,503 |
| |
| Private-label and other mortgage securities | | 741 |
| | | | 1,306 |
| |
| Total mortgage-related securities (includes $922 and $32, respectively, related to consolidated trusts) | | 8,106 |
| | | | 6,276 |
| |
| Non-mortgage-related securities: | | | | | | | |
| U.S. Treasury securities | | 36,016 |
| | | | 35,502 |
| |
| Other securities | | 84 |
| | | | 89 |
| |
| Total non-mortgage-related securities | | 36,100 |
| | | | 35,591 |
| |
| Total trading securities | | $ | 44,206 |
| | | | $ | 41,867 |
| |
| |
(1) | The increase in Alt-A and subprime private-label securities from December 31, 2017 to September 30, 2018 was due toIn the dissolution in the firstsecond quarter of 20182019, we implemented the Single Security Initiative and recognized $1.4 billion in mortgage-related securities that had previously been consolidated. |
| |
(2) | Consists of a Fannie Mae-wrapped private-label securities trust. The Fannie Mae-wrapped private-label securities had been classified as FannieFreddie Mac and Ginnie Mae mortgage-related securities prior to the dissolution.securities. |
The following table displays information about our net trading gains (losses).
|
| | | | | | | | | | | | | | | |
| | For the Three Months Ended September 30, | | For the Nine Months Ended September 30, |
| | |
| | 2019 | | 2018 | | 2019 | | 2018 |
| | (Dollars in millions) |
| Net trading gains (losses) | $ | 95 |
| | $ | (40 | ) | | $ | 370 |
| | $ | 79 |
|
| Net trading gains (losses) recognized in the period related to securities still held at period end | 82 |
| | (27 | ) | | 298 |
| | 20 |
|
|
| | |
Fannie Mae (In conservatorship) Third Quarter 20182019 Form 10-Q | 7174 |
|
| | |
| | Notes to Condensed Consolidated Financial Statements | Investments in Securities |
The following table displays information about our net trading gains (losses).
|
| | | | | | | | | | | | | | | |
| | For the Three Months Ended September 30, | | For the Nine Months Ended September 30, |
| | |
| | 2018 | | 2017 | | 2018 | | 2017 |
| | (Dollars in millions) |
| Net trading gains (losses) | $ | (40 | ) | | $ | 59 |
| | $ | 79 |
| | $ | 145 |
|
| Net trading gains (losses) recognized in the period related to securities still held at period end | (27 | ) | | 51 |
| | 20 |
| | 125 |
|
Available-for-Sale Securities
We record available-for-sale (“AFS”)AFS securities at fair value with unrealized gains and losses, recorded net of tax, as a component of “Other comprehensive income (loss)” and we recognize realized gains and losses from the sale of AFS securities in “Investment gains, net” in our condensed consolidated statements of operations and comprehensive income.
The following table displays the gross realized gains and proceeds on sales of AFS securities.
| | | | For the Three Months | | For the Nine Months | For the Three Months Ended September 30, | | For the Nine Months Ended September 30, |
| | Ended September 30, | | Ended September 30, | |
| | 2018 | | 2017 | | 2018 | | 2017 | 2019 | | 2018 | | 2019 | | 2018 |
| | (Dollars in millions) | (Dollars in millions) |
| Gross realized gains | $ | 12 |
| | $ | 30 |
| | $ | 375 |
| | $ | 260 |
| $ | — |
| | $ | 12 |
| | $ | 171 |
| | $ | 375 |
|
| Total proceeds (excludes initial sale of securities from new portfolio securitizations) | 21 |
| | 187 |
| | 662 |
| | 1,081 |
| — |
| | 21 |
| | 376 |
| | 662 |
|
The following tables display the amortized cost, gross unrealized gains and losses, and fair value by major security type for AFS securities.
| | | | As of September 30, 2018 | As of September 30, 2019 |
| | Total Amortized Cost(1) | | Gross Unrealized Gains | | Gross Unrealized Losses(2) | | Total Fair Value | Total Amortized Cost(1) | | Gross Unrealized Gains | | Gross Unrealized Losses(2) | | Total Fair Value |
| | (Dollars in millions) | (Dollars in millions) |
| Fannie Mae | | $ | 1,808 |
| | $ | 58 |
| | $ | (38 | ) | | $ | 1,828 |
| | $ | 1,492 |
| | $ | 98 |
| | $ | (8 | ) | | $ | 1,582 |
|
| Other agency | | 256 |
| | 16 |
| | — |
| | 272 |
| | 195 |
| | 18 |
| | — |
| | 213 |
|
| Alt-A and subprime private-label securities | | 337 |
| | 280 |
| | — |
| | 617 |
| | 102 |
| | 124 |
| | — |
| | 226 |
|
| Mortgage revenue bonds | | 454 |
| | 15 |
| | (5 | ) | | 464 |
| | 339 |
| | 10 |
| | (3 | ) | | 346 |
|
| Other mortgage-related securities | | 339 |
| | 17 |
| | — |
| | 356 |
| | 320 |
| | 5 |
| | (2 | ) | | 323 |
|
| Total | | $ | 3,194 |
| | $ | 386 |
| | $ | (43 | ) | | $ | 3,537 |
| | $ | 2,448 |
| | $ | 255 |
| | $ | (13 | ) | | $ | 2,690 |
|
|
| | | | | | | | | | | | | | | | | | | | | |
| | As of December 31, 2017 |
| | Total Amortized Cost(1) | | Gross Unrealized Gains | | Gross Unrealized Losses(2) | | Total Fair Value |
| | (Dollars in millions) |
| Fannie Mae | | $ | 2,044 |
| | | | $ | 102 |
| | | | $ | (27 | ) | | | $ | 2,119 |
|
| Other agency | | 332 |
| | | | 25 |
| | | | — |
| | | 357 |
|
| Alt-A and subprime private-label securities | | 662 |
| | | | 652 |
| | | | — |
| | | 1,314 |
|
| CMBS | | 15 |
| | | | — |
| | | | — |
| | | 15 |
|
| Mortgage revenue bonds | | 655 |
| | | | 20 |
| | | | (4 | ) | | | 671 |
|
| Other mortgage-related securities | | 350 |
| | | | 17 |
| | | | — |
| | | 367 |
|
| Total | | $ | 4,058 |
| | | | $ | 816 |
| | | | $ | (31 | ) | | | $ | 4,843 |
|
|
| | |
Fannie Mae (In conservatorship) Third Quarter 2018 Form 10-Q | 72 |
|
| | |
| Notes to Condensed Consolidated Financial Statements | Investments in Securities |
__________ |
| | | | | | | | | | | | | | | | | | | | | |
| | As of December 31, 2018 |
| | Total Amortized Cost(1) | | Gross Unrealized Gains | | Gross Unrealized Losses(2) | | Total Fair Value |
| | (Dollars in millions) |
| Fannie Mae | | $ | 1,754 |
| | | | $ | 69 |
| | | | $ | (26 | ) | | | $ | 1,797 |
|
| Other agency | | 239 |
| | | | 17 |
| | | | — |
| | | 256 |
|
| Alt-A and subprime private-label securities | | 325 |
| | | | 267 |
| | | | — |
| | | 592 |
|
| Mortgage revenue bonds | | 425 |
| | | | 13 |
| | | | (4 | ) | | | 434 |
|
| Other mortgage-related securities | | 336 |
| | | | 14 |
| | | | — |
| | | 350 |
|
| Total | | $ | 3,079 |
| | | | $ | 380 |
| | | | $ | (30 | ) | | | $ | 3,429 |
|
| |
(1) | Amortized cost consists of unpaid principal balance, unamortized premiums, discounts and other cost basis adjustments, as well as net other-than-temporary impairments (“OTTI”) recognized in “Investment gains, net” in our condensed consolidated statements of operations and comprehensive income. |
| |
(2) | Represents the gross unrealized losses on securities for which we have not recognized OTTI, as well as the noncredit component of OTTI and cumulative changes in fair value of securities for which we previously recognized the credit component of OTTI in “Accumulated other comprehensive income” in our condensed consolidated balance sheets. |
|
| | |
| Fannie Mae (In conservatorship) Third Quarter 2019 Form 10-Q | 75 |
|
| | |
| Notes to Condensed Consolidated Financial Statements | Investments in Securities |
The following tables display additional information regarding gross unrealized losses and fair value by major security type for AFS securities in an unrealized loss position.
| | | | As of September 30, 2018 | As of September 30, 2019 |
| | Less Than 12 Consecutive Months | | 12 Consecutive Months or Longer | Less Than 12 Consecutive Months | | 12 Consecutive Months or Longer |
| | Gross Unrealized Losses | | Fair Value | | Gross Unrealized Losses | | Fair Value | Gross Unrealized Losses | | Fair Value | | Gross Unrealized Losses | | Fair Value |
| | (Dollars in millions) | (Dollars in millions) |
| Fannie Mae | | $ | (3 | ) | | $ | 208 |
| | $ | (35 | ) | | $ | 472 |
| | $ | — |
| | $ | — |
| | $ | (8 | ) | | $ | 348 |
|
| Mortgage revenue bonds | | (2 | ) | | 42 |
| | (3 | ) | | 3 |
| | — |
| | — |
| | (3 | ) | | 5 |
|
| Other mortgage-related securities | | | (2 | ) | | 273 |
| | — |
| | — |
|
| Total | | $ | (5 | ) | | $ | 250 |
| | $ | (38 | ) | | $ | 475 |
| | $ | (2 | ) | | $ | 273 |
| | $ | (11 | ) | | $ | 353 |
|
| | | | | | | | | | | | | | | | | |
| | As of December 31, 2017 | As of December 31, 2018 |
| | Less Than 12 Consecutive Months | | 12 Consecutive Months or Longer | Less Than 12 Consecutive Months | | 12 Consecutive Months or Longer |
| | Gross Unrealized Losses | | Fair Value | | Gross Unrealized Losses | | Fair Value | Gross Unrealized Losses | | Fair Value | | Gross Unrealized Losses | | Fair Value |
| | (Dollars in millions) | (Dollars in millions) |
| Fannie Mae | | $ | (1 | ) | | $ | 134 |
| | $ | (26 | ) | | $ | 461 |
| | $ | — |
| | $ | — |
| | $ | (26 | ) | | $ | 487 |
|
| Mortgage revenue bonds | | — |
| | — |
| | (4 | ) | | 3 |
| | (1 | ) | | 24 |
| | (3 | ) | | 19 |
|
| Total | | $ | (1 | ) | | $ | 134 |
| | $ | (30 | ) | | $ | 464 |
| | $ | (1 | ) | | $ | 24 |
| | $ | (29 | ) | | $ | 506 |
|
Other-Than-Temporary Impairments
The cumulative outstanding balance of the unrealizedrelated to other-than-temporary-impairment (“OTTI”) credit loss component of AFS debt securities held by us andamounts previously recognized in our condensed consolidated statements of operations and comprehensive income wasthroughout the life of AFS debt securities held in portfolio were $37 million and $635 million as of September 30, 2019 and December 31, 2018, respectively. Those amounts were $718 million, $733 million and $1.1 billion as of September 30, 2018 June 30, 2018 and December 31, 2017, respectively. The decreases fordecrease in the three andcumulative outstanding balance in the first nine months ended September 30,of 2019 and 2018 werewas primarily driven by securities that we no longer heldhold in our portfolio at period end.portfolio.
The balance of thefollowing table displays net unrealized credit loss component ofgains on AFS debt securities held by us and recognized in our condensed consolidated statements of operations andother amounts within accumulated other comprehensive income was $1.2 billion, $1.8 billion and $1.9 billion as(“AOCI”), net of September 30, 2017, June 30, 2017 and December 31, 2016, respectively. The decreases for the three and nine months ended September 30, 2017 were primarily driventax, by securities we intend to sell or that it is more likely than not we will sell before recovery of our amortized cost basis.major categories. |
| | | | | | | | | | | |
| | As of |
| | September 30, | | December 31, |
| | 2019 | | 2018 |
| | (Dollars in millions) |
| Net unrealized gains on AFS securities for which we have not recorded OTTI | | $ | 191 |
| | | | $ | 52 |
| |
| Net unrealized gains on AFS securities for which we have recorded OTTI | | — |
| | | | 224 |
| |
| Other | | 39 |
| | | | 46 |
| |
| Accumulated other comprehensive income | | $ | 230 |
| | | | $ | 322 |
| |
|
| | |
Fannie Mae (In conservatorship) Third Quarter 20182019 Form 10-Q | 7376 |
|
| | |
| | Notes to Condensed Consolidated Financial Statements | Investments in Securities |
Maturity Information
The following table displays the amortized cost and fair value of our AFS securities by major security type and remaining contractual maturity, assuming no principal prepayments. The contractual maturity of mortgage-backed securities is not a reliable indicator of their expected life because borrowers generally have the right to prepay their obligations at any time.
| | | | As of September 30, 2018 | As of September 30, 2019 |
| | Total Amortized Cost | | Total Fair Value | | One Year or Less | | After One Year Through Five Years | | After Five Years Through Ten Years | | After Ten Years | Total Amortized Cost | | Total Fair Value | | One Year or Less | | After One Year Through Five Years | | After Five Years Through Ten Years | | After Ten Years |
| | | Amortized Cost | | Fair Value | | Amortized Cost | | Fair Value | | Amortized Cost | | Fair Value | | Amortized Cost | | Fair Value | | Amortized Cost | | Fair Value | | Amortized Cost | | Fair Value | | Amortized Cost | | Fair Value | | Amortized Cost | | Fair Value |
| | (Dollars in millions) | (Dollars in millions) |
| Fannie Mae | | $ | 1,808 |
| | $ | 1,828 |
| | $ | — |
| | $ | — |
| | $ | 13 |
| | $ | 13 |
| | $ | 77 |
| | $ | 81 |
| | $ | 1,718 |
| | $ | 1,734 |
| | $ | 1,492 |
| | $ | 1,582 |
| | $ | — |
| | $ | — |
| | $ | 14 |
| | $ | 15 |
| | $ | 101 |
| | $ | 111 |
| | $ | 1,377 |
| | $ | 1,456 |
|
| Other agency | | 256 |
| | 272 |
| | 2 |
| | 1 |
| | 9 |
| | 10 |
| | 42 |
| | 45 |
| | 203 |
| | 216 |
| | 195 |
| | 213 |
| | — |
| | — |
| | 20 |
| | 21 |
| | 26 |
| | 29 |
| | 149 |
| | 163 |
|
| Alt-A and subprime private-label securities | | 337 |
| | 617 |
| | — |
| | — |
| | — |
| | — |
| | — |
| | — |
| | 337 |
| | 617 |
| | 102 |
| | 226 |
| | — |
| | — |
| | — |
| | — |
| | 1 |
| | 1 |
| | 101 |
| | 225 |
|
| Mortgage revenue bonds | | 454 |
| | 464 |
| | 3 |
| | 4 |
| | 33 |
| | 33 |
| | 61 |
| | 62 |
| | 357 |
| | 365 |
| | 339 |
| | 346 |
| | 2 |
| | 2 |
| | 26 |
| | 27 |
| | 36 |
| | 37 |
| | 275 |
| | 280 |
|
| Other mortgage-related securities | | 339 |
| | 356 |
| | — |
| | — |
| | — |
| | — |
| | 7 |
| | 6 |
| | 332 |
| | 350 |
| | 320 |
| | 323 |
| | — |
| | — |
| | 2 |
| | 1 |
| | 24 |
| | 27 |
| | 294 |
| | 295 |
|
| Total | | $ | 3,194 |
| | $ | 3,537 |
| | $ | 5 |
| | $ | 5 |
| | $ | 55 |
| | $ | 56 |
| | $ | 187 |
| | $ | 194 |
| | $ | 2,947 |
| | $ | 3,282 |
| | $ | 2,448 |
| | $ | 2,690 |
| | $ | 2 |
| | $ | 2 |
| | $ | 62 |
| | $ | 64 |
| | $ | 188 |
| | $ | 205 |
| | $ | 2,196 |
| | $ | 2,419 |
|
6. Financial Guarantees
We recognize a guaranty obligation for our obligation to stand ready to perform on our guarantees to unconsolidated trusts and other guaranty arrangements. These off-balance sheet guarantees expose us to credit losses primarily relating to the unpaid principal balance of our unconsolidated Fannie Mae MBS and other financial guarantees. The remaining contractual terms of our guarantees range from 1 day to 3433 years; however, the actual term of each guaranty may be significantly less than the contractual term based on the prepayment characteristics of the related mortgage loans.
As the guarantor of structured securities backed in whole or in part by Freddie Mac-issued securities, we extend our guaranty to the underlying Freddie Mac securities in our resecuritization trusts. However, Freddie Mac continues to guarantee the payment of principal and interest on the underlying Freddie Mac securities that we have resecuritized. We do not charge an incremental guaranty fee to include Freddie Mac securities in the structured securities that we issue. Due to the funding commitment available to Freddie Mac through its senior preferred stock purchase agreement with Treasury, we have concluded that the associated credit risk is negligible. As such, we exclude from the following table approximately $28.9 billion of Freddie Mac securities backing unconsolidated Fannie Mae-issued structured securities as of September 30, 2019.
The following table displays our off-balance sheet maximum exposure, guaranty obligation recognized in our condensed consolidated balance sheets and the potential maximum potential recovery from third parties through available credit enhancements and recourse related to our financial guarantees.
|
| | | | | | | | | | | | | | | | | | | | | | | |
| | As of |
| | September 30, 2018 | | December 31, 2017 |
| | Maximum Exposure | | Guaranty Obligation | | Maximum Recovery(1) | | Maximum Exposure | | Guaranty Obligation | | Maximum Recovery(1) |
| | (Dollars in millions) |
| Unconsolidated Fannie Mae MBS | $ | 7,485 |
| | $ | 31 |
| | $ | 6,930 |
| | $ | 10,876 |
| | $ | 127 |
| | $ | 7,340 |
|
Other guaranty arrangements(2) | 14,024 |
| | 131 |
| | 2,399 |
| | 14,265 |
| | 131 |
| | 2,404 |
|
| Total | $ | 21,509 |
| | $ | 162 |
| | $ | 9,329 |
| | $ | 25,141 |
| | $ | 258 |
| | $ | 9,744 |
|
__________ |
| | | | | | | | | | | | | | | | | | | | | | | | |
| | | As of |
| | | September 30, 2019 | | December 31, 2018 |
| | | Maximum Exposure | | Guaranty Obligation | | Maximum Recovery(1) | | Maximum Exposure | | Guaranty Obligation | | Maximum Recovery(1) |
| | | (Dollars in millions) |
| Unconsolidated Fannie Mae MBS | | $ | 6,603 |
| | $ | 26 |
| | $ | 6,354 |
| | $ | 7,278 |
| | $ | 30 |
| | $ | 6,811 |
|
Other guaranty arrangements(2) | | 12,981 |
| | 135 |
| | 2,609 |
| | 13,847 |
| | 130 |
| | 2,711 |
|
| Total | | $ | 19,584 |
| | $ | 161 |
| | $ | 8,963 |
| | $ | 21,125 |
| | $ | 160 |
| | $ | 9,522 |
|
| |
(1) | Recoverability of such credit enhancements and recourse is subject to, among other factors, our mortgage insurers’ and financial guarantors’ ability to meet their obligations to us. For information on our mortgage insurers and financial guarantors, see “Note 13, Concentrations of Credit Risk” in our 20172018 Form 10-K and “Note 11,10, Concentrations of Credit Risk” in this report. |
| |
(2) | Primarily consists of credit enhancements and long-term standby commitments. |
|
| | |
Fannie Mae (In conservatorship) Third Quarter 20182019 Form 10-Q | 7477 |
|
| | |
| | Notes to Condensed Consolidated Financial Statements | Short-Term and Long-Term Debt |
7. Short-Term and Long-Term Debt
Short-Term Debt
The following table displays our outstanding short-term debt (debt with an original contractual maturity of one year or less) and weighted-average interest rates of this debt.
|
| | | | | | | | | | | | | |
| | As of |
| | September 30, 2018 | | December 31, 2017 |
| | Outstanding | | Weighted- Average Interest Rate(1) | | Outstanding | | Weighted- Average Interest Rate(1) |
| | (Dollars in millions) |
Federal funds purchased and securities sold under agreements to repurchase(2) | $ | 749 |
| | 1.90 | % | | $ | — |
| | — | % |
| | | | | | | | |
| Short-term debt of Fannie Mae | $ | 28,248 |
| | 2.06 | % | | $ | 33,377 |
| | 1.18 | % |
| Debt of consolidated trusts | 274 |
| | 2.33 |
| | 379 |
| | 1.11 |
|
| Total short-term debt | $ | 28,522 |
| | 2.06 | % | | $ | 33,756 |
| | 1.18 | % |
__________ |
| | | | | | | | | | | | | | |
| | | As of |
| | | September 30, 2019 | | December 31, 2018 |
| | | Outstanding | | Weighted- Average Interest Rate(1) | | Outstanding | | Weighted- Average Interest Rate(1) |
| | | (Dollars in millions) |
Federal funds purchased and securities sold under agreements to repurchase(2) | | $ | 1,125 |
| | 2.15 | % | | $ | — |
| | — | % |
| | | | | | | | | |
| Short-term debt of Fannie Mae | | $ | 35,812 |
| | 2.04 | % | | $ | 24,896 |
| | 2.29 | % |
| |
(1) | Includes the effects of discounts, premiums and other cost basis adjustments. |
| |
(2) | Represents agreements to repurchase securities for a specified price, with repayment generally occurring on the following day. |
Intraday Line of Credit
We use a secured intraday funding line of credit provided by a large financial institution. We post collateral which, in some circumstances, the secured party has the right to repledge to third parties. As this line of credit is an uncommitted intraday loan facility, we may be unable to draw on it if and when needed. The line of credit under this facility was up to $15.0 billion as of September 30, 20182019 and December 31, 2017.2018.
|
| | |
Fannie Mae (In conservatorship) Third Quarter 2018 Form 10-Q | 75 |
|
| | |
| Notes to Condensed Consolidated Financial Statements | Short-Term and Long-Term Debt |
Long-Term Debt
Long-term debt represents debt with an original contractual maturity of greater than one year. The following table displays our outstanding long-term debt.
|
| | | | | | | | | | | | | | | | | |
| | As of |
| | September 30, 2018 | | December 31, 2017 |
| | Maturities | | Outstanding | | Weighted- Average Interest Rate(1) | | Maturities | | Outstanding | | Weighted- Average Interest Rate(1) |
| | (Dollars in millions) |
| Senior fixed: | | | | | | | | | | | |
| Benchmark notes and bonds | 2018 - 2030 | | $ | 111,190 |
| | 2.33 | % | | 2018 - 2030 | | $ | 123,541 |
| | 2.11 | % |
Medium-term notes(2) | 2018 - 2026 | | 66,297 |
| | 1.50 |
| | 2018 - 2026 | | 75,901 |
| | 1.41 |
|
Other(3) | 2018 - 2038 | | 6,725 |
| | 4.74 |
| | 2018 - 2038 | | 7,421 |
| | 4.84 |
|
| Total senior fixed | | | 184,212 |
| | 2.12 |
| | | | 206,863 |
| | 1.95 |
|
| Senior floating: | | | | | | | | | | | |
Medium-term notes(2) | 2019 - 2020 | | 2,675 |
| | 2.05 |
| | 2018 - 2020 | | 8,425 |
| | 1.36 |
|
Connecticut Avenue Securities(4) | 2023 - 2031 | | 25,657 |
| | 5.73 |
| | 2023 - 2030 | | 22,527 |
| | 5.18 |
|
Other(5) | 2020 - 2037 | | 347 |
| | 7.59 |
| | 2020 - 2037 | | 376 |
| | 6.36 |
|
| Total senior floating | | | 28,679 |
| | 5.41 |
| | | | 31,328 |
| | 4.14 |
|
| Subordinated debentures | 2019 | | 5,486 |
| | 9.96 |
| | 2019 | | 5,106 |
| | 9.93 |
|
Secured borrowings(6) | 2021 - 2022 | | 57 |
| | 1.75 |
| | 2021 - 2022 | | 78 |
| | 1.70 |
|
Total long-term debt of Fannie Mae(7) | | | 218,434 |
| | 2.75 |
| | | | 243,375 |
| | 2.40 |
|
| Debt of consolidated trusts | 2018 - 2058 | | 3,127,414 |
| | 2.92 |
| | 2018 - 2057 | | 3,052,923 |
| | 2.80 |
|
| Total long-term debt | | | $ | 3,345,848 |
| | 2.91 | % | | | | $ | 3,296,298 |
| | 2.77 | % |
__________ |
| | | | | | | | | | | | | | | | | |
| | As of |
| | September 30, 2019 | | December 31, 2018 |
| | Maturities | | Outstanding | | Weighted- Average Interest Rate(1) | | Maturities | | Outstanding | | Weighted- Average Interest Rate(1) |
| | (Dollars in millions) |
| Senior fixed: | | | | | | | | | | | |
| Benchmark notes and bonds | 2019 - 2030 | | $ | 91,603 |
| | 2.66 | % | | 2019 - 2030 | | $ | 103,206 |
| | 2.36 | % |
Medium-term notes(2) | 2019 - 2026 | | 40,973 |
| | 1.60 |
| | 2019 - 2026 | | 61,455 |
| | 1.48 |
|
Other(3) | 2019 - 2038 | | 6,142 |
| | 4.84 |
| | 2019 - 2038 | | 6,683 |
| | 4.62 |
|
| Total senior fixed | | | 138,718 |
| | 2.44 |
| | | | 171,344 |
| | 2.13 |
|
| Senior floating: | | | | | | | | | | | �� |
Medium-term notes(2) | 2020 - 2021 | | 9,773 |
| | 2.28 |
| | 2019 - 2020 | | 4,174 |
| | 2.36 |
|
Connecticut Avenue Securities(4) | 2023 - 2031 | | 22,977 |
| | 5.90 |
| | 2023 - 2031 | | 25,641 |
| | 5.97 |
|
Other(5) | 2020 - 2037 | | 422 |
| | 7.79 |
| | 2020 - 2037 | | 351 |
| | 10.19 |
|
| Total senior floating | | | 33,172 |
| | 4.86 |
| | | | 30,166 |
| | 5.52 |
|
| Subordinated debentures | 2019 | | 5,783 |
| | 9.99 |
| | 2019 | | 5,617 |
| | 9.64 |
|
Secured borrowings(6) | 2021 - 2022 | | 37 |
| | 2.24 |
| | 2021 - 2022 | | 51 |
| | 1.96 |
|
Total long-term debt of Fannie Mae(7) | | | 177,710 |
| | 3.14 |
| | | | 207,178 |
| | 2.83 |
|
| Debt of consolidated trusts | 2019 - 2058 | | 3,248,336 |
| | 2.79 |
| | 2019 - 2058 | | 3,159,846 |
| | 3.03 |
|
| Total long-term debt | | | $ | 3,426,046 |
| | 2.81 | % | | | | $ | 3,367,024 |
| | 3.02 | % |
| |
(1) | Includes the effects of discounts, premiums and other cost basis adjustments. |
|
| | |
| Fannie Mae (In conservatorship) Third Quarter 2019 Form 10-Q | 78 |
|
| | |
| Notes to Condensed Consolidated Financial Statements | Short-Term and Long-Term Debt |
| |
(2) | Includes long-term debt with an original contractual maturity of greater than 1 year and up to 10 years, excluding zero-coupon debt. |
| |
(3) | Includes other long-term debt with an original contractual maturity of greater than 10 years and foreign exchange bonds. |
| |
(4) | Credit risk-sharing securities that transfer a portion of the credit risk on specified pools of single-family mortgage loans to the investors in these securities, a portion of which is reported at fair value. Represents Connecticut Avenue Securities issued prior to the implementation of our CAS REMIC structure in November 2018. See “Note 2, Consolidations and Transfers of Financial Assets” in our 2018 Form 10-K for more information about our CAS REMIC structure. |
| |
(5) | Consists of structured debt instruments that are reported at fair value. |
| |
(6) | Represents our remaining liability resulting from the transfer of financial assets from our condensed consolidated balance sheets that did not qualify as a sale under the accounting guidance for the transfer of financial instruments. |
| |
(7) | Includes unamortized discounts and premiums, other cost basis adjustments and fair value adjustments of $399$30 million and $752$413 million as of September 30, 20182019 and December 31, 2017,2018, respectively. |
8. Derivative Instruments
Derivative instruments are an integral part of our strategy in managing interest rate risk. Derivative instruments may be privately-negotiated, bilateral contracts, or they may be listed and traded on an exchange. We refer to our derivative transactions made pursuant to bilateral contracts as our over-the-counter (“OTC”) derivative transactions and our derivative transactions accepted for clearing by a derivatives clearing organization as our cleared derivative transactions. We typically do not settle the notional amount of our risk management derivatives; rather, notional amounts provide the basis for calculating actual payments or settlement amounts. The derivativesderivative contracts we use for interest rate risk management purposes consist primarily of interest rate swaps and interest rate options. See “Note 8, Derivative Instruments” in our 2018 Form 10-K for additional information on interest rate risk management.
We enter into various forms of credit risk sharingrisk-sharing agreements including credit risk transfer transactions, swap credit enhancements and mortgage insurance contracts, that we account for as derivatives.derivatives, including some of our credit risk transfer transactions and swap credit enhancements. The majority of our credit-related derivatives are credit risk transfer transactions, whereby a portion of the credit risk associated with losses on a reference pool of mortgage loans is transferred to a third party.
|
| | |
Fannie Mae (In conservatorship) Third Quarter 2018 Form 10-Q | 76 |
|
| | |
| Notes to Condensed Consolidated Financial Statements | Derivative Instruments |
We enter into forward purchase and sale commitments that lock in the future delivery of mortgage loans and mortgage-related securities at a fixed price or yield. Certain commitments to purchase mortgage loans and purchase or sell mortgage-related securities meet the criteria of a derivative. We typically settle the notional amount of our mortgage commitments that are accounted for as derivatives.
We recognize all derivatives as either assets or liabilities in our condensed consolidated balance sheets at their fair value on a trade date basis. Fair value amounts, which are netted to the extent a legal right of offset exists and is enforceable by law at the counterparty level and are inclusive of the right or obligation associated with the cash collateral posted or received, are recorded in “Other assets” or “Other liabilities” in our condensed consolidated balance sheets. See “Note 13,12, Fair Value” for additional information on derivatives recorded at fair value. We present cash flows from derivatives as operating activities in our condensed consolidated statements of cash flows.
|
| | |
| Fannie Mae (In conservatorship) Third Quarter 2019 Form 10-Q | 79 |
|
| | |
| Notes to Condensed Consolidated Financial Statements | Derivative Instruments |
Notional and Fair Value Position of our Derivatives
The following table displays the notional amount and estimated fair value of our asset and liability derivative instruments.
|
| | | | | | | | | | | | | | | | | | | | | | | | | | | | | | | |
| | As of September 30, 2018 | | As of December 31, 2017 |
| | Asset Derivatives | | Liability Derivatives | | Asset Derivatives | | Liability Derivatives |
| | Notional Amount | | Estimated Fair Value | | Notional Amount | | Estimated Fair Value | | Notional Amount | | Estimated Fair Value | | Notional Amount | | Estimated Fair Value |
| | (Dollars in millions) |
| Risk management derivatives: | | | | | | | | | | | | | | | |
| Swaps: | | | | | | | | | | | | | | | |
| Pay-fixed | $ | 103,362 |
| | $ | 898 |
| | $ | 18,245 |
| | $ | (520 | ) | | $ | 52,732 |
| | $ | 772 |
| | $ | 70,211 |
| | $ | (2,120 | ) |
| Receive-fixed | 114,773 |
| | 1,031 |
| | 60,219 |
| | (1,259 | ) | | 31,671 |
| | 2,391 |
| | 138,852 |
| | (1,764 | ) |
| Basis | 273 |
| | 93 |
| | 600 |
| | — |
| | 873 |
| | 124 |
| | — |
| | — |
|
| Foreign currency | 225 |
| | 28 |
| | 228 |
| | (60 | ) | | 234 |
| | 59 |
| | 236 |
| | (56 | ) |
| Swaptions: | | | | | | | | | | | | | | | |
| Pay-fixed | 11,775 |
| | 321 |
| | 350 |
| | (2 | ) | | 9,750 |
| | 95 |
| | 4,000 |
| | (20 | ) |
| Receive-fixed | 500 |
| | 14 |
| | 7,375 |
| | (366 | ) | | 250 |
| | 13 |
| | 9,250 |
| | (304 | ) |
Other(1) | 25,799 |
| | 18 |
| | — |
| | (1 | ) | | 13,240 |
| | 22 |
| | 7,315 |
| | (1 | ) |
| Total gross risk management derivatives | 256,707 |
| | 2,403 |
| | 87,017 |
| | (2,208 | ) | | 108,750 |
| | 3,476 |
| | 229,864 |
| | (4,265 | ) |
| Accrued interest receivable (payable) | — |
| | 437 |
| | — |
| | (504 | ) | | — |
| | 835 |
| | — |
| | (814 | ) |
Netting adjustment(2) | — |
| | (2,775 | ) | | — |
| | 2,648 |
| | — |
| | (4,272 | ) | | — |
| | 4,979 |
|
| Total net risk management derivatives | $ | 256,707 |
| | $ | 65 |
| | $ | 87,017 |
| | $ | (64 | ) | | $ | 108,750 |
| | $ | 39 |
| | $ | 229,864 |
| | $ | (100 | ) |
| Mortgage commitment derivatives: | | | | | | | | | | | | | | | |
| Mortgage commitments to purchase whole loans | $ | 2,569 |
| | $ | 3 |
| | $ | 3,054 |
| | $ | (15 | ) | | $ | 4,143 |
| | $ | 9 |
| | $ | 1,570 |
| | $ | (2 | ) |
| Forward contracts to purchase mortgage-related securities | 15,301 |
| | 21 |
| | 36,797 |
| | (149 | ) | | 45,925 |
| | 108 |
| | 21,099 |
| | (21 | ) |
| Forward contracts to sell mortgage-related securities | 61,979 |
| | 264 |
| | 26,773 |
| | (48 | ) | | 19,320 |
| | 15 |
| | 85,556 |
| | (205 | ) |
| Total mortgage commitment derivatives | 79,849 |
| | 288 |
| | 66,624 |
| | (212 | ) | | 69,388 |
| | 132 |
| | 108,225 |
| | (228 | ) |
| Derivatives at fair value | $ | 336,556 |
| | $ | 353 |
| | $ | 153,641 |
| | $ | (276 | ) | | $ | 178,138 |
| | $ | 171 |
| | $ | 338,089 |
| | $ | (328 | ) |
__________ |
| | | | | | | | | | | | | | | | | | | | | | | | | | | | | | | | |
| | | As of September 30, 2019 | | As of December 31, 2018 |
| | | Asset Derivatives | | Liability Derivatives | | Asset Derivatives | | Liability Derivatives |
| | | Notional Amount | | Estimated Fair Value | | Notional Amount | | Estimated Fair Value | | Notional Amount | | Estimated Fair Value | | Notional Amount | | Estimated Fair Value |
| | | (Dollars in millions) |
| Risk management derivatives: | | | | | | | | | | | | | | | | |
| Swaps: | | | | | | | | | | | | | | | | |
| Pay-fixed | | $ | 35,550 |
| | $ | — |
| | $ | 32,893 |
| | $ | (1,481 | ) | | $ | 71,416 |
| | $ | 438 |
| | $ | 21,253 |
| | $ | (740 | ) |
| Receive-fixed | | 71,372 |
| | 958 |
| | 34,986 |
| | (103 | ) | | 88,799 |
| | 1,113 |
| | 58,399 |
| | (860 | ) |
| Basis | | 273 |
| | 179 |
| | — |
| | — |
| | 250 |
| | 104 |
| | 624 |
| | — |
|
| Foreign currency | | 213 |
| | 27 |
| | 215 |
| | (86 | ) | | 221 |
| | 22 |
| | 223 |
| | (72 | ) |
| Swaptions: | | | | | | | | | | | | | | | | |
| Pay-fixed | | 4,600 |
| | 18 |
| | 6,375 |
| | (270 | ) | | 10,375 |
| | 191 |
| | 1,000 |
| | (4 | ) |
| Receive-fixed | | 2,875 |
| | 203 |
| | 4,600 |
| | (137 | ) | | 500 |
| | 20 |
| | 7,375 |
| | (338 | ) |
Futures(1) | | 47,069 |
| | — |
| | — |
| | — |
| | 16,631 |
| | — |
| | — |
| | — |
|
| Total gross risk management derivatives | | 161,952 |
| | 1,385 |
| | 79,069 |
| | (2,077 | ) | | 188,192 |
| | 1,888 |
| | 88,874 |
| | (2,014 | ) |
| Accrued interest receivable (payable) | | — |
| | 287 |
| | — |
| | (374 | ) | | — |
| | 400 |
| | — |
| | (419 | ) |
Netting adjustment(2) | | — |
| | (1,663 | ) | | — |
| | 2,299 |
| | — |
| | (2,266 | ) | | — |
| | 2,315 |
|
| Total net risk management derivatives | | $ | 161,952 |
| | $ | 9 |
| | $ | 79,069 |
| | $ | (152 | ) | | $ | 188,192 |
| | $ | 22 |
| | $ | 88,874 |
| | $ | (118 | ) |
| Mortgage commitment derivatives: | | | | | | | | | | | | | | | | |
| Mortgage commitments to purchase whole loans | | $ | 7,812 |
| | $ | 20 |
| | $ | 6,258 |
| | $ | (26 | ) | | $ | 4,370 |
| | $ | 29 |
| | $ | 57 |
| | $ | — |
|
| Forward contracts to purchase mortgage-related securities | | 70,120 |
| | 231 |
| | 28,853 |
| | (85 | ) | | 40,650 |
| | 349 |
| | 1,045 |
| | (3 | ) |
| Forward contracts to sell mortgage-related securities | | 57,048 |
| | 170 |
| | 109,229 |
| | (305 | ) | | 292 |
| | 1 |
| | 70,593 |
| | (645 | ) |
| Total mortgage commitment derivatives | | 134,980 |
| | 421 |
| | 144,340 |
| | (416 | ) | | 45,312 |
| | 379 |
| | 71,695 |
| | (648 | ) |
| Credit enhancement derivatives | | 30,407 |
| | 42 |
| | 6,509 |
| | (27 | ) | | 33,431 |
| | 57 |
| | 919 |
| | (11 | ) |
| Derivatives at fair value | | $ | 327,339 |
| | $ | 472 |
| | $ | 229,918 |
| | $ | (595 | ) | | $ | 266,935 |
| | $ | 458 |
| | $ | 161,488 |
| | $ | (777 | ) |
| |
(1) | Includes credit risk transfer transactions, futures, swap credit enhancements and mortgage insurance contracts that we account for as derivatives.Futures have no ascribable fair value because the positions are settled daily. |
| |
(2) | The netting adjustment represents the effect of the legal right to offset under legally enforceable master netting arrangements to settle with the same counterparty on a net basis, including cash collateral posted and received. Cash collateral posted was $611$1.3 billion and $713 million and $1.4 billion as of September 30, 20182019 and December 31, 2017,2018, respectively. Cash collateral received was $738$684 million and $649$664 million as of September 30, 20182019 and December 31, 2017,2018, respectively. |
|
| | |
Fannie Mae (In conservatorship) Third Quarter 20182019 Form 10-Q | 7780 |
|
| | |
| | Notes to Condensed Consolidated Financial Statements | Derivative Instruments |
We record all derivative gains and losses, including accrued interest, in “Fair value gains (losses), net” in our condensed consolidated statements of operations and comprehensive income. The following table displays, by type of derivative instrument, the fair value gains and losses, net on our derivatives.
| | | | For the Three Months | | For the Nine Months | | For the Three Months Ended September 30, | | For the Nine Months Ended September 30, |
| | Ended September 30, | | Ended September 30, | |
| | 2018 | | 2017 | | 2018 | | 2017 | | 2019 | | 2018 | | 2019 | | 2018 |
| | (Dollars in millions) | | (Dollars in millions) |
| Risk management derivatives: | | | | | | | | | | | | | | | |
| Swaps: | | | | | | | | | | | | | | | |
| Pay-fixed | $ | 1,034 |
| | $ | 300 |
| | $ | 4,784 |
| | $ | 300 |
| | $ | (1,414 | ) | | $ | 1,034 |
| | $ | (4,913 | ) | | $ | 4,784 |
|
| Receive-fixed | (524 | ) | | (202 | ) | | (3,508 | ) | | 120 |
| | 966 |
| | (524 | ) | | 4,131 |
| | (3,508 | ) |
| Basis | (5 | ) | | 1 |
| | (31 | ) | | 24 |
| | 24 |
| | (5 | ) | | 75 |
| | (31 | ) |
| Foreign currency | (10 | ) | | 13 |
| | (35 | ) | | 36 |
| | (11 | ) | | (10 | ) | | (9 | ) | | (35 | ) |
| Swaptions: | | | | | | | | | | | | | | | |
| Pay-fixed | 67 |
| | (40 | ) | | 232 |
| | (88 | ) | | (110 | ) | | 67 |
| | (430 | ) | | 232 |
|
| Receive-fixed | (34 | ) | | (8 | ) | | (72 | ) | | (34 | ) | | 209 |
| | (34 | ) | | 309 |
| | (72 | ) |
| Other | (1 | ) | | 11 |
| | (5 | ) | | 6 |
| |
| Futures | | | 42 |
| | — |
| | 296 |
| | (3 | ) |
| Net accrual of periodic settlements | (285 | ) | | (223 | ) | | (786 | ) | | (702 | ) | | (190 | ) | | (285 | ) | | (698 | ) | | (786 | ) |
| Total risk management derivatives fair value gains (losses), net | 242 |
| | (148 | ) | | 579 |
| | (338 | ) | | (484 | ) | | 243 |
| | (1,239 | ) | | 581 |
|
| Mortgage commitment derivatives fair value gains (losses), net | 118 |
| | (248 | ) | | 606 |
| | (520 | ) | | (177 | ) | | 118 |
| | (946 | ) | | 606 |
|
| Credit enhancement derivatives fair value losses, net | | | (7 | ) | | (1 | ) | | (31 | ) | | (2 | ) |
| Total derivatives fair value gains (losses), net | $ | 360 |
| | $ | (396 | ) | | $ | 1,185 |
| | $ | (858 | ) | | $ | (668 | ) | | $ | 360 |
| | $ | (2,216 | ) | | $ | 1,185 |
|
Derivative Counterparty Credit Exposure
Our derivative counterparty credit exposure relates principally to interest rate derivative contracts. We are exposed to the risk that a counterparty in a derivative transaction will default on payments due to us, which may require us to seek a replacement derivative from a different counterparty. This replacement may be at a higher cost, or we may be unable to find a suitable replacement. We manage our derivative counterparty credit exposure relating to our risk management derivative transactions mainly through enforceable master netting arrangements, which allow us to net derivative assets and liabilities with the same counterparty or clearing organization and clearing member. For our OTC derivative transactions, we require counterparties to post collateral, which may include cash, U.S. Treasury securities, agency debt and agency mortgage-related securities.
See “Note 12,11, Netting Arrangements” for information on our rights to offset assets and liabilities.
|
| | |
Fannie Mae (In conservatorship) Third Quarter 20182019 Form 10-Q | 7881 |
|
| | |
| | Notes to Condensed Consolidated Financial Statements | Segment Reporting |
9. Segment Reporting
We have two2 reportable business segments: Single-Family and Multifamily. Results of our two2 business segments are intended to reflect each segment as if it were a stand-alone business. The sum of the results for our two2 business segments equals our condensed consolidated results of operations.
Segment Allocations and Results
The majority of our revenues and expenses are directly associated with either our single-family or our multifamily business segment and are included in determining that segment’s operating results. Other revenues and expenses, including administrative expenses, that are not directly attributable to a particular business segment are allocated based on the size of each segment’s guaranty book of business. The substantial majority of the gains and losses associated with our risk management derivatives are allocated to our single-family business segment.
The following tables displaytable displays our segment results.
|
| | | | | | | | | | | | | | | | | | | | | | | |
| | For the Three Months Ended September 30, |
| | 2018 | | 2017 |
| | Single-Family | | Multifamily | | Total | | Single-Family | | Multifamily | | Total |
| | (Dollars in millions) |
Net interest income(1) | $ | 4,670 |
| | $ | 699 |
| | $ | 5,369 |
| | $ | 4,627 |
| | $ | 647 |
| | $ | 5,274 |
|
Fee and other income(2) | 79 |
| | 192 |
| | 271 |
| | 1,005 |
| | 189 |
| | 1,194 |
|
| Net revenues | 4,749 |
| | 891 |
| | 5,640 |
| | 5,632 |
| | 836 |
| | 6,468 |
|
Investment gains, net(3) | 146 |
| | 20 |
| | 166 |
| | 286 |
| | 27 |
| | 313 |
|
Fair value gains (losses), net(4) | 417 |
| | (31 | ) | | 386 |
| | (300 | ) | | 11 |
| | (289 | ) |
| Administrative expenses | (636 | ) | | (104 | ) | | (740 | ) | | (580 | ) | | (84 | ) | | (664 | ) |
Credit-related income (expense)(5) | | | | | | | | | | | |
| Benefit (provision) for credit losses | 732 |
| | (16 | ) | | 716 |
| | (137 | ) | | (45 | ) | | (182 | ) |
| Foreclosed property income (expense) | (150 | ) | | (9 | ) | | (159 | ) | | (157 | ) | | 17 |
| | (140 | ) |
| Total credit-related income (expense) | 582 |
| | (25 | ) | | 557 |
| | (294 | ) | | (28 | ) | | (322 | ) |
TCCA fees(6) | (576 | ) | | — |
| | (576 | ) | | (531 | ) | | — |
| | (531 | ) |
| Other expenses, net | (282 | ) | | (95 | ) | | (377 | ) | | (320 | ) | | (107 | ) | | (427 | ) |
| Income before federal income taxes | 4,400 |
| | 656 |
| | 5,056 |
| | 3,893 |
| | 655 |
| | 4,548 |
|
| Provision for federal income taxes | (938 | ) | | (107 | ) | | (1,045 | ) | | (1,361 | ) | | (164 | ) | | (1,525 | ) |
| Net income | $ | 3,462 |
| | $ | 549 |
| | $ | 4,011 |
| | $ | 2,532 |
| | $ | 491 |
| | $ | 3,023 |
|
|
| | | | | | | | | | | | | | | | | | | | | | | |
| | For the Nine Months Ended September 30, |
| | 2018 | | 2017 |
| | Single-Family | | Multifamily | | Total | | Single-Family | | Multifamily | | Total |
| | (Dollars in millions) |
Net interest income(1) | $ | 13,954 |
| | $ | 2,024 |
| | $ | 15,978 |
| | $ | 13,749 |
| | $ | 1,873 |
| | $ | 15,622 |
|
Fee and other income(2) | 306 |
| | 524 |
| | 830 |
| | 1,192 |
| | 604 |
| | 1,796 |
|
| Net revenues | 14,260 |
| | 2,548 |
| | 16,808 |
| | 14,941 |
| | 2,477 |
| | 17,418 |
|
Investment gains, net(3) | 640 |
| | 53 |
| | 693 |
| | 557 |
| | 132 |
| | 689 |
|
Fair value gains (losses), net(4) | 1,729 |
| | (69 | ) | | 1,660 |
| | (997 | ) | | (23 | ) | | (1,020 | ) |
| Administrative expenses | (1,928 | ) | | (317 | ) | | (2,245 | ) | | (1,781 | ) | | (253 | ) | | (2,034 | ) |
Credit-related income (expense)(5) | | | | | | | | | | | |
| Benefit (provision) for credit losses | 2,223 |
| | 6 |
| | 2,229 |
| | 1,518 |
| | (37 | ) | | 1,481 |
|
| Foreclosed property income (expense) | (448 | ) | | (12 | ) | | (460 | ) | | (405 | ) | | 14 |
| | (391 | ) |
| Total credit-related income (expense) | 1,775 |
| | (6 | ) | | 1,769 |
| | 1,113 |
| | (23 | ) | | 1,090 |
|
TCCA fees(6) | (1,698 | ) | | — |
| | (1,698 | ) | | (1,552 | ) | | — |
| | (1,552 | ) |
| Other expenses, net | (684 | ) | | (262 | ) | | (946 | ) | | (731 | ) | | (369 | ) | | (1,100 | ) |
| Income before federal income taxes | 14,094 |
| | 1,947 |
| | 16,041 |
| | 11,550 |
| | 1,941 |
| | 13,491 |
|
| Provision for federal income taxes | (2,998 | ) | | (314 | ) | | (3,312 | ) | | (4,014 | ) | | (481 | ) | | (4,495 | ) |
| Net income | $ | 11,096 |
| | $ | 1,633 |
| | $ | 12,729 |
| | $ | 7,536 |
| | $ | 1,460 |
| | $ | 8,996 |
|
|
| | | | | | | | | | | | | | | | | | | | | | | | |
| | | For the Three Months Ended September 30, |
| | | 2019 | | 2018 |
| | | Single-Family | | Multifamily | | Total | | Single-Family | | Multifamily | | Total |
| | | (Dollars in millions) |
Net interest income(1) | | $ | 4,484 |
| | $ | 745 |
| | $ | 5,229 |
| | $ | 4,670 |
| | $ | 699 |
| | $ | 5,369 |
|
Fee and other income(2) | | 156 |
| | 246 |
| | 402 |
| | 79 |
| | 192 |
| | 271 |
|
| Net revenues | | 4,640 |
| | 991 |
| | 5,631 |
| | 4,749 |
| | 891 |
| | 5,640 |
|
Investment gains, net(3) | | 198 |
| | 55 |
| | 253 |
| | 146 |
| | 20 |
| | 166 |
|
Fair value gains (losses), net(4) | | (719 | ) | | 6 |
| | (713 | ) | | 417 |
| | (31 | ) | | 386 |
|
| Administrative expenses | | (634 | ) | | (115 | ) | | (749 | ) | | (636 | ) | | (104 | ) | | (740 | ) |
Credit-related income (expense)(5) | | | | | | | | | | | | |
| Benefit (provision) for credit losses | | 1,840 |
| | 17 |
| | 1,857 |
| | 732 |
| | (16 | ) | | 716 |
|
| Foreclosed property expense | | (93 | ) | | (3 | ) | | (96 | ) | | (150 | ) | | (9 | ) | | (159 | ) |
| Total credit-related income (expense) | | 1,747 |
| | 14 |
| | 1,761 |
| | 582 |
| | (25 | ) | | 557 |
|
TCCA fees(6) | | (613 | ) | | — |
| | (613 | ) | | (576 | ) | | — |
| | (576 | ) |
| Other expenses, net | | (424 | ) | | (147 | ) | | (571 | ) | | (282 | ) | | (95 | ) | | (377 | ) |
| Income before federal income taxes | | 4,195 |
| | 804 |
| | 4,999 |
| | 4,400 |
| | 656 |
| | 5,056 |
|
| Provision for federal income taxes | | (872 | ) | | (164 | ) | | (1,036 | ) | | (938 | ) | | (107 | ) | | (1,045 | ) |
| Net income | | $ | 3,323 |
| | $ | 640 |
| | $ | 3,963 |
| | $ | 3,462 |
| | $ | 549 |
| | $ | 4,011 |
|
|
| | |
Fannie Mae (In conservatorship) Third Quarter 20182019 Form 10-Q | 7982 |
|
| | |
| | Notes to Condensed Consolidated Financial Statements | Segment Reporting |
__________ |
| | | | | | | | | | | | | | | | | | | | | | | | |
| | | For the Nine Months Ended September 30, |
| | | 2019 | | 2018 |
| | | Single-Family | | Multifamily | | Total | | Single-Family | | Multifamily | | Total |
| | | (Dollars in millions) |
Net interest income(1) | | $ | 12,942 |
| | $ | 2,170 |
| | $ | 15,112 |
| | $ | 13,954 |
| | $ | 2,024 |
| | $ | 15,978 |
|
Fee and other income(2) | | 350 |
| | 525 |
| | 875 |
| | 306 |
| | 524 |
| | 830 |
|
| Net revenues | | 13,292 |
| | 2,695 |
| | 15,987 |
| | 14,260 |
| | 2,548 |
| | 16,808 |
|
Investment gains, net(3) | | 709 |
| | 138 |
| | 847 |
| | 640 |
| | 53 |
| | 693 |
|
Fair value gains (losses), net(4) | | (2,364 | ) | | 66 |
| | (2,298 | ) | | 1,729 |
| | (69 | ) | | 1,660 |
|
| Administrative expenses | | (1,899 | ) | | (338 | ) | | (2,237 | ) | | (1,928 | ) | | (317 | ) | | (2,245 | ) |
Credit-related income (expense)(5) | | | | | | | | | | | | |
| Benefit (provision) for credit losses | | 3,753 |
| | (21 | ) | | 3,732 |
| | 2,223 |
| | 6 |
| | 2,229 |
|
| Foreclosed property expense | | (362 | ) | | (2 | ) | | (364 | ) | | (448 | ) | | (12 | ) | | (460 | ) |
| Total credit-related income (expense) | | 3,391 |
| | (23 | ) | | 3,368 |
| | 1,775 |
| | (6 | ) | | 1,769 |
|
TCCA fees(6) | | (1,806 | ) | | — |
| | (1,806 | ) | | (1,698 | ) | | — |
| | (1,698 | ) |
| Other expenses, net | | (1,179 | ) | | (335 | ) | | (1,514 | ) | | (684 | ) | | (262 | ) | | (946 | ) |
| Income before federal income taxes | | 10,144 |
| | 2,203 |
| | 12,347 |
| | 14,094 |
| | 1,947 |
| | 16,041 |
|
| Provision for federal income taxes | | (2,125 | ) | | (427 | ) | | (2,552 | ) | | (2,998 | ) | | (314 | ) | | (3,312 | ) |
| Net income | | $ | 8,019 |
| | $ | 1,776 |
| | $ | 9,795 |
| | $ | 11,096 |
| | $ | 1,633 |
| | $ | 12,729 |
|
| |
(1) | Net interest income primarily consists of guaranty fees received as compensation for assuming and managing the credit risk on loans underlying Fannie Mae MBS held by third parties for the respective business segment, and the difference between the interest income earned on the respective business segment’s mortgage assets in our retained mortgage portfolio and the interest expense associated with the debt funding those assets. Revenues from single-family guaranty fees include revenues generated by the 10 basis point increase in guaranty fees pursuant to the TCCA, the incremental revenue from which is remitted to Treasury and not retained by us. |
| |
(2) | Single-Family fee and other income primarily consists of compensation for engaging in structured transactions and providing other lender services, and income resulting from settlement agreements resolving certain claims relating to private-label securities we purchased or that we have guaranteed. Multifamily fee and other income consists of fees associated with multifamilyMultifamily business activities, including yield maintenance income. |
| |
(3) | Investment gains and losses primarily consistsconsist of gains and losses on the sale of mortgage assets for the respective business segment. |
| |
(4) | Single-Family fair value gains and losses primarily consist of fair value gains and losses on risk management and mortgage commitment derivatives, trading securities and other financial instruments associated with our single-family totalguaranty book of business. Multifamily fair value gains and losses primarily consist of fair value gains and losses on MBS commitment derivatives, trading securities and other financial instruments associated with our multifamily totalguaranty book of business. |
| |
(5) | Credit-related income or expense is based on the guaranty book of business of the respective business segment and consists of the applicable segment’s benefit or provision for credit losses and foreclosed property income or expense on loans underlying the segment’s guaranty book of business. |
| |
(6) | Consists of the portion of our single-family guaranty fees that is remitted to Treasury pursuant to the TCCA. |
10. Equity
The following table displays the activity in other comprehensive income (loss), net of tax, by major categories. |
| | | | | | | | | | | | | | | |
| | For the Three Months Ended September 30, | | For the Nine Months Ended September 30, |
| | 2018 | | 2017 | | 2018 | | 2017 |
| | (Dollars in millions)
|
| Net income | $ | 4,011 |
| | $ | 3,023 |
| | $ | 12,729 |
| | $ | 8,996 |
|
| Other comprehensive income (loss), net of tax effect: | | | | | | | |
| Changes in net unrealized gains (losses) on AFS securities (net of tax of $8 and $25, respectively, for the three months ended and net of tax of $22 and $36, respectively, for the nine months ended) | (31 | ) | | 47 |
| | (84 | ) | | 67 |
|
| Reclassification adjustment for gains on AFS securities and OTTI recognized in net income (net of tax of $1 and $12, respectively for the three months ended and net of tax of $71 and $63, respectively, for the nine months ended) | (2 | ) | | (20 | ) | | (265 | ) | | (113 | ) |
| Other | (3 | ) | | (2 | ) | | (8 | ) | | (6 | ) |
| Total other comprehensive income (loss) | (36 | ) | | 25 |
| | (357 | ) | | (52 | ) |
| Total comprehensive income | $ | 3,975 |
| | $ | 3,048 |
| | $ | 12,372 |
| | $ | 8,944 |
|
The following table displays our accumulated other comprehensive income, net of tax, by major categories. |
| | | | | | | | | | | |
| | As of |
| | September 30, | | December 31, |
| | 2018 | | 2017 |
| | (Dollars in millions) |
| Net unrealized gains on AFS securities for which we have not recorded OTTI | | $ | 34 |
| | | | $ | 87 |
| |
| Net unrealized gains on AFS securities for which we have recorded OTTI | | 237 |
| | | | 423 |
| |
| Other | | 42 |
| | | | 43 |
| |
| Accumulated other comprehensive income | | $ | 313 |
| | | | $ | 553 |
| |
|
| | |
Fannie Mae (In conservatorship) Third Quarter 20182019 Form 10-Q | 8083 |
|
| | |
| | Notes to Condensed Consolidated Financial Statements | EquityConcentrations of Credit Risk |
The following table displays changes in accumulated other comprehensive income, net of tax. |
| | | | | | | | | | | | | | | | | | | | | | | | | | | | | | | | | | | | | | | | | | | | | | | |
| | For the Three Months Ended September 30, | | For the Nine Months Ended September 30, |
| | 2018 | | 2017 | | 2018 | | 2017 |
| | AFS(1) | | Other | | Total | | AFS(1) | | Other | | Total | | AFS(1) | | Other | | Total | | AFS(1) | | Other | | Total |
| | (Dollars in millions)
|
| Beginning balance | $ | 304 |
| | $ | 45 |
| | $ | 349 |
| | $ | 643 |
| | $ | 39 |
| | $ | 682 |
| | $ | 510 |
| | $ | 43 |
| | $ | 553 |
| | $ | 716 |
| | $ | 43 |
| | $ | 759 |
|
Reclassification of accumulated other comprehensive income to retained earnings resulting from the enactment of the Tax Cuts and Jobs Act(2) | — |
| | — |
| | — |
| | — |
| | — |
| | — |
| | 110 |
| | 7 |
| | 117 |
| | — |
| | — |
| | — |
|
| Other comprehensive income (loss) before reclassifications | (31 | ) | | — |
| | (31 | ) | | 47 |
| | — |
| | 47 |
| | (84 | ) | | — |
| | (84 | ) | | 67 |
| | — |
| | 67 |
|
| Amounts reclassified from other comprehensive income (loss) | (2 | ) | | (3 | ) | | (5 | ) | | (20 | ) | | (2 | ) | | (22 | ) | | (265 | ) | | (8 | ) | | (273 | ) | | (113 | ) | | (6 | ) | | (119 | ) |
| Net other comprehensive income (loss) | (33 | ) | | (3 | ) | | (36 | ) | | 27 |
| | (2 | ) | | 25 |
| | (349 | ) | | (8 | ) | | (357 | ) | | (46 | ) | | (6 | ) | | (52 | ) |
| Ending balance | $ | 271 |
| | $ | 42 |
| | $ | 313 |
| | $ | 670 |
| | $ | 37 |
| | $ | 707 |
| | $ | 271 |
| | $ | 42 |
| | $ | 313 |
| | $ | 670 |
| | $ | 37 |
| | $ | 707 |
|
__________
| |
(1)
| The amounts reclassified from accumulated other comprehensive income represent the gain or loss recognized in earnings due to a sale of an AFS security or the recognition of a net impairment recognized in earnings, which are recorded in “Investment gains, net” in our condensed consolidated statements of operations and comprehensive income. |
| |
(2)
| Reclassification from accumulated other comprehensive income to retained earnings of the tax effects resulting from the enactment of tax legislation on December 22, 2017 that reduced the federal corporate income tax rate from 35% to 21% effective January 1, 2018. This amount is not included in net other comprehensive income (loss) for the three or nine months ended September 30, 2018. |
11.10. Concentrations of Credit Risk
Risk Characteristics of our Guaranty Book of Business
One of the key measures by which we gauge our performance risk under our guaranty is the delinquency status of the mortgage loans we hold in our retained mortgage portfolio, or in the caseguaranty book of mortgage-backed securities, the mortgage loans underlying the related securities.
For single-family loans, management monitors the serious delinquency rate, which is the percentage of single-family loans, based on number of loans, that are 90 days or more past due or in the foreclosure process, and loans that have higher risk characteristics, such as high mark-to-market LTV ratios.
For multifamily loans, management monitors the serious delinquency rate, which is the percentage of multifamily loans, based on unpaid principal balance, that are 60 days or more past due, and other loans that have higher risk characteristics, to determine our overall credit quality indicator. Higher risk characteristics include, but are not limited to, current debt service coverage ratio (“DSCR”) below 1.0 and high original LTV ratios. We stratify multifamily loans into different internal risk categories based on the credit risk inherent in each individual loan.business.
For single-family and multifamily loans, we use this information, in conjunction with housing market and economic conditions, to structure our pricing and our eligibility and underwriting criteria to reflect the current risk of loans with these higher-risk characteristics, and in some cases we decide to significantly reduce our participation in riskier loan product categories. Management also uses this data together with other credit risk measures to identify key trends that guide the development of our loss mitigation strategies.
|
| | |
Fannie Mae (In conservatorship) Third Quarter 2018 Form 10-Q | 81 |
|
| | |
| Notes to Condensed Consolidated Financial Statements | Concentrations of Credit Risk |
The following tables display the delinquency status and serious delinquency rates for specified loan categories of our single-family conventional and total multifamily guaranty book of business.
| | | | As of | As of |
| | September 30, 2018(1) | | December 31, 2017(1) | September 30, 2019(1) | | December 31, 2018(1) |
| | 30 Days Delinquent | | 60 Days Delinquent | | Seriously Delinquent(2) | | 30 Days Delinquent | | 60 Days Delinquent | | Seriously Delinquent(2) | 30 Days Delinquent | | 60 Days Delinquent | | Seriously Delinquent(2) | | 30 Days Delinquent | | 60 Days Delinquent | | Seriously Delinquent(2) |
Percentage of single-family conventional guaranty book of business(3) | 1.30 | % | | 0.32 | % | | 0.75 | % | | 1.42 | % | | 0.43 | % | | 1.15 | % | 1.11 | % | | 0.29 | % | | 0.61 | % | | 1.17 | % | | 0.32 | % | | 0.69 | % |
Percentage of single-family conventional loans(4) | 1.52 |
| | 0.37 |
| | 0.82 |
| | 1.63 |
| | 0.50 |
| | 1.24 |
| 1.28 |
| | 0.35 |
| | 0.68 |
| | 1.37 |
| | 0.38 |
| | 0.76 |
|
| | | | As of | As of |
| | September 30, 2018(1) | | December 31, 2017(1) | September 30, 2019(1) | | December 31, 2018(1) |
| | Percentage of Single-Family Conventional Guaranty Book of Business(3) | | Seriously Delinquent Rate(2) | | Percentage of Single-Family Conventional Guaranty Book of Business(3) | | Seriously Delinquent Rate(2) | Percentage of Single-Family Conventional Guaranty Book of Business(3) | | Seriously Delinquent Rate(2) | | Percentage of Single-Family Conventional Guaranty Book of Business(3) | | Seriously Delinquent Rate(2) |
| Estimated mark-to-market LTV ratio: | | | | | | | | | | | |
| Greater than 100% | 1 | % | | 10.65 | % | | 1 | % | | 11.70 | % | * | | 10.62 | % | | * | | 9.85 | % |
| Geographical distribution: | | | | | | | | | | | |
| California | 19 |
| | 0.34 |
| | 19 |
| | 0.42 |
| 19 | | 0.32 |
| | 19 | | 0.34 |
|
| Florida | 6 |
| | 1.51 |
| | 6 |
| | 3.71 |
| 6 | | 0.87 |
| | 6 | | 1.16 |
|
| New Jersey | 4 |
| | 1.51 |
| | 4 |
| | 2.15 |
| 3 | | 1.21 |
| | 4 | | 1.38 |
|
| New York | 5 |
| | 1.55 |
| | 5 |
| | 2.02 |
| 5 | | 1.24 |
| | 5 | | 1.40 |
|
| All other states | 66 |
| | 0.77 |
| | 66 |
| | 1.09 |
| 67 | | 0.67 |
| | 66 | | 0.75 |
|
| Product distribution: | | | | | | | | | | | |
| Alt-A | 2 |
| | 3.68 |
| | 2 |
| | 4.95 |
| 2 | | 3.09 |
| | 2 | | 3.35 |
|
| Vintages: | | | | | | | | | | | |
| 2004 and prior | 3 |
| | 2.77 |
| | 4 |
| | 3.28 |
| 2 | | 2.53 |
| | 3 | | 2.69 |
|
| 2005-2008 | 5 |
| | 4.90 |
| | 6 |
| | 6.55 |
| 4 | | 4.24 |
| | 5 | | 4.61 |
|
| 2009-2018 | 92 |
| | 0.34 |
| | 90 |
| | 0.53 |
| |
| 2009-2019 | | 94 | | 0.33 |
| | 92 | | 0.34 |
|
__________
| |
| * | Represents less than 0.5% of single-family conventional business volume or book of business. |
| |
(1) | Consists of the portion of our single-family conventional guaranty book of business for which we have detailed loan levelloan-level information, which constituted approximatelymore than 99% of our total single-family conventional guaranty book of business as of September 30, 20182019 and December 31, 2017.2018. |
| |
(2) | Consists of single-family conventional loans that were 90 days or more past due or in the foreclosure process as of September 30, 2018 and2019 or December 31, 2017.2018. |
|
| | |
| Fannie Mae (In conservatorship) Third Quarter 2019 Form 10-Q | 84 |
|
| | |
| Notes to Condensed Consolidated Financial Statements | Concentrations of Credit Risk |
| |
(3) | Calculated based on the aggregate unpaid principal balance of single-family conventional loans for each category divided by the aggregate unpaid principal balance of loans in our single-family conventional guaranty book of business. |
| |
(4) | Calculated based on the number of single-family conventional loans that were delinquent divided by the total number of loans in our single-family conventional guaranty book of business. |
|
| | |
Fannie Mae (In conservatorship) Third Quarter 2018 Form 10-Q | 82 |
|
| | |
| Notes to Condensed Consolidated Financial Statements | Concentrations of Credit Risk |
For multifamily loans, management monitors the serious delinquency rate, which is the percentage of multifamily loans, based on unpaid principal balance, that are 60 days or more past due, and other loans that have higher risk characteristics, to determine our overall credit quality indicator. Higher risk characteristics include, but are not limited to, current debt service coverage ratio (“DSCR”) below 1.0 and original LTV ratios greater than 80%. We stratify multifamily loans into different internal risk categories based on the credit risk inherent in each individual loan.
|
| | | | | | | | | | | |
| | As of |
| | September 30, 2018 (1)(2) | | December 31, 2017(1)(2) |
| | 30 Days Delinquent | | Seriously Delinquent(3) | | 30 Days Delinquent | | Seriously Delinquent(3) |
| Percentage of multifamily guaranty book of business | 0.01 | % | | 0.07 | % | | 0.03 | % | | 0.11 | % |
|
| | | | | | | | | | |
| | As of |
| | September 30, 2019(1) | | December 31, 2018(1) |
| | 30 Days Delinquent | | Seriously Delinquent(2) | | 30 Days Delinquent | | Seriously Delinquent(2) |
| Percentage of multifamily guaranty book of business | * | | 0.06 | % | | 0.02 | % | | 0.06 | % |
|
| | | | | | | | | | | |
| | As of |
| | September 30, 2018 | | December 31, 2017 |
| | Percentage of Multifamily Guaranty Book of Business(2) | | Percentage Seriously Delinquent(3)(4) | | Percentage of Multifamily Guaranty Book of Business(2) | | Percentage Seriously Delinquent(3)(4) |
| Original LTV ratio: | | | | | | | |
| Greater than 80% | 1 | % | | 0.19 | % | | 2 | % | | 0.21 | % |
| Less than or equal to 80% | 99 |
| | 0.06 |
| | 98 |
| | 0.11 |
|
Current DSCR below 1.0(5) | 2 |
| | 1.76 |
| | 2 |
| | 1.96 |
|
__________ |
| | | | | | | | | | | |
| | As of |
| | September 30, 2019 | | December 31, 2018 |
| | Percentage of Multifamily Guaranty Book of Business(1) | | Percentage Seriously Delinquent(2)(3) | | Percentage of Multifamily Guaranty Book of Business(1) | | Percentage Seriously Delinquent(2)(3) |
| Original LTV ratio: | | | | | | | |
| Greater than 80% | 1 | % | | — | % | | 1 | % | | — | % |
| Less than or equal to 80% | 99 |
| | 0.06 |
| | 99 |
| | 0.06 |
|
Current DSCR below 1.0(4) | 2 |
| | 0.44 |
| | 2 |
| | 1.38 |
|
| |
(1)
* | ConsistsRepresents less than 0.01% of the portion of our multifamily guarantybusiness volume or book of business for which we have detailed loan level information, which constituted approximately 99% of our total multifamily guaranty book of business as of September 30, 2018 and December 31, 2017, excluding loans that have been defeased.
business. |
| |
(2)(1)
| Calculated based on the aggregate unpaid principal balance of multifamily loans for each category divided by the aggregate unpaid principal balance of loans in our multifamily guaranty book of business. |
| |
(3)(2)
| Consists of multifamily loans that were 60 days or more past due as of the dates indicated. |
| |
(4)(3)
| Calculated based on the unpaid principal balance of multifamily loans that were seriously delinquent divided by the aggregate unpaid principal balance of multifamily loans for each category included in our multifamily guaranty book of business. |
| |
(5)(4)
| Our estimates of current DSCRs are based on the latest available income information for these properties. Although we use the most recently available results of our multifamily borrowers, there is a lag in reporting, which typically can range from 3 to 6 months but in some cases may be longer. |
Other Concentrations
Mortgage Insurers. Mortgage insurance “risk in force” refers to our maximum potential loss recovery under the applicable mortgage insurance policies in force and is generally based on the loan levelloan-level insurance coverage percentage and, if applicable, any aggregate pool loss limit, as specified in the policy.
The following table displays our total mortgage insurance risk in force by primary and pool insurance, as well as the total risk in force mortgage insurance coverage as a percentage of the single-family guaranty book of business.
| | | | As of | | As of |
| | September 30, 2018 | | December 31, 2017 | | September 30, 2019 | | December 31, 2018 |
| | Risk in Force | | Percentage of Single-Family Guaranty Book of Business | | Risk in Force | | Percentage of Single-Family Guaranty Book of Business | | Risk in Force | | Percentage of Single-Family Guaranty Book of Business | | Risk in Force | | Percentage of Single-Family Guaranty Book of Business |
| | (Dollars in millions) | | (Dollars in millions) |
| Mortgage insurance risk in force: | | | | | | | | | |
| Primary mortgage insurance | $ | 148,893 |
| | $ | 137,941 |
| | | $ | 162,339 |
| | $ | 152,379 |
| |
| Pool mortgage insurance | 419 |
| | 519 |
| | | 379 |
| | 409 |
| |
| Total mortgage insurance risk in force | $ | 149,312 |
| | 5% | | $ | 138,460 |
| | 5% | | $ | 162,718 |
| | 6% | | $ | 152,788 |
| | 5% |
|
| | |
Fannie Mae (In conservatorship) Third Quarter 20182019 Form 10-Q | 8385 |
|
| | |
| | Notes to Condensed Consolidated Financial Statements | Concentrations of Credit Risk |
The table below displays our mortgage insurer counterparties that provided approximately 10% or more of the risk in force mortgage insurance coverage on the single-familymortgage loans in our single-family guaranty book of business.
|
| | | | | |
| | Percentage of Total Risk in Force Mortgage Insurance Coverage |
| | As of |
| | September 30, 2018 | | December 31, 2017 |
Counterparty:(1) | |
| Arch Capital Group Ltd. | 25 | % | | 25 | % |
| Radian Guaranty, Inc. | 21 |
| | 21 |
|
| Mortgage Guaranty Insurance Corp. | 18 |
| | 19 |
|
| Genworth Mortgage Insurance Corp. | 15 |
| | 15 |
|
| Essent Guaranty, Inc. | 12 |
| | 11 |
|
| Others | 9 |
| | 9 |
|
| Total | 100 | % | | 100 | % |
__________ |
| | | | | | |
| | | Percentage of Risk in Force Coverage by Mortgage Insurer |
| | | As of |
| | | September 30, 2019 | | December 31, 2018 |
Counterparty:(1) | | |
| Arch Capital Group Ltd. | | 24 | % | | 25 | % |
| Radian Guaranty, Inc. | | 20 |
| | 21 |
|
| Mortgage Guaranty Insurance Corp. | | 18 |
| | 18 |
|
Genworth Mortgage Insurance Corp.(2) | | 15 |
| | 15 |
|
| Essent Guaranty, Inc. | | 13 |
| | 12 |
|
| Others | | 10 |
| | 9 |
|
| Total | | 100 | % | | 100 | % |
| |
(1) | Insurance coverage amounts provided for each counterparty may include coverage provided by affiliates and subsidiaries of the counterparty. |
| |
(2) | Genworth Financial, Inc., the ultimate parent company of Genworth Mortgage Insurance Corp., is in the process of being acquired by China Oceanwide Holdings Group Co., Ltd. We have approved the acquisition subject to specified conditions, including Genworth Financial, Inc. receiving all required and outstanding regulatory approvals. Upon acquisition, Genworth Mortgage Insurance Corp. will continue to be subject to our ongoing review of financial and operational eligibility requirements. |
Three of our mortgage insurer counterparties that are currently not approved to write new business are in run-off: PMI Mortgage Insurance Co. (“PMI”), Triad Guaranty Insurance Corporation (“Triad”) and Republic Mortgage Insurance Company (”RMIC”). Entering run-off may close off a source of profits and liquidity that may have otherwise assisted a mortgage insurer in paying claims under insurance policies, and could also cause the quality and speed of its claims processing to deteriorate. These three mortgage insurers provided a combined $5.0$3.7 billion, or 3%2%, of our risk in force mortgage insurance coverage of our single-family guaranty book of business as of September 30, 2018.2019.
PMI and Triad have been paying only a portion of policyholder claims and deferring the remaining portion. PMI is currently paying 72.5%74.5% of claims under its mortgage insurance policies in cash and is deferring the remaining 27.5%25.5%, and Triad is currently paying 75% of claims in cash and deferring the remaining 25%. It is uncertain whether PMI or Triad will be permitted in the future to pay any remaining deferred policyholder claims and/or increase or decrease the amount of cash they pay on claims. RMIC is no longer deferring payments on policyholder claims and has paid us its previously outstanding deferred payment obligations as well as interest on those obligations; however, RMIC remains in run-off.
We have counterparty credit risk relating to the potential insolvency of, or non-performance by, mortgage insurers that insure single-family loans we purchase or guarantee. There is risk that these counterparties may fail to fulfill their obligations to pay our claims under insurance policies. On at least a quarterly basis, we assess our mortgage insurer counterparties’ respective abilities to fulfill their obligations to us. Our assessment includes financial reviews and analyses of the insurers’ portfolios and capital adequacy. If we determine that it is probable that we will not collect all of our claims from one or more of our mortgage insurer counterparties, it could increase our loss reserves, which could adversely affect our results of operations, liquidity, financial condition and net worth.
When we estimate the credit losses that are inherent in our mortgage loans and under the terms of our guaranty obligations, we also consider the recoveries that we will receive on primary mortgage insurance, as mortgage insurance recoveries would reduce the severity of the loss associated with defaulted loans. We evaluate the financial condition of our mortgage insurer counterparties and adjust the contractually due recovery amounts to ensure that only probable losses as of the balance sheet date are included in our loss reserve estimate. As a result, if our assessment of one or more of our mortgage insurer counterparties’ ability to fulfill their respective obligations to us worsens, it could increase our loss reserves. As of September 30, 20182019 and December 31, 2017, the amount by which2018, our estimated benefit from mortgage insurance reduced our loss reserves was $710by $398 million and $989$691 million, respectively.
|
| | |
Fannie Mae (In conservatorship) Third Quarter 2018 Form 10-Q | 84 |
|
| | |
| Notes to Condensed Consolidated Financial Statements | Concentrations of Credit Risk |
WeAs of September 30, 2019 and December 31, 2018, we had outstanding receivables of $768$669 million and $745 million, respectively, recorded in “Other assets” in our condensed consolidated balance sheets as of September 30, 2018 and $858 million as of December 31, 2017 related to amounts claimed on insured, defaulted loans excluding government-insured loans. Of this amount, $42 million asAs of September 30, 20182019 and $75 million as of December 31, 2017 was due from our mortgage servicers or sellers. We2018, we assessed the totalthese outstanding receivables for collectibility, and they are recorded net ofestablished a valuation allowance of $567$545 million as of September 30, 2018 and $593$564 million, as of December 31, 2017. The valuation allowancerespectively, which reduces our claim receivable to the amount considered probable of collection as of September 30, 2018 and December 31, 2017.collection.
Mortgage Servicers and Sellers. Mortgage servicers collect mortgage and escrow payments from borrowers, pay taxes and insurance costs from escrow accounts, monitor and report delinquencies, and perform other required activities on our behalf. Our mortgage servicers and sellers may also be obligated to repurchase loans or foreclosed properties, reimburse us for losses or provide other remedies under certain circumstances, such as if it is determined that the mortgage loan did not meet
|
| | |
| Fannie Mae (In conservatorship) Third Quarter 2019 Form 10-Q | 86 |
|
| | |
| Notes to Condensed Consolidated Financial Statements | Concentrations of Credit Risk |
our underwriting or eligibility requirements, if certain loan representations and warranties are violated or if mortgage insurers rescind coverage. However, under our revisedOur representation and warranty framework we no longerdoes not require repurchase for loans that have breaches of certain selling representations and warranties if they have met specified criteria for relief.
Our business with mortgage servicers is concentrated. The table below displays the percentage of our single-family guaranty book of business serviced by our top five depository single-family mortgage servicers and top five non-depository single-family mortgage servicers, and identifies one servicer that serviced more than 10% of our single-family guaranty book of business based on unpaid principal balance.
| | | | Percentage of Single-Family Guaranty Book of Business | | Percentage of Single-Family Guaranty Book of Business |
| | As of | | As of |
| | September 30, 2018 | | December 31, 2017 | | September 30, 2019 | | December 31, 2018 |
| Wells Fargo Bank, N.A. (together with its affiliates) | 18 | % | | 18 | % | | 17 | % | | 18 | % |
| Remaining top five depository servicers | 16 |
| | 17 |
| | 15 |
| | 16 |
|
| Top five non-depository servicers | 21 |
| | 20 |
| | 25 |
| | 22 |
|
| Total | 55 | % | | 55 | % | | 57 | % | | 56 | % |
There was an increase in the portion of our single-family guaranty book serviced by our top five non-depository servicers, particularly for our delinquent single-family loans. Compared with depository financial institutions, these institutions pose additional risks to us because they may not have the same financial strength or operational capacity, or be subject to the same level of regulatory oversight, as our largest mortgage servicer counterparties, which are mostly depository institutions.
The table below displays the percentage of our multifamily guaranty book of business serviced by our top five multifamily mortgage servicers, and identifies two servicers that serviced 10% or more of our multifamily guaranty book of business based on unpaid principal balance.
| | | | Percentage of Multifamily Guaranty Book of Business | | Percentage of Multifamily Guaranty Book of Business |
| | As of | | As of |
| | September 30, 2018 | | December 31, 2017 | | September 30, 2019 | | December 31, 2018 |
| Wells Fargo Bank, N.A. (together with its affiliates) | 14 | % | | 14 | % | | 13 | % | | 14 | % |
| Walker & Dunlop, LLC | 12 |
| | 12 |
| |
| Walker & Dunlop, Inc. | | | 12 |
| | 12 |
|
| Remaining top five servicers | 22 |
| | 22 |
| | 23 |
| | 22 |
|
| Total | 48 | % | | 48 | % | | 48 | % | | 48 | % |
If a significant mortgage servicer or seller counterparty, or a number of mortgage servicers or sellers, fails to meet their obligations to us, it could adversely affect our results of operations and financial condition. We mitigate these risks in several ways, including:
establishing minimum standards and financial requirements for our servicers;
monitoring financial and portfolio performance as compared with peers and internal benchmarks; and
for our largest mortgage servicers, conducting periodic on-site and financial reviews to confirm compliance with servicing guidelines and servicing performance expectations.
We may take one or more of the following actions to mitigate our credit exposure to mortgage servicers that present a higher risk:
require a guaranty of obligations by higher-rated entities;
transfer exposure to third parties;
require collateral;
establish more stringent financial requirements;
work on-site with underperforming major servicers to improve operational processes; and
suspend or terminate the selling and servicing relationship if deemed necessary.
Derivative Counterparties. For information on credit risk associated with our derivative transactions and repurchase agreements see “Note 8, Derivative Instruments” and “Note 12,11, Netting Arrangements.”
|
| | |
Fannie Mae (In conservatorship) Third Quarter 20182019 Form 10-Q | 8587 |
|
| | |
| | Notes to Condensed Consolidated Financial Statements | Netting Arrangements |
12.11. Netting Arrangements
We use master netting arrangements, which allow us to offset certain financial instruments and collateral with the same counterparty, to minimize counterparty credit exposure. The tables below display information related to derivatives, securities purchased under agreements to resell or similar arrangements, and securities sold under agreements to repurchase or similar arrangements, which are subject to an enforceable master netting arrangement or similar agreement that are either offset or not offset in our condensed consolidated balance sheets.
| | | | As of September 30, 2018 | | As of September 30, 2019 |
| | | | Gross Amount Offset (1) | | Net Amount Presented in our Condensed Consolidated Balance Sheets | | Amounts Not Offset in our Condensed Consolidated Balance Sheets | | | | | | Gross Amount Offset(1) | | Net Amount Presented in our Condensed Consolidated Balance Sheets | | Amounts Not Offset in our Condensed Consolidated Balance Sheets | | |
| | Gross Amount | | Financial Instruments(2) | | Collateral(3) | | Net Amount | | Gross Amount | | Financial Instruments(2) | | Collateral(3) | | Net Amount |
| | (Dollars in millions) | | (Dollars in millions) |
| Assets: | | | | | | | | | | | | | | | | | | | | | | | |
| OTC risk management derivatives | $ | 2,822 |
| | $ | (2,790 | ) | | $ | 32 |
| | $ | — |
| | $ | — |
| | $ | 32 |
| | $ | 1,672 |
| | $ | (1,667 | ) | | $ | 5 |
| | $ | — |
| | $ | — |
| | $ | 5 |
|
| Cleared risk management derivatives | — |
| | 15 |
| | 15 |
| | — |
| | — |
| | 15 |
| | — |
| | 4 |
| | 4 |
| | — |
| | — |
| | 4 |
|
| Mortgage commitment derivatives | 288 |
| | — |
| | 288 |
| | (104 | ) | | (7 | ) | | 177 |
| | 421 |
| | — |
| | 421 |
| | (368 | ) | | (7 | ) | | 46 |
|
| Total derivative assets | 3,110 |
| | (2,775 | ) | | 335 |
| (4) | | (104 | ) | | (7 | ) | | 224 |
| | 2,093 |
| | (1,663 | ) | | 430 |
| (4) | | (368 | ) | | (7 | ) | | 55 |
|
Securities purchased under agreements to resell or similar arrangements(5) | 44,648 |
| | — |
| | 44,648 |
| | — |
| | (44,648 | ) | | — |
| | 36,051 |
| | — |
| | 36,051 |
| | — |
| | (36,051 | ) | | — |
|
| Total assets | $ | 47,758 |
| | $ | (2,775 | ) | | $ | 44,983 |
| | $ | (104 | ) | | $ | (44,655 | ) | | $ | 224 |
| | $ | 38,144 |
| | $ | (1,663 | ) | | $ | 36,481 |
| | $ | (368 | ) | | $ | (36,058 | ) | | $ | 55 |
|
| Liabilities: | | | | | | | | | | | | | | | | | | | | | | | |
| OTC risk management derivatives | $ | (2,711 | ) | | $ | 2,649 |
| | $ | (62 | ) | | $ | — |
| | $ | — |
| | $ | (62 | ) | | $ | (2,451 | ) | | $ | 2,332 |
| | $ | (119 | ) | | $ | — |
| | $ | — |
| | $ | (119 | ) |
| Cleared risk management derivatives | — |
| | (1 | ) | | (1 | ) | | — |
| | 1 |
| | — |
| | — |
| | (33 | ) | | (33 | ) | | — |
| | 33 |
| | — |
|
| Mortgage commitment derivatives | (212 | ) | | — |
| | (212 | ) | | 104 |
| | — |
| | (108 | ) | | (416 | ) | | — |
| | (416 | ) | | 368 |
| | 4 |
| | (44 | ) |
| Total derivative liabilities | (2,923 | ) | | 2,648 |
| | (275 | ) | (4) | | 104 |
| | 1 |
| | (170 | ) | | (2,867 | ) | | 2,299 |
| | (568 | ) | (4) | | 368 |
| | 37 |
| | (163 | ) |
| Securities sold under agreements to repurchase or similar arrangements | (749 | ) | | — |
| | (749 | ) | | — |
| | 746 |
| | (3 | ) | | (1,125 | ) | | — |
| | (1,125 | ) | | — |
| | 1,123 |
| | (2 | ) |
| Total liabilities | $ | (3,672 | ) | | $ | 2,648 |
| | $ | (1,024 | ) | | $ | 104 |
| | $ | 747 |
| | $ | (173 | ) | | $ | (3,992 | ) | | $ | 2,299 |
| | $ | (1,693 | ) | | $ | 368 |
| | $ | 1,160 |
| | $ | (165 | ) |
| | | | As of December 31, 2017 | | As of December 31, 2018 |
| | | | Gross Amount Offset (1) | | Net Amount Presented in our Condensed Consolidated Balance Sheets | | Amounts Not Offset in our Condensed Consolidated Balance Sheets | | | | | | Gross Amount Offset(1) | | Net Amount Presented in our Condensed Consolidated Balance Sheets | | Amounts Not Offset in our Condensed Consolidated Balance Sheets | | |
| | Gross Amount | | Financial Instruments(2) | | Collateral(3) | | Net Amount | | Gross Amount | | Financial Instruments(2) | | Collateral(3) | | Net Amount |
| | (Dollars in millions) | | (Dollars in millions) |
| Assets: | | | | | | | | | | | | | | | | | | | | | | | |
| OTC risk management derivatives | $ | 2,479 |
| | $ | (2,464 | ) | | $ | 15 |
| | $ | — |
| | $ | — |
| | $ | 15 |
| | $ | 2,288 |
| | $ | (2,273 | ) | | $ | 15 |
| | $ | — |
| | $ | — |
| | $ | 15 |
|
| Cleared risk management derivatives | 1,811 |
| | (1,808 | ) | | 3 |
| | — |
| | — |
| | 3 |
| | — |
| | 7 |
| | 7 |
| | — |
| | — |
| | 7 |
|
| Mortgage commitment derivatives | 132 |
| | — |
| | 132 |
| | (117 | ) | | (1 | ) | | 14 |
| | 379 |
| | — |
| | 379 |
| | (153 | ) | | (7 | ) | | 219 |
|
| Total derivative assets | 4,422 |
| | (4,272 | ) | | 150 |
| (4) | | (117 | ) | | (1 | ) | | 32 |
| | 2,667 |
| | (2,266 | ) | | 401 |
| (4) | | (153 | ) | | (7 | ) | | 241 |
|
Securities purchased under agreements to resell or similar arrangements(5) | 44,670 |
| | — |
| | 44,670 |
| | — |
| | (44,670 | ) | | — |
| | 48,288 |
| | — |
| | 48,288 |
| | — |
| | (48,288 | ) | | — |
|
| Total assets | $ | 49,092 |
| | $ | (4,272 | ) | | $ | 44,820 |
| | $ | (117 | ) | | $ | (44,671 | ) | | $ | 32 |
| | $ | 50,955 |
| | $ | (2,266 | ) | | $ | 48,689 |
| | $ | (153 | ) | | $ | (48,295 | ) | | $ | 241 |
|
| Liabilities: | | | | | | | | | | | | | | | | | | | | | | | |
| OTC risk management derivatives | $ | (3,045 | ) | | $ | 2,957 |
| | $ | (88 | ) | | $ | — |
| | $ | — |
| | $ | (88 | ) | | $ | (2,433 | ) | | $ | 2,342 |
| | $ | (91 | ) | | $ | — |
| | $ | — |
| | $ | (91 | ) |
| Cleared risk management derivatives | (2,033 | ) | | 2,022 |
| | (11 | ) | | — |
| | 11 |
| | — |
| | — |
| | (27 | ) | | (27 | ) | | — |
| | 23 |
| | (4 | ) |
| Mortgage commitment derivatives | (228 | ) | | — |
| | (228 | ) | | 117 |
| | 93 |
| | (18 | ) | | (648 | ) | | — |
| | (648 | ) | | 153 |
| | 466 |
| | (29 | ) |
| Total derivative liabilities | (5,306 | ) | | 4,979 |
| | (327 | ) | (4) | | 117 |
| | 104 |
| | (106 | ) | | (3,081 | ) | | 2,315 |
| | (766 | ) | (4) | | 153 |
| | 489 |
| | (124 | ) |
| Total liabilities | $ | (5,306 | ) | | $ | 4,979 |
| | $ | (327 | ) | | $ | 117 |
| | $ | 104 |
| | $ | (106 | ) | | $ | (3,081 | ) | | $ | 2,315 |
| | $ | (766 | ) | | $ | 153 |
| | $ | 489 |
| | $ | (124 | ) |
|
| | |
Fannie Mae (In conservatorship) Third Quarter 20182019 Form 10-Q | 8688 |
|
| | |
| | Notes to Condensed Consolidated Financial Statements | Netting Arrangements |
__________
| |
(1) | Represents the effect of the right to offset under legally enforceable master netting arrangements to settle with the same counterparty on a net basis, including cash collateral posted and received and accrued interest. |
| |
(2) | Mortgage commitment derivative amounts reflect where we have recognized both an asset and a liability with the same counterparty under an enforceable master netting arrangement but we have not elected to offset the related amounts in our condensed consolidated balance sheets. |
| |
(3) | Represents collateral received or posted that has not been recognized and is not offset in our condensed consolidated balance sheets. Doessheets as well as collateral posted which has been recognized but not include collateral held or postedoffset in excess of our exposure.condensed consolidated balance sheets. The fair value of non-cash collateral we pledged was $2.7$3.1 billion and $747 million$1.9 billion as of September 30, 20182019 and December 31, 2017,2018, respectively, which the counterparty was permitted to sell or repledge. The fair value of non-cash collateral received was $45.3$36.1 billion and $44.7$48.4 billion, of which $42.5$34.3 billion and $45.7 billion could be sold or repledged as of September 30, 20182019 and December 31, 2017,2018, respectively. NoneNaN of the underlying collateral was sold or repledged as of September 30, 20182019 or December 31, 2017.2018. |
| |
(4) | Excludes derivative assets of $18$42 million and $21$57 million as of September 30, 20182019 and December 31, 2017,2018, respectively, and derivative liabilities of $1$27 million as of September 30, 2018 and December 31, 2017,$11 million recognized in our condensed consolidated balance sheets as of September 30, 2019 and December 31, 2018, respectively, that are not subject to enforceable master netting arrangements. |
| |
(5) | Includes $18.1$12.9 billion and $25.2$15.4 billion in securities purchased under agreements to resell classified as “Cash and cash equivalents” in our condensed consolidated balance sheets as of September 30, 20182019 and December 31, 2017,2018, respectively. |
Derivative instruments are recorded at fair value and securities purchased under agreements to resell or similar arrangements are recorded at amortized cost in our condensed consolidated balance sheets. For how we determine our rights to offset the assets and liabilities presented above with the same counterparty, including collateral posted or received, see “Note 14, Netting Arrangements” in our 20172018 Form 10-K.
13.12. Fair Value
We use fair value measurements for the initial recording of certain assets and liabilities and periodic remeasurement of certain assets and liabilities on a recurring or nonrecurring basis.
Fair Value Measurement
Fair value measurement guidance defines fair value, establishes a framework for measuring fair value, and sets forth disclosures around fair value measurements. This guidance applies whenever other accounting guidance requires or permits assets or liabilities to be measured at fair value. The guidance establishes a three-level fair value hierarchy that prioritizes the inputs into the valuation techniques used to measure fair value. The fair value hierarchy gives the highest priority, Level 1, to measurements based on unadjusted quoted prices in active markets for identical assets or liabilities. The next highest priority, Level 2, is given to measurements of assets and liabilities based on limited observable inputs or observable inputs for similar assets and liabilities. The lowest priority, Level 3, is given to measurements based on unobservable inputs.
|
| | |
Fannie Mae (In conservatorship) Third Quarter 2018 Form 10-Q | 87 |
|
| | |
| Notes to Condensed Consolidated Financial Statements | Fair Value |
Recurring Changes in Fair Value
The following tables display our assets and liabilities measured in our condensed consolidated balance sheets at fair value on a recurring basis subsequent to initial recognition, including instruments for which we have elected the fair value option.
| | | | Fair Value Measurements as of September 30, 2018 | Fair Value Measurements as of September 30, 2019 |
| | Quoted Prices in Active Markets for Identical Assets (Level 1) | | Significant Other Observable Inputs (Level 2) | | Significant Unobservable Inputs (Level 3) | | Netting Adjustment(1) | | Estimated Fair Value | Quoted Prices in Active Markets for Identical Assets (Level 1) | | Significant Other Observable Inputs (Level 2) | | Significant Unobservable Inputs (Level 3) | | Netting Adjustment(1) | | Estimated Fair Value |
| | (Dollars in millions) | (Dollars in millions) |
| Recurring fair value measurements: | | | | | | | | | | | | | | | | | | | | | | |
| Assets: | | | | | | | | | | | | | | | | | | | | | | |
Cash equivalents(2) | | $ | 249 |
| | $ | — |
| | $ | — |
| | $ | — |
| | $ | 249 |
| | |
| Trading securities: | | | | | | | | | | | | | | | | | | | | | | |
| Mortgage-related securities: | | | | | | | | | | | | | | | | | | | | | | |
| Fannie Mae | | — |
| | 1,393 |
| | 76 |
| | — |
| | 1,469 |
| | | $ | — |
| | $ | 3,539 |
| | $ | 122 |
| | $ | — |
| | $ | 3,661 |
| |
| Other agency | | — |
| | 3,642 |
| | — |
| | — |
| | 3,642 |
| | | — |
| | 3,702 |
| | 2 |
| | — |
| | 3,704 |
| |
| Alt-A and subprime private-label securities | | — |
| | 1,367 |
| | — |
| | — |
| | 1,367 |
| | |
| Mortgage revenue bonds | | — |
| | — |
| | 1 |
| | — |
| | 1 |
| | |
| Private-label and other mortgage securities | | | — |
| | 741 |
| | — |
| | — |
| | 741 |
| |
| Non-mortgage-related securities: | | | | | | | | | | | | | | | | | | | | | | |
| U.S. Treasury securities | | 37,328 |
| | — |
| | — |
| | — |
| | 37,328 |
| | | 36,016 |
| | — |
| | — |
| | — |
| | 36,016 |
| |
| Other securities | | — |
| | 94 |
| | — |
| | — |
| | 94 |
| | | — |
| | 84 |
| | — |
| | — |
| | 84 |
| |
| Total trading securities | | 37,328 |
| | 6,496 |
| | 77 |
| | — |
| | 43,901 |
| | | 36,016 |
| | 8,066 |
| | 124 |
| | — |
| | 44,206 |
| |
| Available-for-sale securities: | | | | | | | | | | | | | | | | | | | | | | |
| Mortgage-related securities: | | | | | | | | | | | | | | | | | | | | | | |
| Fannie Mae | | — |
| | 1,628 |
| | 200 |
| | — |
| | 1,828 |
| | | — |
| | 1,408 |
| | 174 |
| | — |
| | 1,582 |
| |
| Other agency | | — |
| | 272 |
| | — |
| | — |
| | 272 |
| | | — |
| | 213 |
| | — |
| | — |
| | 213 |
| |
| Alt-A and subprime private-label securities | | — |
| | 593 |
| | 24 |
| | — |
| | 617 |
| | | — |
| | 226 |
| | — |
| | — |
| | 226 |
| |
| Mortgage revenue bonds | | — |
| | — |
| | 464 |
| | — |
| | 464 |
| | | — |
| | — |
| | 346 |
| | — |
| | 346 |
| |
| Other | | — |
| | 8 |
| | 348 |
| | — |
| | 356 |
| | | — |
| | 8 |
| | 315 |
| | — |
| | 323 |
| |
| Total available-for-sale securities | | — |
| | 2,501 |
| | 1,036 |
| | — |
| | 3,537 |
| | | — |
| | 1,855 |
| | 835 |
| | — |
| | 2,690 |
| |
| Mortgage loans | | — |
| | 8,188 |
| | 965 |
| | — |
| | 9,153 |
| | | — |
| | 7,457 |
| | 726 |
| | — |
| | 8,183 |
| |
| Other assets: | | | | | | | | | | | | | | | | | | | | | | |
| Risk management derivatives: | | | | | | | | | | | | | | | | | | | | | | |
| Swaps | | — |
| | 2,389 |
| | 98 |
| | — |
| | 2,487 |
| | | — |
| | 1,267 |
| | 184 |
| | — |
| | 1,451 |
| |
| Swaptions | | — |
| | 335 |
| | — |
| | — |
| | 335 |
| | | — |
| | 221 |
| | — |
| | — |
| | 221 |
| |
| Other | | — |
| | — |
| | 18 |
| | — |
| | 18 |
| | |
| Netting adjustment | | — |
| | — |
| | — |
| | (2,775 | ) | | (2,775 | ) | | | — |
| | — |
| | — |
| | (1,663 | ) | | (1,663 | ) | |
| Mortgage commitment derivatives | | — |
| | 286 |
| | 2 |
| | — |
| | 288 |
| | | — |
| | 421 |
| | — |
| | — |
| | 421 |
| |
| Credit enhancement derivatives | | | — |
| | — |
| | 42 |
| | — |
| | 42 |
| |
| Total other assets | | — |
| | 3,010 |
| | 118 |
| | (2,775 | ) | | 353 |
| | | — |
| | 1,909 |
| | 226 |
| | (1,663 | ) | | 472 |
| |
| Total assets at fair value | | $ | 37,577 |
| | $ | 20,195 |
| | $ | 2,196 |
| | $ | (2,775 | ) | | $ | 57,193 |
| | | $ | 36,016 |
| | $ | 19,287 |
| | $ | 1,911 |
| | $ | (1,663 | ) | | $ | 55,551 |
| |
|
| | |
Fannie Mae (In conservatorship) Third Quarter 2018 Form 10-Q | 88 |
|
| | |
| Notes to Condensed Consolidated Financial Statements | Fair Value |
|
| | | | | | | | | | | | | | | | | | | | | | | | | | | | | |
| | Fair Value Measurements as of September 30, 2018 |
| | Quoted Prices in Active Markets for Identical Assets (Level 1) | | Significant Other Observable Inputs (Level 2) | | Significant Unobservable Inputs (Level 3) | | Netting Adjustment(1) | | Estimated Fair Value |
| | | (Dollars in millions) | |
| Liabilities: | | | | | | | | | | | | | | | | | | | |
| Long-term debt: | | | | | | | | | | | | | | | | | | | |
| Of Fannie Mae: | | | | | | | | | | | | | | | | | | | |
| Senior floating | | $ | — |
| | | | $ | 6,904 |
| | | | $ | 347 |
| | | | $ | — |
| | | | $ | 7,251 |
| |
| Total of Fannie Mae | | — |
| | | | 6,904 |
| | | | 347 |
| | | | — |
| | | | 7,251 |
| |
| Of consolidated trusts | | — |
| | | | 24,785 |
| | | | 163 |
| | | | — |
| | | | 24,948 |
| |
| Total long-term debt | | — |
| | | | 31,689 |
| | | | 510 |
| | | | — |
| | | | 32,199 |
| |
| Other liabilities: | | | | | | | | | | | | | | | | | | | |
| Risk management derivatives: | | | | | | | | | | | | | | | | | | | |
| Swaps | | — |
| | | | 2,342 |
| | | | 1 |
| | | | — |
| | | | 2,343 |
| |
| Swaptions | | — |
| | | | 368 |
| | | | — |
| | | | — |
| | | | 368 |
| |
| Other | | — |
| | | | — |
| | | | 1 |
| | | | — |
| | | | 1 |
| |
| Netting adjustment | | — |
| | | | — |
| | | | — |
| | | | (2,648 | ) | | | | (2,648 | ) | |
| Mortgage commitment derivatives | | — |
| | | | 194 |
| | | | 18 |
| | | | — |
| | | | 212 |
| |
| Total other liabilities | | — |
| | | | 2,904 |
| | | | 20 |
| | | | (2,648 | ) | | | | 276 |
| |
| Total liabilities at fair value | | $ | — |
| | | | $ | 34,593 |
| | | | $ | 530 |
| | | | $ | (2,648 | ) | | | | $ | 32,475 |
| |
|
| | |
Fannie Mae (In conservatorship) Third Quarter 20182019 Form 10-Q | 89 |
|
| | |
| | Notes to Condensed Consolidated Financial Statements | Fair Value |
|
| | | | | | | | | | | | | | | | | | | | | | | | | | | | | |
| | Fair Value Measurements as of December 31, 2017 |
| | Quoted Prices in Active Markets for Identical Assets (Level 1) | | Significant Other Observable Inputs (Level 2) | | Significant Unobservable Inputs (Level 3) | | Netting Adjustment(1) | | Estimated Fair Value |
| | | (Dollars in millions) | |
| Recurring fair value measurements: | | | | | | | | | | | | | | | | | | | |
| Assets: | | | | | | | | | | | | | | | | | | | |
| Trading securities: | | | | | | | | | | | | | | | | | | | |
| Mortgage-related securities: | | | | | | | | | | | | | | | | | | | |
| Fannie Mae | | $ | — |
| | | | $ | 2,905 |
| | | | $ | 971 |
| | | | $ | — |
| | | | $ | 3,876 |
| |
| Other agency | | — |
| | | | 1,083 |
| | | | 35 |
| | | | — |
| | | | 1,118 |
| |
| Alt-A and subprime private-label securities | | — |
| | | | 259 |
| | | | 194 |
| | | | — |
| | | | 453 |
| |
| CMBS | | — |
| | | | 9 |
| | | | — |
| | | | — |
| | | | 9 |
| |
| Mortgage revenue bonds | | — |
| | | | — |
| | | | 1 |
| | | | — |
| | | | 1 |
| |
| Non-mortgage-related securities: | | | | | | | | | | | | | | | | | | | |
| U.S. Treasury securities | | 29,222 |
| | | | — |
| | | | — |
| | | | — |
| | | | 29,222 |
| |
| Total trading securities | | 29,222 |
| | | | 4,256 |
| | | | 1,201 |
| | | | — |
| | | | 34,679 |
| |
| Available-for-sale securities: | | | | | | | | | | | | | | | | | | | |
| Mortgage-related securities: | | | | | | | | | | | | | | | | | | | |
| Fannie Mae | | — |
| | | | 1,911 |
| | | | 208 |
| | | | — |
| | | | 2,119 |
| |
| Other agency | | — |
| | | | 357 |
| | | | — |
| | | | — |
| | | | 357 |
| |
| Alt-A and subprime private-label securities | | — |
| | | | 1,237 |
| | | | 77 |
| | | | — |
| | | | 1,314 |
| |
| CMBS | | — |
| | | | 15 |
| | | | — |
| | | | — |
| | | | 15 |
| |
| Mortgage revenue bonds | | — |
| | | | — |
| | | | 671 |
| | | | — |
| | | | 671 |
| |
| Other | | — |
| | | | 10 |
| | | | 357 |
| | | | — |
| | | | 367 |
| |
| Total available-for-sale securities | | — |
| | | | 3,530 |
| | | | 1,313 |
| | | | — |
| | | | 4,843 |
| |
| Mortgage loans | | — |
| | | | 9,480 |
| | | | 1,116 |
| | | | — |
| | | | 10,596 |
| |
| Other assets: | | | | | | | | | | | | | | | | | | | |
| Risk management derivatives: | | | | | | | | | | | | | | | | | | | |
| Swaps | | — |
| | | | 4,035 |
| | | | 146 |
| | | | — |
| | | | 4,181 |
| |
| Swaptions | | — |
| | | | 108 |
| | | | — |
| | | | — |
| | | | 108 |
| |
| Other | | — |
| | | | — |
| | | | 22 |
| | | | — |
| | | | 22 |
| |
| Netting adjustment | | — |
| | | | — |
| | | | — |
| | | | (4,272 | ) | | | | (4,272 | ) | |
| Mortgage commitment derivatives | | — |
| | | | 131 |
| | | | 1 |
| | | | — |
| | | | 132 |
| |
| Total other assets | | — |
| | | | 4,274 |
| | | | 169 |
| | | | (4,272 | ) | | | | 171 |
| |
| Total assets at fair value | | $ | 29,222 |
| | | | $ | 21,540 |
| | | | $ | 3,799 |
| | | | $ | (4,272 | ) | | | | $ | 50,289 |
| |
|
| | | | | | | | | | | | | | | | | | | | | | | | | | | | | |
| | Fair Value Measurements as of September 30, 2019 |
| | Quoted Prices in Active Markets for Identical Assets (Level 1) | | Significant Other Observable Inputs (Level 2) | | Significant Unobservable Inputs (Level 3) | | Netting Adjustment(1) | | Estimated Fair Value |
| | | (Dollars in millions) | |
| Liabilities: | | | | | | | | | | | | | | | | | | | |
| Long-term debt: | | | | | | | | | | | | | | | | | | | |
| Of Fannie Mae: | | | | | | | | | | | | | | | | | | | |
| Senior floating | | $ | — |
| | | | $ | 5,619 |
| | | | $ | 422 |
| | | | $ | — |
| | | | $ | 6,041 |
| |
| Total of Fannie Mae | | — |
| | | | 5,619 |
| | | | 422 |
| | | | — |
| | | | 6,041 |
| |
| Of consolidated trusts | | — |
| | | | 22,631 |
| | | | 88 |
| | | | — |
| | | | 22,719 |
| |
| Total long-term debt | | — |
| | | | 28,250 |
| | | | 510 |
| | | | — |
| | | | 28,760 |
| |
| Other liabilities: | | | | | | | | | | | | | | | | | | | |
| Risk management derivatives: | | | | | | | | | | | | | | | | | | | |
| Swaps | | — |
| | | | 2,043 |
| | | | 1 |
| | | | — |
| | | | 2,044 |
| |
| Swaptions | | — |
| | | | 407 |
| | | | — |
| | | | — |
| | | | 407 |
| |
| Netting adjustment | | — |
| | | | — |
| | | | — |
| | | | (2,299 | ) | | | | (2,299 | ) | |
| Mortgage commitment derivatives | | — |
| | | | 416 |
| | | | — |
| | | | — |
| | | | 416 |
| |
| Credit enhancement derivatives | | — |
| | | | — |
| | | | 27 |
| | | | — |
| | | | 27 |
| |
| Total other liabilities | | — |
| | | | 2,866 |
| | | | 28 |
| | | | (2,299 | ) | | | | 595 |
| |
| Total liabilities at fair value | | $ | — |
| | | | $ | 31,116 |
| | | | $ | 538 |
| | | | $ | (2,299 | ) | | | | $ | 29,355 |
| |
|
| | |
Fannie Mae (In conservatorship) Third Quarter 20182019 Form 10-Q | 90 |
|
| | |
| | Notes to Condensed Consolidated Financial Statements | Fair Value |
|
| | | | | | | | | | | | | | | | | | | | | | | | | | | | | |
| | Fair Value Measurements as of December 31, 2017 |
| | Quoted Prices in Active Markets for Identical Assets (Level 1) | | Significant Other Observable Inputs (Level 2) | | Significant Unobservable Inputs (Level 3) | | Netting Adjustment(1) | | Estimated Fair Value |
| | | (Dollars in millions) | |
| Liabilities: | | | | | | | | | | | | | | | | | | | |
| Long-term debt: | | | | | | | | | | | | | | | | | | | |
| Of Fannie Mae: | | | | | | | | | | | | | | | | | | | |
| Senior floating | | $ | — |
| | | | $ | 7,810 |
| | | | $ | 376 |
| | | | $ | — |
| | | | $ | 8,186 |
| |
| Total of Fannie Mae | | — |
| | | | 7,810 |
| | | | 376 |
| | | | — |
| | | | 8,186 |
| |
| Of consolidated trusts | | — |
| | | | 29,911 |
| | | | 582 |
| | | | — |
| | | | 30,493 |
| |
| Total long-term debt | | — |
| | | | 37,721 |
| | | | 958 |
| | | | — |
| | | | 38,679 |
| |
| Other liabilities: | | | | | | | | | | | | | | | | | | | |
| Risk management derivatives: | | | | | | | | | | | | | | | | | | | |
| Swaps | | — |
| | | | 4,721 |
| | | | 33 |
| | | | — |
| | | | 4,754 |
| |
| Swaptions | | — |
| | | | 324 |
| | | | — |
| | | | — |
| | | | 324 |
| |
| Other | | — |
| | | | — |
| | | | 1 |
| | | | — |
| | | | 1 |
| |
| Netting adjustment | | — |
| | | | — |
| | | | — |
| | | | (4,979 | ) | | | | (4,979 | ) | |
| Mortgage commitment derivatives | | — |
| | | | 227 |
| | | | 1 |
| | | | — |
| | | | 228 |
| |
| Total other liabilities | | — |
| | | | 5,272 |
| | | | 35 |
| | | | (4,979 | ) | | | | 328 |
| |
| Total liabilities at fair value | | $ | — |
| | | | $ | 42,993 |
| | | | $ | 993 |
| | | | $ | (4,979 | ) | | | | $ | 39,007 |
| |
|
| | | | | | | | | | | | | | | | | | | | | | | | | | | | | |
| | Fair Value Measurements as of December 31, 2018 |
| | Quoted Prices in Active Markets for Identical Assets (Level 1) | | Significant Other Observable Inputs (Level 2) | | Significant Unobservable Inputs (Level 3) | | Netting Adjustment(1) | | Estimated Fair Value |
| | | (Dollars in millions) | |
| Recurring fair value measurements: | | | | | | | | | | | | | | | | | | | |
| Assets: | | | | | | | | | | | | | | | | | | | |
Cash equivalents(2) | | $ | 748 |
| | | | $ | — |
| | | | $ | — |
| | | | $ | — |
| | | | $ | 748 |
| |
| Trading securities: | | | | | | | | | | | | | | | | | | | |
| Mortgage-related securities: | | | | | | | | | | | | | | | | | | | |
| Fannie Mae | | — |
| | | | 1,435 |
| | | | 32 |
| | | | — |
| | | | 1,467 |
| |
| Other agency | | — |
| | | | 3,503 |
| | | | — |
| | | | — |
| | | | 3,503 |
| |
| Private-label and other mortgage securities | | — |
| | | | 1,305 |
| | | | 1 |
| | | | — |
| | | | 1,306 |
| |
| Non-mortgage-related securities: | | | | | | | | | | | | | | | | | | | |
| U.S. Treasury securities | | 35,502 |
| | | | — |
| | | | — |
| | | | — |
| | | | 35,502 |
| |
| Other securities | | — |
| | | | 89 |
| | | | — |
| | | | — |
| | | | 89 |
| |
| Total trading securities | | 35,502 |
| | | | 6,332 |
| | | | 33 |
| | | | — |
| | | | 41,867 |
| |
| Available-for-sale securities: | | | | | | | | | | | | | | | | | | | |
| Mortgage-related securities: | | | | | | | | | | | | | | | | | | | |
| Fannie Mae | | — |
| | | | 1,645 |
| | | | 152 |
| | | | — |
| | | | 1,797 |
| |
| Other agency | | — |
| | | | 256 |
| | | | — |
| | | | — |
| | | | 256 |
| |
| Alt-A and subprime private-label securities | | — |
| | | | 568 |
| | | | 24 |
| | | | — |
| | | | 592 |
| |
| Mortgage revenue bonds | | — |
| | | | — |
| | | | 434 |
| | | | — |
| | | | 434 |
| |
| Other | | — |
| | | | 8 |
| | | | 342 |
| | | | — |
| | | | 350 |
| |
| Total available-for-sale securities | | — |
| | | | 2,477 |
| | | | 952 |
| | | | — |
| | | | 3,429 |
| |
| Mortgage loans | | — |
| | | | 7,985 |
| | | | 937 |
| | | | — |
| | | | 8,922 |
| |
| Other assets: | | | | | | | | | | | | | | | | | | | |
| Risk management derivatives: | | | | | | | | | | | | | | | | | | | |
| Swaps | | — |
| | | | 1,962 |
| | | | 115 |
| | | | — |
| | | | 2,077 |
| |
| Swaptions | | — |
| | | | 211 |
| | | | — |
| | | | — |
| | | | 211 |
| |
| Netting adjustment | | — |
| | | | — |
| | | | — |
| | | | (2,266 | ) | | | | (2,266 | ) | |
| Mortgage commitment derivatives | | — |
| | | | 342 |
| | | | 37 |
| | | | — |
| | | | 379 |
| |
| Credit enhancement derivatives | | — |
| | | | — |
| | | | 57 |
| | | | — |
| | | | 57 |
| |
| Total other assets | | — |
| | | | 2,515 |
| | | | 209 |
| | | | (2,266 | ) | | | | 458 |
| |
| Total assets at fair value | | $ | 36,250 |
| | | | $ | 19,309 |
| | | | $ | 2,131 |
| | | | $ | (2,266 | ) | | | | $ | 55,424 |
| |
__________
|
| | |
| Fannie Mae (In conservatorship) Third Quarter 2019 Form 10-Q | 91 |
|
| | |
| Notes to Condensed Consolidated Financial Statements | Fair Value |
|
| | | | | | | | | | | | | | | | | | | | | | | | | | | | | |
| | Fair Value Measurements as of December 31, 2018 |
| | Quoted Prices in Active Markets for Identical Assets (Level 1) | | Significant Other Observable Inputs (Level 2) | | Significant Unobservable Inputs (Level 3) | | Netting Adjustment(1) | | Estimated Fair Value |
| | | (Dollars in millions) | |
| Liabilities: | | | | | | | | | | | | | | | | | | | |
| Long-term debt: | | | | | | | | | | | | | | | | | | | |
| Of Fannie Mae: | | | | | | | | | | | | | | | | | | | |
| Senior floating | | $ | — |
| | | | $ | 6,475 |
| | | | $ | 351 |
| | | | $ | — |
| | | | $ | 6,826 |
| |
| Total of Fannie Mae | | — |
| | | | 6,475 |
| | | | 351 |
| | | | — |
| | | | 6,826 |
| |
| Of consolidated trusts | | — |
| | | | 23,552 |
| | | | 201 |
| | | | — |
| | | | 23,753 |
| |
| Total long-term debt | | — |
| | | | 30,027 |
| | | | 552 |
| | | | — |
| | | | 30,579 |
| |
| Other liabilities: | | | | | | | | | | | | | | | | | | | |
| Risk management derivatives: | | | | | | | | | | | | | | | | | | | |
| Swaps | | — |
| | | | 2,089 |
| | | | 2 |
| | | | — |
| | | | 2,091 |
| |
| Swaptions | | — |
| | | | 342 |
| | | | — |
| | | | — |
| | | | 342 |
| |
| Netting adjustment | | — |
| | | | — |
| | | | — |
| | | | (2,315 | ) | | | | (2,315 | ) | |
| Mortgage commitment derivatives | | — |
| | | | 646 |
| | | | 2 |
| | | | — |
| | | | 648 |
| |
| Credit enhancement derivatives | | — |
| | | | — |
| | | | 11 |
| | | | — |
| | | | 11 |
| |
| Total other liabilities | | — |
| | | | 3,077 |
| | | | 15 |
| | | | (2,315 | ) | | | | 777 |
| |
| Total liabilities at fair value | | $ | — |
| | | | $ | 33,104 |
| | | | $ | 567 |
| | | | $ | (2,315 | ) | | | | $ | 31,356 |
| |
| |
(1) | Derivative contracts are reported on a gross basis by level. The netting adjustment represents the effect of the legal right to offset under legally enforceable master netting arrangements to settle with the same counterparty on a net basis, including cash collateral posted and received. |
| |
(2) | Cash equivalents are comprised of U.S. Treasuries that have a maturity at the date of acquisition of three months or less at the date of acquisition.less. |
|
| | |
Fannie Mae (In conservatorship) Third Quarter 20182019 Form 10-Q | 9192 |
|
| | |
| | Notes to Condensed Consolidated Financial Statements | Fair Value |
The following tables display a reconciliation of all assets and liabilities measured at fair value on a recurring basis using significant unobservable inputs (Level 3). The tables also display gains and losses due to changes in fair value, including realized and unrealized gains and losses, recognized in our condensed consolidated statements of operations and comprehensive income for Level 3 assets and liabilities. When assets and liabilities are transferred between levels, we recognize the transfer as of the end of the period. |
| | | | | | | | | | | | | | | | | | | | | | | | | | | | | | | | | | | | | | | | | | | | | | | | | |
| | | Fair Value Measurements Using Significant Unobservable Inputs (Level 3) |
| | | For the Three Months Ended September 30, 2019 |
| | | | | Total Gains (Losses) (Realized/Unrealized) | | | | | | | | | | | | | | | | Net Unrealized Gains (Losses) Included in Net Income Related to Assets and Liabilities Still Held as of September 30, 2019(4)(5) | | Net Unrealized Gains (Losses) Included in OCI Related to Assets and Liabilities Still Held as of September 30, 2019(1) |
| | | Balance, June 30, 2019 | | Included in Net Income | | Included in Total OCI Gain/(Loss)(1) | | Purchases(2) | | Sales(2) | | Issues(3) | | Settlements(3) | | Transfers out of Level 3 | | Transfers into Level 3 | | Balance, September 30, 2019 | |
| | | (Dollars in millions) |
| Trading securities: | | | | | | | | | | | | | | | | | | | | | | | | | |
| Mortgage-related: | | | | | | | | | | | | | | | | | | | | | | | | | |
| Fannie Mae | | $ | 74 |
| | $ | 2 |
| | $ | — |
| | | $ | 77 |
| | $ | — |
| | $ | — |
| | $ | — |
| | $ | (31 | ) | | $ | — |
| | $ | 122 |
| | $ | 1 |
| | $ | — |
|
| Other agency | | — |
| | — |
| | — |
| | | — |
| | — |
| | — |
| | — |
| | — |
| | 2 |
| | 2 |
| | — |
| | — |
|
| Total trading securities | | $ | 74 |
| | $ | 2 |
| (5)(6) | $ | — |
| | | $ | 77 |
| | $ | — |
| | $ | — |
| | $ | — |
| | $ | (31 | ) | | $ | 2 |
| | $ | 124 |
| | $ | 1 |
| | $ | — |
|
| | | | | | | | | | | | | | | | | | | | | | | | | | |
| Available-for-sale securities: | | | | | | | | | | | | | | | | | | | | | | | | | |
| Mortgage-related: | | | | | | | | | | | | | | | | | | | | | | | | | |
| Fannie Mae | | $ | 132 |
| | $ | — |
| | $ | 3 |
| | | $ | — |
| | $ | — |
| | $ | — |
| | $ | (1 | ) | | $ | — |
| | $ | 40 |
| | $ | 174 |
| | $ | — |
| | $ | 3 |
|
| Mortgage revenue bonds | | 364 |
| | 1 |
| | (1 | ) | | | — |
| | — |
| | — |
| | (18 | ) | | — |
| | — |
| | 346 |
| | — |
| | — |
|
| Other | | 326 |
| | (1 | ) | | (1 | ) | | | — |
| | — |
| | — |
| | (9 | ) | | — |
| | — |
| | 315 |
| | — |
| | (2 | ) |
| Total available-for-sale securities | | $ | 822 |
| | $ | — |
| (6)(7) | $ | 1 |
| | | $ | — |
| | $ | — |
| | $ | — |
| | $ | (28 | ) | | $ | — |
| | $ | 40 |
| | $ | 835 |
| | $ | — |
| | $ | 1 |
|
| | | | | | | | | | | | | | | | | | | | | | | | | | |
| Mortgage loans | | $ | 770 |
| | $ | 14 |
| (5)(6) | $ | — |
| | | $ | — |
| | $ | (27 | ) | | $ | — |
| | $ | (35 | ) | | $ | (41 | ) | | $ | 45 |
| | $ | 726 |
| | $ | 10 |
| | $ | — |
|
| Net derivatives | | 183 |
| | 21 |
| (5) | — |
| | | — |
| | — |
| | — |
| | (6 | ) | | — |
| | — |
| | 198 |
| | 15 |
| | — |
|
| Long-term debt: | | | | | | | | | | | | | | | | | | | | | | | | | |
| Of Fannie Mae: | | | | | | | | | | | | | | | | | | | | | | | | | |
| Senior floating | | (398 | ) | | (24 | ) | | — |
| | | — |
| | — |
| | — |
| | — |
| | — |
| | — |
| | (422 | ) | | (24 | ) | | — |
|
| Of consolidated trusts | | (102 | ) | | (3 | ) | | — |
| | | — |
| | — |
| | (2 | ) | | 6 |
| | 20 |
| | (7 | ) | | (88 | ) | | (1 | ) | | — |
|
| Total long-term debt | | $ | (500 | ) | | $ | (27 | ) | (5) | $ | — |
| | | $ | — |
| | $ | — |
| | $ | (2 | ) | | $ | 6 |
| | $ | 20 |
| | $ | (7 | ) | | $ | (510 | ) | | $ | (25 | ) | | $ | — |
|
|
| | | | | | | | | | | | | | | | | | | | | | | | | | | | | | | | | | | | | | | | | | | | | | | |
| | Fair Value Measurements Using Significant Unobservable Inputs (Level 3) |
| | For the Three Months Ended September 30, 2018 |
| | | | | | | | | | | | | | | | | | | Net Unrealized Gains (Losses) Included in Net Income Related to Assets and Liabilities Still Held as of September 30, 2018(5)(6) |
| | | | Total Gains (Losses) (Realized/Unrealized) | | | | | | | | | | | | | | |
| | Balance, June 30, 2018 | | Included in Net Income | | Included in Total Other Comprehensive Income (Loss)(1) | | Purchases | | Sales | | Issues(3) | | Settlements(3) | | Transfers out of Level 3 | | Transfers into Level 3 | | Balance, September 30, 2018 | |
| | (Dollars in millions) |
| Trading securities: | | | | | | | | | | | | | | | | | | | | | | | | | |
| Mortgage-related: | | | | | | | | | | | | | | | | | | | | | | | | | |
| Fannie Mae | $ | 79 |
| | $ | (3 | ) | | | $ | — |
| | | $ | — |
| | $ | — |
| | $ | — |
| | $ | — |
| | $ | — |
| | $ | — |
| | $ | 76 |
| | | $ | 2 |
| |
| Mortgage revenue bonds | 1 |
| | — |
| | | — |
| | | — |
| | — |
| | — |
| | — |
| | — |
| | — |
| | 1 |
| | | — |
| |
| Total trading securities | $ | 80 |
| | $ | (3 | ) | (6)(7) | | $ | — |
| | | $ | — |
| | $ | — |
| | $ | — |
| | $ | — |
| | $ | — |
| | $ | — |
| | $ | 77 |
| | | $ | 2 |
| |
| Available-for-sale securities: | | | | | | | | | | | | | | | | | | | | | | | | | |
| Mortgage-related: | | | | | | | | | | | | | | | | | | | | | | | | | |
| Fannie Mae | $ | 204 |
| | $ | — |
| | | $ | (1 | ) | | | $ | — |
| | $ | — |
| | $ | — |
| | $ | (3 | ) | | $ | — |
| | $ | — |
| | $ | 200 |
| | | $ | — |
| |
| Alt-A and subprime private-label securities | 26 |
| | — |
| | | — |
| | | — |
| | — |
| | — |
| | (2 | ) | | — |
| | — |
| | 24 |
| | | — |
| |
| Mortgage revenue bonds | 506 |
| | 1 |
| | | (3 | ) | | | — |
| | (4 | ) | | — |
| | (36 | ) | | — |
| | — |
| | 464 |
| | | — |
| |
| Other | 357 |
| | 7 |
| | | (7 | ) | | | — |
| | — |
| | — |
| | (9 | ) | | — |
| | — |
| | 348 |
| | | — |
| |
| Total available-for-sale securities | $ | 1,093 |
| | $ | 8 |
| (7)(8) | | $ | (11 | ) | | | $ | — |
| | $ | (4 | ) | | $ | — |
| | $ | (50 | ) | | $ | — |
| | $ | — |
| | $ | 1,036 |
| | | $ | — |
| |
| Mortgage loans | $ | 1,018 |
| | $ | 7 |
| (6)(7) | | $ | — |
| | | $ | — |
| | $ | — |
| | $ | — |
| | $ | (47 | ) | | $ | (44 | ) | | $ | 31 |
| | $ | 965 |
| | | $ | 2 |
| |
| Net derivatives | 117 |
| | (18 | ) | (6) | | — |
| | | — |
| | — |
| | — |
| | (1 | ) | | — |
| | — |
| | 98 |
| | | (27 | ) | |
| Long-term debt: | | | | | | | | | | | | | | | | | | | | | | | | | |
| Of Fannie Mae: | | | | | | | | | | | | | | | | | | | | | | | | | |
| Senior floating | $ | (354 | ) | | $ | 7 |
| | | $ | — |
| | | $ | — |
| | $ | — |
| | $ | — |
| | $ | — |
| | $ | — |
| | $ | — |
| | $ | (347 | ) | | | $ | 7 |
| |
| Of consolidated trusts | (319 | ) | | 2 |
| | | — |
| | | — |
| | — |
| | — |
| | 4 |
| | 172 |
| | (22 | ) | | (163 | ) | | | — |
| |
| Total long-term debt | $ | (673 | ) | | $ | 9 |
| (6) | | $ | — |
| | | $ | — |
| | $ | — |
| | $ | — |
| | $ | 4 |
| | $ | 172 |
| | $ | (22 | ) | | $ | (510 | ) | | | $ | 7 |
| |
|
| | |
Fannie Mae (In conservatorship) Third Quarter 2018 Form 10-Q | 92 |
|
| | |
| Notes to Condensed Consolidated Financial Statements | Fair Value |
|
| | | | | | | | | | | | | | | | | | | | | | | | | | | | | | | | | | | | | | | | | | | | | | | |
| | Fair Value Measurements Using Significant Unobservable Inputs (Level 3) |
| | For the Nine Months Ended September 30, 2018 |
| | | | | | | | | | | | | | | | | | | Net Unrealized Gains (Losses) Included in Net Income Related to Assets and Liabilities Still Held as of September 30, 2018(5)(6) |
| | | | Total Gains (Losses) (Realized/Unrealized) | | | | | | | | | | | | | | |
| | Balance, December 31, 2017 | | Included in Net Income | | Included in Total Other Comprehensive Income (Loss)(1) | | Purchases(2) | | Sales(2) | | Issues(3) | | Settlements(3) | | Transfers out of Level 3(4) | | Transfers into Level 3 | | Balance, September 30, 2018 | |
| | (Dollars in millions) |
| Trading securities: | | | | | | | | | | | | | | | | | | | | | | | | | |
| Mortgage-related: | | | | | | | | | | | | | | | | | | | | | | | | | |
| Fannie Mae | $ | 971 |
| | $ | 163 |
| | | $ | — |
| | | $ | 1 |
| | $ | (1,060 | ) | | $ | — |
| | $ | — |
| | $ | — |
| | $ | 1 |
| | $ | 76 |
| | | $ | 2 |
| |
| Other agency | 35 |
| | (1 | ) | | | — |
| | | — |
| | — |
| | — |
| | (1 | ) | | (33 | ) | | — |
| | — |
| | | — |
| |
| Alt-A and subprime private-label securities | 194 |
| | (85 | ) | | | — |
| | | — |
| | — |
| | — |
| | (5 | ) | | (104 | ) | | — |
| | — |
| | | — |
| |
| Mortgage revenue bonds | 1 |
| | — |
| | | — |
| | | — |
| | — |
| | — |
| | — |
| | — |
| | — |
| | 1 |
| | | — |
| |
| Total trading securities | $ | 1,201 |
| | $ | 77 |
| (6)(7) | | $ | — |
| | | $ | 1 |
| | $ | (1,060 | ) | | $ | — |
| | $ | (6 | ) | | $ | (137 | ) | | $ | 1 |
| | $ | 77 |
| | | $ | 2 |
| |
| Available-for-sale securities: | | | | | | | | | | | | | | | | | | | | | | | | | |
| Mortgage-related: | | | | | | | | | | | | | | | | | | | | | | | | | |
| Fannie Mae | $ | 208 |
| | $ | 1 |
| | | $ | (1 | ) | | | $ | — |
| | $ | — |
| | $ | — |
| | $ | (8 | ) | | $ | — |
| | $ | — |
| | $ | 200 |
| | | $ | — |
| |
| Alt-A and subprime private-label securities | 77 |
| | — |
| | | (45 | ) | | | — |
| | — |
| | — |
| | (4 | ) | | (4 | ) | | — |
| | 24 |
| | | — |
| |
| Mortgage revenue bonds | 671 |
| | 1 |
| | | (6 | ) | | | — |
| | (22 | ) | | — |
| | (180 | ) | | — |
| | — |
| | 464 |
| | | — |
| |
| Other | 357 |
| | 21 |
| | | 1 |
| | | — |
| | — |
| | — |
| | (31 | ) | | — |
| | — |
| | 348 |
| | | — |
| |
| Total available-for-sale securities | $ | 1,313 |
| | $ | 23 |
| (7)(8) | | $ | (51 | ) | | | $ | — |
| | $ | (22 | ) | | $ | — |
| | $ | (223 | ) | | $ | (4 | ) | | $ | — |
| | $ | 1,036 |
| | | $ | — |
| |
| Mortgage loans | $ | 1,116 |
| | $ | 35 |
| (6)(7) | | $ | — |
| | | $ | — |
| | $ | — |
| | $ | — |
| | $ | (174 | ) | | $ | (131 | ) | | $ | 119 |
| | $ | 965 |
| | | $ | 17 |
| |
| Net derivatives | 134 |
| | (104 | ) | (6) | | — |
| | | — |
| | — |
| | — |
| | 15 |
| | 53 |
| | — |
| | 98 |
| | | (56 | ) | |
| Long-term debt: | | | | | | | | | | | | | | | | | | | | | | | | | |
| Of Fannie Mae: | | | | | | | | | | | | | | | | | | | | | | | | | |
| Senior floating | $ | (376 | ) | | $ | 29 |
| | | $ | — |
| | | $ | — |
| | $ | — |
| | $ | — |
| | $ | — |
| | $ | — |
| | $ | — |
| | $ | (347 | ) | | | $ | 29 |
| |
| Of consolidated trusts | (582 | ) | | 9 |
| | | — |
| | | — |
| | — |
| | 1 |
| | 35 |
| | 503 |
| | (129 | ) | | (163 | ) | | | (3 | ) | |
| Total long-term debt | $ | (958 | ) | | $ | 38 |
| (6) | | $ | — |
| | | $ | — |
| | $ | — |
| | $ | 1 |
| | $ | 35 |
| | $ | 503 |
| | $ | (129 | ) | | $ | (510 | ) | | | $ | 26 |
| |
|
| | |
Fannie Mae (In conservatorship) Third Quarter 20182019 Form 10-Q | 93 |
|
| | |
| | Notes to Condensed Consolidated Financial Statements | Fair Value |
|
| | | | | | | | | | | | | | | | | | | | | | | | | | | | | | | | | | | | | | | | | | | | | | | |
| | Fair Value Measurements Using Significant Unobservable Inputs (Level 3) |
| | For the Three Months Ended September 30, 2017 |
| | | | | | | | | | | | | | | | | | | Net Unrealized Gains (Losses) Included in Net Income Related to Assets and Liabilities Still Held as of September 30, 2017(5)(6) |
| | | | Total Gains (Losses) (Realized/Unrealized) | | | | | | | | | | | | | | |
| | Balance, June 30, 2017 | | Included in Net Income | | Included in Total Other Comprehensive Income (Loss)(1) | | Purchases(2) | | Sales(2) | | Issues(3) | | Settlements(3) | | Transfers out of Level 3 | | Transfers into Level 3(4) | | Balance, September 30, 2017 | |
| | (Dollars in millions) |
| Trading securities: | | | | | | | | | | | | | | | | | | | | | | | | | |
| Mortgage-related: | | | | | | | | | | | | | | | | | | | | | | | | | |
| Fannie Mae | $ | 1,871 |
| | $ | 16 |
| | | $ | — |
| | | $ | — |
| | $ | — |
| | $ | — |
| | $ | — |
| | $ | (8 | ) | | $ | 7 |
| | $ | 1,886 |
| | | $ | 27 |
| |
| Alt-A and subprime private-label securities | 264 |
| | (2 | ) | | | — |
| | | — |
| | — |
| | — |
| | (9 | ) | | — |
| | — |
| | 253 |
| | | (1 | ) | |
| Mortgage revenue bonds | 1 |
| | — |
| | | — |
| | | — |
| | — |
| | — |
| | — |
| | — |
| | — |
| | 1 |
| | | — |
| |
| Total trading securities | $ | 2,136 |
| | $ | 14 |
| (6)(7) | | $ | — |
| | | $ | — |
| | $ | — |
| | $ | — |
| | $ | (9 | ) | | $ | (8 | ) | | $ | 7 |
| | $ | 2,140 |
| | | $ | 26 |
| |
| Available-for-sale securities: | | | | | | | | | | | | | | | | | | | | | | | | | |
| Mortgage-related: | | | | | | | | | | | | | | | | | | | | | | | | | |
| Fannie Mae | $ | 206 |
| | $ | — |
| | | $ | — |
| | | $ | — |
| | $ | — |
| | $ | — |
| | $ | (2 | ) | | $ | (16 | ) | | $ | 8 |
| | $ | 196 |
| | | $ | — |
| |
| Alt-A and subprime private-label securities | 178 |
| | — |
| | | 10 |
| | | — |
| | — |
| | — |
| | (8 | ) | | — |
| | — |
| | 180 |
| | | — |
| |
| Mortgage revenue bonds | 873 |
| | 5 |
| | | (3 | ) | | | — |
| | (59 | ) | | — |
| | (67 | ) | | — |
| | — |
| | 749 |
| | | — |
| |
| Other | 380 |
| | — |
| | | 4 |
| | | — |
| | — |
| | — |
| | (14 | ) | | — |
| | — |
| | 370 |
| | | — |
| |
| Total available-for-sale securities | $ | 1,637 |
| | $ | 5 |
| (7)(8) | | $ | 11 |
| | | $ | — |
| | $ | (59 | ) | | $ | — |
| | $ | (91 | ) | | $ | (16 | ) | | $ | 8 |
| | $ | 1,495 |
| | | $ | — |
| |
| Mortgage loans | $ | 1,119 |
| | $ | 9 |
| (6)(7) | | $ | — |
| | | $ | — |
| | $ | — |
| | $ | — |
| | $ | (58 | ) | | $ | (6 | ) | | $ | 26 |
| | $ | 1,090 |
| | | $ | 6 |
| |
| Net derivatives | 124 |
| | 18 |
| (6) | | — |
| | | — |
| | — |
| | — |
| | (16 | ) | | — |
| | (1 | ) | | 125 |
| | | (14 | ) | |
| Long-term debt: | | | | | | | | | | | | | | | | | | | | | | | | | |
| Of Fannie Mae: | | | | | | | | | | | | | | | | | | | | | | | | | |
| Senior floating | $ | (365 | ) | | $ | (4 | ) | | | $ | — |
| | | $ | — |
| | $ | — |
| | $ | — |
| | $ | — |
| | $ | — |
| | $ | — |
| | $ | (369 | ) | | | $ | (4 | ) | |
| Of consolidated trusts | (760 | ) | | (2 | ) | | | — |
| | | — |
| | — |
| | — |
| | 33 |
| | 141 |
| | (117 | ) | | (705 | ) | | | (5 | ) | |
| Total long-term debt | $ | (1,125 | ) | | $ | (6 | ) | (6) | | $ | — |
| | | $ | — |
| | $ | — |
| | $ | — |
| | $ | 33 |
| | $ | 141 |
| | $ | (117 | ) | | $ | (1,074 | ) | | | $ | (9 | ) | |
|
| | | | | | | | | | | | | | | | | | | | | | | | | | | | | | | | | | | | | | | | | | | | | | | | | |
| | | Fair Value Measurements Using Significant Unobservable Inputs (Level 3) |
| | | For the Nine Months Ended September 30, 2019 |
| | | | | Total Gains (Losses) (Realized/Unrealized) | | | | | | | | | | | | | | | | Net Unrealized Gains (Losses) Included in Net Income Related to Assets and Liabilities Still Held as of September 30, 2019(4)(5) | | Net Unrealized Gains (Losses) Included in OCI Related to Assets and Liabilities Still Held as of September 30, 2019(1) |
| | | Balance, December 31, 2018 | | Included in Net Income | | Included in Total OCI Gain/(Loss)(1) | | Purchases(2) | | Sales(2) | | Issues(3) | | Settlements(3) | | Transfers out of Level 3 | | Transfers into Level 3 | | Balance, September 30, 2019 | |
| | | (Dollars in millions) |
| Trading securities: | | | | | | | | | | | | | | | | | | | | | | | | | |
| Mortgage-related: | | | | | | | | | | | | | | | | | | | | | | | | | |
| Fannie Mae | | $ | 32 |
| | $ | 5 |
| | $ | — |
| | | $ | 77 |
| | $ | (14 | ) | | $ | — |
| | $ | (16 | ) | | $ | (31 | ) | | $ | 69 |
| | $ | 122 |
| | $ | 4 |
| | $ | — |
|
| Other agency | | — |
| | — |
| | — |
| | | — |
| | — |
| | — |
| | — |
| | — |
| | 2 |
| | 2 |
| | — |
| | — |
|
| Private-label and other mortgage securities | | 1 |
| | — |
| | — |
| | | — |
| | — |
| | — |
| | (1 | ) | | — |
| | — |
| | — |
| | — |
| | — |
|
| Total trading securities | | $ | 33 |
| | $ | 5 |
| (5)(6) | $ | — |
| | | $ | 77 |
| | $ | (14 | ) | | $ | — |
| | $ | (17 | ) | | $ | (31 | ) | | $ | 71 |
| | $ | 124 |
| | $ | 4 |
| | $ | — |
|
| | | | | | | | | | | | | | | | | | | | | | | | | | |
| Available-for-sale securities: | | | | | | | | | | | | | | | | | | | | | | | | | |
| Mortgage-related: | | | | | | | | | | | | | | | | | | | | | | | | | |
| Fannie Mae | | $ | 152 |
| | $ | — |
| | $ | 9 |
| | | $ | — |
| | $ | — |
| | $ | — |
| | $ | (8 | ) | | $ | (103 | ) | | $ | 124 |
| | $ | 174 |
| | $ | — |
| | $ | 8 |
|
| Alt-A and subprime private-label securities | | 24 |
| | 5 |
| | (5 | ) | | | — |
| | (23 | ) | | — |
| | (1 | ) | | — |
| | — |
| | — |
| | — |
| | — |
|
| Mortgage revenue bonds | | 434 |
| | 1 |
| | (2 | ) | | | — |
| | (4 | ) | | — |
| | (83 | ) | | — |
| | — |
| | 346 |
| | — |
| | (1 | ) |
| Other | | 342 |
| | 11 |
| | (11 | ) | | | — |
| | — |
| | — |
| | (26 | ) | | (2 | ) | | 1 |
| | 315 |
| | — |
| | (9 | ) |
| Total available-for-sale securities | | $ | 952 |
| | $ | 17 |
| (6)(7) | $ | (9 | ) | | | $ | — |
| | $ | (27 | ) | | $ | — |
| | $ | (118 | ) | | $ | (105 | ) | | $ | 125 |
| | $ | 835 |
| | $ | — |
| | $ | (2 | ) |
| | | | | | | | | | | | | | | | | | | | | | | | | | |
| Mortgage loans | | $ | 937 |
| | $ | 45 |
| (5)(6) | $ | — |
| | | $ | — |
| | $ | (40 | ) | | $ | — |
| | $ | (105 | ) | | $ | (228 | ) | | $ | 117 |
| | $ | 726 |
| | $ | 28 |
| | $ | — |
|
| Net derivatives | | 194 |
| | 139 |
| (5) | — |
| | | — |
| | — |
| | — |
| | (126 | ) | | (9 | ) | | — |
| | 198 |
| | 39 |
| | — |
|
| Long-term debt: | | | | | | | | | | | | | | | | | | | | | | | | | |
| Of Fannie Mae: | | | | | | | | | | | | | | | | | | | | | | | | | |
| Senior floating | | (351 | ) | | (71 | ) | | — |
| | | — |
| | — |
| | — |
| | — |
| | — |
| | — |
| | (422 | ) | | (71 | ) | | — |
|
| Of consolidated trusts | | (201 | ) | | (7 | ) | | — |
| | | — |
| | — |
| | (2 | ) | | 16 |
| | 189 |
| | (83 | ) | | (88 | ) | | (3 | ) | | — |
|
| Total long-term debt | | $ | (552 | ) | | $ | (78 | ) | (5) | $ | — |
| | | $ | — |
| | $ | — |
| | $ | (2 | ) | | $ | 16 |
| | $ | 189 |
| | $ | (83 | ) | | $ | (510 | ) | | $ | (74 | ) | | $ | — |
|
|
| | |
Fannie Mae (In conservatorship) Third Quarter 20182019 Form 10-Q | 94 |
|
| | |
| | Notes to Condensed Consolidated Financial Statements | Fair Value |
|
| | | | | | | | | | | | | | | | | | | | | | | | | | | | | | | | | | | | | | | | | | | | | | | |
| | Fair Value Measurements Using Significant Unobservable Inputs (Level 3) |
| | For the Nine Months Ended September 30, 2017 |
| | | | | | | | | | | | | | | | | | | Net Unrealized Gains (Losses) Included in Net Income Related to Assets and Liabilities Still Held as of September 30, 2017(5)(6) |
| | | | Total Gains (Losses) (Realized/Unrealized) | | | | | | | | | | | | | | |
| | Balance, December 31, 2016 | | Included in Net Income | | Included in Total Other Comprehensive Income (Loss)(1) | | Purchases(2) | | Sales(2) | | Issues(3) | | Settlements(3) | | Transfers out of Level 3 | | Transfers into Level 3(4) | | Balance, September 30, 2017 | |
| | (Dollars in millions) |
| Trading securities: | | | | | | | | | | | | | | | | | | | | | | | | | |
| Mortgage-related: | | | | | | | | | | | | | | | | | | | | | | | | | |
| Fannie Mae | $ | 835 |
| | $ | 20 |
| | | $ | — |
| | | $ | 63 |
| | $ | — |
| | $ | — |
| | $ | (5 | ) | | $ | (30 | ) | | $ | 1,003 |
| | $ | 1,886 |
| | | $ | 3 |
| |
| Alt-A and subprime private-label securities | 271 |
| | 9 |
| | | — |
| | | — |
| | — |
| | — |
| | (27 | ) | | — |
| | — |
| | 253 |
| | | 10 |
| |
| Mortgage revenue bonds | 21 |
| | 3 |
| | | — |
| | | — |
| | (21 | ) | | — |
| | (2 | ) | | — |
| | — |
| | 1 |
| | | — |
| |
| Total trading securities | $ | 1,127 |
| | $ | 32 |
| (6)(7) | | $ | — |
| | | $ | 63 |
| | $ | (21 | ) | | $ | — |
| | $ | (34 | ) | | $ | (30 | ) | | $ | 1,003 |
| | $ | 2,140 |
| | | $ | 13 |
| |
| Available-for-sale securities: | | | | | | | | | | | | | | | | | | | | | | | | | |
| Mortgage-related: | | | | | | | | | | | | | | | | | | | | | | | | | |
| Fannie Mae | $ | 230 |
| | $ | 1 |
| | | $ | (2 | ) | | | $ | — |
| | $ | — |
| | $ | — |
| | $ | (8 | ) | | $ | (63 | ) | | $ | 38 |
| | $ | 196 |
| | | $ | — |
| |
| Other agency | 5 |
| | — |
| | | — |
| | | — |
| | (1 | ) | | — |
| | — |
| | (4 | ) | | — |
| | — |
| | | — |
| |
| Alt-A and subprime private-label securities | 217 |
| | — |
| | | (5 | ) | | | — |
| | — |
| | — |
| | (32 | ) | | — |
| | — |
| | 180 |
| | | — |
| |
| Mortgage revenue bonds | 1,272 |
| | 40 |
| | | (15 | ) | | | — |
| | (383 | ) | | — |
| | (165 | ) | | — |
| | — |
| | 749 |
| | | — |
| |
| Other | 429 |
| | — |
| | | (10 | ) | | | — |
| | — |
| | — |
| | (49 | ) | | — |
| | — |
| | 370 |
| | | — |
| |
| Total available-for-sale securities | $ | 2,153 |
| | $ | 41 |
| (7)(8) | | $ | (32 | ) | | | $ | — |
| | $ | (384 | ) | | $ | — |
| | $ | (254 | ) | | $ | (67 | ) | | $ | 38 |
| | $ | 1,495 |
| | | $ | — |
| |
| Mortgage loans | $ | 1,197 |
| | $ | 41 |
| (6)(7) | | $ | — |
| | | $ | — |
| | $ | — |
| | $ | — |
| | $ | (175 | ) | | $ | (73 | ) | | $ | 100 |
| | $ | 1,090 |
| | | $ | 21 |
| |
| Net derivatives | 44 |
| | 118 |
| (6) | | — |
| | | — |
| | — |
| | — |
| | (40 | ) | | 5 |
| | (2 | ) | | 125 |
| | | 3 |
| |
| Long-term debt: | | | | | | | | | | | | | | | | | | | | | | | | | |
| Of Fannie Mae: | | | | | | | | | | | | | | | | | | | | | | | | | |
| Senior floating | $ | (347 | ) | | $ | (22 | ) | | | $ | — |
| | | $ | — |
| | $ | — |
| | $ | — |
| | $ | — |
| | $ | — |
| | $ | — |
| | $ | (369 | ) | | | $ | (22 | ) | |
| Of consolidated trusts | (241 | ) | | (6 | ) | | | — |
| | | — |
| | — |
| | (2 | ) | | 52 |
| | 229 |
| | (737 | ) | | (705 | ) | | | (6 | ) | |
| Total long-term debt | $ | (588 | ) | | $ | (28 | ) | (6) | | $ | — |
| | | $ | — |
| | $ | — |
| | $ | (2 | ) | | $ | 52 |
| | $ | 229 |
| | $ | (737 | ) | | $ | (1,074 | ) | | | $ | (28 | ) | |
|
| | | | | | | | | | | | | | | | | | | | | | | | | | | | | | | | | | | | | | | | | | | | | | | | |
| | | Fair Value Measurements Using Significant Unobservable Inputs (Level 3) |
| | | For the Three Months Ended September 30, 2018 |
| | | | | Total Gains (Losses) (Realized/Unrealized) | | | | | | | | | | | | | | | | Net Unrealized Gains (Losses) Included in Net Income Related to Assets and Liabilities Still Held as of September 30, 2018(4)(5) | | Net Unrealized Gains (Losses) Included in OCI Related to Assets and Liabilities Still Held as of September 30, 2018(1) |
| | | Balance, June 30, 2018 | | Included in Net Income | | Included in Total OCI (Loss)(1) | | Purchases(2) | | Sales(2) | | Issues(3) | | Settlements(3) | | Transfers out of Level 3 | | Transfers into Level 3 | | Balance, September 30, 2018 | |
| | | (Dollars in millions) |
| Trading securities: | | | | | | | | | | | | | | | | | | | | | | | | |
| Mortgage-related: | | | | | | | | | | | | | | | | | | | | | | | | |
| Fannie Mae | | $ | 79 |
| | $ | (3 | ) | | $ | — |
| | $ | — |
| | $ | — |
| | $ | — |
| | $ | — |
| | $ | — |
| | $ | — |
| | $ | 76 |
| | $ | 2 |
| | $ | — |
|
| Private-label and other mortgage securities | | 1 |
| | — |
| | — |
| | — |
| | — |
| | — |
| | — |
| | — |
| | — |
| | 1 |
| | — |
| | — |
|
| Total trading securities | | $ | 80 |
| | $ | (3 | ) | (5)(6)
| $ | — |
| | $ | — |
| | $ | — |
| | $ | — |
| | $ | — |
| | $ | — |
| | $ | — |
| | $ | 77 |
| | $ | 2 |
| | $ | — |
|
| | | | | | | | | | | | | | | | | | | | | | | | | |
| Available-for-sale securities: | | | | | | | | | | | | | | | | | | | | | | | | |
| Mortgage-related: | | | | | | | | | | | | | | | | | | | | | | | | |
| Fannie Mae | | $ | 204 |
| | $ | — |
| | $ | (1 | ) | | $ | — |
| | $ | — |
| | $ | — |
| | $ | (3 | ) | | $ | — |
| | $ | — |
| | $ | 200 |
| | $ | — |
| | $ | (1 | ) |
Alt-A and subprime private-label securities
| | 26 |
| | — |
| | — |
| | — |
| | — |
| | — |
| | (2 | ) | | — |
| | — |
| | 24 |
| | — |
| | — |
|
| Mortgage revenue bonds | | 506 |
| | 1 |
| | (3 | ) | | — |
| | (4 | ) | | — |
| | (36 | ) | | — |
| | — |
| | 464 |
| | — |
| | (2 | ) |
| Other | | 357 |
| | 7 |
| | (7 | ) | | — |
| | — |
| | — |
| | (9 | ) | | — |
| | — |
| | 348 |
| | — |
| | (6 | ) |
| Total available-for-sale securities | | $ | 1,093 |
| | $ | 8 |
| (6)(7) | $ | (11 | ) | | $ | — |
| | $ | (4 | ) | | $ | — |
| | $ | (50 | ) | | $ | — |
| | $ | — |
| | $ | 1,036 |
| | $ | — |
| | $ | (9 | ) |
| | | | | | | | | | | | | | | | | | | | | | | | | |
| Mortgage loans | | $ | 1,018 |
| | $ | 7 |
| (5)(6) | $ | — |
| | $ | — |
| | $ | — |
| | $ | — |
| | $ | (47 | ) | | $ | (44 | ) | | $ | 31 |
| | $ | 965 |
| | $ | 2 |
| | $ | — |
|
| Net derivatives | | 117 |
| | (18 | ) | (5) | — |
| | — |
| | — |
| | — |
| | (1 | ) | | — |
| | — |
| | 98 |
| | (27 | ) | | — |
|
| Long-term debt: | | | | | | | | | | | | | | | | | | | | | | | | |
| Of Fannie Mae: | | | | | | | | | | | | | | | | | | | | | | | | |
| Senior floating | | (354 | ) | | 7 |
| | — |
| | — |
| | — |
| | — |
| | — |
| | — |
| | — |
| | (347 | ) | | 7 |
| | — |
|
| Of consolidated trusts | | (319 | ) | | 2 |
| | — |
| | — |
| | — |
| | — |
| | 4 |
| | 172 |
| | (22 | ) | | (163 | ) | | — |
| | — |
|
| Total long-term debt | | $ | (673 | ) | | $ | 9 |
| (5) | $ | — |
| | $ | — |
| | $ | — |
| | $ | — |
| | $ | 4 |
| | $ | 172 |
| | $ | (22 | ) | | $ | (510 | ) | | $ | 7 |
| | $ | — |
|
|
| | |
| Fannie Mae (In conservatorship) Third Quarter 2019 Form 10-Q | 95 |
|
| | |
| Notes to Condensed Consolidated Financial Statements | Fair Value |
|
| | | | | | | | | | | | | | | | | | | | | | | | | | | | | | | | | | | | | | | | | | | | | | | | |
| | | Fair Value Measurements Using Significant Unobservable Inputs (Level 3) |
| | | For the Nine Months Ended September 30, 2018 |
| | | | | Total Gains (Losses) (Realized/Unrealized) | | | | | | | | | | | | | | | | Net Unrealized Gains (Losses) Included in Net Income Related to Assets and Liabilities Still Held as of September 30, 2018(4)(5) | | Net Unrealized Gains (Losses) Included in OCI Related to Assets and Liabilities Still Held as of September 30, 2018(1) |
| | | Balance, December 31, 2017 | | Included in Net Income | | Included in Total OCI (Loss)(1) | | Purchases(2) | | Sales(2) | | Issues(3) | | Settlements(3) | | Transfers out of Level 3 | | Transfers into Level 3 | | Balance, September 30, 2018 | |
| | | (Dollars in millions) |
| Trading securities: | | | | | | | | | | | | | | | | | | | | | | | | |
| Mortgage-related: | | | | | | | | | | | | | | | | | | | | | | | | |
| Fannie Mae | | $ | 971 |
| | $ | 163 |
| | $ | — |
| | $ | 1 |
| | $ | (1,060 | ) | | $ | — |
| | $ | — |
| | $ | — |
| | $ | 1 |
| | $ | 76 |
| | $ | 2 |
| | $ | — |
|
| Other agency | | 35 |
| | (1 | ) | | — |
| | — |
| | — |
| | — |
| | (1 | ) | | (33 | ) | | — |
| | — |
| | — |
| | — |
|
| Private-label and other mortgage securities | | 195 |
| | (85 | ) | | — |
| | — |
| | — |
| | — |
| | (5 | ) | | (104 | ) | | — |
| | 1 |
| | — |
| | — |
|
| Total trading securities | | $ | 1,201 |
| | $ | 77 |
| (5)(6)
| $ | — |
| | $ | 1 |
| | $ | (1,060 | ) | | $ | — |
| | $ | (6 | ) | | $ | (137 | ) | | $ | 1 |
| | $ | 77 |
| | $ | 2 |
| | $ | — |
|
| | | | | | | | | | | | | | | | | | | | | | | | | |
| Available-for-sale securities: | | | | | | | | | | | | | | | | | | | | | | | | |
| Mortgage-related: | | | | | | | | | | | | | | | | | | | | | | | | |
| Fannie Mae | | $ | 208 |
| | $ | 1 |
| | $ | (1 | ) | | $ | — |
| | $ | — |
| | $ | — |
| | $ | (8 | ) | | $ | — |
| | $ | — |
| | $ | 200 |
| | $ | — |
| | $ | (1 | ) |
Alt-A and subprime private-label securities
| | 77 |
| | — |
| | (45 | ) | | — |
| | — |
| | — |
| | (4 | ) | | (4 | ) | | — |
| | 24 |
| | — |
| | 1 |
|
| Mortgage revenue bonds | | 671 |
| | 1 |
| | (6 | ) | | — |
| | (22 | ) | | — |
| | (180 | ) | | — |
| | — |
| | 464 |
| | — |
| | (3 | ) |
| Other | | 357 |
| | 21 |
| | 1 |
| | — |
| | — |
| | — |
| | (31 | ) | | — |
| | — |
| | 348 |
| | — |
| | 3 |
|
| Total available-for-sale securities | | $ | 1,313 |
| | $ | 23 |
| (6)(7) | $ | (51 | ) | | $ | — |
| | $ | (22 | ) | | $ | — |
| | $ | (223 | ) | | $ | (4 | ) | | $ | — |
| | $ | 1,036 |
| | $ | — |
| | $ | — |
|
| | | | | | | | | | | | | | | | | | | | | | | | | |
| Mortgage loans | | $ | 1,116 |
| | $ | 35 |
| (5)(6) | $ | — |
| | $ | — |
| | $ | — |
| | $ | — |
| | $ | (174 | ) | | $ | (131 | ) | | $ | 119 |
| | $ | 965 |
| | $ | 17 |
| | $ | — |
|
| Net derivatives | | 134 |
| | (104 | ) | (5) | — |
| | — |
| | — |
| | — |
| | 15 |
| | 53 |
| | — |
| | 98 |
| | (56 | ) | | — |
|
| Long-term debt: | | | | | | | | | | | | | | | | | | | | | | | | |
| Of Fannie Mae: | | | | | | | | | | | | | | | | | | | | | | | | |
| Senior floating | | (376 | ) | | 29 |
| | — |
| | — |
| | — |
| | — |
| | — |
| | — |
| | — |
| | (347 | ) | | 29 |
| | — |
|
| Of consolidated trusts | | (582 | ) | | 9 |
| | — |
| | — |
| | — |
| | 1 |
| | 35 |
| | 503 |
| | (129 | ) | | (163 | ) | | (3 | ) | | — |
|
| Total long-term debt | | $ | (958 | ) | | $ | 38 |
| (5) | $ | — |
| | $ | — |
| | $ | — |
| | $ | 1 |
| | $ | 35 |
| | $ | 503 |
| | $ | (129 | ) | | $ | (510 | ) | | $ | 26 |
| | $ | — |
|
__________
| |
(1) | Gains (losses) included in other comprehensive income (loss)loss are included in “Changes in unrealized gains on AFSavailable-for-sale securities, net of reclassification adjustments and taxes” in our condensed consolidated statements of operations and comprehensive income. |
| |
(2) | Purchases and sales include activity related to the consolidation and deconsolidation of assets of securitization trusts. For the nine months ended September 30, 2018, this includes the dissolution of a Fannie Mae-wrapped private-label securities trust. |
| |
(3) | Issues and settlements include activity related to the consolidation and deconsolidation of liabilities of securitization trusts. |
| |
(4) | Transfers of long-term debt of consolidated trusts out of Level 3 during the first nine months of 2018 consisted of securities for which prices were available from multiple third-party vendors and demonstrated an increased and sustained level of observability over time. Transfers of Fannie Mae trading securities into Level 3 during the nine months ended September 30, 2017 consisted primarily of a Fannie Mae security backed by private-label mortgage-related securities. Prices for this security were based on inputs that were not readily available. Transfers of long-term debt of consolidated trusts into Level 3 during the first nine months of 2017 consisted of securities for which prices were estimated using inputs that were not readily available. |
| |
(5)
| Amount represents temporary changes in fair value. Amortization, accretion and OTTI are not considered unrealized and are not included in this amount. |
| |
(6)(5)
| Gains (losses) are included in “Fair value gains (losses), net” in our condensed consolidated statements of operations and comprehensive income. |
| |
(6) | Gains (losses) are included in “Net interest income” in our condensed consolidated statements of operations and comprehensive income. |
| |
(7) | Gains (losses) are included in “Investment gains, net” in our condensed consolidated statements of operations and comprehensive income. |
|
| | |
Fannie Mae (In conservatorship) Third Quarter 20182019 Form 10-Q | 9596 |
|
| | |
| | Notes to Condensed Consolidated Financial Statements | Fair Value |
| |
(7)
| Gains (losses) are included in “Net interest income” in our condensed consolidated statements of operations and comprehensive income. |
| |
(8)
| Gains (losses) are included in “Investment gains, net” in our condensed consolidated statements of operations and comprehensive income. |
The following tables display valuation techniques and the range and the weighted average of significant unobservable inputs for our Level 3 assets and liabilities measured at fair value on a recurring basis.basis, excluding instruments for which we have elected the fair value option. Changes in these unobservable inputs can result in significantly higher or lower fair value measurements of these assets and liabilities as of the reporting date.
| | | | Fair Value Measurements as of September 30, 2018 | | Fair Value Measurements as of September 30, 2019 |
| | Fair Value | | Significant Valuation Techniques | | Significant Unobservable Inputs(1) | | Range(1) | | Weighted - Average(1) | | Fair Value | | Significant Valuation Techniques | | Significant Unobservable Inputs(1) | | Range(1) | | Weighted - Average(1)(2) |
| | (Dollars in millions) | | (Dollars in millions) |
| Recurring fair value measurements: | | | | | | | | | | | |
| Trading securities: | | | | | | | | | | | |
| Mortgage-related securities: | | | | | | | | | | | |
Agency(2) | $ | 76 |
| | Various | | | | | |
| Mortgage revenue bonds | 1 |
| | Various | | | | | |
| Total trading securities | $ | 77 |
| | | | | |
Agency(3) | | | $ | 124 |
| | Various | | | | |
| | | | | | | | |
| Available-for-sale securities: | | | | | | | | | | | |
| Mortgage-related securities: | | | | | | | | | | | |
Agency(2) | $ | 107 |
| | Single Vendor | |
| |
| |
|
| |
Agency(3) | | | $ | 118 |
| | Consensus | | | | |
| | 93 |
| | Various | | | | | | 56 |
| | Various | | | | |
| Total Agency | 200 |
| | | | | |
| Alt-A and subprime private-label securities | 24 |
| | Various | | | | | |
| Total agency | | | 174 |
| | | | |
| Mortgage revenue bonds | 326 |
| | Single Vendor | | Spreads (bps) | | (2.0 | ) | - | 377.8 | | 53.0 |
| | 232 |
| | Single Vendor | | Spreads(bps) | | 22.5 |
| - | 204.5 | | 70.3 |
|
| | 138 |
| | Various | | | | | | 114 |
| | Various | | | | |
| Total mortgage revenue bonds | 464 |
| | | | | | 346 |
| | | | |
| Other | 297 |
| | Discounted Cash Flow | | Default Rate (%) | | 5.9 | | 5.9 |
| | 274 |
| | Discounted Cash Flow | | Default Rate(%) | | 0.8 | | 0.8 |
|
| | | | Prepayment Speed (%) | | 10.2 | | 10.2 |
| | | | Prepayment Speed(%) | | 8.7 | | 8.7 |
|
| | | | Severity (%) | | 75.0 | | 75.0 |
| | | | Severity(%) | | 84.0 | | 84.0 |
|
| | | | Spreads (bps) | | 58.3 |
| - | 394.0 | | 392.5 |
| | | | Spreads(bps) | | 77.5 |
| - | 300.0 | | 299.4 |
|
| | 51 |
| | Various | | | | | | 41 |
| | Various | | | | |
| Total other | 348 |
| | | | | | 315 |
| | | | |
| Total available-for-sale securities | $ | 1,036 |
| | | | | | $ | 835 |
| | | | |
| Net derivatives | $ | 97 |
| | Dealer Mark | | | | | | $ | 183 |
| | Dealer Mark | | | | |
| | 1 |
| | Various | | | | | | 15 |
| | Various | | | | |
| Total net derivatives | $ | 98 |
| | | | | | $ | 198 |
| | | | |
|
| | |
Fannie Mae (In conservatorship) Third Quarter 20182019 Form 10-Q | 9697 |
|
| | |
| | Notes to Condensed Consolidated Financial Statements | Fair Value |
|
| | | | | | | | | | | | | | |
| | Fair Value Measurements as of December 31, 2017 |
| | Fair Value | | Significant Valuation Techniques | | Significant Unobservable Inputs(1) | | Range(1) | | Weighted - Average(1) |
| | (Dollars in millions) |
| Recurring fair value measurements: | | | | | | | | | | | |
| Trading securities: | | | | | | | | | | | |
| Mortgage-related securities: | | | | | | | | | | | |
Agency(2) | $ | 971 |
| | Single Vendor | | Prepayment Speed (%) | | 0.0 |
| - | 177.0 | | 160.0 |
| | | | | | Spreads (bps) | | 51.5 |
| - | 375.0 | | 200.1 |
| | 35 |
| | Various | | | | | | | | |
| Total agency | 1,006 |
| | | | | | | | | | |
| Alt-A and subprime private-label securities | 154 |
| | Consensus | | | | | | | | |
| | 40 |
| | Various | | | | | | | | |
| Total Alt-A and subprime private-label securities | 194 |
| | | | | | | | | | |
| Mortgage revenue bonds | 1 |
| | Various | | | | | | | | |
| Total trading securities | $ | 1,201 |
| | | | | | | | | | |
| Available-for-sale securities: | | | | | | | | | | | |
| Mortgage-related securities: | | | | | | | | | | | |
Agency(2) | $ | 112 |
| | Single Vendor | | Prepayment Speed (%) | | 0.0 | - | 175.7 | | 147.1 |
| | | | | | Spreads (bps) | | 150.0 |
| - | 210.0 | | 182.3 |
| | 96 |
| | Various | | | | | | | | |
| Total agency | 208 |
| | | | | | | | | | |
| Alt-A and subprime private-label securities | 77 |
| | Various | | | | | | | | |
| Mortgage revenue bonds | 475 |
| | Single Vendor | | Spreads (bps) | | (17.0 | ) | - | 248.0 | | 39.0 |
| | 196 |
| | Various | | | | | | | | |
| Total mortgage revenue bonds | 671 |
| | | | | | | | | | |
| Other | 325 |
| | Discounted Cash Flow | | Prepayment Speed (%) | | 1.6 |
| - | 2.5 | | 2.5 |
| | | | | | Severity (%) | | 50.0 |
| - | 88.0 | | 86.6 |
| | | | | | Spreads (bps) | | 84.8 |
| - | 607.0 | | 577.9 |
| | 32 |
| | Various | | | | | | | | |
| Total other | 357 |
| | | | | | | | | | |
| Total available-for-sale securities | $ | 1,313 |
| | | | | | | | | | |
| Net derivatives | $ | 113 |
| | Dealer Mark | | | | | | | | |
| | 21 |
| | Various | | | | | | | | |
| Total net derivatives | $ | 134 |
| | | | | | | | | | |
_________ |
| | | | | | | | | | | | | | | | |
| | | Fair Value Measurements as of December 31, 2018 |
| | | Fair Value | | Significant Valuation Techniques | | Significant Unobservable Inputs(1) | | Range(1) | | Weighted - Average(1)(2) |
| | | (Dollars in millions) |
| Recurring fair value measurements: | | | | | | | | | | | | |
| Trading securities: | | | | | | | | | | | | |
| Mortgage-related securities: | | | | | | | | | | | | |
Agency(3) | | $ | 32 |
| | Various | | | | | | | | |
Private-label securities and other mortgage securities
| | 1 |
| | Various | | | | | | | | |
| Total trading securities | | $ | 33 |
| | | | | | | | | | |
| | | | | | | | | | | | | |
| Available-for-sale securities: | | | | | | | | | | | | |
| Mortgage-related securities: | | | | | | | | | | | | |
Agency(3) | | $ | 152 |
| | Various | | | | | | | | |
| | | | | | | | |
|
| |
| |
|
| Alt-A and subprime private-label securities | | 24 |
| | Various | | | | | | | | |
| Mortgage revenue bonds | | 349 |
| | Single Vendor | | Spreads(bps) | | (0.5 | ) | - | 332.8 | | 59.0 |
|
| | | 85 |
| | Various | | | | | | | | |
| Total mortgage revenue bonds | | 434 |
| | | | | | | | | | |
| Other | | 294 |
| | Discounted Cash Flow | | Default Rate(%) | | 4.7 | | 4.7 |
|
| | | | | | | Prepayment Speed(%) | | 8.2 | | 8.2 |
|
| | | | | | | Severity(%) | | 70.0 | | 70.0 |
|
| | | | | | | Spreads(bps) | | 75.4 |
| - | 390.0 | | 389.1 |
|
| | | 48 |
| | Various | | | | | | | | |
| Total other | | 342 |
| | | | | | | | | | |
| Total available-for-sale securities | | $ | 952 |
| | | | | | | | | | |
| Net derivatives | | $ | 113 |
| | Dealers Mark | | | | | | | | |
| | | 81 |
| | Various | | | | | | | | |
| Total net derivatives | | $ | 194 |
| | | | | | | | | | |
| |
(1) | Valuation techniques for which no unobservable inputs are disclosed generally reflect the use of third-party pricing services or dealers, and the range of unobservable inputs applied by these sources is not readily available or cannot be reasonably estimated. Where we have disclosed unobservable inputs for consensus and single vendor techniques, those inputs are based on our validations performed at the security level using discounted cash flows. The prepayment speed used for trading agency securities and available-for-sale agency securities is the Public Securities Association prepayment speed, which can be greater than 100%. For all other securities, the Conditional Prepayment Rate is used as the prepayment speed, which can be between 0% and 100%. |
| |
(2) | Unobservable inputs were weighted by the relative fair value of the instruments. |
| |
(3) | Includes Fannie Mae and Freddie Mac securities. |
|
| | |
| Fannie Mae (In conservatorship) Third Quarter 2019 Form 10-Q | 98 |
|
| | |
| Notes to Condensed Consolidated Financial Statements | Fair Value |
In our condensed consolidated balance sheets, certain assets and liabilities are measured at fair value on a nonrecurring basis; that is, the instruments are not measured at fair value on an ongoing basis but are subject to fair value adjustments in certain circumstances (for example, when we evaluate loans for impairment). We had no0 Level 1 assets or liabilities held as of September 30, 20182019 or December 31, 20172018 that were measured at fair value on a nonrecurring basis. We held $863$620 million and $14$91 million in Level 2 assets as of September 30, 2019 and December 31, 2018, respectively, comprised of mortgage loans held for sale and nomortgage loans held for investment that were individually impaired. We had 0 Level 2 liabilities that were measured at fair value on a nonrecurring basis as of September 30, 2018 or2019 and December 31, 2017, respectively.
|
| | |
Fannie Mae (In conservatorship) Third Quarter 2018 Form 10-Q | 97 |
|
| | |
| Notes to Condensed Consolidated Financial Statements | Fair Value |
The following table displays valuation techniques for our Level 3 assets measured at fair value on a nonrecurring basis. The significant unobservable inputs related to these techniques primarily relate to collateral dependent valuations. The related ranges and weighted averages are not meaningful when aggregated as they vary significantly from property to property.
| | | | | Fair Value Measurements as of | | Fair Value Measurements as of |
| | Valuation Techniques | | September 30, 2018 | | December 31, 2017 | | Valuation Techniques | | September 30, 2019 | | December 31, 2018 |
| | | (Dollars in millions) | | (Dollars in millions)
|
| Nonrecurring fair value measurements: | | | | | | | | | |
| Mortgage loans held for sale, at lower of cost or fair value | Single Vendor | | $ | 623 |
| | $ | 1,880 |
| | | Consensus | | $ | 2,067 |
| | $ | 631 |
|
| | Consensus | | 1,623 |
| | 1,113 |
| | | Single Vendor | | 780 |
| | 1,119 |
|
| | Various | | 1 |
| | — |
| | | Various | | 1 |
| | — |
|
| Total mortgage loans held for sale, at lower of cost or fair value | | 2,247 |
| | 2,993 |
| | | 2,848 |
| | 1,750 |
|
| | | | | | |
| Single-family mortgage loans held for investment, at amortized cost | Internal Model | | 770 |
| | 1,623 |
| | | Internal Model | | 543 |
| | 818 |
|
| Multifamily mortgage loans held for investment, at amortized cost | Asset Manager Estimate | | 143 |
| | 163 |
| | | Asset Manager Estimate | | 70 |
| | 102 |
|
| | Various | | 22 |
| | 32 |
| | | Various | | 13 |
| | 40 |
|
| Total multifamily mortgage loans held for investment, at amortized cost | | 165 |
| | 195 |
| | | 83 |
| | 142 |
|
Acquired property, net:(1) | | | | | | | | | |
| Single-family | Accepted Offers | | 175 |
| | 218 |
| | | Accepted Offers | | 100 |
| | 151 |
|
| | Appraisals | | 431 |
| | 438 |
| | | Appraisals | | 386 |
| | 419 |
|
| | Walk Forwards | | 149 |
| | 222 |
| | | Walk Forwards | | 190 |
| | 181 |
|
| | Internal Model | | 270 |
| | 319 |
| | | Internal Model | | 152 |
| | 219 |
|
| | Various | | 38 |
| | 113 |
| | | Various | | 32 |
| | 41 |
|
| Total single-family | | 1,063 |
| | 1,310 |
| | | | | 860 |
| | 1,011 |
|
| Multifamily | Various | | 50 |
| | 19 |
| | | Various | | — |
| | 50 |
|
| Other assets | Various | | — |
| | 2 |
| | |
| Total nonrecurring assets at fair value | | $ | 4,295 |
| | $ | 6,142 |
| | | | | $ | 4,334 |
| | $ | 3,771 |
|
__________
| |
(1) | The most commonly used techniques in our valuation of acquired property are a proprietary home price model and third-party valuations (both current and walk forward). Based on the number of properties measured as of September 30, 2018,2019, these methodologies comprised approximately 78%83% of our valuations, while accepted offers comprised approximately 17%13% of our valuations. Based on the number of properties measured as of December 31, 2017,2018, these methodologies comprised approximately 77%82% of our valuations, while accepted offers comprised approximately 18%15% of our valuations. |
We use valuation techniques that maximize the use of observable inputs and minimize the use of unobservable inputs. See “Note 15, Fair Value” in our 20172018 Form 10-K for information on the valuation control processes and the valuation techniques we use for fair value measurement and disclosure as well as our basis for classifying these measurements as Level 1, Level 2 or Level 3 of the valuation hierarchy in more specific situations. We made no material changes to the valuation control processes or the valuation techniques for the nine months ended September 30, 2018.2019.
|
| | |
Fannie Mae (In conservatorship) Third Quarter 20182019 Form 10-Q | 9899 |
|
| | |
| | Notes to Condensed Consolidated Financial Statements | Fair Value |
Fair Value of Financial Instruments
The following table displays the carrying value and estimated fair value of our financial instruments. The fair value of financial instruments we disclose includes commitments to purchase multifamily and single-family mortgage loans that we do not record in our condensed consolidated balance sheets. The fair values of these commitments are included as “Mortgage loans held for investment, net of allowance for loan losses.” The disclosure excludes all non-financial instruments; therefore, the fair value of our financial assets and liabilities does not represent the underlying fair value of our total consolidated assets and liabilities.
| | | | As of September 30, 2018 | | As of September 30, 2019 |
| | Carrying
Value | | Quoted Prices in Active Markets for Identical Assets
(Level 1) | | Significant Other Observable Inputs
(Level 2) | | Significant Unobservable Inputs
(Level 3) | | Netting Adjustment | | Estimated
Fair Value | | Carrying
Value | | Quoted Prices in Active Markets for Identical Assets
(Level 1) | | Significant Other Observable Inputs
(Level 2) | | Significant Unobservable Inputs
(Level 3) | | Netting Adjustment | | Estimated
Fair Value |
| | (Dollars in millions) | | (Dollars in millions) |
| Financial assets: | | | | | | | | | | | | | | | | | | | | | | | |
| Cash and cash equivalents and restricted cash | $ | 51,031 |
| | $ | 32,982 |
| | $ | 18,049 |
| | $ | — |
| | $ | — |
| | $ | 51,031 |
| | $ | 64,498 |
| | $ | 51,623 |
| | $ | 12,875 |
| | $ | — |
| | $ | — |
| | $ | 64,498 |
|
| Federal funds sold and securities purchased under agreements to resell or similar arrangements | 26,598 |
| | — |
| | 26,598 |
| | — |
| | — |
| | 26,598 |
| | 23,176 |
| | — |
| | 23,176 |
| | — |
| | — |
| | 23,176 |
|
| Trading securities | 43,901 |
| | 37,328 |
| | 6,496 |
| | 77 |
| | — |
| | 43,901 |
| | 44,206 |
| | 36,016 |
| | 8,066 |
| | 124 |
| | — |
| | 44,206 |
|
| Available-for-sale securities | 3,537 |
| | — |
| | 2,501 |
| | 1,036 |
| | — |
| | 3,537 |
| | 2,690 |
| | — |
| | 1,855 |
| | 835 |
| | — |
| | 2,690 |
|
| Mortgage loans held for sale | 10,572 |
| | — |
| | 1,660 |
| | 9,527 |
| | — |
| | 11,187 |
| | 12,289 |
| | — |
| | 4,783 |
| | 8,672 |
| | — |
| | 13,455 |
|
| Mortgage loans held for investment, net of allowance for loan losses | 3,222,562 |
| | — |
| | 2,935,066 |
| | 210,018 |
| | — |
| | 3,145,084 |
| | 3,301,847 |
| | — |
| | 3,241,129 |
| | 134,732 |
| | — |
| | 3,375,861 |
|
| Advances to lenders | 4,022 |
| | — |
| | 4,020 |
| | 2 |
| | — |
| | 4,022 |
| | 6,937 |
| | — |
| | 6,935 |
| | 2 |
| | — |
| | 6,937 |
|
| Derivative assets at fair value | 353 |
| | — |
| | 3,010 |
| | 118 |
| | (2,775 | ) | | 353 |
| | 472 |
| | — |
| | 1,909 |
| | 226 |
| | (1,663 | ) | | 472 |
|
| Guaranty assets and buy-ups | 149 |
| | — |
| | — |
| | 368 |
| | — |
| | 368 |
| | 149 |
| | — |
| | — |
| | 319 |
| | — |
| | 319 |
|
| Total financial assets | $ | 3,362,725 |
| | $ | 70,310 |
| | $ | 2,997,400 |
| | $ | 221,146 |
| | $ | (2,775 | ) | | $ | 3,286,081 |
| | $ | 3,456,264 |
| | $ | 87,639 |
| | $ | 3,300,728 |
| | $ | 144,910 |
| | $ | (1,663 | ) | | $ | 3,531,614 |
|
| | | | | | | | | | | | | | |
| Financial liabilities: | | | | | | | | | | | | | | | | | | | | | | | |
| Federal funds purchased and securities sold under agreements to repurchase | $ | 749 |
| | $ | — |
| | $ | 749 |
| | $ | — |
| | $ | — |
| | $ | 749 |
| | $ | 1,125 |
| | $ | — |
| | $ | 1,125 |
| | $ | — |
| | $ | — |
| | $ | 1,125 |
|
| Short-term debt: | | | | | | | | | | | | | | | | | | | | | | | |
| Of Fannie Mae | 28,248 |
| | — |
| | 28,251 |
| | — |
| | — |
| | 28,251 |
| | 35,812 |
| | — |
| | 35,818 |
| | — |
| | — |
| | 35,818 |
|
| Of consolidated trusts | 274 |
| | — |
| | — |
| | 273 |
| | — |
| | 273 |
| |
| Long-term debt: | | | | | | | | | | | | | | | | | | | | | | | |
| Of Fannie Mae | 218,434 |
| | — |
| | 221,671 |
| | 771 |
| | — |
| | 222,442 |
| | 177,710 |
| | — |
| | 186,489 |
| | 847 |
| | — |
| | 187,336 |
|
| Of consolidated trusts | 3,127,414 |
| | — |
| | 2,989,699 |
| | 39,447 |
| | — |
| | 3,029,146 |
| | 3,248,336 |
| | — |
| | 3,273,846 |
| | 33,667 |
| | — |
| | 3,307,513 |
|
| Derivative liabilities at fair value | 276 |
| | — |
| | 2,904 |
| | 20 |
| | (2,648 | ) | | 276 |
| | 595 |
| | — |
| | 2,866 |
| | 28 |
| | (2,299 | ) | | 595 |
|
| Guaranty obligations | 162 |
| | — |
| | — |
| | 117 |
| | — |
| | 117 |
| | 161 |
| | — |
| | — |
| | 102 |
| | — |
| | 102 |
|
| Total financial liabilities | $ | 3,375,557 |
| | $ | — |
| | $ | 3,243,274 |
| | $ | 40,628 |
| | $ | (2,648 | ) | | $ | 3,281,254 |
| | $ | 3,463,739 |
| | $ | — |
| | $ | 3,500,144 |
| | $ | 34,644 |
| | $ | (2,299 | ) | | $ | 3,532,489 |
|
|
| | |
Fannie Mae (In conservatorship) Third Quarter 20182019 Form 10-Q | 99100 |
|
| | |
| | Notes to Condensed Consolidated Financial Statements | Fair Value |
| | | | As of December 31, 2017 | | As of December 31, 2018 |
| | Carrying
Value | | Quoted Prices in Active Markets for Identical Assets
(Level 1) | | Significant Other Observable Inputs
(Level 2) | | Significant Unobservable Inputs
(Level 3) | | Netting Adjustment | | Estimated
Fair Value | | Carrying
Value | | Quoted Prices in Active Markets for Identical Assets
(Level 1) | | Significant Other Observable Inputs
(Level 2) | | Significant Unobservable Inputs
(Level 3) | | Netting Adjustment | | Estimated
Fair Value |
| | (Dollars in millions) | | (Dollars in millions) |
| Financial assets: | | | | | | | | | | | | | | | | | | | | | | | |
| Cash and cash equivalents and restricted cash | $ | 60,260 |
| | $ | 35,060 |
| | $ | 25,200 |
| | $ | — |
| | $ | — |
| | $ | 60,260 |
| | $ | 49,423 |
| | $ | 34,073 |
| | $ | 15,350 |
| | $ | — |
| | $ | — |
| | $ | 49,423 |
|
| Federal funds sold and securities purchased under agreements to resell or similar arrangements | 19,470 |
| | — |
| | 19,470 |
| | — |
| | — |
| | 19,470 |
| | 32,938 |
| | — |
| | 32,938 |
| | — |
| | — |
| | 32,938 |
|
| Trading securities | 34,679 |
| | 29,222 |
| | 4,256 |
| | 1,201 |
| | — |
| | 34,679 |
| | 41,867 |
| | 35,502 |
| | 6,332 |
| | 33 |
| | — |
| | 41,867 |
|
| Available-for-sale securities | 4,843 |
| | — |
| | 3,530 |
| | 1,313 |
| | — |
| | 4,843 |
| | 3,429 |
| | — |
| | 2,477 |
| | 952 |
| | — |
| | 3,429 |
|
| Mortgage loans held for sale | 4,988 |
| | — |
| | 101 |
| | 5,333 |
| | — |
| | 5,434 |
| | 7,701 |
| | — |
| | 238 |
| | 7,856 |
| | — |
| | 8,094 |
|
| Mortgage loans held for investment, net of allowance for loan losses | 3,173,537 |
| | — |
| | 2,886,470 |
| | 315,719 |
| | — |
| | 3,202,189 |
| | 3,241,694 |
| | — |
| | 2,990,104 |
| | 216,404 |
| | — |
| | 3,206,508 |
|
| Advances to lenders | 4,938 |
| | — |
| | 4,936 |
| | 2 |
| | — |
| | 4,938 |
| | 3,356 |
| | — |
| | 3,354 |
| | 2 |
| | — |
| | 3,356 |
|
| Derivative assets at fair value | 171 |
| | — |
| | 4,274 |
| | 169 |
| | (4,272 | ) | | 171 |
| | 458 |
| | — |
| | 2,515 |
| | 209 |
| | (2,266 | ) | | 458 |
|
| Guaranty assets and buy-ups | 149 |
| | — |
| | — |
| | 436 |
| | — |
| | 436 |
| | 147 |
| | — |
| | — |
| | 356 |
| | — |
| | 356 |
|
| Total financial assets | $ | 3,303,035 |
| | $ | 64,282 |
| | $ | 2,948,237 |
| | $ | 324,173 |
| | $ | (4,272 | ) | | $ | 3,332,420 |
| | $ | 3,381,013 |
| | $ | 69,575 |
| | $ | 3,053,308 |
| | $ | 225,812 |
| | $ | (2,266 | ) | | $ | 3,346,429 |
|
| | | | | | | | | | | | | | |
| Financial liabilities: | | | | | | | | | | | | | | | | | | | | | | | |
| Short-term debt: | | | | | | | | | | | | | | | | | | | | | | | |
| Of Fannie Mae | $ | 33,377 |
| | $ | — |
| | $ | 33,379 |
| | $ | — |
| | $ | — |
| | $ | 33,379 |
| | $ | 24,896 |
| | $ | — |
| | $ | 24,901 |
| | $ | — |
| | $ | — |
| | $ | 24,901 |
|
| Of consolidated trusts | 379 |
| | — |
| | — |
| | 378 |
| | — |
| | 378 |
| |
| Long-term debt: | | | | | | | | | | | | | | | | | | | | | | | |
| Of Fannie Mae | 243,375 |
| | — |
| | 249,780 |
| | 837 |
| | — |
| | 250,617 |
| | 207,178 |
| | — |
| | 211,403 |
| | 771 |
| | — |
| | 212,174 |
|
| Of consolidated trusts | 3,052,923 |
| | — |
| | 3,014,250 |
| | 40,683 |
| | — |
| | 3,054,933 |
| | 3,159,846 |
| | — |
| | 3,064,239 |
| | 39,043 |
| | — |
| | 3,103,282 |
|
| Derivative liabilities at fair value | 328 |
| | — |
| | 5,272 |
| | 35 |
| | (4,979 | ) | | 328 |
| | 777 |
| | — |
| | 3,077 |
| | 15 |
| | (2,315 | ) | | 777 |
|
| Guaranty obligations | 258 |
| | — |
| | — |
| | 456 |
| | — |
| | 456 |
| | 160 |
| | — |
| | — |
| | 121 |
| | — |
| | 121 |
|
| Total financial liabilities | $ | 3,330,640 |
| | $ | — |
| | $ | 3,302,681 |
| | $ | 42,389 |
| | $ | (4,979 | ) | | $ | 3,340,091 |
| | $ | 3,392,857 |
| | $ | — |
| | $ | 3,303,620 |
| | $ | 39,950 |
| | $ | (2,315 | ) | | $ | 3,341,255 |
|
For a detailed description and classification of our financial instruments, see “Note 15, Fair Value” in our 20172018 Form 10-K.
Fair Value Option
We elected the fair value option for our credit risk sharing debt securities issued under our CAS series issued prior to January 1, 2016 and certain loans and debt that contain embedded derivatives that would otherwise require bifurcation. Additionally, we elected the fair value option for our credit risk-sharing securities accounted for as debt of Fannie Mae issued under our CAS series prior to January 1, 2016. Under the fair value option, we elected to carry these instruments at fair value instead of bifurcating the embedded derivative from such instruments.
We elected the fair value option for all long-term structured debt instruments that are issued in response to specific investor demand and have interest rates that are based on a calculated index or formula and are economically hedged with derivatives at the time of issuance. By electing the fair value option for these instruments, we are able to eliminate the volatility in our results of operations that would otherwise result from the accounting asymmetry created by recording these structured debt instruments at cost while recording the related derivatives at fair value.
Interest income for the mortgage loans is recorded in “Interest income—Mortgage loans” and interest expense for the debt instruments is recorded in “Interest expense—Long-term debt” in our condensed consolidated statements of operations and comprehensive income.
|
| | |
Fannie Mae (In conservatorship) Third Quarter 20182019 Form 10-Q | 100101 |
|
| | |
| | Notes to Condensed Consolidated Financial Statements | Fair Value |
The following table displays the fair value and unpaid principal balance of the financial instruments for which we have made fair value elections.
|
| | | | | | | | | | | | | | | | | | | | | | | | | | | | | | | | | | | |
| | As of |
| | September 30, 2018 | | December 31, 2017 |
| | Loans(1) | | Long-Term Debt of Fannie Mae | | Long-Term Debt of Consolidated Trusts | | Loans(1) | | Long-Term Debt of Fannie Mae | | Long-Term Debt of Consolidated Trusts |
| | (Dollars in millions) |
| Fair value | | $ | 9,153 |
| | | | $ | 7,251 |
| | | | $ | 24,948 |
| | | | $ | 10,596 |
| | | | $ | 8,186 |
| | | | $ | 30,493 |
| |
| Unpaid principal balance | | 9,140 |
| | | | 6,496 |
| | | | 23,245 |
| | | | 10,246 |
| | | | 7,368 |
| | | | 27,717 |
| |
__________ |
| | | | | | | | | | | | | | | | | | | | | | | | | | | | | | | | | | | |
| | As of |
| | September 30, 2019 | | December 31, 2018 |
| | Loans(1) | | Long-Term Debt of Fannie Mae | | Long-Term Debt of Consolidated Trusts | | Loans(1) | | Long-Term Debt of Fannie Mae | | Long-Term Debt of Consolidated Trusts |
| | (Dollars in millions) |
| Fair value | | $ | 8,183 |
| | | | $ | 6,041 |
| | | | $ | 22,719 |
| | | | $ | 8,922 |
| | | | $ | 6,826 |
| | | | $ | 23,753 |
| |
| Unpaid principal balance | | 7,866 |
| | | | 5,541 |
| | | | 20,380 |
| | | | 8,832 |
| | | | 6,241 |
| | | | 22,080 |
| |
| |
(1) | Includes nonaccrual loans with a fair value of $160$127 million and $227$161 million as of September 30, 20182019 and December 31, 2017,2018, respectively. The difference between unpaid principal balance and the fair value of these nonaccrual loans as of September 30, 20182019 and December 31, 20172018 was $19$11 million and $46$19 million, respectively. Includes loans that are 90 days or more past due with a fair value of $106$76 million and $159$102 million as of September 30, 20182019 and December 31, 2017,2018, respectively. The difference between unpaid principal balance and the fair value of these 90 or more days past due loans as of September 30, 20182019 and December 31, 20172018 was $15$9 million and $34$14 million, respectively. |
Changes in Fair Value under the Fair Value Option Election
We recorded gains of $95 million and $334 million for the three and nine months ended September 30, 2019, respectively, and losses of $63 million and $239 million for the three and nine months ended September 30, 2018, respectively, and gains of $30 million and $166 million for the three and nine months ended September 30, 2017, respectively, from changes in the fair value of loans recorded at fair value in “Fair value gains (losses), net” in our condensed consolidated statements of operations and comprehensive income.
We recorded losses of $245 million and $797 million for the three and nine months ended September 30, 2019, respectively, and gains of $128 million and $629 million for the three and nine months ended September 30, 2018, respectively, and gains of $35 million and losses of $422 million for the three and nine months ended September 30, 2017, respectively, from changes in the fair value of long-term debt recorded at fair value in “Fair value gains (losses), net” in our condensed consolidated statements of operations and comprehensive income.
|
| | |
| Fannie Mae (In conservatorship) Third Quarter 2019 Form 10-Q | 102 |
|
| | |
| Notes to Condensed Consolidated Financial Statements | Commitments and Contingencies |
14.13. Commitments and Contingencies
We are party to various types of legal actions and proceedings, including actions brought on behalf of various classes of claimants. We also are subject to regulatory examinations, inquiries and investigations, and other information gathering requests. In some of the matters, indeterminate amounts are sought. Modern pleading practice in the U.S. permits considerable variation in the assertion of monetary damages or other relief. Jurisdictions may permit claimants not to specify the monetary damages sought or may permit claimants to state only that the amount sought is sufficient to invoke the jurisdiction of the trial court. This variability in pleadings, together with our and our counsel’s actual experience in litigating or settling claims, leads us to conclude that the monetary relief that may be sought by plaintiffs bears little relevance to the merits or disposition value of claims.
We have substantial and valid defenses to the claims in the proceedings described below and intend to defend these matters vigorously. However, legal actions and proceedings of all types are subject to many uncertain factors that generally cannot be predicted with assurance. Accordingly, the outcome of any given matter and the amount or range of potential loss at particular points in time is frequently difficult to ascertain. Uncertainties can include how fact finders will evaluate documentary evidence and the credibility and effectiveness of witness testimony, and how courts will apply the law. Disposition valuations are also subject to the uncertainty of how opposing parties and their counsel may view the evidence and applicable law.
On a quarterly basis, we review relevant information about all pending legal actions and proceedings for the purpose of evaluating and revising our contingencies, accruals and disclosures. We establish an accrual only for matters when a loss is probable and we can reasonably estimate the amount of such loss. We are often unable to estimate the possible losses or ranges of losses, particularly for proceedings that are in their early stages of development, where plaintiffs seek indeterminate or unspecified damages, where there may be novel or unsettled legal questions relevant to the proceedings, or where settlement negotiations have not occurred or progressed. Given the uncertainties involved in any action or proceeding, regardless of whether we have established an accrual, the ultimate resolution of certain of these matters may be material to our operating results for a particular period, depending on, among other factors, the size of the loss or liability imposed and the level of our net income or loss for that period.
|
| | |
Fannie Mae (In conservatorship) Third Quarter 2018 Form 10-Q | 101 |
|
| | |
| Notes to Condensed Consolidated Financial Statements | Commitments and Contingencies |
In addition to the matters specifically described below, we are involved in a number of legal and regulatory proceedings that arise in the ordinary course of business that we do not expect will have a material impact on our business or financial condition. We have also advanced fees and expenses of certain current and former officers and directors in connection with various legal proceedings pursuant to our bylaws and indemnification agreements.
Senior Preferred Stock Purchase Agreements Litigation
A consolidated putative class action (“In re Fannie Mae/Freddie Mac Senior Preferred Stock Purchase Agreement Class Action Litigations”) and threetwo non-class action lawsuits filed by Fannie Mae and Freddie Mac shareholders against us, FHFA as our conservator, and Freddie Mac are pending in the U.S. District Court for the District of Columbia against us, FHFA as our conservator, and Freddie Mac thatColumbia. The lawsuits challenge the August 2012 amendment to each company’s senior preferred stock purchase agreement with Treasury.
In the consolidated class action and two of the non-class action suits, Arrowood Indemnity Company v. Fannie Mae and Fairholme Funds v. FHFA, plaintiffs filed amended complaints on November 1, 2017 alleging that the net worth sweep dividend provisions of the senior preferred stock that were implemented pursuant to the August 2012 amendments nullified certain of the shareholders’ rights, particularly the right to receive dividends. Plaintiffs seek unspecified damages, equitable and injunctive relief, and costs and expenses, including attorneys’ fees. Plaintiffs in the class action seek to represent several classes of preferred and/or common shareholders of Fannie Mae and/or Freddie Mac who held stock as of the public announcement of the August 2012 amendments. On September 28, 2018, the court dismissed all of the plaintiffs’ claims except for their claims for breach of an implied covenant of good faith and fair dealing. On October 15, 2018, defendants filed a motion for partial reconsideration. On May 16, 2019, the court denied this motion.
On May 21, 2018, apro se plaintiff in a third non-class action case, Angel v. Federal Home Loan Mortgage Corporation, filed a complaint for declaratory relief and compensatory damages against Fannie Mae (including certain members of its Board of Directors), Freddie Mac (including certain members of its Board of Directors) and FHFA, as conservator.conservator, in the U.S. District Court for the District of Columbia. Plaintiff in that case asserts claims for breach of contract, breach of implied covenants of good faith and fair dealing, and aiding and abetting the federal government in avoiding an alleged implicit guarantee of dividend payments. DefendantsOn March 6, 2019, the court granted defendants’ motion to dismiss and on March 18, 2019, plaintiff moved to dismissalter or amend the complaint on July 12, 2018.judgment and to file an amended complaint. On May 24, 2019, the court denied this motion. On June 19, 2019, plaintiff filed a notice of appeal of the court’s dismissal and related orders with the U.S. Court of Appeals for the District of Columbia Circuit.
Given the stage of these lawsuits, the substantial and novel legal questions that remain, and our substantial defenses, we are currently unable to estimate the reasonably possible loss or range of loss arising from this litigation.
|
| | |
Fannie Mae (In conservatorship) Third Quarter 20182019 Form 10-Q | 102103 |
|
| | |
| | Quantitative and Qualitative Disclosures about Market Risk |
Item 3. Quantitative and Qualitative Disclosures about Market Risk
Information about market risk is set forth in “MD&A—Risk Management—Market Risk Management, Includingincluding Interest Rate Risk Management.”
Item 4. Controls and Procedures
Overview
We are required under applicable laws and regulations to maintain controls and procedures, which include disclosure controls and procedures as well as internal control over financial reporting, as further described below.
Evaluation of Disclosure Controls and Procedures
Disclosure Controls and Procedures
Disclosure controls and procedures refer to controls and other procedures designed to provide reasonable assurance that information required to be disclosed in the reports we file or submit under the Exchange Act is recorded, processed, summarized and reported within the time periods specified in the rules and forms of the SEC. Disclosure controls and procedures include, without limitation, controls and procedures designed to provide reasonable assurance that information required to be disclosed by us in the reports that we file or submit under the Exchange Act is accumulated and communicated to management, including our Chief Executive Officer and Chief Financial Officer, as appropriate, to allow timely decisions regarding our required disclosure. In designing and evaluating our disclosure controls and procedures, management recognizes that any controls and procedures, no matter how well designed and operated, can provide only reasonable assurance of achieving the desired control objectives, and management was required to apply its judgment in evaluating and implementing possible controls and procedures.
EvaluationSenior Preferred Stock Purchase Agreements Litigation
A consolidated putative class action (“In re Fannie Mae/Freddie Mac Senior Preferred Stock Purchase Agreement Class Action Litigations”) and two non-class action lawsuits filed by Fannie Mae and Freddie Mac shareholders against us, FHFA as our conservator, and Freddie Mac are pending in the U.S. District Court for the District of Disclosure ControlsColumbia. The lawsuits challenge the August 2012 amendment to each company’s senior preferred stock purchase agreement with Treasury.
In the consolidated class action and Procedures
As required by Rule 13a-15 under the Exchange Act, management has evaluated, with the participation of our Chief Executive Officer and Chief Financial Officer, the effectiveness of our disclosure controls and procedures as in effect as of September 30, 2018, the endtwo of the period covered by this report. As a resultnon-class action suits, Arrowood Indemnity Company v. Fannie Mae and Fairholme Funds v. FHFA, plaintiffs filed amended complaints on November 1, 2017 alleging that the net worth sweep dividend provisions of management’s evaluation, our Chief Executive Officerthe senior preferred stock that were implemented pursuant to the August 2012 amendments nullified certain of the shareholders’ rights, particularly the right to receive dividends. Plaintiffs seek unspecified damages, equitable and Chief Financial Officer concluded that our disclosure controlsinjunctive relief, and procedures were not effective at a reasonable assurance level ascosts and expenses, including attorneys’ fees. Plaintiffs in the class action seek to represent several classes of September 30, 2018 preferred and/or common shareholders of Fannie Mae and/or Freddie Mac who held stock as of the date of filing this report.
Our disclosure controls and procedures were not effective as of September 30, 2018 or aspublic announcement of the dateAugust 2012 amendments. On September 28, 2018, the court dismissed all of filingthe plaintiffs’ claims except for their claims for breach of an implied covenant of good faith and fair dealing. On October 15, 2018, defendants filed a motion for partial reconsideration. On May 16, 2019, the court denied this report because they did not adequately ensuremotion.
On May 21, 2018, aplaintiff in a non-class action case, Angel v. Federal Home Loan Mortgage Corporation, filed a complaint for declaratory relief and compensatory damages against Fannie Mae (including certain members of its Board of Directors), Freddie Mac (including certain members of its Board of Directors) and FHFA, as conservator, in the accumulationU.S. District Court for the District of Columbia. Plaintiff in that case asserts claims for breach of contract, breach of implied covenants of good faith and communication to management of information known to FHFA that is needed to meet our disclosure obligations underfair dealing, and aiding and abetting the federal securities laws. Asgovernment in avoiding an alleged implicit guarantee of dividend payments. On March 6, 2019, the court granted defendants’ motion to dismiss and on March 18, 2019, plaintiff moved to alter or amend the judgment and to file an amended complaint. On May 24, 2019, the court denied this motion. On June 19, 2019, plaintiff filed a result, we were not able to rely upon the disclosure controls and procedures that were in place asnotice of September 30, 2018 or asappeal of the datecourt’s dismissal and related orders with the U.S. Court of this filing,Appeals for the District of Columbia Circuit.
Given the stage of these lawsuits, the substantial and we continue to have a material weakness innovel legal questions that remain, and our internal control over financial reporting. This material weakness is described in more detail below under “Description of Material Weakness.” Based on discussions with FHFA and the structural nature of this material weakness, we do not expect to remediate this material weakness whilesubstantial defenses, we are under conservatorship.
Descriptioncurrently unable to estimate the reasonably possible loss or range of Material Weakness
The Public Company Accounting Oversight Board’s Auditing Standard 2201 defines a material weakness as a deficiency, or a combination of deficiencies, in internal control over financial reporting, such that there is a reasonable possibility that a material misstatement of the company’s annual or interim financial statements will not be prevented or detected on a timely basis.
Management has determined that we continued to have the following material weakness as of September 30, 2018 and as of the date of filingloss arising from this report:
| |
• | Disclosure Controls and Procedures. We have been under the conservatorship of FHFA since September 6, 2008. Under the GSE Act, FHFA is an independent agency that currently functions as both our conservator and our regulator with respect to our safety, soundness and mission. Because of the nature of the conservatorship under the GSE Act, which places us under the “control” of FHFA (as that term is defined by securities laws), some of the information that we may need to meet our disclosure obligations may be solely within the knowledge of FHFA. As our conservator, FHFA has the power to take actions
|
|
| | |
Fannie Mae Third Quarter 2018 Form 10-Q | 103 |
without our knowledge that could be material to our shareholders and other stakeholders, and could significantly affect our financial performance or our continued existence as an ongoing business. Although we and FHFA attempted to design and implement disclosure policies and procedures that would account for the conservatorship and accomplish the same objectives as a disclosure controls and procedures policy of a typical reporting company, there are inherent structural limitations on our ability to design, implement, test or operate effective disclosure controls and procedures. As both our regulator and our conservator under the GSE Act, FHFA is limited in its ability to design and implement a complete set of disclosure controls and procedures relating to Fannie Mae, particularly with respect to current reporting pursuant to Form 8-K. Similarly, as a regulated entity, we are limited in our ability to design, implement, operate and test the controls and procedures for which FHFA is responsible.
Due to these circumstances, we have not been able to update our disclosure controls and procedures in a manner that adequately ensures the accumulation and communication to management of information known to FHFA that is needed to meet our disclosure obligations under the federal securities laws, including disclosures affecting our condensed consolidated financial statements. As a result, we did not maintain effective controls and procedures designed to ensure complete and accurate disclosure as required by GAAP as of September 30, 2018 or as of the date of filing this report. Based on discussions with FHFA and the structural nature of this weakness, we do not expect to remediate this material weakness while we are under conservatorship.
Mitigating Actions Related to Material Weakness
As described above under “Description of Material Weakness,” we continue to have a material weakness in our internal control over financial reporting relating to our disclosure controls and procedures. However, we and FHFA have engaged in the following practices intended to permit accumulation and communication to management of information needed to meet our disclosure obligations under the federal securities laws:
FHFA has established the Division of Conservatorship, which is intended to facilitate operation of the company with the oversight of the conservator.
We have provided drafts of our SEC filings to FHFA personnel for their review and comment prior to filing. We also have provided drafts of external press releases, statements and speeches to FHFA personnel for their review and comment prior to release.
FHFA personnel, including senior officials, have reviewed our SEC filings prior to filing, including this quarterly report on Form 10-Q for the quarter ended September 30, 2018 (“Third Quarter 2018 Form 10-Q”), and engaged in discussions regarding issues associated with the information contained in those filings. Prior to filing our Third Quarter 2018 Form 10-Q, FHFA provided Fannie Mae management with a written acknowledgment that it had reviewed the Third Quarter 2018 Form 10-Q, and it was not aware of any material misstatements or omissions in the Third Quarter 2018 Form 10-Q and had no objection to our filing the Third Quarter 2018 Form 10-Q.
The Director of FHFA and our Chief Executive Officer have been in frequent communication and meet on a regular basis.
FHFA representatives attend meetings frequently with various groups within the company to enhance the flow of information and to provide oversight on a variety of matters, including accounting, credit and market risk management, external communications and legal matters.
Senior officials within FHFA’s Office of the Chief Accountant have met frequently with our senior finance executives regarding our accounting policies, practices and procedures.
Changes in Internal Control Over Financial Reporting
Management has evaluated, with the participation of our Chief Executive Officer and Chief Financial Officer, whether any changes in our internal control over financial reporting that occurred during our last fiscal quarter have materially affected, or are reasonably likely to materially affect, our internal control over financial reporting. There have been no changes in our internal control over financial reporting since June 30, 2018 that management believes have materially affected, or are reasonably likely to materially affect, our internal control over financial reporting.litigation.
|
| | |
Fannie Mae (In conservatorship) Third Quarter 20182019 Form 10-Q | 104103 |
|
| | |
| | | Other InformationQuantitative and Qualitative Disclosures about Market Risk |
PART II—OTHER INFORMATIONItem 3. Quantitative and Qualitative Disclosures about Market Risk
Information about market risk is set forth in “MD&A—Risk Management—Market Risk Management, including Interest Rate Risk Management.”
Item 1. Legal Proceedings4. Controls and Procedures
The information in this item supplements and updates information regarding certain legal proceedings set forth in “Legal Proceedings” in our 2017 Form 10-K, our First Quarter 2018 Form 10-Q and our Second Quarter 2018 Form 10-Q. We also provide information regarding material legal proceedings in “Note 14, Commitments and Contingencies,” which is incorporated herein by reference. In addition to the matters specifically described or incorporated by reference in this item, we are involved in a number of legal and regulatory proceedings that arise in the ordinary course of business that do not have a material impact on our business. Litigation claims and proceedings of all types are subject to many factors that generally cannot be predicted accurately.Overview
We establish an accrual for legal claims only when a loss is probableare required under applicable laws and we can reasonably estimate the amount of such loss. The actual costs of resolving legal claims may be substantially higher or lower than the amounts accrued for those claims. If certain of these matters are determined against us, FHFA or Treasury, it could have a material adverse effect on our results of operations, liquidityregulations to maintain controls and procedures, which include disclosure controls and procedures as well as internal control over financial condition, including our net worth.reporting, as further described below.
Senior Preferred Stock Purchase Agreements Litigation
A consolidated putative class action (“In re Fannie Mae/Freddie Mac Senior Preferred Stock Purchase Agreement Class Action Litigations”) and two non-class action lawsuits filed by Fannie Mae and Freddie Mac shareholders against us, FHFA as our conservator, and Freddie Mac are pending in the U.S. District Court for the District of Columbia. The lawsuits challenge the August 2012 amendment to each company’s senior preferred stock purchase agreement with Treasury.
In the consolidated class action and two of the non-class action suits, Arrowood Indemnity Company v. Fannie Mae and Fairholme Funds v. FHFA, plaintiffs filed amended complaints on November 1, 2017 alleging that the net worth sweep dividend provisions of the senior preferred stock that were implemented pursuant to the August 2012 amendments nullified certain of the shareholders’ rights, particularly the right to receive dividends. Plaintiffs seek unspecified damages, equitable and injunctive relief, and costs and expenses, including attorneys’ fees. Plaintiffs in the class action seek to represent several classes of preferred and/or common shareholders of Fannie Mae and/or Freddie Mac who held stock as of the public announcement of the August 2012 amendments. On September 28, 2018, the court dismissed all of the plaintiffs’ claims except for their claims for breach of an implied covenant of good faith and fair dealing. On October 15, 2018, defendants filed a motion for partial reconsideration. On May 16, 2019, the court denied this motion.
On May 21, 2018, aplaintiff in a non-class action case, Angel v. Federal Home Loan Mortgage Corporation, filed a complaint for declaratory relief and compensatory damages against Fannie Mae (including certain members of its Board of Directors), Freddie Mac (including certain members of its Board of Directors) and FHFA, as conservator, in the U.S. District Court for the District of Columbia. Plaintiff in that case asserts claims for breach of contract, breach of implied covenants of good faith and fair dealing, and aiding and abetting the federal government in avoiding an alleged implicit guarantee of dividend payments. On March 6, 2019, the court granted defendants’ motion to dismiss and on March 18, 2019, plaintiff moved to alter or amend the judgment and to file an amended complaint. On May 24, 2019, the court denied this motion. On June 19, 2019, plaintiff filed a notice of appeal of the court’s dismissal and related orders with the U.S. Court of Appeals for the District of Columbia Circuit.
Given the stage of these lawsuits, the substantial and novel legal questions that remain, and our substantial defenses, we are currently unable to estimate the reasonably possible loss or range of loss arising from this litigation.
|
| | |
| Fannie Mae (In conservatorship) Third Quarter 2019 Form 10-Q | 103 |
|
| | |
| Quantitative and Qualitative Disclosures about Market Risk |
Item 3. Quantitative and Qualitative Disclosures about Market Risk
Information about market risk is set forth in “MD&A—Risk Management—Market Risk Management, including Interest Rate Risk Management.”
Item 4. Controls and Procedures
Overview
We are required under applicable laws and regulations to maintain controls and procedures, which include disclosure controls and procedures as well as internal control over financial reporting, as further described below.
Evaluation of Disclosure Controls and Procedures
Disclosure Controls and Procedures
Disclosure controls and procedures refer to controls and other procedures designed to provide reasonable assurance that information required to be disclosed in the reports we file or submit under the Exchange Act is recorded, processed, summarized and reported within the time periods specified in the rules and forms of the SEC. Disclosure controls and procedures include, without limitation, controls and procedures designed to provide reasonable assurance that information required to be disclosed by us in the reports that we file or submit under the Exchange Act is accumulated and communicated to management, including our Chief Executive Officer and Chief Financial Officer, as appropriate, to allow timely decisions regarding our required disclosure. In designing and evaluating our disclosure controls and procedures, management recognizes that any controls and procedures, no matter how well designed and operated, can provide only reasonable assurance of achieving the desired control objectives, and management was required to apply its judgment in evaluating and implementing possible controls and procedures.
Evaluation of Disclosure Controls and Procedures
As required by Rule 13a-15 under the Exchange Act, management has evaluated, with the participation of our Chief Executive Officer and Chief Financial Officer, the effectiveness of our disclosure controls and procedures as in effect as of September 30, 2019, the end of the period covered by this report. As a result of management’s evaluation, our Chief Executive Officer and Chief Financial Officer concluded that our disclosure controls and procedures were not effective at a reasonable assurance level as of September 30, 2019 or as of the date of filing this report.
Our disclosure controls and procedures were not effective as of September 30, 2019 or as of the date of filing this report because they did not adequately ensure the accumulation and communication to management of information known to FHFA that is needed to meet our disclosure obligations under the federal securities laws. As a result, we were not able to rely upon the disclosure controls and procedures that were in place as of September 30, 2019 or as of the date of this filing, and we continue to have a material weakness in our internal control over financial reporting. This material weakness is described in more detail below under “Description of Material Weakness.” Based on discussions with FHFA and the structural nature of this material weakness, we do not expect to remediate this material weakness while we are under conservatorship.
Description of Material Weakness
The Public Company Accounting Oversight Board’s Auditing Standard 2201 defines a material weakness as a deficiency, or a combination of deficiencies, in internal control over financial reporting, such that there is a reasonable possibility that a material misstatement of the company’s annual or interim financial statements will not be prevented or detected on a timely basis.
Management has determined that we continued to have the following material weakness as of September 30, 2019 and as of the date of filing this report:
| |
| • | Disclosure Controls and Procedures. We have been under the conservatorship of FHFA since September 6, 2008. Under the GSE Act, FHFA is an independent agency that currently functions as both our conservator and our regulator with respect to our safety, soundness and mission. Because of the nature of the conservatorship under the GSE Act, which places us under the “control” of FHFA (as that term is defined by securities laws), some of the information that we may need to meet our disclosure obligations may be solely within the knowledge of FHFA. As our conservator, FHFA has the power to take actions without our knowledge that could be material to our shareholders and other stakeholders, and could significantly affect our financial performance or our continued existence as an ongoing business. Although we and FHFA attempted to design and implement disclosure policies and procedures that would account for the conservatorship and accomplish the same objectives as a disclosure controls and procedures policy of a typical reporting company, there are inherent structural limitations on our ability to design, implement, test or operate |
effective disclosure controls and procedures. As both our regulator and our conservator under the GSE Act, FHFA is limited in its ability to design and implement a complete set of disclosure controls and procedures relating to Fannie Mae, particularly with respect to current reporting pursuant to Form 8-K. Similarly, as a regulated entity, we are limited in our ability to design, implement, operate and test the controls and procedures for which FHFA is responsible.
Due to these circumstances, we have not been able to update our disclosure controls and procedures in a manner that adequately ensures the accumulation and communication to management of information known to FHFA that is needed to meet our disclosure obligations under the federal securities laws, including disclosures affecting our condensed consolidated financial statements. As a result, we did not maintain effective controls and procedures designed to ensure complete and accurate disclosure as required by GAAP as of September 30, 2019 or as of the date of filing this report. Based on discussions with FHFA and the structural nature of this weakness, we do not expect to remediate this material weakness while we are under conservatorship.
Mitigating Actions Related to Material Weakness
As described above under “Description of Material Weakness,” we continue to have a material weakness in our internal control over financial reporting relating to our disclosure controls and procedures. However, we and FHFA have engaged in the following practices intended to permit accumulation and communication to management of information needed to meet our disclosure obligations under the federal securities laws:
FHFA has established the Division of Conservatorship, which is intended to facilitate operation of the company with the oversight of the conservator.
We have provided drafts of our SEC filings to FHFA personnel for their review and comment prior to filing. We also have provided drafts of external press releases, statements and speeches to FHFA personnel for their review and comment prior to release.
FHFA personnel, including senior officials, have reviewed our SEC filings prior to filing, including this quarterly report on Form 10-Q for the quarter ended September 30, 2019 (“Third Quarter 2019 Form 10-Q”), and engaged in discussions regarding issues associated with the information contained in those filings. Prior to filing our Third Quarter 2019 Form 10-Q, FHFA provided Fannie Mae management with written acknowledgment that it had reviewed the Third Quarter 2019 Form 10-Q, and it was not aware of any material misstatements or omissions in the Third Quarter 2019 Form 10-Q and had no objection to our filing the Third Quarter 2019 Form 10-Q.
Our senior management meets regularly with senior leadership at FHFA, including, but not limited to, the Director.
FHFA representatives attend meetings frequently with various groups within the company to enhance the flow of information and to provide oversight on a variety of matters, including accounting, credit and market risk management, external communications and legal matters.
Senior officials within FHFA’s Office of the Chief Accountant have met frequently with our senior finance executives regarding our accounting policies, practices and procedures.
Changes in Internal Control Over Financial Reporting
Overview
Management has evaluated, with the participation of our Chief Executive Officer and Chief Financial Officer, whether any changes in our internal control over financial reporting that occurred during our last fiscal quarter have materially affected, or are reasonably likely to materially affect, our internal control over financial reporting. Below we describe changes in our internal control over financial reporting since June 30, 2019 that management believes have materially affected, or are reasonably likely to materially affect, our internal control over financial reporting.
In the ordinary course of business, we review our system of internal control over financial reporting and make changes that we believe will improve these controls and increase efficiency, while continuing to ensure that we maintain effective internal controls. Changes may include implementing new, more efficient systems, automating manual processes and updating existing systems. For example, we are currently implementing changes to various financial system applications in stages across the company. As we continue to implement these changes, each implementation may become a significant component of our internal control over financial reporting.
Treasury Cash Management System
In July 2019, we consolidated our treasury systems used for cash activities, liquidity management and bank account administration into a fully integrated new treasury cash management system. In connection with this implementation and related business process changes, we redesigned or replaced multiple existing controls that were previously considered effective with new or modified controls and, in some cases, removed controls that are no longer applicable. We will continue to monitor and test these new and modified controls for adequate design and operating effectiveness. This new system was
|
| | |
| Fannie Mae Third Quarter 2019 Form 10-Q | 104 |
operating during the third quarter of 2019 and was used to prepare our third quarter 2019 condensed consolidated financial statements included in this report.
PART II—OTHER INFORMATION
Item 1. Legal Proceedings
The information in this item supplements and updates information regarding certain legal proceedings set forth in “Legal Proceedings” in our 2018 Form 10-K, our First Quarter 2019 Form 10-Q and our Second Quarter 2019 Form 10-Q. We also provide information regarding material legal proceedings in “Note 13, Commitments and Contingencies,” which is incorporated herein by reference. In addition to the matters specifically described or incorporated by reference in this item, we are involved in a number of legal and regulatory proceedings that arise in the ordinary course of business that we do not expect will have a material impact on our business or financial condition. However, litigation claims and proceedings of all types are subject to many factors and their outcome and effect on our business and financial condition generally cannot be predicted accurately.
We establish an accrual for legal claims only when a loss is probable and we can reasonably estimate the amount of such loss. The actual costs of resolving legal claims may be substantially higher or lower than the amounts accrued for those claims. If certain of these matters are determined against us, FHFA or Treasury, it could have a material adverse effect on our results of operations, liquidity and financial condition, including our net worth.
Senior Preferred Stock Purchase Agreements Litigation
Between June 2013 and August 2018, preferred and common stockholders of Fannie Mae and Freddie Mac filed lawsuits in multiple federal courts against one or more of the United States, Treasury and FHFA, challenging actions taken by the defendants relating to the Fannie Mae and Freddie Mac senior preferred stock purchase agreements and the conservatorships of Fannie Mae and Freddie Mac. Some of these lawsuits also contain claims against Fannie Mae and Freddie Mac. The legal claims being advanced by one or more of these lawsuits include challenges to the net worth sweep dividend provisions of the senior preferred stock that were implemented pursuant to the August 2012 amendments to the agreements, the payment of dividends to Treasury under the net worth sweep dividend provisions, and FHFA’s decision to require Fannie Mae and Freddie Mac to draw funds from Treasury in order to pay dividends to Treasury prior to the August 2012 amendments. Some of the lawsuits also challenge the constitutionality of FHFA’s structure. The plaintiffs seek various forms of equitable and injunctive relief, including rescission of the August 2012 amendments, as well as damages. The cases that remain pending or were terminated after June 30, 20182019 are as follows:
District of Columbia. Fannie Mae is a defendant in fourthree cases pending in the U.S. District Court for the District of Columbia—a consolidated putative class action and threetwo additional cases. In all three cases, Fannie Mae and Freddie Mac stockholders filed amended complaints on November 1, 2017 against us, FHFA as our conservator and Freddie Mac. On September 28, 2018, the court dismissed all of the plaintiffs’ claims in three of these cases, (including the consolidated class action), except for their claims for breach of an implied covenant of good faith and fair dealing.dealing, and on May 16, 2019, the court denied defendants’ motion for partial reconsideration. In thea fourth case whichthat was filed in the U.S. District Court for the District of Columbia on May 21, 2018, defendants filed athe court granted defendants’ motion to dismiss on March 6, 2019, and on March 18, 2019, plaintiff moved to alter or amend the case on July 12, 2018.judgment and to file an amended complaint. On May 24, 2019, the court denied this motion. On June 19, 2019, plaintiff filed a notice of appeal of the court’s dismissal and related orders with the U.S. Court of Appeals for the District of Columbia Circuit. All four cases are described in “Note 14,13, Commitments and Contingencies.”
Northern District of Iowa. On March 27, 2017, the U.S. District Court for the Northern District of Iowa dismissed the case pending before it. On August 23, 2018, the U.S. Court of Appeals for the Eighth Circuit affirmed the district court’s judgment.
Southern District of Texas. On May 22, 2017,October 20, 2016, preferred and common stockholders filed a complaint against FHFA and Treasury in the U.S. District Court for the Southern District of TexasTexas. On May 22, 2017, the court dismissed the case pending before it.case. On July 16, 2018,September 6, 2019, the U.SU.S. Court of Appeals for the Fifth Circuit, sitting en banc, affirmed the district court’s dismissal of claims against Treasury, but reversed the dismissal of plaintiffs’claims against FHFA. The court held that plaintiffs could pursue their claim that FHFA exceeded its statutory claims seeking to invalidatepowers as conservator when it implemented the net worth sweep dividend provisions. Plaintiffs and FHFA filed petitions for rehearing en bancprovisions of the senior preferred stock purchase agreements in August 2018.2012. The court also held that the provision of the Housing and Economic Recovery Act that insulates the FHFA Director from removal without cause violates constitutional separation of powers principles and, thus, that the FHFA Director may be removed by the president for any reason. The court held that the appropriate remedy for this violation is to declare the provision severed from the statute. Plaintiffs have requested that the Supreme Court review the constitutional claim, arguing that the relief granted by Fifth Circuit is insufficient, and the government has requested review of the decision to allow the plaintiffs’ statutory claims to go forward.
Western District of Michigan. On June 1, 2017, preferred and common stockholders of Fannie Mae and Freddie Mac filed a complaint for declaratory and injunctive relief against FHFA and Treasury in the U.S. District Court for the Western District of Michigan. The complaint asks the court to set aside the net worth sweep dividend provisions of the senior preferred stock purchase agreements. FHFA and Treasury moved to dismiss the case on September 8, 2017, and plaintiffs filed a motion for summary judgment on October 6, 2017.
District of Minnesota. On June 22, 2017, preferred and common stockholders of Fannie Mae and Freddie Mac filed a complaint for declaratory and injunctive relief against FHFA and Treasury in the U.S. District Court for the District of Minnesota. The complaint asks the court to set aside the net worth sweep dividend provisions of the senior preferred stock purchase agreements. The court dismissed the case on July 6, 2018, and plaintiffs filed a notice of appeal with the U.S. Court of Appeals for the Eighth Circuit on July 10, 2018.
|
| | |
| Fannie Mae Third Quarter 2019 Form 10-Q | 105 |
Eastern District of Pennsylvania. On August 16, 2018, common stockholders of Fannie Mae and Freddie Mac filed a complaint for declaratory and injunctive relief against FHFA and Treasury in the U.S. District Court for the
|
| | |
Fannie Mae Third Quarter 2018 Form 10-Q | 105 |
Eastern District of Pennsylvania. The complaint asksFHFA and Treasury moved to dismiss the court to set aside the net worth sweep dividend provisions of the senior preferred stock purchase agreements.case on November 16, 2018, and plaintiffs filed a motion for summary judgment on December 21, 2018.
U.S. Court of Federal Claims. Fannie Mae is a nominal defendant in three actions filedNumerous cases are pending against the United States in the U.S. Court of Federal Claims:Claims. Fannie Mae is a nominal defendant in three of these cases: Fisher v. United States of America, filed on December 2, 2013; Rafter v. United States of America, filed on August 14, 2014; and Perry Capital LLC v. United States of America, filed on August 15, 2018. Plaintiffs in these cases allege that the net worth sweep dividend provisions of the senior preferred stock that were implemented pursuant to the August 2012 amendment to the senior preferred stock purchase agreement constitute a taking of Fannie Mae’s property without just compensation in violation of the U.S. Constitution. The Fisher plaintiffs are pursuing this claim derivatively on behalf of Fannie Mae, while the Rafter and Perry Capital plaintiffs are pursing the claim both derivatively and directly against the United States. Plaintiffs in Rafter also allege direct and derivative breach of contract claims against the government. The Perry Capital plaintiffs allege similar breach of contract claims, as well as breach of fiduciary duty claims against the government. Plaintiffs in Fisher request just compensation to Fannie Mae in an unspecified amount. Plaintiffs in Rafter and Perry Capital seek just compensation for themselves on their direct claims and payment of damages to Fannie Mae on their derivative claims. The United States filed a motion to dismiss the Fisher and Rafter cases on August 1, 2018.
District of Delaware.LIBOR Lawsuit
As described further in our 2018 Form 10-K, in October 2013, Fannie Mae isfiled a nominal defendant in Jacobs v. FHFA,filed on August 17, 2015 against FHFA and Treasurylawsuit in the U.S. District Court for the Southern District of Delaware. Plaintiffs allege that the net worth sweep dividend provisionsNew York against a number of banks and other defendants alleging they manipulated LIBOR. On July 22, 2019, we entered into an agreement resolving our claims against two of the senior preferred stock that were implemented pursuantdefendants in this lawsuit: Citigroup Inc. and Citibank, N.A. The financial impact of the settlement was not material to the August 2012 amendments to the agreements violate Delaware law. Plaintiffs are pursuing this claim derivatively on behalf of Fannie Mae and directly against the government. The court dismissed the case on November 27, 2017, and plaintiffs filed a notice of appeal with the U.S. Court of Appeals for the Third Circuit on December 22, 2017.our financial statements.
Item 1A. Risk Factors
In addition to the information in this report, you should carefully consider the risks relating to our business that we identify in “Risk Factors” in our 20172018 Form 10-K. This section supplements and updates that discussion. Please alsodiscussion but does not repeat all of the risk factors described in our 2018 Form 10-K. Also refer to “MD&A—Risk Management”Management,” “MD&A—Single-Family Business” and “MD&A—Multifamily Business” in our 2018 Form 10-K and in this report and in our 2017 Form 10-K for more detailed descriptions of the primary risks to our business and how we seek to manage those risks.
The risks we face could materially adversely affect our business, results of operations, financial condition, liquidity and net worth, and could cause our actual results to differ materially from our past results or the results contemplated by any forward-looking statements containedwe make. We believe the risks described in the sections of this report. However,report and our 2018 Form 10-K identified above are the most significant we face; however, these are not the only risks we face. In addition to the risks we discuss belowin this report and in our 20172018 Form 10-K, we face risks and uncertainties not currently known to us or that we currently believe are immaterial.
GSE and Conservatorship Risk
The Single Security Initiative may adverselyfuture of our company is uncertain.
There continues to be significant uncertainty regarding the future of our company, including how long the company will continue to exist in its current form, the extent of our role in the market, how long we will be in conservatorship, what form we will have, what ownership interest, if any, our current common and preferred stockholders will hold in us after the conservatorship is terminated, and whether we will continue to exist following conservatorship. The conservatorship is indefinite in duration and the timing, conditions and likelihood of our emerging from conservatorship are uncertain. Our conservatorship could terminate through a receivership. Termination of the conservatorship, other than in connection with a receivership, requires Treasury’s consent under the senior preferred stock purchase agreement.
On September 5, 2019, Treasury released its plan to reform the housing finance system. The Treasury plan, which is described in “MD&A—Legislation and Regulation—Housing Finance Reform,” is far-reaching in scope and could have a significant impact on our structure, our role in the secondary mortgage market, our capitalization, our business and our competitive environment. For example:
Some of the recommendations in the Treasury plan, if implemented, could significantly restrict our business activities, increase the competition we face, affect the credit risk of our mortgage acquisitions, affect our pricing, impose additional requirements on our business, increase our costs or have other impacts that could negatively affect our financial results and contribute to declines incondition. For example, the liquidity or market value of our MBS. The Single Security Initiative also increases our counterparty credit risk and operational risk.
In 2014, FHFA directed Fannie Maeplan includes recommendations that we and Freddie Mac should each be required to developoperate a singlecash window for smaller lenders, should be prohibited from offering volume-based pricing discounts or similar incentives, and should be required to maintain a nationwide presence.
The Treasury plan also contains recommendations for administrative and legislative reforms to limit our single-family activities and restrict our multifamily footprint. The plan recommends that FHFA assess whether each of our current single-family products, services and other activities, including our support for cash-out refinancings, investor loans,
and higher principal balance loans, should continue to benefit from support under our senior preferred stock purchase agreement. It also recommends that FHFA and Treasury consider amendments to the senior preferred stock purchase agreement to further limit the type and volume of multifamily loans we guarantee.
Regulatory capital requirements that become applicable to us as contemplated by the Treasury plan, depending on their terms, may substantially constrain our business and activities or adversely affect our financial results. For example, if the final capital rule requires us to hold more capital than FHFA’s proposed capital framework, we may be required to increase our pricing or take other actions to maintain appropriate risk-adjusted returns, which may in turn adversely affect our competitive position and financial results. This effect may be more pronounced in a stressed economic environment.
While the Treasury plan contemplates FHFA ending our conservatorship, implementing the plan will take time and a great deal of effort, and a number of factors may keep us from meeting the preconditions for exiting conservatorship, otherwise prevent our exiting conservatorship, or delay any exit from conservatorship as contemplated under the plan, including the following:
| |
| ◦ | we may be unable to retain or raise sufficient capital; |
| |
| ◦ | we may be unable to meet additional requirements FHFA determines are necessary for us to operate in a safe and sound manner; |
| |
| ◦ | possible future changes in leadership at FHFA or the Administration may result in changes in FHFA’s or Treasury’s willingness to pursue the administrative reform recommendations in the Treasury plan; |
| |
| ◦ | legislation may pass that prevents the Treasury plan from being implemented; |
| |
| ◦ | our exit from conservatorship may be delayed because we need to address operational challenges or the loss of regulatory exemptions or protections resulting from an exit from conservatorship. |
The Treasury plan indicates one potential approach to recapitalizing us would be to place us in receivership to facilitate a restructuring of our capital structure. In the event of such a receivership, existing holders of our preferred and common mortgage-backed securitystock would have no further ownership interest in us.
We expect the Administration, FHFA and Congress to continue to consider housing finance reform, which could result in significant changes in our structure and role in the future, as well as other changes to our business and competitive environment.
In addition to or in connection with the recommendations set forth in the Treasury plan, Congress, FHFA or other agencies may consider legislation, regulation or administrative actions aimed at increasing the competition we face, reducing our market share, expanding our obligations to provide funds to Treasury, constraining our business operations, or subjecting us to new obligations that is fungible with then-outstanding Fannie Mae guaranteed mortgage pass-through certificatescould impose substantial burdens or adversely affect our results of operations or financial condition. We cannot predict the timing or final content of housing finance reform legislation or other legislation, regulations or administrative actions related to our activities, nor can we predict the impact any such enacted legislation, regulations or administrative actions would have on our business and Freddie Mac Participation Certificates (“Freddie Mac PCs”). The securityfinancial condition.
We may not have sufficient capital reserves to be developedavoid a net worth deficit if we experience comprehensive losses in the future. If we have a net worth deficit in a future quarter, we will be knownrequired to draw funds from Treasury to avoid being placed into receivership.
The recently amended dividend provisions of the senior preferred stock permit us to retain only up to $25 billion as a Uniform Mortgage-Backed Security or UMBS. The FHFA initiativecapital reserves, provided our conservator directs us to develop a UMBS (the “Single Security Initiative”) is intended to maximize liquidity for both Fannie Maedeclare and Freddie Mac mortgage-backed securitiespay senior preferred stock dividends that become payable in the “to-be-announced”future. As of September 30, 2019, our net worth was only $10.3 billion. As a result, we may not have sufficient capital reserves to avoid a net worth deficit if we have comprehensive losses in the future.
For any quarter for which we have a net worth deficit, we would need to draw funds from Treasury under the senior preferred stock purchase agreement to avoid being placed into receivership. As of the date of this filing, the maximum amount of remaining funding under the agreement is $113.9 billion. If we were to draw additional funds from Treasury under the agreement with respect to a future period, the amount of remaining funding under the agreement would be reduced by the amount of our draw. Dividend payments we make to Treasury do not restore or TBA market. In March 2018, FHFA announced that Fannie Maeincrease the amount of funding available to us under the agreement. Accordingly, if we experience multiple quarters of net worth deficits, the amount of remaining funding available under the senior preferred stock purchase agreement could be significantly reduced from its current level.
Our business and Freddie Mac will start issuing UMBSresults of operations may be materially adversely affected if we are unable to retain and recruit well-qualified senior executives and other employees. The conservatorship, the uncertainty of our future and limitations on our executive and employee compensation put us at a disadvantage compared to many other companies in placeattracting and retaining these employees.
Our business processes are highly dependent on the talents and efforts of their current offeringsour senior executives and other employees. The conservatorship, the uncertainty of TBA-eligible mortgage-backed securitiesour future and limitations on June 3, 2019. The new UMBS will be issued by Fannie Maeexecutive and Freddie Mac through their joint venture, Common Securitization Solutions, LLC (“CSS”), using the Common Securitization Platform (“CSP”).
Historically, Fannie Mae MBSemployee compensation have had, a trading advantage over comparable Freddie Mac PCs. One ofand are likely to continue to have, an adverse effect on our ability to retain and recruit well-qualified executives and other employees. Turnover in key management positions and challenges in integrating new management could harm our ability to manage our business effectively and successfully implement our and FHFA’s stated objectives for the Single Security Initiative is to reduce the costs to Freddie Maccurrent strategic initiatives, and taxpayers that result from differences in liquidity of Fannie Mae MBS and Freddie Mac PCs. As the implementation date of the Single Security Initiative approaches, some Fannie Mae MBS and comparable Freddie Mac PCs are trading closer to or at parity. If this trend continues, itultimately could adversely affect our financial results.performance.
It is also possibleActions taken by Congress, FHFA and Treasury to date, or that uncertainty surrounding the implementation and overall impact of the Single Security Initiative could contribute to declinesmay be taken by them or other government agencies in the liquidity or market valuefuture, have had, and may continue to have, an adverse effect on our retention and recruitment of our Fannie Mae MBS. The industry has expressed concerns that Fannie Maesenior executives and Freddie Mac UMBS may not be truly fungible. If investors do not acceptother
|
| | |
Fannie Mae Third Quarter 20182019 Form 10-Q | 106 |
employees. We are subject to significant restrictions on the fungibilityamount and type of compensation we may pay our executives and other employees while under conservatorship. For example:
The Equity in Government Compensation Act of 2015 caps the annual direct compensation payable to our chief executive officer to no more than $600,000 while we are in conservatorship or receivership.
The STOCK Act prohibits our senior executives from receiving bonuses during any period of conservatorship.
In April 2019, legislation was introduced in the U.S. Senate that would prohibit either Fannie Mae or Freddie Mac from transferring or delegating any duty or responsibility, as of November 25, 2015, of its chief executive officer to any other position. The legislation would also provide that the Director of FHFA may be removed for cause for approving the compensation of any chief executive officer of Fannie Mae or Freddie Mac at a level greater than that permitted under the Equity in Government Compensation Act of 2015.
As our conservator, FHFA has the authority to approve the terms and amount of our executive compensation, and may require us to make changes to our executive compensation program. For example:
| |
| ◦ | In August 2019, FHFA directed us, for so long as we are in conservatorship, to: |
| |
| ▪ | increase the mandatory deferral period for at-risk deferred salary received by senior vice presidents and above from one year to two years, effective January 1, 2022 for executives hired before January 1, 2020 and effective January 1, 2020 for executives hired on or after January 1, 2020; and |
| |
| ▪ | limit base salaries for all of our employees to $600,000. (We do not currently pay any of our employees, including our named executive officers, a base salary of more than $600,000.) |
| |
| ◦ | In September 2019, FHFA directed us to submit for conservator decision any compensation arrangement for a newly hired employee where the proposed total target direct compensation is $600,000 or above, or any increase in total target direct compensation for an existing employee where the proposed total target direct compensation is $600,000 or above. This directive became effective in October 2019 and continues for so long as we are in conservatorship. |
The terms of our senior preferred stock purchase agreement with Treasury contain specified restrictions relating to compensation, including a prohibition on selling or issuing equity securities without Treasury’s prior written consent, which effectively eliminates our ability to offer equity-based compensation to our employees.
As a result of the restrictions on our compensation practices, we have not been able to incent and reward excellent performance with compensation structures that provide upside potential to our executives, which places us at a disadvantage compared to many other companies in attracting and retaining executives. In addition, the uncertainty of potential action by Congress or the Administration with respect to housing finance reform, which may result in the wind-down or significant restructuring of the company, and with respect to the compensation and role of our executives, also negatively affects our ability to retain and recruit executives and other employees.
Our inability to offer market-based compensation to our chief executive officer also makes retention and succession planning for this position difficult. We believe the limit applicable to our chief executive officer compensation negatively affected our ability to retain our former Chief Executive Officer, who left the company in October 2018.
We face competition from the financial services and technology industries, and from businesses outside of these industries, for qualified executives and other employees. If we are unable to retain, promote and attract executives and other employees with the necessary skills and talent, we would face increased risks for operational failures. If there were several high-level departures at approximately the same time, our ability to conduct our business would likely be materially adversely affected, which could have a material adverse effect on our results of operations and financial condition.
Our business activities are significantly affected by the conservatorship and the senior preferred stock purchase agreement and could be significantly impacted by Treasury’s September 2019 Housing Reform Plan.
We are currently under the control of our conservator, FHFA, and we do not know when or how the conservatorship will terminate. As conservator, FHFA can direct us to enter into contracts or enter into contracts on our behalf, and generally has the power to transfer or sell any of our assets or liabilities. In addition, our directors have no fiduciary duties to any person or entity except to the conservator. Accordingly, our directors are not obligated to consider the interests of the company, the holders of our equity or debt securities, or the holders of Fannie Mae MBS in making or approving a decision unless specifically directed to do so by the conservator.
We are subject to significant restrictions on our business activities during conservatorship. We may be prevented by our conservator from engaging in business activities or transactions that we believe would benefit our business and financial results. For example, because FHFA must approve changes to the national loan level price adjustments we charge and can direct us to make other changes to our guaranty fee pricing, our ability to address changing market conditions, pursue certain strategic objectives, or manage the mix of loans lenders choose to deliver to us is constrained. We publish national risk-based loan level price adjustment grids that specify the additional cash fees we charge at the time we acquire a loan based on the credit characteristics of the loan. These fees allow us to price appropriately for the credit risk we assume in providing our guaranty on the loans. We do not have the ability to implement changes to these pricing grids without the approval of FHFA. If
|
| | |
| Fannie Mae Third Quarter 2019 Form 10-Q | 107 |
the mix of our single-family loan acquisitions changes, and FHFA does not approve requested changes to our pricing grids in response to these changes, it could adversely affect our financial results and condition. In addition, if FHFA directs us to change our pricing in any manner—including increases or decreases in our base guaranty fees or our loan level price adjustments—it could result in a decrease in our guaranty fee revenues in future periods, a decrease in our single-family business volume or a negative impact on the credit risk profile of our new single-family acquisitions, any of which could adversely affect our financial results and condition.
Because we are under the control of our conservator, our business objectives may not be consistent with the investment objectives of our investors. We are devoting significant resources to meeting FHFA’s goals for our conservatorship and expect to continue to do so. We may be required by our conservator to engage in activities that are operationally difficult, costly to implement or unprofitable, or that may adversely affect our financial results or the credit risk profile of our book of business. In addition, actions we take to meet FHFA’s strategic goals and objectives for our conservatorship could adversely affect our financial results. FHFA has changed our business objectives significantly since we entered conservatorship and could make additional changes at any time, any of which could materially affect our results of operations and financial condition.
Even if we are released from conservatorship, we remain subject to the terms of the senior preferred stock purchase agreement, senior preferred stock and warrant, which can only be canceled or modified with the consent of Treasury. Moreover, restrictions on our business and activities imposed by the terms of the senior preferred stock and the senior preferred stock purchase agreement may be applied to us through regulation or legislation even if we cease to be subject to these agreements and instruments. The senior preferred stock purchase agreement with Treasury includes a number of covenants that significantly restrict our business activities. We cannot, without the prior written consent of Treasury: pay dividends (except on the senior preferred stock); sell, issue, purchase or redeem Fannie Mae equity securities; sell, transfer, lease or otherwise dispose of assets except in specified situations; engage in transactions with affiliates other than on arm’s-length terms or in the ordinary course of business; issue subordinated debt; incur indebtedness that would result in our aggregate indebtedness exceeding $300 billion; or seek or permit the termination of our conservatorship (other than in connection with receivership). In deciding whether to consent to any request for approval it receives from us under the agreement, Treasury has the right to withhold its consent for any reason and is not required by the agreement to consider any particular factors, including whether or not management believes that the transaction would benefit the company. Pursuant to the senior preferred stock purchase agreement, the amount of mortgage assets that we may own is limited to $250 billion. In addition, FHFA has directed that we further cap our mortgage assets at $225 billion.
Given FHFA’s control over Fannie Mae as our conservator and its authority as our regulator, and given the restrictions and obligations that apply to Fannie Mae as a result of our senior preferred stock purchase agreement with Treasury, the senior preferred stock and the warrant, possible future changes in leadership at FHFA or the Administration could result in significant changes in our goals, our business and our financial results.
As described in “MD&A—Legislation and Regulation” in this report, Treasury recently released its plan to reform the housing finance system. The Treasury plan includes recommendations for administrative reforms that would impose additional restrictions on our business activities, including further limits on the size of our retained mortgage portfolio and potential limits on our current products, services, and other single-family activities and on our multifamily footprint. Our letter agreement with Treasury of September 27, 2019, contemplates the negotiation and execution of an amendment to the senior preferred stock purchase agreement to adopt covenants broadly consistent with these recommendations. Limitations on our business activities could restrict our potential sources of revenue, impose additional costs on us, negatively impact our ability to compete, or otherwise negatively affect our business, results and financial condition.
Actions taken by the conservator, the restrictions set forth in the senior preferred stock purchase agreement, including those contemplated by the letter agreement with Treasury, and some of the recommendations in the Treasury plan, if implemented, could adversely affect our business, results of operations, financial condition, liquidity and net worth.
A number of lawsuits have been filed against the U.S. government relating to the senior preferred stock purchase agreement and the conservatorship. See “Note 13, Commitments and Contingencies” and “Legal Proceedings” for a description of these lawsuits. These lawsuits, and actions Treasury or FHFA may take in response to these lawsuits, could have a material impact on our business.
We may undertake efforts that adversely affect our business, results of operations, financial condition, liquidity and net worth.
In conservatorship our business has not been managed with a strategy to maximize shareholder returns while fulfilling our mission. In pursuit of FHFA’s previous strategic goals for our conservatorship, which are described in our 2018 Form 10-K in “Business—Conservatorship, Treasury Agreements and Housing Finance Reform—Housing Finance Reform—Conservator Developments and Strategic Goals,” we have been taking a variety of actions that could adversely affect our economic returns, possibly significantly, such as modifying loans to help struggling borrowers; expanding our underwriting and eligibility requirements to increase access to mortgage credit; increasing our use of credit risk transfer transactions, which effectively reduces the guaranty fee income we retain on the covered loans; and issuing structured securities backed by Freddie Mac-issued securities. On October 28, 2019, FHFA released new strategic goals and key priorities for our conservatorship, which are discussed in “MD&A—Legislation and Regulation—New FHFA Strategic Plan for Conservatorships and 2020 Scorecard.” Efforts we take in support of our conservator’s new or future goals may have short- and long-term adverse effects on our business and competitive position, results of operations, financial condition, liquidity and net worth.
|
| | |
| Fannie Mae Third Quarter 2019 Form 10-Q | 108 |
Other agencies of the U.S. government or Congress also may ask us to take actions to support the housing and mortgage markets or in support of other goals. These actions may adversely affect our financial results and condition. For example, in December 2011 Congress enacted the TCCA under which, at the direction of FHFA, we increased the guaranty fee on all single-family residential mortgages delivered to us by 10 basis points effective April 1, 2012. The revenue generated by this fee increase is paid to Treasury and helps offset the cost of a two-month extension of the payroll tax cut in 2012.
We are also required by the GSE Act to undertake efforts in support of the housing market that could adversely affect our financial results and condition. For example, we are subject to housing goals under the GSE Act that require that a portion of the mortgage loans we acquire must be for low- and very low-income families, families in low-income census tracts and moderate-income families in minority census tracts or designated disaster areas. In addition, in December 2016, FHFA issued a final rule to implement our new duty to serve very low-, low- and moderate-income families in three underserved markets: manufactured housing, affordable housing preservation and rural areas. We may take actions to meet our housing goals and duty to serve obligations that could adversely affect our profitability. For example, we may acquire loans that offer lower expected returns on our investment than our other loan acquisitions and that may potentially increase our credit losses and credit-related expenses. If we do not meet our housing goals or duty to serve requirements, and FHFA finds that the goals or requirements were feasible, we may become subject to a housing plan that could require us to take additional steps that could have an adverse effect on our results of operations and financial condition. The potential penalties for failure to comply with housing plan requirements include a cease-and-desist order and civil money penalties. See “Business—Charter Act and Regulation—GSE Act and Other Regulation” in our 2018 Form 10-K for more information on our housing goals and duty to serve underserved markets.
The conservatorship and agreements with Treasury have had, and will continue to have, a material adverse effect on our common and preferred shareholders.
The material adverse effects of the conservatorship and our agreements with Treasury include the following:
No voting rights during conservatorship. The rights and powers of our shareholders are suspended during conservatorship. During conservatorship, our common shareholders do not have the ability to elect directors or to vote on other matters unless the conservator delegates this authority to them.
No dividends to common or preferred shareholders, other than to Treasury. Our conservator announced in September 2008 that we would not pay any dividends on the common stock or on any series of preferred stock, other than the senior preferred stock, while we are in conservatorship. In addition, under the terms of the senior preferred stock purchase agreement, dividends may not be paid to common or preferred shareholders (other than on the senior preferred stock) without the prior written consent of Treasury, regardless of whether we are in conservatorship.
Our profits directly increase the liquidation preference on Treasury’s senior preferred stock and, once they exceed our capital reserve amount, will be payable to Treasury as dividends. The senior preferred stock ranks senior to our common stock and all other series of our preferred stock, as well as any capital stock we issue in the future, as to both dividends and distributions upon liquidation. Accordingly, if we are liquidated, the senior preferred stock is entitled to its then-current liquidation preference (which includes any accumulated but unpaid dividends), before any distribution is made to the holders of our common stock or other preferred stock. The liquidation preference on the senior preferred stock was $127.2 billion as of September 30, 2019. Effective September 30, 2019, the liquidation preference of the senior preferred stock increases at the end of each quarter by an amount equal to the increase in our net worth, if any, during the immediately prior fiscal quarter, until such time as the liquidation preference has increased by $22 billion. The liquidation preference would increase further if we draw on Treasury’s funding commitment with respect to any future quarters or if we do not pay dividends owed on the senior preferred stock. If we are liquidated, it is uncertain that there would be sufficient funds remaining after payment of amounts to our creditors and to Treasury as holder of the senior preferred stock to make any distribution to holders of our common stock and other preferred stock.
Pursuant to the dividend provisions of the senior preferred stock and quarterly directives from our conservator, we are obligated to pay Treasury each quarter any dividends declared consisting of the amount, if any, by which our net worth as of the end of the immediately preceding fiscal quarter exceeds the $25 billion capital reserve amount.
As a result, our net income is not available to common shareholders or preferred shareholders other than Treasury as holder of the senior preferred stock.
Exercise of the Treasury warrant would substantially dilute the investment of current shareholders. If Treasury exercises its warrant to purchase shares of our common stock equal to 79.9% of the total number of shares of our common stock outstanding on a fully diluted basis, the ownership interest in the company of our then-existing common shareholders will be substantially diluted, and we would thereafter have a controlling shareholder.
No longer managed for the benefit of shareholders. Because we are in conservatorship, we are no longer managed with a strategy to maximize shareholder returns.
The senior preferred stock purchase agreement, senior preferred stock and warrant can only be canceled or modified with the consent of Treasury. For additional description of the conservatorship and our agreements with Treasury, see “Business—Conservatorship, Treasury Agreements and Housing Finance Reform” in our 2018 Form 10-K and “MD&A—Legislation and Regulation—Housing Finance Reform” in this report.
|
| | |
| Fannie Mae Third Quarter 2019 Form 10-Q | 109 |
The issuance of UMBS and structured securities backed by Freddie Mac-issued securities may have an adverse effect on the liquidity or market value of our MBS. The issuance of UMBS and our reliance on the common securitization platform also increase our counterparty credit risk and operational risk.
On June 3, 2019, we and Freddie Mac began issuing UMBS. We also began using the common securitization platform operated by CSS to perform certain aspects of the securitization process for our single-family Fannie Mae MBS issuances beginning in May 2019. The issuance of UMBS and use of the common securitization platform represent significant changes for the mortgage market and for our securitization operations and business.
Historically, single-family Fannie Mae MBS had a trading advantage over comparable Freddie Mac single-family mortgage-backed securities. The Single Security Initiative has eliminated this trading advantage. We believe this has contributed, and will continue to contribute, to competitive pressure on our single-family guaranty fee pricing.
Uncertainty in connection with UMBS could contribute to declines in the liquidity or market value of Fannie Mae MBS or otherwise adversely affect our financial condition or results of operations. FHFA adopted a rule to align Fannie Mae and Freddie Mac programs, policies and practices that affect the prepayment rates of TBA-eligible mortgage-backed securities. However, these alignment efforts may not be successful and the prepayment rates on Fannie Mae-issued UMBS and Freddie Mac-issued UMBS could diverge. If investors stop accepting the fungibility of Fannie Mae-issued UMBS and Freddie Mac-issued UMBS, or if investors prefer Freddie MacMac-issued UMBS over Fannie MaeMae-issued UMBS, it could adversely affect the volume of our UMBS issuances and the liquidity and market value of Fannie Mae MBS, which could have a significant adverse impact on our business, liquidity, financial condition, net worth and results of operations,operations.
The continued support of FHFA, Treasury, the Securities Industry and could adversely affectFinancial Markets Association, and certain other regulatory bodies is critical to the success of the Single Security Initiative. If any of these entities were to cease its support, the liquidity orand market value of Fannie Mae-issued UMBS could be adversely affected. Furthermore, if either we or Freddie Mac exit conservatorship in the future, it is unclear whether our MBS.and Freddie Mac’s programs, policies and practices in support of UMBS and resecuritizations of each other’s securities would be sustained.
The Single Security Initiative willhas also resultresulted in ourincreased credit risk exposure and operational risk exposure to Freddie Mac. Once the initiative is implemented, investors will be able to commingle Fannie Mae UMBS and Freddie Mac UMBS in resecuritizations. When we resecuritize Freddie Mac-issued UMBS or other Freddie Mac UMBS,securities, our guaranty of principal and interest would extendextends to the underlying Freddie Mac UMBS. Accordingly, insecurity. Our risk exposure to Freddie Mac is expected to increase as we issue more structured securities backed directly or indirectly by Freddie Mac-issued securities going forward. In the event Freddie Mac were to fail (for credit or operational reasons) to make a payment due on Freddie Mac UMBS that we resecuritized,its securities underlying a Fannie Mae-issued structured security, we would be responsible for makingobligated under our guaranty to fund any shortfall and make the entire payment on the related Fannie Mae UMBS in order forMae-issued structured security on that payment date. Our pricing does not currently reflect any ofincremental credit, liquidity or operational risk associated with our certificates to be paid. We do not intend to limit the amountguaranty of resecuritized Freddie Mac UMBS that we guarantee and we do not intend to modify our liquidity strategies to address this increased risk.securities. As a result, any failure by Freddie Mac to meet its obligations under the terms of its securities that back structured securities we issue could have a material adverse effect on our earnings and financial condition, and we could be dependent on Freddie Mac and on the senior preferred stock purchase agreements that we and Freddie Mac each have with Treasury to avoid a liquidity event or a default under our guaranty. See “Risk Factors” in our 2017 Form 10-K for a discussion of other operational risks associated with our
The implementation of the Single Security Initiative created significant interdependence between the single-family mortgage securitization programs of Fannie Mae and related internal infrastructure upgrades.Freddie Mac. Accordingly, the market value of single-family Fannie Mae MBS could be affected by events relating to Freddie Mac, even if those events do not directly relate to Fannie Mae or Fannie Mae MBS. For example, any actual or perceived change in Freddie Mac’s financial performance or condition, mortgage credit quality, or systems and data reliability could adversely affect the market value of single-family Fannie Mae MBS. Similarly, any disruption in Freddie Mac’s securitization activities or any adverse events affecting Freddie Mac’s significant mortgage sellers and servicers also could adversely affect the market value of single-family Fannie Mae MBS.
OnceWe no longer use our individual proprietary securitization function for our single-family MBS issuances. In addition to using the common securitization platform for our newly issued UMBS issuances, we begin issuing UMBS, we plan to beginare also now using CSSthe common securitization platform for certain ongoing administrative functions for our previously issued and the CSP to perform certain operational functions associated with issuing and managing these UMBS on our behalf.outstanding single-family Fannie Mae MBS. Accordingly, we will beare reliant on CSSthe common securitization platform and the CSPCSS for the operation of manyseveral of our single-family securitization activities. These activities are complex and present significant operational and technological challenges and risks. Any measures we take to mitigate these challenges and risks might not be sufficient to prevent a disruption to our securitization activities. Our business activities could be adversely affected and the market for single-family Fannie Mae MBS could be disrupted if the CSPcommon securitization platform were to fail or otherwise become unavailable to us or if CSS were unable to perform its obligations to us. Any such failure or unavailability could have a significant adverse impact on our business, liquidity, financial condition, net worth and results of operations, and could adversely affect the liquidity or market value of our single-family MBS. In addition, a failure by CSS to maintain effective controls and procedures could result in material errors in our reported results or disclosures that are not complete or accurate. See “Risk Factors” in our 2018 Form 10-K for a discussion of other operational risks associated with our implementation of the Single Security Initiative and related internal infrastructure upgrades.
|
| | |
| Fannie Mae Third Quarter 2019 Form 10-Q | 110 |
Credit Risk
We may suffer losses if borrowers are unable to obtain property or flood insurance, if their claims under insurance policies are not paid, or if they suffer property damage as a result of a hazard for which we do not require insurance.
In general, we require borrowers to obtain property insurance to cover the risk of damage to their homes resulting from hazards such as fire, wind and, for properties in a Special Flood Hazard Area, flooding. For flood insurance, borrowers generally rely on the National Flood Insurance Program (“NFIP”), which is due to expire on November 21, 2019. While Congress has passed a series of short-term extensions of NFIP since late 2017, if Congress does not extend or re-authorize the program again, the Federal Emergency Management Agency may not have sufficient funds to pay claims for flood damage, and borrowers may not be able to renew their flood insurance coverage or obtain new policies through the NFIP. In addition, the maximum limit of coverage available under NFIP for a single-family residential property is limited to $250,000, which may not be sufficient to cover all losses. If borrowers are unable to obtain property or flood insurance and suffer property damage, if their claims under insurance policies are not paid, or if they suffer property damage as a result of a hazard for which we do not require insurance, such as earthquake damage or flood damage on a property located outside a special flood hazard area, they may not pay their mortgage loans, which would negatively impact our credit losses and credit-related expenses.
Market and Industry Risk
Uncertainty relating to the potential discontinuance of LIBOR after 2021 may adversely affect our results of operations, financial condition, liquidity and net worth.
We routinely engage in transactions involving financial instruments that reference LIBOR, including acquiring loans and securities, selling securities and entering into derivative transactions that reference LIBOR. In 2017, the United Kingdom’s Financial Conduct Authority, which regulates LIBOR, announced its intention to stop persuading or compelling the group of major banks that sustain LIBOR to submit rate quotations after 2021. As a result, it is uncertain whether LIBOR will continue to be quoted after 2021.
Efforts are underway to identify and transition to a set of alternative reference rates. The transition may lead to disruption, including yield volatility on LIBOR-based securities. The Federal Reserve convened a group of private-market participants, known as the Alternative Reference Rate Committee (the “ARRC”), to identify a set of alternative U.S. dollar reference interest rates and an adoption plan for those alternative rates. We are a voting member of the ARRC and participate in its working groups. In 2017, the ARRC recommended an alternative reference rate referred to as the Secured Overnight Financing Rate (“SOFR”) and the Federal Reserve Bank of New York began publishing SOFR in 2018. However, SOFR is calculated based on different criteria than LIBOR. Accordingly, SOFR and LIBOR may diverge, particularly in times of macroeconomic stress. Since the initial publication of SOFR in 2018, daily changes in SOFR have at times been more volatile than daily changes in comparable benchmark or market rates, and SOFR may be subject to direct influence by activities of the Federal Reserve and the Federal Reserve Bank of New York in ways that other rates may not be. For example, at the direction of the Federal Reserve, in late September 2019, the Federal Reserve Bank of New York began conducting a series of overnight and term repurchase agreement (“repo”) operations to help maintain the federal funds rate within a target range. In October 2019, the Federal Reserve Bank of New York announced that this activity would continue at least through January 2020. These activities directly impact prevailing SOFR rates.
We continue to analyze potential risks associated with the LIBOR transition, including financial, operational, legal, reputational and compliance risks. We have created an enterprise program office focused on this transition, including identifying and monitoring our exposure to LIBOR, updating our infrastructure (including models and systems) to prepare for the transition, and monitoring the market adoption of alternative reference rates and industry-standard contractual fallback provisions.
While many of our LIBOR-indexed financial instruments allow us to take discretionary action to select an alternative reference rate if LIBOR is discontinued, our use of an alternative reference rate may be subject to legal challenges. There is considerable uncertainty as to how the financial services industry will address the discontinuance of LIBOR in financial instruments. This uncertainty could result in disputes and litigation with counterparties and borrowers surrounding the implementation of alternative reference rates in our financial instruments that reference LIBOR. If LIBOR ceases or changes in a manner that causes regulators or market participants to question its viability, financial instruments indexed to LIBOR could experience disparate outcomes based on their contractual terms, ability to amend those terms, market or product type, legal or regulatory jurisdiction, and a host of other factors. There can be no assurance that legislative or regulatory actions will dictate what happens if LIBOR ceases or is no longer viable, or what those actions might be. In addition, while the ARRC was created to ensure a successful transition from LIBOR, there can be no assurance that the ARRC will endorse practices that create a smooth transition and minimize value transfers between market participants, or that its endorsed practices will be broadly adopted by market participants. Divergent industry or market participant actions could result after LIBOR is no longer available or viable. It is uncertain what effect any divergent industry practices will have on the performance of financial instruments, including those that we own or have issued. Alternative reference rates that replace LIBOR may not yield the same or similar economic results over the lives of the financial instruments, which could adversely affect the value of and return on these instruments. The LIBOR transition could result in our paying higher interest rates on our current LIBOR-indexed obligations, adversely affect the yield on and fair value of the loans and securities we hold or guarantee that reference LIBOR, and increase the costs of or affect our ability to effectively use derivative instruments to manage interest rate risk.
In addition, we cannot anticipate how long it will take to develop the systems and processes necessary to adopt SOFR or other benchmark replacements, which may delay and contribute to uncertainty and volatility surrounding the LIBOR transition.
|
| | |
| Fannie Mae Third Quarter 2019 Form 10-Q | 111 |
These developments could have a material impact on us, adjustable-rate mortgage borrowers, investors, and our customers and counterparties. This could result in losses, reputational damage, litigation or costs, or otherwise adversely affect our business, financial condition, liquidity, net worth or results of operations.
Our business and financial results are affected by general economic conditions, particularly home prices and employment trends, and a deterioration of economic conditions or the financial markets may materially adversely affect our results of operations, net worth and financial condition.
Our business is significantly affected by the status of the U.S. economy, particularly home prices and employment trends. A prolonged period of slow growth in the U.S. economy or any deterioration in general economic conditions or the financial markets could materially adversely affect our results of operations, net worth and financial condition. In general, if home prices decrease, or the unemployment rate increases, it could result in significantly higher levels of credit losses and credit-related expense.
Global economic conditions can also adversely affect our business and financial results. Changes or volatility in market conditions resulting from deterioration in or uncertainty regarding global economic conditions can adversely affect the value of our assets, which could materially adversely affect our results of operations, net worth and financial condition. A slowdown in economic growth around the world remains a concern for policy makers and financial markets. To the extent global economic conditions negatively affect the U.S. economy, they also could negatively affect the credit performance of the loans in our book of business.
Volatility or uncertainty in global political conditions also can significantly affect U.S. economic conditions and financial markets. Currently, there is elevated uncertainty around several unresolved global political events, including the United Kingdom’s exit from the European Union and ongoing international trade negotiations, that could impact global growth and financial markets. See “Risk Factors” in our 2018 Form 10-K for a description of the risks to our business posed by changes in interest rates and changes in spreads. In addition, as described in “Risk Factors” in our 2018 Form 10-K, future changes or disruptions in the financial markets could significantly change the amount, mix and cost of funds we obtain, as well as our liquidity position.
A decline in activity in the U.S. housing market, increasing interest rates, or longer-term effects of tax law changes could lower our business volumes or otherwise adversely affect our results of operations, net worth and financial condition.
Our business volume is affected by the rate of growth in total U.S. residential mortgage debt outstanding and the size of the U.S. residential mortgage market. A decline in mortgage debt outstanding reduces the unpaid principal balance of mortgage loans available for us to acquire, which in turn could reduce our net interest income. Even if we were able to increase our share of the secondary mortgage market, it may not be sufficient to make up for a decline in the rate of growth in mortgage originations.
Mortgage interest rates also affect our business volume. Rising interest rates generally result in fewer mortgage originations, particularly for refinances. An increase in interest rates, particularly if the increase is sudden and steep, could significantly reduce our business volume. Significant reductions in our business volume could adversely affect our results of operations and financial condition.
The cap on mortgage interest deductions, the increase in the amount of the standard deduction and other changes in tax laws may also adversely affect housing demand, home prices or other housing or mortgage market conditions, which could impact our business volumes and adversely affect our results of operations, net worth and financial condition.
The continued run-off of mortgage-backed securities from the Federal Reserve’s portfolio could adversely affect our business, results of operations, financial condition, liquidity and net worth.
In recent years, the Federal Reserve has purchased a significant amount of mortgage-backed securities issued by us, Freddie Mac and Ginnie Mae. In October 2017, the Federal Reserve initiated a balance sheet normalization program to reduce its holdings of Treasury securities and mortgage-backed securities. While the Federal Reserve stopped the run-off of U.S. Treasury securities from its portfolio in September 2019, it continued to allow its mortgage-backed securities to run-off, replacing the principal balance with U.S. Treasuries and thus holding the portfolio constant. This may create upward pressure on mortgage interest rates and reduce demand for mortgage-backed securities, which could adversely affect our business, results of operations, financial condition, liquidity and net worth.
Legal, Regulatory and Other Risks
Regulatory changes in the financial services industry may negatively impact our business.
Changes in the regulation of the financial services industry are affecting and are expected to continue to affect many aspects of our business. Examples of regulatory changes that have affected us or may affect us in the future include: rules requiring the clearing of certain derivatives transactions and margin and capital rules for uncleared derivative trades, which impose additional costs on us; and the development of single-counterparty credit limit regulations, which could cause our customers to change their business practices.
|
| | |
| Fannie Mae Third Quarter 2019 Form 10-Q | 112 |
Our business and results may be adversely affected by changes in the CFPB’s “ability-to-repay” rule to replace the “qualified mortgage patch,” pursuant to which a special class of conventional mortgage loans are considered “qualified mortgages” under the Truth in Lending Act if they (1) meet certain qualified mortgage requirements generally and (2) are eligible for sale to Fannie Mae or Freddie Mac. The qualified mortgage patch is scheduled to expire on the earlier of January 10, 2021 or when Fannie Mae and Freddie Mac cease to be in conservatorship or receivership. In July 2019, the CFPB issued an advance notice of proposed rulemaking relating to the expiration of the qualified mortgage patch, and in September 2019, in the Treasury plan, Treasury recommended that the CFPB establish a bright-line safe harbor to replace the qualified mortgage patch. Although the ability-to-repay rule does not apply directly to us, the rule applies to the lenders from which we acquire single-family mortgage loans. And because FHFA has directed that Fannie Mae and Freddie Mac shall only acquire loans that are qualified mortgages under the ability-to-repay rule, changes in the rule may reduce the number of loans that are eligible for delivery to us, and may increase the competition we face for the acquisition and guaranty of such loans.
Changes to financial regulations could affect our business directly or indirectly if they affect our customers and counterparties. Changes in regulations applicable to U.S. banks could also affect our business, as U.S. banks purchase a large amount of our debt securities and MBS. New or revised liquidity or capital requirements applicable to U.S. banks could materially affect demand by those banks for our debt securities and MBS in the future.
The actions of Treasury, the Commodity Futures Trading Commission, the SEC, the Federal Deposit Insurance Corporation, the Federal Reserve and international central banking authorities directly or indirectly impact financial institutions’ cost of funds for lending, capital-raising and investment activities, which could increase our borrowing costs or make borrowing more difficult for us. Changes in monetary policy are beyond our control and difficult to anticipate.
Overall, these legislative and regulatory changes could affect us in substantial and unforeseeable ways and could have a material adverse effect on our business, results of operations, financial condition, liquidity and net worth.
Legislative, regulatory or judicial actions could negatively impact our business, results of operations, financial condition or net worth.
Legislative, regulatory or judicial actions at the federal, state or local level could negatively impact our business, results of operations, financial condition, liquidity or net worth. Legislative, regulatory or judicial actions could affect us in a number of ways, including by imposing significant additional costs on us and diverting management attention or other resources. For example, we could be affected by:
Legislation designed to affect how we and Freddie Mac manage our business. For example, legislation introduced in the U.S. Senate in April 2019 would prohibit either Fannie Mae or Freddie Mac from transferring or delegating any duty or responsibility, as of November 25, 2015, of its chief executive officer to any other position. If enacted, this legislation could negatively impact our business by requiring us to change our current management structure and limiting our ability to determine the roles and responsibilities of our executives in response to evolving business needs.
Designation as a systemically important financial institution. The Senate Committee on Banking, Housing, and Urban Affairs held a hearing in June 2019 on whether we should be regulated as a systemically important financial institution, which would result in our becoming subject to additional regulation and oversight by the Federal Reserve Board.
Legislative or regulatory changes that expand our, or our servicers’, responsibility and liability for securing, maintaining or otherwise overseeing vacant properties prior to foreclosure, which could increase our costs.
State laws and court decisions granting new or expanded priority rights over our mortgages to homeowners associations or through initiatives that provide a lien priority to loans used to finance energy efficiency or similar improvements, which could adversely affect our ability to recover our losses on affected loans.
State and local laws and regulations expanding rent control and other tenant protections, such as New York’s Housing Stability and Tenant Protection Act of 2019, which could negatively affect the housing market in the applicable areas and increase our credit risk on the loans we guarantee in those areas.
In addition, our business could be materially adversely affected by legislative and regulatory actions relating to housing finance reform or the financial services industry, or by legal or regulatory proceedings. We describe many of these actions and proceedings in these risk factors and in “Risk Factors” in our 2018 Form 10-K.
Item 2. Unregistered Sales of Equity Securities and Use of Proceeds
Recent Sales of Unregistered Equity Securities
Under the terms of our senior preferred stock purchase agreement with Treasury, we are prohibited from selling or issuing our equity interests, other than as required by (and pursuant to) the terms of a binding agreement in effect on September 7, 2008, without the prior written consent of Treasury. During the quarter ended September 30, 2018,2019, we did not sell any equity securities.
Information about Certain Securities Issuances by Fannie Mae
Pursuant to SEC regulations, public companies are required to disclose certain information when they incur a material direct financial obligation or become directly or contingently liable for a material obligation under an off-balance sheet arrangement. The disclosure must be made in a current report on Form 8-K under Item 2.03 or, if the obligation is incurred in connection with certain types of securities offerings, in prospectuses for that offering that are filed with the SEC.
Because the securities we issue are exempted securities under the Securities Act of 1933, we do not file registration statements or prospectuses with the SEC with respect to our securities offerings. To comply with the disclosure requirements of Form 8-K relating to the incurrence of material financial obligations, we report our incurrence of these types of obligations either in offering circulars or prospectuses (or supplements thereto) that we post on our website or in a current report on Form 8-K that we file with the SEC, in accordance with a “no-action” letter we received from the SEC staff in 2004. In cases where the information is disclosed in a prospectus or offering circular posted on our website, the document will be posted on our website within the same time period that a prospectus for a non-exempt securities offering would be required to be filed with the SEC.
The website address for disclosure about our debt securities is www.fanniemae.com/debtsearch. From this address, investors can access the offering circular and related supplements for debt securities offerings under Fannie Mae’s universal debt facility, including pricing supplements for individual issuances of debt securities.
Disclosure about our obligations pursuant to some of the MBS we issue, some of which may be off-balance sheet obligations, can be found at www.fanniemae.com/mbsdisclosure. From this address, investors can access information and documents about our MBS, including prospectuses and related prospectus supplements.
We are providing our website address solely for your information. Information appearing on our website is not incorporated into this report.
|
| | |
Fannie Mae Third Quarter 2018 Form 10-Q | 107 |
Our Purchases of Equity Securities
We did not repurchase any of our equity securities during the third quarter of 2018.2019.
Dividend Restrictions
Our payment of dividends is subject to the following restrictions:
Restrictions Relating to Conservatorship. Our conservator announced on September 7, 2008 that we would not pay any dividends on the common stock or on any series of preferred stock, other than the senior preferred stock. In addition, FHFA’s regulations relating to conservatorship and receivership operations prohibit us from paying any dividends while in conservatorship unless authorized by the Director of FHFA. The Director of FHFA has directed us to make dividend payments on the senior preferred stock on a quarterly basis for every dividend period for which dividends were payable.
Restrictions Under Senior Preferred Stock Purchase Agreement and Senior Preferred Stock. The senior preferred stock purchase agreement prohibits us from declaring or paying any dividends on Fannie Mae equity securities (other than the senior preferred stock) without the prior written consent of Treasury. In addition, pursuant to the dividend provisions of the senior preferred stock and quarterly directives from our conservator, we are obligated to pay Treasury each quarter any dividends declared consisting of the amount, if any, by which our net worth as of the end of the immediately preceding fiscal
|
| | |
| Fannie Mae Third Quarter 2019 Form 10-Q | 113 |
quarter exceeds $3.0$25 billion. As a result, our net income is not available to common stockholders. For more information on the terms of the senior preferred stock purchase agreement and senior preferred stock, see “Business—Conservatorship, Treasury Agreements and Treasury Agreements—Treasury Agreements”Housing Finance Reform” in our 20172018 Form 10-K.10-K and “MD&A—Legislation and Regulation—Letter Agreement with Treasury” in this report.
Additional Restrictions Relating to Preferred Stock. Payment of dividends on our common stock is also subject to the prior payment of dividends on our preferred stock and our senior preferred stock. Payment of dividends on all outstanding preferred stock, other than the senior preferred stock, is also subject to the prior payment of dividends on the senior preferred stock.
Statutory Restrictions. Under the GSE Act, FHFA has authority to prohibit capital distributions, including payment of dividends, if we fail to meet our capital requirements. If FHFA classifies us as significantly undercapitalized, approval of the Director of FHFA is required for any dividend payment. Under the Charter Act and the GSE Act, we are not permitted to make a capital distribution if, after making the distribution, we would be undercapitalized. The Director of FHFA, however, may permit us to repurchase shares if the repurchase is made in connection with the issuance of additional shares or obligations in at least an equivalent amount and will reduce our financial obligations or otherwise improve our financial condition.
Item 3. Defaults Upon Senior Securities
None.
Item 4. Mine Safety Disclosures
None.
Item 5. Other Information
On October 31, 2018, FHFA approved an increase in the annual target direct compensation of Celeste M. Brown, Executive Vice President and Chief Financial Officer of Fannie Mae, to reflect her August 2018 promotion from Senior Vice President and Deputy Chief Financial Officer to Executive Vice President and Chief Financial Officer. The increase will be in two steps:
Effective November 11, 2018, her total annual target direct compensation will increase to $2,300,000; consisting of base salary of $550,000, fixed deferred salary of $1,060,000, and at-risk deferred salary of $690,000. This increase in Ms. Brown’s compensation will be prorated for 2018 based on the effective date of the increase.
Effective August 4, 2019, her total annual target direct compensation will increase to $3,000,000; consisting of base salary of $600,000, fixed deferred salary of $1,500,000, and at-risk deferred salary of $900,000. This increase in Ms. Brown’s compensation will be prorated for 2019 based on the effective date of the increase.None.
|
| | |
Fannie Mae Third Quarter 20182019 Form 10-Q | 108114 |
For a description of the principal elements of Fannie Mae’s executive compensation program for its named executives, see “Executive Compensation—Compensation Discussion and Analysis—Chief Executive Officer Compensation and 2017 Executive Compensation Program—Elements of 2017 Executive Compensation Program” in our 2017 Form 10-K.
Item 6. Exhibits
The exhibits listed below are being filed or furnished with or incorporated by reference into this report.
|
| | |
| Item | | Description |
| 3.1 | | |
| 3.2 | | |
| 4.1 | | |
| 4.2 | | |
| 10.1 | |
|
| 31.1 | | |
| 31.2 | | |
| 32.1 | | |
| 32.2 | | |
| 101. INS | | Inline XBRL Instance Document* - the instance document does not appear in the Interactive Data File because its XBRL tags are embedded within the Inline XBRL document |
| 101. SCH | | Inline XBRL Taxonomy Extension Schema* |
| 101. CAL | | Inline XBRL Taxonomy Extension Calculation* |
| 101. DEF | | Inline XBRL Taxonomy Extension Definition* |
| 101. LAB | | Inline XBRL Taxonomy Extension Label* |
| 101. PRE | | Inline XBRL Taxonomy Extension Presentation* |
| 104 | | Cover Page Interactive Data File* - the cover page interactive data file does not appear in the Interactive Data File because its XBRL tags are embedded within the Inline XBRL document included as Exhibit 101 |
__________
| |
| * | The financial information contained in these XBRL documents is unaudited. |
|
| | |
Fannie Mae Third Quarter 20182019 Form 10-Q | 109115 |
SIGNATURES
Pursuant to the requirements of the Securities Exchange Act of 1934, the registrant has duly caused this report to be signed on its behalf by the undersigned thereunto duly authorized.
|
| | |
| Federal National Mortgage Association |
| | | |
| | By: | /s/ Hugh R. Frater
|
| | | Hugh R. Frater
Interim Chief Executive Officer |
Date: November 2, 2018October 31, 2019
|
| | |
| | By: | /s/ Celeste M. Brown |
| | | Celeste M. Brown Executive Vice President and Chief Financial Officer |
Date: November 2, 2018October 31, 2019
|
| | |
Fannie Mae Third Quarter 20182019 Form 10-Q | 110116 |