
| 63-0780404 | ||||||||
| (State or other jurisdiction of incorporation or organization) | (I.R.S. Employer Identification No.) | |||||||
| Title of each class | Trading Symbol(s) | Name of each exchange on which registered | ||||||
| Common Stock, $1.00 par value per share | GL | New York Stock Exchange | ||||||
| Large accelerated filer | Accelerated filer | |||||||||||||||||||
| Non-accelerated filer | Smaller reporting company | |||||||||||||||||||
| Emerging growth company | ||||||||||||||||||||
| If an emerging growth company, indicate by check mark if the registrant has elected not to use the extended transition period for complying with any new or revised financial accounting standards provided pursuant to Section 13(a) of the Exchange Act. | ||||||||||||||||||||
| Class | Outstanding at April 28, 2021 | |||||||||
Common Stock, | 103,053,356 | |||||||||
| Page | |||||||||||
PART I. FINANCIAL INFORMATION | |||||||||||
| Item 1. | |||||||||||
| Item 2. | |||||||||||
| Item 3. | |||||||||||
| Item 4. | |||||||||||
| Item 1. | |||||||||||
| Item 1A. | |||||||||||
| Item 2. | |||||||||||
| Item 6. | |||||||||||
Item 1. | |
| September 30, 2017 | December 31, 2016 | ||||||
| Assets: | |||||||
| Investments: | |||||||
| Fixed maturities—available for sale, at fair value (amortized cost: 2017—$14,914,580; 2016—$14,188,050) | $ | 16,652,913 | $ | 15,245,861 | |||
| Policy loans | 523,318 | 507,975 | |||||
| Other long-term investments | 70,096 | 53,852 | |||||
| Short-term investments | 65,482 | 72,040 | |||||
| Total investments | 17,311,809 | 15,879,728 | |||||
| Cash | 88,462 | 76,163 | |||||
| Accrued investment income | 238,278 | 223,148 | |||||
| Other receivables | 389,084 | 384,454 | |||||
| Deferred acquisition costs | 3,911,800 | 3,783,158 | |||||
| Goodwill | 441,591 | 441,591 | |||||
| Other assets | 544,011 | 520,313 | |||||
| Assets related to discontinued operations | 68,572 | 127,532 | |||||
| Total assets | $ | 22,993,607 | $ | 21,436,087 | |||
| Liabilities: | |||||||
| Future policy benefits | $ | 13,298,069 | $ | 12,825,837 | |||
| Unearned and advance premiums | 61,536 | 64,017 | |||||
| Policy claims and other benefits payable | 318,832 | 299,565 | |||||
| Other policyholders' funds | 97,016 | 96,993 | |||||
| Total policy liabilities | 13,775,453 | 13,286,412 | |||||
| Current and deferred income taxes payable | 2,069,158 | 1,743,990 | |||||
| Other liabilities | 492,175 | 413,760 | |||||
| Short-term debt | 309,002 | 264,475 | |||||
| Long-term debt (estimated fair value: 2017—$1,243,232; 2016—$1,233,019) | 1,130,806 | 1,133,165 | |||||
| Liabilities related to discontinued operations | 49,328 | 27,424 | |||||
| Total liabilities | 17,825,922 | 16,869,226 | |||||
Commitments and Contingencies (Note 6) | |||||||
| Shareholders’ equity: | |||||||
| Preferred stock, par value $1 per share—Authorized 5,000,000 shares; outstanding: -0- in 2017 and 2016 | — | — | |||||
| Common stock, par value $1 per share—Authorized 320,000,000 shares; outstanding: (2017—127,218,183 issued, less 11,859,162 held in treasury and 2016—127,218,183 issued, less 9,187,075 held in treasury) | 127,218 | 127,218 | |||||
| Additional paid-in capital | 508,386 | 490,421 | |||||
| Accumulated other comprehensive income | 1,039,302 | 577,574 | |||||
| Retained earnings | 4,239,582 | 3,890,798 | |||||
| Treasury stock, at cost | (746,803 | ) | (519,150 | ) | |||
| Total shareholders’ equity | 5,167,685 | 4,566,861 | |||||
| Total liabilities and shareholders’ equity | $ | 22,993,607 | $ | 21,436,087 | |||
| March 31, 2021 | December 31, 2020 | ||||||||||
| Assets: | |||||||||||
| Investments: | |||||||||||
Fixed maturities—available for sale, at fair value (amortized cost: 2021—$17,411,959; 2020—$17,197,145, allowance for credit losses: 2021— $0; 2020— $3,346) | $ | 20,154,910 | $ | 21,213,509 | |||||||
| Policy loans | 584,297 | 584,379 | |||||||||
| Other long-term investments (includes: 2021—$459,707; 2020—$385,038 under the fair value option) | 619,741 | 546,981 | |||||||||
| Short-term investments | 93,348 | 107,782 | |||||||||
| Total investments | 21,452,296 | 22,452,651 | |||||||||
| Cash | 81,504 | 94,847 | |||||||||
| Accrued investment income | 268,384 | 248,991 | |||||||||
| Other receivables | 477,596 | 474,180 | |||||||||
| Deferred acquisition costs | 4,662,509 | 4,595,444 | |||||||||
| Goodwill | 441,591 | 441,591 | |||||||||
| Other assets | 729,016 | 739,027 | |||||||||
| Total assets | $ | 28,112,896 | $ | 29,046,731 | |||||||
| Liabilities: | |||||||||||
| Future policy benefits | $ | 15,433,249 | $ | 15,243,536 | |||||||
| Unearned and advance premium | 68,817 | 61,728 | |||||||||
| Policy claims and other benefits payable | 398,190 | 399,507 | |||||||||
| Other policyholders' funds | 98,251 | 97,968 | |||||||||
| Total policy liabilities | 15,998,507 | 15,802,739 | |||||||||
| Current and deferred income taxes | 1,586,288 | 1,833,723 | |||||||||
| Short-term debt | 274,919 | 254,918 | |||||||||
| Long-term debt (estimated fair value: 2021—$1,799,129; 2020—$1,871,754) | 1,668,322 | 1,667,886 | |||||||||
| Other liabilities | 752,523 | 716,373 | |||||||||
| Total liabilities | 20,280,559 | 20,275,639 | |||||||||
| Commitments and Contingencies (Note 5) | 0 | 0 | |||||||||
| Shareholders' equity: | |||||||||||
| Preferred stock, par value $1 per share—5,000,000 shares authorized; outstanding: 0 in 2021 and 2020 | 0 | 0 | |||||||||
| Common stock, par value $1 per share—320,000,000 shares authorized; outstanding: (2021—113,218,183 issued; 2020—113,218,183 issued) | 113,218 | 113,218 | |||||||||
| Additional paid-in-capital | 516,013 | 527,435 | |||||||||
| Accumulated other comprehensive income (loss) | 2,024,515 | 3,029,244 | |||||||||
| Retained earnings | 6,020,552 | 5,874,109 | |||||||||
| Treasury stock, at cost: (2021—10,025,038 shares; 2020—9,420,699 shares) | (841,961) | (772,914) | |||||||||
| Total shareholders' equity | 7,832,337 | 8,771,092 | |||||||||
| Total liabilities and shareholders' equity | $ | 28,112,896 | $ | 29,046,731 | |||||||
| Three Months Ended September 30, | Nine Months Ended September 30, | ||||||||||||||
| 2017 | 2016 | 2017 | 2016 | ||||||||||||
| Revenue: | |||||||||||||||
| Life premium | $ | 576,223 | $ | 546,415 | $ | 1,725,896 | $ | 1,639,156 | |||||||
| Health premium | 242,991 | 236,987 | 730,557 | 709,936 | |||||||||||
| Other premium | 3 | 9 | 9 | 34 | |||||||||||
| Total premium | 819,217 | 783,411 | 2,456,462 | 2,349,126 | |||||||||||
| Net investment income | 213,872 | 202,720 | 634,930 | 601,415 | |||||||||||
| Realized investment gains (losses) | 12,595 | 3,482 | 6,142 | 7,780 | |||||||||||
| Other income | 331 | 160 | 1,140 | 963 | |||||||||||
| Total revenue | 1,046,015 | 989,773 | 3,098,674 | 2,959,284 | |||||||||||
| Benefits and expenses: | |||||||||||||||
| Life policyholder benefits | 386,445 | 369,546 | 1,168,383 | 1,101,748 | |||||||||||
| Health policyholder benefits | 155,774 | 153,351 | 470,104 | 459,387 | |||||||||||
| Other policyholder benefits | 9,000 | 9,255 | 26,923 | 27,475 | |||||||||||
| Total policyholder benefits | 551,219 | 532,152 | 1,665,410 | 1,588,610 | |||||||||||
| Amortization of deferred acquisition costs | 122,334 | 116,821 | 370,363 | 352,872 | |||||||||||
| Commissions, premium taxes, and non-deferred acquisition costs | 67,863 | 61,153 | 198,011 | 185,609 | |||||||||||
| Other operating expense | 63,019 | 57,805 | 187,788 | 173,080 | |||||||||||
| Interest expense | 20,970 | 20,381 | 62,825 | 62,860 | |||||||||||
| Total benefits and expenses | 825,405 | 788,312 | 2,484,397 | 2,363,031 | |||||||||||
| Income before income taxes | 220,610 | 201,461 | 614,277 | 596,253 | |||||||||||
| Income taxes | (67,264 | ) | (59,551 | ) | (183,390 | ) | (181,475 | ) | |||||||
| Income from continuing operations | 153,346 | 141,910 | 430,887 | 414,778 | |||||||||||
| Income (loss) from discontinued operations, net of tax | (12 | ) | 9,959 | (3,739 | ) | (447 | ) | ||||||||
| Net income | $ | 153,334 | $ | 151,869 | $ | 427,148 | $ | 414,331 | |||||||
| Basic net income (loss) per common share: | |||||||||||||||
| Continuing operations | $ | 1.32 | $ | 1.19 | $ | 3.69 | $ | 3.44 | |||||||
| Discontinued operations | — | 0.08 | (0.03 | ) | — | ||||||||||
| Total basic net income per common share | $ | 1.32 | $ | 1.27 | $ | 3.66 | $ | 3.44 | |||||||
| Diluted net income (loss) per common share: | |||||||||||||||
| Continuing operations | $ | 1.29 | $ | 1.16 | $ | 3.61 | $ | 3.38 | |||||||
| Discontinued operations | — | 0.09 | (0.03 | ) | — | ||||||||||
| Total diluted net income per common share | $ | 1.29 | $ | 1.25 | $ | 3.58 | $ | 3.38 | |||||||
| Dividends declared per common share | $ | 0.15 | $ | 0.14 | $ | 0.45 | $ | 0.42 | |||||||
| Three Months Ended September 30, | Nine Months Ended September 30, | ||||||||||||||
| 2017 | 2016 | 2017 | 2016 | ||||||||||||
| Net income | $ | 153,334 | $ | 151,869 | $ | 427,148 | $ | 414,331 | |||||||
| Other comprehensive income (loss): | |||||||||||||||
| Unrealized investment gains (losses): | |||||||||||||||
| Unrealized gains (losses) on securities: | |||||||||||||||
| Unrealized holding gains (losses) arising during period | 83,216 | 236,040 | 692,747 | 1,397,181 | |||||||||||
| Reclassification adjustment for (gains) losses on securities included in net income | (12,910 | ) | (3,513 | ) | (13,264 | ) | (7,809 | ) | |||||||
| Reclassification adjustment for amortization of (discount) and premium | 119 | (927 | ) | (379 | ) | (3,495 | ) | ||||||||
| Foreign exchange adjustment on securities recorded at fair value | 1,173 | (199 | ) | 1,418 | 849 | ||||||||||
| Unrealized gains (losses) on securities | 71,598 | 231,401 | 680,522 | 1,386,726 | |||||||||||
| Unrealized gains (losses) on other investments | 473 | 1,685 | 3,544 | 3,568 | |||||||||||
| Total unrealized investment gains (losses) | 72,071 | 233,086 | 684,066 | 1,390,294 | |||||||||||
| Less applicable tax (expense) benefit | (25,225 | ) | (81,583 | ) | (239,479 | ) | (486,573 | ) | |||||||
| Unrealized investment gains (losses), net of tax | 46,846 | 151,503 | 444,587 | 903,721 | |||||||||||
| Unrealized gains (losses) attributable to deferred acquisition costs | 505 | 621 | (992 | ) | (4,829 | ) | |||||||||
| Less applicable tax (expense) benefit | (177 | ) | (216 | ) | 347 | 1,691 | |||||||||
| Unrealized gains (losses) attributable to deferred acquisition costs, net of tax | 328 | 405 | (645 | ) | (3,138 | ) | |||||||||
| Foreign exchange translation adjustments, other than securities | 8,533 | 120 | 16,049 | 7,262 | |||||||||||
| Less applicable tax (expense) benefit | (2,986 | ) | (16 | ) | (4,567 | ) | (2,454 | ) | |||||||
| Foreign exchange translation adjustments, other than securities, net of tax | 5,547 | 104 | 11,482 | 4,808 | |||||||||||
| Pension adjustments: | |||||||||||||||
| Amortization of pension costs | 3,108 | 2,551 | 9,326 | 7,654 | |||||||||||
| Experience gain (loss) | — | — | 371 | 791 | |||||||||||
| Pension adjustments | 3,108 | 2,551 | 9,697 | 8,445 | |||||||||||
| Less applicable tax (expense) benefit | (1,087 | ) | (894 | ) | (3,393 | ) | (2,957 | ) | |||||||
| Pension adjustments, net of tax | 2,021 | 1,657 | 6,304 | 5,488 | |||||||||||
| Other comprehensive income (loss) | 54,742 | 153,669 | 461,728 | 910,879 | |||||||||||
| Comprehensive income (loss) | $ | 208,076 | $ | 305,538 | $ | 888,876 | $ | 1,325,210 | |||||||
| Preferred Stock | Common Stock | Additional Paid-in Capital | Accumulated Other Comprehensive Income (Loss) | Retained Earnings | Treasury Stock | Total Shareholders’ Equity | ||||||||||||||||||||||
| Balance at January 1, 2016 | $ | — | $ | 130,218 | $ | 482,284 | $ | 231,947 | $ | 3,614,369 | $ | (403,266 | ) | $ | 4,055,552 | |||||||||||||
| Comprehensive income (loss) | 910,879 | 414,331 | 1,325,210 | |||||||||||||||||||||||||
| Common dividends declared ($0.42 per share) | (50,410 | ) | (50,410 | ) | ||||||||||||||||||||||||
| Acquisition of treasury stock | (311,356 | ) | (311,356 | ) | ||||||||||||||||||||||||
| Stock-based compensation | 13,787 | (2,224 | ) | 8,771 | 20,334 | |||||||||||||||||||||||
| Exercise of stock options | (42,040 | ) | 89,093 | 47,053 | ||||||||||||||||||||||||
| Balance at September 30, 2016 | $ | — | $ | 130,218 | $ | 496,071 | $ | 1,142,826 | $ | 3,934,026 | $ | (616,758 | ) | $ | 5,086,383 | |||||||||||||
| Preferred Stock | Common Stock | Additional Paid-in Capital | Accumulated Other Comprehensive Income (Loss) | Retained Earnings | Treasury Stock | Total Shareholders’ Equity | ||||||||||||||||||||||
| Balance at January 1, 2017 | $ | — | $ | 127,218 | $ | 490,421 | $ | 577,574 | $ | 3,890,798 | $ | (519,150 | ) | $ | 4,566,861 | |||||||||||||
| Comprehensive income (loss) | 461,728 | 427,148 | 888,876 | |||||||||||||||||||||||||
| Common dividends declared ($0.45 per share) | (52,304 | ) | (52,304 | ) | ||||||||||||||||||||||||
| Acquisition of treasury stock | (301,448 | ) | (301,448 | ) | ||||||||||||||||||||||||
| Stock-based compensation | 17,965 | (606 | ) | 7,450 | 24,809 | |||||||||||||||||||||||
| Exercise of stock options | (25,454 | ) | 66,345 | 40,891 | ||||||||||||||||||||||||
| Balance at September 30, 2017 | $ | — | $ | 127,218 | $ | 508,386 | $ | 1,039,302 | $ | 4,239,582 | $ | (746,803 | ) | $ | 5,167,685 | |||||||||||||
| Three Months Ended March 31, | |||||||||||||||||||||||
| 2021 | 2020 | ||||||||||||||||||||||
| Revenue: | |||||||||||||||||||||||
| Life premium | $ | 708,119 | $ | 649,630 | |||||||||||||||||||
| Health premium | 294,173 | 280,205 | |||||||||||||||||||||
| Other premium | 1 | 0 | |||||||||||||||||||||
| Total premium | 1,002,293 | 929,835 | |||||||||||||||||||||
| Net investment income | 235,820 | 228,991 | |||||||||||||||||||||
| Realized gains (losses) | 28,152 | (26,097) | |||||||||||||||||||||
| Other income | 295 | 325 | |||||||||||||||||||||
| Total revenue | 1,266,560 | 1,133,054 | |||||||||||||||||||||
| Benefits and expenses: | |||||||||||||||||||||||
| Life policyholder benefits | 517,631 | 421,670 | |||||||||||||||||||||
| Health policyholder benefits | 187,829 | 178,711 | |||||||||||||||||||||
| Other policyholder benefits | 7,259 | 7,588 | |||||||||||||||||||||
| Total policyholder benefits | 712,719 | 607,969 | |||||||||||||||||||||
| Amortization of deferred acquisition costs | 152,993 | 143,837 | |||||||||||||||||||||
| Commissions, premium taxes, and non-deferred acquisition costs | 79,666 | 78,937 | |||||||||||||||||||||
| Other operating expense | 81,210 | 78,582 | |||||||||||||||||||||
| Interest expense | 21,178 | 20,808 | |||||||||||||||||||||
| Total benefits and expenses | 1,047,766 | 930,133 | |||||||||||||||||||||
| Income before income taxes | 218,794 | 202,921 | |||||||||||||||||||||
| Income tax benefit (expense) | (40,277) | (37,381) | |||||||||||||||||||||
Net income | $ | 178,517 | $ | 165,540 | |||||||||||||||||||
Basic net income per common share | $ | 1.73 | $ | 1.54 | |||||||||||||||||||
Diluted net income per common share | $ | 1.70 | $ | 1.52 | |||||||||||||||||||
| Nine Months Ended September 30, | |||||||
| 2017 | 2016 | ||||||
| Cash provided from operating activities | $ | 1,085,842 | $ | 971,926 | |||
| Cash provided from (used for) investing activities: | |||||||
| Investments sold or matured: | |||||||
| Fixed maturities available for sale—sold | 52,951 | 75,299 | |||||
| Fixed maturities available for sale—matured, called, and repaid | 306,132 | 178,873 | |||||
| Other long-term investments | 3,523 | 466 | |||||
| Total long-term investments sold or matured | 362,606 | 254,638 | |||||
| Acquisition of investments: | |||||||
| Fixed maturities—available for sale | (1,042,705 | ) | (910,090 | ) | |||
| Other long-term investments | (16,775 | ) | (20,404 | ) | |||
| Total investments acquired | (1,059,480 | ) | (930,494 | ) | |||
| Net increase in policy loans | (15,343 | ) | (6,623 | ) | |||
| Net (increase) decrease in short-term investments | 6,556 | (11,138 | ) | ||||
| Net change in payable or receivable for securities | — | 94 | |||||
| Additions to property and equipment | (13,451 | ) | (10,138 | ) | |||
| Sale of other assets | 18 | 767 | |||||
| Investment in low-income housing interests | (13,852 | ) | (16,126 | ) | |||
| Cash provided from (used for) investing activities | (732,946 | ) | (719,020 | ) | |||
| Cash provided from (used for) financing activities: | |||||||
| Issuance of common stock | 40,891 | 47,053 | |||||
| Cash dividends paid to shareholders | (51,532 | ) | (50,258 | ) | |||
| Proceeds from issuance of debt | — | 400,000 | |||||
| Payment for debt issuance costs | — | (9,638 | ) | ||||
| Repayment of debt | (1,250 | ) | (250,000 | ) | |||
| Net borrowing (repayment) of commercial paper | 42,652 | 25,266 | |||||
| Acquisition of treasury stock | (301,448 | ) | (311,356 | ) | |||
| Net receipts (payments) from deposit-type product | (65,912 | ) | (57,188 | ) | |||
| Cash provided from (used for) financing activities | (336,599 | ) | (206,121 | ) | |||
| Effect of foreign exchange rate changes on cash | (3,998 | ) | (3,268 | ) | |||
| Net increase (decrease) in cash | 12,299 | 43,517 | |||||
| Cash at beginning of year | 76,163 | 61,383 | |||||
| Cash at end of period | $ | 88,462 | $ | 104,900 | |||
| Three Months Ended March 31, | |||||||||||||||||||||||
| 2021 | 2020 | ||||||||||||||||||||||
Net income | $ | 178,517 | $ | 165,540 | |||||||||||||||||||
| Other comprehensive income (loss): | |||||||||||||||||||||||
| Investments: | |||||||||||||||||||||||
| Unrealized gains (losses) on fixed maturities: | |||||||||||||||||||||||
| Unrealized holding gains (losses) arising during period | (1,262,059) | (977,936) | |||||||||||||||||||||
| Other reclassification adjustments included in net income | (17,142) | 28,412 | |||||||||||||||||||||
| Foreign exchange adjustment on fixed maturities recorded at fair value | 2,442 | (2,397) | |||||||||||||||||||||
| Unrealized gains (losses) on fixed maturities | (1,276,759) | (951,921) | |||||||||||||||||||||
| Unrealized gains (losses) on other investments | 0 | (10,720) | |||||||||||||||||||||
| Total unrealized investment gains (losses) | (1,276,759) | (962,641) | |||||||||||||||||||||
| Less applicable tax (expense) benefit | 268,119 | 202,150 | |||||||||||||||||||||
| Unrealized gains (losses) on investments, net of tax | (1,008,640) | (760,491) | |||||||||||||||||||||
| Deferred acquisition costs: | |||||||||||||||||||||||
| Unrealized gains (losses) attributable to deferred acquisition costs | 359 | 383 | |||||||||||||||||||||
| Less applicable tax (expense) benefit | (75) | (80) | |||||||||||||||||||||
| Unrealized gains (losses) attributable to deferred acquisition costs, net of tax | 284 | 303 | |||||||||||||||||||||
| Foreign exchange translation: | |||||||||||||||||||||||
| Foreign exchange translation adjustments, other than securities | (610) | (27,442) | |||||||||||||||||||||
| Less applicable tax (expense) benefit | 128 | 5,763 | |||||||||||||||||||||
| Foreign exchange translation adjustments, other than securities, net of tax | (482) | (21,679) | |||||||||||||||||||||
| Pension: | |||||||||||||||||||||||
| Pension adjustments | 5,200 | 4,157 | |||||||||||||||||||||
| Less applicable tax (expense) benefit | (1,091) | (873) | |||||||||||||||||||||
| Pension adjustments, net of tax | 4,109 | 3,284 | |||||||||||||||||||||
| Other comprehensive income (loss) | (1,004,729) | (778,583) | |||||||||||||||||||||
Comprehensive income (loss) | $ | (826,212) | $ | (613,043) | |||||||||||||||||||
| Preferred Stock | Common Stock | Additional Paid-In Capital | Accumulated Other Comprehensive Income (Loss) | Retained Earnings | Treasury Stock | Total Shareholders' Equity | |||||||||||||||||||||||||||||||||||
Balance at December 31, 2020 | $ | 0 | $ | 113,218 | $ | 527,435 | $ | 3,029,244 | $ | 5,874,109 | $ | (772,914) | $ | 8,771,092 | |||||||||||||||||||||||||||
| Comprehensive income (loss) | — | — | — | (1,004,729) | 178,517 | — | (826,212) | ||||||||||||||||||||||||||||||||||
Common dividends declared ($0.1975 per share) | — | — | — | — | (20,435) | — | (20,435) | ||||||||||||||||||||||||||||||||||
| Acquisition of treasury stock | — | — | — | — | — | (132,720) | (132,720) | ||||||||||||||||||||||||||||||||||
| Stock-based compensation | — | — | (11,422) | — | 1,168 | 18,142 | 7,888 | ||||||||||||||||||||||||||||||||||
| Exercise of stock options | — | — | — | — | (12,807) | 45,531 | 32,724 | ||||||||||||||||||||||||||||||||||
Balance at March 31, 2021 | $ | 0 | $ | 113,218 | $ | 516,013 | $ | 2,024,515 | $ | 6,020,552 | $ | (841,961) | $ | 7,832,337 | |||||||||||||||||||||||||||
| Preferred Stock | Common Stock | Additional Paid-In Capital | Accumulated Other Comprehensive Income (Loss) | Retained Earnings | Treasury Stock | Total Shareholders' Equity | |||||||||||||||||||||||||||||||||||
Balance at December 31, 2019 | $ | 0 | $ | 117,218 | $ | 531,554 | $ | 1,844,830 | $ | 5,551,329 | $ | (750,624) | $ | 7,294,307 | |||||||||||||||||||||||||||
Cumulative effect of change in accounting principles, net of tax(1) | — | — | — | — | (454) | — | (454) | ||||||||||||||||||||||||||||||||||
Balance at January 1, 2020 | 0 | 117,218 | 531,554 | 1,844,830 | 5,550,875 | (750,624) | 7,293,853 | ||||||||||||||||||||||||||||||||||
| Comprehensive income (loss) | — | — | — | (778,583) | 165,540 | — | (613,043) | ||||||||||||||||||||||||||||||||||
Common dividends declared ($0.1875 per share) | — | — | — | — | (19,963) | — | (19,963) | ||||||||||||||||||||||||||||||||||
| Acquisition of treasury stock | — | — | — | — | — | (166,729) | (166,729) | ||||||||||||||||||||||||||||||||||
| Stock-based compensation | — | — | (12,126) | — | (482) | 21,964 | 9,356 | ||||||||||||||||||||||||||||||||||
| Exercise of stock options | — | — | — | — | (9,539) | 26,347 | 16,808 | ||||||||||||||||||||||||||||||||||
Balance at March 31, 2020 | $ | 0 | $ | 117,218 | $ | 519,428 | $ | 1,066,247 | $ | 5,686,431 | $ | (869,042) | $ | 6,520,282 | |||||||||||||||||||||||||||
| Three Months Ended March 31, | |||||||||||
| 2021 | 2020 | ||||||||||
Cash provided from (used for) operating activities | $ | 371,830 | $ | 343,554 | |||||||
| Cash provided from (used for) investing activities: | |||||||||||
| Investments sold or matured: | |||||||||||
| Fixed maturities available for sale—sold | 61,858 | 50,360 | |||||||||
| Fixed maturities available for sale—matured or other redemptions | 36,683 | 167,387 | |||||||||
| Other long-term investments | 3,733 | 231 | |||||||||
| Total investments sold or matured | 102,274 | 217,978 | |||||||||
| Acquisition of investments: | |||||||||||
| Fixed maturities—available for sale | (295,869) | (211,754) | |||||||||
| Other long-term investments | (65,997) | (49,896) | |||||||||
| Total investments acquired | (361,866) | (261,650) | |||||||||
| Net (increase) decrease in policy loans | 82 | (3,641) | |||||||||
| Net (increase) decrease in short-term investments | 14,434 | (234,316) | |||||||||
| Additions to properties | (15,529) | (9,316) | |||||||||
| Other investing activities | 0 | 13 | |||||||||
| Investments in low-income housing interests | (9,080) | (20,743) | |||||||||
Cash provided from (used for) investing activities | (269,685) | (311,675) | |||||||||
| Cash provided from (used for) financing activities: | |||||||||||
| Issuance of common stock | 32,724 | 16,808 | |||||||||
| Cash dividends paid to shareholders | (19,511) | (18,588) | |||||||||
| Repayment of debt | 0 | (1,875) | |||||||||
| Net borrowing (repayment) of commercial paper | 20,001 | 158,764 | |||||||||
| Acquisition of treasury stock | (132,720) | (166,729) | |||||||||
| Net receipts (payments) from deposit-type products | (13,811) | (19,651) | |||||||||
Cash provided from (used for) financing activities | (113,317) | (31,271) | |||||||||
| Effect of foreign exchange rate changes on cash | (2,171) | 13,829 | |||||||||
| Net increase (decrease) in cash | (13,343) | 14,437 | |||||||||
| Cash at beginning of year | 94,847 | 75,933 | |||||||||
| Cash at end of period | $ | 81,504 | $ | 90,370 | |||||||
| Accounting Pronouncements Adopted in the Current Year | ||||||||||||||||||||
| Standard | Description | Effective Date | Effect on the Consolidated Financial Statements | |||||||||||||||||
ASU No. 2020-08, Codification Improvements to Subtopic 310-20, Receivables-Nonrefundable Fees and Other Costs | The standard was issued as an amendment to ASU 2017-08, and clarifies that callable debt securities with a premium should be amortized to the next call date. | This standard became effective on January 1, 2021. | The adoption of this standard did not have a material impact on the consolidated financial statements. | |||||||||||||||||
| Accounting Pronouncements Yet to be Adopted | ||||||||||||||||||||
| Standard | Description | Effective Date | Effect on the Consolidated Financial Statements | |||||||||||||||||
ASU No. 2018-12/2019-09/2020-11, Financial Services - Insurance (Topic 944): Targeted Improvements to the Accounting for Long-Duration Contracts, with clarification guidance issued in November 2019 and 2020. | ASU 2018-12 is a significant change to our current accounting and disclosure of long-duration contracts, which is our primary business. The guidance was primarily issued to: 1) improve the timeliness of recognizing changes in the liability for future policy benefits and modify the rate used to discount future cash flows, 2) simplify and improve the accounting for certain market-based options or guarantees associated with deposit (or account balance) contracts, 3) simplify the amortization of deferred acquisition costs, and 4) improve the effectiveness of the required disclosures. | As a result of the issuance of ASU 2020-11 in November 2020, the effective date for this standard was changed to January 1, 2023. Early adoption is available. | The Company is currently in the process of evaluating the impact this standard will have on the consolidated financial statements and disclosures, specifically assessing key accounting policies, assumption and data inputs, controls, and enhanced system solutions. As of the balance sheet date, the Company is continuing to upgrade its valuation systems as part of its implementation plan. In addition, significant progress has been made allowing the Company to execute parallel valuation runs on major blocks of business and is updating its accounting policies. Due to the overall nature of the standard, the impact on the consolidated financial statements is expected to be significant. At this time, the Company does not have an estimate of the impact. The Company does not expect to early adopt this ASU and has selected a modified retrospective transition method. | |||||||||||||||||
| Three Months Ended March 31, 2021 | |||||||||||||||||||||||||||||
| Available for Sale Assets | Deferred Acquisition Costs | Foreign Exchange | Pension Adjustments | Total | |||||||||||||||||||||||||
Balance at January 1, 2021 | $ | 3,175,572 | $ | (4,704) | $ | 23,302 | $ | (164,926) | $ | 3,029,244 | |||||||||||||||||||
| Other comprehensive income (loss) before reclassifications, net of tax | (995,098) | 284 | (482) | 0 | (995,296) | ||||||||||||||||||||||||
| Reclassifications, net of tax | (13,542) | 0 | 0 | 4,109 | (9,433) | ||||||||||||||||||||||||
| Other comprehensive income (loss) | (1,008,640) | 284 | (482) | 4,109 | (1,004,729) | ||||||||||||||||||||||||
Balance at March 31, 2021 | $ | 2,166,932 | $ | (4,420) | $ | 22,820 | $ | (160,817) | $ | 2,024,515 | |||||||||||||||||||
| Three Months Ended March 31, 2020 | |||||||||||||||||||||||||||||
| Available for Sale Assets | Deferred Acquisition Costs | Foreign Exchange | Pension Adjustments | Total | |||||||||||||||||||||||||
Balance at January 1, 2020 | $ | 1,982,650 | $ | (5,916) | $ | 12,058 | $ | (143,962) | $ | 1,844,830 | |||||||||||||||||||
| Other comprehensive income (loss) before reclassifications, net of tax | (782,936) | 303 | (21,679) | 0 | (804,312) | ||||||||||||||||||||||||
| Reclassifications, net of tax | 22,445 | 0 | 0 | 3,284 | 25,729 | ||||||||||||||||||||||||
| Other comprehensive income (loss) | (760,491) | 303 | (21,679) | 3,284 | (778,583) | ||||||||||||||||||||||||
Balance at March 31, 2020 | $ | 1,222,159 | $ | (5,613) | $ | (9,621) | $ | (140,678) | $ | 1,066,247 | |||||||||||||||||||
| Three Months Ended September 30, 2017 | ||||||||||||||||||||
| Available for Sale Assets | Deferred Acquisition Costs | Foreign Exchange | Pension Adjustments | Total | ||||||||||||||||
| Balance at July 1, 2017 | $ | 1,090,055 | $ | (7,655 | ) | $ | 10,902 | $ | (108,742 | ) | $ | 984,560 | ||||||||
| Other comprehensive income (loss) before reclassifications, net of tax | 55,160 | 328 | 5,547 | — | 61,035 | |||||||||||||||
| Reclassifications, net of tax | (8,314 | ) | — | — | 2,021 | (6,293 | ) | |||||||||||||
| Other comprehensive income (loss) | 46,846 | 328 | 5,547 | 2,021 | 54,742 | |||||||||||||||
| Balance at September 30, 2017 | $ | 1,136,901 | $ | (7,327 | ) | $ | 16,449 | $ | (106,721 | ) | $ | 1,039,302 | ||||||||
| Three Months Ended September 30, 2016 | ||||||||||||||||||||
| Available for Sale Assets | Deferred Acquisition Costs | Foreign Exchange | Pension Adjustments | Total | ||||||||||||||||
| Balance at July 1, 2016 | $ | 1,084,551 | $ | (8,658 | ) | $ | 8,331 | $ | (95,067 | ) | $ | 989,157 | ||||||||
| Other comprehensive income (loss) before reclassifications, net of tax | 154,389 | 405 | 104 | — | 154,898 | |||||||||||||||
| Reclassifications, net of tax | (2,886 | ) | — | — | 1,657 | (1,229 | ) | |||||||||||||
| Other comprehensive income (loss) | 151,503 | 405 | 104 | 1,657 | 153,669 | |||||||||||||||
| Balance at September 30, 2016 | $ | 1,236,054 | $ | (8,253 | ) | $ | 8,435 | $ | (93,410 | ) | $ | 1,142,826 | ||||||||
| Nine Months Ended September 30, 2017 | ||||||||||||||||||||
| Available for Sale Assets | Deferred Acquisition Costs | Foreign Exchange | Pension Adjustments | Total | ||||||||||||||||
| Balance at January 1, 2017 | $ | 692,314 | $ | (6,682 | ) | $ | 4,967 | $ | (113,025 | ) | $ | 577,574 | ||||||||
| Other comprehensive income (loss) before reclassifications, net of tax | 453,455 | (645 | ) | 11,482 | 241 | 464,533 | ||||||||||||||
| Reclassifications, net of tax | (8,868 | ) | — | — | 6,063 | (2,805 | ) | |||||||||||||
| Other comprehensive income (loss) | 444,587 | (645 | ) | 11,482 | 6,304 | 461,728 | ||||||||||||||
| Balance at September 30, 2017 | $ | 1,136,901 | $ | (7,327 | ) | $ | 16,449 | $ | (106,721 | ) | $ | 1,039,302 | ||||||||
| Nine Months Ended September 30, 2016 | ||||||||||||||||||||
| Available for Sale Assets | Deferred Acquisition Costs | Foreign Exchange | Pension Adjustments | Total | ||||||||||||||||
| Balance at January 1, 2016 | $ | 332,333 | $ | (5,115 | ) | $ | 3,627 | $ | (98,898 | ) | $ | 231,947 | ||||||||
| Other comprehensive income (loss) before reclassifications, net of tax | 911,069 | (3,138 | ) | 4,808 | 513 | 913,252 | ||||||||||||||
| Reclassifications, net of tax | (7,348 | ) | — | — | 4,975 | (2,373 | ) | |||||||||||||
| Other comprehensive income (loss) | 903,721 | (3,138 | ) | 4,808 | 5,488 | 910,879 | ||||||||||||||
| Balance at September 30, 2016 | $ | 1,236,054 | $ | (8,253 | ) | $ | 8,435 | $ | (93,410 | ) | $ | 1,142,826 | ||||||||
| Three Months Ended March 31, | Affected line items in the Statement of Operations | |||||||||||||||||||||||||||||||
| Component Line Item | 2021 | 2020 | ||||||||||||||||||||||||||||||
| Unrealized investment (gains) losses on available for sale assets: | ||||||||||||||||||||||||||||||||
| Realized (gains) losses | $ | (18,790) | $ | 26,920 | Realized (gains) losses | |||||||||||||||||||||||||||
| Amortization of (discount) premium | 1,648 | 1,492 | Net investment income | |||||||||||||||||||||||||||||
| Total before tax | (17,142) | 28,412 | ||||||||||||||||||||||||||||||
| Tax | 3,600 | (5,967) | Income taxes | |||||||||||||||||||||||||||||
| Total after-tax | (13,542) | 22,445 | ||||||||||||||||||||||||||||||
| Pension adjustments: | ||||||||||||||||||||||||||||||||
| Amortization of prior service cost | 158 | 158 | Other operating expense | |||||||||||||||||||||||||||||
| Amortization of actuarial (gain) loss | 5,042 | 3,999 | Other operating expense | |||||||||||||||||||||||||||||
| Total before tax | 5,200 | 4,157 | ||||||||||||||||||||||||||||||
| Tax | (1,091) | (873) | Income taxes | |||||||||||||||||||||||||||||
| Total after-tax | 4,109 | 3,284 | ||||||||||||||||||||||||||||||
Total reclassification (after-tax) | $ | (9,433) | $ | 25,729 | ||||||||||||||||||||||||||||
| Three Months Ended September 30, | Nine Months Ended September 30, | Affected line items in the Statement of Operations | ||||||||||||||||
| 2017 | 2016 | 2017 | 2016 | |||||||||||||||
| Unrealized investment gains (losses) on available for sale assets: | ||||||||||||||||||
| Realized (gains) losses | $ | (12,910 | ) | $ | (3,513 | ) | $ | (13,264 | ) | $ | (7,809 | ) | Realized gains (losses) | |||||
| Amortization of (discount) premium | 119 | (927 | ) | (379 | ) | (3,495 | ) | Net investment income | ||||||||||
| Total before tax | (12,791 | ) | (4,440 | ) | (13,643 | ) | (11,304 | ) | ||||||||||
| Tax | 4,477 | 1,554 | 4,775 | 3,956 | Income taxes | |||||||||||||
| Total after tax | (8,314 | ) | (2,886 | ) | (8,868 | ) | (7,348 | ) | ||||||||||
| Pension adjustments: | ||||||||||||||||||
| Amortization of prior service cost | 118 | 120 | 356 | 360 | Other operating expenses | |||||||||||||
| Amortization of actuarial gain (loss) | 2,990 | 2,431 | 8,970 | 7,294 | Other operating expenses | |||||||||||||
| Total before tax | 3,108 | 2,551 | 9,326 | 7,654 | ||||||||||||||
| Tax | (1,087 | ) | (894 | ) | (3,263 | ) | (2,679 | ) | Income taxes | |||||||||
| Total after tax | 2,021 | 1,657 | 6,063 | 4,975 | ||||||||||||||
| Total reclassifications (after tax) | $ | (6,293 | ) | $ | (1,229 | ) | $ | (2,805 | ) | $ | (2,373 | ) | ||||||
| At March 31, 2021 | |||||||||||||||||||||||||||||||||||
Amortized Cost | Allowance for Credit Losses | Gross Unrealized Gains | Gross Unrealized Losses | Fair Value(1) | % of Total Fixed Maturities(2) | ||||||||||||||||||||||||||||||
| Fixed maturities available for sale: | |||||||||||||||||||||||||||||||||||
| U.S. Government direct, guaranteed, and government-sponsored enterprises | $ | 381,473 | $ | 0 | $ | 55,367 | $ | (208) | $ | 436,632 | 2 | ||||||||||||||||||||||||
| States, municipalities, and political subdivisions | 1,901,330 | 0 | 197,682 | (7,653) | 2,091,359 | 11 | |||||||||||||||||||||||||||||
| Foreign governments | 56,664 | 0 | 1,944 | (4,407) | 54,201 | 0 | |||||||||||||||||||||||||||||
| Corporates, by sector: | |||||||||||||||||||||||||||||||||||
| Financial | 4,458,076 | 0 | 719,494 | (27,666) | 5,149,904 | 26 | |||||||||||||||||||||||||||||
| Utilities | 1,976,871 | 0 | 425,135 | (2,301) | 2,399,705 | 12 | |||||||||||||||||||||||||||||
| Energy | 1,637,352 | 0 | 257,980 | (9,816) | 1,885,516 | 9 | |||||||||||||||||||||||||||||
| Other corporate sectors | 6,828,995 | 0 | 1,136,803 | (24,753) | 7,941,045 | 39 | |||||||||||||||||||||||||||||
| Total corporates | 14,901,294 | 0 | 2,539,412 | (64,536) | 17,376,170 | 86 | |||||||||||||||||||||||||||||
| Collateralized debt obligations | 36,810 | 0 | 24,491 | 0 | 61,301 | 0 | |||||||||||||||||||||||||||||
| Other asset-backed securities | 134,388 | 0 | 4,482 | (3,623) | 135,247 | 1 | |||||||||||||||||||||||||||||
Total fixed maturities | $ | 17,411,959 | $ | 0 | $ | 2,823,378 | $ | (80,427) | $ | 20,154,910 | 100 | ||||||||||||||||||||||||
Cost or Amortized Cost | Gross Unrealized Gains | Gross Unrealized Losses | Fair Value(1) | % of Total Fixed Maturities(2) | |||||||||||||
| Fixed maturities available for sale: | |||||||||||||||||
| U.S. Government direct, guaranteed, and government-sponsored enterprises | $ | 387,985 | $ | 12,800 | $ | (1,098 | ) | $ | 399,687 | 2 | |||||||
| States, municipalities, and political subdivisions | 1,160,537 | 127,675 | (108 | ) | 1,288,104 | 8 | |||||||||||
| Foreign governments | 20,939 | 1,607 | — | 22,546 | — | ||||||||||||
| Corporates, by sector: | |||||||||||||||||
| Financial | 3,199,469 | 426,345 | (25,880 | ) | 3,599,934 | 22 | |||||||||||
| Utilities | 1,948,519 | 324,060 | (2,655 | ) | 2,269,924 | 14 | |||||||||||
| Energy | 1,602,054 | 185,296 | (28,070 | ) | 1,759,280 | 11 | |||||||||||
| Other corporate sectors | 6,025,262 | 666,120 | (22,670 | ) | 6,668,712 | 40 | |||||||||||
| Total corporates | 12,775,304 | 1,601,821 | (79,275 | ) | 14,297,850 | 87 | |||||||||||
| Collateralized debt obligations | 59,204 | 19,558 | (8,994 | ) | 69,768 | — | |||||||||||
| Other asset-backed securities | 145,224 | 5,018 | (17 | ) | 150,225 | 1 | |||||||||||
| Redeemable preferred stocks, by sector: | |||||||||||||||||
| Financial | 336,822 | 60,159 | (3,030 | ) | 393,951 | 2 | |||||||||||
| Utilities | 28,565 | 2,333 | (116 | ) | 30,782 | — | |||||||||||
| Total redeemable preferred stocks | 365,387 | 62,492 | (3,146 | ) | 424,733 | 2 | |||||||||||
| Total fixed maturities | $ | 14,914,580 | $ | 1,830,971 | $ | (92,638 | ) | $ | 16,652,913 | 100 | |||||||
| At December 31, 2020 | |||||||||||||||||||||||||||||||||||
| Amortized Cost | Allowance for Credit Losses | Gross Unrealized Gains | Gross Unrealized Losses | Fair Value(1) | % of Total Fixed Maturities(2) | ||||||||||||||||||||||||||||||
| Fixed maturities available for sale: | |||||||||||||||||||||||||||||||||||
| U.S. Government direct, guaranteed, and government-sponsored enterprises | $ | 380,602 | $ | 0 | $ | 87,272 | $ | (43) | $ | 467,831 | 2 | ||||||||||||||||||||||||
| States, municipalities, and political subdivisions | 1,880,607 | 0 | 251,291 | (315) | 2,131,583 | 10 | |||||||||||||||||||||||||||||
| Foreign governments | 52,913 | 0 | 2,635 | (898) | 54,650 | 0 | |||||||||||||||||||||||||||||
| Corporates, by sector: | |||||||||||||||||||||||||||||||||||
| Financial | 4,404,203 | 0 | 1,016,813 | (24,221) | 5,396,795 | 26 | |||||||||||||||||||||||||||||
| Utilities | 1,975,460 | 0 | 608,595 | (108) | 2,583,947 | 12 | |||||||||||||||||||||||||||||
| Energy | 1,623,970 | (3,346) | 346,197 | (3,083) | 1,963,738 | 9 | |||||||||||||||||||||||||||||
| Other corporate sectors | 6,687,644 | 0 | 1,727,366 | (6,218) | 8,408,792 | 40 | |||||||||||||||||||||||||||||
| Total corporates | 14,691,277 | (3,346) | 3,698,971 | (33,630) | 18,353,272 | 87 | |||||||||||||||||||||||||||||
| Collateralized debt obligations | 57,007 | 0 | 23,460 | (8,869) | 71,598 | 0 | |||||||||||||||||||||||||||||
| Other asset-backed securities | 134,739 | 0 | 3,614 | (3,778) | 134,575 | 1 | |||||||||||||||||||||||||||||
Total fixed maturities | $ | 17,197,145 | $ | (3,346) | $ | 4,067,243 | $ | (47,533) | $ | 21,213,509 | 100 | ||||||||||||||||||||||||
| At March 31, 2021 | |||||||||||
| Amortized Cost, net | Fair Value | ||||||||||
| Fixed maturities available for sale: | |||||||||||
| Due in one year or less | $ | 105,545 | $ | 108,371 | |||||||
| Due after one year through five years | 772,951 | 855,320 | |||||||||
| Due after five years through ten years | 1,886,155 | 2,215,335 | |||||||||
| Due after ten years through twenty years | 6,391,788 | 7,768,248 | |||||||||
| Due after twenty years | 8,084,093 | 9,010,840 | |||||||||
| Mortgage-backed and asset-backed securities | 171,427 | 196,796 | |||||||||
| $ | 17,411,959 | $ | 20,154,910 | ||||||||
| September 30, 2017 | |||||||
| Amortized Cost | Fair Value | ||||||
| Fixed maturities available for sale: | |||||||
| Due in one year or less | $ | 140,702 | $ | 143,863 | |||
| Due after one year through five years | 660,487 | 705,847 | |||||
| Due after five years through ten years | 1,430,894 | 1,604,091 | |||||
| Due after ten years through twenty years | 4,397,807 | 5,084,516 | |||||
| Due after twenty years | 8,079,191 | 8,893,450 | |||||
| Mortgage-backed and asset-backed securities | 205,499 | 221,146 | |||||
| $ | 14,914,580 | $ | 16,652,913 | ||||
| Three Months Ended March 31, | |||||||||||||||||||||||||||||||||||
| 2021 | 2020 | % Change | |||||||||||||||||||||||||||||||||
| Fixed maturities available for sale | $ | 221,719 | $ | 217,127 | 2 | ||||||||||||||||||||||||||||||
| Policy loans | 11,268 | 11,118 | 1 | ||||||||||||||||||||||||||||||||
Other long-term investments(1) | 8,162 | 4,623 | 77 | ||||||||||||||||||||||||||||||||
| Short-term investments | 4 | 307 | (99) | ||||||||||||||||||||||||||||||||
| 241,153 | 233,175 | 3 | |||||||||||||||||||||||||||||||||
| Less investment expense | (5,333) | (4,184) | 27 | ||||||||||||||||||||||||||||||||
Net investment income | $ | 235,820 | $ | 228,991 | 3 | ||||||||||||||||||||||||||||||
| Three Months Ended March 31, | |||||||||||||||||||||||
| 2021 | 2020 | ||||||||||||||||||||||
| Fixed maturities available for sale: | |||||||||||||||||||||||
Proceeds from sales(1) | $ | 61,858 | $ | 50,360 | |||||||||||||||||||
| Gross realized gains | 1,134 | 2,642 | |||||||||||||||||||||
| Gross realized losses | (12,019) | 0 | |||||||||||||||||||||
| Three Months Ended September 30, | Nine Months Ended September 30, | ||||||||||||||
| 2017 | 2016 | 2017 | 2016 | ||||||||||||
| Proceeds from sales | $ | 52,951 | $ | 24,000 | $ | 52,951 | $ | 75,299 | |||||||
| Gross realized gains | 4,851 | 2,577 | 4,851 | 6,133 | |||||||||||
| Gross realized losses | — | — | — | (214 | ) | ||||||||||
| Three Months Ended March 31, | |||||||||||||||||||||||
| 2021 | 2020 | ||||||||||||||||||||||
| Realized investment gains (losses): | |||||||||||||||||||||||
| Fixed maturities available for sale: | |||||||||||||||||||||||
Sales and other(1) | $ | 15,444 | $ | 4,934 | |||||||||||||||||||
| Provision for credit losses | 3,346 | (31,854) | |||||||||||||||||||||
| Fair value option—change in fair value | 9,885 | 583 | |||||||||||||||||||||
| Other investments | (523) | 240 | |||||||||||||||||||||
Realized gains (losses) from investments | 28,152 | (26,097) | |||||||||||||||||||||
| Applicable tax | (5,912) | 5,480 | |||||||||||||||||||||
Realized gains (losses), net of tax | $ | 22,240 | $ | (20,617) | |||||||||||||||||||
| Fair Value Measurements at September 30, 2017 using: | ||||||||||||||||
| Description | Quoted Prices in Active Markets for Identical Assets (Level 1) | Significant Other Observable Inputs (Level 2) | Significant Unobservable Inputs (Level 3) | Total Fair Value | ||||||||||||
| Bonds: | ||||||||||||||||
| U.S. Government direct, guaranteed, and government-sponsored enterprises | $ | — | $ | 399,687 | $ | — | $ | 399,687 | ||||||||
| States, municipalities, and political subdivisions | 39,100 | 1,249,004 | — | 1,288,104 | ||||||||||||
| Foreign governments | — | 22,546 | — | 22,546 | ||||||||||||
| Corporates, by sector: | ||||||||||||||||
| Financial | — | 3,537,728 | 62,206 | 3,599,934 | ||||||||||||
| Utilities | — | 2,114,600 | 155,324 | 2,269,924 | ||||||||||||
| Energy | — | 1,717,538 | 41,742 | 1,759,280 | ||||||||||||
| Other corporate sectors | 3,225 | 6,340,276 | 325,211 | 6,668,712 | ||||||||||||
| Total corporates | 3,225 | 13,710,142 | 584,483 | 14,297,850 | ||||||||||||
| Collateralized debt obligations | — | — | 69,768 | 69,768 | ||||||||||||
| Other asset-backed securities | — | 135,842 | 14,383 | 150,225 | ||||||||||||
| Redeemable preferred stocks, by sector: | ||||||||||||||||
| Financial | — | 393,951 | — | 393,951 | ||||||||||||
| Utilities | — | 30,782 | — | 30,782 | ||||||||||||
| Total redeemable preferred stocks | — | 424,733 | — | 424,733 | ||||||||||||
| Total fixed maturities | $ | 42,325 | $ | 15,941,954 | $ | 668,634 | $ | 16,652,913 | ||||||||
| Percent of total | 0.3 | % | 95.7 | % | 4.0 | % | 100.0 | % | ||||||||
| Fair Value Measurement at March 31, 2021 Using: | |||||||||||||||||||||||
| Quoted Prices in Active Markets for Identical Assets (Level 1) | Significant Other Observable Inputs (Level 2) | Significant Unobservable Inputs (Level 3) | Total Fair Value | ||||||||||||||||||||
| Fixed maturities available for sale | |||||||||||||||||||||||
| U.S. Government direct, guaranteed, and government-sponsored enterprises | $ | 0 | $ | 436,632 | $ | 0 | $ | 436,632 | |||||||||||||||
| States, municipalities, and political subdivisions | 0 | 2,091,359 | 0 | 2,091,359 | |||||||||||||||||||
| Foreign governments | 0 | 54,201 | 0 | 54,201 | |||||||||||||||||||
| Corporates, by sector: | |||||||||||||||||||||||
| Financial | 0 | 4,976,857 | 173,047 | 5,149,904 | |||||||||||||||||||
| Utilities | 0 | 2,226,600 | 173,105 | 2,399,705 | |||||||||||||||||||
| Energy | 0 | 1,848,502 | 37,014 | 1,885,516 | |||||||||||||||||||
| Other corporate sectors | 0 | 7,635,867 | 305,178 | 7,941,045 | |||||||||||||||||||
| Total corporates | 0 | 16,687,826 | 688,344 | 17,376,170 | |||||||||||||||||||
| Collateralized debt obligations | 0 | 0 | 61,301 | 61,301 | |||||||||||||||||||
| Other asset-backed securities | 0 | 123,638 | 11,609 | 135,247 | |||||||||||||||||||
Total fixed maturities | $ | 0 | $ | 19,393,656 | $ | 761,254 | $ | 20,154,910 | |||||||||||||||
| Percentage of total | 0 | % | 96 | % | 4 | % | 100 | % | |||||||||||||||
| Fair Value Measurement at December 31, 2020 Using: | |||||||||||||||||||||||
| Quoted Prices in Active Markets for Identical Assets (Level 1) | Significant Other Observable Inputs (Level 2) | Significant Unobservable Inputs (Level 3) | Total Fair Value | ||||||||||||||||||||
| Fixed maturities available for sale | |||||||||||||||||||||||
| U.S. Government direct, guaranteed, and government-sponsored enterprises | $ | 0 | $ | 467,831 | $ | 0 | $ | 467,831 | |||||||||||||||
| States, municipalities, and political subdivisions | 0 | 2,131,583 | 0 | 2,131,583 | |||||||||||||||||||
| Foreign governments | 0 | 54,650 | 0 | 54,650 | |||||||||||||||||||
| Corporates, by sector: | |||||||||||||||||||||||
| Financial | 0 | 5,222,066 | 174,729 | 5,396,795 | |||||||||||||||||||
| Utilities | 0 | 2,400,602 | 183,345 | 2,583,947 | |||||||||||||||||||
| Energy | 0 | 1,925,549 | 38,189 | 1,963,738 | |||||||||||||||||||
| Other corporate sectors | 0 | 8,090,550 | 318,242 | 8,408,792 | |||||||||||||||||||
| Total corporates | 0 | 17,638,767 | 714,505 | 18,353,272 | |||||||||||||||||||
| Collateralized debt obligations | 0 | 0 | 71,598 | 71,598 | |||||||||||||||||||
| Other asset-backed securities | 0 | 121,705 | 12,870 | 134,575 | |||||||||||||||||||
Total fixed maturities | $ | 0 | $ | 20,414,536 | $ | 798,973 | $ | 21,213,509 | |||||||||||||||
| Percentage of total | 0 | % | 96 | % | 4 | % | 100 | % | |||||||||||||||
| Analysis of Changes in Fair Value Measurements Using Significant Unobservable Inputs (Level 3) | |||||||||||||||||||||||
Asset- backed Securities | Collateralized Debt Obligations | Corporates | Total | ||||||||||||||||||||
Balance at January 1, 2021 | $ | 12,870 | $ | 71,598 | $ | 714,505 | $ | 798,973 | |||||||||||||||
| Included in realized gains / losses | 0 | (6,787) | 0 | (6,787) | |||||||||||||||||||
| Included in other comprehensive income | (1,261) | 9,900 | (24,135) | (15,496) | |||||||||||||||||||
| Acquisitions | 0 | 0 | 0 | 0 | |||||||||||||||||||
| Sales | 0 | (13,213) | 0 | (13,213) | |||||||||||||||||||
| Amortization | 0 | 1,140 | 2 | 1,142 | |||||||||||||||||||
Other(1) | 0 | (1,337) | (2,028) | (3,365) | |||||||||||||||||||
Transfers into Level 3(2) | 0 | 0 | 0 | 0 | |||||||||||||||||||
Transfers out of Level 3(2) | 0 | 0 | 0 | 0 | |||||||||||||||||||
Balance at March 31, 2021 | $ | 11,609 | $ | 61,301 | $ | 688,344 | $ | 761,254 | |||||||||||||||
| Percent of total fixed maturities | 0 | % | 1 | % | 3 | % | 4 | % | |||||||||||||||
| Nine Months Ended September 30, 2017 | |||||||||||||||
| Asset- Backed Securities | Collateralized Debt Obligations | Corporates(1) | Total | ||||||||||||
| Balance at January 1, 2017 | $ | — | $ | 63,503 | $ | 559,600 | $ | 623,103 | |||||||
| Total gains or losses: | |||||||||||||||
| Included in realized gains/losses | — | — | — | — | |||||||||||
| Included in other comprehensive income | 595 | 7,787 | 10,614 | 18,996 | |||||||||||
| Acquisitions | 14,000 | — | 21,666 | 35,666 | |||||||||||
| Sales | — | — | — | — | |||||||||||
| Amortization | — | 3,705 | 14 | 3,719 | |||||||||||
Other(2) | (212 | ) | (5,227 | ) | (7,411 | ) | (12,850 | ) | |||||||
Transfers in and/or out of Level 3(3) | — | — | — | — | |||||||||||
| Balance at September 30, 2017 | $ | 14,383 | $ | 69,768 | $ | 584,483 | $ | 668,634 | |||||||
| Percent of total fixed maturities | 0.1 | % | 0.4 | % | 3.5 | % | 4.0 | % | |||||||
| Nine Months Ended September 30, 2016 | |||||||||||||||
| Asset- Backed Securities | Collateralized Debt Obligations | Corporates(1) | Total | ||||||||||||
| Balance at January 1, 2016 | $ | — | $ | 70,382 | $ | 530,806 | $ | 601,188 | |||||||
| Total gains or losses: | |||||||||||||||
| Included in realized gains/losses | — | — | 788 | 788 | |||||||||||
| Included in other comprehensive income | — | (3,879 | ) | 33,365 | 29,486 | ||||||||||
| Acquisitions | — | — | 33,662 | 33,662 | |||||||||||
| Sales | — | — | — | — | |||||||||||
| Amortization | — | 3,511 | 14 | 3,525 | |||||||||||
Other(2) | — | (6,732 | ) | (10,882 | ) | (17,614 | ) | ||||||||
Transfers in and/or out of Level 3(3) | — | — | — | — | |||||||||||
| Balance at September 30, 2016 | $ | — | $ | 63,282 | $ | 587,753 | $ | 651,035 | |||||||
| Percent of total fixed maturities | — | % | 0.4 | % | 3.7 | % | 4.1 | % | |||||||
| Analysis of Changes in Fair Value Measurements Using Significant Unobservable Inputs (Level 3) | |||||||||||||||||||||||
Asset- backed Securities | Collateralized Debt Obligations | Corporates | Total | ||||||||||||||||||||
Balance at January 1, 2020 | $ | 13,177 | $ | 74,104 | $ | 672,128 | $ | 759,409 | |||||||||||||||
| Included in realized gains / losses | 0 | 0 | 1,213 | 1,213 | |||||||||||||||||||
| Included in other comprehensive income | (276) | (5,475) | (34,072) | (39,823) | |||||||||||||||||||
| Acquisitions | 0 | 0 | 0 | 0 | |||||||||||||||||||
| Sales | 0 | 0 | 0 | 0 | |||||||||||||||||||
| Amortization | 0 | 1,139 | 2 | 1,141 | |||||||||||||||||||
Other(1) | (134) | (1,395) | (20,876) | (22,405) | |||||||||||||||||||
Transfers into Level 3(2) | 0 | 0 | 0 | 0 | |||||||||||||||||||
Transfers out of Level 3(2) | 0 | 0 | 0 | 0 | |||||||||||||||||||
Balance at March 31, 2020 | $ | 12,767 | $ | 68,373 | $ | 618,395 | $ | 699,535 | |||||||||||||||
| Percent of total fixed maturities | 0 | % | 1 | % | 3 | % | 4 | % | |||||||||||||||
| Changes in Unrealized Gains/Losses included in Other Comprehensive Income for Assets Held at the End of the Period | |||||||||||||||||||||||
| Asset- backed Securities | Collateralized Debt Obligations | Corporates | Total | ||||||||||||||||||||
| At March 31, 2021 | $ | (1,261) | $ | 9,900 | $ | (24,135) | $ | (15,496) | |||||||||||||||
| At March 31, 2020 | (276) | (5,475) | (34,072) | (39,823) | |||||||||||||||||||
| Less than Twelve Months | Twelve Months or Longer | Total | |||||||||||||||
| Number of issues (CUSIPs) held: | |||||||||||||||||
| As of March 31, 2021 | 271 | 23 | 294 | ||||||||||||||
| As of December 31, 2020 | 54 | 24 | 78 | ||||||||||||||
| At March 31, 2021 | |||||||||||||||||||||||||||||||||||
| Less than Twelve Months | Twelve Months or Longer | Total | |||||||||||||||||||||||||||||||||
| Fair Value | Unrealized Loss | Fair Value | Unrealized Loss | Fair Value | Unrealized Loss | ||||||||||||||||||||||||||||||
| Fixed maturities available for sale: | |||||||||||||||||||||||||||||||||||
| Investment grade securities: | |||||||||||||||||||||||||||||||||||
| U.S. Government direct, guaranteed, and government-sponsored enterprises | $ | 3,800 | $ | (208) | $ | 3 | $ | 0 | $ | 3,803 | $ | (208) | |||||||||||||||||||||||
| States, municipalities and political subdivisions | 211,681 | (7,612) | 450 | (41) | 212,131 | (7,653) | |||||||||||||||||||||||||||||
| Foreign governments | 32,807 | (4,407) | 0 | 0 | 32,807 | (4,407) | |||||||||||||||||||||||||||||
| Corporates, by sector: | |||||||||||||||||||||||||||||||||||
| Financial | 296,250 | (12,924) | 4,851 | (386) | 301,101 | (13,310) | |||||||||||||||||||||||||||||
| Utilities | 28,739 | (2,004) | 0 | 0 | 28,739 | (2,004) | |||||||||||||||||||||||||||||
| Energy | 159,994 | (6,492) | 0 | 0 | 159,994 | (6,492) | |||||||||||||||||||||||||||||
| Other corporate sectors | 315,384 | (18,826) | 0 | 0 | 315,384 | (18,826) | |||||||||||||||||||||||||||||
| Total corporates | 800,367 | (40,246) | 4,851 | (386) | 805,218 | (40,632) | |||||||||||||||||||||||||||||
| Collateralized debt obligations | 0 | 0 | 0 | 0 | 0 | 0 | |||||||||||||||||||||||||||||
| Other asset-backed securities | 11,609 | (1,324) | 0 | 0 | 11,609 | (1,324) | |||||||||||||||||||||||||||||
| Total investment grade securities | 1,060,264 | (53,797) | 5,304 | (427) | 1,065,568 | (54,224) | |||||||||||||||||||||||||||||
| Below investment grade securities: | |||||||||||||||||||||||||||||||||||
| States, municipalities and political subdivisions | 0 | 0 | 0 | 0 | 0 | 0 | |||||||||||||||||||||||||||||
| Corporates, by sector: | |||||||||||||||||||||||||||||||||||
| Financial | 25,136 | (125) | 104,183 | (14,231) | 129,319 | (14,356) | |||||||||||||||||||||||||||||
| Utilities | 15,381 | (297) | 0 | 0 | 15,381 | (297) | |||||||||||||||||||||||||||||
| Energy | 4,994 | (2) | 54,866 | (3,322) | 59,860 | (3,324) | |||||||||||||||||||||||||||||
| Other corporate sectors | 20,370 | (3,789) | 19,287 | (2,138) | 39,657 | (5,927) | |||||||||||||||||||||||||||||
| Total corporates | 65,881 | (4,213) | 178,336 | (19,691) | 244,217 | (23,904) | |||||||||||||||||||||||||||||
| Collateralized debt obligations | 0 | 0 | 0 | 0 | 0 | 0 | |||||||||||||||||||||||||||||
| Other asset-backed securities | 0 | 0 | 11,576 | (2,299) | 11,576 | (2,299) | |||||||||||||||||||||||||||||
| Total below investment grade securities | 65,881 | (4,213) | 189,912 | (21,990) | 255,793 | (26,203) | |||||||||||||||||||||||||||||
Total fixed maturities | $ | 1,126,145 | $ | (58,010) | $ | 195,216 | $ | (22,417) | $ | 1,321,361 | $ | (80,427) | |||||||||||||||||||||||
Less than Twelve Months | Twelve Months or Longer | Total | |||||||
| Number of issues (CUSIP numbers) held: | |||||||||
| As of September 30, 2017 | 151 | 109 | 260 | ||||||
| As of December 31, 2016 | 407 | 94 | 501 | ||||||
| At December 31, 2020 | |||||||||||||||||||||||||||||||||||
| Less than Twelve Months | Twelve Months or Longer | Total | |||||||||||||||||||||||||||||||||
| Fair Value | Unrealized Loss | Fair Value | Unrealized Loss | Fair Value | Unrealized Loss | ||||||||||||||||||||||||||||||
| Fixed maturities available for sale: | |||||||||||||||||||||||||||||||||||
| Investment grade securities: | |||||||||||||||||||||||||||||||||||
| U.S. Government direct, guaranteed, and government-sponsored enterprises | $ | 2,006 | $ | (43) | $ | 0 | $ | 0 | $ | 2,006 | $ | (43) | |||||||||||||||||||||||
| States, municipalities and political subdivisions | 32,910 | (315) | 0 | 0 | 32,910 | (315) | |||||||||||||||||||||||||||||
| Foreign governments | 19,532 | (898) | 0 | 0 | 19,532 | (898) | |||||||||||||||||||||||||||||
| Corporates, by sector: | |||||||||||||||||||||||||||||||||||
| Financial | 117,762 | (2,564) | 6,333 | (2,168) | 124,095 | (4,732) | |||||||||||||||||||||||||||||
| Utilities | 2,726 | (108) | 0 | 0 | 2,726 | (108) | |||||||||||||||||||||||||||||
| Energy | 1,692 | (8) | 14,871 | (106) | 16,563 | (114) | |||||||||||||||||||||||||||||
| Other corporate sectors | 21,882 | (720) | 0 | 0 | 21,882 | (720) | |||||||||||||||||||||||||||||
| Total corporates | 144,062 | (3,400) | 21,204 | (2,274) | 165,266 | (5,674) | |||||||||||||||||||||||||||||
| Collateralized debt obligations | 0 | 0 | 0 | 0 | 0 | 0 | |||||||||||||||||||||||||||||
| Other asset-backed securities | 28,864 | (1,051) | 5 | 0 | 28,869 | (1,051) | |||||||||||||||||||||||||||||
| Total investment grade securities | 227,374 | (5,707) | 21,209 | (2,274) | 248,583 | (7,981) | |||||||||||||||||||||||||||||
| Below investment grade securities: | |||||||||||||||||||||||||||||||||||
| States, municipalities and political subdivisions | 0 | 0 | 0 | 0 | 0 | 0 | |||||||||||||||||||||||||||||
| Corporates, by sector: | |||||||||||||||||||||||||||||||||||
| Financial | 6,822 | (36) | 115,093 | (19,453) | 121,915 | (19,489) | |||||||||||||||||||||||||||||
| Utilities | 0 | 0 | 0 | 0 | 0 | 0 | |||||||||||||||||||||||||||||
| Energy | 18,432 | (757) | 38,720 | (2,212) | 57,152 | (2,969) | |||||||||||||||||||||||||||||
| Other corporate sectors | 25,711 | (3,588) | 19,516 | (1,910) | 45,227 | (5,498) | |||||||||||||||||||||||||||||
| Total corporates | 50,965 | (4,381) | 173,329 | (23,575) | 224,294 | (27,956) | |||||||||||||||||||||||||||||
| Collateralized debt obligations | 0 | 0 | 11,131 | (8,869) | 11,131 | (8,869) | |||||||||||||||||||||||||||||
| Other asset-backed securities | 0 | 0 | 11,223 | (2,727) | 11,223 | (2,727) | |||||||||||||||||||||||||||||
| Total below investment grade securities | 50,965 | (4,381) | 195,683 | (35,171) | 246,648 | (39,552) | |||||||||||||||||||||||||||||
Total fixed maturities | $ | 278,339 | $ | (10,088) | $ | 216,892 | $ | (37,445) | $ | 495,231 | $ | (47,533) | |||||||||||||||||||||||
Less than Twelve Months | Twelve Months or Longer | Total | ||||||||||||||||||||||
| Description of Securities | Fair Value | Unrealized Loss | Fair Value | Unrealized Loss | Fair Value | Unrealized Loss | ||||||||||||||||||
| Investment grade securities: | ||||||||||||||||||||||||
| Bonds: | ||||||||||||||||||||||||
| U.S. Government direct, guaranteed, and government-sponsored enterprises | $ | 97,370 | $ | (610 | ) | $ | 5,422 | $ | (488 | ) | $ | 102,792 | $ | (1,098 | ) | |||||||||
| States, municipalities and political subdivisions | 10,115 | (70 | ) | 691 | (2 | ) | 10,806 | (72 | ) | |||||||||||||||
| Corporates, by sector: | ||||||||||||||||||||||||
| Financial | 94,944 | (1,024 | ) | 65,729 | (2,271 | ) | 160,673 | (3,295 | ) | |||||||||||||||
| Utilities | 101,687 | (1,643 | ) | 40,075 | (1,012 | ) | 141,762 | (2,655 | ) | |||||||||||||||
| Energy | 37,009 | (512 | ) | 93,841 | (6,555 | ) | 130,850 | (7,067 | ) | |||||||||||||||
| Other corporate sectors | 369,323 | (6,254 | ) | 247,324 | (11,047 | ) | 616,647 | (17,301 | ) | |||||||||||||||
| Total corporates | 602,963 | (9,433 | ) | 446,969 | (20,885 | ) | 1,049,932 | (30,318 | ) | |||||||||||||||
| Other asset-backed securities | 9,983 | (17 | ) | — | — | 9,983 | (17 | ) | ||||||||||||||||
| Redeemable preferred stocks, by sector: | ||||||||||||||||||||||||
| Utilities | 5,947 | (116 | ) | — | — | 5,947 | (116 | ) | ||||||||||||||||
| Total redeemable preferred stocks | 5,947 | (116 | ) | — | — | 5,947 | (116 | ) | ||||||||||||||||
| Total investment grade securities | 726,378 | (10,246 | ) | 453,082 | (21,375 | ) | 1,179,460 | (31,621 | ) | |||||||||||||||
| Below investment grade securities: | ||||||||||||||||||||||||
| Bonds: | ||||||||||||||||||||||||
| States, municipalities and political subdivisions | 269 | (36 | ) | — | — | 269 | (36 | ) | ||||||||||||||||
| Corporates, by sector: | ||||||||||||||||||||||||
| Financial | — | — | 83,164 | (22,585 | ) | 83,164 | (22,585 | ) | ||||||||||||||||
| Energy | — | — | 78,721 | (21,003 | ) | 78,721 | (21,003 | ) | ||||||||||||||||
| Other corporate sectors | — | — | 45,330 | (5,369 | ) | 45,330 | (5,369 | ) | ||||||||||||||||
| Total corporates | — | — | 207,215 | (48,957 | ) | 207,215 | (48,957 | ) | ||||||||||||||||
| Collateralized debt obligations | — | — | 11,006 | (8,994 | ) | 11,006 | (8,994 | ) | ||||||||||||||||
| Redeemable preferred stocks, by sector: | ||||||||||||||||||||||||
| Financial | — | — | 24,080 | (3,030 | ) | 24,080 | (3,030 | ) | ||||||||||||||||
| Total redeemable preferred stocks | — | — | 24,080 | (3,030 | ) | 24,080 | (3,030 | ) | ||||||||||||||||
| Total below investment grade securities | 269 | (36 | ) | 242,301 | (60,981 | ) | 242,570 | (61,017 | ) | |||||||||||||||
| Total fixed maturities | $ | 726,647 | $ | (10,282 | ) | $ | 695,383 | $ | (82,356 | ) | $ | 1,422,030 | $ | (92,638 | ) | |||||||||
| Three Months Ended March 31, | ||||||||||||||||||||||||||
| 2021 | 2020 | |||||||||||||||||||||||||
Allowance for credit losses beginning balance | $ | 3,346 | $ | 0 | ||||||||||||||||||||||
| Additions to allowance for which credit losses were not previously recorded | 0 | 31,854 | ||||||||||||||||||||||||
| Additions (reductions) to allowance for fixed maturities that previously had an allowance | 0 | 0 | ||||||||||||||||||||||||
| Reduction of allowance for which the Company intends to sell or more likely than not will be required to sell or sold during the period | (3,346) | 0 | ||||||||||||||||||||||||
Allowance for credit losses ending balance | $ | 0 | $ | 31,854 | ||||||||||||||||||||||
| March 31, 2021 | December 31, 2020 | ||||||||||
| Investment funds | $ | 459,707 | $ | 385,038 | |||||||
| Commercial mortgage loan participations | 158,693 | 160,602 | |||||||||
| Other | 1,341 | 1,341 | |||||||||
Total | $ | 619,741 | $ | 546,981 | |||||||
| September 30, 2017 | December 31, 2016 | ||||||
| Assets: | |||||||
| Due premiums | $ | 3,945 | $ | 8,840 | |||
Other receivables(1) | 64,627 | 118,692 | |||||
| Total assets related to discontinued operations | 68,572 | 127,532 | |||||
| Liabilities: | |||||||
| Risk sharing payable | 9,065 | 8,374 | |||||
| Current and deferred income taxes payable | 1,630 | 3,820 | |||||
Other(2) | 38,633 | 15,230 | |||||
| Total liabilities related to discontinued operations | 49,328 | 27,424 | |||||
| Net assets | $ | 19,244 | $ | 100,108 | |||
| Fair Value | Unfunded Commitments | ||||||||||||||||||||||||||||
| Investment Category | March 31, 2021 | December 31, 2020 | March 31, 2021 | Redemption Term/Notice | |||||||||||||||||||||||||
| Commercial mortgage loans | $ | 277,495 | $ | 227,050 | $ | 237,969 | Portion non-redeemable and fully redeemable after 6 month period, subject to fund liquidity/discretion of General Partner. Expected life is 7 years for non-redeemable fund. | ||||||||||||||||||||||
| Opportunistic credit | 166,900 | 157,461 | 0 | Initial 2 year lock on each new investment/semi-annual withdrawals thereafter/full redemption within 36 month period. | |||||||||||||||||||||||||
| Other | 15,312 | 527 | 139,143 | Not redeemable | |||||||||||||||||||||||||
| Total investment funds | $ | 459,707 | $ | 385,038 | $ | 377,112 | |||||||||||||||||||||||
| March 31, 2021 | December 31, 2020 | ||||||||||||||||||||||
| Carrying Value | % of Total | Carrying Value | % of Total | ||||||||||||||||||||
| Property type: | |||||||||||||||||||||||
| Mixed use | $ | 49,614 | 31 | $ | 49,002 | 31 | |||||||||||||||||
| Office | 36,138 | 23 | 36,153 | 22 | |||||||||||||||||||
| Hospitality | 22,841 | 15 | 22,605 | 14 | |||||||||||||||||||
| Retail | 19,562 | 12 | 19,319 | 12 | |||||||||||||||||||
| Industrial | 17,900 | 11 | 17,900 | 11 | |||||||||||||||||||
| Multi-family | 14,785 | 9 | 19,128 | 12 | |||||||||||||||||||
| Total recorded investment | 160,840 | 101 | 164,107 | 102 | |||||||||||||||||||
| Less allowance for credit losses | (2,147) | (1) | (3,505) | (2) | |||||||||||||||||||
Carrying value, net of allowance for credit losses | $ | 158,693 | 100 | $ | 160,602 | 100 | |||||||||||||||||
| March 31, 2021 | December 31, 2020 | ||||||||||||||||||||||
| Carrying Value | % of Total | Carrying Value | % of Total | ||||||||||||||||||||
| Geographic location: | |||||||||||||||||||||||
| California | $ | 61,880 | 39 | $ | 61,610 | 38 | |||||||||||||||||
| Virginia | 27,019 | 17 | 27,019 | 17 | |||||||||||||||||||
| New York | 16,573 | 10 | 16,602 | 10 | |||||||||||||||||||
| Pennsylvania | 11,589 | 7 | 11,314 | 7 | |||||||||||||||||||
| Indiana | 9,717 | 6 | 9,717 | 6 | |||||||||||||||||||
| Florida | 8,021 | 5 | 12,420 | 8 | |||||||||||||||||||
| Other | 26,041 | 17 | 25,425 | 16 | |||||||||||||||||||
| Total recorded investment | 160,840 | 101 | 164,107 | 102 | |||||||||||||||||||
| Less allowance for credit losses | (2,147) | (1) | (3,505) | (2) | |||||||||||||||||||
Carrying value, net of allowance for credit losses | $ | 158,693 | 100 | $ | 160,602 | 100 | |||||||||||||||||
| Net Book Value of Commercial Mortgage Loans Receivable by Year of Origination | ||||||||||||||||||||||||||||||||||||||||||||
| As of March 31, 2021 | ||||||||||||||||||||||||||||||||||||||||||||
| Risk Rating: | Number of Loans | 2021 | 2020 | 2019 | 2018 | 2017 | Total | |||||||||||||||||||||||||||||||||||||
| Low | 17 | $ | 0 | $ | 20,227 | $ | 15,332 | $ | 33,152 | $ | 61,881 | $ | 130,592 | |||||||||||||||||||||||||||||||
| Moderate | 4 | 0 | 0 | 10,686 | 8,021 | 0 | 18,707 | |||||||||||||||||||||||||||||||||||||
| High | 2 | 0 | 0 | 4,561 | 6,980 | 0 | 11,541 | |||||||||||||||||||||||||||||||||||||
| Total commercial mortgage loans | 23 | $ | 0 | $ | 20,227 | $ | 30,579 | $ | 48,153 | $ | 61,881 | 160,840 | ||||||||||||||||||||||||||||||||
| Less allowance for credit losses on the investment pool | (2,147) | |||||||||||||||||||||||||||||||||||||||||||
| Less allowance for credit losses on individual loans | 0 | |||||||||||||||||||||||||||||||||||||||||||
Carrying value, net of valuation allowance | $ | 158,693 | ||||||||||||||||||||||||||||||||||||||||||
| Net Book Value of Commercial Mortgage Loans Receivable by Year of Origination | ||||||||||||||||||||||||||||||||||||||
| As of December 31, 2020 | ||||||||||||||||||||||||||||||||||||||
| Risk Rating: | Number of Loans | 2020 | 2019 | 2018 | 2017 | Total | ||||||||||||||||||||||||||||||||
| Low | 17 | $ | 20,176 | $ | 14,757 | $ | 33,132 | $ | 61,460 | $ | 129,525 | |||||||||||||||||||||||||||
| Moderate | 4 | 0 | 10,640 | 7,796 | 0 | 18,436 | ||||||||||||||||||||||||||||||||
| High | 3 | 0 | 4,554 | 11,592 | 0 | 16,146 | ||||||||||||||||||||||||||||||||
| Total commercial mortgage loans | 24 | $ | 20,176 | $ | 29,951 | $ | 52,520 | $ | 61,460 | 164,107 | ||||||||||||||||||||||||||||
| Less allowance for credit losses on the investment pool | (2,503) | |||||||||||||||||||||||||||||||||||||
| Less allowance for credit losses on individual loans | (1,002) | |||||||||||||||||||||||||||||||||||||
Carrying value, net of valuation allowance | $ | 160,602 | ||||||||||||||||||||||||||||||||||||
| Three Months Ended March 31, | ||||||||||||||||||||||||||
| 2021 | 2020 | |||||||||||||||||||||||||
Allowance for credit losses beginning balance | $ | 3,505 | $ | 0 | ||||||||||||||||||||||
| Cumulative effect of adoption ASU 2016-13 | 0 | 335 | ||||||||||||||||||||||||
| Provision (reversal) for credit losses | (1,358) | 0 | ||||||||||||||||||||||||
| Loans charge-off | 0 | 0 | ||||||||||||||||||||||||
Allowance for credit losses ending balance | $ | 2,147 | $ | 335 | ||||||||||||||||||||||
| Three Months Ended September 30, | Nine Months Ended September 30, | ||||||||||||||
| 2017 | 2016 | 2017 | 2016 | ||||||||||||
| Revenue: | |||||||||||||||
| Health premium | $ | (48 | ) | $ | 53,632 | $ | (343 | ) | $ | 165,105 | |||||
| Benefits and expenses: | |||||||||||||||
| Health policyholder benefits | (115 | ) | 33,331 | 3,817 | 146,683 | ||||||||||
| Amortization of deferred acquisition costs | — | 1,018 | — | 2,958 | |||||||||||
| Commissions, premium taxes, and non-deferred acquisition expenses | 53 | 3,352 | 783 | 12,253 | |||||||||||
| Other operating expense | 32 | 1,222 | 809 | 4,512 | |||||||||||
| Total benefits and expenses | (30 | ) | 38,923 | 5,409 | 166,406 | ||||||||||
| Income (loss) before income taxes for discontinued operations | (18 | ) | 14,709 | (5,752 | ) | (1,301 | ) | ||||||||
| Gain from sale of discontinued operations | — | 613 | — | 613 | |||||||||||
| Income tax benefit (expense) | 6 | (5,363 | ) | 2,013 | 241 | ||||||||||
| Income (loss) from discontinued operations | $ | (12 | ) | $ | 9,959 | $ | (3,739 | ) | $ | (447 | ) | ||||
| Nine Months Ended September 30, | |||||||
| 2017 | 2016 | ||||||
| Net cash provided from (used for) discontinued operations | $ | 77,125 | $ | 82,565 | |||
| March 31, 2021 | December 31, 2020 | ||||||||||
Balance at beginning of period | $ | 162,261 | $ | 163,808 | |||||||
| Incurred related to: | |||||||||||
| Current year | 163,839 | 584,936 | |||||||||
| Prior year | (9,861) | (14,829) | |||||||||
| Total incurred | 153,978 | 570,107 | |||||||||
| Paid related to: | |||||||||||
| Current year | 66,431 | 442,127 | |||||||||
| Prior year | 86,088 | 129,527 | |||||||||
| Total paid | 152,519 | 571,654 | |||||||||
Balance at end of period | $ | 163,720 | $ | 162,261 | |||||||
| Nine Months Ended September 30, | |||||||
| 2017 | 2016 | ||||||
| Balance at beginning of period | $ | 143,128 | $ | 137,120 | |||
| Incurred related to: | |||||||
| Current year | 393,747 | 388,998 | |||||
| Prior years | (10,745 | ) | (5,710 | ) | |||
| Total incurred | 383,002 | 383,288 | |||||
| Paid related to: | |||||||
| Current year | 279,563 | 275,388 | |||||
| Prior years | 103,010 | 102,435 | |||||
| Total paid | 382,573 | 377,823 | |||||
| Balance at end of period | $ | 143,557 | $ | 142,585 | |||
| March 31, 2021 | December 31, 2020 | ||||||||||
| Policy claims and other benefits payable: | |||||||||||
| Life insurance | $ | 234,470 | $ | 237,246 | |||||||
| Health insurance | 163,720 | 162,261 | |||||||||
| Total | $ | 398,190 | $ | 399,507 | |||||||
| September 30, 2017 | December 31, 2016 | ||||||
| Policy claims and other benefits payable: | |||||||
| Short-duration contracts | $ | 23,193 | $ | 26,721 | |||
| Insurance lines other than short duration—health | 120,364 | 116,407 | |||||
| Insurance lines other than short duration—life | 175,275 | 156,437 | |||||
| Total policy claims and other benefits payable | $ | 318,832 | $ | 299,565 | |||
| Fair Value Determined by: | |||||||||||||||||||||||||||||
Quoted Prices in Active Markets for Identical Assets (Level 1) | Significant Observable Inputs (Level 2) | Significant Unobservable Inputs (Level 3) | Total Amount | % to Total | |||||||||||||||||||||||||
| Corporate bonds: | |||||||||||||||||||||||||||||
| Financial | $ | 0 | $ | 54,420 | $ | 0 | $ | 54,420 | 10 | ||||||||||||||||||||
| Utilities | 0 | 42,598 | 0 | 42,598 | 8 | ||||||||||||||||||||||||
| Energy | 0 | 22,015 | 0 | 22,015 | 4 | ||||||||||||||||||||||||
| Other corporates | 0 | 90,605 | 0 | 90,605 | 17 | ||||||||||||||||||||||||
| Total corporate bonds | 0 | 209,638 | 0 | 209,638 | 39 | ||||||||||||||||||||||||
Exchange traded fund(1) | 259,872 | 0 | 0 | 259,872 | 49 | ||||||||||||||||||||||||
| Other bonds | 0 | 244 | 0 | 244 | 0 | ||||||||||||||||||||||||
Guaranteed annuity contract(2) | 0 | 30,253 | 0 | 30,253 | 6 | ||||||||||||||||||||||||
| Short-term investments | 6,651 | 0 | 0 | 6,651 | 1 | ||||||||||||||||||||||||
| Other | 8,419 | 0 | 0 | 8,419 | 2 | ||||||||||||||||||||||||
| $ | 274,942 | $ | 240,135 | $ | 0 | 515,077 | 97 | ||||||||||||||||||||||
Other long-term investments(3) | 15,608 | 3 | |||||||||||||||||||||||||||
Total pension assets | $ | 530,685 | 100 | ||||||||||||||||||||||||||
| As of September 30, 2017 | |||
| Accident Year | Total of incurred-but-not-reported liabilities plus expected development on reported claims | ||
| 2013 | $ | — | |
| 2014 | 1 | ||
| 2015 | 46 | ||
| 2016 | 1,022 | ||
| 2017 | 22,124 | ||
| Total | $ | 23,193 | |
| Three Months Ended September 30, | |||||||||||||||
| Pension Benefits | Other Benefits | ||||||||||||||
| 2017 | 2016 | 2017 | 2016 | ||||||||||||
| Service cost | $ | 4,486 | $ | 3,894 | $ | — | $ | — | |||||||
| Interest cost | 5,552 | 5,430 | 249 | 212 | |||||||||||
| Expected return on assets | (5,900 | ) | (5,782 | ) | — | — | |||||||||
| Amortization: | |||||||||||||||
| Prior service cost | 118 | 120 | — | — | |||||||||||
| Actuarial (gain) loss | 2,952 | 2,423 | 38 | 8 | |||||||||||
| Direct recognition of expense | — | — | 111 | 45 | |||||||||||
| Net periodic benefit cost | $ | 7,208 | $ | 6,085 | $ | 398 | $ | 265 | |||||||
| Nine Months Ended September 30, | |||||||||||||||
| Pension Benefits | Other Benefits | ||||||||||||||
| 2017 | 2016 | 2017 | 2016 | ||||||||||||
| Service cost | $ | 13,457 | $ | 11,682 | $ | — | $ | — | |||||||
| Interest cost | 16,653 | 16,294 | 749 | 636 | |||||||||||
| Expected return on assets | (17,697 | ) | (17,346 | ) | — | — | |||||||||
| Amortization: | |||||||||||||||
| Prior service cost | 356 | 360 | — | — | |||||||||||
| Actuarial (gain)/loss | 8,855 | 7,270 | 115 | 24 | |||||||||||
| Direct recognition of expense | — | — | 323 | 99 | |||||||||||
| Net periodic benefit cost | $ | 21,624 | $ | 18,260 | $ | 1,187 | $ | 759 | |||||||
| Fair Value Determined by: | |||||||||||||||||||||||||||||
Quoted Prices in Active Markets for Identical Assets (Level 1) | Significant Observable Inputs (Level 2) | Significant Unobservable Inputs (Level 3) | Total Amount | % to Total | |||||||||||||||||||||||||
| Corporate bonds: | |||||||||||||||||||||||||||||
| Financial | $ | 0 | $ | 52,252 | $ | 0 | $ | 52,252 | 10 | ||||||||||||||||||||
| Utilities | 0 | 45,888 | — | 45,888 | 9 | ||||||||||||||||||||||||
| Energy | 0 | 22,480 | 0 | 22,480 | 4 | ||||||||||||||||||||||||
| Other corporates | 0 | 88,983 | 0 | 88,983 | 17 | ||||||||||||||||||||||||
| Total corporate bonds | 0 | 209,603 | 0 | 209,603 | 40 | ||||||||||||||||||||||||
Exchange traded fund(1) | 245,170 | 0 | 0 | 245,170 | 46 | ||||||||||||||||||||||||
| Other bonds | 0 | 258 | 0 | 258 | 0 | ||||||||||||||||||||||||
Guaranteed annuity contract(2) | 0 | 30,119 | 0 | 30,119 | 6 | ||||||||||||||||||||||||
| Short-term investments | 20,960 | 0 | 0 | 20,960 | 4 | ||||||||||||||||||||||||
| Other | 7,109 | 0 | 0 | 7,109 | 1 | ||||||||||||||||||||||||
| $ | 273,239 | $ | 239,980 | $ | 0 | 513,219 | 97 | ||||||||||||||||||||||
Other long-term investments(3) | 16,313 | 3 | |||||||||||||||||||||||||||
Total pension assets | $ | 529,532 | 100 | ||||||||||||||||||||||||||
| Three Months Ended March 31, | |||||||||||
| 2021 | 2020 | ||||||||||
| Premiums paid for insurance coverage | $ | 443 | $ | 443 | |||||||
| March 31, 2021 | December 31, 2020 | ||||||||||
| Total investments: | |||||||||||
| Company owned life insurance | $ | 52,138 | $ | 51,361 | |||||||
| Exchange traded funds | 74,711 | 75,390 | |||||||||
| $ | 126,849 | $ | 126,751 | ||||||||
| September 30, 2017 | December 31, 2016 | ||||||||||
| Amount | % | Amount | % | ||||||||
| Corporate bonds | $ | 172,587 | 47 | $ | 160,036 | 49 | |||||
Exchange traded fund(1) | 153,824 | 42 | 134,771 | 41 | |||||||
| Other bonds | 259 | — | 258 | — | |||||||
Guaranteed annuity contract(2) | 21,163 | 6 | 18,997 | 6 | |||||||
| Short-term investments | 12,676 | 4 | 7,391 | 2 | |||||||
| Other | 5,118 | 1 | 7,418 | 2 | |||||||
| Total | $ | 365,627 | 100 | $ | 328,871 | 100 | |||||
| March 31, 2021 | December 31, 2020 | ||||||||||
| Defined benefit pension | $ | 673,114 | $ | 667,753 | |||||||
| SERP | 95,631 | 95,560 | |||||||||
| Pension benefit obligation | $ | 768,745 | $ | 763,313 | |||||||
| September 30, 2017 | December 31, 2016 | ||||||
| Funded defined benefit pension | $ | 475,927 | $ | 449,613 | |||
SERP(1) (Active) | 77,223 | 74,687 | |||||
SERP(1) (Closed) | 2,827 | 3,222 | |||||
| Pension Benefit Obligation | $ | 555,977 | $ | 527,522 | |||
| Three Months Ended March 31, | |||||||||||||||||||||||
| 2021 | 2020 | ||||||||||||||||||||||
| Service cost | $ | 7,918 | $ | 6,116 | |||||||||||||||||||
| Interest cost | 5,467 | 5,651 | |||||||||||||||||||||
| Expected return on assets | (8,083) | (7,390) | |||||||||||||||||||||
| Amortization: | |||||||||||||||||||||||
| Prior service cost | 158 | 158 | |||||||||||||||||||||
| Actuarial (gain) loss | 4,985 | 3,924 | |||||||||||||||||||||
Net periodic benefit cost | $ | 10,445 | $ | 8,459 | |||||||||||||||||||
| Three Months Ended March 31, | |||||||||||||||||||||||
| 2021 | 2020 | ||||||||||||||||||||||
| Basic weighted average shares outstanding | 103,482,944 | 107,285,223 | |||||||||||||||||||||
| Weighted average dilutive options outstanding | 1,354,773 | 1,847,021 | |||||||||||||||||||||
| Diluted weighted average shares outstanding | 104,837,717 | 109,132,244 | |||||||||||||||||||||
| Antidilutive shares | 1,836,559 | 529,129 | |||||||||||||||||||||
| Three Months Ended September 30, | Nine Months Ended September 30, | ||||||||||
| 2017 | 2016 | 2017 | 2016 | ||||||||
| Basic weighted average shares outstanding | 115,921,134 | 119,480,642 | 116,772,652 | 120,476,813 | |||||||
| Weighted average dilutive options outstanding | 2,521,815 | 2,430,121 | 2,540,955 | 2,209,739 | |||||||
| Diluted weighted average shares outstanding | 118,442,949 | 121,910,763 | 119,313,607 | 122,686,552 | |||||||
| Antidilutive shares | — | — | 1,174,469 | — | |||||||
| Three Months Ended March 31, 2021 | ||||||||||||||||||||||||||||||||||||||||||||||||||
| Life | Health | Annuity | Total | |||||||||||||||||||||||||||||||||||||||||||||||
| Distribution Channel | Amount | % of Total | Amount | % of Total | Amount | % of Total | Amount | % of Total | ||||||||||||||||||||||||||||||||||||||||||
| American Income | $ | 334,895 | 47 | $ | 27,351 | 9 | $ | 0 | 0 | $ | 362,246 | 36 | ||||||||||||||||||||||||||||||||||||||
| Direct to Consumer | 244,028 | 35 | 19,360 | 7 | 0 | 0 | 263,388 | 26 | ||||||||||||||||||||||||||||||||||||||||||
| Liberty National | 75,737 | 11 | 47,040 | 16 | 0 | 0 | 122,777 | 12 | ||||||||||||||||||||||||||||||||||||||||||
| United American | 2,277 | 0 | 117,087 | 40 | 1 | 100 | 119,365 | 12 | ||||||||||||||||||||||||||||||||||||||||||
| Family Heritage | 1,118 | 0 | 83,335 | 28 | 0 | 0 | 84,453 | 9 | ||||||||||||||||||||||||||||||||||||||||||
| Other | 50,064 | 7 | 0 | 0 | 0 | 0 | 50,064 | 5 | ||||||||||||||||||||||||||||||||||||||||||
| $ | 708,119 | 100 | $ | 294,173 | 100 | $ | 1 | 100 | $ | 1,002,293 | 100 | |||||||||||||||||||||||||||||||||||||||
| Three Months Ended March 31, 2020 | ||||||||||||||||||||||||||||||||||||||||||||||||||
| Life | Health | Annuity | Total | |||||||||||||||||||||||||||||||||||||||||||||||
| Distribution Channel | Amount | % of Total | Amount | % of Total | Amount | % of Total | Amount | % of Total | ||||||||||||||||||||||||||||||||||||||||||
| American Income | $ | 302,852 | 47 | $ | 25,727 | 9 | $ | 0 | 0 | $ | 328,579 | 35 | ||||||||||||||||||||||||||||||||||||||
| Direct to Consumer | 220,043 | 34 | 19,796 | 7 | 0 | 0 | 239,839 | 26 | ||||||||||||||||||||||||||||||||||||||||||
| Liberty National | 72,868 | 11 | 47,640 | 17 | 0 | 0 | 120,508 | 13 | ||||||||||||||||||||||||||||||||||||||||||
| United American | 2,490 | 0 | 110,059 | 39 | 0 | 0 | 112,549 | 12 | ||||||||||||||||||||||||||||||||||||||||||
| Family Heritage | 1,021 | 0 | 76,983 | 28 | 0 | 0 | 78,004 | 8 | ||||||||||||||||||||||||||||||||||||||||||
| Other | 50,356 | 8 | 0 | 0 | 0 | 0 | 50,356 | 6 | ||||||||||||||||||||||||||||||||||||||||||
| $ | 649,630 | 100 | $ | 280,205 | 100 | $ | 0 | 0 | $ | 929,835 | 100 | |||||||||||||||||||||||||||||||||||||||
| Three Months Ended March 31, 2021 | ||||||||||||||||||||||||||||||||||||||||||||
| Life | Health | Annuity | Investment | Corporate & Other | Adjustments | Consolidated | ||||||||||||||||||||||||||||||||||||||
| Revenue: | ||||||||||||||||||||||||||||||||||||||||||||
| Premium | $ | 708,119 | $ | 294,173 | $ | 1 | $ | 0 | $ | 0 | $ | 0 | $ | 1,002,293 | ||||||||||||||||||||||||||||||
| Net investment income | 0 | 0 | 0 | 235,820 | 0 | 0 | 235,820 | |||||||||||||||||||||||||||||||||||||
| Other income | 0 | 0 | 0 | 0 | 295 | 0 | 295 | |||||||||||||||||||||||||||||||||||||
| Total revenue | 708,119 | 294,173 | 1 | 235,820 | 295 | 0 | 1,238,408 | |||||||||||||||||||||||||||||||||||||
| Expenses: | ||||||||||||||||||||||||||||||||||||||||||||
| Policy benefits | 517,631 | 187,829 | 7,259 | 0 | 0 | 0 | 712,719 | |||||||||||||||||||||||||||||||||||||
| Required interest on reserves | (179,925) | (24,995) | (10,005) | 214,925 | 0 | 0 | 0 | |||||||||||||||||||||||||||||||||||||
| Required interest on DAC | 53,795 | 6,962 | 70 | (60,827) | 0 | 0 | 0 | |||||||||||||||||||||||||||||||||||||
| Amortization of acquisition costs | 123,304 | 29,207 | 482 | 0 | 0 | 0 | 152,993 | |||||||||||||||||||||||||||||||||||||
| Commissions, premium taxes, and non-deferred acquisition costs | 56,668 | 22,990 | 8 | 0 | 0 | 0 | 79,666 | |||||||||||||||||||||||||||||||||||||
Insurance administrative expense(1) | 0 | 0 | 0 | 0 | 66,176 | 4,828 | (2) | 71,004 | ||||||||||||||||||||||||||||||||||||
| Parent expense | 0 | 0 | 0 | 0 | 2,318 | 0 | 2,318 | |||||||||||||||||||||||||||||||||||||
| Stock-based compensation expense | 0 | 0 | 0 | 0 | 7,888 | 0 | 7,888 | |||||||||||||||||||||||||||||||||||||
| Interest expense | 0 | 0 | 0 | 21,178 | 0 | 0 | 21,178 | |||||||||||||||||||||||||||||||||||||
| Total expenses | 571,473 | 221,993 | (2,186) | 175,276 | 76,382 | 4,828 | 1,047,766 | |||||||||||||||||||||||||||||||||||||
| Subtotal | 136,646 | 72,180 | 2,187 | 60,544 | (76,087) | (4,828) | 190,642 | |||||||||||||||||||||||||||||||||||||
| Non-operating items | — | — | — | — | — | 4,828 | (2) | 4,828 | ||||||||||||||||||||||||||||||||||||
Measure of segment profitability (pretax) | $ | 136,646 | $ | 72,180 | $ | 2,187 | $ | 60,544 | $ | (76,087) | $ | 0 | 195,470 | |||||||||||||||||||||||||||||||
| Realized gain (loss)—investments | 28,152 | |||||||||||||||||||||||||||||||||||||||||||
| Legal proceedings | (4,828) | |||||||||||||||||||||||||||||||||||||||||||
| $ | 218,794 | |||||||||||||||||||||||||||||||||||||||||||
| Three Months Ended September 30, 2017 | ||||||||||||||||||||||||||||
| Life | Health | Annuity | Investment | Other & Corporate | Adjustments | Consolidated | ||||||||||||||||||||||
| Revenue: | ||||||||||||||||||||||||||||
| Premium | $ | 576,223 | $ | 242,991 | $ | 3 | $ | 819,217 | ||||||||||||||||||||
| Net investment income | $ | 213,872 | 213,872 | |||||||||||||||||||||||||
| Other income | $ | 361 | $ | (30 | ) | (2) | 331 | |||||||||||||||||||||
| Total revenue | 576,223 | 242,991 | 3 | 213,872 | 361 | (30 | ) | 1,033,420 | ||||||||||||||||||||
| Expenses: | ||||||||||||||||||||||||||||
| Policy benefits | 386,445 | 155,774 | 9,000 | 551,219 | ||||||||||||||||||||||||
| Required interest on reserves | (152,862 | ) | (19,617 | ) | (12,433 | ) | 184,912 | — | ||||||||||||||||||||
| Required interest on DAC | 46,893 | 5,881 | 172 | (52,946 | ) | — | ||||||||||||||||||||||
| Amortization of acquisition costs | 98,268 | 23,458 | 608 | 122,334 | ||||||||||||||||||||||||
| Commissions, premium taxes, and non-deferred acquisition costs | 44,748 | 21,746 | 7 | 1,362 | (2,3) | 67,863 | ||||||||||||||||||||||
Insurance administrative expense(1) | 52,426 | 52,426 | ||||||||||||||||||||||||||
| Parent expense | 2,330 | 2,330 | ||||||||||||||||||||||||||
| Stock compensation expense | 8,263 | 8,263 | ||||||||||||||||||||||||||
| Interest expense | 20,970 | 20,970 | ||||||||||||||||||||||||||
| Total expenses | 423,492 | 187,242 | (2,646 | ) | 152,936 | 63,019 | 1,362 | 825,405 | ||||||||||||||||||||
| Subtotal | 152,731 | 55,749 | 2,649 | 60,936 | (62,658 | ) | (1,392 | ) | 208,015 | |||||||||||||||||||
| Non-operating items | 1,392 | (3) | 1,392 | |||||||||||||||||||||||||
| Measure of segment profitability (pretax) | $ | 152,731 | $ | 55,749 | $ | 2,649 | $ | 60,936 | $ | (62,658 | ) | $ | — | 209,407 | ||||||||||||||
| Deduct applicable income taxes | (63,342 | ) | ||||||||||||||||||||||||||
| Segment profits after tax | 146,065 | |||||||||||||||||||||||||||
| Add back income taxes applicable to segment profitability | 63,342 | |||||||||||||||||||||||||||
| Add (deduct) realized investment gains (losses) | 12,595 | |||||||||||||||||||||||||||
Add (deduct) guaranty fund assessments(3) | (1,392 | ) | ||||||||||||||||||||||||||
| Pretax income from continuing operations per Condensed Consolidated Statements of Operations | $ | 220,610 | ||||||||||||||||||||||||||
| Three Months Ended March 31, 2020 | ||||||||||||||||||||||||||||||||||||||||||||
| Life | Health | Annuity | Investment | Corporate & Other | Adjustments | Consolidated | ||||||||||||||||||||||||||||||||||||||
| Revenue: | ||||||||||||||||||||||||||||||||||||||||||||
| Premium | $ | 649,630 | $ | 280,205 | $ | 0 | $ | 0 | $ | 0 | $ | 0 | $ | 929,835 | ||||||||||||||||||||||||||||||
| Net investment income | 0 | 0 | 0 | 228,991 | 0 | 0 | 228,991 | |||||||||||||||||||||||||||||||||||||
| Other income | 0 | 0 | 0 | 0 | 325 | 0 | 325 | |||||||||||||||||||||||||||||||||||||
| Total revenue | 649,630 | 280,205 | 0 | 228,991 | 325 | 0 | 1,159,151 | |||||||||||||||||||||||||||||||||||||
| Expenses: | ||||||||||||||||||||||||||||||||||||||||||||
| Policy benefits | 421,670 | 178,711 | 7,588 | 0 | 0 | 0 | 607,969 | |||||||||||||||||||||||||||||||||||||
| Required interest on reserves | (171,205) | (22,510) | (10,456) | 204,171 | 0 | 0 | 0 | |||||||||||||||||||||||||||||||||||||
| Required interest on DAC | 52,118 | 6,519 | 88 | (58,725) | 0 | 0 | 0 | |||||||||||||||||||||||||||||||||||||
| Amortization of acquisition costs | 114,308 | 29,025 | 504 | 0 | 0 | 0 | 143,837 | |||||||||||||||||||||||||||||||||||||
| Commissions, premium taxes, and non-deferred acquisition costs | 53,936 | 24,995 | 6 | 0 | 0 | 0 | 78,937 | |||||||||||||||||||||||||||||||||||||
Insurance administrative expense(1) | 0 | 0 | 0 | 0 | 63,620 | 3,275 | (2) | 66,895 | ||||||||||||||||||||||||||||||||||||
| Parent expense | 0 | 0 | 0 | 0 | 2,331 | 0 | 2,331 | |||||||||||||||||||||||||||||||||||||
| Stock-based compensation expense | 0 | 0 | 0 | 0 | 9,356 | 0 | 9,356 | |||||||||||||||||||||||||||||||||||||
| Interest expense | 0 | 0 | 0 | 20,808 | 0 | 0 | 20,808 | |||||||||||||||||||||||||||||||||||||
| Total expenses | 470,827 | 216,740 | (2,270) | 166,254 | 75,307 | 3,275 | 930,133 | |||||||||||||||||||||||||||||||||||||
| Subtotal | 178,803 | 63,465 | 2,270 | 62,737 | (74,982) | (3,275) | 229,018 | |||||||||||||||||||||||||||||||||||||
| Non-operating items | — | — | — | — | — | 3,275 | (2) | 3,275 | ||||||||||||||||||||||||||||||||||||
Measure of segment profitability (pretax) | $ | 178,803 | $ | 63,465 | $ | 2,270 | $ | 62,737 | $ | (74,982) | $ | 0 | 232,293 | |||||||||||||||||||||||||||||||
| Realized gain (loss)—investments | (26,097) | |||||||||||||||||||||||||||||||||||||||||||
| Legal proceedings | (3,275) | |||||||||||||||||||||||||||||||||||||||||||
| $ | 202,921 | |||||||||||||||||||||||||||||||||||||||||||
| Three Months Ended September 30, 2016 | ||||||||||||||||||||||||||||
| Life | Health | Annuity | Investment | Other & Corporate | Adjustments | Consolidated | ||||||||||||||||||||||
| Revenue: | ||||||||||||||||||||||||||||
| Premium | $ | 546,415 | $ | 236,987 | $ | 9 | �� | $ | 783,411 | |||||||||||||||||||
| Net investment income | $ | 202,720 | 202,720 | |||||||||||||||||||||||||
| Other income | $ | 199 | $ | (39 | ) | (2) | 160 | |||||||||||||||||||||
| Total revenue | 546,415 | 236,987 | 9 | 202,720 | 199 | (39 | ) | 986,291 | ||||||||||||||||||||
| Expenses: | ||||||||||||||||||||||||||||
| Policy benefits | 369,546 | 153,351 | 9,255 | 532,152 | ||||||||||||||||||||||||
| Required interest on reserves | (145,295 | ) | (18,476 | ) | (12,761 | ) | 176,532 | — | ||||||||||||||||||||
| Required interest on DAC | 44,950 | 5,789 | 192 | (50,931 | ) | — | ||||||||||||||||||||||
| Amortization of acquisition costs | 93,496 | 22,643 | 682 | 116,821 | ||||||||||||||||||||||||
| Commissions, premium taxes, and non-deferred acquisition costs | 40,577 | 20,604 | 11 | (39 | ) | (2) | 61,153 | |||||||||||||||||||||
Insurance administrative expense(1) | 49,248 | 257 | 49,505 | |||||||||||||||||||||||||
| Parent expense | 1,955 | 1,955 | ||||||||||||||||||||||||||
| Stock compensation expense | 6,345 | 6,345 | ||||||||||||||||||||||||||
| Interest expense | 20,381 | 20,381 | ||||||||||||||||||||||||||
| Total expenses | 403,274 | 183,911 | (2,621 | ) | 145,982 | 57,548 | 218 | 788,312 | ||||||||||||||||||||
| Subtotal | 143,141 | 53,076 | 2,630 | 56,738 | (57,349 | ) | (257 | ) | 197,979 | |||||||||||||||||||
| Non-operating items | 257 | 257 | ||||||||||||||||||||||||||
| Measure of segment profitability (pretax) | $ | 143,141 | $ | 53,076 | $ | 2,630 | $ | 56,738 | $ | (57,349 | ) | $ | — | 198,236 | ||||||||||||||
| Deduct applicable income taxes | (58,422 | ) | ||||||||||||||||||||||||||
| Segment profits after tax | 139,814 | |||||||||||||||||||||||||||
| Add back income taxes applicable to segment profitability | 58,422 | |||||||||||||||||||||||||||
| Add (deduct) realized investment gains (losses) | 3,482 | |||||||||||||||||||||||||||
| Add (deduct) non-operating fees | (257 | ) | ||||||||||||||||||||||||||
| Pretax income from continuing operations per Condensed Consolidated Statements of Operations | $ | 201,461 | ||||||||||||||||||||||||||
| Nine Months Ended September 30, 2017 | ||||||||||||||||||||||||||||
| Life | Health | Annuity | Investment | Other & Corporate | Adjustments | Consolidated | ||||||||||||||||||||||
| Revenue: | ||||||||||||||||||||||||||||
| Premium | $ | 1,725,896 | $ | 730,557 | $ | 9 | $ | 2,456,462 | ||||||||||||||||||||
| Net investment income | $ | 634,930 | 634,930 | |||||||||||||||||||||||||
| Other income | $ | 1,239 | $ | (99 | ) | (2) | 1,140 | |||||||||||||||||||||
| Total revenue | 1,725,896 | 730,557 | 9 | 634,930 | 1,239 | (99 | ) | 3,092,532 | ||||||||||||||||||||
| Expenses: | ||||||||||||||||||||||||||||
| Policy benefits | 1,166,289 | 470,104 | 26,923 | 2,094 | (3) | 1,665,410 | ||||||||||||||||||||||
| Required interest on reserves | (452,339 | ) | (57,859 | ) | (37,245 | ) | 547,443 | — | ||||||||||||||||||||
| Required interest on DAC | 139,042 | 17,530 | 524 | (157,096 | ) | — | ||||||||||||||||||||||
| Amortization of acquisition costs | 296,646 | 71,801 | 1,916 | 370,363 | ||||||||||||||||||||||||
| Commissions, premium taxes, and non-deferred acquisition costs | 132,094 | 64,599 | 25 | 1,293 | (2,4) | 198,011 | ||||||||||||||||||||||
Insurance administrative expense(1) | 155,751 | 155,751 | ||||||||||||||||||||||||||
| Parent expense | 7,228 | 7,228 | ||||||||||||||||||||||||||
| Stock compensation expense | 24,809 | 24,809 | ||||||||||||||||||||||||||
| Interest expense | 62,825 | 62,825 | ||||||||||||||||||||||||||
| Total expenses | 1,281,732 | 566,175 | (7,857 | ) | 453,172 | 187,788 | 3,387 | 2,484,397 | ||||||||||||||||||||
| Subtotal | 444,164 | 164,382 | 7,866 | 181,758 | (186,549 | ) | (3,486 | ) | 608,135 | |||||||||||||||||||
| Non-operating items | 3,486 | (3,4) | 3,486 | |||||||||||||||||||||||||
| Measure of segment profitability (pretax) | $ | 444,164 | $ | 164,382 | $ | 7,866 | $ | 181,758 | $ | (186,549 | ) | $ | — | 611,621 | ||||||||||||||
| Deduct applicable income taxes | (184,703 | ) | ||||||||||||||||||||||||||
| Segment profits after tax | 426,918 | |||||||||||||||||||||||||||
| Add back income taxes applicable to segment profitability | 184,703 | |||||||||||||||||||||||||||
| Add (deduct) realized investment gains (losses) | 6,142 | |||||||||||||||||||||||||||
Add (deduct) administrative settlements(3) | (2,094 | ) | ||||||||||||||||||||||||||
Add (deduct) guaranty fund assessments (4) | (1,392 | ) | ||||||||||||||||||||||||||
| Pretax income from continuing operations per Condensed Consolidated Statements of Operations | $ | 614,277 | ||||||||||||||||||||||||||
| Nine Months Ended September 30, 2016 | ||||||||||||||||||||||||||||
| Life | Health | Annuity | Investment | Other & Corporate | Adjustments | Consolidated | ||||||||||||||||||||||
| Revenue: | ||||||||||||||||||||||||||||
| Premium | $ | 1,639,156 | $ | 709,936 | $ | 34 | $ | 2,349,126 | ||||||||||||||||||||
| Net investment income | $ | 601,415 | 601,415 | |||||||||||||||||||||||||
| Other income | $ | 1,086 | $ | (123 | ) | (2) | 963 | |||||||||||||||||||||
| Total revenue | 1,639,156 | 709,936 | 34 | 601,415 | 1,086 | (123 | ) | 2,951,504 | ||||||||||||||||||||
| Expenses: | ||||||||||||||||||||||||||||
| Policy benefits | 1,101,748 | 459,387 | 27,475 | 1,588,610 | ||||||||||||||||||||||||
| Required interest on reserves | (430,931 | ) | (54,803 | ) | (38,359 | ) | 524,093 | — | ||||||||||||||||||||
| Required interest on DAC | 133,628 | 17,297 | 621 | (151,546 | ) | — | ||||||||||||||||||||||
| Amortization of acquisition costs | 281,698 | 67,110 | 4,064 | 352,872 | ||||||||||||||||||||||||
| Commissions, premium taxes, and non-deferred acquisition costs | 121,968 | 63,733 | 31 | (123 | ) | (2) | 185,609 | |||||||||||||||||||||
Insurance administrative expense (1) | 146,129 | 257 | 146,386 | |||||||||||||||||||||||||
| Parent expense | 6,360 | 6,360 | ||||||||||||||||||||||||||
| Stock compensation expense | 20,334 | 20,334 | ||||||||||||||||||||||||||
| Interest expense | 62,860 | 62,860 | ||||||||||||||||||||||||||
| Total expenses | 1,208,111 | 552,724 | (6,168 | ) | 435,407 | 172,823 | 134 | 2,363,031 | ||||||||||||||||||||
| Subtotal | 431,045 | 157,212 | 6,202 | 166,008 | (171,737 | ) | (257 | ) | 588,473 | |||||||||||||||||||
| Non-operating items | 257 | 257 | ||||||||||||||||||||||||||
| Measure of segment profitability (pretax) | $ | 431,045 | $ | 157,212 | $ | 6,202 | $ | 166,008 | $ | (171,737 | ) | $ | — | 588,730 | ||||||||||||||
| Deduct applicable income taxes | (178,842 | ) | ||||||||||||||||||||||||||
| Segment profits after tax | 409,888 | |||||||||||||||||||||||||||
| Add back income taxes applicable to segment profitability | 178,842 | |||||||||||||||||||||||||||
| Add (deduct) realized investment gains (losses) | 7,780 | |||||||||||||||||||||||||||
| Add (deduct) non-operating fees | (257 | ) | ||||||||||||||||||||||||||
| Pretax income from continuing operations per Condensed Consolidated Statements of Operations | $ | 596,253 | ||||||||||||||||||||||||||
| Three Months Ended September 30, | Nine Months Ended September 30, | ||||||||||||||
| 2017 | 2016 | 2017 | 2016 | ||||||||||||
| Life insurance underwriting margin | $ | 152,731 | $ | 143,141 | $ | 444,164 | $ | 431,045 | |||||||
| Health insurance underwriting margin | 55,749 | 53,076 | 164,382 | 157,212 | |||||||||||
| Annuity underwriting margin | 2,649 | 2,630 | 7,866 | 6,202 | |||||||||||
| Excess investment income | 60,936 | 56,738 | 181,758 | 166,008 | |||||||||||
| Other insurance: | |||||||||||||||
| Other income | 361 | 199 | 1,239 | 1,086 | |||||||||||
| Administrative expense | (52,426 | ) | (49,248 | ) | (155,751 | ) | (146,129 | ) | |||||||
| Corporate and adjustments | (10,593 | ) | (8,300 | ) | (32,037 | ) | (26,694 | ) | |||||||
| Segment profits before tax | 209,407 | 198,236 | 611,621 | 588,730 | |||||||||||
| Applicable taxes | (63,342 | ) | (58,422 | ) | (184,703 | ) | (178,842 | ) | |||||||
| Segment profits after tax | 146,065 | 139,814 | 426,918 | 409,888 | |||||||||||
| Discontinued operations (after tax) | (12 | ) | 9,959 | (3,739 | ) | (447 | ) | ||||||||
| After-tax total, after discontinued operations | 146,053 | 149,773 | 423,179 | 409,441 | |||||||||||
| Realized gains (losses)—investments (after tax) | 8,186 | 2,263 | 6,235 | 5,057 | |||||||||||
| Administrative settlements (after tax) | — | — | (1,361 | ) | — | ||||||||||
| Guaranty fund assessments (after tax) | (905 | ) | — | (905 | ) | — | |||||||||
| Non-operating fees (after tax) | — | (167 | ) | — | (167 | ) | |||||||||
| Net income | $ | 153,334 | $ | 151,869 | $ | 427,148 | $ | 414,331 | |||||||
 | How Globe Life Views Its Operations. Globe Life Inc. is the holding company for a group of insurance companies that market primarily individual life and supplemental health insurance to lower middle to middle income households throughout the United States. We view our operations by segments, which are the insurance product lines of life, supplemental health, and annuities, and the investment segment that supports the product lines. Segments are aligned based on their common characteristics, comparability of the profit margins, and management techniques used to operate each segment. | |||||||
 | Insurance Product Line Segments. The insurance product line segments involve the marketing, underwriting, and administration of policies. Each product line is further segmented by the various distribution channels that market the insurance policies. Each distribution channel operates in a niche market offering insurance products designed for that particular market. Whether analyzing profitability of a segment as a whole, or the individual distribution channels within the segment, the measure of profitability used by management is the underwriting margin, as seen below: | |||||||
Premium revenue (Policy obligations) (Policy acquisition costs and commissions) Underwriting margin | ||||||||
 | Investment Segment.The investment segment involves the management of our capital resources, including investments and the management of corporate debt and liquidity. Our measure of profitability for the investment segment is excess investment income, as seen below: | |||||||
Net investment income (Required interest on net policy liabilities) (Financing costs) Excess investment income | ||||||||
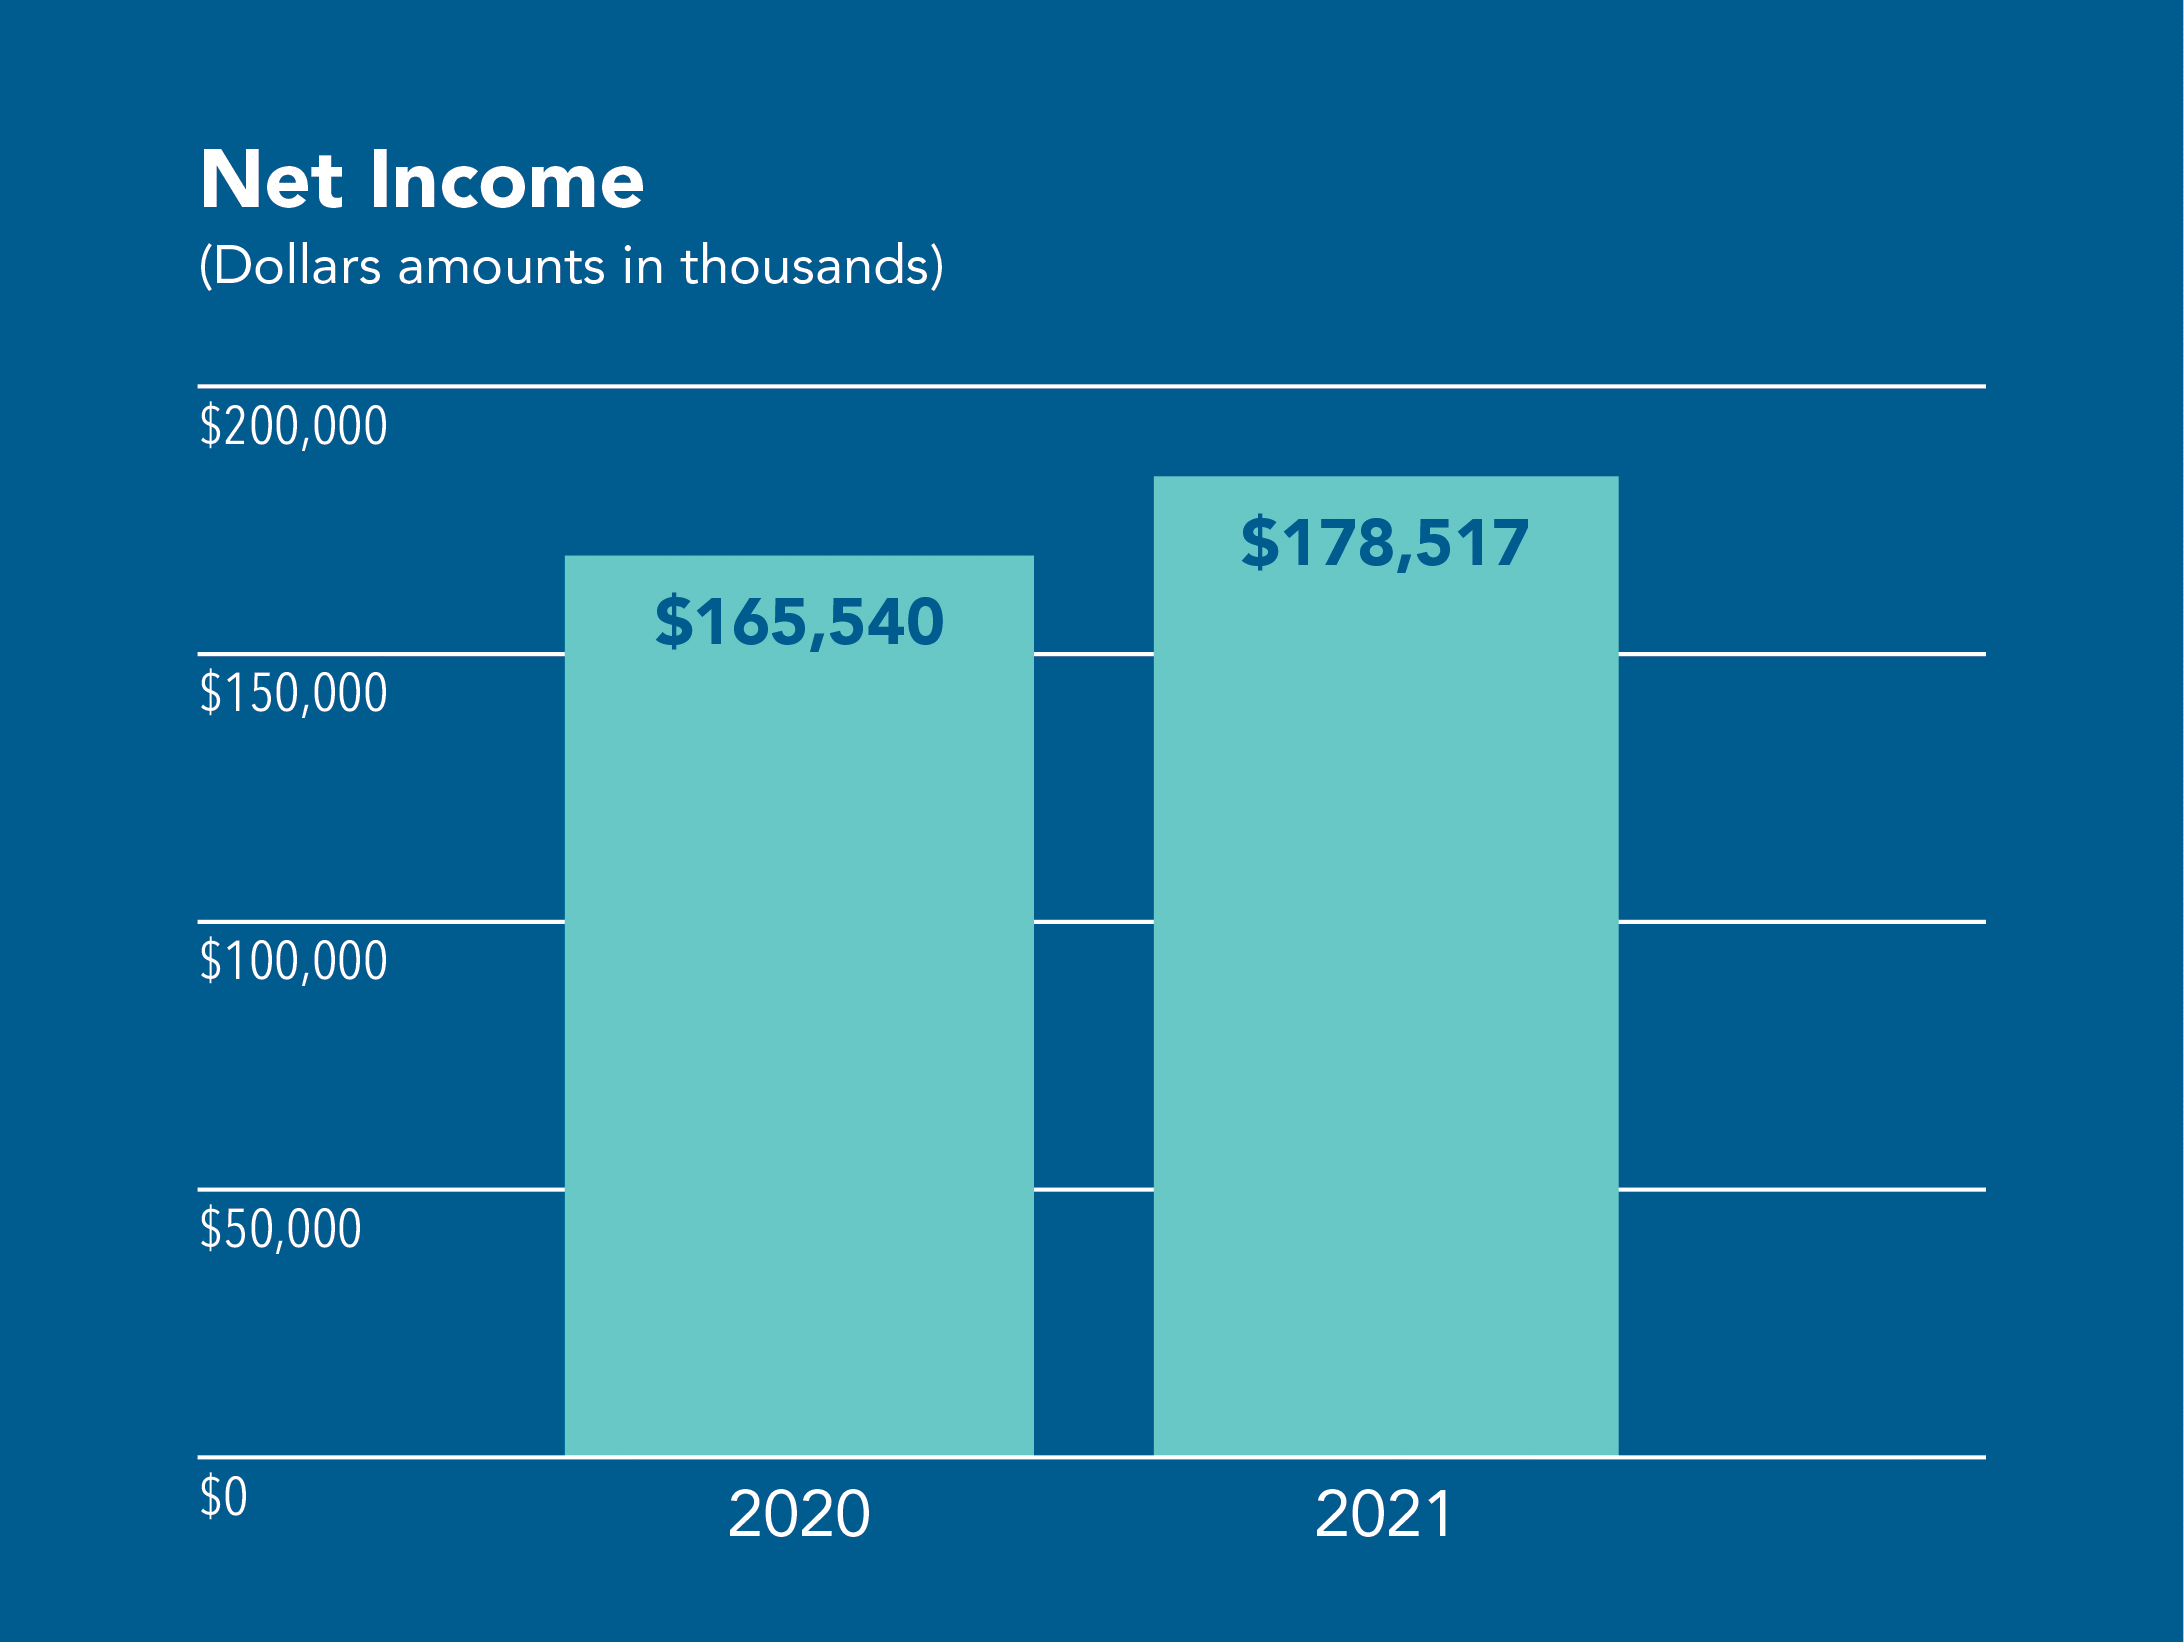
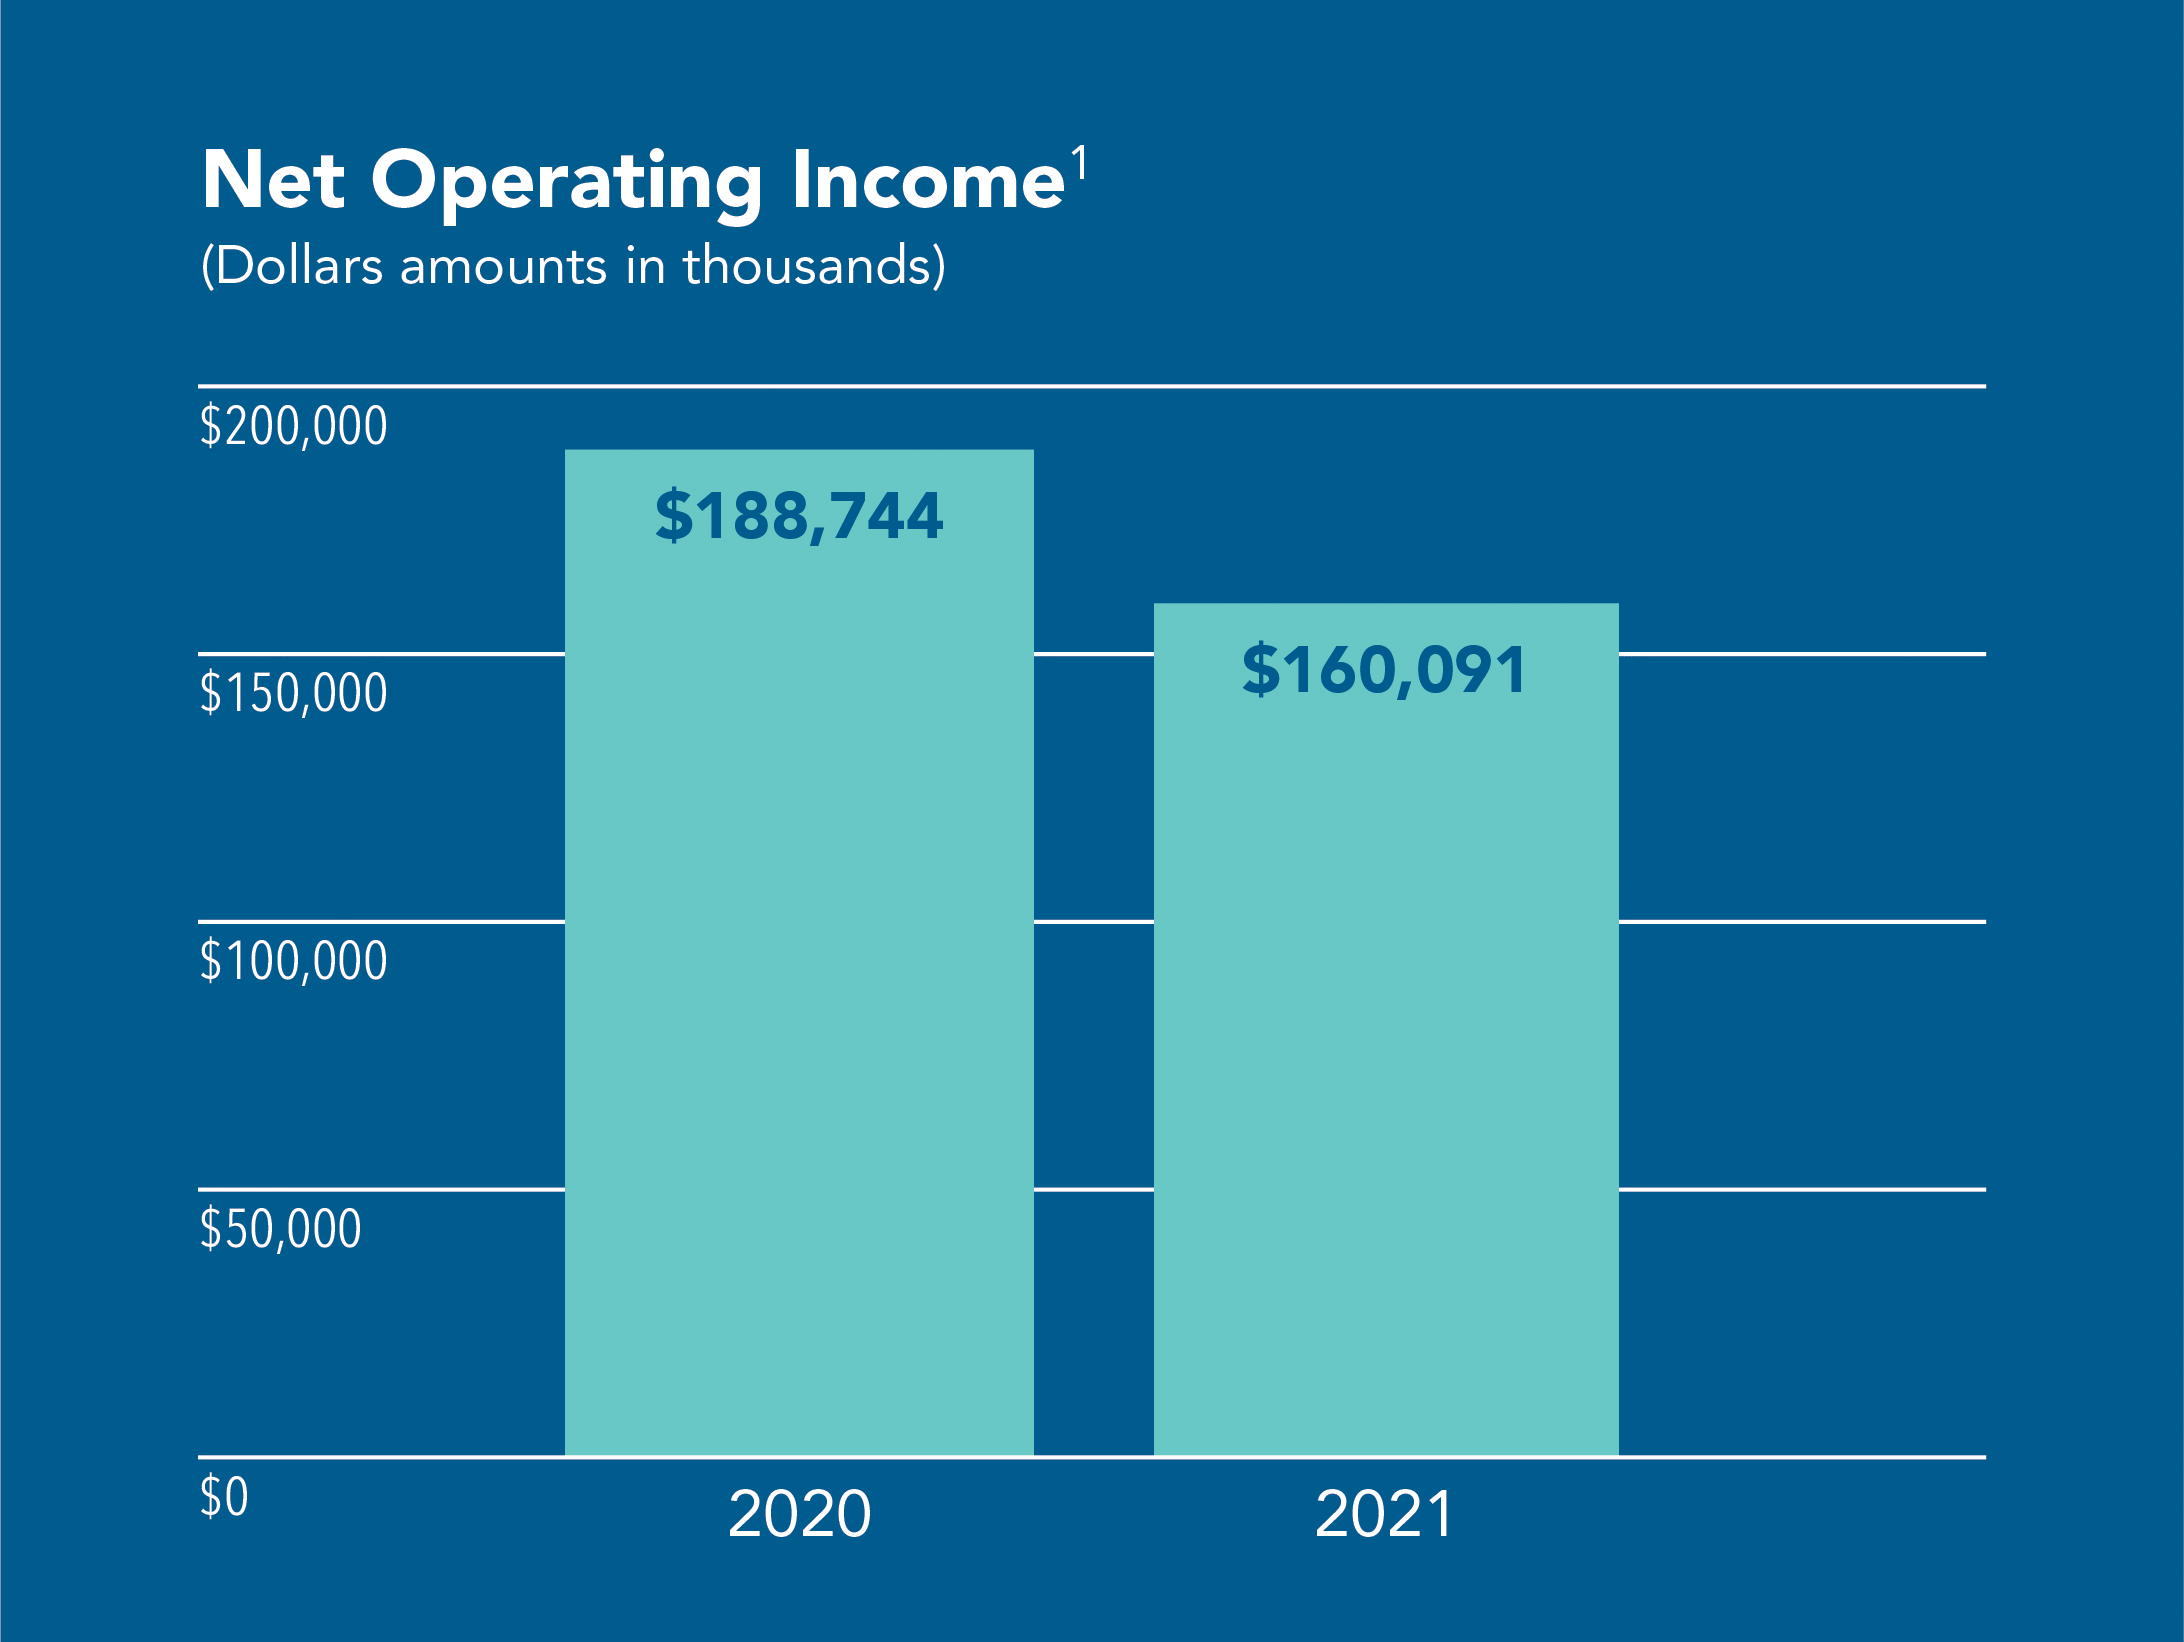
| Three Months Ended March 31, | |||||||||||||||||||||||
| 2021 | 2020 | Change | % | ||||||||||||||||||||
| Life insurance underwriting margin | $ | 136,646 | $ | 178,803 | $ | (42,157) | (24) | ||||||||||||||||
| Health insurance underwriting margin | 72,180 | 63,465 | 8,715 | 14 | |||||||||||||||||||
| Annuity underwriting margin | 2,187 | 2,270 | (83) | (4) | |||||||||||||||||||
| Excess investment income | 60,544 | 62,737 | (2,193) | (3) | |||||||||||||||||||
| Other insurance: | |||||||||||||||||||||||
| Other income | 295 | 325 | (30) | (9) | |||||||||||||||||||
| Administrative expense | (66,176) | (63,620) | (2,556) | 4 | |||||||||||||||||||
| Corporate and other | (10,206) | (11,687) | 1,481 | (13) | |||||||||||||||||||
| Pre-tax total | 195,470 | 232,293 | (36,823) | (16) | |||||||||||||||||||
| Applicable taxes | (35,379) | (43,549) | 8,170 | (19) | |||||||||||||||||||
Net operating income | 160,091 | 188,744 | (28,653) | (15) | |||||||||||||||||||
| Reconciling items, net of tax: | |||||||||||||||||||||||
| Realized gain (loss)—investments | 22,240 | (20,617) | 42,857 | ||||||||||||||||||||
| Legal proceedings | (3,814) | (2,587) | (1,227) | ||||||||||||||||||||
Net income | $ | 178,517 | $ | 165,540 | $ | 12,977 | 8 | ||||||||||||||||
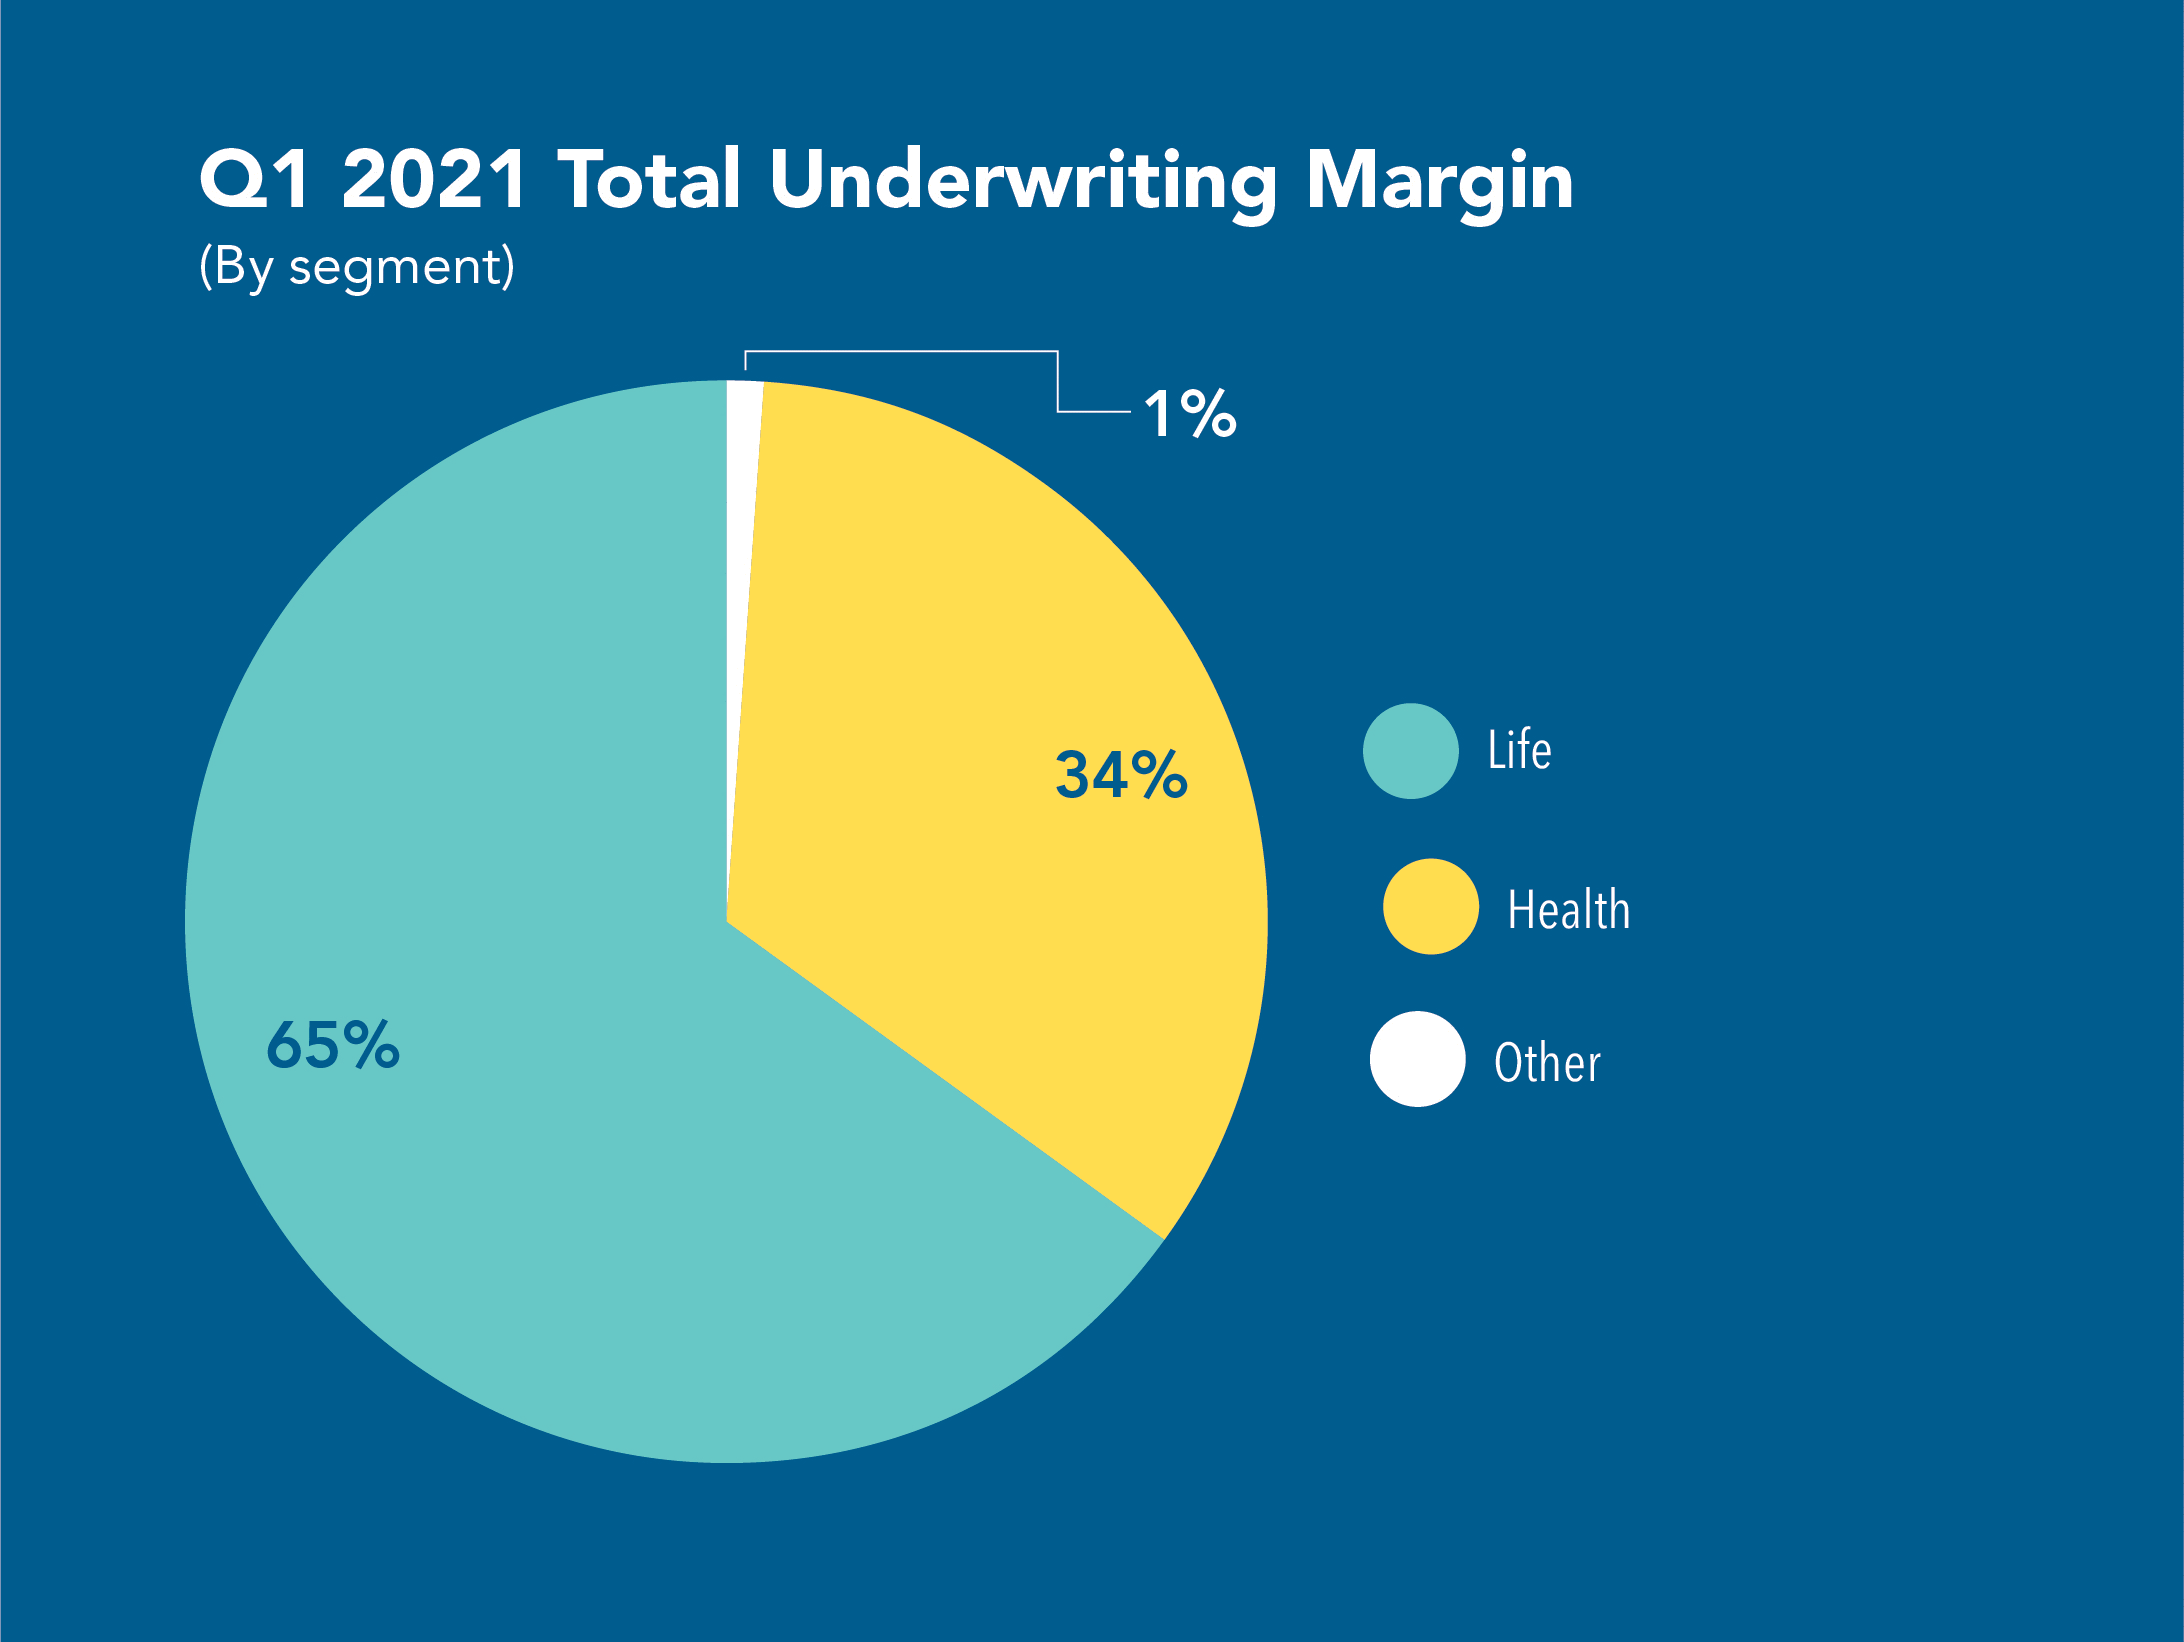
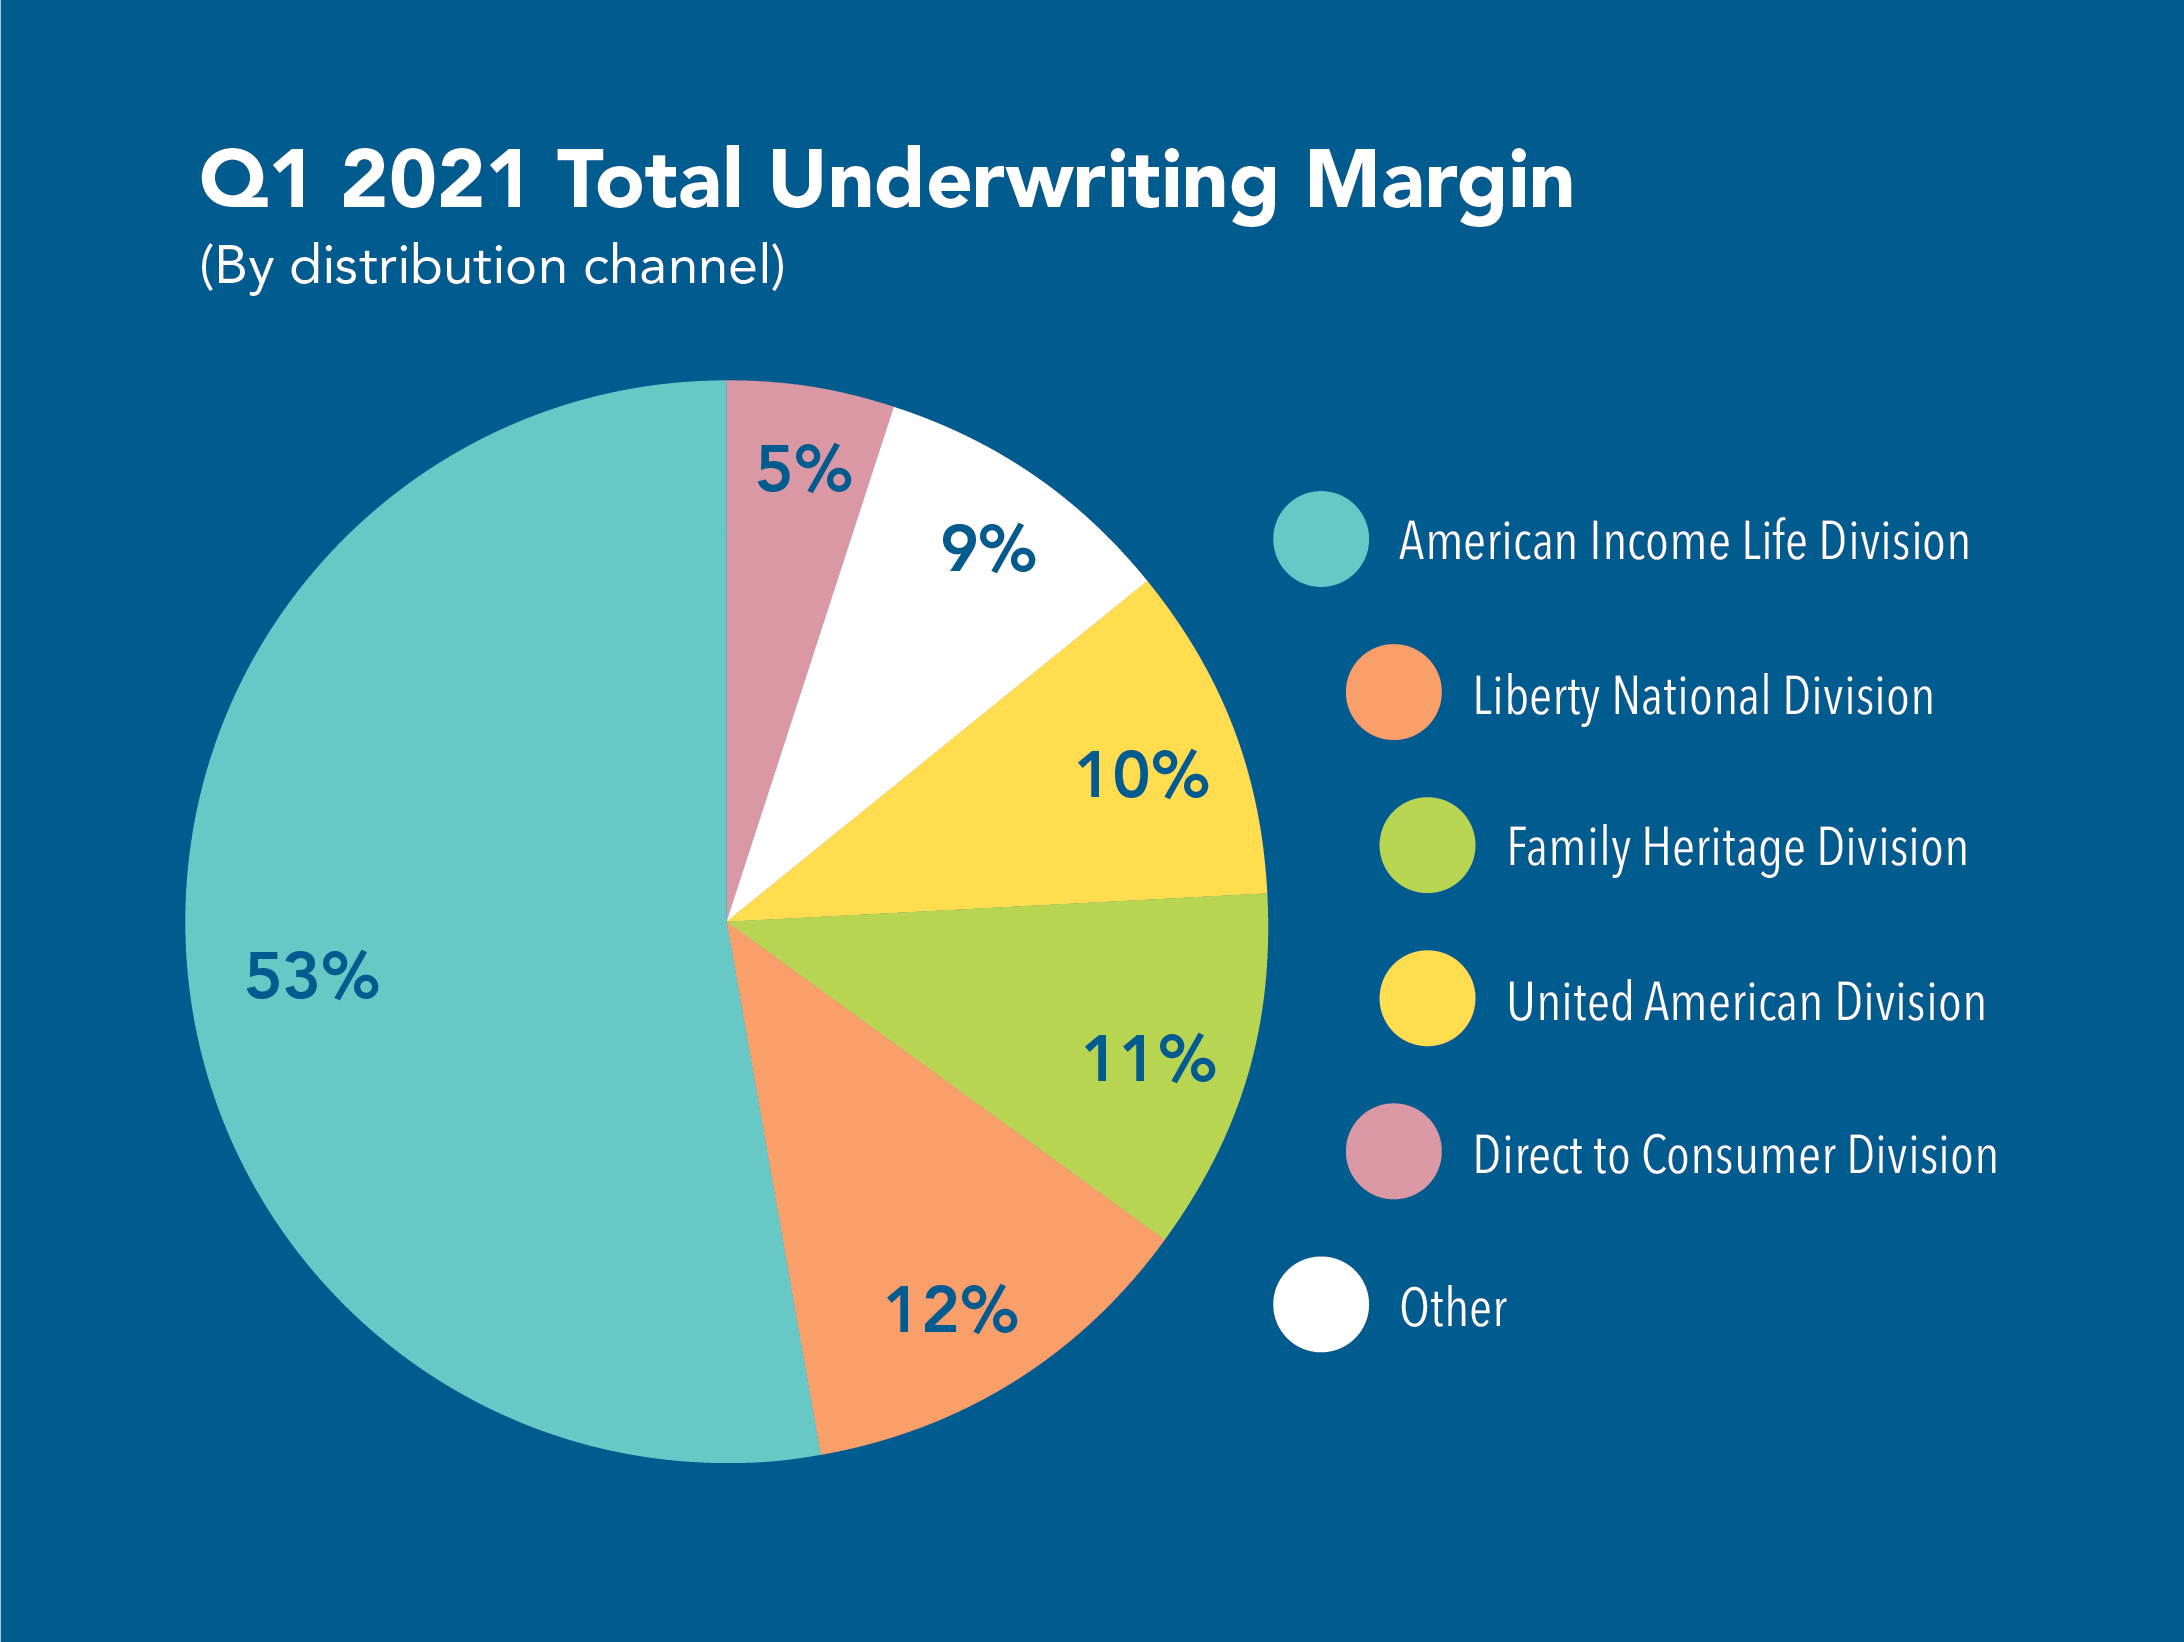
| Nine Months Ended September 30, | |||||||||||||||||||||
| 2017 | 2016 | ||||||||||||||||||||
| Shares | Amount | Average Price | Shares | Amount | Average Price | ||||||||||||||||
| Purchases with: | |||||||||||||||||||||
| Excess cash flow at the Parent Company | 3,176 | $ | 242,841 | $ | 76.46 | 4,170 | $ | 240,108 | $ | 57.58 | |||||||||||
| Option exercise proceeds | 760 | 58,607 | 77.16 | 1,180 | 71,248 | 60.38 | |||||||||||||||
| Total | 3,936 | $ | 301,448 | $ | 76.59 | 5,350 | $ | 311,356 | $ | 58.20 | |||||||||||
Life Insurance Summary of Results (Dollar amounts in thousands) | |||||||||||||||||
| Nine Months Ended September 30, | Increase | ||||||||||||||||
| 2017 | 2016 | (Decrease) | |||||||||||||||
| Amount | % of Premium | Amount | % of Premium | Amount | % | ||||||||||||
| Premium and policy charges | $ | 1,725,896 | 100 | $ | 1,639,156 | 100 | $ | 86,740 | 5 | ||||||||
| Net policy obligations | 713,950 | 41 | 670,817 | 41 | 43,133 | 6 | |||||||||||
| Commissions and acquisition expense | 567,782 | 33 | 537,294 | 33 | 30,488 | 6 | |||||||||||
| Insurance underwriting income before other income and administrative expense | $ | 444,164 | 26 | $ | 431,045 | 26 | $ | 13,119 | 3 | ||||||||
| Three Months Ended March 31, | Change | ||||||||||||||||||||||||||||||||||
| 2021 | 2020 | ||||||||||||||||||||||||||||||||||
| Amount | % of Premium | Amount | % of Premium | Amount | % | ||||||||||||||||||||||||||||||
| Premium and policy charges | $ | 708,119 | 100 | $ | 649,630 | 100 | $ | 58,489 | 9 | ||||||||||||||||||||||||||
| Policy obligations | 517,631 | 73 | 421,670 | 65 | 95,961 | 23 | |||||||||||||||||||||||||||||
| Required interest on reserves | (179,925) | (25) | (171,205) | (27) | (8,720) | 5 | |||||||||||||||||||||||||||||
| Net policy obligations | 337,706 | 48 | 250,465 | 38 | 87,241 | 35 | |||||||||||||||||||||||||||||
| Commissions, premium taxes, and non-deferred acquisition expenses | 56,668 | 8 | 53,936 | 8 | 2,732 | 5 | |||||||||||||||||||||||||||||
| Amortization of acquisition costs | 177,099 | 25 | 166,426 | 26 | 10,673 | 6 | |||||||||||||||||||||||||||||
| Total expense | 571,473 | 81 | 470,827 | 72 | 100,646 | 21 | |||||||||||||||||||||||||||||
Insurance underwriting margin | $ | 136,646 | 19 | $ | 178,803 | 28 | $ | (42,157) | (24) | ||||||||||||||||||||||||||
| Three Months Ended March 31, | Increase (Decrease) | ||||||||||||||||||||||||||||||||||
| 2021 | 2020 | ||||||||||||||||||||||||||||||||||
| Amount | % of Total | Amount | % of Total | Amount | % | ||||||||||||||||||||||||||||||
| American Income | $ | 334,895 | 47 | $ | 302,852 | 47 | $ | 32,043 | 11 | ||||||||||||||||||||||||||
| Direct to Consumer | 244,028 | 34 | 220,043 | 34 | 23,985 | 11 | |||||||||||||||||||||||||||||
| Liberty National | 75,737 | 11 | 72,868 | 11 | 2,869 | 4 | |||||||||||||||||||||||||||||
| Other | 53,459 | 8 | 53,867 | 8 | (408) | (1) | |||||||||||||||||||||||||||||
Total | $ | 708,119 | 100 | $ | 649,630 | 100 | $ | 58,489 | 9 | ||||||||||||||||||||||||||
| Nine Months Ended September 30, | Increase | |||||||||||||||||
| 2017 | 2016 | (Decrease) | ||||||||||||||||
| Amount | % of Total | Amount | % of Total | Amount | % | |||||||||||||
| American Income Exclusive Agency | $ | 741,392 | 43 | $ | 677,702 | 41 | $ | 63,690 | 9 | |||||||||
| Globe Life Direct Response | 613,568 | 35 | 591,084 | 36 | 22,484 | 4 | ||||||||||||
| Liberty National Exclusive Agency | 205,775 | 12 | 203,040 | 13 | 2,735 | 1 | ||||||||||||
| Other Agencies | 165,161 | 10 | 167,330 | 10 | (2,169 | ) | (1 | ) | ||||||||||
| Total | $ | 1,725,896 | 100 | $ | 1,639,156 | 100 | $ | 86,740 | 5 | |||||||||
| Three Months Ended March 31, | Increase (Decrease) | ||||||||||||||||||||||||||||||||||
| 2021 | 2020 | ||||||||||||||||||||||||||||||||||
| Amount | % of Total | Amount | % of Total | Amount | % | ||||||||||||||||||||||||||||||
| American Income | $ | 69,623 | 54 | $ | 62,869 | 57 | $ | 6,754 | 11 | ||||||||||||||||||||||||||
| Direct to Consumer | 39,691 | 31 | 32,547 | 29 | 7,144 | 22 | |||||||||||||||||||||||||||||
| Liberty National | 16,225 | 13 | 12,488 | 11 | 3,737 | 30 | |||||||||||||||||||||||||||||
| Other | 2,688 | 2 | 2,709 | 3 | (21) | (1) | |||||||||||||||||||||||||||||
Total | $ | 128,227 | 100 | $ | 110,613 | 100 | $ | 17,614 | 16 | ||||||||||||||||||||||||||
Life Insurance Net Sales (Dollar amounts in thousands) | ||||||||||||||||||
| Nine Months Ended September 30, | Increase | |||||||||||||||||
| 2017 | 2016 | (Decrease) | ||||||||||||||||
| Amount | % of Total | Amount | % of Total | Amount | % | |||||||||||||
| American Income Exclusive Agency | $ | 167,478 | 53 | $ | 157,949 | 50 | $ | 9,529 | 6 | |||||||||
| Globe Life Direct Response | 106,652 | 34 | 116,224 | 37 | (9,572 | ) | (8 | ) | ||||||||||
| Liberty National Exclusive Agency | 34,609 | 11 | 29,856 | 10 | 4,753 | 16 | ||||||||||||
| Other Agencies | 7,501 | 2 | 9,063 | 3 | (1,562 | ) | (17 | ) | ||||||||||
| Total | $ | 316,240 | 100 | $ | 313,092 | 100 | $ | 3,148 | 1 | |||||||||
| Three Months Ended March 31, | Increase (Decrease) | ||||||||||||||||||||||||||||||||||
| 2021 | 2020 | ||||||||||||||||||||||||||||||||||
| Amount | % of Total | Amount | % of Total | Amount | % | ||||||||||||||||||||||||||||||
| American Income | $ | 58,597 | 57 | $ | 50,669 | 60 | $ | 7,928 | 16 | ||||||||||||||||||||||||||
| Direct to Consumer | 30,627 | 30 | 21,094 | 25 | 9,533 | 45 | |||||||||||||||||||||||||||||
| Liberty National | 11,240 | 11 | 10,666 | 12 | 574 | 5 | |||||||||||||||||||||||||||||
| Other | 2,330 | 2 | 2,652 | 3 | (322) | (12) | |||||||||||||||||||||||||||||
Total | $ | 102,794 | 100 | $ | 85,081 | 100 | $ | 17,713 | 21 | ||||||||||||||||||||||||||
Life Insurance First-Year Collected Premium (Dollar amounts in thousands) | ||||||||||||||||||
| Nine Months Ended September 30, | Increase | |||||||||||||||||
| 2017 | 2016 | (Decrease) | ||||||||||||||||
| Amount | % of Total | Amount | % of Total | Amount | % | |||||||||||||
| American Income Exclusive Agency | $ | 135,935 | 57 | $ | 129,878 | 55 | $ | 6,057 | 5 | |||||||||
| Globe Life Direct Response | 70,989 | 30 | 75,784 | 32 | (4,795 | ) | (6 | ) | ||||||||||
| Liberty National Exclusive Agency | 24,587 | 10 | 21,707 | 9 | 2,880 | 13 | ||||||||||||
| Other Agencies | 7,325 | 3 | 8,801 | 4 | (1,476 | ) | (17 | ) | ||||||||||
| Total | $ | 238,836 | 100 | $ | 236,170 | 100 | $ | 2,666 | 1 | |||||||||
| At March 31, | Change | ||||||||||||||||||||||
| 2021 | 2020 | Amount | % | ||||||||||||||||||||
| American Income | 9,918 | 7,630 | 2,288 | 30 | |||||||||||||||||||
| At March 31, | Change | ||||||||||||||||||||||
| 2021 | 2020 | Amount | % | ||||||||||||||||||||
| Liberty National | 2,734 | 2,648 | 86 | 3 | |||||||||||||||||||
| Three Months Ended March 31, | Change | ||||||||||||||||||||||||||||||||||
| 2021 | 2020 | ||||||||||||||||||||||||||||||||||
| Amount | % of Premium | Amount | % of Premium | Amount | % | ||||||||||||||||||||||||||||||
| Premium | $ | 294,173 | 100 | $ | 280,205 | 100 | $ | 13,968 | 5 | ||||||||||||||||||||||||||
| Policy obligations | 187,829 | 64 | 178,711 | 64 | 9,118 | 5 | |||||||||||||||||||||||||||||
| Required interest on reserves | (24,995) | (9) | (22,510) | (8) | (2,485) | 11 | |||||||||||||||||||||||||||||
| Net policy obligations | 162,834 | 55 | 156,201 | 56 | 6,633 | 4 | |||||||||||||||||||||||||||||
| Commissions, premium taxes, and non-deferred acquisition expenses | 22,990 | 8 | 24,995 | 9 | (2,005) | (8) | |||||||||||||||||||||||||||||
| Amortization of acquisition costs | 36,169 | 12 | 35,544 | 12 | 625 | 2 | |||||||||||||||||||||||||||||
| Total expense | 221,993 | 75 | 216,740 | 77 | 5,253 | 2 | |||||||||||||||||||||||||||||
Insurance underwriting margin | $ | 72,180 | 25 | $ | 63,465 | 23 | $ | 8,715 | 14 | ||||||||||||||||||||||||||
| Nine Months Ended September 30, | Increase | ||||||||||||||||
| 2017 | 2016 | (Decrease) | |||||||||||||||
| Amount | % of Premium | Amount | % of Premium | Amount | % | ||||||||||||
| Premium and policy charges | $ | 730,557 | 100 | $ | 709,936 | 100 | $ | 20,621 | 3 | ||||||||
| Net policy obligations | 412,245 | 56 | 404,584 | 57 | 7,661 | 2 | |||||||||||
| Commissions and acquisition expense | 153,930 | 21 | 148,140 | 21 | 5,790 | 4 | |||||||||||
| Insurance underwriting income before other income and administrative expense | $ | 164,382 | 23 | $ | 157,212 | 22 | $ | 7,170 | 5 | ||||||||
| Three Months Ended March 31, | Increase (Decrease) | ||||||||||||||||||||||||||||||||||
| 2021 | 2020 | ||||||||||||||||||||||||||||||||||
| Amount | % of Total | Amount | % of Total | Amount | % | ||||||||||||||||||||||||||||||
| United American | $ | 117,087 | 40 | $ | 110,059 | 39 | $ | 7,028 | 6 | ||||||||||||||||||||||||||
| Family Heritage | 83,335 | 28 | 76,983 | 28 | 6,352 | 8 | |||||||||||||||||||||||||||||
| Liberty National | 47,040 | 16 | 47,640 | 17 | (600) | (1) | |||||||||||||||||||||||||||||
| American Income | 27,351 | 9 | 25,727 | 9 | 1,624 | 6 | |||||||||||||||||||||||||||||
| Direct to Consumer | 19,360 | 7 | 19,796 | 7 | (436) | (2) | |||||||||||||||||||||||||||||
Total | $ | 294,173 | 100 | $ | 280,205 | 100 | $ | 13,968 | 5 | ||||||||||||||||||||||||||
| Nine Months Ended September 30, | Increase | |||||||||||||||||
| 2017 | 2016 | (Decrease) | ||||||||||||||||
| Amount | % of Total | Amount | % of Total | Amount | % | |||||||||||||
| United American Independent Agency | ||||||||||||||||||
| Limited-benefit plans | $ | 8,686 | $ | 9,737 | $ | (1,051 | ) | (11 | ) | |||||||||
| Medicare Supplement | 263,904 | 256,572 | 7,332 | 3 | ||||||||||||||
| 272,590 | 37 | 266,309 | 38 | 6,281 | 2 | |||||||||||||
| Family Heritage Agency | ||||||||||||||||||
| Limited-benefit plans | 188,350 | 175,538 | 12,812 | 7 | ||||||||||||||
| Medicare Supplement | — | — | — | — | ||||||||||||||
| 188,350 | 26 | 175,538 | 25 | 12,812 | 7 | |||||||||||||
| Liberty National Exclusive Agency | ||||||||||||||||||
| Limited-benefit plans | 108,085 | 106,343 | 1,742 | 2 | ||||||||||||||
| Medicare Supplement | 39,988 | 46,080 | (6,092 | ) | (13 | ) | ||||||||||||
| 148,073 | 20 | 152,423 | 21 | (4,350 | ) | (3 | ) | |||||||||||
| American Income Exclusive Agency | ||||||||||||||||||
| Limited-benefit plans | 66,077 | 62,477 | 3,600 | 6 | ||||||||||||||
| Medicare Supplement | 198 | 241 | (43 | ) | (18 | ) | ||||||||||||
| 66,275 | 9 | 62,718 | 9 | 3,557 | 6 | |||||||||||||
| Direct Response | ||||||||||||||||||
| Limited-benefit plans | 425 | 407 | 18 | 4 | ||||||||||||||
| Medicare Supplement | 54,844 | 52,541 | 2,303 | 4 | ||||||||||||||
| 55,269 | 8 | 52,948 | 7 | 2,321 | 4 | |||||||||||||
| Total Health Premium | ||||||||||||||||||
| Limited-benefit plans | 371,623 | 51 | 354,502 | 50 | 17,121 | 5 | ||||||||||||
| Medicare Supplement | 358,934 | 49 | 355,434 | 50 | 3,500 | 1 | ||||||||||||
| Total | $ | 730,557 | 100 | $ | 709,936 | 100 | $ | 20,621 | 3 | |||||||||
| Three Months Ended March 31, | Increase (Decrease) | ||||||||||||||||||||||||||||||||||
| 2021 | 2020 | ||||||||||||||||||||||||||||||||||
| Amount | % of Total | Amount | % of Total | Amount | % | ||||||||||||||||||||||||||||||
| United American | $ | 12,945 | 33 | $ | 14,464 | 35 | $ | (1,519) | (11) | ||||||||||||||||||||||||||
| Family Heritage | 15,579 | 39 | 16,281 | 39 | (702) | (4) | |||||||||||||||||||||||||||||
| Liberty National | 5,839 | 15 | 5,943 | 14 | (104) | (2) | |||||||||||||||||||||||||||||
| American Income | 4,611 | 12 | 4,752 | 11 | (141) | (3) | |||||||||||||||||||||||||||||
| Direct to Consumer | 642 | 1 | 590 | 1 | 52 | 9 | |||||||||||||||||||||||||||||
Total | $ | 39,616 | 100 | $ | 42,030 | 100 | $ | (2,414) | (6) | ||||||||||||||||||||||||||
| Nine Months Ended September 30, | Increase | |||||||||||||||||
| 2017 | 2016 | (Decrease) | ||||||||||||||||
| Amount | % of Total | Amount | % of Total | Amount | % | |||||||||||||
| United American Independent Agency | ||||||||||||||||||
| Limited-benefit plans | $ | 388 | $ | 428 | $ | (40 | ) | (9 | ) | |||||||||
| Medicare Supplement | 33,052 | 31,799 | 1,253 | 4 | ||||||||||||||
| 33,440 | 32 | 32,227 | 33 | 1,213 | 4 | |||||||||||||
| Family Heritage Agency | ||||||||||||||||||
| Limited-benefit plans | 41,755 | 38,144 | 3,611 | 9 | ||||||||||||||
| Medicare Supplement | — | — | — | — | ||||||||||||||
| 41,755 | 40 | 38,144 | 39 | 3,611 | 9 | |||||||||||||
| Liberty National Exclusive Agency | ||||||||||||||||||
| Limited-benefit plans | 14,558 | 14,665 | (107 | ) | (1 | ) | ||||||||||||
| Medicare Supplement | — | 8 | (8 | ) | (100 | ) | ||||||||||||
| 14,558 | 14 | 14,673 | 15 | (115 | ) | (1 | ) | |||||||||||
| American Income Exclusive Agency | ||||||||||||||||||
| Limited-benefit plans | 10,369 | 9,463 | 906 | 10 | ||||||||||||||
| Medicare Supplement | — | — | — | — | ||||||||||||||
| 10,369 | 10 | 9,463 | 9 | 906 | 10 | |||||||||||||
| Direct Response | ||||||||||||||||||
| Limited-benefit plans | — | — | — | — | ||||||||||||||
| Medicare Supplement | 3,790 | 3,607 | 183 | 5 | ||||||||||||||
| 3,790 | 4 | 3,607 | 4 | 183 | 5 | |||||||||||||
| Total Net Sales | ||||||||||||||||||
| Limited-benefit plans | 67,070 | 65 | 62,700 | 64 | 4,370 | 7 | ||||||||||||
| Medicare Supplement | 36,842 | 35 | 35,414 | 36 | 1,428 | 4 | ||||||||||||
| Total | $ | 103,912 | 100 | $ | 98,114 | 100 | $ | 5,798 | 6 | |||||||||
| Three Months Ended March 31, | Increase (Decrease) | ||||||||||||||||||||||||||||||||||
| 2021 | 2020 | ||||||||||||||||||||||||||||||||||
| Amount | % of Total | Amount | % of Total | Amount | % | ||||||||||||||||||||||||||||||
| United American | $ | 14,306 | 37 | $ | 19,005 | 44 | $ | (4,699) | (25) | ||||||||||||||||||||||||||
| Family Heritage | 13,811 | 36 | 13,446 | 31 | 365 | 3 | |||||||||||||||||||||||||||||
| Liberty National | 4,815 | 13 | 5,286 | 12 | (471) | (9) | |||||||||||||||||||||||||||||
| American Income | 4,587 | 12 | 4,507 | 11 | 80 | 2 | |||||||||||||||||||||||||||||
| Direct to Consumer | 759 | 2 | 767 | 2 | (8) | (1) | |||||||||||||||||||||||||||||
Total | $ | 38,278 | 100 | $ | 43,011 | 100 | $ | (4,733) | (11) | ||||||||||||||||||||||||||
| Nine Months Ended September 30, | Increase | |||||||||||||||||||
| 2017 | 2016 | (Decrease) | ||||||||||||||||||
| Amount | % of Total | Amount | % of Total | Amount | % | |||||||||||||||
| United American Independent Agency | ||||||||||||||||||||
| Limited-benefit plans | $ | 344 | $ | 433 | $ | (89 | ) | (21 | ) | |||||||||||
| Medicare Supplement | 39,306 | 47,653 | (8,347 | ) | (18 | ) | ||||||||||||||
| 39,650 | 40 | 48,086 | 46 | (8,436 | ) | (18 | ) | |||||||||||||
| Family Heritage Agency | ||||||||||||||||||||
| Limited-benefit plans | 33,116 | 30,311 | 2,805 | 9 | ||||||||||||||||
| Medicare Supplement | — | — | — | — | ||||||||||||||||
| 33,116 | 33 | 30,311 | 29 | 2,805 | 9 | |||||||||||||||
| Liberty National Exclusive Agency | ||||||||||||||||||||
| Limited-benefit plans | 12,256 | 11,946 | 310 | 3 | ||||||||||||||||
| Medicare Supplement | 2 | 2 | — | — | ||||||||||||||||
| 12,258 | 12 | 11,948 | 12 | 310 | 3 | |||||||||||||||
| American Income Exclusive Agency | ||||||||||||||||||||
| Limited-benefit plans | 10,840 | 10,188 | 652 | 6 | ||||||||||||||||
| Medicare Supplement | — | — | — | — | ||||||||||||||||
| 10,840 | 11 | 10,188 | 10 | 652 | 6 | |||||||||||||||
| Direct Response | ||||||||||||||||||||
| Limited-benefit plans | — | — | — | — | ||||||||||||||||
| Medicare Supplement | 4,108 | 3,161 | 947 | 30 | ||||||||||||||||
| 4,108 | 4 | 3,161 | 3 | 947 | 30 | |||||||||||||||
| Total First-Year Collected Premium | ||||||||||||||||||||
| Limited-benefit plans | 56,556 | 57 | 52,878 | 51 | 3,678 | 7 | ||||||||||||||
| Medicare Supplement | 43,416 | 43 | 50,816 | 49 | (7,400 | ) | (15 | ) | ||||||||||||
| Total | $ | 99,972 | 100 | $ | 103,694 | 100 | $ | (3,722 | ) | (4 | ) | |||||||||
| At March 31, | Change | ||||||||||||||||||||||
| 2021 | 2020 | Amount | % | ||||||||||||||||||||
| Family Heritage Division | 1,285 | 1,227 | 58 | 5 | |||||||||||||||||||
| Nine Months Ended September 30, | |||||||||||
| 2017 | 2016 | ||||||||||
| Amount | % of Premium | Amount | % of Premium | ||||||||
| Insurance administrative expenses: | |||||||||||
| Salaries | $ | 70,505 | 2.9 | $ | 67,683 | 2.9 | |||||
| Other employee costs | 25,320 | 1.0 | 21,834 | 0.9 | |||||||
| Information technology costs | 19,325 | 0.8 | 17,712 | 0.7 | |||||||
| Legal costs | 6,520 | 0.2 | 6,352 | 0.3 | |||||||
| Other administrative costs | 34,081 | 1.4 | 32,548 | 1.4 | |||||||
| Total insurance administrative expenses | 155,751 | 6.3 | 146,129 | 6.2 | |||||||
| Parent company expense | 7,228 | 6,360 | |||||||||
| Stock compensation expense | 24,809 | 20,334 | |||||||||
| Non-operating fees | — | 257 | |||||||||
Total operating expenses, per Condensed Consolidated Statements of Operations | $ | 187,788 | $ | 173,080 | |||||||
| Insurance administrative expenses: | |||||||||||
| Increase (decrease) over prior year | 6.6 | % | 5.4 | % | |||||||
| Total operating expenses: | |||||||||||
| Increase (decrease) over prior year | 8.5 | % | 3.6 | % | |||||||
| Three Months Ended March 31, | Change | ||||||||||||||||||||||
| 2021 | 2020 | Amount | % | ||||||||||||||||||||
| Net investment income | $ | 235,820 | $ | 228,991 | $ | 6,829 | 3 | ||||||||||||||||
| Interest on net insurance policy liabilities: | |||||||||||||||||||||||
| Interest on reserves | (214,925) | (204,171) | (10,754) | 5 | |||||||||||||||||||
| Interest on deferred acquisition costs | 60,827 | 58,725 | 2,102 | 4 | |||||||||||||||||||
| Net required interest | (154,098) | (145,446) | (8,652) | 6 | |||||||||||||||||||
| Financing costs | (21,178) | (20,808) | (370) | 2 | |||||||||||||||||||
Excess investment income | $ | 60,544 | $ | 62,737 | $ | (2,193) | (3) | ||||||||||||||||
Excess investment income per diluted share | $ | 0.58 | $ | 0.57 | $ | 0.01 | 2 | ||||||||||||||||
| Mean invested assets (at amortized cost) | $ | 18,646,061 | $ | 17,472,498 | $ | 1,173,563 | 7 | ||||||||||||||||
Average net insurance policy liabilities(1) | 10,775,618 | 10,277,692 | 497,926 | 5 | |||||||||||||||||||
| Average debt and preferred securities (at amortized cost) | 1,939,394 | 1,720,755 | 218,639 | 13 | |||||||||||||||||||
| Nine Months Ended September 30, | Increase (Decrease) | |||||||||||||
| 2017 | 2016 | Amount | % | |||||||||||
| Net investment income | $ | 634,930 | $ | 601,415 | $ | 33,515 | 6 | |||||||
| Interest on net insurance policy liabilities: | ||||||||||||||
| Interest on reserves | (547,443 | ) | (524,093 | ) | (23,350 | ) | 4 | |||||||
| Interest on deferred acquisition costs | 157,096 | 151,546 | 5,550 | 4 | ||||||||||
| Net required interest | (390,347 | ) | (372,547 | ) | (17,800 | ) | 5 | |||||||
| Financing costs | (62,825 | ) | (62,860 | ) | 35 | — | ||||||||
| Excess investment income | $ | 181,758 | $ | 166,008 | $ | 15,750 | 9 | |||||||
| Excess investment income per diluted share | $ | 1.52 | $ | 1.35 | $ | 0.17 | 13 | |||||||
| Average invested assets (at amortized cost) | $ | 15,275,412 | $ | 14,339,950 | $ | 935,462 | 7 | |||||||
Average net insurance policy liabilities(1) | 9,306,010 | 8,896,284 | 409,726 | 5 | ||||||||||
| Average debt and preferred securities (at amortized cost) | 1,471,616 | 1,361,234 | 110,382 | 8 | ||||||||||
| Three Months Ended March 31, | Increase (Decrease) | ||||||||||||||||||||||
| 2021 | 2020 | Amount | % | ||||||||||||||||||||
| Interest on funded debt | $ | 19,746 | $ | 17,491 | $ | 2,255 | 13 | ||||||||||||||||
| Interest on term loans | — | 644 | (644) | (100) | |||||||||||||||||||
| Interest on short-term debt | 1,432 | 2,673 | (1,241) | (46) | |||||||||||||||||||
Financing costs | $ | 21,178 | $ | 20,808 | $ | 370 | 2 | ||||||||||||||||
| Nine Months Ended September 30, | Increase (Decrease) | |||||||||||||
| 2017 | 2016 | Amount | % | |||||||||||
| Interest on funded debt | $ | 55,089 | $ | 57,647 | $ | (2,558 | ) | (4 | ) | |||||
| Interest on term loan | 1,706 | 536 | 1,170 | * | ||||||||||
| Interest on short term debt | 6,026 | 4,674 | 1,352 | 29 | ||||||||||
| Other | 4 | 3 | 1 | 33 | ||||||||||
| Financing costs | $ | 62,825 | $ | 62,860 | $ | (35 | ) | — | ||||||
| Three Months Ended March 31, | |||||||||||||||||||||||
| 2021 | 2020 | ||||||||||||||||||||||
| Amount | Per Share | Amount | Per Share | ||||||||||||||||||||
| Fixed maturities: | |||||||||||||||||||||||
| Sales | $ | (8,599) | $ | (0.08) | $ | 2,087 | $ | 0.02 | |||||||||||||||
Matured or other redemptions(1) | 20,800 | 0.20 | 1,811 | 0.02 | |||||||||||||||||||
| Provision for credit losses | 2,643 | 0.02 | (25,165) | (0.23) | |||||||||||||||||||
| Fair value option—change in fair value | 7,809 | 0.07 | 461 | — | |||||||||||||||||||
| Other | (413) | — | 189 | — | |||||||||||||||||||
| Total realized gains (losses) | $ | 22,240 | $ | 0.21 | $ | (20,617) | $ | (0.19) | |||||||||||||||
| Three Months Ended March 31, | |||||||||||
| 2021 | 2020 | ||||||||||
| Cost of acquisitions: | |||||||||||
| Investment-grade corporate securities | $ | 260,002 | $ | 85,409 | |||||||
| Investment-grade municipal securities | 33,228 | 117,601 | |||||||||
| Other investment-grade securities | 5,619 | 8,744 | |||||||||
Total fixed maturity acquisitions(1) | $ | 298,849 | $ | 211,754 | |||||||
Effective annual yield (one year compounded)(2) | 3.41 | % | 3.81 | % | |||||||
| Average life (in years, to next call) | 29.6 | 14.9 | |||||||||
| Average life (in years, to maturity) | 33.7 | 27.0 | |||||||||
| Average rating | A | A+ | |||||||||
| Nine Months Ended September 30, | |||||||
| 2017 | 2016 | ||||||
Cost of acquisitions(1): | |||||||
| Corporate securities | $ | 1,046,773 | $ | 910,085 | |||
| Other | 5,932 | 15,737 | |||||
| Total fixed maturity acquisitions | $ | 1,052,705 | $ | 925,822 | |||
Effective annual yield(2) | 4.74 | % | 4.73 | % | |||
| Average life (in years, to next call) | 22.8 | 24.1 | |||||
| Average life (in years, to maturity) | 23.7 | 24.8 | |||||
| Average rating | BBB+ | BBB+ | |||||
| Amount | % of Total | ||||
| Fixed maturities (at amortized cost) | $ | 14,914,580 | 96 | ||
| Policy loans | 523,318 | 3 | |||
Other long-term investments(1) | 69,592 | 1 | |||
| Short-term investments | 65,482 | — | |||
| Total | $ | 15,572,972 | 100 | ||
| At | |||||||||||||||||
| March 31, 2021 | December 31, 2020 | March 31, 2020 | |||||||||||||||
Average annual effective yield(1) | 5.24% | 5.28% | 5.39% | ||||||||||||||
| Average life, in years, to: | |||||||||||||||||
Next call(2) | 16.2 | 16.2 | 16.7 | ||||||||||||||
Maturity(2) | 19.0 | 19.0 | 19.2 | ||||||||||||||
| Effective duration to: | |||||||||||||||||
Next call(2,3) | 10.6 | 11.0 | 10.6 | ||||||||||||||
Maturity(2,3) | 11.9 | 12.3 | 11.6 | ||||||||||||||
| Below Investment Grade | Total Fixed Maturities | % of Total Fixed Maturities | ||||||||||||||||||||||||||||||||||||
| Amortized Cost, net | Gross Unrealized Gains | Gross Unrealized Losses | Fair Value | Amortized Cost, net | Gross Unrealized Gains | Gross Unrealized Losses | Fair Value | At Amortized Cost, net | At Fair Value | |||||||||||||||||||||||||||||
| Corporates: | ||||||||||||||||||||||||||||||||||||||
| Financial | ||||||||||||||||||||||||||||||||||||||
| Insurance - life, health, P&C | $ | 57,612 | $ | 4,076 | $ | (8,484) | $ | 53,204 | $ | 2,271,939 | $ | 410,461 | $ | (11,885) | $ | 2,670,515 | 13 | 13 | ||||||||||||||||||||
| Banks | 27,005 | 422 | — | 27,427 | 969,244 | 169,848 | (4,044) | 1,135,048 | 6 | 6 | ||||||||||||||||||||||||||||
| Other financial | 114,935 | 17 | (5,872) | 109,080 | 1,216,893 | 139,185 | (11,737) | 1,344,341 | 7 | 7 | ||||||||||||||||||||||||||||
| Total financial | 199,552 | 4,515 | (14,356) | 189,711 | 4,458,076 | 719,494 | (27,666) | 5,149,904 | 26 | 26 | ||||||||||||||||||||||||||||
| Utilities | ||||||||||||||||||||||||||||||||||||||
| Electric | 50,079 | 5,135 | (297) | 54,917 | 1,415,221 | 337,625 | (763) | 1,752,083 | 8 | 9 | ||||||||||||||||||||||||||||
| Gas and water | — | — | — | — | 561,650 | 87,510 | (1,538) | 647,622 | 3 | 3 | ||||||||||||||||||||||||||||
| Total utilities | 50,079 | 5,135 | (297) | 54,917 | 1,976,871 | 425,135 | (2,301) | 2,399,705 | 11 | 12 | ||||||||||||||||||||||||||||
| Industrial - Energy | ||||||||||||||||||||||||||||||||||||||
| Pipelines | 85,302 | 2,009 | (2,782) | 84,529 | 921,637 | 144,321 | (3,305) | 1,062,653 | 5 | 5 | ||||||||||||||||||||||||||||
| Exploration and production | 100,712 | 10,316 | (542) | 110,486 | 576,633 | 82,332 | (6,511) | 652,454 | 4 | 3 | ||||||||||||||||||||||||||||
| Oil field services | — | — | — | — | 49,794 | 11,160 | — | 60,954 | — | — | ||||||||||||||||||||||||||||
| Refiner | — | — | — | — | 89,288 | 20,167 | — | 109,455 | 1 | 1 | ||||||||||||||||||||||||||||
| Driller | — | — | — | — | — | — | — | — | — | — | ||||||||||||||||||||||||||||
| Total energy | 186,014 | 12,325 | (3,324) | 195,015 | 1,637,352 | 257,980 | (9,816) | 1,885,516 | 10 | 9 | ||||||||||||||||||||||||||||
| Industrial - Basic materials | ||||||||||||||||||||||||||||||||||||||
| Chemicals | — | — | — | — | 669,487 | 99,334 | (1,875) | 766,946 | 4 | 4 | ||||||||||||||||||||||||||||
| Metals and mining | — | — | — | — | 406,445 | 105,609 | — | 512,054 | 2 | 2 | ||||||||||||||||||||||||||||
| Forestry products and paper | — | — | — | — | 88,681 | 15,792 | — | 104,473 | 1 | 1 | ||||||||||||||||||||||||||||
| Total basic materials | — | — | — | — | 1,164,613 | 220,735 | (1,875) | 1,383,473 | 7 | 7 | ||||||||||||||||||||||||||||
| Industrial - Consumer, non-cyclical | 84,358 | 6,887 | (2,173) | 89,072 | 2,215,755 | 356,403 | (4,168) | 2,567,990 | 13 | 13 | ||||||||||||||||||||||||||||
| Other industrials | 25,638 | 3,344 | — | 28,982 | 1,268,921 | 223,307 | (2,628) | 1,489,600 | 7 | 7 | ||||||||||||||||||||||||||||
| Industrial - Transportation | 25,659 | 3,951 | (120) | 29,490 | 567,389 | 117,883 | (150) | 685,122 | 3 | 3 | ||||||||||||||||||||||||||||
| Other corporate sectors | 179,727 | 18,328 | (3,634) | 194,421 | 1,612,317 | 218,475 | (15,932) | 1,814,860 | 9 | 9 | ||||||||||||||||||||||||||||
| Total corporates | 751,027 | 54,485 | (23,904) | 781,608 | 14,901,294 | 2,539,412 | (64,536) | 17,376,170 | 86 | 86 | ||||||||||||||||||||||||||||
| Other fixed maturities: | ||||||||||||||||||||||||||||||||||||||
| Government (U.S., municipal, and foreign) | — | — | — | — | 2,339,237 | 254,974 | (12,268) | 2,581,943 | 13 | 13 | ||||||||||||||||||||||||||||
| Collateralized debt obligations | 36,810 | 24,491 | — | 61,301 | 36,810 | 24,491 | — | 61,301 | — | — | ||||||||||||||||||||||||||||
| Other asset-backed securities | 13,875 | — | (2,299) | 11,576 | 134,273 | 4,459 | (3,623) | 135,109 | 1 | 1 | ||||||||||||||||||||||||||||
Mortgage-backed securities(1) | — | — | — | — | 345 | 42 | — | 387 | — | — | ||||||||||||||||||||||||||||
| Total fixed maturities | $ | 801,712 | $ | 78,976 | $ | (26,203) | $ | 854,485 | $ | 17,411,959 | $ | 2,823,378 | $ | (80,427) | $ | 20,154,910 | 100 | 100 | ||||||||||||||||||||
| Below Investment Grade | Total Fixed Maturities | % of Total Fixed Maturities | |||||||||||||||||||||||||||
| Cost or Amortized Cost | Gross Unrealized Gains | Gross Unrealized Losses | Fair Value | Cost or Amortized Cost | Gross Unrealized Gains | Gross Unrealized Losses | Fair Value | At Amortized Cost | At Fair Value | ||||||||||||||||||||
| Corporates: | |||||||||||||||||||||||||||||
| Financial | |||||||||||||||||||||||||||||
| Insurance - life, health, P&C | $ | 58,294 | $ | 2,842 | $ | (3,381 | ) | $ | 57,755 | $ | 2,003,179 | $ | 319,173 | $ | (4,544 | ) | $ | 2,317,808 | 13 | 14 | |||||||||
| Banks | 31,035 | 624 | (3,030 | ) | 28,629 | 739,517 | 107,348 | (3,191 | ) | 843,674 | 5 | 5 | |||||||||||||||||
| Other financial | 74,955 | — | (19,204 | ) | 55,751 | 793,595 | 59,983 | (21,175 | ) | 832,403 | 5 | 5 | |||||||||||||||||
| Total financial | 164,284 | 3,466 | (25,615 | ) | 142,135 | 3,536,291 | 486,504 | (28,910 | ) | 3,993,885 | 23 | 24 | |||||||||||||||||
| Utilities | |||||||||||||||||||||||||||||
| Electric | 20,713 | 1,239 | — | 21,952 | 1,469,534 | 275,245 | (2,332 | ) | 1,742,447 | 10 | 11 | ||||||||||||||||||
| Gas and water | — | — | — | — | 507,550 | 51,148 | (439 | ) | 558,259 | 3 | 3 | ||||||||||||||||||
| Total utilities | 20,713 | 1,239 | — | 21,952 | 1,977,084 | 326,393 | (2,771 | ) | 2,300,706 | 13 | 14 | ||||||||||||||||||
| Industrial - Energy | |||||||||||||||||||||||||||||
| Pipelines | 40,598 | 531 | (2,250 | ) | 38,879 | 865,245 | 100,340 | (5,289 | ) | 960,296 | 6 | 6 | |||||||||||||||||
| Exploration and production | 28,918 | 777 | — | 29,695 | 531,485 | 61,007 | (4,023 | ) | 588,469 | 4 | 4 | ||||||||||||||||||
| Oil field services | 33,871 | — | (4,568 | ) | 29,303 | 83,730 | 9,127 | (4,568 | ) | 88,289 | 1 | 1 | |||||||||||||||||
| Refiner | — | — | — | — | 67,012 | 14,611 | (5 | ) | 81,618 | — | — | ||||||||||||||||||
| Driller | 54,582 | 211 | (14,185 | ) | 40,608 | 54,582 | 211 | (14,185 | ) | 40,608 | — | — | |||||||||||||||||
| Total energy | 157,969 | 1,519 | (21,003 | ) | 138,485 | 1,602,054 | 185,296 | (28,070 | ) | 1,759,280 | 11 | 11 | |||||||||||||||||
| Industrial - Basic materials | |||||||||||||||||||||||||||||
| Chemicals | — | — | — | — | 541,902 | 45,379 | (497 | ) | 586,784 | 4 | 4 | ||||||||||||||||||
| Metals and mining | 68,073 | 7,831 | — | 75,904 | 390,213 | 74,145 | — | 464,358 | 3 | 3 | |||||||||||||||||||
| Forestry products and paper | — | — | — | — | 112,311 | 15,338 | — | 127,649 | 1 | 1 | |||||||||||||||||||
| Total basic materials | 68,073 | 7,831 | — | 75,904 | 1,044,426 | 134,862 | (497 | ) | 1,178,791 | 8 | 8 | ||||||||||||||||||
| Industrial - Consumer, non-cyclical | — | — | — | — | 1,770,933 | 168,731 | (7,462 | ) | 1,932,202 | 11 | 11 | ||||||||||||||||||
| Other industrials | 47,204 | 2,792 | (29 | ) | 49,967 | 1,357,486 | 164,785 | (2,430 | ) | 1,519,841 | 9 | 9 | |||||||||||||||||
| Industrial - Transportation | 26,572 | 387 | (246 | ) | 26,713 | 551,533 | 77,257 | (614 | ) | 628,176 | 4 | 4 | |||||||||||||||||
| Other corporate sectors | 116,459 | 4,920 | (5,094 | ) | 116,285 | 1,300,884 | 120,485 | (11,667 | ) | 1,409,702 | 9 | 8 | |||||||||||||||||
| Total corporates | 601,274 | 22,154 | (51,987 | ) | 571,441 | 13,140,691 | 1,664,313 | (82,421 | ) | 14,722,583 | 88 | 89 | |||||||||||||||||
| Other fixed maturities: | |||||||||||||||||||||||||||||
| Government (U.S., municipal, and foreign) | 306 | — | (36 | ) | 270 | 1,568,390 | 142,000 | (1,205 | ) | 1,709,185 | 11 | 10 | |||||||||||||||||
| Collateralized debt obligations | 59,204 | 19,558 | (8,994 | ) | 69,768 | 59,204 | 19,558 | (8,994 | ) | 69,768 | — | — | |||||||||||||||||
| Other asset-backed securities | — | — | — | — | 144,701 | 4,967 | (17 | ) | 149,651 | 1 | 1 | ||||||||||||||||||
Mortgage-backed securities(1) | — | — | — | — | 1,594 | 133 | (1 | ) | 1,726 | — | — | ||||||||||||||||||
| Total fixed maturities | $ | 660,784 | $ | 41,712 | $ | (61,017 | ) | $ | 641,479 | $ | 14,914,580 | $ | 1,830,971 | $ | (92,638 | ) | $ | 16,652,913 | 100 | 100 | |||||||||
| Below Investment Grade | Total Fixed Maturities | % of Total Fixed Maturities | ||||||||||||||||||||||||||||||||||||
| Amortized Cost | Gross Unrealized Gains | Gross Unrealized Losses | Fair Value | Amortized Cost | Gross Unrealized Gains | Gross Unrealized Losses | Fair Value | At Amortized Cost | At Fair Value | |||||||||||||||||||||||||||||
| Corporates: | ||||||||||||||||||||||||||||||||||||||
| Financial | ||||||||||||||||||||||||||||||||||||||
| Insurance - life, health, P&C | $ | 57,658 | $ | 3,894 | $ | (10,788) | $ | 50,764 | $ | 2,275,843 | $ | 563,349 | $ | (14,769) | $ | 2,824,423 | 13 | 13 | ||||||||||||||||||||
| Banks | 27,014 | 15 | (456) | 26,573 | 993,946 | 259,489 | (1,050) | 1,252,385 | 6 | 6 | ||||||||||||||||||||||||||||
| Other financial | 114,919 | 271 | (8,245) | 106,945 | 1,134,414 | 193,975 | (8,402) | 1,319,987 | 7 | 6 | ||||||||||||||||||||||||||||
| Total financial | 199,591 | 4,180 | (19,489) | 184,282 | 4,404,203 | 1,016,813 | (24,221) | 5,396,795 | 26 | 25 | ||||||||||||||||||||||||||||
| Utilities | ||||||||||||||||||||||||||||||||||||||
| Electric | 50,663 | 6,289 | — | 56,952 | 1,438,796 | 476,744 | (108) | 1,915,432 | 9 | 9 | ||||||||||||||||||||||||||||
| Gas and water | — | — | — | — | 536,664 | 131,851 | — | 668,515 | 3 | 3 | ||||||||||||||||||||||||||||
| Total utilities | 50,663 | 6,289 | — | 56,952 | 1,975,460 | 608,595 | (108) | 2,583,947 | 12 | 12 | ||||||||||||||||||||||||||||
| Industrial - Energy | ||||||||||||||||||||||||||||||||||||||
| Pipelines | 85,327 | 1,624 | (2,309) | 84,642 | 923,756 | 187,851 | (2,423) | 1,109,184 | 5 | 5 | ||||||||||||||||||||||||||||
| Exploration and production | 104,719 | 5,980 | (678) | 110,021 | 555,796 | 121,940 | (678) | 677,058 | 3 | 3 | ||||||||||||||||||||||||||||
| Oil field services | — | — | — | — | 49,799 | 13,613 | — | 63,412 | — | — | ||||||||||||||||||||||||||||
| Refiner | — | — | — | — | 89,371 | 22,793 | — | 112,164 | 1 | 1 | ||||||||||||||||||||||||||||
| Driller | 1,902 | — | 18 | 1,920 | 1,902 | — | 18 | 1,920 | — | — | ||||||||||||||||||||||||||||
| Total energy | 191,948 | 7,604 | (2,969) | 196,583 | 1,620,624 | 346,197 | (3,083) | 1,963,738 | 9 | 9 | ||||||||||||||||||||||||||||
| Industrial - Basic materials | ||||||||||||||||||||||||||||||||||||||
| Chemicals | — | — | — | — | 642,258 | 152,016 | — | 794,274 | 4 | 4 | ||||||||||||||||||||||||||||
| Metals and mining | — | — | — | — | 406,564 | 144,110 | — | 550,674 | 2 | 3 | ||||||||||||||||||||||||||||
| Forestry products and paper | — | — | — | — | 88,804 | 21,588 | — | 110,392 | 1 | 1 | ||||||||||||||||||||||||||||
| Total basic materials | — | — | — | — | 1,137,626 | 317,714 | — | 1,455,340 | 7 | 8 | ||||||||||||||||||||||||||||
| Industrial - Consumer, non-cyclical | 96,265 | 8,680 | (1,903) | 103,042 | 2,233,324 | 576,007 | (2,070) | 2,807,261 | 13 | 13 | ||||||||||||||||||||||||||||
| Other industrials | 25,661 | 3,925 | — | 29,586 | 1,260,646 | 328,986 | (6) | 1,589,626 | 7 | 7 | ||||||||||||||||||||||||||||
| Industrial - Transportation | 25,777 | 4,315 | — | 30,092 | 566,935 | 175,405 | — | 742,340 | 3 | 3 | ||||||||||||||||||||||||||||
| Other corporate sectors | 179,878 | 17,459 | (3,595) | 193,742 | 1,489,113 | 329,254 | (4,142) | 1,814,225 | 9 | 9 | ||||||||||||||||||||||||||||
| Total corporates | 769,783 | 52,452 | (27,956) | 794,279 | 14,687,931 | 3,698,971 | (33,630) | 18,353,272 | 86 | 86 | ||||||||||||||||||||||||||||
| Other fixed maturities: | ||||||||||||||||||||||||||||||||||||||
| Government (U.S., municipal, and foreign) | — | — | — | — | 2,313,855 | 341,176 | (1,256) | 2,653,775 | 13 | 13 | ||||||||||||||||||||||||||||
| Collateralized debt obligations | 57,007 | 23,460 | (8,869) | 71,598 | 57,007 | 23,460 | (8,869) | 71,598 | — | — | ||||||||||||||||||||||||||||
| Other asset-backed securities | 13,949 | — | (2,727) | 11,222 | 134,616 | 3,591 | (3,778) | 134,429 | 1 | 1 | ||||||||||||||||||||||||||||
Mortgage-backed securities(1) | — | — | — | — | 390 | 45 | — | 435 | — | — | ||||||||||||||||||||||||||||
| Total fixed maturities | $ | 840,739 | $ | 75,912 | $ | (39,552) | $ | 877,099 | $ | 17,193,799 | $ | 4,067,243 | $ | (47,533) | $ | 21,213,509 | 100 | 100 | ||||||||||||||||||||
| Amortized Cost, net | % of Total | Fair Value | % of Total | Average Composite Quality Rating on Amortized Cost, net | |||||||||||||||||||||||||
| Investment grade: | |||||||||||||||||||||||||||||
| AAA | $ | 743,505 | 4 | $ | 834,683 | 4 | |||||||||||||||||||||||
| AA | 1,745,884 | 10 | 1,868,577 | 9 | |||||||||||||||||||||||||
| A | 4,443,827 | 25 | 5,344,601 | 27 | |||||||||||||||||||||||||
| BBB+ | 3,752,952 | 22 | 4,426,767 | 22 | |||||||||||||||||||||||||
| BBB | 4,287,007 | 25 | 4,953,231 | 25 | |||||||||||||||||||||||||
| BBB- | 1,637,072 | 9 | 1,872,566 | 9 | |||||||||||||||||||||||||
Total investment grade | 16,610,247 | 95 | 19,300,425 | 96 | A- | ||||||||||||||||||||||||
| Below investment grade: | |||||||||||||||||||||||||||||
| BB | 626,703 | 4 | 647,531 | 3 | |||||||||||||||||||||||||
| B | 138,199 | 1 | 145,653 | 1 | |||||||||||||||||||||||||
| Below B | 36,810 | — | 61,301 | — | |||||||||||||||||||||||||
Total below investment grade | 801,712 | 5 | 854,485 | 4 | BB- | ||||||||||||||||||||||||
| $ | 17,411,959 | 100 | $ | 20,154,910 | 100 | ||||||||||||||||||||||||
Weighted average composite quality rating | A- | ||||||||||||||||||||||||||||
| September 30, 2017 | |||||||||||
| Amortized Cost | % | Fair Value | % | ||||||||
| Investment grade: | |||||||||||
| AAA | $ | 647,007 | 4 | $ | 681,920 | 4 | |||||
| AA | 1,261,049 | 9 | 1,418,391 | 9 | |||||||
| A | 4,023,931 | 27 | 4,727,798 | 28 | |||||||
| BBB+ | 3,493,852 | 23 | 3,886,434 | 23 | |||||||
| BBB | 3,201,975 | 22 | 3,531,015 | 21 | |||||||
| BBB- | 1,625,982 | 11 | 1,765,876 | 11 | |||||||
| Investment grade | 14,253,796 | 96 | 16,011,434 | 96 | |||||||
| Below investment grade: | |||||||||||
| BB | 362,855 | 2 | 351,691 | 2 | |||||||
| B | 161,422 | 1 | 140,346 | 1 | |||||||
| Below B | 136,507 | 1 | 149,442 | 1 | |||||||
| Below investment grade | 660,784 | 4 | 641,479 | 4 | |||||||
| $ | 14,914,580 | 100 | $ | 16,652,913 | 100 | ||||||
Amortized Cost | % of Total | Fair Value | % of Total | Average Composite Quality Rating on Amortized Cost | |||||||||||||||||||||||||
| Investment grade: | |||||||||||||||||||||||||||||
| AAA | $ | 713,053 | 4 | $ | 848,621 | 4 | |||||||||||||||||||||||
| AA | 1,657,270 | 10 | 1,873,323 | 9 | |||||||||||||||||||||||||
| A | 4,566,999 | 26 | 5,969,677 | 28 | |||||||||||||||||||||||||
| BBB+ | 3,634,583 | 21 | 4,612,898 | 22 | |||||||||||||||||||||||||
| BBB | 4,137,099 | 24 | 5,088,114 | 24 | |||||||||||||||||||||||||
| BBB- | 1,644,056 | 10 | 1,943,777 | 9 | |||||||||||||||||||||||||
Total investment grade | 16,353,060 | 95 | 20,336,410 | 96 | A- | ||||||||||||||||||||||||
| Below investment grade: | |||||||||||||||||||||||||||||
| BB | 686,184 | 4 | 692,609 | 3 | |||||||||||||||||||||||||
| B | 115,646 | 1 | 122,104 | 1 | |||||||||||||||||||||||||
| Below B | 38,909 | — | 62,386 | — | |||||||||||||||||||||||||
Total below investment grade | 840,739 | 5 | 877,099 | 4 | BB- | ||||||||||||||||||||||||
| $ | 17,193,799 | 100 | $ | 21,213,509 | 100 | ||||||||||||||||||||||||
Weighted average composite quality rating | A- | ||||||||||||||||||||||||||||
| Balance as of December 31, 2016 | $ | 751,144 | |
| Downgrades by rating agencies | — | ||
| Upgrades by rating agencies | (76,659 | ) | |
| Disposals | (16,422 | ) | |
| Amortization and other | 2,721 | ||
| Balance as of September 30, 2017 | $ | 660,784 | |
| Three Months Ended March 31, | |||||||||||
| 2021 | 2020 | ||||||||||
Balance at beginning of period | $ | 840,739 | $ | 674,155 | |||||||
| Downgrades by rating agencies | — | 102,488 | |||||||||
| Upgrades by rating agencies | — | — | |||||||||
| Dispositions | (43,141) | (5,398) | |||||||||
| Provision for credit losses | 3,346 | (31,854) | |||||||||
| Amortization and other | 768 | 818 | |||||||||
Balance at end of period | $ | 801,712 | $ | 740,209 | |||||||
| September 30, 2017 | December 31, 2016 | September 30, 2016 | |||
Average annual effective yield(1) | 5.63% | 5.74% | 5.76% | ||
| Average life, in years, to: | |||||
Next call(2) | 17.4 | 17.6 | 17.6 | ||
Maturity(2) | 19.2 | 19.8 | 19.9 | ||
| Effective duration to: | |||||
Next call(2)(3) | 10.7 | 10.4 | 10.8 | ||
Maturity(2)(3) | 11.4 | 11.3 | 11.6 | ||
| Three Months Ended March 31, | Increase | ||||||||||||||||||||||||||||||||||
| 2021 | 2020 | (Decrease) | |||||||||||||||||||||||||||||||||
| Amount | % of Premium | Amount | % of Premium | Amount | % | ||||||||||||||||||||||||||||||
| Insurance administrative expenses: | |||||||||||||||||||||||||||||||||||
| Salaries | $ | 28,180 | 2.8 | $ | 26,179 | 2.8 | $ | 2,001 | 8 | ||||||||||||||||||||||||||
| Other employee costs | 11,447 | 1.2 | 11,261 | 1.2 | 186 | 2 | |||||||||||||||||||||||||||||
| Information technology costs | 11,404 | 1.1 | 11,216 | 1.2 | 188 | 2 | |||||||||||||||||||||||||||||
| Legal costs | 2,833 | 0.3 | 2,715 | 0.3 | 118 | 4 | |||||||||||||||||||||||||||||
| Other administrative costs | 12,312 | 1.2 | 12,249 | 1.3 | 63 | 1 | |||||||||||||||||||||||||||||
| Total insurance administrative expenses | 66,176 | 6.6 | 63,620 | 6.8 | 2,556 | 4 | |||||||||||||||||||||||||||||
| Parent company expense | 2,318 | 2,331 | (13) | ||||||||||||||||||||||||||||||||
| Stock compensation expense | 7,888 | 9,356 | (1,468) | ||||||||||||||||||||||||||||||||
| Legal proceedings | 4,828 | 3,275 | 1,553 | ||||||||||||||||||||||||||||||||
Total operating expenses, per Condensed Consolidated Statements of Operations | $ | 81,210 | $ | 78,582 | $ | 2,628 | 3 | ||||||||||||||||||||||||||||
| Three Months Ended March 31, | |||||||||||||||||||||||||||||||||||
| 2021 | 2020 | ||||||||||||||||||||||||||||||||||
| Shares | Amount | Average Price | Shares | Amount | Average Price | ||||||||||||||||||||||||||||||
| Purchases with: | |||||||||||||||||||||||||||||||||||
| Excess cash flow at the Parent Company | 944 | $ | 90,149 | $ | 95.47 | 1,629 | $ | 139,254 | $ | 85.47 | |||||||||||||||||||||||||
| Option exercise proceeds | 435 | 42,571 | 97.89 | 267 | 27,475 | 103.13 | |||||||||||||||||||||||||||||
| Total | 1,379 | $ | 132,720 | $ | 96.23 | 1,896 | $ | 166,729 | $ | 87.95 | |||||||||||||||||||||||||
| Nine Months Ended September 30, | |||||||||||||||
| 2017 | 2016 | ||||||||||||||
| Amount | Per Share | Amount | Per Share | ||||||||||||
| Fixed maturities: | |||||||||||||||
| Investment sales | $ | 3,153 | $ | 0.02 | $ | 3,847 | $ | 0.03 | |||||||
| Investments called or tendered | 5,628 | 0.05 | 995 | 0.01 | |||||||||||
Investment writedowns (1) | (159 | ) | — | — | — | ||||||||||
| Other investments | (2,387 | ) | (0.02 | ) | 215 | — | |||||||||
| Total | $ | 6,235 | $ | 0.05 | $ | 5,057 | $ | 0.04 | |||||||
| Three Months Ended March 31, | Twelve Months Ended December 31, | ||||||||||||||||||||||
| 2021 | 2020 | Projected 2021 | 2020 | ||||||||||||||||||||
| Liquidity Sources: | |||||||||||||||||||||||
| Dividends from Subsidiaries | $ | 120,728 | $ | 219,709 | $ | 480,000 | $ | 485,871 | |||||||||||||||
| Excess Cash Flows | 88,922 | 189,171 | 365,000 | 387,606 | |||||||||||||||||||
| At | |||||||||||||||||
| March 31, 2021 | December 31, 2020 | March 31, 2020 | |||||||||||||||
| Balance of commercial paper at end of period (par value) | $ | 275,000 | $ | 255,000 | $ | 450,000 | |||||||||||
| Annualized interest rate | 0.23 | % | 0.27 | % | 2.37 | % | |||||||||||
| Letters of credit outstanding | $ | 135,000 | $ | 135,000 | $ | 150,000 | |||||||||||
| Remaining amount available under credit line | 340,000 | 360,000 | 150,000 | ||||||||||||||
| At | ||||||||||||
| September 30, 2017 | December 31, 2016 | September 30, 2016 | ||||||||||
| Balance of commercial paper at end of period (par value) | $ | 305,800 | $ | 262,850 | $ | 266,000 | ||||||
| Annualized interest rate | 1.44 | % | 0.96 | % | 0.85 | % | ||||||
| Letters of credit outstanding | $ | 177,000 | $ | 177,000 | $ | 177,000 | ||||||
| Remaining amount available under credit line | 267,200 | 310,150 | 307,000 | |||||||||
| Nine Months Ended September 30, | ||||||||
| 2017 | 2016 | |||||||
| Average balance of commercial paper outstanding during period (par value) | $ | 336,664 | $ | 297,065 | ||||
| Daily-weighted average interest rate (annualized) | 1.24 | % | 0.81 | % | ||||
| Maximum daily amount outstanding during period (par value) | $ | 455,912 | $ | 412,676 | ||||
| Three Months Ended March 31, | |||||||||||
| 2021 | 2020 | ||||||||||
| Average balance of commercial paper outstanding during period (par value) | $ | 300,444 | $ | 363,176 | |||||||
| Daily-weighted average interest rate (annualized) | 0.24 | % | 1.96 | % | |||||||
| Maximum daily amount outstanding during period (par value) | $ | 355,000 | $ | 470,000 | |||||||
| Instrument | Issue Date | Maturity Date | Coupon Rate | Interest Payment Dates | Par Value | Book Value | Fair Value | ||||||||||||||||||||||||||||||||||
| Senior notes | 05/27/1993 | 05/15/2023 | 7.875% | semiannual | $ | 165,612 | $ | 165,018 | $ | 189,687 | |||||||||||||||||||||||||||||||
Senior notes(1) | 09/24/2012 | 09/15/2022 | 3.800% | semiannual | 150,000 | 149,497 | 156,464 | ||||||||||||||||||||||||||||||||||
| Senior notes | 09/27/2018 | 09/15/2028 | 4.550% | semiannual | 550,000 | 544,483 | 633,286 | ||||||||||||||||||||||||||||||||||
| Senior notes | 08/21/2020 | 08/15/2030 | 2.150% | semiannual | 400,000 | 395,269 | 383,644 | ||||||||||||||||||||||||||||||||||
| Junior subordinated debentures | 05/17/2016 | 06/15/2056 | 6.125% | quarterly | 300,000 | 290,670 | 306,000 | ||||||||||||||||||||||||||||||||||
| Junior subordinated debentures | 11/17/2017 | 11/17/2057 | 5.275% | semiannual | 125,000 | 123,385 | 130,048 | ||||||||||||||||||||||||||||||||||
Total long-term debt | 1,690,612 | 1,668,322 | 1,799,129 | ||||||||||||||||||||||||||||||||||||||
| Commercial paper | 275,000 | 274,919 | 274,919 | ||||||||||||||||||||||||||||||||||||||
Total short-term debt | 275,000 | 274,919 | 274,919 | ||||||||||||||||||||||||||||||||||||||
Total debt | $ | 1,965,612 | $ | 1,943,241 | $ | 2,074,048 | |||||||||||||||||||||||||||||||||||
| Instrument | Year Due | Interest Rate | Par Value | Book Value | Fair Value | |||||||||||
| Notes | 2023 | 7.875% | $ | 165,612 | $ | 164,236 | $ | 198,786 | ||||||||
| Senior Notes | 2019 | 9.250% | 292,647 | 291,767 | 327,057 | |||||||||||
Senior Notes(1) | 2022 | 3.800% | 150,000 | 148,404 | 154,449 | |||||||||||
| Junior Subordinated Debentures | 2052 | 5.875% | 125,000 | 120,954 | 126,700 | |||||||||||
| Junior Subordinated Debentures | 2036 | 4.620% | (2) | 20,000 | 20,000 | 20,000 | ||||||||||
| Junior Subordinated Debentures | 2056 | 6.125% | 300,000 | 290,445 | 321,240 | |||||||||||
Term loan(3) | 2021 | 2.489% | (4) | 98,750 | 98,750 | 98,750 | ||||||||||
| 1,152,009 | 1,134,556 | 1,246,982 | ||||||||||||||
Less current maturity of term loan(3) | 3,750 | 3,750 | 3,750 | |||||||||||||
| Total long-term debt | 1,148,259 | 1,130,806 | 1,243,232 | |||||||||||||
Current maturity of term loan(3) | 3,750 | 3,750 | 3,750 | |||||||||||||
| Commercial paper | 305,800 | 305,252 | 305,252 | |||||||||||||
| Total short term debt | 309,550 | 309,002 | 309,002 | |||||||||||||
| Total debt | $ | 1,457,809 | $ | 1,439,808 | $ | 1,552,234 | ||||||||||
| At | At | |||||||||||||||||||||||||||||||||||||||||||||||||||||||||
| September 30, 2017 | December 31, 2016 | September 30, 2016 | March 31, 2021 | December 31, 2020 | March 31, 2020 | |||||||||||||||||||||||||||||||||||||||||||||||||||||
| GAAP | Effect of Accounting Rule Requiring Revaluation(1) | GAAP | Effect of Accounting Rule Requiring Revaluation(1) | GAAP | Effect of Accounting Rule Requiring Revaluation(1) | GAAP | Effect of Accounting Rule Requiring Revaluation(1) | GAAP | Effect of Accounting Rule Requiring Revaluation(1) | GAAP | Effect of Accounting Rule Requiring Revaluation(1) | |||||||||||||||||||||||||||||||||||||||||||||||
| Fixed maturities | $ | 16,652,913 | $ | 1,738,333 | $ | 15,245,861 | $ | 1,057,811 | $ | 15,837,700 | $ | 1,893,233 | Fixed maturities | $ | 20,154,910 | $ | 2,742,951 | $ | 21,213,509 | $ | 4,019,710 | $ | 17,879,541 | $ | 1,539,451 | |||||||||||||||||||||||||||||||||
Deferred acquisition costs(2) | 3,911,800 | (11,273 | ) | 3,783,158 | (10,281 | ) | 3,739,526 | (12,698 | ) | Deferred acquisition costs(2) | 4,662,509 | (5,596) | 4,595,444 | (5,955) | 4,386,478 | (7,095) | ||||||||||||||||||||||||||||||||||||||||||
| Total assets | 22,993,607 | 1,727,060 | 21,436,087 | 1,047,530 | 22,077,031 | 1,880,535 | Total assets | 28,112,896 | 2,737,355 | 29,046,731 | 4,013,755 | 25,351,914 | 1,532,356 | |||||||||||||||||||||||||||||||||||||||||||||
| Short-term debt | 309,002 | — | 264,475 | — | 266,892 | — | Short-term debt | 274,919 | — | 254,918 | — | 458,127 | — | |||||||||||||||||||||||||||||||||||||||||||||
| Long-term debt | 1,130,806 | — | 1,133,165 | — | 1,133,544 | — | Long-term debt | 1,668,322 | — | 1,667,886 | — | 1,346,795 | — | |||||||||||||||||||||||||||||||||||||||||||||
| Shareholders' equity | 5,167,685 | 1,122,589 | 4,566,861 | 680,894 | 5,086,383 | 1,222,348 | Shareholders' equity | 7,832,337 | 2,162,510 | 8,771,092 | 3,170,866 | 6,520,282 | 1,210,561 | |||||||||||||||||||||||||||||||||||||||||||||
| Book value per diluted share | 43.78 | 9.51 | 37.76 | 5.63 | 41.94 | 10.08 | Book value per diluted share | 75.10 | 20.74 | 83.19 | 30.07 | 60.98 | 11.32 | |||||||||||||||||||||||||||||||||||||||||||||
Debt to capitalization(3) | 21.8 | % | (4.5 | )% | 23.4 | % | (3.1 | )% | 21.6 | % | (5.0 | )% | Debt to capitalization(3) | 19.9 | % | (5.6) | % | 18.0 | % | (7.6) | % | 21.7 | % | (3.7) | % | |||||||||||||||||||||||||||||||||
| Diluted shares outstanding | 118,028 | 120,958 | 121,271 | Diluted shares outstanding | 104,292 | 105,429 | 106,926 | |||||||||||||||||||||||||||||||||||||||||||||||||||
| Actual shares outstanding | 115,359 | 118,031 | 118,895 | Actual shares outstanding | 103,193 | 103,797 | 106,434 | |||||||||||||||||||||||||||||||||||||||||||||||||||
| Period | (a) Total Number of Shares Purchased | (b) Average Price Paid Per Share | (c) Total Number of Shares Purchased as Part of Publicly Announced Plans or Programs | (d) Maximum Number of Shares (or Approximate Dollar Amount) that May Yet Be Purchased Under the Plans or Programs | ||||||||||||||||||||||
| January 1-31, 2021 | 315,768 | $ | 94.92 | 315,768 | ||||||||||||||||||||||
| February 1-28, 2021 | 426,625 | 94.69 | 426,625 | |||||||||||||||||||||||
| March 1-31, 2021 | 636,798 | 97.91 | 636,798 | |||||||||||||||||||||||
| Period | (a) Total Number of Shares Purchased | (b) Average Price Paid Per Share | (c) Total Number of Shares Purchased as Part of Publicly Announced Plans or Programs | (d) Maximum Number of Shares (or Approximate Dollar Amount) that May Yet Be Purchased Under the Plans or Programs | ||||||||
| July 1-31, 2017 | 148,621 | $ | 78.04 | 148,621 | ||||||||
| August 1-31, 2017 | 775,262 | 77.79 | 775,262 | |||||||||
| September 1-30, 2017 | 337,147 | 76.48 | 337,147 | |||||||||
| Description | ||||||||
| 31.1 | ||||||||
| 31.2 | ||||||||
| XBRL Instance Document- the instance document does not appear in the Interactive Data | ||||||||
| 101.SCH | Inline XBRL Taxonomy Extension Schema Document. | |||||||
| 101.CAL | Inline XBRL Taxonomy Extension Calculation Linkbase Document. | |||||||
| 101.LAB | Inline XBRL Taxonomy Extension Label Linkbase Document. | |||||||
| 101.PRE | Inline XBRL Taxonomy Extension Presentation Linkbase Document. | |||||||
| 101.DEF | Inline XBRL Taxonomy Extension Definition Linkbase Document. | |||||||
| 104 | Cover Page Interactive Data File (formatted as inline XBRL with applicable taxonomy extension information contained in Exhibits 101). | |||||||
| GLOBE LIFE INC. | ||||||||||||
| Date: May 5, 2021 | ||||||||||||
| /s/ Gary L. Coleman | ||||||||||||
| Gary L. Coleman | ||||||||||||
| Co-Chairman and Chief Executive Officer | ||||||||||||
| Date: | /s/ Larry M. Hutchison | |||||||||||
| Larry M. Hutchison | ||||||||||||
| Co-Chairman and Chief Executive Officer | ||||||||||||
| Date: | /s/ Frank M. Svoboda | |||||||||||
| Frank M. Svoboda | ||||||||||||
| Executive Vice President and Chief Financial Officer | ||||||||||||