UNITED STATES
SECURITIES AND EXCHANGE COMMISSION
Washington, D. C. 20549
______________________________________________
FORM 10-Q
______________________________________________
(Mark one)
| QUARTERLY REPORT PURSUANT TO SECTION 13 OR 15(d) OF THE SECURITIES EXCHANGE ACT OF 1934 | |||||
For the quarterly period ended June 30, 2020March 31, 2021
or
| TRANSITION REPORT PURSUANT TO SECTION 13 OR 15(d) OF THE SECURITIES EXCHANGE ACT OF 1934 | |||||
Commission File Number: 1-8182
PIONEER ENERGY SERVICES CORP.
(Exact name of registrant as specified in its charter)
| 74-2088619 | ||||||||
(State or other jurisdiction of incorporation or organization) | (I.R.S. Employer Identification Number) | |||||||
1250 N.E. Loop 410, Suite 1000 San Antonio, Texas | 78209 | |||||||
| (Address of principal executive offices) | (Zip Code) | |||||||
Registrant’s telephone number, including area code: (855) 884-0575 | ||||||||
| Securities registered pursuant to Section 12(b) of the Act | ||||||||
| Title of each class | Trading Symbol(s) | Name of each exchange on which registered | ||||||
| 0 | 0 | 0 | ||||||
Indicate by check mark whether the registrant (1) has filed all reports required to be filed by Section 13 or 15(d) of the Securities Exchange Act of 1934 during the preceding 12 months (or for such shorter period that the registrant was required to file such reports), and (2) has been subject to such filing requirements for the past 90 days. Yes x No o
Indicate by check mark whether the registrant has submitted electronically every Interactive Data File required to be submitted pursuant to Rule 405 of Regulation S-T (§232.405 of this chapter) during the preceding 12 months (or for such shorter period that the registrant was required to submit such files). Yes x No o
Indicate by check mark whether the registrant is a large accelerated filer, an accelerated filer, a non-accelerated filer, a smaller reporting company, or an emerging growth company. See the definitions of “large accelerated filer,” “accelerated filer,” “smaller reporting company,” and “emerging growth company” in Rule 12b-2 of the Exchange Act.
| Large accelerated filer | o | Accelerated filer | o | ||||||||
| Non-accelerated filer | x | Smaller reporting company | |||||||||
| Emerging growth company | |||||||||||
If an emerging growth company, indicate by check mark if the registrant has elected not to use the extended transition period for complying with any new or revised financial accounting standards provided pursuant to Section 13(a) of the Exchange Act. ¨
Indicate by check mark whether the registrant is a shell company (as defined in Rule 12b-2 of the Exchange Act). Yes ¨ No x
Indicate by check mark whether the registrant has filed all documents and reports required to be filed by Sections 12, 13, or 15(d) of the Securities Exchange Act of 1934 subsequent to the distribution of securities under a plan confirmed by a court. Yes x No ¨
As of August 17, 2020,April 30, 2021, there were 1,138,1851,837,641 shares of common stock, par value $0.001 per share, of the registrant outstanding.
TABLE OF CONTENTS
| Page | ||||||||
PART I. FINANCIAL INFORMATION
PIONEER ENERGY SERVICES CORP. AND SUBSIDIARIES
CONDENSED CONSOLIDATED BALANCE SHEETS
| March 31, 2021 | December 31, 2020 | ||||||||||
| (unaudited) | (audited) | ||||||||||
| (in thousands, except share data) | |||||||||||
| ASSETS | |||||||||||
| Cash and cash equivalents | $ | 28,992 | $ | 31,181 | |||||||
| Restricted cash | 1,503 | 1,148 | |||||||||
| Receivables: | |||||||||||
| Trade, net of allowance for doubtful accounts | 31,626 | 29,803 | |||||||||
| Unbilled receivables | 7,487 | 4,740 | |||||||||
| Insurance recoveries | 21,918 | 22,106 | |||||||||
| Other receivables | 2,597 | 2,716 | |||||||||
| Inventory | 12,093 | 12,641 | |||||||||
| Assets held for sale | 2,733 | 3,608 | |||||||||
| Prepaid expenses and other current assets | 3,697 | 5,190 | |||||||||
| Total current assets | 112,646 | 113,133 | |||||||||
| Property and equipment, at cost | 196,160 | 193,529 | |||||||||
| Less accumulated depreciation | 44,026 | 31,760 | |||||||||
| Net property and equipment | 152,134 | 161,769 | |||||||||
| Intangible assets, net of accumulated amortization | 8,707 | 8,942 | |||||||||
| Deferred income taxes | 12,253 | 12,746 | |||||||||
| Operating lease assets | 4,228 | 4,383 | |||||||||
| Other noncurrent assets | 12,585 | 13,457 | |||||||||
| Total assets | $ | 302,553 | $ | 314,430 | |||||||
| LIABILITIES AND STOCKHOLDERS’ EQUITY | |||||||||||
| Accounts payable | $ | 16,784 | $ | 17,516 | |||||||
| Current portion of long-term debt | 505 | 150 | |||||||||
| Deferred revenues | 824 | 1,019 | |||||||||
| Accrued expenses: | |||||||||||
| Employee compensation and related costs | 8,891 | 7,325 | |||||||||
| Insurance claims and settlements | 21,918 | 22,106 | |||||||||
| Insurance premiums and deductibles | 3,783 | 3,928 | |||||||||
| Interest | 3,662 | 2,015 | |||||||||
| Other | 4,162 | 4,959 | |||||||||
| Total current liabilities | 60,529 | 59,018 | |||||||||
| Long-term debt, less unamortized discount and debt issuance costs | 149,222 | 147,167 | |||||||||
| Noncurrent operating lease liabilities | 3,422 | 3,622 | |||||||||
| Deferred income taxes | 1,825 | 947 | |||||||||
| Other noncurrent liabilities | 1,770 | 1,779 | |||||||||
| Total liabilities | 216,768 | 212,533 | |||||||||
| Commitments and contingencies (Note 10) | |||||||||||
| Stockholders’ equity: | |||||||||||
| Successor common stock, $0.001 par value; 25,000,000 shares authorized; 1,647,224 shares outstanding at both March 31, 2021 and December 31, 2020 | 2 | 2 | |||||||||
| Additional paid-in capital | 142,949 | 142,119 | |||||||||
| Accumulated deficit | (57,166) | (40,224) | |||||||||
| Total stockholders’ equity | 85,785 | 101,897 | |||||||||
| Total liabilities and stockholders’ equity | $ | 302,553 | $ | 314,430 | |||||||
See accompanying notes to condensed consolidated financial statements.
3
| Successor | Predecessor | |||||||
| June 30, 2020 | December 31, 2019 | |||||||
| (unaudited) | (audited) | |||||||
| ASSETS | ||||||||
| Cash and cash equivalents | $ | 15,161 | $ | 24,619 | ||||
| Restricted cash | 16,173 | 998 | ||||||
| Receivables: | ||||||||
| Trade, net of allowance for doubtful accounts | 29,912 | 79,135 | ||||||
| Unbilled receivables | 6,318 | 12,590 | ||||||
| Insurance recoveries | 22,747 | 22,873 | ||||||
| Other receivables | 5,731 | 8,928 | ||||||
| Inventory | 13,056 | 22,453 | ||||||
| Assets held for sale | 7,292 | 3,447 | ||||||
| Prepaid expenses and other current assets | 5,649 | 7,869 | ||||||
| Total current assets | 122,039 | 182,912 | ||||||
| Property and equipment, at cost | 191,259 | 1,119,546 | ||||||
| Less accumulated depreciation | 5,019 | 648,376 | ||||||
| Net property and equipment | 186,240 | 471,170 | ||||||
| Intangible assets, net of accumulated amortization | 9,292 | — | ||||||
| Deferred income taxes | 9,139 | 11,540 | ||||||
| Operating lease assets | 5,040 | 7,264 | ||||||
| Other noncurrent assets | 12,050 | 1,068 | ||||||
| Total assets | $ | 343,800 | $ | 673,954 | ||||
| LIABILITIES AND STOCKHOLDERS’ EQUITY | ||||||||
| Accounts payable | $ | 16,148 | $ | 32,551 | ||||
| Deferred revenues | 642 | 1,339 | ||||||
| Accrued expenses: | ||||||||
| Employee compensation and related costs | 4,954 | 13,781 | ||||||
| Insurance claims and settlements | 22,747 | 22,873 | ||||||
| Insurance premiums and deductibles | 4,043 | 5,940 | ||||||
| Interest | 1,463 | 5,452 | ||||||
| Other | 15,939 | 9,645 | ||||||
| Total current liabilities | 65,936 | 91,581 | ||||||
| Long-term debt, less unamortized discount and debt issuance costs | 142,005 | 467,699 | ||||||
| Noncurrent operating lease liabilities | 4,098 | 5,700 | ||||||
| Deferred income taxes | 1,071 | 4,417 | ||||||
| Other noncurrent liabilities | 1,548 | 481 | ||||||
| Total liabilities | 214,658 | 569,878 | ||||||
| Commitments and contingencies (Note 13) | ||||||||
| Stockholders’ equity: | ||||||||
| Predecessor common stock $.10 par value; 200,000,000 shares authorized; 79,202,216 shares outstanding at December 31, 2019 | — | 8,008 | ||||||
| Successor common stock, $.001 par value; 25,000,000 shares authorized; 1,048,185 shares outstanding at June 30, 2020 | 1 | — | ||||||
| Additional paid-in capital | 138,958 | 553,210 | ||||||
| Predecessor treasury stock, at cost; 877,047 shares at December 31, 2019 | — | (5,090 | ) | |||||
| Retained earnings (Accumulated deficit) | (9,817 | ) | (452,052 | ) | ||||
| Total stockholders’ equity | 129,142 | 104,076 | ||||||
| Total liabilities and stockholders’ equity | $ | 343,800 | $ | 673,954 | ||||
PIONEER ENERGY SERVICES CORP. AND SUBSIDIARIES
CONDENSED CONSOLIDATED STATEMENTS OF OPERATIONS
(in thousands, except per share data)
(unaudited)
| Successor | Predecessor | ||||||||||||||||||||||||||||||||||||||||||||||
| Three Months Ended March 31, 2021 | Three Months Ended March 31, 2020 | ||||||||||||||||||||||||||||||||||||||||||||||
| Revenues | $ | 58,738 | $ | 114,322 | |||||||||||||||||||||||||||||||||||||||||||
| Costs and expenses: | |||||||||||||||||||||||||||||||||||||||||||||||
| Operating costs | 45,326 | 92,022 | |||||||||||||||||||||||||||||||||||||||||||||
| Depreciation and amortization | 13,365 | 21,984 | |||||||||||||||||||||||||||||||||||||||||||||
| General and administrative | 9,713 | 14,655 | |||||||||||||||||||||||||||||||||||||||||||||
| Prepetition restructuring charges | 0 | 17,074 | |||||||||||||||||||||||||||||||||||||||||||||
| Impairment | 0 | 17,853 | |||||||||||||||||||||||||||||||||||||||||||||
| Bad debt expense (recovery), net | (197) | 727 | |||||||||||||||||||||||||||||||||||||||||||||
| Gain on dispositions of property and equipment, net | (2,298) | (717) | |||||||||||||||||||||||||||||||||||||||||||||
| Total costs and expenses | 65,909 | 163,598 | |||||||||||||||||||||||||||||||||||||||||||||
| Loss from operations | (7,171) | (49,276) | |||||||||||||||||||||||||||||||||||||||||||||
| Other income (expense): | |||||||||||||||||||||||||||||||||||||||||||||||
| Interest expense, net of interest capitalized | (6,534) | (8,651) | |||||||||||||||||||||||||||||||||||||||||||||
| Reorganization items, net | (146) | (6,663) | |||||||||||||||||||||||||||||||||||||||||||||
| Loss on extinguishment of debt | (83) | 0 | |||||||||||||||||||||||||||||||||||||||||||||
| Other expense, net | (2,550) | (5,545) | |||||||||||||||||||||||||||||||||||||||||||||
| Total other expense, net | (9,313) | (20,859) | |||||||||||||||||||||||||||||||||||||||||||||
| Loss before income taxes | (16,484) | (70,135) | |||||||||||||||||||||||||||||||||||||||||||||
| Income tax (expense) benefit | (458) | 1,031 | |||||||||||||||||||||||||||||||||||||||||||||
| Net loss | $ | (16,942) | $ | (69,104) | |||||||||||||||||||||||||||||||||||||||||||
| Loss per common share - Basic | $ | (14.89) | $ | (0.88) | |||||||||||||||||||||||||||||||||||||||||||
| Loss per common share - Diluted | $ | (14.89) | $ | (0.88) | |||||||||||||||||||||||||||||||||||||||||||
| Weighted average number of shares outstanding—Basic | 1,138 | 78,753 | |||||||||||||||||||||||||||||||||||||||||||||
| Weighted average number of shares outstanding—Diluted | 1,138 | 78,753 | |||||||||||||||||||||||||||||||||||||||||||||
See accompanying notes to condensed consolidated financial statements.
4
| Successor | Predecessor | |||||||||||
| One Month Ended June 30, 2020 | Two Months Ended May 31, 2020 | Three Months Ended June 30, 2019 | ||||||||||
| Revenues | $ | 11,163 | $ | 28,048 | $ | 152,843 | ||||||
| Costs and expenses: | ||||||||||||
| Operating costs | 8,743 | 22,025 | 115,970 | |||||||||
| Depreciation and amortization | 5,236 | 13,663 | 22,851 | |||||||||
| General and administrative | 4,213 | 7,392 | 18,028 | |||||||||
| Pre-petition restructuring charges | — | (252 | ) | — | ||||||||
| Impairment | 388 | — | 332 | |||||||||
| Bad debt expense (recovery), net | (283 | ) | 482 | (348 | ) | |||||||
| Gain on dispositions of property and equipment, net | (460 | ) | (272 | ) | (1,126 | ) | ||||||
| Total costs and expenses | 17,837 | 43,038 | 155,707 | |||||||||
| Loss from operations | (6,674 | ) | (14,990 | ) | (2,864 | ) | ||||||
| Other income (expense): | ||||||||||||
| Interest expense, net of interest capitalized | (2,215 | ) | (4,135 | ) | (10,105 | ) | ||||||
| Reorganization items, net | (1,144 | ) | (15,240 | ) | — | |||||||
| Loss on extinguishment of debt | — | (3,723 | ) | — | ||||||||
| Other income (expense), net | (230 | ) | 2,212 | 349 | ||||||||
| Total other expense, net | (3,589 | ) | (20,886 | ) | (9,756 | ) | ||||||
| Loss before income taxes | (10,263 | ) | (35,876 | ) | (12,620 | ) | ||||||
| Income tax (expense) benefit | 446 | 755 | (324 | ) | ||||||||
| Net loss | $ | (9,817 | ) | $ | (35,121 | ) | $ | (12,944 | ) | |||
| Loss per common share - Basic | $ | (9.37 | ) | $ | (0.44 | ) | $ | (0.17 | ) | |||
| Loss per common share - Diluted | $ | (9.37 | ) | $ | (0.44 | ) | $ | (0.17 | ) | |||
| Weighted average number of shares outstanding—Basic | 1,048 | 79,288 | 78,430 | |||||||||
| Weighted average number of shares outstanding—Diluted | 1,048 | 79,288 | 78,430 | |||||||||
PIONEER ENERGY SERVICES CORP. AND SUBSIDIARIES
CONDENSED CONSOLIDATED STATEMENTS OF OPERATIONSSTOCKHOLDERS’ EQUITY
(unaudited)
(in thousands, except per share data)thousands)
| As of and for the three months ended March 31, 2021 (Successor) | |||||||||||||||||||||||||||||||||||||||||||||||
| Shares | Amount | Additional Paid In Capital | Accumulated Deficit | Total Stockholders’ Equity | |||||||||||||||||||||||||||||||||||||||||||
| Common | Treasury | Common | Treasury | ||||||||||||||||||||||||||||||||||||||||||||
| Balance as of December 31, 2020 | 1,649 | (1) | $ | 2 | $ | 0 | $ | 142,119 | $ | (40,224) | $ | 101,897 | |||||||||||||||||||||||||||||||||||
| Net loss | — | — | — | — | — | (16,942) | (16,942) | ||||||||||||||||||||||||||||||||||||||||
| Stock-based compensation expense | — | — | — | — | 830 | — | 830 | ||||||||||||||||||||||||||||||||||||||||
| Balance as of March 31, 2021 | 1,649 | (1) | $ | 2 | $ | 0 | $ | 142,949 | $ | (57,166) | $ | 85,785 | |||||||||||||||||||||||||||||||||||
| As of and for the three months ended March 31, 2020 (Predecessor) | |||||||||||||||||||||||||||||||||||||||||||||||
| Shares | Amount | Additional Paid In Capital | Accumulated Deficit | Total Stockholders’ Equity | |||||||||||||||||||||||||||||||||||||||||||
| Common | Treasury | Common | Treasury | ||||||||||||||||||||||||||||||||||||||||||||
| Balance as of December 31, 2019 | 80,079 | (877) | $ | 8,008 | $ | (5,090) | $ | 553,210 | $ | (452,052) | $ | 104,076 | |||||||||||||||||||||||||||||||||||
| Net loss | — | — | — | — | — | (69,104) | (69,104) | ||||||||||||||||||||||||||||||||||||||||
| Purchase of treasury stock | — | (165) | — | (7) | — | — | (7) | ||||||||||||||||||||||||||||||||||||||||
| Issuance of restricted stock | 542 | — | 54 | — | (54) | — | — | ||||||||||||||||||||||||||||||||||||||||
| Stock-based compensation expense | — | — | — | — | 328 | — | 328 | ||||||||||||||||||||||||||||||||||||||||
| Balance as of March 31, 2020 | 80,621 | (1,042) | $ | 8,062 | $ | (5,097) | $ | 553,484 | $ | (521,156) | $ | 35,293 | |||||||||||||||||||||||||||||||||||
See accompanying notes to condensed consolidated financial statements.
5
| Successor | Predecessor | |||||||||||
| One Month Ended June 30, 2020 | Five Months Ended May 31, 2020 | Six Months Ended June 30, 2019 | ||||||||||
| Revenues | $ | 11,163 | $ | 142,370 | $ | 299,411 | ||||||
| Costs and expenses: | ||||||||||||
| Operating costs | 8,743 | 114,047 | 224,555 | |||||||||
| Depreciation and amortization | 5,236 | 35,647 | 45,504 | |||||||||
| General and administrative | 4,213 | 22,047 | 37,786 | |||||||||
| Pre-petition restructuring charges | — | 16,822 | — | |||||||||
| Impairment | 388 | 17,853 | 1,378 | |||||||||
| Bad debt expense (recovery), net | (283 | ) | 1,209 | (286 | ) | |||||||
| Gain on dispositions of property and equipment, net | (460 | ) | (989 | ) | (2,201 | ) | ||||||
| Total costs and expenses | 17,837 | 206,636 | 306,736 | |||||||||
| Loss from operations | (6,674 | ) | (64,266 | ) | (7,325 | ) | ||||||
| Other income (expense): | ||||||||||||
| Interest expense, net of interest capitalized | (2,215 | ) | (12,294 | ) | (19,990 | ) | ||||||
| Reorganization items, net | (1,144 | ) | (21,903 | ) | — | |||||||
| Loss on extinguishment of debt | — | (4,215 | ) | — | ||||||||
| Other income (expense), net | (230 | ) | (3,333 | ) | 1,033 | |||||||
| Total other expense, net | (3,589 | ) | (41,745 | ) | (18,957 | ) | ||||||
| Loss before income taxes | (10,263 | ) | (106,011 | ) | (26,282 | ) | ||||||
| Income tax (expense) benefit | 446 | 1,786 | (1,777 | ) | ||||||||
| Net loss | $ | (9,817 | ) | $ | (104,225 | ) | $ | (28,059 | ) | |||
| Loss per common share - Basic | $ | (9.37 | ) | $ | (1.32 | ) | $ | (0.36 | ) | |||
| Loss per common share - Diluted | $ | (9.37 | ) | $ | (1.32 | ) | $ | (0.36 | ) | |||
| Weighted average number of shares outstanding—Basic | 1,048 | 78,968 | 78,371 | |||||||||
| Weighted average number of shares outstanding—Diluted | 1,048 | 78,968 | 78,371 | |||||||||
PIONEER ENERGY SERVICES CORP. AND SUBSIDIARIES
CONDENSED CONSOLIDATED STATEMENTS OF STOCKHOLDERS’ EQUITY
(in thousands)
(unaudited)
| Successor | Predecessor | |||||||||||||||||||||||||||||||
| Three Months Ended March 31, 2021 | Three Months Ended March 31, 2020 | |||||||||||||||||||||||||||||||
| Cash flows from operating activities: | ||||||||||||||||||||||||||||||||
| Net loss | $ | (16,942) | $ | (69,104) | ||||||||||||||||||||||||||||
| Adjustments to reconcile net loss to net cash used in operating activities: | ||||||||||||||||||||||||||||||||
| Depreciation and amortization | 13,365 | 21,984 | ||||||||||||||||||||||||||||||
| Allowance for doubtful accounts, net of recoveries | (197) | 727 | ||||||||||||||||||||||||||||||
| Gain on dispositions of property and equipment, net | (2,298) | (717) | ||||||||||||||||||||||||||||||
| Reorganization items, net | 0 | 988 | ||||||||||||||||||||||||||||||
| Stock-based compensation expense | 830 | 328 | ||||||||||||||||||||||||||||||
| Phantom stock compensation expense | 0 | (3) | ||||||||||||||||||||||||||||||
| Amortization of debt issuance costs and discount | 2,578 | 1,219 | ||||||||||||||||||||||||||||||
| Interest paid in-kind | 1,057 | 0 | ||||||||||||||||||||||||||||||
| Loss on extinguishment of debt | 83 | 0 | ||||||||||||||||||||||||||||||
| Impairment | 0 | 17,853 | ||||||||||||||||||||||||||||||
| Deferred income taxes | 1,370 | 1,115 | ||||||||||||||||||||||||||||||
| Change in other noncurrent assets | 64 | 690 | ||||||||||||||||||||||||||||||
| Change in other noncurrent liabilities | (162) | (562) | ||||||||||||||||||||||||||||||
| Changes in current assets and liabilities: | ||||||||||||||||||||||||||||||||
| Receivables | (3,386) | 14,234 | ||||||||||||||||||||||||||||||
| Inventory | 548 | 834 | ||||||||||||||||||||||||||||||
| Prepaid expenses and other current assets | 1,548 | (1,253) | ||||||||||||||||||||||||||||||
| Accounts payable | (816) | (4,114) | ||||||||||||||||||||||||||||||
| Deferred revenues | (195) | (342) | ||||||||||||||||||||||||||||||
| Commitment premium | 0 | 9,584 | ||||||||||||||||||||||||||||||
| Accrued expenses | 2,211 | 1,148 | ||||||||||||||||||||||||||||||
| Net cash used in operating activities | (342) | (5,391) | ||||||||||||||||||||||||||||||
| Cash flows from investing activities: | ||||||||||||||||||||||||||||||||
| Purchases of property and equipment | (3,744) | (7,503) | ||||||||||||||||||||||||||||||
| Proceeds from sale of property and equipment | 3,522 | 727 | ||||||||||||||||||||||||||||||
| Net cash used in investing activities | (222) | (6,776) | ||||||||||||||||||||||||||||||
| Cash flows from financing activities: | ||||||||||||||||||||||||||||||||
| Debt repayments | (1,270) | 0 | ||||||||||||||||||||||||||||||
| Proceeds from DIP Facility | 0 | 4,000 | ||||||||||||||||||||||||||||||
| DIP Facility issuance costs | 0 | (988) | ||||||||||||||||||||||||||||||
| Purchase of treasury stock | 0 | (7) | ||||||||||||||||||||||||||||||
| Net cash provided by (used in) financing activities | (1,270) | 3,005 | ||||||||||||||||||||||||||||||
| Net decrease in cash, cash equivalents and restricted cash | (1,834) | (9,162) | ||||||||||||||||||||||||||||||
| Beginning cash, cash equivalents and restricted cash | 32,329 | 25,617 | ||||||||||||||||||||||||||||||
| Ending cash, cash equivalents and restricted cash | $ | 30,495 | $ | 16,455 | ||||||||||||||||||||||||||||
| Supplementary disclosure: | ||||||||||||||||||||||||||||||||
| Interest paid | $ | 1,203 | $ | 4,306 | ||||||||||||||||||||||||||||
| Income tax paid | $ | 406 | $ | 623 | ||||||||||||||||||||||||||||
| Reorganization items paid | $ | 521 | $ | 2,322 | ||||||||||||||||||||||||||||
| Noncash investing and financing activity: | ||||||||||||||||||||||||||||||||
| Change in capital expenditure accruals | $ | 70 | $ | 358 | ||||||||||||||||||||||||||||
See accompanying notes to condensed consolidated financial statements.
6
| Shares | Amount | Additional Paid In Capital | Accumulated Deficit | Total Stockholders’ Equity | |||||||||||||||||||||
| Common | Treasury | Common | Treasury | ||||||||||||||||||||||
| Balance as of December 31, 2019 (Predecessor) | 80,079 | (877 | ) | $ | 8,008 | $ | (5,090 | ) | $ | 553,210 | $ | (452,052 | ) | $ | 104,076 | ||||||||||
| Net loss | — | — | — | — | — | (69,104 | ) | (69,104 | ) | ||||||||||||||||
| Purchase of treasury stock | — | (165 | ) | — | (7 | ) | — | — | (7 | ) | |||||||||||||||
| Equity awards vested or exercised | 542 | — | 54 | — | (54 | ) | — | — | |||||||||||||||||
| Stock-based compensation expense | — | — | — | — | 328 | — | 328 | ||||||||||||||||||
| Balance as of March 31, 2020 (Predecessor) | 80,621 | (1,042 | ) | $ | 8,062 | $ | (5,097 | ) | $ | 553,484 | $ | (521,156 | ) | $ | 35,293 | ||||||||||
| Net loss | — | — | — | — | — | (35,121 | ) | (35,121 | ) | ||||||||||||||||
| Purchase of treasury stock | — | (100 | ) | — | (1 | ) | — | — | (1 | ) | |||||||||||||||
| Equity awards vested or exercised | 363 | — | 36 | — | (36 | ) | — | — | |||||||||||||||||
| Equity awards vested in connection with the Plan | 7,946 | — | 795 | — | (795 | ) | — | — | |||||||||||||||||
| Stock-based compensation expense | — | — | — | — | 978 | — | 978 | ||||||||||||||||||
| Balance as of May 31, 2020 (Predecessor) | 88,930 | (1,142 | ) | $ | 8,893 | $ | (5,098 | ) | $ | 553,631 | $ | (556,277 | ) | $ | 1,149 | ||||||||||
| Cancellation of Predecessor equity | (88,930 | ) | 1,142 | (8,893 | ) | 5,098 | (553,631 | ) | 556,277 | (1,149 | ) | ||||||||||||||
| Balance as of May 31, 2020 (Predecessor) | — | — | $ | — | $ | — | $ | — | $ | — | $ | — | |||||||||||||
| Balance as of June 1, 2020 (Successor) | — | — | $ | — | $ | — | $ | — | $ | — | $ | — | |||||||||||||
| Issuance of Successor common stock | 1,050 | (1 | ) | 1 | — | 18,083 | — | 18,084 | |||||||||||||||||
| Equity component of Convertible Notes, net of offering costs | — | — | — | — | 120,875 | — | 120,875 | ||||||||||||||||||
| Net loss | — | — | — | — | — | (9,817 | ) | (9,817 | ) | ||||||||||||||||
| Balance as of June 30, 2020 (Successor) | 1,050 | (1 | ) | $ | 1 | $ | — | $ | 138,958 | $ | (9,817 | ) | $ | 129,142 | |||||||||||
| Shares | Amount | Additional Paid In Capital | Accumulated Deficit | Total Stockholders’ Equity | |||||||||||||||||||||
| Common | Treasury | Common | Treasury | ||||||||||||||||||||||
| Balance as of December 31, 2018 (Predecessor) | 79,004 | (790 | ) | $ | 7,900 | $ | (4,965 | ) | $ | 550,548 | $ | (388,425 | ) | $ | 165,058 | ||||||||||
| Net loss | — | — | — | — | — | (15,115 | ) | (15,115 | ) | ||||||||||||||||
| Purchase of treasury stock | — | (84 | ) | — | (120 | ) | — | — | (120 | ) | |||||||||||||||
| Cumulative-effect adjustment due to adoption of ASC Topic 842 | — | — | — | — | — | 277 | 277 | ||||||||||||||||||
| Equity awards vested or exercised | 326 | — | 33 | — | (33 | ) | — | — | |||||||||||||||||
| Stock-based compensation expense | — | — | — | — | 867 | — | 867 | ||||||||||||||||||
| Balance as of March 31, 2019 (Predecessor) | 79,330 | (874 | ) | $ | 7,933 | $ | (5,085 | ) | $ | 551,382 | $ | (403,263 | ) | $ | 150,967 | ||||||||||
| Net loss | — | — | — | — | — | (12,944 | ) | (12,944 | ) | ||||||||||||||||
| Purchase of treasury stock | — | (3 | ) | — | (5 | ) | — | — | (5 | ) | |||||||||||||||
| Equity awards vested or exercised | 667 | — | 67 | — | (67 | ) | — | — | |||||||||||||||||
| Stock-based compensation expense | — | — | — | — | 327 | — | 327 | ||||||||||||||||||
| Balance as of June 30, 2019 (Predecessor) | 79,997 | (877 | ) | $ | 8,000 | $ | (5,090 | ) | $ | 551,642 | $ | (416,207 | ) | $ | 138,345 | ||||||||||
| Successor | Predecessor | |||||||||||
| One Month Ended June 30, 2020 | Five Months Ended May 31, 2020 | Six Months Ended June 30, 2019 | ||||||||||
| Cash flows from operating activities: | ||||||||||||
| Net loss | $ | (9,817 | ) | $ | (104,225 | ) | $ | (28,059 | ) | |||
| Adjustments to reconcile net loss to net cash provided by (used in) operating activities: | ||||||||||||
| Depreciation and amortization | 5,236 | 35,647 | 45,504 | |||||||||
| Allowance for doubtful accounts, net of recoveries | (283 | ) | 1,209 | (286 | ) | |||||||
| Gain on dispositions of property and equipment, net | (460 | ) | (989 | ) | (2,201 | ) | ||||||
| Reorganization items, net | — | 18,713 | — | |||||||||
| Stock-based compensation expense | — | 552 | 1,194 | |||||||||
| Phantom stock compensation expense | — | — | 51 | |||||||||
| Amortization of debt issuance costs and discount | 766 | 1,084 | 1,541 | |||||||||
| Loss on extinguishment of debt | — | 4,215 | — | |||||||||
| Impairment | 388 | 17,853 | 1,378 | |||||||||
| Deferred income taxes | (399 | ) | (546 | ) | 1,225 | |||||||
| Change in other noncurrent assets | (36 | ) | (800 | ) | 1,476 | |||||||
| Change in other noncurrent liabilities | 355 | 1,524 | (2,493 | ) | ||||||||
| Changes in current assets and liabilities: | ||||||||||||
| Receivables | 7,395 | 44,041 | (14,858 | ) | ||||||||
| Inventory | 240 | 1,441 | (3,864 | ) | ||||||||
| Prepaid expenses and other current assets | 133 | 1,121 | (108 | ) | ||||||||
| Accounts payable | 1,216 | (15,174 | ) | 10,697 | ||||||||
| Deferred revenues | 522 | (1,219 | ) | (302 | ) | |||||||
| Accrued expenses | (539 | ) | (6,692 | ) | (6,849 | ) | ||||||
| Net cash provided by (used in) operating activities | 4,717 | (2,245 | ) | 4,046 | ||||||||
| Cash flows from investing activities: | ||||||||||||
| Purchases of property and equipment | (900 | ) | (10,848 | ) | (31,382 | ) | ||||||
| Proceeds from sale of property and equipment | 752 | 1,665 | 3,439 | |||||||||
| Proceeds from insurance recoveries | — | 22 | 588 | |||||||||
| Net cash used in investing activities | (148 | ) | (9,161 | ) | (27,355 | ) | ||||||
| Cash flows from financing activities: | ||||||||||||
| Debt repayments | — | (175,000 | ) | — | ||||||||
| Proceeds from debt issuance | — | 195,187 | — | |||||||||
| Proceeds from DIP Facility | — | 4,000 | — | |||||||||
| Repayment of DIP Facility | — | (4,000 | ) | — | ||||||||
| Payments of debt issuance costs | — | (7,625 | ) | — | ||||||||
| Purchase of treasury stock | — | (8 | ) | (125 | ) | |||||||
| Net cash provided by (used in) financing activities | — | 12,554 | (125 | ) | ||||||||
| Net increase (decrease) in cash, cash equivalents and restricted cash | 4,569 | 1,148 | (23,434 | ) | ||||||||
| Beginning cash, cash equivalents and restricted cash | 26,765 | 25,617 | 54,564 | |||||||||
| Ending cash, cash equivalents and restricted cash | $ | 31,334 | $ | 26,765 | $ | 31,130 | ||||||
| Supplementary disclosure: | ||||||||||||
| Interest paid | $ | 9 | $ | 8,105 | $ | 18,832 | ||||||
| Income tax paid | $ | 118 | $ | 893 | $ | 2,156 | ||||||
| Reorganization items paid | $ | 784 | $ | 14,947 | — | |||||||
| Noncash investing and financing activity: | ||||||||||||
| Change in capital expenditure accruals | $ | (188 | ) | $ | (1,924 | ) | $ | (3,766 | ) | |||
PIONEER ENERGY SERVICES CORP. AND SUBSIDIARIES
NOTES TO UNAUDITED CONDENSED CONSOLIDATED FINANCIAL STATEMENTS
1. Organization and Summary of Significant Accounting Policies
Business
Pioneer Energy Services Corp. provides land-based drilling services and production services to a diverse group of oil and gas exploration and production companies in the United States and internationally in Colombia.
Our drilling services business segments provide contract land drilling services through three3 domestic divisions which are located in the Marcellus/Utica, Permian Basin and Eagle Ford, and Bakken regions, and internationally in Colombia. We provide a comprehensive service offering which includes the drilling rig, crews, supplies, and most of the ancillary equipment needed to operate our drilling rigs. Our fleet is 100% pad-capable and offers the latest advancements in pad drilling. The following table summarizes our current rig fleet count and composition for each drilling services business segment:
| Multi-well, Pad-capable | |||||||||||||||||
| AC rigs | SCR rigs | Total | |||||||||||||||
| Domestic drilling | 17 | 0 | 17 | ||||||||||||||
| International drilling | 0 | 8 | 8 | ||||||||||||||
| 25 | |||||||||||||||||
| Multi-well, Pad-capable | |||||||
| AC rigs | SCR rigs | Total | |||||
| Domestic drilling | 17 | — | 17 | ||||
| International drilling | — | 8 | 8 | ||||
| 25 | |||||||
Our production services business segments provide a range of services to producers primarily in Texas, North Dakota and the Rocky Mountain region, and Louisiana.region. As of June 30, 2020,March 31, 2021, the fleet counts for each of our production services business segments were as follows:
| 550 HP | 600 HP | Total | |||||||||||||||
| Well servicing rigs, by horsepower (HP) rating | 111 | 12 | 123 | ||||||||||||||
| Wireline services units | 72 | ||||||||||||||||
| 550 HP | 600 HP | Total | |||
| Well servicing rigs, by horsepower (HP) rating | 111 | 12 | 123 | ||
| Wireline services units | 82 | ||||
Basis of Presentation
The accompanying unaudited condensed consolidated financial statements include the accounts of Pioneer Energy Services Corp. and our wholly-owned subsidiaries. All intercompany balances and transactions have been eliminated in consolidation. The accompanying unaudited condensed consolidated financial statements have been prepared in accordance with accounting principles generally accepted in the United States of America for interim financial information and with the instructions to Form 10-Q and Rule 10-01 of Regulation S-X. Accordingly, they do not include all of the information and footnotes required by generally accepted accounting principles for complete financial statements. In the opinion of our management, all adjustments (consisting of normal, recurring accruals) necessary for a fair presentation have been included. We suggest that you read these unaudited condensed consolidated financial statements together with the consolidated financial statements and the related notes included in our annual report on Form 10-K for the year ended December 31, 2019. 2020.
As described below, as a result of the application of fresh start accountingin Note 2, Emergence from Voluntary Reorganization under Chapter 11, and the effects of the implementation ofNote 3, Fresh Start Accounting, to our Plan of Reorganization (as defined below), the consolidated financial statements afterincluded in our annual report on Form 10-K for the Effective Date (as defined below) are not comparable with the consolidated financial statementsyear ended December 31, 2020, on or before that date. See Note 3, Fresh Start Accounting, for additional information.
statements after the Effective Date are not comparable with the consolidated financial statements on or before that date as indicated by the “black line” division in the financial statements and footnote tables, which emphasizes the lack of comparability between amounts presented. References to “Successor” relate to our financial position and results of operations after the Effective Date. References to “Predecessor” refer to our financial position and results of operations on or before the Effective Date.
Use of Estimates — In preparing the accompanying unaudited condensed consolidated financial statements, we make various estimates and assumptions that affect the amounts of assets and liabilities we report as of the dates of the balance sheets and
7
income and expenses we report for the periods shown in the income statements and statements of cash flows. Our actual results could differ significantly from those estimates. Material estimates affecting our financial results, including those that are particularly susceptible to significant changes in the near term, relate to our application of fresh start accounting, our estimates of certain variable revenues and amortization periods of certain deferred revenues and costs associated with drilling daywork contracts, our estimates of projected cash flows and fair values for impairment evaluations, our estimate of the valuation allowance for deferred tax assets, and our estimate of the liability relating to the self-insurance portion of our health and workers’ compensation insurance. For information about our use of estimates relating to fresh start accounting, see Note 3, Fresh Start Accounting.
Subsequent Events — In preparing the accompanying unaudited condensed consolidated financial statements, we have reviewed events that have occurred after June 30, 2020,March 31, 2021, through the filing of this Form 10-Q, for inclusion as necessary.
Recently Issued Accounting Standards
Changes to accounting principles generally accepted in the United States of America (“U.S. GAAP”) are established by the FASBFinancial Accounting Standards Board (FASB) in the form of Accounting Standards Updates (ASUs) to the FASB ASC. We consider the applicability and impact of all ASUsASUs. Additionally, because we have securities registered under the Securities and Exchange Act of 1934, we consider the applicability and impact of releases issued by the Securities & Exchange Commission (the “SEC”). Other than those listed below, we have determined that there are currently no new or recently adopted ASUs or SEC releases which we believe will have a material impact on our consolidated financial position and results of operations.
•Convertible Instruments and Contracts in an Entity’s Own Equity. In August 2020, the FASB issued ASU No. 2020-06, Accounting for Convertible Instruments and Contracts in an Entity’s Own Equity, which simplifies the accounting for convertible instruments by reducing the number of accounting models available for convertible debt instruments and preferred stock. Additionally, this ASU improves the consistency of EPS calculations by requiring entities to apply one method, the if-converted method, to all convertible instruments in diluted earnings-per-share calculations. This ASU will be effective for us on January 1, 2022, however, early adoption is permitted on January 1, 2021. We are currently evaluating the effect that the ASU will have on our consolidated financial statements.
•Simplifying the Accounting for Income Taxes. In December 2019, the FASB issued ASU No. 2019-12, Income Taxes (Topic 740): Simplifying the Accounting for Income Taxes, which simplifies the accounting and disclosure requirements for income taxes by, among other changes, removing certain exceptions and by clarifying certain aspects of the current accounting guidance. We adopted this ASU on January 1, 2021, and it did not have a material impact on our condensed consolidated financial statements.
Additional Detail of Account Balances
Restricted Cash — Our restricted cash balance at June 30, 2020 reflects the professional fees escrow balance which will be released in accordance with the Plan. Our restricted cash balance at December 31, 2019balance primarily reflects the portion of net proceeds from the issuance of our senior secured term loan held in a restricted account until the completion of certain administrative tasks related to providing access rights to certain of our real property, a condition which is still in effect under the terms of our post-emergence debt instruments.instruments, as well as $0.5 million and $0.2 million of proceeds from asset sales received at March 31, 2021 and December 31, 2020, respectively, which were used to fund the redemption of Senior Secured Notes tendered in January and April 2021, respectively, as further described in Note 5, Debt.
Other Receivables — Our other receivables primarily consist of recoverable taxes related to our international operations, as well as vendor rebates and net incomerefundable payroll tax receivables.credit receivables associated with the CARES Act.
Prepaid Expenses and Other Current Assets —Prepaid expenses and other current assets include items such as insurance, rent deposits, software subscriptions, and other fees. We routinely expense these items in the normal course of business over the periods that we benefit from these expenses. Prepaid expenses and other current assets also include deferred mobilization costs for short-term drilling contracts and demobilization revenues recognized on drilling contracts expiring in the near term.
Other Noncurrent Assets— Other noncurrent assets primarily consist of prepaid taxes in Colombia which are creditable against future income taxes, as well asbut also includes the noncurrent portion of prepaid insurance premiums, unamortized debt issuance costs associated with our ABL Credit Facility, deferred mobilization costs on long-term drilling contracts, cash deposits related to the deductibles on our workers’ compensation insurance policies, the noncurrent portion of prepaid insurance premiums, unamortized debt issuance costs associated with our ABL Credit Facility and deferred compensation plan investments.
8
Other Accrued Expenses — Our other accrued expenses include accruals for professional fees, including those associated with fresh start accounting, and items such as sales taxes, property taxes and withholding tax liabilities related to our international operations.operations and accruals for professional fees. We routinely expense these items in the normal course of business over the periods these expenses benefit. Our other accrued expenses also includes the current portion of the lease liability associated with our long-term operating leases.
Other Noncurrent Liabilities — Our other noncurrent liabilities primarily relate to the noncurrent portion of payroll taxes deferred compensation andin connection with the CARES Act, as well as the noncurrent portion of deferred mobilization revenues.
2. Emergence from Voluntary Reorganization under Chapter 11
| Successor | Predecessor | |||||||||||
| One Month Ended June 30, 2020 | Two Months Ended May 31, 2020 | Five Months Ended May 31, 2020 | ||||||||||
| Gain on settlement of liabilities subject to compromise | $ | — | $ | (291,378 | ) | $ | (291,378 | ) | ||||
| Fresh start valuation adjustments | — | 284,392 | 284,392 | |||||||||
| Legal and professional fees | 741 | 19,888 | 26,038 | |||||||||
| Unamortized debt costs on liabilities subject to compromise | — | 2,003 | 2,003 | |||||||||
| Accelerated stock-based compensation | — | 713 | 713 | |||||||||
| Loss (gain) on rejected leases | 403 | (378 | ) | (378 | ) | |||||||
| DIP facility costs | — | — | 513 | |||||||||
| $ | 1,144 | $ | 15,240 | $ | 21,903 | |||||||
| Enterprise value | $ | 276,000 | |
| Plus: cash and cash equivalents | 10,592 | ||
| Less: fair value of debt | (145,420 | ) | |
| Total implied equity (prior to debt issuance costs on equity component on Convertible Notes) | 141,172 | ||
| Less: equity portion of Convertible Notes | (123,088 | ) | |
| Fair value of Successor stockholders’ equity | $ | 18,084 | |
| Shares issued upon emergence | 1,049,804 | ||
| Per share value | $ | 17.23 | |
| Enterprise value | $ | 276,000 | |
| Plus: cash and cash equivalents | 10,592 | ||
| Plus: current liabilities | 65,799 | ||
| Plus: non-current liabilities excluding long-term debt | 6,626 | ||
| Less: debt issuance costs on Successor debt | (6,394 | ) | |
| Reorganization value of Successor assets | $ | 352,623 | |
| As of May 31, 2020 | |||||||||||||||||
| (in thousands) | Predecessor | Reorganization Adjustments | Fresh Start Accounting Adjustments | Successor | |||||||||||||
| ASSETS | |||||||||||||||||
| Cash and cash equivalents | $ | 21,253 | $ | (10,661 | ) | (1) | $ | — | $ | 10,592 | |||||||
| Restricted cash | 4,452 | 11,721 | (2) | — | 16,173 | ||||||||||||
| Receivables: | |||||||||||||||||
| Trade, net of allowance for doubtful accounts | 33,537 | — | — | 33,537 | |||||||||||||
| Unbilled receivables | 9,163 | — | — | 9,163 | |||||||||||||
| Insurance recoveries | 23,636 | — | — | 23,636 | |||||||||||||
| Other receivables | 5,256 | 1,000 | (3) | — | 6,256 | ||||||||||||
| Inventory | 21,012 | — | (6,883 | ) | (18) | 14,129 | |||||||||||
| Assets held for sale | 1,825 | — | 29 | (19) | 1,854 | ||||||||||||
| Prepaid expenses and other current assets | 4,817 | — | 952 | (20) | 5,769 | ||||||||||||
| Total current assets | 124,951 | 2,060 | (5,902 | ) | 121,109 | ||||||||||||
| Property and equipment, at cost | 1,082,704 | — | (886,733 | ) | (21) | 195,971 | |||||||||||
| Less accumulated depreciation | 655,512 | — | (655,512 | ) | (21) | — | |||||||||||
| Net property and equipment | 427,192 | — | (231,221 | ) | 195,971 | ||||||||||||
| Intangible assets, net of accumulated amortization | — | — | 9,370 | (22) | 9,370 | ||||||||||||
| Deferred income taxes | 10,897 | — | (2,157 | ) | (23) | 8,740 | |||||||||||
| Operating lease assets | 5,234 | — | — | 5,234 | |||||||||||||
| Other noncurrent assets | 13,247 | (5,023 | ) | (4) | 3,975 | (24) | 12,199 | ||||||||||
| Total assets | $ | 581,521 | $ | (2,963 | ) | $ | (225,935 | ) | $ | 352,623 | |||||||
| LIABILITIES AND STOCKHOLDERS’ EQUITY | |||||||||||||||||
| Accounts payable | $ | 24,601 | $ | (9,478 | ) | (5) | $ | — | $ | 15,123 | |||||||
| Deferred revenues | 121 | — | — | 121 | |||||||||||||
| Commitment premium | 9,584 | (9,584 | ) | (6) | — | — | |||||||||||
| Debtor in possession financing | 4,000 | (4,000 | ) | (7) | — | — | |||||||||||
| Accrued expenses: | |||||||||||||||||
| Employee compensation and related costs | 4,970 | — | — | 4,970 | |||||||||||||
| Insurance claims and settlements | 23,517 | — | — | 23,517 | |||||||||||||
| Insurance premiums and deductibles | 5,269 | — | — | 5,269 | |||||||||||||
| Interest | 3,775 | (3,731 | ) | (8) | — | 44 | |||||||||||
| Other | 12,436 | 4,329 | (9) | (10 | ) | 16,755 | |||||||||||
| Total current liabilities | 88,273 | (22,464 | ) | (10 | ) | 65,799 | |||||||||||
| Long-term debt, less unamortized discount and debt issuance costs | 175,000 | (53,831 | ) | (10) | 20,070 | (25) | 141,239 | ||||||||||
| Noncurrent operating lease liabilities | 4,189 | — | — | 4,189 | |||||||||||||
| Deferred income taxes | 4,296 | — | (3,225 | ) | (26) | 1,071 | |||||||||||
| Other noncurrent liabilities | 1,366 | — | — | 1,366 | |||||||||||||
| Total liabilities not subject to compromise | 273,124 | (76,295 | ) | 16,835 | 213,664 | ||||||||||||
| Liabilities subject to compromise | 308,422 | (308,422 | ) | (11) | — | — | |||||||||||
| Stockholders’ equity: | |||||||||||||||||
| Predecessor common stock | 8,893 | (8,893 | ) | (12) | — | — | |||||||||||
| Successor common stock | — | 1 | (13) | — | 1 | ||||||||||||
| Predecessor additional paid-in capital | 553,631 | (553,631 | ) | (14) | — | — | |||||||||||
| Successor additional paid-in capital | — | 98,413 | (15) | 40,545 | (27) | 138,958 | |||||||||||
| Predecessor treasury stock, at cost | (5,098 | ) | 5,098 | (16) | — | — | |||||||||||
| Retained earnings (Accumulated deficit) | (557,451 | ) | 840,766 | (17) | (283,315 | ) | (28) | — | |||||||||
| Total stockholders’ equity | (25 | ) | 381,754 | (242,770 | ) | 138,959 | |||||||||||
| Total liabilities and stockholders’ equity | $ | 581,521 | $ | (2,963 | ) | $ | (225,935 | ) | $ | 352,623 | |||||||
| Cash proceeds from Convertible Notes | $ | 120,187 | |
| Cash proceeds from Senior Secured Notes | 75,000 | ||
| Payment to fund claims reserve | (950 | ) | |
| Payment to escrow remaining professional fees | (10,771 | ) | |
| Payment of professional fees | (9,468 | ) | |
| Payment in full to extinguish DIP Facility | (4,000 | ) | |
| Payment of accrued interest on DIP Facility | (55 | ) | |
| Payment of DIP Facility fees | (177 | ) | |
| Payment in full to extinguish Prepetition Term Loan | (175,000 | ) | |
| Payment of accrued interest on Prepetition Term Loan | (3,677 | ) | |
| Payment of prepayment penalty on Prepetition Term Loan | (1,750 | ) | |
| $ | (10,661 | ) | |
| Payment to fund rejected leases claims reserve | $ | 950 | |
| Payment to escrow remaining professional fees | 10,771 | ||
| $ | 11,721 | ||
| Payment in full to extinguish Prepetition Term Loan | $ | (175,000 | ) |
| Issuance of Senior Secured Notes at Par | 78,125 | ||
| Recognition of debt issue costs on Senior Secured Notes | (2,913 | ) | |
| Recognition of liability component of Convertible Notes issuance | 47,225 | ||
| Recognition of debt issuance costs on liability component of Convertible Notes | (1,268 | ) | |
| $ | (53,831 | ) | |
| Prepetition Senior Notes | $ | 300,000 | |
| Accrued interest on Prepetition Senior Notes | 8,422 | ||
| Liabilities subject to compromise | 308,422 | ||
| Cash paid by holders of Prepetition Senior Notes | 118,013 | ||
| Issuance of equity to Prepetition Senior Notes creditors | (17,044 | ) | |
| Notes Received by Prepetition Senior Note holders | (118,013 | ) | |
| $ | 291,378 | ||
| Recognition of equity component of Convertible Notes | $ | 82,546 | |
| Issuance of Successor common stock to Prepetition Senior Notes creditors and prior equity holders | 18,083 | ||
| Recognition of debt issuance costs of Convertible Notes equity component | (2,216 | ) | |
| $ | 98,413 | ||
Predecessor Historical Value | Fair Value Adjustment | Successor Fair Value | |||||||
| Drilling rigs and equipment | $ | 1,010,612 | $ | (832,294 | ) | $ | 178,318 | ||
| Vehicles | 41,283 | (28,561 | ) | 12,722 | |||||
| Building and improvements | 16,619 | (13,742 | ) | 2,877 | |||||
| Office equipment | 12,231 | (11,743 | ) | 488 | |||||
| Land | 1,959 | (393 | ) | 1,566 | |||||
| $ | 1,082,704 | $ | (886,733 | ) | $ | 195,971 | |||
| Less: Accumulated Depreciation | (655,512 | ) | 655,512 | — | |||||
| $ | 427,192 | $ | (231,221 | ) | $ | 195,971 | |||
| Fair value adjustment to the liability component of the Convertible Notes | $ | 23,195 | |
| Discount on Senior Secured Notes | (3,125 | ) | |
| $ | 20,070 | ||
Our production services business segments earn revenues for well servicing and wireline services pursuant to master services agreements based on purchase orders or other contractual arrangements with the client. Production services jobs are generally short-term (ranging in duration from several hours to less than 30 days) and are charged at current market rates for the labor, equipment and materials necessary to complete the job. Production services jobs are varied in nature but typically represent a single performance obligation, either for a particular job, a series of distinct jobs, or a period of time during which we stand ready to provide services as our client needs them. Revenue is recognized for these services over time, as the services are performed.
Our drilling services business segments earn revenues by drilling oil and gas wells for our clients under daywork contracts. Daywork contracts are comprehensive agreements under which we provide a comprehensive service offering, including the drilling rig, crew, supplies, and most of the ancillary equipment necessary to operate the rig. Contract modifications that extend the term of a dayrate contract are generally accounted for prospectively as a separate dayrate contract. We account for our services provided under daywork contracts as a single performance obligation comprised of a series of distinct time increments which are satisfied over time. Accordingly, dayrate revenues are recognized in the period during which the services are performed.
With most drilling contracts, we also receive payments contractually designated for the mobilization and demobilization of drilling rigs and other equipment to and from the client’s drill site. Revenues associated with the mobilization and demobilization of our drilling rigs to and from the client’s drill site do not relate to a distinct good or service and are recognized ratably over the related contract term.
The amount of demobilization revenue that we ultimately collect is dependent upon the specific contractual terms, most of which include provisions for reduced (or no) payment for demobilization when, among other things, the contract is renewed or extended with the same client, or when the rig is subsequently contracted with another client prior to the termination of the current contract. Since revenues associated with demobilization activity are typically variable, at each period end, they are estimated at the most likely amount, and constrained when the likelihood of a significant reversal is probable. Any change in the expected amount of demobilization revenue is accounted for with the net cumulative impact of the change in estimate recognized in the period during which the revenue estimate is revised.
The upfront costs that we incur to mobilize the drilling rig to our client’s initial drilling site are capitalized and recognized ratably over the term of the related contract, including any contracted renewal or extension periods, which is our estimate of the period during which we expect to benefit from the cost of mobilizing the rig. Costs associated with the final demobilization at the end of the contract term are expensed when incurred, when the demobilization activity is performed.
From time to time, we may receive fees from our clients for capital improvements to our rigs to meet our client’s requirements. Such revenues are not considered to be distinct within the terms of the contract and are therefore allocated to the overall performance obligation, satisfied over the term of the contract. We record deferred revenue for such payments and recognize them ratably as revenue over the initial term of the related drilling contract.
Contract Asset and Liability Balances and Contract Cost Assets
Contract asset and contract liability balances relate to demobilization and mobilization revenues, respectively. Demobilization revenue that we expect to receive is recognized ratably over the related contract term, but invoiced upon completion of the demobilization activity. Mobilization revenue, which is typically collected upon the completion of the initial mobilization activity, is deferred and recognized ratably over the related contract term. Contract asset and liability balances are netted at the contract level, with the net current and noncurrent portions separately classified in our condensed consolidated balance sheets, and the resulting contract liabilities are referred to herein as “deferred revenues.” When demobilization revenues are recognized prior to the activity being performed, they are not yet billable, and the resulting contract assets are included in our other current assets in our unaudited condensed consolidated financial statements.
9
Contract cost assets represent the costs associated with the initial mobilization required in order to fulfill the contract, which are deferred and recognized ratably over the period during which we expect to benefit from the mobilization, or the period during which we expect to satisfy the performance obligations of the related contract. Contract cost assets are presented as either current or noncurrent, according to the duration of the original contract to which it relates, and referred to herein as “deferred costs.”
Our current and noncurrent deferred revenues, contract assets and deferred costs as of June 30, 2020March 31, 2021 and December 31, 20192020 were as follows (amounts in thousands):
| March 31, 2021 | December 31, 2020 | ||||||||||
| Current deferred revenues | $ | 824 | $ | 1,019 | |||||||
| Current deferred costs | 47 | 361 | |||||||||
| Current contract assets | 0 | 300 | |||||||||
| Noncurrent deferred costs | 291 | 194 | |||||||||
| Successor | Predecessor | |||||||
| June 30, 2020 | December 31, 2019 | |||||||
| Current deferred revenues | $ | 642 | $ | 1,339 | ||||
| Current deferred costs | 201 | 1,071 | ||||||
| Noncurrent deferred revenues | $ | — | $ | 57 | ||||
| Noncurrent deferred costs | 30 | 267 | ||||||
The changes in contract balances and contract assets during 20202021 are primarily related to the amortization of deferred revenues and costs and the impact of demobilization performed in January for which the revenue was earned over the contract period in 2020. These decreases were partially offset by increases related to two2 rigs deployed under new contracts in 2020. Amortization2021. Amortization of deferred revenues and costs were as follows (amounts in thousands):
| Successor | Predecessor | |||||||||||||||||||||||||||||||||||||
| Three Months Ended March 31, 2021 | Three Months Ended March 31, 2020 | |||||||||||||||||||||||||||||||||||||
| Amortization of deferred revenues | $ | 528 | $ | 1,613 | ||||||||||||||||||||||||||||||||||
| Amortization of deferred costs | 381 | 1,263 | ||||||||||||||||||||||||||||||||||||
| Successor | Predecessor | |||||||||||
| One Month Ended June 30, 2020 | Five Months Ended May 31, 2020 | Six Months Ended June 30, 2019 | ||||||||||
| Amortization of deferred revenues | $ | 46 | $ | 2,705 | $ | 2,235 | ||||||
| Amortization of deferred costs | 39 | 1,876 | 2,096 | |||||||||
Assets Held for Sale — In April 2020, we closed our coiled tubing services business and placed all $5.4 million of our coiled tubing services assets as held for sale at June 30, 2020.2020, which represents $2.4 million of our total assets held for sale at March 31, 2021. We have various other equipment designated as held for sale which is carried at fair value. When the net carryingcarrying value of an asset designated as held for sale exceeds its estimated fair value, which we estimate based on expected sales prices, which are classified as Level 3 inputs as defined by ASC Topic 820, Fair Value Measurements and Disclosures, we recognize the difference as an impairment charge.
Impairments — In accordance with ASC Topic 360, Property, Plant and Equipment, we monitor all indicators of potential impairments. We evaluate for potential impairment of long-lived assets when indicators of impairment are present, which may include, among other things, significant adverse changes in industry trends (including revenue rates, utilization rates, oil and natural gas market prices, and industry rig counts). In performing an impairment evaluation, we estimate the future undiscounted net cash flows from the use and eventual disposition of the assets grouped at the lowest level that independent cash flows can be identified. We perform an impairment evaluation and estimate future undiscounted cash flows for each of our asset groups separately, which are our domestic drilling services, international drilling services, well servicing and wireline services segments, and, prior to being placed as held for sale, our coiled tubing services segment. If the sum of the estimated future undiscounted net cash flows is less than the carrying amount of the asset group, then we determine the fair value of the asset group, and the amount of an impairment charge would be measured as the difference between the carrying amount and the fair value of the assets.
Due to the significant decline in industry conditions, commodity prices, and projected utilization of equipment, as well as the COVID-19 pandemic’s impact on our industry, our projected cash flows declined during the first quarter of 2020, and we performed recoverability testing on all our reporting units. As a result of this analysis, we incurred impairment charges of $16.4 million to reduce the carrying values of our coiled tubing assets to their estimated fair values during the three months ended March 31, 2020. For all our other reporting units, excluding coiled tubing, we determined that the sum of the estimated future undiscounted net cash flows were in excess of the carrying amounts and that no impairment existed for these reporting units at March 31, 2020. We continuedcontinue to monitor potential indicators of impairment through June 30, 2020 and concluded that none of our reporting units are currently at risk of impairment.
impairment at March 31, 2021.
10
The assumptions we use in the evaluation for impairment are inherently uncertain and require management judgment. Although we believe the assumptions and estimates used in our impairment analysis are reasonable, different assumptions and estimates could materially impact the analysis and resulting conclusions. The most significant inputs used in our impairment analysis include the projected utilization and pricing of our services, as well as the estimated proceeds upon any future sale or disposal of the assets, all of which are classified as Level 3 inputs as defined by ASC Topic 820, Fair Value Measurements and Disclosures. If commodity prices decrease or remain at current levels for an extended period of time, or if the demand for any of our services decreases below what we are currently projecting, our estimated cash flows may decrease and our estimates of the fair value of certain assets may decrease as well. If any of the foregoing were to occur, we could incur impairment charges on the related assets.
As a drilling and production services provider, we provide the drilling rigs and production services equipment which are necessary to fulfill our performance obligations and which are considered leases under ASU No. 2016-02, Leases, (together with its amendments, herein referred to as “ASC Topic 842”). However, ASU No. 2018-11, Leases: Targeted Improvements, allows lessors to (i) combine the lease and non-lease components of revenues when the revenue recognition pattern is the same and when the lease component, when accounted for separately, would be considered an operating lease, and (ii) account for the combined lease and non-lease components under ASC Topic 606, Revenue from Contracts with Customers, when the non-lease component is the predominant element of the combined component. We elected to apply this expedient and therefore recognize our revenues (both lease and service components) under ASC Topic 606, and present them as one revenue stream in our unaudited condensed consolidated statements of operations.
As a lessee, we lease our corporate office headquarters in San Antonio, Texas, and we conduct our business operations through 1614 other regional offices located throughout the United States and internationally in Colombia. These operating locations typically include regional offices, storage and maintenance yards and employee housing sufficient to support our operations in the area. We lease most of these properties under non-cancelable term and month-to-month operating leases, many of which contain renewal options that can extend the lease term from six monthsone year to five years and some of which contain escalation clauses. We also lease various items of supplemental equipment, typically under cancelable short-term and very short term (less than 30 days) leases. Due to the nature of our business, any option to renew these short-term leases, and the options to extend certain of our long-term real estate leases, are generally not considered reasonably certain to be exercised. Therefore, the periods covered by such optional periods are not included in the determination of the term of the lease, and the lease payments during these periods are similarly excluded from the calculation of operating lease asset and lease liability balances.
The following table summarizes our lease expense recognized, excluding variable lease costs (amounts in thousands):
| Successor | Predecessor | |||||||||||
| One Month Ended June 30, 2020 | Five Months Ended May 31, 2020 | Six Months Ended June 30, 2019 | ||||||||||
| Long-term operating lease expense | $ | 151 | $ | 1,080 | $ | 1,671 | ||||||
| Short-term operating lease expense | 456 | 4,456 | 7,736 | |||||||||
| Successor | Predecessor | ||||||||||||||||||||||||||||||||||||||||
| Three Months Ended March 31, 2021 | Three Months Ended March 31, 2020 | ||||||||||||||||||||||||||||||||||||||||
| Long-term operating lease expense | $ | 315 | $ | 662 | |||||||||||||||||||||||||||||||||||||
| Short-term operating lease expense | 2,001 | 3,526 | |||||||||||||||||||||||||||||||||||||||
The following table summarizes the amount and timing of our obligations associated with our long-term operating leases (amounts in thousands):
| March 31, 2021 | December 31, 2020 | ||||||||||
| Within 1 year | $ | 1,120 | $ | 1,069 | |||||||
| In the second year | 1,000 | 985 | |||||||||
| In the third year | 886 | 921 | |||||||||
| In the fourth year | 880 | 874 | |||||||||
| In the fifth year | 740 | 895 | |||||||||
| Thereafter | 229 | 299 | |||||||||
| Total undiscounted lease obligations | $ | 4,855 | $ | 5,043 | |||||||
| Impact of discounting | (486) | (532) | |||||||||
| Discounted value of operating lease obligations | $ | 4,369 | $ | 4,511 | |||||||
| Current operating lease liabilities | $ | 947 | $ | 889 | |||||||
| Noncurrent operating lease liabilities | 3,422 | 3,622 | |||||||||
| $ | 4,369 | $ | 4,511 | ||||||||
11
| Successor | Predecessor | |||||||
| June 30, 2020 | December 31, 2019 | |||||||
| Within 1 year | $ | 1,199 | $ | 2,496 | ||||
| In the second year | 1,004 | 1,933 | ||||||
| In the third year | 992 | 1,447 | ||||||
| In the fourth year | 864 | 1,117 | ||||||
| In the fifth year | 885 | 912 | ||||||
| Thereafter | 746 | 811 | ||||||
| Total undiscounted lease obligations | $ | 5,690 | $ | 8,716 | ||||
| Impact of discounting | (638 | ) | (818 | ) | ||||
| Discounted value of operating lease obligations | $ | 5,052 | $ | 7,898 | ||||
| Current operating lease liabilities | $ | 998 | $ | 2,198 | ||||
| Noncurrent operating lease liabilities | 4,098 | 5,700 | ||||||
| $ | 5,096 | $ | 7,898 | |||||
5. Debt
The commencementprincipal amount of the Chapter 11 Cases constituted an event of default that accelerated our obligations under our Prepetition Senior Notes, the Prepetition ABL Facility, and Term Loan. Under the Bankruptcy Code, holders of our Prepetition Senior Notes and the lenders under our Term Loan and the Prepetition ABL Facility were stayed from taking any action against us as a result of this event of default.
| March 31, 2021 | December 31, 2020 | ||||||||||
| Convertible Notes | $ | 132,763 | $ | 132,763 | |||||||
| Senior Secured Notes | 77,226 | 77,439 | |||||||||
| Successor | |||
| June 30, 2020 | |||
| Convertible Notes | $ | 129,771 | |
| Senior Secured Notes | 78,125 | ||
ABL Credit Facility
On the Effective Date, pursuant to the terms of the Plan, we entered into a senior secured asset-based revolving credit agreement in an aggregate amount of $75 million (the “ABL“ABL Credit Facility”Facility”) among us and substantially all of our domestic subsidiaries as borrowers (the “Borrowers”), the lenders party thereto and PNC Bank, National Association as administrative agent, and on August 7, 2020, we entered into a First Amendment to the ABL Credit Facility (together, herein referred to as the “ABL Credit Facility”) which, among other things, reduced the maximum amount of the revolving credit agreement to $40 million.
Among other things, proceeds of loans under the ABL Credit Facility may be used to pay fees and expenses associated with the ABL Credit Facility and finance ongoing working capital and general corporate needs.
The maturity date of loans made under the ABL Credit Facility is the earliest of 90 days prior to maturity of the Senior Secured Notes or the Convertible Notes (both of which are described further below) and May 29, 2025. Borrowings under the ABL Credit Facility will bear interest at a rate of (i) the LIBOR rate (subject to a floor of 0%) plus an applicable margin of 375 basis points per annum or (ii) the base rate plus an applicable margin of 275 basis points per annum.
The ABL Credit Facility is guaranteed by the Borrowers and is secured by a first lien on the Borrowers’ accounts receivable and inventory, and the cash proceeds thereof, and a second lien on substantially all of the other assets and properties of the Borrowers.
The ABL Credit Facility limits our annual capital expenditures to 125% of the budget set forth in the projections for any fiscal year and provides that if our availability plus pledged cash of up to $3 million falls below $6 million (15% of the maximum revolver amount), we will be required to comply with a fixed charge coverage ratio of 1.0 to 1.0, all of which is defined in the ABL Credit Facility.Facility. As of June 30, 2020,March 31, 2021, we had no0 borrowings and approximately $7.1$7.3 million in outstanding letters of credit under the ABL Credit Facility and subject to the availability requirements in the ABL Credit Facility, based on eligible accounts receivable and inventory balances at June 30, 2020,March 31, 2021, availability under the ABL Credit Facility was $13.2$16.3 million, which our access to would be limited bysubject to (i) our requirement to maintain 15% available or comply with a fixed charge coverage ratio, as described above and (ii) the requirement to maintain availability of at least $4$4.0 million, which may include up to $2$2.0 million of pledged cash.
Convertible Notes
We entered into an indenture, dated as of the Effective Date, among the Company and Wilmington Trust, N.A., as trustee (the “Convertible Notes Indenture”), and issued $129.8 million aggregate principal amount of convertible senior unsecured
pay-in-kind notes due 2025 thereunder (the “Convertible Notes”). We received net issuance proceeds of $120.2 million, which was net of the $9.6 million Backstop Commitment Premium.Premium, which is described further below.
The Convertible Notes are general unsecured obligations which will mature on November 15, 2025, unless earlier accelerated, redeemed, converted or repurchased, and bear interest at a fixed rate of 5% per annum, which will be payable semi-annually on May 15 and November 15 in-kind in the form of an increase to the principal amount. The Convertible Notes are convertible at the option of the holders at any time into shares of our common stock and will convert mandatorily into our common stock at maturity; provided, however, that if the value of our common stock otherwise deliverable in connection with a mandatory conversion of a Convertible Note on the maturity date would be less than the principal amount of such Convertible Note plus accrued and unpaid interest, then the Convertible Note will instead convert into an amount of cash equal to the principal amount thereof plus accrued and unpaid interest. The initial conversion rate is 75 shares of common stock per $1,000 principal amount of the Convertible Notes, which in aggregate represents 9,732,825 shares of
12
common stock and an initial conversion price of $13.33 per share. The conversion rate is subject to customary anti-dilution adjustments.
If we undergo a “fundamental change” as defined in the Convertible Notes Indenture, subject to certain conditions, holders may require us to repurchase all or any portion of their Convertible Notes for cash at an amount equal to 100% of the principal amount of the Convertible Notes to be repurchased plus any accrued and unpaid interest. In the case of certain fundamental change events that constitute merger events (as defined in the Convertible Notes Indenture), we have a superseding right to cause the mandatory conversion of all or part of the Convertible Notes into a number of shares of common stock, per $1,000 principal amount of Convertible Notes, equal to the then-current conversion rate or the cash value of such number of shares of common stock (but not less than the principal amount).stock.
Holders of Convertible Notes are entitled to vote on all matters on which holders of our common stock generally are entitled to vote (or, if any, to take action by written consent of the holders of our common stock), voting together as a single class together with the shares of our common stock and not as a separate class, on an as-converted basis, at any annual or special meeting of holders of our common stock and each holder is entitled to such number of votes as such holder would receive on an as-converted basis on the record date for such vote.
The Convertible Notes Indenture contains customary events of default and covenants that limit our ability and the ability of certain of our subsidiaries to incur, assume or guarantee additional indebtedness and create liens and enter into mergers or consolidations.
Because the Convertible Notes contain an embedded conversion option whereby they, or a portion of them, may be settled in cash, we have separately accounted for the liability and equity components of the Convertible Notes in accordance with the accounting requirements for convertible debt instruments set forth in ASC Topic 470-20, Debt with Conversion and Other Options. The initial fair value of the Convertible Notes was estimated and allocated, along with related debt issuance costs, to the liability and equity components in accordance with the application of Fresh Start Accounting as described further in Note 3, Fresh Start Accounting. In order to allocateand the initial fair value, we first calculatedrequirements of ASC Topic 470. We treat the valueissuance of the liability component by estimating the fair valuenew Convertible Notes for the debtpayment of in-kind interest as an issuance of a new instrument that retains the original economics associated with the conversion option at inception, and therefore, the Convertible Notes issued in payment of in-kind interest are accounted for with their separate equity and liability components that are proportionally the same as the original issuance.
Backstop Commitment Agreement
Prior to filing the Plan, we entered into a separate backstop commitment agreement with some of our previous creditors as well as certain members of our senior management (the “Backstop Commitment Agreement”), pursuant to which these parties committed to backstop the issuance of new Convertible Notes upon our emergence from Chapter 11. As consideration for this commitment, we committed to make an aggregate payment of $9.6 million in the form of additional new convertible bonds, or in cash if it did not containthe Backstop Commitment Agreement was terminated under certain circumstances as forth therein. As a conversion feature.result, we incurred a liability and expense at the time we entered into the Backstop Commitment Agreement for the aggregate amount of $9.6 million (the “Commitment Premium”) which was recognized in our Predecessor condensed consolidated financial statements as of and for the three months ended March 31, 2020. The amount by whichCommitment Premium was settled in conjunction with our emergence from Chapter 11 and the initial fair valueissuance of the Convertible Notes exceeded the estimated fair value of the liability component represented the estimated fair value of the equity component. We also allocated the debt issuance costs incurred to the liability and equity components, for which the portion attributable to the equity component is netted with the respective equity component in additional paid-in capital.
| Successor | |||||||||
| Liability Component | Equity Component | Total | |||||||
| Issuance proceeds, net of Backstop Commitment Premium | $ | 43,738 | $ | 76,449 | $ | 120,187 | |||
| Face value | 47,225 | 82,546 | 129,771 | ||||||
| Issuance discount | 23,195 | 40,542 | 63,737 | ||||||
| Fair value | $ | 70,420 | $ | 123,088 | $ | 193,508 | |||
| Debt issuance costs | (1,268 | ) | (2,216 | ) | (3,484 | ) | |||
| Net carrying value at Fresh Start Reporting Date | $ | 69,152 | $ | 120,872 | $ | 190,024 | |||
Notes.
Senior Secured Notes
We entered into an indenture, dated as of the Effective Date, among the Company, the subsidiary guarantors party thereto and Wilmington Trust, N.A., as trustee, as supplemented by the First Supplemental Indenture, dated March 4, 2021 (the “Senior Secured Notes Indenture”), and issued $78.1 million aggregate principal amount of floating rate senior secured notes due 2025 (the “Senior Secured Notes”) thereunder. The Senior Secured Notes are guaranteed on a senior secured basis by substantially all of our existing domestic subsidiaries, thatwhich also guarantee our obligations under the ABL Credit Facility, (the “Guarantors”) on a full and unconditional basis and are secured by a second lien on the accounts receivable and inventory and a first lien on substantially all of the other assets and properties (including the cash proceeds thereof) of the Company and the Guarantors. We received net issuance proceeds of $75 million, which was net of the original issue discount of $3.1 million.
The Senior Secured Notes will mature on May 15, 2025 and interest will accrue at the rate of LIBOR plus 9.5% per annum, with a LIBOR rate floor of 1.5%, payable quarterly in arrears on February 15, May 15, August 15 and November 15 of each year, commencing on August 15, 2020.2020. With respect to any interest payment due on or prior to May 29, 2021, 50% of the
13
interest will be payable in cash and 50% of the interest will be paid in-kind in the form of an increase to the principal amount; however, a majority in interest of the holders of the Senior Secured Notes may elect to have 100% of the interest due on or prior to May 29, 2021 payable in-kind. For all interest periods commencing on or after May 15, 2024, the interest rate for the Senior Secured Notes will be a rate equal to LIBOR plus 10.5%10.50%, with a LIBOR rate floor of 1.5%.
We may redeem all or part of the Senior Secured Notes on or after June 1, 2021 at redemption prices (expressed as percentages of the principal amount) equal to (i) 104% for the twelve-month period beginning on June 1, 2021; (ii) 102% for the twelve-month period beginning on June 1, 2022; (iii) 101% for the twelve-month period beginning on June 1, 2023 and (iii)(iv) 100% for the twelve-month period beginning June 1, 2024 and at any time thereafter, plus accrued and unpaid interest at the redemption date. Notwithstanding the foregoing, if a change of control (as defined in the Senior Secured Notes Indenture) occurs prior to June 1, 2022, we may elect to purchase all remaining outstanding Senior Secured Notes not tendered to us as described below at a redemption price equal to 103% of the principal amount thereof, plus accrued and unpaid interest, if any, thereon to the applicable redemption date. If a change of control (as defined in the Senior Secured Notes Indenture) occurs, holders of the Senior Secured Notes will have the right to require us to repurchase all or any part of their Senior Secured Notes at a purchase price equal to 101% of the aggregate principal amount of the Senior Secured Notes repurchased, plus accrued and unpaid interest, if any, to the repurchase date.
The Senior Secured Notes Indenture contains a minimum asset coverage ratio of 1.5 to 1.0 as of any June 30 or December 31, beginning December 31, 2020. The Senior Secured Notes Indenture provides for certain customary events of default and contains covenants that limit, among other things, our ability and the ability of certain of our subsidiaries, to incur, assume or guarantee additional indebtedness; pay dividends or distributions on capital stock or redeem or repurchase capital stock; make investments; repay junior debt; sell stock of our subsidiaries; transfer or sell assets; enter into sale and lease back transactions; create liens; enter into transactions with affiliates; and enter into mergers or consolidations.
Having completed aggregate qualifying asset sales in excess of $5 million, in accordance with the Senior Notes Indenture, we commenced and completed offers to purchase $2.6 million in aggregate principal amount of the Senior Secured Notes during the year ended December 31, 2020 at a purchase price equal to 100% of the principal amount, plus accrued and unpaid interest through, but not including, the respective purchase dates. During the three months ended March 31, 2021, we completed additional qualifying asset sales and associated offers to purchase an aggregate $1.3 million in principal amount of the Senior Secured Notes and recognized $0.1 million of loss on extinguishment of debt associated with these repayments.
When we have completed qualifying asset sales before a reporting period end which require us to commence an offer to purchase Senior Secured Notes in the subsequent period, the related amount of Senior Secured Notes is presented as a current liability, and the cash on hand which will fund the purchase is classified as “restricted cash” in our consolidated balance sheet.
Successor Debt Issuance Costs and Discount
Costs incurred in connection with the issuance of our Convertible Notes (which were allocated to the liability component, as described above) and Senior Secured Notes, as well as the issuance discounts, were capitalized and are being amortized using the effective interest method over the term of the related debt instrument. Costs incurred in connection with our ABL Credit Facility were capitalized and are being amortized using the straight-line method over the expected term of the agreement. Our unamortized debt issuance costs and discounts are presented below (amounts in thousands):
| Successor | |||
| June 30, 2020 | |||
| Unamortized discount on Convertible Notes (based on imputed interest rate of 20.9%) | $ | 58,680 | |
| Unamortized discount on Senior Secured Notes (based on imputed interest rate of 13.2%) | 3,083 | ||
| Unamortized debt issuance costs | 4,153 | ||
| Successor | |||||
| March 31, 2021 | |||||
| Unamortized discount on Convertible Notes (based on imputed interest rate of 20.9%) | $ | 54,205 | |||
| Unamortized discount on Senior Secured Notes (based on imputed interest rate of 13.2%) | 2,556 | ||||
| Unamortized debt issuance costs | 3,501 | ||||
6. Taxes
Upon emergence from Voluntary Reorganization under Chapter 11,, in accordance with the Plan, our Prepetition Senior Notes were exchanged for shares of our new common stock. Absent an exception, a debtor recognizes cancellation of debt income (CODI) upon discharge of its outstanding indebtedness for an amount of consideration that is less than its adjusted issue price. The Internal Revenue Code (IRC) provides that a debtor in a Chapter 11 bankruptcy case may exclude CODI from taxable income but must reduce certain of its tax attributes by the amount of CODI realized as a result of the consummation of a plan of reorganization. The amount of CODI realized by a taxpayer is determined based on the fair market value of the consideration received by the creditors in settlement of outstanding indebtedness. As a result of the market value of equity upon emergence from Chapter 11 bankruptcy proceedings, the estimated amount of CODIcancellation of debt income (CODI) for federal income tax purposes is approximately $217$229 million, which will reducereduces the value of our net operating losses by an equal amount. The actual reduction in tax attributes does not occur until the first day of our tax year subsequent to the date of emergence, or January 1, 2021. The reduction of net operating losses is expected to bewas fully offset by a corresponding decrease in valuation allowance.
14
We provide a valuation allowance when it is more likely than not that some portion of our deferred tax assets will not be realized. We evaluated the impact of the reorganization, including the change in control, resulting from our bankruptcy emergence and determined it is more likely than not that we will not fully realize future income tax benefits related to our domestic net deferred tax assets based on the annual limitations discussed above,that impact us, historical results, and expected market conditions known on the date of measurement.
| Successor | Predecessor | |||||||||||||
| March 31, 2021 | December 31, 2020 | |||||||||||||
| Net operating loss carryforward deferred tax asset | $ | 83,277 | $ | 82,901 | ||||||||||
| Valuation allowance | (76,061) | (74,676) | ||||||||||||
7. Fair Value of Financial Instruments
The FASB’s Accounting Standards Codification (ASC) Topic 820, Fair Value Measurements and Disclosures, defines fair value and provides a hierarchalhierarchical framework associated with the level of subjectivity used in measuring assets and liabilities at fair value. Currently, our financial instruments consist primarily of cash and cash equivalents, trade and other receivables, trade payables and long-term debt. The carrying value of cash and cash equivalents, trade and other receivables, and trade payables are considered to be representative of their respective fair values due to the short-term nature of these instruments. As a result of the application of fresh start accounting and subsequent stability in the market for energy bonds, we estimate that the carrying value of our long-term debt approximates fair value.
Basic earnings (loss) per share (EPS) is computed by dividing net income (loss) by the weighted-average number of common shares outstanding during the period.
Diluted EPS is computed based on the sum of the weighted average number of common shares and potentially dilutive common shares outstanding during the period. Potentially dilutive common shares consist of shares issuable from stock-based compensation awards and the Convertible Notes. Potentially dilutive common shares from outstanding stock-based compensation awards are determined using the average share price for each period under the treasury stock method. Potentially dilutive shares from the Convertible Notes are determined using the if-converted method, whereby the Convertible Notes are assumed to be converted and included in the denominator of the EPS calculation and the interest expense, net of tax, recorded in connection with the Convertible Notes is added back to net income (loss).
15
The following presents a reconciliation of the numerators and denominators of the basic and diluted EPS computations (amounts in thousands, except per share data):
| Successor | Predecessor | |||||||||||
| One Month Ended June 30, 2020 | Two Months Ended May 31, 2020 | Three Months Ended June 30, 2019 | ||||||||||
| Numerator: | ||||||||||||
| Net loss (numerator for basic EPS) | $ | (9,817 | ) | $ | (35,121 | ) | $ | (12,944 | ) | |||
| Interest expense on Convertible Notes, net of tax | — | — | — | |||||||||
| Numerator for diluted EPS, if-converted method | (9,817 | ) | (35,121 | ) | (12,944 | ) | ||||||
| Denominator: | ||||||||||||
| Weighted-average shares (denominator for basic EPS) | 1,048 | 79,288 | 78,430 | |||||||||
| Potentially dilutive shares issuable from Convertible Notes, if-converted method | — | — | — | |||||||||
| Potentially dilutive shares issuable from outstanding stock-based compensation awards, treasury stock method | — | — | — | |||||||||
| Denominator for diluted EPS | 1,048 | 79,288 | 78,430 | |||||||||
| Loss per common share - Basic | $ | (9.37 | ) | $ | (0.44 | ) | $ | (0.17 | ) | |||
| Loss per common share - Diluted | $ | (9.37 | ) | $ | (0.44 | ) | $ | (0.17 | ) | |||
| Potentially dilutive securities excluded as anti-dilutive | 9,733 | 4,103 | 4,858 | |||||||||
| Successor | Predecessor | |||||||||||
| One Month Ended June 30, 2020 | Five Months Ended May 31, 2020 | Six Months Ended June 30, 2019 | ||||||||||
| Numerator: | ||||||||||||
| Net loss (numerator for basic EPS) | $ | (9,817 | ) | $ | (104,225 | ) | $ | (28,059 | ) | |||
| Interest expense on Convertible Notes, net of tax | — | — | — | |||||||||
| Numerator for diluted EPS, if-converted method | (9,817 | ) | (104,225 | ) | (28,059 | ) | ||||||
| Denominator: | ||||||||||||
| Weighted-average shares (denominator for basic EPS) | 1,048 | 78,968 | 78,371 | |||||||||
| Potentially dilutive shares issuable from Convertible Notes, if-converted method | — | — | — | |||||||||
| Potentially dilutive shares issuable from outstanding stock-based compensation awards, treasury stock method | — | — | — | |||||||||
| Denominator for diluted EPS | 1,048 | 78,968 | 78,371 | |||||||||
| Loss per common share - Basic | $ | (9.37 | ) | $ | (1.32 | ) | $ | (0.36 | ) | |||
| Loss per common share - Diluted | $ | (9.37 | ) | $ | (1.32 | ) | $ | (0.36 | ) | |||
| Potentially dilutive securities excluded as anti-dilutive | 9,733 | 4,517 | 3,709 | |||||||||
| Successor | Predecessor | ||||||||||||||||||||||||||||||||||||||||||||||
| Three Months Ended March 31, 2021 | Three Months Ended March 31, 2020 | ||||||||||||||||||||||||||||||||||||||||||||||
| Numerator: | |||||||||||||||||||||||||||||||||||||||||||||||
| Net loss (numerator for basic EPS) | $ | (16,942) | $ | (69,104) | |||||||||||||||||||||||||||||||||||||||||||
| Interest expense on Convertible Notes, net of tax | 0 | 0 | |||||||||||||||||||||||||||||||||||||||||||||
| Numerator for diluted EPS, if-converted method | (16,942) | (69,104) | |||||||||||||||||||||||||||||||||||||||||||||
| Denominator: | |||||||||||||||||||||||||||||||||||||||||||||||
| Weighted-average shares (denominator for basic EPS) | 1,138 | 78,753 | |||||||||||||||||||||||||||||||||||||||||||||
| Potentially dilutive shares issuable from Convertible Notes, if-converted method | 0 | 0 | |||||||||||||||||||||||||||||||||||||||||||||
| Potentially dilutive shares issuable from outstanding stock-based compensation awards, treasury stock method | 0 | 0 | |||||||||||||||||||||||||||||||||||||||||||||
| Denominator for diluted EPS | 1,138 | 78,753 | |||||||||||||||||||||||||||||||||||||||||||||
| Loss per common share - Basic | $ | (14.89) | $ | (0.88) | |||||||||||||||||||||||||||||||||||||||||||
| Loss per common share - Diluted | $ | (14.89) | $ | (0.88) | |||||||||||||||||||||||||||||||||||||||||||
| Potentially dilutive securities excluded as anti-dilutive | 9,957 | 4,794 | |||||||||||||||||||||||||||||||||||||||||||||
In July 2020, we issued 90,000April 2021, our Compensation, Nominating and Governance Committee approved the grant of an aggregate 196,417 shares of restricted stock to our former Chief Executive Officer in connection with his resignation.directors and certain employees.
As of June 30, 2020,March 31, 2021, we have four4 operating segments, comprised of two2 drilling services business segments (domestic and international drilling) and two2 production services business segments (well servicing and wireline services), which reflects the basis used by management in making decisions regarding our business for resource allocation and performance assessment, as required by ASC Topic 280, Segment Reporting. In April 2020, we closed our coiled tubing services business and placed all of our coiled tubing services assets as held for sale at June 30, 2020. Historical financial information for our coiled tubing services business, which had previously been presented as a separate operating segment, continues to be presented in the following tables as a component of continuing operations.
Our domestic and international drilling services segments provide contract land drilling services to a diverse group of exploration and production companies through our three3 drilling divisions in the US and internationally in Colombia. We provide a comprehensive service offering which includes the drilling rig, crews, supplies, and most of the ancillary equipment needed to operate our drilling rigs.
Our well servicing and wireline services segments provide a range of production services to producers primarily in Texas, North Dakota and the Rocky Mountain region, and Louisiana.region. Our former coiled tubing services segment also provided various production services primarily in Texas, Wyoming, and surrounding areas.
16
The following tables set forth certain financial information for each of our segments and corporate (amounts in thousands):
| Successor | Predecessor | Successor | Predecessor | ||||||||||||||||||||||||||||||||||||||||||||||||||
| One Month Ended June 30, 2020 | Two Months Ended May 31, 2020 | Three Months Ended June 30, 2019 | Three Months Ended March 31, 2021 | Three Months Ended March 31, 2020 | |||||||||||||||||||||||||||||||||||||||||||||||||
| Revenues: | Revenues: | ||||||||||||||||||||||||||||||||||||||||||||||||||||
| Domestic drilling | $ | 5,866 | $ | 17,450 | $ | 39,652 | Domestic drilling | $ | 22,483 | $ | 35,891 | ||||||||||||||||||||||||||||||||||||||||||
| International drilling | 828 | 1,473 | 25,422 | International drilling | 11,063 | 14,455 | |||||||||||||||||||||||||||||||||||||||||||||||
| Drilling services | 6,694 | 18,923 | 65,074 | Drilling services | 33,546 | 50,346 | |||||||||||||||||||||||||||||||||||||||||||||||
| Well servicing | 3,756 | 6,331 | 29,506 | Well servicing | 14,857 | 25,616 | |||||||||||||||||||||||||||||||||||||||||||||||
| Wireline services | 713 | 2,410 | 47,386 | Wireline services | 10,335 | 33,133 | |||||||||||||||||||||||||||||||||||||||||||||||
| Coiled tubing services | — | 384 | 10,877 | Coiled tubing services | 0 | 5,227 | |||||||||||||||||||||||||||||||||||||||||||||||
| Production services | 4,469 | 9,125 | 87,769 | Production services | 25,192 | 63,976 | |||||||||||||||||||||||||||||||||||||||||||||||
| Consolidated revenues | $ | 11,163 | $ | 28,048 | $ | 152,843 | Consolidated revenues | $ | 58,738 | $ | 114,322 | ||||||||||||||||||||||||||||||||||||||||||
| Operating costs: | Operating costs: | ||||||||||||||||||||||||||||||||||||||||||||||||||||
| Domestic drilling | $ | 3,646 | $ | 9,236 | $ | 24,698 | Domestic drilling | $ | 15,459 | $ | 23,865 | ||||||||||||||||||||||||||||||||||||||||||
| International drilling | 1,063 | 1,538 | 18,555 | International drilling | 8,075 | 12,138 | |||||||||||||||||||||||||||||||||||||||||||||||
| Drilling services | 4,709 | 10,774 | 43,253 | Drilling services | 23,534 | 36,003 | |||||||||||||||||||||||||||||||||||||||||||||||
| Well servicing | 2,810 | 5,926 | 21,038 | Well servicing | 11,888 | 20,951 | |||||||||||||||||||||||||||||||||||||||||||||||
| Wireline services | 1,085 | 3,552 | 41,804 | Wireline services | 9,878 | 28,284 | |||||||||||||||||||||||||||||||||||||||||||||||
| Coiled tubing services | 139 | 1,773 | 9,875 | Coiled tubing services | 26 | 6,784 | |||||||||||||||||||||||||||||||||||||||||||||||
| Production services | 4,034 | 11,251 | 72,717 | Production services | 21,792 | 56,019 | |||||||||||||||||||||||||||||||||||||||||||||||
| Consolidated operating costs | $ | 8,743 | $ | 22,025 | $ | 115,970 | Consolidated operating costs | $ | 45,326 | $ | 92,022 | ||||||||||||||||||||||||||||||||||||||||||
| Gross margin: | Gross margin: | ||||||||||||||||||||||||||||||||||||||||||||||||||||
| Domestic drilling | $ | 2,220 | $ | 8,214 | $ | 14,954 | Domestic drilling | $ | 7,024 | $ | 12,026 | ||||||||||||||||||||||||||||||||||||||||||
| International drilling | (235 | ) | (65 | ) | 6,867 | International drilling | 2,988 | 2,317 | |||||||||||||||||||||||||||||||||||||||||||||
| Drilling services | 1,985 | 8,149 | 21,821 | Drilling services | 10,012 | 14,343 | |||||||||||||||||||||||||||||||||||||||||||||||
| Well servicing | 946 | 405 | 8,468 | Well servicing | 2,969 | 4,665 | |||||||||||||||||||||||||||||||||||||||||||||||
| Wireline services | (372 | ) | (1,142 | ) | 5,582 | Wireline services | 457 | 4,849 | |||||||||||||||||||||||||||||||||||||||||||||
| Coiled tubing services | (139 | ) | (1,389 | ) | 1,002 | Coiled tubing services | (26) | (1,557) | |||||||||||||||||||||||||||||||||||||||||||||
| Production services | 435 | (2,126 | ) | 15,052 | Production services | 3,400 | 7,957 | ||||||||||||||||||||||||||||||||||||||||||||||
| Consolidated gross margin | $ | 2,420 | $ | 6,023 | $ | 36,873 | Consolidated gross margin | $ | 13,412 | $ | 22,300 | ||||||||||||||||||||||||||||||||||||||||||
| Identifiable Assets: | Identifiable Assets: | ||||||||||||||||||||||||||||||||||||||||||||||||||||
Domestic drilling (1) | $ | 150,897 | $ | 158,283 | $ | 365,477 | Domestic drilling (1) | $ | 141,186 | $ | 336,260 | ||||||||||||||||||||||||||||||||||||||||||
International drilling (1) (2) | 47,541 | 49,611 | 47,158 | International drilling (1) (2) | 41,048 | 51,443 | |||||||||||||||||||||||||||||||||||||||||||||||
| Drilling services | 198,438 | 207,894 | 412,635 | Drilling services | 182,234 | 387,703 | |||||||||||||||||||||||||||||||||||||||||||||||
| Well servicing | 47,832 | 49,388 | 121,180 | Well servicing | 41,778 | 107,747 | |||||||||||||||||||||||||||||||||||||||||||||||
| Wireline services | 22,623 | 23,948 | 94,413 | Wireline services | 19,399 | 66,712 | |||||||||||||||||||||||||||||||||||||||||||||||
| Coiled tubing services | 5,941 | 6,336 | 37,292 | Coiled tubing services | 2,357 | 11,373 | |||||||||||||||||||||||||||||||||||||||||||||||
| Production services | 76,396 | 79,672 | 252,885 | Production services | 63,534 | 185,832 | |||||||||||||||||||||||||||||||||||||||||||||||
| Corporate | 68,966 | 65,057 | 58,149 | Corporate | 56,785 | 42,199 | |||||||||||||||||||||||||||||||||||||||||||||||
| Consolidated identifiable assets | $ | 343,800 | $ | 352,623 | $ | 723,669 | |||||||||||||||||||||||||||||||||||||||||||||||
Consolidated identifiable assets (3) | Consolidated identifiable assets (3) | $ | 302,553 | $ | 615,734 | ||||||||||||||||||||||||||||||||||||||||||||||||
| Depreciation and amortization: | Depreciation and amortization: | ||||||||||||||||||||||||||||||||||||||||||||||||||||
| Domestic drilling | Domestic drilling | $ | 6,290 | $ | 10,905 | ||||||||||||||||||||||||||||||||||||||||||||||||
| International drilling | International drilling | 3,148 | 1,301 | ||||||||||||||||||||||||||||||||||||||||||||||||||
| Drilling services | Drilling services | 9,438 | 12,206 | ||||||||||||||||||||||||||||||||||||||||||||||||||
| Well servicing | Well servicing | 2,936 | 4,781 | ||||||||||||||||||||||||||||||||||||||||||||||||||
| Wireline services | Wireline services | 890 | 3,077 | ||||||||||||||||||||||||||||||||||||||||||||||||||
| Coiled tubing services | Coiled tubing services | 0 | 1,693 | ||||||||||||||||||||||||||||||||||||||||||||||||||
| Production services | Production services | 3,826 | 9,551 | ||||||||||||||||||||||||||||||||||||||||||||||||||
| Corporate | Corporate | 101 | 227 | ||||||||||||||||||||||||||||||||||||||||||||||||||
| Consolidated depreciation | Consolidated depreciation | $ | 13,365 | $ | 21,984 | ||||||||||||||||||||||||||||||||||||||||||||||||
17
| Successor | Predecessor | ||||||||||||||||||||||||||||||||||||||||
| Three Months Ended March 31, 2021 | Three Months Ended March 31, 2020 | ||||||||||||||||||||||||||||||||||||||||
| Capital Expenditures: | |||||||||||||||||||||||||||||||||||||||||
| Domestic drilling | $ | 2,385 | $ | 3,241 | |||||||||||||||||||||||||||||||||||||
| International drilling | 565 | 1,167 | |||||||||||||||||||||||||||||||||||||||
| Drilling services | 2,950 | 4,408 | |||||||||||||||||||||||||||||||||||||||
| Well servicing | 335 | 1,717 | |||||||||||||||||||||||||||||||||||||||
| Wireline services | 492 | 1,572 | |||||||||||||||||||||||||||||||||||||||
| Coiled tubing services | 0 | 163 | |||||||||||||||||||||||||||||||||||||||
| Production services | 827 | 3,452 | |||||||||||||||||||||||||||||||||||||||
| Corporate | 37 | 1 | |||||||||||||||||||||||||||||||||||||||
| Consolidated capital expenditures | $ | 3,814 | $ | 7,861 | |||||||||||||||||||||||||||||||||||||
(1) Identifiable assets for our drilling segments include the impact of a $28.5 million and $32.9 million intercompany balance, as of March 31, 2021 and 2020, respectively, between our domestic drilling segment (intercompany receivable) and our international drilling segment (intercompany payable).
| Successor | Predecessor | |||||||||||
| One Month Ended June 30, 2020 | Two Months Ended May 31, 2020 | Three Months Ended June 30, 2019 | ||||||||||
| Depreciation and amortization: | ||||||||||||
| Domestic drilling | $ | 2,012 | $ | 7,153 | $ | 10,888 | ||||||
| International drilling | 1,076 | 843 | 1,373 | |||||||||
| Drilling services | 3,088 | 7,996 | 12,261 | |||||||||
| Well servicing | 1,261 | 3,039 | 4,942 | |||||||||
| Wireline services | 763 | 2,011 | 3,907 | |||||||||
| Coiled tubing services | — | 471 | 1,531 | |||||||||
| Production services | 2,024 | 5,521 | 10,380 | |||||||||
| Corporate | 124 | 146 | 210 | |||||||||
| Consolidated depreciation | $ | 5,236 | $ | 13,663 | $ | 22,851 | ||||||
| Capital Expenditures: | ||||||||||||
| Domestic drilling | $ | 484 | $ | 621 | $ | 3,325 | ||||||
| International drilling | 138 | 106 | 524 | |||||||||
| Drilling services | 622 | 727 | 3,849 | |||||||||
| Well servicing | 30 | 201 | 2,141 | |||||||||
| Wireline services | 60 | 112 | 1,588 | |||||||||
| Coiled tubing services | — | 3 | 1,287 | |||||||||
| Production services | 90 | 316 | 5,016 | |||||||||
| Corporate | — | 20 | 376 | |||||||||
| Consolidated capital expenditures | $ | 712 | $ | 1,063 | $ | 9,241 | ||||||
| Successor | Predecessor | |||||||||||
| One Month Ended June 30, 2020 | Five Months Ended May 31, 2020 | Six Months Ended June 30, 2019 | ||||||||||
| Revenues: | ||||||||||||
| Domestic drilling | $ | 5,866 | $ | 53,341 | $ | 77,661 | ||||||
| International drilling | 828 | 15,928 | 47,065 | |||||||||
| Drilling services | 6,694 | 69,269 | 124,726 | |||||||||
| Well servicing | 3,756 | 31,947 | 55,760 | |||||||||
| Wireline services | 713 | 35,543 | 93,260 | |||||||||
| Coiled tubing services | — | 5,611 | 25,665 | |||||||||
| Production services | 4,469 | 73,101 | 174,685 | |||||||||
| Consolidated revenues | $ | 11,163 | $ | 142,370 | $ | 299,411 | ||||||
| Operating costs: | ||||||||||||
| Domestic drilling | $ | 3,646 | $ | 33,101 | $ | 47,167 | ||||||
| International drilling | 1,063 | 13,676 | 35,040 | |||||||||
| Drilling services | 4,709 | 46,777 | 82,207 | |||||||||
| Well servicing | 2,810 | 26,877 | 39,934 | |||||||||
| Wireline services | 1,085 | 31,836 | 81,151 | |||||||||
| Coiled tubing services | 139 | 8,557 | 21,263 | |||||||||
| Production services | 4,034 | 67,270 | 142,348 | |||||||||
| Consolidated operating costs | $ | 8,743 | $ | 114,047 | $ | 224,555 | ||||||
| Successor | Predecessor | |||||||||||
| One Month Ended June 30, 2020 | Five Months Ended May 31, 2020 | Six Months Ended June 30, 2019 | ||||||||||
| Gross margin: | ||||||||||||
| Domestic drilling | $ | 2,220 | $ | 20,240 | $ | 30,494 | ||||||
| International drilling | (235 | ) | 2,252 | 12,025 | ||||||||
| Drilling services | 1,985 | 22,492 | 42,519 | |||||||||
| Well servicing | 946 | 5,070 | 15,826 | |||||||||
| Wireline services | (372 | ) | 3,707 | 12,109 | ||||||||
| Coiled tubing services | (139 | ) | (2,946 | ) | 4,402 | |||||||
| Production services | 435 | 5,831 | 32,337 | |||||||||
| Consolidated gross margin | $ | 2,420 | $ | 28,323 | $ | 74,856 | ||||||
| Identifiable Assets: | ||||||||||||
Domestic drilling (1) | $ | 150,897 | $ | 158,283 | $ | 365,477 | ||||||
International drilling (1) (2) | 47,541 | 49,611 | 47,158 | |||||||||
| Drilling services | 198,438 | 207,894 | 412,635 | |||||||||
| Well servicing | 47,832 | 49,388 | 121,180 | |||||||||
| Wireline services | 22,623 | 23,948 | 94,413 | |||||||||
| Coiled tubing services | 5,941 | 6,336 | 37,292 | |||||||||
| Production services | 76,396 | 79,672 | 252,885 | |||||||||
| Corporate | 68,966 | 65,057 | 58,149 | |||||||||
| Consolidated identifiable assets | $ | 343,800 | $ | 352,623 | $ | 723,669 | ||||||
| Depreciation and amortization: | ||||||||||||
| Domestic drilling | $ | 2,012 | $ | 18,058 | $ | 21,433 | ||||||
| International drilling | 1,076 | 2,144 | 2,716 | |||||||||
| Drilling services | 3,088 | 20,202 | 24,149 | |||||||||
| Well servicing | 1,261 | 7,820 | 9,824 | |||||||||
| Wireline services | 763 | 5,088 | 7,982 | |||||||||
| Coiled tubing services | — | 2,164 | 3,059 | |||||||||
| Production services | 2,024 | 15,072 | 20,865 | |||||||||
| Corporate | 124 | 373 | 490 | |||||||||
| Consolidated depreciation | $ | 5,236 | $ | 35,647 | $ | 45,504 | ||||||
| Capital Expenditures: | ||||||||||||
| Domestic drilling | $ | 484 | $ | 3,862 | $ | 11,567 | ||||||
| International drilling | 138 | 1,273 | 2,282 | |||||||||
| Drilling services | 622 | 5,135 | 13,849 | |||||||||
| Well servicing | 30 | 1,918 | 6,036 | |||||||||
| Wireline services | 60 | 1,684 | 4,423 | |||||||||
| Coiled tubing services | — | 166 | 2,811 | |||||||||
| Production services | 90 | 3,768 | 13,270 | |||||||||
| Corporate | — | 21 | 497 | |||||||||
| Consolidated capital expenditures | $ | 712 | $ | 8,924 | $ | 27,616 | ||||||
(3) Upon our emergence from Chapter 11, due to the application of fresh start accounting, the carrying value of our identifiable assets was reduced to the estimated fair value and a new historical cost basis was established for all our property and equipment.
The following is a reconciliation of consolidated gross margin of our segments reported above to loss from operations as reported on the condensed consolidated statements of operations (amounts in thousands):
| Successor | Predecessor | ||||||||||||||||||||||||||||||||||||||||
| Three Months Ended March 31, 2021 | Three Months Ended March 31, 2020 | ||||||||||||||||||||||||||||||||||||||||
| Consolidated gross margin | $ | 13,412 | $ | 22,300 | |||||||||||||||||||||||||||||||||||||
| Depreciation and amortization | (13,365) | (21,984) | |||||||||||||||||||||||||||||||||||||||
| General and administrative | (9,713) | (14,655) | |||||||||||||||||||||||||||||||||||||||
| Prepetition restructuring charges | 0 | (17,074) | |||||||||||||||||||||||||||||||||||||||
| Impairment | 0 | (17,853) | |||||||||||||||||||||||||||||||||||||||
| Bad debt (expense) recovery, net | 197 | (727) | |||||||||||||||||||||||||||||||||||||||
| Gain on dispositions of property and equipment, net | 2,298 | 717 | |||||||||||||||||||||||||||||||||||||||
| Loss from operations | $ | (7,171) | $ | (49,276) | |||||||||||||||||||||||||||||||||||||
| Successor | Predecessor | |||||||||||
| One Month Ended June 30, 2020 | Two Months Ended May 31, 2020 | Three Months Ended June 30, 2019 | ||||||||||
| Consolidated gross margin | $ | 2,420 | $ | 6,023 | $ | 36,873 | ||||||
| Depreciation and amortization | (5,236 | ) | (13,663 | ) | (22,851 | ) | ||||||
| General and administrative | (4,213 | ) | (7,392 | ) | (18,028 | ) | ||||||
| Pre-petition restructuring charges | — | 252 | — | |||||||||
| Impairment | (388 | ) | — | (332 | ) | |||||||
| Bad debt (expense) recovery, net | 283 | (482 | ) | 348 | ||||||||
| Gain on dispositions of property and equipment, net | 460 | 272 | 1,126 | |||||||||
| Loss from operations | $ | (6,674 | ) | $ | (14,990 | ) | $ | (2,864 | ) | |||
| Successor | Predecessor | |||||||||||
| One Month Ended June 30, 2020 | Five Months Ended May 31, 2020 | Six Months Ended June 30, 2019 | ||||||||||
| Consolidated gross margin | $ | 2,420 | $ | 28,323 | $ | 74,856 | ||||||
| Depreciation and amortization | (5,236 | ) | (35,647 | ) | (45,504 | ) | ||||||
| General and administrative | (4,213 | ) | (22,047 | ) | (37,786 | ) | ||||||
| Pre-petition restructuring charges | — | (16,822 | ) | — | ||||||||
| Impairment | (388 | ) | (17,853 | ) | (1,378 | ) | ||||||
| Bad debt (expense) recovery, net | 283 | (1,209 | ) | 286 | ||||||||
| Gain on dispositions of property and equipment, net | 460 | 989 | 2,201 | |||||||||
| Loss from operations | $ | (6,674 | ) | $ | (64,266 | ) | $ | (7,325 | ) | |||
In connection with our operations in Colombia, our foreign subsidiaries routinely obtain bonds for bidding on drilling contracts, performing under drilling contracts, and remitting customs and importation duties. Based on historical experience and information currently available, we believe the likelihood of demand for payment under these bonds and guarantees is remote.
In February 2021, we received a $2.5 million assessment from the Colombian tax and customs authority related to an administrative delay in documentation provided for one of our drilling rigs. After evaluating the assessment with our customs advisors, we do not believe that it is probable that we will be required to pay the customs duty assessment.
We are currently undergoingroutinely subject to various states’ sales and use tax audits for multi-year periods.audits. As of June 30, 2020March 31, 2021 and December 31, 2019,2020, our accrued liability was $2.2$1.0 million and $2.0$0.9 million,, respectively, based on our estimate of the sales and useindirect tax obligations that are expected to result from these audits.obligations. Due to the inherent uncertainty of the audit process, we believe that it is reasonably possible that we may incur additional tax assessments with respect to one or more of thepotential audits in excess of the amount accrued. We believe that such an outcome would not have a material adverse effect on our results of operations or financial position. Because certainposition, but because of these audits are in a preliminary stage,the aforementioned uncertainty, an estimate of the possible loss or range of loss from an adverse result in all or substantially all of these casesaudit results cannot reasonably be made.
18
Due to the nature of our business, we are, from time to time, involved in litigation or subject to disputes or claims related to our business activities, including workers’ compensation claims and employment-related disputes. Legal costs relating to these matters are expensed as incurred. In the opinion of our management, none of the pending litigation, disputes or claims against us will have a material adverse effect on our financial condition, results of operations or cash flow from operations.
Insurance Claim Liabilities
We use a combination of self-insurance and third-party insurance for various types of coverage. At March 31, 2021, our accrued insurance premiums and deductibles include approximately $0.7 million of accruals for costs incurred under the self-insurance portion of our health insurance and approximately $1.8 million of accruals for costs associated with our workers’ compensation insurance. We accrue for these costs as claims are incurred using an actuarial calculation that is based on industry and our company’s historical claim development data, and we accrue the cost of administrative services associated with claims processing. Based upon our past experience, management believes that we have adequately provided for potential losses. However, future multiple occurrences of serious injuries to employees could have a material adverse effect on our financial position and results of operations.
Our Prepetition Senior Notes were fullyinsurance recoveries receivables and unconditionally guaranteed, jointlyour accrued liability for insurance claims and severally, on a senior unsecured basissettlements represent our estimate of claims in excess of our deductible, which are covered and managed by all existing 100% owned domestic subsidiaries, except for Pioneer Services Holdings, LLC. The Prepetition Senior Notes,our third-party insurance providers, some of which may ultimately be settled by the guarantees, andinsurance provider in the Prepetition Senior Notes Indenture were terminated on the Effective Date pursuantlong-term. These are presented in our condensed consolidated balance sheets as current due to the Plan. See Note 2, Emergence from Voluntary Reorganization under Chapter 11, for more information.
claims.
19
| Successor | |||||||||||||||||||
| June 30, 2020 | |||||||||||||||||||
| Parent | Guarantor Subsidiaries | Non-Guarantor Subsidiaries | Eliminations | Consolidated | |||||||||||||||
| ASSETS | |||||||||||||||||||
| Current assets: | |||||||||||||||||||
| Cash and cash equivalents | $ | 12,534 | $ | — | $ | 2,627 | $ | — | $ | 15,161 | |||||||||
| Restricted cash | 16,173 | — | — | — | 16,173 | ||||||||||||||
| Receivables, net of allowance | 413 | 50,286 | 13,707 | 302 | 64,708 | ||||||||||||||
| Intercompany receivable (payable) | (2,786 | ) | 30,855 | (28,069 | ) | — | — | ||||||||||||
| Inventory | — | 5,321 | 7,735 | — | 13,056 | ||||||||||||||
| Assets held for sale | — | 7,292 | — | — | 7,292 | ||||||||||||||
| Prepaid expenses and other current assets | 2,469 | 2,510 | 265 | 405 | 5,649 | ||||||||||||||
| Total current assets | 28,803 | 96,264 | (3,735 | ) | 707 | 122,039 | |||||||||||||
| Net property and equipment | 521 | 160,610 | 25,109 | — | 186,240 | ||||||||||||||
| Investment in subsidiaries | 250,356 | 37,491 | — | (287,847 | ) | — | |||||||||||||
| Intangible assets, net of accumulated amortization | 9,292 | — | — | — | 9,292 | ||||||||||||||
| Deferred income taxes | — | — | 9,140 | (1 | ) | 9,139 | |||||||||||||
| Operating lease assets | 2,800 | 2,177 | 63 | — | 5,040 | ||||||||||||||
| Other noncurrent assets | 1,784 | 82 | 10,184 | — | 12,050 | ||||||||||||||
| Total assets | $ | 293,556 | $ | 296,624 | $ | 40,761 | $ | (287,141 | ) | $ | 343,800 | ||||||||
| LIABILITIES AND STOCKHOLDERS’ EQUITY | |||||||||||||||||||
| Current liabilities: | |||||||||||||||||||
| Accounts payable | $ | 5,643 | $ | 7,720 | $ | 2,785 | $ | — | $ | 16,148 | |||||||||
| Deferred revenues | — | 74 | 163 | 405 | 642 | ||||||||||||||
| Accrued expenses | 13,886 | 35,994 | 278 | (1,012 | ) | 49,146 | |||||||||||||
| Total current liabilities | 19,529 | 43,788 | 3,226 | (607 | ) | 65,936 | |||||||||||||
| Long-term debt, less unamortized discount and debt issuance costs | 142,005 | — | — | — | 142,005 | ||||||||||||||
| Noncurrent operating lease liabilities | 2,467 | 1,587 | 44 | — | 4,098 | ||||||||||||||
| Deferred income taxes | 254 | 818 | — | (1 | ) | 1,071 | |||||||||||||
| Other noncurrent liabilities | 159 | 75 | — | 1,314 | 1,548 | ||||||||||||||
| Total liabilities | 164,414 | 46,268 | 3,270 | 706 | 214,658 | ||||||||||||||
| Total stockholders’ equity | 129,142 | 250,356 | 37,491 | (287,847 | ) | 129,142 | |||||||||||||
| Total liabilities and stockholders’ equity | $ | 293,556 | $ | 296,624 | $ | 40,761 | $ | (287,141 | ) | $ | 343,800 | ||||||||
| Predecessor | |||||||||||||||||||
| December 31, 2019 | |||||||||||||||||||
| Parent | Guarantor Subsidiaries | Non-Guarantor Subsidiaries | Eliminations | Consolidated | |||||||||||||||
| ASSETS | |||||||||||||||||||
| Current assets: | |||||||||||||||||||
| Cash and cash equivalents | $ | 14,461 | $ | — | $ | 10,158 | $ | — | $ | 24,619 | |||||||||
| Restricted cash | 998 | — | — | — | 998 | ||||||||||||||
| Receivables, net of allowance | 107 | 92,394 | 30,908 | 117 | 123,526 | ||||||||||||||
| Intercompany receivable (payable) | (28,664 | ) | 64,485 | (35,821 | ) | — | — | ||||||||||||
| Inventory | — | 10,325 | 12,128 | — | 22,453 | ||||||||||||||
| Assets held for sale | — | 3,447 | — | — | 3,447 | ||||||||||||||
| Prepaid expenses and other current assets | 2,849 | 4,122 | 898 | — | 7,869 | ||||||||||||||
| Total current assets | (10,249 | ) | 174,773 | 18,271 | 117 | 182,912 | |||||||||||||
| Net property and equipment | 2,374 | 441,567 | 27,229 | — | 471,170 | ||||||||||||||
| Investment in subsidiaries | 547,123 | 47,953 | — | (595,076 | ) | — | |||||||||||||
| Deferred income taxes | 44,224 | — | 11,540 | (44,224 | ) | 11,540 | |||||||||||||
| Operating lease assets | 3,114 | 3,581 | 569 | — | 7,264 | ||||||||||||||
| Other noncurrent assets | 506 | 562 | — | — | 1,068 | ||||||||||||||
| Total assets | $ | 587,092 | $ | 668,436 | $ | 57,609 | $ | (639,183 | ) | $ | 673,954 | ||||||||
| LIABILITIES AND STOCKHOLDERS’ EQUITY | |||||||||||||||||||
| Current liabilities: | |||||||||||||||||||
| Accounts payable | $ | 1,811 | $ | 24,436 | $ | 6,304 | $ | — | $ | 32,551 | |||||||||
| Deferred revenues | — | 513 | 826 | — | 1,339 | ||||||||||||||
| Accrued expenses | 10,570 | 44,893 | 2,111 | 117 | 57,691 | ||||||||||||||
| Total current liabilities | 12,381 | 69,842 | 9,241 | 117 | 91,581 | ||||||||||||||
| Long-term debt, less unamortized discount and debt issuance costs | 467,699 | — | — | — | 467,699 | ||||||||||||||
| Noncurrent operating lease liabilities | 2,749 | 2,536 | 415 | — | 5,700 | ||||||||||||||
| Deferred income taxes | — | 48,641 | — | (44,224 | ) | 4,417 | |||||||||||||
| Other noncurrent liabilities | 187 | 294 | — | — | 481 | ||||||||||||||
| Total liabilities not subject to compromise | 483,016 | 121,313 | 9,656 | (44,107 | ) | 569,878 | |||||||||||||
| Total stockholders’ equity | 104,076 | 547,123 | 47,953 | (595,076 | ) | 104,076 | |||||||||||||
| Total liabilities and stockholders’ equity | $ | 587,092 | $ | 668,436 | $ | 57,609 | $ | (639,183 | ) | $ | 673,954 | ||||||||
| Successor | |||||||||||||||||||
| One Month Ended June 30, 2020 | |||||||||||||||||||
| Parent | Guarantor Subsidiaries | Non-Guarantor Subsidiaries | Eliminations | Consolidated | |||||||||||||||
| Revenues | $ | — | $ | 10,335 | $ | 828 | $ | — | $ | 11,163 | |||||||||
| Costs and expenses: | |||||||||||||||||||
| Operating costs | — | 7,680 | 1,063 | — | 8,743 | ||||||||||||||
| Depreciation and amortization | 124 | 4,036 | 1,076 | — | 5,236 | ||||||||||||||
| General and administrative | 2,429 | 1,703 | 146 | (65 | ) | 4,213 | |||||||||||||
| Intercompany leasing | — | (405 | ) | 405 | — | — | |||||||||||||
| Impairment | — | 388 | — | — | 388 | ||||||||||||||
| Bad debt expense (recovery), net | — | (283 | ) | — | — | (283 | ) | ||||||||||||
| Gain on dispositions of property and equipment, net | — | (460 | ) | — | — | (460 | ) | ||||||||||||
| Total costs and expenses | 2,553 | 12,659 | 2,690 | (65 | ) | 17,837 | |||||||||||||
| Income (loss) from operations | (2,553 | ) | (2,324 | ) | (1,862 | ) | 65 | (6,674 | ) | ||||||||||
| Other income (expense): | |||||||||||||||||||
| Equity in earnings of subsidiaries | (4,312 | ) | (1,656 | ) | — | 5,968 | — | ||||||||||||
| Interest expense | (2,217 | ) | — | 2 | — | (2,215 | ) | ||||||||||||
| Reorganization items, net | (741 | ) | (403 | ) | — | — | (1,144 | ) | |||||||||||
| Other income | 6 | 89 | (260 | ) | (65 | ) | (230 | ) | |||||||||||
| Total other income (expense), net | (7,264 | ) | (1,970 | ) | (258 | ) | 5,903 | (3,589 | ) | ||||||||||
| Income (loss) before income taxes | (9,817 | ) | (4,294 | ) | (2,120 | ) | 5,968 | (10,263 | ) | ||||||||||
Income tax (expense) benefit 1 | — | (18 | ) | 464 | — | 446 | |||||||||||||
| Net income (loss) | $ | (9,817 | ) | $ | (4,312 | ) | $ | (1,656 | ) | $ | 5,968 | $ | (9,817 | ) | |||||
| Predecessor | |||||||||||||||||||
| Two Months Ended May 31, 2020 | |||||||||||||||||||
| Parent | Guarantor Subsidiaries | Non-Guarantor Subsidiaries | Eliminations | Consolidated | |||||||||||||||
| Revenues | $ | — | $ | 26,575 | $ | 1,473 | $ | — | $ | 28,048 | |||||||||
| Costs and expenses: | |||||||||||||||||||
| Operating costs | — | 20,487 | 1,538 | — | 22,025 | ||||||||||||||
| Depreciation and amortization | 147 | 12,673 | 843 | — | 13,663 | ||||||||||||||
| General and administrative | 2,922 | 4,277 | 283 | (90 | ) | 7,392 | |||||||||||||
| Pre-petition restructuring charges | (252 | ) | — | — | — | (252 | ) | ||||||||||||
| Intercompany leasing | — | (810 | ) | 810 | — | — | |||||||||||||
| Bad debt expense (recovery), net | — | 482 | — | — | 482 | ||||||||||||||
| Gain on dispositions of property and equipment, net | — | (272 | ) | — | — | (272 | ) | ||||||||||||
| Total costs and expenses | 2,817 | 36,837 | 3,474 | (90 | ) | 43,038 | |||||||||||||
| Income (loss) from operations | (2,817 | ) | (10,262 | ) | (2,001 | ) | 90 | (14,990 | ) | ||||||||||
| Other income (expense): | |||||||||||||||||||
| Equity in earnings of subsidiaries | (202,279 | ) | (2,086 | ) | — | 204,365 | — | ||||||||||||
| Interest expense | (4,138 | ) | (1 | ) | 4 | — | (4,135 | ) | |||||||||||
| Loss on extinguishment of debt | (3,723 | ) | — | — | — | (3,723 | ) | ||||||||||||
| Reorganization items, net | 217,009 | (231,420 | ) | (829 | ) | — | (15,240 | ) | |||||||||||
| Other income | 33 | 160 | 2,109 | (90 | ) | 2,212 | |||||||||||||
| Total other income (expense), net | 6,902 | (233,347 | ) | 1,284 | 204,275 | (20,886 | ) | ||||||||||||
| Income (loss) before income taxes | 4,085 | (243,609 | ) | (717 | ) | 204,365 | (35,876 | ) | |||||||||||
Income tax (expense) benefit 1 | (39,206 | ) | 41,330 | (1,369 | ) | — | 755 | ||||||||||||
| Net income (loss) | $ | (35,121 | ) | $ | (202,279 | ) | $ | (2,086 | ) | $ | 204,365 | $ | (35,121 | ) | |||||
| Predecessor | |||||||||||||||||||
| Three months ended June 30, 2019 | |||||||||||||||||||
| Parent | Guarantor Subsidiaries | Non-Guarantor Subsidiaries | Eliminations | Consolidated | |||||||||||||||
| Revenues | $ | — | $ | 127,421 | $ | 25,422 | $ | — | $ | 152,843 | |||||||||
| Costs and expenses: | |||||||||||||||||||
| Operating costs | — | 97,417 | 18,553 | — | 115,970 | ||||||||||||||
| Depreciation and amortization | 210 | 21,268 | 1,373 | — | 22,851 | ||||||||||||||
| General and administrative | 6,907 | 10,579 | 677 | (135 | ) | 18,028 | |||||||||||||
| Intercompany leasing | — | (1,215 | ) | 1,215 | — | — | |||||||||||||
| Bad debt expense (recovery), net | — | (348 | ) | — | — | (348 | ) | ||||||||||||
| Impairment | — | 332 | — | — | 332 | ||||||||||||||
| Gain on dispositions of property and equipment, net | — | (1,121 | ) | (5 | ) | — | (1,126 | ) | |||||||||||
| Total costs and expenses | 7,117 | 126,912 | 21,813 | (135 | ) | 155,707 | |||||||||||||
| Income (loss) from operations | (7,117 | ) | 509 | 3,609 | 135 | (2,864 | ) | ||||||||||||
| Other income (expense): | |||||||||||||||||||
| Equity in earnings of subsidiaries | 3,305 | 3,431 | — | (6,736 | ) | — | |||||||||||||
| Interest expense | (10,059 | ) | (1 | ) | (45 | ) | — | (10,105 | ) | ||||||||||
| Other income (expense) | 91 | 401 | (8 | ) | (135 | ) | 349 | ||||||||||||
| Total other income (expense), net | (6,663 | ) | 3,831 | (53 | ) | (6,871 | ) | (9,756 | ) | ||||||||||
| Income (loss) before income taxes | (13,780 | ) | 4,340 | 3,556 | (6,736 | ) | (12,620 | ) | |||||||||||
Income tax (expense) benefit 1 | 836 | (1,035 | ) | (125 | ) | — | (324 | ) | |||||||||||
| Net income (loss) | $ | (12,944 | ) | $ | 3,305 | $ | 3,431 | $ | (6,736 | ) | $ | (12,944 | ) | ||||||
1 The income tax (expense) benefit reflected in each column does not include any tax effect of the equity in earnings (losses) of subsidiaries. | |||||||||||||||||||
| Successor | |||||||||||||||||||
| One Month Ended June 30, 2020 | |||||||||||||||||||
| Parent | Guarantor Subsidiaries | Non-Guarantor Subsidiaries | Eliminations | Consolidated | |||||||||||||||
| Revenues | $ | — | $ | 10,335 | $ | 828 | $ | — | $ | 11,163 | |||||||||
| Costs and expenses: | |||||||||||||||||||
| Operating costs | — | 7,680 | 1,063 | — | 8,743 | ||||||||||||||
| Depreciation and amortization | 124 | 4,036 | 1,076 | — | 5,236 | ||||||||||||||
| General and administrative | 2,429 | 1,703 | 146 | (65 | ) | 4,213 | |||||||||||||
| Intercompany leasing | — | (405 | ) | 405 | — | — | |||||||||||||
| Impairment | — | 388 | — | — | 388 | ||||||||||||||
| Bad debt recovery, net of expense | — | (283 | ) | — | — | (283 | ) | ||||||||||||
| Gain on dispositions of property and equipment, net | — | (460 | ) | — | — | (460 | ) | ||||||||||||
| Total costs and expenses | 2,553 | 12,659 | 2,690 | (65 | ) | 17,837 | |||||||||||||
| Loss from operations | (2,553 | ) | (2,324 | ) | (1,862 | ) | 65 | (6,674 | ) | ||||||||||
| Other income (expense): | |||||||||||||||||||
| Equity in earnings of subsidiaries | (4,312 | ) | (1,656 | ) | — | 5,968 | — | ||||||||||||
| Interest expense | (2,217 | ) | — | 2 | — | (2,215 | ) | ||||||||||||
| Reorganization items, net | (741 | ) | (403 | ) | — | — | (1,144 | ) | |||||||||||
| Other income (expense) | 6 | 89 | (260 | ) | (65 | ) | (230 | ) | |||||||||||
| Total other expense, net | (7,264 | ) | (1,970 | ) | (258 | ) | 5,903 | (3,589 | ) | ||||||||||
| Loss before income taxes | (9,817 | ) | (4,294 | ) | (2,120 | ) | 5,968 | (10,263 | ) | ||||||||||
Income tax (expense) benefit 1 | — | (18 | ) | 464 | — | 446 | |||||||||||||
| Net income (loss) | $ | (9,817 | ) | $ | (4,312 | ) | $ | (1,656 | ) | $ | 5,968 | $ | (9,817 | ) | |||||
| Predecessor | |||||||||||||||||||
| Five Months Ended May 31, 2020 | |||||||||||||||||||
| Parent | Guarantor Subsidiaries | Non-Guarantor Subsidiaries | Eliminations | Consolidated | |||||||||||||||
| Revenues | $ | — | $ | 126,442 | $ | 15,928 | $ | — | $ | 142,370 | |||||||||
| Costs and expenses: | |||||||||||||||||||
| Operating costs | — | 100,372 | 13,675 | — | 114,047 | ||||||||||||||
| Depreciation and amortization | 374 | 33,129 | 2,144 | — | 35,647 | ||||||||||||||
| General and administrative | 8,865 | 12,489 | 918 | (225 | ) | 22,047 | |||||||||||||
| Pre-petition restructuring charges | 16,822 | — | — | — | 16,822 | ||||||||||||||
| Intercompany leasing | — | (2,025 | ) | 2,025 | — | — | |||||||||||||
| Impairment | — | 17,853 | — | — | 17,853 | ||||||||||||||
| Bad debt recovery, net of expense | — | 1,209 | — | — | 1,209 | ||||||||||||||
| Loss (gain) on dispositions of property and equipment, net | 3 | (992 | ) | — | — | (989 | ) | ||||||||||||
| Total costs and expenses | 26,064 | 162,035 | 18,762 | (225 | ) | 206,636 | |||||||||||||
| Loss from operations | (26,064 | ) | (35,593 | ) | (2,834 | ) | 225 | (64,266 | ) | ||||||||||
| Other income (expense): | |||||||||||||||||||
| Equity in earnings of subsidiaries | (227,497 | ) | (8,594 | ) | — | 236,091 | — | ||||||||||||
| Interest expense | (12,315 | ) | — | 21 | — | (12,294 | ) | ||||||||||||
| Reorganization items, net | 210,346 | (231,420 | ) | (829 | ) | — | (21,903 | ) | |||||||||||
| Loss on extinguishment of debt | (4,215 | ) | — | — | — | (4,215 | ) | ||||||||||||
| Other income (expense) | (4 | ) | 394 | (3,498 | ) | (225 | ) | (3,333 | ) | ||||||||||
| Total other expense, net | (33,685 | ) | (239,620 | ) | (4,306 | ) | 235,866 | (41,745 | ) | ||||||||||
| Loss before income taxes | (59,749 | ) | (275,213 | ) | (7,140 | ) | 236,091 | (106,011 | ) | ||||||||||
Income tax (expense) benefit 1 | (44,476 | ) | 47,716 | (1,454 | ) | — | 1,786 | ||||||||||||
| Net income (loss) | $ | (104,225 | ) | $ | (227,497 | ) | $ | (8,594 | ) | $ | 236,091 | $ | (104,225 | ) | |||||
| Predecessor | |||||||||||||||||||
| Six months ended June 30, 2019 | |||||||||||||||||||
| Parent | Guarantor Subsidiaries | Non-Guarantor Subsidiaries | Eliminations | Consolidated | |||||||||||||||
| Revenues | $ | — | $ | 252,346 | $ | 47,065 | $ | — | $ | 299,411 | |||||||||
| Costs and expenses: | |||||||||||||||||||
| Operating costs | — | 189,519 | 35,036 | — | 224,555 | ||||||||||||||
| Depreciation and amortization | 490 | 42,298 | 2,716 | — | 45,504 | ||||||||||||||
| General and administrative | 14,903 | 22,025 | 1,128 | (270 | ) | 37,786 | |||||||||||||
| Intercompany leasing | — | (2,430 | ) | 2,430 | — | — | |||||||||||||
| Impairment | — | 1,378 | — | — | 1,378 | ||||||||||||||
| Bad debt recovery, net of expense | — | (286 | ) | — | — | (286 | ) | ||||||||||||
| Gain on dispositions of property and equipment, net | — | (2,105 | ) | (96 | ) | — | (2,201 | ) | |||||||||||
| Total costs and expenses | 15,393 | 250,399 | 41,214 | (270 | ) | 306,736 | |||||||||||||
| Income (loss) from operations | (15,393 | ) | 1,947 | 5,851 | 270 | (7,325 | ) | ||||||||||||
| Other income (expense): | |||||||||||||||||||
| Equity in earnings of subsidiaries | 6,073 | 5,895 | — | (11,968 | ) | — | |||||||||||||
| Interest expense | (19,933 | ) | (15 | ) | (42 | ) | — | (19,990 | ) | ||||||||||
| Other income | 297 | 667 | 339 | (270 | ) | 1,033 | |||||||||||||
| Total other income (expense), net | (13,563 | ) | 6,547 | 297 | (12,238 | ) | (18,957 | ) | |||||||||||
| Income (loss) before income taxes | (28,956 | ) | 8,494 | 6,148 | (11,968 | ) | (26,282 | ) | |||||||||||
Income tax (expense) benefit 1 | 897 | (2,421 | ) | (253 | ) | — | (1,777 | ) | |||||||||||
| Net income (loss) | $ | (28,059 | ) | $ | 6,073 | $ | 5,895 | $ | (11,968 | ) | $ | (28,059 | ) | ||||||
1 The income tax (expense) benefit reflected in each column does not include any tax effect of the equity in earnings (losses) of subsidiaries. | |||||||||||||||||||
| Successor | |||||||||||||||||||
| One Month Ended June 30, 2020 | |||||||||||||||||||
| Parent | Guarantor Subsidiaries | Non-Guarantor Subsidiaries | Eliminations | Consolidated | |||||||||||||||
| Cash flows from operating activities | $ | (4,616 | ) | $ | 10,312 | $ | (979 | ) | $ | — | $ | 4,717 | |||||||
| Cash flows from investing activities: | |||||||||||||||||||
| Purchases of property and equipment | (14 | ) | (809 | ) | (77 | ) | — | (900 | ) | ||||||||||
| Proceeds from sale of property and equipment | — | 752 | — | — | 752 | ||||||||||||||
| (14 | ) | (57 | ) | (77 | ) | — | (148 | ) | |||||||||||
| Cash flows from financing activities: | |||||||||||||||||||
| Intercompany contributions/distributions | 16,730 | (10,255 | ) | (6,475 | ) | — | — | ||||||||||||
| 16,730 | (10,255 | ) | (6,475 | ) | — | — | |||||||||||||
| Net decrease in cash, cash equivalents and restricted cash | 12,100 | — | (7,531 | ) | — | 4,569 | |||||||||||||
| Beginning cash, cash equivalents and restricted cash | 16,607 | — | 10,158 | — | 26,765 | ||||||||||||||
| Ending cash, cash equivalents and restricted cash | $ | 28,707 | $ | — | $ | 2,627 | $ | — | $ | 31,334 | |||||||||
| Predecessor | |||||||||||||||||||
| Five Months Ended May 31, 2020 | |||||||||||||||||||
| Parent | Guarantor Subsidiaries | Non-Guarantor Subsidiaries | Eliminations | Consolidated | |||||||||||||||
| Cash flows from operating activities | $ | (127,760 | ) | $ | 132,354 | $ | (6,839 | ) | $ | — | $ | (2,245 | ) | ||||||
| Cash flows from investing activities: | |||||||||||||||||||
| Purchases of property and equipment | (569 | ) | (8,755 | ) | (1,524 | ) | — | (10,848 | ) | ||||||||||
| Proceeds from sale of property and equipment | — | 1,819 | — | (154 | ) | 1,665 | |||||||||||||
| Proceeds from insurance recoveries | — | 22 | — | — | 22 | ||||||||||||||
| (569 | ) | (6,914 | ) | (1,524 | ) | (154 | ) | (9,161 | ) | ||||||||||
| Cash flows from financing activities: | |||||||||||||||||||
| Debt repayments | (175,000 | ) | — | — | — | (175,000 | ) | ||||||||||||
| Proceeds from debt issuance | 195,187 | — | — | — | 195,187 | ||||||||||||||
| Proceeds from DIP Facility | 4,000 | — | — | — | 4,000 | ||||||||||||||
| Repayment of DIP Facility | (4,000 | ) | — | — | — | (4,000 | ) | ||||||||||||
| Payments of debt issuance costs | (7,625 | ) | — | — | — | (7,625 | ) | ||||||||||||
| Purchase of treasury stock | (8 | ) | — | — | — | (8 | ) | ||||||||||||
| Intercompany contributions/distributions | 116,923 | (125,440 | ) | 8,363 | 154 | — | |||||||||||||
| 129,477 | (125,440 | ) | 8,363 | 154 | 12,554 | ||||||||||||||
| Net decrease in cash, cash equivalents and restricted cash | 1,148 | — | — | — | 1,148 | ||||||||||||||
| Beginning cash, cash equivalents and restricted cash | 15,459 | — | 10,158 | — | 25,617 | ||||||||||||||
| Ending cash, cash equivalents and restricted cash | $ | 16,607 | $ | — | $ | 10,158 | $ | — | $ | 26,765 | |||||||||
| Predecessor | |||||||||||||||||||
| Six months ended June 30, 2019 | |||||||||||||||||||
| Parent | Guarantor Subsidiaries | Non-Guarantor Subsidiaries | Eliminations | Consolidated | |||||||||||||||
| Cash flows from operating activities | $ | (35,104 | ) | $ | 35,209 | $ | 3,941 | $ | — | $ | 4,046 | ||||||||
| Cash flows from investing activities: | |||||||||||||||||||
| Purchases of property and equipment | (314 | ) | (28,634 | ) | (2,434 | ) | — | (31,382 | ) | ||||||||||
| Proceeds from sale of property and equipment | — | 3,376 | 63 | — | 3,439 | ||||||||||||||
| Proceeds from insurance recoveries | — | 588 | — | — | 588 | ||||||||||||||
| (314 | ) | (24,670 | ) | (2,371 | ) | — | (27,355 | ) | |||||||||||
| Cash flows from financing activities: | |||||||||||||||||||
| Purchase of treasury stock | (125 | ) | — | — | — | (125 | ) | ||||||||||||
| Intercompany contributions/distributions | 10,784 | (10,539 | ) | (245 | ) | — | — | ||||||||||||
| 10,659 | (10,539 | ) | (245 | ) | — | (125 | ) | ||||||||||||
| Net increase (decrease) in cash, cash equivalents and restricted cash | (24,759 | ) | — | 1,325 | — | (23,434 | ) | ||||||||||||
| Beginning cash, cash equivalents and restricted cash | 51,348 | — | 3,216 | — | 54,564 | ||||||||||||||
| Ending cash, cash equivalents and restricted cash | $ | 26,589 | $ | — | $ | 4,541 | $ | — | $ | 31,130 | |||||||||
ITEM 2. MANAGEMENT’S DISCUSSION AND ANALYSIS OF FINANCIAL CONDITION AND RESULTS OF OPERATIONS
Statements we make in the following discussion that express a belief, expectation or intention, as well as those that are not historical fact, are forward-looking statements made in good faith that are subject to risks, uncertainties and assumptions. These forward-looking statements are based on our current beliefs, intentions, and expectations and are not guarantees or indicators of future performance. Our actual results, performance or achievements, or industry results, could differ materially from those we express in the following discussion as a result of a variety of factors, including risks and uncertainties relating to the effects of our bankruptcy on our business and relationships, the concentration of our equity ownership following bankruptcy, the application of fresh start accounting, the effect of the coronavirus (COVID-19) pandemic on our industry, general economic and business conditions and industry trends, levels and volatility of oil and gas prices, the continued demand for drilling services or production services in the geographic areas where we operate, the highly competitive nature of our business, the supply of marketable equipment within the industry, technological advancements and trends in our industry and improvements in our competitors' equipment, the loss of one or more of our major clients or a decrease in their demand for our services, operating hazards inherent in our operations, the supply of marketable equipment within the industry, the continued availability of new components forsupplies, equipment and qualified personnel required to operate our fleets, the continued availability of qualified personnel, the political, economic, regulatory and other uncertainties encountered by our operations, and changes in, or our failure or inability to comply with, governmental regulations, including those relating to the environment, the occurrence of cybersecurity incidents, the success or failure of future acquisitions or dispositions, or acquisitions,our level of indebtedness and future compliance with covenants under our debt agreements, and the impact of not having our common stock listed on a national securities exchange or quoted on an over-the-counter market. We have discussed many of these factors in more detail elsewhere in this report, and in our Annual Report on Form 10-K for the year ended December 31, 2019,2020, as amended by Form 10-K/A for the year ended December 31, 2019, and our Quarterly Report for the quarterly period ended March 31, 2020, including under the headings “Risk Factors” in Item 1A and “Special Note Regarding Forward-Looking Statements”Statements and Risk Factor Summary” in the Introductory Note to Part I. These factors are not necessarily all the important factors that could affect us. Other unpredictable or unknown factors could also have material adverse effects on actual results of matters that are the subject of our forward-looking statements. All forward-looking statements speak only as of the date on which they are made and we undertake no obligation to publicly update or revise any forward-looking statements whether as a result of new information, future events or otherwise. We advise our stockholders that they should (1) recognize that important factors not referred to above could affect the accuracy of our forward-looking statements and (2) use caution and common sense when considering our forward-looking statements.
20
Company Overview
Pioneer Energy Services Corp. provides land-based drilling services and production services to a diverse group of oil and gas exploration and production companies in the United States and internationally in Colombia. Drilling services and production services are fundamental to establishing and maintaining the flow of oil and natural gas throughout the productive life of a well.
•Drilling Services — Our current drilling rig fleet is 100% pad-capable and offers the latest advancements in pad drilling, with 17 AC rigs in the US and 8 SCR rigs in Colombia. We provide a comprehensive service offering which includes the drilling rig, crews, supplies, and most of the ancillary equipment needed to operate our drilling rigs, which are deployed through our division offices in the following regions:
| Rig Count | ||||||||
| Domestic drilling: | ||||||||
| Marcellus/Utica | 5 | |||||||
| Permian Basin and Eagle Ford | 10 | |||||||
| Bakken | 2 | |||||||
| International drilling | 8 | |||||||
| 25 | ||||||||
•Production Services —Our production services business segments provide a range of services to producers primarily in Texas, North Dakota and the Rocky Mountain region.
◦Well Servicing. Our fleet consists of 111 rigs with 550 horsepower and 12 rigs with 600 horsepower which are deployed through 5 operating locations in Texas and North Dakota.
◦Wireline Services. Our fleet of 72 wireline units, including nine units that offer greaseless electric wireline used to reach further depths in longer laterals and two greaseless EcoQuietTM units designed to reduce noise when operating in proximity to urban areas, is deployed through 5 operating locations in Texas, the Rocky Mountain region and Louisiana. North Dakota.
Pioneer Energy Services Corp. was incorporated under the laws of the State of Texas in 1979 as the successor to a business that had been operating since 1968. Since then, we have significantly expanded and transformed our business through acquisitions and organic growth. Upon emergence from Chapter 11 in May 2020, we converted from a Texas corporation to a Delaware corporation.
Our current business is comprised of two business lines — Drilling Services (consisting of Domestic Drilling and International Drilling reportable segments) and Production Services (consisting of Well Servicing and Wireline Services reportable segments). In April 2020, we closed our coiled tubing operations and idled all our coiled tubing equipment, which were subsequently placed as held for sale as of June 30, 2020. Financial information about our operating segments is included in Note 12, 9, Segment Information, of the Notes to Unaudited Condensed Consolidated Financial Statements, included in Part I, Item 1,, Financial Statements, of this Quarterly Report on Form 10-Q.10-Q.
Pioneer Energy Services Corp.’s corporate office is located at 1250 N.E. Loop 410, Suite 1000, San Antonio, Texas 78209. Our phone number is (855) 884-0575 and our website address is www.pioneeres.com. We make available free of charge through our website our Annual Reports on Form 10-K, Quarterly Reports on Form 10-Q, Current Reports on Form 8-K, and all amendments to those reports as soon as reasonably practicable after such material is electronically filed with the Securities and Exchange Commission (SEC). Information on our website is not incorporated into this report or otherwise made part of this report.
Reorganization and Emergence from Chapter 11
On March 1, 2020, we filed a petition for reorganization under Chapter 11 of the Bankruptcy Code. On May 11, 2020, the Bankruptcy Court confirmed the plan of reorganization (the “Plan”) that was filed with the Bankruptcy Court on March 2, 2020, and on May 29, 2020 (the “Effective Date”), the conditions to effectiveness of the Plan were satisfied, and we emerged from Chapter 11.
As a result of the application of fresh start accounting and the effects of the implementation of the Plan, our condensed consolidated financial statements after the Effective Date are not comparable with the consolidated financial statements on or
21
before that date as indicated by the “black line” division in the financial statements and footnote tables, which emphasizes the lack of comparability between amounts presented. References to “Successor” relate to our financial position and results of operations after the Effective Date. References to “Predecessor” refer to our financial position and results of operations on or before the Effective Date.
Market Conditions and Outlook
Industry Overview — Demand for oilfield services offered by our industry is a function of our clients’ willingness and ability to make operating expenditurescapital and capitaloperating expenditures to explore for, develop and produce hydrocarbons, which is primarily driven by current and expected oil and natural gas prices.
However, in a severe downturn that is prolonged, both operating and capital expenditures are significantly reduced, and the demand for all our service offerings is significantly impacted. After a prolonged or severe downturn, among the production services, the demand for production-related workover services generally improves first, followed by the demand for completion-oriented services as exploration and production companies begin to complete wells that were previously drilled but not completed during the downturn, and to complete newly drilled wells asfinally by the demand for drilling services improves during recovery.of new wells.
For additional information concerning the potential effects of volatility in oil and gas prices and other industry trends, see Item 1A – “Risk Factors” in Part I of our Annual Report on Form 10-K for the year ended December 31, 2019, filed with the SEC on March 6, 2020, as amended by Form 10-K/A filed with the SEC on April 28, 2020.
Market Conditions and Outlook — Since January 2020, theThe COVID-19 pandemic and oil and natural gas market volatility havewhich began in early 2020 resulted in a significant decrease in oil prices and significant disruption and uncertainty in the oil and natural gas market. Beginning inIn March 2020, the decline in demand due to the COVID-19 pandemic coincided with the announcement of price reductions and possible production increases by members of OPEC and other oil exporting nations, including Russia. Although OPEC and other oil exporting nations ultimately agreed to cut production, the downward pressure on commodity prices has remained and could continue in the foreseeable future. Thesethese extreme supply and demand dynamics caused significant crude oil price declines, negatively impacting our industry’s oil producers who responded with significant cuts in their recentpreviously planned and projected spending.
The trends in spot prices of WTI crude oil and Henry Hub natural gas, and the resulting trends in domestic land rig counts (per Baker Hughes) and domestic well servicing rig counts (per Association of Energy Service Companies/Energy Workforce & Technology Council) from January 2019 through March 2021 are illustrated in the graphs below.
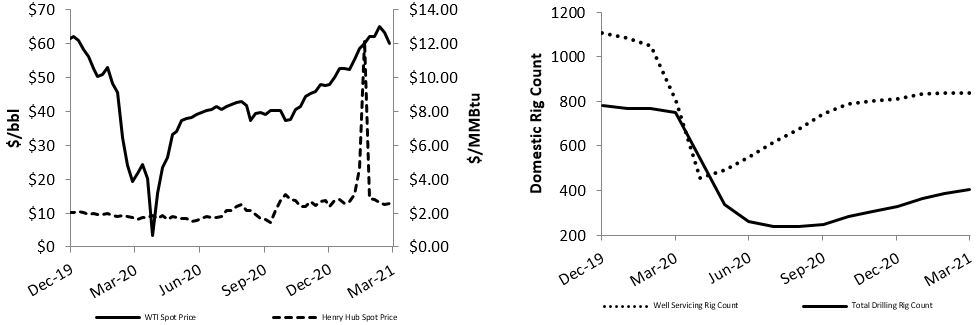
22
The commodity price environment and global oversupply of oil during 2020 resulted in an oversupply of equipment in the industry, declining rig counts and dayrates, and substantially reduced activity for all our service offerings. Additionally, because our business depends on the level of spending by our clients, we are also affected by our clients’ ability to access the capital markets. After several consecutive years without significant improvement in commodity prices, many exploration and production companies have limited their spending to a level which can be supported by net operating cash flows alone, as access to the capital markets through debt or equity financings has become more challenging in our industry. This challenge has increased recently due to
However, the major stock market and bond market indices experiencing elevated levelsrecovery of volatility in 2020.
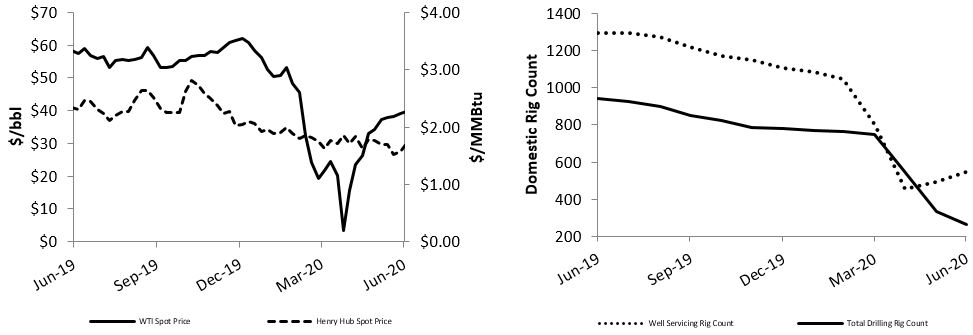
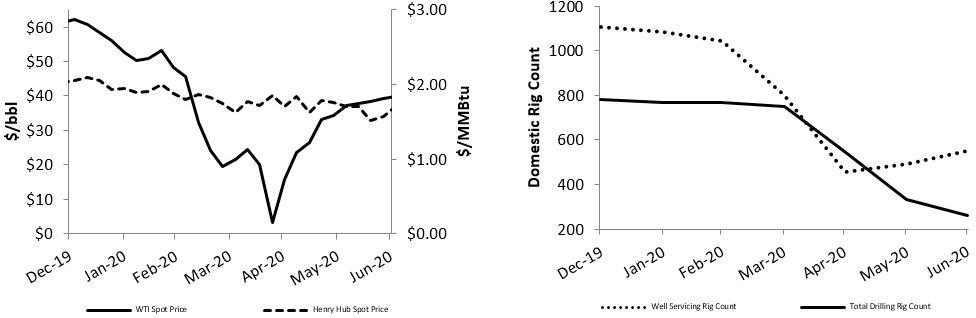
Activity levels for our services. In March 2020, many operators begandomestic drilling, international drilling, and well servicing operations (measured in revenue days and hours, respectively) in the first quarter of 2021 increased 6%, 9%, and 3%, respectively, as compared to curtail operations and several ofthe prior quarter, while our clients terminated their drilling contracts with us in April and May 2020.
wireline stage counts completed were down approximately 7%. At the end of March 31, 2020, 152021, 16 of our 25 drilling rigs were earning revenues, 11revenue, 10 of which were under term contracts, and 3 more were under contractcontracts. Including the one additional rig we have contracted but with suspended operations. Atwhich is pending operations, the end of June 30, 2020, 10 of our 25 drilling rigs were earning revenues, 8 of which were under term contracts with an aggregate average term remaining ofon our term contracts is approximately 9 months, 2 more were under contract but with suspended operations and one additional rig was under contract which began operations in July. Utilization of our production services fleets also dropped significantly in response to recent market conditions, and in April 2020, we closed our coiled tubing operations and idled all our coiled tubing equipment, which were subsequently placed as held for sale.11 months.
safety record position us well to compete whenas our industry recovers.
Liquidity and Capital Resources
Liquidity Overview
Our completion of theemergence from Chapter 11 Cases has allowed us to significantly reduce our level of indebtedness and our future cash interest obligations. We currently expect that cash and cash equivalents, cash generated from operations, proceeds from sales of assets, and available funds under the ABL Credit Facility are adequate to cover our liquidity requirements for at least the next 12 months.months. However, our ability to maintain sufficient liquidity and compliance with our debt instruments over the next 12 months, is dependentgrow, make capital expenditures, and service our debt depends primarily upon (i) the level of demand for, and pricing of, our products and services,services; (ii) the level of spending by our clients,clients; (iii) our ability to collect our receivables and access borrowings under the ABL Credit Facility, the supply and demand for oil, oil and gas prices, general economic and market conditions and other factors which are beyond our control.
The market competition between OPEC and non-OPEC countries andcoupled with the impact of the COVID-19 pandemic has caused significant crude oil price declines in 2020, negatively impacting our industry’s oil producers who responded with significant cuts in their recent and projected spending. A continued decrease in the demand for oil, combined with current depressed oil prices, hasspending which affected, and could continue to negatively affect, the amount of cash we generate and have available for working capital requirements, capital expenditures, and debt service.
Sources of CapitalCapital Resources
Our principal sources of liquidity currently consist of:
•total cash and cash equivalents, including restricted cash ($31.330.5 million as of June 30, 2020)March 31, 2021);
•cash generated from operations; and
23
In the future, we may also consider equity and/or debt offerings, as appropriate, to meet our liquidity needs. However, our ability to access the capital markets by issuing debt or equity securities will be dependent on market conditions, our financial condition, and other factors beyond our control. Additionally, the ABL Credit Facility and the indentures for our Convertible Notes and Senior Secured Notes contain covenants that limit our ability to incur additional indebtedness, the incurrence of which would also first require the approval of two of our principal stockholders, and our bylaws limit our ability to issue equity securities without the prior written consent of one of our principal stockholders.
ABL Credit Facility — On the Effective Date, pursuant to the terms of the Plan, we entered into a senior secured asset-based revolving credit agreement in an aggregate amount of $75 million among us and substantially all of our domestic subsidiaries as borrowers (the “Borrowers”), the lenders party thereto and PNC Bank, National Association as administrative agent and onagent. On August 7, 2020, we entered into a First Amendment to the ABL Credit Facility (together, herein referred to as the “ABL Credit Facility”) which, among other things, reduced the maximum amount of the revolving credit agreement to $40 million.
Among other things, proceeds of loans under the ABL Credit Facility may be used to pay fees and expenses associated with the ABL Credit Facility and finance ongoing working capital and general corporate needs.
The maturity date of loans made under the ABL Credit Facility is the earliest of 90 days prior to maturity of the Senior Secured Notes or the Convertible Notes (both of which are described below in the section entitled Debt Instruments and Compliance Requirements) and May 29, 2025. Borrowings under the ABL Credit Facility will bear interest at a rate of (i)
the LIBOR rate (subject to a floor of 0%) plus an applicable margin of 375 basis points per annum or (ii) the base rate plus an applicable margin of 275 basis points per annum.
The ABL Credit Facility is guaranteed by the Borrowers and is secured by a first lien on the Borrowers’ accounts receivable and inventory, and the cash proceeds thereof, and a second lien on substantially all of the other assets and properties of the Borrowers. The ABL Credit Facility limits our annual capital expenditures to 125% of the budget set forth in the projections for any fiscal year and provides that if our availability plus pledged cash of up to $3 million falls below $6 million (15% of the maximum revolver amount), we will be required to comply with a fixed charge coverage ratio of 1.0 to 1.0, all of which is defined in the ABL Credit Facility. Facility.
As of June 30, 2020,March 31, 2021, we had no borrowings and approximately $7.1$7.3 million in outstanding letters of credit under the ABL Credit Facility and subject to the availability requirements in the ABL Credit Facility, based on eligible accounts receivable and inventory balances at June 30, 2020,March 31, 2021, availability under the ABL Credit Facility was $13.2$16.3 million, which our access to would be limited bysubject to (i) our requirement to maintain 15% of the maximum revolver amount available or comply with a fixed charge coverage ratio, as described above, and (ii) the requirement to maintain availability of at least $4 million, which may include up to $2 million of pledged cash.
Uses of Capital Resources
Our principal liquidity requirements are currently for:
•working capital needs;
•capital expenditures; and
•debt service.
Our working capital needs typically fluctuate in relation to activity and pricing. Following a sustained period of low activity, our working capital needs generally increase as we invest in reactivating previously idle equipment and in purchases of inventory and supplies for expected increasing activity. Our capital requirements to maintain our equipment also fluctuate in relation to activity, and increase following a period of sustained low activity. Our capital requirements are also increased duringDuring periods of expansion at which timesand/or organic growth, we have been more likely to accessmeet increased capital requirements through equity or debt financing. During periods of sustained low activity and pricing, when our cash flow from operations are negatively impacted, we may also access additional capital through the use of available funds under the ABL Credit Facility.
24
Working Capital — Our working capital and current ratio, which we calculate by dividing current assets by current liabilities, waswere as follows as of June 30, 2020March 31, 2021 and December 31, 20192020 (amounts in thousands, except current ratio):
| March 31, 2021 | December 31, 2020 | Change | |||||||||||||||
| Current assets | $ | 112,646 | $ | 113,133 | $ | (487) | |||||||||||
| Current liabilities | 60,529 | 59,018 | 1,511 | ||||||||||||||
| Working capital | $ | 52,117 | $ | 54,115 | $ | (1,998) | |||||||||||
| Current ratio | 1.9 | 1.9 | — | ||||||||||||||
| June 30, 2020 | December 31, 2019 | Change | |||||||||
| Current assets | $ | 122,039 | $ | 182,912 | $ | (60,873 | ) | ||||
| Current liabilities | 65,936 | 91,581 | (25,645 | ) | |||||||
| Working capital | $ | 56,103 | $ | 91,331 | $ | (35,228 | ) | ||||
| Current ratio | 1.9 | 2.0 | (0.1 | ) | |||||||
•The decrease in our working capital during 2020total cash, including cash equivalents and restricted cash, is primarily due to repayments of Senior Secured Notes totaling $1.3 million, as well as $0.3 million of net cash used in operating activities and a net investment of $0.2 million in capital expenditures.
•The decrease in prepaid expenses and other current assets is primarily due to the amortization of $55.5 million, or 61%,prepaid insurance premiums which are generally paid in late October each year.
•The increase in our total trade and unbilled receivables despite a decreaseduring 2021 is attributable primarily to an increase in activity for our international drilling operations, which experienced an increase in revenue of $16.4 million, orapproximately 50%, for the quarter ended March 31, 2021 as compared to the quarter ended December 31, 2020. This increase in activity during 2021, combined with the impact of the timing of the billing and collection cycles for our international drilling contracts, drove the 13% increase in our total trade and unbilled receivables.
Our current liabilities increased $1.5 million during 2021, due to $1.6 million increases in both accrued employee costs and accrued interest, offset partially by decreases in other accrued expenses and trade accounts payable and a $8.8 million decreasepayable.
•The increase in accrued employee costs all of which are primarily a result of the significant decline in demand for our service offerings which resulted in decreased revenue and related costs.
•The increase in prepaid and other current assets partially dueaccrued interest during 2021 is attributable to the usagetiming of professional fee retainers associated withinterest payments on our bankruptcy proceedings.Convertible Notes, for which interest is payable semi-annually in May and November, and our Senior Secured Notes, for which interest is payable quarterly in February, May, August and November each year.
Capital Expenditures — During the first half ofthree months ended March 31, 2021 and 2020, we spent $11.7our capital expenditures totaled $3.7 million on purchases of property.and $7.5 million, respectively, primarily related to routine expenditures that are necessary to maintain our fleets. Currently, we expect to spend a total of $15approximately $17 million to $17$19 million on capital expenditures during 2020, primarily for2021, which is limited to routine expenditures which are necessary to maintain our fleets. Actual capital expenditures may vary depending on the climate of our industry and any resulting increase or decrease in activity levels, the timing of commitments and payments, availability of capital resources, and the level of investment opportunities that meet our strategic and return on capital employed criteria. We expect to fund the remaining capital expenditures in 20202021 from cash and operating cash flow in excess of our working capital requirements, although available borrowings under our ABL Credit Facility are also available, if necessary.
Debt Instruments and Compliance Requirements— On the Effective Date, we entered into a $75 million senior secured asset-based revolving credit agreement which was later amended and reduced to $40 million in August 2020 (the “ABL Credit Facility”), and issued $129.8 million of aggregate principal amount of 5% convertible senior unsecured pay-in-kind notes due 2025 (the “Convertible Notes”) and $78.1 million of aggregate principal amount of floating rate senior secured notes due 2025 (the “Senior Secured Notes”). The proceeds from the issuance of the Convertible Notes and the Senior Secured Notes were used to repay the then outstanding Term Loan.term loan.
25
The following is a summary of our debt instruments and compliance requirements including covenants, restrictions and guarantees, as it relates to our Convertible Notes and Senior Secured Notes, and a summary of our ABL Credit Facility is included in the above section entitled ABL Credit Facility.Facility.As of June 30, 2020,March 31, 2021, we were in compliance with all covenants required by our debt instruments. However, our ability to maintain compliance with our debt instruments, and to service our debt, is dependent upon the level of demand for our products and services, the level of spending by our clients, the supply and demand for oil, oil and gas prices, general economic and market conditions and other factors which are beyond our control. If we are unable to generate cash flow sufficient for debt service and repayment at maturity, we may seek to refinance our debts or access additional capital through debt/equity offerings.
Convertible Notes Indenture and Convertible Notes due 2025. We entered into an indenture, dated as of the Effective Date, among the Company and Wilmington Trust, N.A., as trustee (the “Convertible Notes Indenture”), and issued $129.8 million aggregate principal amount of convertible senior unsecured pay-in-kind notes due 2025 thereunder.
The Convertible Notes are general unsecured obligations which will mature on November 15, 2025, unless earlier accelerated, redeemed, converted or repurchased, and bear interest at a fixed rate of 5% per annum, which will be payable semi-annually in-kind in the form of an increase to the principal amount.
The Convertible Notes are convertible at the option of the holders at any time into shares of our common stock and will convert mandatorily into our common stock at maturity; provided, however, that if the value of our common stock otherwise deliverable in connection with a mandatory conversion of a Convertible Note on the maturity date would be less than the principal amount of such Convertible Note plus accrued and unpaid interest, then the Convertible Note will instead convert into an amount of cash equal to the principal amount thereof plus accrued and unpaid interest. The initial conversion rate is 75 shares of common stock per $1,000 principal amount of the Convertible Notes, which in aggregate represents 9,732,825 shares of common stock and an initial conversion price of $13.33 per share. The conversion rate is subject to customary anti-dilution adjustments.
If we undergo a “fundamental change” as defined in the Convertible Notes Indenture, subject to certain conditions, holders may require us to repurchase all or any portion of their Convertible Notes for cash at an amount equal to 100% of the principal amount of the Convertible Notes to be repurchased plus any accrued and unpaid interest. In the case of certain fundamental change events that constitute merger events (as defined in the Convertible Notes Indenture), we have a superseding right to cause the mandatory conversion of all or part of the Convertible Notes into a number of shares of common stock, per $1,000 principal amount of Convertible Notes, equal to the then-current conversion rate or the cash value of such number of shares of common stock (but not less than the principal amount).stock.
Holders of Convertible Notes are entitled to vote on all matters on which holders of our common stock generally are entitled to vote (or, if any, to take action by written consent of the holders of our common stock), voting together as a single class together with the shares of our common stock and not as a separate class, on an as-converted basis, at any annual or special meeting of holders of our common stock and each holder is entitled to such number of votes as such holder would receive on an as-converted basis on the record date for such vote.
The Convertible Notes Indenture contains covenants that limit our ability and the ability of certain of our subsidiaries to incur, assume or guarantee additional indebtedness and create liens and enter into mergers or consolidations.
The Convertible Notes Indenture also contains customary events of default. In the case of an event of default arising from certain events of bankruptcy, insolvency or other similar law, with respect to us or any of our significant subsidiaries, all outstanding Convertible Notes will become due and payable immediately without further action or notice. If any other event of default occurs and is continuing, then the trustee or the holders of at least 25% in aggregate principal amount of the Convertible Notes then outstanding may declare the Convertible Notes due and payable immediately.
The Convertible Notes Indenture provides, subject to certain exceptions, that for so long as our common stock is registered under the Securities Exchange Act of 1934 (the “Exchange Act”), a beneficial owner of the Convertible Notes is not entitled to receive shares of our common stock upon an optional conversion of any Convertible Notes during any period of time in which the aggregate number of shares of our common stock that may be acquired by such beneficial owner upon conversion of Convertible Notes shall, when added to the aggregate number of shares of our common stock deemed beneficially owned, directly or indirectly, by such beneficial owner and each person subject to aggregation of our common stock with such beneficial owner under Section 13 or Section 16 of the Exchange Act at such time, exceed 9.99% of the total issued and outstanding shares of our common stock. Certain of the holders of Convertible Notes opted out of this provision at the Effective Date.
26
Senior Secured Notes Indenture and Senior Secured Notes due 2025. We entered into an indenture, dated as of the Effective Date, among the Company, the subsidiary guarantors party thereto and Wilmington Trust, N.A., as trustee, as supplemented by the First Supplemental Indenture, dated March 4, 2021 (the “Senior Secured Notes Indenture”), and issued $78.1 million aggregate principal amount of floating rate senior secured notes due 2025 thereunder. The Senior Secured Notes are guaranteed on a senior secured basis by substantially all of our existing domestic subsidiaries, thatwhich also guarantee our obligations under the ABL Credit Facility, (the “Guarantors”) on a full and unconditional basis and are secured by a second lien on the accounts receivable and inventory and a first lien on substantially all of the other assets and properties (including the cash proceeds thereof) of the Company and the Guarantors.
The Senior Secured Notes will mature on May 15, 2025 and interest will accrue at the rate of LIBOR plus 9.5% per annum, with a LIBOR rate floor of 1.5%, payable quarterly in arrears on February 15, May 15, August 15 and November 15 of each year, commencing on August 15, 2020. With respect to any interest payment due on or prior to May 29, 2021, 50% of the interest will be payable in cash and 50% of the interest will be paid in-kind in the form of an increase to the principal amount; however, a majority in interest of the holders of the Senior Secured Notes may elect to have 100% of the interest due on or prior to May 29, 2021 payable in-kind. For all interest periods commencing on or after May 15, 2024, the interest rate for the Senior Secured Notes will be a rate equal to LIBOR plus 10.5%, with a LIBOR rate floor of 1.5%.
We may redeem all or part of the Senior Secured Notes on or after June 1, 2021 at redemption prices (expressed as percentages of the principal amount) equal to (i) 104% for the twelve-month period beginning on June 1, 2021; (ii) 102% for the twelve-month period beginning on June 1, 2022; (iii) 101% for the twelve-month period beginning on June 1, 2023 and (iii)(iv) 100% for the twelve-month period beginning June 1, 2024 and at any time thereafter, plus accrued and unpaid interest at the redemption date. Notwithstanding the foregoing, if a change of control (as defined in the Senior Secured Notes Indenture) occurs prior to June 1, 2022, we may elect to purchase all remaining outstanding Senior Secured Notes not tendered to us as described below at a redemption price equal to 103% of the principal amount thereof, plus accrued and unpaid interest, if any, thereon to the applicable redemption date. If a change of control (as defined in the Senior Secured Notes Indenture) occurs, holders of the Senior Secured Notes will have the right to require us to repurchase all or any part of their Senior Secured Notes at a purchase price equal to 101% of the aggregate principal amount of the Senior Secured Notes repurchased, plus accrued and unpaid interest, if any, to the repurchase date.
The Senior Secured Notes Indenture contains covenants that limit, among other things, our ability and the ability of certain of our subsidiaries, to incur, assume or guarantee additional indebtedness; pay dividends or distributions on capital stock or redeem or repurchase capital stock; make investments; repay junior debt; sell stock of our subsidiaries; transfer or sell assets; enter into sale and lease back transactions; create liens; enter into transactions with affiliates; and enter into mergers or consolidations. The Senior Secured Notes Indenture contains a minimum asset coverage ratio of 1.5 to 1.0 as of any June 30 or December 31, beginning December 31, 2020. As of December 31, 2020, the asset coverage ratio, as calculated under the Senior Secured Notes Indenture, was 3.2 to 1.0.
The Senior Secured Notes Indenture also provides for certain customary events of default, including, among others, nonpayment of principal or interest, breach of covenants, failure to pay final judgments in excess of a specified threshold, failure of a guarantee to remain in effect, failure of a security document to create an effective security interest in collateral, bankruptcy and insolvency events, and cross acceleration, which would permit the principal, premium, if any, interest and other monetary obligations on all the then outstanding Senior Secured Notes to be declared due and payable immediately.
Pursuant to the Senior Secured Notes Indenture, we commenced and completed offers to purchase $2.6 million in aggregate principal amount of the Senior Secured Notes during the year ended December 31, 2020 at a purchase price equal to 100% of the principal amount, plus accrued and unpaid interest through, but not including, the respective purchase dates. During the three months ended March 31, 2021, we completed additional qualifying asset sales and associated offers to purchase an aggregate $1.3 million in principal amount of the Senior Secured Notes and recognized $0.1 million of loss on extinguishment of debt associated with these repayments. As of March 31, 2021, the aggregate principal amount of Senior Secured Notes outstanding is $77.2 million.
Supplemental Guarantor Information
Our Senior Secured Notes are issued by Pioneer Energy Services Corp. (the “Parent Issuer”) and are fully and unconditionally guaranteed, jointly and severally, on a senior secured basis by all existing 100%-owned domestic subsidiaries (the “Guarantors”), except for Pioneer Services Holdings, LLC. The subsidiaries that generally operate our non-U.S. business concentrated in Colombia do not guarantee our Senior Secured Notes (and did not guarantee our Prepetition Senior Notes). The non-guarantor subsidiaries do not have any payment obligations under the Senior Secured Notes, the guarantees, or the
27
Senior Secured Notes Indenture. In the event of a bankruptcy, liquidation or reorganization of any non-guarantor subsidiary, such non-guarantor subsidiary would be obligated to pay the holders of its debt and other liabilities, including its trade creditors, before it would be able to distribute any of its assets to us. As of March 31, 2021, there were no restrictions on the ability of subsidiary guarantors to transfer funds to the parent company.
The following tables present summarized financial information for the Parent Issuer and Guarantors, on a combined basis after the elimination of intercompany balances and transactions between the Parent Issuer and Guarantors and investments in any subsidiary that is a non-guarantor (amounts in thousands):
| March 31, 2021 | |||||
| Current assets, excluding those due from non-guarantor subsidiaries | $ | 86,885 | |||
| Current assets due from non-guarantor subsidiaries | 28,213 | ||||
| Property and equipment, net | 136,225 | ||||
| Noncurrent assets, excluding property and equipment | 15,082 | ||||
| Current liabilities | $ | 55,650 | |||
| Long-term debt | 149,222 | ||||
| Noncurrent liabilities, excluding long-term debt | 7,017 | ||||
| Three Months Ended March 31, 2021 | |||||||||||||||||
| Revenues | $ | 47,675 | |||||||||||||||
| Operating costs | 37,251 | ||||||||||||||||
Loss from operations(1) | (5,502) | ||||||||||||||||
Net loss(1) | (13,038) | ||||||||||||||||
(1) Includes intercompany lease income from non-guarantor subsidiary totaling $1.2 million during the period.
28
Results of Operations
As a result of our emergence from Chapter 11 on May 29, 2020, our financial results for the periods prior to the Fresh Start Reportingfresh start reporting date of May 31, 2020 are referred to as those of the “Predecessor,” and our financial results for the periods subsequent to May 31, 2020 are referred to as those of the “Successor.”
The following table provides certain information about our operations, including details of each of our business segments’ revenues, operating costs and gross margin for the periods indicated (amounts in thousands).
| Successor | Predecessor | ||||||||||||||||||||||||||||||||||||||||||||||||||||||||||||||||
| Three Months Ended March 31, 2021 | Three Months Ended March 31, 2020 | ||||||||||||||||||||||||||||||||||||||||||||||||||||||||||||||||
| Revenues: | |||||||||||||||||||||||||||||||||||||||||||||||||||||||||||||||||
| Domestic drilling | $ | 22,483 | $ | 35,891 | |||||||||||||||||||||||||||||||||||||||||||||||||||||||||||||
| International drilling | 11,063 | 14,455 | |||||||||||||||||||||||||||||||||||||||||||||||||||||||||||||||
| Drilling services | 33,546 | 50,346 | |||||||||||||||||||||||||||||||||||||||||||||||||||||||||||||||
| Well servicing | 14,857 | 25,616 | |||||||||||||||||||||||||||||||||||||||||||||||||||||||||||||||
| Wireline services | 10,335 | 33,133 | |||||||||||||||||||||||||||||||||||||||||||||||||||||||||||||||
| Coiled tubing services | — | 5,227 | |||||||||||||||||||||||||||||||||||||||||||||||||||||||||||||||
| Production services | 25,192 | 63,976 | |||||||||||||||||||||||||||||||||||||||||||||||||||||||||||||||
| Consolidated revenues | $ | 58,738 | $ | 114,322 | |||||||||||||||||||||||||||||||||||||||||||||||||||||||||||||
| Operating costs: | |||||||||||||||||||||||||||||||||||||||||||||||||||||||||||||||||
| Domestic drilling | $ | 15,459 | $ | 23,865 | |||||||||||||||||||||||||||||||||||||||||||||||||||||||||||||
| International drilling | 8,075 | 12,138 | |||||||||||||||||||||||||||||||||||||||||||||||||||||||||||||||
| Drilling services | 23,534 | 36,003 | |||||||||||||||||||||||||||||||||||||||||||||||||||||||||||||||
| Well servicing | 11,888 | 20,951 | |||||||||||||||||||||||||||||||||||||||||||||||||||||||||||||||
| Wireline services | 9,878 | 28,284 | |||||||||||||||||||||||||||||||||||||||||||||||||||||||||||||||
| Coiled tubing services | 26 | 6,784 | |||||||||||||||||||||||||||||||||||||||||||||||||||||||||||||||
| Production services | 21,792 | 56,019 | |||||||||||||||||||||||||||||||||||||||||||||||||||||||||||||||
| Consolidated operating costs | $ | 45,326 | $ | 92,022 | |||||||||||||||||||||||||||||||||||||||||||||||||||||||||||||
| Gross margin: | |||||||||||||||||||||||||||||||||||||||||||||||||||||||||||||||||
| Domestic drilling | $ | 7,024 | $ | 12,026 | |||||||||||||||||||||||||||||||||||||||||||||||||||||||||||||
| International drilling | 2,988 | 2,317 | |||||||||||||||||||||||||||||||||||||||||||||||||||||||||||||||
| Drilling services | 10,012 | 14,343 | |||||||||||||||||||||||||||||||||||||||||||||||||||||||||||||||
| Well servicing | 2,969 | 4,665 | |||||||||||||||||||||||||||||||||||||||||||||||||||||||||||||||
| Wireline services | 457 | 4,849 | |||||||||||||||||||||||||||||||||||||||||||||||||||||||||||||||
| Coiled tubing services | (26) | (1,557) | |||||||||||||||||||||||||||||||||||||||||||||||||||||||||||||||
| Production services | 3,400 | 7,957 | |||||||||||||||||||||||||||||||||||||||||||||||||||||||||||||||
| Consolidated gross margin | $ | 13,412 | $ | 22,300 | |||||||||||||||||||||||||||||||||||||||||||||||||||||||||||||
| Consolidated: | |||||||||||||||||||||||||||||||||||||||||||||||||||||||||||||||||
| Net loss | $ | (16,942) | $ | (69,104) | |||||||||||||||||||||||||||||||||||||||||||||||||||||||||||||
Adjusted EBITDA (1) | $ | 3,644 | $ | 2,090 | |||||||||||||||||||||||||||||||||||||||||||||||||||||||||||||
| Successor | Predecessor | Combined (Non-GAAP) | Predecessor | |||||||||||||
| One Month Ended June 30, 2020 | Two Months Ended May 31, 2020 | Three Months Ended June 30, 2020 | Three Months Ended June 30, 2019 | |||||||||||||
| Revenues: | ||||||||||||||||
| Domestic drilling | $ | 5,866 | $ | 17,450 | $ | 23,316 | $ | 39,652 | ||||||||
| International drilling | 828 | 1,473 | 2,301 | 25,422 | ||||||||||||
| Drilling services | 6,694 | 18,923 | 25,617 | 65,074 | ||||||||||||
| Well servicing | 3,756 | 6,331 | 10,087 | 29,506 | ||||||||||||
| Wireline services | 713 | 2,410 | 3,123 | 47,386 | ||||||||||||
| Coiled tubing services | — | 384 | 384 | 10,877 | ||||||||||||
| Production services | 4,469 | 9,125 | 13,594 | 87,769 | ||||||||||||
| Consolidated revenues | $ | 11,163 | $ | 28,048 | $ | 39,211 | $ | 152,843 | ||||||||
| Operating costs: | ||||||||||||||||
| Domestic drilling | $ | 3,646 | $ | 9,236 | $ | 12,882 | $ | 24,698 | ||||||||
| International drilling | 1,063 | 1,538 | 2,601 | 18,555 | ||||||||||||
| Drilling services | 4,709 | 10,774 | 15,483 | 43,253 | ||||||||||||
| Well servicing | 2,810 | 5,926 | 8,736 | 21,038 | ||||||||||||
| Wireline services | 1,085 | 3,552 | 4,637 | 41,804 | ||||||||||||
| Coiled tubing services | 139 | 1,773 | 1,912 | 9,875 | ||||||||||||
| Production services | 4,034 | 11,251 | 15,285 | 72,717 | ||||||||||||
| Consolidated operating costs | $ | 8,743 | $ | 22,025 | $ | 30,768 | $ | 115,970 | ||||||||
| Gross margin: | ||||||||||||||||
| Domestic drilling | $ | 2,220 | $ | 8,214 | $ | 10,434 | $ | 14,954 | ||||||||
| International drilling | (235 | ) | (65 | ) | (300 | ) | 6,867 | |||||||||
| Drilling services | 1,985 | 8,149 | 10,134 | 21,821 | ||||||||||||
| Well servicing | 946 | 405 | 1,351 | 8,468 | ||||||||||||
| Wireline services | (372 | ) | (1,142 | ) | (1,514 | ) | 5,582 | |||||||||
| Coiled tubing services | (139 | ) | (1,389 | ) | (1,528 | ) | 1,002 | |||||||||
| Production services | 435 | (2,126 | ) | (1,691 | ) | 15,052 | ||||||||||
| Consolidated gross margin | $ | 2,420 | $ | 6,023 | $ | 8,443 | $ | 36,873 | ||||||||
| Consolidated: | ||||||||||||||||
| Net loss | $ | (9,817 | ) | $ | (35,121 | ) | $ | (44,938 | ) | $ | (12,944 | ) | ||||
Adjusted EBITDA (1) | $ | (1,280 | ) | $ | 633 | $ | (647 | ) | $ | 20,668 | ||||||
| Successor | Predecessor | Combined (Non-GAAP) | Predecessor | |||||||||||||
| One Month Ended June 30, 2020 | Five Months Ended May 31, 2020 | Six Months Ended June 30, 2020 | Six Months Ended June 30, 2019 | |||||||||||||
| Revenues: | ||||||||||||||||
| Domestic drilling | $ | 5,866 | $ | 53,341 | $ | 59,207 | $ | 77,661 | ||||||||
| International drilling | 828 | 15,928 | 16,756 | 47,065 | ||||||||||||
| Drilling services | 6,694 | 69,269 | 75,963 | 124,726 | ||||||||||||
| Well servicing | 3,756 | 31,947 | 35,703 | 55,760 | ||||||||||||
| Wireline services | 713 | 35,543 | 36,256 | 93,260 | ||||||||||||
| Coiled tubing services | — | 5,611 | 5,611 | 25,665 | ||||||||||||
| Production services | 4,469 | 73,101 | 77,570 | 174,685 | ||||||||||||
| Consolidated revenues | $ | 11,163 | $ | 142,370 | $ | 153,533 | $ | 299,411 | ||||||||
| Operating costs: | ||||||||||||||||
| Domestic drilling | $ | 3,646 | $ | 33,101 | $ | 36,747 | $ | 47,167 | ||||||||
| International drilling | 1,063 | 13,676 | 14,739 | 35,040 | ||||||||||||
| Drilling services | 4,709 | 46,777 | 51,486 | 82,207 | ||||||||||||
| Well servicing | 2,810 | 26,877 | 29,687 | 39,934 | ||||||||||||
| Wireline services | 1,085 | 31,836 | 32,921 | 81,151 | ||||||||||||
| Coiled tubing services | 139 | 8,557 | 8,696 | 21,263 | ||||||||||||
| Production services | 4,034 | 67,270 | 71,304 | 142,348 | ||||||||||||
| Consolidated operating costs | $ | 8,743 | $ | 114,047 | $ | 122,790 | $ | 224,555 | ||||||||
| Gross margin: | ||||||||||||||||
| Domestic drilling | $ | 2,220 | $ | 20,240 | $ | 22,460 | $ | 30,494 | ||||||||
| International drilling | (235 | ) | 2,252 | 2,017 | 12,025 | |||||||||||
| Drilling services | 1,985 | 22,492 | 24,477 | 42,519 | ||||||||||||
| Well servicing | 946 | 5,070 | 6,016 | 15,826 | ||||||||||||
| Wireline services | (372 | ) | 3,707 | 3,335 | 12,109 | |||||||||||
| Coiled tubing services | (139 | ) | (2,946 | ) | (3,085 | ) | 4,402 | |||||||||
| Production services | 435 | 5,831 | 6,266 | 32,337 | ||||||||||||
| Consolidated gross margin | $ | 2,420 | $ | 28,323 | $ | 30,743 | $ | 74,856 | ||||||||
| Consolidated: | ||||||||||||||||
| Net loss | $ | (9,817 | ) | $ | (104,225 | ) | $ | (114,042 | ) | $ | (28,059 | ) | ||||
Adjusted EBITDA (1) | $ | (1,280 | ) | $ | 2,723 | $ | 1,443 | $ | 40,590 | |||||||
(1) Adjusted EBITDA represents income (loss) before interest expense, income tax (expense) benefit, depreciation and amortization, pre-petitionprepetition restructuring charges, impairment, reorganization items, and any loss on extinguishment of debt. Adjusted EBITDA is a non-GAAP measure that our management uses to facilitate period-to-period comparisons of our core operating performance and to evaluate our long-term financial performance against that of our peers. We believe that this measure is useful to investors and analysts in allowing for greater transparency of our core operating performance and makes it easier to compare our results with those of other companies within our industry. Adjusted EBITDA should not be considered (a) in isolation of, or as a substitute for, net income (loss), (b) as an indication of cash flows from operating activities or (c) as a measure of liquidity. In addition, Adjusted EBITDA does not represent funds available for discretionary use. Adjusted EBITDA may not be comparable to other similarly titled measures reported by other companies.
29
A reconciliation of net loss, as reported, to Adjusted EBITDA, and to consolidated gross margin, are set forth in the following table (amounts in thousands):
| Successor | Predecessor | |||||||||||||||||||||||||||||||||||||||||||
| Three Months Ended March 31, 2021 | Three Months Ended March 31, 2020 | |||||||||||||||||||||||||||||||||||||||||||
| Net loss | $ | (16,942) | $ | (69,104) | ||||||||||||||||||||||||||||||||||||||||
| Depreciation and amortization | 13,365 | 21,984 | ||||||||||||||||||||||||||||||||||||||||||
| Prepetition restructuring charges | — | 17,074 | ||||||||||||||||||||||||||||||||||||||||||
| Impairment | — | 17,853 | ||||||||||||||||||||||||||||||||||||||||||
| Reorganization items, net | 146 | 6,663 | ||||||||||||||||||||||||||||||||||||||||||
| Interest expense | 6,534 | 8,651 | ||||||||||||||||||||||||||||||||||||||||||
| Loss on extinguishment of debt | 83 | — | ||||||||||||||||||||||||||||||||||||||||||
| Income tax expense (benefit) | 458 | (1,031) | ||||||||||||||||||||||||||||||||||||||||||
| Adjusted EBITDA | 3,644 | 2,090 | ||||||||||||||||||||||||||||||||||||||||||
| General and administrative | 9,713 | 14,655 | ||||||||||||||||||||||||||||||||||||||||||
| Bad debt recovery (expense), net | (197) | 727 | ||||||||||||||||||||||||||||||||||||||||||
| Gain on dispositions of property and equipment, net | (2,298) | (717) | ||||||||||||||||||||||||||||||||||||||||||
| Other expense | 2,550 | 5,545 | ||||||||||||||||||||||||||||||||||||||||||
| Consolidated gross margin | $ | 13,412 | $ | 22,300 | ||||||||||||||||||||||||||||||||||||||||
| Successor | Predecessor | Combined (Non-GAAP) | Predecessor | |||||||||||||
| One Month Ended June 30, 2020 | Two Months Ended May 31, 2020 | Three Months Ended June 30, 2020 | Three Months Ended June 30, 2019 | |||||||||||||
| Net loss | $ | (9,817 | ) | $ | (35,121 | ) | $ | (44,938 | ) | $ | (12,944 | ) | ||||
| Depreciation and amortization | 5,236 | 13,663 | 18,899 | 22,851 | ||||||||||||
| Pre-petition restructuring charges | — | (252 | ) | (252 | ) | — | ||||||||||
| Impairment | 388 | — | 388 | 332 | ||||||||||||
| Reorganization items, net | 1,144 | 15,240 | 16,384 | — | ||||||||||||
| Interest expense | 2,215 | 4,135 | 6,350 | 10,105 | ||||||||||||
| Loss on extinguishment of debt | — | 3,723 | 3,723 | — | ||||||||||||
| Income tax expense (benefit) | (446 | ) | (755 | ) | (1,201 | ) | 324 | |||||||||
| Adjusted EBITDA | (1,280 | ) | 633 | (647 | ) | 20,668 | ||||||||||
| General and administrative | 4,213 | 7,392 | 11,605 | 18,028 | ||||||||||||
| Bad debt recovery (expense), net | (283 | ) | 482 | 199 | (348 | ) | ||||||||||
| Gain on dispositions of property and equipment, net | (460 | ) | (272 | ) | (732 | ) | (1,126 | ) | ||||||||
| Other expense (income) | 230 | (2,212 | ) | (1,982 | ) | (349 | ) | |||||||||
| Consolidated gross margin | $ | 2,420 | $ | 6,023 | $ | 8,443 | $ | 36,873 | ||||||||
| Successor | Predecessor | Combined (Non-GAAP) | Predecessor | |||||||||||||
| One Month Ended June 30, 2020 | Five Months Ended May 31, 2020 | Six Months Ended June 30, 2020 | Six Months Ended June 30, 2019 | |||||||||||||
| Net loss | $ | (9,817 | ) | $ | (104,225 | ) | $ | (114,042 | ) | $ | (28,059 | ) | ||||
| Depreciation and amortization | 5,236 | 35,647 | 40,883 | 45,504 | ||||||||||||
| Pre-petition restructuring charges | — | 16,822 | 16,822 | — | ||||||||||||
| Impairment | 388 | 17,853 | 18,241 | 1,378 | ||||||||||||
| Reorganization items, net | 1,144 | 21,903 | 23,047 | — | ||||||||||||
| Interest expense | 2,215 | 12,294 | 14,509 | 19,990 | ||||||||||||
| Loss on extinguishment of debt | ��� | 4,215 | 4,215 | — | ||||||||||||
| Income tax expense (benefit) | (446 | ) | (1,786 | ) | (2,232 | ) | 1,777 | |||||||||
| Adjusted EBITDA | (1,280 | ) | 2,723 | 1,443 | 40,590 | |||||||||||
| General and administrative | 4,213 | 22,047 | 26,260 | 37,786 | ||||||||||||
| Bad debt recovery (expense), net | (283 | ) | 1,209 | 926 | (286 | ) | ||||||||||
| Gain on dispositions of property and equipment, net | (460 | ) | (989 | ) | (1,449 | ) | (2,201 | ) | ||||||||
| Other expense (income) | 230 | 3,333 | 3,563 | (1,033 | ) | |||||||||||
| Consolidated gross margin | $ | 2,420 | $ | 28,323 | $ | 30,743 | $ | 74,856 | ||||||||
Consolidated gross margin— We experienced a significant decline in demand for all our service offerings beginning in March 2020 as a result of the economic downturn caused by the COVID-19 pandemic and adverse global oil production and pricing decisions made by OPEC and non-OPEC countries, as described in more detail in the earlier section above entitled, “Market Conditions and Outlook.Outlook.” Our consolidated gross margin decreased by $28.4$8.9 million, or 77%40%, for the three months ended June 30, 2020, and decreased by $44.1 million, or 59%, for the six months ended June 30, 2020, as compared to the corresponding periods in 2019. Our production services offerings, which are heavily completion-oriented businesses, were most significantly impacted by the decline in demand, with a combined gross margin decrease of 81% for the six months ended June 30, 2020March 31, 2021, as compared to the corresponding period in 2019. While2020 with our domestic drilling and wireline businesses experiencing a combined $9.4 million decrease in gross margin.
•DrillingServices— On a percentage basis, our drilling services business were also significantly impacted,revenues and experienced a combined 42% gross margin decrease during this same period, the impact was mitigated by the longer term nature of the operations, which are typically supported by term contracts.
| Successor | Predecessor | Combined (Non-GAAP) | Predecessor | |||||||||||||
| One Month Ended June 30, 2020 | Two Months Ended May 31, 2020 | Three Months Ended June 30, 2020 | Three Months Ended June 30, 2019 | |||||||||||||
| Domestic drilling: | ||||||||||||||||
| Average number of drilling rigs | 17 | 17 | 17 | 17 | ||||||||||||
| Utilization rate | 53 | % | 69 | % | 64 | % | 95 | % | ||||||||
| Revenue days | 270 | 718 | 988 | 1,476 | ||||||||||||
| Average revenues per day | $ | 21,726 | $ | 24,304 | $ | 23,599 | $ | 26,864 | ||||||||
| Average operating costs per day | 13,504 | 12,864 | 13,038 | 16,733 | ||||||||||||
| Average margin per day | $ | 8,222 | $ | 11,440 | $ | 10,561 | $ | 10,131 | ||||||||
| International drilling: | ||||||||||||||||
| Average number of drilling rigs | 8 | 8 | 8 | 8 | ||||||||||||
| Utilization rate | 10 | % | 4 | % | 6 | % | 86 | % | ||||||||
| Revenue days | 25 | 20 | 45 | 623 | ||||||||||||
| Average revenues per day | $ | 33,120 | $ | 73,650 | $ | 51,133 | $ | 40,806 | ||||||||
| Average operating costs per day | 42,520 | 76,900 | 57,800 | 29,783 | ||||||||||||
| Average margin per day | $ | (9,400 | ) | $ | (3,250 | ) | $ | (6,667 | ) | $ | 11,023 | |||||
| Successor | Predecessor | |||||||||||||||||||||||||||||||||||||||||||||||||||||||||||||||||
| Three Months Ended March 31, 2021 | Three Months Ended March 31, 2020 | |||||||||||||||||||||||||||||||||||||||||||||||||||||||||||||||||
| Successor | Predecessor | Combined (Non-GAAP) | Predecessor | |||||||||||||||||||||||||||||||||||||||||||||||||||||||||||||||
| One Month Ended June 30, 2020 | Five Months Ended May 31, 2020 | Six Months Ended June 30, 2020 | Six Months Ended June 30, 2019 | |||||||||||||||||||||||||||||||||||||||||||||||||||||||||||||||
| Domestic drilling: | Domestic drilling: | |||||||||||||||||||||||||||||||||||||||||||||||||||||||||||||||||
| Average number of drilling rigs | 17 | 17 | 17 | 17 | Average number of drilling rigs | 17 | 17 | |||||||||||||||||||||||||||||||||||||||||||||||||||||||||||
| Utilization rate | 53 | % | 81 | % | 77 | % | 96 | % | Utilization rate | 68 | % | 89 | % | |||||||||||||||||||||||||||||||||||||||||||||||||||||
| Revenue days | 270 | 2,100 | 2,370 | 2,896 | Revenue days | 1,034 | 1,382 | |||||||||||||||||||||||||||||||||||||||||||||||||||||||||||
| Average revenues per day | $ | 21,726 | $ | 25,400 | $ | 24,982 | $ | 26,817 | Average revenues per day | $ | 21,744 | $ | 25,970 | |||||||||||||||||||||||||||||||||||||||||||||||||||||
| Average operating costs per day | 13,504 | 15,762 | 15,505 | 16,287 | Average operating costs per day | 14,951 | 17,268 | |||||||||||||||||||||||||||||||||||||||||||||||||||||||||||
| Average margin per day | $ | 8,222 | $ | 9,638 | $ | 9,477 | $ | 10,530 | Average margin per day | $ | 6,793 | $ | 8,702 | |||||||||||||||||||||||||||||||||||||||||||||||||||||
| International drilling: | International drilling: | |||||||||||||||||||||||||||||||||||||||||||||||||||||||||||||||||
| Average number of drilling rigs | 8 | 8 | 8 | 8 | Average number of drilling rigs | 8 | 8 | |||||||||||||||||||||||||||||||||||||||||||||||||||||||||||
| Utilization rate | 10 | % | 28 | % | 25 | % | 83 | % | Utilization rate | 44 | % | 43 | % | |||||||||||||||||||||||||||||||||||||||||||||||||||||
| Revenue days | 25 | 335 | 360 | 1,203 | Revenue days | 319 | 315 | |||||||||||||||||||||||||||||||||||||||||||||||||||||||||||
| Average revenues per day | $ | 33,120 | $ | 47,546 | $ | 46,544 | $ | 39,123 | Average revenues per day | $ | 34,680 | $ | 45,889 | |||||||||||||||||||||||||||||||||||||||||||||||||||||
| Average operating costs per day | 42,520 | 40,824 | 40,942 | 29,127 | Average operating costs per day | 25,313 | 38,533 | |||||||||||||||||||||||||||||||||||||||||||||||||||||||||||
| Average margin per day | $ | (9,400 | ) | $ | 6,722 | $ | 5,602 | $ | 9,996 | Average margin per day | $ | 9,367 | $ | 7,356 | ||||||||||||||||||||||||||||||||||||||||||||||||||||
Our domestic drilling average revenues and margin per day increased by 4% and decreased by 10% for the three and six months ended June 30, 2020,March 31, 2021 decreased by 16% and 22%, respectively, as compared to the corresponding periodsperiod in 2019, as revenue days decreased by 33% and 18%, respectively. Average revenues per day declined during 2020 asprimarily due to the decline in dayrates for contracts that were renewed or renegotiated during 2020, as well as the impact of increased amortization of deferred mobilization revenue and renegotiated in late 2019costs during 2020 for rigs that were reduced, the decreases of which were partially offset by the benefit of $1.2 million of additional revenues associated with the early termination of one of our domestic drillingdeployed under new contracts in May 2020, which is netthe second half of $0.4 million of early termination revenue recognized in the corresponding period in 2019. Additionally, beginning in late March 2020, rather than terminating their contracts with us, certain of our clients elected to temporarily stack three of our rigs, placing them on an extended standby for a reduced revenue rate and the option to reactivate the rigs through the remainder of the contract term. Although these drilling rigs earn lower standby rates as compared to daywork rates, operating costs incurred are minimal, which reduces operating costs per day and benefits overall margin per day.
30
Our international drilling operations experienced decreases of 93% and 70% in revenue days duringaverage margin per day improved 27% for the three and six months ended June 30, 2020, respectively,March 31, 2021 as compared to the corresponding periodsperiod in 2019, while average2020, despite only a 2% improvement in utilization over the same period. Average revenues and operating costs per day increased,decreased by 24% and 34%, respectively, as certain customers terminated or suspended drilling contracts in 2020 in response to the recent decline in industry conditions, whichconditions. These contract terminations and suspensions in 2020 also resulted in an increase in rig demobilization activity, for which revenues and costs are higher than daywork activity, andbut for which there are no associated revenue days. The decline in utilization combined with an increasedecrease in rig standby and demobilization costs for the three months ended March 31, 2021 as compared to the corresponding period in 2020 contributed to the decreasesimprovement in average margin per day.day during 2021.
•Production Services— Our revenues and operating costs from production services each decreased by $97.1 million, or 56%, and $71.0 million, or 50%,61% for the sixthree months ended June 30, 2020, respectively,March 31, 2021 as compared to the corresponding period in 2019.2020. The following table provides operating statistics for each of our production services segments:
| Successor | Predecessor | Combined (Non-GAAP) | Predecessor | |||||||||||||
| One Month Ended June 30, 2020 | Two Months Ended May 31, 2020 | Three Months Ended June 30, 2020 | Three Months Ended June 30, 2019 | |||||||||||||
| Well servicing: | ||||||||||||||||
| Average number of rigs | 123 | 123 | 123 | 125 | ||||||||||||
| Utilization rate | 26 | % | 23 | % | 24 | % | 60 | % | ||||||||
| Rig hours | 7,765 | 12,565 | 20,330 | 51,895 | ||||||||||||
| Average revenue per hour | $ | 484 | $ | 504 | $ | 496 | $ | 569 | ||||||||
| Wireline services: | ||||||||||||||||
| Average number of units | 93 | 93 | 93 | 95 | ||||||||||||
| Number of stages | 92 | 383 | 475 | 7,514 | ||||||||||||
| Coiled tubing services: | ||||||||||||||||
| Average number of units | 9 | 9 | 9 | 9 | ||||||||||||
| Revenue days | — | 20 | 20 | 307 | ||||||||||||
| Average revenue per day | $ | — | $ | 19,200 | $ | 19,200 | $ | 35,430 | ||||||||
| Successor | Predecessor | Combined (Non-GAAP) | Predecessor | Successor | Predecessor | ||||||||||||||||||||||||||||||||||||||||||||||||||||||||||
| One Month Ended June 30, 2020 | Five Months Ended May 31, 2020 | Six Months Ended June 30, 2020 | Six Months Ended June 30, 2019 | Three Months Ended March 31, 2021 | Three Months Ended March 31, 2020 | ||||||||||||||||||||||||||||||||||||||||||||||||||||||||||
| Well servicing: | Well servicing: | ||||||||||||||||||||||||||||||||||||||||||||||||||||||||||||||
| Average number of rigs | 123 | 123 | 123 | 125 | Average number of rigs | 123 | 123 | ||||||||||||||||||||||||||||||||||||||||||||||||||||||||
| Utilization rate | 26 | % | 40 | % | 38 | % | 57 | % | Utilization rate | 35 | % | 51 | % | ||||||||||||||||||||||||||||||||||||||||||||||||||
| Rig hours | 7,765 | 56,797 | 64,562 | 98,959 | Rig hours | 29,858 | 44,232 | ||||||||||||||||||||||||||||||||||||||||||||||||||||||||
| Average revenue per hour | $ | 484 | $ | 562 | $ | 553 | $ | 563 | Average revenue per hour | $ | 498 | $ | 579 | ||||||||||||||||||||||||||||||||||||||||||||||||||
| Wireline services: | Wireline services: | ||||||||||||||||||||||||||||||||||||||||||||||||||||||||||||||
| Average number of units | 93 | 93 | 93 | 100 | Average number of units | 74 | 93 | ||||||||||||||||||||||||||||||||||||||||||||||||||||||||
| Number of stages | 92 | 6,510 | 6,602 | 14,209 | Number of stages | 2,591 | 6,070 | ||||||||||||||||||||||||||||||||||||||||||||||||||||||||
| Coiled tubing services: | |||||||||||||||||||||||||||||||||||||||||||||||||||||||||||||||
| Average number of units | 9 | 9 | 9 | 9 | |||||||||||||||||||||||||||||||||||||||||||||||||||||||||||
| Revenue days | — | 226 | 226 | 658 | |||||||||||||||||||||||||||||||||||||||||||||||||||||||||||
| Average revenue per day | $ | — | $ | 24,827 | $ | 24,827 | $ | 39,005 | |||||||||||||||||||||||||||||||||||||||||||||||||||||||
Our well servicing rig hours decreased by 61% and 35%32% for the three and six months ended June 30, 2020, respectively,March 31, 2021 as compared to the corresponding periodsperiod in 2019,2020, while average revenues per hour decreased by 13% and 2%, respectively.14%. Although overall activity declined beginning in March 2020, especially for completion services, average revenues per hour remained relatively stable until June 2020 in regions where pricing was slower to respond to economic conditions.
Our wireline services business segment experienced decreases of 94%57% and 26%32% in the number of perforating stages performed and revenue per stage, respectively, for the three months ended June 30, 2020, and decreases of 54% and 13% in the number of perforating stages performed and revenue per stage, respectively, for the six months ended June
In April 2020,early 2021, we closed our coiled tubing operations and idled all our coiled tubing equipment, which were subsequently placed as held for sale. This closure, combined with theanother operating location that experienced a decline in demandrevenue and are continuing our evaluation of this business for our coiled tubing services prior to April 2020, resulted in the 66% decrease in revenue daysfurther cost reductions.
Depreciation and the 36% decrease in average revenue per dayamortization expense — Our depreciation expense decreased by $8.6 million, or 39%, for the sixthree months ended June 30, 2020March 31, 2021 as compared to the corresponding period in 2019.
Impairment— Due to the significant decline in industry conditions, commodity prices, and projected utilization of equipment, as well as the COVID-19 pandemic’s impact on our industry, our projected cash flows declined during the first quarter of 2020, and we performed recoverability testing on all our reporting units. As a result of this analysis, we incurred
31
impairment charges of $16.4 million and $1.9$1.5 million during 2020 to reduce the carrying values of our coiled tubing assets and certain held-for-sale assets, respectively, to their estimated fair values. For more detail, see Note 5, Property and Equipment, of the Notes to Condensed Consolidated Financial Statements, included in Part I, Item 1, Financial Statements, of this Quarterly Report on Form 10-Q.
Reorganization items, net — Any expenses, gains, and losses incurred subsequent to and as a direct result of the filing for Chapter 11 and directly related to such proceedings are presented as reorganization items in our condensed consolidated statements of operations. For more detail, see Note 2, Emergence from Voluntary Reorganization under Chapter 11,, of the Notes to Condensed Consolidated Financial Statements, included in Part I,II, Item 1, 8, Financial Statements and Supplementary Data, of this Quarterly Reportour annual report on Form 10-Q.10-K for the year ended December 31, 2020.
Interest expense — Our interest expense decreased by $5.5$2.1 million, or 24% for the sixthree months ended June 30, 2020,March 31, 2021 as compared to the corresponding period in 2019,2020, primarily because the Prepetition Senior Notes stopped accruing interest as of March 1, 2020, in accordance with the terms of the Plan, as well asand because our total outstanding debt was significantly reduced interest expense in June 2020 subsequent toupon our emergence from Chapter 11. The overall decreases were slightly offset by an increase in amortization of debt discounts and issuance costs, which increased the total effective interest rate during the period.
Income tax expense (benefit)— Our effective tax rates differ from the applicable U.S. statutory rates primarily due to the impact of valuation allowances, including those against the losses generated in the U.S. for which no benefit was recorded because we believe it is more likely than not that the tax benefits would not be realized and the change in the valuation allowance due to the application of fresh start accounting, as well as the impact of state taxes, other permanent differences, and the mix of profit and loss between federal, state and international taxing jurisdictions with different tax rates. For more information, see Note 8, Taxes, of the Notes to Condensed Consolidated Financial Statements, included in Part I, Item 1, Financial Statements, of this Quarterly Report on Form 10-Q.
General and administrative expense — Our general and administrative expense decreased by $11.5$4.9 million, or 31%34%, for the sixthree months ended June 30, 2020March 31, 2021 as compared to the corresponding period in 2019,2020, of which $8.7$3.9 million is attributable to reduced employee costs,costs. During 2020, we implemented various cost cutting measures including, a $5.8 million decreaseamong other things, reductions in headcount, incentive compensation, primarily associated with the termination ofand base salary compensation for our previous annualexecutives and long-termother administrative personnel, and reduced cash incentive awards in 2019 and the suspension of incentive awards in early 2020. compensation for our non-employee directors.
Gain on dispositions of property and equipment, net— During the sixthree months ended June 30, 2020March 31, 2021 and the corresponding period in 2019,2020, we recognized net gains of $1.4$2.3 million and $2.2$0.7 million, respectively, on the disposition or sale of various property and equipment, including drill pipe and collars and certain older and/or underutilized equipment.primarily for the sale of coiled tubing equipment during the three months ended March 31, 2021.
Other expense (income)— The decrease in our other incomeexpense for the sixthree months ended June 30,March 31, 2021 as compared to the corresponding period in 2020 is primarily related to $5.6$2.6 million of net foreign currency losses recognized for our Colombian operations, as compared to $0.4$5.6 million of net foreign currency losses during the corresponding period in 2019.2020.
Critical Accounting Policies and Estimates
The preparation of financial statements in conformity with U.S. GAAP requires us to make estimates and assumptions that affect the amounts reported in our financial statements and accompanying notes. Actual results could differ from those estimates. Except for the applicationAs of fresh start accounting,March 31, 2021, there were no significant changes to our critical accounting policies since the date of our annual report on Form 10-K for the year ended December 31, 2019.2020.
Accounting estimates — Material estimates affecting our financial results, including those that are particularly susceptible to significant changes in the near term, relate to our application of fresh start accounting, our estimates of certain variable revenues and amortization periods of certain deferred revenues and costs associated with drilling daywork contracts, our estimates of projected cash flows and fair values for impairment evaluations, our estimate of the valuation allowance for deferred tax assets, and our estimate of the liability relating to the self-insurance portion of our health and workers’ compensation insurance.
•Revenues. In accordance with ASC Topic 606, Revenue from Contracts with Customers, we estimate certain variable revenues associated with the demobilization of our drilling rigs under daywork drilling contracts. We also make estimates of the applicable amortization periods for deferred mobilization costs, and for mobilization revenues related to cancelable term contracts which represent a material right to our clients. These estimates and assumptions are described in more detail in Note 4, 2, Revenue from Contracts with Customers. In order to make these estimates, management considers all the facts and circumstances pertaining to each particular contract, our past experience and knowledge of current market conditions. For more information, see Note 4, 2, Revenue from Contracts with Customers, of the Notes to Condensed Consolidated Financial Statements, included in Part I, Item 1, Financial Statements, of this Quarterly Report on Form 10-Q.
•Impairment Evaluation. In accordance with ASC Topic 360, Property, Plant and Equipment, we monitor all indicators of potential impairments.impairments. Due to the significant decline in industry conditions, commodity prices, and projected utilization of equipment, as well as the COVID-19 pandemic’s impact on our industry, our projected cash flows declined during the
32
first quarter of 2020, and we performed recoverability testing on all our reporting units. As a result of this analysis, we incurred impairment charges of $16.4 million to reduce the carrying values of our coiled tubing assets to their estimated fair values during the three months ended March 31, 2020. For all our other reporting units, excluding coiled tubing, we determined that the sum of the estimated future undiscounted net cash flows were in excess of the carrying amounts and that no impairment existed for these reporting units at March 31, 2020. We continuedcontinue to monitor
potential indicators of impairment through June 30, 2020 and concluded that none of our reporting units are currently at risk of impairment.impairment at March 31, 2021.
The assumptions we use in the evaluation for impairment are inherently uncertain and require management judgment. Although we believe the assumptions and estimates used in our impairment analysis are reasonable, different assumptions and estimates could materially impact the analysis and resulting conclusions. The most significant inputs used in our impairment analysis include the projected utilization and pricing of our services, as well as the estimated proceeds upon any future sale or disposal of the assets, all of which are classified as Level 3 inputs as defined by ASC Topic 820, Fair Value Measurements and Disclosures. If commodity prices decrease or remain at current levels for an extended period of time, or if the demand for any of our services decreases below what we are currently projecting, our estimated cash flows may decrease and our estimates of the fair value of certain assets may decrease as well. If any of the foregoing were to occur, we could incur impairment charges on the related assets. For more information, see Note 5, 3, Property and Equipment, of the Notes to Condensed Consolidated Financial Statements, included in Part I, Item 1, Financial Statements, of this Quarterly Report on Form 10-Q.
•Deferred Tax Assets. We provide a valuation allowance when it is more likely than not that some portion of our deferred tax assets will not be realized. We evaluated the impact of the reorganization, including the change in control, resulting from our bankruptcy emergence and determined it is more likely than not that we will not fully realize future income tax benefits related to our domestic net deferred tax assets based on the annual limitations that impact us, historical results, and expected market conditions.conditions known on the date of measurement. For more information, see Note 8, 6, Taxes, of the Notes to Condensed Consolidated Financial Statements, included in Part I, Item 1, Financial Statements, of this Quarterly Report on Form 10-Q.
•Insurance Claim Liabilities. We use a combination of self-insurance and third-party insurance for various types of coverage. We have stop-loss coverage of $225,000 per covered individual per year under our health insurance and a deductibledeductibles of $500,000 and $250,000 per occurrence under our workers’ compensation insurance.and auto liability insurance, respectively. We have a $500,000 self-insured retention and an additional aggregate deductible of $250,000 per occurrence$500,000 under both our general liability insurance and auto liability insurance as well as an additional annual aggregate deductible of $250,000 under our general liability insurance.$1,000,000 on the first layer of excess coverage. At June 30, 2020,March 31, 2021, our accrued insurance premiums and deductibles include approximately $0.8$0.7 million of accruals for costs incurred under the self-insurance portion of our health insurance and approximately $2.2$1.8 million of accruals for costs associated with our workers’ compensation insurance. We accrue for these costs as claims are incurred using an actuarial calculation that is based on industry and our company’s historical claim development data, and we accrue the cost of administrative services associated with claims processing.
For more information, about recently issued accounting standards, see Note 1, Organization10, Commitments, Contingencies and Summary of Significant Accounting Policies, Insurance Claim Liabilities of the Notes to Condensed Consolidated Financial Statements, included in Part I, Item 1, Financial Statements, of this Quarterly Report on Form 10-Q.
33
ITEM 3. QUANTITATIVE AND QUALITATIVE DISCLOSURES ABOUT MARKET RISK |
Our exposure to market risk primarily consists of (i) interest rate risk associated with our variable rate debt and (ii) foreign currency exchange rate risk associated with our international operations in Colombia.
Interest Rate Risk — We are exposed to interest rate market risk on our variable rate debt. We do not use financial instruments for trading or other speculative purposes. As of March 31, 2021, the principal amount outstanding under our variable rate debt, the Senior Secured Notes, was $77.2 million. The impact of a hypothetical 1% increase or decrease in interest rates on this amount of debt would have resulted in a corresponding increase or decrease, respectively, in interest expense of approximately $0.2 million during the three months ended March 31, 2021. This potential increase or decrease is based on the simplified assumption that the level of variable rate debt remains constant with an immediate across-the-board interest rate increase or decrease as of January 1, 2021.
Foreign Currency Risk — While the U.S. dollar is the functional currency for reporting purposes for our Colombian operations, we enter into transactions denominated in Colombian Pesos. Nonmonetary assets and liabilities are translated at historical rates and monetary assets and liabilities are translated at exchange rates in effect at the end of the period. Income statement accounts are translated at average rates for the period. As a result, Colombian Peso denominated transactions are affected by changes in exchange rates. We generally accept the exposure to exchange rate movements without using derivative financial instruments to manage this risk. Therefore, both positive and negative movements in the Colombian Peso currency exchange rate against the U.S. dollar have and will continue to affect the reported amount of revenues, expenses, profit, and assets and liabilities in our consolidated financial statements. The impact of currency rate changes on our Colombian Peso denominated transactions and balances resulted in net foreign currency losses of $2.6 million for the three months ended March 31, 2021.
ITEM 4. CONTROLS AND PROCEDURES
In accordance with Exchange Act Rules 13a-15 and 15d-15, we carried out an evaluation, under the supervision and with the participation of management, including our Chief Executive Officer and Chief Financial Officer, of the effectiveness of our disclosure controls and procedures as of the end of the period covered by this report. Based upon that evaluation, our Chief Executive Officer and Chief Financial Officer concluded that our disclosure controls and procedures were effective as of June 30, 2020,March 31, 2021, to ensureprovide reasonable assurance that information required to be disclosed in our reports filed or submitted under the Exchange Act is (1) recorded, processed, summarized and reported within the time periods specified in the Securities and Exchange Commission’s rules and forms and (2) accumulated and communicated to our management, including our Chief Executive Officer and Chief Financial Officer, as appropriate to allow timely decisions regarding required disclosure.
In the ordinary course of business, we may make changes to our systems and processes to improve controls and increase efficiency, and make changes to our internal controls over financial reporting in order to ensure that we maintain an effective internal control environment.
34
PART II - OTHER INFORMATION
ITEM 1. LEGAL PROCEEDINGS
From time to time, we are involved in routine litigation or subject to disputes or claims arising out of our business activities, including workers’ compensation claims and employment-related disputes. In the opinion of our management, none of the pending litigation, disputes or claims against us will have a material adverse effect on our financial condition, results of operations or cash flows. For information on Legal Proceedings, see Note 13, 10, Commitments, Contingencies and ContingenciesInsurance Claim Liabilities, of the Notes to Condensed Consolidated Financial Statements, included in Part I, Item 1 Financial Statements, of this Quarterly Report on Form 10-Q.
ITEM 1A.RISK FACTORS
| Period | Total Number of Shares Purchased (1) | Average Price Paid per Share (2) | Total Number of Shares Purchased as Part of Publicly Announced Plans or Programs | Maximum Number of Shares that May Yet Be Purchased Under the Plans or Programs | ||||||||
| April 1 - April 30 | 100,228 | $ | 0.02 | — | — | |||||||
| May 1 - May 31 | — | — | — | — | ||||||||
| June 1 - June 30 | 1,387 | 19.12 | — | — | ||||||||
| Total | 101,615 | $ | 0.28 | — | — | |||||||
ITEM 3.DEFAULTS UPON SENIOR SECURITIES
None.
ITEM 4. MINE SAFETY DISCLOSURES
Not applicable.
None.
35
ITEM 6. EXHIBITS
The following exhibits are filed as part of this report:
| Exhibit Number | Description | |||||||||||||
| 3.1* | - | |||||||||||||
| 3.2* | - | |||||||||||||
| 4.1* | - | |||||||||||||
| 4.2* | - | |||||||||||||
| 4.3* | - | |||||||||||||
| 4.4* | - | |||||||||||||
| 4.5* | - | |||||||||||||
| 4.6* | - | |||||||||||||
| 4.7* | - | |||||||||||||
| 31.1** | - | |||||||||||||
| 31.2** | - | |||||||||||||
| 32.1# | - | |||||||||||||
| 32.2# | - | |||||||||||||
| 101.INS | - | Inline XBRL Instance Document—the instance document does not appear in the Interactive Data File as its XBRL tags are embedded within the Inline XBRL document | ||||||||||||
| 101.SCH | - | Inline XBRL Taxonomy Extension Schema Document | ||||||||||||
| - | Inline XBRL Taxonomy Extension Calculation Linkbase Document | |||||||||||||
| - | Inline XBRL Taxonomy Extension Label Linkbase Document | |||||||||||||
| - | Inline XBRL Taxonomy Extension Presentation Linkbase Document | |||||||||||||
| - | Inline XBRL Taxonomy Extension Definition Linkbase Document | |||||||||||||
| 104 | - | Cover Page Interactive Data File (embedded within the Inline XBRL document) | ||||||||||||
| * | Incorporated by reference to the filing indicated. | |||||||||||||
| ** | Filed herewith. | |||||||||||||
| # | Furnished herewith. | |||||||||||||
SIGNATURES
Pursuant to the requirements of the Securities Exchange Act of 1934, the registrant has duly caused this report to be signed on its behalf by the undersigned, thereunto duly authorized.
| PIONEER ENERGY SERVICES CORP. | ||
| /s/ Lorne E. Phillips | ||
| Lorne E. Phillips | ||
| Executive Vice President and Chief Financial Officer | ||
| (Principal Financial Officer and Duly Authorized Officer) | ||
Dated: August 19, 2020May 7, 2021