0000356309 us-gaap:OperatingSegmentsMember njr:MidstreamInvestmentsMember 2020-06-30
UNITED STATES
SECURITIES AND EXCHANGE COMMISSION
Washington, D.C. 20549
FORM 10-Q
FORM 10-Q
☒ QUARTERLY REPORT PURSUANT TO SECTION 13 OR 15(d) OF THE SECURITIES EXCHANGE ACT OF 1934
For the quarterly period ended June 30, 2020March 31, 2021
OR
☐ TRANSITION REPORT PURSUANT TO SECTION 13 OR 15(d) OF THE SECURITIES EXCHANGE ACT OF 1934
For the transition period from to
Commission File Number: 001-08359
001-08359
NEW JERSEY RESOURCES CORPORATION
| | | | | | | | | | | | | | | | | | | | | | | | | | |
| (Exact name of registrant as specified in its charter) |
| | | | | | | | |
| New Jersey | | | | | 22-2376465 | |
| (State or other jurisdiction of incorporation or organization) | | (I.R.S. Employer Identification Number) |
| | | | | | | | |
| 1415 Wyckoff Road | | | (732) | 938‑1480 | |
| Wall | New Jersey | 07719 | | | (Registrant's telephone number,
including area code) |
| (Address of principal executive offices) | |
| | | | | | | | |
(Exact name of registrant as specified in its charter) |
| | | | | | | | |
New Jersey | | | | | 22-2376465 | |
(State or other jurisdiction of incorporation or organization) | | (I.R.S. Employer Identification Number) |
| | | | | | | | |
1415 Wyckoff Road | | | (732) | 938‑1480 | |
Wall | New Jersey | 07719 | | | (Registrant's telephone number,
including area code)
|
(Address of principal executive offices) | |
| | | | | | | | |
| Securities registered pursuant to Section 12 (b) of the Act: |
| | | | | | | | |
| Title of each class | Trading symbol(s) | Name of each exchange on which registered) |
| Common Stock - $2.50 Par Value | | NJR | New York Stock Exchange |
Indicate by check mark whether the registrant (1) has filed all reports required to be filed by Section 13 or 15(d) of the Securities Exchange Act of 1934 during the preceding 12 months (or for such shorter period that the registrant was required to file such reports), and (2) has been subject to such filing requirements for the past 90 days.
Yes: ☒ No: ☐
Indicate by check mark whether the registrant has submitted electronically every Interactive Data File required to be submitted pursuant to Rule 405 of Regulation S-T during the preceding 12 months (or for such shorter period that the registrant was required to submit such files).
Yes: ☒ No: ☐
Indicate by check mark whether the registrant is a large accelerated filer, an accelerated filer, a non-accelerated filer, a smaller reporting company or an emerging growth company. See definitions of “large accelerated filer,” “accelerated filer,” “smaller reporting company,” and “emerging growth company” in Rule 12b‑2 of the Exchange Act.
|
| | | | | | | | | | | | | |
| Large accelerated filer | ☒ | | Accelerated filer | ☐ |
| Non-accelerated filer | ☐ | | Smaller reporting company | ☐ |
| | | Emerging growth company | ☐ |
If an emerging growth company, indicate by check mark if the registrant has elected not to use the extended transition period for complying with any new or revised financial accounting standards provided pursuant to Section 13(a) of the Exchange Act. o
Indicate by check mark whether the registrant is a shell company (as defined in Rule 12b-2 of the Exchange Act).
Yes: ☐ No: ☒
The number of shares outstanding of $2.50 par value Common Stock as of August 5, 2020May 3, 2021 was 95,930,191.
New Jersey Resources Corporation
TABLE OF CONTENTS
| | | | | | | | | | | |
| | | |
| | | Page |
| |
| |
| PART I. FINANCIAL INFORMATION | |
| ITEM 1. | | |
| | | |
| | | |
| | | |
| | | |
| | | |
| | | |
| | | |
| | | |
| | | |
| | | |
| | | |
| | | |
| | | |
| | | |
| | | |
| | | |
| | | |
| | | |
| ITEM 2. | | |
| ITEM 3. | | |
| ITEM 4. | | |
| PART II. OTHER INFORMATION | |
| ITEM 1. | | |
| ITEM 1A. | | |
| ITEM 2. | | |
| ITEM 6. | | |
| | | |
New Jersey Resources Corporation
GLOSSARY OF KEY TERMS
|
| | | | |
| Adelphia Gateway | Adelphia Gateway, LLC |
| AFUDC | Allowance for Funds Used During Construction |
| ASC | Accounting Standards Codification |
| ASU | Accounting Standards Update |
| Bcf | Billion Cubic Feet |
| BGSS | Basic Gas Supply Service |
| BPU | New Jersey Board of Public Utilities |
Bridge Facility | The $350 million term loan credit agreement expiring in October 2020 |
| CARES Act | Coronavirus Aid, Relief, and Economic Security Act |
| CIP | Conservation Incentive Program |
| CME | Chicago Mercantile Exchange |
| COVID-19 | Novel coronavirus disease |
| CR&R | Commercial Realty & Resources Corp. |
| DRP | NJR Direct Stock Purchase and Dividend Reinvestment Plan |
| Dths | Dekatherms |
| EE | Energy Efficiency |
| Energy Services | Energy Services segment |
| EPS | Earnings Per Share |
| FASB | Financial Accounting Standards Board |
| FCM | Futures Commission Merchant |
| FERC | Federal Energy Regulatory Commission |
| Financial margin | A non-GAAP financial measure, which represents revenues earned from the sale of natural gas less costs of natural gas sold including any transportation and storage costs, and excludes any accounting impact from the change in the fair value of certain derivative instruments |
| Fitch | Fitch Ratings Company |
| FMB | First Mortgage Bond |
| GAAP | Generally Accepted Accounting Principles of the United States |
| Home Services and Other | Home Services and Other Operations |
| ICE | Intercontinental Exchange |
| IEC | Interstate Energy Company, LLC |
| IIP | Infrastructure Investment Program |
| IRS | Internal Revenue Service |
| ISDA | The International Swaps and Derivatives Association |
| ITC | Federal Investment Tax Credit |
| Leaf River | Leaf River Energy Center LLC |
LIBORMGP | London Inter-Bank Offered Rate |
MGP | Manufactured Gas Plant |
| Moody's | Moody's Investors Service, Inc. |
| Mortgage Indenture | The Amended and Restated Indenture of Mortgage, Deed of Trust and Security Agreement between NJNG and U.S. Bank National Association dated as of September 1, 2014 |
| MW | Megawatts |
| MWh | Megawatt Hour |
| NAESB | The North American Energy Standards Board |
| Natural Gas Act | The Natural Gas Act of 1938, as amended; the federal law regulating interstate natural gas pipeline and storage companies, among other things, codified beginning at 15 U.S.C. Section 717. |
| NFE | Net Financial Earnings |
| NJ RISE | New Jersey Reinvestment in System Enhancement |
| NJCEP | New Jersey's Clean Energy Program |
| NJDEP | New Jersey Department of Environmental Protection |
New Jersey Resources Corporation
|
| | | | |
| GLOSSARY OF KEY TERMS (cont.) |
| |
NJ RISENJNG | New Jersey Reinvestment in System Enhancement |
NJCEP | New Jersey's Clean Energy Program |
NJDEP | New Jersey Department of Environmental Protection |
NJNG | New Jersey Natural Gas Company |
| NJNG Credit Facility | NJNG's $250 million unsecured committed credit facility expiring in December 2023 |
| NJR Credit Facility | NJR's $425 million unsecured committed credit facility expiring in December 2023 |
| NJR or The Company | New Jersey Resources Corporation |
| NJRHS | NJR Home Services Company |
| Non-GAAP | Not in accordance with Generally Accepted Accounting Principles of the United States |
| NPNS | Normal Purchase/Normal Sale |
| NYMEX | New York Mercantile Exchange |
| OASDI | Old Age, Survivors and Disability Insurance tax |
| O&M | Operation and Maintenance |
| OPEB | Other Postemployment Benefit Plans |
| PennEast | PennEast Pipeline Company, LLC |
| PPA | Power Purchase Agreement |
| RAC | Remediation Adjustment Clause |
| REC | Renewable Energy Certificate |
| S&P | Standard & Poor's Financial Services, LLC |
| SAFE | Safety Acceleration and Facility Enhancement |
| SAVEGREEN | The SAVEGREEN Project® |
| SBC | Societal Benefits Charge |
| SEC | U.S. Securities and Exchange Commission |
| SREC | Solar Renewable Energy Certificate |
| SRL | Southern Reliability Link |
| Steckman Ridge | Collectively, Steckman Ridge GP, LLC and Steckman Ridge, LP |
TalenStorage and Transportation | Storage and Transportation segment |
| Talen | Talen Energy Marketing, LLC |
| TETCO | Texas Eastern Transmission |
| The Exchange Act | The Securities Exchange Act of 1934, as amended |
| The Tax Act | An Act to Provide for Reconciliation Pursuant to Titles II and V of the Concurrent Resolution on the Budget for Fiscal Year 2018, previously known as The Tax Cuts and Jobs Act of 2017 |
| Third Circuit | The United States Court of Appeals for the Third Circuit |
TrusteeTREC | Transition Renewable Energy Certificate |
| Trustee | U.S. Bank National Association |
| U.S. | The United States of America |
| USF | Universal Service Fund |
New Jersey Resources Corporation
INFORMATION CONCERNING FORWARD-LOOKING STATEMENTS
Certain statements contained in this report, including, without limitation, statements as to management expectations, assumptions and beliefs presented in Part I, Item 2. “Management's Discussion and Analysis of Financial Condition and Results of Operations,” Part I, Item 3. “Quantitative and Qualitative Disclosures About Market Risk,” Part II, Item 1. “Legal Proceedings” and in the notes to the financial statements are forward-looking statements within the meaning of Section 27A of the Securities Act of 1933, as amended, Section 21E of the Securities Exchange Act of 1934, as amended, and the Private Securities Litigation Reform Act of 1995. Forward-looking statements can also be identified by the use of forward-looking terminology such as “anticipate,” “estimate,” “may,” “could,” “might,” “intend,” “expect,” “believe,” “will” “plan,” or “should,” or comparable terminology and are made based upon management's current expectations, assumptions and beliefs as of this date concerning future developments and their potential effect on us. There can be no assurance that future developments will be in accordance with management's expectations, assumptions or beliefs, or that the effect of future developments on us will be those anticipated by management.
We caution readers that the expectations, assumptions and beliefs that form the basis for forward-looking statements regarding customer growth, customer usage, qualifications for ITCs, and SRECs,RECs, future rate case proceedings, completion of infrastructure projects, impacts of COVID-19, financial condition, results of operations, cash flows, capital requirements, future capital expenditures, market risk, effective tax rate and other matters for fiscal 20202021 and thereafter include many factors that are beyond our ability to control or estimate precisely, such as estimates of future market conditions, the behavior of other market participants and changes in the debt and equity capital markets. The factors that could cause actual results to differ materially from our expectations, assumptions and beliefs include, but are not limited to, those discussed in Item 1A. Risk Factors of our Annual Report on Form 10-K for the fiscal year ended September 30, 2019 and Item 1A. Risk Factors of our Quarterly Report on Form 10-Q for the fiscal quarter ended March 31, 2020, as well as the following:
•risks related to the impact of COVID-19 on business operations, financial performance and condition and cash flows;
•our ability to obtain governmental and regulatory approvals, land-use rights, electric grid connection (in the case of clean energy projects) and/or financing for the construction, development and operation of our unregulated energy investments, pipeline transportation systems and NJNG and MidstreamStorage and Transportation infrastructure projects, including PennEast and Adelphia Gateway, in a timely manner;
| |
• | •risks associated with our investments in clean energy projects, including the availability of regulatory incentives and federal tax credits, the availability of viable projects, our eligibility for ITCs, the future market for SRECs and electricity prices, and operational risks related to projects in service; •including the availability of regulatory incentives and federal tax credits, the availability of viable projects, our eligibility for ITCs, the future market for SRECs and electricity prices, and operational risks related to projects in service; |
risks associated with acquisitions and the related integration of acquired assets with our current operations, including the acquisitionsacquisition of Adelphia Gateway and Leaf River and Adelphia;River;
•our ability to comply with current and future regulatory requirements;
| |
•volatility of natural gas and other commodity prices and their impact on NJNG customer usage, NJNG’s BGSS incentive programs, our Energy Services segment operations and our risk management efforts; • | volatility of natural gas and other commodity prices and their impact on NJNG customer usage, NJNG’s BGSS incentive programs, our Energy Services segment operations and our risk management efforts;
|
the performance of our subsidiaries;
•access to adequate supplies of natural gas and dependence on third-party storage and transportation facilities for natural gas supply;
| |
•the level and rate at which NJNG’s costs and expenses are incurred and the extent to which they are approved for recovery from customers through the regulatory process, including through future base rate case filings; • | the level and rate at which NJNG’s costs and expenses are incurred and the extent to which they are approved for recovery from customers through the regulatory process, including through future base rate case filings;
|
the impact of a disallowance of recovery of environmental-related expenditures and other regulatory changes;
•the regulatory and pricing policies of federal and state regulatory agencies;
•operating risks incidental to handling, storing, transporting and providing customers with natural gas;
| |
• | •demographic changes in our service territory and their effect on our customer growth; •service territory and their effect on our customer growth; |
timing of qualifying for ITCs due to delays or failures to complete planned solar projects and the resulting impact on our effective tax rate and earnings;
•changes in rating agency requirements and/or credit ratings and their effect on availability and cost of capital to the Company;
•the impact of volatility in the equity and credit markets on our access to capital;
•our ability to comply with debt covenants;
•the results of legal or administrative proceedings with respect to claims, rates, environmental issues, natural gas cost prudence reviews and other matters;
•risks related to cyberattacks or failure of information technology systems;
•the impact to the asset values and resulting higher costs and funding obligations of our pension and postemployment benefit plans as a result of potential downturns in the financial markets, lower discount rates, revised actuarial assumptions or impacts associated with the Patient Protection and the Affordable Care Act;
•commercial and wholesale credit risks, including the availability of creditworthy customers and counterparties, and liquidity in the wholesale energy trading market;
•accounting effects and other risks associated with hedging activities and use of derivatives contracts;
•our ability to optimize our physical assets;
•weather and economic conditions;
•the costs of compliance with present and future environmental laws, potential climate change-related legislation or any legislation resulting from the 2019 New Jersey Energy Master Plan;
•uncertainties related to litigation, regulatory, administrative or environmental proceedings;
•changes to tax laws and regulations;
•any potential need to record a valuation allowance for our deferred tax assets;
•the impact of natural disasters, terrorist activities and other extreme events on our operations and customers;
•risks related to our employee workforce and succession planning;
•risks associated with the management of our joint ventures and partnerships; and
•risks associated with keeping pace with technological change.
While we periodically reassess material trends and uncertainties affecting our results of operations and financial condition in connection with the preparation of management's discussion and analysis of results of operations and financial condition contained in our Quarterly and Annual Reports on Form 10-Q and Form 10-K, respectively, we do not, by including this statement, assume any obligation to review or revise any particular forward-looking statement referenced herein in light of future events.
New Jersey Resources Corporation
Part I
ITEM 1. FINANCIAL STATEMENTS
CONDENSED CONSOLIDATED STATEMENTS OF OPERATIONS (Unaudited)
| | | | | | | | | | | | | | | | | | | | |
| Three Months Ended | Six Months Ended |
| March 31, | March 31, |
| (Thousands, except per share data) | 2021 | | 2020 | 2021 | | 2020 |
| OPERATING REVENUES | | | | | | |
| Utility | $ | 310,167 | | | $ | 297,220 | | $ | 505,896 | | | $ | 516,843 | |
| Nonutility | 492,020 | | | 342,394 | | 750,596 | | | 737,807 | |
| Total operating revenues | 802,187 | | | 639,614 | | 1,256,492 | | | 1,254,650 | |
| OPERATING EXPENSES | | | | | | |
| Natural gas purchases: | | | | | | |
| Utility | 113,235 | | | 111,563 | | 169,380 | | | 203,377 | |
| Nonutility | 330,488 | | | 318,384 | | 503,735 | | | 635,740 | |
| Related parties | 1,730 | | | 1,506 | | 3,464 | | | 3,030 | |
| Operation and maintenance | 110,265 | | | 66,832 | | 183,901 | | | 130,177 | |
| Regulatory rider expenses | 18,413 | | | 15,330 | | 29,114 | | | 27,072 | |
| Depreciation and amortization | 26,848 | | | 27,516 | | 54,210 | | | 52,153 | |
| | | | | | |
| Total operating expenses | 600,979 | | | 541,131 | | 943,804 | | | 1,051,549 | |
| OPERATING INCOME | 201,208 | | | 98,483 | | 312,688 | | | 203,101 | |
| Other income, net | 5,007 | | | 7,261 | | 9,124 | | | 7,547 | |
| Interest expense, net of capitalized interest | 20,153 | | | 19,203 | | 39,939 | | | 35,273 | |
| INCOME BEFORE INCOME TAXES AND EQUITY IN EARNINGS OF AFFILIATES | 186,062 | | | 86,541 | | 281,873 | | | 175,375 | |
| Income tax provision | 39,057 | | | 16,284 | | 56,498 | | | 32,755 | |
| Equity in earnings of affiliates | 2,804 | | | 3,589 | | 5,479 | | | 6,978 | |
| NET INCOME | $ | 149,809 | | | $ | 73,846 | | $ | 230,854 | | | $ | 149,598 | |
| | | | | | |
| EARNINGS PER COMMON SHARE | | | | | | |
| Basic | $1.56 | | $0.78 | $2.40 | | $1.60 |
| Diluted | $1.55 | | $0.77 | $2.39 | | $1.59 |
| WEIGHTED AVERAGE SHARES OUTSTANDING | | | | | | |
| Basic | 96,248 | | | 95,584 | | 96,181 | | | 93,747 | |
| Diluted | 96,618 | | | 95,890 | | 96,598 | | | 94,073 | |
|
| | | | | | | | | | | | | | |
| | Three Months Ended | Nine Months Ended |
| | June 30, | June 30, |
| (Thousands, except per share data) | 2020 | | 2019 | 2020 |
| 2019 |
| OPERATING REVENUES | | | | | | |
| Utility | $ | 128,532 |
| | $ | 120,782 |
| $ | 645,375 |
| | $ | 622,167 |
|
| Nonutility | 170,442 |
| | 314,160 |
| 908,249 |
| | 1,490,797 |
|
| Total operating revenues | 298,974 |
| | 434,942 |
| 1,553,624 |
| | 2,112,964 |
|
| OPERATING EXPENSES | | | | | | |
| Gas purchases: | | | | | | |
| Utility | 45,665 |
| | 54,861 |
| 249,042 |
| | 280,627 |
|
| Nonutility | 166,761 |
| | 289,757 |
| 802,501 |
| | 1,370,408 |
|
| Related parties | 1,518 |
| | 2,126 |
| 4,548 |
| | 6,455 |
|
| Operation and maintenance | 68,541 |
| | 64,932 |
| 198,718 |
| | 194,298 |
|
| Regulatory rider expenses | 5,464 |
| | 4,136 |
| 32,536 |
| | 32,159 |
|
| Depreciation and amortization | 31,216 |
| | 23,149 |
| 89,758 |
| | 67,292 |
|
| Total operating expenses | 319,165 |
| | 438,961 |
| 1,377,103 |
| | 1,951,239 |
|
| OPERATING (LOSS) INCOME | (20,191 | ) | | (4,019 | ) | 176,521 |
| | 161,725 |
|
| Other income, net | 2,713 |
| | 1,829 |
| 10,260 |
| | 5,456 |
|
| Interest expense, net of capitalized interest | 15,144 |
| | 11,648 |
| 50,417 |
| | 37,643 |
|
| (LOSS) INCOME BEFORE INCOME TAXES AND EQUITY IN EARNINGS OF AFFILIATES | (32,622 | ) | | (13,838 | ) | 136,364 |
| | 129,538 |
|
| Income tax benefit | (2,190 | ) | | (1,941 | ) | (4,092 | ) | | (11,854 | ) |
| Equity in earnings of affiliates | 3,213 |
| | 3,495 |
| 10,191 |
| | 10,027 |
|
| NET (LOSS) INCOME | $ | (27,219 | ) | | $ | (8,402 | ) | $ | 150,647 |
| | $ | 151,419 |
|
| | | | | | | |
| EARNINGS PER COMMON SHARE | | | | | | |
| Basic | $(0.28) | | $(0.09) | $1.60 | | $1.70 |
| Diluted | $(0.28) | | $(0.09) | $1.59 | | $1.69 |
| WEIGHTED AVERAGE SHARES OUTSTANDING | | | | | | |
| Basic | 95,764 |
| | 89,600 |
| 94,420 |
| | 88,995 |
|
| Diluted | 95,764 |
| | 89,600 |
| 94,718 |
| | 89,402 |
|
CONDENSED CONSOLIDATED STATEMENTS OF COMPREHENSIVE INCOME (Unaudited)
| | | | | | | | | | | | | | | | | |
| | Three Months Ended | Six Months Ended |
| | March 31, | March 31, |
| (Thousands) | | 2021 | 2020 | 2021 | 2020 |
| Net income | | $ | 149,809 | | $ | 73,846 | | $ | 230,854 | | $ | 149,598 | |
| Other comprehensive income, net of tax | | | | | |
| | | | | |
| | | | | |
| Reclassifications of losses to net income on derivatives designated as hedging instruments, net of tax of $(79), $0, $(191) and $0, respectively | | 263 | | 0 | | 494 | | 0 | |
| Loss on derivatives designated as hedging instruments, net of tax of $0, $2,781, $0 and $2,781, respectively | | 0 | | (9,711) | | 0 | | (9,711) | |
| Adjustment to postemployment benefit obligation, net of tax of $(244), $(1,753), $(489) and $(1,970), respectively | | 813 | | 6,100 | | 1,625 | | 6,859 | |
| Other comprehensive income (loss) | | $ | 1,076 | | $ | (3,611) | | $ | 2,119 | | $ | (2,852) | |
| Comprehensive income | | $ | 150,885 | | $ | 70,235 | | $ | 232,973 | | $ | 146,746 | |
|
| | | | | | | | | | | | | |
| | | Three Months Ended | Nine Months Ended |
| | | June 30, | June 30, |
| (Thousands) | | 2020 | 2019 | 2020 | 2019 |
| Net (loss) income | | $ | (27,219 | ) | $ | (8,402 | ) | $ | 150,647 |
| $ | 151,419 |
|
| Other comprehensive (loss) income, net of tax | | | | | |
| Loss on derivatives designated as hedging instruments, net of tax of $180, $0, $2,961 and $0, respectively | | (626 | ) | — |
| (10,337 | ) | — |
|
| Adjustment to postemployment benefit obligation, net of tax of $(191), $(118), $(2,161) and $(333), respectively | | 663 |
| 305 |
| 7,522 |
| 844 |
|
| Other comprehensive income (loss) | | $ | 37 |
| $ | 305 |
| $ | (2,815 | ) | $ | 844 |
|
| Comprehensive (loss) income | | $ | (27,182 | ) | $ | (8,097 | ) | $ | 147,832 |
| $ | 152,263 |
|
See Notes to Unaudited Condensed Consolidated Financial Statements
New Jersey Resources Corporation
Part I
ITEM 1. FINANCIAL STATEMENTS (Continued)
CONDENSED CONSOLIDATED STATEMENTS OF CASH FLOWS (Unaudited) | | | | | | | | | | | |
| Six Months Ended |
| March 31, |
| (Thousands) | 2021 | | 2020 |
| CASH FLOWS FROM OPERATING ACTIVITIES | | | |
| Net income | $ | 230,854 | | | $ | 149,598 | |
| Adjustments to reconcile net income to cash flows from operating activities | | | |
| Unrealized gain on derivative instruments | (8,235) | | | (45,539) | |
| | | |
| | | |
| Depreciation and amortization | 54,210 | | | 52,153 | |
| Amortization of acquired wholesale energy contracts | 3,401 | | | 3,953 | |
| Allowance for equity used during construction | (10,603) | | | (8,053) | |
| Allowance for doubtful accounts | 10,607 | | | 951 | |
| Non cash lease expense | 1,957 | | | 1,856 | |
| Deferred income taxes | 20,909 | | | 34,975 | |
| | | |
| | | |
| Manufactured gas plant remediation costs | (6,284) | | | (5,291) | |
| Equity in earnings, net of distributions received from equity investees | (3,543) | | | (2,760) | |
| Cost of removal - asset retirement obligations | (512) | | | (122) | |
| Contributions to postemployment benefit plans | (2,018) | | | (5,742) | |
| Taxes related to stock-based compensation | (145) | | | 803 | |
| Changes in: | | | |
| Components of working capital | 6,846 | | | 3,526 | |
| Other noncurrent assets | 18,854 | | | (1,258) | |
| Other noncurrent liabilities | 39,993 | | | 95 | |
| Cash flows from operating activities | 356,291 | | | 179,145 | |
| CASH FLOWS USED IN INVESTING ACTIVITIES | | | |
| Expenditures for: | | | |
| Utility plant | (152,496) | | | (132,352) | |
| Solar equipment | (40,884) | | | (69,786) | |
| Storage and Transportation and other | (28,518) | | | (7,724) | |
| Cost of removal | (23,989) | | | (17,487) | |
| Acquisition of assets, net of cash acquired of $5.1 million | 0 | | | (523,647) | |
| Distribution from equity investees in excess of equity in earnings | 871 | | | 1,132 | |
| Investments in equity investees | (482) | | | (1,266) | |
| | | |
| | | |
| | | |
| Cash flows used in investing activities | (245,498) | | | (751,130) | |
| CASH FLOWS (USED IN) FROM FINANCING ACTIVITIES | | | |
| | | |
| Payments of long-term debt | (11,001) | | | (9,764) | |
| Proceeds from term loan | 0 | | | 350,000 | |
| Payments of term loan | 0 | | | (212,900) | |
| (Payments of) proceeds from short-term debt, net | (116,850) | | | 304,023 | |
| Proceeds from sale leaseback transaction - solar | 12,124 | | | 0 | |
| Proceeds from sale leaseback transaction | 0 | | | 4,000 | |
| Payments of common stock dividends | (60,894) | | | (56,821) | |
| Proceeds from issuance of common stock - public equity offering | 0 | | | 212,900 | |
| Cash settlement of equity forward agreement | (388) | | | 0 | |
| | | |
| Proceeds from issuance of common stock - DRP | 7,540 | | | 8,767 | |
| | | |
| Tax withholding payments related to net settled stock compensation | (1,772) | | | (3,893) | |
| Cash flows (used in) from financing activities | (171,241) | | | 596,312 | |
| Change in cash, cash equivalents and restricted cash | (60,448) | | | 24,327 | |
| Cash, cash equivalents and restricted cash at beginning of period | 119,423 | | | 4,063 | |
| Cash, cash equivalents and restricted cash at end of period | $ | 58,975 | | | $ | 28,390 | |
| CHANGES IN COMPONENTS OF WORKING CAPITAL | | | |
| Receivables | $ | (136,295) | | | $ | (87,532) | |
| Inventories | 94,233 | | | 90,484 | |
| Recovery of natural gas costs | (20,279) | | | (21,891) | |
| Natural gas purchases payable | 33,191 | | | (10,933) | |
| Natural gas purchases payable - related parties | 62 | | | 11 | |
| Accounts payable and other | (19,621) | | | (27,345) | |
| Prepaid expenses | (8,170) | | | (602) | |
| Prepaid and accrued taxes | 59,614 | | | 22,258 | |
| Restricted broker margin accounts | 7,644 | | | 39,193 | |
| Customers' credit balances and deposits | (5,171) | | | (7,788) | |
| Other current assets | 1,638 | | | 7,671 | |
| Total | $ | 6,846 | | | $ | 3,526 | |
| SUPPLEMENTAL DISCLOSURES OF CASH FLOWS INFORMATION | | | |
| Cash paid for: | | | |
| Interest (net of amounts capitalized) | $ | 40,465 | | | $ | 32,872 | |
| Income taxes | $ | 3,733 | | | $ | 1,193 | |
| Accrued capital expenditures | $ | 22,840 | | | $ | 17,930 | |
| | | |
| See Notes to Unaudited Condensed Consolidated Financial Statements |
|
| | | | | | | |
| | Nine Months Ended |
| | June 30, |
| (Thousands) | 2020 | | 2019 |
| CASH FLOWS FROM OPERATING ACTIVITIES | | | |
| Net income | $ | 150,647 |
| | $ | 151,419 |
|
| Adjustments to reconcile net income to cash flows from operating activities | | | |
| Unrealized gain on derivative instruments | (21,827 | ) | | (25,353 | ) |
| Realized and unrealized gains on investments in equity securities | — |
| | (1,567 | ) |
| Gain on sale of businesses | — |
| | (645 | ) |
| Depreciation and amortization | 89,758 |
| | 67,292 |
|
| Amortization of acquired wholesale energy contracts | 4,356 |
| | 7,813 |
|
| Allowance for equity used during construction | (12,328 | ) | | (6,135 | ) |
| Allowance for doubtful accounts | 1,657 |
| | 1,686 |
|
| Non cash lease expense | 2,864 |
| | — |
|
| Deferred income taxes | (3,066 | ) | | (29,092 | ) |
| Manufactured gas plant remediation costs | (6,629 | ) | | (9,582 | ) |
| Equity in earnings, net of distributions received from equity investees | (4,985 | ) | | (2,700 | ) |
| Cost of removal - asset retirement obligations | (183 | ) | | (194 | ) |
| Contributions to postemployment benefit plans | (5,969 | ) | | (5,994 | ) |
| Tax benefit from stock-based compensation | 644 |
| | 1,289 |
|
| Changes in: | | | |
| Components of working capital | (17,397 | ) | | (14,829 | ) |
| Other noncurrent assets | 10,177 |
| | 16,906 |
|
| Other noncurrent liabilities | (4,936 | ) | | 15,476 |
|
| Cash flows from operating activities | 182,783 |
| | 165,790 |
|
| CASH FLOWS USED IN INVESTING ACTIVITIES | | | |
| Expenditures for: | | | |
| Utility plant | (213,667 | ) | | (207,357 | ) |
| Solar equipment | (110,968 | ) | | (91,333 | ) |
| Midstream and other | (18,261 | ) | | (13,116 | ) |
| Cost of removal | (24,343 | ) | | (32,212 | ) |
| Acquisition of assets, net of cash acquired of $5.1 million | (523,647 | ) | | — |
|
| Distribution from equity investees in excess of equity in earnings | 1,411 |
| | 1,473 |
|
| Investments in equity investees | (1,491 | ) | | (2,696 | ) |
| Proceeds from sale of businesses, net of closing costs | — |
| | 205,745 |
|
| Proceeds from sale of investments in equity securities, net | — |
| | 34,484 |
|
| Cash flows used in investing activities | (890,966 | ) | | (105,012 | ) |
| CASH FLOWS FROM (USED IN) FINANCING ACTIVITIES | | | |
| Proceeds from term loan | 350,000 |
| | — |
|
| Payments of term loan | (212,900 | ) | | — |
|
| Proceeds from long-term debt | 50,000 |
| | 35,800 |
|
| Payments of long-term debt | (11,947 | ) | | (15,001 | ) |
| Proceeds from (payments of) short-term debt, net | 390,562 |
| | (52,650 | ) |
| Proceeds from sale-leaseback transaction - solar | 42,927 |
| | — |
|
| Proceeds from sale-leaseback transaction | 4,000 |
| | 9,895 |
|
| Payments of common stock dividends | (86,709 | ) | | (77,730 | ) |
| Proceeds from issuance of common stock - public equity offering | 212,900 |
| | — |
|
| Proceeds from waiver discount issuance of common stock | — |
| | 57,391 |
|
| Proceeds from issuance of common stock - DRP | 14,498 |
| | 13,199 |
|
| Tax withholding payments related to net settled stock compensation | (3,966 | ) | | (6,704 | ) |
| Cash flows from (used in) financing activities | 749,365 |
| | (35,800 | ) |
| Change in cash, cash equivalents and restricted cash | 41,182 |
| | 24,978 |
|
| Cash, cash equivalents and restricted cash at beginning of period | 4,063 |
| | 1,710 |
|
| Cash, cash equivalents and restricted cash at end of period | $ | 45,245 |
| | $ | 26,688 |
|
| CHANGES IN COMPONENTS OF WORKING CAPITAL | | | |
| Receivables | $ | (3,019 | ) | | $ | 28,385 |
|
| Inventories | 42,566 |
| | 51,833 |
|
| Recovery of gas costs | (5,722 | ) | | (14,870 | ) |
| Gas purchases payable | (55,593 | ) | | (66,060 | ) |
| Prepaid expenses | 1,487 |
| | (2,385 | ) |
| Prepaid and accrued taxes | (991 | ) | | 10,110 |
|
| Accounts payable and other | (13,084 | ) | | (31,883 | ) |
| Restricted broker margin accounts | 11,900 |
| | 13,092 |
|
| Customers' credit balances and deposits | (7,060 | ) | | (7,832 | ) |
| Other current assets | 12,119 |
| | 4,781 |
|
| Total | $ | (17,397 | ) | | $ | (14,829 | ) |
| SUPPLEMENTAL DISCLOSURES OF CASH FLOWS INFORMATION | | | |
| Cash paid for: | | | |
| Interest (net of amounts capitalized) | $ | 47,642 |
| | $ | 42,107 |
|
| Income taxes | $ | 1,127 |
| | $ | 8,550 |
|
| Accrued capital expenditures | $ | 20,814 |
| | $ | 32,143 |
|
See Notes to Unaudited Condensed Consolidated Financial Statements
New Jersey Resources Corporation
Part I
ITEM 1. FINANCIAL STATEMENTS (Continued)
CONDENSED CONSOLIDATED BALANCE SHEETS (Unaudited)
ASSETS
| | | | | | | | |
| (Thousands) | March 31, 2021 | September 30, 2020 |
| PROPERTY, PLANT AND EQUIPMENT | | |
| Utility plant, at cost | $ | 2,883,656 | | $ | 2,800,052 | |
| Construction work in progress | 456,513 | | 379,846 | |
| Nonutility plant and equipment, at cost | 1,121,155 | | 1,108,512 | |
| Construction work in progress | 229,923 | | 176,556 | |
| Total property, plant and equipment | 4,691,247 | | 4,464,966 | |
| Accumulated depreciation and amortization, utility plant | (620,028) | | (601,635) | |
| Accumulated depreciation and amortization, nonutility plant and equipment | (156,063) | | (140,562) | |
| Property, plant and equipment, net | 3,915,156 | | 3,722,769 | |
| CURRENT ASSETS | | |
| Cash and cash equivalents | 57,654 | | 117,012 | |
| Customer accounts receivable | | |
| Billed | 237,229 | | 134,173 | |
| Unbilled revenues | 41,941 | | 9,226 | |
| Allowance for doubtful accounts | (17,325) | | (7,242) | |
| Regulatory assets | 23,527 | | 36,530 | |
| Natural gas in storage, at average cost | 74,853 | | 167,504 | |
| Materials and supplies, at average cost | 18,824 | | 20,406 | |
| Prepaid expenses | 14,729 | | 6,639 | |
| Prepaid and accrued taxes | 3,432 | | 24,301 | |
| Derivatives, at fair value | 17,433 | | 23,310 | |
| Restricted broker margin accounts | 45,916 | | 69,444 | |
| | |
| Other | 17,015 | | 21,029 | |
| Total current assets | 535,228 | | 622,332 | |
| NONCURRENT ASSETS | | |
| Investments in equity method investees | 214,521 | | 208,375 | |
| Regulatory assets | 522,027 | | 527,459 | |
| Operating lease assets | 144,326 | | 131,769 | |
| Derivatives, at fair value | 1,977 | | 3,349 | |
| | |
| Intangible assets, net | 6,462 | | 10,060 | |
| Software costs | 5,485 | | 4,707 | |
| Other noncurrent assets | 79,952 | | 85,657 | |
| Total noncurrent assets | 974,750 | | 971,376 | |
| Total assets | $ | 5,425,134 | | $ | 5,316,477 | |
|
| | | | | | |
| (Thousands) | June 30,
2020 | September 30,
2019 |
| PROPERTY, PLANT AND EQUIPMENT | | |
| Utility plant, at cost | $ | 2,741,021 |
| $ | 2,625,730 |
|
| Construction work in progress | 362,970 |
| 237,011 |
|
| Nonutility plant and equipment, at cost | 1,410,428 |
| 861,904 |
|
| Construction work in progress | 167,807 |
| 62,492 |
|
| Total property, plant and equipment | 4,682,226 |
| 3,787,137 |
|
| Accumulated depreciation and amortization, utility plant | (586,711 | ) | (585,160 | ) |
| Accumulated depreciation and amortization, nonutility plant and equipment | (191,520 | ) | (156,033 | ) |
| Property, plant and equipment, net | 3,903,995 |
| 3,045,944 |
|
| CURRENT ASSETS | | |
| Cash and cash equivalents | 42,821 |
| 2,676 |
|
| Customer accounts receivable | | |
| Billed | 143,059 |
| 139,263 |
|
| Unbilled revenues | 8,738 |
| 6,510 |
|
| Allowance for doubtful accounts | (6,975 | ) | (6,148 | ) |
| Regulatory assets | 52,251 |
| 32,871 |
|
| Gas in storage, at average cost | 123,962 |
| 169,803 |
|
| Materials and supplies, at average cost | 18,128 |
| 14,475 |
|
| Prepaid expenses | 7,700 |
| 8,333 |
|
| Prepaid and accrued taxes | 25,546 |
| 22,602 |
|
| Derivatives, at fair value | 29,367 |
| 25,103 |
|
| Restricted broker margin accounts | 52,212 |
| 73,723 |
|
| Other | 24,269 |
| 22,395 |
|
| Total current assets | 521,078 |
| 511,606 |
|
| NONCURRENT ASSETS | | |
| Investments in equity method investees | 205,800 |
| 200,268 |
|
| Regulatory assets | 451,115 |
| 496,637 |
|
| Operating lease assets | 101,657 |
| — |
|
| Derivatives, at fair value | 6,347 |
| 7,426 |
|
| Intangible assets, net | 11,006 |
| 14,611 |
|
| Other noncurrent assets | 81,086 |
| 96,493 |
|
| Total noncurrent assets | 857,011 |
| 815,435 |
|
| Total assets | $ | 5,282,084 |
| $ | 4,372,985 |
|
See Notes to Unaudited Condensed Consolidated Financial Statements
New Jersey Resources Corporation
Part I
ITEM 1. FINANCIAL STATEMENTS (Continued)
CAPITALIZATION AND LIABILITIES
| | | | | | | | |
| (Thousands, except share data) | March 31, 2021 | September 30, 2020 |
| CAPITALIZATION | | |
| Common stock, $2.50 par value; authorized 150,000,000 shares; outstanding March 31, 2021 — 96,262,016; September 30, 2020 — 95,949,183 | $ | 240,497 | | $ | 240,243 | |
| Premium on common stock | 497,167 | | 491,982 | |
| Accumulated other comprehensive loss, net of tax | (42,196) | | (44,315) | |
Treasury stock at cost and other; shares March 31, 2021 — 16,313; September 30, 2020 — 148,310 | 11,983 | | 8,485 | |
| Retained earnings | 1,114,382 | | 947,501 | |
| Common stock equity | 1,821,833 | | 1,643,896 | |
| Long-term debt | 2,265,202 | | 2,259,466 | |
| Total capitalization | 4,087,035 | | 3,903,362 | |
| CURRENT LIABILITIES | | |
| Current maturities of long-term debt | 22,635 | | 27,236 | |
| Short-term debt | 8,500 | | 125,350 | |
| Natural gas purchases payable | 129,136 | | 95,945 | |
| Natural gas purchases payable to related parties | 853 | | 791 | |
| Accounts payable and other | 126,154 | | 141,500 | |
| Dividends payable | 32,007 | | 31,902 | |
| Accrued taxes | 41,462 | | 2,717 | |
| Regulatory liabilities | 717 | | 26,188 | |
| New Jersey Clean Energy Program | 6,148 | | 15,570 | |
| Derivatives, at fair value | 23,690 | | 33,865 | |
| Operating lease liabilities | 4,001 | | 6,724 | |
| | |
| | |
| Customers' credit balances and deposits | 20,763 | | 25,934 | |
| Total current liabilities | 416,066 | | 533,722 | |
| NONCURRENT LIABILITIES | | |
| Deferred income taxes | 166,238 | | 138,081 | |
| Deferred investment tax credits | 3,171 | | 3,332 | |
| Deferred gain | 894 | | 1,035 | |
| Derivatives, at fair value | 20,506 | | 13,352 | |
| Manufactured gas plant remediation | 143,490 | | 150,590 | |
| Postemployment employee benefit liability | 236,432 | | 237,221 | |
| Regulatory liabilities | 193,817 | | 196,450 | |
| Operating lease liabilities | 111,034 | | 95,030 | |
| Asset retirement obligation | 34,102 | | 33,723 | |
| Other | 12,349 | | 10,579 | |
| Total noncurrent liabilities | 922,033 | | 879,393 | |
| Commitments and contingent liabilities (Note 13) | 0 | 0 |
| Total capitalization and liabilities | $ | 5,425,134 | | $ | 5,316,477 | |
|
| | | | | | |
| (Thousands, except share data) | June 30,
2020 | September 30,
2019 |
| CAPITALIZATION | | |
| Common stock, $2.50 par value; authorized 150,000,000 shares; outstanding June 30, 2020 — 95,830,500; September 30, 2019 — 89,998,788 | $ | 240,227 |
| $ | 226,649 |
|
| Premium on common stock | 492,365 |
| 291,331 |
|
| Accumulated other comprehensive loss, net of tax | (34,602 | ) | (31,787 | ) |
Treasury stock at cost and other; shares June 30, 2020 — 260,462;
September 30, 2019 —660,734 | 4,012 |
| (10,436 | ) |
| Retained earnings | 1,136,925 |
| 1,075,960 |
|
| Common stock equity | 1,838,927 |
| 1,551,717 |
|
| Long-term debt | 1,664,517 |
| 1,537,177 |
|
| Total capitalization | 3,503,444 |
| 3,088,894 |
|
| CURRENT LIABILITIES | | |
| Current maturities of long-term debt | 25,954 |
| 21,419 |
|
| Short-term debt | 553,112 |
| 25,450 |
|
| Gas purchases payable | 81,677 |
| 137,271 |
|
| Gas purchases payable to related parties | 791 |
| 790 |
|
| Accounts payable and other | 109,987 |
| 129,724 |
|
| Dividends payable | 29,947 |
| 28,122 |
|
| Accrued taxes | 5,347 |
| 3,394 |
|
| Regulatory liabilities | 6,774 |
| — |
|
| New Jersey Clean Energy Program | 17,062 |
| 15,468 |
|
| Derivatives, at fair value | 47,094 |
| 57,623 |
|
| Operating lease liabilities | 4,458 |
| — |
|
| Customers' credit balances and deposits | 20,056 |
| 27,116 |
|
| Total current liabilities | 902,259 |
| 446,377 |
|
| NONCURRENT LIABILITIES | | |
| Deferred income taxes | 187,508 |
| 190,663 |
|
| Deferred investment tax credits | 3,412 |
| 3,653 |
|
| Deferred gain | 1,035 |
| 1,554 |
|
| Derivatives, at fair value | 23,600 |
| 18,821 |
|
| Manufactured gas plant remediation | 128,886 |
| 131,080 |
|
| Postemployment employee benefit liability | 196,664 |
| 246,517 |
|
| Regulatory liabilities | 197,281 |
| 202,435 |
|
| Operating lease liabilities | 96,118 |
| — |
|
| Asset retirement obligation | 33,305 |
| 31,046 |
|
| Other | 8,572 |
| 11,945 |
|
| Total noncurrent liabilities | 876,381 |
| 837,714 |
|
| Commitments and contingent liabilities (Note 13) |
|
|
|
| Total capitalization and liabilities | $ | 5,282,084 |
| $ | 4,372,985 |
|
See Notes to Unaudited Condensed Consolidated Financial Statements
New Jersey Resources Corporation
Part I
ITEM 1. FINANCIAL STATEMENTS (Continued)
CONDENSED CONSOLIDATED STATEMENTS OF COMMON STOCK EQUITY (Unaudited)
| | | | | | | | | | | | | | | | | | | | | | | | | | | | | |
| (Thousands) | Number of Shares | Common Stock | Premium on Common Stock | Accumulated Other Comprehensive (Loss) Income | Treasury Stock And Other | Retained Earnings | Total |
| Balance at September 30, 2020 | 95,949 | | $ | 240,243 | | $ | 491,982 | | | $ | (44,315) | | | $ | 8,485 | | $ | 947,501 | | $ | 1,643,896 | |
| Net income | — | | — | | — | | | — | | | — | | 81,045 | | 81,045 | |
| Other comprehensive income | — | | — | | — | | | 1,043 | | | — | | — | | 1,043 | |
| Common stock issued: | | | | | | | | | |
| | | | | | | | | |
| Incentive compensation plan | 50 | | 124 | | 5,410 | | | — | | | — | | — | | 5,534 | |
Dividend reinvestment plan (1) | 140 | | — | | (4,502) | | | — | | | 5,593 | | — | | 1,091 | |
| | | | | | | | | |
| Cash dividend declared ($.3325 per share) | — | | — | | — | | | — | | | — | | (31,966) | | (31,966) | |
| Treasury stock and other | — | | — | | — | | | — | | | (2,429) | | — | | (2,429) | |
| Balance at December 31, 2020 | 96,139 | | $ | 240,367 | | $ | 492,890 | | | $ | (43,272) | | | $ | 11,649 | | $ | 996,580 | | $ | 1,698,214 | |
| | | | | | | | | |
| | | | | | | | | |
| | | | | | | | | |
| | | | | | | | | |
| | | | | | | | | |
| | | | | | | | | |
| | | | | | | | | |
| | | | | | | | | |
| | | | | | | | | |
| Net income | — | | — | | — | | | — | | | — | | 149,809 | | 149,809 | |
| Other comprehensive income | — | | — | | — | | | 1,076 | | | — | | — | | 1,076 | |
| Common stock issued: | | | | | | | | | |
| Common stock offering | — | | — | | (388) | | | — | | | — | | — | | (388) | |
| Incentive compensation plan | 28 | | 72 | | 1,144 | | | — | | | — | | — | | 1,216 | |
| Dividend reinvestment plan | 103 | | 58 | | 3,521 | | | — | | | — | | — | | 3,579 | |
| | | | | | | | | |
| Cash dividend declared ($.3325 per share) | — | | — | | — | | | — | | | — | | (32,007) | | (32,007) | |
| Treasury stock and other | (8) | | — | | — | | | — | | | 334 | | — | | 334 | |
| Balance at March 31, 2021 | 96,262 | | $ | 240,497 | | $ | 497,167 | | | $ | (42,196) | | | $ | 11,983 | | $ | 1,114,382 | | $ | 1,821,833 | |
|
| | | | | | | | | | | | | | | | | | | | | | |
| (Thousands) | Number of Shares | Common Stock | Premium on Common Stock | Accumulated Other Comprehensive (Loss) Income | Treasury Stock And Other | Retained Earnings | Total |
| Balance at September 30, 2019 | 89,999 |
| $ | 226,649 |
| $ | 291,331 |
| | $ | (31,787 | ) | | $ | (10,436 | ) | $ | 1,075,960 |
| $ | 1,551,717 |
|
| Net income | — |
| — |
| — |
| | — |
| | — |
| 89,361 |
| 89,361 |
|
| Other comprehensive income | — |
| — |
| — |
| | 759 |
| | — |
| — |
| 759 |
|
| Common stock issued: | | | | | | | | | |
| Common stock offering | 5,333 |
| 13,333 |
| 199,567 |
| | — |
| | — |
| — |
| 212,900 |
|
| Incentive compensation plan | 96 |
| 239 |
| 3,053 |
| | — |
| | — |
| — |
| 3,292 |
|
Dividend reinvestment plan (1) | 80 |
| — |
| 314 |
| | — |
| | 3,185 |
| — |
| 3,499 |
|
Cash dividend declared
($.3125 per share) | — |
| — |
| — |
| | — |
| | — |
| (29,846 | ) | (29,846 | ) |
| Treasury stock and other | — |
| — |
| — |
| | — |
| | (3,879 | ) | — |
| (3,879 | ) |
| Balance at December 31, 2019 | 95,508 |
| $ | 240,221 |
| $ | 494,265 |
| | $ | (31,028 | ) | | $ | (11,130 | ) | $ | 1,135,475 |
| $ | 1,827,803 |
|
| Net income | — |
| — |
| — |
| | — |
| | — |
| 88,505 |
| 88,505 |
|
| Other comprehensive loss | — |
| — |
| — |
| | (3,611 | ) | | — |
| — |
| (3,611 | ) |
| Common stock issued: | | | | | | | | | |
Dividend reinvestment plan (1) | 143 |
| — |
| (416 | ) | | — |
| | 5,621 |
| — |
| 5,205 |
|
Cash dividend declared
($.3125 per share) | — |
| — |
| — |
| | — |
| | — |
| (29,888 | ) | (29,888 | ) |
| Treasury stock and other | (8 | ) | — |
| 107 |
| | — |
| | 986 |
| — |
| 1,093 |
|
| Balance at March 31, 2020 | 95,643 |
| $ | 240,221 |
| $ | 493,956 |
| | $ | (34,639 | ) | | $ | (4,523 | ) | $ | 1,194,092 |
| $ | 1,889,107 |
|
| Net loss | — |
| — |
| — |
| | — |
| | — |
| (27,219 | ) | (27,219 | ) |
| Other comprehensive income | — |
| — |
| — |
| | 37 |
| | — |
| — |
| 37 |
|
| Common stock issued: |
|
|
| |
|
| |
|
|
|
|
| Incentive compensation plan | 2 |
| 6 |
| 113 |
| | — |
| | — |
| — |
| 119 |
|
Dividend reinvestment plan (1) | 185 |
| — |
| (1,694 | ) | | — |
| | 7,417 |
| — |
| 5,723 |
|
Cash dividend declared
($.3125 per share) | — |
| — |
| — |
| | — |
| | — |
| (29,948 | ) | (29,948 | ) |
| Treasury stock and other | — |
| — |
| (10 | ) | | — |
| | 1,118 |
| — |
| 1,108 |
|
| Balance at June 30, 2020 | 95,830 |
| $ | 240,227 |
| $ | 492,365 |
| | $ | (34,602 | ) | | $ | 4,012 |
| $ | 1,136,925 |
| $ | 1,838,927 |
|
| |
(1) | Shares sold through the DRP are issued from treasury stock at average cost, which may differ from the actual market price paid. |
| | | | | | | | | | | | | | | | | | | | | | | | | | | | | |
| (Thousands) | Number of Shares | Common Stock | Premium on Common Stock | Accumulated Other Comprehensive (Loss) Income | Treasury Stock And Other | Retained Earnings | Total |
| Balance at September 30, 2019 | 89,999 | | $ | 226,649 | | $ | 291,331 | | | $ | (31,787) | | | $ | (10,436) | | $ | 869,858 | | $ | 1,345,615 | |
| Net income | — | | — | | — | | | — | | | — | | 75,752 | | 75,752 | |
| Other comprehensive income | — | | — | | — | | | 759 | | | — | | — | | 759 | |
| Common stock issued: | | | | | | | | | |
| Common stock offering | 5,333 | | 13,333 | | 199,567 | | | — | | | — | | — | | 212,900 | |
| Incentive compensation plan | 96 | | 239 | | 3,053 | | | — | | | — | | — | | 3,292 | |
Dividend reinvestment plan (1) | 80 | | — | | 314 | | | — | | | 3,185 | | — | | 3,499 | |
| | | | | | | | | |
| Cash dividend declared ($.3125 per share) | — | | — | | — | | | — | | | — | | (29,846) | | (29,846) | |
| Treasury stock and other | — | | — | | — | | | — | | | (3,879) | | — | | (3,879) | |
| | | | | | | | | |
| | | | | | | | | |
| | | | | | | | | |
| Balance at December 31, 2019 | 95,508 | | $ | 240,221 | | $ | 494,265 | | | $ | (31,028) | | | $ | (11,130) | | $ | 915,764 | | $ | 1,608,092 | |
| Net income | — | | — | | — | | | — | | | — | | 73,846 | | 73,846 | |
| Other comprehensive income | — | | — | | — | | | (3,611) | | | — | | — | | (3,611) | |
| Common stock issued: | | | | | | | | | |
| | | | | | | | | |
Dividend reinvestment plan (1) | 143 | | — | | (416) | | | — | | | 5,621 | | — | | 5,205 | |
| | | | | | | | | |
| Cash dividend declared ($.3125 per share) | — | | — | | — | | | — | | | — | | (29,888) | | (29,888) | |
| Treasury stock and other | (8) | | — | | 107 | | | — | | | 986 | | — | | 1,093 | |
| Balance at March 31, 2020 | 95,643 | | $ | 240,221 | | $ | 493,956 | | | $ | (34,639) | | | $ | (4,523) | | $ | 959,722 | | $ | 1,654,737 | |
| | | | | | | | | |
| | | | | | | | | |
| | | | | | | | | |
| | | | | | | | | |
| | | | | | | | | |
| | | | | | | | | |
| | | | | | | | | |
| | | | | | | | | |
| | | | | | | | | |
(1)Shares sold through the DRP are issued from treasury stock at average cost, which may differ from the actual market price paid.
New Jersey Resources Corporation
Part I
ITEM 1.8. FINANCIAL STATEMENTS (Continued)AND SUPPLEMENTARY DATA
|
| | | | | | | | | | | | | | | | | | | | | | |
| Balance at September 30, 2018 | 88,293 |
| $ | 226,196 |
| $ | 274,748 |
| | $ | (12,610 | ) | | $ | (76,473 | ) | $ | 1,007,117 |
| $ | 1,418,978 |
|
| Net income | — |
| — |
| — |
| | — |
| | — |
| 86,248 |
| 86,248 |
|
| Other comprehensive income | — |
| — |
| — |
| | 234 |
| | — |
| — |
| 234 |
|
| Common stock issued: | | | | | | | | | |
| Incentive compensation plan | 137 |
| 343 |
| 1,791 |
| | — |
| | — |
| — |
| 2,134 |
|
Dividend reinvestment plan (1) | 82 |
| — |
| 454 |
| | — |
| | 3,238 |
| — |
| 3,692 |
|
| Waiver discount | 168 |
| — |
| 1,293 |
| | — |
| | 6,671 |
| — |
| 7,964 |
|
Cash dividend declared
($.2925 per share) | — |
| — |
| — |
| | — |
| | — |
| (25,938 | ) | (25,938 | ) |
| Treasury stock and other | — |
| — |
| — |
| | — |
| | 1,504 |
| — |
| 1,504 |
|
| Adoption of ASU 2016-01 | — |
| — |
| — |
| | (3,446 | ) | | — |
| 3,446 |
| — |
|
| Adoption of ASU 2017-05 | — |
| — |
| — |
| | — |
| | — |
| 4,970 |
| 4,970 |
|
| Adoption of ASU 2014-09/ASC 606 | — |
| — |
| — |
| | — |
| | — |
| (2,736 | ) | (2,736 | ) |
| Balance at December 31, 2018 | 88,680 |
| $ | 226,539 |
| $ | 278,286 |
| | $ | (15,822 | ) | | $ | (65,060 | ) | $ | 1,073,107 |
| $ | 1,497,050 |
|
| Net income | — |
| — |
| — |
| | — |
| | — |
| 73,573 |
| 73,573 |
|
| Other comprehensive income | — |
| — |
| — |
| | 305 |
| | — |
| — |
| 305 |
|
| Common stock issued: | | | | | | | | | |
| Incentive plan | 30 |
| 74 |
| 1,150 |
| | — |
| | — |
| — |
| 1,224 |
|
Dividend reinvestment plan (1) | 123 |
| — |
| 870 |
| | — |
| | 4,892 |
| — |
| 5,762 |
|
| Waiver discount | 339 |
| — |
| 3,123 |
| | — |
| | 13,452 |
| — |
| 16,575 |
|
Cash dividend declared
($.2925 per share) | — |
| — |
| — |
| | — |
| | — |
| (25,981 | ) | (25,981 | ) |
| Treasury stock and other | (8 | ) | — |
| — |
| | — |
| | 654 |
| — |
| 654 |
|
| Balance at March 31, 2019 | 89,164 |
| $ | 226,613 |
| $ | 283,429 |
| | $ | (15,517 | ) | | $ | (46,062 | ) | $ | 1,120,699 |
| $ | 1,569,162 |
|
| Net loss | — |
| — |
| — |
| | — |
| | — |
| (8,402 | ) | (8,402 | ) |
| Other comprehensive income | — |
| — |
| — |
| | 305 |
| | — |
| — |
| 305 |
|
| Common stock issued: |
|
|
| |
| |
|
|
|
|
|
| Incentive plan | 6 |
| 14 |
| 194 |
| | — |
| | — |
| — |
| 208 |
|
Dividend reinvestment plan (1) | 74 |
| — |
| 676 |
| | — |
| | 2,956 |
| — |
| 3,632 |
|
| Waiver discount | 674 |
| — |
| 6,115 |
| | — |
| | 26,737 |
| — |
| 32,852 |
|
Cash dividend declared
($.2925 per share) | — |
| — |
| — |
| | — |
| | — |
| (26,301 | ) | (26,301 | ) |
| Treasury stock and other | — |
| — |
| — |
| | — |
| | 741 |
| — |
| 741 |
|
| Balance at June 30, 2019 | 89,918 |
| $ | 226,627 |
| $ | 290,414 |
| | $ | (15,212 | ) | | $ | (15,628 | ) | $ | 1,085,996 |
| $ | 1,572,197 |
|
| |
(1) | Shares sold through the DRP are issued from treasury stock at average cost, which may differ from the actual market price paid. |
New Jersey Resources Corporation
Part I
NOTES TO UNAUDITED CONDENSED CONSOLIDATED FINANCIAL STATEMENTS
1. NATURE OF THE BUSINESS
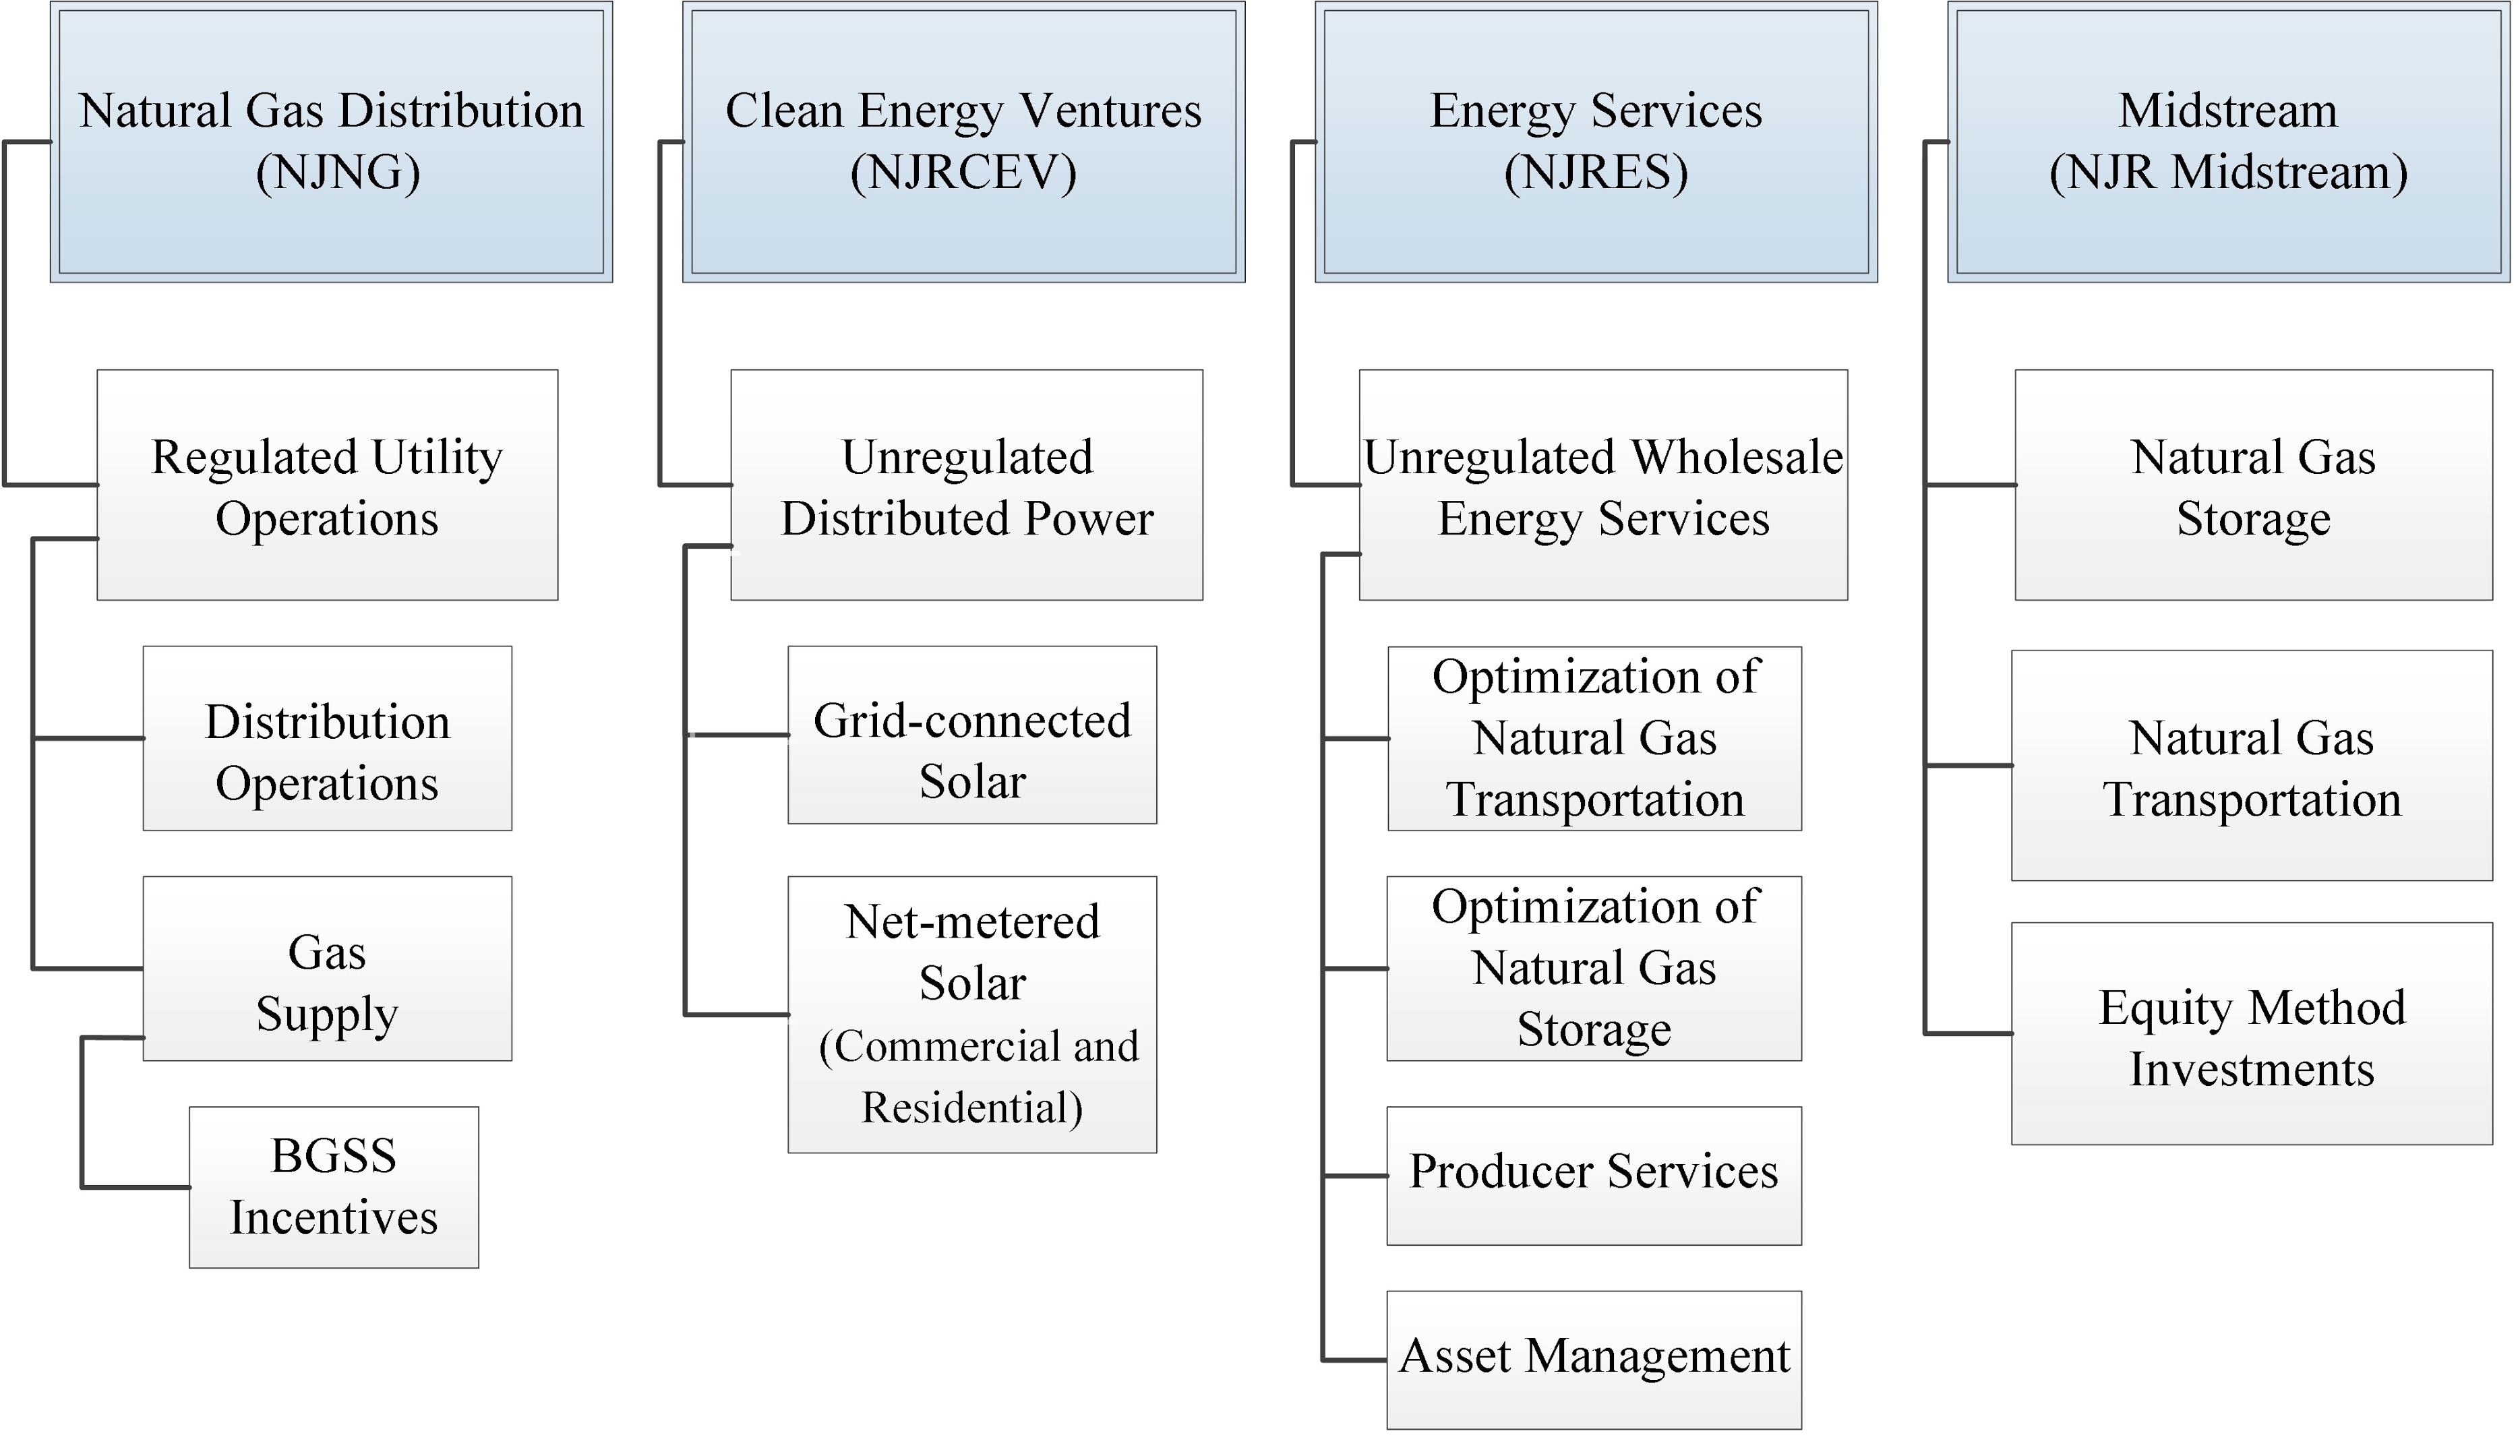
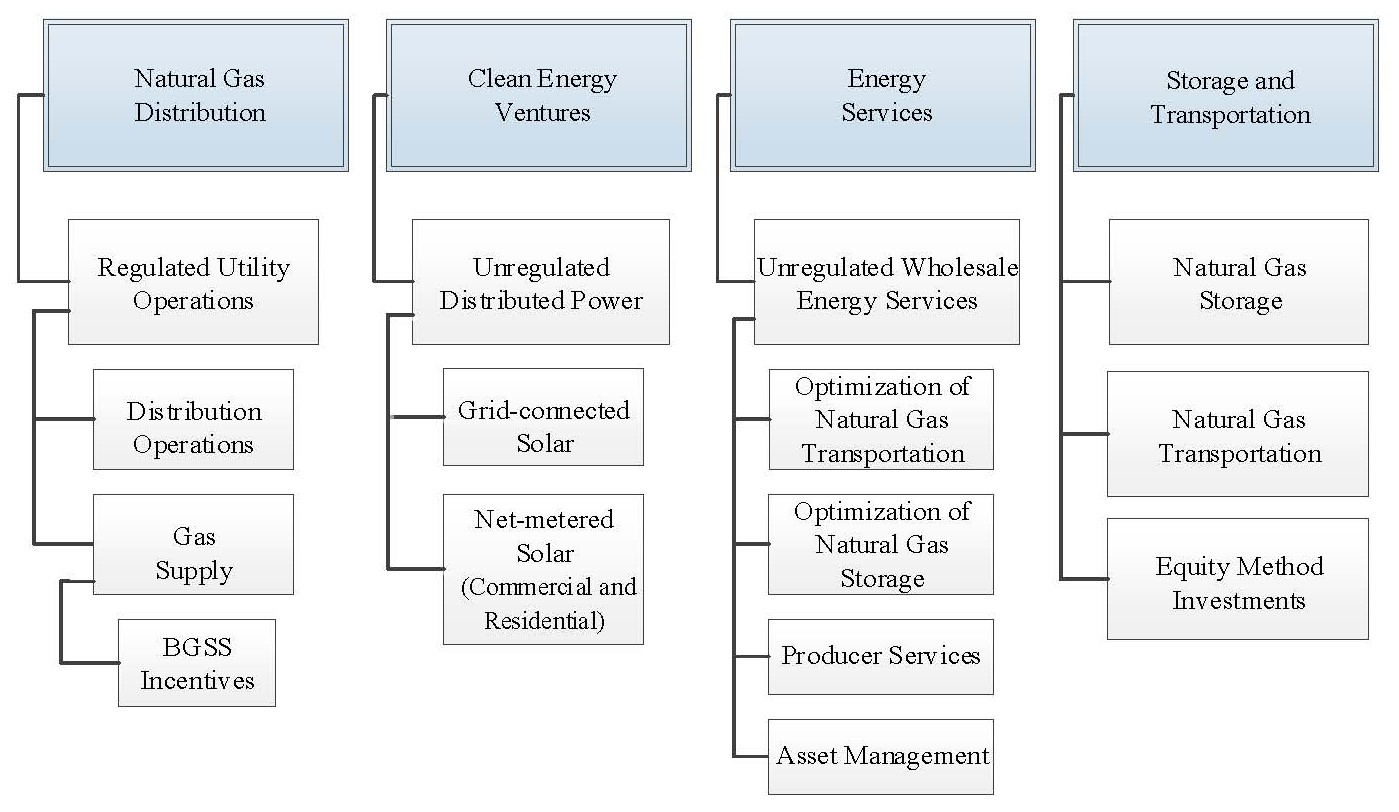
New Jersey Resources CorporationNJR provides regulated natural gas distribution services, transportation and storage services and operates certain unregulated businesses primarily through the following:
New Jersey Natural Gas CompanyNJNG provides natural gas utility service to approximately 555,000561,500 customers in centralthroughout Burlington, Middlesex, Monmouth, Morris and northernOcean counties in New Jersey and is subject to rate regulation by the BPU. NJNG comprises the Natural Gas Distribution segment.
NJR Clean Energy Ventures Corporation,NJRCEV, the Company's clean energy subsidiary, comprises the Clean Energy Ventures segment and consists of the Company's capital investments in commercial and residential solar projects located throughout New Jersey. Clean Energy Ventures finalized the sale of its remaining wind assets on February 7, 2019; see projects.
Note 18. Acquisitions and Dispositions for more details.
NJR Energy Services Company NJRES comprises the Energy Services segment. Energy Services maintains and transacts around a portfolio of natural gas storagetransportation and transportationstorage capacity contracts and provides physical wholesale energy, retail energy and energy management services in the U.S. and Canada.
NJR Midstream Holdings Corporation, which comprises the Storage and Transportation segment, formerly the Midstream segment, invests in energy-related ventures which include the Company'sthrough its subsidiaries. The Company holds a 50 percent combined ownership interest in Steckman Ridge, located in Pennsylvania the Company'sand 20 percent ownership interest in PennEast, which are accounted for under the equity method of accounting. The Company also operates natural gas storage and transmission assets through the wholly-owned subsidiaries of LeafLeaf River, which was acquired on October 11, 2019 and Adelphia Gateway, which was acquired on January 13, 2020, and is subject to FERCrate regulation. by FERC. See Note 17. Acquisitions and Dispositions for more information regarding these acquisitions.
NJR Retail Holdings Corporation has 2 principal subsidiaries, NJR Home Services Company,NJRHS, which provides heating, central air conditioning, standby generators, solar and other indoor and outdoor comfort products to residential homes throughout New Jersey, and Commercial Realty & Resources Corp.,CR&R, which owns commercial real estate. NJR Home Services CompanyNJRHS and Commercial Realty & Resources Corp.CR&R are included in Home Services and Other operations.
Impacts of the COVID-19 Pandemic
In March 2020, COVID-19 was declared a pandemic by the World Health Organization and the Centers for Disease Control and Prevention and has spread globally, including throughout the United States. The Company’s Unaudited Condensed Consolidated Financial Statements reflect estimates and assumptions made by management that affect the reported amounts of assets and liabilities at the balance sheet date and reported amounts of revenue and expenses during the reporting periods presented. The Company considered the impacts of COVID-19 on the assumptions and estimates used and determined that there have been no material adverse impacts on the Company’s results of operations as of June 30, 2020.
2. SUMMARY OF SIGNIFICANT ACCOUNTING POLICIES
The accompanying Unaudited Condensed Consolidated Financial Statements have been prepared by NJR in accordance with the rules and regulations of the SEC and GAAP. The September 30, 20192020 Balance Sheet data is derived from the audited financial statements of the Company. These Unaudited Condensed Consolidated Financial Statements should be read in conjunction with the consolidated financial statements and the notes thereto included in NJR's 20192020 Annual Report on Form 10-K.
The Unaudited Condensed Consolidated Financial Statements include the accounts of NJR and its subsidiaries. In the opinion of management, the accompanying Unaudited Condensed Consolidated Financial Statements reflect all adjustments necessary for a fair presentation of the results of the interim periods presented. These adjustments are of a normal and recurring nature. Because of the seasonal nature of NJR's utility and wholesale energy services operations, in addition to other factors, the financial results for the interim periods presented are not indicative of the results that are to be expected for the fiscal year ending September 30, 2020.2021. Intercompany transactions and accounts have been eliminated.
New Jersey Resources Corporation
Part I
NOTES TO UNAUDITED CONDENSED CONSOLIDATED FINANCIAL STATEMENTS (Continued)
Use of Estimates
The preparation of financial statements in conformity with GAAP requires the Company to make estimates that affect the reported amounts of assets, liabilities, revenues, expenses and related disclosure of contingencies during the reporting period. On a quarterly basis or more frequently whenever events or changes in circumstances indicate a need, the Company evaluates its estimates, including those related to the calculation of the fair value of derivative instruments, debt, equity method investments, unbilled revenues, allowance for doubtful accounts, provisions for depreciation and amortization, long-lived assets, regulatory assets and liabilities, income taxes, pensions and other postemployment benefits, contingencies related to environmental matters and litigation. ARO are evaluated as often as needed. The Company’s estimates are based on historical experience and on various other assumptions that are believed to be reasonable under the circumstances, the results of which form the basis for making judgments about the carrying value of assets and liabilities that are not readily apparent from other sources.
New Jersey Resources Corporation
Part I
NOTES TO UNAUDITED CONDENSED CONSOLIDATED FINANCIAL STATEMENTS (Continued)
The Company has legal, regulatory and environmental proceedings during the normal course of business that can result in loss contingencies. When evaluating the potential for a loss, the Company will establish a reserve if a loss is probable and can be reasonably estimated, in which case it is the Company’s policy to accrue the full amount of such estimates. Where the information is sufficient only to establish a range of probable liability, and no point within the range is more likely than any other, it is the Company’s policy to accrue the lower end of the range. In the normal course of business, estimated amounts are subsequently adjusted to actual results that may differ from estimates.
In March 2020, COVID-19 was declared a pandemic by the World Health Organization and the Centers for Disease Control and Prevention and has spread globally, including throughout the United States. The Company’s Unaudited Condensed Consolidated Financial Statements reflect estimates and assumptions made by management that affect the reported amounts of assets and liabilities at the balance sheet date and reported amounts of revenue and expenses during the reporting periods presented. The Company considered the impacts of COVID-19 on the assumptions and estimates used and determined that there have been no material adverse impacts on the Company’s results of operations as of March 31, 2021.
Acquisitions
The Company follows the guidance in ASC 805, Business Combinations, for determining the appropriate accounting treatment for acquisitions. ASU No. 2017-01, Clarifying the Definition of a Business, provides an initial fair value screen to determine if substantially all of the fair value of the assets acquired is concentrated in a single asset or group of similar assets. If the initial screening test is not met, the set is considered a business based on whether there are inputs and substantive processes in place. Based on the results of this analysis and conclusion on an acquisition’s classification of a business combination or an asset acquisition, the accounting treatment is derived.
If the acquisition is deemed to be a business, the acquisition method of accounting is applied. Identifiable assets acquired and liabilities assumed at the acquisition date are recorded at fair value. If the transaction is deemed to be an asset purchase, the cost accumulation and allocation model is used whereby the assets and liabilities are recorded based on the purchase price and allocated to the individual assets and liabilities based on relative fair values.
The determination and allocation of fair values to the identifiable assets acquired and liabilities assumed are based on various assumptions and valuation methodologies requiring considerable management judgment. The most significant variables in these valuations are discount rates and the number of years on which to base the cash flow projections, as well as other assumptions and estimates used to determine the cash inflows and outflows. Management determines discount rates based on the risk inherent in the acquired assets, specific risks, industry beta and capital structure of guideline companies. The valuation of an acquired business is based on available information at the acquisition date and assumptions that are believed to be reasonable. However, a change in facts and circumstances as of the acquisition date can result in subsequent adjustments during the measurement period, but no later than one year from the acquisition date.
Revenues
Revenues from the sale of natural gas to NJNG customers are recognized in the period that natural gas is delivered and consumed by customers, including an estimate for unbilled revenue. NJNG records unbilled revenue for natural gas services. Natural gas sales to individual customers are based on meter readings, which are performed on a systematic basis throughout the month. At the end of each month, the amount of natural gas delivered to each customer after the last meter reading through the end of the respective accounting period is estimated, and recognizes unbilled revenues related to these amounts. The unbilled revenue estimates are based on estimated customer usage by customer type, weather effects, unaccounted-for natural gas and the most current tariff rates.
Clean Energy Ventures recognizes revenue when SRECs are transferred to counterparties. SRECs are physically delivered through the transfer of certificates as per contractual settlement schedules. The Clean Energy Act of 2018 established guidelines for the closure of the SREC registration program to new applicants in New Jersey. The SREC program officially closed to new qualified solar projects on April 30, 2020.
In December 2019, the BPU established the TREC as the successor to the SREC program. TRECs provide a fixed compensation base multiplied by an assigned project factor in order to determine their value. The project factor is determined by the type and location of the project, as defined. All TRECs generated are required to be purchased monthly by a TREC program administrator as appointed by the BPU.
New Jersey Resources Corporation
Part I
NOTES TO UNAUDITED CONDENSED CONSOLIDATED FINANCIAL STATEMENTS (Continued)
In June 2020, Clean Energy Ventures began generating TRECs for qualified new residential and commercial solar projects placed into service following the close of the SREC program. TREC revenue is recognized when TRECs are generated and are transferred monthly based upon metered solar electricity activity.
Revenues for Energy Services are recognized when the natural gas is physically delivered to the customer. In addition, changes in the fair value of derivatives that economically hedge the forecasted sales of the natural gas are recognized in operating
New Jersey Resources Corporation
Part I
NOTES TO UNAUDITED CONDENSED CONSOLIDATED FINANCIAL STATEMENTS (Continued)
revenues as they occur, as noted above. Energy Services also recognizes changes in the fair value of SREC derivative contracts as a component of operating revenues.
MidstreamThe Storage and Transportation segment generates revenues from firm storage contracts and transportation contracts, related usage fees and hub services for the use of storage space, injections and withdrawals from their natural gas storage facility and the delivery of natural gas to customers. Demand fees are recognized as revenue over the term of the related agreement while usage fees and hub services revenues are recognized as services are performed.
Revenues from all other activities are recorded in the period during which products or services are delivered and accepted by customers, or over the related contractual term. See Note 3. Revenue for further information.
Gas in Storage
The following table summarizes gas in storage, at average cost by segment as of:
|
| | | | | | | | | | | | |
| | June 30, 2020 | September 30, 2019 |
| ($ in thousands) | Gas in Storage | | Bcf | Gas in Storage | | Bcf |
| Energy Services | | $ | 50,400 |
| 33.1 |
| | $ | 52,390 |
| 25.6 |
|
| Natural Gas Distribution | | 73,501 |
| 17.5 |
| | 117,413 |
| 27.0 |
|
| Midstream | | 61 |
| — |
| | — |
| — |
|
| Total | | $ | 123,962 |
| 50.6 |
| | $ | 169,803 |
| 52.6 |
|
Cash and Cash Equivalents
Cash and cash equivalents consist of cash on deposit and temporary investments with maturities of three months or less, and excludes restricted cash related to escrow balances for utility plant projects at NJNG and irrevocable letters of credit at Leaf River, which is recorded in other current and noncurrent assets on the Unaudited Condensed Consolidated Balance Sheets, respectively.
ASU No. 2016-18, an amendment to ASC 230, Statement of Cash Flows, required that any amounts that are deemed to be restricted cash or restricted cash-equivalents be included in cash and cash-equivalent balances on the cash flow statement. The following table provides a reconciliation of cash and cash equivalents and restricted cash reported in the Unaudited Condensed Consolidated Balance Sheets to the total amounts in the Unaudited Condensed Consolidated Statements of Cash Flows as follows:
| | | | | | | | | | | | | | |
| (Thousands) | March 31,
2021 | September 30,
2020 | March 31,
2020 | September 30,
2019 |
| Balance Sheet | | | | |
| Cash and cash equivalents | $ | 57,654 | | $ | 117,012 | | $ | 25,968 | | $ | 2,676 | |
| Restricted cash in other noncurrent assets | $ | 1,321 | | $ | 2,411 | | $ | 2,422 | | $ | 1,387 | |
| Statements of Cash Flow | | | | |
| Cash, cash equivalents and restricted cash | $ | 58,975 | | $ | 119,423 | | $ | 28,390 | | $ | 4,063 | |
|
| | | | | | | | | | | | |
| (Thousands) | June 30,
2020 | September 30,
2019 | June 30,
2019 | September 30,
2018 |
| Balance Sheet | | | | |
| Cash and cash equivalents | $ | 42,821 |
| $ | 2,676 |
| $ | 26,297 |
| $ | 1,458 |
|
| Restricted cash in other noncurrent assets | 2,424 |
| 1,387 |
| 391 |
| 252 |
|
| Statements of Cash Flow | | | | |
| Cash, cash equivalents and restricted cash in the statement of cash flows | $ | 45,245 |
| $ | 4,063 |
| $ | 26,688 |
| $ | 1,710 |
|
Allowance for Doubtful Accounts
As of October 1, 2021, the Company adopted ASU No. 2016-13, an amendment to ASC 326, Financial Instruments - Credit Losses, which changes the impairment model for certain financial assets that have a contractual right to receive cash, including trade and loan receivables. The Company segregates financial assets that fall within the scope of ASC 326, primarily trade receivables and unbilled revenues due in one year or less, into portfolio segments based on shared risk characteristics, such as geographical location and regulatory environment, for evaluation of expected credit losses. Historical and current information, such as average write-offs, are applied to each portfolio segment to estimate the allowance for losses on uncollectible receivables. Additionally, the allowance for losses on uncollectible receivables is adjusted for reasonable and supportable forecasts of future economic conditions, which can include changing weather, commodity prices, regulations, and macroeconomic factors, such as unemployment rates among others.
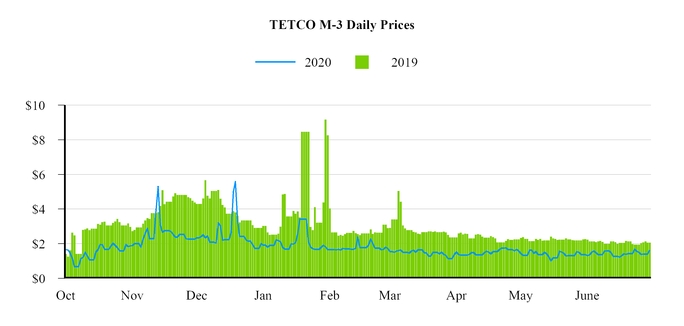
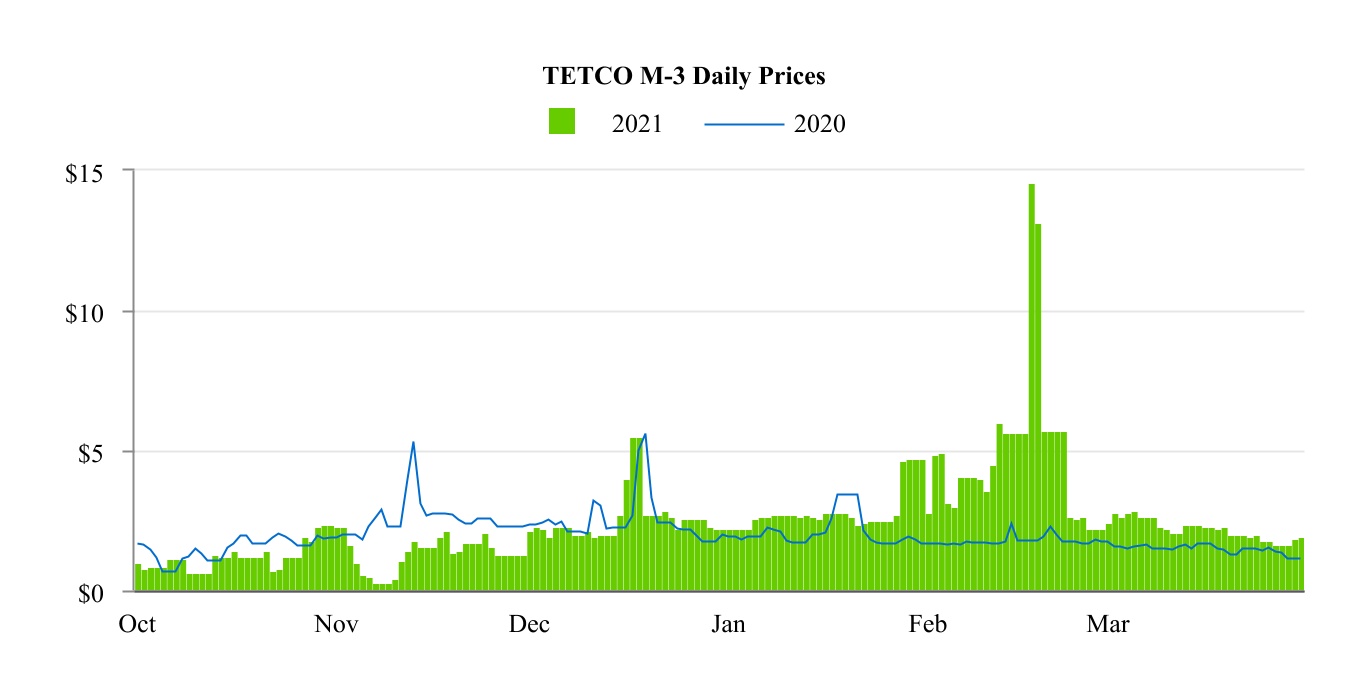
In February 2021, severe winter weather affected the U.S. mid-continent and southern regions that resulted in increased demand for natural gas supply and increases in wholesale energy prices. As a result, at March 31, 2021, Energy Services evaluated its counterparties for credit deterioration, as well as the related receivables for the purchase and receipt of natural gas for amounts past due.
The Company examined the credit characteristics of its counterparties, including the history of past due amounts for contractual settlements, counterparty credit ratings, and the likelihood of recovering amounts owed. As of March 31, 2021, the Company recorded a reserve for expected credit losses for Energy Services totaling $5.2 million within operations and maintenance expense on the Unaudited Condensed Consolidated Statement of Operations, representing management’s best estimate of expected credit losses at this time.
New Jersey Resources Corporation
Part I
NOTES TO UNAUDITED CONDENSED CONSOLIDATED FINANCIAL STATEMENTS (Continued)
It is possible that future developments could occur that could result in impairment of a portion or all of the remaining amounts owed to Energy Services, which would result in an additional charge to earnings.
Loans Receivable
NJNG currently provides loans, with terms ranging from two to 10 years, to customers that elect to purchase and install certain energy-efficient equipment in accordance with its BPU-approved SAVEGREEN program. The loans are recognized at fair value on the Unaudited Condensed Consolidated Balance Sheets. The Company recorded $13$14.3 million and $12.4$13.7 million in other current assets and $36.3$33.9 million and $38.8$35.3 million in other noncurrent assets as of June 30, 2020March 31, 2021 and September 30, 2019,2020, respectively, on the Unaudited Condensed Consolidated Balance Sheets, related to the loans. The Company regularly evaluates the credit quality and collection profile of its customers. If NJNG determines a loan is impaired, the basis of the loan would be subject to regulatory review for recovery. As of June 30, 2020March 31, 2021 and September 30, 2019,2020, the Company has not recorded any impairments for SAVEGREEN loans.
New Jersey Resources Corporation
Part I
NOTES TO UNAUDITED CONDENSED CONSOLIDATED FINANCIAL STATEMENTS (Continued)
Natural Gas in Storage
The following table summarizes natural gas in storage, at average cost by segment as of:
| | | | | | | | | | | | | | | | | | | | |
| March 31, 2021 | September 30, 2020 |
| ($ in thousands) | Natural Gas in Storage | Bcf | Natural Gas in Storage | Bcf |
| Natural Gas Distribution | | $ | 40,083 | | 9.4 | | | $ | 110,037 | | 27.2 | |
| Energy Services | | 34,439 | | 13.3 | | | 57,352 | | 34.3 | |
| Storage and Transportation | | 331 | | 0.1 | | | 115 | | 0.02 | |
| Total | | $ | 74,853 | | 22.8 | | | $ | 167,504 | | 61.52 | |
Software Costs
The Company capitalizes certain costs, such as software design and configuration, coding, testing and installation, that are incurred to purchase or create and implement computer software for internal use. Capitalized costs include external costs of materials and services utilized in developing or obtaining internal-use software and payroll and payroll-related costs for employees who are directly associated with and devote time to the internal-use software project. Maintenance costs are expensed as incurred. Upgrades and enhancements are capitalized if it is probable that such expenditures will result in additional functionality.
Amortization is recorded on the straight-line basis over the estimated useful lives. The Company capitalized $4.3 millionfollowing table presents the software costs included in the Unaudited Condensed Consolidated Financial Statements:
| | | | | | | | |
| (Thousands) | March 31,
2021 | September 30,
2020 |
| Balance Sheets | | |
| Utility plant, at cost | $ | 14,011 | | $ | 13,452 | |
| | |
| Nonutility plant and equipment, at cost | $ | 334 | | $ | 316 | |
| | |
| Accumulated depreciation and amortization, utility plant | $ | (790) | | $ | (279) | |
| Accumulated depreciation and amortization, nonutility plant and equipment | $ | (17) | | $ | (5) | |
| Software costs | $ | 5,485 | | $ | 4,707 | |
| | | | | | | | | | | | | | |
| Three Months Ended | Six Months Ended |
| March 31, | March 31, |
| Statements of Operations | 2021 | 2020 | 2021 | 2020 |
Operation and maintenance (1) | $ | 2,847 | | $ | 1,109 | | $ | 4,770 | | $ | 2,596 | |
| Depreciation and amortization | $ | 270 | | $ | 0 | | $ | 523 | | $ | 0 | |
(1)During the three and $1.7 millionsix months ended March 31, 2021, $111,000 and $188,000 was amortized from software costs into O&M. There were 0 amounts amortized for the three and six months ended March 31, 2020.
New Jersey Resources Corporation
Part I
NOTES TO UNAUDITED CONDENSED CONSOLIDATED FINANCIAL STATEMENTS (Continued)
Sale Leasebacks
NJNG utilizes sale leaseback arrangements as a financing mechanism to fund certain of its capital expenditures related to natural gas meters, whereby the physical asset is sold concurrent with an agreement to lease the asset back. These agreements include options to renew the lease or repurchase the asset at the end of the term. Proceeds from sale leaseback transactions are accounted for as financing arrangements and are included in other noncurrent assets and $12.2 million and $4.8 million in utility plant construction work in progresslong-term debt on the Unaudited Condensed Consolidated Balance Sheets at June 30, 2020Sheets. NJNG received $4.0 million in December 2019, in connection with the sale leaseback of its natural gas meters. There were 0 natural gas meter sale leasebacks recorded during the six months ended March 31, 2021.
In addition, for certain of its commercial solar energy projects, the Company enters into lease agreements that provide for the sale of commercial solar energy assets to third parties and September 30, 2019, respectively. the concurrent leaseback of the assets. For sale leaseback transactions where the Company has concluded that the terms of the arrangement does not qualify as a sale as the Company retains control of the underlying assets and, as such, the Company uses the financing method to account for the transaction. Under the financing method, the Company recognizes the proceeds received from the buyer-lessor that constitute a payment to acquire the solar energy asset as a financing arrangement, which is recorded as a component of debt on the Unaudited Condensed Consolidated Balance Sheets.
The Company recorded $1.9 millioncontinues to operate the solar assets and $4.5 millionis responsible for related expenses and entitled to retain the revenue generated from SRECs, TRECs and energy sales. The ITCs and other tax benefits associated with these solar projects transfer to the buyer; however, the payments are structured so that Clean Energy Ventures is compensated for the transfer of the related tax attributes. Accordingly, Clean Energy Ventures recognizes the equivalent value of the tax attributes in O&Mother income on the Unaudited Condensed Consolidated Statements of Operations over the respective five-year ITC recapture periods, starting with the second year of the lease.
In December 2020, Clean Energy Ventures received proceeds of $12.1 million in connection with the sale leaseback of two commercial solar projects. The proceeds received were recognized as a financing obligation on the Unaudited Condensed Consolidated Balance Sheets. Clean Energy Ventures did 0t receive proceeds related to the sale leaseback of commercial solar assets during the three and ninesix months ended June 30, 2020, respectively and $3.7 million in O&M on the Unaudited Condensed Consolidated Statements of Operations during both the three and nine months ended June 30, 2019.March 31, 2020.
Accumulated Other Comprehensive Loss
The following table presents the changes in the components of accumulated other comprehensive (loss) income, (loss), net of related tax effects during the three months ended June 30, 2020March 31, 2021 and 2019:2020:
| | | | | | | | | | | | | | | | | |
| (Thousands) | Cash Flow Hedges | Postemployment Benefit Obligation | Total |
| Balance at December 31, 2020 | $ | (10,166) | | | $ | (33,106) | | | $ | (43,272) | |
| Other comprehensive income, net of tax | | | | | |
| | | | | |
| Amounts reclassified from accumulated other comprehensive income, net of tax of $(79), $(244), $(323), respectively | 263 | | | 813 | | (1) | 1,076 | |
| | | | | |
| Balance at March 31, 2021 | $ | (9,903) | | | $ | (32,293) | | | $ | (42,196) | |
| | | | | |
| Balance at December 31, 2019 | $ | 0 | | | $ | (31,028) | | | $ | (31,028) | |
| Other comprehensive income, net of tax | | | | | |
| Other comprehensive (loss) income, before reclassifications, net of tax of $2,781, $(1,681), $1,100 | (9,711) | | | 5,378 | | | (4,333) | |
| Amounts reclassified from accumulated other comprehensive income, net of tax of $0, $(72), $(72) | 0 | | | 722 | | (1) | 722 | |
| Net current-period other comprehensive income, net of tax of $2,781, $(1,753), $1,028 | (9,711) | | | 6,100 | | | (3,611) | |
| | | | | |
| Balance at March 31, 2020 | $ | (9,711) | | | $ | (24,928) | | | $ | (34,639) | |
(1)Included in the computation of net periodic pension cost, a component of operations and maintenance expense on the Unaudited Condensed Consolidated Statements of Operations.
|
| | | | | | | | | | | | | | | |
| (Thousands) | Investments in Equity Securities | Cash Flow Hedges | Postemployment Benefit Obligation | Total |
| Balance at March 31, 2020 | $ | — |
| | $ | (9,711 | ) | | $ | (24,928 | ) | | $ | (34,639 | ) |
| Other comprehensive income (loss), net of tax | | | | | | | |
| Other comprehensive (loss) income, before reclassifications, net of tax of $0, $180, $0, $180 | — |
| | (626 | ) | | — |
| | (626 | ) |
| Amounts reclassified from accumulated other comprehensive loss, net of tax of $0, $0, $(191), $(191) | — |
| | — |
| | 663 |
| (1) | 663 |
|
| Net current-period other comprehensive income, net of tax of $0, $180, $(191), $(11) | — |
| | (626 | ) | | 663 |
| | 37 |
|
| Balance at June 30, 2020 | $ | — |
| | $ | (10,337 | ) | | $ | (24,265 | ) | | $ | (34,602 | ) |
| Balance at March 31, 2019 | $ | — |
| | $ | — |
| | $ | (15,517 | ) | | $ | (15,517 | ) |
| Other comprehensive income (loss), net of tax | | | | | | | |
| Amounts reclassified from accumulated other comprehensive loss, net of tax of $0, $(118), $(118) | — |
| | — |
| | 305 |
| (1) | 305 |
|
| Balance at June 30, 2019 | $ | — |
| | $ | — |
| | $ | (15,212 | ) | | $ | (15,212 | ) |
| |
(1) | Included in the computation of net periodic pension cost, a component of operations and maintenance expense on the Unaudited Condensed Consolidated Statements of Operations. |
New Jersey Resources Corporation
Part I
NOTES TO UNAUDITED CONDENSED CONSOLIDATED FINANCIAL STATEMENTS (Continued)
The following table presents the changes in the components of accumulated other comprehensive (loss) income, (loss), net of related tax effects during the ninesix months ended June 30,March 31, 2021 and 2020:
| | | | | | | | | | | | | | | | | |
| (Thousands) | Cash Flow Hedges | Postemployment Benefit Obligation | Total |
| Balance at September 30, 2020 | $ | (10,397) | | | $ | (33,918) | | | $ | (44,315) | |
| Other comprehensive income, net of tax | | | | | |
| | | | | |
| Amounts reclassified from accumulated other comprehensive income, net of tax of $(191), $(489), $(680), respectively | 494 | | | 1,625 | | (1) | 2,119 | |
| | | | | |
| | | | | |
| Balance at March 31, 2021 | $ | (9,903) | | | $ | (32,293) | | | $ | (42,196) | |
| | | | | |
| Balance at September 30, 2019 | $ | 0 | | | $ | (31,787) | | | $ | (31,787) | |
| Other comprehensive income, net of tax | | | | | |
| Other comprehensive (loss) income, before reclassifications, net of tax of $2,781, $(1,681), $1,100 | (9,711) | | | 5,378 | | | (4,333) | |
| Amounts reclassified from accumulated other comprehensive income, net of tax of $0, $(289) and $(289) | 0 | | | 1,481 | | (1) | 1,481 | |
| Net current-period other comprehensive income, net of tax of $2,781, $(1,970), $811 | (9,711) | | | 6,859 | | | (2,852) | |
| | | | | |
| Balance at March 31, 2020 | $ | (9,711) | | | $ | (24,928) | | | $ | (34,639) | |
(1)Included in the computation of net periodic pension cost, a component of operations and maintenance expense on the Unaudited Condensed Consolidated Statements of Operations.
Change in Accounting Policy
Effective October 1, 2020, the Company changed its method of accounting for ITCs at Clean Energy Ventures from the flow through method to the deferral method. Prior to the change, the Company recognized ITCs as a reduction of income tax expense in the period that the qualified solar energy property, to which it relates, was placed in service. Effective with the accounting change, the Company records ITCs as a reduction to the carrying value of the related asset when placed in service and 2019:recognizes ITCs in earnings as a reduction to depreciation expense over the productive life of the related property. The deferral method is considered the preferred method per the authoritative guidance as described in ASC 740 - Income Taxes. The change to the deferral method is also consistent with the application of authoritative accounting guidance throughout other reporting segments and promotes proper matching of the benefits of the recognition of the ITC with the expected use of the asset.
|
| | | | | | | | | | | | | | | |
| (Thousands) | Investments in Equity Securities | Cash Flow Hedges | Postemployment Benefit Obligation | Total |
| Balance at September 30, 2019 | $ | — |
| | $ | — |
| | $ | (31,787 | ) | | $ | (31,787 | ) |
| Other comprehensive income (loss), net of tax | | | | | | | |
| Other comprehensive (loss) income, before reclassifications, net of tax of $0, $2,961, $(1,681), $1,280 | — |
| | (10,337 | ) | | 5,378 |
| | (4,959 | ) |
| Amounts reclassified from accumulated other comprehensive loss, net of tax of $0, $0, $(480), $(480) | — |
| | — |
| | 2,144 |
| (1) | 2,144 |
|
| Net current-period other comprehensive income, net of tax of $0, $2,961, $(2,161), $800 | — |
| | (10,337 | ) | | 7,522 |
| | (2,815 | ) |
| Balance at June 30, 2020 | $ | — |
| | $ | (10,337 | ) | | $ | (24,265 | ) | | $ | (34,602 | ) |
| Balance at September 30, 2018 | $ | 3,446 |
| | $ | — |
| | $ | (16,056 | ) | | $ | (12,610 | ) |
| Other comprehensive income (loss), net of tax | | | | | | | |
| Amounts reclassified from accumulated other comprehensive income (loss), net of tax of $0, $(333), $(333) | — |
| | — |
| | 844 |
| (1) | 844 |
|
| Reclassification to retained earnings | $ | (3,446 | ) | (2) |
|
| | $ | — |
| | $ | (3,446 | ) |
| Balance at June 30, 2019 | $ | — |
| | $ | — |
| | $ | (15,212 | ) | | $ | (15,212 | ) |
| |
(1) | Included in the computation of net periodic pension cost, a component of operations and maintenance expense on the Unaudited Condensed Consolidated Statements of Operations. |
| |
(2) | Due to the adoption of ASU No. 2016-01, an amendment to ASC 825, Financial Instruments.
|
Reclassification
Certain prior period amounts related to energy and other taxesThe impact of the change in accounting policy on the Unaudited Condensed Consolidated Statements of Operations and prepaid expensesduring the three months ended March 31, 2020 is as follows:
| | | | | | | | | | | |
| As Previously | Effect of | As |
| (Thousands) | Reported | Change | Adjusted |
| Depreciation and amortization | $ | 30,784 | | (3,268) | | $ | 27,516 | |
| Total operating expenses | $ | 544,399 | | (3,268) | | $ | 541,131 | |
| Operating income | $ | 95,215 | | 3,268 | | $ | 98,483 | |
| Income before income taxes and equity in earnings of affiliates | $ | 83,273 | | 3,268 | | $ | 86,541 | |
| Income tax (benefit) expense | $ | (1,643) | | 17,927 | | $ | 16,284 | |
| Net income | $ | 88,505 | | (14,659) | | $ | 73,846 | |
| Earnings per common share | | | |
| Basic | $ | 0.93 | | (0.15) | | $ | 0.78 | |
| Diluted | $ | 0.92 | | (0.15) | | $ | 0.77 | |
New Jersey Resources Corporation
Part I
NOTES TO UNAUDITED CONDENSED CONSOLIDATED FINANCIAL STATEMENTS (Continued)
The impact of the change in accounting policy on the Unaudited Condensed Consolidated Statements of Operations during the six months ended March 31, 2020 is as follows:
| | | | | | | | | | | |
| As Previously | Effect of | As |
| (Thousands) | Reported | Change | Adjusted |
| Depreciation and amortization | $ | 58,542 | | (6,389) | | $ | 52,153 | |
| Total operating expenses | $ | 1,057,938 | | (6,389) | | $ | 1,051,549 | |
| Operating income | $ | 196,712 | | 6,389 | | $ | 203,101 | |
| Income before income taxes and equity in earnings of affiliates | $ | 168,986 | | 6,389 | | $ | 175,375 | |
| Income tax (benefit) expense | $ | (1,902) | | 34,657 | | $ | 32,755 | |
| Net income | $ | 177,866 | | (28,268) | | $ | 149,598 | |
| Earnings per common share | | | |
| Basic | $ | 1.90 | | (0.30) | | $ | 1.60 | |
| Diluted | $ | 1.89 | | (0.30) | | $ | 1.59 | |
The cumulative effect of the change in accounting policy on the Unaudited Condensed Consolidated Balance Sheets and Unaudited Consolidated Condensed Statementsas of Cash Flows have been reclassified to conform toSeptember 30, 2020 is as follows:
| | | | | | | | | | | |
| As Previously | Effect of | As |
| (Thousands) | Reported | Change | Adjusted |
| Assets | | | |
| Nonutility plant and equipment, at cost | $ | 1,430,723 | | (322,211) | | $ | 1,108,512 | |
| Accumulated depreciation and amortization, nonutility plant and equipment | $ | (202,507) | | 61,945 | | $ | (140,562) | |
| Property, plant and equipment, net | $ | 3,983,035 | | (260,266) | | $ | 3,722,769 | |
| Other noncurrent assets | $ | 78,716 | | 6,941 | | $ | 85,657 | |
| Total noncurrent assets | $ | 964,435 | | 6,941 | | $ | 971,376 | |
| Total assets | $ | 5,569,802 | | (253,325) | | $ | 5,316,477 | |
| Capitalization | | | |
| Retained earnings | $ | 1,148,297 | | (200,796) | | $ | 947,501 | |
| Common stock equity | $ | 1,844,692 | | (200,796) | | $ | 1,643,896 | |
| Total capitalization | $ | 4,104,158 | | (200,796) | | $ | 3,903,362 | |
| Liabilities | | | |
| Deferred income taxes | $ | 190,610 | | (52,529) | | $ | 138,081 | |
| Total noncurrent liabilities | $ | 931,922 | | (52,529) | | $ | 879,393 | |
| Total capitalization and liabilities | $ | 5,569,802 | | (253,325) | | $ | 5,316,477 | |
The impact of the current period presentation. Certain amounts related to software costschange in accounting policy on the Unaudited Condensed Consolidated Balance Sheets have been reclassified to utility plant construction workStatements of Cash Flows as of March 31, 2020 is as follows:
| | | | | | | | | | | |
| As Previously | Effect of | As |
| (Thousands) | Reported | Change | Adjusted |
| Depreciation and amortization | $ | 58,542 | | (6,389) | | $ | 52,153 | |
| Deferred income taxes | $ | 318 | | 34,657 | | $ | 34,975 | |
| | | |
| | | |
| | | |
| | | |
New Jersey Resources Corporation
Part I
NOTES TO UNAUDITED CONDENSED CONSOLIDATED FINANCIAL STATEMENTS (Continued)
The impact of the change in progress to conform toaccounting policy on the current period presentation.Unaudited Condensed Consolidated Statements of Common Stock Equity as of March 31, 2020 is as follows:
| | | | | | | | | | | |
| As Previously | Effect of | As |
| (Thousands) | Reported | Change | Adjusted |
| Retained Earnings | | | |
| Balance at September 30, 2019 | $ | 1,075,960 | | (206,102) | | $ | 869,858 | |
| Net income | $ | 89,361 | | (13,609) | | $ | 75,752 | |
| Balance at December 31, 2019 | $ | 1,135,475 | | (219,711) | | $ | 915,764 | |
| Net income | $ | 88,505 | | (14,659) | | $ | 73,846 | |
| Balance at March 31, 2020 | $ | 1,194,092 | | (234,370) | | $ | 959,722 | |
| Total | | | |
| Balance at September 30, 2019 | $ | 1,551,717 | | (206,102) | | $ | 1,345,615 | |
| Net income | $ | 89,361 | | (13,609) | | $ | 75,752 | |
| Balance at December 31, 2019 | $ | 1,827,803 | | (219,711) | | $ | 1,608,092 | |
| Net income | $ | 88,505 | | (14,659) | | $ | 73,846 | |
| Balance at March 31, 2020 | $ | 1,889,107 | | (234,370) | | $ | 1,654,737 | |
Recently Adopted Updates to the Accounting Standards Codification
LeasesFinancial Instruments
In FebruaryJune 2016, the FASB issued ASU No. 2016-02,2016-13, an amendment to ASC 842,326, LeasesFinancial Instruments - Credit Losses, which along with other ASU's containing minor amendmentschanges the impairment model for certain financial assets that have a contractual right to receive cash, including trade and technical corrections, provides forloan receivables. The new model requires recognition based upon an estimation of expected credit losses rather than recognition of losses when it is probable that they have been incurred. An entity will apply the amendment through a comprehensive overhaulcumulative-effect adjustment to retained earnings as of the lease accounting modelbeginning of the first reporting period in which the guidance is effective. The Company assessed the impact of the guidance on NJR's reserve methodologies and changescredit policies and procedures for any assets that could be impacted, noting the definitionmajority of NJR's financial assets are short-term in nature, such as trade receivables and unbilled revenues.
The Company completed its evaluation of this amendment and all subsequent amendments related to this topic and adopted this guidance on October 1, 2020 using the modified retrospective method. The adoption did not result in a leasecumulative effect adjustment to retained earnings as the current expected lifetime loss estimates were not materially different from the reserves already in place.
The Company segregates financial assets that fall within the accounting literature. Under the new standard, all leases with an original term greater thanscope of ASC 326, primarily trade receivables and unbilled revenues due in one year or less, into portfolio segments based on shared risk characteristics, such as geographical location and regulatory environment, for evaluation of expected credit losses. Historical and current information, such as average write-offs, are recordedapplied to each portfolio segment to estimate the allowance for losses on uncollectible receivables. Additionally, the balance sheet. The related assetallowance for losses on uncollectible receivables is amortized straight-line over the termadjusted for reasonable and supportable forecasts of the lease. Additional disclosures are required to provide transparencyfuture economic conditions, which can include changing weather, commodity prices, regulations, and macroeconomic factors, such as to the amount, timing and uncertainty of cash flows arising from leasing activities.unemployment rates among others.
Fair Value
In JanuaryAugust 2018, the FASB issued ASU No. 2018-01, a further amendment to ASC 842, Leases, which was introduced by ASU No. 2016-02, as discussed above. This update provides an optional practical expedient that allows companies to not evaluate existing or expired land easements that were not previously accounted for under Topic 840 as leases as of October 1, 2019. The Company adopted this practical expedient. In July 2018, the FASB issued ASU No. 2018-11, which provides an optional transition method to ASC 842 that allows the Company to recognize a cumulative effect adjustment to the opening balance of retained earnings in the period of adoption, if any. The Company elected this transition method and did not have any cumulative impact to the opening balance of retained earnings.
The Company’s other practical expedient elections include the package of practical expedients whereby the Company was not required to reassess all of its leases identified, lease classifications and initial direct costs associated with leases. The Company also elected to not separate non-lease components from lease components and elected to exclude short-term leases from the recognition requirements of ASC 842. The Company did not elect the portfolio approach for the application of the discount rate and therefore applies a discount rate individually to each lease in its population. The Company adopted ASC 842 and all related amendments on October 1, 2019, using the modified retrospective transition method.
The Company’s lease agreements primarily consist of commercial solar land leases, storage and capacity leases, equipment and real property leases, including land and office facility leases and office equipment and the sale-leaseback of its natural gas meters. The total right-of-use assets and operating lease liabilities recorded upon adoption were $67.1 million. Upon the acquisition
New Jersey Resources Corporation
Part I
NOTES TO UNAUDITED CONDENSED CONSOLIDATED FINANCIAL STATEMENTS (Continued)
of Leaf River, on October 11, 2019, the Company adopted ASC 842 for Leaf River which resulted in additional right-of-use asset and lease liability of $21.6 million.
Derivatives and Hedging
In August 2017, the FASB issued ASU No. 2017-12,2018-13, an amendment to ASC 815820, , Derivatives and HedgingFair Value Measurement, which along with other ASU's containing minor amendmentsremoves, modifies and technical corrections, is intendedadds to make targeted improvements tocertain disclosure requirements of fair value measurements. Disclosure requirements removed include the accountingamount of and reasons for hedging activities by better aligning an entity’s risk management activitiestransfers between Level 1 and financial reporting for hedging relationships. These amendments modify the accounting for both nonfinancial and financial risk components and align the recognition and presentationLevel 2 of the effectsfair value hierarchy, the policy for timing of the hedging instrumenttransfers between levels and the hedged itemvaluation processes for Level 3 fair value measurements. Modifications include considerations around the requirement to disclose the timing of liquidation of an investee’s assets and the date when restrictions from redemption might lapse. The additions include the requirement to disclose changes in unrealized gains and losses for the financial statements. Additionally,period in other comprehensive income for recurring Level 3 fair value measurements held and the amendments are intendedrange and weighted average of significant unobservable inputs used to simplify the application of the hedge accounting guidance and provide relief to companies by easing certain hedge documentation requirements.develop Level 3 fair value measurements. The Company adopted this guidance on October 1, 2019. As October2020 on a prospective basis. The Company does not have either Level 3 fair value measurements or transfers between Level 1 2019, the Company did not apply hedge accounting toor Level 2 in its risk management activities,current portfolios, and therefore, the amendmentsthis ASU did not have an impact on itsto the Company's financial position, results of operations or cash flows.
New Jersey Resources Corporation
Part I
NOTES TO UNAUDITED CONDENSED CONSOLIDATED FINANCIAL STATEMENTS (Continued)
Compensation - Retirement Benefits
In OctoberAugust 2018, the FASB issued ASU No. 2018-16,2018-14, an amendment to ASC 815,715, Derivatives and HedgingCompensation - Retirement Benefits, which permitsremoves disclosures that no longer are considered cost-beneficial, clarifies the usespecific requirements of the Overnight Index Swap rate based on the Secured Overnight Financing Ratecertain disclosures and adds new disclosure requirements identified as an additional acceptable U.S. benchmark interest rate for hedge accounting purposes.relevant. The Company adopted this guidance on October 1, 2019. As the Company did not apply hedge accounting to any of its risk management activities as of October 1, 2019, the amendments did not have an impact on its financial position, results of operations or cash flows.
Stock Compensation
In June 2018, the FASB issued ASU No. 2018-07, an amendment to ASC 718, Compensation - Stock Compensation, which expands the scope of Topic 718 to include share-based payment transactions for acquiring goods and services from non-employees. The Company adopted this guidance on October 1, 2019.2020. There was no impact to the Company's financial position, results of operations or cash flows.
Financial Instruments
In March 2020, the FASB issued ASU No. 2020-03, Codification Improvements to Financial Instruments. This accounting standard provides clarification of guidance for financial instruments and makes narrow scope amendments related to various issues. The Company adopted this standard effective upon issuance. There was no impact to the Company's financial position, results of operations or cash flows as a result of its adoption.
Reference Rate Reform
In March 2020,January 2021, the FASB issued ASU No. 2020-04, an amendment to2021-01, which refines the scope of ASC 848, Reference Rate Reform, which provides relief for companies preparing for discontinuationand clarifies some of interest rates such as LIBOR.its guidance of global reference rate reform activities. The amendments in this update providepermits entities to elect certain optional expedients and exceptions when accounting for applying GAAP toderivative contracts and certain hedging relationships and other transactions affected by changes in the interest rates used for discounting cash flows, for computing variation margin settlements, and for calculating price alignment interest in connection with reference rate reform if certain criteria are met.activities under way in global financial markets (the “discounting transition”). The amendments in this update apply only to contracts and hedging relationships that reference LIBOR or another reference rate expected to be discontinued due to reference rate reform. The amendments in this update are elective and are effective upon the ASU issuance through December 31, 2022. There was no impact to the Company's financial position, results of operations or cash flows as a result of its adoption.
Other Recent Updates to the Accounting Standards Codification
Financial Instruments
In June 2016, the FASB issued ASU No. 2016-13, an amendment to ASC 326, Financial Instruments - Credit Losses, which changes the impairment model for certain financial assets that have a contractual right to receive cash, including trade and loan receivables. The new model requires recognition based upon an estimation of expected credit losses rather than recognition of losses when it is probable that they have been incurred. An entity will apply the amendment through a cumulative-effect adjustment to retained earnings as of the beginning of the first reporting period in which the guidance is effective. The guidance is effective for the Company beginning October 1, 2020, with early adoption permitted. The Company is in the process of assessing the impact of the guidance on NJR's reserve methodologies and credit policies and procedures for any assets that could be impacted. The Company is currently evaluating the amendment and all subsequent amendments related to this topic, but does not expect that the pending adoption of this ASU will have a material effect on its consolidated financial statements and its disclosures since the majority of NJR's financial assets are short-term in nature, such as trade receivables.
New Jersey Resources Corporation
Part I
NOTES TO UNAUDITED CONDENSED CONSOLIDATED FINANCIAL STATEMENTS (Continued)
Fair Value
In August 2018, the FASB issued ASU No. 2018-13, an amendment to ASC 820, Fair Value Measurement, which removes, modifies and adds to certain disclosure requirements of fair value measurements. Disclosure requirements removed include the amount of and reasons for transfers between Level 1 and Level 2 of the fair value hierarchy, the policy for timing of transfers between levels and the valuation processes for Level 3 fair value measurements. Modifications include considerations around the requirement to disclose the timing of liquidation of an investee’s assets and the date when restrictions from redemption might lapse. The additions include the requirement to disclose changes in unrealized gains and losses for the period in other comprehensive income for recurring Level 3 fair value measurements held and the range and weighted average of significant unobservable inputs used to develop Level 3 fair value measurements. The guidance is effective for the Company beginning October 1, 2020, with early adoption permitted. Upon adoption, the amendments will be applied on a prospective or retrospective basis depending on the specific amendments’ transition requirements. The Company is currently evaluating the impact of the adoption of this ASU but does not expect that its pending adoption will have a material effect on its consolidated financial statements. The Company does not have either Level 3 fair value measurements or transfers between Level 1 or Level 2 in its current portfolios, and therefore, does not expect this ASU to have an impact on the Company's financial statements and disclosures.
Compensation - Retirement Benefits
In August 2018, the FASB issued ASU No. 2018-14, an amendment to ASC 715, Compensation - Retirement Benefits, which removes disclosures that no longer are considered cost-beneficial, clarifies the specific requirements of certain disclosures and adds new disclosure requirements identified as relevant. The guidance is effective for the Company beginning October 1, 2021, with early adoption permitted. Upon adoption, the amended presentation and disclosure guidance will be applied on a retrospective basis. The Company is continuing to evaluate the amendment to fully understand the impact on the Company's disclosures upon adoption but it is not expecting this ASU to materially affect the financial statements and disclosures.
Income Taxes
In December 2019, the FASB issued ASU No. 2019-12, an amendment to ASC 740, Income Taxes, which is intended to simplifysimplifies the accounting for income taxes and changes the accounting for certain income tax transactions, among other minor improvements. The guidance is effective for the Company beginning October 1, 2021, with early adoption permitted. Upon adoption, the amendments will be applied on a prospective basis. The Company is currently evaluating the amendments to understand the impact on its financial position, results of operations, cash flows and disclosures upon adoption.
Investments - Equity Method and Derivatives and Hedging
In January 2020, the FASB issued ASU No. 2020-01, Investments - Equity Securities (Topic 321), Investments - Equity Method and Joint Ventures (Topic 323), and Derivatives and Hedging (Topic 815): Clarifying the Interactions between Topic 321, Topic 323, and Topic 815. The update states thatrequires an entity is required to evaluate observable transactions that necessitate applying or discontinuing the equity method of accounting when applying the measurement alternative in Topic 321. This evaluation occurs prior to applying or upon ceasing the equity method. The update also states that when applying paragraph 815-10-15-141(a) for forward contracts and purchased options, an entity is not required to assess whether the underlying securities will be accounted for under the equity method in accordance with Topic 323 or fair value method under Topic 825 upon settlement or exercise. The guidance is effective for the Company beginning October 1, 2021, with early adoption permitted. The Company is currently evaluating the impact of the adoption of this ASUthese amendments but does not expect that its pending adoption will have a material effect on its consolidated financial statements.
In October 2020, the FASB issued ASU 2020-10, which clarifies application of various provisions in the ASC by amending and adding new headings, cross referencing to other guidance, and refining or correcting terminology. It also improves the consistency by amending the ASC to include all disclosure guidance in the appropriate section. The guidance is effective for the Company on October 1, 2021, with early adoption permitted. The Company is currently evaluating the impact of the adoption of these amendments but does not expect that its pending adoption will have a material effect on its consolidated financial statements.
3. REVENUE
Revenue is recognized when a performance obligation is satisfied by transferring control of a product or service to a customer. Revenue is measured based on consideration specified in a contract with a customer using the output method of progress. The Company elected to apply the invoice practical expedient for recognizing revenue, whereby the amounts invoiced to customers represent the value to the customer and the Company’s performance completion as of the invoice date. Therefore, the Company does not disclose related unsatisfied performance obligations. The Company also elected the practical expedient to exclude from the transaction price all sales taxes that are assessed by a governmental authority and therefore presents sales tax net in operating revenues on the Unaudited Condensed Consolidated Statements of Operations.
New Jersey Resources Corporation
Part I
NOTES TO UNAUDITED CONDENSED CONSOLIDATED FINANCIAL STATEMENTS (Continued)
Below is a listing of performance obligations that arise from contracts with customers, along with details on the satisfaction of each performance obligation, the significant payment terms and the nature of the goods and services being transferred, by reporting segment and other business operations:
|
| | | | | | | |
| Revenue Recognized Over Time: |
| Segment | Performance Obligation | Description |
| Natural Gas Distribution | Natural gas utility sales | NJNG's performance obligation is to provide natural gas to residential, commercial and industrial customers as demanded, based on regulated tariff rates, which are established by the BPU. Revenues from the sale of natural gas are recognized in the period that gas is delivered and consumed by customers, including an estimate for quantities consumed but not billed during the period. Payment is due each month for the previous month's deliveries. Natural gas sales to individual customers are based on meter readings, which are performed on a systematic basis throughout the billing period. The unbilled revenue estimates are based on estimated customer usage by customer type, weather effects and the most current tariff rates. NJNG is entitled to be compensated for performance completed until service is terminated.
Customers may elect to purchase the natural gas commodity from NJNG or may contract separately to purchase natural gas directly from third-party suppliers. As NJNG is acting as an agent on behalf of the third-party supplier, revenue is recorded for the delivery of natural gas to the customer. |
| Clean Energy Ventures | Commercial solar and wind electricity | Clean Energy Ventures operates wholly-owned solar projects that recognize revenue as electricity is generated and transferred to the customer. The performance obligation is to provide electricity to the customer in accordance with contract terms or the interconnection agreement and is satisfied upon transfer of electricity generated. All wind assets were sold as of February 2019.
Revenue is recognized as invoiced and the payment is due each month for the previous month's services. |
| Clean Energy Ventures | Residential solar electricity | Clean Energy Ventures provides access to residential rooftop and ground-mount solar equipment to customers who then pay the Company a monthly fee. The performance obligation is to provide electricity to the customer based on generation from the underlying residential solar asset and is satisfied upon transfer of electricity generated.
Revenue is derived from the contract terms and is recognized as invoiced, with the payment due each month for the previous month's services. |
| Clean Energy Ventures | Transition renewable energy certificates | Clean Energy Ventures generates TRECs, which are created for every MWh of electricity produced by a solar generator. The performance obligation of Clean Energy Ventures is to generate electricity and TRECs, which are purchased monthly by a REC Administrator.
Revenue is recognized upon generation. |
| Energy Services | Natural gas services | The performance obligation of Energy Services is to provide the customer transportation, storage and asset management services on an as-needed basis. Energy Services generates revenue through management fees, demand charges, reservation fees and transportation charges centered around the buying and selling of the natural gas commodity, representing one series of distinct performance obligations.
Revenue is recognized based upon the underlying natural gas quantities physically delivered and the customer obtaining control. Energy Services invoices customers on a monthly basis in line with the terms of the contract and based on the services provided. Payment is due each month for the previous month's invoiced services. |
MidstreamStorage and Transportation | Natural gas services | The performance obligation of Midstreamthe Storage and Transportation segment is to provide the customer with storage and transportation services. MidstreamThe Storage and Transportation segment generates revenues from firm storage contracts and transportation contracts, related usage fees for the use of storage space, injection and withdrawal at the storage facility and the delivery of natural gas to customers. Revenue is recognized over time as our customers receive the benefits of our service as it is performed on their behalf using an output method based on actual deliveries.
Demand fees are recognized as revenue over the term of the related agreement. |
| Home Services and Other | Service contracts | Home Services enters into service contracts with homeowners to provide maintenance and replacement services of applicable heating, cooling or ventilation equipment. All services provided relate to a distinct performance obligation which is to provide services for the specific equipment over the term of the contract.
Revenue is recognized on a straight-line basis over the term of the contract and payment is due upon receipt of the invoice. |
| | |
New Jersey Resources Corporation
Part I
NOTES TO UNAUDITED CONDENSED CONSOLIDATED FINANCIAL STATEMENTS (Continued)
|
| | | | | | | |
| Revenue Recognized at a Point in Time: |
MidstreamStorage and Transportation | Natural gas services | The performance obligation of Midstreamthe Storage and Transportation segment is to provide the customer with storage and transportation services. MidstreamThe Storage and Transportation segment generates revenues from hub services for the use of storage space, injection and withdrawal from the storage facility. Hub services include park and loan transactions and wheeling.
Hub services revenues are recognized as services are performed. |
| Home Services and Other | Installations | Home Services installs appliances, including but not limited to, furnaces, air conditioning units, boilers and generators to customers. The distinct performance obligation is the installation of the contracted appliance, which is satisfied at the point in time the item is installed.
The transaction price for each installation differs accordingly. Revenue is recognitionrecognized at a point in time upon completion of the installation, which is when the customer is billed.
|
Disaggregated revenues from contracts with customers by product line and by reporting segment and other business operations during the three months ended June 30,March 31, 2021 and 2020, is as follows:
| | | | | | | | | | | | | | | | | | | | | | | |
| (Thousands) | Natural Gas Distribution | Clean Energy Ventures | Energy Services | Storage and Transportation | Home Services
and Other | Total |
| 2021 | | | | | | | |
| Natural gas utility sales | $ | 296,888 | | 0 | | | 0 | | 0 | | 0 | | $ | 296,888 | |
| Natural gas services | 0 | | 0 | | | 11,011 | | 13,926 | | 0 | | 24,937 | |
| Service contracts | 0 | | 0 | | | 0 | | 0 | | 8,314 | | 8,314 | |
| Installations and maintenance | 0 | | 0 | | | 0 | | 0 | | 4,459 | | 4,459 | |
| Renewable energy certificates | 0 | | 817 | | | 0 | | 0 | | 0 | | 817 | |
| Electricity sales | 0 | | 4,882 | | | 0 | | 0 | | 0 | | 4,882 | |
Eliminations (1) | 0 | | 0 | | | 0 | | (669) | | (252) | | (921) | |
| Revenues from contracts with customers | 296,888 | | 5,699 | | | 11,011 | | 13,257 | | 12,521 | | 339,376 | |
Alternative revenue programs (2) | (6,664) | | 0 | | | 0 | | 0 | | 0 | | (6,664) | |
| Derivative instruments | 19,943 | | 777 | | (3) | 451,558 | | 0 | | 0 | | 472,278 | |
Eliminations (1) | 0 | | 0 | | | (2,803) | | 0 | | 0 | | (2,803) | |
| Revenues out of scope | 13,279 | | 777 | | | 448,755 | | 0 | | 0 | | 462,811 | |
| Total operating revenues | $ | 310,167 | | 6,476 | | | 459,766 | | 13,257 | | 12,521 | | $ | 802,187 | |
| 2020 | | | | | | | |
| Natural gas utility sales | $ | 266,868 | | 0 | | | 0 | | 0 | | 0 | | $ | 266,868 | |
| Natural gas services | 0 | | 0 | | | 9,634 | | 11,076 | | 0 | | 20,710 | |
| Service contracts | 0 | | 0 | | | 0 | | 0 | | 8,073 | | 8,073 | |
| Installations and maintenance | 0 | | 0 | | | 0 | | 0 | | 4,292 | | 4,292 | |
| | | | | | | |
| Electricity sales | 0 | | 4,458 | | | 0 | | 0 | | 0 | | 4,458 | |
Eliminations (1) | 0 | | 0 | | | 0 | | (675) | | (326) | | (1,001) | |
| Revenues from contracts with customers | 266,868 | | 4,458 | | | 9,634 | | 10,401 | | 12,039 | | 303,400 | |
Alternative revenue programs (2) | 22,073 | | 0 | | | 0 | | 0 | | 0 | | 22,073 | |
| Derivative instruments | 8,279 | | 1,537 | | | 304,067 | | 0 | | 0 | | 313,883 | |
Eliminations (1) | 0 | | 0 | | | 258 | | 0 | | 0 | | 258 | |
| Revenues out of scope | 30,352 | | 1,537 | | | 304,325 | | 0 | | 0 | | 336,214 | |
| Total operating revenues | $ | 297,220 | | 5,995 | | | 313,959 | | 10,401 | | 12,039 | | $ | 639,614 | |
|
| | | | | | | | | | | | | | | |
| (Thousands) | Natural Gas Distribution | Clean Energy Ventures | Energy Services | Midstream | Home Services and Other | Total |
| 2020 | | | | | | | |
| Natural gas utility sales | $ | 124,888 |
| — |
| | — |
| — |
| — |
| $ | 124,888 |
|
| Wholesale natural gas services | — |
| — |
| | 3,536 |
| 11,863 |
| — |
| 15,399 |
|
| Service contracts | — |
| — |
| | — |
| — |
| 8,126 |
| 8,126 |
|
| Installations and maintenance | — |
| — |
| | — |
| — |
| 4,243 |
| 4,243 |
|
| Electricity sales | — |
| 5,294 |
| | — |
| — |
| — |
| 5,294 |
|
Eliminations (1) | — |
| — |
| | — |
| (720 | ) | (206 | ) | (926 | ) |
| Revenues from contracts with customers | 124,888 |
| 5,294 |
| | 3,536 |
| 11,143 |
| 12,163 |
| 157,024 |
|
| Alternative revenue programs | (2,665 | ) | — |
| | — |
| — |
| — |
| (2,665 | ) |
| Derivative Instruments | 6,309 |
| 8,102 |
| (2) | 130,007 |
| — |
| — |
| 144,418 |
|
Eliminations (1) | — |
| — |
| | 197 |
| — |
| — |
| 197 |
|
| Revenues out of scope | 3,644 |
| 8,102 |
| | 130,204 |
| — |
| — |
| 141,950 |
|
| Total operating revenues | $ | 128,532 |
| 13,396 |
| | 133,740 |
| 11,143 |
| 12,163 |
| $ | 298,974 |
|
| 2019 | | | | | | | |
| Natural gas utility sales | $ | 115,525 |
| — |
| | — |
| — |
| — |
| $ | 115,525 |
|
| Wholesale natural gas services | — |
| — |
| | 3,876 |
| — |
| — |
| 3,876 |
|
| Service contracts | — |
| — |
| | — |
| — |
| 7,890 |
| 7,890 |
|
| Installations and maintenance | — |
| — |
| | — |
| — |
| 5,193 |
| 5,193 |
|
| Electricity sales | — |
| 4,745 |
| | — |
| — |
| — |
| 4,745 |
|
Eliminations (1) | — |
| — |
| | — |
| — |
| (456 | ) | (456 | ) |
| Revenues from contracts with customers | 115,525 |
| 4,745 |
| | 3,876 |
| — |
| 12,627 |
| 136,773 |
|
| Alternative revenue programs | 2,025 |
| — |
| | — |
| — |
| — |
| 2,025 |
|
| Derivative Instruments | 3,232 |
| 6,705 |
| (2) | 286,145 |
| — |
| — |
| 296,082 |
|
Eliminations (1) | — |
| — |
| | 62 |
| — |
| — |
| 62 |
|
| Revenues out of scope | 5,257 |
| 6,705 |
| | 286,207 |
| — |
| — |
| 298,169 |
|
| Total operating revenues | $ | 120,782 |
| 11,450 |
| | 290,083 |
| — |
| 12,627 |
| $ | 434,942 |
|
(2)Includes CIP revenue.
(3)Includes SREC revenue.
| |
(1) | Consists of transactions between subsidiaries that are eliminated in consolidation. |
| |
(2) | Includes SREC revenue. |
New Jersey Resources Corporation
Part I
NOTES TO UNAUDITED CONDENSED CONSOLIDATED FINANCIAL STATEMENTS (Continued)
Disaggregated revenues from contracts with customers by product line and by reporting segment and other business operations during the ninesix months ended June 30,March 31, 2021 and 2020, and 2019, is as follows:
| | | | | | | | | | | | | | | | | | | | | | | |
| (Thousands) | Natural Gas Distribution | Clean Energy Ventures | Energy Services | Storage and Transportation | Home Services
and Other | Total |
| 2021 | | | | | | | |
| Natural gas utility sales | $ | 486,252 | | 0 | | | 0 | | 0 | | 0 | | $ | 486,252 | |
| Natural gas services | 0 | | 0 | | | 17,439 | | 27,030 | | 0 | | 44,469 | |
| Service contracts | 0 | | 0 | | | 0 | | 0 | | 16,573 | | 16,573 | |
| Installations and maintenance | 0 | | 0 | | | 0 | | 0 | | 8,777 | | 8,777 | |
| Renewable energy certificates | 0 | | 1,507 | | | 0 | | 0 | | 0 | | 1,507 | |
| Electricity sales | 0 | | 9,270 | | | 0 | | 0 | | 0 | | 9,270 | |
Eliminations (1) | 0 | | 0 | | | 0 | | (1,326) | | (419) | | (1,745) | |
| Revenues from contracts with customers | 486,252 | | 10,777 | | | 17,439 | | 25,704 | | 24,931 | | 565,103 | |
Alternative revenue programs (2) | (5,096) | | 0 | | | 0 | | 0 | | 0 | | (5,096) | |
| Derivative instruments | 24,740 | | 2,069 | | (3) | 674,607 | | 0 | | 0 | | 24,740 | |
Eliminations (1) | 0 | | 0 | | | (4,931) | | 0 | | 0 | | (4,931) | |
| Revenues out of scope | 19,644 | | 2,069 | | | 669,676 | | 0 | | 0 | | 691,389 | |
| Total operating revenues | $ | 505,896 | | 12,846 | | | 687,115 | | 25,704 | | 24,931 | | $ | 1,256,492 | |
| 2020 | | | | | | | |
| Natural gas utility sales | $ | 486,762 | | 0 | | | 0 | | 0 | | 0 | | $ | 486,762 | |
| Natural gas services | 0 | | 0 | | | 16,955 | | 20,148 | | 0 | | 37,103 | |
| Service contracts | 0 | | 0 | | | 0 | | 0 | | 16,111 | | 16,111 | |
| Installations and maintenance | 0 | | 0 | | | 0 | | 0 | | 9,161 | | 9,161 | |
| | | | | | | |
| Electricity sales | 0 | | 8,476 | | | 0 | | 0 | | 0 | | 8,476 | |
Eliminations (1) | 0 | | 0 | | | 0 | | (1,342) | | (741) | | (2,083) | |
| Revenues from contracts with customers | 486,762 | | 8,476 | | | 16,955 | | 18,806 | | 24,531 | | 555,530 | |
Alternative revenue programs (2) | 20,130 | | 0 | | | 0 | | 0 | | 0 | | 20,130 | |
| Derivative instruments | 9,951 | | 3,731 | | (3) | 667,161 | | 0 | | 0 | | 680,843 | |
Eliminations (1) | 0 | | 0 | | | (1,853) | | 0 | | 0 | | (1,853) | |
| Revenues out of scope | 30,081 | | 3,731 | | | 665,308 | | 0 | | 0 | | 699,120 | |
| Total operating revenues | $ | 516,843 | | 12,207 | | | 682,263 | | 18,806 | | 24,531 | | $ | 1,254,650 | |
|
| | | | | | | | | | | | | | | |
| (Thousands) | Natural Gas Distribution | Clean Energy Ventures | Energy Services | Midstream | Home Services and Other | Total |
| 2020 | | | | | | | |
| Natural gas utility sales | $ | 611,650 |
| — |
| | — |
| — |
| — |
| $ | 611,650 |
|
| Natural gas services | — |
| — |
| | 20,491 |
| 32,011 |
| — |
| 52,502 |
|
| Service contracts | — |
| — |
| | — |
| — |
| 24,237 |
| 24,237 |
|
| Installations and maintenance | — |
| — |
| | — |
| — |
| 13,404 |
| 13,404 |
|
| Electricity sales | — |
| 13,770 |
| | — |
| — |
| — |
| 13,770 |
|
Eliminations (1) | — |
| — |
| | — |
| (2,062 | ) | (947 | ) | (3,009 | ) |
| Revenues from contracts with customers | 611,650 |
| 13,770 |
| | 20,491 |
| 29,949 |
| 36,694 |
| 712,554 |
|
| Alternative revenue programs | 17,465 |
| — |
| | — |
| — |
| — |
| 17,465 |
|
| Derivative Instruments | 16,260 |
| 11,833 |
| (2) | 797,168 |
| — |
| — |
| 825,261 |
|
Eliminations (1) | — |
| — |
| | (1,656 | ) | — |
| — |
| (1,656 | ) |
| Revenues out of scope | 33,725 |
| 11,833 |
| | 795,512 |
| — |
| — |
| 841,070 |
|
| Total operating revenues | $ | 645,375 |
| 25,603 |
| | 816,003 |
| 29,949 |
| 36,694 |
| $ | 1,553,624 |
|
| 2019 | | | | | | | |
| Natural gas utility sales | $ | 598,676 |
| — |
| | — |
| — |
| — |
| $ | 598,676 |
|
| Natural gas services | — |
| — |
| | 26,204 |
| — |
| — |
| 26,204 |
|
| Service contracts | — |
| — |
| | — |
| — |
| 23,533 |
| 23,533 |
|
| Installations and maintenance | — |
| — |
| | — |
| — |
| 14,373 |
| 14,373 |
|
| Electricity sales | — |
| 16,944 |
| | — |
| — |
| — |
| 16,944 |
|
Eliminations (1) | — |
| — |
| | — |
| — |
| (1,653 | ) | (1,653 | ) |
| Revenues from contracts with customers | 598,676 |
| 16,944 |
| | 26,204 |
| — |
| 36,253 |
| 678,077 |
|
| Alternative revenue programs | 9,059 |
| — |
| | — |
| — |
| — |
| 9,059 |
|
| Derivative Instruments | 14,432 |
| 20,763 |
| (2) | 1,398,909 |
| — |
| — |
| 1,434,104 |
|
Eliminations (1) | — |
| — |
| | (8,276 | ) | — |
| — |
| (8,276 | ) |
| Revenues out of scope | 23,491 |
| 20,763 |
| | 1,390,633 |
| — |
| — |
| 1,434,887 |
|
| Total operating revenues | $ | 622,167 |
| 37,707 |
| | 1,416,837 |
| — |
| 36,253 |
| $ | 2,112,964 |
|
| |
(1) | Consists of transactions between subsidiaries that are eliminated in consolidation. |
| |
(2) | Includes SREC revenue. |
(2)Includes CIP revenue.
(3)Includes SREC revenue.
Disaggregated revenues from contracts with customers by customer type and by reporting segment and other business operations during the three months ended June 30,March 31, 2021 and 2020, and 2019, is as follows:
| | | | | | | | | | | | | | | | | | | | |
| (Thousands) | Natural Gas Distribution | Clean Energy Ventures | Energy Services | Storage and Transportation | Home Services
and Other | Total |
| 2021 | | | | | | |
| Residential | $ | 225,174 | | 2,692 | | 0 | | 0 | | 12,234 | | $ | 240,100 | |
| Commercial and industrial | 42,824 | | 3,007 | | 11,011 | | 13,257 | | 287 | | 70,386 | |
| Firm transportation | 28,190 | | 0 | | 0 | | 0 | | 0 | | 28,190 | |
| Interruptible and off-tariff | 700 | | 0 | | 0 | | 0 | | 0 | | 700 | |
| Revenues out of scope | 13,279 | | 777 | | 448,755 | | 0 | | 0 | | 462,811 | |
| Total operating revenues | $ | 310,167 | | 6,476 | | 459,766 | | 13,257 | | 12,521 | | $ | 802,187 | |
| 2020 | | | | | | |
| Residential | $ | 199,776 | | 2,469 | | 0 | | 0 | | 11,831 | | $ | 214,076 | |
| Commercial and industrial | 41,635 | | 1,989 | | 9,634 | | 10,401 | | 208 | | 63,867 | |
| Firm transportation | 24,123 | | 0 | | 0 | | 0 | | 0 | | 24,123 | |
| Interruptible and off-tariff | 1,334 | | 0 | | 0 | | 0 | | 0 | | 1,334 | |
| Revenues out of scope | 30,352 | | 1,537 | | 304,325 | | 0 | | 0 | | 336,214 | |
| Total operating revenues | $ | 297,220 | | 5,995 | | 313,959 | | 10,401 | | 12,039 | | $ | 639,614 | |
|
| | | | | | | | | | | | | | |
| (Thousands) | Natural Gas Distribution | Clean Energy Ventures | Energy Services | Midstream | Home Services and Other | Total |
| 2020 | | | | | | |
| Residential | $ | 89,095 |
| 2,587 |
| — |
| — |
| 11,845 |
| $ | 103,527 |
|
| Commercial and industrial | 20,050 |
| 2,707 |
| 3,536 |
| 11,143 |
| 318 |
| 37,754 |
|
| Firm transportation | 14,331 |
| — |
| — |
| — |
| — |
| 14,331 |
|
| Interruptible and off-tariff | 1,412 |
| — |
| — |
| — |
| — |
| 1,412 |
|
| Revenues out of scope | 3,644 |
| 8,102 |
| 130,204 |
| — |
| — |
| 141,950 |
|
| Total operating revenues | $ | 128,532 |
| 13,396 |
| 133,740 |
| 11,143 |
| 12,163 |
| $ | 298,974 |
|
| | | | | | | |
| 2019 | | | | | | |
| Residential | $ | 63,984 |
| 2,304 |
| — |
| — |
| 12,388 |
| $ | 78,676 |
|
| Commercial and industrial | 37,511 |
| 2,441 |
| 3,876 |
| — |
| 239 |
| 44,067 |
|
| Firm transportation | 12,296 |
| — |
| — |
| — |
| — |
| 12,296 |
|
| Interruptible and off-tariff | 1,734 |
| — |
| — |
| — |
| — |
| 1,734 |
|
| Revenues out of scope | 5,257 |
| 6,705 |
| 286,207 |
| — |
| — |
| 298,169 |
|
| Total operating revenues | $ | 120,782 |
| 11,450 |
| 290,083 |
| — |
| 12,627 |
| $ | 434,942 |
|
New Jersey Resources Corporation
Part I
NOTES TO UNAUDITED CONDENSED CONSOLIDATED FINANCIAL STATEMENTS (Continued)
Disaggregated revenues from contracts with customers by customer type and by reporting segment and other business operations during the ninesix months ended June 30,March 31, 2021 and 2020, and 2019, is as follows:
| | | | | | | | | | | | | | | | | | | | |
| (Thousands) | Natural Gas Distribution | Clean Energy Ventures | Energy Services | Storage and Transportation | Home Services
and Other | Total |
| 2021 | | | | | | |
| Residential | $ | 362,398 | | 5,414 | | 0 | | 0 | | 24,438 | | $ | 392,250 | |
| Commercial and industrial | 72,053 | | 5,363 | | 17,439 | | 25,704 | | 493 | | 121,052 | |
| Firm transportation | 49,294 | | 0 | | 0 | | 0 | | 0 | | 49,294 | |
| Interruptible and off-tariff | 2,507 | | 0 | | 0 | | 0 | | 0 | | 2,507 | |
| Revenues out of scope | 19,644 | | 2,069 | | 669,676 | | 0 | | 0 | | 691,389 | |
| Total operating revenues | $ | 505,896 | | 12,846 | | 687,115 | | 25,704 | | 24,931 | | $ | 1,256,492 | |
| | | | | | |
| 2020 | | | | | | |
| Residential | $ | 352,998 | | 4,929 | | 0 | | 0 | | 24,110 | | $ | 382,037 | |
| Commercial and industrial | 87,057 | | 3,547 | | 16,955 | | 18,806 | | 421 | | 126,786 | |
| Firm transportation | 43,712 | | — | | 0 | | 0 | | 0 | | 43,712 | |
| Interruptible and off-tariff | 2,995 | | 0 | | 0 | | 0 | | 0 | | 2,995 | |
| Revenues out of scope | 30,081 | | 3,731 | | 665,308 | | 0 | | 0 | | 699,120 | |
| Total operating revenues | $ | 516,843 | | 12,207 | | 682,263 | | 18,806 | | 24,531 | | $ | 1,254,650 | |
|
| | | | | | | | | | | | | | |
| (Thousands) | Natural Gas Distribution | Clean Energy Ventures | Energy Services | Midstream | Home Services and Other | Total |
| 2020 | | | | | | |
| Residential | $ | 442,093 |
| 7,516 |
| — |
| — |
| 35,955 |
| $ | 485,564 |
|
| Commercial and industrial | 107,107 |
| 6,254 |
| 20,491 |
| 29,949 |
| 739 |
| 164,540 |
|
| Firm transportation | 58,043 |
| — |
| — |
| — |
| — |
| 58,043 |
|
| Interruptible and off-tariff | 4,407 |
| — |
| — |
| — |
| — |
| 4,407 |
|
| Revenues out of scope | 33,725 |
| 11,833 |
| 795,512 |
| — |
| — |
| 841,070 |
|
| Total operating revenues | $ | 645,375 |
| 25,603 |
| 816,003 |
| 29,949 |
| 36,694 |
| $ | 1,553,624 |
|
| | | | | | | |
| 2019 | | | | | | |
| Residential | $ | 402,192 |
| 6,627 |
| — |
| — |
| 35,522 |
| $ | 444,341 |
|
| Commercial and industrial | 139,691 |
| 10,317 |
| 26,204 |
| — |
| 731 |
| 176,943 |
|
| Firm transportation | 52,006 |
| — |
| — |
| — |
| — |
| 52,006 |
|
| Interruptible and off-tariff | 4,787 |
| — |
| — |
| — |
| — |
| 4,787 |
|
| Revenues out of scope | 23,491 |
| 20,763 |
| 1,390,633 |
| — |
| — |
| 1,434,887 |
|
| Total operating revenues | $ | 622,167 |
| 37,707 |
| 1,416,837 |
| — |
| 36,253 |
| $ | 2,112,964 |
|
Customer Accounts Receivable/Credit Balances and Deposits
The timing of revenue recognition, customer billings and cash collections resulting in accounts receivables, billed and unbilled, and customers’ credit balances and deposits on the Unaudited Condensed Consolidated Balance Sheets during the ninesix months ended June 30, 2020,March 31, 2021 are as follows:
| | | | | | | | | | | |
| Customer Accounts Receivable | Customers' Credit |
| (Thousands) | Billed | Unbilled | Balances and Deposits |
| Balance as of October 1, 2020 | $ | 134,173 | | $ | 9,226 | | $ | 25,934 | |
| Increase (Decrease) | 103,056 | | 32,715 | | (5,171) | |
| Balance as of March 31, 2021 | $ | 237,229 | | $ | 41,941 | | $ | 20,763 | |
|
| | | | | | | | | |
| | Customer Accounts Receivable | Customers' Credit |
| (Thousands) | Billed | Unbilled | Balances and Deposits |
| Balance as of October 1, 2019 | $ | 139,263 |
| $ | 6,510 |
| $ | 27,116 |
|
| Increase (decrease) | 3,796 |
| 2,228 |
| (7,060 | ) |
| Balance as of June 30, 2020 | $ | 143,059 |
| $ | 8,738 |
| $ | 20,056 |
|
The following table provides information about receivables, which are included within accounts receivable, billed and unbilled, and customers’ credit balances and deposits, respectively, on the Unaudited Condensed Consolidated Balance Sheets as of June 30, 2020:March 31, 2021:
| | | | | | | | | | | | | | | | | | | | | |
| (Thousands) | Natural Gas Distribution | Clean Energy Ventures | Energy Services | Storage and Transportation | Home Services
and Other | | Total |
| | | | | | | |
| Customer accounts receivable | | | | | | | |
| Billed | $ | 119,845 | | 4,794 | | 107,353 | | 3,437 | | 1,800 | | | $ | 237,229 | |
| Unbilled | 39,652 | | 2,289 | | 0 | | 0 | | 0 | | | 41,941 | |
| Customers' credit balances and deposits | (20,763) | | 0 | | 0 | | 0 | | 0 | | | (20,763) | |
| Total | $ | 138,734 | | 7,083 | | 107,353 | | 3,437 | | 1,800 | | | $ | 258,407 | |
| | | | | | | |
| | | | | | | |
| | | | | | | |
| | | | | | | |
| | | | | | | |
| | | | | | | |
|
| | | | | | | | | | | | | | |
| (Thousands) | Natural Gas Distribution | Clean Energy Ventures | Energy Services | Midstream | Home Services and Other | Total |
| Customer accounts receivable | | | | | | |
| Billed | $ | 78,370 |
| 3,469 |
| 55,364 |
| 3,828 |
| 2,028 |
| $ | 143,059 |
|
| Unbilled | 8,738 |
| — |
| — |
| — |
| — |
| 8,738 |
|
| Customers' credit balances and deposits | (20,056 | ) | — |
| — |
| — |
| — |
| (20,056 | ) |
| Total | $ | 67,052 |
| 3,469 |
| 55,364 |
| 3,828 |
| 2,028 |
| $ | 131,741 |
|
4. REGULATION
NJNG is subject to cost-based regulation, therefore, it is permitted to recover authorized operating expenses and earn a reasonable return on its utility capital investments based on the BPU's approval. The impact of the ratemaking process and decisions authorized by the BPU allows NJNG to capitalize or defer certain costs that are expected to be recovered from its customers as regulatory assets and to recognize certain obligations representing amounts that are probable future expenditures as regulatory liabilities in accordance with accounting guidance applicable to regulated operations.
NJNG's recovery of costs is facilitated through its base rates, BGSS and other regulatory tariff riders. NJNG is required to make annual filings to the BPU for review of its BGSS, CIP and various other programs and related rates. Annual rate changes are typically requested to be effective at the beginning of the following fiscal year. All rate and program changes are subject to
New Jersey Resources Corporation
Part I
NOTES TO UNAUDITED CONDENSED CONSOLIDATED FINANCIAL STATEMENTS (Continued)
proper notification and BPU review and approval. In addition, NJNG is permitted to implement certain BGSS rate changes on a provisional basis with proper notification to the BPU.
New Jersey Resources Corporation
Part I
NOTES TO UNAUDITED CONDENSED CONSOLIDATED FINANCIAL STATEMENTS (Continued)
Regulatory assets and liabilities included on the Unaudited Condensed Consolidated Balance Sheets for NJNG are comprised of the following:
| | | | | | | | |
| (Thousands) | March 31,
2021 | September 30,
2020 |
| Regulatory assets-current | | |
| New Jersey Clean Energy Program | $ | 6,147 | | $ | 15,570 | |
| Conservation Incentive Program | 14,025 | | 19,120 | |
| | |
| Derivatives at fair value, net | 1,509 | | 0 | |
| Other current regulatory assets | 1,730 | | 1,682 | |
| Total current regulatory assets | $ | 23,411 | | $ | 36,372 | |
| Regulatory assets-noncurrent | | |
| Environmental remediation costs: | | |
| Expended, net of recoveries | $ | 37,476 | | $ | 36,516 | |
| Liability for future expenditures | 143,495 | | 150,590 | |
| Deferred income taxes | 31,603 | | 28,241 | |
| Derivatives at fair value, net | 4 | | 1 | |
| SAVEGREEN | 21,842 | | 21,281 | |
| Postemployment and other benefit costs | 180,360 | | 188,170 | |
| Deferred storm damage costs | 5,429 | | 6,515 | |
| Cost of removal | 82,353 | | 75,080 | |
| | |
| Other noncurrent regulatory assets | 17,952 | | 20,068 | |
| Total noncurrent regulatory assets | $ | 520,514 | | $ | 526,462 | |
| Regulatory liability-current | | |
| Overrecovered natural gas costs | $ | 541 | | $ | 25,914 | |
| | |
| | |
| Derivatives at fair value, net | 176 | | 274 | |
| Total current regulatory liabilities | $ | 717 | | $ | 26,188 | |
| Regulatory liabilities-noncurrent | | |
Tax Act impact (1) | $ | 192,895 | | $ | 195,425 | |
| Derivatives at fair value, net | 0 | | 352 | |
| | |
| Other noncurrent regulatory liabilities | 759 | | 509 | |
| Total noncurrent regulatory liabilities | $ | 193,654 | | $ | 196,286 | |
|
| | | | | | |
| (Thousands) | June 30,
2020 | September 30,
2019 |
| Regulatory assets-current | | |
| New Jersey Clean Energy Program | $ | 17,062 |
| $ | 15,468 |
|
| Under-recovered gas costs | — |
| 9,506 |
|
| Conservation Incentive Program | 20,836 |
| 3,371 |
|
| Derivatives at fair value, net | 9,845 |
| 4,526 |
|
| Other | 4,508 |
| — |
|
| Total current regulatory assets | $ | 52,251 |
| $ | 32,871 |
|
| Regulatory assets-noncurrent | | |
| Environmental remediation costs | | |
| Expended, net of recoveries | $ | 36,053 |
| $ | 38,351 |
|
| Liability for future expenditures | 128,886 |
| 131,080 |
|
| Deferred income taxes | 22,477 |
| 19,631 |
|
| Derivatives at fair value, net | — |
| 486 |
|
| SAVEGREEN | 15,229 |
| 10,201 |
|
| Postemployment and other benefit costs | 161,847 |
| 212,461 |
|
| Deferred storm damage costs | 7,058 |
| 8,687 |
|
| Cost of removal | 62,831 |
| 65,660 |
|
| Other noncurrent regulatory assets | 16,720 |
| 10,080 |
|
| Total noncurrent regulatory assets | $ | 451,101 |
| $ | 496,637 |
|
| Regulatory liabilities-current | | |
| Over-recovered gas costs | 6,774 |
| — |
|
| Total current regulatory liabilities | $ | 6,774 |
| $ | — |
|
| Regulatory liabilities-noncurrent | | |
Tax Act impact (1) | $ | 196,705 |
| $ | 200,417 |
|
| New Jersey Clean Energy Program | 128 |
| 197 |
|
| Other noncurrent regulatory liabilities | 448 |
| 1,821 |
|
| Total noncurrent regulatory liabilities | $ | 197,281 |
| $ | 202,435 |
|
| |
(1) | Reflects the re-measurement and subsequent amortization of NJNG's net deferred tax liabilities as a result of the change in federal tax rates enacted in the Tax Act.
|
| | | | | | | | |
| (Thousands) | March 31,
2021 | September 30,
2020 |
| Total current regulatory assets | $ | 116 | | $ | 158 | |
| Total noncurrent regulatory assets | $ | 1,514 | | $ | 997 | |
| | |
| Total-noncurrent regulatory liabilities | $ | 164 | | $ | 0 | |
The assets are comprised primarily of the tax benefit associated with the equity component of AFUDC and the liability consists primarily of scheduling penalties. Recovery of regulatory assets is subject to FERC approval.
Regulatory filings and/or actions that occurred during the current fiscal year include the following:
•On October 25, 2019,28, 2020, the BPU approved NJNG’s annual filing to increase its EE recovery rate, which resulted in an annual recoverythe Company’s transmission and distribution component of approximately $11.3the IIP for $150.0 million over five years, effective November 1, 2019.2020. The recovery of information technology replacement and enhancements, that was included in the original IIP filing, will be included as part of base rate filings as projects are placed in service.
•On November 13, 2019,20, 2020, NJNG notified the BPU issued an order adopting a stipulation of settlement approving a $62.2its intent to provide BGSS bill credits to residential and small commercial sales customers effective December 1, 2020 to December 31, 2020. On December 22, 2020, NJNG notified the BPU of the extension of the BGSS bill credits through January 31, 2021. The actual bill credits given to customers totaled $20.6 million, increase to base rates, effective on November 15, 2019. The increase includes an overall rate$19.3 million net of return on rate base of 6.95 percent, return on common equity of 9.6 percent, a common equity ratio of 54 percent and a depreciation rate of 2.78 percent.tax.
New Jersey Resources Corporation
Part I
NOTES TO UNAUDITED CONDENSED CONSOLIDATED FINANCIAL STATEMENTS (Continued)
•On March 16, 2020, a stipulation was signed in NJNG's annual SBC application which included an increase in the RAC rate of $1.2 million annually and a decrease to the NJCEP factor of $600,000. The stipulation is pending BPU approval.
On March 30, 2020, NJNG filed a petition with3, 2021, the BPU requesting a base rate increaseapproved the three-year SAVEGREEN program consisting of approximately $7.4 million for the recovery associated with NJ RISE and SAFE II capital investments cost of approximately $57.9 million made through June 30, 2020. On July 24, 2020, the Company updated this filing for actual information through June 30, 2020 and the revised rate increase requested is $7.1 million based on $55.1$126.1 million of actual capital investments. Changes to base rates are anticipateddirect investment, $109.4 million in financing options, and $23.4 million in operation and maintenance expenses, to be effective OctoberJuly 1, 2020.2021.
•On May 29, 2020, NJNG filed itsMarch 3, 2021, the BPU approved, on a final basis, NJNG’s annual petition with the BPU to decreasemodify its BGSS, ratebalancing charge and CIP rates for residential and small commercial customers. The rate changes will resultresulted in a $20.4 million decrease to the annual revenues credited to BGSS, a $3.9$3.8 million annual decrease related to its balancing charge, as well as changes to CIP rates, which will resultresulted in a $22.3$16.5 million annual recovery increase, anticipated to be effective October 1, 2020.
New Jersey Resources Corporation
Part I
NOTES TO UNAUDITED CONDENSED CONSOLIDATED FINANCIAL STATEMENTS (Continued)
•On March 30, 2021, NJNG filed a base rate case with the BPU requesting a natural gas revenue increase of $165.7 million including a rate recovery for SRL and other infrastructure investments. SRL is expected to be placed in service during fiscal 2021.
•On May 29, 2020,March 31, 2021, NJNG filed a petition with the BPU torequesting the final base rate increase its EE recovery rate, which will result in an annual decrease of approximately $70,000,$311,000 for the recovery associated with NJ RISE and SAFE II capital investments cost of approximately $3.4 million made through June 30, 2021. This filing will be updated for actual information through June 30, 2021. Changes to base rates are anticipated to be effective October 1, 2020.2021.
•On June 25, 2020, NJNG filed itsApril 7, 2021, the BPU approved a stipulation resolving NJNG’s annual USF compliance filing proposing a decreaseSBC application requesting to recover remediation expenses including an increase in the RAC, of approximately $1.3 million annually and an increase to the statewide USF rate, which will resultNJCEP factor, resulting in thean annual recovery decreasing byincrease of approximately $400,000, to be$6 million, effective OctoberApril 1, 2020.2021.
On July 2, 2020, the BPU issued an order which authorized New Jersey utilities to create a regulatory asset by deferring incremental COVID-19 related costs and required a related quarterly report be filed for the COVID-19-related costs and savings incurred.
Regulatory assets at Adelphia, not included in the table above, were immaterial as of June 30, 2020.
5. DERIVATIVE INSTRUMENTS
The Company is subject primarily to commodity price risk due to fluctuations in the market price of natural gas, SRECs and electricity. To manage this risk, the Company enters into a variety of derivative instruments including, but not limited to, futures contracts, physical forward contracts, financial options and swaps to economically hedge the commodity price risk associated with its existing and anticipated commitments to purchase and sell natural gas, SRECs and electricity. In addition, the Company is exposed to foreign currency and interest rate risk and may utilize foreign currency derivatives to hedge Canadian dollar denominated natural gas purchases and/or sales and interest rate derivatives to reduce exposure to fluctuations in interest rates. All of these types of contracts are accounted for as derivatives.derivatives, unless the Company elects NPNS, which is done on a contract-by-contract election. Accordingly, all of the financial and certain of the Company's physical derivative instruments are recorded at fair value on the Unaudited Condensed Consolidated Balance Sheets. For a more detailed discussion of the Company'sCompany’s fair value measurement policies and level disclosures associated with NJR'sthe Company’s derivative instruments, see Note 6. Fair Value.
Energy Services
Energy Services chooses not to designate its financial commodity and physical forward commodity derivatives as accounting hedges or to elect NPNS. The changes in the fair value of these derivatives are recorded as a component of natural gas purchases or operating revenues, as appropriate for Energy Services, on the Unaudited Condensed Consolidated Statements of Operations as unrealized gains or losses. For Energy Services at settlement, realized gains and losses on all financial derivative instruments are recognized as a component of natural gas purchases and realized gains and losses on all physical derivatives follow the presentation of the related unrealized gains and losses as a component of either natural gas purchases or operating revenues.
Energy Services also enters into natural gas transactions in Canada and, consequently, is exposed to fluctuations in the value of Canadian currency relative to the U.S. dollar. Energy Services may utilize foreign currency derivatives to lock in the exchange rates associated with natural gas transactions denominated in Canadian currency. The derivatives may include currency forwards, futures, or swaps and are accounted for as derivatives. These derivatives are typically used to hedge demand fee payments on pipeline capacity, storage and natural gas purchase agreements.
As a result of Energy Services entering into transactions to borrow natural gas, commonly referred to as “park and loans,” an embedded derivative is recognized relating to differences between the fair value of the amount borrowed and the fair value of the amount that will ultimately be repaid, based on changes in the forward price for natural gas prices at the borrowed location over the contract term. This embedded derivative is accounted for as a forward sale in the month in which the repayment of the borrowed natural gas is expected to occur, and is considered a derivative transaction that is recorded at fair value on the Unaudited Condensed Consolidated Balance Sheets, with changes in value recognized in current period earnings.
Expected production of SRECs is hedged through the use of forward and futures contracts. All contracts require the Company to physically deliver SRECs through the transfer of certificates as per contractual settlement schedules. Energy
New Jersey Resources Corporation
Part I
NOTES TO UNAUDITED CONDENSED CONSOLIDATED FINANCIAL STATEMENTS (Continued)
Services recognizes changes in the fair value of these derivatives as a component of operating revenues. Upon settlement of the contract, the related revenue is recognized when the SREC is transferred to the counterparty.
Natural Gas Distribution
Changes in fair value of NJNG's financial commodity derivatives are recorded as a component of regulatory assets or liabilities on the Unaudited Condensed Consolidated Balance Sheets. The Company elects NPNS accounting treatment on all physical commodity contracts that NJNG entered into on or before December 31, 2015, and accounts for these contracts on an accrual basis. Accordingly, physical natural gas purchases are recognized in regulatory assets or liabilities on the Unaudited Condensed Consolidated Balance Sheets when the contract settles and the natural gas is delivered. The average cost of natural gas is charged to expense in the current period earnings based on the BGSS factor times the therm sales. Effective for contracts executed on or after January 1, 2016, NJNG no longer elects NPNS accounting treatment on all physical forward commodity contracts.a portfolio basis. However, since NPNS is a contract-by-contract election, where it makes sense to do so, NJNG can and may elect to treat certain contracts to beas normal. Because NJNG
New Jersey Resources Corporation
Part I
NOTES TO UNAUDITED CONDENSED CONSOLIDATED FINANCIAL STATEMENTS (Continued)
recovers these amounts through future BGSS rates as increases or decreases to the cost of natural gas in NJNG’s tariff for natural gas service, the changes in fair value of these contracts are deferred as a component of regulatory assets or liabilities on the Unaudited Condensed Consolidated Balance Sheets.
In February 2020 and March 2020, NJNG entered into treasury lock transactions to fix the benchmark treasury rate associated with a forecasted$75 million debt issuance expected duringtranche that was issued in September 2020. Settlement of the fiscal year. The changetreasury locks resulted in fair value of NJNG's treasury lock agreement isa $6.6 million loss, which was recorded as a component of regulatory assets or liabilities on the Unaudited Condensed Consolidated Balance Sheets since NJNG believes that the market value upon settlement will be reflected in future rates. Upon settlement, any gain orSheets. The loss will beis being amortized ininto earnings over the lifeterm of the future debt issuance as a component of interest expense on the Unaudited Condensed Consolidated Statements of Operations.Operations, which totaled $54,000 and $114,000 during the three and six months ended March 31, 2021.
Clean Energy Ventures
The Company elects NPNS accounting treatment on PPA contracts thatexecuted by Clean Energy Ventures enters into that meet the definition of a derivative and accounts for the contract on an accrual basis. Accordingly, electricity sales are recognized in revenues throughout the term of the PPA as electricity is delivered. NPNS is a contract-by-contract election and where it makes sense to do so, the Company can and may elect to treat certain contracts to beas normal.
Home Services and Other
In January 2018,During fiscal 2020, NJR entered into treasury lock transactions to fix the benchmark treasury rate associated with a variable-for-fixed interest rate swap on$260 million debt issuance that was finalized in July 2020 and a $200 million debt issuance that was finalized in September 2020. NJR designated its existing $100 million variable rate term loan, which fixed the variable rate at 2.84 percent. The swap terminated on August 16, 2019, which coincided with the maturity of the debt. The changetreasury lock contracts as cash flow hedges, therefore, changes in the fair value of the interest rate swapeffective portion of the hedges were recorded in OCI. Settlement of the treasury locks in fiscal 2020 resulted in a loss of $13.7 million, which was recorded within OCI. The loss is being amortized into earnings over the term of the debt as a component of interest expense on the Unaudited Condensed Consolidated Statements of Operations.
In February 2020Operations, which totaled $263,000 and March 2020, NJR entered into treasury lock transactions, designated as cash flow hedges, to fix the benchmark treasury rate associated with a forecasted debt issuance expected$494,000, net of tax, during the fiscal year. The treasury lock transaction is recorded as a derivative asset or liability at fair value on the Unaudited Condensed Consolidated Balance Sheets. Upon settlement, any gain or loss will be amortized in earnings over the life of the future debt issuance as a component of interest expense on the Consolidated Statements of Operations.three and six months ended March 31, 2021.
Fair Value of Derivatives
The following table presents the fair value of NJR's derivative assets and liabilities recognized on the Unaudited Condensed Consolidated Balance Sheets as of:
| | | | | | | | | | | | | | | | | | | | | | | | | | | | | |
| | | Derivatives at Fair Value |
| | March 31, 2021 | | September 30, 2020 |
| (Thousands) | Balance Sheet Location | Assets | Liabilities | Assets | Liabilities |
| Derivatives not designated as hedging instruments: | | | | | | | | |
| Natural Gas Distribution: | | | | | | | | | |
| Physical commodity contracts | Derivatives - current | | $ | 177 | | | $ | 1 | | | $ | 78 | | | $ | 76 | |
| | | | | | | | | |
| Financial commodity contracts | Derivatives - current | | 589 | | | 88 | | | 71 | | | 282 | |
| | | | | | | | | |
| | | | | | | | | |
| | | | | | | | | |
| Energy Services: | | | | | | | | | |
| Physical commodity contracts | Derivatives - current | | 3,668 | | | 16,415 | | | 6,454 | | | 20,438 | |
| Derivatives - noncurrent | | 1,364 | | | 20,090 | | | 1,264 | | | 12,003 | |
| | | | | | | | | |
| | | | | | | | | |
| Financial commodity contracts | Derivatives - current | | 12,770 | | | 7,166 | | | 16,671 | | | 12,965 | |
| Derivatives - noncurrent | | 585 | | | 407 | | | 2,037 | | | 1,346 | |
| Foreign currency contracts | Derivatives - current | | 229 | | | 20 | | | 36 | | | 104 | |
| Derivatives - noncurrent | | 28 | | | 9 | | | 48 | | | 3 | |
| | | | | | | | |
| | | | | | | | | |
| | | | | | | | | |
| | | | | | | | | |
| Total fair value of derivatives | | | $ | 19,410 | | | $ | 44,196 | | | $ | 26,659 | | | $ | 47,217 | |
|
| | | | | | | | | | | | | | | | | |
| | | | Fair Value |
| | | June 30, 2020 | | September 30, 2019 |
| (Thousands) | Balance Sheet Location | Asset Derivatives | Liability Derivatives | Asset Derivatives | Liability Derivatives |
| Derivatives not designated as hedging instruments: | | | | | | | | |
| Natural Gas Distribution: | | | | | | | | | |
| Physical commodity contracts | Derivatives - current | | $ | 66 |
| | $ | 133 |
| | $ | 67 |
| | $ | 245 |
|
| Financial commodity contracts | Derivatives - current | | — |
| | 190 |
| | 382 |
| | 570 |
|
| Interest rate contracts | Derivatives - current | | — |
| | 5,056 |
| | — |
| | — |
|
| Energy Services: | | | | | | | | | |
| Physical commodity contracts | Derivatives - current | | 5,440 |
| | 17,242 |
| | 6,847 |
| | 27,540 |
|
| | Derivatives - noncurrent | | 2,671 |
| | 22,448 |
| | 1,710 |
| | 12,641 |
|
| Financial commodity contracts | Derivatives - current | | 23,852 |
| | 13,447 |
| | 17,806 |
| | 29,057 |
|
| | Derivatives - noncurrent | | 3,647 |
| | 1,129 |
| | 5,716 |
| | 6,105 |
|
| Foreign currency contracts | Derivatives - current | | 9 |
| | 230 |
| | 1 |
| | 211 |
|
| | Derivatives - noncurrent | | 29 |
| | 23 |
| | — |
| | 75 |
|
| Derivatives designated as hedging instruments: | | | | | | | | |
| Home Services and Other: | | | | | | | | | |
| Interest rate contracts | Derivatives - current | | — |
| | 10,796 |
| | — |
| | — |
|
| Total fair value of derivatives | | | $ | 35,714 |
| | $ | 70,694 |
| | $ | 32,529 |
| | $ | 76,444 |
|
New Jersey Resources Corporation
Part I
NOTES TO UNAUDITED CONDENSED CONSOLIDATED FINANCIAL STATEMENTS (Continued)
Offsetting of Derivatives
The Company transacts under master netting arrangements or equivalent agreements that allow it to offset derivative assets and liabilities with the same counterparty. However, the Company’s policy is to present its derivative assets and liabilities on a gross basis at the contract level unit of account on the Unaudited Condensed Consolidated Balance Sheets.
New Jersey Resources Corporation
Part I
NOTES TO UNAUDITED CONDENSED CONSOLIDATED FINANCIAL STATEMENTS (Continued)
The following table summarizes the reported gross amounts, the amounts that the Company has the right to offset but elects not to, financial collateral, as well as the net amounts the Company could present on the Unaudited Condensed Consolidated Balance Sheets but elects not to.
| | | | | | | | | | | | | | | | | | | | | | | | | | |
| (Thousands) | Amounts Presented on Balance Sheets (1) | Offsetting Derivative Instruments (2) | Financial Collateral Received/Pledged (3) | Net Amounts (4) |
| As of March 31, 2021: | | | | | | | | |
| Derivative assets: | | | | | | | | |
| Energy Services | | | | | | | | |
| Physical commodity contracts | | $ | 5,032 | | | $ | (1,757) | | | $ | (200) | | | $ | 3,075 | |
| Financial commodity contracts | | 13,355 | | | (7,573) | | | 0 | | 5,782 | |
| Foreign currency contracts | | 257 | | | (29) | | | 0 | | 228 | |
| Total Energy Services | | $ | 18,644 | | | $ | (9,359) | | | $ | (200) | | | $ | 9,085 | |
| Natural Gas Distribution | | | | | | | | |
| Physical commodity contracts | | $ | 177 | | | $ | (1) | | | $ | 0 | | | $ | 176 | |
| Financial commodity contracts | | 589 | | | (88) | | | 0 | | | 501 | |
| | | | | | | | |
| Total Natural Gas Distribution | | $ | 766 | | | $ | (89) | | | $ | 0 | | | $ | 677 | |
| | | | | | | | |
| | | | | | | | |
| | | | | | | | |
| Derivative liabilities: | | | | | | | | |
| Energy Services | | | | | | | | |
| Physical commodity contracts | | $ | 36,505 | | | $ | (1,757) | | | $ | 0 | | | $ | 34,748 | |
| | | | | | | | |
| Financial commodity contracts | | 7,573 | | | (7,573) | | | 0 | | | 0 | |
| Foreign currency contracts | | 29 | | | (29) | | | 0 | | | 0 | |
| Total Energy Services | | $ | 44,107 | | | $ | (9,359) | | | $ | 0 | | | $ | 34,748 | |
| Natural Gas Distribution | | | | | | | | |
| Physical commodity contracts | | $ | 1 | | | $ | (1) | | | 0 | | $ | 0 | |
| Financial commodity contracts | | 88 | | | (88) | | | 0 | | 0 | |
| | | | | | | | |
| Total Natural Gas Distribution | | $ | 89 | | | $ | (89) | | | $ | 0 | | | $ | 0 | |
| | | | | | | | |
| | | | | | | | |
| | | | | | | | |
| As of September 30, 2020: | | | | | | | | |
| Derivative assets: | | | | | | | | |
| Energy Services | | | | | | | | |
| Physical commodity contracts | | $ | 7,718 | | | $ | (3,587) | | | $ | (200) | | | $ | 3,931 | |
| Financial commodity contracts | | 18,708 | | | (14,311) | | | 0 | | | 4,397 | |
| Foreign currency contracts | | 84 | | | (84) | | | 0 | | | 0 | |
| Total Energy Services | | $ | 26,510 | | | $ | (17,982) | | | $ | (200) | | | $ | 8,328 | |
| Natural Gas Distribution | | | | | | | | |
| Physical commodity contracts | | $ | 78 | | | $ | (65) | | | $ | 0 | | | $ | 13 | |
| Financial commodity contracts | | 71 | | | (71) | | | 0 | | | 0 | |
| Total Natural Gas Distribution | | $ | 149 | | | $ | (136) | | | $ | 0 | | | $ | 13 | |
| | | | | | | | |
| | | | | | | | |
| | | | | | | | |
| Derivative liabilities: | | | | | | | | |
| Energy Services | | | | | | | | |
| Physical commodity contracts | | $ | 32,441 | | | $ | (3,587) | | | $ | 0 | | | $ | 28,854 | |
| Financial commodity contracts | | 14,311 | | | (14,311) | | | 0 | | | 0 | |
| Foreign currency contracts | | 107 | | | (84) | | | 0 | | | 23 | |
| Total Energy Services | | $ | 46,859 | | | $ | (17,982) | | | $ | 0 | | | $ | 28,877 | |
| Natural Gas Distribution | | | | | | | | |
| Physical commodity contracts | | $ | 76 | | | $ | (65) | | | $ | 0 | | | $ | 11 | |
| Financial commodity contracts | | 282 | | | (71) | | | 0 | | | 211 | |
| | | | | | | | |
| Total Natural Gas Distribution | | $ | 358 | | | $ | (136) | | | $ | 0 | | | $ | 222 | |
(1)Derivative assets and liabilities are presented on a gross basis on the balance sheet as the Company does not elect balance sheet offsetting under ASC 210-20.
(2)Includes transactions with NAESB netting election, transactions held by FCMs with net margining and transactions with ISDA netting.
(3)Financial collateral includes cash balances at FCMs as well as cash received from or pledged to other counterparties.
(4)Net amounts represent presentation of derivative assets and liabilities if the Company were to elect balance sheet offsetting under ASC 210-20.
|
| | | | | | | | | | | | | | | | |
| (Thousands) | Amounts Presented on Balance Sheets (1) | Offsetting Derivative Instruments (2) | Financial Collateral Received/Pledged (3) | Net Amounts (4) |
| As of June 30, 2020: | | | | | | | | |
| Derivative assets: | | | | | | | | |
| Energy Services | | | | | | | | |
| Physical commodity contracts | | $ | 8,111 |
| | $ | (3,097 | ) | | $ | (200 | ) | | $ | 4,814 |
|
| Financial commodity contracts | | 27,499 |
| | (14,576 | ) | | — |
| | 12,923 |
|
| Foreign currency contracts | | 38 |
| | (38 | ) | | — |
| | — |
|
| Total Energy Services | | $ | 35,648 |
| | $ | (17,711 | ) | | $ | (200 | ) | | $ | 17,737 |
|
| Natural Gas Distribution | | | | | | | | |
| Physical commodity contracts | | $ | 66 |
| | $ | (39 | ) | | $ | — |
| | $ | 27 |
|
| Total Natural Gas Distribution | | $ | 66 |
| | $ | (39 | ) | | $ | — |
| | $ | 27 |
|
| Derivative liabilities: | | | | | | | | |
| Energy Services | | | | | | | | |
| Physical commodity contracts | | $ | 39,690 |
| | $ | (3,097 | ) | | $ | — |
| | $ | 36,593 |
|
| Financial commodity contracts | | 14,576 |
| | (14,576 | ) | | — |
| | — |
|
| Foreign currency contracts | | 253 |
| | (38 | ) | | — |
| | 215 |
|
| Total Energy Services | | $ | 54,519 |
| | $ | (17,711 | ) | | $ | — |
| | $ | 36,808 |
|
| Natural Gas Distribution | | | | | | | | |
| Physical commodity contracts | | $ | 133 |
| | $ | (39 | ) | | $ | — |
| | $ | 94 |
|
| Financial commodity contracts | | 190 |
| | — |
| | (190 | ) | | — |
|
| Interest rate contracts | | 5,056 |
| | — |
| | — |
| | 5,056 |
|
| Total Natural Gas Distribution | | $ | 5,379 |
| | $ | (39 | ) | | $ | (190 | ) | | $ | 5,150 |
|
| Home Services and Other | | | | | | | | |
| Interest rate contracts | | $ | 10,796 |
| | $ | — |
| | $ | — |
| | $ | 10,796 |
|
| Total Home Services and Other | | $ | 10,796 |
| | $ | — |
| | $ | — |
| | $ | 10,796 |
|
| As of September 30, 2019: | | | | | | | | |
| Derivative assets: | | | | | | | | |
| Energy Services | | | | | | | | |
| Physical commodity contracts | | $ | 8,557 |
| | $ | (2,906 | ) | | $ | (200 | ) | | $ | 5,451 |
|
| Financial commodity contracts | | 23,522 |
| | (19,646 | ) | | — |
| | 3,876 |
|
| Foreign currency contracts | | 1 |
| | (1 | ) | | — |
| | — |
|
| Total Energy Services | | $ | 32,080 |
| | $ | (22,553 | ) | | $ | (200 | ) | | $ | 9,327 |
|
| Natural Gas Distribution | | | | | | | | |
| Physical commodity contracts | | $ | 67 |
| | $ | (9 | ) | | $ | — |
| | $ | 58 |
|
| Financial commodity contracts | | 382 |
| | (382 | ) | | — |
| | — |
|
| Total Natural Gas Distribution | | $ | 449 |
| | $ | (391 | ) | | $ | — |
| | $ | 58 |
|
| Derivative liabilities: | | | | | | | | |
| Energy Services | | | | | | | | |
| Physical commodity contracts | | $ | 40,181 |
| | $ | (2,906 | ) | | $ | — |
| | $ | 37,275 |
|
| Financial commodity contracts | | 35,162 |
| | (19,646 | ) | | (15,516 | ) | | — |
|
| Foreign currency contracts | | 286 |
| | (1 | ) | | — |
| | 285 |
|
| Total Energy Services | | $ | 75,629 |
| | $ | (22,553 | ) | | $ | (15,516 | ) | | $ | 37,560 |
|
| Natural Gas Distribution | | | | | | | | |
| Physical commodity contracts | | $ | 245 |
| | $ | (9 | ) | | $ | — |
| | $ | 236 |
|
| Financial commodity contracts | | 570 |
| | (382 | ) | | (188 | ) | | — |
|
| Total Natural Gas Distribution | | $ | 815 |
| | $ | (391 | ) | | $ | (188 | ) | | $ | 236 |
|
| |
(1)
| Derivative assets and liabilities are presented on a gross basis on the balance sheet as the Company does not elect balance sheet offsetting under ASC 210-20. |
| |
(2)
| Includes transactions with NAESB netting election, transactions held by FCMs with net margining and transactions with ISDA netting. |
| |
(3)
| Financial collateral includes cash balances at FCMs as well as cash received from or pledged to other counterparties. |
| |
(4)
| Net amounts represent presentation of derivative assets and liabilities if the Company were to elect balance sheet offsetting under ASC 210-20. |
New Jersey Resources Corporation
Part I
NOTES TO UNAUDITED CONDENSED CONSOLIDATED FINANCIAL STATEMENTS (Continued)
Energy Services utilizes financial derivatives to economically hedge the gross margin associated with the purchase of physical natural gas to be used for storage injection and its subsequent sale at a later date. The gains or (losses) on the financial transactions that are economic hedges of the cost of the purchased natural gas are recognized prior to the gains or (losses) on the physical transaction, which are recognized in earnings when the natural gas is delivered. Therefore, mismatches between the timing of the recognition of realized gains or (losses) on the financial derivative instruments and gains or (losses) associated with the actual sale of the natural gas that is being economically hedged along with fair value changes in derivative instruments, creates volatility in the results of Energy Services, although the Company's intended economic results relating to the entire transaction are unaffected.
The following table presents the effect of derivative instruments recognized on the Unaudited Condensed Consolidated Statements of Operations for the periods set forth below:
| | | | | | | | | | | | | | | | | | | | | | | |
| (Thousands) | Location of gain (loss) recognized in income on derivatives | Amount of gain (loss) recognized
in income on derivatives |
| | Three Months Ended | Six Months Ended |
| | March 31, | March 31, |
| Derivatives not designated as hedging instruments: | 2021 | | 2020 | 2021 | | 2020 |
| Energy Services: | | | | | | | |
| Physical commodity contracts | Operating revenues | $ | 36,419 | | | $ | 12,096 | | $ | 41,671 | | | $ | 21,932 | |
| Physical commodity contracts | Natural gas purchases | 2,650 | | | (1,892) | | (2,404) | | | (3,302) | |
| Financial commodity contracts | Natural gas purchases | (27,315) | | | 23,319 | | 20,440 | | | 69,412 | |
| Foreign currency contracts | Natural gas purchases | 27 | | | (475) | | 227 | | | (360) | |
| | | | | | | |
| | | | | | | |
| Total unrealized and realized gains | $ | 11,781 | | | $ | 33,048 | | $ | 59,934 | | | $ | 87,682 | |
|
| | | | | | | | | | | | | | | |
| (Thousands) | Location of gain (loss) recognized in income on derivatives | Amount of gain (loss) recognized in income on derivatives |
| | | Three Months Ended | Nine Months Ended |
| | | June 30, | June 30, |
| Derivatives not designated as hedging instruments: | 2020 | | 2019 | 2020 | | 2019 |
| Energy Services: | | | | | | | |
| Physical commodity contracts | Operating revenues | $ | (18,061 | ) | | $ | 1,435 |
| $ | 3,871 |
| | $ | 74 |
|
| Physical commodity contracts | Gas purchases | 1,014 |
| | 2,392 |
| (2,288 | ) | | 266 |
|
| Financial commodity contracts | Gas purchases | 2,408 |
| | 22,919 |
| 71,820 |
| | 17,732 |
|
| Foreign currency contracts | Gas purchases | 181 |
| | 37 |
| (179 | ) | | (188 | ) |
| Home Services and Other: | | | | | | | |
| Interest rate contracts | Interest expense | — |
| | (43 | ) |
| | (228 | ) |
| Total unrealized and realized gains (losses) | $ | (14,458 | ) | | $ | 26,740 |
| $ | 73,224 |
| | $ | 17,656 |
|
NJNG’s derivative contracts are part of the Company's risk management activities that relate to its natural gas purchases and BGSS incentive programs. At settlement, the resulting gains and/or losses are payable to or recoverable from utility customers and are deferred in regulatory assets or liabilities resulting in no impact to earnings. The following table reflects the (losses) gains associated with NJNG's derivative instruments for the periods set forth below:
| | | | | | | | | | | | | | | | | | | | |
| Three Months Ended | Six Months Ended |
| March 31, | March 31, |
| (Thousands) | 2021 | | 2020 | 2021 | | 2020 |
| Natural Gas Distribution: | | | | | | |
| Physical commodity contracts | $ | 1,091 | | | $ | 209 | | $ | 1,433 | | | $ | 1,049 | |
| Financial commodity contracts | 645 | | | (11,434) | | (3,627) | | | (12,522) | |
| Interest rate contracts | 0 | | | (6,692) | | 0 | | | (6,692) | |
| Total unrealized and realized losses | $ | 1,736 | | | $ | (17,917) | | $ | (2,194) | | | $ | (18,165) | |
|
| | | | | | | | | | | | | | |
| | Three Months Ended | Nine Months Ended |
| | June 30, | June 30, |
| (Thousands) | 2020 | | 2019 | 2020 | | 2019 |
| Natural Gas Distribution: | | | | | | |
| Physical commodity contracts | $ | 308 |
| | $ | 812 |
| $ | 1,357 |
| | $ | 5,225 |
|
| Financial commodity contracts | 1,029 |
| | (10,368 | ) | (11,493 | ) | | (7,129 | ) |
| Interest rate contracts | 1,636 |
| | — |
| (5,056 | ) | | — |
|
| Total unrealized and realized (losses) gains | $ | 2,973 |
| | $ | (9,556 | ) | $ | (15,192 | ) | | $ | (1,904 | ) |
NJR designates its treasury lock contracts as cash flow hedges, therefore, changes in fair value of the effective portion of the hedges are recorded in OCI and upon settlement of the contracts, realized gains and (losses) are reclassified from OCI to interest expense on the Unaudited Condensed Consolidated Statements of Operations.
The following table reflects the effect of derivative instruments designated as cash flow hedges in OCI for the periods set forth below:OCI:
| | | | | | | | | | | | | | | | | | | |
| (Thousands) | Amount of Pre-tax Gain (Loss) Recognized in OCI on Derivatives | Location of Gain (Loss) Reclassified from OCI into Income | Amount of Pre-tax Gain (Loss) Reclassified from OCI into Income | |
| Three Months Ended | | Three Months Ended | | |
| March 31, | | March 31, | | |
| Derivatives in cash flow hedging relationships: | 2021 | 2020 | | 2021 | 2020 | | |
| Interest rate contracts | $ | 0 | | $ | (12,492) | | Interest expense | $ | (342) | | $ | 0 | | | |
| Six Months Ended | | Six Months Ended | | |
| March 31, | | March 31, | | |
| Derivatives in cash flow hedging relationships: | 2021 | 2020 | | 2021 | 2020 | | |
| Interest rate contracts | $ | 0 | | $ | (12,492) | | Interest expense | $ | (685) | | $ | 0 | | | |
|
| | | | | | | | | | | | |
| (Thousands) | Amount of Gain or (Loss) Recognized in OCI on Derivatives (Effective Portion) | Amount of Gain or (Loss) Reclassified from OCI into Income (Effective Portion) |
| | Three Months Ended | Three Months Ended |
| | June 30, | June 30, |
| Derivatives in cash flow hedging relationships: | 2020 | 2019 | 2020 | 2019 |
| Interest rate contracts | $ | (807 | ) | $ | — |
| $ | — |
| $ | — |
|
| | Nine Months Ended | Nine Months Ended |
| | June 30, | June 30, |
| Derivatives in cash flow hedging relationships: | 2020 | 2019 | 2020 | 2019 |
| Interest rate contracts | $ | (13,299 | ) | $ | — |
| $ | — |
| $ | — |
|
26
New Jersey Resources Corporation
Part I
NOTES TO UNAUDITED CONDENSED CONSOLIDATED FINANCIAL STATEMENTS (Continued)
NJNG and Energy Services had the following outstanding long (short) derivatives as of:
| | | | | | | | | | | | | | | | | | | |
| | | | | Volume (Bcf) |
| | Transaction Type | | | March 31,
2021 | | September 30,
2020 |
| Natural Gas Distribution | | Futures | | | 22.1 | | | 23.7 | |
| | | | | | | |
| | | | | | | |
| | Physical Commodity | | | 16.6 | | | 6.0 | |
| | | | | | | |
| Energy Services | | Futures | | | (11.6) | | | (27.5) | |
| | Swaps | | | (0.8) | | | (1.8) | |
| | | | | | | |
| | Physical Commodity | | | 1.5 | | | 5.0 | |
| | | | | | | |
| | | | | | | |
| | | | | | | |
|
| | | | | | | |
| | | | Volume (Bcf) |
| | | | June 30,
2020 | | September 30,
2019 |
| Natural Gas Distribution | Futures | | 18.8 |
| | 27.6 |
|
| | Physical | | 10.3 |
| | 11.6 |
|
| Energy Services | Futures | | (38.4 | ) | | (29.6 | ) |
| | Physical | | 12.6 |
| | 44.5 |
|
| | Swaps | | (2.3 | ) | | (5.0 | ) |
Not included in the previousabove table are Energy Services' net notional amount of foreign currency transactions of approximately $6.4$42,000 as of March 31, 2021 and $5.1 million notional amounts related to treasury lock transactionsas of approximately $60 millionSeptember 30, 2020 and $195 million at NJNG1,588,000 and NJR respectively, and 1,276,000960,000 SRECs at Energy Services that were open as of JuneMarch 31, 2021 and September 30, 2020.2020, respectively.
Broker Margin
Futures exchanges have contract specific margin requirements that require the posting of cash or cash equivalents relating to traded contracts. Margin requirements consist of initial margin that is posted upon the initiation of a position, maintenance margin that is usually expressed as a percent of initial margin, and variation margin that fluctuates based on the daily marked-to-market relative to maintenance margin requirements. The Company maintains separate broker margin accounts for the Natural Gas Distribution and Energy Services segments. The balances are as follows:
| | | | | | | | | | | |
| (Thousands) | Balance Sheet Location | March 31,
2021 | September 30,
2020 |
| Natural Gas Distribution | Restricted broker margin accounts | $ | 4,190 | | $ | 13,525 | |
| | | |
| Energy Services | Restricted broker margin accounts | $ | 41,726 | | $ | 55,919 | |
| | | |
|
| | | | | | | |
| (Thousands) | Balance Sheet Location | June 30,
2020 | September 30,
2019 |
| Natural Gas Distribution | Restricted broker margin accounts | $ | — |
| $ | 1,982 |
|
| | Accounts payable and other | $ | (219 | ) | $ | — |
|
| Energy Services | Restricted broker margin accounts | $ | 52,211 |
| $ | 71,741 |
|
Wholesale Credit Risk
NJNG, Energy Services, Clean Energy Ventures and Midstreamthe Storage and Transportation segment are exposed to credit risk as a result of their sales/wholesale marketing activities. As a result of services performed or sold, the inherent volatility in the prices of natural gas commodities, derivatives, SRECs, electricity and RECs, the market value of contractual positions with individual counterparties could exceed established credit limits or collateral provided by those counterparties. If a counterparty fails to perform the obligations under its contract (e.g., failed to deliver or pay for natural gas, SRECs, electricity, RECs or Midstream services), then the Company could sustain a loss.
NJRThe Company monitors and manages the credit risk of its wholesale operations through credit policies and procedures that management believes reduce overall credit risk. These policies include a review and evaluation of current and prospective counterparties' financial statements and/or credit ratings, daily monitoring of counterparties' credit limits and exposure, daily communication with commercial teamstraders regarding credit status and the use of credit mitigation measures, such as collateral requirements and netting agreements. Examples of collateral include letters of credit and cash received for either prepayment or margin deposit. Collateral may be requested due to NJR'sthe Company's election not to extend credit or because exposure exceeds defined thresholds. Most of NJR'sthe Company's wholesale marketing contracts contain standard netting provisions. These contracts include those governed by ISDA and the NAESB. The netting provisions refer to payment netting, whereby receivables and payables with the same counterparty are offset and the resulting net amount is paid to the party to which it is due.
Internally-rated exposure applies to counterparties that are not rated by S&PFitch or Moody's. In these cases, the counterparty's or guarantor's financial statements are reviewed, and similar methodologies and ratios used by S&PFitch and/or Moody's are applied to arrive at a substitute rating. Gross credit exposure is defined as the unrealized fair value of physical and financial derivative commodity contracts, plus any outstanding wholesale receivable for the value of natural gas delivered and/or financial derivative commodity contract that has settled for which payment has not yet been received.
New Jersey Resources Corporation
Part I
NOTES TO UNAUDITED CONDENSED CONSOLIDATED FINANCIAL STATEMENTS (Continued)
The following is a summary of gross credit exposures grouped by investment and noninvestment grade counterparties, as of June 30, 2020.March 31, 2021. The amounts presented below have not been reduced by any collateral received or netting and exclude accounts receivable for NJNG retail natural gas sales and services and Clean Energy Ventures residential solar installations.
| | | | | | | | | | | |
| (Thousands) | Gross Credit Exposure |
| Investment grade | | $ | 128,585 | | |
| Noninvestment grade | | 9,471 | | |
| Internally rated investment grade | | 23,661 | | |
| Internally rated noninvestment grade | | 20,118 | | |
| Total | | $ | 181,835 | | |
|
| | | | | |
| (Thousands) | Gross Credit Exposure |
| Investment grade | | $ | 126,026 |
| |
| Noninvestment grade | | 8,915 |
| |
| Internally rated investment grade | | 22,877 |
| |
| Internally rated noninvestment grade | | 12,319 |
| |
| Total | | $ | 170,137 |
| |
Conversely, certain of NJR's, NJNG's and Energy Services' derivative instruments are linked to agreements containing provisions that would require cash collateral payments from the Company if certain events occur. These provisions vary based upon the terms in individual counterparty agreements and can result in cash payments if NJNG's credit rating were to fall below its current level. Specifically, most, but not all, of these additional payments will be triggered if NJNG's debt is downgraded by the major credit agencies, regardless of investment grade status. In addition, some of these agreements include threshold amounts that would result in additional collateral payments if the values of derivative liabilities were to exceed the maximum values provided for in relevant counterparty agreements. Other provisions include payment features that are not specifically linked to ratings, but are based on certain financial metrics.
Collateral amounts associated with any of these conditions are determined based on a sliding scale and are contingent upon the degree to which the Company's credit rating and/or financial metrics deteriorate, and the extent to which liability amounts exceed applicable threshold limits. The aggregate fair value of allThere were no derivative instruments with credit-risk-related contingent features that were in a liability position on June 30, 2020, was $15.9 million, for which the Company had not posted collateral. If all thresholds related to the credit-risk-related contingent features underlying these agreements had been invoked on June 30, 2020, the Company would have beencollateral is required to post an additional $15.9 million to its counterparties.as of March 31, 2021. These amounts differ from the respective net derivative liabilities reflected on the Unaudited Condensed Consolidated Balance Sheets because the agreements also include clauses, commonly known as “Rights of Offset,” that would permit the Company to offset its derivative assets against its derivative liabilities for determining additional collateral to be posted, as previously discussed.
6. FAIR VALUE
Fair Value of Assets and Liabilities
The fair value of cash and cash equivalents, accounts receivable, current loan receivables, accounts payable, commercial paper and borrowings under revolving credit facilities are estimated to equal their carrying amounts due to the short maturity of those instruments. Non-current loan receivables are recorded atbased on what the Company expects to receive, which approximates fair value, in other noncurrent assets on the Unaudited Condensed Consolidated Balance Sheets. The Company regularly evaluates the credit quality and collection profile of its customers to approximate fair value.
The estimated fair value of long-term debt, including current maturities, excluding capitalfinance leases, debt issuance costs and solar asset financing obligations, is as follows:
| | | (Thousands) | June 30,
2020 | September 30,
2019 | (Thousands) | March 31,
2021 | September 30,
2020 |
Carrying value (1) (2) (3) (4) | $ | 1,492,845 |
| $ | 1,442,845 |
| |
Carrying value (1) (2) (3) | | Carrying value (1) (2) (3) | $ | 2,102,845 | | $ | 2,102,845 | |
| Fair market value | $ | 1,719,734 |
| $ | 1,568,864 |
| Fair market value | $ | 2,259,855 | | $ | 2,417,748 | |
| |
(1) | Excludes finance leases of $77.6 million and $35.4 million as of June(1)Excludes finance leases of $68.2 million and $74.2 million as of March 31, 2021 and September 30, 2020, and September 30, 2019, respectively. |
| |
(2) | Excludes solar asset financing obligations of $130.8 million and $91.4 millionas of June 30, 2020 and September 30, 2019, respectively.
|
| |
(3) | Excludes NJNG's debt issuance costs of $9.2 million and $9 million as of June 30, 2020 and September 30, 2019, respectively.
|
| |
(4) | Excludes NJR's debt issuance costs of $1.5 million and $2 million as of June 30, 2020 and September 30, 2019, respectively.
|
(2)Excludes NJNG's debt issuance costs of $9.4 million and $9.2 million as of March 31, 2021 and September 30, 2020, respectively.
(3)Excludes NJR's debt issuance costs of $3.3 million and $3.4 million as of March 31, 2021 and September 30, 2020, respectively.
Clean Energy Ventures enters into transactions to sell certain commercial solar assets and lease the assets back for a term specified in the lease. These transactions are considered financing obligations for accounting purposes and are recorded within long-term debt on the Unaudited Condensed Consolidated Balance Sheets. The estimated fair value of solar asset financing obligations as of JuneMarch 31, 2021 and September 30, 2020 and September 30, 2019 was $148.3$155.6 million and $98.6$149.2 million, respectively.
New Jersey Resources Corporation
Part I
NOTES TO UNAUDITED CONDENSED CONSOLIDATED FINANCIAL STATEMENTS (Continued)
The Company utilizes a discounted cash flow method to determine the fair value of its debt. Inputs include observable municipal and corporate yields, as appropriate for the maturity of the specific issue and the Company's credit rating. As of June 30, 2020,March 31, 2021, NJR discloses its debt within Level 2 of the fair value hierarchy.
New Jersey Resources Corporation
Part I
NOTES TO UNAUDITED CONDENSED CONSOLIDATED FINANCIAL STATEMENTS (Continued)
Fair Value Hierarchy
NJR applies fair value measurement guidance to its financial assets and liabilities, as appropriate, which include financial derivatives and physical commodity contracts qualifying as derivatives, investments in equity securities and other financial assets and liabilities. In addition, authoritative accounting literature prescribes the use of a fair value hierarchy that prioritizes the inputs to valuation techniques used to measure fair value based on the source of the data used to develop the price inputs. The hierarchy gives the highest priority to unadjusted quoted prices in active markets for identical assets or liabilities and the lowest priority to inputs that are based on unobservable market data and include the following:
| |
Level 1 | Level 1Unadjusted quoted prices for identical assets or liabilities in active markets. NJR's Level 1 assets and liabilities include exchange traded natural gas futures and options contracts, listed equities and money market funds. Exchange traded futures and options contracts include all energy contracts traded on the NYMEX, CME and ICE that NJR refers to internally as basis swaps, fixed swaps, futures and financial options that are cleared through a FCM.
Level 2Other significant observable inputs such as interest rates or price data, including both commodity and basis pricing that is observed either directly or indirectly from publications or pricing services. NJR's Level 2 assets and liabilities include over-the-counter physical forward commodity contracts and swap contracts, SREC forward sales or derivatives that are initially valued using observable quotes and are subsequently adjusted to include time value, credit risk or estimated transport pricing components for which no basis price is available. Level 2 financial derivatives consist of transactions with non-FCM counterparties (basis swaps, fixed swaps and/or options). NJNG's treasury lock is also considered Level 2 as valuation is based on quoted market interest and swap rates as inputs to the valuation model. Inputs are verifiable and do not require significant management judgment. For some physical commodity contracts the Company utilizes transportation tariff rates that are publicly available and that it considers to be observable inputs that are equivalent to market data received from an independent source. There are no significant judgments or adjustments applied to the transportation tariff inputs and no market perspective is required. Even if the transportation tariff input were considered to be a “model,” it would still be considered to be a Level 2 input as the data is:
•Exchange traded futures and options contracts include all energy contracts traded on the NYMEX, CME and ICE that NJR refers to internally as basis swaps, fixed swaps, futures and financial options that are cleared through a FCM. |
| |
Level 2 | Other significant observable inputs such as interest rates or price data, including both commodity and basis pricing that is observed either directly or indirectly from publications or pricing services. NJR's Level 2 assets and liabilities include over-the-counter physical forward commodity contracts and swap contracts, SREC forward sales or derivatives that are initially valued using observable quotes and are subsequently adjusted to include time value, credit risk or estimated transport pricing components for which no basis price is available. Level 2 financial derivatives consist of transactions with non-FCM counterparties (basis swaps, fixed swaps and/or options). NJNG's treasury lock is also considered Level 2 as valuation is based on quoted market interest and swap rates as inputs to the valuation model. Inputs are verifiable and do not require significant management judgment. For some physical commodity contracts the Company utilizes transportation tariff rates that are publicly available and that it considers to be observable inputs that are equivalent to market data received from an independent source. There are no significant judgments or adjustments applied to the transportation tariff inputs and no market perspective is required. Even if the transportation tariff input were considered to be a “model,” it would still be considered to be a Level 2 input as the data is:
|
widely accepted and public;
•non-proprietary and sourced from an independent third party; and
•observable and published.
These additional adjustments are generally not considered to be significant to the ultimate recognized values.
| |
Level 3 | Inputs derived from a significant amount of unobservable market data. These include NJR's best estimate of fair value and are derived primarily through the use of internal valuation methodologies. |
Level 3Inputs derived from a significant amount of unobservable market data. These include NJR's best estimate of fair value and are derived primarily through the use of internal valuation methodologies.
New Jersey Resources Corporation
Part I
NOTES TO UNAUDITED CONDENSED CONSOLIDATED FINANCIAL STATEMENTS (Continued)
Assets and liabilities measured at fair value on a recurring basis are summarized as follows:
| | | | Quoted Prices in Active Markets for Identical Assets | Significant Other Observable Inputs | Significant Unobservable Inputs | | | Quoted Prices in Active Markets for Identical Assets | Significant Other Observable Inputs | Significant Unobservable Inputs | |
| (Thousands) | (Level 1) | (Level 2) | (Level 3) | Total | (Thousands) | (Level 1) | (Level 2) | (Level 3) | Total |
| As of June 30, 2020: | | | | | | | | | |
| As of March 31, 2021: | | As of March 31, 2021: | |
| Assets: | | | | | | | | | Assets: | |
| Physical commodity contracts | | $ | — |
| | $ | 8,177 |
| | $ | — |
| | $ | 8,177 |
| Physical commodity contracts | | $ | 0 | | | $ | 5,209 | | | $ | 0 | | | $ | 5,209 | |
| Financial commodity contracts | | 25,349 |
| | 2,150 |
| | — |
| | 27,499 |
| Financial commodity contracts | | 13,751 | | | 193 | | | 0 | | | 13,944 | |
| Financial commodity contracts - foreign exchange | | — |
| | 38 |
| | — |
| | 38 |
| Financial commodity contracts - foreign exchange | | 0 | | | 257 | | | 0 | | | 257 | |
| | Money market funds | | 36,172 |
| | — |
| | — |
| | 36,172 |
| Money market funds | | 50,368 | | | 0 | | | 0 | | | 50,368 | |
Other (1) | | 1,814 |
| | — |
| | — |
| | 1,814 |
| |
| Other | | Other | | 1,818 | | | 0 | | | 0 | | | 1,818 | |
| Total assets at fair value | | $ | 63,335 |
| | $ | 10,365 |
| | $ | — |
| | $ | 73,700 |
| Total assets at fair value | | $ | 65,937 | | | $ | 5,659 | | | $ | 0 | | | $ | 71,596 | |
| Liabilities: | | | | | | | | | Liabilities: | |
| Physical commodity contracts | | $ | — |
| | $ | 39,823 |
| | $ | — |
| | $ | 39,823 |
| Physical commodity contracts | | $ | 0 | | | $ | 36,506 | | | $ | 0 | | | $ | 36,506 | |
| Financial commodity contracts | | 14,766 |
| | — |
| | — |
| | 14,766 |
| Financial commodity contracts | | 7,661 | | | 0 | | | 0 | | | 7,661 | |
| Financial commodity contracts - foreign exchange | | — |
| | 253 |
| | — |
| | 253 |
| Financial commodity contracts - foreign exchange | | 0 | | | 29 | | | 0 | | | 29 | |
| Interest rate contracts | | — |
| | 15,852 |
| | — |
| | 15,852 |
| |
| | Total liabilities at fair value | | $ | 14,766 |
| | $ | 55,928 |
| | $ | — |
| | $ | 70,694 |
| Total liabilities at fair value | | $ | 7,661 | | | $ | 36,535 | | | $ | 0 | | | $ | 44,196 | |
| As of September 30, 2019: | | | | | | | | | |
| As of September 30, 2020: | | As of September 30, 2020: | |
| Assets: | | | | | | | | | Assets: | |
| Physical commodity contracts | | $ | — |
| | $ | 8,624 |
| | $ | — |
| | $ | 8,624 |
| Physical commodity contracts | | $ | 0 | | | $ | 7,796 | | | $ | 0 | | | $ | 7,796 | |
| Financial commodity contracts | | 20,028 |
| | 3,876 |
| | — |
| | 23,904 |
| Financial commodity contracts | | 18,279 | | | 500 | | | 0 | | | 18,779 | |
| Financial commodity contracts - foreign exchange | | — |
| | 1 |
| | — |
| | 1 |
| Financial commodity contracts - foreign exchange | | 0 | | | 84 | | | 0 | | | 84 | |
Other (1) | | 1,706 |
| | — |
| | — |
| | 1,706 |
| |
| | Money market funds | | Money market funds | | 112,291 | | | 0 | | | 0 | | | 112,291 | |
| Other | | Other | | 1,840 | | | 0 | | | 0 | | | 1,840 | |
| Total assets at fair value | | $ | 21,734 |
| | $ | 12,501 |
| | $ | — |
| | $ | 34,235 |
| Total assets at fair value | | $ | 132,410 | | | $ | 8,380 | | | $ | 0 | | | $ | 140,790 | |
| Liabilities: | | | | | | | | | Liabilities: | |
| Physical commodity contracts | | $ | — |
| | $ | 40,426 |
| | $ | — |
| | $ | 40,426 |
| Physical commodity contracts | | $ | 0 | | | $ | 32,517 | | | $ | 0 | | | $ | 32,517 | |
| Financial commodity contracts | | 35,732 |
| | — |
| | — |
| | 35,732 |
| Financial commodity contracts | | 14,593 | | | 0 | | | 0 | | | 14,593 | |
| Financial commodity contracts - foreign exchange | | — |
| | 286 |
| | — |
| | 286 |
| Financial commodity contracts - foreign exchange | | 0 | | | 107 | | | 0 | | | 107 | |
| Total liabilities at fair value | | $ | 35,732 |
| | $ | 40,712 |
| | $ | — |
| | $ | 76,444 |
| Total liabilities at fair value | | $ | 14,593 | | | $ | 32,624 | | | $ | 0 | | | $ | 47,217 | |
7. INVESTMENTS IN EQUITY INVESTEES
NJR's investments in equity method investees include the following as of:
|
| | | | | | |
| (Thousands) | June 30,
2020 | September 30,
2019 |
| Steckman Ridge | $ | 112,909 |
| $ | 114,428 |
|
PennEast (1) | 92,891 |
| 85,840 |
|
| Total | $ | 205,800 |
| $ | 200,268 |
|
| |
(1) | Includes a deferred tax component related to AFUDC equity of $4.6 million and $4.1 million for June 30, 2020 and September 30, 2019, respectively.
|
| | | | | | | | |
| (Thousands) | March 31,
2021 | September 30,
2020 |
Steckman Ridge (1) | $ | 111,435 | | $ | 112,378 | |
PennEast (2) | 103,086 | | 95,997 | |
| Total | $ | 214,521 | | $ | 208,375 | |
The Company, through its subsidiary NJR Pipeline Company holds a 50 percent ownership interest in Steckman Ridge, a storage facility that operates under market-based rates. NJR's investment in Steckman Ridge includes(1)Includes loans with a total outstanding principal balance of $70.4 million for both JuneMarch 31, 2021 and September 30, 2020, and September 30, 2019. The loans which accrue interest at a variable rate that resets quarterly and are due October 1, 2023.
NJNG
Steckman Ridge
The Company holds a 50 percent equity method investment in Steckman Ridge, a jointly owned and Energy Services have entered intocontrolled natural gas storage facility located in Bedford County, Pennsylvania. Due to the expiration of a customer contract in October 2020, the Company evaluated its investment in Steckman Ridge for other-than-temporary impairment and park and loan agreements with Steckman Ridge. In addition, NJNG and Energy Services are each party to a precedent capacity agreement with PennEast. See determined an impairment charge was not necessary.
Note 16. Related Party Transactions for more information on these intercompany transactions.
New Jersey Resources Corporation
Part I
NOTES TO UNAUDITED CONDENSED CONSOLIDATED FINANCIAL STATEMENTS (Continued)
The fair value of the Company’s investment in Steckman Ridge was determined using a discounted cash flow method and utilized management’s best estimates and assumptions related to expected future results, including the price and capacity of firm natural gas storage contracting, operations and maintenance costs, the nature and timing of major maintenance and capital investment, and discount rates. Fair value determinations require considerable judgment and are sensitive to changes in underlying assumptions and other factors. As a result, it is reasonably possible that unfavorable developments, such as the failure to execute storage contracts and other services for available capacity at anticipated price levels could result in an other-than temporary impairment charge in the Unaudited Condensed Consolidated Financial Statements.
PennEast
The Company, through its subsidiary NJR Pipeline Company, is a 20 percent investor in PennEast, a partnership whose purpose is to construct and operate a 120-mile natural gas pipeline that will extend from northeast Pennsylvania to western New Jersey. PennEast received a Certificate of Public Convenience and Necessity for the project from FERC on January 19, 2018.
New Jersey Resources Corporation
Part I
NOTES TO UNAUDITED CONDENSED CONSOLIDATED FINANCIAL STATEMENTS (Continued)
On September 10, 2019, the United States Court of Appeals for the Third Circuit issued an order overturning the United States District Court for the District of New Jersey’s order granting PennEast condemnation and immediate access in accordance with the Natural Gas Act to certain properties in which the State of New Jersey holds an interest. A Petition for Rehearing was denied by the Third Circuit on November 5, 2019.
On October 8, 2019, the NJDEP issued a letter indicating that it deemed PennEast’s freshwater wetlands permit application to be administratively incomplete and closed the matter without prejudice. On October 11, 2019, PennEast submitted a letter to the NJDEP objecting to its position that the application is administratively incomplete. PennEast's objections were rejected by the NJDEP on November 18, 2019.
On October 4, 2019, PennEast filed a petition for Declaratory Order with FERC requesting an interpretation of the eminent domain authority of a FERC certificate holder under the Natural Gas Act. The Declaratory Order was granted on January 30, 2020.
On January 30, 2020, PennEast filed an amendment with FERC to construct the PennEast pipeline in 2 phases. Phase one consists of construction of a 68-mile pipeline in Pennsylvania from the eastern Marcellus Shale region in Luzerne County that would terminate in Northampton County. Phase two includes construction of the remaining original certificated route in Pennsylvania and New Jersey. Construction is expected to begin following approval by FERC of the phased approach and receipt of any remaining governmental and regulatory permits.
On February 18, 2020, PennEast filed a writ of certiorari with the Supreme Court of the United States to review the September 10, 2019 Third Circuit decision.
On June 29, 2020, the Supreme Court requested that the Solicitor General of the United States file a brief that expresses the views on the question of the use of eminent domain to acquire state owned lands for pipeline construction. The Solicitor General filed its brief with the Supreme Court on December 9, 2020.
The State of New Jersey filed a brief with the Supreme Court on December 23, 2020 in response to the brief of the Solicitor General.
On February 3, 2021, the Supreme Court granted the petition for a writ of certiorari. The matter was argued before the Supreme Court on April 28, 2021.
The Company evaluated its investment in PennEast for an other-than-temporary impairment and determined an impairment charge was not necessary. It is reasonably possible that future unfavorable developments, such as a reduced likelihood of success from development options and legal outcomes, estimated increases in construction costs, increases in the discount rate, or further significant delays, could result in an impairment of ourthe Company's equity method investment. Also, the use of alternate judgments and assumptions could result in a different calculation of fair value, which could ultimately result in the recognition of an impairment charge in the Unaudited Condensed Consolidated Financial Statements.charge.
New Jersey Resources Corporation
Part I
NOTES TO UNAUDITED CONDENSED CONSOLIDATED FINANCIAL STATEMENTS (Continued)
8. EARNINGS PER SHARE
The following table presents the calculation of the Company's basic and diluted earnings per share for:
| | | | | | | | | | | | | | |
| Three Months Ended | Six Months Ended |
| March 31, | March 31, |
| (Thousands, except per share amounts) | 2021 | 2020 | 2021 | 2020 |
| Net income, as reported | $ | 149,809 | | $ | 73,846 | | $ | 230,854 | | $ | 149,598 | |
| Basic earnings per share | | | | |
| Weighted average shares of common stock outstanding-basic | 96,248 | | 95,584 | | 96,181 | | 93,747 | |
| Basic earnings per common share | $1.56 | $0.78 | $2.40 | $1.60 |
| Diluted earnings per share | | | | |
| Weighted average shares of common stock outstanding-basic | 96,248 | | 95,584 | | 96,181 | | 93,747 | |
| | | | |
Equity forward sale agreement (1) | 0 | | 0 | | 0 | | 4 | |
Other (2) | 370 | | 306 | | 417 | | 322 | |
| Weighted average shares of common stock outstanding-diluted | 96,618 | | 95,890 | | 96,598 | | 94,073 | |
Diluted earnings per common share (3) | $1.55 | $0.77 | $2.39 | $1.59 |
|
| | | | | | | | | | | | |
| | Three Months Ended | Nine Months Ended |
| | June 30, | June 30, |
| (Thousands, except per share amounts) | 2020 | 2019 | 2020 | 2019 |
| Net income, as reported | $ | (27,219 | ) | $ | (8,402 | ) | $ | 150,647 |
| $ | 151,419 |
|
| Basic earnings per share | | | | |
| Weighted average shares of common stock outstanding-basic | 95,764 |
| 89,600 |
| 94,420 |
| 88,995 |
|
| Basic earnings per common share | $(0.28) | $(0.09) | $1.60 | $1.70 |
| Diluted earnings per share | | | | |
| Weighted average shares of common stock outstanding-basic | 95,764 |
| 89,600 |
| 94,420 |
| 88,995 |
|
Incremental shares (1) | — |
| — |
| 298 |
| 407 |
|
| Weighted average shares of common stock outstanding-diluted | 95,764 |
| 89,600 |
| 94,718 |
| 89,402 |
|
Diluted earnings per common share (2) | $(0.28) | $(0.09) | $1.59 | $1.69 |
(2)Consist primarily of unvested stock awards and performance shares.
(3)There were anti-dilutive shares of 24,101 and 30,708 excluded from the calculation of diluted earnings per share related to the equity forward sale agreement during the three months ended March 31, 2021 and 2020. There were anti-dilutive shares of 65,334 excluded from the calculation of diluted earnings per share related to the equity forward sale agreement during the six months ended March 31, 2021. There were 0 anti-dilutive shares excluded during the six months ended March 31, 2020.
| |
(1) | Consist primarily of unvested stock awards and performance shares.
|
| |
(2) | There were anti-dilutive shares of 251,780 and 95,817 excluded from the calculation of diluted earnings per share related to the equity forward sale agreement during the three and nine months ended June 30, 2020, respectively. Since there was a net loss for the three months ended June 30, 2020 and 2019, incremental shares of 310,000 and 409,000, respectively, were not included in the computation of diluted loss per common share, as their effect would have been anti-dilutive. There were 0 anti-dilutive shares excluded from the calculation of diluted earnings per share during the nine months ended June 30, 2019.
|
New Jersey Resources Corporation
Part I
NOTES TO UNAUDITED CONDENSED CONSOLIDATED FINANCIAL STATEMENTS (Continued)
9. DEBT
NJR and NJNG finance working capital requirements and capital expenditures through various short-term debt and long-term financing arrangements, including a commercial paper program and committed unsecured credit facilities.
Credit FacilitiesClean Energy Ventures
On April 24,The Company elects NPNS accounting treatment on PPA contracts executed by Clean Energy Ventures that meet the definition of a derivative and accounts for the contract on an accrual basis. Accordingly, electricity sales are recognized in revenues throughout the term of the PPA as electricity is delivered. NPNS is a contract-by-contract election and where it makes sense to do so, the Company can and may elect to treat certain contracts as normal.
Home Services and Other
During fiscal 2020, NJR entered into treasury lock transactions to fix the benchmark treasury rate associated with a 364-day $250$260 million revolving credit facility with an interest rate based on LIBOR plus 1.625 percent. After six months, all outstanding amounts underdebt issuance that was finalized in July 2020 and a $200 million debt issuance that was finalized in September 2020. NJR designated its treasury lock contracts as cash flow hedges, therefore, changes in fair value of the credit facility will convert toeffective portion of the hedges were recorded in OCI. Settlement of the treasury locks in fiscal 2020 resulted in a term loan and will be due on April 23, 2021. Proceeds will be used to fund ongoing ordinary working capital requirements and other general corporate purposes. In connection with entry into this credit facility, all outstanding borrowings under NJR's December 13, 2019, $150loss of $13.7 million, revolving line of credit facility were repaid.
A summary of NJR's credit facility and NJNG's commercial paper program and credit facility are as follows:
|
| | | | | | | | | |
| (Thousands) | June 30,
2020 | | September 30,
2019 | | Expiration Dates |
| NJR | | | | | |
Bank revolving credit facilities (1) | $ | 425,000 |
| | $ | 425,000 |
| | December 2023 |
| Notes outstanding at end of period | $ | 416,300 |
| | $ | 25,450 |
| | |
| Weighted average interest rate at end of period | 1.06 | % | | 3.04 | % | | |
Amount available at end of period (2) | $ | 244 |
| | $ | 394,800 |
| | |
Bank revolving credit facilities (1) | $ | 250,000 |
| | $ | — |
| | April 2021 |
| Notes outstanding at end of period | $ | — |
| | $ | — |
| | |
| Weighted average interest rate at end of period | — | % | | — | % | | |
Amount available at end of period (2) | $ | 250,000 |
| | $ | — |
| | |
| NJNG | | | | | |
Bank revolving credit facilities (1) | $ | 250,000 |
| | $ | 250,000 |
| | December 2023 |
| Commercial paper outstanding at end of period | $ | — |
| | $ | — |
| | |
| Weighted average interest rate at end of period | 0.25 | % | | — | % | | |
Amount available at end of period (3) | $ | 249,269 |
| | $ | 249,269 |
| | |
| |
(1) | Committed credit facilities, which require commitment fees on the unused amounts. |
| |
(2) | Letters of credit outstanding total $8.5 million and $4.8 million for June 30, 2020 and September 30, 2019, respectively, which reduces amount available by the same amount.
|
| |
(3) | Letters of credit outstanding total $731,000 for both June 30, 2020 and September 30, 2019, which reduces the amount available by the same amount.
|
Amounts available under credit facilities are reduced by bank or commercial paper borrowings, as applicable, and any outstanding letters of credit. Neither NJNG nor the results of its operations are obligated or pledged to support the NJR credit or debt shelf facilities.
On October 9, 2019, NJR entered into a $350 million Bridge Facility, which was used primarily to finance the Leaf River acquisition.recorded within OCI. The Bridge Facility accrues interest at the LIBOR rate for a 1-month interest period plus 0.875 percent during the first 180 days, and 1.075 percent after 180 days. Loans under the Bridge Facility are required to be prepaid to the extent of new cash proceeds received upon the issuance of equity of NJR, the incurrence of indebtedness by NJR or its subsidiaries, the disposition of assets by NJR or its subsidiaries or upon other specified events, in each case subject to certain exceptions set forth in the Bridge Facility. As of June 30, 2020, there were $137.1 million in borrowings remaining against the facility. The net proceeds from the December 2019 equity issuance were used to pay down the Bridge Facility. On July 23, 2020, the remaining $137.1 million in borrowings were repaid.
New Jersey Resources Corporation
Part I
NOTES TO UNAUDITED CONDENSED CONSOLIDATED FINANCIAL STATEMENTS (Continued)
Long-term Debt
NJNG
NJNG received $4 million and $9.9 million in December 2019 and 2018, respectively, in connection with the sale-leaseback of its natural gas meters. NJNG records a capital lease obligation thatloss is paidbeing amortized into earnings over the term of the lease and has the option to purchase the meters back at fair value upon expirationdebt as a component of the lease. NJNG exercised early purchase options with respect to certain outstanding meter leases by making final principal payments of $1.2 million and $1.1 million during the nine months ended June 30, 2020 and 2019, respectively.
On May 14, 2020, NJNG entered into a Note Purchase Agreement for $125 million of its senior notes, of which $100 million were at an interest rate of 3.13 percent, maturing in 2050, and $25 million were at an interest rate of 3.33 percent, maturing in 2060. On June 30, 2020, NJNG issued $50 million of the 3.13 percent senior notes due June 30, 2050. On July 23, 2020, NJNG issued the remaining $50 million of 3.13 percent senior notes due July 23, 2050, and $25 million of 3.33 percent senior notes due July 23, 2060. The senior notes are secured by an equal principal amount of NJNG’s FMBs issued under NJNG’s Mortgage Indenture.
NJR
On May 14, 2020, NJR entered into a Note Purchase Agreement for $260 million of its senior notes, of which $130 million were at an interest rate of 3.5 percent, maturing in 2030, and $130 million were at an interest rate of 3.6 percent, maturing in 2032. On July 23, 2020, NJR issued all $260 million of the senior notes. The senior notes are unsecured and guaranteed by certain unregulated subsidiaries of NJR.
On April 29, 2020, NJR settled a treasury lock resulting in a $2.5 million loss, which was recorded to accumulated other comprehensive income on the Unaudited Condensed Consolidated Balance Sheets. When the related forecasted debt issuance occurs, the loss will be amortized to interest expense on the Unaudited Condensed Consolidated Statements of Operations, which totaled $263,000 and $494,000, net of tax, during the three and six months ended March 31, 2021.
Fair Value of Derivatives
The following table presents the fair value of NJR's derivative assets and liabilities recognized on the Unaudited Condensed Consolidated Balance Sheets as of:
| | | | | | | | | | | | | | | | | | | | | | | | | | | | | |
| | | Derivatives at Fair Value |
| | March 31, 2021 | | September 30, 2020 |
| (Thousands) | Balance Sheet Location | Assets | Liabilities | Assets | Liabilities |
| Derivatives not designated as hedging instruments: | | | | | | | | |
| Natural Gas Distribution: | | | | | | | | | |
| Physical commodity contracts | Derivatives - current | | $ | 177 | | | $ | 1 | | | $ | 78 | | | $ | 76 | |
| | | | | | | | | |
| Financial commodity contracts | Derivatives - current | | 589 | | | 88 | | | 71 | | | 282 | |
| | | | | | | | | |
| | | | | | | | | |
| | | | | | | | | |
| Energy Services: | | | | | | | | | |
| Physical commodity contracts | Derivatives - current | | 3,668 | | | 16,415 | | | 6,454 | | | 20,438 | |
| Derivatives - noncurrent | | 1,364 | | | 20,090 | | | 1,264 | | | 12,003 | |
| | | | | | | | | |
| | | | | | | | | |
| Financial commodity contracts | Derivatives - current | | 12,770 | | | 7,166 | | | 16,671 | | | 12,965 | |
| Derivatives - noncurrent | | 585 | | | 407 | | | 2,037 | | | 1,346 | |
| Foreign currency contracts | Derivatives - current | | 229 | | | 20 | | | 36 | | | 104 | |
| Derivatives - noncurrent | | 28 | | | 9 | | | 48 | | | 3 | |
| | | | | | | | |
| | | | | | | | | |
| | | | | | | | | |
| | | | | | | | | |
| Total fair value of derivatives | | | $ | 19,410 | | | $ | 44,196 | | | $ | 26,659 | | | $ | 47,217 | |
New Jersey Resources Corporation
Part I
NOTES TO UNAUDITED CONDENSED CONSOLIDATED FINANCIAL STATEMENTS (Continued)
Offsetting of Derivatives
The Company transacts under master netting arrangements or equivalent agreements that allow it to offset derivative assets and liabilities with the same counterparty. However, the Company’s policy is to present its derivative assets and liabilities on a gross basis at the contract level unit of account on the Unaudited Condensed Consolidated Balance Sheets. The following table summarizes the reported gross amounts, the amounts that the Company has the right to offset but elects not to, financial collateral, as well as the net amounts the Company could present on the Unaudited Condensed Consolidated Balance Sheets but elects not to.
| | | | | | | | | | | | | | | | | | | | | | | | | | |
| (Thousands) | Amounts Presented on Balance Sheets (1) | Offsetting Derivative Instruments (2) | Financial Collateral Received/Pledged (3) | Net Amounts (4) |
| As of March 31, 2021: | | | | | | | | |
| Derivative assets: | | | | | | | | |
| Energy Services | | | | | | | | |
| Physical commodity contracts | | $ | 5,032 | | | $ | (1,757) | | | $ | (200) | | | $ | 3,075 | |
| Financial commodity contracts | | 13,355 | | | (7,573) | | | 0 | | 5,782 | |
| Foreign currency contracts | | 257 | | | (29) | | | 0 | | 228 | |
| Total Energy Services | | $ | 18,644 | | | $ | (9,359) | | | $ | (200) | | | $ | 9,085 | |
| Natural Gas Distribution | | | | | | | | |
| Physical commodity contracts | | $ | 177 | | | $ | (1) | | | $ | 0 | | | $ | 176 | |
| Financial commodity contracts | | 589 | | | (88) | | | 0 | | | 501 | |
| | | | | | | | |
| Total Natural Gas Distribution | | $ | 766 | | | $ | (89) | | | $ | 0 | | | $ | 677 | |
| | | | | | | | |
| | | | | | | | |
| | | | | | | | |
| Derivative liabilities: | | | | | | | | |
| Energy Services | | | | | | | | |
| Physical commodity contracts | | $ | 36,505 | | | $ | (1,757) | | | $ | 0 | | | $ | 34,748 | |
| | | | | | | | |
| Financial commodity contracts | | 7,573 | | | (7,573) | | | 0 | | | 0 | |
| Foreign currency contracts | | 29 | | | (29) | | | 0 | | | 0 | |
| Total Energy Services | | $ | 44,107 | | | $ | (9,359) | | | $ | 0 | | | $ | 34,748 | |
| Natural Gas Distribution | | | | | | | | |
| Physical commodity contracts | | $ | 1 | | | $ | (1) | | | 0 | | $ | 0 | |
| Financial commodity contracts | | 88 | | | (88) | | | 0 | | 0 | |
| | | | | | | | |
| Total Natural Gas Distribution | | $ | 89 | | | $ | (89) | | | $ | 0 | | | $ | 0 | |
| | | | | | | | |
| | | | | | | | |
| | | | | | | | |
| As of September 30, 2020: | | | | | | | | |
| Derivative assets: | | | | | | | | |
| Energy Services | | | | | | | | |
| Physical commodity contracts | | $ | 7,718 | | | $ | (3,587) | | | $ | (200) | | | $ | 3,931 | |
| Financial commodity contracts | | 18,708 | | | (14,311) | | | 0 | | | 4,397 | |
| Foreign currency contracts | | 84 | | | (84) | | | 0 | | | 0 | |
| Total Energy Services | | $ | 26,510 | | | $ | (17,982) | | | $ | (200) | | | $ | 8,328 | |
| Natural Gas Distribution | | | | | | | | |
| Physical commodity contracts | | $ | 78 | | | $ | (65) | | | $ | 0 | | | $ | 13 | |
| Financial commodity contracts | | 71 | | | (71) | | | 0 | | | 0 | |
| Total Natural Gas Distribution | | $ | 149 | | | $ | (136) | | | $ | 0 | | | $ | 13 | |
| | | | | | | | |
| | | | | | | | |
| | | | | | | | |
| Derivative liabilities: | | | | | | | | |
| Energy Services | | | | | | | | |
| Physical commodity contracts | | $ | 32,441 | | | $ | (3,587) | | | $ | 0 | | | $ | 28,854 | |
| Financial commodity contracts | | 14,311 | | | (14,311) | | | 0 | | | 0 | |
| Foreign currency contracts | | 107 | | | (84) | | | 0 | | | 23 | |
| Total Energy Services | | $ | 46,859 | | | $ | (17,982) | | | $ | 0 | | | $ | 28,877 | |
| Natural Gas Distribution | | | | | | | | |
| Physical commodity contracts | | $ | 76 | | | $ | (65) | | | $ | 0 | | | $ | 11 | |
| Financial commodity contracts | | 282 | | | (71) | | | 0 | | | 211 | |
| | | | | | | | |
| Total Natural Gas Distribution | | $ | 358 | | | $ | (136) | | | $ | 0 | | | $ | 222 | |
(1)Derivative assets and liabilities are presented on a gross basis on the balance sheet as the Company does not elect balance sheet offsetting under ASC 210-20.
(2)Includes transactions with NAESB netting election, transactions held by FCMs with net margining and transactions with ISDA netting.
(3)Financial collateral includes cash balances at FCMs as well as cash received from or pledged to other counterparties.
(4)Net amounts represent presentation of derivative assets and liabilities if the Company were to elect balance sheet offsetting under ASC 210-20.
New Jersey Resources Corporation
Part I
NOTES TO UNAUDITED CONDENSED CONSOLIDATED FINANCIAL STATEMENTS (Continued)
Energy Services utilizes financial derivatives to economically hedge the gross margin associated with the purchase of physical natural gas to be used for storage injection and its subsequent sale at a later date. The gains or (losses) on the financial transactions that are economic hedges of the cost of the purchased natural gas are recognized prior to the gains or (losses) on the physical transaction, which are recognized in earnings when the natural gas is delivered. Therefore, mismatches between the timing of the recognition of realized gains or (losses) on the financial derivative instruments and gains or (losses) associated with the actual sale of the natural gas that is being economically hedged along with fair value changes in derivative instruments, creates volatility in the results of Energy Services, although the Company's intended economic results relating to the entire transaction are unaffected.
The following table presents the effect of derivative instruments recognized on the Unaudited Condensed Consolidated Statements of Operations for the periods set forth below:
| | | | | | | | | | | | | | | | | | | | | | | |
| (Thousands) | Location of gain (loss) recognized in income on derivatives | Amount of gain (loss) recognized
in income on derivatives |
| | Three Months Ended | Six Months Ended |
| | March 31, | March 31, |
| Derivatives not designated as hedging instruments: | 2021 | | 2020 | 2021 | | 2020 |
| Energy Services: | | | | | | | |
| Physical commodity contracts | Operating revenues | $ | 36,419 | | | $ | 12,096 | | $ | 41,671 | | | $ | 21,932 | |
| Physical commodity contracts | Natural gas purchases | 2,650 | | | (1,892) | | (2,404) | | | (3,302) | |
| Financial commodity contracts | Natural gas purchases | (27,315) | | | 23,319 | | 20,440 | | | 69,412 | |
| Foreign currency contracts | Natural gas purchases | 27 | | | (475) | | 227 | | | (360) | |
| | | | | | | |
| | | | | | | |
| Total unrealized and realized gains | $ | 11,781 | | | $ | 33,048 | | $ | 59,934 | | | $ | 87,682 | |
NJNG’s derivative contracts are part of the Company's risk management activities that relate to its natural gas purchases and BGSS incentive programs. At settlement, the resulting gains and/or losses are payable to or recoverable from utility customers and are deferred in regulatory assets or liabilities resulting in no impact to earnings. The following table reflects the (losses) gains associated with NJNG's derivative instruments for the periods set forth below:
| | | | | | | | | | | | | | | | | | | | |
| Three Months Ended | Six Months Ended |
| March 31, | March 31, |
| (Thousands) | 2021 | | 2020 | 2021 | | 2020 |
| Natural Gas Distribution: | | | | | | |
| Physical commodity contracts | $ | 1,091 | | | $ | 209 | | $ | 1,433 | | | $ | 1,049 | |
| Financial commodity contracts | 645 | | | (11,434) | | (3,627) | | | (12,522) | |
| Interest rate contracts | 0 | | | (6,692) | | 0 | | | (6,692) | |
| Total unrealized and realized losses | $ | 1,736 | | | $ | (17,917) | | $ | (2,194) | | | $ | (18,165) | |
NJR designates its treasury lock contracts as cash flow hedges, therefore, changes in fair value of the effective portion of the hedges are recorded in OCI and upon settlement of the contracts, realized gains and (losses) are reclassified from OCI to interest expense on the Consolidated Statements of Operations.
The following table reflects the effect of derivative instruments designated as cash flow hedges in OCI:
| | | | | | | | | | | | | | | | | | | |
| (Thousands) | Amount of Pre-tax Gain (Loss) Recognized in OCI on Derivatives | Location of Gain (Loss) Reclassified from OCI into Income | Amount of Pre-tax Gain (Loss) Reclassified from OCI into Income | |
| Three Months Ended | | Three Months Ended | | |
| March 31, | | March 31, | | |
| Derivatives in cash flow hedging relationships: | 2021 | 2020 | | 2021 | 2020 | | |
| Interest rate contracts | $ | 0 | | $ | (12,492) | | Interest expense | $ | (342) | | $ | 0 | | | |
| Six Months Ended | | Six Months Ended | | |
| March 31, | | March 31, | | |
| Derivatives in cash flow hedging relationships: | 2021 | 2020 | | 2021 | 2020 | | |
| Interest rate contracts | $ | 0 | | $ | (12,492) | | Interest expense | $ | (685) | | $ | 0 | | | |
New Jersey Resources Corporation
Part I
NOTES TO UNAUDITED CONDENSED CONSOLIDATED FINANCIAL STATEMENTS (Continued)
NJNG and Energy Services had the following outstanding long (short) derivatives as of:
| | | | | | | | | | | | | | | | | | | |
| | | | | Volume (Bcf) |
| | Transaction Type | | | March 31,
2021 | | September 30,
2020 |
| Natural Gas Distribution | | Futures | | | 22.1 | | | 23.7 | |
| | | | | | | |
| | | | | | | |
| | Physical Commodity | | | 16.6 | | | 6.0 | |
| | | | | | | |
| Energy Services | | Futures | | | (11.6) | | | (27.5) | |
| | Swaps | | | (0.8) | | | (1.8) | |
| | | | | | | |
| | Physical Commodity | | | 1.5 | | | 5.0 | |
| | | | | | | |
| | | | | | | |
| | | | | | | |
Not included in the above table are Energy Services' net notional amount of foreign currency transactions of approximately $42,000 as of March 31, 2021 and $5.1 million as of September 30, 2020 and 1,588,000 and 960,000 SRECs that were open as of March 31, 2021 and September 30, 2020, respectively.
Broker Margin
Futures exchanges have contract specific margin requirements that require the posting of cash or cash equivalents relating to traded contracts. Margin requirements consist of initial margin that is posted upon the initiation of a position, maintenance margin that is usually expressed as a percent of initial margin, and variation margin that fluctuates based on the daily marked-to-market relative to maintenance margin requirements. The Company maintains separate broker margin accounts for the Natural Gas Distribution and Energy Services segments. The balances are as follows:
| | | | | | | | | | | |
| (Thousands) | Balance Sheet Location | March 31,
2021 | September 30,
2020 |
| Natural Gas Distribution | Restricted broker margin accounts | $ | 4,190 | | $ | 13,525 | |
| | | |
| Energy Services | Restricted broker margin accounts | $ | 41,726 | | $ | 55,919 | |
| | | |
Wholesale Credit Risk
NJNG, Energy Services, Clean Energy Ventures and the Storage and Transportation segment are exposed to credit risk as a result of their sales/wholesale marketing activities. As a result of the inherent volatility in the prices of natural gas commodities, derivatives, SRECs, the market value of contractual positions with individual counterparties could exceed established credit limits or collateral provided by those counterparties. If a counterparty fails to perform the obligations under its contract then the Company could sustain a loss.
The Company monitors and manages the credit risk of its wholesale operations through credit policies and procedures that management believes reduce overall credit risk. These policies include a review and evaluation of current and prospective counterparties' financial statements and/or credit ratings, daily monitoring of counterparties' credit limits and exposure, daily communication with traders regarding credit status and the use of credit mitigation measures, such as collateral requirements and netting agreements. Examples of collateral include letters of credit and cash received for either prepayment or margin deposit. Collateral may be requested due to the Company's election not to extend credit or because exposure exceeds defined thresholds. Most of the Company's wholesale marketing contracts contain standard netting provisions. These contracts include those governed by ISDA and the NAESB. The netting provisions refer to payment netting, whereby receivables and payables with the same counterparty are offset and the resulting net amount is paid to the party to which it is due.
Internally-rated exposure applies to counterparties that are not rated by Fitch or Moody's. In these cases, the counterparty's or guarantor's financial statements are reviewed, and similar methodologies and ratios used by Fitch and/or Moody's are applied to arrive at a substitute rating. Gross credit exposure is defined as the unrealized fair value of physical and financial derivative commodity contracts, plus any outstanding wholesale receivable for the value of natural gas delivered and/or financial derivative commodity contract that has settled for which payment has not yet been received.
New Jersey Resources Corporation
Part I
NOTES TO UNAUDITED CONDENSED CONSOLIDATED FINANCIAL STATEMENTS (Continued)
The following is a summary of gross credit exposures grouped by investment and noninvestment grade counterparties, as of March 31, 2021. The amounts presented below have not been reduced by any collateral received or netting and exclude accounts receivable for NJNG retail natural gas sales and services and Clean Energy Ventures residential solar installations.
| | | | | | | | | | | |
| (Thousands) | Gross Credit Exposure |
| Investment grade | | $ | 128,585 | | |
| Noninvestment grade | | 9,471 | | |
| Internally rated investment grade | | 23,661 | | |
| Internally rated noninvestment grade | | 20,118 | | |
| Total | | $ | 181,835 | | |
Conversely, certain of NJNG's and Energy Services' derivative instruments are linked to agreements containing provisions that would require cash collateral payments from the Company if certain events occur. These provisions vary based upon the terms in individual counterparty agreements and can result in cash payments if NJNG's credit rating were to fall below its current level. Specifically, most, but not all, of these additional payments will be triggered if NJNG's debt is downgraded by the major credit agencies, regardless of investment grade status. In addition, some of these agreements include threshold amounts that would result in additional collateral payments if the values of derivative liabilities were to exceed the maximum values provided for in relevant counterparty agreements. Other provisions include payment features that are not specifically linked to ratings, but are based on certain financial metrics.
Collateral amounts associated with any of these conditions are determined based on a sliding scale and are contingent upon the degree to which the Company's credit rating and/or financial metrics deteriorate, and the extent to which liability amounts exceed applicable threshold limits. There were no derivative instruments with credit-risk-related contingent features that were in a liability position for which collateral is required as of March 31, 2021. These amounts differ from the respective net derivative liabilities reflected on the Unaudited Condensed Consolidated Balance Sheets because the agreements also include clauses, commonly known as “Rights of Offset,” that would permit the Company to offset its derivative assets against its derivative liabilities for determining additional collateral to be posted, as previously discussed.
6. FAIR VALUE
Fair Value of Assets and Liabilities
The fair value of cash and cash equivalents, accounts receivable, current loan receivables, accounts payable, commercial paper and borrowings under revolving credit facilities are estimated to equal their carrying amounts due to the short maturity of those instruments. Non-current loan receivables are recorded based on what the Company expects to receive, which approximates fair value, in other noncurrent assets on the Unaudited Condensed Consolidated Balance Sheets. The Company regularly evaluates the credit quality and collection profile of its customers to approximate fair value.
The estimated fair value of long-term debt, including current maturities, excluding finance leases, debt issuance costs and solar asset financing obligations, is as follows:
| | | | | | | | |
| (Thousands) | March 31,
2021 | September 30,
2020 |
Carrying value (1) (2) (3) | $ | 2,102,845 | | $ | 2,102,845 | |
| Fair market value | $ | 2,259,855 | | $ | 2,417,748 | |
(1)Excludes finance leases of $68.2 million and $74.2 million as of March 31, 2021 and September 30, 2020, respectively.
(2)Excludes NJNG's debt issuance costs of $9.4 million and $9.2 million as of March 31, 2021 and September 30, 2020, respectively.
(3)Excludes NJR's debt issuance costs of $3.3 million and $3.4 million as of March 31, 2021 and September 30, 2020, respectively.
Clean Energy Ventures enters into transactions to sell certain commercial solar assets and lease the assets back for a term specified in the lease. These transactions are considered financing obligations for accounting purposes and are recorded within long-term debt on the Unaudited Condensed Consolidated Balance Sheets. The estimated fair value of solar asset financing obligations as of March 31, 2021 and September 30, 2020 was $155.6 million and $149.2 million, respectively.
New Jersey Resources Corporation
Part I
NOTES TO UNAUDITED CONDENSED CONSOLIDATED FINANCIAL STATEMENTS (Continued)
The Company utilizes a discounted cash flow method to determine the fair value of its debt. Inputs include observable municipal and corporate yields, as appropriate for the maturity of the specific issue and the Company's credit rating. As of March 31, 2021, NJR discloses its debt within Level 2 of the fair value hierarchy.
Fair Value Hierarchy
NJR applies fair value measurement guidance to its financial assets and liabilities, as appropriate, which include financial derivatives and physical commodity contracts qualifying as derivatives, investments in equity securities and other financial assets and liabilities. In addition, authoritative accounting literature prescribes the use of a fair value hierarchy that prioritizes the inputs to valuation techniques used to measure fair value based on the source of the data used to develop the price inputs. The hierarchy gives the highest priority to unadjusted quoted prices in active markets for identical assets or liabilities and the lowest priority to inputs that are based on unobservable market data and include the following:
Level 1Unadjusted quoted prices for identical assets or liabilities in active markets. NJR's Level 1 assets and liabilities include exchange traded natural gas futures and options contracts, listed equities and money market funds. Exchange traded futures and options contracts include all energy contracts traded on the NYMEX, CME and ICE that NJR refers to internally as basis swaps, fixed swaps, futures and financial options that are cleared through a FCM.
Level 2Other significant observable inputs such as interest rates or price data, including both commodity and basis pricing that is observed either directly or indirectly from publications or pricing services. NJR's Level 2 assets and liabilities include over-the-counter physical forward commodity contracts and swap contracts, SREC forward sales or derivatives that are initially valued using observable quotes and are subsequently adjusted to include time value, credit risk or estimated transport pricing components for which no basis price is available. Level 2 financial derivatives consist of transactions with non-FCM counterparties (basis swaps, fixed swaps and/or options). NJNG's treasury lock is also considered Level 2 as valuation is based on quoted market interest and swap rates as inputs to the valuation model. Inputs are verifiable and do not require significant management judgment. For some physical commodity contracts the Company utilizes transportation tariff rates that are publicly available and that it considers to be observable inputs that are equivalent to market data received from an independent source. There are no significant judgments or adjustments applied to the transportation tariff inputs and no market perspective is required. Even if the transportation tariff input were considered to be a “model,” it would still be considered to be a Level 2 input as the data is:
•widely accepted and public;
•non-proprietary and sourced from an independent third party; and
•observable and published.
These additional adjustments are generally not considered to be significant to the ultimate recognized values.
Level 3Inputs derived from a significant amount of unobservable market data. These include NJR's best estimate of fair value and are derived primarily through the use of internal valuation methodologies.
New Jersey Resources Corporation
Part I
NOTES TO UNAUDITED CONDENSED CONSOLIDATED FINANCIAL STATEMENTS (Continued)
Assets and liabilities measured at fair value on a recurring basis are summarized as follows:
| | | | | | | | | | | | | | | | | | | | | | | | | | | | | | | | |
| Quoted Prices in Active Markets for Identical Assets | Significant Other Observable Inputs | Significant Unobservable Inputs | |
| (Thousands) | (Level 1) | (Level 2) | (Level 3) | Total |
| As of March 31, 2021: | | | | | | | | | | |
| Assets: | | | | | | | | | | |
| Physical commodity contracts | | $ | 0 | | | | $ | 5,209 | | | | $ | 0 | | | $ | 5,209 | |
| Financial commodity contracts | | 13,751 | | | | 193 | | | | 0 | | | 13,944 | |
| Financial commodity contracts - foreign exchange | | 0 | | | | 257 | | | | 0 | | | 257 | |
| | | | | | | | | | |
| | | | | | | | | | |
| Money market funds | | 50,368 | | | | 0 | | | | 0 | | | 50,368 | |
| Other | | 1,818 | | | | 0 | | | | 0 | | | 1,818 | |
| Total assets at fair value | | $ | 65,937 | | | | $ | 5,659 | | | | $ | 0 | | | $ | 71,596 | |
| Liabilities: | | | | | | | | | | |
| Physical commodity contracts | | $ | 0 | | | | $ | 36,506 | | | | $ | 0 | | | $ | 36,506 | |
| Financial commodity contracts | | 7,661 | | | | 0 | | | | 0 | | | 7,661 | |
| Financial commodity contracts - foreign exchange | | 0 | | | | 29 | | | | 0 | | | 29 | |
| | | | | | | | | | |
| Total liabilities at fair value | | $ | 7,661 | | | | $ | 36,535 | | | | $ | 0 | | | $ | 44,196 | |
| As of September 30, 2020: | | | | | | | | | | |
| Assets: | | | | | | | | | | |
| Physical commodity contracts | | $ | 0 | | | | $ | 7,796 | | | | $ | 0 | | | $ | 7,796 | |
| Financial commodity contracts | | 18,279 | | | | 500 | | | | 0 | | | 18,779 | |
| Financial commodity contracts - foreign exchange | | 0 | | | | 84 | | | | 0 | | | 84 | |
| | | | | | | | | | |
| Money market funds | | 112,291 | | | | 0 | | | | 0 | | | 112,291 | |
| Other | | 1,840 | | | | 0 | | | | 0 | | | 1,840 | |
| Total assets at fair value | | $ | 132,410 | | | | $ | 8,380 | | | | $ | 0 | | | $ | 140,790 | |
| Liabilities: | | | | | | | | | | |
| Physical commodity contracts | | $ | 0 | | | | $ | 32,517 | | | | $ | 0 | | | $ | 32,517 | |
| Financial commodity contracts | | 14,593 | | | | 0 | | | | 0 | | | 14,593 | |
| Financial commodity contracts - foreign exchange | | 0 | | | | 107 | | | | 0 | | | 107 | |
| Total liabilities at fair value | | $ | 14,593 | | | | $ | 32,624 | | | | $ | 0 | | | $ | 47,217 | |
7. INVESTMENTS IN EQUITY INVESTEES
NJR's investments in equity method investees include the following as of:
| | | | | | | | |
| (Thousands) | March 31,
2021 | September 30,
2020 |
Steckman Ridge (1) | $ | 111,435 | | $ | 112,378 | |
PennEast (2) | 103,086 | | 95,997 | |
| Total | $ | 214,521 | | $ | 208,375 | |
(1)Includes loans with a total outstanding principal balance of $70.4 million for both March 31, 2021 and September 30, 2020, which accrue interest at a variable rate that resets quarterly and are due October 1, 2023.
(2)Includes a deferred tax component related to AFUDC equity of $7.6 million and $4.6 million for March 31, 2021 and September 30, 2020, respectively.
Steckman Ridge
The Company holds a 50 percent equity method investment in Steckman Ridge, a jointly owned and controlled natural gas storage facility located in Bedford County, Pennsylvania. Due to the expiration of a customer contract in October 2020, the Company evaluated its investment in Steckman Ridge for other-than-temporary impairment and determined an impairment charge was not necessary.
New Jersey Resources Corporation
Part I
NOTES TO UNAUDITED CONDENSED CONSOLIDATED FINANCIAL STATEMENTS (Continued)
The fair value of the Company’s investment in Steckman Ridge was determined using a discounted cash flow method and utilized management’s best estimates and assumptions related to expected future results, including the price and capacity of firm natural gas storage contracting, operations and maintenance costs, the nature and timing of major maintenance and capital investment, and discount rates. Fair value determinations require considerable judgment and are sensitive to changes in underlying assumptions and other factors. As a result, it is reasonably possible that unfavorable developments, such as the failure to execute storage contracts and other services for available capacity at anticipated price levels could result in an other-than temporary impairment charge in the Unaudited Condensed Consolidated Financial Statements.
PennEast
The Company, through its subsidiary NJR Pipeline Company, is a 20 percent investor in PennEast, a partnership whose purpose is to construct and operate a 120-mile natural gas pipeline that will extend from northeast Pennsylvania to western New Jersey. PennEast received a Certificate of Public Convenience and Necessity for the project from FERC on January 19, 2018.
On September 10, 2019, the Third Circuit issued an order overturning the United States District Court for the District of New Jersey’s order granting PennEast condemnation and immediate access in accordance with the Natural Gas Act to certain properties in which the State of New Jersey holds an interest. A Petition for Rehearing was denied by the Third Circuit on November 5, 2019.
On October 8, 2019, the NJDEP issued a letter indicating that it deemed PennEast’s freshwater wetlands permit application to be administratively incomplete and closed the matter without prejudice. On October 11, 2019, PennEast submitted a letter to the NJDEP objecting to its position that the application is administratively incomplete. PennEast's objections were rejected by the NJDEP on November 18, 2019.
On October 4, 2019, PennEast filed a petition for Declaratory Order with FERC requesting an interpretation of the eminent domain authority of a FERC certificate holder under the Natural Gas Act. The Declaratory Order was granted on January 30, 2020.
On January 30, 2020, PennEast filed an amendment with FERC to construct the PennEast pipeline in 2 phases. Phase one consists of construction of a 68-mile pipeline in Pennsylvania from the eastern Marcellus Shale region in Luzerne County that would terminate in Northampton County. Phase two includes construction of the remaining original certificated route in Pennsylvania and New Jersey. Construction is expected to begin following approval by FERC of the phased approach and receipt of any remaining governmental and regulatory permits.
On February 18, 2020, PennEast filed a writ of certiorari with the Supreme Court of the United States to review the September 10, 2019 Third Circuit decision.
On June 29, 2020, the Supreme Court requested that the Solicitor General of the United States file a brief that expresses the views on the question of the use of eminent domain to acquire state owned lands for pipeline construction. The Solicitor General filed its brief with the Supreme Court on December 9, 2020.
The State of New Jersey filed a brief with the Supreme Court on December 23, 2020 in response to the brief of the Solicitor General.
On February 3, 2021, the Supreme Court granted the petition for a writ of certiorari. The matter was argued before the Supreme Court on April 28, 2021.
The Company evaluated its investment in PennEast for an other-than-temporary impairment and determined an impairment charge was not necessary. It is reasonably possible that future unfavorable developments, such as a reduced likelihood of success from development options and legal outcomes, estimated increases in construction costs, increases in the discount rate, or further significant delays, could result in an impairment of the Company's equity method investment. Also, the use of alternate judgments and assumptions could result in a different calculation of fair value, which could ultimately result in the recognition of an impairment charge.
New Jersey Resources Corporation
Part I
NOTES TO UNAUDITED CONDENSED CONSOLIDATED FINANCIAL STATEMENTS (Continued)
8. EARNINGS PER SHARE
The following table presents the calculation of the Company's basic and diluted earnings per share for:
| | | | | | | | | | | | | | |
| Three Months Ended | Six Months Ended |
| March 31, | March 31, |
| (Thousands, except per share amounts) | 2021 | 2020 | 2021 | 2020 |
| Net income, as reported | $ | 149,809 | | $ | 73,846 | | $ | 230,854 | | $ | 149,598 | |
| Basic earnings per share | | | | |
| Weighted average shares of common stock outstanding-basic | 96,248 | | 95,584 | | 96,181 | | 93,747 | |
| Basic earnings per common share | $1.56 | $0.78 | $2.40 | $1.60 |
| Diluted earnings per share | | | | |
| Weighted average shares of common stock outstanding-basic | 96,248 | | 95,584 | | 96,181 | | 93,747 | |
| | | | |
Equity forward sale agreement (1) | 0 | | 0 | | 0 | | 4 | |
Other (2) | 370 | | 306 | | 417 | | 322 | |
| Weighted average shares of common stock outstanding-diluted | 96,618 | | 95,890 | | 96,598 | | 94,073 | |
Diluted earnings per common share (3) | $1.55 | $0.77 | $2.39 | $1.59 |
(1)See Note 14. Common Stock Equity for details regarding the forward sale agreement.
(2)Consist primarily of unvested stock awards and performance shares.
(3)There were anti-dilutive shares of 24,101 and 30,708 excluded from the calculation of diluted earnings per share related to the equity forward sale agreement during the three months ended March 31, 2021 and 2020. There were anti-dilutive shares of 65,334 excluded from the calculation of diluted earnings per share related to the equity forward sale agreement during the six months ended March 31, 2021. There were 0 anti-dilutive shares excluded during the six months ended March 31, 2020.
9. DEBT
NJR and NJNG finance working capital requirements and capital expenditures through various short-term debt and long-term financing arrangements, including a commercial paper program and committed unsecured credit facilities.
Clean Energy Ventures
In June 2020,The Company elects NPNS accounting treatment on PPA contracts executed by Clean Energy Ventures that meet the definition of a derivative and accounts for the contract on an accrual basis. Accordingly, electricity sales are recognized in revenues throughout the term of the PPA as electricity is delivered. NPNS is a contract-by-contract election and where it makes sense to do so, the Company can and may elect to treat certain contracts as normal.
Home Services and Other
During fiscal 2020, NJR entered into treasury lock transactions to fix the benchmark treasury rate associated with a $260 million debt issuance that was finalized in July 2020 and a $200 million debt issuance that was finalized in September 2020. NJR designated its treasury lock contracts as cash flow hedges, therefore, changes in fair value of the effective portion of the hedges were recorded in OCI. Settlement of the treasury locks in fiscal 2020 resulted in a loss of $13.7 million, which was recorded within OCI. The loss is being amortized into earnings over the term of the debt as a component of interest expense on the Unaudited Condensed Consolidated Statements of Operations, which totaled $263,000 and $494,000, net of tax, during the three and six months ended March 31, 2021.
Fair Value of Derivatives
The following table presents the fair value of NJR's derivative assets and liabilities recognized on the Unaudited Condensed Consolidated Balance Sheets as of:
| | | | | | | | | | | | | | | | | | | | | | | | | | | | | |
| | | Derivatives at Fair Value |
| | March 31, 2021 | | September 30, 2020 |
| (Thousands) | Balance Sheet Location | Assets | Liabilities | Assets | Liabilities |
| Derivatives not designated as hedging instruments: | | | | | | | | |
| Natural Gas Distribution: | | | | | | | | | |
| Physical commodity contracts | Derivatives - current | | $ | 177 | | | $ | 1 | | | $ | 78 | | | $ | 76 | |
| | | | | | | | | |
| Financial commodity contracts | Derivatives - current | | 589 | | | 88 | | | 71 | | | 282 | |
| | | | | | | | | |
| | | | | | | | | |
| | | | | | | | | |
| Energy Services: | | | | | | | | | |
| Physical commodity contracts | Derivatives - current | | 3,668 | | | 16,415 | | | 6,454 | | | 20,438 | |
| Derivatives - noncurrent | | 1,364 | | | 20,090 | | | 1,264 | | | 12,003 | |
| | | | | | | | | |
| | | | | | | | | |
| Financial commodity contracts | Derivatives - current | | 12,770 | | | 7,166 | | | 16,671 | | | 12,965 | |
| Derivatives - noncurrent | | 585 | | | 407 | | | 2,037 | | | 1,346 | |
| Foreign currency contracts | Derivatives - current | | 229 | | | 20 | | | 36 | | | 104 | |
| Derivatives - noncurrent | | 28 | | | 9 | | | 48 | | | 3 | |
| | | | | | | | |
| | | | | | | | | |
| | | | | | | | | |
| | | | | | | | | |
| Total fair value of derivatives | | | $ | 19,410 | | | $ | 44,196 | | | $ | 26,659 | | | $ | 47,217 | |
New Jersey Resources Corporation
Part I
NOTES TO UNAUDITED CONDENSED CONSOLIDATED FINANCIAL STATEMENTS (Continued)
Offsetting of Derivatives
The Company transacts under master netting arrangements or equivalent agreements that allow it to offset derivative assets and liabilities with the same counterparty. However, the Company’s policy is to present its derivative assets and liabilities on a gross basis at the contract level unit of account on the Unaudited Condensed Consolidated Balance Sheets. The following table summarizes the reported gross amounts, the amounts that the Company has the right to offset but elects not to, financial collateral, as well as the net amounts the Company could present on the Unaudited Condensed Consolidated Balance Sheets but elects not to.
| | | | | | | | | | | | | | | | | | | | | | | | | | |
| (Thousands) | Amounts Presented on Balance Sheets (1) | Offsetting Derivative Instruments (2) | Financial Collateral Received/Pledged (3) | Net Amounts (4) |
| As of March 31, 2021: | | | | | | | | |
| Derivative assets: | | | | | | | | |
| Energy Services | | | | | | | | |
| Physical commodity contracts | | $ | 5,032 | | | $ | (1,757) | | | $ | (200) | | | $ | 3,075 | |
| Financial commodity contracts | | 13,355 | | | (7,573) | | | 0 | | 5,782 | |
| Foreign currency contracts | | 257 | | | (29) | | | 0 | | 228 | |
| Total Energy Services | | $ | 18,644 | | | $ | (9,359) | | | $ | (200) | | | $ | 9,085 | |
| Natural Gas Distribution | | | | | | | | |
| Physical commodity contracts | | $ | 177 | | | $ | (1) | | | $ | 0 | | | $ | 176 | |
| Financial commodity contracts | | 589 | | | (88) | | | 0 | | | 501 | |
| | | | | | | | |
| Total Natural Gas Distribution | | $ | 766 | | | $ | (89) | | | $ | 0 | | | $ | 677 | |
| | | | | | | | |
| | | | | | | | |
| | | | | | | | |
| Derivative liabilities: | | | | | | | | |
| Energy Services | | | | | | | | |
| Physical commodity contracts | | $ | 36,505 | | | $ | (1,757) | | | $ | 0 | | | $ | 34,748 | |
| | | | | | | | |
| Financial commodity contracts | | 7,573 | | | (7,573) | | | 0 | | | 0 | |
| Foreign currency contracts | | 29 | | | (29) | | | 0 | | | 0 | |
| Total Energy Services | | $ | 44,107 | | | $ | (9,359) | | | $ | 0 | | | $ | 34,748 | |
| Natural Gas Distribution | | | | | | | | |
| Physical commodity contracts | | $ | 1 | | | $ | (1) | | | 0 | | $ | 0 | |
| Financial commodity contracts | | 88 | | | (88) | | | 0 | | 0 | |
| | | | | | | | |
| Total Natural Gas Distribution | | $ | 89 | | | $ | (89) | | | $ | 0 | | | $ | 0 | |
| | | | | | | | |
| | | | | | | | |
| | | | | | | | |
| As of September 30, 2020: | | | | | | | | |
| Derivative assets: | | | | | | | | |
| Energy Services | | | | | | | | |
| Physical commodity contracts | | $ | 7,718 | | | $ | (3,587) | | | $ | (200) | | | $ | 3,931 | |
| Financial commodity contracts | | 18,708 | | | (14,311) | | | 0 | | | 4,397 | |
| Foreign currency contracts | | 84 | | | (84) | | | 0 | | | 0 | |
| Total Energy Services | | $ | 26,510 | | | $ | (17,982) | | | $ | (200) | | | $ | 8,328 | |
| Natural Gas Distribution | | | | | | | | |
| Physical commodity contracts | | $ | 78 | | | $ | (65) | | | $ | 0 | | | $ | 13 | |
| Financial commodity contracts | | 71 | | | (71) | | | 0 | | | 0 | |
| Total Natural Gas Distribution | | $ | 149 | | | $ | (136) | | | $ | 0 | | | $ | 13 | |
| | | | | | | | |
| | | | | | | | |
| | | | | | | | |
| Derivative liabilities: | | | | | | | | |
| Energy Services | | | | | | | | |
| Physical commodity contracts | | $ | 32,441 | | | $ | (3,587) | | | $ | 0 | | | $ | 28,854 | |
| Financial commodity contracts | | 14,311 | | | (14,311) | | | 0 | | | 0 | |
| Foreign currency contracts | | 107 | | | (84) | | | 0 | | | 23 | |
| Total Energy Services | | $ | 46,859 | | | $ | (17,982) | | | $ | 0 | | | $ | 28,877 | |
| Natural Gas Distribution | | | | | | | | |
| Physical commodity contracts | | $ | 76 | | | $ | (65) | | | $ | 0 | | | $ | 11 | |
| Financial commodity contracts | | 282 | | | (71) | | | 0 | | | 211 | |
| | | | | | | | |
| Total Natural Gas Distribution | | $ | 358 | | | $ | (136) | | | $ | 0 | | | $ | 222 | |
(1)Derivative assets and liabilities are presented on a gross basis on the balance sheet as the Company does not elect balance sheet offsetting under ASC 210-20.
(2)Includes transactions with NAESB netting election, transactions held by FCMs with net margining and transactions with ISDA netting.
(3)Financial collateral includes cash balances at FCMs as well as cash received proceedsfrom or pledged to other counterparties.
(4)Net amounts represent presentation of $42.9derivative assets and liabilities if the Company were to elect balance sheet offsetting under ASC 210-20.
New Jersey Resources Corporation
Part I
NOTES TO UNAUDITED CONDENSED CONSOLIDATED FINANCIAL STATEMENTS (Continued)
Energy Services utilizes financial derivatives to economically hedge the gross margin associated with the purchase of physical natural gas to be used for storage injection and its subsequent sale at a later date. The gains or (losses) on the financial transactions that are economic hedges of the cost of the purchased natural gas are recognized prior to the gains or (losses) on the physical transaction, which are recognized in earnings when the natural gas is delivered. Therefore, mismatches between the timing of the recognition of realized gains or (losses) on the financial derivative instruments and gains or (losses) associated with the actual sale of the natural gas that is being economically hedged along with fair value changes in derivative instruments, creates volatility in the results of Energy Services, although the Company's intended economic results relating to the entire transaction are unaffected.
The following table presents the effect of derivative instruments recognized on the Unaudited Condensed Consolidated Statements of Operations for the periods set forth below:
| | | | | | | | | | | | | | | | | | | | | | | |
| (Thousands) | Location of gain (loss) recognized in income on derivatives | Amount of gain (loss) recognized
in income on derivatives |
| | Three Months Ended | Six Months Ended |
| | March 31, | March 31, |
| Derivatives not designated as hedging instruments: | 2021 | | 2020 | 2021 | | 2020 |
| Energy Services: | | | | | | | |
| Physical commodity contracts | Operating revenues | $ | 36,419 | | | $ | 12,096 | | $ | 41,671 | | | $ | 21,932 | |
| Physical commodity contracts | Natural gas purchases | 2,650 | | | (1,892) | | (2,404) | | | (3,302) | |
| Financial commodity contracts | Natural gas purchases | (27,315) | | | 23,319 | | 20,440 | | | 69,412 | |
| Foreign currency contracts | Natural gas purchases | 27 | | | (475) | | 227 | | | (360) | |
| | | | | | | |
| | | | | | | |
| Total unrealized and realized gains | $ | 11,781 | | | $ | 33,048 | | $ | 59,934 | | | $ | 87,682 | |
NJNG’s derivative contracts are part of the Company's risk management activities that relate to its natural gas purchases and BGSS incentive programs. At settlement, the resulting gains and/or losses are payable to or recoverable from utility customers and are deferred in regulatory assets or liabilities resulting in no impact to earnings. The following table reflects the (losses) gains associated with NJNG's derivative instruments for the periods set forth below:
| | | | | | | | | | | | | | | | | | | | |
| Three Months Ended | Six Months Ended |
| March 31, | March 31, |
| (Thousands) | 2021 | | 2020 | 2021 | | 2020 |
| Natural Gas Distribution: | | | | | | |
| Physical commodity contracts | $ | 1,091 | | | $ | 209 | | $ | 1,433 | | | $ | 1,049 | |
| Financial commodity contracts | 645 | | | (11,434) | | (3,627) | | | (12,522) | |
| Interest rate contracts | 0 | | | (6,692) | | 0 | | | (6,692) | |
| Total unrealized and realized losses | $ | 1,736 | | | $ | (17,917) | | $ | (2,194) | | | $ | (18,165) | |
NJR designates its treasury lock contracts as cash flow hedges, therefore, changes in fair value of the effective portion of the hedges are recorded in OCI and upon settlement of the contracts, realized gains and (losses) are reclassified from OCI to interest expense on the Consolidated Statements of Operations.
The following table reflects the effect of derivative instruments designated as cash flow hedges in OCI:
| | | | | | | | | | | | | | | | | | | |
| (Thousands) | Amount of Pre-tax Gain (Loss) Recognized in OCI on Derivatives | Location of Gain (Loss) Reclassified from OCI into Income | Amount of Pre-tax Gain (Loss) Reclassified from OCI into Income | |
| Three Months Ended | | Three Months Ended | | |
| March 31, | | March 31, | | |
| Derivatives in cash flow hedging relationships: | 2021 | 2020 | | 2021 | 2020 | | |
| Interest rate contracts | $ | 0 | | $ | (12,492) | | Interest expense | $ | (342) | | $ | 0 | | | |
| Six Months Ended | | Six Months Ended | | |
| March 31, | | March 31, | | |
| Derivatives in cash flow hedging relationships: | 2021 | 2020 | | 2021 | 2020 | | |
| Interest rate contracts | $ | 0 | | $ | (12,492) | | Interest expense | $ | (685) | | $ | 0 | | | |
New Jersey Resources Corporation
Part I
NOTES TO UNAUDITED CONDENSED CONSOLIDATED FINANCIAL STATEMENTS (Continued)
NJNG and Energy Services had the following outstanding long (short) derivatives as of:
| | | | | | | | | | | | | | | | | | | |
| | | | | Volume (Bcf) |
| | Transaction Type | | | March 31,
2021 | | September 30,
2020 |
| Natural Gas Distribution | | Futures | | | 22.1 | | | 23.7 | |
| | | | | | | |
| | | | | | | |
| | Physical Commodity | | | 16.6 | | | 6.0 | |
| | | | | | | |
| Energy Services | | Futures | | | (11.6) | | | (27.5) | |
| | Swaps | | | (0.8) | | | (1.8) | |
| | | | | | | |
| | Physical Commodity | | | 1.5 | | | 5.0 | |
| | | | | | | |
| | | | | | | |
| | | | | | | |
Not included in the above table are Energy Services' net notional amount of foreign currency transactions of approximately $42,000 as of March 31, 2021 and $5.1 million as of September 30, 2020 and 1,588,000 and 960,000 SRECs that were open as of March 31, 2021 and September 30, 2020, respectively.
Broker Margin
Futures exchanges have contract specific margin requirements that require the posting of cash or cash equivalents relating to traded contracts. Margin requirements consist of initial margin that is posted upon the initiation of a position, maintenance margin that is usually expressed as a percent of initial margin, and variation margin that fluctuates based on the daily marked-to-market relative to maintenance margin requirements. The Company maintains separate broker margin accounts for the Natural Gas Distribution and Energy Services segments. The balances are as follows:
| | | | | | | | | | | |
| (Thousands) | Balance Sheet Location | March 31,
2021 | September 30,
2020 |
| Natural Gas Distribution | Restricted broker margin accounts | $ | 4,190 | | $ | 13,525 | |
| | | |
| Energy Services | Restricted broker margin accounts | $ | 41,726 | | $ | 55,919 | |
| | | |
Wholesale Credit Risk
NJNG, Energy Services, Clean Energy Ventures and the Storage and Transportation segment are exposed to credit risk as a result of their sales/wholesale marketing activities. As a result of the inherent volatility in the prices of natural gas commodities, derivatives, SRECs, the market value of contractual positions with individual counterparties could exceed established credit limits or collateral provided by those counterparties. If a counterparty fails to perform the obligations under its contract then the Company could sustain a loss.
The Company monitors and manages the credit risk of its wholesale operations through credit policies and procedures that management believes reduce overall credit risk. These policies include a review and evaluation of current and prospective counterparties' financial statements and/or credit ratings, daily monitoring of counterparties' credit limits and exposure, daily communication with traders regarding credit status and the use of credit mitigation measures, such as collateral requirements and netting agreements. Examples of collateral include letters of credit and cash received for either prepayment or margin deposit. Collateral may be requested due to the Company's election not to extend credit or because exposure exceeds defined thresholds. Most of the Company's wholesale marketing contracts contain standard netting provisions. These contracts include those governed by ISDA and the NAESB. The netting provisions refer to payment netting, whereby receivables and payables with the same counterparty are offset and the resulting net amount is paid to the party to which it is due.
Internally-rated exposure applies to counterparties that are not rated by Fitch or Moody's. In these cases, the counterparty's or guarantor's financial statements are reviewed, and similar methodologies and ratios used by Fitch and/or Moody's are applied to arrive at a substitute rating. Gross credit exposure is defined as the unrealized fair value of physical and financial derivative commodity contracts, plus any outstanding wholesale receivable for the value of natural gas delivered and/or financial derivative commodity contract that has settled for which payment has not yet been received.
New Jersey Resources Corporation
Part I
NOTES TO UNAUDITED CONDENSED CONSOLIDATED FINANCIAL STATEMENTS (Continued)
The following is a summary of gross credit exposures grouped by investment and noninvestment grade counterparties, as of March 31, 2021. The amounts presented below have not been reduced by any collateral received or netting and exclude accounts receivable for NJNG retail natural gas sales and services and Clean Energy Ventures residential solar installations.
| | | | | | | | | | | |
| (Thousands) | Gross Credit Exposure |
| Investment grade | | $ | 128,585 | | |
| Noninvestment grade | | 9,471 | | |
| Internally rated investment grade | | 23,661 | | |
| Internally rated noninvestment grade | | 20,118 | | |
| Total | | $ | 181,835 | | |
Conversely, certain of NJNG's and Energy Services' derivative instruments are linked to agreements containing provisions that would require cash collateral payments from the Company if certain events occur. These provisions vary based upon the terms in individual counterparty agreements and can result in cash payments if NJNG's credit rating were to fall below its current level. Specifically, most, but not all, of these additional payments will be triggered if NJNG's debt is downgraded by the major credit agencies, regardless of investment grade status. In addition, some of these agreements include threshold amounts that would result in additional collateral payments if the values of derivative liabilities were to exceed the maximum values provided for in relevant counterparty agreements. Other provisions include payment features that are not specifically linked to ratings, but are based on certain financial metrics.
Collateral amounts associated with any of these conditions are determined based on a sliding scale and are contingent upon the degree to which the Company's credit rating and/or financial metrics deteriorate, and the extent to which liability amounts exceed applicable threshold limits. There were no derivative instruments with credit-risk-related contingent features that were in a liability position for which collateral is required as of March 31, 2021. These amounts differ from the respective net derivative liabilities reflected on the Unaudited Condensed Consolidated Balance Sheets because the agreements also include clauses, commonly known as “Rights of Offset,” that would permit the Company to offset its derivative assets against its derivative liabilities for determining additional collateral to be posted, as previously discussed.
6. FAIR VALUE
Fair Value of Assets and Liabilities
The fair value of cash and cash equivalents, accounts receivable, current loan receivables, accounts payable, commercial paper and borrowings under revolving credit facilities are estimated to equal their carrying amounts due to the short maturity of those instruments. Non-current loan receivables are recorded based on what the Company expects to receive, which approximates fair value, in other noncurrent assets on the Unaudited Condensed Consolidated Balance Sheets. The Company regularly evaluates the credit quality and collection profile of its customers to approximate fair value.
The estimated fair value of long-term debt, including current maturities, excluding finance leases, debt issuance costs and solar asset financing obligations, is as follows:
| | | | | | | | |
| (Thousands) | March 31,
2021 | September 30,
2020 |
Carrying value (1) (2) (3) | $ | 2,102,845 | | $ | 2,102,845 | |
| Fair market value | $ | 2,259,855 | | $ | 2,417,748 | |
(1)Excludes finance leases of $68.2 million and $74.2 million as of March 31, 2021 and September 30, 2020, respectively.
(2)Excludes NJNG's debt issuance costs of $9.4 million and $9.2 million as of March 31, 2021 and September 30, 2020, respectively.
(3)Excludes NJR's debt issuance costs of $3.3 million and $3.4 million as of March 31, 2021 and September 30, 2020, respectively.
Clean Energy Ventures enters into transactions to sell certain commercial solar assets and lease the assets back for a term specified in the lease. These transactions are considered financing obligations for accounting purposes and are recorded within long-term debt on the Unaudited Condensed Consolidated Balance Sheets. The estimated fair value of solar asset financing obligations as of March 31, 2021 and September 30, 2020 was $155.6 million and $149.2 million, respectively.
New Jersey Resources Corporation
Part I
NOTES TO UNAUDITED CONDENSED CONSOLIDATED FINANCIAL STATEMENTS (Continued)
The Company utilizes a discounted cash flow method to determine the fair value of its debt. Inputs include observable municipal and corporate yields, as appropriate for the maturity of the specific issue and the Company's credit rating. As of March 31, 2021, NJR discloses its debt within Level 2 of the fair value hierarchy.
Fair Value Hierarchy
NJR applies fair value measurement guidance to its financial assets and liabilities, as appropriate, which include financial derivatives and physical commodity contracts qualifying as derivatives, investments in equity securities and other financial assets and liabilities. In addition, authoritative accounting literature prescribes the use of a fair value hierarchy that prioritizes the inputs to valuation techniques used to measure fair value based on the source of the data used to develop the price inputs. The hierarchy gives the highest priority to unadjusted quoted prices in active markets for identical assets or liabilities and the lowest priority to inputs that are based on unobservable market data and include the following:
Level 1Unadjusted quoted prices for identical assets or liabilities in active markets. NJR's Level 1 assets and liabilities include exchange traded natural gas futures and options contracts, listed equities and money market funds. Exchange traded futures and options contracts include all energy contracts traded on the NYMEX, CME and ICE that NJR refers to internally as basis swaps, fixed swaps, futures and financial options that are cleared through a FCM.
Level 2Other significant observable inputs such as interest rates or price data, including both commodity and basis pricing that is observed either directly or indirectly from publications or pricing services. NJR's Level 2 assets and liabilities include over-the-counter physical forward commodity contracts and swap contracts, SREC forward sales or derivatives that are initially valued using observable quotes and are subsequently adjusted to include time value, credit risk or estimated transport pricing components for which no basis price is available. Level 2 financial derivatives consist of transactions with non-FCM counterparties (basis swaps, fixed swaps and/or options). NJNG's treasury lock is also considered Level 2 as valuation is based on quoted market interest and swap rates as inputs to the valuation model. Inputs are verifiable and do not require significant management judgment. For some physical commodity contracts the Company utilizes transportation tariff rates that are publicly available and that it considers to be observable inputs that are equivalent to market data received from an independent source. There are no significant judgments or adjustments applied to the transportation tariff inputs and no market perspective is required. Even if the transportation tariff input were considered to be a “model,” it would still be considered to be a Level 2 input as the data is:
•widely accepted and public;
•non-proprietary and sourced from an independent third party; and
•observable and published.
These additional adjustments are generally not considered to be significant to the ultimate recognized values.
Level 3Inputs derived from a significant amount of unobservable market data. These include NJR's best estimate of fair value and are derived primarily through the use of internal valuation methodologies.
New Jersey Resources Corporation
Part I
NOTES TO UNAUDITED CONDENSED CONSOLIDATED FINANCIAL STATEMENTS (Continued)
Assets and liabilities measured at fair value on a recurring basis are summarized as follows:
| | | | | | | | | | | | | | | | | | | | | | | | | | | | | | | | |
| Quoted Prices in Active Markets for Identical Assets | Significant Other Observable Inputs | Significant Unobservable Inputs | |
| (Thousands) | (Level 1) | (Level 2) | (Level 3) | Total |
| As of March 31, 2021: | | | | | | | | | | |
| Assets: | | | | | | | | | | |
| Physical commodity contracts | | $ | 0 | | | | $ | 5,209 | | | | $ | 0 | | | $ | 5,209 | |
| Financial commodity contracts | | 13,751 | | | | 193 | | | | 0 | | | 13,944 | |
| Financial commodity contracts - foreign exchange | | 0 | | | | 257 | | | | 0 | | | 257 | |
| | | | | | | | | | |
| | | | | | | | | | |
| Money market funds | | 50,368 | | | | 0 | | | | 0 | | | 50,368 | |
| Other | | 1,818 | | | | 0 | | | | 0 | | | 1,818 | |
| Total assets at fair value | | $ | 65,937 | | | | $ | 5,659 | | | | $ | 0 | | | $ | 71,596 | |
| Liabilities: | | | | | | | | | | |
| Physical commodity contracts | | $ | 0 | | | | $ | 36,506 | | | | $ | 0 | | | $ | 36,506 | |
| Financial commodity contracts | | 7,661 | | | | 0 | | | | 0 | | | 7,661 | |
| Financial commodity contracts - foreign exchange | | 0 | | | | 29 | | | | 0 | | | 29 | |
| | | | | | | | | | |
| Total liabilities at fair value | | $ | 7,661 | | | | $ | 36,535 | | | | $ | 0 | | | $ | 44,196 | |
| As of September 30, 2020: | | | | | | | | | | |
| Assets: | | | | | | | | | | |
| Physical commodity contracts | | $ | 0 | | | | $ | 7,796 | | | | $ | 0 | | | $ | 7,796 | |
| Financial commodity contracts | | 18,279 | | | | 500 | | | | 0 | | | 18,779 | |
| Financial commodity contracts - foreign exchange | | 0 | | | | 84 | | | | 0 | | | 84 | |
| | | | | | | | | | |
| Money market funds | | 112,291 | | | | 0 | | | | 0 | | | 112,291 | |
| Other | | 1,840 | | | | 0 | | | | 0 | | | 1,840 | |
| Total assets at fair value | | $ | 132,410 | | | | $ | 8,380 | | | | $ | 0 | | | $ | 140,790 | |
| Liabilities: | | | | | | | | | | |
| Physical commodity contracts | | $ | 0 | | | | $ | 32,517 | | | | $ | 0 | | | $ | 32,517 | |
| Financial commodity contracts | | 14,593 | | | | 0 | | | | 0 | | | 14,593 | |
| Financial commodity contracts - foreign exchange | | 0 | | | | 107 | | | | 0 | | | 107 | |
| Total liabilities at fair value | | $ | 14,593 | | | | $ | 32,624 | | | | $ | 0 | | | $ | 47,217 | |
7. INVESTMENTS IN EQUITY INVESTEES
NJR's investments in equity method investees include the following as of:
| | | | | | | | |
| (Thousands) | March 31,
2021 | September 30,
2020 |
Steckman Ridge (1) | $ | 111,435 | | $ | 112,378 | |
PennEast (2) | 103,086 | | 95,997 | |
| Total | $ | 214,521 | | $ | 208,375 | |
(1)Includes loans with a total outstanding principal balance of $70.4 million for both March 31, 2021 and September 30, 2020, which accrue interest at a variable rate that resets quarterly and are due October 1, 2023.
(2)Includes a deferred tax component related to AFUDC equity of $7.6 million and $4.6 million for March 31, 2021 and September 30, 2020, respectively.
Steckman Ridge
The Company holds a 50 percent equity method investment in Steckman Ridge, a jointly owned and controlled natural gas storage facility located in Bedford County, Pennsylvania. Due to the expiration of a customer contract in October 2020, the Company evaluated its investment in Steckman Ridge for other-than-temporary impairment and determined an impairment charge was not necessary.
New Jersey Resources Corporation
Part I
NOTES TO UNAUDITED CONDENSED CONSOLIDATED FINANCIAL STATEMENTS (Continued)
The fair value of the Company’s investment in Steckman Ridge was determined using a discounted cash flow method and utilized management’s best estimates and assumptions related to expected future results, including the price and capacity of firm natural gas storage contracting, operations and maintenance costs, the nature and timing of major maintenance and capital investment, and discount rates. Fair value determinations require considerable judgment and are sensitive to changes in underlying assumptions and other factors. As a result, it is reasonably possible that unfavorable developments, such as the failure to execute storage contracts and other services for available capacity at anticipated price levels could result in an other-than temporary impairment charge in the Unaudited Condensed Consolidated Financial Statements.
PennEast
The Company, through its subsidiary NJR Pipeline Company, is a 20 percent investor in PennEast, a partnership whose purpose is to construct and operate a 120-mile natural gas pipeline that will extend from northeast Pennsylvania to western New Jersey. PennEast received a Certificate of Public Convenience and Necessity for the project from FERC on January 19, 2018.
On September 10, 2019, the Third Circuit issued an order overturning the United States District Court for the District of New Jersey’s order granting PennEast condemnation and immediate access in accordance with the Natural Gas Act to certain properties in which the State of New Jersey holds an interest. A Petition for Rehearing was denied by the Third Circuit on November 5, 2019.
On October 8, 2019, the NJDEP issued a letter indicating that it deemed PennEast’s freshwater wetlands permit application to be administratively incomplete and closed the matter without prejudice. On October 11, 2019, PennEast submitted a letter to the NJDEP objecting to its position that the application is administratively incomplete. PennEast's objections were rejected by the NJDEP on November 18, 2019.
On October 4, 2019, PennEast filed a petition for Declaratory Order with FERC requesting an interpretation of the eminent domain authority of a FERC certificate holder under the Natural Gas Act. The Declaratory Order was granted on January 30, 2020.
On January 30, 2020, PennEast filed an amendment with FERC to construct the PennEast pipeline in 2 phases. Phase one consists of construction of a 68-mile pipeline in Pennsylvania from the eastern Marcellus Shale region in Luzerne County that would terminate in Northampton County. Phase two includes construction of the remaining original certificated route in Pennsylvania and New Jersey. Construction is expected to begin following approval by FERC of the phased approach and receipt of any remaining governmental and regulatory permits.
On February 18, 2020, PennEast filed a writ of certiorari with the Supreme Court of the United States to review the September 10, 2019 Third Circuit decision.
On June 29, 2020, the Supreme Court requested that the Solicitor General of the United States file a brief that expresses the views on the question of the use of eminent domain to acquire state owned lands for pipeline construction. The Solicitor General filed its brief with the Supreme Court on December 9, 2020.
The State of New Jersey filed a brief with the Supreme Court on December 23, 2020 in response to the brief of the Solicitor General.
On February 3, 2021, the Supreme Court granted the petition for a writ of certiorari. The matter was argued before the Supreme Court on April 28, 2021.
The Company evaluated its investment in PennEast for an other-than-temporary impairment and determined an impairment charge was not necessary. It is reasonably possible that future unfavorable developments, such as a reduced likelihood of success from development options and legal outcomes, estimated increases in construction costs, increases in the discount rate, or further significant delays, could result in an impairment of the Company's equity method investment. Also, the use of alternate judgments and assumptions could result in a different calculation of fair value, which could ultimately result in the recognition of an impairment charge.
New Jersey Resources Corporation
Part I
NOTES TO UNAUDITED CONDENSED CONSOLIDATED FINANCIAL STATEMENTS (Continued)
8. EARNINGS PER SHARE
The following table presents the calculation of the Company's basic and diluted earnings per share for:
| | | | | | | | | | | | | | |
| Three Months Ended | Six Months Ended |
| March 31, | March 31, |
| (Thousands, except per share amounts) | 2021 | 2020 | 2021 | 2020 |
| Net income, as reported | $ | 149,809 | | $ | 73,846 | | $ | 230,854 | | $ | 149,598 | |
| Basic earnings per share | | | | |
| Weighted average shares of common stock outstanding-basic | 96,248 | | 95,584 | | 96,181 | | 93,747 | |
| Basic earnings per common share | $1.56 | $0.78 | $2.40 | $1.60 |
| Diluted earnings per share | | | | |
| Weighted average shares of common stock outstanding-basic | 96,248 | | 95,584 | | 96,181 | | 93,747 | |
| | | | |
Equity forward sale agreement (1) | 0 | | 0 | | 0 | | 4 | |
Other (2) | 370 | | 306 | | 417 | | 322 | |
| Weighted average shares of common stock outstanding-diluted | 96,618 | | 95,890 | | 96,598 | | 94,073 | |
Diluted earnings per common share (3) | $1.55 | $0.77 | $2.39 | $1.59 |
(1)See Note 14. Common Stock Equity for details regarding the forward sale agreement.
(2)Consist primarily of unvested stock awards and performance shares.
(3)There were anti-dilutive shares of 24,101 and 30,708 excluded from the calculation of diluted earnings per share related to the equity forward sale agreement during the three months ended March 31, 2021 and 2020. There were anti-dilutive shares of 65,334 excluded from the calculation of diluted earnings per share related to the equity forward sale agreement during the six months ended March 31, 2021. There were 0 anti-dilutive shares excluded during the six months ended March 31, 2020.
9. DEBT
NJR and NJNG finance working capital requirements and capital expenditures through various short-term debt and long-term financing arrangements, including a commercial paper program and committed unsecured credit facilities.
Credit Facilities
A summary of NJR's credit facility and NJNG's commercial paper program and credit facility are as follows:
| | | | | | | | | | | | | | | | | |
| (Thousands) | March 31,
2021 | | September 30,
2020 | | Expiration Dates |
| NJR | | | | | |
Bank revolving credit facilities (1) | $ | 425,000 | | | $ | 425,000 | | | December 2023 |
| Notes outstanding at end of period | $ | 8,500 | | | $ | 125,350 | | | |
| Weighted average interest rate at end of period | 1.75 | % | | 1.49 | % | | |
Amount available at end of period (2) | $ | 406,206 | | | $ | 289,356 | | | |
Bank revolving credit facilities (1) | $ | 0 | | | $ | 250,000 | | | |
| Notes outstanding at end of period | $ | 0 | | | $ | 0 | | | |
| Weighted average interest rate at end of period | 0 | % | | 0 | % | | |
Amount available at end of period (2) | $ | 0 | | | $ | 250,000 | | | |
| NJNG | | | | | |
Bank revolving credit facilities (3) | $ | 250,000 | | | $ | 250,000 | | | December 2023 |
| Commercial paper outstanding at end of period | $ | 0 | | | $ | 0 | | | |
| Weighted average interest rate at end of period | 0 | % | | 0 | % | | |
Amount available at end of period (4) | $ | 249,269 | | | $ | 249,269 | | | |
(1)Committed credit facilities, which require commitment fees of 0.075 percent on the unused amounts.
(2)Letters of credit outstanding total $10.3 million for both March 31, 2021 and September 30, 2020, which reduces amount available by the same amount.
(3)Committed credit facilities, which require commitment fees of 0.075 percent on the unused amounts.
(4)Letters of credit outstanding total $731,000 for both March 31, 2021 and September 30, 2020, which reduces the amount available by the same amount.
New Jersey Resources Corporation
Part I
NOTES TO UNAUDITED CONDENSED CONSOLIDATED FINANCIAL STATEMENTS (Continued)
On April 24, 2020, NJR entered into a 364-day $250 million revolving credit facility with an interest rate based on LIBOR plus 1.625 percent. After six months, all outstanding amounts under the credit facility would convert to a term loan and would be due on April 23, 2021. In connection with entry into this credit facility, all outstanding borrowings under NJR's December 13, 2019, $150 million revolving line of credit facility were repaid. On October 24, 2020, there was 0 balance outstanding on the $250 million credit facility. As a result, the credit facility was considered terminated.
Amounts available under credit facilities are reduced by bank or commercial paper borrowings, as applicable, and any outstanding letters of credit. Neither NJNG nor the results of its operations are obligated or pledged to support the NJR credit or debt shelf facilities.
Long-term Debt
NJNG
NJNG received $4.0 million in December 2019, in connection with the sale-leasebacksale leaseback of three commercial solar projects. its natural gas meters. NJNG records a capital lease obligation that is paid over the term of the lease and has the option to purchase the meters back at fair value upon expiration of the lease. NJNG exercised early purchase options with respect to certain outstanding meter leases by making final principal payments of $1.2 million for both the six months ended March 31, 2021 and 2020. There were no natural gas meter sale leasebacks recorded during the six months ended March 31, 2021.
Clean Energy Ventures did 0t receive proceeds related to the sale-leaseback of commercial solar assets during the nine months ended June 30, 2019.
Clean Energy Ventures enters into transactions to sell the commercial solar assets concurrent with agreements to lease the assets back over a period of five to 15 years. These transactions are considered failed sale-leasebackssale leasebacks for accounting purposes and are therefore treated as financing obligations, which are typically secured by the renewable energy facility asset and its future cash flows from SREC, TRECs and energy sales. ITCs and other tax benefits associated with these solar projects are transferred to the buyer, if applicable. Clean Energy Ventures continues to operate the solar assets, including related expenses, and retain the revenue generated from SRECs and energy sales, and has the option to renew the lease or repurchase the assets sold at the end of the lease term.
In December 2020, Clean Energy Ventures received proceeds of $12.1 million in connection with the sale leaseback of two commercial solar projects. Clean Energy Ventures did 0t receive proceeds related to the sale leaseback of commercial solar assets during the six months ended March 31, 2020.
10. EMPLOYEE BENEFIT PLANS
Pension and Other Postemployment Benefit Plans
The components of the net periodic cost for pension benefits, including the Company's Pension Equalization Plan, and OPEB costs (principally health care and life insurance) for employees and covered dependents were as follows:
| | | | | | | | | | | | | | | | | | | | | | | | | | |
| Pension | OPEB |
| Three Months Ended | Six Months Ended | Three Months Ended | Six Months Ended |
| March 31, | March 31, | March 31, | March 31, |
| (Thousands) | 2021 | 2020 | 2021 | 2020 | 2021 | 2020 | 2021 | 2020 |
| Service cost | $ | 2,183 | | $ | 2,055 | | $ | 4,365 | | $ | 4,111 | | $ | 1,211 | | $ | 1,072 | | $ | 2,422 | | $ | 2,427 | |
| Interest cost | 2,278 | | 2,646 | | 4,556 | | 5,293 | | 1,517 | | 1,509 | | 3,035 | | 3,513 | |
| Expected return on plan assets | (4,851) | | (5,232) | | (10,075) | | (10,289) | | (1,565) | | (1,695) | | (3,248) | | (3,255) | |
| Recognized actuarial loss | 2,861 | | 2,466 | | 5,723 | | 5,212 | | 1,978 | | 930 | | 3,955 | | 3,721 | |
| Prior service cost (credit) amortization | 26 | | 26 | | 51 | | 51 | | (45) | | (50) | | (90) | | (99) | |
| | | | | | | | |
| Net periodic benefit cost | $ | 2,497 | | $ | 1,961 | | $ | 4,620 | | $ | 4,378 | | $ | 3,096 | | $ | 1,766 | | $ | 6,074 | | $ | 6,307 | |
|
| | | | | | | | | | | | | | | | | | | | | | | | |
| | Pension | OPEB |
| | Three Months Ended | Nine Months Ended | Three Months Ended | Nine Months Ended |
| | June 30, | June 30, | June 30, | June 30, |
| (Thousands) | 2020 | 2019 | 2020 | 2019 | 2020 | 2019 | 2020 | 2019 |
| Service cost | $ | 2,056 |
| $ | 1,845 |
| $ | 6,167 |
| $ | 5,536 |
| $ | 1,213 |
| $ | 1,101 |
| $ | 3,640 |
| $ | 3,303 |
|
| Interest cost | 2,647 |
| 3,043 |
| 7,940 |
| 9,129 |
| 1,757 |
| 2,081 |
| 5,270 |
| 6,243 |
|
| Expected return on plan assets | (5,145 | ) | (4,763 | ) | (15,434 | ) | (14,290 | ) | (1,628 | ) | (1,379 | ) | (4,883 | ) | (4,137 | ) |
| Recognized actuarial loss | 2,606 |
| 1,442 |
| 7,818 |
| 4,324 |
| 1,861 |
| 1,617 |
| 5,582 |
| 4,850 |
|
| Prior service cost amortization | 25 |
| 25 |
| 76 |
| 76 |
| (49 | ) | (91 | ) | (148 | ) | (273 | ) |
| Net periodic benefit cost | $ | 2,189 |
| $ | 1,592 |
| $ | 6,567 |
| $ | 4,775 |
| $ | 3,154 |
| $ | 3,329 |
| $ | 9,461 |
| $ | 9,986 |
|
New Jersey Resources Corporation
Part I
NOTES TO UNAUDITED CONDENSED CONSOLIDATED FINANCIAL STATEMENTS (Continued)
The Company does not expect to be required to make additional contributions to fund the pension plans during fiscal 2020 or 2021 based on current actuarial assumptions; however, funding requirements are uncertain and can depend significantly on changes in actuarial assumptions, returns on plan assets and changes in the demographics of eligible employees and covered dependents. In addition, as in the past, the Company may elect to make contributions in excess of the minimum required amount to the plans. There were 0 discretionary contributions made during the ninesix months ended June 30, 2020March 31, 2021 and 2019.2020.
There are no federal requirements to pre-fund OPEB benefits. However, the Company is required to fund certain amounts due to regulatory agreements with the BPU and estimates that it will contribute between $5 million and $10 million over each of the next five years. Additional contributions may be required based on market conditions and changes to assumptions.
New Jersey Resources Corporation
Part I
NOTES TO UNAUDITED CONDENSED CONSOLIDATED FINANCIAL STATEMENTS (Continued)
The Company's OPEB liability was revalued for changes related to the Affordable Care Act-mandated excise tax applicable to high-cost health plans, commonly known as the Cadillac Tax. The Company applied a practical expedient to remeasure the plan assets and obligations as of December 31, 2019, which was the nearest calendar month-end date. The impact of the revaluation of the OPEB liability was recorded as of January 1, 2020.
11. INCOME TAXES
ASC Topic 740, Income Taxes requires the use of an estimated annual effective tax rate for purposes of determining the income tax provision during interim reporting periods. In calculating its estimated annual effective tax rate, NJR considers forecasted annual pre-tax income and estimated permanent book versus tax differences, as well as investment tax credits associated with solar asset investment. For investment tax credits, the estimate is based on solar projects that are probable of being completed and placed in service during the current fiscal year based on the best information available at each reporting period.differences. Adjustments to the effective tax rate and management's estimates will occur as information and assumptions change.
Changes in tax laws or tax rates are recognized in the financial reporting period that includes the enactment date, the date in which the act is signed into law.
In May 2019, the Company received a favorable ruling from the IRS regarding a change to its tax method of accounting for the capitalization of certain costs associated with self-constructed property placed in service during fiscal years prior to September 30, 2016. The self-constructed property to which these costs relate is considered qualified energy property as defined under the Internal Revenue Code. As such, the Company is eligible to claim a 30 percent ITC on the increase in the depreciable cost basis of the property through the filing of an amended tax return in the year of change. As a result of the favorable IRS ruling, in June 2019, the Company recorded a benefit from income taxes of approximately $10 million from the additional ITC recognized, net of deferred taxes.
NJR evaluates its tax positions to determine the appropriate accounting and recognition of potential future obligations associated with unrecognized tax benefits. A tax benefit claimed, or expected to be claimed, on a tax return may be recognized if it is more likely than not that the position will be upheld upon examination by the applicable taxing authority. Interest and penalties related to unrecognized tax benefits, if any, are recognized within income tax expense and accrued interest, and penalties are recognized within other noncurrent liabilities on the Unaudited Condensed Consolidated Balance Sheets.
As of June 30, 2020,The Company evaluates certain tax benefits that have been recorded in the financial statements for uncertainties. During fiscal 2019 the Company had a reserve of $4.9 million forconcluded that a portion of tax benefits that arewere uncertain at this time, which istime. As a result, the Company recorded a reserve that was included in deferred incomeaccrued taxes on the Unaudited Condensed Consolidated Balance Sheets. During fiscal 2021, a tax audit was completed and the positions that the prior tax reserves related to are now considered effectively settled and the tax reserve has been released. As a result of the change in the Company's method of accounting for ITCs from the flow through method to the deferral method, which was effective October 1, 2020, the settlement of the reserve was recorded as an adjustment to nonutility plant and equipment, at cost on the Unaudited Condensed Consolidated Balance Sheets.
The reserve for uncertain tax benefits is as follows:
| | | | | | | | | |
| (Thousands) | March 31,
2021 | September 30,
2020 | |
| Balance at October 1, | $ | 4,930 | | $ | 4,930 | | |
| Settlements | (4,930) | | 0 | | |
| Balance at period end | $ | 0 | | $ | 4,930 | | |
The tax benefits relaterelated to fiscal tax years open to examination by the IRS and may be subject to subsequent adjustment.adjustments.
On March 27, 2020, the President of the U.S. signed the CARES Act, which is aimed at providing emergency assistance and health care for individuals, families, and businesses affected by the COVID-19 pandemic and generally supporting the U.S. economy. The CARES Act, among other things, includes several business tax provisions which include, but are not limited to modifications of federal net operating loss carrybacks and deductibility, changes to prior year refundable alternative minimum tax liabilities, increase of limitations on business interest deductions from 30 percent to 50 percent of earnings before interest, taxes, depreciation, and amortization, technical corrections of the classification of qualified improvement property making them eligible for bonus depreciation, increase of the limits on charitable contribution deductions from 10 percent to 25 percent of adjusted taxable income, modifications of the treatment of federal loans, loan guarantees, and other investments, suspension of industry specific excise taxes, deferral of the company portion of OASDI, and implementation of a refundable employee retention tax credit.
The CARES Act provides for the delay in the required deposit of the employer portion of the OASDI payroll tax from the date of enactment through the end of 2020. Of the taxes that the Company can defer, 50 percent of the deferred taxes are required to be deposited by the end of 2021 and the remaining 50 percent are required to be deposited by the end of 2022. Additionally, The CARES Act provides a refundable tax credit, the employee retention tax credit, to certain employers who are ordered by a competent governmental authority to suspend or reduce business operations due to concern about the spread of COVID-19 or suffered a significant decline in the business during a calendar quarter during 2020 compared to the same calendar quarter during the previous year. As of JuneMarch 31, 2021 and September 30, 2019, there were 0 reserves associated with uncertain2020, the Company deferred $5.1 million and $3.1 million, respectively, related to the employer portion of the OASDI tax.
New Jersey Resources Corporation
Part I
NOTES TO UNAUDITED CONDENSED CONSOLIDATED FINANCIAL STATEMENTS (Continued)
On March 11, 2021, the President of the U.S. signed the American Rescue Plan Act of 2021, which is primarily an economic stimulus package. It also expanded the scope of Section 162(m) of the Internal Revenue Code, which imposes a $1 million deduction limit on compensation paid to covered employees from the top five officers to include the additional top five highest paid employees for tax positions.years beginning after December 31, 2026.
Effective Tax Rate
The forecasted effective tax rates were (1.2)19.9 percent and (4.6)19.4 percent, for the ninesix months ended June 30, 2020March 31, 2021 and 2019,2020, respectively. The increase in the effective tax rate, when compared with the prior fiscal year, is due primarily to a combination of an increase in forecasted pre-tax income and a decrease in forecasted tax credits for the fiscal year ending September 30, 2020. Forecasted tax credits, net of deferred income taxes, were $37.5 million and $46.3 million for fiscal 2020 and 2019, respectively.
New Jersey Resources Corporation
Part I
NOTES TO UNAUDITED CONDENSED CONSOLIDATED FINANCIAL STATEMENTS (Continued)
To the extent there are discrete tax items that are not included in the forecasted effective tax rate, the actual effective tax rate willmay differ from the estimated annual effective tax rate. During the ninesix months ended June 30, 2020 and 2019,March 31, 2021, discrete items totaled $2.3$(145,000) related to excess tax expense associated with the vesting of share-based awards. During the six months ended March 31, 2020, discrete items totaled $2.7 million and $5.4 million, respectively, related to a revaluation of certain state deferred tax assets and liabilities as a result of a change in the New Jersey state apportionment factor and excess tax benefits associated with the vesting of share-based awards. NJR’s actual effective tax rate was (2.8)19.7 percent and (8.5)18.0 percent during the ninesix months ended June 30, 2020 and 2019, respectively.
CARES Act
On March 27, 2020, the President of the United States signed the CARES Act, which is aimed at providing emergency assistance and health care for individuals, families, and businesses affected by the COVID-19 pandemic and generally supporting the U.S. economy. The CARES Act, among other things, includes several business tax provisions which include, but are not limited to modifications of federal net operating loss carrybacks and deductibility, changes to prior year refundable alternative minimum tax liabilities, increase of limitations on business interest deductions from 30 percent to 50 percent of earnings before interest, taxes, depreciation, and amortization, technical corrections of the classification of qualified improvement property making them eligible for bonus depreciation, increase of the limits on charitable contribution deductions from 10 percent to 25 percent of adjusted taxable income, modifications of the treatment of federal loans, loan guarantees, and other investments, suspension of industry specific excise taxes, deferral of the company portion of OASDI, and implementation of a refundable employee retention tax credit.
The CARES Act provides for the delay in the required deposit of the employer portion of the OASDI payroll tax from the date of enactment through the end of 2020. Of the taxes that the Company can defer, 50 percent of the deferred taxes are required to be deposited by the end of31, 2021 and the remaining 50 percent are required to be deposited by the end of 2022. Additionally, The CARES Act provides a refundable tax credit, the employee retention tax credit, to certain employers who are ordered by a competent governmental authority to suspend or reduce business operations due to concern about the spread of COVID-19 or suffered a significant decline in the business during a calendar quarter during 2020, compared to the same calendar quarter during the previous year. As of June 30, 2020, the Company deferred $1.3 million related to the employer portion of the OASDI tax. The Company is currently investigating the applicability of the Employee Retention Tax credit.respectively.
Other Tax Items
As of June 30, 2020March 31, 2021 and September 30, 2019,2020, the Company had ITC carryforwards of approximately $184.7 million and $154.2 million, respectively, which each have a life of 20 years. When the Company carries back the federal net operating losses noted below, it expects to recapture investment tax credits totaling $24.1 million. These recaptured tax credits are in addition to the $184.7 million noted above and will be carried forward to offset future taxable income. The Company expects to utilize this entire carryforward, which would begin to expire in fiscal 2034.
The Company hadhas federal income tax net operating losses of approximately $134 million as of June 30, 2020 and September 30, 2019, respectively.$134.0 million. Federal net operating losses incurred before the implementation of the Tax Act can generally be carried back two years and forward 20 years and will begin to expire in fiscal 2036, with the remainder expiring by 2038. The Company expects to exercise its ability to carryback federal net operating losses to offset taxable income in prior periods.
For the net operating losses it expects to carryback, the Company estimated the portion considered refundable and recorded receivables of approximately $22.8 million for both June 30, 2020as of March 31, 2021 and September 30, 2019,2020, as a component of other noncurrent assets on the Unaudited Condensed Consolidated Balance Sheets. Upon filing amended federal income tax returns to carryback its remaining federal net operating losses the Company will recapture tax credits totaling $24.1 million, the Company will reduce its taxable income in those periods and recapture federal investment tax creditsITCs of the same amount that were previously utilized to offset taxable income.
In addition, as of March 31, 2021 and September 30, 2020, the Company has tax credit carryforwards of approximately $193.2 million and $195.2 million, respectively, which each have a life of 20 years. When the Company carries back the federal net operating losses noted above, it expects to recapture investment tax credits totaling $24.1 million. These recaptured tax credits are in addition to the $193.2 million and will be carried forward to offset future taxable income. The Company hadexpects to utilize this entire carryforward prior to expiration, which would begin in fiscal 2034.
As of March 31, 2021 and September 30, 2020, the Company has state income tax net operating losses of approximately $489.7$442.4 million and $340.2$487.7 million, for June 30, 2020 and September 30, 2019, respectively. These state net operating losses have varying carry-forward periods dictated by the state in which they were incurred. Theseincurred; these state carry forwardcarry-forward periods range from seven to 20 years and would begin to expire in fiscal 2021, with the majority expiring after 2035. The Company expects to utilize this entire carryforward, other than as described below.
New Jersey Resources Corporation
Part I
NOTES TO UNAUDITED CONDENSED CONSOLIDATED FINANCIAL STATEMENTS (Continued)
In February 2019, Clean Energy Ventures finalizedAs of March 31, 2021 and September 30, 2020, the sale of its remaining wind assets. As a result of the sale, it is more likely than not that a portion of certain state net operating loss carryforwards will not be realizable prior to their expiration. The Company hadhas a valuation allowance of $1.8$17.6 million, and $4 million for June 30, 2020 and September 30, 2019, respectively,which is primarily related to the recognition of state net operating loss carryforwards in Montana, Iowa and Kansas. The remaining state income tax net operating losses are expected to be utilized prior to expiration.New Jersey.
12. LEASES
As a result of changes to filing requirements in the State of New Jersey that require tax returns filed for periods ending on or after July 31, 2019 be filed on a combined basis when part of an affiliated group, the Company recorded a benefit from income taxes of approximately $15.3 million during the nine months ended June 30, 2020, resulting from the re-measurement of deferred income tax attributes. The Company also evaluated its New Jersey state net operating loss carryforwards on a post-apportionment basis and determined it is more likely than not that a portion of these net operating loss carryforwards may not be realizable prior to their expiration. As a result, the Company recorded a valuation allowance associated with New Jersey state net operating loss carryforwards of approximately $13.6 million as of June 30, 2020.
The Consolidated Appropriations Act extended the 30 percent ITC for solar property that is under construction on or before December 31, 2019. The credit will decline to 26 percent for property under construction during 2020 and to 22 percent for property under construction during 2021. For any property that is under construction before 2022, but not placed in service before 2024, the ITC will be reduced to 10 percent. Projects placed in service after December 31, 2019, may also qualify for a 30 percent federal ITC if five percent or more of the total costs of a solar property are incurred before the end of the applicable year and there are continuous efforts to advance towards completion of the project, based on the IRS guidance around ITC safe harbor determination. The Company has taken steps to preserve the current ITC rates for solar projects that are completed after the scheduled reduction in rates, in accordance with IRS guidance.
As of June 30, 2020, the IRS has an open examination of the Company's federal income tax return for fiscal 2016. All periods subsequent to those ended September 30, 2014, are statutorily open for both state and federal examinations.
12. LEASES
Lessee Accounting
The Company determines if an arrangement is a lease at inception based on whether the Company has the right to control the use of an identified asset, the right to obtain substantially all of the economic benefits from the use of the asset and the right to direct the use of the asset and accounts for leases in accordance with ASC 842, Leases. Right-of-use assets represent the Company’s right to use the underlying asset for the lease term and lease liabilities represent the Company's obligation to make lease payments arising from the lease. Right-of-use assets and liabilities are recognized at the lease commencement date based on the present value of lease payments over the lease term, including payments at commencement that depend on an index or rate. Most leases in which the Company is the lessee do not have a readily determinable implicit rate, so an incremental borrowing rate, based on the information available at the lease commencement date, is utilized to determine the present value of lease payments. When a secured borrowing rate is not readily available, unsecured borrowing rates are adjusted for the effects of collateral to determine the incremental borrowing rate. The Company uses the implicit rate for agreements in which it is a lessor. The Company has not entered into any material agreements in which it is a lessor. Lease expense and lease income are recognized on a straight-line basis over the lease term for operating leases. For more information on the adoption of ASC 842, Leases, see Note 2. Summary of Significant Accounting Policies.
New Jersey Resources Corporation
Part I
NOTES TO UNAUDITED CONDENSED CONSOLIDATED FINANCIAL STATEMENTS (Continued)
The Company’s lease agreements primarily consist of commercial solar land leases, storage and capacity leases, equipment and real property, including land and office facilities, office equipment and the sale-leasebacksale leaseback of its natural gas meters.
Certain leases contain escalation provisions for inflation metrics. The storage leases contain a variable payment component that relates to the change in the inflation metrics that are not known past the current payment period. TheseThe variable components of these lease payments are excluded from the lease payments that are used to determine the related right-of-use lease asset and liability. The variable portion of these leases are recognized as leasing expenses when they are incurred. The capacity lease payments are fully variable and based on the amount of natural gas stored in the storage caverns.
Generally, the Company’s solar land leases terms are between 15 and 2535 years and may include multiple options to extend the terms for multiplean additional 5five to 10 year terms each.years. The Company’s office leases vary in duration, ranging from 1one to 25 years and may or may not include extension or early purchase options. The majority of the Company’s meter leases are for terms of 7seven years with
New Jersey Resources Corporation
Part I
NOTES TO UNAUDITED CONDENSED CONSOLIDATED FINANCIAL STATEMENTS (Continued)
purchase options available prior to the end of the 7seven year term. Equipment leases include general office equipment that also vary in duration, most of which are for a term of 5five years. The Company's storage and capacity leases have assumed terms of 50 years to coincide with the expected useful lives of the cavern assets with which the leases are associated. The Company's lease terms may include options to extend, purchase the leased asset or terminate a lease and they are included in the lease liability calculation when it is reasonably certain that those options will be exercised. The Company has elected an accounting policy that exempts leases with an original term of one year or less from the recognition requirements of ASC 842, Leases.
The Company has lease agreements with lease and non-lease components and has elected the practical expedient to combine lease and non-lease components for certain classes of leases, such as office buildings, solar land leases and office equipment. Variable payments are not significantconsidered material to the Company. The Company’s lease agreements do not contain any material residual value guarantees, material restrictions or material covenants. There are no material lease transactions with related parties.
The following table presents the Company's lease costs included in the Unaudited Condensed Consolidated Statements of Operations:
| | | | | | | | | | | | | | | | | | | |
| | Three Months Ended | Six Months Ended |
| | March 31, | March 31, |
| (Thousands) | Income Statement Location | 2021 | 2020 | 2021 | 2020 | | |
Operating lease cost (1) | Operation and maintenance | $ | 1,356 | | 1,719 | | 3,445 | | 3,111 | | | |
| Finance lease cost | | | | | | | |
| Amortization of right-of-use assets | Depreciation and amortization | $ | 1,191 | | $ | 1,299 | | $ | 2,437 | | $ | 2,460 | | | |
| Interest on lease liabilities | Interest expense, net of capitalized interest | 113 | | 301 | | 334 | | 548 | | | |
| Total finance lease cost | | 1,304 | | 1,600 | | 2,771 | | 3,008 | | | |
| Short-term lease cost | Operation and maintenance | 127 | | 172 | | 254 | | 626 | | | |
| Variable lease cost | Operation and maintenance | 549 | | 403 | | 702 | | 1,110 | | | |
| Total lease cost | | $ | 3,336 | | $ | 3,894 | | $ | 7,172 | | $ | 7,855 | | | |
|
| | | | | | | |
| | | Three Months Ended | Nine Months Ended |
| | | June 30, | June 30, |
| (Thousands) | Income Statement Location | 2020 | 2020 |
| Finance lease cost | | | |
| Amortization of right-of-use assets | Depreciation and amortization | $ | 1,274 |
| $ | 3,734 |
|
| Interest on lease liabilities | Interest expense, net of capitalized interest | 248 |
| 796 |
|
| Total finance lease cost | | 1,522 |
| 4,530 |
|
| Operating lease cost | Operation and maintenance, net of capitalized costs | $ | 1,650 |
| $ | 4,761 |
|
| Short-term lease cost | Operation and maintenance | 95 |
| 721 |
|
| Variable lease cost | Operation and maintenance | 597 |
| 1,707 |
|
| Total lease cost | | $ | 3,864 |
| $ | 11,719 |
|
The following table presents supplemental cash flow information related to leases:
| | | | | | | | | | |
| Six Months Ended |
| March 31, |
| (Thousands) | 2021 | 2020 | | |
| Cash paid for amounts included in the measurement of lease liabilities | | | | |
| Operating cash flows for operating leases | $ | 2,932 | | $ | 2,856 | | | |
| Operating cash flows for finance leases | $ | 791 | | $ | 704 | | | |
| Financing cash flows for finance leases | $ | 5,690 | | $ | 4,038 | | | |
|
| | | |
| | Nine Months Ended |
| | June 30, |
| (Thousands) | 2020 |
| Cash paid for amounts included in the measurement of lease liabilities | |
| Operating cash flows from operating leases | $ | 4,133 |
|
| Operating cash flows from finance leases | $ | 952 |
|
| Financing cash flows from finance leases | $ | 5,505 |
|
Assets obtained or modified through amendments in exchange for operating lease liabilities totaled $5.7 million and $12.4 million during the three and nine months ended June 30,March 31, 2021 and 2020, were $270,000respectively, and $34.2totaled $13.3 million and $34.0 million during the six months ended March 31, 2021 and 2020, respectively. Assets obtained or modified through amendments in exchange for finance lease liabilities totaled $45.7 million and $49.7 million during the ninethree and six months ended June 30,March 31, 2020, were $49.7 million.respectively. There were 0 assets obtained or modified through amendments in exchange for finance lease liabilities during the three and six months ended June 30, 2020.March 31, 2021.
New Jersey Resources Corporation
Part I
NOTES TO UNAUDITED CONDENSED CONSOLIDATED FINANCIAL STATEMENTS (Continued)
The following table presents the balance and classifications of ourthe Company's right of use assets and lease liabilities included in the Unaudited Condensed Consolidated Balance Sheets:
| | | | | | | | | | | | |
| (Thousands) | Balance Sheet Location | March 31,
2021 | September 30,
2020 | |
| Assets | | | | |
| Noncurrent | | | | |
| Operating lease assets | Operating lease assets | $ | 144,326 | | $ | 131,769 | | |
| Finance lease assets | Utility plant | 61,432 | | 71,085 | | |
| Total lease assets | | $ | 205,758 | | $ | 202,854 | | |
| Liabilities | | | | |
| Current | | | | |
| Operating lease liabilities | Operating lease liabilities | $ | 4,001 | | $ | 6,724 | | |
| Finance lease liabilities | Current maturities of long-term debt | 5,855 | | 10,416 | | |
| Noncurrent | | | | |
| Operating lease liabilities | Operating lease liabilities | 111,034 | | 95,030 | | |
| Finance lease liabilities | Long-term debt | 62,334 | | 63,743 | | |
| Total lease liabilities | | $ | 183,224 | | $ | 175,913 | | |
|
| | | | |
| (Thousands) | Balance Sheet Location | June 30, 2020 |
| Assets | | |
| Noncurrent | | |
| Operating lease assets | Operating lease assets | $ | 101,657 |
|
| Finance lease assets | Utility plant | 72,357 |
|
| Total lease assets | | $ | 174,014 |
|
| Liabilities | | |
| Current | | |
| Operating lease liabilities | Operating lease liabilities | $ | 4,458 |
|
| Finance lease liabilities | Current maturities of long-term debt | 10,645 |
|
| Noncurrent | | |
| Operating lease liabilities | Operating lease liabilities | 96,118 |
|
| Finance lease liabilities | Long-term debt | 66,944 |
|
| Total lease liabilities | | $ | 178,165 |
|
AsFor operating lease assets and liabilities, the weighted average remaining lease term was 27.6 years and 25.5 years and the weighted average discount rate used in the valuation over the remaining lease term was 3.3 percent and 3.2 percent as of JuneMarch 31, 2021 and September 30, 2020, respectively. For finance lease assets and liabilities as of March 31, 2021 and September 30, 2020, the weighted average remaining lease term forwas 11.9 years and 11.5 years, respectively, and the operating and finance leases is 27.3 and 2.37 years, respectively. The weighted average discount rate used in the valuation of the operating and finance lease liabilities and right-of-use assets over the remaining lease term is 3.182.5 percent and 2.54 percent, respectively.
As of June 30, 2020, the Company has entered into 3 commercial solar land leases, which have not yet commenced, that would entitle the Company to significant rights or create additional obligations. The leases are expected to commence when construction of the assets is completed during fiscal 2020. Total estimated payments over the life of these leases are approximately $6.1 million. There are options to extend the term of these leases for 2 additional five-year periods.
The following table presents the Company's maturities of lease liabilities as of Juneboth March 31, 2021 and September 30, 2020:2020.
|
| | | | | | |
| (Thousands) | Operating Leases | Finance Leases |
| Remainder of fiscal 2020 | $ | 2,137 |
| $ | 3,417 |
|
| 2021 | 6,481 |
| 56,271 |
|
| 2022 | 6,387 |
| 6,004 |
|
| 2023 | 6,356 |
| 4,622 |
|
| 2024 | 5,985 |
| 5,279 |
|
| Thereafter | 126,331 |
| 5,720 |
|
| Total future minimum lease payments | 153,677 |
| 81,313 |
|
| Less: Interest component | (53,101 | ) | (3,724 | ) |
| Total lease liability | $ | 100,576 |
| $ | 77,589 |
|
The following table reflects the Company's future minimum lease payments due under non-cancelable operating leases for continuing operations as of September 30, 2019, under ASC 840 and is being presented for comparative purposes. These commitments relate principally to commercial solar land leases, equipment and real property leases, including land and office facility leases, gas meters and office equipment.
|
| | | | | | |
| (Thousands) | Operating Leases | Capital Leases |
| 2020 | $ | 4,411 |
| $ | 11,707 |
|
| 2021 | $ | 4,698 |
| $ | 6,603 |
|
| 2022 | $ | 4,609 |
| $ | 7,494 |
|
| 2023 | $ | 4,579 |
| $ | 3,995 |
|
| 2024 | $ | 4,199 |
| $ | 4,652 |
|
| Thereafter | $ | 54,405 |
| $ | 4,173 |
|
New Jersey Resources Corporation
Part I
NOTES TO UNAUDITED CONDENSED CONSOLIDATED FINANCIAL STATEMENTS (Continued)
13. COMMITMENTS AND CONTINGENT LIABILITIES
Cash Commitments
NJNG has entered into long-term contracts, expiring at various dates through October 2036,November 2038, for the supply, storagetransportation and transportationstorage of natural gas. These contracts include annual fixed charges of approximately $125.7$156.0 million at current contract rates and volumes for the remainder of the fiscal year, which are recoverable through BGSS.
For the purpose of securing storage and pipeline capacity, the Energy Services segment enters into storage and pipeline capacity contracts, which require the payment of certain demand charges by Energy Services to maintain the ability to access such natural gas storage or pipeline capacity, during a fixed time period, which generally ranges from one to 10 years.years Demand charges are established by interstate storage and pipeline operators and are regulated by FERC. These demand charges represent commitments to pay storage providers or pipeline companies for the right to store and/or transport natural gas utilizing their respective assets.
Commitments as of June 30, 2020,March 31, 2021, for natural gas purchases and future demand fees for the next five fiscal year periods are as follows:
| | | | | | | | | | | | | | | | | | | | |
| (Thousands) | 2021 | 2022 | 2023 | 2024 | 2025 | Thereafter |
| Energy Services: | | | | | | |
| Natural gas purchases | $ | 98,845 | | $ | 0 | | $ | 0 | | $ | 0 | | $ | 0 | | $ | 0 | |
| Storage demand fees | 18,712 | | 14,248 | | 6,712 | | 3,318 | | 2,742 | | 277 | |
| Pipeline demand fees | 60,585 | | 49,224 | | 21,689 | | 18,673 | | 16,245 | | 34,074 | |
| Sub-total Energy Services | $ | 178,142 | | $ | 63,472 | | $ | 28,401 | | $ | 21,991 | | $ | 18,987 | | $ | 34,351 | |
| NJNG: | | | | | | |
| Natural gas purchases | $ | 32,320 | | $ | 0 | | $ | 0 | | $ | 0 | | $ | 0 | | $ | 0 | |
| Storage demand fees | 37,285 | | 28,593 | | 17,090 | | 11,506 | | 2,207 | | 2,495 | |
| Pipeline demand fees | 118,672 | | 150,719 | | 136,124 | | 158,600 | | 154,297 | | 1,437,814 | |
| Sub-total NJNG | $ | 188,277 | | $ | 179,312 | | $ | 153,214 | | $ | 170,106 | | $ | 156,504 | | $ | 1,440,309 | |
| Total | $ | 366,419 | | $ | 242,784 | | $ | 181,615 | | $ | 192,097 | | $ | 175,491 | | $ | 1,474,660 | |
|
| | | | | | | | | | | | | | | | | | |
| (Thousands) | 2020 | 2021 | 2022 | 2023 | 2024 | Thereafter |
| Energy Services: | | | | | | |
| Natural gas purchases | $ | 161,351 |
| $ | 1,264 |
| $ | — |
| $ | — |
| $ | — |
| $ | — |
|
| Storage demand fees | 23,483 |
| 12,975 |
| 10,116 |
| 4,063 |
| 2,173 |
| 1,329 |
|
| Pipeline demand fees | 66,544 |
| 55,599 |
| 33,068 |
| 22,364 |
| 17,163 |
| 40,206 |
|
| Sub-total Energy Services | $ | 251,378 |
| $ | 69,838 |
| $ | 43,184 |
| $ | 26,427 |
| $ | 19,336 |
| $ | 41,535 |
|
| NJNG: | | | | | | |
| Natural gas purchases | $ | 13,273 |
| $ | — |
| $ | — |
| $ | — |
| $ | — |
| $ | — |
|
| Storage demand fees | 36,062 |
| 34,483 |
| 23,424 |
| 13,409 |
| 9,154 |
| 4,077 |
|
| Pipeline demand fees | 89,627 |
| 107,510 |
| 106,414 |
| 89,217 |
| 79,899 |
| 572,433 |
|
| Sub-total NJNG | $ | 138,962 |
| $ | 141,993 |
| $ | 129,838 |
| $ | 102,626 |
| $ | 89,053 |
| $ | 576,510 |
|
| Total | $ | 390,340 |
| $ | 211,831 |
| $ | 173,022 |
| $ | 129,053 |
| $ | 108,389 |
| $ | 618,045 |
|
Certain pipeline demand fees totaling $4.0 million per year, for which Energy Services is the responsible party, will be paid for by the counterparty to a capacity release transaction beginning November 1, 2021 for a period of 10 years.
New Jersey Resources Corporation
Part I
NOTES TO UNAUDITED CONDENSED CONSOLIDATED FINANCIAL STATEMENTS (Continued)
Legal Proceedings
Manufactured Gas Plant Remediation
NJNG is responsible for the remedial cleanup of certain former MGP sites, dating back to gas operations in the late 1800s and early 1900s, which contain contaminated residues from former gas manufacturing operations. NJNG is currently involved in administrative proceedings with the NJDEP, and participating in various studies and investigations by outside consultants, to determine the nature and extent of any such contaminated residues and to develop appropriate programs of remedial action, where warranted, under NJDEP regulations.
NJNG periodically, and at least annually, performs an environmental review of former MGP sites located in Atlantic Highlands, Berkeley, Long Branch, Manchester, Toms River, and Freehold, New Jersey, collectively, the "former MGP sites", including a review of potential liability for investigation and remedial action. NJNG estimated at the time of the most recent review that total future expenditures at the former MGP sites for which it is responsible, including potential liabilities for further and continued natural resource damages, may be brought by the NJDEP for alleged injury to groundwater or other natural resources concerning these sites. As we haveAt the MGP site in Freehold, New Jersey, as the Company has not yet completed the remedial investigation of the site, the total amount of potential costs of all remedial actions at the MGP site in Freehold, New Jersey, cannot be reasonably estimated at this time.
The estimated total future expenditures for all former MGP sites will range from approximately $115.9$143.1 million to $186.2$181.7 million. NJNG’s estimate of these liabilities is based upon known facts, existing technology and enacted laws and regulations in place when the review was completed. Where it is probable that costs will be incurred, and the information is sufficient to establish a range of possible liability, NJNG accrues the most likely amount in the range. If no point within the range is more likely than the other, it is NJNG’s policy to accrue the lower end of the range. Accordingly, NJNG recorded an MGP remediation liability and a corresponding regulatory asset on the Unaudited Condensed Consolidated Balance Sheets of $128.9$143.5 million as of June 30, 2020March 31, 2021, and $131.1$150.6 million as of September 30, 2019,2020, based on the most likely amount. The remediation liability at June 30, 2020March 31, 2021, includes adjustments for actual expenditures during fiscal 2020.2021. The actual costs to be incurred by NJNG are dependent upon several factors, including final determination of remedial action, changing technologies and governmental regulations, the ultimate ability of other responsible parties to pay and insurance recoveries, if any.
New Jersey Resources Corporation
Part I
NOTES TO UNAUDITED CONDENSED CONSOLIDATED FINANCIAL STATEMENTS (Continued)
In June 2019, NJNG initiated a preliminary assessment of a site in Aberdeen, New Jersey to determine prior ownership and if there were former MGP operations were active at the location. The Company is in the process of conducting site investigation activities to identify and evaluate the nature and extent of MGP related contaminants present at the location. The costs associated with preliminary assessment and site investigation activities are considered immaterialongoing at the Aberdeen, NJ site location. The estimated costs to complete the preliminary assessment and site investigation phase are included as a component of NJNG’s annual SBC application to recoverin the MGP remediation expenses.liability and corresponding regulatory asset on the Unaudited Condensed Consolidated Balance Sheets. NJNG will continue to gather information to further refine and enhance its estimate of potential costs for this site as it becomes available.
NJNG recovers its remediation expenditures, including carrying costs, over rolling seven-year periods pursuant to a RAC approved by the BPU. On March 16,September 9, 2020, a stipulation was signed inthe BPU approved NJNG's annual SBC filing which included an increase in the RAC, which will increaseincreased the annual recovery from $8.5 million to $9.7 million and is pending approval.effective October 1, 2020. As of June 30, 2020, $36.1March 31, 2021, $37.5 million of previously incurred remediation costs, net of recoveries from customers and insurance proceeds, are included in regulatory assets on the Unaudited Condensed Consolidated Balance Sheets. NJNG will continue to seek recovery of MGP-related costs through the RAC. If any future regulatory position indicates that the recovery of such costs is not probable, the related non-recoverable costs would be charged to income in the period of such determination.
General
The Company is involved, and from time to time in the future may be involved, in a number of pending and threatened judicial, regulatory and arbitration proceedings relating to matters that arise in the ordinary course of business. In view of the inherent difficulty of predicting the outcome of litigation matters, particularly when such matters are in their early stages or where the claimants seek indeterminate damages, the Company cannot state with confidence what the eventual outcome of the pending litigation will be, what the timing of the ultimate resolution of these matters will be, or what the eventual loss, fines or penalties related to each pending matter will be, if any. In accordance with applicable accounting guidance, NJR establishes accruals for litigation for those matters that present loss contingencies as to which it is both probable that a loss will be incurred and the amount of such loss can be reasonably estimated. NJR also discloses contingent matters for which there is a reasonable possibility of a loss. Based upon currently available information, NJR believes that the results of litigation that is currently pending, taken together, will not have a materially adverse effect on the Company’s financial condition, results of operations or cash flows. The actual results of resolving the pending litigation matters may be substantially higher than the amounts accrued.
New Jersey Resources Corporation
Part I
NOTES TO UNAUDITED CONDENSED CONSOLIDATED FINANCIAL STATEMENTS (Continued)
The foregoing statements about NJR’s litigation are based upon the Company’s judgments, assumptions and estimates and are necessarily subjective and uncertain. The Company has a number of threatened and pending litigation matters at various stages.
14. COMMON STOCK EQUITY
OnIn December 4, 2019, the Company completed an equity offering of 6,545,454 common shares, consisting of 5,333,334 common shares issued directly by the Company and 1,212,120 common shares issuable pursuant to forward sales agreements with investment banks. The issuance of 5,333,334 resulted in proceeds of approximately $212.9 million, net of issuance costs, and was reflected in shareholders' equity and as a financing activity on the statement of cash flows.
Under the forward sale agreements, a total of 1,212,120 common shares were borrowed from third parties and sold to the underwriters. Each forward sale agreement allows the Company, at its election and prior to September 30, 2020, to physically settle the forward sale agreement by issuing common shares in exchange for net proceeds at the then-applicable forward sale price specified by the agreement, which was initially $40.0125 per share, or, alternatively, to settle the forward sale agreement in whole or in part through the delivery or receipt of shares or cash. The forward sale price is subject to adjustment daily based on a floating interest rate factor and will decrease in respect of certain fixed amounts specified in the agreement, such as anticipated dividends.
The Company's current intent isOn September 18, 2020, the Company amended its forward sale agreements to physically settleextend the maturity date of such forward sales agreements from September 30, 2020 to September 10, 2021. On March 3, 2021, the Company cash settled a portion of the forward sale agreements by issuingagreement for a payout of $387,744 for 727,272 common shares. As of June 30, 2020,March 31, 2021, if the Company elected to net settle the remaining forward sale agreement, the Company would receivehave paid approximately $7$1.4 million under a cash settlement or would receive 227,461have issued 31,607 common shares under a net share settlement.
Issuances of shares under the forward sale agreements are classified as equity transactions. Accordingly, no amounts relating to the forward sale agreements have or will be recorded in the financial statements until settlements take place. Prior to any settlements, the only impact to the financial statements is the inclusion of incremental shares within the calculation of diluted EPS using the treasury stock method until settlement of the forward sale agreements. Under this method, the number of the Company common shares used in calculating diluted EPS is deemed to be increased by the excess, if any, of the number of shares that would be issued upon physical settlement of the forward sale agreements less the number of shares that would be purchased by the Company in the market (based on the average market price during the same reporting period) using the proceeds receivable upon settlement (based on the adjusted forward sale price at the end of that reporting period). Share dilution occurs when the average market price of the Company's common shares is higher than the adjusted forward sale price. See Note 8. Earnings Per Share for the impact of the forward sale agreements on the calculation of diluted earnings per share.
New Jersey Resources Corporation
Part I
NOTES TO UNAUDITED CONDENSED CONSOLIDATED FINANCIAL STATEMENTS (Continued)
15. REPORTING SEGMENT AND OTHER OPERATIONS DATA
The Company organizes its businesses based on a combination of factors, including its products and its regulatory environment. As a result, the Company manages its businesses through the following reporting segments and other operations: the Natural Gas Distribution segment consists of regulated energy and off-system, capacity and storage management operations; the Clean Energy Ventures segment consists of capital investments in clean energy projects; the Energy Services segment consists of unregulated wholesale and retail energy operations; the MidstreamStorage and Transportation segment consists of the Company’s investments in natural gas transportation and storage facilities; the Home Services and Other operations consist of heating, cooling and water appliance sales, installations and services, other investments and general corporate activities.
New Jersey Resources Corporation
Part I
NOTES TO UNAUDITED CONDENSED CONSOLIDATED FINANCIAL STATEMENTS (Continued)
Information related to the Company's various reporting segments and other operations is detailed below:
| | | | | | | | | | | | | | |
| Three Months Ended | Six Months Ended |
| March 31, | March 31, |
| (Thousands) | 2021 | 2020 | 2021 | 2020 |
| Operating revenues | | | | |
| Natural Gas Distribution | | | | |
| External customers | $ | 310,167 | | $ | 297,220 | | $ | 505,896 | | $ | 516,843 | |
| | | | |
| Clean Energy Ventures | | | | |
| External customers | 6,476 | | 5,995 | | 12,846 | | 12,207 | |
| Energy Services | | | | |
External customers (1) | 459,766 | | 313,959 | | 687,115 | | 682,263 | |
| Intercompany | 2,803 | | (258) | | 4,931 | | 1,853 | |
| Storage and Transportation | | | | |
| External customers | 13,257 | | 10,401 | | 25,704 | | 18,806 | |
| Intercompany | 669 | | 675 | | 1,326 | | 1,342 | |
| Subtotal | 793,138 | | 627,992 | | 1,237,818 | | 1,233,314 | |
| Home Services and Other | | | | |
| External customers | 12,521 | | 12,039 | | 24,931 | | 24,531 | |
| Intercompany | 252 | | 326 | | 419 | | 741 | |
| Eliminations | (3,724) | | (743) | | (6,676) | | (3,936) | |
| Total | $ | 802,187 | | $ | 639,614 | | $ | 1,256,492 | | $ | 1,254,650 | |
| Depreciation and amortization | | | | |
| Natural Gas Distribution | $ | 19,475 | | $ | 18,100 | | $ | 38,644 | | $ | 34,917 | |
| Clean Energy Ventures | 4,685 | | 6,603 | | 10,118 | | 12,919 | |
Energy Services (2) | 13 | | 27 | | 55 | | 56 | |
| Storage and Transportation | 2,364 | | 2,397 | | 5,004 | | 4,078 | |
| Subtotal | 26,537 | | 27,127 | | 53,821 | | 51,970 | |
| Home Services and Other | 227 | | 250 | | 487 | | 496 | |
| Eliminations | 84 | | 139 | | (98) | | (313) | |
| Total | $ | 26,848 | | $ | 27,516 | | $ | 54,210 | | $ | 52,153 | |
Interest income (3) | | | | |
| Natural Gas Distribution | $ | 76 | | $ | 136 | | $ | 158 | | $ | 243 | |
| Clean Energy Ventures | 240 | | 0 | | 240 | | 0 | |
| Energy Services | 0 | | 52 | | 0 | | 89 | |
| Storage and Transportation | 851 | | 2,085 | | 1,545 | | 2,782 | |
| Subtotal | 1,167 | | 2,273 | | 1,943 | | 3,114 | |
| Home Services and Other | 127 | | 208 | | 259 | | 699 | |
| Eliminations | (237) | | (760) | | (476) | | (1,906) | |
| Total | $ | 1,057 | | $ | 1,721 | | $ | 1,726 | | $ | 1,907 | |
(1)Includes sales to Canada for the Energy Services segment, which are immaterial.
(2)The amortization of acquired wholesale energy contracts is excluded above and is included in natural gas purchases - nonutility on the Unaudited Condensed Consolidated Statements of Operations.
(3)Included in other income, net on the Unaudited Condensed Consolidated Statements of Operations.
|
| | | | | | | | | | | | |
| | Three Months Ended | Nine Months Ended |
| | June 30, | June 30, |
| (Thousands) | 2020 | 2019 | 2020 | 2019 |
| Operating revenues | | | | |
| Natural Gas Distribution | | | | |
| External customers | $ | 128,532 |
| $ | 120,782 |
| $ | 645,375 |
| $ | 622,167 |
|
| Clean Energy Ventures | | | | |
| External customers | 13,396 |
| 11,450 |
| 25,603 |
| 37,707 |
|
| Energy Services | | | | |
External customers (1) | 133,740 |
| 290,083 |
| 816,003 |
| 1,416,837 |
|
| Intercompany | (197 | ) | (62 | ) | 1,656 |
| 8,276 |
|
| Midstream | | | | |
| External customers | 11,143 |
| — |
| 29,949 |
| — |
|
| Intercompany | 720 |
| — |
| 2,062 |
| — |
|
| Subtotal | 287,334 |
| 422,253 |
| 1,520,648 |
| 2,084,987 |
|
| Home Services and Other | | | | |
| External customers | 12,163 |
| 12,627 |
| 36,694 |
| 36,253 |
|
| Intercompany | 206 |
| 455 |
| 947 |
| 1,652 |
|
| Eliminations | (729 | ) | (393 | ) | (4,665 | ) | (9,928 | ) |
| Total | $ | 298,974 |
| $ | 434,942 |
| $ | 1,553,624 |
| $ | 2,112,964 |
|
| Depreciation and amortization | | | | |
| Natural Gas Distribution | $ | 18,269 |
| $ | 14,689 |
| $ | 53,186 |
| $ | 42,557 |
|
| Clean Energy Ventures | 10,121 |
| 8,239 |
| 29,429 |
| 24,253 |
|
Energy Services (2) | 28 |
| 23 |
| 84 |
| 75 |
|
| Midstream | 2,513 |
| 1 |
| 6,591 |
| 4 |
|
| Subtotal | 30,931 |
| 22,952 |
| 89,290 |
| 66,889 |
|
| Home Services and Other | 265 |
| 230 |
| 761 |
| 673 |
|
| Eliminations | 20 |
| (33 | ) | (293 | ) | (270 | ) |
| Total | $ | 31,216 |
| $ | 23,149 |
| $ | 89,758 |
| $ | 67,292 |
|
Interest income (3) | | | | |
| Natural Gas Distribution | $ | 135 |
| $ | 187 |
| $ | 378 |
| $ | 567 |
|
| Energy Services | 10 |
| 26 |
| 99 |
| 40 |
|
| Midstream | 463 |
| 1,088 |
| 3,245 |
| 3,089 |
|
| Subtotal | 608 |
| 1,301 |
| 3,722 |
| 3,696 |
|
| Home Services and Other | 157 |
| 515 |
| 856 |
| 1,620 |
|
| Eliminations | (618 | ) | (1,320 | ) | (2,524 | ) | (4,202 | ) |
| Total | $ | 147 |
| $ | 496 |
| $ | 2,054 |
| $ | 1,114 |
|
| |
(1) | Includes sales to Canada for the Energy Services segment, which are immaterial. |
| |
(2) | The amortization of acquired wholesale energy contracts is excluded above and is included in gas purchases - nonutility on the Unaudited Condensed Consolidated Statements of Operations. |
| |
(3) | Included in other income, net on the Unaudited Condensed Consolidated Statements of Operations. |
New Jersey Resources Corporation
Part I
NOTES TO UNAUDITED CONDENSED CONSOLIDATED FINANCIAL STATEMENTS (Continued)
| | | | | | | | | | | | | | |
| Three Months Ended | Six Months Ended |
| March 31, | March 31, |
| (Thousands) | 2021 | 2020 | 2021 | 2020 |
| Interest expense, net of capitalized interest | | | | |
| Natural Gas Distribution | $ | 9,006 | | $ | 7,473 | | $ | 17,980 | | $ | 15,305 | |
| Clean Energy Ventures | 5,266 | | 4,835 | | 10,300 | | 9,327 | |
| Energy Services | 575 | | 937 | | 1,255 | | 2,163 | |
| Storage and Transportation | 3,578 | | 5,621 | | 7,560 | | 8,443 | |
| Subtotal | 18,425 | | 18,866 | | 37,095 | | 35,238 | |
| Home Services and Other | 1,728 | | 565 | | 2,844 | | 837 | |
| Eliminations | 0 | | (228) | | 0 | | (802) | |
| Total | $ | 20,153 | | $ | 19,203 | | $ | 39,939 | | $ | 35,273 | |
| Income tax provision (benefit) | | | | |
| Natural Gas Distribution | $ | 15,622 | | $ | 19,702 | | $ | 23,989 | | $ | 28,337 | |
| Clean Energy Ventures | (2,714) | | (4,134) | | (5,800) | | (7,968) | |
| Energy Services | 23,128 | | (2,449) | | 35,250 | | 8,303 | |
| Storage and Transportation | 873 | | 1,105 | | 1,519 | | 1,807 | |
| Subtotal | 36,909 | | 14,224 | | 54,958 | | 30,479 | |
| Home Services and Other | (59) | | 1,956 | | 59 | | 2,175 | |
| Eliminations | 2,207 | | 104 | | 1,481 | | 101 | |
| Total | $ | 39,057 | | $ | 16,284 | | $ | 56,498 | | $ | 32,755 | |
| Equity in earnings of affiliates | | | | |
| Storage and Transportation | $ | 3,386 | | $ | 3,921 | | $ | 6,579 | | $ | 7,585 | |
| Eliminations | (582) | | (332) | | (1,100) | | (607) | |
| Total | $ | 2,804 | | $ | 3,589 | | $ | 5,479 | | $ | 6,978 | |
| Net financial earnings (loss) | | | | |
| Natural Gas Distribution | $ | 80,541 | | $ | 86,336 | | $ | 130,008 | | $ | 130,192 | |
| Clean Energy Ventures | (8,872) | | (8,829) | | (19,146) | | (17,008) | |
| Energy Services | 96,528 | | 2,487 | | 98,028 | | (2,635) | |
| Storage and Transportation | 4,711 | | 4,258 | | 8,219 | | 7,262 | |
| Subtotal | 172,908 | | 84,252 | | 217,109 | | 117,811 | |
| Home Services and Other | 747 | | 148 | | 685 | | 1,257 | |
| Eliminations | (3,051) | | (109) | | (2,533) | | 154 | |
| Total | $ | 170,604 | | $ | 84,291 | | $ | 215,261 | | $ | 119,222 | |
| Capital expenditures | | | | |
| Natural Gas Distribution | $ | 97,239 | | $ | 72,042 | | $ | 176,485 | | $ | 149,839 | |
| Clean Energy Ventures | 18,549 | | 24,087 | | 40,884 | | 69,786 | |
| Storage and Transportation | 20,094 | | 5,148 | | 27,707 | | 7,709 | |
| Subtotal | 135,882 | | 101,277 | | 245,076 | | 227,334 | |
| Home Services and Other | 125 | | (111) | | 811 | | 15 | |
| Total | $ | 136,007 | | $ | 101,166 | | $ | 245,887 | | $ | 227,349 | |
| Investments in equity investees | | | | |
| Storage and Transportation | $ | 196 | | $ | 757 | | $ | 482 | | $ | 1,266 | |
| Total | $ | 196 | | $ | 757 | | $ | 482 | | $ | 1,266 | |
|
| | | | | | | | | | | | |
| | Three Months Ended | Nine Months Ended |
| | June 30, | June 30, |
| (Thousands) | 2020 | 2019 | 2020 | 2019 |
| Interest expense, net of capitalized interest | | | | |
| Natural Gas Distribution | $ | 7,455 |
| $ | 6,301 |
| $ | 22,760 |
| $ | 18,166 |
|
| Clean Energy Ventures | 5,070 |
| 4,320 |
| 14,397 |
| 14,405 |
|
| Energy Services | 517 |
| 766 |
| 2,680 |
| 4,277 |
|
| Midstream | 1,843 |
| 522 |
| 10,286 |
| 1,630 |
|
| Subtotal | 14,885 |
| 11,909 |
| 50,123 |
| 38,478 |
|
| Home Services and Other | 427 |
| 407 |
| 1,264 |
| 1,410 |
|
| Eliminations | (168 | ) | (668 | ) | (970 | ) | (2,245 | ) |
| Total | $ | 15,144 |
| $ | 11,648 |
| $ | 50,417 |
| $ | 37,643 |
|
| Income tax provision (benefit) | | | | |
| Natural Gas Distribution | $ | 939 |
| $ | (1,391 | ) | $ | 29,276 |
| $ | 16,705 |
|
| Clean Energy Ventures | 4,193 |
| (1,787 | ) | (38,432 | ) | (39,033 | ) |
| Energy Services | (8,909 | ) | (1,193 | ) | (606 | ) | 7,063 |
|
| Midstream | 1,646 |
| 729 |
| 3,453 |
| 2,910 |
|
| Subtotal | (2,131 | ) | (3,642 | ) | (6,309 | ) | (12,355 | ) |
| Home Services and Other | (131 | ) | 1,705 |
| 2,044 |
| 854 |
|
| Eliminations | 72 |
| (4 | ) | 173 |
| (353 | ) |
| Total | $ | (2,190 | ) | $ | (1,941 | ) | $ | (4,092 | ) | $ | (11,854 | ) |
| Equity in earnings of affiliates | | | | |
| Midstream | $ | 3,615 |
| $ | 4,167 |
| $ | 11,200 |
| $ | 11,966 |
|
| Eliminations | (402 | ) | (672 | ) | (1,009 | ) | (1,939 | ) |
| Total | $ | 3,213 |
| $ | 3,495 |
| $ | 10,191 |
| $ | 10,027 |
|
| Net financial earnings (loss) | | | | |
| Natural Gas Distribution | $ | 11,968 |
| $ | (3,795 | ) | $ | 142,160 |
| $ | 96,464 |
|
| Clean Energy Ventures | (13,891 | ) | (7,138 | ) | (2,817 | ) | 24,797 |
|
| Energy Services | (6,913 | ) | (14,030 | ) | (9,511 | ) | 13,644 |
|
| Midstream | 3,615 |
| 3,052 |
| 10,877 |
| 11,201 |
|
| Subtotal | (5,221 | ) | (21,911 | ) | 140,709 |
| 146,106 |
|
| Home Services and Other | (582 | ) | 4,437 |
| 675 |
| 2,932 |
|
| Eliminations | (14 | ) | (32 | ) | 140 |
| (34 | ) |
| Total | $ | (5,817 | ) | $ | (17,506 | ) | $ | 141,524 |
| $ | 149,004 |
|
| Capital expenditures | | | | |
| Natural Gas Distribution | $ | 88,171 |
| $ | 100,473 |
| $ | 238,010 |
| $ | 239,569 |
|
| Clean Energy Ventures | 41,182 |
| 38,813 |
| 110,968 |
| 91,333 |
|
| Midstream | 8,575 |
| 6,406 |
| 16,284 |
| 11,290 |
|
| Subtotal | 137,928 |
| 145,692 |
| 365,262 |
| 342,192 |
|
| Home Services and Other | 1,962 |
| 924 |
| 1,977 |
| 1,826 |
|
| Total | $ | 139,890 |
| $ | 146,616 |
| $ | 367,239 |
| $ | 344,018 |
|
| Investments in equity investees | | | | |
| Midstream | $ | 225 |
| $ | 1,239 |
| $ | 1,491 |
| $ | 2,696 |
|
| Total | $ | 225 |
| $ | 1,239 |
| $ | 1,491 |
| $ | 2,696 |
|
New Jersey Resources Corporation
Part I
NOTES TO UNAUDITED CONDENSED CONSOLIDATED FINANCIAL STATEMENTS (Continued)
The Chief Executive Officer, who uses NFE as a measure of profit or loss in measuring the results of the Company's segments and operations, is the chief operating decision maker of the Company. A reconciliation of consolidated NFE to consolidated net income is as follows:
| | | | | | | | | | | | | | |
| Three Months Ended | Six Months Ended |
| March 31, | March 31, |
| (Thousands) | 2021 | 2020 | 2021 | 2020 |
| Net financial earnings | $ | 170,604 | | $ | 84,291 | | $ | 215,261 | | $ | 119,222 | |
| Less: | | | | |
| Unrealized gain on derivative instruments and related transactions | 29,255 | | (3,773) | | (8,235) | | (45,539) | |
| Tax effect | (6,954) | | 897 | | 1,958 | | 10,828 | |
| Effects of economic hedging related to natural gas inventory | (7,209) | | 14,622 | | (14,741) | | 5,735 | |
| Tax effect | 1,713 | | (3,475) | | 3,503 | | (1,363) | |
| NFE tax adjustment | 3,990 | | 2,174 | | 1,922 | | (37) | |
| Net income | $ | 149,809 | | $ | 73,846 | | $ | 230,854 | | $ | 149,598 | |
|
| | | | | | | | | | | | |
| | Three Months Ended | Nine Months Ended |
| | June 30, | June 30, |
| (Thousands) | 2020 | 2019 | 2020 | 2019 |
| Net financial earnings (loss) | $ | (5,817 | ) | $ | (17,506 | ) | $ | 141,524 |
| $ | 149,004 |
|
| Less: | | | | |
| Unrealized loss (gain) on derivative instruments and related transactions | 23,712 |
| (24,646 | ) | (21,827 | ) | (25,353 | ) |
| Tax effect | (5,639 | ) | 5,885 |
| 5,189 |
| 6,034 |
|
| Effects of economic hedging related to natural gas inventory | 4,739 |
| 11,317 |
| 10,474 |
| 12,073 |
|
| Tax effect | (1,126 | ) | (2,689 | ) | (2,489 | ) | (2,869 | ) |
| NFE tax adjustment | (284 | ) | 1,029 |
| (470 | ) | 7,700 |
|
| Net (loss) income | $ | (27,219 | ) | $ | (8,402 | ) | $ | 150,647 |
| $ | 151,419 |
|
The Company uses derivative instruments as economic hedges of purchases and sales of physical natural gas inventory. For GAAP purposes, these derivatives are recorded at fair value and related changes in fair value are included in reported earnings. Revenues and cost of natural gas related to physical natural gas flow is recognized when the natural gas is delivered to customers. Consequently, there is a mismatch in the timing of earnings recognition between the economic hedges and physical natural gas flows. Timing differences occur in two ways:
•unrealized gains and losses on derivatives are recognized in reported earnings in periods prior to physical natural gas inventory flows; and
•unrealized gains and losses of prior periods are reclassified as realized gains and losses when derivatives are settled in the same period as physical natural gas inventory movements occur.
NFE is a measure of the earnings based on eliminating these timing differences, to effectively match the earnings effects of the economic hedges with the physical sale of natural gas, SRECs and foreign currency contracts. Consequently, to reconcile between net income and NFE, current period unrealized gains and losses on the derivatives are excluded from NFE as a reconciling item. Additionally, realized derivative gains and losses are also included in current period net income. However, NFE includes only realized gains and losses related to natural gas sold out of inventory, effectively matching the full earnings effects of the derivatives with realized margins on physical natural gas flows. Included in the tax effects are current and deferred income tax expense corresponding with the NFE. NJR also calculates a quarterly tax adjustment based on an estimated annual effective tax rate for NFE purposes.
The Company's assets for the various business segments and business operations are detailed below:
| | | | | | | | |
| (Thousands) | March 31,
2021 | September 30,
2020 |
| Assets at end of period: | | |
| Natural Gas Distribution | $ | 3,593,630 | | $ | 3,531,477 | |
| Clean Energy Ventures | 848,290 | | 814,277 | |
| Energy Services | 224,069 | | 244,836 | |
| Storage and Transportation | 874,976 | | 844,799 | |
| Subtotal | 5,540,965 | | 5,435,389 | |
| Home Services and Other | 136,531 | | 138,375 | |
Intercompany assets (1) | (252,362) | | (257,287) | |
| Total | $ | 5,425,134 | | $ | 5,316,477 | |
(1)Consists of transactions between subsidiaries that are eliminated and reclassified in consolidation.
|
| | | | | | |
| (Thousands) | June 30,
2020 | September 30,
2019 |
| Assets at end of period: | | |
| Natural Gas Distribution | $ | 3,319,754 |
| $ | 3,064,309 |
|
| Clean Energy Ventures | 1,007,240 |
| 864,323 |
|
| Energy Services | 225,830 |
| 290,847 |
|
| Midstream | 813,932 |
| 240,955 |
|
| Subtotal | 5,366,756 |
| 4,460,434 |
|
| Home Services and Other | 133,773 |
| 104,411 |
|
Intercompany assets (1) | (218,445 | ) | (191,860 | ) |
| Total | $ | 5,282,084 |
| $ | 4,372,985 |
|
| |
(1) | Consists of transactions between subsidiaries that are eliminated and reclassified in consolidation. |
New Jersey Resources Corporation
Part I
NOTES TO UNAUDITED CONDENSED CONSOLIDATED FINANCIAL STATEMENTS (Continued)
16. RELATED PARTY TRANSACTIONS
Effective April 1, 2020, NJNG has anentered into a 5-year agreement with Steckman Ridge for 3 Bcf of firm storage capacity with Steckman Ridge, which expires on March 31, 2025. Under the terms of the agreement, NJNG incurs demand fees, at market rates, of approximately $9.3 million annually, a portion of which is eliminated in consolidation. These fees are recoverable through NJNG'sNJNG’s BGSS mechanism and are included as a component of regulatory assets.
Energy Services may periodically enter into storage or park and loan agreements with its affiliated FERC-jurisdictional natural gas storage facility, Steckman Ridge. As of June 30, 2020,March 31, 2021, Energy Services has entered into transactions with Steckman Ridge for varying terms, all of which expire by October 31, 2020.2021.
Demand fees, net of eliminations, associated with Steckman Ridge were as follows:
| | | | | | | | | | | | | | |
| Three Months Ended | Six Months Ended |
| March 31, | March 31, |
| (Thousands) | 2021 | 2020 | 2021 | 2020 |
| Natural Gas Distribution | $ | 1,505 | | $ | 1,477 | | $ | 3,073 | | $ | 2,971 | |
| Energy Services | 226 | | 29 | | 391 | | 59 | |
| Total | $ | 1,731 | | $ | 1,506 | | $ | 3,464 | | $ | 3,030 | |
|
| | | | | | | | | | | | |
| | Three Months Ended | Nine Months Ended |
| | June 30, | June 30, |
| (Thousands) | 2020 | 2019 | 2020 | 2019 |
| Natural Gas Distribution | $ | 1,491 |
| $ | 1,431 |
| $ | 4,462 |
| $ | 4,349 |
|
| Energy Services | 27 |
| 695 |
| 86 |
| 2,106 |
|
| Total | $ | 1,518 |
| $ | 2,126 |
| $ | 4,548 |
| $ | 6,455 |
|
The following table summarizes demand fees payable to Steckman Ridge as of:
| | | | | | | | |
| (Thousands) | March 31,
2021 | September 30,
2020 |
| Natural Gas Distribution | $ | 775 | | $ | 775 | |
| Energy Services | 78 | | 16 | |
| Total | $ | 853 | | $ | 791 | |
|
| | | | | | |
| (Thousands) | June 30,
2020 | September 30,
2019 |
| Natural Gas Distribution | $ | 775 |
| $ | 775 |
|
| Energy Services | 16 |
| 15 |
|
| Total | $ | 791 |
| $ | 790 |
|
NJNG and Energy Services have entered into various asset management agreements, the effects of which are eliminated in consolidation. Under the terms of these agreements, NJNG releases certain transportation and storage contracts to Energy Services. As of June 30, 2020,March 31, 2021, NJNG and Energy Services had 43 asset management agreements with expiration dates ranging from October 31, 20202021 through OctoberMarch 31, 2021.2022.
NJNG has entered into a 15-year transportation precedent agreement for committed capacity of 180,000 Dths per day and NJRES has entered into a 5-year, 50,000 Dths per day transportation precedent agreement with PennEast, both to commence when PennEast is placed in service.
NJNG has entered into a transportation precedent agreement with Adelphia Gateway for committed capacity of 130,000 Dths per day, which expires in October 2025.2026.
Energy Services has a 5-year agreement for 3 Bcf of firm storage capacity with Leaf River, which is eliminated in consolidation and expires in March 2024. On February 19, 2021, Energy Services entered into a park and loan agreement with Leaf River for 330,000 Dths, which expired on April 30, 2021 and is eliminated in consolidation.
NJNG and Clean Energy Ventures entered into a sublease agreement and PPA agreement related to an onsite solar array and the related energy output at the Company’s headquarters in Wall, New Jersey.
17. ACQUISITIONS AND DISPOSITIONS
Acquisitions
Adelphia Gateway
On January 13, 2020, Adelphia Gateway, an indirect wholly-owned subsidiary of NJR, acquired all of Talen’s membership interests in IEC, an existing 84-mile pipeline in southeastern Pennsylvania, including related assets and rights of
New Jersey Resources Corporation
Part I
NOTES TO UNAUDITED CONDENSED CONSOLIDATED FINANCIAL STATEMENTS (Continued)
way, for a base purchase price of $166 million. In November 2017, the Company made an initial payment of $10 million towards the base purchase price, which was included in other noncurrent assets on the Consolidated Balance Sheets. The remaining purchase price of $156 million was paid upon the close of the acquisition of the related assets. As additional consideration, Adelphia Gateway will pay Talen specified amounts of up to $23 million contingent upon the achievement of certain regulatory approvals and binding natural gas capacity
New Jersey Resources Corporation
Part I
NOTES TO UNAUDITED CONDENSED CONSOLIDATED FINANCIAL STATEMENTS (Continued)
commitments. On December 20, 2019, FERC issued Adelphia Gateway’s Certificate of Public Convenience and Necessity. Adelphia Gateway has agreed to provide firm natural gas transportation service for 10 years following the closing to two power generators owned by affiliates of Talen that are currently served by the pipeline.
The Company evaluated the acquisition under the guidance of ASU 2017-01, Clarifying the Definition of a Business and concluded that the acquisition did not meet the definition of a business, as almost all of the fair value relates to the pipeline assets acquired. As a result, the purchase was accounted for as an asset acquisition.
The following table summarizes the consideration transferred and purchase price allocation based upon the relative fair value of the assets acquired and liabilities to be assumed:
| | | | | |
| (Thousands) | Estimated Fair Value |
| Purchase price | $ | 166,000 | |
| Net working capital adjustment | (449) | |
| Transaction costs | 9,456 | |
| Total costs capitalized | $ | 175,007 | |
| Identifiable assets acquired | |
| Property, plant and equipment | $ | 174,438 | |
| Other | 1,018 | |
| Net working capital | (449) | |
| Net assets acquired | $ | 175,007 | |
|
| | | |
| (Thousands) | Estimated Fair Value |
| Purchase price | $ | 166,000 |
|
| Net working capital adjustment | (449 | ) |
| Transaction costs | 9,456 |
|
| Total costs capitalized | $ | 175,007 |
|
| Identifiable assets acquired | |
| Property, plant and equipment | $ | 174,438 |
|
| Other | 1,018 |
|
| Net working capital | (449 | ) |
| Net assets acquired | $ | 175,007 |
|
The Company utilized a discounted cash flow valuation technique to measure the fair value of the property, plant, and equipment based upon the present value of their future economic benefits reflecting current market expectations. The assumptions used in the discounted cash flow valuation are not observable in active markets and thus represent non-recurring Level 3 fair value measurements.
Property, plant and equipment consist primarily of pipeline related assets, land, buildings and other structures and software. Depreciation is computed on a straight-line basis over the estimated useful life of the assets, ranging from five to 30 years, based on various classes of depreciable property. Other assets consist primarily of an assembled workforce and base natural gas.
Asset retirement obligations are initially recognized when the legal obligation to retire an asset has been incurred and a reasonable estimate of fair value can be made. The Company records any asset retirement obligations in the period in which information permitting a reasonable estimate of such obligation becomes available. The Company is unable to predict when, or if, the pipelines would become completely obsolete and require decommissioning. As such, upon acquisition, there were no liabilities recorded for asset retirement obligations, as both the timing and future estimates of decommissioning the pipeline was indeterminable.
Leaf River
On October 11, 2019, NJR Pipeline Company, an indirect wholly-owned subsidiary of NJR, acquired 100 percent of the issued and outstanding limited liability company interests of Leaf River Energy Center LLC for $367.5 million. The purchase price was subject to certain contractual conditions, including customary purchase price adjustments related to the amount of net working capital and transaction expenses. Leaf River owns and operates a 32.2 million Dth salt dome natural gas storage facility, located in southeastern Mississippi.
New Jersey Resources Corporation
Part I
NOTES TO UNAUDITED CONDENSED CONSOLIDATED FINANCIAL STATEMENTS (Continued)
The Company evaluated the acquisition under the guidance of ASU 2017-01, Clarifying the Definition of a Business and concluded that the acquisition did not meet the definition of a business, as almost all of the fair value relates to the natural gas storage assets acquired. As a result, the purchase was accounted for as an asset acquisition.
New Jersey Resources Corporation
Part I
NOTES TO UNAUDITED CONDENSED CONSOLIDATED FINANCIAL STATEMENTS (Continued)
The following table summarizes the consideration transferred and purchase price allocation based upon the relative fair value of the assets acquired and liabilities to be assumed:
| | | | | |
| (Thousands) | Estimated Fair Value |
| Purchase price | $ | 367,500 | |
| Net working capital adjustment | 4,111 | |
| Transaction costs | 1,664 | |
| Total costs capitalized | $ | 373,275 | |
| Identifiable assets acquired | |
| Property, plant and equipment | $ | 365,715 | |
| Base gas | 3,445 | |
| Other assets, net | 4 | |
| Net working capital | 4,111 | |
| Net assets acquired | $ | 373,275 | |
|
| | | |
| (Thousands) | Estimated Fair Value |
| Purchase price | $ | 367,500 |
|
| Net working capital adjustment | 4,111 |
|
| Transaction costs | 1,664 |
|
| Total costs capitalized | $ | 373,275 |
|
| Identifiable assets acquired | |
| Property, plant and equipment | $ | 365,715 |
|
| Base gas | 3,445 |
|
| Other assets, net | 4 |
|
| Net working capital | 4,111 |
|
| Net assets acquired | $ | 373,275 |
|
The total consideration transferred is comprised of the purchase price to the seller and the transaction costs incurred during the acquisition. The Company utilized a discounted cash flow valuation technique to measure the fair value of the property, plant, and equipment based upon the present value of their future economic benefits reflecting current market expectations. Base gas is valued based upon the estimated replacement costs associated with the respective assets.
Base gas is needed to maintain the necessary pressure to allow efficient operation of the storage facility. The base gas is determined to be recoverable and is considered a component of the facility and presented as a component in property, plant and equipment. This natural gas is not depreciated, as it is expected to be recovered and sold.
Property, plant and equipment consist primarily of surface equipment and pipelines necessary to operate the facility. Depreciation is computed on a straight-line basis over the estimated useful life of the assets, ranging from five to 50 years, based on various classes of depreciable property.
Asset retirement obligations are initially recognized when the legal obligation to retire an asset has been incurred and a reasonable estimate of fair value can be made. The Company records any asset retirement obligations in the period in which information permitting a reasonable estimate of such obligation becomes available. The Company is unable to predict when, or if, the storage facilities and related pipelines would become completely obsolete and require decommissioning. As such, upon acquisition, there were no liabilities recorded for asset retirement obligations, as both the timing and future estimates of decommissioning the storage facilities and related pipelines were indeterminable.
The assumptions used in the discounted cash flow valuation are not observable in active markets and thus represent non-recurring Level 3 fair value measurements.
New Jersey Resources Corporation
Part II
ITEM 2. MANAGEMENT'SMANAGEMENT’S DISCUSSION AND ANALYSIS OF FINANCIAL CONDITION AND RESULTS OF
OPERATIONS
Critical Accounting Policies
A summary of our critical accounting policies is included in Item 7. Management's Discussion and Analysis of Financial Condition and Results of Operations of our Annual Report on Form 10-K for the period ended September 30, 2019.2020. Our critical accounting policies have not changed from those reported in the 20192020 Annual Report on Form 10-K.
Recently Issued Accounting Standards
Refer to Note 2. Summary of Significant Accounting Policies for discussion of recently issued accounting standards.
New Jersey Resources Corporation
Part I
ITEM 2. MANAGEMENT’S DISCUSSION AND ANALYSIS OF FINANCIAL CONDITION AND RESULTS OF
OPERATIONS (Continued)
Management's Overview
Consolidated
NJR is an energy services holding company providing retail natural gas service in New Jersey and wholesale natural gas and related energy services to customers in the United StatesU.S. and Canada. In addition, we invest in clean energy projects, midstreamstorage and transportation assets and provide various repair, sales and installations services. A more detailed description of our organizational structure can be found in Item 1. Business of our 20192020 Annual Report on Form 10-K.
Reporting Segments
We have four primary reporting segments as presented in the chart below:
In addition to our four reporting segments above, we have non-utility operations that either provide corporate support services or do not meet the criteria to be treated as a separate reporting segment. These operations, which comprise Home Services and Other, include: appliance repair services, sales and installations at NJRHS; and commercial real estate holdings at CR&R.
New Jersey Resources Corporation
Part I
ITEM 2. MANAGEMENT’S DISCUSSION AND ANALYSIS OF FINANCIAL CONDITION AND RESULTS OF
OPERATIONS (Continued)
Impacts of the COVID-19 Pandemic
We are closely monitoringmonitor developments related to the COVID-19 pandemic and are takinghave taken steps intended to limit potential exposure for our employees and those we serve. We have also taken proactive steps to ensure business continuity in the safe operation of our business. Both NJR and NJNG continue to have sufficient liquidity to meet their current obligations and business operations remain fundamentally unchanged at this time. This is, however, a rapidlyremains an evolving situation, and we cannot predict the extent or duration of the outbreak, the effects of the pandemic on the global, national or local economy, or its effects on our financial condition, results of operations and cash flows. We cannot predict the nature and extent of impacts to future operations. We will continue to monitor developments affecting our employees, customers, and operations and take additional steps to address the COVID-19 pandemic and its impacts, as necessary.
New Jersey Resources Corporation
Part I
ITEM 2. MANAGEMENT’S DISCUSSION AND ANALYSIS OF FINANCIAL CONDITION AND RESULTS OF
OPERATIONS (Continued)
Operating Results
Net income (loss) income by reporting segment and operations are as follows:
| | | | | | | | | | | | | | | | | | | | | | | | | | | | | | | | | | | |
| Three Months Ended | | Six Months Ended |
| March 31, | | March 31, |
| (Thousands) | 2021 | | 2020 | | 2021 | | 2020 |
| Net income (loss) | | | | | | | | | | | |
| Natural Gas Distribution | $ | 80,541 | | 54 | % | | $ | 86,336 | | 117 | % | | $ | 130,008 | | 56 | % | | $ | 130,192 | | 87 | % |
| Clean Energy Ventures | (8,872) | | (6) | | | (8,829) | | (12) | | | (19,146) | | (8) | | | (17,008) | | (11) | |
| Energy Services | 75,662 | | 51 | | | (8,435) | | (11) | | | 114,534 | | 49 | | | 27,590 | | 18 | |
| Storage and Transportation | 4,711 | | 3 | | | 4,258 | | 6 | | | 8,219 | | 4 | | | 7,262 | | 5 | |
| Home Services and Other | 747 | | — | | | 148 | | — | | | 685 | | — | | | 1,257 | | 1 | |
Eliminations (1) | (2,980) | | (2) | | | 368 | | — | | | (3,446) | | (1) | | | 305 | | — | |
| Total | $ | 149,809 | | 100 | % | | $ | 73,846 | | 100 | % | | $ | 230,854 | | 100 | % | | $ | 149,598 | | 100 | % |
|
| | | | | | | | | | | | | | | | | | | | | | | |
| | Three Months Ended | | Nine Months Ended |
| | June 30, | | June 30, |
| (Thousands) | 2020 | | 2019 | | 2020 | | 2019 |
| Net income (loss) | | | | | | | | | | | |
| Natural Gas Distribution | $ | 11,968 |
| (44 | )% | | $ | (3,795 | ) | 45 | % | | $ | 142,160 |
| 95 | % | | $ | 96,464 |
| 64 | % |
| Clean Energy Ventures | (13,607 | ) | 50 |
| | (8,167 | ) | 97 |
| | (2,347 | ) | (2 | ) | | 17,097 |
| 11 |
|
| Energy Services | (28,845 | ) | 106 |
| | (3,873 | ) | 46 |
| | (1,255 | ) | (1 | ) | | 25,041 |
| 17 |
|
| Midstream | 3,615 |
| (13 | ) | | 3,052 |
| (36 | ) | | 10,877 |
| 7 |
| | 11,201 |
| 7 |
|
| Home Services and Other | (582 | ) | 2 |
| | 4,365 |
| (52 | ) | | 675 |
| 1 |
| | 2,672 |
| 2 |
|
Eliminations (1) | 232 |
| (1 | ) | | 16 |
| — |
| | 537 |
| — |
| | (1,056 | ) | (1 | ) |
| Total | $ | (27,219 | ) | 100 | % | | $ | (8,402 | ) | 100 | % | | $ | 150,647 |
| 100 | % | | $ | 151,419 |
| 100 | % |
| |
(1) | Consists
of transactions between subsidiaries that are eliminated in consolidation.
|
The decreaseincrease in net income during the three and ninesix months ended June 30, 2020,March 31, 2021, compared with the three and ninesix months ended June 30, 2019,March 31, 2020, was driven primarily by decreasedincreased earnings at Energy Services resulting from fewerdue to strong market opportunities compareddemand related to the prior period and decreased earnings at Clean Energy Ventures resulting from the timing of SREC transfers and ITC recognition, partially offset by increased earnings at our Natural Gas Distribution segment due to higher base rates, resulting from the base rate case in November 2019.extreme cold weather during February 2021. The primary drivers of the changes noted above are described in more detail in the individual segment discussions.
Assets by reporting segment and operations are as follows:
|
| | | | | | | | | | | |
| (Thousands) | June 30,
2020 | | September 30,
2019 |
| Assets | | | | | |
| Natural Gas Distribution | $ | 3,319,754 |
| 63 | % | | $ | 3,064,309 |
| 70 | % |
Clean Energy Ventures | 1,007,240 |
| 19 |
| | 864,323 |
| 20 |
|
| Energy Services | 225,830 |
| 4 |
| | 290,847 |
| 7 |
|
| Midstream | 813,932 |
| 15 |
| | 240,955 |
| 5 |
|
| Home Services and Other | 133,773 |
| 3 |
| | 104,411 |
| 2 |
|
Intercompany assets (1) | (218,445 | ) | (4 | ) | | (191,860 | ) | (4 | ) |
| Total | $ | 5,282,084 |
| 100 | % | | $ | 4,372,985 |
| 100 | % |
| |
(1)
| Consists of transactions between subsidiaries that are eliminated in consolidation. |
| | | | | | | | | | | | | | | | | |
| (Thousands) | March 31,
2021 | | September 30,
2020 |
| Assets | | | | | |
| Natural Gas Distribution | $ | 3,593,630 | | 66 | % | | $ | 3,531,477 | | 66 | % |
Clean Energy Ventures | 848,290 | | 16 | | | 814,277 | | 15 | |
| Energy Services | 224,069 | | 4 | | | 244,836 | | 5 | |
| Storage and Transportation | 874,976 | | 16 | | | 844,799 | | 16 | |
| Home Services and Other | 136,531 | | 3 | | | 138,375 | | 3 | |
Intercompany assets (1) | (252,362) | | (5) | | | (257,287) | | (5) | |
| Total | $ | 5,425,134 | | 100 | % | | $ | 5,316,477 | | 100 | % |
(1)Consists of transactions between subsidiaries that are eliminated in consolidation.
The increase in assets was due primarily to the acquisition of Leaf River and Adelphia at our Midstream segment, increases inadditional utility plant and an increase in solar asset investmentinvestments at Clean Energy Ventures, along with an increase in accounts receivable and at our Natural Gas Distribution segment and Clean Energy Ventures segment, respectively, the recognition of a right-of-use asset upon adoption of ASC 842, Leases on October 1, 2019, partially offset by decreased gas in storage at our Natural Gas Distribution segment and accounts receivable and broker margin requirements at Energy Services.
New Jersey Resources Corporation
Part I
ITEM 2. MANAGEMENT’S DISCUSSION AND ANALYSIS OF FINANCIAL CONDITION AND RESULTS OFServices segments.
OPERATIONS (Continued)
Non-GAAP Financial Measures
Our management uses NFE, a non-GAAP financial measure, when evaluating our operating results. Energy Services economically hedges its natural gas inventory with financial derivative instruments. NFE is a measure of the earnings based on eliminating timing differences surrounding the recognition of certain gains or losses, to effectively match the earnings effects of the economic hedges with the physical sale of natural gas and, therefore, eliminates the impact of volatility to GAAP earnings associated with the derivative instruments. There is a related tax effect on current and deferred income tax expense corresponding with this non-GAAP measure. To the extent we utilize forwards, futures, or other derivatives to hedge forecasted SREC production, unrealized gains and losses are also eliminated for NFE purposes.
GAAP requires us, during the interim periods, to estimate our annual effective tax rate and use this rate to calculate the year-to-date tax provision. We also determine an annual estimated effective tax rate for NFE purposes and calculate a quarterly tax adjustment based on the differences between our forecasted net income and our forecasted NFE for the fiscal year. Since the annual estimated effective tax rate is based on certain forecasted assumptions, including estimates surrounding completion of Clean Energy Ventures projects, the rate and resulting NFE are subject to change. No adjustment is needed during the fourth quarter, since the actual effective tax rate is calculated at year end.
New Jersey Resources Corporation
Part I
ITEM 2. MANAGEMENT’S DISCUSSION AND ANALYSIS OF FINANCIAL CONDITION AND RESULTS OF
OPERATIONS (Continued)
Non-GAAP financial measures are not in accordance with, or an alternative to, GAAP and should be considered in addition to, and not as a substitute for or a replacement of, the comparable GAAP measure and should be read in conjunction with those GAAP results. Below is a reconciliation of consolidated net income, the most directly comparable GAAP measure, to NFE:
|
| | | | | | | | | | | | | |
| | Three Months Ended | | Nine Months Ended |
| | June 30, | | June 30, |
| (Thousands, except per share data) | 2020 | 2019 | | 2020 | 2019 |
| Net (loss) income | $ | (27,219 | ) | $ | (8,402 | ) | | $ | 150,647 |
| $ | 151,419 |
|
| Add: | | | | | |
| Unrealized loss (gain) on derivative instruments and related transactions | 23,712 |
| (24,646 | ) | | (21,827 | ) | (25,353 | ) |
| Tax effect | (5,639 | ) | 5,885 |
| | 5,189 |
| 6,034 |
|
Effects of economic hedging related to natural gas inventory (1) | 4,739 |
| 11,317 |
| | 10,474 |
| 12,073 |
|
| Tax effect | (1,126 | ) | (2,689 | ) | | (2,489 | ) | (2,869 | ) |
| NFE tax adjustment | (284 | ) | 1,029 |
| | (470 | ) | 7,700 |
|
| Net financial earnings (loss) | $ | (5,817 | ) | $ | (17,506 | ) | | $ | 141,524 |
| $ | 149,004 |
|
| Basic (loss) earnings per share | $ | (0.28 | ) | $ | (0.09 | ) | | $ | 1.60 |
| $ | 1.70 |
|
| Add: | | | | | |
| Unrealized loss (gain) on derivative instruments and related transactions | 0.24 |
| (0.28 | ) | | (0.23 | ) | (0.28 | ) |
| Tax effect | (0.06 | ) | 0.06 |
| | 0.05 |
| 0.06 |
|
Effects of economic hedging related to natural gas inventory (1) | 0.05 |
| 0.13 |
| | 0.11 |
| 0.13 |
|
| Tax effect | (0.01 | ) | (0.03 | ) | | (0.03 | ) | (0.03 | ) |
| NFE tax adjustment | — |
| 0.01 |
| | — |
| 0.09 |
|
| Basic NFE per share | $ | (0.06 | ) | $ | (0.20 | ) | | $ | 1.50 |
| $ | 1.67 |
|
| |
(1) | Effects of hedging natural gas inventory transactions where the economic impact is realized in a future period. |
New Jersey Resources Corporation
Part I
ITEM 2. MANAGEMENT’S DISCUSSION AND ANALYSIS OF FINANCIAL CONDITION AND RESULTS OF | | | | | | | | | | | | | | | | | |
| Three Months Ended | | Six Months Ended |
| March 31, | | March 31, |
| (Thousands, except per share data) | 2021 | 2020 | | 2021 | 2020 |
| Net income | $ | 149,809 | | $ | 73,846 | | | $ | 230,854 | | $ | 149,598 | |
| Add: | | | | | |
| Unrealized gain on derivative instruments and related transactions | 29,255 | | (3,773) | | | (8,235) | | (45,539) | |
| Tax effect | (6,954) | | 897 | | | 1,958 | | 10,828 | |
Effects of economic hedging related to natural gas inventory (1) | (7,209) | | 14,622 | | | (14,741) | | 5,735 | |
| Tax effect | 1,713 | | (3,475) | | | 3,503 | | (1,363) | |
| NFE tax adjustment | 3,990 | | 2,174 | | | 1,922 | | (37) | |
| Net financial earnings | $ | 170,604 | | $ | 84,291 | | | $ | 215,261 | | $ | 119,222 | |
| Basic earnings per share | $ | 1.56 | | $ | 0.78 | | | $ | 2.40 | | $ | 1.60 | |
| Add: | | | | | |
| Unrealized gain on derivative instruments and related transactions | 0.30 | | (0.04) | | | (0.09) | | (0.49) | |
| Tax effect | (0.08) | | 0.01 | | | 0.02 | | 0.11 | |
Effects of economic hedging related to natural gas inventory (1) | (0.07) | | 0.15 | | | (0.15) | | 0.06 | |
| Tax effect | 0.02 | | (0.04) | | | 0.04 | | (0.01) | |
| NFE tax adjustment | 0.04 | | 0.02 | | | 0.02 | | — | |
| Basic NFE per share | $ | 1.77 | | $ | 0.88 | | | $ | 2.24 | | $ | 1.27 | |
OPERATIONS (Continued)(1)Effects of hedging natural gas inventory transactions where the economic impact is realized in a future period.
NFE by reporting segment and other operations, discussed in more detail within the operating results sections of each segment, is summarized as follows:
|
| | | | | | | | | | | | | | | | | | | | | | | |
| | Three Months Ended | | Nine Months Ended |
| | June 30, | | June 30, |
| (Thousands) | 2020 | | 2019 | | 2020 | | 2019 |
| Net financial (loss) earnings | | | | | | | | | | | |
| Natural Gas Distribution | $ | 11,968 |
| (206 | )% | | $ | (3,795 | ) | 21 | % | | $ | 142,160 |
| 100 | % | | $ | 96,464 |
| 65 | % |
| Clean Energy Ventures | (13,891 | ) | 239 |
| | (7,138 | ) | 41 |
| | (2,817 | ) | (2 | ) | | 24,797 |
| 17 |
|
| Energy Services | (6,913 | ) | 119 |
| | (14,030 | ) | 80 |
| | (9,511 | ) | (7 | ) | | 13,644 |
| 9 |
|
| Midstream | 3,615 |
| (62 | ) | | 3,052 |
| (17 | ) | | 10,877 |
| 8 |
| | 11,201 |
| 7 |
|
| Home Services and Other | (582 | ) | 10 |
| | 4,437 |
| (25 | ) | | 675 |
| 1 |
| | 2,932 |
| 2 |
|
Eliminations (1) | (14 | ) | — |
| | (32 | ) | — |
| | 140 |
| — |
| | (34 | ) | — |
|
| Total | $ | (5,817 | ) | 100 | % | | $ | (17,506 | ) | 100 | % | | $ | 141,524 |
| 100 | % | | $ | 149,004 |
| 100 | % |
| |
(1) | Consists of transactions between subsidiaries that are eliminated in consolidation.
|
| | | | | | | | | | | | | | | | | | | | | | | | | | | | | | | | | | | |
| Three Months Ended | | Six Months Ended |
| March 31, | | March 31, |
| (Thousands) | 2021 | | 2020 | | 2021 | | 2020 |
| Net financial earnings (loss) | | | | | | | | | | | |
| Natural Gas Distribution | $ | 80,541 | | 47 | % | | $ | 86,336 | | 102 | % | | $ | 130,008 | | 60 | % | | $ | 130,192 | | 109 | % |
| Clean Energy Ventures | (8,872) | | (5) | | | (8,829) | | (10) | | | (19,146) | | (9) | | | (17,008) | | (14) | |
| Energy Services | 96,528 | | 57 | | | 2,487 | | 3 | | | 98,028 | | 46 | | | (2,635) | | (2) | |
| Storage and Transportation | 4,711 | | 3 | | | 4,258 | | 5 | | | 8,219 | | 4 | | | 7,262 | | 6 | |
| Home Services and Other | 747 | | — | | | 148 | | — | | | 685 | | — | | | 1,257 | | 1 | |
Eliminations (1) | (3,051) | | (2) | | | (109) | | — | | | (2,533) | | (1) | | | 154 | | — | |
| Total | $ | 170,604 | | 100 | % | | $ | 84,291 | | 100 | % | | $ | 215,261 | | 100 | % | | $ | 119,222 | | 100 | % |
(1) Consists of transactions between subsidiaries that are eliminated in consolidation.
The decreaseincrease in net financial lossNFE during the three and six months ended June 30, 2020,March 31, 2021, compared with the three and six months ended June 30, 2019,March 31, 2020, was due primarily to increased base rates at our Natural Gas Distribution segment, partially offset by decreased earnings at Clean Energy Ventures resulting from the timing of SREC transfers and ITC recognition. The decrease in NFE during the nine months ended June 30, 2020, compared with the nine months ended June 30, 2019, was due primarily to lower financial margin generated at Energy Services resulting from warmer weather, which lead to decreased demand, lower natural gas prices and ultimately decreased volatility in the wholesale natural gas markets, decreased earnings at Clean Energy Ventures, as previously discussed, partially offset by increased base rates at our Natural Gas Distribution segment.discussed.
Natural Gas Distribution Segment
Overview
Our Natural Gas Distribution segment is comprised of NJNG, a natural gas utility that provides regulated retail natural gas service in centralthroughout Burlington, Middlesex, Monmouth, Morris and northernOcean counties in New Jersey to approximately 555,000561,500 residential and commercial customers in its service territory and also participates in the off-system sales and capacity release markets. The business is subject to various risks, including those risks associated with COVID-19 and may include but is not limited to impacts to customer growth and customer usage, customer collections, the timing and costs of capital expenditures and construction of infrastructure projects, operating and financing costs, fluctuations in commodity prices and customer
New Jersey Resources Corporation
Part I
ITEM 2. MANAGEMENT’S DISCUSSION AND ANALYSIS OF FINANCIAL CONDITION AND RESULTS OF
OPERATIONS (Continued)
conservation efforts. In addition, NJNG may be subject to adverse economic conditions, certain regulatory actions, environmental remediation and severe weather conditions. It is often difficult to predict the impact of events or trends associated with these risks.
NJNG’sNJNG’s business is seasonal by nature, as weather conditions directly influence the volume of natural gas delivered to customers on an annual basis. Specifically, customer demand substantially increases during the winter months when natural gas is used for heating purposes. As a result, NJNG receives most of its natural gas distribution revenues during the first and second fiscal quarters and is subject to variations in earnings and working capital during the year.
As a regulated company, NJNG is required to recognize the impact of regulatory decisions on its financial statements. See Note 4. Regulation in the accompanying Unaudited Condensed Consolidated Financial Statements for a more detailed discussion on regulatory actions, including filings related to programs and associated expenditures, as well as rate requests related to recovery of capital investments and operating costs.
NJNG’sNJNG’s operations are managed with the goal of providing safe and reliable service, growing its customer base, diversifying its utility gross margin, promoting clean energy programs and mitigating the risks discussed above.
Base Rate Case
On November 13, 2019, the BPU issued an order adopting a stipulation of settlement approving a $62.2 million increase to base rates, effective on November 15, 2019. The increase includes an overall rate of return on rate base of 6.95 percent, return on common equity of 9.6 percent, a common equity ratio of 54 percent and a depreciation rate of 2.78 percent.
New Jersey Resources Corporation
Part I
ITEM 2. MANAGEMENT’S DISCUSSION AND ANALYSIS OF FINANCIAL CONDITION AND RESULTS OF
OPERATIONS (Continued)
Infrastructure projects
NJNG has significant annual capital expenditures associated with the management of its natural gas distribution and transmission system, including new utility plant associated with customer growth and its associated pipeline integrity management and infrastructure programs.
Below is a summary of NJNG’s capital expenditures, including accruals, for the ninesix months ended June 30, 2020, March 31, 2021, and estimates of expected investments for fiscal 20202021 and 2021:2022:
Estimated capital expenditures are reviewed on a regular basis and may vary based on the ongoing effects of regulatory oversight, environmental regulations, unforeseen events and the ability to access capital.
Infrastructure Investment Program
On February 28, 2019, NJNG filed a petition with the BPU seeking authority to implement a five-year Infrastructure Investment Program.IIP. The IIP consists of two components: transmission and distribution investments and information technology replacement and enhancements. The total expected investment for the IIP is approximately $507 million. IfAll approved the investments are expected towill be recovered through annual filings to adjust base rates. On October 28, 2020, the BPU approved the Company’s transmission and
New Jersey Resources Corporation
Part I
ITEM 2. MANAGEMENT’S DISCUSSION AND ANALYSIS OF FINANCIAL CONDITION AND RESULTS OF
OPERATIONS (Continued)
distribution component of the IIP for $150 million over five years, effective November 1, 2020. NJNG voluntarily withdrew the information technology upgrade component and will seek to recover associated costs in future rate case proceedings.
SAFE II and NJ RISE
NJNG continues to implement BPU-approved infrastructure projects that are designed to enhance the reliability and integrity of NJNG'sNJNG’s natural gas distribution system.
The BPU approved the 5-year SAFE II program and the associated rate mechanism to replace the remaining unprotected steel mains and services from NJNG’s natural gas distribution system at an estimated cost of approximately $200 million, excluding AFUDC. With the approval of SAFE II, $157.5 million was approved for accelerated cost recovery methodology. The remaining $42.5 million in capital expenditures must be requested for recovery in base rate cases, of which $23.4 million was approved in NJNG’s most recent2019 base rate case.
The BPU approved NJNG'sNJNG’s NJ RISE capital infrastructure program, which consists of six capital investment projects estimated to cost $102.5 million, excluding AFUDC, for natural gas distribution storm hardening and mitigation projects, along with associated depreciation expense. These system enhancements are intended to minimize service impacts during extreme weather events to customers in the most storm-prone areas of NJNG’s service territory. Recovery of NJ RISE investments is included in NJNG’s base rates.
In September 2019, the BPU approved NJNG’s annual petition requesting a rate increase of $7.8 million, effective October 1, 2019.
New Jersey Resources Corporation
Part I
ITEM 2. MANAGEMENT’S DISCUSSION AND ANALYSIS OF FINANCIAL CONDITION AND RESULTS OF
OPERATIONS (Continued)
On March 30, 2020, NJNG filed a petition with the BPU requesting a rate increase of approximately $7.4 million for the recovery associated with NJ RISE and SAFE II capital investment costs of approximately $57.9 million made for the twelve months ended June 30, 2020.million. On July 24, 2020, the Company updated thisthe filing forwith actual information through June 30, 2020 and the revised rate increase requested iswas $7.1 million based on $55.1 million of actual capital investments. On September 9, 2020, the BPU approved the increase to base rate revenue, effective October 1, 2020.
On March 31, 2021, NJNG filed a petition with the BPU requesting the final base rate increase of approximately $311,000 for the recovery associated with NJ RISE and SAFE II capital investments cost of approximately $3.4 million made through June 30, 2021. This filing will be updated for actual information through June 30, 2021. Changes to base rates are anticipated to be effective October 1, 2020.2021.
Southern Reliability Link
The SRL is an approximately 30-mile, 30-inch transmission main designed to support improved system reliability and integrity in the southern portion of NJNG’s service territory. Construction began on the project in December 2018 and is estimated to cost between $250$290 million and $270$310 million upon completion. Costs associated with SRL will be requested for recovery inOn March 30, 2021, NJNG filed a future base rate case.case with the BPU requesting rate recovery for SRL and other infrastructure investments. SRL is expected to be placed in service during fiscal 2021.
Customer Growth
In conducting NJNG's business, management focuses on factors it believes may have significant influence on its future financial results. NJNG's policy is to work with all stakeholders, including customers, regulators and policymakers, to achieve favorable results. These factors include the rate of NJNG's customer growth in its service territory, which can be influenced by political and regulatory policies, the delivered cost of natural gas compared with competing fuels, interest rates and general economic and business conditions.
NJNG's total customers include the following:
| | | | | | | | |
| March 31,
2021 | March 31,
2020 |
| Firm customers | | |
| Residential | 498,583 | | 491,419 | |
| Commercial, industrial & other | 31,313 | | 30,545 | |
| Residential transport | 22,574 | | 22,783 | |
| Commercial transport | 8,971 | | 9,230 | |
| Total firm customers | 561,441 | | 553,977 | |
| Other | 45 | | 59 | |
| Total customers | 561,486 | | 554,036 | |
|
| | | | |
| | June 30,
2020 | June 30,
2019 |
| Firm customers | | |
| Residential | 493,322 |
| 484,720 |
|
| Commercial, industrial & other | 29,810 |
| 29,223 |
|
| Residential transport | 22,840 |
| 23,160 |
|
| Commercial transport | 9,240 |
| 9,334 |
|
| Total firm customers | 555,212 |
| 546,437 |
|
| Other | 51 |
| 56 |
|
| Total customers | 555,263 |
| 546,493 |
|
New Jersey Resources Corporation
Part I
ITEM 2. MANAGEMENT’S DISCUSSION AND ANALYSIS OF FINANCIAL CONDITION AND RESULTS OF
OPERATIONS (Continued)
During the ninesix months ended June 30,March 31, 2021 and 2020, and 2019, respectively, NJNG added 5,8793,694 and 6,8004,339 new customers and converted 214 and 190 existing customers to natural gas heat and other services.customers. NJNG expects these new customer additions, and those customers who added additional natural gas services to their premises to contribute approximately $4$2.7 million to utility gross margin.margin during the fiscal year.
NJNG continues to expect to add approximately 28,000 to 30,000 new customers during the three-year period of fiscal 20202021 to 2022.2023. Based on information from municipalities and developers, as well as external industry analysts and management's experience, NJNG estimates that approximately 65 percent of the growth will come from new construction markets and 35 percent from customer conversions to natural gas from other fuel sources. This new customer and conversion growth would increase utility gross margin under NJNG's base rates by approximately $5.5$6.3 million annually, as calculated under NJNG's CIP tariff. See the Natural Gas Distribution Segment Operating Results section of Item 2. Management's Discussion and Analysis of Financial Condition and Results of Operations that follows for a definition and further discussion of utility gross margin.
Energy Efficiency Programs
SAVEGREEN conducts home energy audits and provides various grants, incentives and financing alternatives which are designed to encourage the installation of high-efficiency heating and cooling equipment and other energy-efficiencyenergy efficiency upgrades. Depending on the specific incentive or approval, NJNG recovers costs associated with the programs over a twotwo- to 10-year period through a tariff rider mechanism.
On October 25, 2019,March 3, 2021, the BPU approved NJNG’s annual filing to increase its EE recovery rate, which resulted in an annual recoverya three-year SAVEGREEN program consisting of approximately $11.3$126.1 million of direct investment, $109.4 million in financing options, and approximately $23.4 million in operation and maintenance expenses, to be effective NovemberJuly 1, 2019. 2021.
On May 29, 2020, NJNG filed a petition with the BPU to minimally decrease its EE recovery rate. Throughout the course of the proceeding, NJNG updated the filing with additional actual information. Based on the updated information, the BPU approved NJNG to maintain its existing rate, which will result in an annual decreaserecovery of approximately $70,000, anticipated to be$11.4 million, effective OctoberNovember 1, 2020.
From inception through June 30, 2020, $192.4 million inThe following table summarizes, loans, grants, rebates and loans has been provided to customers. Therelated investments as of:
New Jersey Resources Corporation
Part I
ITEM 2. MANAGEMENT’S DISCUSSION AND ANALYSIS OF FINANCIAL CONDITION AND RESULTS OF | | | | | | | | |
| (Thousands) | March 31,
2021 | September 30,
2020 |
| Loans | $ | 126,400 | | $ | 119,400 | |
| Grants, rebates and related investments | 82,900 | | 80,500 | |
| Total | $ | 209,300 | | $ | 199,900 | |
OPERATIONS (Continued)
Program recoveries from customers during the six months ended March 31, 2021 and 2020, were $5.3 million and $4.5 million, respectively. The recovery includes a weighted average cost of capital that ranges from 6.96.69 percent to 7.76 percent, with a return on equity of 9.69.75 percent to 9.7510.3 percent.
Conservation Incentive Program/BGSS
The CIP facilitates normalizing NJNG’s utility gross margin for variances not only due to weather but also for other factors affecting customer usage, such as conservation and energy efficiency. Recovery of utility gross margin for the non-weather variance through the CIP is limited to the amount of certain natural gas supply cost savings achieved and is subject to a variable margin revenue test. Additionally, recovery of the CIP utility gross margin is subject to an annual earnings test. An annual review of the CIP must be filed by June 1, coincident with NJNG’s annual BGSS filing, during which NJNG can request rate changes to the CIP. In May 2014, the BPU approved the continuation of the CIP program with no expiration date.
NJNG's total utility firm gross margin includes the following adjustments related to the CIP mechanism:
| | | | | | | | | | | | | | |
| Three Months Ended | Six Months Ended |
| March 31, | March 31, |
| (Thousands) | 2021 | 2020 | 2021 | 2020 |
Weather (1) | $ | 6,335 | | $ | 25,363 | | $ | 12,790 | | $ | 23,144 | |
| Usage | (3,839) | | (2,321) | | (3,245) | | (1,278) | |
| Total | $ | 2,496 | | $ | 23,042 | | $ | 9,545 | | $ | 21,866 | |
(1)Compared with the 20-year average, weather was 4.1 percent warmer-than-normal and 19.8 percent warmer-than-normal during the three months ended March 31, 2021 and 2020, respectively and 6.4 percent warmer-than-normal and 11.2 percent warmer-than-normal during the.six months ended March 31, 2021 and 2020, respectively.
|
| | | | | | | | | | | | |
| | Three Months Ended | Nine Months Ended |
| | June 30, | June 30, |
| (Thousands) | 2020 | 2019 | 2020 | 2019 |
Weather (1) | $ | (5,261 | ) | $ | 4,530 |
| $ | 17,883 |
| $ | 2,699 |
|
| Usage | 3,061 |
| (3,504 | ) | 1,783 |
| (1,161 | ) |
| Total | $ | (2,200 | ) | $ | 1,026 |
| $ | 19,666 |
| $ | 1,538 |
|
New Jersey Resources Corporation
| |
(1) | Compared with the 20-year average, weather was 21.9 percent colder-than-normal and 25.5 percent warmer-than-normal during the three months ended June 30, 2020 and 2019, respectively, and 7.6 percent and 0.6 percent warmer-than-normal during the nine months ended June 30, 2020 and 2019, respectively.Part I
ITEM 2. MANAGEMENT’S DISCUSSION AND ANALYSIS OF FINANCIAL CONDITION AND RESULTS OF OPERATIONS (Continued) |
Recovery of natural gas costs
NJNG’s cost of natural gas is passed through to our customers, without markup, by applying NJNG’s authorized BGSS rate to actual therms delivered. There is no utility gross margin associated with BGSS costs; therefore, changes in such costs do not impact NJNG’s earnings. NJNG monitors its actual natural gas costs in comparison to its BGSS rates to manage its cash flows associated with its allowed recovery of natural gas costs, which is facilitated through BPU-approved deferred accounting and the BGSS pricing mechanism. Accordingly, NJNG occasionally adjusts its periodic BGSS rates or can issue credits or refunds, as appropriate, for its residential and small commercial customers when the commodity cost varies from the existing BGSS rate. BGSS rates for its large commercial customers are adjusted monthly based on NYMEX prices.
NJNG’s residential and commercial markets are currently open to competition, and its rates are segregated between BGSS (i.e., natural gas commodity) and delivery (i.e., transportation) components. NJNG earns utility gross margin through the delivery of natural gas to its customers and, therefore, is not negatively affected by customers who use its transportation service and purchase natural gas from another supplier. Under an existing order from the BPU, BGSS can be provided by suppliers other than the state’s natural gas utilities; however, customers who purchase natural gas from another supplier continue to use NJNG for transportation service.
On March 27, 2020, the BPU approved, on a final basis, a decrease to NJNG’s BGSS rate for residential and small commercial customers, and an increase to its balancing charge rate, resulting in a $2$2.0 million decrease to the annual revenues credited to BGSS, as well as changes to the CIP rates, resultingwhich resulted in a $10.6 million annual recovery increase, effective October 1, 2019.
On May 29,November 20, 2020, NJNG filednotified the BPU of its intent to provide BGSS bill credits to residential and small commercial sales customers effective December 1, 2020 to December 31, 2020. On December 22, 2020, NJNG notified the BPU of the extension of the BGSS bill credits through January 31, 2021. The actual bill credits given to customers totaled $20.6 million, $19.3 million net of tax.
On March 3, 2021, the BPU approved, on a final basis, NJNG’s annual petition with the BPU to decreasemodify its BGSS, ratebalancing charge and CIP rates for residential and small commercial customers. The rate changes to the BGSS rate, the balancing charge and the CIP rates will resultresulted in a $2$20.4 million overall net decrease to the annual revenues credited to BGSS, a $3.8 million annual decrease related to its balancing charge, as well as changes to CIP rates, which resulted in a $16.5 million annual recovery anticipated to beincrease, effective October 1, 2020. The balancing charge rate includes the cost of balancing natural gas deliveries with customer usage for sales and transportation customers and balancing charge revenues are credited to BGSS.
BGSS Incentive Programs
NJNG is eligible to receive financial incentives for reducing BGSS costs through a series of utility gross margin-sharing programs that include off-system sales, capacity release and storage incentive programs. These programs are designed to encourage better utilization and hedging of NJNG’s natural gas supply, transportation and storage assets. Depending on the program, NJNG shares 80 or 85 percent of utility gross margin generated by these programs with firm customers. Utility gross margin from incentive programs was $2.4$2.1 million and $2.5$1.6 million during the three months ended June 30,March 31, 2021 and 2020, and 2019, respectively, and $6.7 million and $5.9$4.3 million during the ninesix months ended June 30,March 31, 2021 and 2020, and 2019, respectively.
Hedging
In order to provide relative price stability to its natural gas supply portfolio, NJNG employs a hedging strategy with the goal of having at least 75 percent of the Company's projected winter periodic BGSS natural gas sales volumes hedged by each November 1 and at least 25 percent of the projected periodic BGSS natural gas sales hedged for the following April through March period. This is accomplished with the use of various financial instruments including futures, swaps and options used in conjunction with commodity and/or weather-related hedging activity.
New Jersey Resources Corporation
Part I
ITEM 2. MANAGEMENT’S DISCUSSION AND ANALYSIS OF FINANCIAL CONDITION AND RESULTS OF
OPERATIONS (Continued)
Commodity prices
Our Natural Gas Distribution segment is affected by the price of natural gas, which can have a significant impact on our cash flows, short-term financing costs, the price of natural gas charged to our customers through the BGSS clause, our ability to collect accounts receivable, which impacts our bad debt expense, and our ability to maintain a competitive advantage over other energy sources.
New Jersey Resources Corporation
Part I
ITEM 2. MANAGEMENT’S DISCUSSION AND ANALYSIS OF FINANCIAL CONDITION AND RESULTS OF
OPERATIONS (Continued)
Natural gas commodity prices are shown in the graph below, which illustrates the daily natural gas prices(1) in the Northeast market region, also known as TETCO M-3.
(1) Data source from S&P Global Platts.
The maximum price per MMBtu was $5.59$14.57 and $9.17$5.59 and the minimum price was $0.68$0.28 and $1.25$0.68 for the ninesix months ended June 30,March 31, 2021 and 2020, and 2019, respectively. A more detailed discussion of the impacts of the price of natural gas on operating revenues, natural gas purchases and cash flows can be found in the Results of Operations and Cash Flow sections of Item 2. Management's Discussion and Analysis of Financial Condition and Results of Operations.
Societal Benefits Charge
USF
NJNG’s qualifying customers are eligible for the USF program, which is administered by the New Jersey Department of Community Affairs, to help make energy bills more affordable. On June 24, 2019, NJNG filed its annual USF compliance filing proposing an increase to the statewide USF rate, which resulted in the annual recovery increasing by $1.2 million, effective October 1, 2019. On June 25, 2020, NJNG filed its annual USF compliance filing proposing a decrease to the statewide USF rate, which will result in annual decreases of approximately $400,000, to be$400,000. On September 23, 2020, the BPU approved the decrease, effective October 1, 2020.
On March 16, 2020, the BPU approved on a final basis NJNG's annual SBC application including recovery of remediation expenses, an increase in the RAC of approximately $1.2 million annually and an annual decrease to the NJCEP factor of $600,000, which was effective April 1, 2020.
On April 7, 2021, the BPU approved on a final basis NJNG's annual SBC application to recover remediation expenses, including an increase in the RAC, of approximately $1.3 million annually and an increase to the NJCEP factor, of approximately $6.0 million, which was effective April 1, 2021.
Environmental Remediation
NJNG is responsible for the remedial cleanupenvironmental remediation of certain former MGP sites, dating back to gas operations in the late 1800s and early 1900s, which contain contaminated residues from former gas manufacturing operations.operations that ceased operating at these sites by the mid-1950s and, in some cases, had been discontinued many years earlier. Actual MGP remediation costs may vary from management’s estimates due to the developing nature of remediation requirements, regulatory decisions by the NJDEP and related litigation. NJNG reviews these costs at the end of each fiscal year and adjusts its liability and corresponding regulatory asset as necessary to reflect its expected future remediation obligation. Accordingly, NJNG recognized a regulatory asset and an obligation of $128.9$143.5 million as of June 30, 2020,March 31, 2021, a decrease of $2.2$7.1 million compared with September 30, 2019. On March 16, 2020, a stipulation was signed in NJNG's annual SBC application including recovery of remediation expenses, an increase in the RAC of approximately $1.2 million annually and an annual decrease to the NJCEP factor of $600,000. The stipulation is pending BPU approval.prior fiscal period.
New Jersey Resources Corporation
Part I
ITEM 2. MANAGEMENT’S DISCUSSION AND ANALYSIS OF FINANCIAL CONDITION AND RESULTS OF
OPERATIONS (Continued)
In June 2019, NJNG initiated a preliminary assessment of a site in Aberdeen, New Jersey to determine prior ownership and if there were former MGP operations were active at the location. The Company is in the process of conducting site investigation activities to identify and evaluate the nature and extent of MGP relatedMGP-related contaminants present at the location. The costs associated with preliminary assessment and site investigation activities are considered immaterial and are included as a component of NJNG’s annual SBC application to recover remediation expenses. We will continue to gather information to further refine and enhance its estimate of potential costs for this site as it becomes available. See Note 13. Commitments and Contingent Liabilities for a more detailed description.
Other regulatory filings and a more detailed discussion of the filings in this section can be found in Note 4. Regulation in the accompanying Unaudited Condensed Consolidated Financial Statements.
Operating Results
NJNG's operating results are as follows:
| | | | | | | | | | | | | | |
| Three Months Ended | Six Months Ended |
| March 31, | March 31, |
| (Thousands) | 2021 | 2020 | 2021 | 2020 |
| Operating revenues | $ | 310,167 | | $ | 297,220 | | $ | 505,896 | | $ | 516,843 | |
| Operating expenses | | | | |
Natural gas purchases (1) | 118,452 | | 114,256 | | 177,761 | | 210,078 | |
| Operation and maintenance | 52,951 | | 39,815 | | 96,589 | | 76,000 | |
| Regulatory rider expense | 18,413 | | 15,330 | | 29,114 | | 27,072 | |
| Depreciation and amortization | 19,475 | | 18,100 | | 38,644 | | 34,917 | |
| | | | |
| Total operating expenses | 209,291 | | 187,501 | | 342,108 | | 348,067 | |
| Operating income | 100,876 | | 109,719 | | 163,788 | | 168,776 | |
| Other income, net | 4,293 | | 3,792 | | 8,189 | | 5,058 | |
| Interest expense, net of capitalized interest | 9,006 | | 7,473 | | 17,980 | | 15,305 | |
| Income tax provision | 15,622 | | 19,702 | | 23,989 | | 28,337 | |
| Net income | $ | 80,541 | | $ | 86,336 | | $ | 130,008 | | $ | 130,192 | |
|
| | | | | | | | | | | | |
| | Three Months Ended | Nine Months Ended |
| | June 30, | June 30, |
| (Thousands) | 2020 | 2019 | 2020 | 2019 |
| Operating revenues | $ | 128,532 |
| $ | 120,782 |
| $ | 645,375 |
| $ | 622,167 |
|
| Operating expenses | | | | |
Gas purchases (1) | 48,116 |
| 57,187 |
| 258,194 |
| 294,536 |
|
Operation and maintenance (2) | 39,344 |
| 45,138 |
| 115,344 |
| 124,471 |
|
| Regulatory rider expense | 5,464 |
| 4,136 |
| 32,536 |
| 32,159 |
|
| Depreciation and amortization | 18,269 |
| 14,689 |
| 53,186 |
| 42,557 |
|
| Total operating expenses | 111,193 |
| 121,150 |
| 459,260 |
| 493,723 |
|
| Operating income (expense) | 17,339 |
| (368 | ) | 186,115 |
| 128,444 |
|
| Other income, net | 3,023 |
| 1,483 |
| 8,081 |
| 2,891 |
|
| Interest expense, net of capitalized interest | 7,455 |
| 6,301 |
| 22,760 |
| 18,166 |
|
| Income tax provision (benefit) | 939 |
| (1,391 | ) | 29,276 |
| 16,705 |
|
| Net income (loss) | $ | 11,968 |
| $ | (3,795 | ) | $ | 142,160 |
| $ | 96,464 |
|
| |
(1) | Includes related party transactions of approximately $2.5 million and $2.3 million
for the three months ended June 30, 2020 and 2019, respectively, and$9.2 million and $13.9 million for the nine months ended June 30, 2020 and 2019, respectively, the majority of which is eliminated in consolidation.
|
| |
(2) | Includes energy and other taxes due to change in presentation in the Unaudited Condensed Consolidated Statements of Operations. |
Operating Revenues and Natural Gas Purchases
During the three months ended June 30, 2020,March 31, 2021, compared with the three months ended June 30, 2019,March 31, 2020, operating revenues increased by 6.44.4 percent and natural gas purchases increased 3.7 percent. During the six months ended March 31, 2021, compared with the six months ended March 31, 2020, operating revenues decreased by 2.1 percent and natural gas purchases decreased 15.915.4 percent. During the nine months ended June 30, 2020, compared with the nine months ended June 30, 2019, operating revenues increased by 3.7 percent and gas purchases decreased 12.3 percent.
The factors contributing to the increases and decreases in operating revenues and natural gas purchases are as follows:
| | | | | | | | | | | | | | | | | |
| Three Months Ended | | Six Months Ended |
| March 31, | | March 31, |
| 2021 v. 2020 | | 2021 v. 2020 |
| (Thousands) | Operating
revenues | Natural gas
purchases | | Operating
revenues | Natural gas
purchases |
| Firm sales | $ | 39,422 | | $ | 17,970 | | | $ | 31,218 | | $ | 12,144 | |
| BGSS incentives | 5,193 | | 4,666 | | | (5,682) | | (8,058) | |
| SAFE II/NJ RISE | 2,681 | | — | | | 5,012 | | — | |
| Base rate impact | (117) | | — | | | 5,076 | | — | |
| CIP adjustments | (20,546) | | — | | | (12,321) | | — | |
| Average BGSS rates | (6,551) | | (6,551) | | | (14,891) | | (14,891) | |
| Bill credits | (11,071) | | (11,071) | | | (20,590) | | (20,590) | |
Other (1) | 3,936 | | (818) | | | 1,231 | | (922) | |
| Total increase (decrease) | $ | 12,947 | | $ | 4,196 | | | $ | (10,947) | | $ | (32,317) | |
(1)Other includes changes in rider rates, including those related to EE, NJCEP and other programs.
|
| | | | | | | | | | | | | |
| | Three Months Ended | | Nine Months Ended |
| | June 30, | | June 30, |
| | 2020 v. 2019 | | 2020 v. 2019 |
| (Thousands) | Operating revenues | Gas purchases | | Operating revenues | Gas purchases |
| Base rate impact | 14,314 |
| — |
| | 48,580 |
| — |
|
| CIP adjustments | (3,226 | ) | — |
| | 18,128 |
| — |
|
| SAFE II/NJ RISE | 1,250 |
| — |
| | 7,040 |
| — |
|
| Firm sales | $ | 12,722 |
| $ | 7,984 |
| | $ | (31,921 | ) | $ | (14,501 | ) |
| BGSS incentives | (15,822 | ) | (15,680 | ) | | (20,133 | ) | (20,950 | ) |
| Average BGSS rates | (1,367 | ) | (1,367 | ) | | (873 | ) | (873 | ) |
Other (1) | (121 | ) | (8 | ) | | 2,387 |
| (18 | ) |
| Total increase (decrease) | $ | 7,750 |
| $ | (9,071 | ) | | $ | 23,208 |
| $ | (36,342 | ) |
| |
(1)
| Other includes changes in rider rates, including those related to EE, NJCEP and other programs. |
New Jersey Resources Corporation
Part I
ITEM 2. MANAGEMENT’S DISCUSSION AND ANALYSIS OF FINANCIAL CONDITION AND RESULTS OF
OPERATIONS (Continued)
Non-GAAP Financial Measures
Management uses utility gross margin, a non-GAAP financial measure, when evaluating the operating results of NJNG. NJNG's utility gross margin is defined as natural gas revenues less natural gas purchases, sales tax, and regulatory rider expenses, and may not be comparable to the definition of gross margin used by others in the natural gas distribution business and other industries. Management believes that utility gross margin provides a meaningful basis for evaluating utility operations since natural gas costs, sales tax and regulatory rider expenses are included in operating revenuerevenues and passed through to customers and, therefore, have no effect on utility gross margin. Non-GAAP financial measures are not in accordance with, or an alternative to, GAAP and should be considered in addition to, and not as a substitute for, the comparable GAAP measure.
Utility Gross Margin
A reconciliation of operating revenues, the closest GAAP financial measure to NJNG's utility gross margin, is as follows:
| | | | | | | | | | | | | | |
| Three Months Ended | Six Months Ended |
| March 31, | March 31, |
| (Thousands) | 2021 | 2020 | 2021 | 2020 |
| Operating revenues | $ | 310,167 | | $ | 297,220 | | $ | 505,896 | | $ | 516,843 | |
| Less: | | | | |
| Natural gas purchases | 118,452 | | 114,256 | | 177,761 | | 210,078 | |
| Regulatory rider expense | 18,413 | | 15,330 | | 29,114 | | 27,072 | |
| Utility gross margin | $ | 173,302 | | $ | 167,634 | | $ | 299,021 | | $ | 279,693 | |
|
| | | | | | | | | | | | |
| | Three Months Ended | Nine Months Ended |
| | June 30, | June 30, |
| (Thousands) | 2020 | 2019 | 2020 | 2019 |
| Operating revenues | $ | 128,532 |
| $ | 120,782 |
| $ | 645,375 |
| $ | 622,167 |
|
| Less: | | | | |
| Gas purchases | 48,116 |
| 57,187 |
| 258,194 |
| 294,536 |
|
| Regulatory rider expense | 5,464 |
| 4,136 |
| 32,536 |
| 32,159 |
|
| Utility gross margin | $ | 74,952 |
| $ | 59,459 |
| $ | 354,645 |
| $ | 295,472 |
|
Utility gross margin consists of three components:
•utility firm gross margin generated from only the delivery component of either a sales tariff or a transportation tariff from residential and commercial customers who receive natural gas service from NJNG;
•BGSS incentive programs, where revenues generated or savings achieved from BPU-approved off-system sales, capacity release or storage incentive programs are shared between customers and NJNG; and
•utility gross margin generated from off-tariff customers, as well as interruptible customers.
The following provides more information on the components of utility gross margin and associated throughput (Bcf) of natural gas delivered to customers:
| | | | | | | | | | | | | | | | | | | | | | | | | | | | | | | | |
| Three Months Ended | Six Months Ended |
| March 31, | March 31, |
| 2021 | | 2020 | 2021 | | 2020 |
| ($ in thousands) | Margin | Bcf | | Margin | Bcf | Margin | Bcf | | Margin | Bcf |
| Utility gross margin/throughput | | | | | | | | | | |
| Residential | $ | 124,468 | | 22.7 | | | $ | 120,541 | | 18.9 | | $ | 210,443 | | 36.3 | | | $ | 197,623 | | 33.5 | |
| Commercial, industrial and other | 23,050 | | 4.3 | | | 22,884 | | 3.6 | | 40,090 | | 6.7 | | | 38,071 | | 6.4 | |
| Firm transportation | 22,878 | | 5.7 | | | 21,469 | | 5.1 | | 40,166 | | 9.6 | | | 37,128 | | 9.4 | |
| Total utility firm gross margin/throughput | 170,396 | | 32.7 | | | 164,894 | | 27.6 | | 290,699 | | 52.6 | | | 272,822 | | 49.3 | |
| BGSS incentive programs | 2,114 | | 23.6 | | | 1,587 | | 28.2 | | 6,692 | | 49.5 | | | 4,316 | | 56.1 | |
| Interruptible/off-tariff agreements | 792 | | 0.8 | | | 1,153 | | 4.7 | | 1,630 | | 5.3 | | | 2,555 | | 13.7 | |
| Total utility gross margin/throughput | $ | 173,302 | | 57.1 | | | $ | 167,634 | | 60.5 | | $ | 299,021 | | 107.4 | | | $ | 279,693 | | 119.1 | |
|
| | | | | | | | | | | | | | | | | | | | | | |
| | Three Months Ended | Nine Months Ended |
| | June 30, | June 30, |
| | 2020 | | 2019 | 2020 | | 2019 |
| ($ in thousands) | Margin | Bcf | | Margin | Bcf | Margin | Bcf | | Margin | Bcf |
| Utility gross margin/throughput | | | | | | | | | | |
| Residential | $ | 47,002 |
| 7.7 |
| | $ | 35,914 |
| 5.9 |
| $ | 244,625 |
| 41.2 |
| | $ | 199,698 |
| 43.0 |
|
| Commercial, industrial and other | 11,668 |
| 1.2 |
| | 9,198 |
| 1.2 |
| 49,739 |
| 7.6 |
| | 43,217 |
| 9.0 |
|
| Firm transportation | 12,655 |
| 2.3 |
| | 10,259 |
| 2.5 |
| 49,783 |
| 11.7 |
| | 42,526 |
| 12.1 |
|
| Total utility firm gross margin/throughput | 71,325 |
| 11.2 |
| | 55,371 |
| 9.6 |
| 344,147 |
| 60.5 |
| | 285,441 |
| 64.1 |
|
| BGSS incentive programs | 2,402 |
| 28.2 |
| | 2,544 |
| 33.2 |
| 6,718 |
| 84.3 |
| | 5,901 |
| 89.0 |
|
| Interruptible/off-tariff agreements | 1,225 |
| 5.2 |
| | 1,544 |
| 12.0 |
| 3,780 |
| 18.9 |
| | 4,130 |
| 24.8 |
|
| Total utility gross margin/throughput | $ | 74,952 |
| 44.6 |
| | $ | 59,459 |
| 54.8 |
| $ | 354,645 |
| 163.7 |
| | $ | 295,472 |
| 177.9 |
|
Utility Firm Gross Margin
Utility firm gross margin increased $16 million and $58.7$5.5 million during the three and nine months ended June 30, 2020, respectively,March 31, 2021, compared with the three and nine months ended June 30, 2019,March 31, 2020, due primarily to increased returns on infrastructure programs related to SAFE II and NJ RISE.Utility firm gross margin increased $17.9 million during the six months ended March 31, 2021, compared with the six months ended March 31, 2020, due primarily to the increase in base rates, along with increased returns on infrastructure programs related to SAFE II and NJ RISE.as previously discussed.
New Jersey Resources Corporation
Part I
ITEM 2. MANAGEMENT’S DISCUSSION AND ANALYSIS OF FINANCIAL CONDITION AND RESULTS OF
OPERATIONS (Continued)
BGSS Incentive Programs
The factors contributing to the change in utility gross margin generated by BGSS incentive programs are as follows:
| | | | | | | | | | | | | | | | | | | | |
| Three Months Ended | Six Months Ended |
| March 31, | March 31, |
| (Thousands) | 2021 v. 2020 | 2021 v. 2020 |
| Off-system sales | | $ | 903 | | | | $ | 767 | | |
| Storage | | (327) | | | | 1,749 | | |
| Capacity release | | (49) | | | | (140) | | |
| Total increase | | $ | 527 | | | | $ | 2,376 | | |
|
| | | | | | | | | | |
| | Three Months Ended | Nine Months Ended |
| | June 30, | June 30, |
| (Thousands) | 2020 v. 2019 | 2020 v. 2019 |
| Storage | | $ | (2 | ) | | | $ | 1,058 |
| |
| Off-system sales | | 111 |
| | | 458 |
| |
| Capacity release | | (251 | ) | | | (699 | ) | |
| Total (decrease) increase | | $ | (142 | ) | | | $ | 817 |
| |
The decrease in BGSS incentive programs during the three months ended June 30, 2020, compared with the three months ended June 30, 2019, was due primarily to a decrease in capacity release volume, partially offset by an increased margin from off-system sales. The increase in BGSS incentive programs during the ninethree and six months ended June 30, 2020,March 31, 2021, compared with the ninethree and six months ended June 30, 2019,March 31, 2020, was due primarily to an increase in the storage incentive program related to timing of storage injections and improvedincreased margins from off-system sales partially offset by a decrease in capacity release volume.along with improved and earlier opportunities for storage incentive compared with the prior year.
Operation and Maintenance Expense
O&M expense decreased $5.8increased $13.1 million during the three months ended March 31, 2021, compared with the three months ended March 31, 2020, due primarily to increased compensation and information technologies expenses. O&M expense increased $20.6 million during the six months ended March 31, 2021, compared with the six months ended March 31, 2020, due primarily to increased compensation, information technology and bad debt expenses.
Depreciation Expense
Depreciation expense increased $1.4 million and $9.1$3.7 million during the three and ninesix months ended months ended June 30, 2020,March 31, 2021, compared with the three and ninesix months ended months ended June 30, 2019, respectively, due primarily to lower consulting expenses, decreased shared corporate costs and decreased compensation costs.
Depreciation Expense
Depreciation expense increased $3.6 million and $10.6 million during the three and nine months ended June 30,March 31, 2020, compared with the three and nine months ended June 30, 2019, respectively, as a result of additional utility plant being placed into service, as well as an increase in the overall depreciation rate from 2.4 percent to 2.78 percent resulting from the settlement of the base rate case.service.
Interest Expense
Interest expense increased $1.2$1.5 million and $4.6$2.7 million during the three and ninesix months ended June 30, 2020,March 31, 2021, compared with the three and ninesix months ended June 30, 2019, respectively,March 31, 2020, due primarily to increased outstanding long-term debt.
Other Income
Other income increased $1.5 million$501,000 and $5.2$3.1 million during the three and ninesix months ended June 30, 2020,March 31, 2021, compared with the three and ninesix months ended June 30, 2019, respectively,March 31, 2020, due primarily to increased AFUDC earned on infrastructure projects.
Income Tax Provision
IncomeIncome tax provision increased $2.3decreased $4.1 million and $12.6$4.3 million during the three and ninesix months ended June 30, 2020,March 31, 2021, compared with the three and ninesix months ended June 30, 2019, respectively,March 31, 2020, due to lower operating income.
Net Income
Net income decreased $5.8 million during the three months ended March 31, 2021, compared with the three months ended March 31, 2020, due primarily to increased operating income.
Net Income
O&M, depreciation and interest expenses, as previously discussed. Net income increased $15.8 million and $45.7 millionremained relatively flat during the three and ninesix months ended June 30, 2020,March 31, 2021, compared with the three and ninesix months ended June 30, 2019March 31, 2020.
, respectively, due primarily to the increase in operating revenues related to increased base rates and increased other income related to AFUDC earned on infrastructure projects, partially offset by the increases in depreciation, income tax expense and interest expense, as previously discussed.
New Jersey Resources Corporation
Part I
ITEM 2. MANAGEMENT’S DISCUSSION AND ANALYSIS OF FINANCIAL CONDITION AND RESULTS OF
OPERATIONS (Continued)
Clean Energy Ventures Segment
Overview
Our Clean Energy Ventures segment actively pursues opportunities in the renewable energy markets. Clean Energy Ventures enters into various agreements to install solar net-metered systems for residential and commercial customers, as well as large commercial grid-connected projects. In addition, Clean Energy Ventures enters into various long-term agreements, including PPAs, to supply energy from commercial solar projects.
Capital expenditures related to clean energy projects are subject to change due to a variety of factors that may affect our ability to commence operations at these projects on a timely basis or at all, including logistics associated with the start-up of residential and commercial solar projects, such as timing of construction schedules, the permitting and regulatory process, any delays related to electric grid interconnection, economic trends, unforeseen events and the ability to access capital or allocation of capital to other investments or business opportunities. Clean Energy Ventures is also subject to risks associated with COVID-19, which may include impacts to residential solar customer growth and customer collections, our ability to identify and develop commercial solar asset investments, impacts to our supply chain and our ability to source materials for construction.
The primary contributors toward the value of qualifying clean energy projects are tax incentives and SRECs. Changes in the federal statutes related to the ITC or in the marketplace and/or relevant state legislation and regulatory policies affecting the market for solar renewable energy credits, could significantly affect future results.
Solar
Solar projects placed in service and related expenditures are as follows:
| | | | | | | | | | | | | | | | | | | | | | | | | | |
| Three Months Ended |
| March 31, |
| ($ in Thousands) | 2021 | 2020 |
| Placed in service | Projects | MW | Costs | Projects | MW | Costs |
| Grid-connected | 1 | | 2.7 | | $ | 5,492 | | | 2 | | 20.0 | | $ | 40,385 | | |
| Net-metered: | | | | | | | | |
| | | | | | | | |
| Residential | 80 | | 0.8 | | 2,230 | | | 157 | | 1.7 | | 5,075 | | |
| Total placed in service | 81 | | 3.5 | | $ | 7,722 | | | 159 | | 21.7 | | $ | 45,460 | | |
|
| | | | | | | | | | | | | | | | |
| | Three Months Ended |
| | June 30, |
| ($ in Thousands) | 2020 | 2019 |
| Placed in service | Projects | MW | Costs | Projects | MW | Costs |
| Grid-connected | 3 |
| 32.0 |
| $ | 53,771 |
| | 1 |
| 10.0 |
| $ | 21,785 |
| |
| Net-metered: | | | | | | | | |
| Commercial | — |
| — |
| 50 |
| | — |
| — |
| — |
| |
| Residential | 90 |
| 1.2 |
| 3,291 |
| | 190 |
| 1.9 |
| 6,178 |
| |
| Total placed in service | 93 |
| 33.2 |
| $ | 57,112 |
| | 191 |
| 11.9 |
| $ | 27,963 |
| |
| |
(1) | Includes an operational 12.5 MW commercial solar project acquired in June 2020. |
| | | | | | | | | | | | | | | | | | | | | | | | | | |
| Six Months Ended |
| March 31, |
| ($ in Thousands) | 2021 | 2020 |
| Placed in service | Projects | MW | Costs | Projects | MW | Costs |
| Grid-connected | 2 | | 5.6 | | $ | 9,175 | | | 3 | | 22.9 | | $ | 52,092 | | |
| Net-metered: | | | | | | | | |
| | | | | | | | |
| Residential | 126 | | 1.3 | | 3,829 | | | 281 | | 3.0 | | 9,085 | | |
| Total placed in service | 128 | | 6.9 | | $ | 13,004 | | | 284 | | 25.9 | | $ | 61,177 | | |
(1)Includes an operational 2.9 MW commercial solar project acquired in December 2020. |
| | | | | | | | | | | | | | | | |
| | Nine Months Ended |
| | June 30, |
| ($ in Thousands) | 2020 | 2019 |
| Placed in service | Projects | MW | Costs | Projects | MW | Costs |
| Grid-connected | 6 |
| 54.9 |
| $ | 105,863 |
| | 2 |
| 20.0 |
| $ | 42,340 |
| |
| Net-metered: | | | | | | | | |
| Commercial | — |
| — |
| 50 |
| | 1 |
| 9.2 |
| 27,562 |
| |
| Residential | 371 |
| 4.2 |
| 12,376 |
| | 545 |
| 5.5 |
| 17,086 |
| |
| Total placed in service | 377 |
| 59.1 |
| $ | 118,289 |
| | 548 |
| 34.7 |
| $ | 86,988 |
| |
| |
(1) | Includes an operational 12.5 MW commercial solar project acquired in June 2020. |
Since inception, Clean Energy Ventures has constructed a total of 350.5364.3 MW of solar capacity and has an additional 7.1 MW under construction or planned for fiscal 2020.capacity. Projects that were placed in service through December 31, 2019, qualifyqualified for a 30-percent federal ITC. The credit declinesdeclined to 26 percent for property under construction during 2020 and was originally scheduled to decline to 22 percent for property under construction during 2021 and 10 percent for any property that is under construction beforeafter 2021. On December 27, 2020, the 26 percent federal ITC was extended through the end of 2022. The credit declines to 22 percent after 2022 and to 10 percent after 2023.
Projects placed in service after December 31, 2019, may also qualifyqualified for a 30 percent federal ITC if five percent or more of the total costs of a solar property are incurred before the end of the applicable year and there are continuous efforts to advance towards completion of the project, based on the IRS guidance around the ITC safe harbor determination. We have taken steps to preserve the ITC at the higher rate for certain solar projects that are completed after the scheduled reduction in rates, in accordance with IRS guidance.
New Jersey Resources Corporation
Part I
ITEM 2. MANAGEMENT’S DISCUSSION AND ANALYSIS OF FINANCIAL CONDITION AND RESULTS OF
OPERATIONS (Continued)
Clean Energy Ventures may enter into transactions to sell certain of its commercial solar assets concurrent with agreements to lease the assets back over a period of five to 15 years. The Company will continue to operate the solar assets and are responsible for related expenses and entitled to retain the revenue generated from SRECs, TRECs and energy sales. The ITCs and other tax benefits associated with these solar projects transfer to the buyer if applicable; however, the lease payments are structured so that Clean Energy Ventures is compensated for the transfer of the related tax incentives. Accordingly, for solar projects financed under sale leasebacks for which the assets were sold during the first 5 years of in service life, Clean Energy Ventures recognizes the equivalent value of the ITC in other income on the Unaudited Condensed Consolidated Statements of Operations over the respective five-year ITC recapture periods, starting with the second year of the lease. In JuneDecember 2020,, Clean Energy Ventures received proceeds of $42.9$12.1 million in connection with the sale-leasebacksale leaseback of commercial solar assets. Clean Energy Ventures did not enter into any sale-leasebacksale leaseback transactions for its commercial solar assets during the ninesix months ended June 30, 2019.March 31, 2020.
As part of its solar investment portfolio, Clean Energy Ventures operates a residential and small commercial solar program, The Sunlight Advantage®, that provides qualifying homeowners and small business owners the opportunity to have a solar system installed at their home or place of business with no installation or maintenance expenses. Clean Energy Ventures owns, operates and maintains the system over the life of the contract in exchange for monthly payments.
Once aFor solar installation has received the proper certifications and commences operations,installations placed in-service in New Jersey prior to April 30, 2020, each MWh of electricity produced creates an SREC that represents the renewable energy attribute of the solar-electricity generated that can be sold to third parties, predominantly load-serving entities that are required to comply with the solar requirements under New Jersey's renewable portfolio standard.
In December 2019, the BPU established the TREC as pursuant to the successor program to the SREC activity consistedprogram. TRECs provide a fixed compensation base multiplied by an assigned project factor in order to determine their value. The project factor is determined by the type and location of the following:project, as defined. All TRECs generated are required to be purchased monthly by a TREC program administrator as appointed by the BPU.
|
| | | | |
| | Nine Months Ended |
| | June 30, |
| | 2020 | 2019 |
| Inventory balance as of October 1, | 53,395 |
| 105,192 |
|
| SRECs generated | 253,649 |
| 197,041 |
|
| SRECs delivered | (62,680 | ) | (104,670 | ) |
| Inventory balance as of June 30, | 244,364 |
| 197,563 |
|
| | | | | | | | | | | |
| SREC and TREC activity consisted of the following: | Six Months Ended |
| March 31, |
| 2021 | 2020 |
| SRECs | TRECs | SRECs |
| Inventory balance as of October 1, | 35,011 | | 9,270 | | 53,395 | |
| RECs generated | 141,071 | | 10,310 | | 138,700 | |
| RECs delivered | (9,495) | | (5,294) | | (19,693) | |
| Inventory balance as of December 31, | 166,587 | | 14,286 | | 172,402 | |
The average SREC sales price was $189$218 and $190$189 during the ninesix months ended June 30,March 31, 2021 and 2020, respectively and 2019, respectively.the average TREC price was $147 during the six months ended March 31, 2021.
Clean Energy Ventures hedges its expected SREC production through the use of forward sales contracts. The following table reflects the hedged percentage of our projected inventory related to its in-service commercial and residential assets:
| | | | | |
Energy Year (1) | Percent of SRECs Hedged |
| 2021 | 98% |
| 2022 | 97% |
| 2023 | 97% |
| 2024 | 93% |
| 2025 | 36% |
| 2026 | 10% |
|
| |
Energy Year (1) | Percent of SRECs Hedged |
| 2020 | 99% |
| 2021 | 94% |
| 2022 | 92% |
| 2023 | 55% |
| |
(1) | Energy years are compliance periods for New Jersey's renewable portfolio standard that run from June 1 to May 31. |
There are no direct costs associated with the production of SRECs or TRECs by our solar assets. All related costs are included as a component of O&M expenses on the Unaudited Condensed Consolidated Statements of Operations, including such expenses as facility maintenance and various fees.
Onshore Wind
Clean Energy Ventures invested in small to mid-size onshore wind projects that fit its investment profile. In February 2019, Clean Energy Ventures finalized the sale of its remaining wind assets to a subsidiary of Skyline Renewables LLC for total proceeds of $208.6 million. The transaction generated a pre-tax gain of $645,000, which was recognized as a component of O&M expense on the Unaudited Condensed Consolidated Statements of Operations.
New Jersey Resources Corporation
Part I
ITEM 2. MANAGEMENT’S DISCUSSION AND ANALYSIS OF FINANCIAL CONDITION AND RESULTS OF
OPERATIONS (Continued)
Operating Results
Clean Energy Ventures’ financial results are summarized as follows:
| | | | | | | | | | | | | | |
| Three Months Ended | Six Months Ended |
| March 31, | March 31, |
| (Thousands) | 2021 | 2020 | 2021 | 2020 |
| Operating revenues | $ | 6,476 | | $ | 5,995 | | $ | 12,846 | | $ | 12,207 | |
| Operating expenses | | | | |
| Operation and maintenance | 8,260 | | 7,479 | | 17,461 | | 14,813 | |
| Depreciation and amortization | 4,685 | | 6,603 | | 10,118 | | 12,919 | |
| | | | |
| Total operating expenses | 12,945 | | 14,082 | | 27,579 | | 27,732 | |
| Operating loss | (6,469) | | (8,087) | | (14,733) | | (15,525) | |
| Other income (expense), net | 149 | | (41) | | 87 | | (124) | |
| Interest expense, net | 5,266 | | 4,835 | | 10,300 | | 9,327 | |
| Income tax benefit | (2,714) | | (4,134) | | (5,800) | | (7,968) | |
| Net loss | $ | (8,872) | | $ | (8,829) | | $ | (19,146) | | $ | (17,008) | |
|
| | | | | | | | | | | | |
| | Three Months Ended | Nine Months Ended |
| | June 30, | June 30, |
| (Thousands) | 2020 | 2019 | 2020 | 2019 |
| Operating revenues | $ | 13,396 |
| $ | 11,450 |
| $ | 25,603 |
| $ | 37,707 |
|
| Operating expenses | | | | |
Operation and maintenance (1) | 7,542 |
| 9,488 |
| 22,355 |
| 21,479 |
|
| Depreciation and amortization | 10,121 |
| 8,239 |
| 29,429 |
| 24,253 |
|
| Total operating expenses | 17,663 |
| 17,727 |
| 51,784 |
| 45,732 |
|
| Operating loss | (4,267 | ) | (6,277 | ) | (26,181 | ) | (8,025 | ) |
| Other (expense) income, net | (77 | ) | 643 |
| (201 | ) | 494 |
|
| Interest expense, net | 5,070 |
| 4,320 |
| 14,397 |
| 14,405 |
|
| Income tax provision (benefit) | 4,193 |
| (1,787 | ) | (38,432 | ) | (39,033 | ) |
| Net (loss) income | $ | (13,607 | ) | $ | (8,167 | ) | $ | (2,347 | ) | $ | 17,097 |
|
| |
(1) | Includes energy and other taxes due to change in presentation in the Unaudited Condensed Consolidated Statements of Operations. |
Operating Revenues
Operating revenues increased $481,000 and $639,000 during the three and six months ended March 31, 2021, compared with the three and six months ended March 31, 2020, due primarily to the recognition of TREC revenue, which was not present during the same period in the prior year.
Operation and Maintenance Expense
O&M expense increased $781,000 and $2.6 million during the three and six months ended March 31, 2021, compared with the three and six months ended March 31, 2020, due primarily to increased project maintenance, lease and information technology expenses.
Depreciation Expense
Depreciation expense decreased $1.9 million and $2.8 million during the three and six months ended March 31, 2021, compared with the three and six months ended March 31, 2020, primarily due to the change in estimated useful lives of our commercial solar assets, effective July 1, 2020.
Income Tax Benefit
Income tax benefit decreased $1.4 million and $2.2 million during the three and six months ended March 31, 2021, compared with the three and six months ended March 31, 2020, due primarily to a decreased state tax rate.
Net Income
Net income remained relatively flat during the three months ended June 30, 2020,March 31, 2021, compared with the three months ended June 30, 2019, due primarily to increased SREC sales, residential solar revenue and electricity sales. Operating revenuesMarch 31, 2020. Net income decreased $12.1$2.1 million during the ninesix months ended June 30, 2020,March 31, 2021, compared with the ninesix months ended June 30, 2019, March 31, 2020, due primarily to the timing of SREC sales and decreased electricity sales as a result of the sale of the remaining wind assets in February 2019,increased O&M, partially offset by increased residential solar revenue.
Operation and Maintenance Expense
O&M expense decreased $1.9 million during the three months ended June 30, 2020, compared with the three months ended June 30, 2019, due primarily to decreased shared corporate costs related to technology improvement projects, partially offset by increased project maintenance expenses related to additional projects placed in service. O&M expense increased $876,000 during the nine months ended June 30, 2020, compared with the nine months ended June 30, 2019, due primarily to increased project maintenance expenses, partially offset by a decrease in shared corporate costs, as well as a pre-tax gain of $645,000, associated with the sale of the remaining wind assets in February 2019, that did not recur.
Depreciation Expense
Depreciation expense increased $1.9 million and $5.2 million during the three and nine months ended June 30, 2020, compared with the three and nine months ended June 30, 2019, respectively, due primarily to increased solar capital additions placed in service.
Income Tax Provision (Benefit)
Income tax provision increased $6 million during the three months ended June 30, 2020, compared with the three months ended June 30, 2019, due primarily to a decrease in forecasted ITCs expected to be recognized in fiscal 2020. Income tax benefit decreased $601,000 during the nine months ended June 30, 2020, compared with the nine months ended June 30, 2019, due primarily to a decrease in forecasted ITCs.
Net Income
Net income decreased $5.4 million during the three months ended June 30, 2020, compared with the three months ended June 30, 2019, due primarily to increased income tax expense, as previously discussed. Net income decreased $19.4 million during the nine months ended June 30, 2020, compared with the nine months ended June 30, 2019, due primarily to the decreased operating revenue and increased depreciation expense, as previously discussed.
Non-GAAP Financial Measures
Management of the Company uses NFE, a non-GAAP financial measure, when evaluating the operating results of Clean Energy Ventures. GAAP requires us, during the interim periods, to estimate our annual effective tax rate and use this rate to calculate the year-to-date tax provision. We also determine an annual estimated effective tax rate for NFE purposes and calculate a quarterly
New Jersey Resources Corporation
Part I
ITEM 2. MANAGEMENT’S DISCUSSION AND ANALYSIS OF FINANCIAL CONDITION AND RESULTS OF
OPERATIONS (Continued)
tax adjustment based on the differences between our forecasted net income and our forecasted NFE for the fiscal year. This adjustment is applied to Clean Energy Ventures, as such adjustment is primarily related to tax credits generated by Clean Energy Ventures. No adjustment is needed during the fourth quarter, since the actual effective tax rate is calculated at year end. Accordingly, for NFE purposes, the annual estimated effective tax rate is (3) percent for fiscal 2020 and (13.7) percent for fiscal 2019.
Since the annual estimated effective tax rate is based on certain forecasted assumptions, including estimates surrounding completion of projects, the rate and resulting NFE are subject to change. The details of such tax adjustments can be found in the table below. Non-GAAP financial measures are not in accordance with, or an alternative to GAAP, and should be considered in addition to, and not as a substitute for the comparable GAAP measure. A reconciliation of Clean Energy Ventures' net income, the most directly comparable GAAP financial measure to NFE is as follows:
|
| | | | | | | | | | | | |
| | Three Months Ended | Nine Months Ended |
| | June 30, | June 30, |
| (Thousands) | 2020 | 2019 | 2020 | 2019 |
| Net (loss) income | $ | (13,607 | ) | $ | (8,167 | ) | $ | (2,347 | ) | $ | 17,097 |
|
| Add: | | | | |
| Net income to NFE tax adjustment | (284 | ) | 1,029 |
| (470 | ) | 7,700 |
|
| Net financial (loss) earnings | $ | (13,891 | ) | $ | (7,138 | ) | $ | (2,817 | ) | $ | 24,797 |
|
Energy Services Segment
Overview
Energy Services markets and sells natural gas to wholesale and retail customers and manages natural gas storagetransportation and transportationstorage assets throughout major market areas across North America. Energy Services maintains a strategic portfolio of natural gas storagetransportation and transportationstorage contracts that it utilizes in conjunction with its market expertise to provide service and value to its customers. Availability of these storagetransportation and transportationstorage contracts allows Energy Services to generate market opportunities by capturing price differentials over specific time horizons and between geographic market locations.
Energy Services also provides management of storagetransportation and transportationstorage assets for natural gas producers and regulated utilities. These management transactions typically involve the release of producer/utility owned storage and/or transportation
New Jersey Resources Corporation
Part I
ITEM 2. MANAGEMENT’S DISCUSSION AND ANALYSIS OF FINANCIAL CONDITION AND RESULTS OF
OPERATIONS (Continued)
capacity in combination with either an obligation to purchase and/or deliver physical natural gas. In addition to the contractual purchase and/or sale of physical natural gas, Energy Services generates or pays fee-based margin in exchange for its active management and may provide the producer and/or utility with additional margin based on actual results.
In conjunction with the active management of these contracts, Energy Services generates financial margin by identifying market opportunities and simultaneously entering into natural gas purchase/sale, storage or transportation contracts and financial derivative contracts. In cases where storage is utilized to fulfill these contracts, these forecast sales and/or purchases are economically hedged through the use of financial derivative contracts. The financial derivative contracts consist primarily of exchange-traded futures, options and swap contracts, and are frequently used to lock in anticipated transactional cash flows and to help manage volatility in natural gas market prices. Generally, when its storagetransportation and transportationstorage contracts are exposed to periods of increased market volatility, Energy Services is able to implement strategies that allow them to capture margin by improving the respective time or geographic spreads on a forward basis.
Energy Services accounts for its physical commodity contracts and its financial derivative instruments at fair value on the Unaudited Condensed Consolidated Balance Sheets. Changes in the fair value of physical commodity contracts and financial derivative instruments are included in earnings as a component of operating revenuerevenues or natural gas purchases on the Unaudited Condensed Consolidated Statements of Operations. Volatility in reported net income at Energy Services can occur over periods of time due to changes in the fair value of derivatives, as well as timing differences related to certain transactions. Unrealized gains and losses can fluctuate as a result of changes in the price of natural gas, SRECs and foreign currency from the original transaction price. Volatility in earnings can also occur as a result of timing differences between the settlement of financial derivatives and the sale of the underlying physical commodity. For example, when a financial instrument settles and the physical natural gas is injected into inventory, the realized gains and losses associated with the financial instrument are recognized in earnings. However, the gains and losses associated with the physical natural gas are not recognized in earnings until the natural gas inventory is withdrawn from storage and sold, at which time Energy Services realizes the entire margin on the transaction.
Operating Results
Energy Services’ financial results are summarized as follows:
| | | | | | | | | | | | | | |
| Three Months Ended | Six Months Ended |
| March 31, | March 31, |
| (Thousands) | 2021 | 2020 | 2021 | 2020 |
Operating revenues (1) | $ | 462,569 | | $ | 313,701 | | $ | 692,046 | | $ | 684,116 | |
| Operating expenses | | | | |
Natural gas purchases (including demand charges (2)(3)) | 330,280 | | 318,912 | | 504,117 | | 636,636 | |
| Operation and maintenance | 32,998 | | 4,822 | | 37,014 | | 9,560 | |
| Depreciation and amortization | 13 | | 27 | | 55 | | 56 | |
| | | | |
| Total operating expenses | 363,291 | | 323,761 | | 541,186 | | 646,252 | |
| Operating income (loss) | 99,278 | | (10,060) | | 150,860 | | 37,864 | |
| Other income, net | 87 | | 113 | | 179 | | 192 | |
| Interest expense, net | 575 | | 937 | | 1,255 | | 2,163 | |
| Income tax provision (benefit) | 23,128 | | (2,449) | | 35,250 | | 8,303 | |
| Net income (loss) | $ | 75,662 | | $ | (8,435) | | $ | 114,534 | | $ | 27,590 | |
(1)Includes related party transactions of approximately $2.8 million and $259,000 for the three months ended March 31, 2021 and 2020, respectively, and $4.9 million and $1.9 million for the six months ended March 31, 2021 and 2020, respectively, which are eliminated in consolidation.
(2)Costs associated with pipeline and storage capacity are expensed over the term of the related contracts, which generally varies from less than one year to ten years.
(3)Includes related party transactions of approximately $226,000 and $46,000 for the three months ended March 31, 2021 and 2020, respectively, and $391,000 and $92,000 for the six months ended March 31, 2021 and 2020, respectively, a portion of which is eliminated in consolidation.
Energy Services' portfolio of financial derivative instruments are composed of:
| | | | | | | | |
| Six Months Ended |
| March 31, |
| (in Bcf) | 2021 | 2020 |
| Net short futures contracts | 12.4 | | 29.9 | |
| | |
| | |
New Jersey Resources Corporation
Part I
ITEM 2. MANAGEMENT’S DISCUSSION AND ANALYSIS OF FINANCIAL CONDITION AND RESULTS OF
OPERATIONS (Continued)
Operating Results
Energy Services’ financial results are summarized as follows:
|
| | | | | | | | | | | | |
| | Three Months Ended | Nine Months Ended |
| | June 30, | June 30, |
| (Thousands) | 2020 | 2019 | 2020 | 2019 |
Operating revenues (1) | $ | 133,543 |
| $ | 290,021 |
| $ | 817,659 |
| $ | 1,425,113 |
|
| Operating expenses | | | | |
Gas purchases (including demand charges (2)(3)) | 167,061 |
| 290,881 |
| 803,697 |
| 1,373,784 |
|
Operation and maintenance (4) | 3,753 |
| 3,462 |
| 13,313 |
| 14,969 |
|
| Depreciation and amortization | 28 |
| 23 |
| 84 |
| 75 |
|
| Total operating expenses | 170,842 |
| 294,366 |
| 817,094 |
| 1,388,828 |
|
| Operating (loss) income | (37,299 | ) | (4,345 | ) | 565 |
| 36,285 |
|
| Other income, net | 62 |
| 45 |
| 254 |
| 96 |
|
| Interest expense, net | 517 |
| 766 |
| 2,680 |
| 4,277 |
|
| Income tax (benefit) provision | (8,909 | ) | (1,193 | ) | (606 | ) | 7,063 |
|
| Net (loss) income | $ | (28,845 | ) | $ | (3,873 | ) | $ | (1,255 | ) | $ | 25,041 |
|
| |
(1) | Includes related party transactions of approximately $(197,000) and $(62,000) for the three months ended June 30, 2020 and 2019, respectively, and $1.7 million and $8.3 million for the nine months ended June 30, 2020 and 2019, respectively, which are eliminated in consolidation.
|
| |
(2) | Costs associated with pipeline and storage capacity are expensed over the term of the related contracts, which generally varies from less than one year to ten years. |
| |
(3) | Includes related party transactions of approximately $46,000 and $1.1 million for the three months ended June 30, 2020 and 2019, respectively, and $137,000 and $3.4 million for the nine months ended June 30, 2020 and 2019, respectively, a portion of which is eliminated in consolidation.
|
| |
(4) | Includes energy and other taxes due to change in presentation in the Unaudited Condensed Consolidated Statements of Operations. |
Energy Services' portfolio of financial derivative instruments are composed of:
|
| | | | |
| | Nine Months Ended |
| | June 30, |
| (in Bcf) | 2020 | 2019 |
| Net short futures contracts | 40.7 |
| 33.1 |
|
Operating Revenues and Natural Gas Purchases
Operating revenues decreased $156.5increased $148.9 million and natural gas purchases decreased $123.8increased $11.4 million during the three months ended June 30, 2020,March 31, 2021, compared with the three months ended June 30, 2019, respectively,March 31, 2020. Operating revenues increased $7.9 million and natural gas purchases decreased $132.5 million during the six months ended March 31, 2021, compared with the six months ended March 31, 2020. The increases during the three and six months were due primarily to warmerincreased natural gas price volatility related to the extreme weather in the mid-continent and southern regions of the U.S. during February 2021 compared to the prior period, which lead to decreased demand and lower natural gas prices, increased gasperiod. The decrease in storage and ultimately decreased volatility in the wholesale natural gas markets, along with unrealized losses as a result of timing differences in the settlement of certain economic hedges. Operating revenues decreased $607.5 million and gas purchases decreased $570.1 millionduring the ninesix months ended June 30, 2020,March 31, 2021, compared with the ninesix months ended June 30, 2019,March 31, 2020, was due primarily to decreasedthe timing of injections and withdrawals for natural gas market volatility discussed above.in storage.
Future results at Energy Services are contingent upon natural gas market price volatility driven by variations in both the supply and demand balances caused by weather and other factors. As a result, variations in weather patterns in the key market areas served may affect earnings during the fiscal year. Changes in market fundamentals such as an increase in supply and decrease in demand due to warmer temperatures, and reduced volatility can negatively impact Energy Services' earnings. See Item 2. Management's Discussion and Analysis of Financial Condition and Results of Operations - Natural Gas Distribution Segment for TETCO M-3 Daily Prices, which illustrates the daily natural gas prices in the Northeast market region.
Operation and Maintenance Expense
O&M expense increased $291,000$28.2 million and $27.5 million during the three and six months ended June 30, 2020,March 31, 2021, compared with the three and six months ended June 30, 2019,March 31, 2020, due primarily to increased compensation partially offset by lower shared corporate costs. O&M expense decreased $1.7 million during the nine months ended June 30, 2020, compared with the nine months ended June 30, 2019, due primarily to decreased compensation costs.
New Jersey Resources Corporation
Part I
ITEM 2. MANAGEMENT’S DISCUSSION AND ANALYSIS OF FINANCIAL CONDITION AND RESULTS OFcosts, charitable contributions and bad debt expense.
OPERATIONS (Continued)
Income Tax Provision
Income tax benefitprovision increased $7.7$25.6 million and $26.9 million during both the three and ninesix months ended June 30, 2020,March 31, 2021, compared with the three and ninesix months ended June 30, 2019, March 31, 2020, due primarily to decreasedincreased operating income.income related to increased natural gas price volatility during February 2021 as discussed above.
Net Income
Net income decreased $25increased $84.1 million and $26.3$86.9 million during the three and ninesix months ended June 30, 2020,March 31, 2021, compared with the three and ninesix months ended June 30, 2019,March 31, 2020, respectively, due primarily to lowerincreased operating income, partially offset by the related increase in the benefit from income taxes,higher O&M expenses, as previously discussed.
Non-GAAP Financial Measures
Management uses financial margin and NFE, non-GAAP financial measures, when evaluating the operating results of Energy Services. Financial margin and NFE are based on removing timing differences associated with certain derivative instruments. GAAP also requires us, during the interim periods, to estimate our annual effective tax rate and use this rate to calculate the year-to-date tax provision. We also determine an annual estimated effective tax rate for NFE purposes and calculate a quarterly tax adjustment based on the differences between our forecasted net income and our forecasted NFE for the fiscal year. This adjustment is applied to Energy Services, as the adjustment primarily relates to timing differences associated with certain derivative instruments as discussed above. Therewhich impacts the estimate of the annual effective tax rate for NFE. No adjustment is a relatedneeded during the fourth quarter, since the actual effective tax effect on currentrate is calculated at year end. Accordingly, for NFE purposes, the annual estimated effective tax rate is 18.8 percent for fiscal 2021 and deferred income tax expense corresponding with NFE.18.2 percent for fiscal 2020.
Management views these measures as representative of the overall expected economic result and uses these measures to compare Energy Services' results against established benchmarks and earnings targets as these measures eliminate the impact of volatility on GAAP earnings as a result of timing differences associated with the settlement of derivative instruments. To the extent that there are unanticipated impacts from changes in the market value related to the effectiveness of economic hedges, Energy Services' actual non-GAAP results can differ from the results anticipated at the outset of the transaction. Non-GAAP financial measures are not in accordance with, or an alternative to, GAAP and should be considered in addition to, and not as a substitute for, the comparable GAAP measure.
When Energy Services reconciles the most directly comparable GAAP measure to both financial margin and NFE, the current period unrealized gains and losses on derivatives are excluded as a reconciling item. Financial margin and NFE also exclude the effects of economic hedging of the value of our natural gas in storage and, therefore, only include realized gains and losses related to natural gas withdrawn from storage, effectively matching the full earnings effects of the derivatives with realized margins on the related physical natural gas flows.
New Jersey Resources Corporation
Part I
ITEM 2. MANAGEMENT’S DISCUSSION AND ANALYSIS OF FINANCIAL CONDITION AND RESULTS OF
OPERATIONS (Continued)
Financial Margin
The following table is a computation of Energy Services' financial margin:
|
| | | | | | | | | | | | |
| | Three Months Ended | Nine Months Ended |
| | June 30, | June 30, |
| (Thousands) | 2020 | 2019 | 2020 | 2019 |
Operating revenues (1) | $ | 133,543 |
| $ | 290,021 |
| $ | 817,659 |
| $ | 1,425,113 |
|
| Less: Gas purchases | 167,061 |
| 290,881 |
| 803,697 |
| 1,373,784 |
|
| Add: | | | | |
| Unrealized loss (gain) on derivative instruments and related transactions | 24,034 |
| (24,684 | ) | (21,306 | ) | (27,056 | ) |
Effects of economic hedging related to natural gas inventory (2) | 4,739 |
| 11,317 |
| 10,474 |
| 12,073 |
|
| Financial margin | $ | (4,745 | ) | $ | (14,227 | ) | $ | 3,130 |
| $ | 36,346 |
|
| |
(1) | Includes unrealized losses related to an intercompany transaction between NJNG and Energy Services that have been eliminated in consolidation of approximately $(322,000) and $(62,000) for the three months ended June 30, 2020 and 2019, respectively, and $(521,000) and $1.3 million for the nine months ended June 30, 2020 and 2019, respectively.
|
| |
(2) | Effects of hedging natural gas inventory transactions where the economic impact is realized in a future period. |
New Jersey Resources Corporation
Part I
ITEM 2. MANAGEMENT’S DISCUSSION AND ANALYSIS OF FINANCIAL CONDITION AND RESULTS OF | | | | | | | | | | | | | | |
| Three Months Ended | Six Months Ended |
| March 31, | March 31, |
| (Thousands) | 2021 | 2020 | 2021 | 2020 |
Operating revenues (1) | $ | 462,569 | | $ | 313,701 | | $ | 692,046 | | $ | 684,116 | |
| Less: Natural gas purchases | 330,280 | | 318,912 | | 504,117 | | 636,636 | |
| Add: | | | | |
| Unrealized loss (gain) on derivative instruments and related transactions | 29,348 | | (3,146) | | (9,433) | | (45,340) | |
Effects of economic hedging related to natural gas inventory (2) | (7,209) | | 14,622 | | (14,741) | | 5,735 | |
| Financial margin | $ | 154,428 | | $ | 6,265 | | $ | 163,755 | | $ | 7,875 | |
OPERATIONS (Continued)(1)Includes unrealized (gains) losses related to an intercompany transaction between NJNG and Energy Services that have been eliminated in consolidation of approximately $(91,000) and $(626,000) for the three months ended March 31, 2021 and 2020, respectively, $1.2 million and $(199,000) for the six months ended March 31, 2021 and 2020, respectively.
(2)Effects of hedging natural gas inventory transactions where the economic impact is realized in a future period.
A reconciliation of operating income, the closest GAAP financial measure, to Energy Services' financial margin is as follows:
|
| | | | | | | | | | | | |
| | Three Months Ended | Nine Months Ended |
| | June 30, | June 30, |
| (Thousands) | 2020 | 2019 | 2020 | 2019 |
| Operating (loss) income | $ | (37,299 | ) | $ | (4,345 | ) | $ | 565 |
| $ | 36,285 |
|
| Add: | | | | |
| Operation and maintenance | 3,753 |
| 3,462 |
| 13,313 |
| 14,969 |
|
| Depreciation and amortization | 28 |
| 23 |
| 84 |
| 75 |
|
| Subtotal | (33,518 | ) | (860 | ) | 13,962 |
| 51,329 |
|
| Add: | | | | |
| Unrealized loss (gain) on derivative instruments and related transactions | 24,034 |
| (24,684 | ) | (21,306 | ) | (27,056 | ) |
| Effects of economic hedging related to natural gas inventory | 4,739 |
| 11,317 |
| 10,474 |
| 12,073 |
|
| Financial margin | $ | (4,745 | ) | $ | (14,227 | ) | $ | 3,130 |
| $ | 36,346 |
|
| | | | | | | | | | | | | | |
| Three Months Ended | Six Months Ended |
| March 31, | March 31, |
| (Thousands) | 2021 | 2020 | 2021 | 2020 |
| Operating income (loss) | $ | 99,278 | | $ | (10,060) | | $ | 150,860 | | $ | 37,864 | |
| Add: | | | | |
| Operation and maintenance | 32,998 | | 4,822 | | 37,014 | | 9,560 | |
| Depreciation and amortization | 13 | | 27 | | 55 | | 56 | |
| | | | |
| Subtotal | 132,289 | | (5,211) | | 187,929 | | 47,480 | |
| Add: | | | | |
| Unrealized loss (gain) on derivative instruments and related transactions | 29,348 | | (3,146) | | (9,433) | | (45,340) | |
| Effects of economic hedging related to natural gas inventory | (7,209) | | 14,622 | | (14,741) | | 5,735 | |
| Financial margin | $ | 154,428 | | $ | 6,265 | | $ | 163,755 | | $ | 7,875 | |
Financial margin increased $9.5$148.2 million and $155.9 million during the three and six months ended June 30, 2020,March 31, 2021, compared with the three and six months ended June 30, 2019,March 31, 2020, due primarily to decreases in the variable component of transportation and storage demand fees. Financial margin decreased $33.2 millionnatural gas price volatility during the nine months ended June 30, 2020, compared with the nine months ended June 30, 2019, due primarily to warmer weatherFebruary 2021, as previously discussed compared to the prior period, which lead to decreased demand and lower natural gas prices, increased gas in storage and ultimately decreased volatility in the wholesale natural gas markets.period.
Net Financial Earnings
A reconciliation of Energy Services' net income, the most directly comparable GAAP financial measure, to NFE is as follows:
| | | | | | | | | | | | | | |
| Three Months Ended | Six Months Ended |
| March 31, | March 31, |
| (Thousands) | 2021 | 2020 | 2021 | 2020 |
| Net income (loss) | $ | 75,662 | | $ | (8,435) | | $ | 114,534 | | $ | 27,590 | |
| Add: | | | | |
| Unrealized loss (gain) on derivative instruments and related transactions | 29,348 | | (3,146) | | (9,433) | | (45,340) | |
Tax effect (1) | (6,976) | | 747 | | 2,243 | | 10,780 | |
| Effects of economic hedging related to natural gas inventory | (7,209) | | 14,622 | | (14,741) | | 5,735 | |
| Tax effect | 1,713 | | (3,475) | | 3,503 | | (1,363) | |
| Net income to NFE tax adjustment | 3,990 | | 2,174 | | 1,922 | | (37) | |
| Net financial earnings (loss) | $ | 96,528 | | $ | 2,487 | | $ | 98,028 | | $ | (2,635) | |
(1)Includes taxes related to an intercompany transaction between NJNG and Energy Services that have been eliminated in consolidation of approximately $23,000 and $150,000 for the three months ended and 2020, respectively, and $(284,000) and $48,000 for the six months ended March 31, 2021 and 2020, respectively.
New Jersey Resources Corporation
Part I
ITEM 2. MANAGEMENT’S DISCUSSION AND ANALYSIS OF FINANCIAL CONDITION AND RESULTS OF
OPERATIONS (Continued)
|
| | | | | | | | | | | | |
| | Three Months Ended | Nine Months Ended |
| | June 30, | June 30, |
| (Thousands) | 2020 | 2019 | 2020 | 2019 |
| Net (loss) income | $ | (28,845 | ) | $ | (3,873 | ) | $ | (1,255 | ) | $ | 25,041 |
|
| Add: | | | | |
| Unrealized loss (gain) on derivative instruments and related transactions | 24,034 |
| (24,684 | ) | (21,306 | ) | (27,056 | ) |
Tax effect (1) | (5,715 | ) | 5,899 |
| 5,065 |
| 6,455 |
|
| Effects of economic hedging related to natural gas inventory | 4,739 |
| 11,317 |
| 10,474 |
| 12,073 |
|
| Tax effect | (1,126 | ) | (2,689 | ) | (2,489 | ) | (2,869 | ) |
| Net financial (loss) earnings | $ | (6,913 | ) | $ | (14,030 | ) | $ | (9,511 | ) | $ | 13,644 |
|
| |
(1) | Includes taxes related to an intercompany transaction between NJNG and Energy Services that have been eliminated in consolidation of approximately $76,000 and $14,000 for the three months ended June 30, 2020 and 2019, respectively, and $124,000 and $(320,000) for the nine months ended June 30, 2020 and 2019, respectively.
|
NFE increased $7.1$94.0 million and $100.7 million during the three and six months ended June 30, 2020,March 31, 2021, compared with the three and six months ended June 30, 2019,March 31, 2020, due primarily to a decrease in financial loss, as previously discussed. NFE decreased $23.2 million during the nine months ended June 30, 2020, compared with the nine months ended June 30, 2019, due primarily to lowerhigher financial margin, as previously discussed.
Future results are subject to Energy Services' ability to expand its wholesale sales and service activities and are contingent upon many other factors, including an adequate number of appropriate and credit qualified counterparties in an active and liquid natural marketplace, volatility in the natural gas market due to weather or other fundamental market factors impacting supply and/or demand, transportation, storage and/or other market arbitrage opportunities, sufficient liquidity in the overall energy trading market, and continued access to liquidity in the capital markets.
New Jersey Resources Corporation
Part I
ITEM 2. MANAGEMENT’S DISCUSSION AND ANALYSIS OF FINANCIAL CONDITION AND RESULTS OFStorage and Transportation Segment
OPERATIONS (Continued)
Midstream Segment
Overview
Our MidstreamStorage and Transportation segment invests in natural gas assets, such as natural gas transportation and storage facilities. We believe that acquiring, owning and developing these midstreamstorage and transportation assets, which operate under a tariff structure that has either regulated or market-based rates, can provide us a growth opportunity. Our MidstreamStorage and Transportation segment is subject to various risks, including the construction, development and operation of our transportation and storage assets, obtaining necessary governmental, environmental and regulatory approvals, our ability to obtain necessary property rights and our ability to obtain financing at reasonable costs for the constructions and maintenance of our assets. In addition, our Midstreamstorage and transportation assets may be subject to risk associated with the COVID-19 pandemic, such as disruption to the supply chain and availability of critical equipment and supplies, disruptions to the availability of our specialized workforce and contractors and changes to demand for natural gas, transportation and other downstream activities.
Our MidstreamStorage and Transportation segment is comprised of a 50 percent ownership interest in Steckman Ridge, a storage facility that operates under market-based rates and a 20 percent ownership interest in PennEast, a natural gas pipeline. NJR Pipeline Company acquired 100 percent of Leaf River for $367.5 million, on October 11, 2019. Leaf River owns and operates a 32.2 million Dth salt dome natural gas storage facility that operates under market-based rates. In addition, on January 13, 2020, Adelphia Gateway, acquired all of Talen’s membership interests in IEC, an existing 84-mile pipeline in southeastern Pennsylvania, including related assets and rights of way, for a base purchase price of $166$166.0 million. Adelphia Gateway operates under cost of service rates but can enter into negotiated rates with counterparties. The northern portion of the pipeline was operational upon acquisition and it currently serves two natural gas generation facilities. TheOn October 5, 2020, we received a partial Notice to Proceed with construction from FERC and have begun the conversion of the southern portionzone of the pipeline to natural gas is expected to begin upon receipt of the Notice to Proceed from FERC.gas.
Through our subsidiary NJR Pipeline Company, we are a 20 percent investor in PennEast, a partnership whose purpose is to construct and operate a 120-mile natural gas pipeline that will extend from northeast Pennsylvania to western New Jersey. PennEast received a Certificate of Public Convenience and Necessity for the project from FERC on January 19, 2018.
On September 10, 2019, the United States Court of Appeals for the Third Circuit issued an order overturning the United StatesU.S. District Court for the District of New Jersey’s order granting PennEast condemnation and immediate access in accordance with the Natural Gas Act to certain properties in which the State of New Jersey holds an interest. A Petition for Rehearing was denied by the Third Circuit on November 5, 2019.
On October 8, 2019, the NJDEP issued a letter indicating that it deemed PennEast’s freshwater wetlands permit application to be administratively incomplete and closed the matter without prejudice. On October 11, 2019, PennEast submitted a letter to the NJDEP objecting to its position that the application is administratively incomplete. PennEast's objections were rejected by the NJDEP on November 18, 2019.
On October 4, 2019, PennEast filed a petition for Declaratory Order with FERC requesting an interpretation of the eminent domain authority of a FERC certificate holder under the Natural Gas Act. The Declaratory Order was granted on January 30, 2020.
On January 30, 2020, PennEast filed an amendment with FERC to construct the PennEast pipeline in two phases. Phase one consists of construction of a 68-mile pipeline in Pennsylvania from the eastern Marcellus Shale region in Luzerne County that would terminateend in Northampton County. Phase two includes construction of the remaining original certificated route in Pennsylvania and New Jersey. Construction is expected to begin following approval by FERC of the phased approach and receipt of any remaining governmental and regulatory permits.
New Jersey Resources Corporation
Part I
ITEM 2. MANAGEMENT’S DISCUSSION AND ANALYSIS OF FINANCIAL CONDITION AND RESULTS OF
OPERATIONS (Continued)
On February 18, 2020, PennEast filed a writ of certiorari with the Supreme Court of the United States to review the September 10, 2019 Third Circuit decision.
On June 29, 2020, the Supreme Court requested that the Solicitor General of the United States file a brief that expresses the views on the question of the use of eminent domain to acquire state owned lands for pipeline construction. The Solicitor General filed its brief with the Supreme Court on December 9, 2020.
The State of New Jersey filed a brief with the Supreme Court on December 23, 2020, in response to the brief of the Solicitor General.
On February 3, 2021, the Supreme Court granted the petition for a writ of certiorari. The matter was argued before the Supreme Court on April 28, 2021.
We evaluated our investment in PennEast for an other-than-temporary impairment and determined an impairment charge was not necessary. It is reasonably possible that future unfavorable developments, such as a reduced likelihood of success from development options and legal outcomes, estimated increases in construction costs, increases in the discount rate, or further significant delays, could result in an impairment of our equity method investment. Also, the use of alternate judgments and assumptions could result in a different calculation of fair value, which could ultimately result in the recognition of an impairment charge in the Unaudited Condensed Consolidated Financial Statements.
Due to the expiration of a customer contract for Steckman Ridge, we evaluated our investment in Steckman Ridge for other-than-temporary impairment and determined an impairment charge was not necessary.
The fair value of our investment in Steckman Ridge was determined using a discounted cash flow method and utilized management’s best estimates and assumptions related to expected future results, including the price and capacity of firm natural gas storage contracting, operations and maintenance costs, the nature and timing of major maintenance and capital investment, and discount rates. Fair value determinations require considerable judgment and are sensitive to changes in underlying assumptions and other factors. As a result, it is reasonably possible that future unfavorable developments, such as the failure to execute storage contracts and other services for available capacity at anticipated price levels could result in an other-than temporary impairment charge in the Unaudited Condensed Consolidated Financial Statements.
As of June 30, 2020,March 31, 2021, our investments in Steckman Ridge and PennEast were $112.9$111.4 million and $92.9$103.1 million, respectively.
Operating Results
The financial results of our Storage and Transportation segment are summarized as follows:
| | | | | | | | | | | | | | |
| Three Months Ended | Six Months Ended |
| March 31, | March 31, |
| (Thousands) | 2021 | 2020 | 2021 | 2020 |
Operating revenues (1) | $ | 13,926 | | $ | 11,076 | | $ | 27,030 | | $ | 20,148 | |
| Operating expenses | | | | |
| Natural gas purchases | 238 | | 193 | | 471 | | 539 | |
| Operation and maintenance | 7,139 | | 6,094 | | 13,681 | | 10,972 | |
| Depreciation and amortization | 2,364 | | 2,397 | | 5,004 | | 4,078 | |
| Total operating expenses | 9,741 | | 8,684 | | 19,156 | | 15,589 | |
| Operating income | 4,185 | | 2,392 | | 7,874 | | 4,559 | |
| Other income, net | 1,591 | | 4,671 | | 2,845 | | 5,368 | |
| Interest expense, net | 3,578 | | 5,621 | | 7,560 | | 8,443 | |
| Income tax provision | 873 | | 1,105 | | 1,519 | | 1,807 | |
| Equity in earnings of affiliates | 3,386 | | 3,921 | | 6,579 | | 7,585 | |
| Net income | $ | 4,711 | | $ | 4,258 | | $ | 8,219 | | $ | 7,262 | |
(1)Includes related party transactions of approximately $669,000 and $675,000 for the three months ended March 31, 2021 and 2020, respectively, and $1.3 million for both the six months ended March 31, 2021 and 2020, which are eliminated in consolidation.
New Jersey Resources Corporation
Part I
ITEM 2. MANAGEMENT’S DISCUSSION AND ANALYSIS OF FINANCIAL CONDITION AND RESULTS OF
OPERATIONS (Continued)
Operating Results
The financial results of our Midstream segment are summarized as follows:
|
| | | | | | | | | | | | |
| | Three Months Ended | Nine Months Ended |
| | June 30, | June 30, |
| (Thousands) | 2020 | 2019 | 2020 | 2019 |
Operating revenues (1) | $ | 11,863 |
| $ | — |
| $ | 32,011 |
| $ | — |
|
| Operating expenses | | | | |
| Gas purchases | 464 |
| — |
| 1,003 |
| — |
|
| Operation and maintenance | 6,430 |
| 951 |
| 17,402 |
| 2,655 |
|
| Depreciation and amortization | 2,513 |
| 1 |
| 6,591 |
| 4 |
|
| Total operating expenses | 9,407 |
| 952 |
| 24,996 |
| 2,659 |
|
| Operating income | 2,456 |
| (952 | ) | 7,015 |
| (2,659 | ) |
| Other income, net | 1,033 |
| 1,088 |
| 6,401 |
| 6,434 |
|
| Interest expense, net | 1,843 |
| 522 |
| 10,286 |
| 1,630 |
|
| Income tax provision | 1,646 |
| 729 |
| 3,453 |
| 2,910 |
|
| Equity in earnings of affiliates | 3,615 |
| 4,167 |
| 11,200 |
| 11,966 |
|
| Net income | $ | 3,615 |
| $ | 3,052 |
| $ | 10,877 |
| $ | 11,201 |
|
| |
(1) | Includes related party transactions of approximately $720,000 and $2.1 million for the three and nine months ended June 30, 2020, respectively, which are eliminated in consolidation. |
Operating revenuerevenues increased $11.9$2.9 million and $32$6.9 million during the three and ninesix months ended June 30, 2020,March 31, 2021, compared with the three and ninesix months ended June 30, 2019, March 31, 2020, due to increased operating revenues at Leaf River and Adelphia that were not present in the prior period.Gateway.
Equity in earnings of affiliates decreased $552,000$535,000 and $766,000$1.0 million during the three and ninesix months ended June 30, 2020,March 31, 2021, compared with the three and ninesix months ended June 30, 2019,March 31, 2020, due primarily to decreases in storage revenue at Steckman Ridge, partially offset by an increase in AFUDC earned at PennEast.
Operation and Maintenance Expense
O&M expense increased $5.5$1.0 million and $14.7$2.7 million during the three and ninesix months ended June 30, 2020,March 31, 2021, compared with the three and ninesix months ended June 30, 2019, respectively, March 31, 2020, due primarily to operations of Adelphia Gateway and increases at Leaf River and AdelphiaRiver.
Depreciation Expense
Depreciation expense remained relatively flat during the ninethree months ended June 30,March 31, 2021, compared with the three months ended March 31, 2020.
Depreciation expense increased $2.5$926,000 during the six months ended March 31, 2021, compared with the six months ended March 31, 2020, due primarily to operations of Adelphia Gateway during the six months ended March 31, 2021, that were not present in the first quarter of fiscal 2020.
Interest Expense
Interest expense decreased $2.0 million and $6.6 million$883,000 during the three and ninesix months ended June 30, 2020,March 31, 2021, compared with the three and ninesix months ended June 30, 2019, respectively, March 31, 2020, due primarily to operations of Leaf River and Adelphia during the nine months ended June 30, 2020.
Income tax provision increased $917,000 and $543,000 during the three and nine months ended June 30, 2020, compared with the three and nine months ended June 30, 2019, respectively, due primarily to the increased operating income generated at Leaf River and Adelphia.
Interesthigher interest expense increased $1.3 million and $8.7 million during the three and nine months ended June 30, 2020, compared with the three and nine months ended June 30, 2019, respectively, due primarily to increased debt service requirements related to the acquisition of Leaf River and Adelphia.Adelphia during fiscal 2020.
Net income increased $563,000$453,000 and $957,000 during the three and six months ended June 30, 2020,March 31, 2021, compared with the three and six months ended June 30, 2019, due primarily to the increased operating income, partially offset by the related increase in income tax provision and interest expense, as previously discussed. Net income decreased $324,000 during the nine months ended June 30,March 31, 2020, compared with the nine months ended June 30, 2019, due primarily to increased O&M and interest expense,operating revenue, partially offset by an increase in operating revenue,increased O&M and depreciation expense, as previously discussed.
New Jersey Resources Corporation
Part I
ITEM 2. MANAGEMENT’S DISCUSSION AND ANALYSIS OF FINANCIAL CONDITION AND RESULTS OF
OPERATIONS (Continued)
Home Services and Other Operations
Overview
The financial results of Home Services and Other consist primarily of the operating results of NJRHS. NJRHS provides service, sales and installation of appliances to service contract customers and has been focused on growing its installation business and expanding its service contract customer base. Home Services and Other also includes organizational expenses incurred at NJR and rental income at CR&R.
Operating Results
The condensed financial results of Home Services and Other are summarized as follows:
|
| | | | | | | | | | | | |
| | Three Months Ended | Nine Months Ended |
| | June 30, | June 30, |
| (Thousands) | 2020 | 2019 | 2020 | 2019 |
| Operating revenues | $ | 12,369 |
| $ | 13,082 |
| $ | 37,641 |
| $ | 37,905 |
|
Operation and maintenance (1) | $ | 11,686 |
| $ | 6,276 |
| $ | 31,145 |
| $ | 32,049 |
|
| Income tax (benefit) provision | $ | (131 | ) | $ | 1,705 |
| $ | 2,044 |
| $ | 854 |
|
| Net income (loss) | $ | (582 | ) | $ | 4,365 |
| $ | 675 |
| $ | 2,672 |
|
| |
(1) | Includes energy and other taxes due to change in presentation in the Unaudited Condensed Consolidated Statements of Operations. |
| | | | | | | | | | | | | | |
| Three Months Ended | Six Months Ended |
| March 31, | March 31, |
| (Thousands) | 2021 | 2020 | 2021 | 2020 |
| Operating revenues | $ | 12,773 | | $ | 12,365 | | $ | 25,350 | | $ | 25,272 | |
| Operation and maintenance | $ | 9,254 | | $ | 8,926 | | $ | 19,575 | | $ | 19,459 | |
| Interest expense, net | $ | 1,728 | | $ | 565 | | $ | 2,844 | | $ | 837 | |
| Income tax (benefit) provision | $ | (59) | | $ | 1,956 | | $ | 59 | | $ | 2,175 | |
| Net income | $ | 747 | | $ | 148 | | $ | 685 | | $ | 1,257 | |
Operating revenue decreased $713,000 and $264,000 during the three and nine months ended June 30, 2020, respectively, compared with the three and nine months ended June 30, 2019, due primarily to decreased installation revenue at NJRHS.
O&M increased $5.4 million during the three months ended June 30, 2020, compared with the three months ended June 30, 2019, due to a higher allocation of shared corporate costs primarily related to IT infrastructure enhancements and improvements during the three months ended June 30, 2019 that did not recur. O&M decreased $904,000 during the nine months ended June 30, 2020, compared with the nine months ended June 30, 2019, due primarily to higher consulting expenses related to technology improvement projects in the prior period, partially offset by increased compensation and shared corporate costs in the current period.
Net income decreased $4.9 million during the three months ended June 30, 2020, compared with the three months ended June 30, 2019, due primarily to increased O&M, as previously discussed. Net income decreased $2 million during the nine months ended June 30, 2020, compared with the nine months ended June 30, 2019, due primarily to decreases in interest income and changes in income taxes.
Non-GAAP Financial Measures
In fiscal 2019, NFE is based on removing timing differences associated with NJR's variable-for-fixed interest rate swap. Non-GAAP financial measures are not in accordance with, or an alternative to GAAP, and should be considered in addition to, and not as a substitute for the comparable GAAP measure. A reconciliation of Home Services and Other's net income, the most directly comparable GAAP financial measure, to NFE is as follows:
|
| | | | | | | | | | | | |
| | Three Months Ended | Nine Months Ended |
| | June 30, | June 30, |
| (Thousands) | 2020 | 2019 | 2020 | 2019 |
| Net income (loss) | $ | (582 | ) | $ | 4,365 |
| $ | 675 |
| $ | 2,672 |
|
| Add: | | | | |
| Unrealized loss on derivative instruments and related transactions | — |
| 100 |
| — |
| 361 |
|
| Tax effect | — |
| (28 | ) | — |
| (101 | ) |
| Net financial earnings | $ | (582 | ) | $ | 4,437 |
| $ | 675 |
| $ | 2,932 |
|
New Jersey Resources Corporation
Part I
ITEM 2. MANAGEMENT’S DISCUSSION AND ANALYSIS OF FINANCIAL CONDITION AND RESULTS OF
OPERATIONS (Continued)
Operating Revenues
Operating revenues increased $408,000 during the three months ended March 31, 2021, compared with the three months ended March 31, 2020, due primarily to increased service contract and installation revenue at NJRHS. Operating revenues remained relatively flat during the six months ended March 31, 2021, compared with the six months ended March 31, 2020.
Net Income
Net income increased $599,000 during the three months ended March 31, 2021, compared with the three months ended March 31, 2020, due primarily to increased operating revenues as previously discussed along with decreased income tax expense, partially offset by higher interest expense. Net income decreased $572,000 during the six months ended March 31, 2021, compared with the six months ended March 31, 2020, due primarily to increased shared corporate costs and information technology expense.
Liquidity and Capital Resources
Our objective is to maintain an efficient consolidated capital structure that reflects the different characteristics of each business segment and business operations and provides adequate financial flexibility for accessing capital markets as required.
Our consolidated capital structure was as follows:
| | | | | | | | |
| March 31,
2021 | September 30,
2020 |
| Common stock equity | 44 | % | 43 | % |
| Long-term debt | 55 | | 53 | |
| Short-term debt | 1 | | 4 | |
| Total | 100 | % | 100 | % |
|
| | | | |
| | June 30,
2020 | September 30,
2019 |
| Common stock equity | 45 | % | 50 | % |
| Long-term debt | 41 |
| 49 |
|
| Short-term debt | 14 |
| 1 |
|
| Total | 100 | % | 100 | % |
Common Stock Equity
We satisfy our external common equity requirements, if any, through issuances of our common stock, including the proceeds from stock issuances under our DRP. The DRP allows us, at our option, to use treasury shares or newly issued shares to raise capital. On December 4, 2019, NJR completed an equity offering which satisfied our currently forecasted equity needs for fiscal 2020 and 2021. NJR raised approximately $212.9 million of equity, net of issuance costs, by issuing 5,333,334 shares of common stock related to the equity offering. NJR also raised approximately $14.5 million and $13.2$3.6 million of equity through the DRP by issuing 23,000 shares of common stock during the three months ended March 31, 2021 and raised $5.2 million during the three months ended March 31, 2020 by issuing 143,000 shares of treasury stock. NJR raised approximately 408,000$7.5 million of equity through the DRP by issuing 23,000 shares of common stock and 279,000approximately 140,000 shares of treasury stock during the ninesix months ended June 30, 2020March 31, 2021, and 2019, respectively. Duringraised $8.8 million during the ninesix months ended June 30, 2019, NJR raised approximately $57.4 million of equityMarch 31, 2020, by issuing approximately 1,181,000223,000 shares of common stock through the waiver discount feature of the DRP.treasury stock. There were no shares of common stock issued through the waiver discount feature of the DRP during the ninethree and six months ended June 30,March 31, 2021 and 2020.
In 1996, the Board of Directors authorized us to implement a share repurchase program, which was expanded seven times since the inception of the program, authorizing a total of 19.5 million shares of common stock for repurchase. As of June 30, 2020, we have repurchased a total of approximately 17.1 million of those shares and may repurchase an additional 2.4 million shares under the approved program. There were no shares repurchased during the nine months ended June 30, 2020 and 2019.
Common Stock Issuance and Forward Sale Agreement
On December 4, 2019, we completed an equity offering of 6,545,454 common shares, consisting of 5,333,334 common shares issued directly by NJR and 1,212,120 common shares issuable pursuant to forward sales agreements with investment banks. The issuance of 5,333,334 common shares resulted in proceeds of approximately $212.9 million, net of issuance costs, and was reflected in shareholders' equity and as a financing activity on the statement of cash flows.
Under the forward sale agreements, a total of 1,212,120 common shares were borrowed from third parties and sold to the underwriters. Each forward sale agreement allows us, at our election and prior to September 30, 2020, to physically settle the forward sale agreements by issuing common shares in exchange for net proceeds at the then-applicable forward sale price specified by the agreement, which was initially $40.0125 per share, or, alternatively, to settle the forward sale agreements in whole or in part through the delivery or receipt of shares or cash. The forward sale price is subject to adjustment daily based on a floating interest rate factor and will decrease inwith respect ofto certain fixed amounts specified in the agreements, such as dividends.
New Jersey Resources Corporation
Our current intent isPart I
ITEM 2. MANAGEMENT’S DISCUSSION AND ANALYSIS OF FINANCIAL CONDITION AND RESULTS OF
OPERATIONS (Continued)
On September 18, 2020, we amended our forward sale agreements to physically settleextend the maturity date of such forward sales agreements from September 30, 2020 to September 10, 2021. On March 3, 2021, we cash settled a portion of the forward sale agreements by issuingagreement for a payout of approximately $388,000 for 727,272 common shares. As of June 30, 2020,March 31, 2021, if we had elected to net settle the remaining forward sale agreements,agreement, we would receive $7have paid approximately $1.4 million under a cash settlement or would receive 227,461issued 31,607 common shares under a net share settlement.
In 1996, the Board of Directors authorized us to implement a share repurchase program, which was expanded seven times since the inception of the program, authorizing a total of 19.5 million shares of common stock for repurchase. As of March 31, 2021, we had repurchased a total of approximately 17.1 million of those shares and may repurchase an additional 2.4 million shares under the approved program. There were no shares repurchased during the six months ended March 31, 2021 and 2020.
Debt
NJR and its unregulated subsidiaries generally rely on cash flows generated from operating activities and the utilization of committed credit facilities to provide liquidity to meet working capital and short-term debt financing requirements. NJNG also relies on the issuance of commercial paper for short-term funding. NJR and NJNG periodically access the capital markets to fund long-life assets through the issuance of long-term debt securities.
We believe that our existing borrowing availability, equity proceeds and cash flow from operations will be sufficient to satisfy our and our subsidiaries' working capital, capital expenditures and dividend requirements for the next 12 months. NJR, NJNG, Clean Energy Ventures, MidstreamStorage and Transportation and Energy Services currently anticipate that each of their financing requirements for
New Jersey Resources Corporation
Part I
ITEM 2. MANAGEMENT’S DISCUSSION AND ANALYSIS OF FINANCIAL CONDITION AND RESULTS OF
OPERATIONS (Continued)
the next 12 months will be met primarily through the issuance of short and long-term debt and meter andor solar sale-leasebacks and proceeds from the issuance of equity.asset sale leasebacks.
We believe that as of June 30, 2020,March 31, 2021, NJR and NJNG were, and currently are, in compliance with all existing debt covenants, both financial and non-financial.
As a result of the COVID-19 pandemic there have been disruptions, uncertainty and volatility in the credit and capital markets. Our ability to access funds from financial institutions at a reasonable cost may impact the nature and timing of future capital market transactions.
Short-Term Debt
We use our short-term borrowings primarily to finance Energy Services' short-term liquidity needs, MidstreamStorage and Transportation investments and PennEast contributions, share repurchases and, on an initial basis, Clean Energy Ventures' investments. Energy Services' use of high volumehigh-volume storage facilities and anticipated pipeline park-and-loan arrangements, combined with related economic hedging activities in the volatile wholesale natural gas market, create significant short-term cash requirements.
As of June 30, 2020,March 31, 2021, NJR had revolving credit facilities totaling $675$425 million, with $250.2$406.2 million available under the facilities. As of June 30, 2020, NJR has a $350 million Bridge Facility, there were $137.1 million in borrowings remaining against the facility.
NJNG satisfies its debt needs by issuing short-term and long-term debt based on its financial profile. The seasonal nature of NJNG's operations creates large short-term cash requirements, primarily to finance natural gas purchases and customer accounts receivable. NJNG obtains working capital for these requirements, and for the temporary financing of construction and MGP remediation expenditures and energy tax payments, based on its financial profile, through the issuance of commercial paper supported by the NJNG Credit Facility or through short-term bank loans under the NJNG Credit Facility.
NJNG’s commercial paper is sold through several commercial banks under an issuing and paying agency agreement and is supported by the $250 million NJNG Credit Facility. As of June 30, 2020,March 31, 2021, the unused amount available under the NJNG Credit Facility, including amounts allocated to the backstop under the commercial paper program and the issuance of letters of credit, was $249.3 million.
New Jersey Resources Corporation
Part I
ITEM 2. MANAGEMENT’S DISCUSSION AND ANALYSIS OF FINANCIAL CONDITION AND RESULTS OF
OPERATIONS (Continued)
Short-term borrowings were as follows:
| | | | | | | | | | | |
| Three Months Ended | Six Months Ended |
| (Thousands) | March 31, 2021 |
| NJR | | | |
| Notes Payable to banks: | | | |
| Balance at end of period | $ | 8,500 | | | $ | 8,500 | |
| Weighted average interest rate at end of period | 1.75 | % | | 1.75 | % |
| Average balance for the period | $ | 141,381 | | | $ | 123,582 | |
| Weighted average interest rate for average balance | 1.04 | % | | 1.04 | % |
| Month end maximum for the period | $ | 153,000 | | | $ | 153,000 | |
| NJNG | | | |
| Commercial Paper and Notes Payable to banks: | | | |
| Balance at end of period | $ | — | | | $ | — | |
| Weighted average interest rate at end of period | — | % | | — | % |
| Average balance for the period | $ | 106 | | | $ | 292 | |
| Weighted average interest rate for average balance | .06 | % | | .04 | % |
| Month end maximum for the period | $ | 5,100 | | | $ | 14,350 | |
|
| | | | | | | |
| | Three Months Ended | Nine Months Ended |
| (Thousands) | June 30, 2020 |
| NJR | | | |
| Notes Payable to banks: | | | |
| Balance at end of period | $ | 553,400 |
| | $ | 553,400 |
|
| Weighted average interest rate at end of period | 1.15 | % | | 1.15 | % |
| Average balance for the period | $ | 545,366 |
| | $ | 482,971 |
|
| Weighted average interest rate for average balance | 1.42 | % | | 2.17 | % |
| Month end maximum for the period | $ | 553,400 |
| | $ | 533,400 |
|
| NJNG | | | |
| Commercial Paper and Notes Payable to banks: | | | |
| Balance at end of period | $ | — |
| | $ | — |
|
| Weighted average interest rate at end of period | 0.25 | % | | 0.25 | % |
| Average balance for the period | $ | 387 |
| | $ | 18,587 |
|
| Weighted average interest rate for average balance | .25 | % | | 1.61 | % |
| Month end maximum for the period | $ | — |
| | $ | 62,300 |
|
Due to the seasonal nature of natural gas prices and demand, and because inventory levels are built up during its natural gas injection season (April through October), NJR and NJNG's short-term borrowings tend to peak in the November through January time frame.
NJR
Based on its average borrowings during the three and ninesix months ended June 30, 2020,March 31, 2021, NJR's average interest rate was 1.421.04 percent and 2.171.04 percent, resulting in interest expense of approximately $1.9 million$362,000 and $7.6 million,$643,000, respectively.
New Jersey Resources Corporation
Part I
ITEM 2. MANAGEMENT’S DISCUSSION AND ANALYSIS OF FINANCIAL CONDITION AND RESULTS OF
OPERATIONS (Continued)
As of June 30, 2020,March 31, 2021, NJR had threeseven letters of credit outstanding totaling $8.5$10.3 million, which reduced the amount available under the NJR Credit Facility by the same amount. NJR does not anticipate that these letters of credit will be drawn upon by the counterparties.
On October 9, 2019, NJR entered into a $350 million Bridge Facility, which was used primarily to finance the Leaf River acquisition. The Bridge Facility accrues interest at the LIBOR rate for a 1-month interest period plus 0.875 percent during the first 180 days, and 1.075 percent after 180 days, which is dependent on the credit rating of NJNG from Fitch and Moody’s. The occurrence of an event of default under the Bridge Facility could result in all loans and other obligations of NJR becoming immediately due and payable and the Bridge Facility being terminated. Loans under the Bridge Facility are required to be prepaid to the extent of new cash proceeds received upon the issuance of equity of NJR, the incurrence of indebtedness by NJR or its subsidiaries, the disposition of assets by NJR or its subsidiaries or upon other specified events, in each case subject to certain exceptions set forth in the Bridge Facility. As of June 30, 2020, there were $137.1 million in borrowings remaining against the facility. The net proceeds from the December 2019 equity issuance were used to pay down the Bridge Facility. On April 23, 2020, the Bridge Facility was amended to clarify that the April 24, 2020 $250 million revolving credit facility is not considered a debt issuance that requires prepayment of the Bridge Facility. On July 23, 2020, the remaining $137.1 million in borrowings were repaid.
On April 24, 2020, NJR entered into a 364-day $250 million revolving credit facility with an interest rate based on LIBOR plus 1.625 percent. After six months, all outstanding amounts under the credit facility will convert to a term loan and will be due on April 23, 2021. Proceeds will be used to fund ongoing ordinary working capital requirements and other general corporate purposes. In connection with entry into this credit facility, all outstanding borrowings under NJR's December 13, 2019, $150 million revolving line of credit facility were repaid. As of June 30, 2020, there were no borrowings against the facility.
Neither NJNG nor its assets are obligated or pledged to support the NJR Credit Facility.
NJNG
As noted above, based on its average borrowings during the three and ninesix months ended June 30, 2020,March 31, 2021, NJNG's average interest rate was 0.250.06 percent and 1.610.04 percent, resulting inrespectively. NJNG's interest expense of approximately $265,000, for the nine months ended June 30, 2020. Interest expense was immaterial for the three and six months ended June 30, 2020.March 31, 2021.
As of June 30, 2020,March 31, 2021, NJNG had two letters of credit outstanding for $731,000, which reduced the amount available under NJNG's committed credit facility by the same amount. NJNG does not anticipate that these letters of credit will be drawn upon by the counterparties.
Short-Term Debt Covenants
Borrowings under the NJR Credit Facilities and the NJNG Credit Facility are conditioned upon compliance with a maximum leverage ratio (consolidated total indebtedness to consolidated total capitalization as defined in the applicable agreements), of not more than .65 to 1.00 at any time. These revolving credit facilities contain customary representations and warranties for transactions of this type. They also contain customary events of default and certain covenants that will limit NJR's or NJNG's ability, beyond agreed upon thresholds, to, among other things:
•incur additional debt;
•incur liens and encumbrances;
•make dispositions of assets;
•enter into transactions with affiliates; and
•merge, consolidate, transfer, sell or lease all or substantially all of the borrower's or guarantors' assets.
These covenants are subject to a number of exceptions and qualifications set forth in the applicable agreements.
New Jersey Resources Corporation
Part I
ITEM 2. MANAGEMENT’S DISCUSSION AND ANALYSIS OF FINANCIAL CONDITION AND RESULTS OF
OPERATIONS (Continued)
Default Provisions
The agreements governing our long-term and short-term debt obligations include provisions that, if not complied with, could require early payment or similar actions. Default events include, but are not limited to, the following:
•defaults for non-payment;
•defaults for breach of representations and warranties;
•defaults for insolvency;
•defaults for non-performance of covenants;
•cross-defaults to other debt obligations of the borrower; and
•guarantor defaults.
The occurrence of an event of default under these agreements could result in all loans and other obligations of the borrower becoming immediately due and payable and the termination of the credit facilities or term loan.
Long-Term Debt
NJR
As of June 30, 2020,March 31, 2021, NJR had the following outstanding:
•$50 million of 3.25 percent senior notes due September 17, 2022;
•$50 million of 3.20 percent senior notes due August 18, 2023;
•$100 million of 3.48 percent senior notes due November 7, 2024;
•$100 million of 3.54 percent senior notes due August 18, 2026;
•$100 million of 3.96 percent senior notes due June 8, 2028; and
•$150 million of 3.29 percent senior notes due July 17, 2029.2029;
•$130 million of 3.50 percent senior notes due July 23, 2030;
•$120 million of 3.13 percent senior notes due September 1, 2031;
•$130 million of 3.60 percent senior notes due July 23, 2032; and
•$80 million of 3.25 percent senior notes due September 1, 2033.
Neither NJNG nor its assets are obligated or pledged to support NJR's long-term debt.
On May 14, 2020, NJR entered into a Note Purchase Agreement for $260 million of its senior notes, of which $130 million are at a fixed interest rate of 3.5 percent, maturing in 2030, and $130 million are at a fixed interest rate of 3.6 percent, maturing in 2032. On July 23, 2020, NJR issued all $260 million of the senior notes. The senior notes are unsecured and guaranteed by certain unregulated subsidiaries of NJR.
NJNG
As of June 30, 2020,March 31, 2021, NJNG's long-term debt consisted of $942.8 million$1.1 billion in fixed-rate debt issuances secured by the Mortgage Indenture, with maturities ranging from 2024 to 2059,2060, and $66.9$58.3 million in capitalfinance leases with various maturities ranging from 2021 to 2026.2037.
On May 14, 2020, NJNG entered into a Note Purchase Agreement for $125 million of its senior notes, of which $100 million were at an interest rate of 3.13 percent, maturing in 2050, and $25 million were at an interest rate of 3.33 percent, maturing in 2060. On June 30, 2020, NJNG issued $50 million of 3.13 percent senior notes due June 30, 2050. On July 23, 2020, NJNG issued the remaining $50 million of 3.13 percent senior notes due July 23, 2050 and $25 million of 3.33 percent senior notes due July 23, 2060. The senior notes are secured by an equal principal amount of NJNG’s FMBs issued under NJNG’s Mortgage Indenture.
NJR is not obligated directly or contingently with respect to the NJNG notes or the FMBs.NJNG’s fixed-rate debt issuances.
Long-Term Debt Covenants and Default Provisions
The NJR and NJNG long-term debt instruments contain customary representations and warranties for transactions of their type. They also contain customary events of default and certain covenants that will limit NJR or NJNG's ability beyond agreed upon thresholds to, among other things:
New Jersey Resources Corporation
Part I
ITEM 2. MANAGEMENT’S DISCUSSION AND ANALYSIS OF FINANCIAL CONDITION AND RESULTS OF
OPERATIONS (Continued)
•incur additional debt (including a covenant that limits the amount of consolidated total debt of the borrower at the end of a fiscal quarter to 65 percent of the consolidated total capitalization of the borrower, as those terms are defined in the applicable agreements, and a covenant limiting priority debt to 20 percent of the borrower's consolidated total capitalization, as those terms are defined in the applicable agreements);
•incur liens and encumbrances;
•make loans and investments;
•make dispositions of assets;
•make dividends or restricted payments;
•enter into transactions with affiliates; and
•merge, consolidate, transfer, sell or lease substantially all of the borrower's assets.
New Jersey Resources Corporation
Part I
ITEM 2. MANAGEMENT’S DISCUSSION AND ANALYSIS OF FINANCIAL CONDITION AND RESULTS OF
OPERATIONS (Continued)
The aforementioned covenants are subject to a number of exceptions and qualifications set forth in the applicable note purchase agreements.
In addition, the FMBs issued by NJNG under the Mortgage Indenture are subject to certain default provisions. Events of Default, as defined in the Mortgage Indenture, consist mainly of:
•failure for 30 days to pay interest when due;
•failure to pay principal or premium when due and payable;
•failure to make sinking fund payments when due;
•failure to comply with any other covenants of the Mortgage Indenture after 30 days' written notice from the Trustee;
•failure to pay or provide for judgments in excess of $30 million in aggregate amount within 60 days of the entry thereof; or
•certain events that are or could be the basis of a bankruptcy, reorganization, insolvency or receivership proceeding.
Upon the occurrence and continuance of such an Event of Default, the Mortgage Indenture, subject to any provisions of law applicable thereto, provides that the Trustee may take possession and conduct the business of NJNG, may sell the trust estate, or proceed to foreclose the lien pursuant to the Mortgage Indenture. The interest rate on defaulted principal and interest, to the extent permitted by law, on the FMBs issued under the Mortgage Indenture is the rate stated in the applicable supplement or, if no such rate is stated, six percent per annum.
Sale-LeasebackSale Leaseback
NJNG
NJNG received $4 million and $9.9$4.0 million in December 2019, and 2018, respectively, in connection with the sale-leasebacksale leaseback of its natural gas meters. NJNG records a capital lease obligation that is paid over the term of the lease and has the option to purchase the meters back at fair value upon expiration of the lease. NJNG exercised early purchase options with respect to certain outstanding meter leases by making final principal payments of $1.2 million for both the six months ended March 31, 2021 and $1.1 million2020. There were no natural gas meter sale leasebacks recorded during the ninesix months ended June 30, 2020 and 2019, respectively. NJNG continues to evaluate this sale-leaseback program based on current market conditions. As noted, natural gas meters are accepted as property under the Mortgage Indenture. March 31, 2021.
Clean Energy Ventures
Clean Energy Ventures enters into transactions to sell the commercial solar assets concurrent with agreements to lease the assets back over a period of five to 15 years. These transactions are considered failed sale leasebacks for accounting purposes and are therefore treated as financing obligations, which are typically secured by the renewable energy facility asset and its future cash flows from SREC and energy sales. ITCs and other tax benefits associated with these solar projects are transferred to the buyer, if applicable. Clean Energy Ventures continues to operate the solar assets, including related expenses, and retain the revenue generated from SRECs and energy sales, and has the option to renew the lease or repurchase the assets sold at the end of the lease term. In JuneDecember 2020,, Clean Energy Ventures received proceeds of $42.9$12.1 million in connection with the sale-leasebacksale leaseback of threetwo commercial solar projects. Clean Energy Ventures did not receive proceeds related to the sale-leasebacksale leaseback of commercial solar assets during the ninesix months ended June 30, 2019. Clean Energy Ventures entered into transactions to sell certain of its commercial solar assets concurrent with agreements to lease the assets back over five to 15-year terms. These sale-leasebacks are financing obligations secured by the solar assets, related future cash flows from SREC and energy sales and a continuing guaranty by NJR. ITCs and other tax benefits associated with these solar projects were transferred to the buyer. Clean Energy Ventures will continue to operate the solar projects and retain ownership of SRECs generated, and has the option to renew the lease or repurchase the assets at the end of the lease term per the terms of the arrangement.March 31, 2020.
New Jersey Resources Corporation
Part I
ITEM 2. MANAGEMENT’S DISCUSSION AND ANALYSIS OF FINANCIAL CONDITION AND RESULTS OF
OPERATIONS (Continued)
Contractual Obligations
NJNG's total capital expenditures are projected to be $388between $424 million and $396$454 million induring fiscal 2020 and 2021, respectively.2021. Total capital expenditures spent or accrued during the ninesix months ended June 30, 2020,March 31, 2021, were $241.9$188.4 million. NJNG expects to fund its obligations with a combination of cash flowflows from operations, cash on hand, issuance of commercial paper, available capacity under its revolving credit facility and the issuance of long-term debt. As of June 30, 2020,March 31, 2021, NJNG's future MGP expenditures are estimated to be $128.9$143.5 million. For a more detailed description of MGP expenditures see Note 13. Commitments and Contingent Liabilities in the accompanying Unaudited Condensed Consolidated Financial Statements.
Estimated capital expenditures are reviewed on a regular basis and may vary based on the ongoing effects of regulatory constraints, environmental regulations, unforeseen events, and the ability to access capital.
New Jersey Resources Corporation
Part I
ITEM 2. MANAGEMENT’S DISCUSSION AND ANALYSIS OF FINANCIAL CONDITION AND RESULTS OF
OPERATIONS (Continued)
Clean Energy Ventures' expenditures include clean energy projects that support our goal to promote renewable energy. Accordingly, Clean Energy Ventures enters into agreements to install solar equipment involving both residential and commercial projects. During the ninesix months ended June 30, 2020,March 31, 2021, total capital expenditures spent or accrued related to the purchase and installation of solar equipment were $99.7$37.5 million. We estimate solar-related capital expenditures for projects during fiscal 20202021 to be between $125$96 million and $135$118 million.
During the ninesix months ended June 30, 2020,March 31, 2021, our Storage and Transportation segment had capital expenditures for the Adelphia Gateway project totaling $27.4 million and capital expenditures for Leaf River totaling $2.6 million. During fiscal 2021, we expect expenditures related to our Midstream investment in the Adelphia project were $175 million, which includes the remaining purchase price of $156 million that was paid upon the close of the acquisition of the related assets in January 2020. We estimate capital expenditures related to our Midstream investment in the AdelphiaGateway project to be between $180$110 million and $200$130 million in fiscal 2020. We estimate capitaland expenditures related to our Midstream investment in the PennEast projectLeaf River to be between $7$22 million and $8 million in fiscal 2020.$23 million.
Energy Services does not currently anticipate any significant capital expenditures during fiscal 2021 and 2022.
On December 16, 2020, Energy Services entered into a series of asset management agreements with an investment grade public utility to release pipeline capacity associated with certain natural gas transportation contracts. The utility will provide certain asset management services and Energy Services may deliver natural gas to the utility in exchange for aggregate net proceeds of approximately $500 million, payable through November 1, 2030. The asset management agreements include a series of initial and permanent releases commencing on November 1, 2021. NJR will receive approximately $260 million in cash from fiscal 20202022 through fiscal 2024 and 2021.$34 million per year from fiscal 2025 through fiscal 2031 under the agreements.
More detailed information regarding contractual obligations is contained in Liquidity and Capital Resources - Contractual Obligations section of Part II, Item 7. Management's Discussion and Analysis of Financial Condition and Results of Operations of our Annual Report on Form 10-K for the period ended September 30, 2019.2020.
Off-Balance-Sheet Arrangements
As of June 30, 2020,March 31, 2021, our off-balance-sheet arrangements consist of guarantees covering approximately $274.5$196.5 million of natural gas purchases, SREC sales and demand fee commitments and outstanding letters of credit totaling $9.2$11.0 million.
Cash Flows
Operating Activities
Cash flows from operating activities during the ninesix months ended June 30, 2020,March 31, 2021, totaled $182.8$356.3 million compared with $165.8$179.1 million during the ninesix months ended June 30, 2019.March 31, 2020. Operating cash flows are primarily affected by variations in working capital, which can be impacted by several factors, including:
•seasonality of our business;
•fluctuations in wholesale natural gas prices and other energy prices, including changes in derivative asset and liability values;
•timing of storage injections and withdrawals;
•the deferral and recovery of natural gas costs;
•changes in contractual assets utilized to optimize margins related to natural gas transactions;
•broker margin requirements;
•impact of unusual weather patterns on our wholesale business;
•timing of the collections of receivables and payments of current liabilities;
•volumes of natural gas purchased and sold; and
•timing of SREC deliveries.
The increase of $177.1 million in cash flows from operating activities during the six months ended March 31, 2021, compared with the six months ended March 31, 2020, was due primarily to higher net income due primarily to increased earnings at Energy Services along with increased working capital.
New Jersey Resources Corporation
Part I
ITEM 2. MANAGEMENT’S DISCUSSION AND ANALYSIS OF FINANCIAL CONDITION AND RESULTS OF
OPERATIONS (Continued)
The increase of $17 million in cash flows from operating activities during the nine months ended June 30, 2020, compared with the nine months ended June 30, 2019, was due primarily to increased margin at our Natural Gas Distribution segment related to increased base rates.
Investing Activities
Cash flows used in investing activities totaled $891$245.5 million during the ninesix months ended June 30, 2020,March 31, 2021, compared with cash flows used in investing activities totaling $105$751.1 million during the ninesix months ended June 30, 2019.March 31, 2020. The increasedecrease of $786$505.6 million was due primarily to the acquisition of Leaf River and Adelphia see Note 17. Acquisitions and Dispositions, for more detail,in the prior period that did not recur along with a decrease of $28.9 million in solar capital expenditures, partially offset by an increase in capital expenditures of $1.5$20.1 million for utility plant investments including cost of removal and $19.6$20.8 million in solar capital expenditures, a well as proceeds from the sale of our wind assetsfor Storage and Dominion shares that occurred in February 2019 and March 2019, respectively, that did not recur in fiscal 2020.Transportation.
Financing Activities
Financing cash flows generally are seasonal in nature and are impacted by the volatility in pricing in the natural gas and other energy markets. NJNG's inventory levels are built up during its natural gas injection season (April through October) and reduced during withdrawal season (November through March) in response to the supply requirements of its customers. Changes in financing cash flows can also be impacted by natural gas management and marketing activities at Energy Services and clean energy investments at Clean Energy Ventures.
Cash flows from financing activities totaled $749.4 million during the nine months ended June 30, 2020, compared with cash flows used in financing activities of $35.8totaled $171.2 million during the ninesix months ended June 30, 2019.March 31, 2021, compared with cash flows from financing activities of $596.3 million during the six months ended March 31, 2020. The increasedecrease of $785.2$767.6 million is due primarily to increased short-term debt activity at NJR primarily related to the acquisitionacquisitions of Leaf River and Adelphia in the issuanceprior period that did not recur and current period payments of $50 million of long-termshort-term debt, at NJNG, as well aspartially offset by proceeds of $42.9$12.1 million from solar sale-leasebackssale leasebacks at Clean Energy Ventures.Ventures in the current period.
Credit Ratings
The table below summarizes NJNG's credit ratings as of June 30, 2020,March 31, 2021, issued by two rating entities, Moody's and Fitch:
| | | | | | | | | |
| | Moody's | Fitch |
| Corporate Rating | Moody's | FitchN/A | A- |
Corporate RatingCommercial Paper | N/A | A-P-2 | F-2 |
Commercial PaperSenior Secured | P-2 | F-2A1 | A+ |
Senior Secured | A1 | A+ |
| Ratings Outlook | Stable | Stable | Stable |
The Fitch ratings and outlook were reaffirmed on March 18, 2020.15, 2021. NJNG's Moody's and Fitch ratings are investment-grade ratings. NJR is not a rated entity.
On March 18, 2020, Moody’s revised NJNG's secured rating from Aa3 to A1 and its commercial paper rating from P-1 to P-2. This change reflects Moody’s view that the NJNG's financial metrics are expected to remain below 20 percent over the next few years as the loss of cash flowP-2 resulting from deferred taxes and higher debt levels in funding itsto fund NJNG’s elevated capital program has brought down historically very strong credit metrics. These measures are mitigated by the credit supportive regulatory rate construct and NJNG's recovery mechanism.program. The outlook was increased to stable from negative. This action does not currently affect any of NJNG’s long-term borrowing rates or credit facility pricing.
Although NJNG is not party to any lending agreements that would accelerate the maturity date of any obligation caused by a failure to maintain any specific credit rating, if such ratings are downgraded below investment grade, borrowing costs could increase, as would the costs of maintaining certain contractual relationships and future financing and our access to capital markets would be reduced. Even if ratings are downgraded without falling below investment grade, NJR and NJNG could face increased borrowing costs under their credit facilities. A rating set forth above is not a recommendation to buy, sell or hold NJR's or NJNG's securities and may be subject to revision or withdrawal at any time. Each rating set forth above should be evaluated independently of any other rating.
The timing and mix of any external financings will target a common equity ratio that is consistent with maintaining NJNG's current short-term and long-term credit ratings.
New Jersey Resources Corporation
Part I
ITEM 3. QUANTITATIVE AND QUALITATIVE DISCLOSURES ABOUT MARKET RISK
Financial Risk Management
Commodity Market Risks
Natural gas is a nationally traded commodity. Its prices are determined effectively by the NYMEX, ICE and over-the-counter markets. The prices on the NYMEX, CME, ICE and over-the-counter markets generally reflect the national balance of natural gas supply and demand, but are also significantly influenced from time to time by other events.
Our regulated and unregulated businesses are subject to market risk due to fluctuations in the price of natural gas. To economically hedge against such fluctuations, we have entered into forwards, futures, options and swap agreements. To manage these derivative instruments, we have well-defined risk management policies and procedures that include daily monitoring of volumetric limits and monetary guidelines. Our natural gas businesses are conducted through two of our operating subsidiaries. NJNG is a regulated utility that uses futures, options and swaps to provide relative price stability, and its recovery of natural gas costs is governed by the BPU. Energy Services uses futures, options, swaps and physical contracts to economically hedge purchases and sales of natural gas.
The following table reflects the changes in the fair market value of financial derivatives related to natural gas purchases and sales:
| | | | | | | | | | | | | | | | | | | | | | | | | | |
| Balance | Increase | Less | Balance |
| (Thousands) | September 30, 2020 | (Decrease) in Fair
Market Value | Amounts
Settled | March 31,
2021 |
| Natural Gas Distribution | | $ | (211) | | | (1,440) | | | (2,152) | | | $ | 501 | |
| Energy Services | | 4,397 | | | 24,569 | | | 23,184 | | | 5,782 | |
| Total | | $ | 4,186 | | | 23,129 | | | 21,032 | | | $ | 6,283 | |
|
| | | | | | | | | | | | | | |
| | Balance | Increase | Less | Balance |
| (Thousands) | September 30, 2019 | (Decrease) in Fair Market Value | Amounts Settled | June 30,
2020 |
| Natural Gas Distribution | | $ | (188 | ) | | (6,605 | ) | | (6,603 | ) | | $ | (190 | ) |
| Energy Services | | (11,640 | ) | | 66,094 |
| | 41,531 |
| | 12,923 |
|
| Total | | $ | (11,828 | ) | | 59,489 |
| | 34,928 |
| | $ | 12,733 |
|
There were no changes in methods of valuations during the ninesix months ended June 30, 2020.March 31, 2021.
The following is a summary of fair market value of financial derivatives at June 30, 2020,March 31, 2021, excluding foreign exchange contracts discussed below, by method of valuation and by maturity for each fiscal year period:
|
| | | | | | | | | | | | | | | |
| (Thousands) | 2020 | 2021 | 2022 - 2024 | After 2024 | Total Fair Value |
| Price based on NYMEX/CME | $ | 1,159 |
| 869 |
| | 122 |
| | — |
| | $ | 2,150 |
|
| Price based on ICE | 4,957 |
| 4,975 |
| | 701 |
| | (50 | ) | | 10,583 |
|
| Total | $ | 6,116 |
| 5,844 |
| | 823 |
| | (50 | ) | | $ | 12,733 |
|
| | | | | | | | | | | | | | | | | | | | | | | | | | |
| (Thousands) | 2021 | 2022 | 2023 - 2025 | After 2025 | Total
Fair Value |
| Price based on NYMEX/CME | $ | 139 | | 42 | | | 12 | | | | | $ | 193 | |
| Price based on ICE | 4,658 | | 1,372 | | | 60 | | | | | 6,090 | |
| Total | $ | 4,797 | | 1,414 | | | 72 | | | — | | | $ | 6,283 | |
The following is a summary of financial derivatives by type as of June 30, 2020:March 31, 2021:
| | | | | | | | | | | | | | | | | |
| | Volume Bcf | Price per MMBtu(1) | Amounts included in Derivatives (Thousands) |
| Natural Gas Distribution | Futures | 22.1 | | $0.00 - $3.03 | | $ | 501 | |
| | | | | |
| | | | | |
| Energy Services | Futures | (11.6) | | $1.67 - $4.73 | | 5,589 | |
| Swaps | (0.8) | | $2.72 - $3.08 | | 193 | |
| | | | | |
| Total | | | | | $ | 6,283 | |
|
| | | | | | | | |
| | | Volume Bcf | Price per MMBtu(1) | Amounts included in Derivatives (Thousands) |
| Natural Gas Distribution | Futures | 18.8 |
| $1.62 - $3.88 | | $ | (190 | ) |
| Energy Services | Futures | (38.4 | ) | ($0.18) - $5.30 | | 11,149 |
|
| | Swaps | (2.3 | ) | $2.72 - $3.20 | | 1,774 |
|
| Total | | | | | $ | 12,733 |
|
| |
(1) | Million British thermal unit |
The following table reflects the changes in the fair market value of physical commodity contracts:
| | | | Balance | Increase | Less | Balance | | Balance | Increase | Less | Balance |
| (Thousands) | September 30, 2019 | (Decrease) in Fair
Market Value | Amounts
Settled | June 30,
2020 | (Thousands) | September 30, 2020 | (Decrease) in Fair
Market Value | Amounts
Settled | March 31,
2021 |
| Natural Gas Distribution - Prices based on other external data | | $ | (178 | ) | | 184 |
| | 73 |
| | $ | (67 | ) | Natural Gas Distribution - Prices based on other external data | | $ | 2 | | | 782 | | | 608 | | | $ | 176 | |
| Energy Services - Prices based on other external data | | (31,624 | ) | | (1,999 | ) | | (2,044 | ) | | (31,579 | ) | Energy Services - Prices based on other external data | | (24,723) | | | (7,121) | | | (371) | | | (31,473) | |
| Total | | $ | (31,802 | ) | | (1,815 | ) | | (1,971 | ) | | $ | (31,646 | ) | Total | | $ | (24,721) | | | (6,339) | | | 237 | | | $ | (31,297) | |
New Jersey Resources Corporation
Part I
ITEM 3. QUANTITATIVE AND QUALITATIVE DISCLOSURES ABOUT MARKET RISK (Continued)
The following table reflects the changes in the fair market value of interest rate contracts:
|
| | | | | | | | | | | | | | |
| | Balance | Increase | Less | Balance |
| (Thousands) | September 30, 2019 | (Decrease) in Fair
Market Value | Amounts
Settled | June 30,
2020 |
| Natural Gas Distribution - Prices based on other external data | | $ | — |
| | (5,056 | ) | | — |
| | $ | (5,056 | ) |
| Home Services and Other - Prices based on other external data | | — |
| | (13,298 | ) | | (2,502 | ) | | (10,796 | ) |
| Total | | $ | — |
| | (18,354 | ) | | (2,502 | ) | | $ | (15,852 | ) |
Our market price risk is predominately linked with changes in the price of natural gas at the Henry Hub, the delivery point for the NYMEX natural gas futures contracts. Based on price sensitivity analysis, an illustrative 10 percent movement in the natural gas futures contract price, for example, increases (decreases) the reported derivative fair value of all open, unadjusted Henry Hub natural gas futures and fixed price swap positions by approximately $7.5$2.4 million. This analysis does not include potential changes to reported credit adjustments embedded in the $0$0.4 million reported fair value.
| | | | | | | | | | | | | | | | | |
| Derivative Fair Value Sensitivity Analysis | |
| (Thousands) | Henry Hub Futures and Fixed Price Swaps |
| Percent increase in NYMEX natural gas futures prices | 0% | 5% | 10% | 15% | 20% |
| Estimated change in derivative fair value | $ | — | | $ | (1,179) | | $ | (2,357) | | $ | (3,536) | | $ | (4,715) | |
| Ending derivative fair value | $ | 423 | | $ | (756) | | $ | (1,934) | | $ | (3,113) | | $ | (4,292) | |
| | | | | |
| Percent decrease in NYMEX natural gas futures prices | 0% | (5)% | (10)% | (15)% | (20)% |
| Estimated change in derivative fair value | $ | — | | $ | 1,179 | | $ | 2,357 | | $ | 3,536 | | $ | 4,715 | |
| Ending derivative fair value | $ | 423 | | $ | 1,602 | | $ | 2,780 | | $ | 3,959 | | $ | 5,138 | |
|
| | | | | | | | | | | | | | | |
| Derivative Fair Value Sensitivity Analysis | |
| (Thousands) | Henry Hub Futures and Fixed Price Swaps |
| Percent increase in NYMEX natural gas futures prices | 0% | 5% | 10% | 15% | 20% |
| Estimated change in derivative fair value | $ | — |
| $ | (3,773 | ) | $ | (7,546 | ) | $ | (11,319 | ) | $ | (15,092 | ) |
| Ending derivative fair value | $ | (373 | ) | $ | (4,146 | ) | $ | (7,919 | ) | $ | (11,692 | ) | $ | (15,465 | ) |
| | | | | | |
| Percent decrease in NYMEX natural gas futures prices | 0% | (5)% | (10)% | (15)% | (20)% |
| Estimated change in derivative fair value | $ | — |
| $ | 3,773 |
| $ | 7,546 |
| $ | 11,319 |
| $ | 15,092 |
|
| Ending derivative fair value | $ | (373 | ) | $ | 3,400 |
| $ | 7,173 |
| $ | 10,946 |
| $ | 14,719 |
|
Wholesale Credit Risk
The following is a summary of gross and net credit exposures, grouped by investment and non-investment grade counterparties, as of June 30, 2020.March 31, 2021. Gross credit exposure for Energy Services is defined as the unrealized fair value of derivative and energy trading contracts plus any outstanding wholesale receivable for the value of natural gas or power delivered and/or financial derivative commodity contract that has settled for which payment has not yet been received. Gross credit exposure for MidstreamStorage and Transportation is defined as demand and estimated usage fees for contracted services and/or market value of loan balances for which payment has not yet been received. Net credit exposure is defined as gross credit exposure reduced by collateral received from counterparties and/or payables, where netting agreements exist. The amounts presented below exclude accounts receivable for NJNG retail natural gas sales and services.
Energy Services', Clean Energy Ventures' and Midstream'sStorage and Transportation's counterparty credit exposure as of June 30, 2020,March 31, 2021, is as follows:
| | | | | | | | | | | | | | |
| (Thousands) | Gross Credit Exposure | Net Credit Exposure |
| Investment grade | | $ | 122,148 | | | $ | 107,865 | |
| Noninvestment grade | | 9,445 | | | 1,114 | |
| Internally rated investment grade | | 23,607 | | | 17,921 | |
| Internally rated noninvestment grade | | 19,949 | | | 11,966 | |
| Total | | $ | 175,149 | | | $ | 138,866 | |
|
| | | | | | | | |
| (Thousands) | Gross Credit Exposure | Net Credit Exposure |
| Investment grade | | $ | 122,345 |
| | $ | 109,175 |
|
| Noninvestment grade | | 8,460 |
| | 1,771 |
|
| Internally rated investment grade | | 22,660 |
| | 20,003 |
|
| Internally rated noninvestment grade | | 9,171 |
| | 3,649 |
|
| Total | | $ | 162,636 |
| | $ | 134,598 |
|
New Jersey Resources Corporation
Part I
ITEM 3. QUANTITATIVE AND QUALITATIVE DISCLOSURES ABOUT MARKET RISK (Continued)
NJNG's counterparty credit exposure as of June 30, 2020,March 31, 2021, is as follows:
| | | | | | | | | | | | | | |
| (Thousands) | Gross Credit Exposure | Net Credit Exposure |
| Investment grade | | $ | 6,437 | | | $ | 6,182 | |
| Noninvestment grade | | 26 | | | — | |
| Internally rated investment grade | | 54 | | | 32 | |
| Internally rated noninvestment grade | | 169 | | | 2 | |
| Total | | $ | 6,686 | | | $ | 6,216 | |
|
| | | | | | | | |
| (Thousands) | Gross Credit Exposure | Net Credit Exposure |
| Investment grade | | $ | 3,681 |
| | $ | 3,302 |
|
| Noninvestment grade | | 455 |
| | — |
|
| Internally rated investment grade | | 217 |
| | 39 |
|
| Internally rated noninvestment grade | | 3,148 |
| | — |
|
| Total | | $ | 7,501 |
| | $ | 3,341 |
|
Due to the inherent volatility in the market price for natural gas, electricity and SRECs, the market value of contractual positions with individual counterparties could exceed established credit limits or collateral provided by those counterparties. If a counterparty failed to perform the obligations under its contract (for example, failed to make payment for natural gas received), we could sustain a loss. This loss would comprise the loss on natural gas delivered but not paid for and/or the cost of replacing natural gas not delivered or received at a price that exceeds the original contract price. Any such loss could have a material impact on our financial condition, results of operations or cash flows.
New Jersey Resources Corporation
Part I
ITEM 3. QUANTITATIVE AND QUALITATIVE DISCLOSURES ABOUT MARKET RISK (Continued)
Effects of Interest Rate and Foreign Currency Rate Fluctuations
We are also exposed to changes in interest rates on our debt hedges, variable rate debt and changes in foreign currency rates for our business conducted in Canada using Canadian dollars. We do not believe an immediate 10 percent increase or decrease in interest rates or foreign currency rates would have a material effect on our operating results or cash flows.
Information regarding NJR's interest rate risk can be found in Item 7A. Quantitative and Qualitative Disclosures About Market Risks and the Liquidity and Capital Resources - Debt section of Item 7. Management's Discussion and Analysis of Financial Condition and Results of Operations of our Annual Report on Form 10-K for the period ended September 30, 20192020.
Effects of Inflation
Although inflation rates have been relatively low to moderate in recent years, including the three most recent fiscal years, any change in price levels has an effect on operating results due to the capital-intensive and regulated nature of our utility subsidiary. We attempt to minimize the effects of inflation through cost control, productivity improvements and regulatory actions, when appropriate.
ITEM 4. CONTROLS AND PROCEDURES
Disclosure Controls and Procedures
Under the supervision and with the participation of our management, including our principal executive officer and principal financial officer, we conducted an evaluation of the effectiveness of the design and operation of our disclosure controls and procedures (as defined in Rules 13a-15(e) and 15d-15(e) under the Exchange Act), as of the end of the period covered by this report. Based on this evaluation, our principal executive officer and principal financial officer concluded that, as of end of the period covered by this report, our disclosure controls and procedures are effective, to ensure that information required to be disclosed by us in the reports that we file or submit under the Exchange Act, is recorded, processed, summarized and reported, within the time periods specified in the U.S. Securities and Exchange Commission'sSEC's rules and forms, and that such information is accumulated and communicated to our management, including our principal executive officer and principal financial officer, as appropriate, to allow timely decisions regarding required disclosure.
Changes in Internal Control over Financial Reporting
There has been no change in internal control over financial reporting (as such term is defined in Exchange Act Rule 13a-15(f)) that occurred during the quarter ended June 30, 2020,March 31, 2021, that has materially affected, or is reasonably likely to materially affect, internal control over financial reporting.
New Jersey Resources Corporation
Part II
ITEM 1. LEGAL PROCEEDINGS
Information regarding reportable legal proceedings is contained in Part I, Item 3. Legal Proceedings in our Annual Report on Form 10-K for the year ended September 30, 2019,2020, and is set forth in Part I, Item 1, Note 13. Commitments and Contingent Liabilities-Legal Proceedings on the Unaudited Condensed Consolidated Financial Statements, which is incorporated by reference. No legal proceedings became reportable during the quarter ended June 30, 2020,March 31, 2021, and there have been no material developments during such quarter regarding any previously reported legal proceedings, which have not been previously disclosed.
ITEM 1A. RISK FACTORS
While we attempt to identify, manage and mitigate risks and uncertainties associated with our business to the extent practical, under the circumstances, some level of risk and uncertainty will always be present. Part I, Item 1A. Risk Factors of our 20192020 Annual Report on Form 10-K includes a detailed discussion of our risk factors. Those risks and uncertainties have the potential to materially affect our financial condition and results of operations. There have been no material changes in our risk factors from those previously disclosed in Part I, Item 1A, of our 20192020 Annual Report on Form 10-K and Part II, Item 1A, of our Quarterly Report on Form 10-Q for the quarter ended March 31, 2020.10-K.
ITEM 2. UNREGISTERED SALE OF EQUITY SECURITIES AND USE OF PROCEEDS
The following table sets forth our repurchase activity for the quarter ended June 30, 2020:March 31, 2021:
|
| | | | | | | | | | | | | | | | |
| Period | Total Number of Shares (or (or Units) Purchased
| Average Price Paid per Share (or Unit) | Total Number of Shares (or Units) Purchased as Part of Publicly Announced Plans or Programs | Maximum Number (or Approximate Dollar Value) of Shares (or Units) That May Yet Be Purchased Under the Plans or Programs |
1/01/2001/21 - 4/30/2001/31/21 | — | $ | — |
| — |
| | 2,431,053 |
5/02/01/2021 - 5/31/2002/28/21 | — | — |
| — |
| | 2,431,053 |
6/03/01/2021 - 6/30/2003/31/21 | — | — |
| — |
| | 2,431,053 |
| Total | — | $ | — |
| — |
| | 2,431,053 |
The stock repurchase plan, which was authorized by our Board of Directors, became effective in September 1996 and as of June 30, 2020,March 31, 2021, included 19.5 million shares of common stock for repurchase, of which, approximately 2.4 million shares remained available for repurchase. The stock repurchase plan will expire when we have repurchased all shares authorized for repurchase thereunder, unless the repurchase plan is earlier terminated by action of our Board of Directors or further shares are authorized for repurchase.
New Jersey Resources Corporation
Part II
ITEM 6. EXHIBITS
| | | | | |
Exhibit
Number | Exhibit Description |
| | | | | | | | |
| |
Exhibit
Number
| Exhibit Description |
|
| | |
4.1 | | |
| | |
| | |
| | |
| | |
| | |
| | |
| | |
| | |
| | |
| | |
| | |
| | |
| | |
| | |
| | |
| | |
| | |
| 31.1+ | |
| |
4.2 | |
| |
4.3 | |
| |
10.1 | 364-Day $250,000,000 Revolving Credit Facility, dated as of April 24, 2020 by and among New Jersey Resources Corporation and each of the Guarantors party thereto and the lenders party thereto, and PNC Bank, National Association and PNC Capital Markets LLC, SunTrust Robinson Humphrey, Inc. and TD Bank, N.A., as Joint Lead Arrangers, and Truist Bank and TB Bank, N.A., as Co- Syndication Agents (incorporated by reference to Exhibit 10.1 to the Current Report on Form 8-K, as filed on April 27, 2020) |
| |
10.2 | First Amendment to the Term Loan Credit Agreement, dated as of April 23, 2020, by and among New Jersey Resources Corporation and each of the Guarantors party thereto and the lenders party thereto and Wells Fargo Bank, National Association and Wells Fargo Securities, LLC (incorporated by reference to Exhibit 10.2 to the Current Report on Form 8-K, as filed on April 27, 2020) |
| |
31.1+ | | |
| | |
| 31.2+ | | |
| | |
| 32.1+ † | | |
| | |
| 32.2+ † | | |
| | |
| 101+ | Interactive Data File (Form 10-Q, for the fiscal period ended June 30, 2020,March 31, 2021, furnished in iXBRL (Inline eXtensible Business Reporting Language)) | |
| | |
| 104+ | Cover Page Interactive Data File included in Exhibit 101 | |
+ Filed herewith.
† This certificate accompanies this report pursuant to Section 906 of the Sarbanes-Oxley Act of 2002 and shall not be deemed filed by NJR for purposes of Section 18 or any other provision of the Securities Exchange Act of 1934, as amended.
New Jersey Resources Corporation
Part II
SIGNATURES
Pursuant to the requirements of the Securities Exchange Act of 1934, the registrant has duly caused this report to be signed on its behalf by the undersigned, thereunto duly authorized.
| | | | | | | | |
| | |
| | NEW JERSEY RESOURCES CORPORATION |
| | (Registrant) |
| Date: | August 7, 2020May 6, 2021 | |
| | By:/s/ Patrick Migliaccio |
| | Patrick Migliaccio |
| | Senior Vice President and |
| | Chief Financial Officer |