UNITED STATES
SECURITIES AND EXCHANGE COMMISSION
Washington, D.C. 20549
FORM 10-Q
☒ QUARTERLY REPORT PURSUANT TO SECTION 13 OR 15(d) OF THE SECURITIES EXCHANGE ACT OF 1934
For the quarterly period ended March 31, 20212022
OR
☐ TRANSITION REPORT PURSUANT TO SECTION 13 OR 15(d) OF THE SECURITIES EXCHANGE ACT OF 1934
For the transition period from to
Commission File Number: 001-08359
NEW JERSEY RESOURCES CORPORATION
| | | | | | | | | | | | | | | | | | | | | | | | | | |
| (Exact name of registrant as specified in its charter) |
| | | | | | | | |
| New Jersey | | | | | 22-2376465 | |
| (State or other jurisdiction of incorporation or organization) | | (I.R.S. Employer Identification Number) |
| | | | | | | | |
| 1415 Wyckoff Road | | | (732) | 938‑1480 | |
| Wall | New Jersey | 07719 | | | (Registrant's telephone number,
including area code) |
| (Address of principal executive offices) | |
| | | | | | | | |
| Securities registered pursuant to Section 12 (b) of the Act: |
| | | | | | | | |
| Title of each class | Trading symbol(s) | Name of each exchange on which registered)registered |
| Common Stock - $2.50 Par Value | | NJR | New York Stock Exchange |
Indicate by check mark whether the registrant (1) has filed all reports required to be filed by Section 13 or 15(d) of the Securities Exchange Act of 1934 during the preceding 12 months (or for such shorter period that the registrant was required to file such reports), and (2) has been subject to such filing requirements for the past 90 days.
Yes: ☒ No: ☐
Indicate by check mark whether the registrant has submitted electronically every Interactive Data File required to be submitted pursuant to Rule 405 of Regulation S-T during the preceding 12 months (or for such shorter period that the registrant was required to submit such files).
Yes: ☒ No: ☐
Indicate by check mark whether the registrant is a large accelerated filer, an accelerated filer, a non-accelerated filer, a smaller reporting company or an emerging growth company. See definitions of “large accelerated filer,” “accelerated filer,” “smaller reporting company,” and “emerging growth company” in Rule 12b‑2 of the Exchange Act.
| | | | | | | | | | | | | | |
| Large accelerated filer | ☒ | | Accelerated filer | ☐ |
| Non-accelerated filer | ☐ | | Smaller reporting company | ☐ |
| | | Emerging growth company | ☐ |
If an emerging growth company, indicate by check mark if the registrant has elected not to use the extended transition period for complying with any new or revised financial accounting standards provided pursuant to Section 13(a) of the Exchange Act. o
Indicate by check mark whether the registrant is a shell company (as defined in Rule 12b-2 of the Exchange Act).
Yes: ☐ No: ☒
The number of shares outstanding of $2.50 par value Common Stock as of May 3, 20212, 2022 was 96,339,849.96,152,712.
New Jersey Resources Corporation
TABLE OF CONTENTS
| | | | | | | | | | | |
| | | Page |
| |
| |
| PART I. FINANCIAL INFORMATION | |
| ITEM 1. | | |
| | | |
| | | |
| | | |
| | | |
| | | |
| | | |
| | | |
| | | |
| | | |
| | | |
| | | |
| | | |
| | | |
| | | |
| | | |
| | | |
| | | |
| | | |
| | | |
| ITEM 2. | | |
| ITEM 3. | | |
| ITEM 4. | | |
| PART II. OTHER INFORMATION | |
| ITEM 1. | | |
| ITEM 1A. | | |
| ITEM 2. | | |
| ITEM 6. | | |
| | | |
New Jersey Resources Corporation
GLOSSARY OF KEY TERMS
| | | | | |
| Adelphia Gateway | Adelphia Gateway, LLC |
| AFUDC | Allowance for Funds Used During Construction |
| AMA | Asset Management Agreement |
| ASC | Accounting Standards Codification |
| ASU | Accounting Standards Update |
| Bcf | Billion Cubic Feet |
| BGSS | Basic Gas Supply Service |
| BPU | New Jersey Board of Public Utilities |
CARES Act | Coronavirus Aid, Relief, and Economic Security Act |
| CIP | Conservation Incentive Program |
| Clean Energy Ventures | Clean Energy Ventures segment |
| CME | Chicago Mercantile Exchange |
| COVID-19 | Novel coronavirus disease |
| CR&R | Commercial Realty & Resources Corp. |
| DRP | NJR Direct Stock Purchase and Dividend Reinvestment Plan |
Dths | Dekatherms |
| EE | Energy Efficiency |
| Energy Services | Energy Services segment |
EPSExchange Act | Earnings Per ShareSecurities Exchange Act of 1934, as amended |
| FASB | Financial Accounting Standards Board |
| FCM | Futures Commission Merchant |
| FERC | Federal Energy Regulatory Commission |
| Financial margin | A non-GAAP financial measure, which represents revenues earned from the sale of natural gas less costs of natural gas sold including any transportation and storage costs, and excludes certain operations and maintenance expense and depreciation and amortization, as well as any accounting impact from the change in the fair value of certain derivative instruments |
| Fitch | Fitch Ratings Company |
| FMB | First Mortgage Bond |
| GAAP | Generally Accepted Accounting Principles of the United States |
| Home Services and Other | Home Services and Other Operations |
| ICE | Intercontinental Exchange |
IEC | Interstate Energy Company, LLC |
| IIP | Infrastructure Investment Program |
| IRS | Internal Revenue Service |
| ISDA | The International Swaps and Derivatives Association |
| ITC | Federal Investment Tax Credit |
| Leaf River | Leaf River Energy Center LLC |
| MGP | Manufactured Gas Plant |
| MMBtu | Million British Thermal Units |
| Moody's | Moody's Investors Service, Inc. |
| Mortgage Indenture | The Amended and Restated Indenture of Mortgage, Deed of Trust and Security Agreement between NJNG and U.S. Bank National Association dated as of September 1, 2014 |
| MW | Megawatts |
| MWh | Megawatt Hour |
| NAESB | The North American Energy Standards Board |
Natural Gas ActDistribution | The Natural Gas Act of 1938, as amended; the federal law regulating interstate natural gas pipeline and storage companies, among other things, codified beginning at 15 U.S.C. Section 717.Distribution segment |
| NFE | Net Financial Earnings |
| NJ RISE | New Jersey Reinvestment in System Enhancement |
| NJCEP | New Jersey's Clean Energy Program |
| NJDEP | New Jersey Department of Environmental Protection |
| |
New Jersey Resources Corporation
| | | | | |
| GLOSSARY OF KEY TERMS (cont.) |
| |
| NJNG | New Jersey Natural Gas Company |
| NJNG Credit Facility | NJNG'sThe $250 million unsecured committed credit facility expiring in December 2023September 2026 |
| NJR Credit Facility | NJR's $425The $500 million unsecured committed credit facility expiring in December 2023September 2026 |
| NJR or The Company | New Jersey Resources Corporation |
| NJRHS | NJR Home Services Company |
| Non-GAAP | Not in accordance with Generally Accepted Accounting Principles of the United States |
| NPNS | Normal Purchase/Normal Sale |
| NYMEX | New York Mercantile Exchange |
OASDIOCI | Old Age, Survivors and Disability Insurance taxOther Comprehensive Income |
| O&M | Operation and Maintenance |
| OPEB | Other Postemployment Benefit Plans |
| PennEast | PennEast Pipeline Company, LLC |
| PPA | Power Purchase Agreement |
| RAC | Remediation Adjustment Clause |
| REC | Renewable Energy Certificate |
S&P | Standard & Poor's Financial Services, LLC |
| SAFE II | Safety Acceleration and Facility Enhancement Program, Phase II |
| SAVEGREEN | The SAVEGREEN Project® |
| SBC | Societal Benefits Charge |
SECSOFR | U.S. Securities and Exchange CommissionA rate equal to the secured overnight financing rate as administered by the Federal Reserve Bank of New York (or a successor administrator of the secured overnight financing rate) |
| SREC | Solar Renewable Energy Certificate |
SRL | Southern Reliability Link |
| Steckman Ridge | Collectively, Steckman Ridge GP, LLC and Steckman Ridge, LP |
| Storage and Transportation | Storage and Transportation segment |
Talen | Talen Energy Marketing, LLC |
| TETCO | Texas Eastern Transmission |
The Exchange Act | The Securities Exchange Act of 1934, as amended |
The Tax Act | An Act to Provide for Reconciliation Pursuant to Titles II and V of the Concurrent Resolution on the Budget for Fiscal Year 2018, previously known as The Tax Cuts and Jobs Act of 2017 |
Third Circuit | The United States Court of Appeals for the Third Circuit |
| TREC | Transition Renewable Energy Certificate |
| Trustee | U.S. Bank National Association |
| U.S. | The United States of America |
| USF | Universal Service Fund |
| Utility Gross Margin | A non-GAAP financial measure, which represents operating revenues less natural gas purchases, sales tax, and regulatory rider expense, and excludes certain operations and maintenance expense and depreciation and amortization |
New Jersey Resources Corporation
INFORMATION CONCERNING FORWARD-LOOKING STATEMENTS
Certain statements contained in this report, including, without limitation, statements as to management expectations, assumptions and beliefs presented in Part I, Item 2. “Management's Discussion and Analysis of Financial Condition and Results of Operations,” Part I, Item 3. “Quantitative and Qualitative Disclosures About Market Risk,” Part II, Item 1. “Legal Proceedings” and in the notes to the financial statements are forward-looking statements within the meaning of Section 27A of the Securities Act of 1933, as amended, Section 21E of the Securities Exchange Act of 1934, as amended, and the Private Securities Litigation Reform Act of 1995. Forward-looking statements can also be identified by the use of forward-looking terminology such as “anticipate,” “estimate,” “may,” “could,” “might,” “intend,” “expect,” “believe,” “will” “plan,” or “should,” or comparable terminology and are made based upon management's current expectations, assumptions and beliefs as of this date concerning future developments and their potential effect on us. There can be no assurance that future developments will be in accordance with management's expectations, assumptions or beliefs, or that the effect of future developments on us will be those anticipated by management.
We caution readers that the expectations, assumptions and beliefs that form the basis for forward-looking statements regarding customer growth, customer usage, qualifications for ITCs, RECs, future rate case proceedings, financial condition, results of operations, cash flows, capital requirements, future capital expenditures, market risk, effective tax rate and other matters for fiscal 20212022 and thereafter include many factors that are beyond our ability to control or estimate precisely, such as estimates of future market conditions, the behavior of other market participants and changes in the debt and equity capital markets. The factors that could cause actual results to differ materially from our expectations, assumptions and beliefs include, but are not limited to, those discussed in Item 1A. Risk Factors of our Annual Report on Form 10-K for the fiscal year ended September 30, 2020,2021, as well as the following:
•risks related to the impact of COVID-19, including the rise of COVID-19 mutations that have resulted in increased rates of reported cases, as well as impacts on business operations, supply chain, financial performance and condition and cash flows;
•our ability to obtain governmental and regulatory approvals, land-use rights, electric grid connection (in the case of clean energy projects) and/or financing for the construction, development and operation of our unregulated energy investments, pipeline transportation systems and NJNG and Storage and Transportation infrastructure projects, including PennEast and Adelphia Gateway, in a timely manner;
•risks associated with our investments in clean energy projects, including the availability of regulatory incentives and federal tax credits, the availability of viable projects, our eligibility for ITCs, the future market for SRECsRECs and electricity prices, our ability to complete construction of the projects and operational risks related to projects in service;
•risks associated with acquisitions and the related integration of acquired assets with our current operations, including the acquisition of Adelphia Gateway and Leaf River;Gateway;
•our ability to comply with current and future regulatory requirements;
•volatility of natural gas and other commodity prices and their impact on NJNG customer usage, NJNG’s BGSS incentive programs, our Energy Services segment operations and our risk management efforts;
•the performance of our subsidiaries;
•access to adequate supplies of natural gas and dependence on third-party storage and transportation facilities for natural gas supply;
•the level and rate at which NJNG’s costs and expenses are incurred and the extent to which they are approved for recovery from customers through the regulatory process, including through future base rate case filings;
•the impact of a disallowance of recovery of environmental-related expenditures and other regulatory changes;
•the regulatory and pricing policies of federal and state regulatory agencies;
•operating risks incidental to handling, storing, transporting and providing customers with natural gas;
•demographic changes in our service territory and their effect on our customer growth;
•timing of qualifying for ITCs due to delays or failures to complete planned solar projects and the resulting impact on our effective tax rate and earnings;
•changes in rating agency requirements and/or credit ratings and their effect on availability and cost of capital to the Company;
•the impact of volatility in the equity and credit markets on our access to capital;capital, including the risks, political and economic disruption and uncertainty related to Russia's recent military invasion of Ukraine, and the international community’s responses;
•our ability to comply with debt covenants;
•the results of legal or administrative proceedings with respect to claims, rates, environmental issues, natural gas cost prudence reviews and other matters;
•risks related to cyberattacks or failure of information technology systems;
•the impact to the asset values and resulting higher costs and funding obligations of our pension and postemployment benefit plans as a result of potential downturns in the financial markets, lower discount rates, revised actuarial assumptions or impacts associated with the Patient Protection and Affordable Care Act;
•commercial and wholesale credit risks, including the availability of creditworthy customers and counterparties, and liquidity in the wholesale energy trading market;
•accounting effects and other risks associated with hedging activities and use of derivatives contracts;
•our ability to optimize our physical assets;
•weather and economic conditions;conditions, including those changes in weather and weather patterns that could be attributable to climate change;
•the costs of compliance with present and future environmental laws, potential climate change-related legislation or any legislation resulting from the 2019 New Jersey Energy Master Plan;
•uncertainties related to litigation, regulatory, administrative or environmental proceedings;
•changes to tax laws and regulations;
•impacts of inflation and increased natural gas costs;
•any potential need to record a valuation allowance for our deferred tax assets;
•the impact of natural disasters, terrorist activities and other extreme events on our operations and customers;
•risks related to our employee workforce and succession planning;
•risks associated with the management of our joint ventures and partnerships; and
•risks associated with keeping pace with technological change.
While we periodically reassess material trends and uncertainties affecting our results of operations and financial condition in connection with the preparation of management's discussion and analysis of results of operations and financial condition contained in our Quarterly and Annual Reports on Form 10-Q and Form 10-K, respectively, we do not, by including this statement, assume any obligation to review or revise any particular forward-looking statement referenced herein in light of future events.
New Jersey Resources Corporation
Part I
ITEM 1. FINANCIAL STATEMENTS
CONDENSED CONSOLIDATED STATEMENTS OF OPERATIONS (Unaudited)
| | | Three Months Ended | Six Months Ended | | Three Months Ended | Six Months Ended |
| | March 31, | | March 31, |
| (Thousands, except per share data) | (Thousands, except per share data) | 2021 | | 2020 | 2021 | | 2020 | (Thousands, except per share data) | 2022 | | 2021 | 2022 | | 2021 |
| OPERATING REVENUES | OPERATING REVENUES | | OPERATING REVENUES | |
| Utility | Utility | $ | 310,167 | | | $ | 297,220 | | $ | 505,896 | | | $ | 516,843 | | Utility | $ | 463,474 | | | $ | 310,167 | | $ | 737,909 | | | $ | 505,896 | |
| Nonutility | Nonutility | 492,020 | | | 342,394 | | 750,596 | | | 737,807 | | Nonutility | 448,842 | | | 492,020 | | 850,249 | | | 750,596 | |
| Total operating revenues | Total operating revenues | 802,187 | | | 639,614 | | 1,256,492 | | | 1,254,650 | | Total operating revenues | 912,316 | | | 802,187 | | 1,588,158 | | | 1,256,492 | |
| OPERATING EXPENSES | OPERATING EXPENSES | | OPERATING EXPENSES | |
| Natural gas purchases: | Natural gas purchases: | | Natural gas purchases: | |
| Utility | Utility | 113,235 | | | 111,563 | | 169,380 | | | 203,377 | | Utility | 212,892 | | | 113,235 | | 335,161 | | | 169,380 | |
| Nonutility | Nonutility | 330,488 | | | 318,384 | | 503,735 | | | 635,740 | | Nonutility | 410,535 | | | 330,488 | | 689,329 | | | 503,735 | |
| Related parties | Related parties | 1,730 | | | 1,506 | | 3,464 | | | 3,030 | | Related parties | 1,883 | | | 1,730 | | 3,729 | | | 3,464 | |
| Operation and maintenance | Operation and maintenance | 110,265 | | | 66,832 | | 183,901 | | | 130,177 | | Operation and maintenance | 85,786 | | | 110,265 | | 154,770 | | | 183,901 | |
| Regulatory rider expenses | Regulatory rider expenses | 18,413 | | | 15,330 | | 29,114 | | | 27,072 | | Regulatory rider expenses | 30,910 | | | 18,413 | | 47,581 | | | 29,114 | |
| Depreciation and amortization | Depreciation and amortization | 26,848 | | | 27,516 | | 54,210 | | | 52,153 | | Depreciation and amortization | 31,435 | | | 26,848 | | 61,828 | | | 54,210 | |
| | Total operating expenses | Total operating expenses | 600,979 | | | 541,131 | | 943,804 | | | 1,051,549 | | Total operating expenses | 773,441 | | | 600,979 | | 1,292,398 | | | 943,804 | |
| OPERATING INCOME | OPERATING INCOME | 201,208 | | | 98,483 | | 312,688 | | | 203,101 | | OPERATING INCOME | 138,875 | | | 201,208 | | 295,760 | | | 312,688 | |
| Other income, net | Other income, net | 5,007 | | | 7,261 | | 9,124 | | | 7,547 | | Other income, net | 4,127 | | | 5,007 | | 8,263 | | | 9,124 | |
| Interest expense, net of capitalized interest | Interest expense, net of capitalized interest | 20,153 | | | 19,203 | | 39,939 | | | 35,273 | | Interest expense, net of capitalized interest | 18,926 | | | 20,153 | | 38,403 | | | 39,939 | |
| INCOME BEFORE INCOME TAXES AND EQUITY IN EARNINGS OF AFFILIATES | INCOME BEFORE INCOME TAXES AND EQUITY IN EARNINGS OF AFFILIATES | 186,062 | | | 86,541 | | 281,873 | | | 175,375 | | INCOME BEFORE INCOME TAXES AND EQUITY IN EARNINGS OF AFFILIATES | 124,076 | | | 186,062 | | 265,620 | | | 281,873 | |
| Income tax provision | Income tax provision | 39,057 | | | 16,284 | | 56,498 | | | 32,755 | | Income tax provision | 28,810 | | | 39,057 | | 59,617 | | | 56,498 | |
| Equity in earnings of affiliates | Equity in earnings of affiliates | 2,804 | | | 3,589 | | 5,479 | | | 6,978 | | Equity in earnings of affiliates | 769 | | | 2,804 | | 1,344 | | | 5,479 | |
| NET INCOME | NET INCOME | $ | 149,809 | | | $ | 73,846 | | $ | 230,854 | | | $ | 149,598 | | NET INCOME | $ | 96,035 | | | $ | 149,809 | | $ | 207,347 | | | $ | 230,854 | |
| | EARNINGS PER COMMON SHARE | EARNINGS PER COMMON SHARE | | EARNINGS PER COMMON SHARE | |
| Basic | Basic | $1.56 | | $0.78 | $2.40 | | $1.60 | Basic | $1.00 | | $1.56 | $2.16 | | $2.40 |
| Diluted | Diluted | $1.55 | | $0.77 | $2.39 | | $1.59 | Diluted | $1.00 | | $1.55 | $2.15 | | $2.39 |
| WEIGHTED AVERAGE SHARES OUTSTANDING | WEIGHTED AVERAGE SHARES OUTSTANDING | | WEIGHTED AVERAGE SHARES OUTSTANDING | |
| Basic | Basic | 96,248 | | | 95,584 | | 96,181 | | | 93,747 | | Basic | 96,068 | | | 96,248 | | 96,006 | | | 96,181 | |
| Diluted | Diluted | 96,618 | | | 95,890 | | 96,598 | | | 94,073 | | Diluted | 96,516 | | | 96,618 | | 96,480 | | | 96,598 | |
CONDENSED CONSOLIDATED STATEMENTS OF COMPREHENSIVE INCOME (Unaudited)
| | | Three Months Ended | Six Months Ended | | Three Months Ended | Six Months Ended |
| | March 31, | | March 31, |
| (Thousands) | (Thousands) | | 2021 | 2020 | 2021 | 2020 | (Thousands) | | 2022 | 2021 | 2022 | 2021 |
| Net income | Net income | | $ | 149,809 | | $ | 73,846 | | $ | 230,854 | | $ | 149,598 | | Net income | | $ | 96,035 | | $ | 149,809 | | $ | 207,347 | | $ | 230,854 | |
| Other comprehensive income, net of tax | Other comprehensive income, net of tax | | Other comprehensive income, net of tax | |
| Reclassifications of losses to net income on derivatives designated as hedging instruments, net of tax of $(80), $(79), $(159) and $(191), respectively | | Reclassifications of losses to net income on derivatives designated as hedging instruments, net of tax of $(80), $(79), $(159) and $(191), respectively | | 263 | | 263 | | 527 | | 494 | |
| | Reclassifications of losses to net income on derivatives designated as hedging instruments, net of tax of $(79), $0, $(191) and $0, respectively | | 263 | | 0 | | 494 | | 0 | | |
| Loss on derivatives designated as hedging instruments, net of tax of $0, $2,781, $0 and $2,781, respectively | | 0 | | (9,711) | | 0 | | (9,711) | | |
| Adjustment to postemployment benefit obligation, net of tax of $(244), $(1,753), $(489) and $(1,970), respectively | | 813 | | 6,100 | | 1,625 | | 6,859 | | |
| Other comprehensive income (loss) | | $ | 1,076 | | $ | (3,611) | | $ | 2,119 | | $ | (2,852) | | |
| Adjustment to postemployment benefit obligation, net of tax of $(232), $(244), $(465) and $(489), respectively | | Adjustment to postemployment benefit obligation, net of tax of $(232), $(244), $(465) and $(489), respectively | | 768 | | 813 | | 1,534 | | 1,625 | |
| Other comprehensive income | | Other comprehensive income | | $ | 1,031 | | $ | 1,076 | | $ | 2,061 | | $ | 2,119 | |
| Comprehensive income | Comprehensive income | | $ | 150,885 | | $ | 70,235 | | $ | 232,973 | | $ | 146,746 | | Comprehensive income | | $ | 97,066 | | $ | 150,885 | | $ | 209,408 | | $ | 232,973 | |
See Notes to Unaudited Condensed Consolidated Financial Statements
New Jersey Resources Corporation
Part I
ITEM 1. FINANCIAL STATEMENTS (Continued)
CONDENSED CONSOLIDATED STATEMENTS OF CASH FLOWS (Unaudited) | | | | | | | | | | | |
| Six Months Ended |
| March 31, |
| (Thousands) | 2021 | | 2020 |
| CASH FLOWS FROM OPERATING ACTIVITIES | | | |
| Net income | $ | 230,854 | | | $ | 149,598 | |
| Adjustments to reconcile net income to cash flows from operating activities | | | |
| Unrealized gain on derivative instruments | (8,235) | | | (45,539) | |
| | | |
| | | |
| Depreciation and amortization | 54,210 | | | 52,153 | |
| Amortization of acquired wholesale energy contracts | 3,401 | | | 3,953 | |
| Allowance for equity used during construction | (10,603) | | | (8,053) | |
| Allowance for doubtful accounts | 10,607 | | | 951 | |
| Non cash lease expense | 1,957 | | | 1,856 | |
| Deferred income taxes | 20,909 | | | 34,975 | |
| | | |
| | | |
| Manufactured gas plant remediation costs | (6,284) | | | (5,291) | |
| Equity in earnings, net of distributions received from equity investees | (3,543) | | | (2,760) | |
| Cost of removal - asset retirement obligations | (512) | | | (122) | |
| Contributions to postemployment benefit plans | (2,018) | | | (5,742) | |
| Taxes related to stock-based compensation | (145) | | | 803 | |
| Changes in: | | | |
| Components of working capital | 6,846 | | | 3,526 | |
| Other noncurrent assets | 18,854 | | | (1,258) | |
| Other noncurrent liabilities | 39,993 | | | 95 | |
| Cash flows from operating activities | 356,291 | | | 179,145 | |
| CASH FLOWS USED IN INVESTING ACTIVITIES | | | |
| Expenditures for: | | | |
| Utility plant | (152,496) | | | (132,352) | |
| Solar equipment | (40,884) | | | (69,786) | |
| Storage and Transportation and other | (28,518) | | | (7,724) | |
| Cost of removal | (23,989) | | | (17,487) | |
| Acquisition of assets, net of cash acquired of $5.1 million | 0 | | | (523,647) | |
| Distribution from equity investees in excess of equity in earnings | 871 | | | 1,132 | |
| Investments in equity investees | (482) | | | (1,266) | |
| | | |
| | | |
| | | |
| Cash flows used in investing activities | (245,498) | | | (751,130) | |
| CASH FLOWS (USED IN) FROM FINANCING ACTIVITIES | | | |
| | | |
| Payments of long-term debt | (11,001) | | | (9,764) | |
| Proceeds from term loan | 0 | | | 350,000 | |
| Payments of term loan | 0 | | | (212,900) | |
| (Payments of) proceeds from short-term debt, net | (116,850) | | | 304,023 | |
| Proceeds from sale leaseback transaction - solar | 12,124 | | | 0 | |
| Proceeds from sale leaseback transaction | 0 | | | 4,000 | |
| Payments of common stock dividends | (60,894) | | | (56,821) | |
| Proceeds from issuance of common stock - public equity offering | 0 | | | 212,900 | |
| Cash settlement of equity forward agreement | (388) | | | 0 | |
| | | |
| Proceeds from issuance of common stock - DRP | 7,540 | | | 8,767 | |
| | | |
| Tax withholding payments related to net settled stock compensation | (1,772) | | | (3,893) | |
| Cash flows (used in) from financing activities | (171,241) | | | 596,312 | |
| Change in cash, cash equivalents and restricted cash | (60,448) | | | 24,327 | |
| Cash, cash equivalents and restricted cash at beginning of period | 119,423 | | | 4,063 | |
| Cash, cash equivalents and restricted cash at end of period | $ | 58,975 | | | $ | 28,390 | |
| CHANGES IN COMPONENTS OF WORKING CAPITAL | | | |
| Receivables | $ | (136,295) | | | $ | (87,532) | |
| Inventories | 94,233 | | | 90,484 | |
| Recovery of natural gas costs | (20,279) | | | (21,891) | |
| Natural gas purchases payable | 33,191 | | | (10,933) | |
| Natural gas purchases payable - related parties | 62 | | | 11 | |
| Accounts payable and other | (19,621) | | | (27,345) | |
| Prepaid expenses | (8,170) | | | (602) | |
| Prepaid and accrued taxes | 59,614 | | | 22,258 | |
| Restricted broker margin accounts | 7,644 | | | 39,193 | |
| Customers' credit balances and deposits | (5,171) | | | (7,788) | |
| Other current assets | 1,638 | | | 7,671 | |
| Total | $ | 6,846 | | | $ | 3,526 | |
| SUPPLEMENTAL DISCLOSURES OF CASH FLOWS INFORMATION | | | |
| Cash paid for: | | | |
| Interest (net of amounts capitalized) | $ | 40,465 | | | $ | 32,872 | |
| Income taxes | $ | 3,733 | | | $ | 1,193 | |
| Accrued capital expenditures | $ | 22,840 | | | $ | 17,930 | |
| | | |
| See Notes to Unaudited Condensed Consolidated Financial Statements |
| | | | | | | | | | | |
| Six Months Ended |
| March 31, |
| (Thousands) | 2022 | | 2021 |
| CASH FLOWS FROM OPERATING ACTIVITIES | | | |
| Net income | $ | 207,347 | | | $ | 230,854 | |
| Adjustments to reconcile net income to cash flows from operating activities | | | |
| Unrealized (gain) on derivative instruments | (40,169) | | | (8,235) | |
| | | |
| | | |
| | | |
| Depreciation and amortization | 61,828 | | | 54,210 | |
| Amortization of acquired wholesale energy contracts | 1,464 | | | 3,401 | |
| Allowance for equity used during construction | (6,133) | | | (10,603) | |
| Allowance for doubtful accounts | 1,139 | | | 10,607 | |
| Non cash lease expense | 2,559 | | | 1,957 | |
| Deferred income taxes | 16,912 | | | 20,909 | |
| Equivalent value of ITCs recognized on equipment financing | (727) | | | — | |
| Manufactured gas plant remediation costs | (14,677) | | | (6,284) | |
| Equity in earnings, net of distributions received from equity investees | 968 | | | (3,543) | |
| Cost of removal - asset retirement obligations | (565) | | | (512) | |
| Contributions to postemployment benefit plans | (2,324) | | | (2,018) | |
| Taxes related to stock-based compensation | (166) | | | (145) | |
| Changes in: | | | |
| Components of working capital | 74,290 | | | 6,846 | |
| Other noncurrent assets | 4,870 | | | 18,854 | |
| Other noncurrent liabilities | 23,836 | | | 39,993 | |
| Cash flows from operating activities | 330,452 | | | 356,291 | |
| CASH FLOWS USED IN INVESTING ACTIVITIES | | | |
| Expenditures for: | | | |
| Utility plant | (108,434) | | | (152,496) | |
| Solar equipment | (66,556) | | | (40,884) | |
| Storage and Transportation and other | (109,290) | | | (28,518) | |
| Cost of removal | (17,030) | | | (23,989) | |
| | | |
| Distribution from equity investees in excess of equity in earnings | 478 | | | 871 | |
| Investments in equity investees, net of return of capital | 4,000 | | | (482) | |
| | | |
| | | |
| | | |
| Cash flows used in investing activities | (296,832) | | | (245,498) | |
| CASH FLOWS USED IN FINANCING ACTIVITIES | | | |
| Proceeds from long-term debt | 100,000 | | | — | |
| Payments of long-term debt | (10,032) | | | (11,001) | |
| Proceeds from term loan | 150,000 | | | — | |
| | | |
| Payments of short-term debt, net | (225,090) | | | (116,850) | |
| Proceeds from sale leaseback transactions - solar | 3,300 | | | 12,124 | |
| Proceeds from sale leaseback transactions | 17,300 | | | — | |
| Payments of common stock dividends | (63,725) | | | (60,894) | |
| | | |
| Cash settlement of equity forward agreement | — | | | (388) | |
| | | |
| Proceeds from issuance of common stock - DRP | 7,521 | | | 7,540 | |
| | | |
| Tax withholding payments related to net settled stock compensation | (3,737) | | | (1,772) | |
| Cash flows used in financing activities | (24,463) | | | (171,241) | |
| Change in cash, cash equivalents and restricted cash | 9,157 | | | (60,448) | |
| Cash, cash equivalents and restricted cash at beginning of period | 6,043 | | | 119,423 | |
| Cash, cash equivalents and restricted cash at end of period | $ | 15,200 | | | $ | 58,975 | |
| CHANGES IN COMPONENTS OF WORKING CAPITAL | | | |
| Receivables | $ | (107,479) | | | $ | (136,295) | |
| Inventories | 125,012 | | | 94,233 | |
| Recovery of natural gas costs | 8,465 | | | (20,279) | |
| Natural gas purchases payable | (25,964) | | | 33,191 | |
| Natural gas purchases payable - related parties | (6) | | | 62 | |
| Deferred revenue | 52,368 | | | (970) | |
| Accounts payable and other | (88,866) | | | (18,651) | |
| Prepaid expenses | (5,548) | | | (8,170) | |
| Prepaid and accrued taxes | 75,921 | | | 59,614 | |
| Restricted broker margin accounts | 53,708 | | | 7,644 | |
| Customers' credit balances and deposits | (12,302) | | | (5,171) | |
| Other current assets | (1,019) | | | 1,638 | |
| Total | $ | 74,290 | | | $ | 6,846 | |
| SUPPLEMENTAL DISCLOSURES OF CASH FLOWS INFORMATION | | | |
| Cash paid for: | | | |
| Interest (net of amounts capitalized) | $ | 42,754 | | | $ | 40,465 | |
| Income taxes | $ | 1,263 | | | $ | 3,733 | |
| Accrued capital expenditures | $ | 53,245 | | | $ | 22,840 | |
| | | |
| See Notes to Unaudited Condensed Consolidated Financial Statements |
New Jersey Resources Corporation
Part I
ITEM 1. FINANCIAL STATEMENTS (Continued)
CONDENSED CONSOLIDATED BALANCE SHEETS (Unaudited)
ASSETS
| | | | | | | | | | | (Unaudited) | |
| (Thousands) | (Thousands) | March 31, 2021 | September 30, 2020 | (Thousands) | March 31, 2022 | September 30,
2021 |
| PROPERTY, PLANT AND EQUIPMENT | PROPERTY, PLANT AND EQUIPMENT | | PROPERTY, PLANT AND EQUIPMENT | |
| Utility plant, at cost | Utility plant, at cost | $ | 2,883,656 | | $ | 2,800,052 | | Utility plant, at cost | $ | 3,451,038 | | $ | 3,324,611 | |
| Construction work in progress | Construction work in progress | 456,513 | | 379,846 | | Construction work in progress | 154,978 | | 182,196 | |
| Nonutility plant and equipment, at cost | Nonutility plant and equipment, at cost | 1,121,155 | | 1,108,512 | | Nonutility plant and equipment, at cost | 1,154,104 | | 1,124,896 | |
| Construction work in progress | Construction work in progress | 229,923 | | 176,556 | | Construction work in progress | 511,351 | | 365,346 | |
| Total property, plant and equipment | Total property, plant and equipment | 4,691,247 | | 4,464,966 | | Total property, plant and equipment | 5,271,471 | | 4,997,049 | |
| Accumulated depreciation and amortization, utility plant | Accumulated depreciation and amortization, utility plant | (620,028) | | (601,635) | | Accumulated depreciation and amortization, utility plant | (637,491) | | (611,827) | |
| Accumulated depreciation and amortization, nonutility plant and equipment | Accumulated depreciation and amortization, nonutility plant and equipment | (156,063) | | (140,562) | | Accumulated depreciation and amortization, nonutility plant and equipment | (187,141) | | (171,709) | |
| Property, plant and equipment, net | Property, plant and equipment, net | 3,915,156 | | 3,722,769 | | Property, plant and equipment, net | 4,446,839 | | 4,213,513 | |
| CURRENT ASSETS | CURRENT ASSETS | | CURRENT ASSETS | |
| Cash and cash equivalents | Cash and cash equivalents | 57,654 | | 117,012 | | Cash and cash equivalents | 13,906 | | 4,749 | |
| Customer accounts receivable | Customer accounts receivable | | Customer accounts receivable | |
| Billed | Billed | 237,229 | | 134,173 | | Billed | 273,313 | | 212,838 | |
| Unbilled revenues | Unbilled revenues | 41,941 | | 9,226 | | Unbilled revenues | 56,270 | | 10,351 | |
| Allowance for doubtful accounts | Allowance for doubtful accounts | (17,325) | | (7,242) | | Allowance for doubtful accounts | (21,470) | | (24,652) | |
| Regulatory assets | Regulatory assets | 23,527 | | 36,530 | | Regulatory assets | 33,717 | | 30,118 | |
| Natural gas in storage, at average cost | Natural gas in storage, at average cost | 74,853 | | 167,504 | | Natural gas in storage, at average cost | 66,300 | | 193,606 | |
| Materials and supplies, at average cost | Materials and supplies, at average cost | 18,824 | | 20,406 | | Materials and supplies, at average cost | 21,855 | | 19,561 | |
| Prepaid expenses | Prepaid expenses | 14,729 | | 6,639 | | Prepaid expenses | 13,714 | | 8,166 | |
| Prepaid and accrued taxes | Prepaid and accrued taxes | 3,432 | | 24,301 | | Prepaid and accrued taxes | 4,087 | | 51,211 | |
| Derivatives, at fair value | Derivatives, at fair value | 17,433 | | 23,310 | | Derivatives, at fair value | 21,586 | | 35,251 | |
| Restricted broker margin accounts | Restricted broker margin accounts | 45,916 | | 69,444 | | Restricted broker margin accounts | 49,901 | | 72,840 | |
| | Other | 17,015 | | 21,029 | | |
| Other current assets | | Other current assets | 22,857 | | 20,235 | |
| Total current assets | Total current assets | 535,228 | | 622,332 | | Total current assets | 556,036 | | 634,274 | |
| NONCURRENT ASSETS | NONCURRENT ASSETS | | NONCURRENT ASSETS | |
| Investments in equity method investees | Investments in equity method investees | 214,521 | | 208,375 | | Investments in equity method investees | 109,980 | | 114,529 | |
| Regulatory assets | Regulatory assets | 522,027 | | 527,459 | | Regulatory assets | 513,006 | | 522,099 | |
| Operating lease assets | Operating lease assets | 144,326 | | 131,769 | | Operating lease assets | 171,207 | | 173,928 | |
| Derivatives, at fair value | Derivatives, at fair value | 1,977 | | 3,349 | | Derivatives, at fair value | 4,140 | | 3,403 | |
| | Intangible assets, net | Intangible assets, net | 6,462 | | 10,060 | | Intangible assets, net | 3,445 | | 5,029 | |
| Software costs | Software costs | 5,485 | | 4,707 | | Software costs | 5,714 | | 5,582 | |
| Other noncurrent assets | Other noncurrent assets | 79,952 | | 85,657 | | Other noncurrent assets | 59,637 | | 49,921 | |
| Total noncurrent assets | Total noncurrent assets | 974,750 | | 971,376 | | Total noncurrent assets | 867,129 | | 874,491 | |
| Total assets | Total assets | $ | 5,425,134 | | $ | 5,316,477 | | Total assets | $ | 5,870,004 | | $ | 5,722,278 | |
See Notes to Unaudited Condensed Consolidated Financial Statements
New Jersey Resources Corporation
Part I
ITEM 1. FINANCIAL STATEMENTS (Continued)
CAPITALIZATION AND LIABILITIES
| | | | | | | | | | | (Unaudited) | |
| (Thousands, except share data) | (Thousands, except share data) | March 31, 2021 | September 30, 2020 | (Thousands, except share data) | March 31, 2022 | September 30,
2021 |
| CAPITALIZATION | CAPITALIZATION | | CAPITALIZATION | |
| Common stock, $2.50 par value; authorized 150,000,000 shares; outstanding March 31, 2021 — 96,262,016; September 30, 2020 — 95,949,183 | $ | 240,497 | | $ | 240,243 | | |
| Common stock, $2.50 par value; authorized 150,000,000 shares; outstanding March 31, 2022 — 96,081,796; September 30, 2021 — 95,709,662 | | Common stock, $2.50 par value; authorized 150,000,000 shares; outstanding March 31, 2022 — 96,081,796; September 30, 2021 — 95,709,662 | $ | 241,593 | | $ | 240,644 | |
| Premium on common stock | Premium on common stock | 497,167 | | 491,982 | | Premium on common stock | 517,843 | | 502,584 | |
| Accumulated other comprehensive loss, net of tax | Accumulated other comprehensive loss, net of tax | (42,196) | | (44,315) | | Accumulated other comprehensive loss, net of tax | (32,467) | | (34,528) | |
Treasury stock at cost and other; shares March 31, 2021 — 16,313; September 30, 2020 — 148,310 | 11,983 | | 8,485 | | |
Treasury stock at cost and other; shares March 31, 2022 — 769,835; September 30, 2021 — 762,313 | | Treasury stock at cost and other; shares March 31, 2022 — 769,835; September 30, 2021 — 762,313 | (15,025) | | (12,448) | |
| Retained earnings | Retained earnings | 1,114,382 | | 947,501 | | Retained earnings | 1,072,343 | | 934,610 | |
| Common stock equity | Common stock equity | 1,821,833 | | 1,643,896 | | Common stock equity | 1,784,287 | | 1,630,862 | |
| Long-term debt | Long-term debt | 2,265,202 | | 2,259,466 | | Long-term debt | 2,319,434 | | 2,162,164 | |
| Total capitalization | Total capitalization | 4,087,035 | | 3,903,362 | | Total capitalization | 4,103,721 | | 3,793,026 | |
| CURRENT LIABILITIES | CURRENT LIABILITIES | | CURRENT LIABILITIES | |
| Current maturities of long-term debt | Current maturities of long-term debt | 22,635 | | 27,236 | | Current maturities of long-term debt | 24,539 | | 72,840 | |
| Short-term debt | Short-term debt | 8,500 | | 125,350 | | Short-term debt | 302,210 | | 377,300 | |
| Natural gas purchases payable | Natural gas purchases payable | 129,136 | | 95,945 | | Natural gas purchases payable | 142,733 | | 168,697 | |
| Natural gas purchases payable to related parties | Natural gas purchases payable to related parties | 853 | | 791 | | Natural gas purchases payable to related parties | 855 | | 861 | |
| Deferred revenue | | Deferred revenue | 54,113 | | 1,745 | |
| Accounts payable and other | Accounts payable and other | 126,154 | | 141,500 | | Accounts payable and other | 123,190 | | 223,497 | |
| Dividends payable | Dividends payable | 32,007 | | 31,902 | | Dividends payable | 34,830 | | 34,768 | |
| Accrued taxes | Accrued taxes | 41,462 | | 2,717 | | Accrued taxes | 32,153 | | 3,356 | |
| Regulatory liabilities | Regulatory liabilities | 717 | | 26,188 | | Regulatory liabilities | 88,064 | | 28,007 | |
| New Jersey Clean Energy Program | New Jersey Clean Energy Program | 6,148 | | 15,570 | | New Jersey Clean Energy Program | 6,608 | | 16,308 | |
| Derivatives, at fair value | Derivatives, at fair value | 23,690 | | 33,865 | | Derivatives, at fair value | 45,216 | | 87,145 | |
| Operating lease liabilities | Operating lease liabilities | 4,001 | | 6,724 | | Operating lease liabilities | 4,878 | | 4,300 | |
| | Restricted broker margin accounts | | Restricted broker margin accounts | 2,464 | | — | |
| Customers' credit balances and deposits | Customers' credit balances and deposits | 20,763 | | 25,934 | | Customers' credit balances and deposits | 20,284 | | 32,586 | |
| Total current liabilities | Total current liabilities | 416,066 | | 533,722 | | Total current liabilities | 882,137 | | 1,051,410 | |
| NONCURRENT LIABILITIES | NONCURRENT LIABILITIES | | NONCURRENT LIABILITIES | |
| Deferred income taxes | Deferred income taxes | 166,238 | | 138,081 | | Deferred income taxes | 181,875 | | 163,530 | |
| Deferred investment tax credits | Deferred investment tax credits | 3,171 | | 3,332 | | Deferred investment tax credits | 2,849 | | 3,010 | |
| Deferred gain | 894 | | 1,035 | | |
| Deferred revenue | | Deferred revenue | 5,088 | | 847 | |
| Derivatives, at fair value | Derivatives, at fair value | 20,506 | | 13,352 | | Derivatives, at fair value | 19,632 | | 13,497 | |
| Manufactured gas plant remediation | Manufactured gas plant remediation | 143,490 | | 150,590 | | Manufactured gas plant remediation | 121,605 | | 135,012 | |
| Postemployment employee benefit liability | Postemployment employee benefit liability | 236,432 | | 237,221 | | Postemployment employee benefit liability | 166,887 | | 169,267 | |
| Regulatory liabilities | Regulatory liabilities | 193,817 | | 196,450 | | Regulatory liabilities | 191,450 | | 193,051 | |
| Operating lease liabilities | Operating lease liabilities | 111,034 | | 95,030 | | Operating lease liabilities | 140,036 | | 141,363 | |
| Asset retirement obligation | Asset retirement obligation | 34,102 | | 33,723 | | Asset retirement obligation | 46,753 | | 46,306 | |
| Other | 12,349 | | 10,579 | | |
| Other noncurrent liabilities | | Other noncurrent liabilities | 7,971 | | 11,959 | |
| Total noncurrent liabilities | Total noncurrent liabilities | 922,033 | | 879,393 | | Total noncurrent liabilities | 884,146 | | 877,842 | |
| Commitments and contingent liabilities (Note 13) | Commitments and contingent liabilities (Note 13) | 0 | Commitments and contingent liabilities (Note 13) | 0 |
| Total capitalization and liabilities | Total capitalization and liabilities | $ | 5,425,134 | | $ | 5,316,477 | | Total capitalization and liabilities | $ | 5,870,004 | | $ | 5,722,278 | |
See Notes to Unaudited Condensed Consolidated Financial Statements
New Jersey Resources Corporation
Part I
ITEM 1. FINANCIAL STATEMENTS (Continued)
CONDENSED CONSOLIDATED STATEMENTS OF COMMON STOCK EQUITY (Unaudited)
| | (Thousands) | (Thousands) | Number of Shares | Common Stock | Premium on Common Stock | Accumulated Other Comprehensive (Loss) Income | Treasury Stock And Other | Retained Earnings | Total | (Thousands) | Number of Shares | Common Stock | Premium on Common Stock | Accumulated Other Comprehensive (Loss) Income | Treasury Stock and Other | Retained Earnings | Total |
| Balance at September 30, 2020 | 95,949 | | $ | 240,243 | | $ | 491,982 | | | $ | (44,315) | | | $ | 8,485 | | $ | 947,501 | | $ | 1,643,896 | | |
| Balance at September 30, 2021 | | Balance at September 30, 2021 | 95,710 | | $ | 240,644 | | $ | 502,584 | | | $ | (34,528) | | | $ | (12,448) | | $ | 934,610 | | $ | 1,630,862 | |
| Net income | Net income | — | | — | | — | | | — | | | — | | 81,045 | | 81,045 | | Net income | — | | — | | — | | | — | | | — | | 111,312 | | 111,312 | |
| Other comprehensive income | Other comprehensive income | — | | — | | — | | | 1,043 | | | — | | — | | 1,043 | | Other comprehensive income | — | | — | | — | | | 1,030 | | | — | | — | | 1,030 | |
| Common stock issued: | Common stock issued: | | Common stock issued: | |
| | Incentive compensation plan | Incentive compensation plan | 50 | | 124 | | 5,410 | | | — | | | — | | — | | 5,534 | | Incentive compensation plan | 147 | | 367 | | 7,135 | | | — | | | — | | — | | 7,502 | |
Dividend reinvestment plan (1) | 140 | | — | | (4,502) | | | — | | | 5,593 | | — | | 1,091 | | |
| Dividend reinvestment plan | | Dividend reinvestment plan | 105 | | 263 | | 3,415 | | | — | | | — | | — | | 3,678 | |
| | Cash dividend declared ($.3325 per share) | — | | — | | — | | | — | | | — | | (31,966) | | (31,966) | | |
| Cash dividend declared ($.3625 per share) | | Cash dividend declared ($.3625 per share) | — | | — | | — | | | — | | | — | | (34,787) | | (34,787) | |
| Treasury stock and other | Treasury stock and other | — | | — | | — | | | — | | | (2,429) | | — | | (2,429) | | Treasury stock and other | — | | — | | — | | | — | | | (2,619) | | — | | (2,619) | |
| Balance at December 31, 2020 | 96,139 | | $ | 240,367 | | $ | 492,890 | | | $ | (43,272) | | | $ | 11,649 | | $ | 996,580 | | $ | 1,698,214 | | |
| Balance at December 31, 2021 | | Balance at December 31, 2021 | 95,962 | | $ | 241,274 | | $ | 513,134 | | | $ | (33,498) | | | $ | (15,067) | | $ | 1,011,135 | | $ | 1,716,978 | |
| | | Net income | Net income | — | | — | | — | | | — | | | — | | 149,809 | | 149,809 | | Net income | — | | — | | — | | | — | | | — | | 96,035 | | 96,035 | |
| Other comprehensive income | Other comprehensive income | — | | — | | — | | | 1,076 | | | — | | — | | 1,076 | | Other comprehensive income | — | | — | | — | | | 1,031 | | | — | | — | | 1,031 | |
| Common stock issued: | Common stock issued: | | Common stock issued: | |
| Common stock offering | — | | — | | (388) | | | — | | | — | | — | | (388) | | |
| | Incentive compensation plan | Incentive compensation plan | 28 | | 72 | | 1,144 | | | — | | | — | | — | | 1,216 | | Incentive compensation plan | 36 | | 91 | | 1,216 | | | — | | | — | | — | | 1,307 | |
| Dividend reinvestment plan | Dividend reinvestment plan | 103 | | 58 | | 3,521 | | | — | | | — | | — | | 3,579 | | Dividend reinvestment plan | 91 | | 228 | | 3,493 | | | — | | | — | | — | | 3,721 | |
| | Cash dividend declared ($.3325 per share) | — | | — | | — | | | — | | | — | | (32,007) | | (32,007) | | |
| Cash dividend declared ($.3625 per share) | | Cash dividend declared ($.3625 per share) | — | | — | | — | | | — | | | — | | (34,827) | | (34,827) | |
| Treasury stock and other | Treasury stock and other | (8) | | — | | — | | | — | | | 334 | | — | | 334 | | Treasury stock and other | (7) | | — | | — | | | — | | | 42 | | — | | 42 | |
| Balance at March 31, 2021 | 96,262 | | $ | 240,497 | | $ | 497,167 | | | $ | (42,196) | | | $ | 11,983 | | $ | 1,114,382 | | $ | 1,821,833 | | |
| Balance at March 31, 2022 | | Balance at March 31, 2022 | 96,082 | | $ | 241,593 | | $ | 517,843 | | | $ | (32,467) | | | $ | (15,025) | | $ | 1,072,343 | | $ | 1,784,287 | |
| | | | | | | | | | | | | | | | | | | | | | | | | | | | | |
| (Thousands) | Number of Shares | Common Stock | Premium on Common Stock | Accumulated Other Comprehensive (Loss) Income | Treasury Stock and Other | Retained Earnings | Total |
| Balance at September 30, 2020 | 95,949 | | $ | 240,243 | | $ | 491,982 | | | $ | (44,315) | | | $ | 8,485 | | $ | 947,501 | | $ | 1,643,896 | |
| Net income | — | | — | | — | | | — | | | — | | 81,045 | | 81,045 | |
| Other comprehensive income | — | | — | | — | | | 1,043 | | | — | | — | | 1,043 | |
| Common stock issued: | | | | | | | | | |
| | | | | | | | | |
| Incentive compensation plan | 50 | | 124 | | 5,410 | | | — | | | — | | — | | 5,534 | |
Dividend reinvestment plan (1) | 140 | | — | | (4,502) | | | — | | | 5,593 | | — | | 1,091 | |
| | | | | | | | | |
| Cash dividend declared ($.3325 per share) | — | | — | | — | | | — | | | — | | (31,966) | | (31,966) | |
| Treasury stock and other | — | | — | | — | | | — | | | (2,429) | | — | | (2,429) | |
| Balance at December 31, 2020 | 96,139 | | $ | 240,367 | | $ | 492,890 | | | $ | (43,272) | | | $ | 11,649 | | $ | 996,580 | | $ | 1,698,214 | |
| Net income | — | | — | | — | | | — | | | — | | 149,809 | | 149,809 | |
| Other comprehensive loss | — | | — | | — | | | 1,076 | | | — | | — | | 1,076 | |
| Common stock issued: | | | | | | | | | |
| Incentive plan | 28 | | 72 | | 1,144 | | | — | | | — | | — | | 1,216 | |
| Dividend reinvestment plan | 103 | | 58 | | 3,521 | | | — | | | — | | — | | 3,579 | |
| | | | | | | | | |
| Common stock offering | — | | — | | (388) | | | — | | | — | | — | | (388) | |
| Cash dividend declared ($.3325 per share) | — | | — | | — | | | — | | | — | | (32,007) | | (32,007) | |
| Treasury stock and other | (8) | | — | | — | | | — | | | 334 | | — | | 334 | |
| Balance at March 31, 2021 | 96,262 | | $ | 240,497 | | $ | 497,167 | | | $ | (42,196) | | | $ | 11,983 | | $ | 1,114,382 | | $ | 1,821,833 | |
| | | | | | | | | |
| | | | | | | | | |
| | | | | | | | | |
| | | | | | | | | |
| | | | | | | | | |
| | | | | | | | | |
| | | | | | | | | |
| | | | | | | | | |
| | | | | | | | | |
(1)Shares sold through the DRP are issued from treasury stock at average cost, which may differ from the actual market price paid.
| | | | | | | | | | | | | | | | | | | | | | | | | | | | | |
| (Thousands) | Number of Shares | Common Stock | Premium on Common Stock | Accumulated Other Comprehensive (Loss) Income | Treasury Stock And Other | Retained Earnings | Total |
| Balance at September 30, 2019 | 89,999 | | $ | 226,649 | | $ | 291,331 | | | $ | (31,787) | | | $ | (10,436) | | $ | 869,858 | | $ | 1,345,615 | |
| Net income | — | | — | | — | | | — | | | — | | 75,752 | | 75,752 | |
| Other comprehensive income | — | | — | | — | | | 759 | | | — | | — | | 759 | |
| Common stock issued: | | | | | | | | | |
| Common stock offering | 5,333 | | 13,333 | | 199,567 | | | — | | | — | | — | | 212,900 | |
| Incentive compensation plan | 96 | | 239 | | 3,053 | | | — | | | — | | — | | 3,292 | |
Dividend reinvestment plan (1) | 80 | | — | | 314 | | | — | | | 3,185 | | — | | 3,499 | |
| | | | | | | | | |
| Cash dividend declared ($.3125 per share) | — | | — | | — | | | — | | | — | | (29,846) | | (29,846) | |
| Treasury stock and other | — | | — | | — | | | — | | | (3,879) | | — | | (3,879) | |
| | | | | | | | | |
| | | | | | | | | |
| | | | | | | | | |
| Balance at December 31, 2019 | 95,508 | | $ | 240,221 | | $ | 494,265 | | | $ | (31,028) | | | $ | (11,130) | | $ | 915,764 | | $ | 1,608,092 | |
| Net income | — | | — | | — | | | — | | | — | | 73,846 | | 73,846 | |
| Other comprehensive income | — | | — | | — | | | (3,611) | | | — | | — | | (3,611) | |
| Common stock issued: | | | | | | | | | |
| | | | | | | | | |
Dividend reinvestment plan (1) | 143 | | — | | (416) | | | — | | | 5,621 | | — | | 5,205 | |
| | | | | | | | | |
| Cash dividend declared ($.3125 per share) | — | | — | | — | | | — | | | — | | (29,888) | | (29,888) | |
| Treasury stock and other | (8) | | — | | 107 | | | — | | | 986 | | — | | 1,093 | |
| Balance at March 31, 2020 | 95,643 | | $ | 240,221 | | $ | 493,956 | | | $ | (34,639) | | | $ | (4,523) | | $ | 959,722 | | $ | 1,654,737 | |
| | | | | | | | | |
| | | | | | | | | |
| | | | | | | | | |
| | | | | | | | | |
| | | | | | | | | |
| | | | | | | | | |
| | | | | | | | | |
| | | | | | | | | |
| | | | | | | | | |
(1)Shares sold through the DRP are issued from treasury stock at average cost, which may differ from the actual market price paid.
New Jersey Resources Corporation
Part I
ITEM 8.NOTES TO UNAUDITED CONDENSED CONSOLIDATED FINANCIAL STATEMENTS AND SUPPLEMENTARY DATA
1. NATURE OF THE BUSINESS
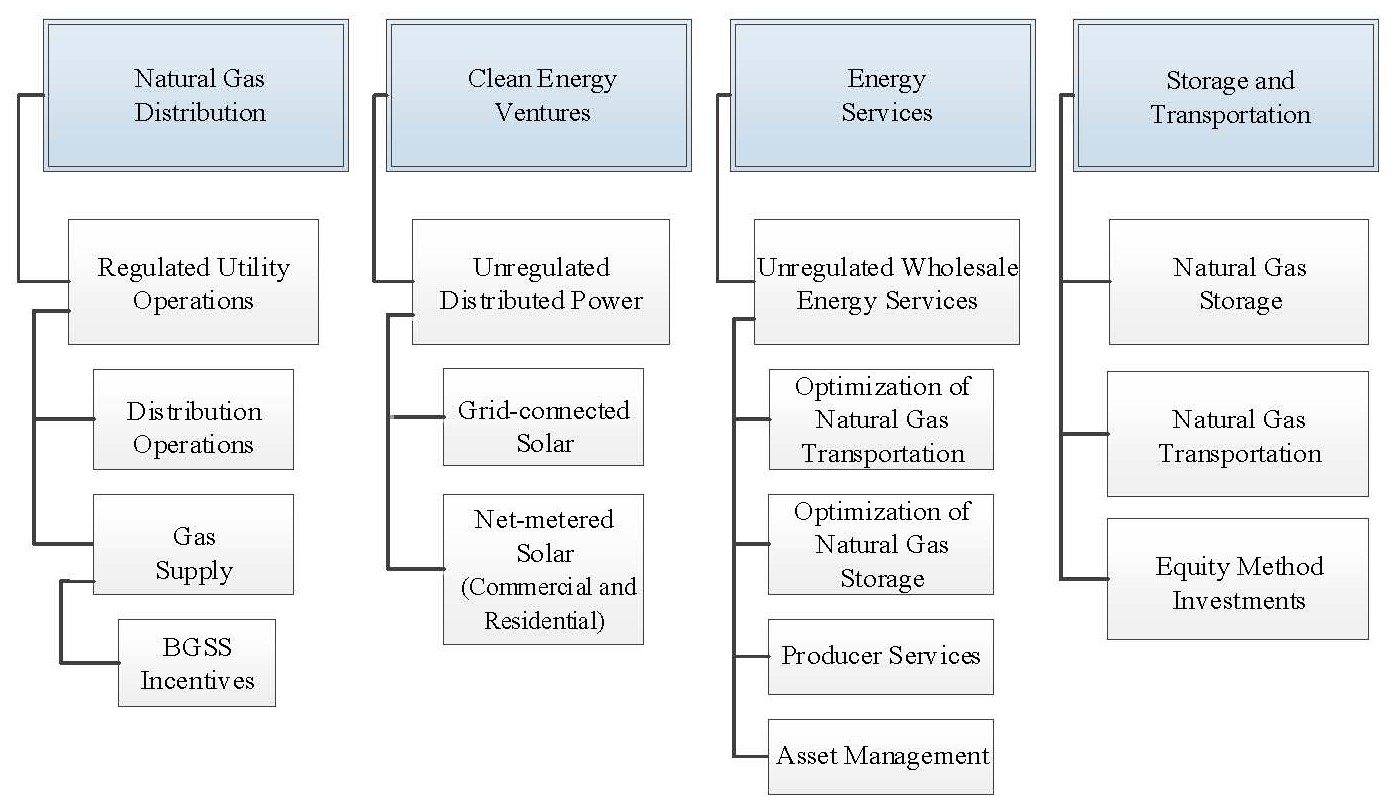
NJRThe Company provides regulated natural gas distribution services, transportationtransmission and storage services and operates certain unregulated businesses primarily through the following:
NJNG provides natural gas utility service to approximately 561,500568,100 customers throughout Burlington, Middlesex, Monmouth, Morris, Ocean and OceanSussex counties in New Jersey and is subject to rate regulation by the BPU. NJNG comprises the Natural Gas Distribution segment.
NJRCEV, the Company's clean energy subsidiary, comprises the Clean Energy Ventures segment and consists of the Company's capital investmentsinvests in, owns and operates clean energy projects, including commercial and residential solar projects.installations located in New Jersey, Connecticut, Rhode Island and New York.
NJRES comprises the Energy Services segment. Energy Services maintains and transacts around a portfolio of natural gas transportation and storage capacity contracts and provides physical wholesale energy, retail energy and energy management services in the U.S. and Canada.
NJR Midstream Holdings Corporation, which comprises the Storage and Transportation segment, formerly the Midstream segment, invests in energy-related ventures through its subsidiaries. The Company operates natural gas storage and transmission assets through the wholly-owned subsidiaries of Leaf River and Adelphia Gateway, and is subject to rate regulation by FERC. The Company holds a 50 percent combined ownership interest in Steckman Ridge, located in Pennsylvania and 20 percent ownership interest in PennEast, which are accounted for under the equity method of accounting. The Company also operates natural gas storage and transmission assets through the wholly-owned subsidiaries of Leaf River, which was acquired on October 11, 2019 and Adelphia Gateway, which was acquired on January 13, 2020 and is subject to rate regulation by FERC. See Note 17. Acquisitions and Dispositions for more information regarding these acquisitions.
NJR Retail Holdings Corporation has 2 principal subsidiaries, NJRHS, which provides heating, central air conditioning, standby generators, solar and other indoor and outdoor comfort products to residential homes throughout New Jersey, and CR&R, which owns commercial real estate. NJRHS and CR&R are included in Home Services and Other operations.
2. SUMMARY OF SIGNIFICANT ACCOUNTING POLICIES
The accompanying Unaudited Condensed Consolidated Financial Statements have been prepared by NJRthe Company in accordance with the rules and regulations of the SECU.S. Securities and Exchange Commission and GAAP. The September 30, 20202021 Balance Sheet data is derived from the audited financial statements of the Company. These Unaudited Condensed Consolidated Financial Statements should be read in conjunction with the consolidated financial statements and the notes thereto included in NJR's 2020the Company's 2021 Annual Report on Form 10-K.
The Unaudited Condensed Consolidated Financial Statements include the accounts of NJR and its subsidiaries. In the opinion of management, the accompanying Unaudited Condensed Consolidated Financial Statements reflect all adjustments necessary for a fair presentation of the results of the interim periods presented. These adjustments are of a normal and recurring nature. Because of the seasonal nature of NJR'sthe Company's utility and wholesale energy services operations, in addition to other factors, the financial results for the interim periods presented are not indicative of the results that are to be expected for the fiscal year ending September 30, 2021.2022. Intercompany transactions and accounts have been eliminated.
Use of Estimates
The preparation of financial statements in conformity with GAAP requires the Company to make estimates that affect the reported amounts of assets, liabilities, revenues, expenses and related disclosure of contingencies during the reporting period. On a quarterly basis or more frequently whenever events or changes in circumstances indicate a need, the Company evaluates its estimates, including those related to the calculation of the fair value of derivative instruments, debt, equity method investments, unbilled revenues, allowance for doubtful accounts, provisions for depreciation and amortization, long-lived assets, regulatory assets and liabilities, income taxes, pensions and other postemployment benefits, contingencies related to environmental matters and litigation. AROAsset retirement obligations are evaluated as often as needed. The Company’s estimates are based on historical experience and on various other assumptions that are believed to be reasonable under the circumstances, the results of which form the basis for making judgments about the carrying value of assets and liabilities that are not readily apparent from other sources.
New Jersey Resources Corporation
Part I
NOTES TO UNAUDITED CONDENSED CONSOLIDATED FINANCIAL STATEMENTS (Continued)
The Company has legal, regulatory and environmental proceedings during the normal course of business that can result in loss contingencies. When evaluating the potential for a loss, the Company will establish a reserve if a loss is probable and can be reasonably estimated, in which case it is the Company’s policy to accrue the full amount of such estimates. Where the information is sufficient only to establish a range of probable liability, and no point within the range is more likely than any other, it is the Company’s policy to accrue the lower end of the range. In the normal course of business, estimated amounts are subsequently adjusted to actual results that may differ from estimates.
In March 2020, COVID-19 was declared a pandemic by the World Health Organization and the Centers for Disease Control and Prevention and has spread globally, including throughout the United States.U.S. The Company’s Unaudited Condensed Consolidated Financial Statements reflect estimates and assumptions made by management that affect the reported amounts of assets and liabilities at the balance sheet date and reported amounts of revenue and expenses during the reporting periods presented.
The Company continues to closely monitor developments related to the COVID-19 pandemic and has, when appropriate, taken steps to ensure business continuity in the safe operation of its business. These steps include working from home for office-based employees utilizing a newly implemented hybrid schedule, limiting direct contact with customers and suspending late payment fees for utility customers. While the Company and many businesses are beginning to return to normal operating practices, this remains an evolving situation. The timing for recovery of businesses and local economies, resurgences or mutations of the virus, and any potential future shutdowns remains unknown. Throughout the COVID-19 pandemic, the Company has continued to provide essential services to our customers. Both the Company and NJNG continue to have sufficient liquidity to meet their current obligations and business operations remain fundamentally unchanged at this time. The Company will continue to monitor developments affecting its employees, customers, and operations and take additional steps to address the COVID-19 pandemic and its impacts, as necessary. The Company considered the impacts of COVID-19 on the assumptions and estimates used and determined that there have been no material adverse impacts on the Company’s results of operations as of March 31, 2021.
Acquisitions
The Company follows the guidance in ASC 805, Business Combinations, for determining the appropriate accounting treatment for acquisitions. ASU No. 2017-01, Clarifying the Definition of a Business, provides an initial fair value screen to determine if substantially all of the fair value of the assets acquired is concentrated in a single asset or group of similar assets. If the initial screening test is not met, the set is considered a business based on whether there are inputs and substantive processes in place. Based on the results of this analysis and conclusion on an acquisition’s classification of a business combination or an asset acquisition, the accounting treatment is derived.
If the acquisition is deemed to be a business, the acquisition method of accounting is applied. Identifiable assets acquired and liabilities assumed at the acquisition date are recorded at fair value. If the transaction is deemed to be an asset purchase, the cost accumulation and allocation model is used whereby the assets and liabilities are recorded based on the purchase price and allocated to the individual assets and liabilities based on relative fair values.
The determination and allocation of fair values to the identifiable assets acquired and liabilities assumed are based on various assumptions and valuation methodologies requiring considerable management judgment. The most significant variables in these valuations are discount rates and the number of years on which to base the cash flow projections, as well as other assumptions and estimates used to determine the cash inflows and outflows. Management determines discount rates based on the risk inherent in the acquired assets, specific risks, industry beta and capital structure of guideline companies. The valuation of an acquired business is based on available information at the acquisition date and assumptions that are believed to be reasonable. However, a change in facts and circumstances as of the acquisition date can result in subsequent adjustments during the measurement period, but no later than one year from the acquisition date.2022.
Revenues
Revenues from the sale of natural gas to NJNG customers are recognized in the period that natural gas is delivered and consumed by customers, including an estimate for unbilled revenue. NJNG records unbilled revenue for natural gas services. Natural gas sales to individual customers are based on meter readings, which are performed on a systematic basis throughout the month. At the end of each month, the amount of natural gas delivered to each customer after the last meter reading through the end of the respective accounting period is estimated, and recognizes unbilled revenues related to these amounts. The unbilled revenue estimates are based on estimated customer usage by customer type, weather effects, unaccounted-for natural gas and the most current tariff rates.
Clean Energy Ventures recognizes revenue when SRECs are transferred to counterparties. SRECs are physically delivered through the transfer of certificates as per contractual settlement schedules. The Clean Energy Act of 2018 established guidelines for the closure of the SREC registration program to new applicants in New Jersey. The SREC program officially closed to new qualified solar projects on April 30, 2020.
In December 2019, the BPU established the TREC as the successor to the SREC program. TRECs provide a fixed compensation base multiplied by an assigned project factor in order to determine their value. The project factor is determined by the type and location of the project, as defined. All TRECs generated are required to be purchased monthly by a TREC program administrator as appointed by the BPU.
New Jersey Resources Corporation
Part I
NOTES TO UNAUDITED CONDENSED CONSOLIDATED FINANCIAL STATEMENTS (Continued)
In June 2020, Clean Energy Ventures began generating TRECs for qualified new residential and commercial solar projects placed into service following the close of the SREC program. TREC revenue is recognized when TRECs are generated and are transferred monthly based upon metered solar electricity activity.
Revenues for Energy Services are recognized when the natural gas is physically delivered to the customer. In addition, changes in the fair value of derivatives that economically hedge the forecasted sales of the natural gas are recognized in operating revenues as they occur, as noted above. Energy Services also recognizes changes in the fair value of SREC derivative contracts as a component of operating revenues.
During December 2020, Energy Services entered into a series of AMAs with an investment grade public utility to release pipeline capacity associated with certain natural gas transportation contracts, which commenced on November 1, 2021. The AMAs include a series of temporary and permanent releases and revenue under these agreements is recognized as the performance obligations are satisfied. For temporary releases of pipeline capacity, revenue is recognized on a straight-line basis over the agreed upon term. For permanent releases of pipeline capacity, which represent a transfer of contractual rights for such
capacity, revenue is recognized upon the transfer of the underlying contractual rights. Energy Services recognized $10.3 million and $32.4 million of operating revenue on the Unaudited Condensed Consolidated Statements of Operations during the three and six months ended March 31, 2022, respectively. Amounts received in excess of revenue totaling $54.4 million are included in deferred revenue on the Unaudited Condensed Consolidated Balance Sheets as of March 31, 2022.
The Storage and Transportation segment generates revenues from firm storage contracts and transportation contracts, related usage fees and hub services for the use of storage space, injections and withdrawals from their natural gas storage facility and the delivery of natural gas to customers. Demand fees are recognized as revenue over the term of the related agreement while usage fees and hub services revenues are recognized as services are performed.
Revenues from all other activities are recorded in the period during which products or services are delivered and accepted by customers, or over the related contractual term. See Note 3. Revenue for further information.
Cash and Cash Equivalents
Cash and cash equivalents consist of cash on deposit and temporary investments with maturities of three months or less, and excludes restricted cash related to irrevocable letters of credit at Leaf River and escrow balances for utility plant projects at NJNG, and irrevocable letters of credit at Leaf River, which isare recorded in other current and noncurrent assets on the Unaudited Condensed Consolidated Balance Sheets, respectively.
The following table provides a reconciliation of cash and cash equivalents and restricted cash reported in the Unaudited Condensed Consolidated Balance Sheets to the total amounts in the Unaudited Condensed Consolidated Statements of Cash Flows as follows:
| | (Thousands) | (Thousands) | March 31,
2021 | September 30,
2020 | March 31,
2020 | September 30,
2019 | (Thousands) | March 31, 2022 | September 30,
2021 | March 31,
2021 | |
| Balance Sheet | Balance Sheet | | Balance Sheet | | |
| Cash and cash equivalents | Cash and cash equivalents | $ | 57,654 | | $ | 117,012 | | $ | 25,968 | | $ | 2,676 | | Cash and cash equivalents | $ | 13,906 | | $ | 4,749 | | $ | 57,654 | | |
| Restricted cash in other noncurrent assets | Restricted cash in other noncurrent assets | $ | 1,321 | | $ | 2,411 | | $ | 2,422 | | $ | 1,387 | | Restricted cash in other noncurrent assets | $ | 1,294 | | $ | 1,294 | | $ | 1,321 | | |
| Statements of Cash Flow | Statements of Cash Flow | | Statements of Cash Flow | | |
| Cash, cash equivalents and restricted cash | Cash, cash equivalents and restricted cash | $ | 58,975 | | $ | 119,423 | | $ | 28,390 | | $ | 4,063 | | Cash, cash equivalents and restricted cash | $ | 15,200 | | $ | 6,043 | | $ | 58,975 | | |
Allowance for Doubtful Accounts
As of October 1, 2021, the Company adopted ASU No. 2016-13, an amendment to ASC 326, Financial Instruments - Credit Losses, which changes the impairment model for certain financial assets that have a contractual right to receive cash, including trade and loan receivables. The Company segregates financial assets, that fall within the scope of ASC 326, primarily trade receivables and unbilled revenues due in one year or less, into portfolio segments based on shared risk characteristics, such as geographical location and regulatory environment, for evaluation of expected credit losses. Historical and current information, such as average write-offs, are applied to each portfolio segment to estimate the allowance for losses on uncollectible receivables. Additionally, the allowance for losses on uncollectible receivables is adjusted for reasonable and supportable forecasts of future economic conditions, which can include changing weather, commodity prices, regulations, and macroeconomic factors, such as unemployment rates among others.others, including the estimated impact of the ongoing pandemic on the outstanding balances.
In December 2021, the Company deferred a portion of costs incurred related to bad debt for NJNG associated with customer accounts receivable as a regulatory asset resulting from the impacts of the ongoing COVID-19 pandemic. See Note 4. Regulation for additional information.
In February 2021, severe winter weather affected the U.S. mid-continent and southern regions that resulted in increased demand for natural gas supply and increases in wholesale energy prices. As a result, at March 31, 2021, Energy Services evaluated its counterparties for credit deterioration, as well as the related receivables for the purchase and receipt of natural gas for amounts past due.
The Company examined the credit characteristics of its counterparties, including the history of past due amounts for contractual settlements, counterparty credit ratings, and the likelihood of recovering amounts owed. As of March 31, 2021, the Company recorded a reserve for expected credit losses for Energy Services totaling $5.2 million within operations and maintenance expense on the Unaudited Condensed Consolidated Statement of Operations, representing management’s best estimate of expected credit losses at this time.
New Jersey Resources Corporation
Part I
NOTES TO UNAUDITED CONDENSED CONSOLIDATED FINANCIAL STATEMENTS (Continued)
It is possible that future developments could occur that could result in impairment of a portion or all of the remaining amounts owed to Energy Services, which would result in an additional charge to earnings.
Loans Receivable
NJNG currently provides loans, with terms ranging from two to 10 years, to customers that elect to purchase and install certain energy-efficient equipment in accordance with its BPU-approved SAVEGREEN program. The loans are recognized at fair value on the Unaudited Condensed Consolidated Balance Sheets. The Company recorded $14.3has $14.5 million and $13.7$14.2 million recorded in other current assets and $33.9$33.7 million and $35.3$32.3 million in other noncurrent assets as of March 31, 20212022 and September 30, 2020,2021, respectively, on the Unaudited Condensed Consolidated Balance Sheets, related to the loans. The Company regularly evaluates the credit quality and collection profile of its customers. If NJNG determines a loan is impaired, the basis of the loan would be subject to regulatory review for recovery. As of March 31, 20212022 and September 30, 2020,2021, the Company has not recorded any impairments for SAVEGREEN loans.
Natural Gas in Storage
The following table summarizes natural gas in storage, at average cost by segment as of:
| | | March 31, 2021 | September 30, 2020 | | March 31, 2022 | September 30, 2021 |
| ($ in thousands) | ($ in thousands) | Natural Gas in Storage | Bcf | Natural Gas in Storage | Bcf | ($ in thousands) | Natural Gas in Storage | Bcf | Natural Gas in Storage | Bcf |
| Natural Gas Distribution | Natural Gas Distribution | | $ | 40,083 | | 9.4 | | | $ | 110,037 | | 27.2 | | Natural Gas Distribution | | $ | 31,066 | | 4.9 | | | $ | 115,824 | | 27.6 | |
| Energy Services | Energy Services | | 34,439 | | 13.3 | | | 57,352 | | 34.3 | | Energy Services | | 35,234 | | 7.4 | | | 77,782 | | 18.8 | |
| Storage and Transportation | | 331 | | 0.1 | | | 115 | | 0.02 | | |
| Total | Total | | $ | 74,853 | | 22.8 | | | $ | 167,504 | | 61.52 | | Total | | $ | 66,300 | | 12.3 | | | $ | 193,606 | | 46.4 | |
Software Costs
The Company capitalizes certain costs, such as software design and configuration, coding, testing and installation, that are incurred to purchase or create and implement computer software for internal use. Capitalized costs include external costs of materials and services utilized in developing or obtaining internal-use software and payroll and payroll-related costs for employees who are directly associated with and devote time to the internal-use software project. Maintenance costs are expensed as incurred. Upgrades and enhancements are capitalized if it is probable that such expenditures will result in additional functionality.
Amortization is recorded on the straight-line basis over the estimated useful lives.
The following table presentstables present the software costs included in the Unaudited Condensed Consolidated Financial Statements:
| | | | | | | | |
| (Thousands) | March 31,
2021 | September 30,
2020 |
| Balance Sheets | | |
| Utility plant, at cost | $ | 14,011 | | $ | 13,452 | |
| | |
| Nonutility plant and equipment, at cost | $ | 334 | | $ | 316 | |
| | |
| Accumulated depreciation and amortization, utility plant | $ | (790) | | $ | (279) | |
| Accumulated depreciation and amortization, nonutility plant and equipment | $ | (17) | | $ | (5) | |
| Software costs | $ | 5,485 | | $ | 4,707 | |
| | | | | | | | |
| (Thousands) | March 31, 2022 | September 30,
2021 |
| Balance Sheets | | |
| Utility plant, at cost | $ | 16,959 | | $ | 16,543 | |
| Construction work in progress | $ | 20,752 | | $ | 7,801 | |
| Nonutility plant and equipment, at cost | $ | 344 | | $ | 338 | |
| Construction work in progress | $ | — | | $ | 8 | |
| Accumulated depreciation and amortization, utility plant | $ | (1,944) | | $ | (1,333) | |
| Accumulated depreciation and amortization, nonutility plant and equipment | $ | (19) | | $ | (29) | |
| Software costs | $ | 5,714 | | $ | 5,582 | |
| | | Three Months Ended | Six Months Ended | | Three Months Ended | Six Months Ended |
| | March 31, | | March 31, |
| Statements of Operations | Statements of Operations | 2021 | 2020 | 2021 | 2020 | Statements of Operations | 2022 | 2021 | 2022 | 2021 |
Operation and maintenance (1) | Operation and maintenance (1) | $ | 2,847 | | $ | 1,109 | | $ | 4,770 | | $ | 2,596 | | Operation and maintenance (1) | $ | 2,828 | | $ | 2,847 | | $ | 5,351 | | $ | 4,770 | |
| Depreciation and amortization | Depreciation and amortization | $ | 270 | | $ | 0 | | $ | 523 | | $ | 0 | | Depreciation and amortization | $ | 303 | | $ | 270 | | $ | 602 | | $ | 523 | |
(1)During the three and six months ended March 31, 2021, $111,0002022, approximately $113,000 and $188,000$225,000, respectively, was amortized from software costs into O&M. There were 0 amounts amortized forDuring the three and six months ended March 31, 2020.2021, approximately $111,000 and $188,000, respectively, was amortized from software costs into O&M.
New Jersey Resources Corporation
Part I
NOTES TO UNAUDITED CONDENSED CONSOLIDATED FINANCIAL STATEMENTS (Continued)
Sale Leasebacks
NJNG utilizes sale leaseback arrangements as a financing mechanism to fund certain of its capital expenditures related to natural gas meters, whereby the physical asset is sold concurrent with an agreement to lease the asset back. These agreements include options to renew the lease or repurchase the asset at the end of the term. Proceeds from sale leaseback transactions are accounted for as financing arrangements and are included in long-term debt on the Unaudited Condensed Consolidated Balance Sheets. NJNG received $4.0$17.3 million in December 2019,during the six months ended March 31, 2022, in connection with the sale leaseback of its natural gas meters. There were 0no natural gas meter sale leasebacks recorded during the six months ended March 31, 2021.
In addition, for certain of its commercial solar energy projects, the Company enters into lease agreements that provide for the sale of commercial solar energy assets to third parties and the concurrent leaseback of the assets. For sale leaseback transactions where the Company has concluded that the terms of the arrangement does not qualify as a sale as the Company retains control of the underlying assets and, as such, the Company uses the financing method to account for the transaction. Under the financing method, the Company recognizes the proceeds received from the buyer-lessor that constitute a payment to acquire the solar energy asset as a financing arrangement, which is recorded as a component of debt on the Unaudited Condensed Consolidated Balance Sheets.
The Company continues to operate the solar assets and is responsible for related expenses and entitled to retain the revenue generated from SRECs, TRECsRECs and energy sales. The ITCs and other tax benefits associated with these solar projects transfer to the buyer; however, the payments are structured so that Clean Energy Ventures is compensated for the transfer of the related tax attributes. Accordingly, Clean Energy Ventures recognizes the equivalent value of the tax attributes in other income on the Unaudited Condensed Consolidated Statements of Operations over the respective five-year ITC recapture periods, starting with the second year of the lease.
In December 2020, Clean Energy Ventures received proceeds of $3.3 million and $12.1 million during the six months ended March 31, 2022 and 2021, respectively, in connection with the sale leaseback of two commercial solar projects. The proceeds received were recognized as a financing obligation on the Unaudited Condensed Consolidated Balance Sheets. Clean Energy Ventures did 0t receive proceeds related to the sale leaseback of commercial solar assets during the three and six months ended March 31, 2020.
Accumulated Other Comprehensive Loss(Loss) Income
The following table presents the changes in the components of accumulated other comprehensive (loss) income, net of related tax effects during the three months ended March 31, 20212022 and 2020:2021:
| | | | | | | | | | | | | | | | | |
| (Thousands) | Cash Flow Hedges | Postemployment Benefit Obligation | Total |
| Balance at December 31, 2021 | $ | (9,112) | | | $ | (24,386) | | | $ | (33,498) | |
| Other comprehensive income, net of tax | | | | | |
| | | | | |
| Amounts reclassified from accumulated other comprehensive loss, net of tax of $(80), $(232), $(312), respectively | 263 | | | 768 | | (1) | 1,031 | |
| | | | | |
| Balance at March 31, 2022 | $ | (8,849) | | | $ | (23,618) | | | $ | (32,467) | |
| | | | | |
| Balance at December 31, 2020 | $ | (10,166) | | | $ | (33,106) | | | $ | (43,272) | |
| Other comprehensive income, net of tax | | | | | |
| | | | | |
| Amounts reclassified from accumulated other comprehensive loss, net of tax of $(79), $(244), $(323) | 263 | | | 813 | | (1) | 1,076 | |
| | | | | |
| | | | | |
| Balance at March 31, 2021 | $ | (9,903) | | | $ | (32,293) | | | $ | (42,196) | |
| | | | | | | | | | | | | | | | | |
| (Thousands) | Cash Flow Hedges | Postemployment Benefit Obligation | Total |
| Balance at December 31, 2020 | $ | (10,166) | | | $ | (33,106) | | | $ | (43,272) | |
| Other comprehensive income, net of tax | | | | | |
| | | | | |
| Amounts reclassified from accumulated other comprehensive income, net of tax of $(79), $(244), $(323), respectively | 263 | | | 813 | | (1) | 1,076 | |
| | | | | |
| Balance at March 31, 2021 | $ | (9,903) | | | $ | (32,293) | | | $ | (42,196) | |
| | | | | |
| Balance at December 31, 2019 | $ | 0 | | | $ | (31,028) | | | $ | (31,028) | |
| Other comprehensive income, net of tax | | | | | |
| Other comprehensive (loss) income, before reclassifications, net of tax of $2,781, $(1,681), $1,100 | (9,711) | | | 5,378 | | | (4,333) | |
| Amounts reclassified from accumulated other comprehensive income, net of tax of $0, $(72), $(72) | 0 | | | 722 | | (1) | 722 | |
| Net current-period other comprehensive income, net of tax of $2,781, $(1,753), $1,028 | (9,711) | | | 6,100 | | | (3,611) | |
| | | | | |
| Balance at March 31, 2020 | $ | (9,711) | | | $ | (24,928) | | | $ | (34,639) | |
| | | | | | | | | | | | | | | | | |
| (Thousands) | Cash Flow Hedges | Postemployment Benefit Obligation | Total |
| Balance at September 30, 2021 | $ | (9,376) | | | $ | (25,152) | | | $ | (34,528) | |
| Other comprehensive income, net of tax | | | | | |
| | | | | |
| Amounts reclassified from accumulated other comprehensive loss, net of tax of $(159), $(465), $(624), respectively | 527 | | | 1,534 | | (1) | 2,061 | |
| | | | | |
| Balance at March 31, 2022 | $ | (8,849) | | | $ | (23,618) | | | $ | (32,467) | |
| | | | | |
| Balance at September 30, 2020 | $ | (10,397) | | | $ | (33,918) | | | $ | (44,315) | |
| Other comprehensive income, net of tax | | | | | |
| | | | | |
| Amounts reclassified from accumulated other comprehensive loss, net of tax of $(191), $(489) and $(680) | 494 | | | 1,625 | | (1) | 2,119 | |
| | | | | |
| | | | | |
| Balance at March 31, 2021 | $ | (9,903) | | | $ | (32,293) | | | $ | (42,196) | |
(1)Included in the computation of net periodic pension cost, a component of operations and maintenance expense on the Unaudited Condensed Consolidated Statements of Operations.
Reclassification
Certain prior period amounts related to deferred revenue within current liabilities on the Unaudited Condensed Consolidated Balance Sheets and Unaudited Consolidated Condensed Statements of Cash Flows have been reclassified to conform to the current period presentation.
New Jersey Resources Corporation
Part I
NOTES TO UNAUDITED CONDENSED CONSOLIDATED FINANCIAL STATEMENTS (Continued)
The following table presents the changes in the components of accumulated other comprehensive (loss) income, net of related tax effects during the six months ended March 31, 2021 and 2020:
| | | | | | | | | | | | | | | | | |
| (Thousands) | Cash Flow Hedges | Postemployment Benefit Obligation | Total |
| Balance at September 30, 2020 | $ | (10,397) | | | $ | (33,918) | | | $ | (44,315) | |
| Other comprehensive income, net of tax | | | | | |
| | | | | |
| Amounts reclassified from accumulated other comprehensive income, net of tax of $(191), $(489), $(680), respectively | 494 | | | 1,625 | | (1) | 2,119 | |
| | | | | |
| | | | | |
| Balance at March 31, 2021 | $ | (9,903) | | | $ | (32,293) | | | $ | (42,196) | |
| | | | | |
| Balance at September 30, 2019 | $ | 0 | | | $ | (31,787) | | | $ | (31,787) | |
| Other comprehensive income, net of tax | | | | | |
| Other comprehensive (loss) income, before reclassifications, net of tax of $2,781, $(1,681), $1,100 | (9,711) | | | 5,378 | | | (4,333) | |
| Amounts reclassified from accumulated other comprehensive income, net of tax of $0, $(289) and $(289) | 0 | | | 1,481 | | (1) | 1,481 | |
| Net current-period other comprehensive income, net of tax of $2,781, $(1,970), $811 | (9,711) | | | 6,859 | | | (2,852) | |
| | | | | |
| Balance at March 31, 2020 | $ | (9,711) | | | $ | (24,928) | | | $ | (34,639) | |
(1)Included in the computation of net periodic pension cost, a component of operations and maintenance expense on the Unaudited Condensed Consolidated Statements of Operations.
Change in Accounting Policy
Effective October 1, 2020, the Company changed its method of accounting for ITCs at Clean Energy Ventures from the flow through method to the deferral method. Prior to the change, the Company recognized ITCs as a reduction of income tax expense in the period that the qualified solar energy property, to which it relates, was placed in service. Effective with the accounting change, the Company records ITCs as a reduction to the carrying value of the related asset when placed in service and recognizes ITCs in earnings as a reduction to depreciation expense over the productive life of the related property. The deferral method is considered the preferred method per the authoritative guidance as described in ASC 740 - Income Taxes. The change to the deferral method is also consistent with the application of authoritative accounting guidance throughout other reporting segments and promotes proper matching of the benefits of the recognition of the ITC with the expected use of the asset.
The Company applied the change in accounting method retrospectively to all prior periods presented.
The impact of the change in accounting policy on the Unaudited Condensed Consolidated Statements of Operations during the three months ended March 31, 2020 is as follows:
| | | | | | | | | | | |
| As Previously | Effect of | As |
| (Thousands) | Reported | Change | Adjusted |
| Depreciation and amortization | $ | 30,784 | | (3,268) | | $ | 27,516 | |
| Total operating expenses | $ | 544,399 | | (3,268) | | $ | 541,131 | |
| Operating income | $ | 95,215 | | 3,268 | | $ | 98,483 | |
| Income before income taxes and equity in earnings of affiliates | $ | 83,273 | | 3,268 | | $ | 86,541 | |
| Income tax (benefit) expense | $ | (1,643) | | 17,927 | | $ | 16,284 | |
| Net income | $ | 88,505 | | (14,659) | | $ | 73,846 | |
| Earnings per common share | | | |
| Basic | $ | 0.93 | | (0.15) | | $ | 0.78 | |
| Diluted | $ | 0.92 | | (0.15) | | $ | 0.77 | |
New Jersey Resources Corporation
Part I
NOTES TO UNAUDITED CONDENSED CONSOLIDATED FINANCIAL STATEMENTS (Continued)
The impact of the change in accounting policy on the Unaudited Condensed Consolidated Statements of Operations during the six months ended March 31, 2020 is as follows:
| | | | | | | | | | | |
| As Previously | Effect of | As |
| (Thousands) | Reported | Change | Adjusted |
| Depreciation and amortization | $ | 58,542 | | (6,389) | | $ | 52,153 | |
| Total operating expenses | $ | 1,057,938 | | (6,389) | | $ | 1,051,549 | |
| Operating income | $ | 196,712 | | 6,389 | | $ | 203,101 | |
| Income before income taxes and equity in earnings of affiliates | $ | 168,986 | | 6,389 | | $ | 175,375 | |
| Income tax (benefit) expense | $ | (1,902) | | 34,657 | | $ | 32,755 | |
| Net income | $ | 177,866 | | (28,268) | | $ | 149,598 | |
| Earnings per common share | | | |
| Basic | $ | 1.90 | | (0.30) | | $ | 1.60 | |
| Diluted | $ | 1.89 | | (0.30) | | $ | 1.59 | |
The cumulative effect of the change in accounting policy on the Unaudited Condensed Consolidated Balance Sheets as of September 30, 2020 is as follows:
| | | | | | | | | | | |
| As Previously | Effect of | As |
| (Thousands) | Reported | Change | Adjusted |
| Assets | | | |
| Nonutility plant and equipment, at cost | $ | 1,430,723 | | (322,211) | | $ | 1,108,512 | |
| Accumulated depreciation and amortization, nonutility plant and equipment | $ | (202,507) | | 61,945 | | $ | (140,562) | |
| Property, plant and equipment, net | $ | 3,983,035 | | (260,266) | | $ | 3,722,769 | |
| Other noncurrent assets | $ | 78,716 | | 6,941 | | $ | 85,657 | |
| Total noncurrent assets | $ | 964,435 | | 6,941 | | $ | 971,376 | |
| Total assets | $ | 5,569,802 | | (253,325) | | $ | 5,316,477 | |
| Capitalization | | | |
| Retained earnings | $ | 1,148,297 | | (200,796) | | $ | 947,501 | |
| Common stock equity | $ | 1,844,692 | | (200,796) | | $ | 1,643,896 | |
| Total capitalization | $ | 4,104,158 | | (200,796) | | $ | 3,903,362 | |
| Liabilities | | | |
| Deferred income taxes | $ | 190,610 | | (52,529) | | $ | 138,081 | |
| Total noncurrent liabilities | $ | 931,922 | | (52,529) | | $ | 879,393 | |
| Total capitalization and liabilities | $ | 5,569,802 | | (253,325) | | $ | 5,316,477 | |
The impact of the change in accounting policy on the Unaudited Condensed Consolidated Statements of Cash Flows as of March 31, 2020 is as follows:
| | | | | | | | | | | |
| As Previously | Effect of | As |
| (Thousands) | Reported | Change | Adjusted |
| Depreciation and amortization | $ | 58,542 | | (6,389) | | $ | 52,153 | |
| Deferred income taxes | $ | 318 | | 34,657 | | $ | 34,975 | |
| | | |
| | | |
| | | |
| | | |
New Jersey Resources Corporation
Part I
NOTES TO UNAUDITED CONDENSED CONSOLIDATED FINANCIAL STATEMENTS (Continued)
The impact of the change in accounting policy on the Unaudited Condensed Consolidated Statements of Common Stock Equity as of March 31, 2020 is as follows:
| | | | | | | | | | | |
| As Previously | Effect of | As |
| (Thousands) | Reported | Change | Adjusted |
| Retained Earnings | | | |
| Balance at September 30, 2019 | $ | 1,075,960 | | (206,102) | | $ | 869,858 | |
| Net income | $ | 89,361 | | (13,609) | | $ | 75,752 | |
| Balance at December 31, 2019 | $ | 1,135,475 | | (219,711) | | $ | 915,764 | |
| Net income | $ | 88,505 | | (14,659) | | $ | 73,846 | |
| Balance at March 31, 2020 | $ | 1,194,092 | | (234,370) | | $ | 959,722 | |
| Total | | | |
| Balance at September 30, 2019 | $ | 1,551,717 | | (206,102) | | $ | 1,345,615 | |
| Net income | $ | 89,361 | | (13,609) | | $ | 75,752 | |
| Balance at December 31, 2019 | $ | 1,827,803 | | (219,711) | | $ | 1,608,092 | |
| Net income | $ | 88,505 | | (14,659) | | $ | 73,846 | |
| Balance at March 31, 2020 | $ | 1,889,107 | | (234,370) | | $ | 1,654,737 | |
Recently Adopted Updates to the Accounting Standards Codification
Financial InstrumentsIncome Taxes
In June 2016,December 2019, the FASB issued ASU No. 2016-13,2019-12, an amendment to ASC 326,740, Financial Instruments - Credit LossesIncome Taxes, which simplifies the accounting for income taxes and changes the impairment modelaccounting for certain financial assets that have a contractual right to receive cash, including trade and loan receivables. The new model requires recognition based upon an estimation of expected credit losses rather than recognition of losses when it is probable that they have been incurred. An entity will apply the amendment through a cumulative-effect adjustment to retained earnings as of the beginning of the first reporting period in which the guidance is effective. The Company assessed the impact of the guidance on NJR's reserve methodologies and credit policies and procedures for any assets that could be impacted, noting the majority of NJR's financial assets are short-term in nature, such as trade receivables and unbilled revenues.
The Company completed its evaluation of this amendment and all subsequent amendments related to this topic and adopted this guidance on October 1, 2020 using the modified retrospective method. The adoption did not result in a cumulative effect adjustment to retained earnings as the current expected lifetime loss estimates were not materially different from the reserves already in place.
The Company segregates financial assets that fall within the scope of ASC 326, primarily trade receivables and unbilled revenues due in one year or less, into portfolio segments based on shared risk characteristics, such as geographical location and regulatory environment, for evaluation of expected credit losses. Historical and current information, such as average write-offs, are applied to each portfolio segment to estimate the allowance for losses on uncollectible receivables. Additionally, the allowance for losses on uncollectible receivables is adjusted for reasonable and supportable forecasts of future economic conditions, which can include changing weather, commodity prices, regulations, and macroeconomic factors, such as unemployment ratesincome tax transactions, among others.
Fair Value
In August 2018, the FASB issued ASU No. 2018-13, an amendment to ASC 820, Fair Value Measurement, which removes, modifies and adds to certain disclosure requirements of fair value measurements. Disclosure requirements removed include the amount of and reasons for transfers between Level 1 and Level 2 of the fair value hierarchy, the policy for timing of transfers between levels and the valuation processes for Level 3 fair value measurements. Modifications include considerations around the requirement to disclose the timing of liquidation of an investee’s assets and the date when restrictions from redemption might lapse. The additions include the requirement to disclose changes in unrealized gains and losses for the period in other comprehensive income for recurring Level 3 fair value measurements held and the range and weighted average of significant unobservable inputs used to develop Level 3 fair value measurements.minor improvements. The Company adopted this guidance on October 1, 20202021, and applied it on a prospective basis. The Company doesamendments in this update were either not have either Level 3 fair value measurementsapplicable, currently applied, or transfers between Level 1 or Level 2 in its current portfolios, and therefore, this ASU did not have ana material impact toon the Company's financial position, results of operations, cash flows or cash flows.disclosures.
New Jersey Resources Corporation
Part I
NOTES TO UNAUDITED CONDENSED CONSOLIDATED FINANCIAL STATEMENTS (Continued)
CompensationInvestments - Retirement BenefitsEquity Securities, Investments - Equity Method and Joint Ventures and Derivatives and Hedging
In August 2018,January 2020, the FASB issued ASU No. 2018-14,2020-01, an amendment to ASC 715,321, CompensationInvestments - Retirement BenefitsEquity Securities, ASC 323, Investments - Equity Method and Joint Ventures, and ASC 815, Derivatives and Hedging,which removes disclosures that no longer are considered cost-beneficial, clarifies the specific requirementsinteractions between the three ASU topics. The update requires an entity to evaluate observable transactions that necessitate applying or discontinuing the equity method of certain disclosuresaccounting when applying the measurement alternative in Topic 321. This evaluation occurs prior to applying or upon ceasing the equity method. The update also states that when applying paragraph 815-10-15-141(a) for forward contracts and adds new disclosure requirements identified as relevant.purchased options, an entity is not required to assess whether the underlying securities will be accounted for under the equity method in accordance with Topic 323 or fair value method under Topic 825 upon settlement or exercise. The Company adopted this guidance on October 1, 2020.2021, and applied it on a prospective basis. There was no material impact toon the Company's financial position, results of operations, cash flows or cash flows.disclosures.
Reference Rate ReformOther
In January 2021,October 2020, the FASB issued ASU 2021-01, which refines the scope of ASC 848,No. 2020-10, Reference Rate ReformCodification Improvements, andwhich clarifies someapplication of its guidance of global reference rate reform activities. The amendments in this update permits entities to elect certain optional expedients and exceptions when accounting for derivative contracts and certain hedging relationships affected by changesvarious provisions in the interest rates used for discounting cash flows, for computing variation margin settlements,ASC by amending and for calculating price alignment interestadding new headings, cross referencing to other guidance, and refining or correcting terminology. It also improves the consistency by amending the ASC to include all disclosure guidance in connection with reference rate reform activities under way in global financial markets (the “discounting transition”).the appropriate section. The amendments inCompany adopted this update are effective upon the ASU issuance through December 31, 2022.guidance on October 1, 2021, and applied it on a prospective basis. There was no material impact toon the Company's financial position, results of operations, or cash flows as a result of its adoption.or disclosures.
Other Recent Updates to the Accounting Standards Codification
Income TaxesDebt and Other
In December 2019,August 2020, the FASB issued ASU No. 2019-12,2020-06, an amendment to ASC 740,470, Income TaxesDebt, and ASC 815, Derivatives and Hedging, which simplifies the accounting for income taxes and changes the accounting for certain income tax transactions, among other minor improvements.convertible instruments by reducing the number of acceptable accounting models to three models including, the embedded derivative, substantial premium, and traditional no proceeds allocated models. The guidance is effective for the Company beginning October 1, 2021, with early adoption permitted. Upon adoption,2022, and the Company can elect to apply it on either a modified or a full retrospective basis. The Company does not currently have convertible debt instruments and thus does not expect the amendments to have an impact on its financial position, results of operations, cash flows and disclosures upon adoption.
In May 2021, the FASB issued ASU No. 2021-04, an amendment to ASC 470, Debt, ASC 260, Earnings per Share, ASC 718, Stock Compensation, and ASC 815, Derivatives and Hedging. The update impacts equity-classified written call options that remain equity-classified after a modification or exchange. The guidance is effective for the Company beginning October 1, 2022, and will be applied on a prospective basis. The Company does not currently have equity-classified written call options and thus does not expect the amendments to have an impact on its financial position, results of operations, cash flows and disclosures upon adoption.
Leases
In July 2021, the FASB issued ASU No. 2021-05, an amendment to ASC 842, Leases, which requires a lessor to classify a lease with entirely or partially variable payments that do not depend on an index or rate as an operating lease if another classification, including sales-type or direct financing would trigger a loss at the lease commencement date. The guidance is effective for the Company beginning October 1, 2022, and the Company can elect to apply it either on a retrospective basis to leases that have commenced or have been modified under ASC 842 or on a prospective basis. The Company is currently evaluating the amendments to understand the impact on its financial position, results of operations, cash flows and disclosures upon adoption.
New Jersey Resources Corporation
Part I
Investments - Equity Method and Derivatives and HedgingNOTES TO UNAUDITED CONDENSED CONSOLIDATED FINANCIAL STATEMENTS (Continued)
Business Combinations
In January 2020,October 2021, the FASB issued ASU No. 2020-01,2021-08, an amendment to ASC 805, Investments - Equity Securities (Topic 321)Business Combinations, Investments - Equity Methodwhich requires that an acquirer recognize, and Joint Ventures (Topic 323),measure contract assets and Derivatives and Hedging (Topic 815): Clarifying the Interactions between Topic 321, Topic 323, and Topic 815. The update requires an entity to evaluate observable transactions that necessitate applying or discontinuing the equity method of accounting when applying the measurement alternativecontract liabilities acquired in Topic 321. This evaluation occurs prior to applying or upon ceasing the equity method. The update also states that when applying paragraph 815-10-15-141(a) for forward contracts and purchased options, an entity is not required to assess whether the underlying securities will be accounted for under the equity methoda business combination in accordance with Topic 323 or fair value method under Topic 825 upon settlement or exercise.606, Revenue from Contracts with Customers. The guidance is effective for the Company beginning October 1, 2021, with early adoption permitted.2023, and will be applied on a prospective basis to new acquisitions following the date of adoption. The Company is currently evaluating the impact ofamendments to understand the adoption of these amendments but does not expect that its pending adoption will have a material effectimpact on its consolidated financial statements.position, results of operations, cash flows and disclosures upon adoption.
OtherDerivatives and Hedging
In October 2020,March 2022, the FASB issued ASU 2020-10,No. 2022-01, an amendment to ASC 815, Derivatives and Hedging, which addresses fair value hedge accounting of interest rate risk for portfolios of financial assets. This update further clarifies application of various provisionsguidance previously released in ASU 2017-12 which established the ASC by amending"last-of-layer" method and adding new headings, cross referencingthis update renames that method to other guidance, and refining or correcting terminology. It also improves the consistency by amending the ASC to include all disclosure guidance in the appropriate section.“portfolio layer” method. The guidance is effective for the Company onbeginning October 1, 2021,2023, and the transition method can be on a prospective basis for a multiple-layer hedging strategy or a modified retrospective basis for a portfolio layer method. The Company does not currently apply hedge accounting to any of its risk management activities and thus does not expect the amendments to have an impact on its financial position, results of operations, cash flows and disclosures upon adoption.
Financial Instruments
In March 2022, the FASB issued ASU No. 2022-02, an amendment to ASC 326, Financial Instruments-Credit Losses, which eliminates the accounting guidance for creditors in troubled debt restructuring. It also aligns conflicting disclosure requirement guidance in ASC 326 by requiring disclosure of current-period gross write-offs by year of origination. The amendment also adds new disclosures for creditors with early adoption permitted.loan refinancing and restructuring for borrowers experiencing financial difficulty. The guidance is effective for the Company beginning October 1, 2023, and the Company can elect to apply it either on a modified retrospective or prospective basis. At this time, the Company has not experienced a troubled debt restructuring and thus does not expect the amendments to have an impact on its financial position, results of operations and cash flows upon adoption. The Company is currently evaluating the impact ofamendments to understand the adoption of these amendments but does not expect that its pending adoption will have a material effectimpact on its consolidated financial statements.disclosures upon adoption.
3. REVENUE
Revenue is recognized when a performance obligation is satisfied by transferring control of a product or service to a customer. Revenue is measured based on consideration specified in a contract with a customer using the output method of progress. The Company elected to apply the invoice practical expedient for recognizing revenue, whereby the amounts invoiced to customers represent the value to the customer and the Company’s performance completion as of the invoice date. Therefore, the Company does not disclose related unsatisfied performance obligations. The Company also elected the practical expedient to exclude from the transaction price all sales taxes that are assessed by a governmental authority and therefore presents sales tax net in operating revenues on the Unaudited Condensed Consolidated Statements of Operations.
New Jersey Resources Corporation
Part I
NOTES TO UNAUDITED CONDENSED CONSOLIDATED FINANCIAL STATEMENTS (Continued)
Below is a listing of performance obligations that arise from contracts with customers, along with details on the satisfaction of each performance obligation, the significant payment terms and the nature of the goods and services being transferred, by reporting segment and other business operations:
| | | | | | | | |
| Revenue Recognized Over Time: |
| Segment | Performance Obligation | Description |
| Natural Gas Distribution | Natural gas utility sales | NJNG's performance obligation is to provide natural gas to residential, commercial and industrial customers as demanded, based on regulated tariff rates, which are established by the BPU. Revenues from the sale of natural gas are recognized in the period that natural gas is delivered and consumed by customers, including an estimate for quantities consumed but not billed during the period. Payment is due each month for the previous month's deliveries. Natural gas sales to individual customers are based on meter readings, which are performed on a systematic basis throughout the billing period. The unbilled revenue estimates are based on estimated customer usage by customer type, weather effects and the most current tariff rates. NJNG is entitled to be compensated for performance completed until service is terminated.
Customers may elect to purchase the natural gas commodity from NJNG or may contract separately to purchase natural gas directly from third-party suppliers. As NJNG is acting as an agent on behalf of the third-party supplier, revenue is recorded for the delivery of natural gas to the customer. |
| Clean Energy Ventures | Commercial solar electricity | Clean Energy Ventures operates wholly-owned solar projects that recognize revenue as electricity is generated and transferred to the customer. The performance obligation is to provide electricity to the customer in accordance with contract terms or the interconnection agreement and is satisfied upon transfer of electricity generated.
Revenue is recognized as invoiced and the payment is due each month for the previous month's services. |
| Clean Energy Ventures | Residential solar electricity | Clean Energy Ventures provides access to residential rooftop and ground-mount solar equipment to customers who then pay the Company a monthly fee. The performance obligation is to provide electricity to the customer based on generation from the underlying residential solar asset and is satisfied upon transfer of electricity generated.
Revenue is derived from the contract terms and is recognized as invoiced, with the payment due each month for the previous month's services. |
| Clean Energy Ventures | Transition renewable energy certificates | Clean Energy Ventures generates TRECs, which are created for every MWh of electricity produced by a solar generator. The performance obligation of Clean Energy Ventures is to generate electricity and TRECs, which are purchased monthly by a REC Administrator.
Revenue is recognized upon generation. |
| Energy Services | Natural gas services | The performance obligation of Energy Services is to provide the customer transportation, storage and asset management services on an as-needed basis. Energy Services generates revenue through management fees, demand charges, reservation fees and transportation charges centered around the buying and selling of the natural gas commodity, representing one series of distinct performance obligations.
Revenue is recognized based upon the underlying natural gas quantities physically delivered and the customer obtaining control. Energy Services invoices customers on a monthly basis in line with the terms of the contract and based on the services provided. Payment is due each month forupon receipt of the previous month's invoiced services.invoice. For temporary releases of pipeline capacity, revenue is recognized on a straight-line basis over the agreed upon term. |
| Storage and Transportation | Natural gas services | The performance obligation of the Storage and Transportation segment is to provide the customer with storage and transportation services. The Storage and Transportation segment generates revenues from firm storage contracts and transportation contracts, related usage fees for the use of storage space, injection and withdrawal at the storage facility and the delivery of natural gas to customers. Revenue is recognized over time as customers receive the benefits of its service as it is performed on their behalf using an output method based on actual deliveries.
Demand fees are recognized as revenue over the term of the related agreement. |
| Home Services and Other | Service contracts | Home Services enters into service contracts with homeowners to provide maintenance and replacement services of applicable heating, cooling or ventilation equipment. All services provided relate to a distinct performance obligation which is to provide services for the specific equipment over the term of the contract.
Revenue is recognized on a straight-line basis over the term of the contract and payment is due upon receipt of the invoice. |
| | |
New Jersey Resources Corporation
Part I
NOTES TO UNAUDITED CONDENSED CONSOLIDATED FINANCIAL STATEMENTS (Continued)
| | | | | | | | |
| Revenue Recognized at a Point in Time: |
| Energy Services | Natural gas services | For a permanent release of pipeline capacity, the performance obligation of NJRES is the release of the pipeline capacity associated with certain natural gas transportation contracts and the transfer of the underlying contractual rights to the counterparty.
Revenue is recognized upon the transfer of the underlying contractual rights. |
| Storage and Transportation | Natural gas services | The performance obligation of the Storage and Transportation segment is to provide the customer with storage and transportation services. The Storage and Transportation segment generates revenues from usage fees and hub services for the use of storage space, injection and withdrawal from the storage facility. Hub services include park and loan transactions and wheeling.
HubUsage fees and hub services revenues are recognized as services are performed.
|
| Home Services and Other | Installations | Home Services installs appliances, including but not limited to, furnaces, air conditioning units, boilers and generators to customers. The distinct performance obligation is the installation of the contracted appliance, which is satisfied at the point in time the item is installed.
The transaction price for each installation differs accordingly. Revenue is recognized at a point in time upon completion of the installation, which is when the customer is billed. |
Disaggregated revenues from contracts with customers by product line and by reporting segment and other business operations during the three months ended March 31, 2022 and 2021, and 2020, isare as follows:
| | (Thousands) | (Thousands) | Natural Gas Distribution | Clean Energy Ventures | Energy Services | Storage and Transportation | Home Services
and Other | Total | (Thousands) | Natural Gas Distribution | Clean Energy Ventures | Energy Services | Storage and Transportation | Home Services
and Other | Total |
| 2022 | | 2022 | |
| Natural gas utility sales | | Natural gas utility sales | $ | 381,861 | | — | | | — | | — | | — | | $ | 381,861 | |
| Natural gas services | | Natural gas services | — | | — | | | 17,309 | | 13,342 | | — | | 30,651 | |
| Service contracts | | Service contracts | — | | — | | | — | | — | | 8,492 | | 8,492 | |
| Installations and maintenance | | Installations and maintenance | — | | — | | | — | | — | | 4,730 | | 4,730 | |
| Renewable energy certificates | | Renewable energy certificates | — | | 1,019 | | | — | | — | | — | | 1,019 | |
| Electricity sales | | Electricity sales | — | | 6,846 | | | — | | — | | — | | 6,846 | |
Eliminations (1) | | Eliminations (1) | (338) | | — | | | — | | (537) | | (81) | | (956) | |
| Revenues from contracts with customers | | Revenues from contracts with customers | 381,523 | | 7,865 | | | 17,309 | | 12,805 | | 13,141 | | 432,643 | |
Alternative revenue programs (2) | | Alternative revenue programs (2) | 2,504 | | — | | | — | | — | | — | | 2,504 | |
| Derivative instruments | | Derivative instruments | 79,447 | | 3,962 | | (3) | 395,336 | | — | | — | | 478,745 | |
Eliminations (1) | | Eliminations (1) | — | | — | | | (1,576) | | — | | — | | (1,576) | |
| Revenues out of scope | | Revenues out of scope | 81,951 | | 3,962 | | | 393,760 | | — | | — | | 479,673 | |
| Total operating revenues | | Total operating revenues | $ | 463,474 | | 11,827 | | | 411,069 | | 12,805 | | 13,141 | | $ | 912,316 | |
| 2021 | 2021 | | 2021 | |
| Natural gas utility sales | Natural gas utility sales | $ | 296,888 | | 0 | | | 0 | | 0 | | 0 | | $ | 296,888 | | Natural gas utility sales | $ | 296,888 | | — | | | — | | — | | — | | $ | 296,888 | |
| Natural gas services | Natural gas services | 0 | | 0 | | | 11,011 | | 13,926 | | 0 | | 24,937 | | Natural gas services | — | | — | | | 11,011 | | 13,926 | | — | | 24,937 | |
| Service contracts | Service contracts | 0 | | 0 | | | 0 | | 0 | | 8,314 | | 8,314 | | Service contracts | — | | — | | | — | | — | | 8,314 | | 8,314 | |
| Installations and maintenance | Installations and maintenance | 0 | | 0 | | | 0 | | 0 | | 4,459 | | 4,459 | | Installations and maintenance | — | | — | | | — | | — | | 4,459 | | 4,459 | |
| Renewable energy certificates | Renewable energy certificates | 0 | | 817 | | | 0 | | 0 | | 0 | | 817 | | Renewable energy certificates | — | | 817 | | | — | | — | | — | | 817 | |
| Electricity sales | Electricity sales | 0 | | 4,882 | | | 0 | | 0 | | 0 | | 4,882 | | Electricity sales | — | | 4,882 | | | — | | — | | — | | 4,882 | |
Eliminations (1) | Eliminations (1) | 0 | | 0 | | | 0 | | (669) | | (252) | | (921) | | Eliminations (1) | — | | — | | | — | | (669) | | (252) | | (921) | |
| Revenues from contracts with customers | Revenues from contracts with customers | 296,888 | | 5,699 | | | 11,011 | | 13,257 | | 12,521 | | 339,376 | | Revenues from contracts with customers | 296,888 | | 5,699 | | | 11,011 | | 13,257 | | 12,521 | | 339,376 | |
Alternative revenue programs (2) | Alternative revenue programs (2) | (6,664) | | 0 | | | 0 | | 0 | | 0 | | (6,664) | | Alternative revenue programs (2) | (6,664) | | — | | | — | | — | | — | | (6,664) | |
| Derivative instruments | Derivative instruments | 19,943 | | 777 | | (3) | 451,558 | | 0 | | 0 | | 472,278 | | Derivative instruments | 19,943 | | 777 | | (3) | 451,558 | | — | | — | | 472,278 | |
Eliminations (1) | Eliminations (1) | 0 | | 0 | | | (2,803) | | 0 | | 0 | | (2,803) | | Eliminations (1) | — | | — | | | (2,803) | | — | | — | | (2,803) | |
| Revenues out of scope | Revenues out of scope | 13,279 | | 777 | | | 448,755 | | 0 | | 0 | | 462,811 | | Revenues out of scope | 13,279 | | 777 | | | 448,755 | | — | | — | | 462,811 | |
| Total operating revenues | Total operating revenues | $ | 310,167 | | 6,476 | | | 459,766 | | 13,257 | | 12,521 | | $ | 802,187 | | Total operating revenues | $ | 310,167 | | 6,476 | | | 459,766 | | 13,257 | | 12,521 | | $ | 802,187 | |
| 2020 | | |
| Natural gas utility sales | $ | 266,868 | | 0 | | | 0 | | 0 | | 0 | | $ | 266,868 | | |
| Natural gas services | 0 | | 0 | | | 9,634 | | 11,076 | | 0 | | 20,710 | | |
| Service contracts | 0 | | 0 | | | 0 | | 0 | | 8,073 | | 8,073 | | |
| Installations and maintenance | 0 | | 0 | | | 0 | | 0 | | 4,292 | | 4,292 | | |
| | Electricity sales | 0 | | 4,458 | | | 0 | | 0 | | 0 | | 4,458 | | |
Eliminations (1) | 0 | | 0 | | | 0 | | (675) | | (326) | | (1,001) | | |
| Revenues from contracts with customers | 266,868 | | 4,458 | | | 9,634 | | 10,401 | | 12,039 | | 303,400 | | |
Alternative revenue programs (2) | 22,073 | | 0 | | | 0 | | 0 | | 0 | | 22,073 | | |
| Derivative instruments | 8,279 | | 1,537 | | | 304,067 | | 0 | | 0 | | 313,883 | | |
Eliminations (1) | 0 | | 0 | | | 258 | | 0 | | 0 | | 258 | | |
| Revenues out of scope | 30,352 | | 1,537 | | | 304,325 | | 0 | | 0 | | 336,214 | | |
| Total operating revenues | $ | 297,220 | | 5,995 | | | 313,959 | | 10,401 | | 12,039 | | $ | 639,614 | | |
(1)Includes building rent related to the Wall headquarters, which is eliminated in consolidation.
(2)Consists of transactions between subsidiaries that are eliminated in consolidation.
(2)(3)Includes CIP revenue.
(3)(4)Includes SREC revenue.
New Jersey Resources Corporation
Part I
NOTES TO UNAUDITED CONDENSED CONSOLIDATED FINANCIAL STATEMENTS (Continued)
Disaggregated revenues from contracts with customers by product line and by reporting segment and other business operations during the six months ended March 31, 2022 and 2021, and 2020, isare as follows:
| | (Thousands) | (Thousands) | Natural Gas Distribution | Clean Energy Ventures | Energy Services | Storage and Transportation | Home Services
and Other | Total | (Thousands) | Natural Gas Distribution | Clean Energy Ventures | Energy Services | Storage and Transportation | Home Services
and Other | Total |
| 2022 | | 2022 | |
Natural gas utility sales (1) | | Natural gas utility sales (1) | $ | 605,657 | | — | | | — | | — | | — | | $ | 605,657 | |
| Natural gas services | | Natural gas services | — | | — | | | 45,188 | | 25,485 | | — | | 70,673 | |
| Service contracts | | Service contracts | — | | — | | | — | | — | | 16,959 | | 16,959 | |
| Installations and maintenance | | Installations and maintenance | — | | — | | | — | | — | | 10,214 | | 10,214 | |
| Renewable energy certificates | | Renewable energy certificates | — | | 1,865 | | | — | | — | | — | | 1,865 | |
| Electricity sales | | Electricity sales | — | | 13,316 | | | — | | — | | — | | 13,316 | |
Eliminations (2) | | Eliminations (2) | (675) | | — | | | — | | (1,096) | | (180) | | (1,951) | |
| Revenues from contracts with customers | | Revenues from contracts with customers | 604,982 | | 15,181 | | | 45,188 | | 24,389 | | 26,993 | | 716,733 | |
Alternative revenue programs (2)(3) | | Alternative revenue programs (2)(3) | 13,158 | | — | | | — | | — | | — | | 13,158 | |
| Derivative instruments | | Derivative instruments | 119,769 | | 6,829 | | (4) | 736,701 | | — | | — | | 863,299 | |
Eliminations (2) | | Eliminations (2) | — | | — | | | (5,032) | | — | | — | | (5,032) | |
| Revenues out of scope | | Revenues out of scope | 132,927 | | 6,829 | | | 731,669 | | — | | — | | 871,425 | |
| Total operating revenues | | Total operating revenues | $ | 737,909 | | 22,010 | | | 776,857 | | 24,389 | | 26,993 | | $ | 1,588,158 | |
| 2021 | 2021 | | 2021 | |
| Natural gas utility sales | Natural gas utility sales | $ | 486,252 | | 0 | | | 0 | | 0 | | 0 | | $ | 486,252 | | Natural gas utility sales | $ | 486,252 | | — | | | — | | — | | — | | $ | 486,252 | |
| Natural gas services | Natural gas services | 0 | | 0 | | | 17,439 | | 27,030 | | 0 | | 44,469 | | Natural gas services | — | | — | | | 17,439 | | 27,030 | | — | | 44,469 | |
| Service contracts | Service contracts | 0 | | 0 | | | 0 | | 0 | | 16,573 | | 16,573 | | Service contracts | — | | — | | | — | | — | | 16,573 | | 16,573 | |
| Installations and maintenance | Installations and maintenance | 0 | | 0 | | | 0 | | 0 | | 8,777 | | 8,777 | | Installations and maintenance | — | | — | | | — | | — | | 8,777 | | 8,777 | |
| Renewable energy certificates | Renewable energy certificates | 0 | | 1,507 | | | 0 | | 0 | | 0 | | 1,507 | | Renewable energy certificates | — | | 1,507 | | | — | | — | | — | | 1,507 | |
| Electricity sales | Electricity sales | 0 | | 9,270 | | | 0 | | 0 | | 0 | | 9,270 | | Electricity sales | — | | 9,270 | | | — | | — | | — | | 9,270 | |
Eliminations (1) | Eliminations (1) | 0 | | 0 | | | 0 | | (1,326) | | (419) | | (1,745) | | Eliminations (1) | — | | — | | | — | | (1,326) | | (419) | | (1,745) | |
| Revenues from contracts with customers | Revenues from contracts with customers | 486,252 | | 10,777 | | | 17,439 | | 25,704 | | 24,931 | | 565,103 | | Revenues from contracts with customers | 486,252 | | 10,777 | | | 17,439 | | 25,704 | | 24,931 | | 565,103 | |
Alternative revenue programs (2)(3) | Alternative revenue programs (2)(3) | (5,096) | | 0 | | | 0 | | 0 | | 0 | | (5,096) | | Alternative revenue programs (2)(3) | (5,096) | | — | | | — | | — | | — | | (5,096) | |
| Derivative instruments | Derivative instruments | 24,740 | | 2,069 | | (3) | 674,607 | | 0 | | 0 | | 24,740 | | Derivative instruments | 24,740 | | 2,069 | | (4) | 674,607 | | — | | — | | 24,740 | |
Eliminations (1) | 0 | | 0 | | | (4,931) | | 0 | | 0 | | (4,931) | | |
Eliminations (2) | | Eliminations (2) | — | | — | | | (4,931) | | — | | — | | (4,931) | |
| Revenues out of scope | Revenues out of scope | 19,644 | | 2,069 | | | 669,676 | | 0 | | 0 | | 691,389 | | Revenues out of scope | 19,644 | | 2,069 | | | 669,676 | | — | | — | | 691,389 | |
| Total operating revenues | Total operating revenues | $ | 505,896 | | 12,846 | | | 687,115 | | 25,704 | | 24,931 | | $ | 1,256,492 | | Total operating revenues | $ | 505,896 | | 12,846 | | | 687,115 | | 25,704 | | 24,931 | | $ | 1,256,492 | |
| 2020 | | |
| Natural gas utility sales | $ | 486,762 | | 0 | | | 0 | | 0 | | 0 | | $ | 486,762 | | |
| Natural gas services | 0 | | 0 | | | 16,955 | | 20,148 | | 0 | | 37,103 | | |
| Service contracts | 0 | | 0 | | | 0 | | 0 | | 16,111 | | 16,111 | | |
| Installations and maintenance | 0 | | 0 | | | 0 | | 0 | | 9,161 | | 9,161 | | |
| | Electricity sales | 0 | | 8,476 | | | 0 | | 0 | | 0 | | 8,476 | | |
Eliminations (1) | 0 | | 0 | | | 0 | | (1,342) | | (741) | | (2,083) | | |
| Revenues from contracts with customers | 486,762 | | 8,476 | | | 16,955 | | 18,806 | | 24,531 | | 555,530 | | |
Alternative revenue programs (2)(3) | 20,130 | | 0 | | | 0 | | 0 | | 0 | | 20,130 | | |
| Derivative instruments | 9,951 | | 3,731 | | (3) | 667,161 | | 0 | | 0 | | 680,843 | | |
Eliminations (1) | 0 | | 0 | | | (1,853) | | 0 | | 0 | | (1,853) | | |
| Revenues out of scope | 30,081 | | 3,731 | | | 665,308 | | 0 | | 0 | | 699,120 | | |
| Total operating revenues | $ | 516,843 | | 12,207 | | | 682,263 | | 18,806 | | 24,531 | | $ | 1,254,650 | | |
(1)Includes building rent related to the Wall headquarters, which is eliminated in consolidation.
(2)Consists of transactions between subsidiaries that are eliminated in consolidation.
(2)(3)Includes CIP revenue.
(3)(4)Includes SREC revenue.
Disaggregated revenues from contracts with customers by customer type and by reporting segment and other business operations during the three months ended March 31, 2021 and 2020, is as follows:
| | | | | | | | | | | | | | | | | | | | |
| (Thousands) | Natural Gas Distribution | Clean Energy Ventures | Energy Services | Storage and Transportation | Home Services
and Other | Total |
| 2021 | | | | | | |
| Residential | $ | 225,174 | | 2,692 | | 0 | | 0 | | 12,234 | | $ | 240,100 | |
| Commercial and industrial | 42,824 | | 3,007 | | 11,011 | | 13,257 | | 287 | | 70,386 | |
| Firm transportation | 28,190 | | 0 | | 0 | | 0 | | 0 | | 28,190 | |
| Interruptible and off-tariff | 700 | | 0 | | 0 | | 0 | | 0 | | 700 | |
| Revenues out of scope | 13,279 | | 777 | | 448,755 | | 0 | | 0 | | 462,811 | |
| Total operating revenues | $ | 310,167 | | 6,476 | | 459,766 | | 13,257 | | 12,521 | | $ | 802,187 | |
| 2020 | | | | | | |
| Residential | $ | 199,776 | | 2,469 | | 0 | | 0 | | 11,831 | | $ | 214,076 | |
| Commercial and industrial | 41,635 | | 1,989 | | 9,634 | | 10,401 | | 208 | | 63,867 | |
| Firm transportation | 24,123 | | 0 | | 0 | | 0 | | 0 | | 24,123 | |
| Interruptible and off-tariff | 1,334 | | 0 | | 0 | | 0 | | 0 | | 1,334 | |
| Revenues out of scope | 30,352 | | 1,537 | | 304,325 | | 0 | | 0 | | 336,214 | |
| Total operating revenues | $ | 297,220 | | 5,995 | | 313,959 | | 10,401 | | 12,039 | | $ | 639,614 | |
New Jersey Resources Corporation
Part I
NOTES TO UNAUDITED CONDENSED CONSOLIDATED FINANCIAL STATEMENTS (Continued)
Disaggregated revenues from contracts with customers by customer type and by reporting segment and other business operations during the three months ended March 31, 2022 and 2021, are as follows:
| | | | | | | | | | | | | | | | | | | | |
| (Thousands) | Natural Gas Distribution | Clean Energy Ventures | Energy Services | Storage and Transportation | Home Services
and Other | Total |
| 2022 | | | | | | |
| Residential | $ | 286,205 | | 2,991 | | — | | — | | 13,105 | | $ | 302,301 | |
| Commercial and industrial | 60,106 | | 4,874 | | 17,309 | | 12,805 | | 36 | | 95,130 | |
| Firm transportation | 34,636 | | — | | — | | — | | — | | 34,636 | |
| Interruptible and off-tariff | 576 | | — | | — | | — | | — | | 576 | |
| Revenues out of scope | 81,951 | | 3,962 | | 393,760 | | — | | — | | 479,673 | |
| Total operating revenues | $ | 463,474 | | 11,827 | | 411,069 | | 12,805 | | 13,141 | | $ | 912,316 | |
| 2021 | | | | | | |
| Residential | $ | 225,174 | | 2,692 | | — | | — | | 12,234 | | $ | 240,100 | |
| Commercial and industrial | 42,824 | | 3,007 | | 11,011 | | 13,257 | | 287 | | 70,386 | |
| Firm transportation | 28,190 | | — | | — | | — | | — | | 28,190 | |
| Interruptible and off-tariff | 700 | | — | | — | | — | | — | | 700 | |
| Revenues out of scope | 13,279 | | 777 | | 448,755 | | — | | — | | 462,811 | |
| Total operating revenues | $ | 310,167 | | 6,476 | | 459,766 | | 13,257 | | 12,521 | | $ | 802,187 | |
Disaggregated revenues from contracts with customers by customer type and by reporting segment and other business operations during the six months ended March 31, 2022 and 2021, and 2020, isare as follows:
| | (Thousands) | (Thousands) | Natural Gas Distribution | Clean Energy Ventures | Energy Services | Storage and Transportation | Home Services
and Other | Total | (Thousands) | Natural Gas Distribution | Clean Energy Ventures | Energy Services | Storage and Transportation | Home Services
and Other | Total |
| 2022 | | 2022 | |
| Residential | | Residential | $ | 437,513 | | 5,963 | | — | | — | | 26,880 | | $ | 470,356 | |
| Commercial and industrial | | Commercial and industrial | 107,290 | | 9,218 | | 45,188 | | 24,389 | | 113 | | 186,198 | |
| Firm transportation | | Firm transportation | 57,311 | | — | | — | | — | | — | | 57,311 | |
| Interruptible and off-tariff | | Interruptible and off-tariff | 2,868 | | — | | — | | — | | — | | 2,868 | |
| Revenues out of scope | | Revenues out of scope | 132,927 | | 6,829 | | 731,669 | | — | | — | | 871,425 | |
| Total operating revenues | | Total operating revenues | $ | 737,909 | | 22,010 | | 776,857 | | 24,389 | | 26,993 | | $ | 1,588,158 | |
| 2021 | 2021 | | 2021 | |
| Residential | Residential | $ | 362,398 | | 5,414 | | 0 | | 0 | | 24,438 | | $ | 392,250 | | Residential | $ | 362,398 | | 5,414 | | — | | — | | 24,438 | | $ | 392,250 | |
| Commercial and industrial | Commercial and industrial | 72,053 | | 5,363 | | 17,439 | | 25,704 | | 493 | | 121,052 | | Commercial and industrial | 72,053 | | 5,363 | | 17,439 | | 25,704 | | 493 | | 121,052 | |
| Firm transportation | Firm transportation | 49,294 | | 0 | | 0 | | 0 | | 0 | | 49,294 | | Firm transportation | 49,294 | | — | | — | | — | | — | | 49,294 | |
| Interruptible and off-tariff | Interruptible and off-tariff | 2,507 | | 0 | | 0 | | 0 | | 0 | | 2,507 | | Interruptible and off-tariff | 2,507 | | — | | — | | — | | — | | 2,507 | |
| Revenues out of scope | Revenues out of scope | 19,644 | | 2,069 | | 669,676 | | 0 | | 0 | | 691,389 | | Revenues out of scope | 19,644 | | 2,069 | | 669,676 | | — | | — | | 691,389 | |
| Total operating revenues | Total operating revenues | $ | 505,896 | | 12,846 | | 687,115 | | 25,704 | | 24,931 | | $ | 1,256,492 | | Total operating revenues | $ | 505,896 | | 12,846 | | 687,115 | | 25,704 | | 24,931 | | $ | 1,256,492 | |
| | 2020 | | |
| Residential | $ | 352,998 | | 4,929 | | 0 | | 0 | | 24,110 | | $ | 382,037 | | |
| Commercial and industrial | 87,057 | | 3,547 | | 16,955 | | 18,806 | | 421 | | 126,786 | | |
| Firm transportation | 43,712 | | — | | 0 | | 0 | | 0 | | 43,712 | | |
| Interruptible and off-tariff | 2,995 | | 0 | | 0 | | 0 | | 0 | | 2,995 | | |
| Revenues out of scope | 30,081 | | 3,731 | | 665,308 | | 0 | | 0 | | 699,120 | | |
| Total operating revenues | $ | 516,843 | | 12,207 | | 682,263 | | 18,806 | | 24,531 | | $ | 1,254,650 | | |
New Jersey Resources Corporation
Part I
NOTES TO UNAUDITED CONDENSED CONSOLIDATED FINANCIAL STATEMENTS (Continued)
Customer Accounts Receivable/Credit Balances and Deposits
The timing of revenue recognition, customer billings and cash collections resulting in accounts receivables, billed and unbilled, and customers’ credit balances and deposits on the Unaudited Condensed Consolidated Balance Sheets during the six months ended March 31, 2022 and 2021, are as follows:
| | | Customer Accounts Receivable | Customers' Credit | | Customer Accounts Receivable | Customers' Credit |
| (Thousands) | (Thousands) | Billed | Unbilled | Balances and Deposits | (Thousands) | Billed | Unbilled | Balances and Deposits |
| Balance as of October 1, 2020 | $ | 134,173 | | $ | 9,226 | | $ | 25,934 | | |
| Balance as of September 30, 2021 | | Balance as of September 30, 2021 | $ | 212,838 | | $ | 10,351 | | $ | 32,586 | |
| Increase (Decrease) | | Increase (Decrease) | 60,475 | | 45,919 | | (12,302) | |
| Balance as of March 31, 2022 | | Balance as of March 31, 2022 | $ | 273,313 | | $ | 56,270 | | $ | 20,284 | |
| Balance as of September 30, 2020 | | Balance as of September 30, 2020 | $ | 134,173 | | $ | 9,226 | | $ | 25,934 | |
| Increase (Decrease) | Increase (Decrease) | 103,056 | | 32,715 | | (5,171) | | Increase (Decrease) | 103,056 | | 32,715 | | (5,171) | |
| Balance as of March 31, 2021 | Balance as of March 31, 2021 | $ | 237,229 | | $ | 41,941 | | $ | 20,763 | | Balance as of March 31, 2021 | $ | 237,229 | | $ | 41,941 | | $ | 20,763 | |
The following table provides information about receivables, which are included within accounts receivable, billed and unbilled, and customers’ credit balances and deposits, respectively, on the Unaudited Condensed Consolidated Balance Sheets as of March 31, 2022 and September 30, 2021:
| | (Thousands) | (Thousands) | Natural Gas Distribution | Clean Energy Ventures | Energy Services | Storage and Transportation | Home Services
and Other | | Total | (Thousands) | Natural Gas Distribution | Clean Energy Ventures | Energy Services | Storage and Transportation | Home Services
and Other | | Total |
| | March 31, 2022 | | March 31, 2022 | | | |
| Customer accounts receivable | Customer accounts receivable | | | | Customer accounts receivable | | | |
| Billed | Billed | $ | 119,845 | | 4,794 | | 107,353 | | 3,437 | | 1,800 | | | $ | 237,229 | | Billed | $ | 154,380 | | 5,239 | | 107,262 | | 4,385 | | 2,047 | | | $ | 273,313 | |
| Unbilled | Unbilled | 39,652 | | 2,289 | | 0 | | 0 | | 0 | | | 41,941 | | Unbilled | 54,675 | | 1,595 | | — | | — | | — | | | 56,270 | |
| Customers' credit balances and deposits | Customers' credit balances and deposits | (20,763) | | 0 | | 0 | | 0 | | 0 | | | (20,763) | | Customers' credit balances and deposits | (20,284) | | — | | — | | — | | — | | | (20,284) | |
| Total | Total | $ | 138,734 | | 7,083 | | 107,353 | | 3,437 | | 1,800 | | | $ | 258,407 | | Total | $ | 188,771 | | 6,834 | | 107,262 | | 4,385 | | 2,047 | | | $ | 309,299 | |
| | September 30, 2021 | | September 30, 2021 | | | |
| Customer accounts receivable | | Customer accounts receivable | | | |
| Billed | | Billed | $ | 54,514 | | 5,534 | | 147,087 | | 3,956 | | 1,747 | | | $ | 212,838 | |
| Unbilled | | Unbilled | 8,427 | | 1,924 | | — | | — | | — | | | 10,351 | |
| Customers' credit balances and deposits | | Customers' credit balances and deposits | (32,586) | | — | | — | | — | | — | | | (32,586) | |
| Total | | Total | $ | 30,355 | | 7,458 | | 147,087 | | 3,956 | | 1,747 | | | $ | 190,603 | |
4. REGULATION
NJNG is subject to cost-based regulation, therefore, it is permitted to recover authorized operating expenses and earn a reasonable return on its utility capital investments based on the BPU's approval. The impact of the ratemaking process and decisions authorized by the BPU allows NJNG to capitalize or defer certain costs that are expected to be recovered from its customers as regulatory assets and to recognize certain obligations representing amounts that are probable future expenditures as regulatory liabilities in accordance with accounting guidance applicable to regulated operations.
NJNG's recovery of costs is facilitated through its base rates, BGSS and other regulatory tariff riders. NJNG is required to make annual filings to the BPU for review of its BGSS, CIP and various other programs and related rates. Annual rate changes are typically requested to be effective at the beginning of the following fiscal year. The current base rates include a weighted average cost of capital of 6.84 percent and a return on common equity of 9.6 percent. All rate and program changes are subject to proper notification and BPU review and approval. In addition, NJNG is permitted to implement certain BGSS rate changes on a provisional basis with proper notification to the BPU.
New Jersey Resources Corporation
Part I
NOTES TO UNAUDITED CONDENSED CONSOLIDATED FINANCIAL STATEMENTS (Continued)
Regulatory assets and liabilities included on the Unaudited Condensed Consolidated Balance Sheets for NJNG are comprised of the following:
| | (Thousands) | (Thousands) | March 31,
2021 | September 30,
2020 | (Thousands) | March 31, 2022 | September 30,
2021 |
| Regulatory assets-current | Regulatory assets-current | | Regulatory assets-current | |
| New Jersey Clean Energy Program | New Jersey Clean Energy Program | $ | 6,147 | | $ | 15,570 | | New Jersey Clean Energy Program | $ | 6,608 | | $ | 16,308 | |
| Conservation Incentive Program | Conservation Incentive Program | 14,025 | | 19,120 | | Conservation Incentive Program | 24,997 | | 11,839 | |
| | Derivatives at fair value, net | 1,509 | | 0 | | |
| | Other current regulatory assets | Other current regulatory assets | 1,730 | | 1,682 | | Other current regulatory assets | 1,241 | | 1,554 | |
| Total current regulatory assets | Total current regulatory assets | $ | 23,411 | | $ | 36,372 | | Total current regulatory assets | $ | 32,846 | | $ | 29,701 | |
| Regulatory assets-noncurrent | Regulatory assets-noncurrent | | Regulatory assets-noncurrent | |
| Environmental remediation costs: | Environmental remediation costs: | | Environmental remediation costs: | |
| Expended, net of recoveries | Expended, net of recoveries | $ | 37,476 | | $ | 36,516 | | Expended, net of recoveries | $ | 65,523 | | $ | 58,483 | |
| Liability for future expenditures | Liability for future expenditures | 143,495 | | 150,590 | | Liability for future expenditures | 121,615 | | 135,012 | |
| Deferred income taxes | Deferred income taxes | 31,603 | | 28,241 | | Deferred income taxes | 39,857 | | 39,694 | |
| Derivatives at fair value, net | 4 | | 1 | | |
| | SAVEGREEN | SAVEGREEN | 21,842 | | 21,281 | | SAVEGREEN | 33,917 | | 32,941 | |
| Postemployment and other benefit costs | Postemployment and other benefit costs | 180,360 | | 188,170 | | Postemployment and other benefit costs | 111,918 | | 117,194 | |
| Deferred storm damage costs | Deferred storm damage costs | 5,429 | | 6,515 | | Deferred storm damage costs | 3,257 | | 4,343 | |
| Cost of removal | Cost of removal | 82,353 | | 75,080 | | Cost of removal | 100,423 | | 99,238 | |
| | Other noncurrent regulatory assets | Other noncurrent regulatory assets | 17,952 | | 20,068 | | Other noncurrent regulatory assets | 32,040 | | 32,695 | |
| Total noncurrent regulatory assets | Total noncurrent regulatory assets | $ | 520,514 | | $ | 526,462 | | Total noncurrent regulatory assets | $ | 508,550 | | $ | 519,600 | |
| Regulatory liability-current | Regulatory liability-current | | Regulatory liability-current | |
| Overrecovered natural gas costs | Overrecovered natural gas costs | $ | 541 | | $ | 25,914 | | Overrecovered natural gas costs | $ | 27,133 | | $ | 5,510 | |
| | Derivatives at fair value, net | Derivatives at fair value, net | 176 | | 274 | | Derivatives at fair value, net | 60,931 | | 22,497 | |
| Total current regulatory liabilities | Total current regulatory liabilities | $ | 717 | | $ | 26,188 | | Total current regulatory liabilities | $ | 88,064 | | $ | 28,007 | |
| Regulatory liabilities-noncurrent | Regulatory liabilities-noncurrent | | Regulatory liabilities-noncurrent | |
Tax Act impact (1) | Tax Act impact (1) | $ | 192,895 | | $ | 195,425 | | Tax Act impact (1) | $ | 187,876 | | $ | 190,386 | |
| Derivatives at fair value, net | Derivatives at fair value, net | 0 | | 352 | | Derivatives at fair value, net | — | | 1,166 | |
| | Other noncurrent regulatory liabilities | Other noncurrent regulatory liabilities | 759 | | 509 | | Other noncurrent regulatory liabilities | 590 | | 336 | |
| Total noncurrent regulatory liabilities | Total noncurrent regulatory liabilities | $ | 193,654 | | $ | 196,286 | | Total noncurrent regulatory liabilities | $ | 188,466 | | $ | 191,888 | |
(1)Reflects the re-measurement and subsequent amortization of NJNG's net deferred tax liabilities as a result of the change in federal tax rates enacted in the Tax Act.Act, an Act to Provide for Reconciliation Pursuant to Titles II and V of the Concurrent Resolution on the Budget for Fiscal Year 2018, previously known as The Tax Cuts and Jobs Act of 2017.
As of March 31, 2022, other noncurrent regulatory assets include deferred pandemic costs of $7.5 million primarily related to a portion of bad debt associated with customer accounts receivable resulting from the impacts of the ongoing COVID-19 pandemic. These costs are eligible for future regulatory recovery. There were no deferred pandemic costs as of September 30, 2021.
Regulatory assets and liabilities included on the Unaudited Condensed Consolidated Balance Sheets for Adelphia Gateway are comprised of the following:
| | (Thousands) | (Thousands) | March 31,
2021 | September 30,
2020 | (Thousands) | March 31,
2022 | September 30,
2021 |
| Total current regulatory assets | Total current regulatory assets | $ | 116 | | $ | 158 | | Total current regulatory assets | $ | 871 | | $ | 417 | |
| Total noncurrent regulatory assets | Total noncurrent regulatory assets | $ | 1,514 | | $ | 997 | | Total noncurrent regulatory assets | $ | 4,456 | | $ | 2,499 | |
| | Total-noncurrent regulatory liabilities | $ | 164 | | $ | 0 | | |
| Total noncurrent regulatory liabilities | | Total noncurrent regulatory liabilities | $ | 2,984 | | $ | 1,163 | |
The assets are comprised primarily of the tax benefit associated with the equity component of AFUDC and the liability consists primarily of scheduling penalties. Recovery of regulatory assets is subject to FERC approval.
Regulatory filings and/or actions that occurred during the current fiscal year include the following:
•On October 28, 2020,November 17, 2021, the BPU approved the Company’s transmission and distribution componentissued an order adopting a stipulation of the IIP for $150.0settlement approving a $79.0 million over five years, effective November 1, 2020. The recovery of information technology replacement and enhancements, that was included in the original IIP filing, will be included as part ofincrease to base rate filings as projects are placed in service.
•On November 20, 2020, NJNG notified the BPU of its intent to provide BGSS bill credits to residential and small commercial sales customersrates, effective December 1, 2020 to December 31, 2020. On December 22, 2020, NJNG notified2021. In addition, the BPUorder also included approval for the final increase for the NJ RISE/SAFE II programs, which totaled $269,000. The increase includes an overall rate of the extensionreturn on rate base of the BGSS bill credits through January 31, 2021. The actual bill credits given to customers totaled $20.6 million, $19.3 million net6.84 percent, return on common equity of tax.9.6 percent, a common equity ratio of 54.0 percent and a depreciation rate of 2.78 percent.
New Jersey Resources Corporation
Part I
NOTES TO UNAUDITED CONDENSED CONSOLIDATED FINANCIAL STATEMENTS (Continued)
•On March 3,November 17, 2021, the BPU approved the three-year SAVEGREEN program consisting of approximately $126.1a $2.9 million of direct investment, $109.4 million in financing options, and $23.4 million in operation and maintenance expenses, to be effective July 1, 2021.
•On March 3, 2021, the BPU approved, on a final basis, NJNG’s annual petition to modify its BGSS, balancing charge and CIP rates for residential and small commercial customers. The rate changes resulted in a $20.4 million decreaseincrease to the annual revenues credited to BGSS, a $3.8$13.0 million annual decreaseincrease related to its balancing charge, as well as changes to CIP rates, which resultedwill result in a $16.5$6.3 million decrease to the annual recovery, effective December 1, 2021. On April 6, 2022, the BPU and Rate Counsel executed a Stipulation for final BGSS/CIP rates. The BGSS, CIP, and balancing charge rates are currently in effect, on an interim basis, so there is no further rate impact to customers with this filing.
•On November 19, 2021, NJNG submitted notification of its intent to self-implement an increase to its BGSS rate which will result in an approximately $24.2 million increase to annual revenues credited to BGSS, effective OctoberDecember 1, 2020.2021.
•On January 26, 2022, the BPU approved a stipulation to resolve the current EE annual cost recovery filing, which will increase annual recoveries by $2.2 million, effective February 1, 2022.
•On March 30, 2021, NJNG filed a base rate case with23, 2022, the BPU requesting a natural gas revenueapproved NJNG's annual filing to increase of $165.7the RAC by $600,000 and decrease the NJCEP by $2.9 million, including a rate recovery for SRL and other infrastructure investments. SRL is expected to be placed in service during fiscal 2021.effective April 1, 2022.
•On March 31, 2021,2022, NJNG filed a petitionits first rate recovery request for its BPU approved IIP with the BPU requesting the final base rate increase of approximately $311,000 for the recovery associated with NJ RISE and SAFE II capital investments cost of approximately $3.4expenditures estimated at $25.6 million, madeincluding AFUDC through June 30, 2021. This filing will be updated for actual information through June 30, 2021. Changes to base rates are anticipated to be effective October 1, 2021.2022.
•On April 7, 2021,22, 2022, NJNG filed a petition with the BPU approvedseeking authority to issue up to $500 million in Medium Term Notes over a stipulation resolving NJNG’s annual SBC application requesting to recover remediation expenses including an increase in the RAC, of approximately $1.3 million annually and an increase to the NJCEP factor, resulting in an annual increase of approximately $6 million, effective April 1, 2021.3-year period.
5. DERIVATIVE INSTRUMENTS
The Company is subject primarily to commodity price risk due to fluctuations in the market price of natural gas, SRECs and electricity. To manage this risk, the Company enters into a variety of derivative instruments including, but not limited to, futures contracts, physical forward contracts, financial options and swaps to economically hedge the commodity price risk associated with its existing and anticipated commitments to purchase and sell natural gas, SRECs and electricity. In addition, the Company is exposed to foreign currency and interest rate risk and may utilize foreign currency derivatives to hedge Canadian dollar denominated natural gas purchases and/or sales and interest rate derivatives to reduce exposure to fluctuations in interest rates. All of these types of contracts are accounted for as derivatives, unless the Company elects NPNS, which is done on a contract-by-contract election. Accordingly, all of the financial and certain of the Company's physical derivative instruments are recorded at fair value on the Unaudited Condensed Consolidated Balance Sheets. For a more detailed discussion of the Company’s fair value measurement policies and level disclosures associated with the Company’s derivative instruments, see Note 6. Fair Value.
Energy Services
Energy Services chooses not to designate its financial commodity and physical forward commodity derivatives as accounting hedges or to elect NPNS. The changes in the fair value of these derivatives are recorded as a component of natural gas purchases or operating revenues, as appropriate for Energy Services, on the Unaudited Condensed Consolidated Statements of Operations as unrealized gains or losses. For Energy Services at settlement, realized gains and losses on all financial derivative instruments are recognized as a component of natural gas purchases and realized gains and losses on all physical derivatives follow the presentation of the related unrealized gains and losses as a component of either natural gas purchases or operating revenues.
Energy Services also enters into natural gas transactions in Canada and, consequently, is exposed to fluctuations in the value of Canadian currency relative to the U.S. dollar. Energy Services may utilize foreign currency derivatives to lock in the exchange rates associated with natural gas transactions denominated in Canadian currency. The derivatives may include currency forwards, futures, or swaps and are accounted for as derivatives. These derivatives are typically used to hedge demand fee payments on pipeline capacity, storage and natural gas purchase agreements.
As a result of Energy Services entering into transactions to borrow natural gas, commonly referred to as “park and loans,” an embedded derivative is recognized relating to differences between the fair value of the amount borrowed and the fair value of the amount that will ultimately be repaid, based on changes in the forward price for natural gas prices at the borrowed location over the contract term. This embedded derivative is accounted for as a forward sale in the month in which the repayment of the borrowed natural gas is expected to occur, and is considered a derivative transaction that is recorded at fair value on the Unaudited Condensed Consolidated Balance Sheets, with changes in value recognized in current period earnings.
New Jersey Resources Corporation
Part I
NOTES TO UNAUDITED CONDENSED CONSOLIDATED FINANCIAL STATEMENTS (Continued)
Expected production of SRECs is hedged through the use of forward and futures contracts. All contracts require the Company to physically deliver SRECs through the transfer of certificates as per contractual settlement schedules. Energy
New Jersey Resources Corporation
Part I
NOTES TO UNAUDITED CONDENSED CONSOLIDATED FINANCIAL STATEMENTS (Continued)
Services recognizes changes in the fair value of these derivatives as a component of operating revenues. Upon settlement of the contract, the related revenue is recognized when the SREC is transferred to the counterparty.
Natural Gas Distribution
Changes in fair value of NJNG's financial commodity derivatives are recorded as a component of regulatory assets or liabilities on the Unaudited Condensed Consolidated Balance Sheets. The Company elects NPNS accounting treatment on all physical commodity contracts that NJNG entered into on or before December 31, 2015, and accounts for these contracts on an accrual basis. Accordingly, physical natural gas purchases are recognized in regulatory assets or liabilities on the Unaudited Condensed Consolidated Balance Sheets when the contract settles and the natural gas is delivered. The average cost of natural gas is charged to expense in the current period earnings based on the BGSS factor times the therm sales. Effective for contracts executed on or after January 1, 2016, NJNG no longer elects NPNS accounting treatment on a portfolio basis. However, since NPNS is a contract-by-contract election, where it makes sense to do so, NJNG can and may elect to treat certain contracts as normal. Because NJNG recovers these amounts through future BGSS rates as increases or decreases to the cost of natural gas in NJNG’s tariff for natural gas service, the changes in fair value of these contracts are deferred as a component of regulatory assets or liabilities on the Unaudited Condensed Consolidated Balance Sheets.
In February 2020 and March 2020, NJNG entered into treasury lock transactions to fix the benchmark treasury rate associated with a $75 million debt tranche that was issued in September 2020. Settlement of the treasury locks resulted in a $6.6 million loss, which was recorded as a component of regulatory assets on the Unaudited Condensed Consolidated Balance Sheets. The loss is being amortized into earnings over the term of the debt as a component of interest expense on the Unaudited Condensed Consolidated Statements of Operations, which totaled $54,000 and $114,000 during the three and six months ended March 31, 2021.
Clean Energy Ventures
The Company elects NPNS accounting treatment on PPA contracts executed by Clean Energy Ventures that meet the definition of a derivative and accounts for the contract on an accrual basis. Accordingly, electricity sales are recognized in revenues throughout the term of the PPA as electricity is delivered. NPNS is a contract-by-contract election and where it makes sense to do so, the Company can and may elect to treat certain contracts as normal.
Home Services and Other
During fiscal 2020, NJR entered into treasury lock transactions to fix the benchmark treasury rate associated with a $260 million debt issuance that was finalized in July 2020 and a $200 million debt issuance that was finalized in September 2020. NJR designated its treasury lock contracts as cash flow hedges, therefore, changes in fair value of the effective portion of the hedges were recorded in OCI. Settlement of the treasury locks in fiscal 2020 resulted in a loss of $13.7 million, which was recorded within OCI. The loss is being amortized into earnings over the term of the debt as a component of interest expense on the Unaudited Condensed Consolidated Statements of Operations, which totaled $263,000 and $494,000, net of tax, during the three and six months ended March 31, 2021.
Fair Value of Derivatives
The following table presents the fair value of NJR'sthe Company's derivative assets and liabilities recognized on the Unaudited Condensed Consolidated Balance Sheets as of:
| | | Derivatives at Fair Value | | Derivatives at Fair Value |
| | | March 31, 2021 | | September 30, 2020 | | | March 31, 2022 | | September 30, 2021 |
| (Thousands) | (Thousands) | Balance Sheet Location | Assets | Liabilities | Assets | Liabilities | (Thousands) | Balance Sheet Location | Assets | Liabilities | Assets | Liabilities |
| Derivatives not designated as hedging instruments: | Derivatives not designated as hedging instruments: | | Derivatives not designated as hedging instruments: | |
| Natural Gas Distribution: | Natural Gas Distribution: | | Natural Gas Distribution: | |
| Physical commodity contracts | Physical commodity contracts | Derivatives - current | | $ | 177 | | | $ | 1 | | | $ | 78 | | | $ | 76 | | Physical commodity contracts | Derivatives - current | | $ | 101 | | | $ | 16 | | | $ | 36 | | | $ | 16 | |
| | Financial commodity contracts | Financial commodity contracts | Derivatives - current | | 589 | | | 88 | | | 71 | | | 282 | | Financial commodity contracts | Derivatives - current | | 111 | | | 1,887 | | | 2,046 | | | 13 | |
| | Energy Services: | Energy Services: | | Energy Services: | |
| Physical commodity contracts | Physical commodity contracts | Derivatives - current | | 3,668 | | | 16,415 | | | 6,454 | | | 20,438 | | Physical commodity contracts | Derivatives - current | | 1,853 | | | 21,594 | | | 2,818 | | | 24,592 | |
| | Derivatives - noncurrent | | 1,364 | | | 20,090 | | | 1,264 | | | 12,003 | | | Derivatives - noncurrent | | 131 | | | 19,632 | | | 333 | | | 13,237 | |
| | Financial commodity contracts | Financial commodity contracts | Derivatives - current | | 12,770 | | | 7,166 | | | 16,671 | | | 12,965 | | Financial commodity contracts | Derivatives - current | | 19,483 | | | 21,701 | | | 30,226 | | | 62,521 | |
| | Derivatives - noncurrent | | 585 | | | 407 | | | 2,037 | | | 1,346 | | | Derivatives - noncurrent | | 4,009 | | | — | | | 3,068 | | | 260 | |
| Foreign currency contracts | Foreign currency contracts | Derivatives - current | | 229 | | | 20 | | | 36 | | | 104 | | Foreign currency contracts | Derivatives - current | | 38 | | | 18 | | | 125 | | | 3 | |
| | Derivatives - noncurrent | | 28 | | | 9 | | | 48 | | | 3 | | | Derivatives - noncurrent | | — | | | — | | | 2 | | | — | |
| | | Total fair value of derivatives | Total fair value of derivatives | | $ | 19,410 | | | $ | 44,196 | | | $ | 26,659 | | | $ | 47,217 | | Total fair value of derivatives | | $ | 25,726 | | | $ | 64,848 | | | $ | 38,654 | | | $ | 100,642 | |
New Jersey Resources Corporation
Part I
NOTES TO UNAUDITED CONDENSED CONSOLIDATED FINANCIAL STATEMENTS (Continued)
Offsetting of Derivatives
The Company transacts under master netting arrangements or equivalent agreements that allow it to offset derivative assets and liabilities with the same counterparty. However, the Company’s policy is to present its derivative assets and liabilities on a gross basis at the contract level unit of account on the Unaudited Condensed Consolidated Balance Sheets. The following table summarizes the reported gross amounts, the amounts that the Company has the right to offset but elects not to, financial collateral, as well as the net amounts the Company could present on the Unaudited Condensed Consolidated Balance Sheets but elects not to.
| | (Thousands) | (Thousands) | Amounts Presented on Balance Sheets (1) | Offsetting Derivative Instruments (2) | Financial Collateral Received/Pledged (3) | Net Amounts (4) | (Thousands) | Amounts Presented on Balance Sheets (1) | Offsetting Derivative Instruments (2) | Financial Collateral Received/Pledged (3) | Net Amounts (4) |
| As of March 31, 2021: | | |
| As of March 31, 2022: | | As of March 31, 2022: | |
| Derivative assets: | Derivative assets: | | Derivative assets: | |
| Energy Services | Energy Services | | Energy Services | |
| Physical commodity contracts | Physical commodity contracts | | $ | 5,032 | | | $ | (1,757) | | | $ | (200) | | | $ | 3,075 | | Physical commodity contracts | | $ | 1,984 | | | $ | (480) | | | $ | (200) | | | $ | 1,304 | |
| Financial commodity contracts | Financial commodity contracts | | 13,355 | | | (7,573) | | | 0 | | 5,782 | | Financial commodity contracts | | 23,492 | | | (18,300) | | | — | | | 5,192 | |
| Foreign currency contracts | Foreign currency contracts | | 257 | | | (29) | | | 0 | | 228 | | Foreign currency contracts | | 38 | | | (18) | | | — | | | 20 | |
| Total Energy Services | Total Energy Services | | $ | 18,644 | | | $ | (9,359) | | | $ | (200) | | | $ | 9,085 | | Total Energy Services | | $ | 25,514 | | | $ | (18,798) | | | $ | (200) | | | $ | 6,516 | |
| Natural Gas Distribution | Natural Gas Distribution | | Natural Gas Distribution | |
| Physical commodity contracts | Physical commodity contracts | | $ | 177 | | | $ | (1) | | | $ | 0 | | | $ | 176 | | Physical commodity contracts | | $ | 101 | | | $ | (8) | | | $ | — | | | $ | 93 | |
| Financial commodity contracts | Financial commodity contracts | | 589 | | | (88) | | | 0 | | | 501 | | Financial commodity contracts | | 111 | | | (111) | | | — | | | — | |
| | Total Natural Gas Distribution | Total Natural Gas Distribution | | $ | 766 | | | $ | (89) | | | $ | 0 | | | $ | 677 | | Total Natural Gas Distribution | | $ | 212 | | | $ | (119) | | | $ | — | | | $ | 93 | |
| | Derivative liabilities: | Derivative liabilities: | | Derivative liabilities: | |
| Energy Services | Energy Services | | Energy Services | |
| Physical commodity contracts | Physical commodity contracts | | $ | 36,505 | | | $ | (1,757) | | | $ | 0 | | | $ | 34,748 | | Physical commodity contracts | | $ | 41,226 | | | $ | (480) | | | $ | — | | | $ | 40,746 | |
| | Financial commodity contracts | Financial commodity contracts | | 7,573 | | | (7,573) | | | 0 | | | 0 | | Financial commodity contracts | | 21,701 | | | (18,300) | | | — | | | 3,401 | |
| Foreign currency contracts | Foreign currency contracts | | 29 | | | (29) | | | 0 | | | 0 | | Foreign currency contracts | | 18 | | | (18) | | | — | | | — | |
| Total Energy Services | Total Energy Services | | $ | 44,107 | | | $ | (9,359) | | | $ | 0 | | | $ | 34,748 | | Total Energy Services | | $ | 62,945 | | | $ | (18,798) | | | $ | — | | | $ | 44,147 | |
| Natural Gas Distribution | Natural Gas Distribution | | Natural Gas Distribution | |
| Physical commodity contracts | Physical commodity contracts | | $ | 1 | | | $ | (1) | | | 0 | | $ | 0 | | Physical commodity contracts | | $ | 16 | | | $ | (8) | | | $ | — | | | $ | 8 | |
| Financial commodity contracts | Financial commodity contracts | | 88 | | | (88) | | | 0 | | 0 | | Financial commodity contracts | | 1,887 | | | (111) | | | — | | | 1,776 | |
| | Total Natural Gas Distribution | Total Natural Gas Distribution | | $ | 89 | | | $ | (89) | | | $ | 0 | | | $ | 0 | | Total Natural Gas Distribution | | $ | 1,903 | | | $ | (119) | | | $ | — | | | $ | 1,784 | |
| | As of September 30, 2020: | | |
| As of September 30, 2021: | | As of September 30, 2021: | |
| Derivative assets: | Derivative assets: | | Derivative assets: | |
| Energy Services | Energy Services | | Energy Services | |
| Physical commodity contracts | Physical commodity contracts | | $ | 7,718 | | | $ | (3,587) | | | $ | (200) | | | $ | 3,931 | | Physical commodity contracts | | $ | 3,151 | | | $ | (894) | | | $ | (700) | | | $ | 1,557 | |
| Financial commodity contracts | Financial commodity contracts | | 18,708 | | | (14,311) | | | 0 | | | 4,397 | | Financial commodity contracts | | 33,294 | | | (33,294) | | | 20,532 | | | 20,532 | |
| Foreign currency contracts | Foreign currency contracts | | 84 | | | (84) | | | 0 | | | 0 | | Foreign currency contracts | | 127 | | | (3) | | | — | | | 124 | |
| Total Energy Services | Total Energy Services | | $ | 26,510 | | | $ | (17,982) | | | $ | (200) | | | $ | 8,328 | | Total Energy Services | | $ | 36,572 | | | $ | (34,191) | | | $ | 19,832 | | | $ | 22,213 | |
| Natural Gas Distribution | Natural Gas Distribution | | Natural Gas Distribution | |
| Physical commodity contracts | Physical commodity contracts | | $ | 78 | | | $ | (65) | | | $ | 0 | | | $ | 13 | | Physical commodity contracts | | $ | 36 | | | $ | (8) | | | $ | — | | | $ | 28 | |
| Financial commodity contracts | Financial commodity contracts | | 71 | | | (71) | | | 0 | | | 0 | | Financial commodity contracts | | 2,046 | | | (13) | | | — | | | 2,033 | |
| Total Natural Gas Distribution | Total Natural Gas Distribution | | $ | 149 | | | $ | (136) | | | $ | 0 | | | $ | 13 | | Total Natural Gas Distribution | | $ | 2,082 | | | $ | (21) | | | $ | — | | | $ | 2,061 | |
| | Derivative liabilities: | Derivative liabilities: | | Derivative liabilities: | |
| Energy Services | Energy Services | | Energy Services | |
| Physical commodity contracts | Physical commodity contracts | | $ | 32,441 | | | $ | (3,587) | | | $ | 0 | | | $ | 28,854 | | Physical commodity contracts | | $ | 37,829 | | | $ | (894) | | | $ | — | | | $ | 36,935 | |
| Financial commodity contracts | Financial commodity contracts | | 14,311 | | | (14,311) | | | 0 | | | 0 | | Financial commodity contracts | | 62,781 | | | (33,294) | | | — | | | 29,487 | |
| Foreign currency contracts | Foreign currency contracts | | 107 | | | (84) | | | 0 | | | 23 | | Foreign currency contracts | | 3 | | | (3) | | | — | | | — | |
| Total Energy Services | Total Energy Services | | $ | 46,859 | | | $ | (17,982) | | | $ | 0 | | | $ | 28,877 | | Total Energy Services | | $ | 100,613 | | | $ | (34,191) | | | $ | — | | | $ | 66,422 | |
| Natural Gas Distribution | Natural Gas Distribution | | Natural Gas Distribution | |
| Physical commodity contracts | Physical commodity contracts | | $ | 76 | | | $ | (65) | | | $ | 0 | | | $ | 11 | | Physical commodity contracts | | $ | 16 | | | $ | (8) | | | $ | — | | | $ | 8 | |
| Financial commodity contracts | Financial commodity contracts | | 282 | | | (71) | | | 0 | | | 211 | | Financial commodity contracts | | 13 | | | (13) | | | — | | | — | |
| | Total Natural Gas Distribution | Total Natural Gas Distribution | | $ | 358 | | | $ | (136) | | | $ | 0 | | | $ | 222 | | Total Natural Gas Distribution | | $ | 29 | | | $ | (21) | | | $ | — | | | $ | 8 | |
(1)Derivative assets and liabilities are presented on a gross basis on the balance sheet as the Company does not elect balance sheet offsetting under ASC 210-20.
(2)Includes transactions with NAESB netting election, transactions held by FCMs with net margining and transactions with ISDA netting.
(3)Financial collateral includes cash balances at FCMs as well as cash received from or pledged to other counterparties.
(4)Net amounts represent presentation of derivative assets and liabilities if the Company were to elect balance sheet offsetting under ASC 210-20.
New Jersey Resources Corporation
Part I
NOTES TO UNAUDITED CONDENSED CONSOLIDATED FINANCIAL STATEMENTS (Continued)
Energy Services utilizes financial derivatives to economically hedge the gross margin associated with the purchase of physical natural gas to be used for storage injection and its subsequent sale at a later date. The gains or (losses) on the financial transactions that are economic hedges of the cost of the purchased natural gas are recognized prior to the gains or (losses) on the physical transaction, which are recognized in earnings when the natural gas is delivered. Therefore, mismatches between the timing of the recognition of realized gains or (losses) on the financial derivative instruments and gains or (losses) associated with the actual sale of the natural gas that is being economically hedged along with fair value changes in derivative instruments, creates volatility in the results of Energy Services, although the Company's intended economic results relating to the entire transaction are unaffected.
The following table presents the effect of derivative instruments recognized on the Unaudited Condensed Consolidated Statements of Operations for the periods set forth below:
| | (Thousands) | (Thousands) | Location of gain (loss) recognized in income on derivatives | Amount of gain (loss) recognized
in income on derivatives | (Thousands) | Location of gain (loss) recognized in income on derivatives | Amount of gain (loss) recognized
in income on derivatives |
| | Three Months Ended | Six Months Ended | | Three Months Ended | Six Months Ended |
| | March 31, | | March 31, |
| Derivatives not designated as hedging instruments: | Derivatives not designated as hedging instruments: | 2021 | | 2020 | 2021 | | 2020 | Derivatives not designated as hedging instruments: | 2022 | | 2021 | 2022 | | 2021 |
| Energy Services: | Energy Services: | | Energy Services: | |
| Physical commodity contracts | Physical commodity contracts | Operating revenues | $ | 36,419 | | | $ | 12,096 | | $ | 41,671 | | | $ | 21,932 | | Physical commodity contracts | Operating revenues | $ | (11,582) | | | $ | 36,419 | | $ | (11,432) | | | $ | 41,671 | |
| Physical commodity contracts | Physical commodity contracts | Natural gas purchases | 2,650 | | | (1,892) | | (2,404) | | | (3,302) | | Physical commodity contracts | Natural gas purchases | (875) | | | 2,650 | | 630 | | | (2,404) | |
| Financial commodity contracts | Financial commodity contracts | Natural gas purchases | (27,315) | | | 23,319 | | 20,440 | | | 69,412 | | Financial commodity contracts | Natural gas purchases | (31,223) | | | (27,315) | | 29,966 | | | 20,440 | |
| Foreign currency contracts | Foreign currency contracts | Natural gas purchases | 27 | | | (475) | | 227 | | | (360) | | Foreign currency contracts | Natural gas purchases | (14) | | | 27 | | (14) | | | 227 | |
| | Total unrealized and realized gains | $ | 11,781 | | | $ | 33,048 | | $ | 59,934 | | | $ | 87,682 | | |
| Total unrealized and realized (gain) loss | | Total unrealized and realized (gain) loss | $ | (43,694) | | | $ | 11,781 | | $ | 19,150 | | | $ | 59,934 | |
NJNG’s derivative contracts are part of the Company's risk management activities that relate to its natural gas purchases and BGSS incentive programs. At settlement, the resulting gains and/or losses are payable to or recoverable from utility customers and are deferred in regulatory assets or liabilities resulting in no impact to earnings. The following table reflects the gains (losses) gains associated with NJNG's derivative instruments for the periods set forth below:
| | | Three Months Ended | Six Months Ended | | Three Months Ended | Six Months Ended |
| | March 31, | | March 31, |
| (Thousands) | (Thousands) | 2021 | | 2020 | 2021 | | 2020 | (Thousands) | 2022 | | 2021 | 2022 | | 2021 |
| Natural Gas Distribution: | Natural Gas Distribution: | | Natural Gas Distribution: | |
| Physical commodity contracts | Physical commodity contracts | $ | 1,091 | | | $ | 209 | | $ | 1,433 | | | $ | 1,049 | | Physical commodity contracts | $ | 4,538 | | | $ | 1,091 | | $ | 6,234 | | | $ | 1,433 | |
| Financial commodity contracts | Financial commodity contracts | 645 | | | (11,434) | | (3,627) | | | (12,522) | | Financial commodity contracts | 61,485 | | | 645 | | 46,838 | | | (3,627) | |
| Interest rate contracts | 0 | | | (6,692) | | 0 | | | (6,692) | | |
| Total unrealized and realized losses | $ | 1,736 | | | $ | (17,917) | | $ | (2,194) | | | $ | (18,165) | | |
| | Total unrealized and realized gain (loss) | | Total unrealized and realized gain (loss) | $ | 66,023 | | | $ | 1,736 | | $ | 53,072 | | | $ | (2,194) | |
During fiscal 2020, NJR entered into treasury lock transactions to fix the benchmark treasury rate associated with debt issuances that were finalized in 2020. NJR designates its treasury lock contracts as cash flow hedges, therefore, changes in fair value of the effective portion of the hedges are recorded in OCI and upon settlement of the contracts, realized gains and (losses) are reclassified from OCI to interest expense on the Consolidated Statements of Operations. Pre-tax losses of $343,000 and $342,000 were reclassified from OCI into income during the three months ended March 31, 2022 and 2021, respectively, and pre-tax losses of $686,000 and $685,000 were reclassified during the six months ended March 31, 2022 and 2021, respectively.
The following table reflects the effect of derivative instruments designated as cash flow hedges in OCI:
| | | | | | | | | | | | | | | | | | | |
| (Thousands) | Amount of Pre-tax Gain (Loss) Recognized in OCI on Derivatives | Location of Gain (Loss) Reclassified from OCI into Income | Amount of Pre-tax Gain (Loss) Reclassified from OCI into Income | |
| Three Months Ended | | Three Months Ended | | |
| March 31, | | March 31, | | |
| Derivatives in cash flow hedging relationships: | 2021 | 2020 | | 2021 | 2020 | | |
| Interest rate contracts | $ | 0 | | $ | (12,492) | | Interest expense | $ | (342) | | $ | 0 | | | |
| Six Months Ended | | Six Months Ended | | |
| March 31, | | March 31, | | |
| Derivatives in cash flow hedging relationships: | 2021 | 2020 | | 2021 | 2020 | | |
| Interest rate contracts | $ | 0 | | $ | (12,492) | | Interest expense | $ | (685) | | $ | 0 | | | |
New Jersey Resources Corporation
Part I
NOTES TO UNAUDITED CONDENSED CONSOLIDATED FINANCIAL STATEMENTS (Continued)
NJNG and Energy Services had the following outstanding long (short) derivatives as of:
| | | | | | | Volume (Bcf) | | | | | | Volume (Bcf) |
| | | Transaction Type | | | March 31,
2021 | | September 30,
2020 | | | Transaction Type | | | March 31, 2022 | | September 30,
2021 |
| Natural Gas Distribution | Natural Gas Distribution | | Futures | | | 22.1 | | | 23.7 | | Natural Gas Distribution | | Futures | | | 29.6 | | | 22.2 | |
| | | | Physical Commodity | | | 16.6 | | | 6.0 | | | | Physical Commodity | | | 12.8 | | | 7.6 | |
| | Energy Services | Energy Services | | Futures | | | (11.6) | | | (27.5) | | Energy Services | | Futures | | | (0.7) | | | (13.4) | |
| | | Swaps | | | (0.8) | | | (1.8) | | | | Swaps | | | (0.2) | | | (0.3) | |
| | | | Physical Commodity | | | 1.5 | | | 5.0 | | | | Physical Commodity | | | 7.5 | | | 0.6 | |
|
Not included in the above table are Energy Services' net notional amount of foreign currency transactions of approximately $42,000$(20,000) as of March 31, 20212022 and $5.1 million$(123,000) as of September 30, 20202021, and 1,588,0001.5 million and 960,0001.4 million SRECs that were open as of March 31, 20212022 and September 30, 2020,2021, respectively.
New Jersey Resources Corporation
Part I
NOTES TO UNAUDITED CONDENSED CONSOLIDATED FINANCIAL STATEMENTS (Continued)
Broker Margin
Futures exchanges have contract specific margin requirements that require the posting of cash or cash equivalents relating to traded contracts. Margin requirements consist of initial margin that is posted upon the initiation of a position, maintenance margin that is usually expressed as a percent of initial margin, and variation margin that fluctuates based on the daily marked-to-market relative to maintenance margin requirements. The Company maintains separate broker margin accounts for the Natural Gas Distribution and Energy Services segments. The balances are as follows:
| | (Thousands) | (Thousands) | Balance Sheet Location | March 31,
2021 | September 30,
2020 | (Thousands) | Balance Sheet Location | March 31, 2022 | September 30,
2021 |
| Natural Gas Distribution | Natural Gas Distribution | Restricted broker margin accounts | $ | 4,190 | | $ | 13,525 | | Natural Gas Distribution | Restricted broker margin accounts-current assets | $ | 11,617 | | $ | 2,790 | |
| | Energy Services | Energy Services | Restricted broker margin accounts | $ | 41,726 | | $ | 55,919 | | Energy Services | Restricted broker margin accounts-current assets | $ | 38,284 | | $ | 70,050 | |
| | | Restricted broker margin accounts-current liabilities | $ | (2,464) | | $ | — | |
Wholesale Credit Risk
NJNG, Energy Services, Clean Energy Ventures and the Storage and Transportation segment are exposed to credit risk as a result of their sales/wholesale marketing activities. As a result of the inherent volatility in the prices of natural gas commodities, derivatives, SRECs, the market value of contractual positions with individual counterparties could exceed established credit limits or collateral provided by those counterparties. If a counterparty fails to perform the obligations under its contract then the Company could sustain a loss.
The Company monitors and manages the credit risk of its wholesale operations through credit policies and procedures that management believes reduce overall credit risk. These policies include a review and evaluation of current and prospective counterparties' financial statements and/or credit ratings, daily monitoring of counterparties' credit limits and exposure, daily communication with traders regarding credit status and the use of credit mitigation measures, such as collateral requirements and netting agreements. Examples of collateral include letters of credit and cash received for either prepayment or margin deposit. Collateral may be requested due to the Company's election not to extend credit or because exposure exceeds defined thresholds. Most of the Company's wholesale marketing contracts contain standard netting provisions. These contracts include those governed by ISDA and the NAESB. The netting provisions refer to payment netting, whereby receivables and payables with the same counterparty are offset and the resulting net amount is paid to the party to which it is due.
Internally-rated exposure applies to counterparties that are not rated by Fitch or Moody's. In these cases, the counterparty's or guarantor's financial statements are reviewed, and similar methodologies and ratios used by Fitch and/or Moody's are applied to arrive at a substitute rating. Gross credit exposure is defined as the unrealized fair value of physical and financial derivative commodity contracts, plus any outstanding wholesale receivable for the value of natural gas delivered and/or financial derivative commodity contract that has settled for which payment has not yet been received.
New Jersey Resources Corporation
Part I
NOTES TO UNAUDITED CONDENSED CONSOLIDATED FINANCIAL STATEMENTS (Continued)
The following is a summary of gross credit exposures grouped by investment and noninvestment grade counterparties, as of March 31, 2021.2022. The amounts presented below have not been reduced by any collateral received or netting and exclude accounts receivable for NJNG retail natural gas sales and services and Clean Energy Ventures residential solar installations.
| | | | | | | | | | | |
| (Thousands) | Gross Credit Exposure |
| Investment grade | | $ | 128,585128,926 | | |
| Noninvestment grade | | 9,4719,601 | | |
| Internally rated investment grade | | 23,66120,566 | | |
| Internally rated noninvestment grade | | 20,11822,225 | | |
| Total | | $ | 181,835181,318 | | |
Conversely, certain of NJNG's and Energy Services' derivative instruments are linked to agreements containing provisions that would require cash collateral payments from the Company if certain events occur. These provisions vary based upon the terms in individual counterparty agreements and can result in cash payments if NJNG's credit rating were to fall below its current level. Specifically, most, but not all, of these additional payments will be triggered if NJNG's debt is downgraded by the major credit agencies, regardless of investment grade status. In addition, some of these agreements include threshold amounts that would result in additional collateral payments if the values of derivative liabilities were to exceed the maximum values provided for in relevant counterparty agreements. Other provisions include payment features that are not specifically linked to ratings but are based on certain financial metrics.
New Jersey Resources Corporation
Part I
NOTES TO UNAUDITED CONDENSED CONSOLIDATED FINANCIAL STATEMENTS (Continued)
Collateral amounts associated with any of these conditions are determined based on a sliding scale and are contingent upon the degree to which the Company's credit rating and/or financial metrics deteriorate, and the extent to which liability amounts exceed applicable threshold limits. There were no derivative instruments with credit-risk-related contingent features that were in a liability position for which collateral is required as of March 31, 2021.2022. These amounts differ from the respective net derivative liabilities reflected on the Unaudited Condensed Consolidated Balance Sheets because the agreements also include clauses, commonly known as “Rights of Offset,” that would permit the Company to offset its derivative assets against its derivative liabilities for determining additional collateral to be posted, as previously discussed.
6. FAIR VALUE
Fair Value of Assets and Liabilities
The fair value of cash and cash equivalents, accounts receivable, current loan receivables, accounts payable, commercial paper and borrowings under revolving credit facilities are estimated to equal their carrying amounts due to the short maturity of those instruments. Non-current loan receivables are recorded based on what the Company expects to receive, which approximates fair value, in other noncurrent assets on the Unaudited Condensed Consolidated Balance Sheets. The Company regularly evaluates the credit quality and collection profile of its customers to approximate fair value.
The estimated fair value of long-term debt, including current maturities, excluding finance leases, debt issuance costs and solar asset financing obligations, is as follows:
| | (Thousands) | (Thousands) | March 31,
2021 | September 30,
2020 | (Thousands) | March 31, 2022 | September 30,
2021 |
Carrying value (1) (2) (3) | Carrying value (1) (2) (3) | $ | 2,102,845 | | $ | 2,102,845 | | Carrying value (1) (2) (3) | $ | 2,202,845 | | $ | 2,102,845 | |
| Fair market value | Fair market value | $ | 2,259,855 | | $ | 2,417,748 | | Fair market value | $ | 2,137,966 | | $ | 2,288,544 | |
(1)Excludes finance leases of $68.2$33.5 million and $74.2$20.1 million as of March 31, 20212022 and September 30, 2020,2021, respectively.
(2)Excludes NJNG's debt issuance costs of $9.4$10.1 million and $9.2$9.1 million as of March 31, 20212022 and September 30, 2020,2021, respectively.
(3)Excludes NJR's debt issuance costs of $3.3$3.6 million and $3.4$3.3 million as of March 31, 20212022 and September 30, 2020,2021, respectively.
Clean Energy Ventures enters into transactions to sell certain commercial solar assets and lease the assets back for a term specified in the lease. These transactions are considered financing obligations for accounting purposes and are recorded within long-term debt on the Unaudited Condensed Consolidated Balance Sheets. The estimated fair value of solar asset financing obligations as of March 31, 20212022 and September 30, 20202021 was $155.6$121.8 million and $149.2$132.5 million, respectively.
New Jersey Resources Corporation
Part I
NOTES TO UNAUDITED CONDENSED CONSOLIDATED FINANCIAL STATEMENTS (Continued)
The Company utilizes a discounted cash flow method to determine the fair value of its debt. Inputs include observable municipal and corporate yields, as appropriate for the maturity of the specific issue and the Company's credit rating. As of March 31, 2021, NJR2022, the Company discloses its debt within Level 2 of the fair value hierarchy.
Fair Value Hierarchy
NJRThe Company applies fair value measurement guidance to its financial assets and liabilities, as appropriate, which include financial derivatives and physical commodity contracts qualifying as derivatives, investments in equity securities and other financial assets and liabilities. In addition, authoritative accounting literature prescribes the use of a fair value hierarchy that prioritizes the inputs to valuation techniques used to measure fair value based on the source of the data used to develop the price inputs. The hierarchy gives the highest priority to unadjusted quoted prices in active markets for identical assets or liabilities and the lowest priority to inputs that are based on unobservable market data and include the following:
Level 1Unadjusted quoted prices for identical assets or liabilities in active markets. NJR'sThe Company's Level 1 assets and liabilities include exchange traded natural gas futures and options contracts, listed equities and money market funds. Exchange traded futures and options contracts include all energy contracts traded on the NYMEX, CME and ICE that NJRthe Company refers to internally as basis swaps, fixed swaps, futures and financial options that are cleared through a FCM.
Level 2Other significant observable inputs such as interest rates or price data, including both commodity and basis pricing that is observed either directly or indirectly from publications or pricing services. NJR'sThe Company's Level 2 assets and liabilities include over-the-counter physical forward commodity contracts and swap contracts, SREC forward sales or derivatives that are initially valued using observable quotes and are subsequently adjusted to include time value, credit risk or estimated transport pricing components for which no basis price is available. Level 2 financial
New Jersey Resources Corporation
Part I
NOTES TO UNAUDITED CONDENSED CONSOLIDATED FINANCIAL STATEMENTS (Continued)
derivatives consist of transactions with non-FCM counterparties (basis swaps, fixed swaps and/or options). NJNG's treasury lock is also considered Level 2 as valuation is based on quoted market interest and swap rates as inputs to the valuation model. Inputs are verifiable and do not require significant management judgment. For some physical commodity contracts the Company utilizes transportation tariff rates that are publicly available and that it considers to be observable inputs that are equivalent to market data received from an independent source. There are no significant judgments or adjustments applied to the transportation tariff inputs and no market perspective is required. Even if the transportation tariff input were considered to be a “model,” it would still be considered to be a Level 2 input as the data is:
•widely accepted and public;
•non-proprietary and sourced from an independent third party; and
•observable and published.
These additional adjustments are generally not considered to be significant to the ultimate recognized values.
Level 3Inputs derived from a significant amount of unobservable market data. These include NJR'sthe Company's best estimate of fair value and are derived primarily through the use of internal valuation methodologies.
Assets and liabilities measured at fair value on a recurring basis are summarized as follows:
| | | | | | | | | | | | | | | | | | | | | | | | | | | | | | | | |
| Quoted Prices in Active Markets for Identical Assets | Significant Other Observable Inputs | Significant Unobservable Inputs | |
| (Thousands) | (Level 1) | (Level 2) | (Level 3) | Total |
| As of March 31, 2022: | | | | | | | | | | |
| Assets: | | | | | | | | | | |
| Physical commodity contracts | | $ | — | | | | $ | 2,085 | | | | $ | — | | | $ | 2,085 | |
| Financial commodity contracts | | 23,603 | | | | — | | | | — | | | 23,603 | |
| Financial commodity contracts - foreign exchange | | — | | | | 38 | | | | — | | | 38 | |
| | | | | | | | | | |
| Money market funds | | 39 | | | | — | | | | — | | | 39 | |
| Other | | 1,998 | | | | — | | | | — | | | 1,998 | |
| Total assets at fair value | | $ | 25,640 | | | | $ | 2,123 | | | | $ | — | | | $ | 27,763 | |
| Liabilities: | | | | | | | | | | |
| Physical commodity contracts | | $ | — | | | | $ | 41,242 | | | | $ | — | | | $ | 41,242 | |
| Financial commodity contracts | | 23,050 | | | | 538 | | | | — | | | 23,588 | |
| Financial commodity contracts - foreign exchange | | — | | | | 18 | | | | — | | | 18 | |
| | | | | | | | | | |
| Total liabilities at fair value | | $ | 23,050 | | | | $ | 41,798 | | | | $ | — | | | $ | 64,848 | |
| | | | | | | | | | | | | | | | | | | | | | | | | | | | | | | | |
| Quoted Prices in Active Markets for Identical Assets | Significant Other Observable Inputs | Significant Unobservable Inputs | |
| (Thousands) | (Level 1) | (Level 2) | (Level 3) | Total |
| As of September 30, 2021: | | | | | | | | | | |
| Assets: | | | | | | | | | | |
| Physical commodity contracts | | $ | — | | | | $ | 3,187 | | | | $ | — | | | $ | 3,187 | |
| Financial commodity contracts | | 35,340 | | | | — | | | | — | | | 35,340 | |
| Financial commodity contracts - foreign exchange | | — | | | | 127 | | | | — | | | 127 | |
| | | | | | | | | | |
| Money market funds | | 41 | | | | — | | | | — | | | 41 | |
| Other | | 1,815 | | | | — | | | | — | | | 1,815 | |
| Total assets at fair value | | $ | 37,196 | | | | $ | 3,314 | | | | $ | — | | | $ | 40,510 | |
| Liabilities: | | | | | | | | | | |
| Physical commodity contracts | | $ | — | | | | $ | 37,845 | | | | $ | — | | | $ | 37,845 | |
| Financial commodity contracts | | 62,188 | | | | 606 | | | | — | | | 62,794 | |
| Financial commodity contracts - foreign exchange | | — | | | | 3 | | | | — | | | 3 | |
| Total liabilities at fair value | | $ | 62,188 | | | | $ | 38,454 | | | | $ | — | | | $ | 100,642 | |
New Jersey Resources Corporation
Part I
NOTES TO UNAUDITED CONDENSED CONSOLIDATED FINANCIAL STATEMENTS (Continued)
Assets and liabilities measured at fair value on a recurring basis are summarized as follows:
| | | | | | | | | | | | | | | | | | | | | | | | | | | | | | | | |
| Quoted Prices in Active Markets for Identical Assets | Significant Other Observable Inputs | Significant Unobservable Inputs | |
| (Thousands) | (Level 1) | (Level 2) | (Level 3) | Total |
| As of March 31, 2021: | | | | | | | | | | |
| Assets: | | | | | | | | | | |
| Physical commodity contracts | | $ | 0 | | | | $ | 5,209 | | | | $ | 0 | | | $ | 5,209 | |
| Financial commodity contracts | | 13,751 | | | | 193 | | | | 0 | | | 13,944 | |
| Financial commodity contracts - foreign exchange | | 0 | | | | 257 | | | | 0 | | | 257 | |
| | | | | | | | | | |
| | | | | | | | | | |
| Money market funds | | 50,368 | | | | 0 | | | | 0 | | | 50,368 | |
| Other | | 1,818 | | | | 0 | | | | 0 | | | 1,818 | |
| Total assets at fair value | | $ | 65,937 | | | | $ | 5,659 | | | | $ | 0 | | | $ | 71,596 | |
| Liabilities: | | | | | | | | | | |
| Physical commodity contracts | | $ | 0 | | | | $ | 36,506 | | | | $ | 0 | | | $ | 36,506 | |
| Financial commodity contracts | | 7,661 | | | | 0 | | | | 0 | | | 7,661 | |
| Financial commodity contracts - foreign exchange | | 0 | | | | 29 | | | | 0 | | | 29 | |
| | | | | | | | | | |
| Total liabilities at fair value | | $ | 7,661 | | | | $ | 36,535 | | | | $ | 0 | | | $ | 44,196 | |
| As of September 30, 2020: | | | | | | | | | | |
| Assets: | | | | | | | | | | |
| Physical commodity contracts | | $ | 0 | | | | $ | 7,796 | | | | $ | 0 | | | $ | 7,796 | |
| Financial commodity contracts | | 18,279 | | | | 500 | | | | 0 | | | 18,779 | |
| Financial commodity contracts - foreign exchange | | 0 | | | | 84 | | | | 0 | | | 84 | |
| | | | | | | | | | |
| Money market funds | | 112,291 | | | | 0 | | | | 0 | | | 112,291 | |
| Other | | 1,840 | | | | 0 | | | | 0 | | | 1,840 | |
| Total assets at fair value | | $ | 132,410 | | | | $ | 8,380 | | | | $ | 0 | | | $ | 140,790 | |
| Liabilities: | | | | | | | | | | |
| Physical commodity contracts | | $ | 0 | | | | $ | 32,517 | | | | $ | 0 | | | $ | 32,517 | |
| Financial commodity contracts | | 14,593 | | | | 0 | | | | 0 | | | 14,593 | |
| Financial commodity contracts - foreign exchange | | 0 | | | | 107 | | | | 0 | | | 107 | |
| Total liabilities at fair value | | $ | 14,593 | | | | $ | 32,624 | | | | $ | 0 | | | $ | 47,217 | |
7. INVESTMENTS IN EQUITY INVESTEES
NJR'sThe Company's investments in equity method investees include the following as of:
| | (Thousands) | (Thousands) | March 31,
2021 | September 30,
2020 | (Thousands) | March 31, 2022 | September 30,
2021 |
Steckman Ridge (1) | Steckman Ridge (1) | $ | 111,435 | | $ | 112,378 | | Steckman Ridge (1) | $ | 108,501 | | $ | 109,050 | |
PennEast (2) | PennEast (2) | 103,086 | | 95,997 | | PennEast (2) | 1,479 | | 5,479 | |
| Total | Total | $ | 214,521 | | $ | 208,375 | | Total | $ | 109,980 | | $ | 114,529 | |
(1)Includes loans with a total outstanding principal balance of $70.4 million for both March 31, 20212022 and September 30, 2020,2021, which accrue interest at a variable rate that resets quarterly and are due October 1, 2023.
(2)Includes a deferred tax component related to AFUDC equity of $7.6 million and $4.6 million for March 31, 2021 and September 30, 2020, respectively.
Steckman Ridge
The Company holds a 50 percent equity method investment in Steckman Ridge, a jointly owned and controlled natural gas storage facility located in Bedford County, Pennsylvania. Due to the expiration of a customer contract in October 2020, the Company evaluated its investment inNJNG and Energy Services have entered into storage and park and loan agreements with Steckman RidgeRidge. See Note 15. Related Party Transactions for other-than-temporary impairment and determined an impairment charge was not necessary.
New Jersey Resources Corporation
Part I
NOTES TO UNAUDITED CONDENSED CONSOLIDATED FINANCIAL STATEMENTS (Continued)
The fair value of the Company’s investment in Steckman Ridge was determined using a discounted cash flow method and utilized management’s best estimates and assumptions related to expected future results, including the price and capacity of firm natural gas storage contracting, operations and maintenance costs, the nature and timing of major maintenance and capital investment, and discount rates. Fair value determinations require considerable judgment and are sensitive to changes in underlying assumptions and other factors. As a result, it is reasonably possible that unfavorable developments, such as the failure to execute storage contracts and other services for available capacity at anticipated price levels could result in an other-than temporary impairment charge in the Unaudited Condensed Consolidated Financial Statements.
PennEast
The Company, through its subsidiary NJR PipelineMidstream Company, is a 20 percent investor in PennEast, a partnership whose purpose iswas to construct and operate a 120-mile natural gas pipeline that will extendwould have extended from northeast Pennsylvania to western New Jersey.
During the third quarter of fiscal 2021, the PennEast received a Certificatepartnership determined that this project was no longer supported, and all further development ceased. The Company recognized an other-than-temporary impairment charge of Public Convenience and Necessity for$92.0 million, or approximately $74.5 million, net of income taxes, which represents the project from FERC on January 19, 2018.best estimate of the salvage value of the remaining assets of the project. Other-than-temporary impairments are recorded in equity in earnings (losses) of affiliates in the Unaudited Condensed Consolidated Statements of Operations.
On September 10, 2019,December 16, 2021, the Third Circuit issued anFERC dismissed PennEast’s pending applications. The order overturningvacates the United States District Courtcertificate authorization for the DistrictPennEast pipeline project in light of New Jersey’s order granting PennEast condemnation and immediate access in accordance with the Natural Gas ActPennEast’s response to certain propertiesFERC staff’s November 23, 2021 request for a status update, in which PennEast informed the State of New Jersey holds an interest. A Petition for Rehearing was denied byCommission it is no longer developing the Third Circuit on November 5, 2019.project.
On October 8, 2019,March 10, 2022, following the NJDEP issuedsale of certain project related assets and refunds of interconnection fees received from interstate pipelines, the PennEast board of managers approved a letter indicating that it deemed PennEast’s freshwater wetlands permit applicationcash distribution to be administratively incomplete and closedmembers of the matter without prejudice. On October 11, 2019, PennEast submitted a letter to the NJDEP objecting to its position that the application is administratively incomplete. PennEast's objections were rejectedpartnership totaling $4.0 million per partner. The return of capital was received by the NJDEPCompany on November 18, 2019.
On October 4, 2019, PennEast filed a petition for Declaratory Order with FERC requesting an interpretation of the eminent domain authority of a FERC certificate holder under the Natural Gas Act. The Declaratory Order was granted on January 30, 2020.
On January 30, 2020, PennEast filed an amendment with FERC to construct the PennEast pipeline in 2 phases. Phase one consists of construction of a 68-mile pipeline in Pennsylvania from the eastern Marcellus Shale region in Luzerne County that would terminate in Northampton County. Phase two includes construction ofMarch 31, 2022, and reduced the remaining original certificated route in Pennsylvania and New Jersey. Construction is expected to begin following approval by FERCcarrying value of the phased approach and receipt of any remaining governmental and regulatory permits.
On February 18, 2020, PennEast filed a writ of certiorari with the Supreme Court of the United States to review the September 10, 2019 Third Circuit decision.
On June 29, 2020, the Supreme Court requested that the Solicitor General of the United States file a brief that expresses the views on the question of the use of eminent domain to acquire state owned lands for pipeline construction. The Solicitor General filed its brief with the Supreme Court on December 9, 2020.
The State of New Jersey filed a brief with the Supreme Court on December 23, 2020 in response to the brief of the Solicitor General.
On February 3, 2021, the Supreme Court granted the petition for a writ of certiorari. The matter was argued before the Supreme Court on April 28, 2021.
The Company evaluated itsequity method investment in PennEast for an other-than-temporary impairment and determined an impairment charge was not necessary. It is reasonably possible that future unfavorable developments, such as a reduced likelihood of success from development options and legal outcomes, estimated increases in construction costs, increasesto $1.5 million in the discount rate, or further significant delays, could result in an impairment of the Company's equity method investment. Also, the use of alternate judgments and assumptions could result in a different calculation of fair value, which could ultimately result in the recognition of an impairment charge.
New Jersey Resources Corporation
Part I
NOTES TO UNAUDITED CONDENSED CONSOLIDATED FINANCIAL STATEMENTS (Continued)
8. EARNINGS PER SHARE
The following table presents the calculation of the Company's basic and diluted earnings per share for:
| | | Three Months Ended | Six Months Ended | | Three Months Ended | Six Months Ended |
| | March 31, | | March 31, |
| (Thousands, except per share amounts) | (Thousands, except per share amounts) | 2021 | 2020 | 2021 | 2020 | (Thousands, except per share amounts) | 2022 | 2021 | 2022 | 2021 |
| Net income, as reported | Net income, as reported | $ | 149,809 | | $ | 73,846 | | $ | 230,854 | | $ | 149,598 | | Net income, as reported | $ | 96,035 | | $ | 149,809 | | $ | 207,347 | | $ | 230,854 | |
| Basic earnings per share | Basic earnings per share | | Basic earnings per share | |
| Weighted average shares of common stock outstanding-basic | Weighted average shares of common stock outstanding-basic | 96,248 | | 95,584 | | 96,181 | | 93,747 | | Weighted average shares of common stock outstanding-basic | 96,068 | | 96,248 | | 96,006 | | 96,181 | |
| Basic earnings per common share | Basic earnings per common share | $1.56 | $0.78 | $2.40 | $1.60 | Basic earnings per common share | $1.00 | $1.56 | $2.16 | $2.40 |
| Diluted earnings per share | Diluted earnings per share | | Diluted earnings per share | |
| Weighted average shares of common stock outstanding-basic | Weighted average shares of common stock outstanding-basic | 96,248 | | 95,584 | | 96,181 | | 93,747 | | Weighted average shares of common stock outstanding-basic | 96,068 | | 96,248 | | 96,006 | | 96,181 | |
| Equity forward sale agreement (1) | 0 | | 0 | | 0 | | 4 | | |
Other (2) | 370 | | 306 | | 417 | | 322 | | |
Incremental shares (1) | | Incremental shares (1) | 448 | | 370 | | 474 | | 417 | |
| Weighted average shares of common stock outstanding-diluted | Weighted average shares of common stock outstanding-diluted | 96,618 | | 95,890 | | 96,598 | | 94,073 | | Weighted average shares of common stock outstanding-diluted | 96,516 | | 96,618 | | 96,480 | | 96,598 | |
Diluted earnings per common share (3) | $1.55 | $0.77 | $2.39 | $1.59 | |
Diluted earnings per common share (2) | | Diluted earnings per common share (2) | $1.00 | $1.55 | $2.15 | $2.39 |
(1)See Note 14. Common Stock Equity for details regarding the forward sale agreement.
(2)ConsistIncremental shares consist primarily of unvested stock awards and performance shares.
(3)(2)There were anti-dilutive shares of 24,101 and 30,708 excluded from the calculation of diluted earnings per share related to the equity forward sale agreement during the three months ended March 31, 2021 and 2020. There were anti-dilutive shares of 65,334 excluded from the calculation of diluted earnings per share related to thean equity forward sale agreement during the three and six months ended March 31, 2021. There were 0 anti-dilutive shares excluded during the six months ended March 31, 2020.2021, respectively.
New Jersey Resources Corporation
Part I
NOTES TO UNAUDITED CONDENSED CONSOLIDATED FINANCIAL STATEMENTS (Continued)
9. DEBT
NJR and NJNG finance working capital requirements and capital expenditures through various short-term debt and long-term financing arrangements, including a commercial paper program and committed unsecured credit facilities.
Credit Facilities and Short-term Debt
On February 8, 2022, NJR entered into a 364-day $150 million term loan credit agreement with an interest rate based on SOFR plus 0.85 percent and expires on February 7, 2023. The Company borrowed $50 million on February 9, 2022 and $100 million on February 14, 2022.
A summary of NJR's credit facility and term loan credit agreement and NJNG's commercial paper program and credit facility are as follows:
| | (Thousands) | (Thousands) | March 31,
2021 | | September 30,
2020 | | Expiration Dates | (Thousands) | March 31, 2022 | | September 30,
2021 | | Expiration Dates |
| NJR | NJR | | NJR | |
Bank revolving credit facilities (1) | $ | 425,000 | | | $ | 425,000 | | | December 2023 | |
Bank revolving credit facility (1) | | Bank revolving credit facility (1) | $ | 500,000 | | | $ | 500,000 | | | September 2026 |
| Notes outstanding at end of period | Notes outstanding at end of period | $ | 8,500 | | | $ | 125,350 | | | Notes outstanding at end of period | $ | 152,210 | | | $ | 219,100 | | |
| Weighted average interest rate at end of period | Weighted average interest rate at end of period | 1.75 | % | | 1.49 | % | | Weighted average interest rate at end of period | 2.02 | % | | 1.05 | % | |
Amount available at end of period (2) | Amount available at end of period (2) | $ | 406,206 | | | $ | 289,356 | | | Amount available at end of period (2) | $ | 334,325 | | | $ | 270,312 | | |
Bank revolving credit facilities (1) | $ | 0 | | | $ | 250,000 | | | |
| Notes outstanding at end of period | $ | 0 | | | $ | 0 | | | |
| Bank term loan credit agreement | | Bank term loan credit agreement | $ | 150,000 | | | $ | — | | | February 2023 |
| Loans outstanding at end of period | | Loans outstanding at end of period | $ | 150,000 | | | $ | — | | |
| Weighted average interest rate at end of period | Weighted average interest rate at end of period | 0 | % | | 0 | % | | Weighted average interest rate at end of period | 1.04 | % | | — | % | |
Amount available at end of period (2) | Amount available at end of period (2) | $ | 0 | | | $ | 250,000 | | | Amount available at end of period (2) | $ | — | | | $ | — | | |
| NJNG | NJNG | | NJNG | |
Bank revolving credit facilities (3) | $ | 250,000 | | | $ | 250,000 | | | December 2023 | |
| Commercial paper outstanding at end of period | $ | 0 | | | $ | 0 | | | |
Bank revolving credit facility (3) | | Bank revolving credit facility (3) | $ | 250,000 | | | $ | 250,000 | | | September 2026 |
| Commercial paper and notes outstanding at end of period | | Commercial paper and notes outstanding at end of period | $ | — | | | $ | 158,200 | | |
| Weighted average interest rate at end of period | Weighted average interest rate at end of period | 0 | % | | 0 | % | | Weighted average interest rate at end of period | — | % | | 0.17 | % | |
Amount available at end of period (4) | Amount available at end of period (4) | $ | 249,269 | | | $ | 249,269 | | | Amount available at end of period (4) | $ | 249,269 | | | $ | 91,069 | | |
(1)Committed credit facilities, which require commitment fees of 0.0750.10 percent on the unused amounts.
(2)Letters of credit outstanding total $10.3$13.5 million for bothat March 31, 20212022 and $10.6 million at September 30, 2020,2021, which reduces the amount available by the same amount.
(3)Committed credit facilities, which require commitment fees of 0.075 percent on the unused amounts.
(4)Letters of credit outstanding total $731,000 forat both March 31, 20212022 and September 30, 2020,2021, which reduces the amount available by the same amount.
New Jersey Resources Corporation
Part I
NOTES TO UNAUDITED CONDENSED CONSOLIDATED FINANCIAL STATEMENTS (Continued)
On April 24, 2020, NJR entered into a 364-day $250 million revolving credit facility with an interest rate based on LIBOR plus 1.625 percent. After six months, all outstanding amounts under the credit facility would convert to a term loan and would be due on April 23, 2021. In connection with entry into this credit facility, all outstanding borrowings under NJR's December 13, 2019, $150 million revolving line of credit facility were repaid. On October 24, 2020, there was 0 balance outstanding on the $250 million credit facility. As a result, the credit facility was considered terminated.
Amounts available under credit facilities are reduced by bank or commercial paper borrowings, as applicable, and any outstanding letters of credit. Neither NJNG nor the results of its operations are obligated or pledged to support the NJR credit facility or debt shelf facilities.term loan.
Long-term Debt
NJR
On February 16, 2022, NJR signed a commitment letter with a financial institution to refinance $50 million of its Senior Unsecured Notes that are currently scheduled to mature in September 2022. The new Senior Unsecured Note will be financed over a 12-year term with an interest rate of 3.64 percent maturing in September 2034.
NJNG
On October 28, 2021, NJNG entered into a Note Purchase Agreement for $100 million of its senior notes, of which $50 million were issued at an interest rate of 2.97 percent, maturing in 2051, and $50 million were issued at an interest rate of 3.07 percent, maturing in 2061. The senior notes are secured by an equal principal amount of NJNG’s FMBs issued under NJNG’s Mortgage Indenture.
New Jersey Resources Corporation
Part I
NOTES TO UNAUDITED CONDENSED CONSOLIDATED FINANCIAL STATEMENTS (Continued)
NJNG received $4.0$17.3 million in December 2019,during the six months ended March 31, 2022, in connection with the sale leaseback of its natural gas meters. NJNG records a capitalfinancing lease obligation that is paid over the term of the lease and has the option to purchase the meters back at fair value upon expiration of the lease. NJNG exercised early purchase options with respect to certain outstanding meter leases by making final principal payments of $1.2 million for both the six months ended March 31, 2021 and 2020. There were no natural gas meter sale leasebacks recorded during the six months ended March 31, 2021. NJNG exercised early purchase options with respect to meter leases by making final principal payments of $1.1 million and $1.2 million during the six months ended March 31, 2022 and 2021, respectively.
Clean Energy Ventures
Clean Energy Ventures enters into transactions to sell the commercial solar assets concurrent with agreements to lease the assets back over a period of five to 15 years. These transactions are considered failed sale leasebackstreated as financing obligations for accounting purposes and are therefore treated as financing obligations, which are typically secured by the renewable energy facility asset and its future cash flows from SREC, TRECsRECs and energy sales. ITCs and other tax benefits associated with these solar projects are transferred to the buyer, if applicable.applicable; however, the lease payments are structured so that Clean Energy Ventures is compensated for the transfer of the related tax incentives. Clean Energy Ventures continues to operate the solar assets, including related expenses, and retain the revenue generated from SRECsRECs and energy sales, and has the option to renew the lease or repurchase the assets sold at the end of the lease term. In December 2020,During the six months ended March 31, 2022 and 2021, Clean Energy Ventures received proceeds of $3.3 million and $12.1 million, respectively, in connection with the sale leaseback of two commercial solar projects. Clean Energy Ventures did 0t receiveThe proceeds related toreceived were recognized as a financing obligation on the sale leaseback of commercial solar assets during the six months ended March 31, 2020.Unaudited Condensed Consolidated Balance Sheets.
10. EMPLOYEE BENEFIT PLANS
Pension and Other Postemployment Benefit Plans
The components of the net periodic cost for pension benefits, including the Company's Pension Equalization Plan, and OPEB costs (principally health care and life insurance) for employees and covered dependents were as follows:
| | | Pension | OPEB | | Pension | OPEB |
| | Three Months Ended | Six Months Ended | Three Months Ended | Six Months Ended | | Three Months Ended | Six Months Ended | Three Months Ended | Six Months Ended |
| | March 31, | | March 31, |
| (Thousands) | (Thousands) | 2021 | 2020 | 2021 | 2020 | 2021 | 2020 | 2021 | 2020 | (Thousands) | 2022 | 2021 | 2022 | 2021 | 2022 | 2021 | 2022 | 2021 |
| Service cost | Service cost | $ | 2,183 | | $ | 2,055 | | $ | 4,365 | | $ | 4,111 | | $ | 1,211 | | $ | 1,072 | | $ | 2,422 | | $ | 2,427 | | Service cost | $ | 2,073 | | $ | 2,183 | | $ | 4,146 | | $ | 4,365 | | $ | 1,076 | | $ | 1,211 | | $ | 2,152 | | $ | 2,422 | |
| Interest cost | Interest cost | 2,278 | | 2,646 | | 4,556 | | 5,293 | | 1,517 | | 1,509 | | 3,035 | | 3,513 | | Interest cost | 2,408 | | 2,278 | | 4,816 | | 4,556 | | 1,589 | | 1,517 | | 3,178 | | 3,035 | |
| Expected return on plan assets | Expected return on plan assets | (4,851) | | (5,232) | | (10,075) | | (10,289) | | (1,565) | | (1,695) | | (3,248) | | (3,255) | | Expected return on plan assets | (5,318) | | (4,851) | | (10,637) | | (10,075) | | (1,894) | | (1,565) | | (3,788) | | (3,248) | |
| Recognized actuarial loss | Recognized actuarial loss | 2,861 | | 2,466 | | 5,723 | | 5,212 | | 1,978 | | 930 | | 3,955 | | 3,721 | | Recognized actuarial loss | 2,186 | | 2,861 | | 4,372 | | 5,723 | | 1,421 | | 1,978 | | 2,842 | | 3,955 | |
| Prior service cost (credit) amortization | Prior service cost (credit) amortization | 26 | | 26 | | 51 | | 51 | | (45) | | (50) | | (90) | | (99) | | Prior service cost (credit) amortization | 26 | | 26 | | 51 | | 51 | | (36) | | (45) | | (72) | | (90) | |
| | Net periodic benefit cost | Net periodic benefit cost | $ | 2,497 | | $ | 1,961 | | $ | 4,620 | | $ | 4,378 | | $ | 3,096 | | $ | 1,766 | | $ | 6,074 | | $ | 6,307 | | Net periodic benefit cost | $ | 1,375 | | $ | 2,497 | | $ | 2,748 | | $ | 4,620 | | $ | 2,156 | | $ | 3,096 | | $ | 4,312 | | $ | 6,074 | |
The Company does not expect to be required to make additional contributions to fund the pension plans during fiscal 2020 or 20212022 based on current actuarial assumptions; however, funding requirements are uncertain and can depend significantly on changes in actuarial assumptions, returns on plan assets and changes in the demographics of eligible employees and covered dependents. In addition, as in the past, the Company may elect to make contributions in excess of the minimum required amount to the plans. There were 0no discretionary contributions made during the six months ended March 31, 20212022 and 2020.2021.
There are no federal requirements to pre-fund OPEB benefits. However, the Company is required to fund certain amounts due to regulatory agreements with the BPU and estimates that it will contribute between $5 million and $10 million over each of the next five years. Additional contributions may be required based on market conditions and changes to assumptions.
New Jersey Resources Corporation
Part I
NOTES TO UNAUDITED CONDENSED CONSOLIDATED FINANCIAL STATEMENTS (Continued)
The Company's OPEB liability was revalued for changes related to the Affordable Care Act-mandated excise tax applicable to high-cost health plans, commonly known as the Cadillac Tax. The Company applied a practical expedient to remeasure the plan assets and obligations as of December 31, 2019, which was the nearest calendar month-end date. The impact of the revaluation of the OPEB liability was recorded as of January 1, 2020.
11. INCOME TAXES
ASC Topic 740, Income Taxes requires the use of an estimated annual effective tax rate for purposes of determining the income tax provision during interim reporting periods. In calculating its estimated annual effective tax rate, NJRthe Company considers forecasted annual pre-tax income and estimated permanent book versus tax differences. Adjustments to the effective tax rate and management's estimates will occur as information and assumptions change.
New Jersey Resources Corporation
Part I
NOTES TO UNAUDITED CONDENSED CONSOLIDATED FINANCIAL STATEMENTS (Continued)
Changes in tax laws or tax rates are recognized in the financial reporting period that includes the enactment date, the date in which the act is signed into law.
NJRThe Company evaluates its tax positions to determine the appropriate accounting and recognition of potential future obligations associated with unrecognized tax benefits. A tax benefit claimed, or expected to be claimed, on a tax return may be recognized if it is more likely than not that the position will be upheld upon examination by the applicable taxing authority. Interest and penalties related to unrecognized tax benefits, if any, are recognized within income tax expense and accrued interest, and penalties are recognized within other noncurrent liabilities on the Unaudited Condensed Consolidated Balance Sheets.
The Company evaluates certain tax benefits that have been recorded in the financial statements for uncertainties. During fiscal 2019 the Company concluded that a portion of tax benefits were uncertain at this time. As a result, the Company recorded a reserve that was included in accrued taxes on the Unaudited Condensed Consolidated Balance Sheets. During fiscal 2021, a tax audit was completed and the positions that the prior tax reserves related to are now considered effectively settled and the tax reserve has been released. As a result of the change in the Company's method of accounting for ITCs from the flow through method to the deferral method, which was effective October 1, 2020, the settlement of the reserve was recorded as an adjustment to nonutility plant and equipment, at cost on the Unaudited Condensed Consolidated Balance Sheets.
The reserve for uncertain tax benefits is as follows:
| | | | | | | | | |
| (Thousands) | March 31,
2021 | September 30,
2020 | |
| Balance at October 1, | $ | 4,930 | | $ | 4,930 | | |
| Settlements | (4,930) | | 0 | | |
| Balance at period end | $ | 0 | | $ | 4,930 | | |
The tax benefits related to fiscal tax years open to examination by the IRS may be subject to subsequent adjustments.
On March 27, 2020, the President of the U.S. signed the CARES Act, which is aimed at providing emergency assistance and health care for individuals, families, and businesses affected by the COVID-19 pandemic and generally supporting the U.S. economy. The CARES Act, among other things, includes several business tax provisions which include, but are not limited to modifications of federal net operating loss carrybacks and deductibility, changes to prior year refundable alternative minimum tax liabilities, increase of limitations on business interest deductions from 30 percent to 50 percent of earnings before interest, taxes, depreciation, and amortization, technical corrections of the classification of qualified improvement property making them eligible for bonus depreciation, increase of the limits on charitable contribution deductions from 10 percent to 25 percent of adjusted taxable income, modifications of the treatment of federal loans, loan guarantees, and other investments, suspension of industry specific excise taxes, deferral of the company portion of OASDI, and implementation of a refundable employee retention tax credit.
The CARES Act provides for the delay in the required deposit of the employer portion of the OASDI payroll tax from the date of enactment through the end of 2020. Of the taxes that the Company can defer, 50 percent of the deferred taxes are required to be deposited by the end of 2021 and the remaining 50 percent are required to be deposited by the end of 2022. Additionally, The CARES Act provides a refundable tax credit, the employee retention tax credit, to certain employers who are ordered by a competent governmental authority to suspend or reduce business operations due to concern about the spread of COVID-19 or suffered a significant decline in the business during a calendar quarter during 2020 compared to the same calendar quarter during the previous year. As of March 31, 2021 and September 30, 2020, the Company deferred $5.1 million and $3.1 million, respectively, related to the employer portion of the OASDI tax.
New Jersey Resources Corporation
Part I
NOTES TO UNAUDITED CONDENSED CONSOLIDATED FINANCIAL STATEMENTS (Continued)
On March 11, 2021, the President of the U.S. signed the American Rescue Plan Act of 2021, which is primarily an economic stimulus package. It also expanded the scope of Section 162(m) of the Internal Revenue Code, which imposes a $1 million deduction limit on compensation paid to covered employees from the top five officers to include the additional top five highest paid employees for tax years beginning after December 31, 2026.
Effective Tax Rate
The forecasted effective tax rates were 19.922.3 percent and 19.419.9 percent, for the six months ended March 31, 20212022 and 2020,2021, respectively.
To the extent there are discrete tax items that are not included in the forecasted effective tax rate, the actual effective tax rate may differ from the estimated annual effective tax rate. During the six months ended March 31, 2022 and 2021, discrete items totaled approximately $(166,000) and $(145,000), respectively, related to excess tax expense associated with the vesting of share-based awards. During the six months ended March 31, 2020, discrete items totaled $2.7 million related to a revaluation of certain state deferred tax assets and liabilities as a result of a change in the New Jersey state apportionment factor and excess tax benefits(benefits) associated with the vesting of share-based awards. NJR’s actual effective tax rate was 19.722.3 percent and 18.019.7 percent during the six months ended March 31, 20212022 and 2020,2021, respectively.
Other Tax Items
As of March 31, 20212022 and September 30, 2020, the Company has federal income tax net operating losses of approximately $134.0 million. Federal net operating losses can generally be carried back two years and forward 20 years and will begin to expire in fiscal 2036, with the remainder expiring by 2038. The Company expects to exercise its ability to carryback federal net operating losses to offset taxable income in prior periods.
For the net operating losses it expects to carryback, the Company estimated the portion considered refundable and recorded receivables of approximately $22.8 million as of March 31, 2021, and September 30, 2020, as a component of other noncurrent assets on the Unaudited Condensed Consolidated Balance Sheets. Upon filing amended federal income tax returns to carryback its remaining federal net operating losses totaling $24.1 million, the Company will reduce its taxable income in those periods and recapture ITCs of the same amount that were previously utilized to offset taxable income.
In addition, as of March 31, 2021 and September 30, 2020, the Company has tax credit carryforwards of approximately $193.2$227.1 million and $195.2$224.2 million, respectively, which each have a life of 20 years. When the Company carries back the federal net operating losses noted above, it expects to recapture investment tax credits totaling $24.1 million. These recaptured tax credits are in addition to the $193.2 million and will be carried forward to offset future taxable income. The Company expects to utilize this entire carryforward prior to expiration, which would begin in fiscal 2034.2035.
As of March 31, 20212022 and September 30, 2020,2021, the Company has state income tax net operating losses of approximately $442.4$404.8 million and $487.7$554.6 million, respectively. These state net operating losses have varying carry-forward periods dictated by the state in which they were incurred; these state carry-forward periods range from seven to 20 years and would beginbegan to expire in fiscal 2021, with the majority expiring after 2035. The Company expects to utilize this entire carryforward, other than as described below.
The impairment of the equity method investment in PennEast created potential net capital loss attributes totaling approximately $61.8 million, which can only be utilized to offset capital gains income, and can be carried back three years and forward five years prior to expiration.
As of March 31, 2021 and September 30, 2020,2022, the Company has a valuation allowance totaling $23.7 million comprised of $17.6approximately $17.3 million which is primarily related to the recognition of state net operating loss carryforwards, which primarily relate to New Jersey and approximately $6.4 million related to potential capital loss carryforwards resulting from the impairment of the equity method investment in New Jersey.PennEast, which the Company believes may not be fully utilized prior to expiration. As of September 30, 2021, the Company had a valuation allowance totaling $23.6 million related to the state net operating loss carryforwards and the potential capital loss carryforwards resulting from the impairment of the equity method investment, as previously discussed.
The Consolidated Appropriations Act extended the 30 percent ITC for solar property that is under construction on or before December 31, 2019. Projects placed in service after December 31, 2019, may also qualify for a 30 percent federal ITC if five percent or more of the total costs of a solar property are incurred before the end of the applicable year and there are continuous efforts to advance towards completion of the project, based on the IRS guidance around ITC safe harbor determination. The credit declined to 26 percent for property under construction before the end of 2020. The Consolidated Appropriations Act, 2021 extended the 26 percent tax credit for property under construction during 2021 and 2022. The credit will drop to 22 percent for property under construction before the end of 2023. After 2023 the ITC will be reduced to 10 percent.
12. LEASES
Lessee Accounting
The Company determines if an arrangement is a lease at inception based on whether the Company has the right to control the use of an identified asset, the right to obtain substantially all of the economic benefits from the use of the asset and the right to direct the use of the asset andasset. After the criteria is satisfied, the Company accounts for these arrangements as leases in accordance
New Jersey Resources Corporation
Part I
NOTES TO UNAUDITED CONDENSED CONSOLIDATED FINANCIAL STATEMENTS (Continued)
with ASC 842, Leases. Right-of-use assets represent the Company’s right to use the underlying asset for the lease term and lease liabilities represent the Company's obligation to make lease payments arising from the lease. Right-of-use assets and liabilities are recognized at the lease commencement date based on the present value of lease payments over the lease term, including payments at commencement that depend on an index or rate. Most leases in which the Company is the lessee do not have a readily determinable implicit rate, so an incremental borrowing rate, based on the information available at the lease commencement date, is utilized to determine the present value of lease payments. When a secured borrowing rate is not readily available, unsecured borrowing rates are adjusted for the effects of collateral to determine the incremental borrowing rate. The Company uses the implicit rate for agreements in which it is a lessor. The Company has not entered into any material agreements in which it is a lessor. Lease expense and lease income are recognized on a straight-line basis over the lease term for operating leases.
New Jersey Resources Corporation
Part I
NOTES TO UNAUDITED CONDENSED CONSOLIDATED FINANCIAL STATEMENTS (Continued)
The Company’s lease agreements primarily consist of commercial solar land leases, storage and capacity leases, equipment and real property, including land and office facilities, office equipment and the sale leaseback of its natural gas meters.
Certain leases contain escalation provisions for inflation metrics. The storage leases contain a variable payment component that relates to the change in the inflation metrics that are not known past the current payment period. The variable components of these lease payments are excluded from the lease payments that are used to determine the related right-of-use lease asset and liability. The variable portion of these leases are recognized as leasing expenses when they are incurred. The capacity lease payments are fully variable and based on the amount of natural gas stored in the storage caverns.
Generally, the Company’s solar land leaseslease terms are between 1520 and 3550 years and may include multiple options to extend the terms for an additional five to 1020 years. The Company’s office leases vary in duration, ranging from onetwo to 2517 years and may or may not include extension or early purchase options. The majority of the Company’s meter leaseslease terms are for terms of between seven and ten years with purchase options available prior to the end of the seven year term. Equipment leases include general office equipment that also vary in duration, most of which are for awith an average term of fivesix years. The Company's storage and capacity leases have assumed terms of 50 years to coincide with the expected useful lives of the cavern assets with which the leases are associated. The Company's lease terms may include options to extend, purchase the leased asset or terminate a lease and they are included in the lease liability calculation when it is reasonably certain that those options will be exercised. The Company has elected an accounting policy that exempts leases with an original term of one year or less from the recognition requirements of ASC 842, Leases.
The Company has lease agreements with lease and non-lease components and has elected the practical expedient to combine lease and non-lease components for certain classes of leases, such as office buildings, solar land leases and office equipment. Variable payments are not considered material to the Company. The Company’s lease agreements do not contain any material residual value guarantees, material restrictions or material covenants. ThereIn July 2021, NJNG entered into 16-year lease agreements, as Lessor, with various NJR subsidiaries, as Lessees, for office space at the Company’s headquarters in Wall, New Jersey, the effects of which are no material lease transactions with related parties.eliminated in consolidation.
The following table presents the Company's lease costs included in the Unaudited Condensed Consolidated Statements of Operations:
| | | Three Months Ended | Six Months Ended | | Three Months Ended | Six Months Ended |
| | March 31, | | March 31, |
| (Thousands) | (Thousands) | Income Statement Location | 2021 | 2020 | 2021 | 2020 | | (Thousands) | Income Statement Location | 2022 | 2021 | 2022 | 2021 |
Operating lease cost (1) | Operating lease cost (1) | Operation and maintenance | $ | 1,356 | | 1,719 | | 3,445 | | 3,111 | | | Operating lease cost (1) | Operation and maintenance | $ | 2,915 | | 1,356 | | $ | 5,034 | | $ | 3,445 | |
| Finance lease cost | Finance lease cost | | | Finance lease cost | |
| Amortization of right-of-use assets | Amortization of right-of-use assets | Depreciation and amortization | $ | 1,191 | | $ | 1,299 | | $ | 2,437 | | $ | 2,460 | | | Amortization of right-of-use assets | Depreciation and amortization | $ | 457 | | $ | 1,191 | | 853 | | 2,437 | |
| Interest on lease liabilities | Interest on lease liabilities | Interest expense, net of capitalized interest | 113 | | 301 | | 334 | | 548 | | | Interest on lease liabilities | Interest expense, net of capitalized interest | 104 | | 113 | | 184 | | 334 | |
| Total finance lease cost | Total finance lease cost | | 1,304 | | 1,600 | | 2,771 | | 3,008 | | | Total finance lease cost | | 561 | | 1,304 | | 1,037 | | 2,771 | |
| Short-term lease cost | Short-term lease cost | Operation and maintenance | 127 | | 172 | | 254 | | 626 | | | Short-term lease cost | Operation and maintenance | 12 | | 127 | | 23 | | 254 | |
| Variable lease cost | Variable lease cost | Operation and maintenance | 549 | | 403 | | 702 | | 1,110 | | | Variable lease cost | Operation and maintenance | 172 | | 549 | | 363 | | 702 | |
| Total lease cost | Total lease cost | | $ | 3,336 | | $ | 3,894 | | $ | 7,172 | | $ | 7,855 | | | Total lease cost | | $ | 3,660 | | $ | 3,336 | | $ | 6,457 | | $ | 7,172 | |
(1)Net of capitalized costs.
The following table presents supplemental cash flow information related to leases:
| | | | | | | | | | |
| Six Months Ended |
| March 31, |
| (Thousands) | 2021 | 2020 | | |
| Cash paid for amounts included in the measurement of lease liabilities | | | | |
| Operating cash flows for operating leases | $ | 2,932 | | $ | 2,856 | | | |
| Operating cash flows for finance leases | $ | 791 | | $ | 704 | | | |
| Financing cash flows for finance leases | $ | 5,690 | | $ | 4,038 | | | |
Assets obtained or modified through amendments in exchange for operating lease liabilities totaled $5.7 million and $12.4 million during the three months ended March 31, 2021 and 2020, respectively, and totaled $13.3 million and $34.0 million during the six months ended March 31, 2021 and 2020, respectively. Assets obtained or modified through finance lease liabilities totaled $45.7 million and $49.7 million during the three and six months ended March 31, 2020, respectively. There were 0 assets obtained or modified through finance lease liabilities during the three and six months ended March 31, 2021.
New Jersey Resources Corporation
Part I
NOTES TO UNAUDITED CONDENSED CONSOLIDATED FINANCIAL STATEMENTS (Continued)
The following table presents supplemental cash flow information related to leases:
| | | | | | | | |
| Six Months Ended |
| March 31, |
| (Thousands) | 2022 | 2021 |
| Cash paid for amounts included in the measurement of lease liabilities | | |
| Operating cash flows for operating leases | $ | 3,557 | | $ | 2,932 | |
| Operating cash flows for finance leases | $ | 404 | | $ | 791 | |
| Financing cash flows for finance leases | $ | 3,947 | | $ | 5,690 | |
Assets obtained or modified for operating lease liabilities totaled approximately $17,000 and $5.7 million during the three months ended March 31, 2022 and 2021, respectively, and totaled $825,000 and $13.3 million during the six months ended March 31, 2022 and 2021, respectively. Assets obtained or modified through finance lease liabilities totaled $17.3 million during the six months ended March 31, 2022. There were no assets obtained or modified through finance lease liabilities during the three months ended March 31, 2022 and the three and six months ended March 31, 2021.
The following table presents the balance and classifications of the Company's right of use assets and lease liabilities included in the Unaudited Condensed Consolidated Balance Sheets:
| | (Thousands) | (Thousands) | Balance Sheet Location | March 31,
2021 | September 30,
2020 | | (Thousands) | Balance Sheet Location | March 31, 2022 | September 30,
2021 |
| Assets | Assets | | | Assets | |
| Noncurrent | Noncurrent | | | Noncurrent | |
| Operating lease assets | Operating lease assets | Operating lease assets | $ | 144,326 | | $ | 131,769 | | | Operating lease assets | Operating lease assets | $ | 171,207 | | $ | 173,928 | |
| Finance lease assets | Finance lease assets | Utility plant | 61,432 | | 71,085 | | | Finance lease assets | Utility plant | 22,828 | | 13,489 | |
| Total lease assets | Total lease assets | | $ | 205,758 | | $ | 202,854 | | | Total lease assets | | $ | 194,035 | | $ | 187,417 | |
| Liabilities | Liabilities | | | Liabilities | |
| Current | Current | | | Current | |
| Operating lease liabilities | Operating lease liabilities | Operating lease liabilities | $ | 4,001 | | $ | 6,724 | | | Operating lease liabilities | Operating lease liabilities | $ | 4,878 | | $ | 4,300 | |
| Finance lease liabilities | Finance lease liabilities | Current maturities of long-term debt | 5,855 | | 10,416 | | | Finance lease liabilities | Current maturities of long-term debt | 6,443 | | 5,393 | |
| Noncurrent | Noncurrent | | | Noncurrent | |
| Operating lease liabilities | Operating lease liabilities | Operating lease liabilities | 111,034 | | 95,030 | | | Operating lease liabilities | Operating lease liabilities | 140,036 | | 141,363 | |
| Finance lease liabilities | Finance lease liabilities | Long-term debt | 62,334 | | 63,743 | | | Finance lease liabilities | Long-term debt | 27,045 | | 14,742 | |
| Total lease liabilities | Total lease liabilities | | $ | 183,224 | | $ | 175,913 | | | Total lease liabilities | | $ | 178,402 | | $ | 165,798 | |
For operating lease assets and liabilities, the weighted average remaining lease term was 27.6 years and 25.529.6 years and the weighted average discount rate used in the valuation over the remaining lease term was 3.3 percent and 3.2 percent as offor both March 31, 20212022 and September 30, 2020, respectively. 2021.
For finance lease assets and liabilities as of March 31, 20212022 and September 30, 2020,2021, the weighted average remaining lease term was 11.94.5 years and 11.53.4 years, respectively, and the weighted average discount rate used in the valuation over the remaining lease term is 2.52.7 percent and 3.5 percent as of both March 31, 20212022 and September 30, 2020.2021, respectively.
13. COMMITMENTS AND CONTINGENT LIABILITIES
Cash Commitments
NJNG has entered into long-term contracts, expiring at various dates through November 2038,September 2039, for the supply, transportation and storage of natural gas. These contracts include annual fixed charges of approximately $156.0$199.5 million at current contract rates and volumes for the remainder of the fiscal year, which are recoverable through BGSS.
New Jersey Resources Corporation
Part I
NOTES TO UNAUDITED CONDENSED CONSOLIDATED FINANCIAL STATEMENTS (Continued)
For the purpose of securing storage and pipeline capacity, the Energy Services segment enters into storage and pipeline capacity contracts, which require the payment of certain demand charges by Energy Services to maintain the ability to access such natural gas storage or pipeline capacity, during a fixed time period, which generally ranges from one to 10 yearsyears. Demand charges are established by interstate storage and pipeline operators and are regulated by FERC. These demand charges represent commitments to pay storage providers or pipeline companies for the right to store and/or transport natural gas utilizing their respective assets.
Commitments as of March 31, 2021,2022, for natural gas purchases and future demand fees for the next five fiscal year periods are as follows:
| | (Thousands) | (Thousands) | 2021 | 2022 | 2023 | 2024 | 2025 | Thereafter | (Thousands) | 2022 | 2023 | 2024 | 2025 | 2026 | Thereafter |
| Energy Services: | Energy Services: | | Energy Services: | |
| Natural gas purchases | Natural gas purchases | $ | 98,845 | | $ | 0 | | $ | 0 | | $ | 0 | | $ | 0 | | $ | 0 | | Natural gas purchases | $ | 110,029 | | $ | 17,096 | | $ | — | | $ | — | | $ | — | | $ | — | |
| Storage demand fees | Storage demand fees | 18,712 | | 14,248 | | 6,712 | | 3,318 | | 2,742 | | 277 | | Storage demand fees | 11,881 | | 20,416 | | 12,256 | | 6,434 | | 3,789 | | 3,027 | |
| Pipeline demand fees | Pipeline demand fees | 60,585 | | 49,224 | | 21,689 | | 18,673 | | 16,245 | | 34,074 | | Pipeline demand fees | 36,564 | | 59,876 | | 41,802 | | 27,037 | | 26,359 | | 32,082 | |
| Sub-total Energy Services | Sub-total Energy Services | $ | 178,142 | | $ | 63,472 | | $ | 28,401 | | $ | 21,991 | | $ | 18,987 | | $ | 34,351 | | Sub-total Energy Services | $ | 158,474 | | $ | 97,388 | | $ | 54,058 | | $ | 33,471 | | $ | 30,148 | | $ | 35,109 | |
| NJNG: | NJNG: | | NJNG: | |
| Natural gas purchases | Natural gas purchases | $ | 32,320 | | $ | 0 | | $ | 0 | | $ | 0 | | $ | 0 | | $ | 0 | | Natural gas purchases | $ | 55,151 | | $ | 5,361 | | $ | — | | $ | — | | $ | — | | $ | — | |
| Storage demand fees | Storage demand fees | 37,285 | | 28,593 | | 17,090 | | 11,506 | | 2,207 | | 2,495 | | Storage demand fees | 25,167 | | 41,758 | | 27,318 | | 17,362 | | 10,266 | | 14,320 | |
| Pipeline demand fees | Pipeline demand fees | 118,672 | | 150,719 | | 136,124 | | 158,600 | | 154,297 | | 1,437,814 | | Pipeline demand fees | 72,067 | | 147,689 | | 91,216 | | 136,515 | | 127,692 | | 1,179,683 | |
| Sub-total NJNG | Sub-total NJNG | $ | 188,277 | | $ | 179,312 | | $ | 153,214 | | $ | 170,106 | | $ | 156,504 | | $ | 1,440,309 | | Sub-total NJNG | $ | 152,385 | | $ | 194,808 | | $ | 118,534 | | $ | 153,877 | | $ | 137,958 | | $ | 1,194,003 | |
| Total | Total | $ | 366,419 | | $ | 242,784 | | $ | 181,615 | | $ | 192,097 | | $ | 175,491 | | $ | 1,474,660 | | Total | $ | 310,859 | | $ | 292,196 | | $ | 172,592 | | $ | 187,348 | | $ | 168,106 | | $ | 1,229,112 | |
Certain pipeline demand fees totaling approximately $4.0 million per year, for which Energy Services is the responsible party, will beare being paid for by the counterparty to a capacity release transaction beginning November 1, 2021 for a period of 10 years.
New Jersey Resources Corporation
Part I
NOTES TO UNAUDITED CONDENSED CONSOLIDATED FINANCIAL STATEMENTS (Continued)
Legal Proceedings
Manufactured Gas Plant Remediation
NJNG is responsible for the remedial cleanup of certain former MGP sites, dating back to gas operations in the late 1800s and early 1900s, which contain contaminated residues from former gas manufacturing operations. NJNG is currently involved in administrative proceedings with the NJDEP and participating in various studies and investigations by outside consultants, to determine the nature and extent of any such contaminated residues and to develop appropriate programs of remedial action, where warranted, under NJDEP regulations.
NJNG periodically, and at least annually, performs an environmental review of former MGP sites located in Atlantic Highlands, Berkeley, Long Branch, Manchester, Toms River, Freehold and Freehold,Aberdeen, New Jersey, collectively, the "former MGP sites", including a review of potential liability for investigation and remedial action. NJNG estimated at the time of the most recent review that total future expenditures at the former MGP sites for which it is responsible, including potential liabilities for further and continued natural resource damages maythat might be brought by the NJDEP for alleged injury to groundwater or other natural resources concerning these sites. At the MGP site in Freehold, New Jersey, as the Company has not yet completed the remedial investigation of the site, the total amount of potential costs of all remedial actions cannot be reasonably estimated at this time.
The estimated total future expenditures for all former MGP sites will range from approximately $143.1$115.7 million to $181.7$178.7 million. NJNG’s estimate of these liabilities is based upon known facts, existing technology and enacted laws and regulations in place when the review was completed. Where it is probable that costs will be incurred, and the information is sufficient to establish a range of possible liability, NJNG accrues the most likely amount in the range. If no point within the range is more likely than the other, it is NJNG’s policy to accrue the lower end of the range. Accordingly, as of March 31, 2022, NJNG recorded ana MGP remediation liability and a corresponding regulatory asset of approximately $121.6 million on the Unaudited Condensed Consolidated Balance Sheets of $143.5 million as of March 31, 2021, and $150.6 million as of September 30, 2020, based on the most likely amount. The remediation liability at March 31, 2021, includes adjustments for actual expenditures during fiscal 2021. The actual costs to be incurred by NJNG are dependent upon several factors, including final determination of remedial action, changing technologies and governmental regulations, the ultimate ability of other responsible parties to pay and insurance recoveries, if any.
New Jersey Resources Corporation
Part I
NOTES TO UNAUDITED CONDENSED CONSOLIDATED FINANCIAL STATEMENTS (Continued)
In June 2019, NJNG initiated a preliminary assessment of a site in Aberdeen, New Jersey to determine prior ownership and if former MGP operations were active at the location. The preliminary assessment and site investigation activities are ongoing at the Aberdeen, NJ site location. The estimated costs to complete the preliminary assessment and site investigation phase are included in the MGP remediation liability and corresponding regulatory asset on the Unaudited Condensed Consolidated Balance Sheets.Sheets at March 31, 2022 and September 30, 2021. NJNG will continue to gather information to determine whether the obligation exists to undertake remedial action.action, if any, and refine its estimate of potential costs for this site as more information becomes available.
NJNG recovers its remediation expenditures, including carrying costs, over rolling seven-year periods pursuant to a RAC approved by the BPU. On September 9, 2020,March 23, 2022, the BPU approved NJNG'san increase in the RAC, which increased the pre-tax annual recovery from $8.5$11.1 million to $9.7$11.7 million, and is effective OctoberApril 1, 2020.2022. As of March 31, 2021, $37.52022, $65.5 million of previously incurred remediation costs, net of recoveries from customers and insurance proceeds, are included in regulatory assets on the Unaudited Condensed Consolidated Balance Sheets. NJNG will continue to seek recovery of MGP-related costs through the RAC. If any future regulatory position indicates that the recovery of such costs is not probable, the related non-recoverable costs would be charged to income in the period of such determination.
General
The Company is involved, and from time to time in the future may be involved, in a number of pending and threatened judicial, regulatory and arbitration proceedings relating to matters that arise in the ordinary course of business. In view of the inherent difficulty of predicting the outcome of litigation matters, particularly when such matters are in their early stages or where the claimants seek indeterminate damages, the Company cannot state with confidence what the eventual outcome of the pending litigation will be, what the timing of the ultimate resolution of these matters will be, or what the eventual loss, fines or penalties related to each pending matter will be, if any. In accordance with applicable accounting guidance, NJRthe Company establishes accruals for litigation for those matters that present loss contingencies as to which it is both probable that a loss will be incurred and the amount of such loss can be reasonably estimated. NJRThe Company also discloses contingent matters for which there is a reasonable possibility of a loss. Based upon currently available information, NJRthe Company believes that the results of litigation that isare currently pending, taken together, will not have a materially adverse effect on the Company’s financial condition, results of operations or cash flows. The actual results of resolving the pending litigation matters may be substantially higher than the amounts accrued.
New Jersey Resources Corporation
Part I
NOTES TO UNAUDITED CONDENSED CONSOLIDATED FINANCIAL STATEMENTS (Continued)
The foregoing statements about NJR’sthe Company’s litigation are based upon the Company’s judgments, assumptions and estimates and are necessarily subjective and uncertain. The Company has a number of threatened and pending litigation matters at various stages.
14. COMMON STOCK EQUITY
New Jersey Resources Corporation
Part I
In December 2019, the Company completed an equity offering of 6,545,454 common shares, consisting of 5,333,334 common shares issued directly by the Company and 1,212,120 common shares issuable pursuant to forward sales agreements with investment banks. The issuance of 5,333,334 resulted in proceeds of approximately $212.9 million, net of issuance costs, and was reflected in shareholders' equity and as a financing activity on the statement of cash flows.NOTES TO UNAUDITED CONDENSED CONSOLIDATED FINANCIAL STATEMENTS (Continued)
Under the forward sale agreements, a total of 1,212,120 common shares were borrowed from third parties and sold to the underwriters. Each forward sale agreement allows the Company, at its election and prior to September 30, 2020, to physically settle the forward sale agreement by issuing common shares in exchange for net proceeds at the then-applicable forward sale price specified by the agreement, which was initially $40.0125 per share, or, alternatively, to settle the forward sale agreement in whole or in part through the delivery or receipt of shares or cash. The forward sale price is subject to adjustment daily based on a floating interest rate factor and will decrease in respect of certain fixed amounts specified in the agreement, such as anticipated dividends.
On September 18, 2020, the Company amended its forward sale agreements to extend the maturity date of such forward sales agreements from September 30, 2020 to September 10, 2021. On March 3, 2021, the Company cash settled a portion of the forward sale agreement for a payout of $387,744 for 727,272 common shares. As of March 31, 2021, if the Company elected to net settle the remaining forward sale agreement, the Company would have paid approximately $1.4 million under a cash settlement or would have issued 31,607 common shares under a net share settlement.
Issuances of shares under the forward sale agreements are classified as equity transactions. Accordingly, no amounts relating to the forward sale agreements have or will be recorded in the financial statements until settlements take place. Prior to any settlements, the only impact to the financial statements is the inclusion of incremental shares within the calculation of diluted EPS using the treasury stock method until settlement of the forward sale agreements. Under this method, the number of the Company common shares used in calculating diluted EPS is deemed to be increased by the excess, if any, of the number of shares that would be issued upon physical settlement of the forward sale agreements less the number of shares that would be purchased by the Company in the market (based on the average market price during the same reporting period) using the proceeds receivable upon settlement (based on the adjusted forward sale price at the end of that reporting period). Share dilution occurs when the average market price of the Company's common shares is higher than the adjusted forward sale price. See Note 8. Earnings Per Share for the impact of the forward sale agreements on the calculation of diluted earnings per share.
15.14. REPORTING SEGMENT AND OTHER OPERATIONS DATA
The Company organizes its businesses based on a combination of factors, including its products and its regulatory environment. As a result, the Company manages its businesses through the following reporting segments and other operations: the Natural Gas Distribution segment consists of regulated energy and off-system, capacity and storage management operations; the Clean Energy Ventures segment consists of capital investments in clean energy projects; the Energy Services segment consists of unregulated wholesale and retail energy operations; the Storage and Transportation segment consists of the Company’s investments in natural gas transportation and storage facilities; the Home Services and Other operations consist of heating, cooling and water appliance sales, installations and services, other investments and general corporate activities.
New Jersey Resources Corporation
Part I
NOTES TO UNAUDITED CONDENSED CONSOLIDATED FINANCIAL STATEMENTS (Continued)
Information related to the Company's various reporting segments and other operations is detailed below:
| | | Three Months Ended | Six Months Ended | | Three Months Ended | Six Months Ended |
| | March 31, | | March 31, |
| (Thousands) | (Thousands) | 2021 | 2020 | 2021 | 2020 | (Thousands) | 2022 | 2021 | 2022 | 2021 |
| Operating revenues | Operating revenues | | Operating revenues | |
| Natural Gas Distribution | Natural Gas Distribution | | Natural Gas Distribution | |
| External customers | External customers | $ | 310,167 | | $ | 297,220 | | $ | 505,896 | | $ | 516,843 | | External customers | $ | 463,474 | | $ | 310,167 | | $ | 737,909 | | $ | 505,896 | |
| | Intercompany | | Intercompany | 338 | | — | | 675 | | — | |
| Clean Energy Ventures | Clean Energy Ventures | | Clean Energy Ventures | |
| External customers | External customers | 6,476 | | 5,995 | | 12,846 | | 12,207 | | External customers | 11,827 | | 6,476 | | 22,010 | | 12,846 | |
| Energy Services | Energy Services | | Energy Services | |
External customers (1) | External customers (1) | 459,766 | | 313,959 | | 687,115 | | 682,263 | | External customers (1) | 411,069 | | 459,766 | | 776,857 | | 687,115 | |
| Intercompany | Intercompany | 2,803 | | (258) | | 4,931 | | 1,853 | | Intercompany | 1,576 | | 2,803 | | 5,032 | | 4,931 | |
| Storage and Transportation | Storage and Transportation | | Storage and Transportation | |
| External customers | External customers | 13,257 | | 10,401 | | 25,704 | | 18,806 | | External customers | 12,805 | | 13,257 | | 24,389 | | 25,704 | |
| Intercompany | Intercompany | 669 | | 675 | | 1,326 | | 1,342 | | Intercompany | 537 | | 669 | | 1,096 | | 1,326 | |
| Subtotal | Subtotal | 793,138 | | 627,992 | | 1,237,818 | | 1,233,314 | | Subtotal | 901,626 | | 793,138 | | 1,567,968 | | 1,237,818 | |
| Home Services and Other | Home Services and Other | | Home Services and Other | |
| External customers | External customers | 12,521 | | 12,039 | | 24,931 | | 24,531 | | External customers | 13,141 | | 12,521 | | 26,993 | | 24,931 | |
| Intercompany | Intercompany | 252 | | 326 | | 419 | | 741 | | Intercompany | 81 | | 252 | | 180 | | 419 | |
| Eliminations | Eliminations | (3,724) | | (743) | | (6,676) | | (3,936) | | Eliminations | (2,532) | | (3,724) | | (6,983) | | (6,676) | |
| Total | Total | $ | 802,187 | | $ | 639,614 | | $ | 1,256,492 | | $ | 1,254,650 | | Total | $ | 912,316 | | $ | 802,187 | | $ | 1,588,158 | | $ | 1,256,492 | |
| Depreciation and amortization | Depreciation and amortization | | Depreciation and amortization | |
| Natural Gas Distribution | Natural Gas Distribution | $ | 19,475 | | $ | 18,100 | | $ | 38,644 | | $ | 34,917 | | Natural Gas Distribution | $ | 23,344 | | $ | 19,475 | | $ | 46,237 | | $ | 38,644 | |
| Clean Energy Ventures | Clean Energy Ventures | 4,685 | | 6,603 | | 10,118 | | 12,919 | | Clean Energy Ventures | 5,311 | | 4,685 | | 10,544 | | 10,118 | |
Energy Services (2) | Energy Services (2) | 13 | | 27 | | 55 | | 56 | | Energy Services (2) | 32 | | 13 | | 60 | | 55 | |
| Storage and Transportation | Storage and Transportation | 2,364 | | 2,397 | | 5,004 | | 4,078 | | Storage and Transportation | 2,571 | | 2,364 | | 4,704 | | 5,004 | |
| Subtotal | Subtotal | 26,537 | | 27,127 | | 53,821 | | 51,970 | | Subtotal | 31,258 | | 26,537 | | 61,545 | | 53,821 | |
| Home Services and Other | Home Services and Other | 227 | | 250 | | 487 | | 496 | | Home Services and Other | 203 | | 227 | | 407 | | 487 | |
| Eliminations | Eliminations | 84 | | 139 | | (98) | | (313) | | Eliminations | (26) | | 84 | | (124) | | (98) | |
| Total | Total | $ | 26,848 | | $ | 27,516 | | $ | 54,210 | | $ | 52,153 | | Total | $ | 31,435 | | $ | 26,848 | | $ | 61,828 | | $ | 54,210 | |
Interest income (3) | Interest income (3) | | Interest income (3) | |
| Natural Gas Distribution | Natural Gas Distribution | $ | 76 | | $ | 136 | | $ | 158 | | $ | 243 | | Natural Gas Distribution | $ | 191 | | $ | 76 | | $ | 384 | | $ | 158 | |
| Clean Energy Ventures | Clean Energy Ventures | 240 | | 0 | | 240 | | 0 | | Clean Energy Ventures | — | | 240 | | — | | 240 | |
| Energy Services | 0 | | 52 | | 0 | | 89 | | |
| | Storage and Transportation | Storage and Transportation | 851 | | 2,085 | | 1,545 | | 2,782 | | Storage and Transportation | 381 | | 851 | | 758 | | 1,545 | |
| Subtotal | Subtotal | 1,167 | | 2,273 | | 1,943 | | 3,114 | | Subtotal | 572 | | 1,167 | | 1,142 | | 1,943 | |
| Home Services and Other | Home Services and Other | 127 | | 208 | | 259 | | 699 | | Home Services and Other | 147 | | 127 | | 302 | | 259 | |
| Eliminations | Eliminations | (237) | | (760) | | (476) | | (1,906) | | Eliminations | (231) | | (237) | | (455) | | (476) | |
| Total | Total | $ | 1,057 | | $ | 1,721 | | $ | 1,726 | | $ | 1,907 | | Total | $ | 488 | | $ | 1,057 | | $ | 989 | | $ | 1,726 | |
(1)Includes sales to Canada for the Energy Services segment, which are immaterial.
(2)The amortization of acquired wholesale energy contracts is excluded above and is included in natural gas purchases - nonutility on the Unaudited Condensed Consolidated Statements of Operations.
(3)Included in other income, net on the Unaudited Condensed Consolidated Statements of Operations.
New Jersey Resources Corporation
Part I
NOTES TO UNAUDITED CONDENSED CONSOLIDATED FINANCIAL STATEMENTS (Continued)
| | | Three Months Ended | Six Months Ended | | Three Months Ended | Six Months Ended |
| | March 31, | | March 31, |
| (Thousands) | (Thousands) | 2021 | 2020 | 2021 | 2020 | (Thousands) | 2022 | 2021 | 2022 | 2021 |
| Interest expense, net of capitalized interest | Interest expense, net of capitalized interest | | Interest expense, net of capitalized interest | |
| Natural Gas Distribution | Natural Gas Distribution | $ | 9,006 | | $ | 7,473 | | $ | 17,980 | | $ | 15,305 | | Natural Gas Distribution | $ | 10,764 | | $ | 9,006 | | $ | 21,759 | | $ | 17,980 | |
| Clean Energy Ventures | Clean Energy Ventures | 5,266 | | 4,835 | | 10,300 | | 9,327 | | Clean Energy Ventures | 5,395 | | 5,266 | | 10,822 | | 10,300 | |
| Energy Services | Energy Services | 575 | | 937 | | 1,255 | | 2,163 | | Energy Services | 795 | | 575 | | 1,470 | | 1,255 | |
| Storage and Transportation | Storage and Transportation | 3,578 | | 5,621 | | 7,560 | | 8,443 | | Storage and Transportation | 1,847 | | 3,578 | | 3,983 | | 7,560 | |
| Subtotal | Subtotal | 18,425 | | 18,866 | | 37,095 | | 35,238 | | Subtotal | 18,801 | | 18,425 | | 38,034 | | 37,095 | |
| Home Services and Other | Home Services and Other | 1,728 | | 565 | | 2,844 | | 837 | | Home Services and Other | 125 | | 1,728 | | 369 | | 2,844 | |
| Eliminations | 0 | | (228) | | 0 | | (802) | | |
| | Total | Total | $ | 20,153 | | $ | 19,203 | | $ | 39,939 | | $ | 35,273 | | Total | $ | 18,926 | | $ | 20,153 | | $ | 38,403 | | $ | 39,939 | |
| Income tax provision (benefit) | Income tax provision (benefit) | | Income tax provision (benefit) | |
| Natural Gas Distribution | Natural Gas Distribution | $ | 15,622 | | $ | 19,702 | | $ | 23,989 | | $ | 28,337 | | Natural Gas Distribution | $ | 29,689 | | $ | 15,622 | | $ | 42,893 | | $ | 23,989 | |
| Clean Energy Ventures | Clean Energy Ventures | (2,714) | | (4,134) | | (5,800) | | (7,968) | | Clean Energy Ventures | (1,952) | | (2,714) | | (3,998) | | (5,800) | |
| Energy Services | Energy Services | 23,128 | | (2,449) | | 35,250 | | 8,303 | | Energy Services | (790) | | 23,128 | | 19,715 | | 35,250 | |
| Storage and Transportation | Storage and Transportation | 873 | | 1,105 | | 1,519 | | 1,807 | | Storage and Transportation | 714 | | 873 | | 1,057 | | 1,519 | |
| Subtotal | Subtotal | 36,909 | | 14,224 | | 54,958 | | 30,479 | | Subtotal | 27,661 | | 36,909 | | 59,667 | | 54,958 | |
| Home Services and Other | Home Services and Other | (59) | | 1,956 | | 59 | | 2,175 | | Home Services and Other | 256 | | (59) | | 502 | | 59 | |
| Eliminations | Eliminations | 2,207 | | 104 | | 1,481 | | 101 | | Eliminations | 893 | | 2,207 | | (552) | | 1,481 | |
| Total | Total | $ | 39,057 | | $ | 16,284 | | $ | 56,498 | | $ | 32,755 | | Total | $ | 28,810 | | $ | 39,057 | | $ | 59,617 | | $ | 56,498 | |
| Equity in earnings of affiliates | Equity in earnings of affiliates | | Equity in earnings of affiliates | |
| Storage and Transportation | Storage and Transportation | $ | 3,386 | | $ | 3,921 | | $ | 6,579 | | $ | 7,585 | | Storage and Transportation | $ | 1,256 | | $ | 3,386 | | $ | 2,312 | | $ | 6,579 | |
| Eliminations | Eliminations | (582) | | (332) | | (1,100) | | (607) | | Eliminations | (487) | | (582) | | (968) | | (1,100) | |
| Total | Total | $ | 2,804 | | $ | 3,589 | | $ | 5,479 | | $ | 6,978 | | Total | $ | 769 | | $ | 2,804 | | $ | 1,344 | | $ | 5,479 | |
| Net financial earnings (loss) | Net financial earnings (loss) | | Net financial earnings (loss) | |
| Natural Gas Distribution | Natural Gas Distribution | $ | 80,541 | | $ | 86,336 | | $ | 130,008 | | $ | 130,192 | | Natural Gas Distribution | $ | 102,783 | | $ | 80,541 | | $ | 153,863 | | $ | 130,008 | |
| Clean Energy Ventures | Clean Energy Ventures | (8,872) | | (8,829) | | (19,146) | | (17,008) | | Clean Energy Ventures | (6,491) | | (8,872) | | (13,312) | | (19,146) | |
| Energy Services | Energy Services | 96,528 | | 2,487 | | 98,028 | | (2,635) | | Energy Services | 29,940 | | 96,528 | | 47,507 | | 98,028 | |
| Storage and Transportation | Storage and Transportation | 4,711 | | 4,258 | | 8,219 | | 7,262 | | Storage and Transportation | 4,625 | | 4,711 | | 7,587 | | 8,219 | |
| Subtotal | Subtotal | 172,908 | | 84,252 | | 217,109 | | 117,811 | | Subtotal | 130,857 | | 172,908 | | 195,645 | | 217,109 | |
| Home Services and Other | Home Services and Other | 747 | | 148 | | 685 | | 1,257 | | Home Services and Other | 451 | | 747 | | 898 | | 685 | |
| Eliminations | Eliminations | (3,051) | | (109) | | (2,533) | | 154 | | Eliminations | (1,102) | | (3,051) | | (567) | | (2,533) | |
| Total | Total | $ | 170,604 | | $ | 84,291 | | $ | 215,261 | | $ | 119,222 | | Total | $ | 130,206 | | $ | 170,604 | | $ | 195,976 | | $ | 215,261 | |
| Capital expenditures | Capital expenditures | | Capital expenditures | |
| Natural Gas Distribution | Natural Gas Distribution | $ | 97,239 | | $ | 72,042 | | $ | 176,485 | | $ | 149,839 | | Natural Gas Distribution | $ | 52,000 | | $ | 97,239 | | $ | 125,464 | | $ | 176,485 | |
| Clean Energy Ventures | Clean Energy Ventures | 18,549 | | 24,087 | | 40,884 | | 69,786 | | Clean Energy Ventures | 41,176 | | 18,549 | | 66,556 | | 40,884 | |
| Storage and Transportation | Storage and Transportation | 20,094 | | 5,148 | | 27,707 | | 7,709 | | Storage and Transportation | 43,673 | | 20,094 | | 109,048 | | 27,707 | |
| Subtotal | Subtotal | 135,882 | | 101,277 | | 245,076 | | 227,334 | | Subtotal | 136,849 | | 135,882 | | 301,068 | | 245,076 | |
| Home Services and Other | Home Services and Other | 125 | | (111) | | 811 | | 15 | | Home Services and Other | 163 | | 125 | | 242 | | 811 | |
| Total | Total | $ | 136,007 | | $ | 101,166 | | $ | 245,887 | | $ | 227,349 | | Total | $ | 137,012 | | $ | 136,007 | | $ | 301,310 | | $ | 245,887 | |
| Investments in equity investees | | |
| Investments in (return of capital from) equity investees | | Investments in (return of capital from) equity investees | |
| Storage and Transportation | Storage and Transportation | $ | 196 | | $ | 757 | | $ | 482 | | $ | 1,266 | | Storage and Transportation | $ | (4,000) | | $ | 196 | | $ | (4,000) | | $ | 482 | |
| Total | Total | $ | 196 | | $ | 757 | | $ | 482 | | $ | 1,266 | | Total | $ | (4,000) | | $ | 196 | | $ | (4,000) | | $ | 482 | |
New Jersey Resources Corporation
Part I
NOTES TO UNAUDITED CONDENSED CONSOLIDATED FINANCIAL STATEMENTS (Continued)
The Company's assets for the various reporting segments and business operations are detailed below:
| | | | | | | | |
| (Thousands) | March 31,
2022 | September 30,
2021 |
| Assets at end of period: | | |
| Natural Gas Distribution | $ | 3,844,036 | | $ | 3,707,461 | |
| Clean Energy Ventures | 970,599 | | 914,788 | |
| Energy Services | 248,112 | | 365,423 | |
| Storage and Transportation | 965,615 | | 862,407 | |
| Subtotal | 6,028,362 | | 5,850,079 | |
| Home Services and Other | 136,300 | | 162,134 | |
Intercompany assets (1) | (294,658) | | (289,935) | |
| Total | $ | 5,870,004 | | $ | 5,722,278 | |
(1)Consists of transactions between subsidiaries that are eliminated and reclassified in consolidation.
The Chief Executive Officer, who uses NFE as a measure of profit or loss in measuring the results of the Company's reporting segments and operations, is the chief operating decision maker of the Company. A reconciliation of consolidated NFE to consolidated net income is as follows:
| | | Three Months Ended | Six Months Ended | | Three Months Ended | Six Months Ended |
| | March 31, | | March 31, |
| (Thousands) | (Thousands) | 2021 | 2020 | 2021 | 2020 | (Thousands) | 2022 | 2021 | 2022 | 2021 |
| Net financial earnings | Net financial earnings | $ | 170,604 | | $ | 84,291 | | $ | 215,261 | | $ | 119,222 | | Net financial earnings | $ | 130,206 | | $ | 170,604 | | $ | 195,976 | | $ | 215,261 | |
| Less: | Less: | | Less: | |
| Unrealized gain on derivative instruments and related transactions | 29,255 | | (3,773) | | (8,235) | | (45,539) | | |
| Unrealized loss (gain) on derivative instruments and related transactions | | Unrealized loss (gain) on derivative instruments and related transactions | 42,022 | | 29,255 | | (40,169) | | (8,235) | |
| Tax effect | Tax effect | (6,954) | | 897 | | 1,958 | | 10,828 | | Tax effect | (9,980) | | (6,954) | | 9,556 | | 1,958 | |
| Effects of economic hedging related to natural gas inventory | Effects of economic hedging related to natural gas inventory | (7,209) | | 14,622 | | (14,741) | | 5,735 | | Effects of economic hedging related to natural gas inventory | 1,155 | | (7,209) | | 24,732 | | (14,741) | |
| Tax effect | Tax effect | 1,713 | | (3,475) | | 3,503 | | (1,363) | | Tax effect | (274) | | 1,713 | | (5,877) | | 3,503 | |
| | NFE tax adjustment | NFE tax adjustment | 3,990 | | 2,174 | | 1,922 | | (37) | | NFE tax adjustment | 1,248 | | 3,990 | | 387 | | 1,922 | |
| Net income | Net income | $ | 149,809 | | $ | 73,846 | | $ | 230,854 | | $ | 149,598 | | Net income | $ | 96,035 | | $ | 149,809 | | $ | 207,347 | | $ | 230,854 | |
The Company uses derivative instruments as economic hedges of purchases and sales of physical natural gas inventory. For GAAP purposes, these derivatives are recorded at fair value and related changes in fair value are included in reported earnings. Revenues and cost of natural gas related to physical natural gas flow isare recognized when the natural gas is delivered to customers. Consequently, there is a mismatch in the timing of earnings recognition between the economic hedges and physical natural gas flows. Timing differences occur in two ways:
•unrealized gains and losses on derivatives are recognized in reported earnings in periods prior to physical natural gas inventory flows; and
•unrealized gains and losses of prior periods are reclassified as realized gains and losses when derivatives are settled in the same period as physical natural gas inventory movements occur.
NFE is a measure of the earnings based on eliminating these timing differences, to effectively match the earnings effects of the economic hedges with the physical sale of natural gas, SRECs and foreign currency contracts. Consequently, to reconcile between net income and NFE, current period unrealized gains and losses on the derivatives are excluded from NFE as a reconciling item. Additionally, realizedRealized derivative gains and losses are also included in current period net income. However, NFE includes only realized gains and losses related to natural gas sold out of inventory, effectively matching the full earnings effects of the derivatives with realized margins on physical natural gas flows. NFE also excludes impairment charges associated with equity method investments, which are non-cash charges considered unusual in nature that occur infrequently and are not indicative of the Company's performance for its ongoing operations. Included in the tax effects are current and deferred income tax expense corresponding with the components of NFE. NJRThe Company also calculates a quarterly tax adjustment based on an estimated annual effective tax rate for NFE purposes.
The Company's assets for the various business segments and business operations are detailed below:
| | | | | | | | |
| (Thousands) | March 31,
2021 | September 30,
2020 |
| Assets at end of period: | | |
| Natural Gas Distribution | $ | 3,593,630 | | $ | 3,531,477 | |
| Clean Energy Ventures | 848,290 | | 814,277 | |
| Energy Services | 224,069 | | 244,836 | |
| Storage and Transportation | 874,976 | | 844,799 | |
| Subtotal | 5,540,965 | | 5,435,389 | |
| Home Services and Other | 136,531 | | 138,375 | |
Intercompany assets (1) | (252,362) | | (257,287) | |
| Total | $ | 5,425,134 | | $ | 5,316,477 | |
(1)Consists of transactions between subsidiaries that are eliminated and reclassified in consolidation.
New Jersey Resources Corporation
Part I
NOTES TO UNAUDITED CONDENSED CONSOLIDATED FINANCIAL STATEMENTS (Continued)
16.15. RELATED PARTY TRANSACTIONS
Effective April 1, 2020, NJNG entered into a 5-year agreement for 3 Bcf of firm storage capacity with Steckman Ridge, which expires on March 31, 2025. Under the terms of the agreement, NJNG incurs demand fees, at market rates, of approximately $9.3 million annually, a portion of which is eliminated in consolidation. These fees are recoverable through NJNG’s BGSS mechanism and are included as a component of regulatory assets.
Energy Services may periodically enter into storage or park and loan agreements with its affiliated FERC-jurisdictional natural gas storage facility, Steckman Ridge. As of March 31, 2021,2022, Energy Services has entered into transactions with Steckman Ridge for varying terms, all of which expire by OctoberMarch 31, 2021.2024.
Demand fees, net of eliminations, associated with Steckman Ridge were as follows:
| | | Three Months Ended | Six Months Ended | | Three Months Ended | Six Months Ended |
| | March 31, | | March 31, |
| (Thousands) | (Thousands) | 2021 | 2020 | 2021 | 2020 | (Thousands) | 2022 | 2021 | 2022 | 2021 |
| Natural Gas Distribution | Natural Gas Distribution | $ | 1,505 | | $ | 1,477 | | $ | 3,073 | | $ | 2,971 | | Natural Gas Distribution | $ | 1,546 | | $ | 1,505 | | $ | 3,104 | | $ | 3,073 | |
| Energy Services | Energy Services | 226 | | 29 | | 391 | | 59 | | Energy Services | 337 | | 226 | | 625 | | 391 | |
| Total | Total | $ | 1,731 | | $ | 1,506 | | $ | 3,464 | | $ | 3,030 | | Total | $ | 1,883 | | $ | 1,731 | | $ | 3,729 | | $ | 3,464 | |
The following table summarizes demand fees payable to Steckman Ridge as of:
| | (Thousands) | (Thousands) | March 31,
2021 | September 30,
2020 | (Thousands) | March 31, 2022 | September 30,
2021 |
| Natural Gas Distribution | Natural Gas Distribution | $ | 775 | | $ | 775 | | Natural Gas Distribution | $ | 779 | | $ | 778 | |
| Energy Services | Energy Services | 78 | | 16 | | Energy Services | 76 | | 83 | |
| Total | Total | $ | 853 | | $ | 791 | | Total | $ | 855 | | $ | 861 | |
NJNG and Energy Services have entered into various asset management agreements,AMAs, the effects of which are eliminated in consolidation. Under the terms of these agreements, NJNG releases certain transportation and storage contracts to Energy Services. As of March 31, 2021,2022, NJNG and Energy Services had 3 asset management agreements1 AMA with an expiration dates ranging from October 31, 2021 throughdate of March 31, 2022.2023.
NJNG has entered into a 15-year transportation precedent agreement for committed capacity of 180,000 Dths per day and NJRES has entered into a 5-year 50,000 Dths per day transportation precedent agreement with PennEast, both to commence when PennEast is placed in service.
NJNG has entered into a transportation precedent agreement with Adelphia Gateway for committed capacity of 130,000 DthsDekatherms per day, which expires in October 2026.is expected to begin during the 2nd half of fiscal 2022.
Energy Services has a 5-year agreement for 3 Bcf of firm storage capacity with Leaf River, which is eliminated in consolidation and expires in March 2024. On February 19, 2021, Energy Services entered into a park and loan agreement with Leaf River for 330,000 Dths, which expired on April 30, 2021 and is eliminated in consolidation.
In March 2021, NJNG and Clean Energy Ventures entered into a 15-year sublease agreement and PPA agreement related to an onsite solar array and the related energy output at the Company’s headquarters in Wall, New Jersey.Jersey, the effects of which are immaterial to the consolidated financial statements.
17. ACQUISITIONS AND DISPOSITIONS
Acquisitions
Adelphia Gateway
On January 13, 2020, Adelphia Gateway, an indirect wholly-owned subsidiary ofIn July 2021, NJNG entered into 16-year lease agreements, as Lessor, with various NJR acquired all of Talen’s membership interestssubsidiaries, as Lessees, for office space at the Company’s headquarters in IEC, an existing 84-mile pipeline in southeastern Pennsylvania, including related assets and rights of
Wall, New Jersey, Resources Corporation
Part I
NOTES TO UNAUDITED CONDENSED CONSOLIDATED FINANCIAL STATEMENTS (Continued)
way, for a base purchase pricethe effects of $166 million. In November 2017, the Company made an initial payment of $10 million towards the base purchase price, which was includedare eliminated in other noncurrent assets on the Consolidated Balance Sheets. The remaining purchase price of $156 million was paid upon the close of the acquisition of the related assets. As additional consideration, Adelphia Gateway will pay Talen specified amounts of up to $23 million contingent upon the achievement of certain regulatory approvals and binding natural gas capacity commitments. On December 20, 2019, FERC issued Adelphia Gateway’s Certificate of Public Convenience and Necessity. Adelphia Gateway has agreed to provide firm natural gas transportation service for 10 years following the closing to two power generators owned by affiliates of Talen that are currently served by the pipeline.
The Company evaluated the acquisition under the guidance of ASU 2017-01, Clarifying the Definition of a Business and concluded that the acquisition did not meet the definition of a business, as almost all of the fair value relates to the pipeline assets acquired. As a result, the purchase was accounted for as an asset acquisition.
The following table summarizes the consideration transferred and purchase price allocation based upon the relative fair value of the assets acquired and liabilities to be assumed:
| | | | | |
(Thousands) | Estimated Fair Value |
Purchase price | $ | 166,000 | |
Net working capital adjustment | (449) | |
Transaction costs | 9,456 | |
Total costs capitalized | $ | 175,007 | |
Identifiable assets acquired | |
Property, plant and equipment | $ | 174,438 | |
Other | 1,018 | |
Net working capital | (449) | |
Net assets acquired | $ | 175,007 | |
The Company utilized a discounted cash flow valuation technique to measure the fair value of the property, plant, and equipment based upon the present value of their future economic benefits reflecting current market expectations. The assumptions used in the discounted cash flow valuation are not observable in active markets and thus represent non-recurring Level 3 fair value measurements.
Property, plant and equipment consist primarily of pipeline related assets, land, buildings and other structures and software. Depreciation is computed on a straight-line basis over the estimated useful life of the assets, ranging from five to 30 years, based on various classes of depreciable property. Other assets consist primarily of an assembled workforce and base natural gas.
Asset retirement obligations are initially recognized when the legal obligation to retire an asset has been incurred and a reasonable estimate of fair value can be made. The Company records any asset retirement obligations in the period in which information permitting a reasonable estimate of such obligation becomes available. The Company is unable to predict when, or if, the pipelines would become completely obsolete and require decommissioning. As such, upon acquisition, there were no liabilities recorded for asset retirement obligations, as both the timing and future estimates of decommissioning the pipeline was indeterminable.
Leaf River
On October 11, 2019, NJR Pipeline Company, an indirect wholly-owned subsidiary of NJR, acquired 100 percent of the issued and outstanding limited liability company interests of Leaf River Energy Center LLC for $367.5 million. The purchase price was subject to certain contractual conditions, including customary purchase price adjustments related to the amount of net working capital and transaction expenses. Leaf River owns and operates a 32.2 million Dth salt dome natural gas storage facility, located in southeastern Mississippi.
New Jersey Resources Corporation
Part I
NOTES TO UNAUDITED CONDENSED CONSOLIDATED FINANCIAL STATEMENTS (Continued)
The Company evaluated the acquisition under the guidance of ASU 2017-01, Clarifying the Definition of a Business and concluded that the acquisition did not meet the definition of a business, as almost all of the fair value relates to the natural gas storage assets acquired. As a result, the purchase was accounted for as an asset acquisition.
The following table summarizes the consideration transferred and purchase price allocation based upon the relative fair value of the assets acquired and liabilities to be assumed:
| | | | | |
(Thousands) | Estimated Fair Value |
Purchase price | $ | 367,500 | |
Net working capital adjustment | 4,111 | |
Transaction costs | 1,664 | |
Total costs capitalized | $ | 373,275 | |
Identifiable assets acquired | |
Property, plant and equipment | $ | 365,715 | |
Base gas | 3,445 | |
Other assets, net | 4 | |
Net working capital | 4,111 | |
Net assets acquired | $ | 373,275 | |
The total consideration transferred is comprised of the purchase price to the seller and the transaction costs incurred during the acquisition. The Company utilized a discounted cash flow valuation technique to measure the fair value of the property, plant, and equipment based upon the present value of their future economic benefits reflecting current market expectations. Base gas is valued based upon the estimated replacement costs associated with the respective assets.
Base gas is needed to maintain the necessary pressure to allow efficient operation of the storage facility. The base gas is determined to be recoverable and is considered a component of the facility and presented as a component in property, plant and equipment. This natural gas is not depreciated, as it is expected to be recovered and sold.
Property, plant and equipment consist primarily of surface equipment and pipelines necessary to operate the facility. Depreciation is computed on a straight-line basis over the estimated useful life of the assets, ranging from five to 50 years, based on various classes of depreciable property.
Asset retirement obligations are initially recognized when the legal obligation to retire an asset has been incurred and a reasonable estimate of fair value can be made. The Company records any asset retirement obligations in the period in which information permitting a reasonable estimate of such obligation becomes available. The Company is unable to predict when, or if, the storage facilities and related pipelines would become completely obsolete and require decommissioning. As such, upon acquisition, there were no liabilities recorded for asset retirement obligations, as both the timing and future estimates of decommissioning the storage facilities and related pipelines were indeterminable.
The assumptions used in the discounted cash flow valuation are not observable in active markets and thus represent non-recurring Level 3 fair value measurements.consolidation.
ITEM 2. MANAGEMENT’S DISCUSSION AND ANALYSIS OF FINANCIAL CONDITION AND RESULTS OF
OPERATIONS
Critical Accounting PoliciesEstimates
A summary of our critical accounting policies is included in Item 7. Management's Discussion and Analysis of Financial Condition and Results of Operations of our Annual Report on Form 10-K for the period ended September 30, 2020.2021. Our critical accounting policies have not changed from those reported in the 20202021 Annual Report on Form 10-K.
New Jersey Resources Corporation
Part I
ITEM 2. MANAGEMENT’S DISCUSSION AND ANALYSIS OF FINANCIAL CONDITION AND RESULTS OF
OPERATIONS (Continued)
Recently Issued Accounting Standards
Refer to Note 2. Summary of Significant Accounting Policies for discussion of recently issued accounting standards.
New Jersey Resources Corporation
Part I
ITEM 2. MANAGEMENT’S DISCUSSION AND ANALYSIS OF FINANCIAL CONDITION AND RESULTS OF
OPERATIONS (Continued)
Management's Overview
Consolidated
NJR is ana diversified energy services holding company providing retail natural gas service in New Jersey and wholesale natural gas and related energy services to customers in the U.S. and Canada. In addition, we invest in clean energy projects, storage and transportation assets and provide various repair, sales and installationsinstallation services. A more detailed description of our organizational structure can be found in Item 1. Business of our 20202021 Annual Report on Form 10-K.
Reporting Segments
We have four primary reporting segments as presented in the chart below:
In addition to our four reporting segments above, we have non-utility operations that either provide corporate support services or do not meet the criteria to be treated as a separate reporting segment. These operations, which comprise Home Services and Other, include: appliance repair services, sales and installations at NJRHS; andNJRHS, commercial real estate holdings at CR&R.&R and home warranty contracts at NJR Retail.
Impacts of the COVID-19 Pandemic
We continue to closely monitor developments related to the COVID-19 pandemic and have, when appropriate, taken steps intended to limit potential exposure for our employees and those we serve. We have also taken proactive steps to ensure businessserve, including continuity in the safe operation of our business. These steps include working from home for our office-based employees utilizing a newly implemented hybrid schedule, limiting direct contact with our customers and suspending late payment fees for our utility customers. And while we, along with other businesses, are continuing to return to normal operating practices, this remains an evolving situation. The timing for recovery of businesses and local economies, resurgences or mutations of the virus, and any potential future shutdowns remains unknown. Throughout the COVID-19 pandemic, we have continued to provide essential services to our
New Jersey Resources Corporation
Part I
ITEM 2. MANAGEMENT’S DISCUSSION AND ANALYSIS OF FINANCIAL CONDITION AND RESULTS OF
OPERATIONS (Continued)
customers. Both NJR and NJNG continue to have sufficient liquidity to meet their current obligations and business operations remain fundamentally unchanged at this time. This remains an evolving situation, and weWe cannot predict the nature and extent or duration of the outbreak, the effects of the pandemic on the global, national or local economy,impacts to future operations, or its effects on our financial condition, results of operations and cash flows. We cannot predict the nature and extent of impacts to future operations. We will continue to monitor developments affecting our employees, customers, and operations and take additional steps to address the COVID-19 pandemic and its impacts, as necessary.
New Jersey Resources Corporation
Part I
ITEM 2. MANAGEMENT’S DISCUSSION AND ANALYSIS OF FINANCIAL CONDITION AND RESULTS OF
OPERATIONS (Continued)
Operating Results
Net income (loss) by reporting segment and operations are as follows:
| | | Three Months Ended | | Six Months Ended | | Three Months Ended | | Six Months Ended |
| | March 31, | | March 31, | | March 31, | | March 31, |
| (Thousands) | (Thousands) | 2021 | | 2020 | | 2021 | | 2020 | (Thousands) | 2022 | | 2021 | | 2022 | | 2021 |
| Net income (loss) | Net income (loss) | | Net income (loss) | |
| Natural Gas Distribution | Natural Gas Distribution | $ | 80,541 | | 54 | % | | $ | 86,336 | | 117 | % | | $ | 130,008 | | 56 | % | | $ | 130,192 | | 87 | % | Natural Gas Distribution | $ | 102,783 | | 107 | % | | $ | 80,541 | | 54 | % | | $ | 153,863 | | 74 | % | | $ | 130,008 | | 56 | % |
| Clean Energy Ventures | Clean Energy Ventures | (8,872) | | (6) | | | (8,829) | | (12) | | | (19,146) | | (8) | | | (17,008) | | (11) | | Clean Energy Ventures | (6,491) | | (7) | | | (8,872) | | (6) | | | (13,312) | | (6) | | | (19,146) | | (8) | |
| Energy Services | Energy Services | 75,662 | | 51 | | | (8,435) | | (11) | | | 114,534 | | 49 | | | 27,590 | | 18 | | Energy Services | (3,031) | | (3) | | | 75,662 | | 51 | | | 62,713 | | 30 | | | 114,534 | | 49 | |
| Storage and Transportation | Storage and Transportation | 4,711 | | 3 | | | 4,258 | | 6 | | | 8,219 | | 4 | | | 7,262 | | 5 | | Storage and Transportation | 4,625 | | 5 | | | 4,711 | | 3 | | | 7,587 | | 4 | | | 8,219 | | 4 | |
| Home Services and Other | Home Services and Other | 747 | | — | | | 148 | | — | | | 685 | | — | | | 1,257 | | 1 | | Home Services and Other | 451 | | — | | | 747 | | — | | | 898 | | — | | | 685 | | — | |
Eliminations (1) | Eliminations (1) | (2,980) | | (2) | | | 368 | | — | | | (3,446) | | (1) | | | 305 | | — | | Eliminations (1) | (2,302) | | (2) | | | (2,980) | | (2) | | | (4,402) | | (2) | | | (3,446) | | (1) | |
| Total | Total | $ | 149,809 | | 100 | % | | $ | 73,846 | | 100 | % | | $ | 230,854 | | 100 | % | | $ | 149,598 | | 100 | % | Total | $ | 96,035 | | 100 | % | | $ | 149,809 | | 100 | % | | $ | 207,347 | | 100 | % | | $ | 230,854 | | 100 | % |
(1) Consists of transactions between subsidiaries that are eliminated in consolidation.
The increasedecrease in net income during the three and six months ended March 31, 2021,2022, compared with the three and six months ended March 31, 2020,2021, was driven primarily by increaseddecreased earnings at Energy Services due toresulting from extreme cold weather and strong market demand relatedduring February 2021, which did not reoccur to the extreme cold weathersame extent during February 2021. The primary drivers2022, partially offset by the commencement of the changes noted above are describedAMAs at Energy Services with an investment grade public utility, which began in more detail in the individual segment discussions.November 2021 and increased earnings at NJNG due to higher base rates.
Assets by reporting segment and operations are as follows:
| | (Thousands) | (Thousands) | March 31,
2021 | | September 30,
2020 | (Thousands) | March 31,
2022 | | September 30,
2021 |
| Assets | Assets | | Assets | |
| Natural Gas Distribution | Natural Gas Distribution | $ | 3,593,630 | | 66 | % | | $ | 3,531,477 | | 66 | % | Natural Gas Distribution | $ | 3,844,036 | | 66 | % | | $ | 3,707,461 | | 65 | % |
Clean Energy Ventures | Clean Energy Ventures | 848,290 | | 16 | | | 814,277 | | 15 | | Clean Energy Ventures | 970,599 | | 17 | | | 914,788 | | 16 | |
| Energy Services | Energy Services | 224,069 | | 4 | | | 244,836 | | 5 | | Energy Services | 248,112 | | 4 | | | 365,423 | | 6 | |
| Storage and Transportation | Storage and Transportation | 874,976 | | 16 | | | 844,799 | | 16 | | Storage and Transportation | 965,615 | | 16 | | | 862,407 | | 15 | |
| Home Services and Other | Home Services and Other | 136,531 | | 3 | | | 138,375 | | 3 | | Home Services and Other | 136,300 | | 2 | | | 162,134 | | 3 | |
Intercompany assets (1) | Intercompany assets (1) | (252,362) | | (5) | | | (257,287) | | (5) | | Intercompany assets (1) | (294,658) | | (5) | | | (289,935) | | (5) | |
| Total | Total | $ | 5,425,134 | | 100 | % | | $ | 5,316,477 | | 100 | % | Total | $ | 5,870,004 | | 100 | % | | $ | 5,722,278 | | 100 | % |
(1)Consists of transactions between subsidiaries that are eliminated in consolidation.
The increase in assets was due primarily to additional investment in utility plant and an increase in our Natural Gas Distribution segment, solar asset investments at Clean Energy Ventures, along withincreased infrastructure spend in Storage and Transportation primarily related to the on-going conversion and construction of the southern end of Adelphia Gateway and an increase in accounts receivable and at our Natural Gas Distribution andsegment, partially offset by lower gas in storage at Energy Services segments.and our Natural Gas Distribution segment.
Non-GAAP Financial Measures
Our management uses NFE, a non-GAAP financial measure, when evaluating our operating results. Energy Services economically hedges its natural gas inventory with financial derivative instruments. NFE is a measure of the earnings based on eliminating timing differences surrounding the recognition of certain gains or losses, to effectively match the earnings effects of the economic hedges with the physical sale of natural gas and, therefore, eliminates the impact of volatility to GAAP earnings associated with the derivative instruments. There is a related tax effect on current and deferred income tax expense corresponding with this non-GAAP measure. To the extent we utilize forwards, futures, or other derivatives to hedge forecasted SREC production, unrealized gains and losses are also eliminated from NFE. NFE also excludes impairment charges associated with equity method investments, which are a non-cash charge considered unusual in nature that occur infrequently and are not
New Jersey Resources Corporation
Part I
ITEM 2. MANAGEMENT’S DISCUSSION AND ANALYSIS OF FINANCIAL CONDITION AND RESULTS OF
OPERATIONS (Continued)
indicative of the Company's performance for NFE purposes.our ongoing operations. Included in the tax effects are current and deferred income tax expense corresponding with the components of NFE.
GAAP requires us, during the interim periods, to estimate our annual effective tax rate and use this rate to calculate the year-to-date tax provision. We also determine an annual estimated effective tax rate for NFE purposes and calculate a quarterly tax adjustment based on the differences between our forecasted net income and our forecasted NFE for the fiscal year. Since the annual estimated effective tax rate is based on certain forecasted assumptions, the rate and resulting NFE are subject to change. No adjustment is needed during the fourth quarter, since the actual effective tax rate is calculated at year end.
New Jersey Resources Corporation
Part I
ITEM 2. MANAGEMENT’S DISCUSSION AND ANALYSIS OF FINANCIAL CONDITION AND RESULTS OF
OPERATIONS (Continued)
Non-GAAP financial measures are not in accordance with, or an alternative to, GAAP and should be considered in addition to, and not as a substitute for or a replacement of, the comparable GAAP measure and should be read in conjunction with those GAAP results. Below is a reconciliation of consolidated net income, the most directly comparable GAAP measure, to NFE:
| | | Three Months Ended | | Six Months Ended | | Three Months Ended | | Six Months Ended |
| | March 31, | | March 31, | | March 31, | | March 31, |
| (Thousands, except per share data) | (Thousands, except per share data) | 2021 | 2020 | | 2021 | 2020 | (Thousands, except per share data) | 2022 | 2021 | | 2022 | 2021 |
| Net income | Net income | $ | 149,809 | | $ | 73,846 | | | $ | 230,854 | | $ | 149,598 | | Net income | $ | 96,035 | | $ | 149,809 | | | $ | 207,347 | | $ | 230,854 | |
| Add: | Add: | | Add: | |
| Unrealized gain on derivative instruments and related transactions | 29,255 | | (3,773) | | | (8,235) | | (45,539) | | |
| Unrealized loss (gain) on derivative instruments and related transactions | | Unrealized loss (gain) on derivative instruments and related transactions | 42,022 | | 29,255 | | | (40,169) | | (8,235) | |
| Tax effect | Tax effect | (6,954) | | 897 | | | 1,958 | | 10,828 | | Tax effect | (9,980) | | (6,954) | | | 9,556 | | 1,958 | |
Effects of economic hedging related to natural gas inventory (1) | Effects of economic hedging related to natural gas inventory (1) | (7,209) | | 14,622 | | | (14,741) | | 5,735 | | Effects of economic hedging related to natural gas inventory (1) | 1,155 | | (7,209) | | | 24,732 | | (14,741) | |
| Tax effect | Tax effect | 1,713 | | (3,475) | | | 3,503 | | (1,363) | | Tax effect | (274) | | 1,713 | | | (5,877) | | 3,503 | |
| | NFE tax adjustment | NFE tax adjustment | 3,990 | | 2,174 | | | 1,922 | | (37) | | NFE tax adjustment | 1,248 | | 3,990 | | | 387 | | 1,922 | |
| Net financial earnings | Net financial earnings | $ | 170,604 | | $ | 84,291 | | | $ | 215,261 | | $ | 119,222 | | Net financial earnings | $ | 130,206 | | $ | 170,604 | | | $ | 195,976 | | $ | 215,261 | |
| Basic earnings per share | Basic earnings per share | $ | 1.56 | | $ | 0.78 | | | $ | 2.40 | | $ | 1.60 | | Basic earnings per share | $ | 1.00 | | $ | 1.56 | | | $ | 2.16 | | $ | 2.40 | |
| Add: | Add: | | Add: | |
| Unrealized gain on derivative instruments and related transactions | 0.30 | | (0.04) | | | (0.09) | | (0.49) | | |
| Unrealized loss (gain) on derivative instruments and related transactions | | Unrealized loss (gain) on derivative instruments and related transactions | 0.44 | | 0.30 | | | (0.42) | | (0.09) | |
| Tax effect | Tax effect | (0.08) | | 0.01 | | | 0.02 | | 0.11 | | Tax effect | (0.10) | | (0.08) | | | 0.10 | | 0.02 | |
Effects of economic hedging related to natural gas inventory (1) | Effects of economic hedging related to natural gas inventory (1) | (0.07) | | 0.15 | | | (0.15) | | 0.06 | | Effects of economic hedging related to natural gas inventory (1) | 0.01 | | (0.07) | | | 0.26 | | (0.15) | |
| Tax effect | Tax effect | 0.02 | | (0.04) | | | 0.04 | | (0.01) | | Tax effect | — | | 0.02 | | | (0.06) | | 0.04 | |
| | NFE tax adjustment | NFE tax adjustment | 0.04 | | 0.02 | | | 0.02 | | — | | NFE tax adjustment | 0.01 | | 0.04 | | | — | | 0.02 | |
| Basic NFE per share | Basic NFE per share | $ | 1.77 | | $ | 0.88 | | | $ | 2.24 | | $ | 1.27 | | Basic NFE per share | $ | 1.36 | | $ | 1.77 | | | $ | 2.04 | | $ | 2.24 | |
(1)Effects of hedging natural gas inventory transactions where the economic impact is realized in a future period.
NFE by reporting segment and other operations, discussed in more detail within the operating results sections of each segment, is summarized as follows:
| | | Three Months Ended | | Six Months Ended | | Three Months Ended | | Six Months Ended |
| | March 31, | | March 31, | | March 31, | | March 31, |
| (Thousands) | (Thousands) | 2021 | | 2020 | | 2021 | | 2020 | (Thousands) | 2022 | | 2021 | | 2022 | | 2021 |
| Net financial earnings (loss) | Net financial earnings (loss) | | Net financial earnings (loss) | |
| Natural Gas Distribution | Natural Gas Distribution | $ | 80,541 | | 47 | % | | $ | 86,336 | | 102 | % | | $ | 130,008 | | 60 | % | | $ | 130,192 | | 109 | % | Natural Gas Distribution | $ | 102,783 | | 79 | % | | $ | 80,541 | | 47 | % | | $ | 153,863 | | 79 | % | | $ | 130,008 | | 60 | % |
| Clean Energy Ventures | Clean Energy Ventures | (8,872) | | (5) | | | (8,829) | | (10) | | | (19,146) | | (9) | | | (17,008) | | (14) | | Clean Energy Ventures | (6,491) | | (5) | | | (8,872) | | (5) | | | (13,312) | | (7) | | | (19,146) | | (9) | |
| Energy Services | Energy Services | 96,528 | | 57 | | | 2,487 | | 3 | | | 98,028 | | 46 | | | (2,635) | | (2) | | Energy Services | 29,940 | | 23 | | | 96,528 | | 57 | | | 47,507 | | 24 | | | 98,028 | | 46 | |
| Storage and Transportation | Storage and Transportation | 4,711 | | 3 | | | 4,258 | | 5 | | | 8,219 | | 4 | | | 7,262 | | 6 | | Storage and Transportation | 4,625 | | 4 | | | 4,711 | | 3 | | | 7,587 | | 4 | | | 8,219 | | 4 | |
| Home Services and Other | Home Services and Other | 747 | | — | | | 148 | | — | | | 685 | | — | | | 1,257 | | 1 | | Home Services and Other | 451 | | — | | | 747 | | — | | | 898 | | — | | | 685 | | — | |
Eliminations (1) | Eliminations (1) | (3,051) | | (2) | | | (109) | | — | | | (2,533) | | (1) | | | 154 | | — | | Eliminations (1) | (1,102) | | (1) | | | (3,051) | | (2) | | | (567) | | — | | | (2,533) | | (1) | |
| Total | Total | $ | 170,604 | | 100 | % | | $ | 84,291 | | 100 | % | | $ | 215,261 | | 100 | % | | $ | 119,222 | | 100 | % | Total | $ | 130,206 | | 100 | % | | $ | 170,604 | | 100 | % | | $ | 195,976 | | 100 | % | | $ | 215,261 | | 100 | % |
(1) Consists of transactions between subsidiaries that are eliminated in consolidation.
The increasedecrease in NFE during the three and six months ended March 31, 2021,2022, compared with the three and six months ended March 31, 2020,2021, was due primarily to increaseddecreased earnings at Energy Services related to the extreme cold weather during February 2021, which did not reoccur to the same extent during 2022, partially offset by the commencement of AMAs at Energy Services and higher base rates at NJNG as previously discussed.
New Jersey Resources Corporation
Part I
ITEM 2. MANAGEMENT’S DISCUSSION AND ANALYSIS OF FINANCIAL CONDITION AND RESULTS OF
OPERATIONS (Continued)
Natural Gas Distribution Segment
Overview
Our Natural Gas Distribution segment is comprised of NJNG, a natural gas utility that provides regulated retail natural gas service throughout Burlington, Middlesex, Monmouth, Morris, Ocean, and OceanSussex counties in New Jersey to approximately 561,500568,100 residential and commercial customers in its service territory and also participates in the off-system sales and capacity release markets. The business is subject to various risks, including those risks associated with COVID-19, andwhich may include but isare not limited to impacts to customer growth and customer usage, customer collections, the timing and costs of capital expenditures and construction of infrastructure projects, operating and financing costs, fluctuations in commodity prices and customer
New Jersey Resources Corporation
Part I
ITEM 2. MANAGEMENT’S DISCUSSION AND ANALYSIS OF FINANCIAL CONDITION AND RESULTS OF
OPERATIONS (Continued)
conservation efforts. In addition, NJNG may be subject to adverse economic conditions, certain regulatory actions, environmental remediation and severe weather conditions. It is often difficult to predict the impact of events or trends associated with these risks.
NJNG’s business is seasonal by nature, as weather conditions directly influence the volume of natural gas delivered to customers on an annual basis. Specifically, customer demand substantially increases during the winter months when natural gas is used for heating purposes. As a result, NJNG receivesgenerates most of its natural gas distribution revenues during the first and second fiscal quarters and is subject to variations in earnings and working capital during the fiscal year.
As a regulated company, NJNG is required to recognize the impact of regulatory decisions on its financial statements. See Note 4. Regulation in the accompanying Unaudited Condensed Consolidated Financial Statements for a more detailed discussion on regulatory actions, including filings related to programs and associated expenditures, as well as rate requests related to recovery of capital investments and operating costs.
NJNG’s operations are managed with the goal of providing safe and reliable service, growing its customer base, diversifying its utility gross margin, promoting clean energy programs and mitigating the risks discussed above.
Base Rate Case
On November 17, 2021, the BPU issued an order adopting a stipulation of settlement approving a $79.0 million increase to base rates, effective December 1, 2021. In addition, the order also included approval for the final increase for the NJ RISE/SAFE II programs, which totaled $269,000. These increases include an overall rate of return on rate base of 6.84 percent, return on common equity of 9.6 percent, a common equity ratio of 54.0 percent and a composite depreciation rate of 2.78 percent.
Infrastructure projectsProjects
NJNG has significant annual capital expenditures associated with the management of its natural gas distribution and transmission system, including new utility plant associated with customer growth and its associated pipeline integrity management and infrastructure programs. Below is a summary of NJNG’s capital expenditures, including accruals, for the six months ended March 31, 2021,2022, and estimates of expected investments for fiscal 20212022 and 2022:2023:
New Jersey Resources Corporation
Part I
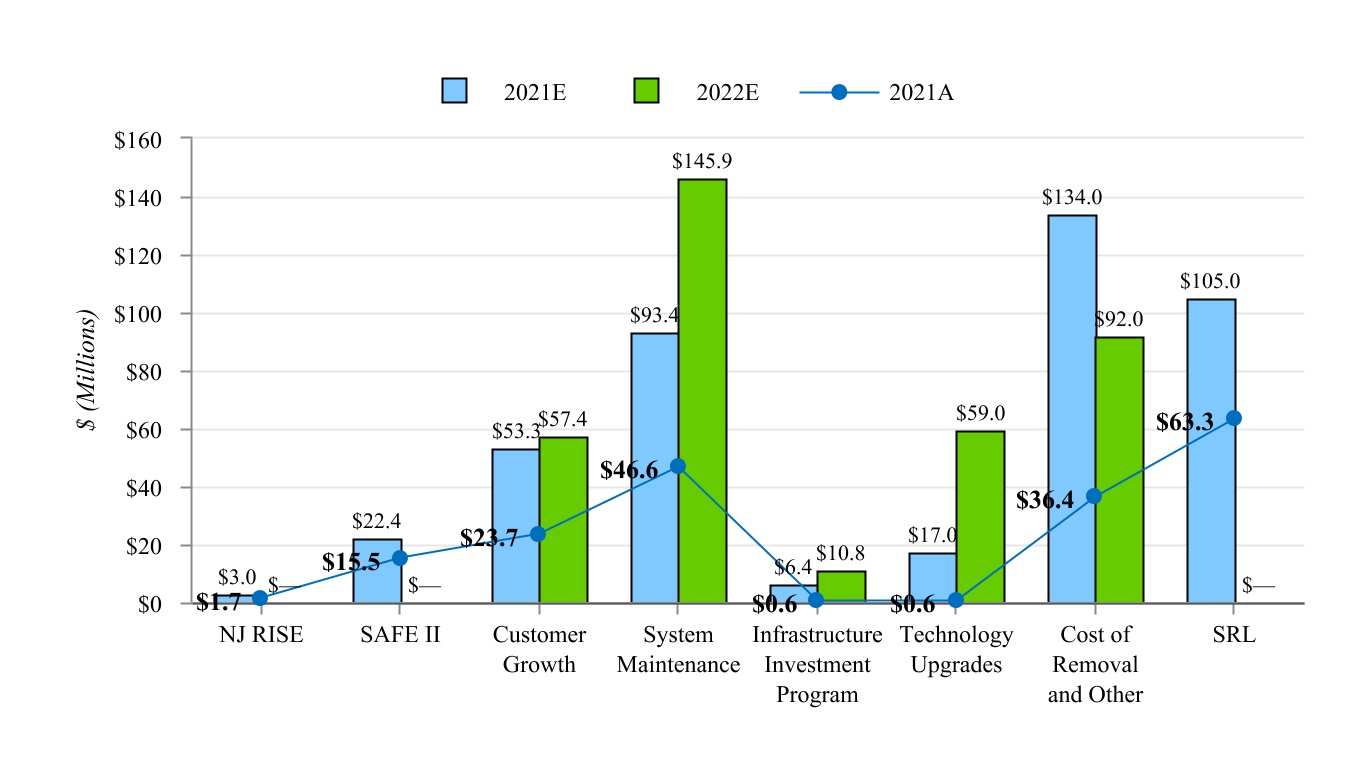
OPERATIONS (Continued)
Estimated capital expenditures are reviewed on a regular basis and may vary based on the ongoing effects of regulatory oversight, environmental regulations, unforeseen events and the ability to access capital.
Infrastructure Investment Program
OnIn February 28, 2019, NJNG filed a petition with the BPU seeking authority to implement a five-year IIP. The IIP consistsconsisted of two components: transmission and distribution investments and information technology replacement and enhancements. The total investment for the IIP iswas approximately $507$507.0 million. All approved investments will be recovered through annual filings to adjust base rates. OnIn October 28, 2020, the BPU approved the Company’s transmission and
New Jersey Resources Corporation
Part I
ITEM 2. MANAGEMENT’S DISCUSSION AND ANALYSIS OF FINANCIAL CONDITION AND RESULTS OF
OPERATIONS (Continued)
distribution component of the IIP for $150$150.0 million over five years, effective November 1, 2020. NJNG voluntarily withdrew the information technology upgrade component and will seek to recover associated costs in future rate case proceedings. On March 31, 2022, the Company filed its first rate recovery request for its BPU approved IIP with capital expenditures estimated at $25.6 million, including AFUDC through June 30, 2022.
SAFE II and NJ RISE
NJNG continues to implement BPU-approved infrastructure projects that are designed to enhance the reliability and integrity of NJNG’s natural gas distribution system.
The BPU approved the 5-year SAFE II program and the associated rate mechanism to replace the remaining unprotected steel mains and services from NJNG’s natural gas distribution system at an estimated cost of approximately $200 million, excluding AFUDC. With the approval of SAFE II, $157.5 million was approved for accelerated cost recovery methodology. The remaining $42.5 million in capital expenditures must bewas requested for recovery in base rate cases, of which $23.4 million was approved in NJNG’s 2019 base rate case and $19.1 million was approved in the 2021 base rate case.
The BPU approved NJNG’s NJ RISE capital infrastructure program, which consists of six capital investment projects estimated to cost $102.5 million, excluding AFUDC, for natural gas distribution storm hardening and mitigation projects, along with associated depreciation expense. These system enhancements are intended to minimize service impacts during extreme weather events to customers in the most storm-prone areas of NJNG’s service territory. Recovery of NJ RISE investments is included in NJNG’s base rates.
OnIn March 30, 2020, NJNG filed a petition with the BPU requesting a rate increase of approximately $7.4 million for the recovery associated with NJ RISE and SAFE II capital investment costs of approximately $57.9 million. On July 24, 2020, the Company updated the filing with actual information through June 30, 2020 and the revised rate increase requested was $7.1 million based on $55.1 million of actual capital investments. On September 9, 2020, the BPU approved the increase to base rate revenue, effective October 1, 2020.
On March 31, 2021, NJNG filed a petition with the BPU requesting the final base rate increase of approximately $311,000 for the recovery associated with NJ RISE and SAFE II capital investments cost of approximately $3.4 million made through June 30, 2021. ThisIn June 2021, this filing will be updated for actual information through June 30, 2021. Changes to base rates are anticipated to be effective October 1, 2021.
Southern Reliability Link
The SRL is an approximately 30-mile, 30-inch transmission main designed to support improved system reliability and integrity inwas consolidated with the southern portion of NJNG’s service territory. Construction began on the project in December 2018 and is estimated to cost between $290 million and $310 million upon completion. On March 30, 2021 NJNG filed a base rate case withcase. On November 17, 2021, the BPU requesting rate recoveryissued an order for SRLthe consolidated matter which included approval for the final increase for the NJ RISE and other infrastructure investments. SRL is expectedSAFE II programs of $269,000. With this approval, the filings with respect to be placed in service during fiscal 2021.NJ RISE and SAFE II are complete.
Customer Growth
In conducting NJNG's business, management focuses on factors it believes may have significant influence on its future financial results. NJNG's policy is to work with all stakeholders, including customers, regulators and policymakers, to achieve favorable results. These factors include the rate of NJNG's customer growth in its service territory, which can be influenced by political and regulatory policies, the delivered cost of natural gas compared with competing fuels, interest rates and general economic and business conditions.
NJNG's total customers include the following:
| | | March 31,
2021 | March 31,
2020 | | March 31, 2022 | March 31,
2021 |
| Firm customers | Firm customers | | Firm customers | |
| Residential | Residential | 498,583 | | 491,419 | | Residential | 508,729 | | 498,583 | |
| Commercial, industrial & other | Commercial, industrial & other | 31,313 | | 30,545 | | Commercial, industrial & other | 32,116 | | 31,313 | |
| Residential transport | Residential transport | 22,574 | | 22,783 | | Residential transport | 18,675 | | 22,574 | |
| Commercial transport | Commercial transport | 8,971 | | 9,230 | | Commercial transport | 8,551 | | 8,971 | |
| Total firm customers | Total firm customers | 561,441 | | 553,977 | | Total firm customers | 568,071 | | 561,441 | |
| Other | Other | 45 | | 59 | | Other | 53 | | 45 | |
| Total customers | Total customers | 561,486 | | 554,036 | | Total customers | 568,124 | | 561,486 | |
New Jersey Resources Corporation
Part I
ITEM 2. MANAGEMENT’S DISCUSSION AND ANALYSIS OF FINANCIAL CONDITION AND RESULTS OF
OPERATIONS (Continued)
During the six months ended March 31, 20212022 and 2020,2021, respectively, NJNG added 3,6943,579 and 4,3393,694 new customers. NJNG expects these new customer additions, and those customers who added additional natural gas services to their premises to contribute approximately $2.7$2.9 million toof incremental utility gross margin during the fiscal year.on an annualized basis.
NJNG continues to expect to add approximately 28,000 to 30,000 new customers during the three-year period of fiscal 20212022 to 2023.2024. Based on information from municipalities and developers, as well as external industry analysts and management's experience, NJNG estimates that approximately 65 percent of the growth will come from new construction markets and 35 percent from customer conversions to natural gas from other fuel sources. This new customer and conversion growth would increase utility gross margin under NJNG's base rates by approximately $6.3$19.1 million annually, as calculated under NJNG's CIP tariff. See the Natural Gas Distribution Segment Operating Results section of Item 2. Management's Discussion and Analysis of Financial Condition and Results of Operations that follows for a definition and further discussion of utility gross margin.
Energy Efficiency Programs
SAVEGREEN conducts home energy audits and provides various grants, incentives and financing alternatives designed to encourage the installation of high-efficiency heating and cooling equipment and other energy efficiency upgrades. Depending on the specific incentive or approval, NJNG recovers costs associated with the programs over a two- to 10-year period through a tariff rider mechanism. OnIn March 3, 2021, the BPU approved a three-year SAVEGREEN program consisting of approximately $126.1 million of direct investment, $109.4 million in financing options, and approximately $23.4 million in operation and maintenance expenses, to bewhich resulted in a $15.6 million annual recovery increase, effective July 1, 2021.
OnIn May 29, 2020, NJNG filed a petition with the BPU to minimally decrease its EE recovery rate. Throughout the course of the proceeding, NJNG updated the filing with additional actual information. Based on the updated information,In October 2020, the BPU approved NJNG to maintain its existing rate, which will result in an annual recovery of approximately $11.4 million, effective November 1, 2020.
In June 2021, NJNG submitted its annual cost recovery filing for the SAVEGREEN programs established from 2010 through 2018. On January 26, 2022, the BPU approved the stipulation, which increases annual recoveries by $2.2 million, effective February 1, 2022.
The following table summarizes, loans, grants, rebates and related investments as of:
| | (Thousands) | (Thousands) | March 31,
2021 | September 30,
2020 | (Thousands) | March 31, 2022 | September 30,
2021 |
| Loans | Loans | $ | 126,400 | | $ | 119,400 | | Loans | $ | 142,400 | | $ | 132,800 | |
| Grants, rebates and related investments | Grants, rebates and related investments | 82,900 | | 80,500 | | Grants, rebates and related investments | 112,700 | | 98,100 | |
| Total | Total | $ | 209,300 | | $ | 199,900 | | Total | $ | 255,100 | | $ | 230,900 | |
Program recoveries from customers during the six months ended March 31, 2022 and 2021, and 2020, were $5.3$12.5 million and $4.5$5.3 million, respectively. The recovery includes a weighted average cost of capital that ranges from 6.69 percent to 7.76 percent, with a return on equity of 9.759.6 percent to 10.3 percent.
Conservation Incentive Program/BGSS
The CIP facilitates normalizing NJNG’s utility gross margin for variances not only due to weather but also for other factors affecting customer usage, such as conservation and energy efficiency. Recovery of utility gross margin for the non-weather variance through the CIP is limited to the amount of certain natural gas supply cost savings achieved and is subject to a variable margin revenue test. Additionally, recovery of the CIP utility gross margin is subject to an annual earnings test. An annual review of the CIP must be filed by June 1, coincident with NJNG’s annual BGSS filing, during which NJNG can request rate changes to the CIP. In May 2014, the BPU approved the continuation of the CIP program with no expiration date.
NJNG's total utility firm gross margin includes the following adjustments related to the CIP mechanism:
| | | | | | | | | | | | | | |
| Three Months Ended | Six Months Ended |
| March 31, | March 31, |
| (Thousands) | 2021 | 2020 | 2021 | 2020 |
Weather (1) | $ | 6,335 | | $ | 25,363 | | $ | 12,790 | | $ | 23,144 | |
| Usage | (3,839) | | (2,321) | | (3,245) | | (1,278) | |
| Total | $ | 2,496 | | $ | 23,042 | | $ | 9,545 | | $ | 21,866 | |
(1)Compared with the 20-year average, weather was 4.1 percent warmer-than-normal and 19.8 percent warmer-than-normal during the three months ended March 31, 2021 and 2020, respectively and 6.4 percent warmer-than-normal and 11.2 percent warmer-than-normal during the.six months ended March 31, 2021 and 2020, respectively.
New Jersey Resources Corporation
Part I
ITEM 2. MANAGEMENT’S DISCUSSION AND ANALYSIS OF FINANCIAL CONDITION AND RESULTS OF
OPERATIONS (Continued)
NJNG's total utility firm gross margin includes the following adjustments related to the CIP mechanism:
| | | | | | | | | | | | | | |
| Three Months Ended | Six Months Ended |
| March 31, | March 31, |
| (Thousands) | 2022 | 2021 | 2022 | 2021 |
Weather (1) | $ | 5,523 | | $ | 6,335 | | $ | 21,457 | | $ | 12,790 | |
| Usage | 3,057 | | (3,839) | | 1,984 | | (3,245) | |
| Total | $ | 8,580 | | $ | 2,496 | | $ | 23,441 | | $ | 9,545 | |
(1)Compared with the 20-year average, weather was 3.0 percent warmer-than-normal and 4.1 percent warmer-than-normal during the three months ended March 31, 2022 and 2021, respectively, and 8.7 percent warmer-than-normal and 6.4 percent warmer-than-normal during the six months ended March 31, 2022 and 2021, respectively.
Recovery of natural gas costsNatural Gas Costs
NJNG’s cost of natural gas is passed through to our customers, without markup, by applying NJNG’s authorized BGSS rate to actual therms delivered. There is no utility gross margin associated with BGSS costs; therefore, changes in such costs do not impact NJNG’s earnings. NJNG monitors its actual natural gas costs in comparison to its BGSS rates to manage its cash flows associated with its allowed recovery of natural gas costs, which is facilitated through BPU-approved deferred accounting and the BGSS pricing mechanism. Accordingly, NJNG occasionally adjusts its periodic BGSS rates or can issue credits or refunds, as appropriate, for its residential and small commercial customers when the commodity cost varies from the existing BGSS rate. BGSS rates for its large commercial customers are adjusted monthly based on NYMEX prices.
NJNG’s residential and commercial markets are currently open to competition, and its rates are segregated between BGSS (i.e., natural gas commodity) and delivery (i.e., transportation) components. NJNG earns utility gross margin through the delivery of natural gas to its customers and, therefore, is not negatively affected by customers who use its transportation service and purchase natural gas from another supplier. Under an existing order from the BPU, BGSS can be provided by suppliers other than the state’s natural gas utilities; however, customers who purchase natural gas from another supplier continue to use NJNG for transportation service.
On March 27, 2020, the BPU approved, on a final basis, a decrease to NJNG’s BGSS rate for residential and small commercial customers, an increase to its balancing charge rate, resulting in a $2.0 million decrease to the annual revenues credited to BGSS, as well as changes to the CIP rates, which resulted in a $10.6 million annual recovery increase, effective October 1, 2019.
On November 20, 2020,During fiscal 2021, NJNG notified the BPU of its intent to provide BGSS bill credits to residential and small commercial sales customers effective December 1, 2020 to December 31, 2020. On December 22, 2020, NJNG notified the BPU of the extension of the BGSS bill credits through January 31, 2021.customers. The actual bill credits given to customers totaled $20.6 million, $19.3 million net of tax.
On March 3,November 17, 2021, the BPU approved on a final basis, NJNG’s annual petition to modify its BGSS, balancing charge and CIP rates for residential and small commercial customers. The rate changes resulted in a $20.4$2.9 million decreaseincrease to the annual revenues credited to BGSS, a $3.8$13.0 million annual decreaseincrease related to its balancing charge, as well as changes to CIP rates, which resultedresult in a $16.5$6.3 million annual recovery decrease, effective December 1, 2021. On November 19, 2021, NJNG submitted notification of its intent to self-implement an increase to its BGSS rate, which result in an approximately $24.2 million increase to annual revenues credited to BGSS, effective OctoberDecember 1, 2020.2021. On April 6, 2022, the Company, BPU, and Rate Counsel executed a Stipulation for final rates. The current BGSS, CIP, and balancing charge rates remain in effect and there is no further rate impact from this filing. The balancing charge rate includes the cost of balancing natural gas deliveries with customer usage for sales and transportation customers and balancing charge revenues are credited to BGSS.
BGSS Incentive Programs
NJNG is eligible to receive financial incentives for reducing BGSS costs through a series of utility gross margin-sharing programs that include off-system sales, capacity release and storage incentive programs. These programs are designed to encourage better utilization and hedging of NJNG’s natural gas supply, transportation and storage assets. Depending on the program, NJNG shares 80 or 85 percent of utility gross margin generated by these programs with firm customers. Utility gross margin from incentive programs was $2.1$6.3 million and $1.6$2.1 million during the three months ended March 31, 20212022 and 2020,2021, respectively, and $6.7$10.1 million and $4.3$6.7 million during the six months ended March 31, 20212022 and 2020,2021, respectively.
Hedging
In order to provide relative price stability to its natural gas supply portfolio, NJNG employs a hedging strategy with the goal of having at least 75 percent of the Company's projected winter periodic BGSS natural gas sales volumes hedged by each November 1 and at least 25 percent of the projected periodic BGSS natural gas sales hedged for the following April through March period. This is accomplished with the use of various financial instruments including futures, swaps and options used in conjunction with commodity and/or weather-related hedging activity.
New Jersey Resources Corporation
Part I
ITEM 2. MANAGEMENT’S DISCUSSION AND ANALYSIS OF FINANCIAL CONDITION AND RESULTS OF
OPERATIONS (Continued)
Commodity pricesPrices
Our Natural Gas Distribution segment is affected by the price of natural gas, which can have a significant impact on our cash flows, short-term financing costs, the price of natural gas charged to our customers through the BGSS clause, our ability to collect accounts receivable, which impacts our bad debt expense, and our ability to maintain a competitive advantage over other energy sources.
New Jersey Resources Corporation
Part I
ITEM 2. MANAGEMENT’S DISCUSSION AND ANALYSIS OF FINANCIAL CONDITION AND RESULTS OF
OPERATIONS (Continued)
Natural gas commodity prices are shown in the graph below, which illustrates the daily natural gas prices(1) in the Northeast market region, also known as TETCO M-3.
(1) Data sourcesourced from S&PStandard & Poor's Financial Services, LLC Global Platts.
The maximum price per MMBtu was $14.57$17.69 and $5.59$14.57 and the minimum price was $0.28$2.42 and $0.68$0.28 for the six months ended March 31, 20212022 and 2020,2021, respectively. A more detailed discussion of the impacts of the price of natural gas on operating revenues, natural gas purchases and cash flows can be found in the Operating Results of Operations and Cash Flow sections of Item 2. Management's Discussion and Analysis of Financial Condition and Results of Operations.
Societal Benefits ChargeNon-GAAP Financial Measures
NJNG’s qualifying customers are eligible forOur management uses NFE, a non-GAAP financial measure, when evaluating our operating results. Energy Services economically hedges its natural gas inventory with financial derivative instruments. NFE is a measure of the USF program, which is administered byearnings based on eliminating timing differences surrounding the New Jersey Departmentrecognition of Community Affairs,certain gains or losses, to help make energy bills more affordable. On June 25, 2020, NJNG filed its annual USF compliance filing proposing a decrease toeffectively match the statewide USF rate, which will result in annual decreasesearnings effects of approximately $400,000. On September 23, 2020, the BPU approved the decrease, effective October 1, 2020.
On March 16, 2020, the BPU approved on a final basis NJNG's annual SBC application including recovery of remediation expenses, an increase in the RAC of approximately $1.2 million annually and an annual decrease to the NJCEP factor of $600,000, which was effective April 1, 2020.
On April 7, 2021, the BPU approved on a final basis NJNG's annual SBC application to recover remediation expenses, including an increase in the RAC, of approximately $1.3 million annually and an increase to the NJCEP factor, of approximately $6.0 million, which was effective April 1, 2021.
Environmental Remediation
NJNG is responsible for the environmental remediation of former MGP sites, which contain contaminated residues from former gas manufacturing operations that ceased operating at these sites by the mid-1950s and, in some cases, had been discontinued many years earlier. Actual MGP remediation costs may vary from management’s estimates due to the developing nature of remediation requirements, regulatory decisions by the NJDEP and related litigation. NJNG reviews these costs at the end of each fiscal year and adjusts its liability and corresponding regulatory asset as necessary to reflect its expected future remediation obligation. Accordingly, NJNG recognized a regulatory asset and an obligation of $143.5 million as of March 31, 2021, a decrease of $7.1 million comparedeconomic hedges with the prior fiscal period.physical sale of natural gas and, therefore, eliminates the impact of volatility to GAAP earnings associated with the derivative instruments. To the extent we utilize forwards, futures, or other derivatives to hedge forecasted SREC production, unrealized gains and losses are also eliminated from NFE. NFE also excludes impairment charges associated with equity method investments, which are a non-cash charge considered unusual in nature that occur infrequently and are not
New Jersey Resources Corporation
Part I
ITEM 2. MANAGEMENT’S DISCUSSION AND ANALYSIS OF FINANCIAL CONDITION AND RESULTS OF
OPERATIONS (Continued)
In June 2019,indicative of the Company's performance for our ongoing operations. Included in the tax effects are current and deferred income tax expense corresponding with the components of NFE.
GAAP requires us, during the interim periods, to estimate our annual effective tax rate and use this rate to calculate the year-to-date tax provision. We also determine an annual estimated effective tax rate for NFE purposes and calculate a quarterly tax adjustment based on the differences between our forecasted net income and our forecasted NFE for the fiscal year. Since the annual estimated effective tax rate is based on certain forecasted assumptions, the rate and resulting NFE are subject to change. No adjustment is needed during the fourth quarter, since the actual effective tax rate is calculated at year end.
Non-GAAP financial measures are not in accordance with, or an alternative to, GAAP and should be considered in addition to, and not as a substitute for or a replacement of, the comparable GAAP measure and should be read in conjunction with those GAAP results. Below is a reconciliation of consolidated net income, the most directly comparable GAAP measure, to NFE:
| | | | | | | | | | | | | | | | | |
| Three Months Ended | | Six Months Ended |
| March 31, | | March 31, |
| (Thousands, except per share data) | 2022 | 2021 | | 2022 | 2021 |
| Net income | $ | 96,035 | | $ | 149,809 | | | $ | 207,347 | | $ | 230,854 | |
| Add: | | | | | |
| Unrealized loss (gain) on derivative instruments and related transactions | 42,022 | | 29,255 | | | (40,169) | | (8,235) | |
| Tax effect | (9,980) | | (6,954) | | | 9,556 | | 1,958 | |
Effects of economic hedging related to natural gas inventory (1) | 1,155 | | (7,209) | | | 24,732 | | (14,741) | |
| Tax effect | (274) | | 1,713 | | | (5,877) | | 3,503 | |
| | | | | |
| | | | | |
| NFE tax adjustment | 1,248 | | 3,990 | | | 387 | | 1,922 | |
| Net financial earnings | $ | 130,206 | | $ | 170,604 | | | $ | 195,976 | | $ | 215,261 | |
| Basic earnings per share | $ | 1.00 | | $ | 1.56 | | | $ | 2.16 | | $ | 2.40 | |
| Add: | | | | | |
| Unrealized loss (gain) on derivative instruments and related transactions | 0.44 | | 0.30 | | | (0.42) | | (0.09) | |
| Tax effect | (0.10) | | (0.08) | | | 0.10 | | 0.02 | |
Effects of economic hedging related to natural gas inventory (1) | 0.01 | | (0.07) | | | 0.26 | | (0.15) | |
| Tax effect | — | | 0.02 | | | (0.06) | | 0.04 | |
| | | | | |
| | | | | |
| NFE tax adjustment | 0.01 | | 0.04 | | | — | | 0.02 | |
| Basic NFE per share | $ | 1.36 | | $ | 1.77 | | | $ | 2.04 | | $ | 2.24 | |
(1)Effects of hedging natural gas inventory transactions where the economic impact is realized in a future period.
NFE by reporting segment and other operations, discussed in more detail within the operating results sections of each segment, is summarized as follows:
| | | | | | | | | | | | | | | | | | | | | | | | | | | | | | | | | | | |
| Three Months Ended | | Six Months Ended |
| March 31, | | March 31, |
| (Thousands) | 2022 | | 2021 | | 2022 | | 2021 |
| Net financial earnings (loss) | | | | | | | | | | | |
| Natural Gas Distribution | $ | 102,783 | | 79 | % | | $ | 80,541 | | 47 | % | | $ | 153,863 | | 79 | % | | $ | 130,008 | | 60 | % |
| Clean Energy Ventures | (6,491) | | (5) | | | (8,872) | | (5) | | | (13,312) | | (7) | | | (19,146) | | (9) | |
| Energy Services | 29,940 | | 23 | | | 96,528 | | 57 | | | 47,507 | | 24 | | | 98,028 | | 46 | |
| Storage and Transportation | 4,625 | | 4 | | | 4,711 | | 3 | | | 7,587 | | 4 | | | 8,219 | | 4 | |
| Home Services and Other | 451 | | — | | | 747 | | — | | | 898 | | — | | | 685 | | — | |
Eliminations (1) | (1,102) | | (1) | | | (3,051) | | (2) | | | (567) | | — | | | (2,533) | | (1) | |
| Total | $ | 130,206 | | 100 | % | | $ | 170,604 | | 100 | % | | $ | 195,976 | | 100 | % | | $ | 215,261 | | 100 | % |
(1) Consists of transactions between subsidiaries that are eliminated in consolidation.
The decrease in NFE during the three and six months ended March 31, 2022, compared with the three and six months ended March 31, 2021, was due primarily to decreased earnings at Energy Services related to the extreme cold weather during February 2021, which did not reoccur to the same extent during 2022, partially offset by the commencement of AMAs at Energy Services and higher base rates at NJNG initiatedas previously discussed.
New Jersey Resources Corporation
Part I
ITEM 2. MANAGEMENT’S DISCUSSION AND ANALYSIS OF FINANCIAL CONDITION AND RESULTS OF
OPERATIONS (Continued)
Natural Gas Distribution Segment
Overview
Our Natural Gas Distribution segment is comprised of NJNG, a preliminary assessment of a sitenatural gas utility that provides regulated natural gas service throughout Burlington, Middlesex, Monmouth, Morris, Ocean, and Sussex counties in Aberdeen, New Jersey to determine prior ownershipapproximately 568,100 residential and if former MGP operations were active at the location. The Company iscommercial customers in its service territory and also participates in the process of conducting site investigation activitiesoff-system sales and capacity release markets. The business is subject to identify and evaluate the nature and extent of MGP-related contaminants present at the location. The costsvarious risks, including those risks associated with preliminary assessmentCOVID-19, which may include but are not limited to impacts to customer growth and site investigation activities are considered immaterialcustomer usage, customer collections, the timing and are includedcosts of capital expenditures and construction of infrastructure projects, operating and financing costs, fluctuations in commodity prices and customer conservation efforts. In addition, NJNG may be subject to adverse economic conditions, certain regulatory actions, environmental remediation and severe weather conditions. It is often difficult to predict the impact of events or trends associated with these risks.
NJNG’s business is seasonal by nature, as weather conditions directly influence the volume of natural gas delivered to customers on an annual basis. Specifically, customer demand substantially increases during the winter months when natural gas is used for heating purposes. As a componentresult, NJNG generates most of NJNG’s annual SBC applicationits natural gas distribution revenues during the first and second fiscal quarters and is subject to recover remediation expenses. We will continue to gather information to further refinevariations in earnings and enhance its estimate of potential costs for this site as it becomes available. See Note 13. Commitments and Contingent Liabilities for a more detailed description.working capital during the fiscal year.
OtherAs a regulated company, NJNG is required to recognize the impact of regulatory filings and a more detailed discussion of the filings in this section can be found indecisions on its financial statements. See Note 4. Regulation in the accompanying Unaudited Condensed Consolidated Financial Statements.Statements for a more detailed discussion on regulatory actions, including filings related to programs and associated expenditures, as well as rate requests related to recovery of capital investments and operating costs.
Operating ResultsNJNG’s operations are managed with the goal of providing safe and reliable service, growing its customer base, diversifying its utility gross margin, promoting clean energy programs and mitigating the risks discussed above.
NJNG's operating results are as follows:
| | | | | | | | | | | | | | |
| Three Months Ended | Six Months Ended |
| March 31, | March 31, |
| (Thousands) | 2021 | 2020 | 2021 | 2020 |
| Operating revenues | $ | 310,167 | | $ | 297,220 | | $ | 505,896 | | $ | 516,843 | |
| Operating expenses | | | | |
Natural gas purchases (1) | 118,452 | | 114,256 | | 177,761 | | 210,078 | |
| Operation and maintenance | 52,951 | | 39,815 | | 96,589 | | 76,000 | |
| Regulatory rider expense | 18,413 | | 15,330 | | 29,114 | | 27,072 | |
| Depreciation and amortization | 19,475 | | 18,100 | | 38,644 | | 34,917 | |
| | | | |
| Total operating expenses | 209,291 | | 187,501 | | 342,108 | | 348,067 | |
| Operating income | 100,876 | | 109,719 | | 163,788 | | 168,776 | |
| Other income, net | 4,293 | | 3,792 | | 8,189 | | 5,058 | |
| Interest expense, net of capitalized interest | 9,006 | | 7,473 | | 17,980 | | 15,305 | |
| Income tax provision | 15,622 | | 19,702 | | 23,989 | | 28,337 | |
| Net income | $ | 80,541 | | $ | 86,336 | | $ | 130,008 | | $ | 130,192 | |
(1)
Includes related party transactions
On November 17, 2021, the BPU issued an order adopting a stipulation of approximately $5.2settlement approving a $79.0 million and $2.7 millionincrease to base rates, effective December 1, 2021. In addition, the order also included approval for the three months ended March 31, 2021final increase for the NJ RISE/SAFE II programs, which totaled $269,000. These increases include an overall rate of return on rate base of 6.84 percent, return on common equity of 9.6 percent, a common equity ratio of 54.0 percent and 2020, respectively,a composite depreciation rate of 2.78 percent.
Infrastructure Projects
NJNG has significant annual capital expenditures associated with the management of its natural gas distribution and $8.4 milliontransmission system, including new utility plant associated with customer growth and $6.7 millionits associated pipeline integrity management and infrastructure programs. Below is a summary of NJNG’s capital expenditures, including accruals, for the six months ended March 31, 20212022, and 2020, respectively, the majorityestimates of which is eliminated in consolidation.expected investments for fiscal 2022 and 2023:
Operating Revenues and Natural Gas Purchases
During the three months ended March 31, 2021, compared with the three months ended March 31, 2020, operating revenues increased by 4.4 percent and natural gas purchases increased 3.7 percent. During the six months ended March 31, 2021, compared with the six months ended March 31, 2020, operating revenues decreased by 2.1 percent and natural gas purchases decreased 15.4 percent.
The factors contributing to the increases and decreases in operating revenues and natural gas purchases are as follows:
| | | | | | | | | | | | | | | | | |
| Three Months Ended | | Six Months Ended |
| March 31, | | March 31, |
| 2021 v. 2020 | | 2021 v. 2020 |
| (Thousands) | Operating
revenues | Natural gas
purchases | | Operating
revenues | Natural gas
purchases |
| Firm sales | $ | 39,422 | | $ | 17,970 | | | $ | 31,218 | | $ | 12,144 | |
| BGSS incentives | 5,193 | | 4,666 | | | (5,682) | | (8,058) | |
| SAFE II/NJ RISE | 2,681 | | — | | | 5,012 | | — | |
| Base rate impact | (117) | | — | | | 5,076 | | — | |
| CIP adjustments | (20,546) | | — | | | (12,321) | | — | |
| Average BGSS rates | (6,551) | | (6,551) | | | (14,891) | | (14,891) | |
| Bill credits | (11,071) | | (11,071) | | | (20,590) | | (20,590) | |
Other (1) | 3,936 | | (818) | | | 1,231 | | (922) | |
| Total increase (decrease) | $ | 12,947 | | $ | 4,196 | | | $ | (10,947) | | $ | (32,317) | |
(1)Other includes changes in rider rates, including those related to EE, NJCEP and other programs.
New Jersey Resources Corporation
Part I
ITEM 2. MANAGEMENT’S DISCUSSION AND ANALYSIS OF FINANCIAL CONDITION AND RESULTS OF
OPERATIONS (Continued)
Estimated capital expenditures are reviewed on a regular basis and may vary based on the ongoing effects of regulatory oversight, environmental regulations, unforeseen events and the ability to access capital.
Infrastructure Investment Program
In February 2019, NJNG filed a petition with the BPU seeking authority to implement a five-year IIP. The IIP consisted of two components: transmission and distribution investments and information technology replacement and enhancements. The total investment for the IIP was approximately $507.0 million. All approved investments will be recovered through annual filings to adjust base rates. In October 2020, the BPU approved the Company’s transmission and distribution component of the IIP for $150.0 million over five years, effective November 1, 2020. NJNG voluntarily withdrew the information technology upgrade component and will seek to recover associated costs in future rate case proceedings. On March 31, 2022, the Company filed its first rate recovery request for its BPU approved IIP with capital expenditures estimated at $25.6 million, including AFUDC through June 30, 2022.
SAFE II and NJ RISE
NJNG continues to implement BPU-approved infrastructure projects that are designed to enhance the reliability and integrity of NJNG’s natural gas distribution system.
The BPU approved the 5-year SAFE II program and the associated rate mechanism to replace the remaining unprotected steel mains and services from NJNG’s natural gas distribution system at an estimated cost of approximately $200 million, excluding AFUDC. With the approval of SAFE II, $157.5 million was approved for accelerated cost recovery methodology. The remaining $42.5 million in capital expenditures was requested for recovery in base rate cases, of which $23.4 million was approved in NJNG’s 2019 base rate case and $19.1 million was approved in the 2021 base rate case.
The BPU approved NJNG’s NJ RISE capital infrastructure program, which consists of six capital investment projects estimated to cost $102.5 million, excluding AFUDC, for natural gas distribution storm hardening and mitigation projects, along with associated depreciation expense. These system enhancements are intended to minimize service impacts during extreme weather events to customers in the most storm-prone areas of NJNG’s service territory. Recovery of NJ RISE investments is included in NJNG’s base rates.
In March 2021, NJNG filed a petition with the BPU requesting the final base rate increase for the recovery associated with NJ RISE and SAFE II capital investments cost of approximately $3.4 million made through June 30, 2021. In June 2021, this filing was consolidated with the 2021 base rate case. On November 17, 2021, the BPU issued an order for the consolidated matter which included approval for the final increase for the NJ RISE and SAFE II programs of $269,000. With this approval, the filings with respect to NJ RISE and SAFE II are complete.
Customer Growth
In conducting NJNG's business, management focuses on factors it believes may have significant influence on its future financial results. NJNG's policy is to work with all stakeholders, including customers, regulators and policymakers, to achieve favorable results. These factors include the rate of NJNG's customer growth in its service territory, which can be influenced by political and regulatory policies, the delivered cost of natural gas compared with competing fuels, interest rates and general economic and business conditions.
NJNG's total customers include the following:
| | | | | | | | |
| March 31, 2022 | March 31,
2021 |
| Firm customers | | |
| Residential | 508,729 | | 498,583 | |
| Commercial, industrial & other | 32,116 | | 31,313 | |
| Residential transport | 18,675 | | 22,574 | |
| Commercial transport | 8,551 | | 8,971 | |
| Total firm customers | 568,071 | | 561,441 | |
| Other | 53 | | 45 | |
| Total customers | 568,124 | | 561,486 | |
New Jersey Resources Corporation
Part I
ITEM 2. MANAGEMENT’S DISCUSSION AND ANALYSIS OF FINANCIAL CONDITION AND RESULTS OF
OPERATIONS (Continued)
During the six months ended March 31, 2022 and 2021, respectively, NJNG added 3,579 and 3,694 new customers. NJNG expects new customer additions, and those customers who added additional natural gas services to their premises to contribute approximately $2.9 million of incremental utility gross margin on an annualized basis.
NJNG continues to expect to add approximately 28,000 to 30,000 new customers during the three-year period of fiscal 2022 to 2024. Based on information from municipalities and developers, as well as external industry analysts and management's experience, NJNG estimates that approximately 65 percent of the growth will come from new construction markets and 35 percent from customer conversions to natural gas from other fuel sources. This new customer and conversion growth would increase utility gross margin under NJNG's base rates by approximately $19.1 million annually, as calculated under NJNG's CIP tariff.
Energy Efficiency Programs
SAVEGREEN conducts home energy audits and provides various grants, incentives and financing alternatives designed to encourage the installation of high-efficiency heating and cooling equipment and other energy efficiency upgrades. Depending on the specific incentive or approval, NJNG recovers costs associated with the programs over a two- to 10-year period through a tariff rider mechanism. In March 2021, the BPU approved a three-year SAVEGREEN program consisting of approximately $126.1 million of direct investment, $109.4 million in financing options, and approximately $23.4 million in operation and maintenance expenses, which resulted in a $15.6 million annual recovery increase, effective July 1, 2021.
In May 2020, NJNG filed a petition with the BPU to decrease its EE recovery rate. In October 2020, the BPU approved NJNG to maintain its existing rate, which will result in an annual recovery of approximately $11.4 million, effective November 1, 2020.
In June 2021, NJNG submitted its annual cost recovery filing for the SAVEGREEN programs established from 2010 through 2018. On January 26, 2022, the BPU approved the stipulation, which increases annual recoveries by $2.2 million, effective February 1, 2022.
The following table summarizes, loans, grants, rebates and related investments as of:
| | | | | | | | |
| (Thousands) | March 31, 2022 | September 30,
2021 |
| Loans | $ | 142,400 | | $ | 132,800 | |
| Grants, rebates and related investments | 112,700 | | 98,100 | |
| Total | $ | 255,100 | | $ | 230,900 | |
Program recoveries from customers during the six months ended March 31, 2022 and 2021, were $12.5 million and $5.3 million, respectively. The recovery includes a weighted average cost of capital that ranges from 6.69 percent to 7.76 percent, with a return on equity of 9.6 percent to 10.3 percent.
Conservation Incentive Program/BGSS
The CIP facilitates normalizing NJNG’s utility gross margin for variances not only due to weather but also for other factors affecting customer usage, such as conservation and energy efficiency. Recovery of utility gross margin for the non-weather variance through the CIP is limited to the amount of certain natural gas supply cost savings achieved and is subject to a variable margin revenue test. Additionally, recovery of the CIP utility gross margin is subject to an annual earnings test. An annual review of the CIP must be filed by June 1, coincident with NJNG’s annual BGSS filing, during which NJNG can request rate changes to the CIP.
New Jersey Resources Corporation
Part I
ITEM 2. MANAGEMENT’S DISCUSSION AND ANALYSIS OF FINANCIAL CONDITION AND RESULTS OF
OPERATIONS (Continued)
NJNG's total utility firm gross margin includes the following adjustments related to the CIP mechanism:
| | | | | | | | | | | | | | |
| Three Months Ended | Six Months Ended |
| March 31, | March 31, |
| (Thousands) | 2022 | 2021 | 2022 | 2021 |
Weather (1) | $ | 5,523 | | $ | 6,335 | | $ | 21,457 | | $ | 12,790 | |
| Usage | 3,057 | | (3,839) | | 1,984 | | (3,245) | |
| Total | $ | 8,580 | | $ | 2,496 | | $ | 23,441 | | $ | 9,545 | |
(1)Compared with the 20-year average, weather was 3.0 percent warmer-than-normal and 4.1 percent warmer-than-normal during the three months ended March 31, 2022 and 2021, respectively, and 8.7 percent warmer-than-normal and 6.4 percent warmer-than-normal during the six months ended March 31, 2022 and 2021, respectively.
Recovery of Natural Gas Costs
NJNG’s cost of natural gas is passed through to our customers, without markup, by applying NJNG’s authorized BGSS rate to actual therms delivered. There is no utility gross margin associated with BGSS costs; therefore, changes in such costs do not impact NJNG’s earnings. NJNG monitors its actual natural gas costs in comparison to its BGSS rates to manage its cash flows associated with its allowed recovery of natural gas costs, which is facilitated through BPU-approved deferred accounting and the BGSS pricing mechanism. Accordingly, NJNG occasionally adjusts its periodic BGSS rates or can issue credits or refunds, as appropriate, for its residential and small commercial customers when the commodity cost varies from the existing BGSS rate. BGSS rates for its large commercial customers are adjusted monthly based on NYMEX prices.
NJNG’s residential and commercial markets are currently open to competition, and its rates are segregated between BGSS (i.e., natural gas commodity) and delivery (i.e., transportation) components. NJNG earns utility gross margin through the delivery of natural gas to its customers and, therefore, is not negatively affected by customers who use its transportation service and purchase natural gas from another supplier. Under an existing order from the BPU, BGSS can be provided by suppliers other than the state’s natural gas utilities; however, customers who purchase natural gas from another supplier continue to use NJNG for transportation service.
During fiscal 2021, NJNG notified the BPU of its intent to provide BGSS bill credits to residential and small commercial sales customers. The actual bill credits given to customers totaled $20.6 million, $19.3 million net of tax.
On November 17, 2021, the BPU approved a $2.9 million increase to the annual revenues credited to BGSS, a $13.0 million annual increase related to its balancing charge, as well as changes to CIP rates, which result in a $6.3 million annual recovery decrease, effective December 1, 2021. On November 19, 2021, NJNG submitted notification of its intent to self-implement an increase to its BGSS rate, which result in an approximately $24.2 million increase to annual revenues credited to BGSS, effective December 1, 2021. On April 6, 2022, the Company, BPU, and Rate Counsel executed a Stipulation for final rates. The current BGSS, CIP, and balancing charge rates remain in effect and there is no further rate impact from this filing. The balancing charge rate includes the cost of balancing natural gas deliveries with customer usage for sales and transportation customers and balancing charge revenues are credited to BGSS.
BGSS Incentive Programs
NJNG is eligible to receive financial incentives for reducing BGSS costs through a series of utility gross margin-sharing programs that include off-system sales, capacity release and storage incentive programs. These programs are designed to encourage better utilization and hedging of NJNG’s natural gas supply, transportation and storage assets. Depending on the program, NJNG shares 80 or 85 percent of utility gross margin generated by these programs with firm customers. Utility gross margin from incentive programs was $6.3 million and $2.1 million during the three months ended March 31, 2022 and 2021, respectively, and $10.1 million and $6.7 million during the six months ended March 31, 2022 and 2021, respectively.
Hedging
In order to provide relative price stability to its natural gas supply portfolio, NJNG employs a hedging strategy with the goal of having at least 75 percent of the Company's projected winter periodic BGSS natural gas sales volumes hedged by each November 1 and at least 25 percent of the projected periodic BGSS natural gas sales hedged for the following April through March period. This is accomplished with the use of various financial instruments including futures, swaps and options used in conjunction with commodity and/or weather-related hedging activity.
New Jersey Resources Corporation
Part I
ITEM 2. MANAGEMENT’S DISCUSSION AND ANALYSIS OF FINANCIAL CONDITION AND RESULTS OF
OPERATIONS (Continued)
Commodity Prices
Our Natural Gas Distribution segment is affected by the price of natural gas, which can have a significant impact on our cash flows, short-term financing costs, the price of natural gas charged to our customers through the BGSS clause, our ability to collect accounts receivable, which impacts our bad debt expense, and our ability to maintain a competitive advantage over other energy sources.
Natural gas commodity prices are shown in the graph below, which illustrates the daily natural gas prices(1) in the Northeast market region, also known as TETCO M-3.
(1) Data sourced from Standard & Poor's Financial Services, LLC Global Platts.
The maximum price per MMBtu was $17.69 and $14.57 and the minimum price was $2.42 and $0.28 for the six months ended March 31, 2022 and 2021, respectively. A more detailed discussion of the impacts of the price of natural gas on operating revenues, natural gas purchases and cash flows can be found in the Operating Results and Cash Flow sections of Item 2. Management's Discussion and Analysis of Financial Condition and Results of Operations.
Non-GAAP Financial Measures
Our management uses NFE, a non-GAAP financial measure, when evaluating our operating results. Energy Services economically hedges its natural gas inventory with financial derivative instruments. NFE is a measure of the earnings based on eliminating timing differences surrounding the recognition of certain gains or losses, to effectively match the earnings effects of the economic hedges with the physical sale of natural gas and, therefore, eliminates the impact of volatility to GAAP earnings associated with the derivative instruments. To the extent we utilize forwards, futures, or other derivatives to hedge forecasted SREC production, unrealized gains and losses are also eliminated from NFE. NFE also excludes impairment charges associated with equity method investments, which are a non-cash charge considered unusual in nature that occur infrequently and are not
New Jersey Resources Corporation
Part I
ITEM 2. MANAGEMENT’S DISCUSSION AND ANALYSIS OF FINANCIAL CONDITION AND RESULTS OF
OPERATIONS (Continued)
indicative of the Company's performance for our ongoing operations. Included in the tax effects are current and deferred income tax expense corresponding with the components of NFE.
GAAP requires us, during the interim periods, to estimate our annual effective tax rate and use this rate to calculate the year-to-date tax provision. We also determine an annual estimated effective tax rate for NFE purposes and calculate a quarterly tax adjustment based on the differences between our forecasted net income and our forecasted NFE for the fiscal year. Since the annual estimated effective tax rate is based on certain forecasted assumptions, the rate and resulting NFE are subject to change. No adjustment is needed during the fourth quarter, since the actual effective tax rate is calculated at year end.
Non-GAAP financial measures are not in accordance with, or an alternative to, GAAP and should be considered in addition to, and not as a substitute for or a replacement of, the comparable GAAP measure and should be read in conjunction with those GAAP results. Below is a reconciliation of consolidated net income, the most directly comparable GAAP measure, to NFE:
| | | | | | | | | | | | | | | | | |
| Three Months Ended | | Six Months Ended |
| March 31, | | March 31, |
| (Thousands, except per share data) | 2022 | 2021 | | 2022 | 2021 |
| Net income | $ | 96,035 | | $ | 149,809 | | | $ | 207,347 | | $ | 230,854 | |
| Add: | | | | | |
| Unrealized loss (gain) on derivative instruments and related transactions | 42,022 | | 29,255 | | | (40,169) | | (8,235) | |
| Tax effect | (9,980) | | (6,954) | | | 9,556 | | 1,958 | |
Effects of economic hedging related to natural gas inventory (1) | 1,155 | | (7,209) | | | 24,732 | | (14,741) | |
| Tax effect | (274) | | 1,713 | | | (5,877) | | 3,503 | |
| | | | | |
| | | | | |
| NFE tax adjustment | 1,248 | | 3,990 | | | 387 | | 1,922 | |
| Net financial earnings | $ | 130,206 | | $ | 170,604 | | | $ | 195,976 | | $ | 215,261 | |
| Basic earnings per share | $ | 1.00 | | $ | 1.56 | | | $ | 2.16 | | $ | 2.40 | |
| Add: | | | | | |
| Unrealized loss (gain) on derivative instruments and related transactions | 0.44 | | 0.30 | | | (0.42) | | (0.09) | |
| Tax effect | (0.10) | | (0.08) | | | 0.10 | | 0.02 | |
Effects of economic hedging related to natural gas inventory (1) | 0.01 | | (0.07) | | | 0.26 | | (0.15) | |
| Tax effect | — | | 0.02 | | | (0.06) | | 0.04 | |
| | | | | |
| | | | | |
| NFE tax adjustment | 0.01 | | 0.04 | | | — | | 0.02 | |
| Basic NFE per share | $ | 1.36 | | $ | 1.77 | | | $ | 2.04 | | $ | 2.24 | |
(1)Effects of hedging natural gas inventory transactions where the economic impact is realized in a future period.
NFE by reporting segment and other operations, discussed in more detail within the operating results sections of each segment, is summarized as follows:
| | | | | | | | | | | | | | | | | | | | | | | | | | | | | | | | | | | |
| Three Months Ended | | Six Months Ended |
| March 31, | | March 31, |
| (Thousands) | 2022 | | 2021 | | 2022 | | 2021 |
| Net financial earnings (loss) | | | | | | | | | | | |
| Natural Gas Distribution | $ | 102,783 | | 79 | % | | $ | 80,541 | | 47 | % | | $ | 153,863 | | 79 | % | | $ | 130,008 | | 60 | % |
| Clean Energy Ventures | (6,491) | | (5) | | | (8,872) | | (5) | | | (13,312) | | (7) | | | (19,146) | | (9) | |
| Energy Services | 29,940 | | 23 | | | 96,528 | | 57 | | | 47,507 | | 24 | | | 98,028 | | 46 | |
| Storage and Transportation | 4,625 | | 4 | | | 4,711 | | 3 | | | 7,587 | | 4 | | | 8,219 | | 4 | |
| Home Services and Other | 451 | | — | | | 747 | | — | | | 898 | | — | | | 685 | | — | |
Eliminations (1) | (1,102) | | (1) | | | (3,051) | | (2) | | | (567) | | — | | | (2,533) | | (1) | |
| Total | $ | 130,206 | | 100 | % | | $ | 170,604 | | 100 | % | | $ | 195,976 | | 100 | % | | $ | 215,261 | | 100 | % |
(1) Consists of transactions between subsidiaries that are eliminated in consolidation.
The decrease in NFE during the three and six months ended March 31, 2022, compared with the three and six months ended March 31, 2021, was due primarily to decreased earnings at Energy Services related to the extreme cold weather during February 2021, which did not reoccur to the same extent during 2022, partially offset by the commencement of AMAs at Energy Services and higher base rates at NJNG as previously discussed.
New Jersey Resources Corporation
Part I
ITEM 2. MANAGEMENT’S DISCUSSION AND ANALYSIS OF FINANCIAL CONDITION AND RESULTS OF
OPERATIONS (Continued)
Natural Gas Distribution Segment
Overview
Our Natural Gas Distribution segment is comprised of NJNG, a natural gas utility that provides regulated natural gas service throughout Burlington, Middlesex, Monmouth, Morris, Ocean, and Sussex counties in New Jersey to approximately 568,100 residential and commercial customers in its service territory and also participates in the off-system sales and capacity release markets. The business is subject to various risks, including those risks associated with COVID-19, which may include but are not limited to impacts to customer growth and customer usage, customer collections, the timing and costs of capital expenditures and construction of infrastructure projects, operating and financing costs, fluctuations in commodity prices and customer conservation efforts. In addition, NJNG may be subject to adverse economic conditions, certain regulatory actions, environmental remediation and severe weather conditions. It is often difficult to predict the impact of events or trends associated with these risks.
NJNG’s business is seasonal by nature, as weather conditions directly influence the volume of natural gas delivered to customers on an annual basis. Specifically, customer demand substantially increases during the winter months when natural gas is used for heating purposes. As a result, NJNG generates most of its natural gas distribution revenues during the first and second fiscal quarters and is subject to variations in earnings and working capital during the fiscal year.
As a regulated company, NJNG is required to recognize the impact of regulatory decisions on its financial statements. See Note 4. Regulation in the accompanying Unaudited Condensed Consolidated Financial Statements for a more detailed discussion on regulatory actions, including filings related to programs and associated expenditures, as well as rate requests related to recovery of capital investments and operating costs.
NJNG’s operations are managed with the goal of providing safe and reliable service, growing its customer base, diversifying its utility gross margin, promoting clean energy programs and mitigating the risks discussed above.
Base Rate Case
On November 17, 2021, the BPU issued an order adopting a stipulation of settlement approving a $79.0 million increase to base rates, effective December 1, 2021. In addition, the order also included approval for the final increase for the NJ RISE/SAFE II programs, which totaled $269,000. These increases include an overall rate of return on rate base of 6.84 percent, return on common equity of 9.6 percent, a common equity ratio of 54.0 percent and a composite depreciation rate of 2.78 percent.
Infrastructure Projects
NJNG has significant annual capital expenditures associated with the management of its natural gas distribution and transmission system, including new utility plant associated with customer growth and its associated pipeline integrity management and infrastructure programs. Below is a summary of NJNG’s capital expenditures, including accruals, for the six months ended March 31, 2022, and estimates of expected investments for fiscal 2022 and 2023:
New Jersey Resources Corporation
Part I
ITEM 2. MANAGEMENT’S DISCUSSION AND ANALYSIS OF FINANCIAL CONDITION AND RESULTS OF
OPERATIONS (Continued)
Estimated capital expenditures are reviewed on a regular basis and may vary based on the ongoing effects of regulatory oversight, environmental regulations, unforeseen events and the ability to access capital.
Infrastructure Investment Program
In February 2019, NJNG filed a petition with the BPU seeking authority to implement a five-year IIP. The IIP consisted of two components: transmission and distribution investments and information technology replacement and enhancements. The total investment for the IIP was approximately $507.0 million. All approved investments will be recovered through annual filings to adjust base rates. In October 2020, the BPU approved the Company’s transmission and distribution component of the IIP for $150.0 million over five years, effective November 1, 2020. NJNG voluntarily withdrew the information technology upgrade component and will seek to recover associated costs in future rate case proceedings. On March 31, 2022, the Company filed its first rate recovery request for its BPU approved IIP with capital expenditures estimated at $25.6 million, including AFUDC through June 30, 2022.
SAFE II and NJ RISE
NJNG continues to implement BPU-approved infrastructure projects that are designed to enhance the reliability and integrity of NJNG’s natural gas distribution system.
The BPU approved the 5-year SAFE II program and the associated rate mechanism to replace the remaining unprotected steel mains and services from NJNG’s natural gas distribution system at an estimated cost of approximately $200 million, excluding AFUDC. With the approval of SAFE II, $157.5 million was approved for accelerated cost recovery methodology. The remaining $42.5 million in capital expenditures was requested for recovery in base rate cases, of which $23.4 million was approved in NJNG’s 2019 base rate case and $19.1 million was approved in the 2021 base rate case.
The BPU approved NJNG’s NJ RISE capital infrastructure program, which consists of six capital investment projects estimated to cost $102.5 million, excluding AFUDC, for natural gas distribution storm hardening and mitigation projects, along with associated depreciation expense. These system enhancements are intended to minimize service impacts during extreme weather events to customers in the most storm-prone areas of NJNG’s service territory. Recovery of NJ RISE investments is included in NJNG’s base rates.
In March 2021, NJNG filed a petition with the BPU requesting the final base rate increase for the recovery associated with NJ RISE and SAFE II capital investments cost of approximately $3.4 million made through June 30, 2021. In June 2021, this filing was consolidated with the 2021 base rate case. On November 17, 2021, the BPU issued an order for the consolidated matter which included approval for the final increase for the NJ RISE and SAFE II programs of $269,000. With this approval, the filings with respect to NJ RISE and SAFE II are complete.
Customer Growth
In conducting NJNG's business, management focuses on factors it believes may have significant influence on its future financial results. NJNG's policy is to work with all stakeholders, including customers, regulators and policymakers, to achieve favorable results. These factors include the rate of NJNG's customer growth in its service territory, which can be influenced by political and regulatory policies, the delivered cost of natural gas compared with competing fuels, interest rates and general economic and business conditions.
NJNG's total customers include the following:
| | | | | | | | |
| March 31, 2022 | March 31,
2021 |
| Firm customers | | |
| Residential | 508,729 | | 498,583 | |
| Commercial, industrial & other | 32,116 | | 31,313 | |
| Residential transport | 18,675 | | 22,574 | |
| Commercial transport | 8,551 | | 8,971 | |
| Total firm customers | 568,071 | | 561,441 | |
| Other | 53 | | 45 | |
| Total customers | 568,124 | | 561,486 | |
New Jersey Resources Corporation
Part I
ITEM 2. MANAGEMENT’S DISCUSSION AND ANALYSIS OF FINANCIAL CONDITION AND RESULTS OF
OPERATIONS (Continued)
During the six months ended March 31, 2022 and 2021, respectively, NJNG added 3,579 and 3,694 new customers. NJNG expects new customer additions, and those customers who added additional natural gas services to their premises to contribute approximately $2.9 million of incremental utility gross margin on an annualized basis.
NJNG continues to expect to add approximately 28,000 to 30,000 new customers during the three-year period of fiscal 2022 to 2024. Based on information from municipalities and developers, as well as external industry analysts and management's experience, NJNG estimates that approximately 65 percent of the growth will come from new construction markets and 35 percent from customer conversions to natural gas from other fuel sources. This new customer and conversion growth would increase utility gross margin under NJNG's base rates by approximately $19.1 million annually, as calculated under NJNG's CIP tariff.
Energy Efficiency Programs
SAVEGREEN conducts home energy audits and provides various grants, incentives and financing alternatives designed to encourage the installation of high-efficiency heating and cooling equipment and other energy efficiency upgrades. Depending on the specific incentive or approval, NJNG recovers costs associated with the programs over a two- to 10-year period through a tariff rider mechanism. In March 2021, the BPU approved a three-year SAVEGREEN program consisting of approximately $126.1 million of direct investment, $109.4 million in financing options, and approximately $23.4 million in operation and maintenance expenses, which resulted in a $15.6 million annual recovery increase, effective July 1, 2021.
In May 2020, NJNG filed a petition with the BPU to decrease its EE recovery rate. In October 2020, the BPU approved NJNG to maintain its existing rate, which will result in an annual recovery of approximately $11.4 million, effective November 1, 2020.
In June 2021, NJNG submitted its annual cost recovery filing for the SAVEGREEN programs established from 2010 through 2018. On January 26, 2022, the BPU approved the stipulation, which increases annual recoveries by $2.2 million, effective February 1, 2022.
The following table summarizes, loans, grants, rebates and related investments as of:
| | | | | | | | |
| (Thousands) | March 31, 2022 | September 30,
2021 |
| Loans | $ | 142,400 | | $ | 132,800 | |
| Grants, rebates and related investments | 112,700 | | 98,100 | |
| Total | $ | 255,100 | | $ | 230,900 | |
Program recoveries from customers during the six months ended March 31, 2022 and 2021, were $12.5 million and $5.3 million, respectively. The recovery includes a weighted average cost of capital that ranges from 6.69 percent to 7.76 percent, with a return on equity of 9.6 percent to 10.3 percent.
Conservation Incentive Program/BGSS
The CIP facilitates normalizing NJNG’s utility gross margin for variances not only due to weather but also for other factors affecting customer usage, such as conservation and energy efficiency. Recovery of utility gross margin for the non-weather variance through the CIP is limited to the amount of certain natural gas supply cost savings achieved and is subject to a variable margin revenue test. Additionally, recovery of the CIP utility gross margin is subject to an annual earnings test. An annual review of the CIP must be filed by June 1, coincident with NJNG’s annual BGSS filing, during which NJNG can request rate changes to the CIP.
New Jersey Resources Corporation
Part I
ITEM 2. MANAGEMENT’S DISCUSSION AND ANALYSIS OF FINANCIAL CONDITION AND RESULTS OF
OPERATIONS (Continued)
NJNG's total utility firm gross margin includes the following adjustments related to the CIP mechanism:
| | | | | | | | | | | | | | |
| Three Months Ended | Six Months Ended |
| March 31, | March 31, |
| (Thousands) | 2022 | 2021 | 2022 | 2021 |
Weather (1) | $ | 5,523 | | $ | 6,335 | | $ | 21,457 | | $ | 12,790 | |
| Usage | 3,057 | | (3,839) | | 1,984 | | (3,245) | |
| Total | $ | 8,580 | | $ | 2,496 | | $ | 23,441 | | $ | 9,545 | |
(1)Compared with the 20-year average, weather was 3.0 percent warmer-than-normal and 4.1 percent warmer-than-normal during the three months ended March 31, 2022 and 2021, respectively, and 8.7 percent warmer-than-normal and 6.4 percent warmer-than-normal during the six months ended March 31, 2022 and 2021, respectively.
Recovery of Natural Gas Costs
NJNG’s cost of natural gas is passed through to our customers, without markup, by applying NJNG’s authorized BGSS rate to actual therms delivered. There is no utility gross margin associated with BGSS costs; therefore, changes in such costs do not impact NJNG’s earnings. NJNG monitors its actual natural gas costs in comparison to its BGSS rates to manage its cash flows associated with its allowed recovery of natural gas costs, which is facilitated through BPU-approved deferred accounting and the BGSS pricing mechanism. Accordingly, NJNG occasionally adjusts its periodic BGSS rates or can issue credits or refunds, as appropriate, for its residential and small commercial customers when the commodity cost varies from the existing BGSS rate. BGSS rates for its large commercial customers are adjusted monthly based on NYMEX prices.
NJNG’s residential and commercial markets are currently open to competition, and its rates are segregated between BGSS (i.e., natural gas commodity) and delivery (i.e., transportation) components. NJNG earns utility gross margin through the delivery of natural gas to its customers and, therefore, is not negatively affected by customers who use its transportation service and purchase natural gas from another supplier. Under an existing order from the BPU, BGSS can be provided by suppliers other than the state’s natural gas utilities; however, customers who purchase natural gas from another supplier continue to use NJNG for transportation service.
During fiscal 2021, NJNG notified the BPU of its intent to provide BGSS bill credits to residential and small commercial sales customers. The actual bill credits given to customers totaled $20.6 million, $19.3 million net of tax.
On November 17, 2021, the BPU approved a $2.9 million increase to the annual revenues credited to BGSS, a $13.0 million annual increase related to its balancing charge, as well as changes to CIP rates, which result in a $6.3 million annual recovery decrease, effective December 1, 2021. On November 19, 2021, NJNG submitted notification of its intent to self-implement an increase to its BGSS rate, which result in an approximately $24.2 million increase to annual revenues credited to BGSS, effective December 1, 2021. On April 6, 2022, the Company, BPU, and Rate Counsel executed a Stipulation for final rates. The current BGSS, CIP, and balancing charge rates remain in effect and there is no further rate impact from this filing. The balancing charge rate includes the cost of balancing natural gas deliveries with customer usage for sales and transportation customers and balancing charge revenues are credited to BGSS.
BGSS Incentive Programs
NJNG is eligible to receive financial incentives for reducing BGSS costs through a series of utility gross margin-sharing programs that include off-system sales, capacity release and storage incentive programs. These programs are designed to encourage better utilization and hedging of NJNG’s natural gas supply, transportation and storage assets. Depending on the program, NJNG shares 80 or 85 percent of utility gross margin generated by these programs with firm customers. Utility gross margin from incentive programs was $6.3 million and $2.1 million during the three months ended March 31, 2022 and 2021, respectively, and $10.1 million and $6.7 million during the six months ended March 31, 2022 and 2021, respectively.
Hedging
In order to provide relative price stability to its natural gas supply portfolio, NJNG employs a hedging strategy with the goal of having at least 75 percent of the Company's projected winter periodic BGSS natural gas sales volumes hedged by each November 1 and at least 25 percent of the projected periodic BGSS natural gas sales hedged for the following April through March period. This is accomplished with the use of various financial instruments including futures, swaps and options used in conjunction with commodity and/or weather-related hedging activity.
New Jersey Resources Corporation
Part I
ITEM 2. MANAGEMENT’S DISCUSSION AND ANALYSIS OF FINANCIAL CONDITION AND RESULTS OF
OPERATIONS (Continued)
Commodity Prices
Our Natural Gas Distribution segment is affected by the price of natural gas, which can have a significant impact on our cash flows, short-term financing costs, the price of natural gas charged to our customers through the BGSS clause, our ability to collect accounts receivable, which impacts our bad debt expense, and our ability to maintain a competitive advantage over other energy sources.
Natural gas commodity prices are shown in the graph below, which illustrates the daily natural gas prices(1) in the Northeast market region, also known as TETCO M-3.
(1) Data sourced from Standard & Poor's Financial Services, LLC Global Platts.
The maximum price per MMBtu was $17.69 and $14.57 and the minimum price was $2.42 and $0.28 for the six months ended March 31, 2022 and 2021, respectively. A more detailed discussion of the impacts of the price of natural gas on operating revenues, natural gas purchases and cash flows can be found in the Operating Results and Cash Flow sections of Item 2. Management's Discussion and Analysis of Financial Condition and Results of Operations.
Societal Benefits Charge
NJNG’s qualifying customers are eligible for the USF program, which is administered by the New Jersey Department of Community Affairs, to help make energy bills more affordable.
In April 2021, the BPU approved on a final basis NJNG's annual SBC application to recover remediation expenses, including an increase in the RAC, of approximately $1.3 million annually and an increase to the NJCEP factor, of approximately $6.0 million, which was effective May 1, 2021.
In September 2021, the BPU approved on a final basis NJNG's annual USF compliance filing, which resulted in an annual increase of approximately $4.9 million, effective October 1, 2021.
On March 23, 2022, the BPU approved on a final basis NJNG's annual SBC application to recover remediation expenses, including an increase in the RAC, of approximately $600,000 annually and a decrease to the NJCEP factor of approximately $2.9 million, effective April 1, 2022.
New Jersey Resources Corporation
Part I
ITEM 2. MANAGEMENT’S DISCUSSION AND ANALYSIS OF FINANCIAL CONDITION AND RESULTS OF
OPERATIONS (Continued)
Environmental Remediation
NJNG is responsible for the environmental remediation of former MGP sites, which contain contaminated residues from former gas manufacturing operations that ceased operating at these sites by the mid-1950s and, in some cases, had been discontinued many years earlier. Actual MGP remediation costs may vary from management’s estimates due to the developing nature of remediation requirements, regulatory decisions by the NJDEP and related litigation. NJNG reviews these costs at the end of each fiscal year and adjusts its liability and corresponding regulatory asset as necessary to reflect its expected future remediation obligation. Accordingly, NJNG recognized a regulatory asset and an obligation of $121.6 million as of March 31, 2022, a decrease of $13.4 million compared with the prior fiscal period.
In June 2019, NJNG initiated a preliminary assessment of a site in Aberdeen, New Jersey to determine prior ownership and if former MGP operations were active at the location. The preliminary assessment and site investigation activities are ongoing at the Aberdeen, NJ site location and based on initial findings will be moving to remedial investigation phase. The costs associated with preliminary assessment, site investigation and remedial investigation activities are considered immaterial and are included as a component of NJNG’s annual SBC application to recover remediation expenses. We will continue to gather information to further refine and enhance its estimate of potential costs for this site as it becomes available. See Note 13. Commitments and Contingent Liabilities for a more detailed description.
Other regulatory filings and a more detailed discussion of the filings in this section can be found in Note 4. Regulation in the accompanying Unaudited Condensed Consolidated Financial Statements.
Operating Results
NJNG's operating results are as follows:
| | | | | | | | | | | | | | |
| Three Months Ended | Six Months Ended |
| March 31, | March 31, |
| (Thousands) | 2022 | 2021 | 2022 | 2021 |
Operating revenues (1) | $ | 463,812 | | $ | 310,167 | | $ | 738,584 | | $ | 505,896 | |
| Operating expenses | | | | |
Natural gas purchases (2)(3) | 215,223 | | 118,452 | | 339,817 | | 177,761 | |
| Operation and maintenance | 53,024 | | 52,951 | | 89,455 | | 96,589 | |
Regulatory rider expense (4) | 30,910 | | 18,413 | | 47,581 | | 29,114 | |
| Depreciation and amortization | 23,344 | | 19,475 | | 46,237 | | 38,644 | |
| Total operating expenses | 322,501 | | 209,291 | | 523,090 | | 342,108 | |
| Operating income | 141,311 | | 100,876 | | 215,494 | | 163,788 | |
| Other income, net | 1,925 | | 4,293 | | 3,021 | | 8,189 | |
| Interest expense, net of capitalized interest | 10,764 | | 9,006 | | 21,759 | | 17,980 | |
| Income tax provision | 29,689 | | 15,622 | | 42,893 | | 23,989 | |
| Net income | $ | 102,783 | | $ | 80,541 | | $ | 153,863 | | $ | 130,008 | |
(1)Includes nonutility revenue of approximately $338,000 and $675,000 for the three and six months ended March 31, 2022, respectively, for lease agreements with various NJR subsidiaries leasing office space from NJNG at the Company’s headquarters that commenced in July 2021, which are eliminated in consolidation. There was no nonutility revenue for the three and six months ended March 31, 2021.
(2)Includes the purchased cost of the natural gas, fees paid to pipelines and storage facilities, adjustments as a result of BGSS incentive programs and hedging transactions. These expenses are passed through to customers and are offset by corresponding revenues.
(3)Includes related party transactions of approximately $2.3 million and $5.2 million for the three months ended March 31, 2022 and 2021, respectively, and approximately $4.7 million and $8.4 million for the six months ended March 31, 2022 and 2021, respectively, the majority of which is eliminated in consolidation.
(4)Consists of expenses associated with state-mandated programs, the RAC and energy efficiency programs, and are calculated on a per-therm basis. These expenses are passed through to customers and are offset by corresponding revenues.
Operating Revenues and Natural Gas Purchases
Operating revenues increased by 49.5 percent and 46.0 percent and natural gas purchases increased 81.7 percent and 91.2 percent during the three and six months ended March 31, 2022, respectively, compared with the three and six months ended March 31, 2021, respectively.
New Jersey Resources Corporation
Part I
ITEM 2. MANAGEMENT’S DISCUSSION AND ANALYSIS OF FINANCIAL CONDITION AND RESULTS OF
OPERATIONS (Continued)
The factors contributing to the increases and decreases in operating revenues and natural gas purchases are as follows:
| | | | | | | | | | | | | | | | | |
| Three Months Ended | | Six Months Ended |
| March 31, | | March 31, |
| 2022 v. 2021 | | 2022 v. 2021 |
| (Thousands) | Operating
revenues | Natural gas
purchases | | Operating
revenues | Natural gas
purchases |
| BGSS incentives | $ | 63,074 | | $ | 58,840 | | | $ | 109,427 | | $ | 106,006 | |
| Average BGSS rates | 25,309 | | 25,309 | | | 39,451 | | 39,451 | |
| Base rate impact | 32,757 | | — | | | 41,067 | | — | |
| Bill credits | 11,071 | | 11,071 | | | 20,590 | | 20,590 | |
| Firm sales | 2,356 | | 1,097 | | | (10,788) | | (4,675) | |
| CIP adjustments | 6,084 | | — | | | 13,896 | | — | |
Riders and other (1) | 12,994 | | 454 | | | 19,045 | | 684 | |
| Total increase | $ | 153,645 | | $ | 96,771 | | | $ | 232,688 | | $ | 162,056 | |
(1)Other includes changes in rider rates, including those related to EE, NJCEP and other programs.
Non-GAAP Financial Measures
Management uses utility gross margin, a non-GAAP financial measure, when evaluating the operating results of NJNG. NJNG's utility gross margin is defined as natural gasoperating revenues less natural gas purchases, sales tax, and regulatory rider expenses,expenses. This measure differs from gross margin as presented on a GAAP basis as it excludes certain operations and maintenance expense and depreciation and amortization. Utility gross margin may also not be comparable to the definition of gross margin used by others in the natural gas distribution business and other industries. Management believes that utility gross margin provides a meaningful basis for evaluating utility operations since natural gas costs, sales tax and regulatory rider expenses are included in operating revenues and passed through to customers and, therefore, have no effect on utility gross margin. Non-GAAP financial measures are not in accordance with, or an alternative to, GAAP and should be considered in addition to, and not as a substitute for, the comparable GAAP measure.
Utility Gross Margin
A reconciliation of operating revenues,gross margin, the closest GAAP financial measure to NJNG's utility gross margin, is as follows:
| | | Three Months Ended | Six Months Ended | | Three Months Ended | Six Months Ended |
| | March 31, | | March 31, |
| (Thousands) | (Thousands) | 2021 | 2020 | 2021 | 2020 | (Thousands) | 2022 | 2021 | 2022 | 2021 |
| Operating revenues | Operating revenues | $ | 310,167 | | $ | 297,220 | | $ | 505,896 | | $ | 516,843 | | Operating revenues | $ | 463,812 | | $ | 310,167 | | $ | 738,584 | | $ | 505,896 | |
| Less: | Less: | | Less: | |
| Natural gas purchases | Natural gas purchases | 118,452 | | 114,256 | | 177,761 | | 210,078 | | Natural gas purchases | 215,223 | | 118,452 | | 339,817 | | 177,761 | |
Operation and maintenance (1) | | Operation and maintenance (1) | 26,748 | | 26,281 | | 39,889 | | 51,106 | |
| Regulatory rider expense | Regulatory rider expense | 18,413 | | 15,330 | | 29,114 | | 27,072 | | Regulatory rider expense | 30,910 | | 18,413 | | 47,581 | | 29,114 | |
| Depreciation and amortization | | Depreciation and amortization | 23,344 | | 19,475 | | 46,237 | | 38,644 | |
| Gross margin | | Gross margin | 167,587 | | 127,546 | | 265,060 | | 209,271 | |
| Add: | | Add: | |
Operation and maintenance (1) | | Operation and maintenance (1) | 26,748 | | 26,281 | | 39,889 | | 51,106 | |
| Depreciation and amortization | | Depreciation and amortization | 23,344 | | 19,475 | | 46,237 | | 38,644 | |
| Utility gross margin | Utility gross margin | $ | 173,302 | | $ | 167,634 | | $ | 299,021 | | $ | 279,693 | | Utility gross margin | $ | 217,679 | | $ | 173,302 | | $ | 351,186 | | $ | 299,021 | |
(1)Excludes selling, general and administrative expenses of $26.3 million and $26.7 million for the three months ended March 31, 2022 and 2021, respectively, and approximately $49.6 million and $45.5 million for the six months ended March 31, 2022 and 2021, respectively
Utility gross margin consists of three components:
•utility firm gross margin generated from only the delivery component of either a sales tariff or a transportation tariff from residential and commercial customers who receive natural gas service from NJNG;
•BGSS incentive programs, where revenues generated or savings achieved from BPU-approved off-system sales, capacity release or storage incentive programs are shared between customers and NJNG; and
•utility gross margin generated from off-tariff customers, as well as interruptible customers.
The following provides more information on the components of utility gross margin and associated throughput (Bcf) of natural gas delivered to customers:
| | | | | | | | | | | | | | | | | | | | | | | | | | | | | | | | |
| Three Months Ended | Six Months Ended |
| March 31, | March 31, |
| 2021 | | 2020 | 2021 | | 2020 |
| ($ in thousands) | Margin | Bcf | | Margin | Bcf | Margin | Bcf | | Margin | Bcf |
| Utility gross margin/throughput | | | | | | | | | | |
| Residential | $ | 124,468 | | 22.7 | | | $ | 120,541 | | 18.9 | | $ | 210,443 | | 36.3 | | | $ | 197,623 | | 33.5 | |
| Commercial, industrial and other | 23,050 | | 4.3 | | | 22,884 | | 3.6 | | 40,090 | | 6.7 | | | 38,071 | | 6.4 | |
| Firm transportation | 22,878 | | 5.7 | | | 21,469 | | 5.1 | | 40,166 | | 9.6 | | | 37,128 | | 9.4 | |
| Total utility firm gross margin/throughput | 170,396 | | 32.7 | | | 164,894 | | 27.6 | | 290,699 | | 52.6 | | | 272,822 | | 49.3 | |
| BGSS incentive programs | 2,114 | | 23.6 | | | 1,587 | | 28.2 | | 6,692 | | 49.5 | | | 4,316 | | 56.1 | |
| Interruptible/off-tariff agreements | 792 | | 0.8 | | | 1,153 | | 4.7 | | 1,630 | | 5.3 | | | 2,555 | | 13.7 | |
| Total utility gross margin/throughput | $ | 173,302 | | 57.1 | | | $ | 167,634 | | 60.5 | | $ | 299,021 | | 107.4 | | | $ | 279,693 | | 119.1 | |
Utility Firm Gross Margin
Utility firm gross margin increased $5.5 million during the three months ended March 31, 2021, compared with the three months ended March 31, 2020, due primarily to increased returns on infrastructure programs related to SAFE II and NJ RISE.Utility firm gross margin increased $17.9 million during the six months ended March 31, 2021, compared with the six months ended March 31, 2020, due primarily to the increase in base rates, along with increased returns on infrastructure programs as previously discussed.
New Jersey Resources Corporation
Part I
ITEM 2. MANAGEMENT’S DISCUSSION AND ANALYSIS OF FINANCIAL CONDITION AND RESULTS OF
OPERATIONS (Continued)
The following provides more information on the components of utility gross margin and associated throughput (Bcf) of natural gas delivered to customers:
| | | | | | | | | | | | | | | | | | | | | | | | | | | | | | | | |
| Three Months Ended | Six Months Ended |
| March 31, | March 31, |
| 2022 | | 2021 | 2022 | | 2021 |
| ($ in thousands) | Margin | Bcf | | Margin | Bcf | Margin | Bcf | | Margin | Bcf |
| Utility gross margin/throughput | | | | | | | | | | |
| Residential | $ | 155,514 | | 23.0 | | | $ | 124,468 | | 22.7 | | $ | 248,119 | | 35.6 | | | $ | 210,443 | | 36.3 | |
| Commercial, industrial and other | 30,120 | | 4.3 | | | 23,050 | | 4.3 | | 49,222 | | 6.6 | | | 40,090 | | 6.7 | |
| Firm transportation | 25,090 | | 5.6 | | | 22,878 | | 5.7 | | 42,372 | | 9.2 | | | 40,166 | | 9.6 | |
| Total utility firm gross margin/throughput | 210,724 | | 32.9 | | | 170,396 | | 32.7 | | 339,713 | | 51.4 | | | 290,699 | | 52.6 | |
| BGSS incentive programs | 6,349 | | 24.0 | | | 2,114 | | 23.6 | | 10,113 | | 49.1 | | | 6,692 | | 49.5 | |
| Interruptible/off-tariff agreements | 606 | | 1.1 | | | 792 | | 0.8 | | 1,360 | | 7.2 | | | 1,630 | | 5.3 | |
| Total utility gross margin/throughput | $ | 217,679 | | 58.0 | | | $ | 173,302 | | 57.1 | | $ | 351,186 | | 107.7 | | | $ | 299,021 | | 107.4 | |
Utility Firm Gross Margin
Utility firm gross margin increased $40.3 million and $49.0 million during the three and six months ended March 31, 2022, compared with the three and six months ended March 31, 2021, respectively, due primarily to the increase in base rates as previously discussed.
BGSS Incentive Programs
The factors contributing to the change in utility gross margin generated by BGSS incentive programs are as follows:
| | | Three Months Ended | Six Months Ended | | Three Months Ended | Six Months Ended |
| | March 31, | | March 31, |
| (Thousands) | (Thousands) | 2021 v. 2020 | (Thousands) | 2022 v. 2021 |
| Off-system sales | Off-system sales | | $ | 903 | | | $ | 767 | | | Off-system sales | | $ | 4,969 | | | $ | 6,149 | | |
| Storage | Storage | | (327) | | | 1,749 | | | Storage | | (165) | | | (1,669) | | |
| Capacity release | Capacity release | | (49) | | | (140) | | | Capacity release | | (569) | | | (1,059) | | |
| Total increase | Total increase | | $ | 527 | | | $ | 2,376 | | | Total increase | | $ | 4,235 | | | $ | 3,421 | | |
The increase in BGSS incentive programs during the three and six months ended March 31, 2021,2022, compared with the three and six months ended March 31, 2020,2021, was due primarily to increased margins from off-system sales, along with improved and earlier opportunitiespartially offset by the timing differences for storage incentive compared with the prior year.and lower capacity release volumes.
Operation and Maintenance Expense
O&M expense increased $13.1 million during the three months ended March 31, 2021, compared2022, remained consistent with the three months ended March 31, 2020, due primarily to increased compensation and information technologies expenses.2021. O&M expense increased $20.6decreased $7.1 million during the six months ended March 31, 2021,2022, compared with the six months ended March 31, 2020,2021, due primarily to increasedthe deferral of bad debt costs in accordance with the July 2, 2020 BPU deferral order, partially offset by an increase in compensation, information technology expenditures and bad debt expenses.consulting fees.
Depreciation Expense
Depreciation expense increased $1.4$3.9 million and $3.7$7.6 million during the three and six months ended March 31, 2021,2022, compared with the three and six months ended March 31, 2020,2021, as a result of additional utility plant being placed into service.
Interest Expense
Interest expense increased $1.5$1.8 million and $2.7$3.8 million during the three and six months ended March 31, 2021,2022, compared with the three and six months ended March 31, 2020,2021, due primarily to increased outstanding long-term debt.debt and lower AFUDC debt related to infrastructure projects completed and placed in service at the end of fiscal 2021.
Other Income
Other income increased $501,000decreased $2.4 million and $3.1$5.2 million during the three and six months ended March 31, 2021,2022, compared with the three and six months ended March 31, 2020,2021, due primarily to increaseddecreased AFUDC earned on infrastructure projects.
Income Tax Provision
Income tax provision decreased $4.1 million and $4.3 million during the three and six months ended March 31, 2021, compared with the three and six months ended March 31, 2020, due to lower operating income.
Net Income
Net income decreased $5.8 million during the three months ended March 31, 2021, compared with the three months ended March 31, 2020, due primarily to increased O&M, depreciation and interest expenses,equity as previously discussed. Net income remained relatively flat during the six months ended March 31, 2021, compared with the six months ended March 31, 2020.
New Jersey Resources Corporation
Part I
ITEM 2. MANAGEMENT’S DISCUSSION AND ANALYSIS OF FINANCIAL CONDITION AND RESULTS OF
OPERATIONS (Continued)
Income Tax Provision
Income tax provision increased $14.1 million and $18.9 million during the three and six months ended March 31, 2022, compared with the three and six months ended March 31, 2021, due to higher operating income and an increase in the annualized effective tax rate applied.
Net Income
Net income increased $22.2 million and $23.9 million during the three and six months ended March 31, 2022, compared with the three and six months ended March 31, 2021, due primarily to higher revenue along with decreased O&M, partially offset by higher depreciation and interest expenses and decreased other income, as previously discussed.
Clean Energy Ventures Segment
Overview
Our Clean Energy Ventures segment actively pursues opportunities in the renewable energy markets. Clean Energy Ventures enters into various agreements to install solar net-metered systems for residential and commercial customers, as well as large commercial grid-connected projects. In addition, Clean Energy Ventures enters into various long-term agreements, including PPAs, to supply energy from commercial solar projects.
Capital expenditures related to clean energy projects are subject to change due to a variety of factors that may affect our ability to commence operations at these projects on a timely basis or at all, including logistics associated with the start-up of residential and commercial solar projects, such as timing of construction schedules, the permitting and regulatory process, any delays related to electric grid interconnection, economic trends, unforeseen events and the ability to access capital or allocation of capital to other investments or business opportunities. Clean Energy Ventures is also subject to risks associated with COVID-19, which may include impacts to residential solar customer growth and customer collections, our ability to identify and develop commercial solar asset investments, impacts to our supply chain and our ability to source materials for construction.
The primary contributors toward the value of qualifying clean energy projects are tax incentives and SRECs.RECs. Changes in the federal statutes related to the ITC and/or relevant state legislation and regulatory policies affecting the market for solar renewable energy credits, could significantly affect future results.
Solar
Solar projects placed in service and related expenditures are as follows:
| | | | | | | | | | | | | | | | | | | | | | | | | | |
| Three Months Ended |
| March 31, |
| ($ in Thousands) | 2021 | 2020 |
| Placed in service | Projects | MW | Costs | Projects | MW | Costs |
| Grid-connected | 1 | | 2.7 | | $ | 5,492 | | | 2 | | 20.0 | | $ | 40,385 | | |
| Net-metered: | | | | | | | | |
| | | | | | | | |
| Residential | 80 | | 0.8 | | 2,230 | | | 157 | | 1.7 | | 5,075 | | |
| Total placed in service | 81 | | 3.5 | | $ | 7,722 | | | 159 | | 21.7 | | $ | 45,460 | | |
| | | Six Months Ended | | Three Months Ended |
| | March 31, | | March 31, |
| ($ in Thousands) | ($ in Thousands) | 2021 | 2020 | ($ in Thousands) | 2022 | 2021 |
| Placed in service | Placed in service | Projects | MW | Costs | Projects | MW | Costs | Placed in service | Projects | MW | Costs | Projects | MW | Costs |
| Grid-connected | 2 | | 5.6 | | $ | 9,175 | | | 3 | | 22.9 | | $ | 52,092 | | | |
Grid-connected (1) | | Grid-connected (1) | — | | — | | $ | 10 | | | 1 | | 2.7 | | $ | 5,492 | | |
| Net-metered: | Net-metered: | | Net-metered: | |
| | Residential | Residential | 126 | | 1.3 | | 3,829 | | | 281 | | 3.0 | | 9,085 | | | Residential | 114 | | 1.3 | | 4,144 | | | 80 | | 0.8 | | 2,230 | | |
| Total placed in service | Total placed in service | 128 | | 6.9 | | $ | 13,004 | | | 284 | | 25.9 | | $ | 61,177 | | | Total placed in service | 114 | | 1.3 | | $ | 4,154 | | | 81 | | 3.5 | | $ | 7,722 | | |
| | | Six Months Ended |
| | | March 31, |
| ($ in Thousands) | | ($ in Thousands) | 2022 | 2021 |
| Placed in service | | Placed in service | Projects | MW | Costs | Projects | MW | Costs |
Grid-connected (1) | | Grid-connected (1) | 1 | | 1.0 | | $ | 3,130 | | | 2 | | 5.6 | | $ | 9,175 | | (2) |
| Net-metered: | | Net-metered: | |
| | Residential | | Residential | 167 | | 1.9 | | 5,697 | | | 126 | | 1.3 | | 3,829 | | |
| Total placed in service | | Total placed in service | 168 | | 2.9 | | $ | 8,827 | | | 128 | | 6.9 | | $ | 13,004 | | |
(1)Includes projects subject to sale leaseback arrangements.
(2)Includes an operational 2.9 MW commercial solar project acquired in December 2020.
New Jersey Resources Corporation
Part I
ITEM 2. MANAGEMENT’S DISCUSSION AND ANALYSIS OF FINANCIAL CONDITION AND RESULTS OF
OPERATIONS (Continued)
Clean Energy Ventures has constructed a total of 364.3approximately 370.6 MW of solar capacity.capacity in service. Projects that were placed in service through December 31, 2019, qualified for a 30-percent federal ITC. The credit declined to 26 percent for property under construction during 2020 and was originally scheduled to decline to 22 percent for property under construction during 2021 and 10 percent for any property that is under construction after 2021. On December 27, 2020, the 26 percent federal ITC was extended through the end of 2022. The credit declines to 22 percent after 2022 and to 10 percent after 2023.
Projects placed in service after December 31, 2019, also qualified for a 30 percent federal ITC if five percent or more of the total costs of a solar property are incurred before the end of the applicable year and there are continuous efforts to advance towards completion of the project, based on the IRS guidance around the ITC safe harbor determination. We have taken steps to preserve the ITC at the higher raterates for certain solar projects that are completed after the scheduled reduction in rates, in accordance with IRS guidance.
New Jersey Resources Corporation
Part I
ITEM 2. MANAGEMENT’S DISCUSSION AND ANALYSIS OF FINANCIAL CONDITION AND RESULTS OF
OPERATIONS (Continued)
Clean Energy Ventures may enter into transactions to sell certain of its commercial solar assets concurrent with agreements to lease the assets back over a period of five to 15 years. The Company will continue to operate the solar assets and are responsible for related expenses and entitled to retain the revenue generated from SRECs, TRECsRECs and energy sales. The ITCs and other tax benefits associated with these solar projects transfer to the buyer if applicable; however, the lease payments are structured so that Clean Energy Ventures is compensated for the transfer of the related tax incentives. Accordingly, for solar projects financed under sale leasebacks for which the assets were sold during the first 5 years of in servicein-service life, Clean Energy Ventures recognizes the equivalent value of the ITC in other income on the Unaudited Condensed Consolidated Statements of Operations over the respective five-year ITC recapture periods, starting with the second year of the lease. In December 2020,During the six months ended March 31, 2022 and 2021, Clean Energy Ventures received proceeds of $3.3 million and $12.1 million, respectively, in connection with the sale leaseback of commercial solar assets. Clean Energy Ventures did not enter into anyThere were no proceeds from sale leaseback transactions for its commercial solar assetsleasebacks during the sixthree months ended March 31, 2020.2022 and 2021.
As part of its solar investment portfolio, Clean Energy Ventures operates a residential and small commercial solar program, The Sunlight Advantage®, that provides qualifying homeowners and small business owners the opportunity to have a solar system installed at their home or place of business with no installation or maintenance expenses. Clean Energy Ventures owns, operates and maintains the system over the life of the contract in exchange for monthly payments.
For solar installations placed in-service in New Jersey prior to April 30, 2020, each MWh of electricity produced creates an SREC that represents the renewable energy attribute of the solar-electricity generated that can be sold to third parties, predominantly load-serving entities that are required to comply with the solar requirements under New Jersey's renewable portfolio standard.
In December 2019, the BPU established the TREC as pursuant to the successor program to the SREC program. TRECs provide a fixed compensation base multiplied by an assigned project factor in order to determine their value. The project factor is determined by the type and location of the project, as defined. All TRECs generated are required to be purchased monthly by a TREC program administrator as appointed by the BPU.
| | SREC and TREC activity consisted of the following: | Six Months Ended | |
| REC activity consisted of the following: | | REC activity consisted of the following: | Six Months Ended |
| | March 31, | | March 31, |
| | 2021 | 2020 | | 2022 | 2021 |
| | SRECs | TRECs | SRECs | | SRECs | TRECs | SRECs | TRECs |
| Inventory balance as of October 1, | Inventory balance as of October 1, | 35,011 | | 9,270 | | 53,395 | | Inventory balance as of October 1, | 108,104 | | 6,944 | | 35,011 | | 9,270 | |
| RECs generated | RECs generated | 141,071 | | 10,310 | | 138,700 | | RECs generated | 157,902 | | 13,261 | | 141,071 | | 10,310 | |
| RECs delivered | RECs delivered | (9,495) | | (5,294) | | (19,693) | | RECs delivered | (32,200) | | (12,353) | | (9,495) | | (5,294) | |
| Inventory balance as of December 31, | 166,587 | | 14,286 | | 172,402 | | |
| Inventory balance as of March 31, | | Inventory balance as of March 31, | 233,806 | | 7,852 | | 166,587 | | 14,286 | |
The average SREC sales price was $218$212 and $189$218 during the six months ended March 31, 20212022 and 2020,2021, respectively, and the average TREC price was $138 and $147 during the six months ended March 31, 2021.2022 and 2021, respectively.
New Jersey Resources Corporation
Part I
ITEM 2. MANAGEMENT’S DISCUSSION AND ANALYSIS OF FINANCIAL CONDITION AND RESULTS OF
OPERATIONS (Continued)
Clean Energy Ventures hedges its expected SREC production through the use of forward sales contracts. The following table reflects the hedged percentage of our projected inventory of SRECs related to its in-service commercial and residential assets:
| Energy Year (1) | Energy Year (1) | Percent of SRECs Hedged | Energy Year (1) | Percent of SRECs Hedged |
| 2021 | 98% | |
| 2022 | 2022 | 97% | 2022 | 98% |
| 2023 | 2023 | 97% | 2023 | 99% |
| 2024 | 2024 | 93% | 2024 | 95% |
| 2025 | 2025 | 36% | 2025 | 81% |
| 2026 | 2026 | 10% | 2026 | 29% |
|
(1)Energy years are compliance periods for New Jersey's renewable portfolio standard that run from June 1 to May 31.
There are no direct costs associated with the production of SRECs or TRECs by our solar assets. All related costs are included as a component of O&M expenses on the Unaudited Condensed Consolidated Statements of Operations, including such expenses as facility maintenance and variousbroker fees.
Operating Results
Clean Energy Ventures’ financial results are summarized as follows:
| | | | | | | | | | | | | | |
| Three Months Ended | Six Months Ended |
| March 31, | March 31, |
| (Thousands) | 2022 | 2021 | 2022 | 2021 |
| Operating revenues | $ | 11,827 | | $ | 6,476 | | $ | 22,010 | | $ | 12,846 | |
| Operating expenses | | | | |
| Operation and maintenance | 9,212 | | 8,260 | | 18,134 | | 17,461 | |
| Depreciation and amortization | 5,311 | | 4,685 | | 10,544 | | 10,118 | |
| | | | |
| Total operating expenses | 14,523 | | 12,945 | | 28,678 | | 27,579 | |
| Operating loss | (2,696) | | (6,469) | | (6,668) | | (14,733) | |
| Other (expense) income, net | (352) | | 149 | | 180 | | 87 | |
| Interest expense, net | 5,395 | | 5,266 | | 10,822 | | 10,300 | |
| Income tax benefit | (1,952) | | (2,714) | | (3,998) | | (5,800) | |
| Net loss | $ | (6,491) | | $ | (8,872) | | $ | (13,312) | | $ | (19,146) | |
Operating Revenues
Operating revenues increased $5.4 million and $9.2 million during the three and six months ended March 31, 2022, compared with the three and six months ended March 31, 2021, respectively, due primarily to increased SREC and electricity sales.
Net Loss
Net loss decreased $2.4 million and $5.8 million during the three and six months ended March 31, 2022, compared with the three and six months ended March 31, 2021, respectively, due primarily to the increased operating revenues, as previously discussed.
New Jersey Resources Corporation
Part I
ITEM 2. MANAGEMENT’S DISCUSSION AND ANALYSIS OF FINANCIAL CONDITION AND RESULTS OF
OPERATIONS (Continued)
Operating Results
Clean Energy Ventures’ financial results are summarized as follows:
| | | | | | | | | | | | | | |
| Three Months Ended | Six Months Ended |
| March 31, | March 31, |
| (Thousands) | 2021 | 2020 | 2021 | 2020 |
| Operating revenues | $ | 6,476 | | $ | 5,995 | | $ | 12,846 | | $ | 12,207 | |
| Operating expenses | | | | |
| Operation and maintenance | 8,260 | | 7,479 | | 17,461 | | 14,813 | |
| Depreciation and amortization | 4,685 | | 6,603 | | 10,118 | | 12,919 | |
| | | | |
| Total operating expenses | 12,945 | | 14,082 | | 27,579 | | 27,732 | |
| Operating loss | (6,469) | | (8,087) | | (14,733) | | (15,525) | |
| Other income (expense), net | 149 | | (41) | | 87 | | (124) | |
| Interest expense, net | 5,266 | | 4,835 | | 10,300 | | 9,327 | |
| Income tax benefit | (2,714) | | (4,134) | | (5,800) | | (7,968) | |
| Net loss | $ | (8,872) | | $ | (8,829) | | $ | (19,146) | | $ | (17,008) | |
Operating Revenues
Operating revenues increased $481,000 and $639,000 during the three and six months ended March 31, 2021, compared with the three and six months ended March 31, 2020, due primarily to the recognition of TREC revenue, which was not present during the same period in the prior year.
Operation and Maintenance Expense
O&M expense increased $781,000 and $2.6 million during the three and six months ended March 31, 2021, compared with the three and six months ended March 31, 2020, due primarily to increased project maintenance, lease and information technology expenses.
Depreciation Expense
Depreciation expense decreased $1.9 million and $2.8 million during the three and six months ended March 31, 2021, compared with the three and six months ended March 31, 2020, primarily due to the change in estimated useful lives of our commercial solar assets, effective July 1, 2020.
Income Tax Benefit
Income tax benefit decreased $1.4 million and $2.2 million during the three and six months ended March 31, 2021, compared with the three and six months ended March 31, 2020, due primarily to a decreased state tax rate.
Net Income
Net income remained relatively flat during the three months ended March 31, 2021, compared with the three months ended March 31, 2020. Net income decreased $2.1 million during the six months ended March 31, 2021, compared with the six months ended March 31, 2020, due primarily to the increased O&M, partially offset by decreased depreciation expense, as previously discussed.
Income Tax Provision
Income tax provision increased $14.1 million and $18.9 million during the three and six months ended March 31, 2022, compared with the three and six months ended March 31, 2021, due to higher operating income and an increase in the annualized effective tax rate applied.
Net Income
Net income increased $22.2 million and $23.9 million during the three and six months ended March 31, 2022, compared with the three and six months ended March 31, 2021, due primarily to higher revenue along with decreased O&M, partially offset by higher depreciation and interest expenses and decreased other income, as previously discussed.
Clean Energy ServicesVentures Segment
Overview
Our Clean Energy Services marketsVentures segment actively pursues opportunities in the renewable energy markets. Clean Energy Ventures enters into various agreements to install solar net-metered systems for residential and sells natural gascommercial customers, as well as large commercial grid-connected projects. In addition, Clean Energy Ventures enters into various long-term agreements, including PPAs, to wholesale and retail customers and manages natural gas transportation and storage assets throughout major market areas across North America. Energy Services maintains a strategic portfolio of natural gas transportation and storage contracts that it utilizes in conjunction with its market expertise to provide service and value to its customers. Availability of these transportation and storage contracts allows Energy Services to generate market opportunities by capturing price differentials over specific time horizons and between geographic market locations.supply energy from commercial solar projects.
Capital expenditures related to clean energy projects are subject to change due to a variety of factors that may affect our ability to commence operations at these projects on a timely basis or at all, including logistics associated with the start-up of residential and commercial solar projects, such as timing of construction schedules, the permitting and regulatory process, any delays related to electric grid interconnection, economic trends, unforeseen events and the ability to access capital or allocation of capital to other investments or business opportunities. Clean Energy ServicesVentures is also provides managementsubject to risks associated with COVID-19, which may include impacts to residential solar customer growth and customer collections, our ability to identify and develop commercial solar asset investments, impacts to our supply chain and our ability to source materials for construction.
The primary contributors toward the value of transportationqualifying clean energy projects are tax incentives and storage assets for natural gas producers and regulated utilities. These management transactions typically involveRECs. Changes in the release of producer/utility owned storagefederal statutes related to the ITC and/or transportationrelevant state legislation and regulatory policies affecting the market for solar renewable energy credits, could significantly affect future results.
Solar
Solar projects placed in service and related expenditures are as follows:
| | | | | | | | | | | | | | | | | | | | | | | | | | |
| Three Months Ended |
| March 31, |
| ($ in Thousands) | 2022 | 2021 |
| Placed in service | Projects | MW | Costs | Projects | MW | Costs |
Grid-connected (1) | — | | — | | $ | 10 | | | 1 | | 2.7 | | $ | 5,492 | | |
| Net-metered: | | | | | | | | |
| | | | | | | | |
| Residential | 114 | | 1.3 | | 4,144 | | | 80 | | 0.8 | | 2,230 | | |
| Total placed in service | 114 | | 1.3 | | $ | 4,154 | | | 81 | | 3.5 | | $ | 7,722 | | |
| Six Months Ended |
| March 31, |
| ($ in Thousands) | 2022 | 2021 |
| Placed in service | Projects | MW | Costs | Projects | MW | Costs |
Grid-connected (1) | 1 | | 1.0 | | $ | 3,130 | | | 2 | | 5.6 | | $ | 9,175 | | (2) |
| Net-metered: | | | | | | | | |
| | | | | | | | |
| Residential | 167 | | 1.9 | | 5,697 | | | 126 | | 1.3 | | 3,829 | | |
| Total placed in service | 168 | | 2.9 | | $ | 8,827 | | | 128 | | 6.9 | | $ | 13,004 | | |
(1)Includes projects subject to sale leaseback arrangements.
(2)Includes an operational 2.9 MW commercial solar project acquired in December 2020.
New Jersey Resources Corporation
Part I
ITEM 2. MANAGEMENT’S DISCUSSION AND ANALYSIS OF FINANCIAL CONDITION AND RESULTS OF
OPERATIONS (Continued)
Clean Energy Ventures has approximately 370.6 MW of solar capacity in combination with either an obligationservice. Projects that were placed in service through December 31, 2019, qualified for a 30-percent federal ITC. The credit declined to purchase and/or deliver physical natural gas. In addition26 percent for property under construction during 2020 and was originally scheduled to decline to 22 percent for property under construction during 2021 and 10 percent for any property that is under construction after 2021. On December 27, 2020, the contractual purchase and/or sale26 percent federal ITC was extended through the end of physical natural gas, Energy Services generates or pays fee-based margin in exchange for its active management2022. The credit declines to 22 percent after 2022 and may provide the producer and/or utility with additional margin based on actual results.to 10 percent after 2023.
In conjunctionProjects placed in service after December 31, 2019, also qualified for a 30 percent federal ITC if five percent or more of the total costs of a solar property are incurred before the end of the applicable year and there are continuous efforts to advance towards completion of the project, based on the IRS guidance around the ITC safe harbor determination. We have taken steps to preserve the ITC at higher rates for certain solar projects that are completed after the scheduled reduction in rates, in accordance with the active management of these contracts, Energy Services generates financial margin by identifying market opportunities and simultaneously entering into natural gas purchase/sale, storage or transportation contracts and financial derivative contracts. In cases where storage is utilized to fulfill these contracts, these forecast sales and/or purchases are economically hedged through the use of financial derivative contracts. The financial derivative contracts consist primarily of exchange-traded futures, options and swap contracts, and are frequently used to lock in anticipated transactional cash flows and to help manage volatility in natural gas market prices. Generally, when its transportation and storage contracts are exposed to periods of increased market volatility, Energy Services is able to implement strategies that allow them to capture margin by improving the respective time or geographic spreads on a forward basis.IRS guidance.
Clean Energy Services accountsVentures may enter into transactions to sell certain of its commercial solar assets concurrent with agreements to lease the assets back over a period of five to 15 years. The Company will continue to operate the solar assets and are responsible for its physical commodity contractsrelated expenses and its financial derivative instruments at fair value onentitled to retain the Unaudited Condensed Consolidated Balance Sheets. Changes inrevenue generated from RECs and energy sales. The ITCs and other tax benefits associated with these solar projects transfer to the fairbuyer if applicable; however, the lease payments are structured so that Clean Energy Ventures is compensated for the transfer of the related tax incentives. Accordingly, for solar projects financed under sale leasebacks for which the assets were sold during the first 5 years of in-service life, Clean Energy Ventures recognizes the equivalent value of physical commodity contracts and financial derivative instruments are includedthe ITC in earnings as a component of operating revenues or natural gas purchasesother income on the Unaudited Condensed Consolidated Statements of Operations. VolatilityOperations over the respective five-year ITC recapture periods, starting with the second year of the lease. During the six months ended March 31, 2022 and 2021, Clean Energy Ventures received proceeds of $3.3 million and $12.1 million, respectively, in reported net income at Energy Services can occur over periods of time due to changes in the fair value of derivatives, as well as timing differences related to certain transactions. Unrealized gains and losses can fluctuate as a result of changes in the price of natural gas, SRECs and foreign currency from the original transaction price. Volatility in earnings can also occur as a result of timing differences between the settlement of financial derivatives andconnection with the sale leaseback of the underlying physical commodity. For example, when a financial instrument settles and the physical natural gas is injected into inventory, the realized gains and losses associated with the financial instrument are recognized in earnings. However, the gains and losses associated with the physical natural gas are not recognized in earnings until the natural gas inventory is withdrawncommercial solar assets. There were no proceeds from storage and sold, at which time Energy Services realizes the entire margin on the transaction.
Operating Results
Energy Services’ financial results are summarized as follows:
| | | | | | | | | | | | | | |
| Three Months Ended | Six Months Ended |
| March 31, | March 31, |
| (Thousands) | 2021 | 2020 | 2021 | 2020 |
Operating revenues (1) | $ | 462,569 | | $ | 313,701 | | $ | 692,046 | | $ | 684,116 | |
| Operating expenses | | | | |
Natural gas purchases (including demand charges (2)(3)) | 330,280 | | 318,912 | | 504,117 | | 636,636 | |
| Operation and maintenance | 32,998 | | 4,822 | | 37,014 | | 9,560 | |
| Depreciation and amortization | 13 | | 27 | | 55 | | 56 | |
| | | | |
| Total operating expenses | 363,291 | | 323,761 | | 541,186 | | 646,252 | |
| Operating income (loss) | 99,278 | | (10,060) | | 150,860 | | 37,864 | |
| Other income, net | 87 | | 113 | | 179 | | 192 | |
| Interest expense, net | 575 | | 937 | | 1,255 | | 2,163 | |
| Income tax provision (benefit) | 23,128 | | (2,449) | | 35,250 | | 8,303 | |
| Net income (loss) | $ | 75,662 | | $ | (8,435) | | $ | 114,534 | | $ | 27,590 | |
(1)Includes related party transactions of approximately $2.8 million and $259,000 forsale leasebacks during the three months ended March 31, 20212022 and 2021.
As part of its solar investment portfolio, Clean Energy Ventures operates a residential and small commercial solar program, The Sunlight Advantage®, that provides qualifying homeowners and small business owners the opportunity to have a solar system installed at their home or place of business with no installation or maintenance expenses. Clean Energy Ventures owns, operates and maintains the system over the life of the contract in exchange for monthly payments.
For solar installations placed in-service in New Jersey prior to April 30, 2020, respectively,each MWh of electricity produced creates an SREC that represents the renewable energy attribute of the solar-electricity generated that can be sold to third parties, predominantly load-serving entities that are required to comply with the solar requirements under New Jersey's renewable portfolio standard.
In December 2019, the BPU established the TREC as pursuant to the successor program to the SREC program. TRECs provide a fixed compensation base multiplied by an assigned project factor in order to determine their value. The project factor is determined by the type and $4.9 millionlocation of the project, as defined. All TRECs generated are required to be purchased monthly by a TREC program administrator as appointed by the BPU.
| | | | | | | | | | | | | | |
| REC activity consisted of the following: | Six Months Ended |
| March 31, |
| 2022 | 2021 |
| SRECs | TRECs | SRECs | TRECs |
| Inventory balance as of October 1, | 108,104 | | 6,944 | | 35,011 | | 9,270 | |
| RECs generated | 157,902 | | 13,261 | | 141,071 | | 10,310 | |
| RECs delivered | (32,200) | | (12,353) | | (9,495) | | (5,294) | |
| Inventory balance as of March 31, | 233,806 | | 7,852 | | 166,587 | | 14,286 | |
The average SREC sales price was $212 and $1.9 million for$218 during the six months ended March 31, 20212022 and 2020, respectively, which are eliminated in consolidation.
(2)Costs associated with pipeline and storage capacity are expensed over the term of the related contracts, which generally varies from less than one year to ten years.
(3)Includes related party transactions of approximately $226,000 and $46,000 for the three months ended March 31, 2021, and 2020, respectively, and $391,000the average TREC price was $138 and $92,000 for$147 during the six months ended March 31, 2022 and 2021, and 2020, respectively, a portion of which is eliminated in consolidation.
Energy Services' portfolio of financial derivative instruments are composed of:
| | | | | | | | |
| Six Months Ended |
| March 31, |
| (in Bcf) | 2021 | 2020 |
| Net short futures contracts | 12.4 | | 29.9 | |
| | |
| | |
New Jersey Resources Corporation
Part I
ITEM 2. MANAGEMENT’S DISCUSSION AND ANALYSIS OF FINANCIAL CONDITION AND RESULTS OF
OPERATIONS (Continued)
Clean Energy Ventures hedges its expected SREC production through the use of forward sales contracts. The following table reflects the hedged percentage of our projected inventory of SRECs related to its in-service commercial and residential assets:
| | | | | |
Energy Year (1) | Percent of SRECs Hedged |
| 2022 | 98% |
| 2023 | 99% |
| 2024 | 95% |
| 2025 | 81% |
| 2026 | 29% |
| |
(1)Energy years are compliance periods for New Jersey's renewable portfolio standard that run from June 1 to May 31.
There are no direct costs associated with the production of SRECs or TRECs by our solar assets. All related costs are included as a component of O&M expenses on the Unaudited Condensed Consolidated Statements of Operations, including such expenses as facility maintenance and broker fees.
Operating Results
Clean Energy Ventures’ financial results are summarized as follows:
| | | | | | | | | | | | | | |
| Three Months Ended | Six Months Ended |
| March 31, | March 31, |
| (Thousands) | 2022 | 2021 | 2022 | 2021 |
| Operating revenues | $ | 11,827 | | $ | 6,476 | | $ | 22,010 | | $ | 12,846 | |
| Operating expenses | | | | |
| Operation and maintenance | 9,212 | | 8,260 | | 18,134 | | 17,461 | |
| Depreciation and amortization | 5,311 | | 4,685 | | 10,544 | | 10,118 | |
| | | | |
| Total operating expenses | 14,523 | | 12,945 | | 28,678 | | 27,579 | |
| Operating loss | (2,696) | | (6,469) | | (6,668) | | (14,733) | |
| Other (expense) income, net | (352) | | 149 | | 180 | | 87 | |
| Interest expense, net | 5,395 | | 5,266 | | 10,822 | | 10,300 | |
| Income tax benefit | (1,952) | | (2,714) | | (3,998) | | (5,800) | |
| Net loss | $ | (6,491) | | $ | (8,872) | | $ | (13,312) | | $ | (19,146) | |
Operating Revenues and Natural Gas Purchases
Operating revenues increased $148.9$5.4 million and natural gas purchases increased $11.4 million during the three months ended March 31, 2021, compared with the three months ended March 31, 2020. Operating revenues increased $7.9 million and natural gas purchases decreased $132.5 million during the six months ended March 31, 2021, compared with the six months ended March 31, 2020. The increases during the three and six months were due primarily to increased natural gas price volatility related to the extreme weather in the mid-continent and southern regions of the U.S. during February 2021 compared to the prior period. The decrease in gas purchases during the six months ended March 31, 2021, compared with the six months ended March 31, 2020, was due primarily to the timing of injections and withdrawals for natural gas in storage.
Future results at Energy Services are contingent upon natural gas market price volatility driven by variations in both the supply and demand balances caused by weather and other factors. As a result, variations in weather patterns in the key market areas served may affect earnings during the fiscal year. Changes in market fundamentals such as an increase in supply and decrease in demand due to warmer temperatures, and reduced volatility can negatively impact Energy Services' earnings. See Item 2. Management's Discussion and Analysisof Financial Condition and Results of Operations - Natural Gas Distribution Segment forTETCO M-3 Daily Prices, which illustrates the daily natural gas prices in the Northeast market region.
Operation and Maintenance Expense
O&M expense increased $28.2 million and $27.5$9.2 million during the three and six months ended March 31, 2021,2022, compared with the three and six months ended March 31, 2020,2021, respectively, due primarily to increased compensation costs, charitable contributionsSREC and bad debt expense.electricity sales.
Net Loss
Net loss decreased $2.4 million and $5.8 million during the three and six months ended March 31, 2022, compared with the three and six months ended March 31, 2021, respectively, due primarily to the increased operating revenues, as previously discussed.
New Jersey Resources Corporation
Part I
ITEM 2. MANAGEMENT’S DISCUSSION AND ANALYSIS OF FINANCIAL CONDITION AND RESULTS OF
OPERATIONS (Continued)
Income Tax Provision
Income tax provision increased $25.6$14.1 million and $26.9$18.9 million during the three and six months ended March 31, 2021,2022, compared with the three and six months ended March 31, 2020,2021, due primarily to increasedhigher operating income related to increased natural gas price volatility during February 2021 as discussed above.and an increase in the annualized effective tax rate applied.
Net Income
Net income increased $84.1$22.2 million and $86.9$23.9 million during the three and six months ended March 31, 2021,2022, compared with the three and six months ended March 31, 2021, due primarily to higher revenue along with decreased O&M, partially offset by higher depreciation and interest expenses and decreased other income, as previously discussed.
Clean Energy Ventures Segment
Overview
Our Clean Energy Ventures segment actively pursues opportunities in the renewable energy markets. Clean Energy Ventures enters into various agreements to install solar net-metered systems for residential and commercial customers, as well as large commercial grid-connected projects. In addition, Clean Energy Ventures enters into various long-term agreements, including PPAs, to supply energy from commercial solar projects.
Capital expenditures related to clean energy projects are subject to change due to a variety of factors that may affect our ability to commence operations at these projects on a timely basis or at all, including logistics associated with the start-up of residential and commercial solar projects, such as timing of construction schedules, the permitting and regulatory process, any delays related to electric grid interconnection, economic trends, unforeseen events and the ability to access capital or allocation of capital to other investments or business opportunities. Clean Energy Ventures is also subject to risks associated with COVID-19, which may include impacts to residential solar customer growth and customer collections, our ability to identify and develop commercial solar asset investments, impacts to our supply chain and our ability to source materials for construction.
The primary contributors toward the value of qualifying clean energy projects are tax incentives and RECs. Changes in the federal statutes related to the ITC and/or relevant state legislation and regulatory policies affecting the market for solar renewable energy credits, could significantly affect future results.
Solar
Solar projects placed in service and related expenditures are as follows:
| | | | | | | | | | | | | | | | | | | | | | | | | | |
| Three Months Ended |
| March 31, |
| ($ in Thousands) | 2022 | 2021 |
| Placed in service | Projects | MW | Costs | Projects | MW | Costs |
Grid-connected (1) | — | | — | | $ | 10 | | | 1 | | 2.7 | | $ | 5,492 | | |
| Net-metered: | | | | | | | | |
| | | | | | | | |
| Residential | 114 | | 1.3 | | 4,144 | | | 80 | | 0.8 | | 2,230 | | |
| Total placed in service | 114 | | 1.3 | | $ | 4,154 | | | 81 | | 3.5 | | $ | 7,722 | | |
| Six Months Ended |
| March 31, |
| ($ in Thousands) | 2022 | 2021 |
| Placed in service | Projects | MW | Costs | Projects | MW | Costs |
Grid-connected (1) | 1 | | 1.0 | | $ | 3,130 | | | 2 | | 5.6 | | $ | 9,175 | | (2) |
| Net-metered: | | | | | | | | |
| | | | | | | | |
| Residential | 167 | | 1.9 | | 5,697 | | | 126 | | 1.3 | | 3,829 | | |
| Total placed in service | 168 | | 2.9 | | $ | 8,827 | | | 128 | | 6.9 | | $ | 13,004 | | |
(1)Includes projects subject to sale leaseback arrangements.
(2)Includes an operational 2.9 MW commercial solar project acquired in December 2020.
New Jersey Resources Corporation
Part I
ITEM 2. MANAGEMENT’S DISCUSSION AND ANALYSIS OF FINANCIAL CONDITION AND RESULTS OF
OPERATIONS (Continued)
Clean Energy Ventures has approximately 370.6 MW of solar capacity in service. Projects that were placed in service through December 31, 2019, qualified for a 30-percent federal ITC. The credit declined to 26 percent for property under construction during 2020 and was originally scheduled to decline to 22 percent for property under construction during 2021 and 10 percent for any property that is under construction after 2021. On December 27, 2020, the 26 percent federal ITC was extended through the end of 2022. The credit declines to 22 percent after 2022 and to 10 percent after 2023.
Projects placed in service after December 31, 2019, also qualified for a 30 percent federal ITC if five percent or more of the total costs of a solar property are incurred before the end of the applicable year and there are continuous efforts to advance towards completion of the project, based on the IRS guidance around the ITC safe harbor determination. We have taken steps to preserve the ITC at higher rates for certain solar projects that are completed after the scheduled reduction in rates, in accordance with IRS guidance.
Clean Energy Ventures may enter into transactions to sell certain of its commercial solar assets concurrent with agreements to lease the assets back over a period of five to 15 years. The Company will continue to operate the solar assets and are responsible for related expenses and entitled to retain the revenue generated from RECs and energy sales. The ITCs and other tax benefits associated with these solar projects transfer to the buyer if applicable; however, the lease payments are structured so that Clean Energy Ventures is compensated for the transfer of the related tax incentives. Accordingly, for solar projects financed under sale leasebacks for which the assets were sold during the first 5 years of in-service life, Clean Energy Ventures recognizes the equivalent value of the ITC in other income on the Unaudited Condensed Consolidated Statements of Operations over the respective five-year ITC recapture periods, starting with the second year of the lease. During the six months ended March 31, 2022 and 2021, Clean Energy Ventures received proceeds of $3.3 million and $12.1 million, respectively, in connection with the sale leaseback of commercial solar assets. There were no proceeds from sale leasebacks during the three months ended March 31, 2022 and 2021.
As part of its solar investment portfolio, Clean Energy Ventures operates a residential and small commercial solar program, The Sunlight Advantage®, that provides qualifying homeowners and small business owners the opportunity to have a solar system installed at their home or place of business with no installation or maintenance expenses. Clean Energy Ventures owns, operates and maintains the system over the life of the contract in exchange for monthly payments.
For solar installations placed in-service in New Jersey prior to April 30, 2020, each MWh of electricity produced creates an SREC that represents the renewable energy attribute of the solar-electricity generated that can be sold to third parties, predominantly load-serving entities that are required to comply with the solar requirements under New Jersey's renewable portfolio standard.
In December 2019, the BPU established the TREC as pursuant to the successor program to the SREC program. TRECs provide a fixed compensation base multiplied by an assigned project factor in order to determine their value. The project factor is determined by the type and location of the project, as defined. All TRECs generated are required to be purchased monthly by a TREC program administrator as appointed by the BPU.
| | | | | | | | | | | | | | |
| REC activity consisted of the following: | Six Months Ended |
| March 31, |
| 2022 | 2021 |
| SRECs | TRECs | SRECs | TRECs |
| Inventory balance as of October 1, | 108,104 | | 6,944 | | 35,011 | | 9,270 | |
| RECs generated | 157,902 | | 13,261 | | 141,071 | | 10,310 | |
| RECs delivered | (32,200) | | (12,353) | | (9,495) | | (5,294) | |
| Inventory balance as of March 31, | 233,806 | | 7,852 | | 166,587 | | 14,286 | |
The average SREC sales price was $212 and $218 during the six months ended March 31, 2022 and 2021, respectively, and the average TREC price was $138 and $147 during the six months ended March 31, 2022 and 2021, respectively.
New Jersey Resources Corporation
Part I
ITEM 2. MANAGEMENT’S DISCUSSION AND ANALYSIS OF FINANCIAL CONDITION AND RESULTS OF
OPERATIONS (Continued)
Clean Energy Ventures hedges its expected SREC production through the use of forward sales contracts. The following table reflects the hedged percentage of our projected inventory of SRECs related to its in-service commercial and residential assets:
| | | | | |
Energy Year (1) | Percent of SRECs Hedged |
| 2022 | 98% |
| 2023 | 99% |
| 2024 | 95% |
| 2025 | 81% |
| 2026 | 29% |
| |
(1)Energy years are compliance periods for New Jersey's renewable portfolio standard that run from June 1 to May 31.
There are no direct costs associated with the production of SRECs or TRECs by our solar assets. All related costs are included as a component of O&M expenses on the Unaudited Condensed Consolidated Statements of Operations, including such expenses as facility maintenance and broker fees.
Operating Results
Clean Energy Ventures’ financial results are summarized as follows:
| | | | | | | | | | | | | | |
| Three Months Ended | Six Months Ended |
| March 31, | March 31, |
| (Thousands) | 2022 | 2021 | 2022 | 2021 |
| Operating revenues | $ | 11,827 | | $ | 6,476 | | $ | 22,010 | | $ | 12,846 | |
| Operating expenses | | | | |
| Operation and maintenance | 9,212 | | 8,260 | | 18,134 | | 17,461 | |
| Depreciation and amortization | 5,311 | | 4,685 | | 10,544 | | 10,118 | |
| | | | |
| Total operating expenses | 14,523 | | 12,945 | | 28,678 | | 27,579 | |
| Operating loss | (2,696) | | (6,469) | | (6,668) | | (14,733) | |
| Other (expense) income, net | (352) | | 149 | | 180 | | 87 | |
| Interest expense, net | 5,395 | | 5,266 | | 10,822 | | 10,300 | |
| Income tax benefit | (1,952) | | (2,714) | | (3,998) | | (5,800) | |
| Net loss | $ | (6,491) | | $ | (8,872) | | $ | (13,312) | | $ | (19,146) | |
Operating Revenues
Operating revenues increased $5.4 million and $9.2 million during the three and six months ended March 31, 2022, compared with the three and six months ended March 31, 2021, respectively, due primarily to increased SREC and electricity sales.
Net Loss
Net loss decreased $2.4 million and $5.8 million during the three and six months ended March 31, 2022, compared with the three and six months ended March 31, 2021, respectively, due primarily to the increased operating revenues, as previously discussed.
New Jersey Resources Corporation
Part I
ITEM 2. MANAGEMENT’S DISCUSSION AND ANALYSIS OF FINANCIAL CONDITION AND RESULTS OF
OPERATIONS (Continued)
Energy Services Segment
Overview
Energy Services markets and sells natural gas to wholesale and retail customers and manages natural gas transportation and storage assets throughout major market areas across North America. Energy Services maintains a strategic portfolio of natural gas transportation and storage contracts that it utilizes in conjunction with its market expertise to provide service and value to its customers. Availability of these transportation and storage contracts allows Energy Services to generate market opportunities by capturing price differentials over specific time horizons and between geographic market locations.
Energy Services also provides management of transportation and storage assets for natural gas producers and regulated utilities. These management transactions typically involve the release of producer/utility-owned storage and/or transportation capacity in combination with either an obligation to purchase and/or deliver physical natural gas. In addition to the contractual purchase and/or sale of physical natural gas, Energy Services generates or pays fee-based margin in exchange for its active management and may provide the producer and/or utility with additional margin based on actual results.
In conjunction with the active management of these contracts, Energy Services generates financial margin by identifying market opportunities and simultaneously entering into natural gas purchase/sale, storage or transportation contracts and financial derivative contracts. In cases where storage is utilized to fulfill these contracts, these forecast sales and/or purchases are economically hedged through the use of financial derivative contracts. The financial derivative contracts consist primarily of exchange-traded futures, options and swap contracts, and are frequently used to lock in anticipated transactional cash flows and to help manage volatility in natural gas market prices. Generally, when its transportation and storage contracts are exposed to periods of increased market volatility, Energy Services is able to implement strategies that allow it to capture margin by improving the respective time or geographic spreads on a forward basis.
Energy Services accounts for its physical commodity contracts and its financial derivative instruments at fair value on the Unaudited Condensed Consolidated Balance Sheets. Changes in the fair value of physical commodity contracts and financial derivative instruments are included in earnings as a component of operating revenues or natural gas purchases on the Unaudited Condensed Consolidated Statements of Operations. Volatility in reported net income at Energy Services can occur over periods of time due to changes in the fair value of derivatives, as well as timing differences related to certain transactions. Unrealized gains and losses can fluctuate as a result of changes in the price of natural gas, SRECs and foreign currency from the original transaction price. Volatility in earnings can also occur as a result of timing differences between the settlement of financial derivatives and the sale of the underlying physical commodity. For example, when a financial instrument settles and the physical natural gas is injected into inventory, the realized gains and losses associated with the financial instrument are recognized in earnings. However, the gains and losses associated with the physical natural gas are not recognized in earnings until the natural gas inventory is withdrawn from storage and sold, at which time Energy Services realizes the entire margin on the transaction.
During December 2020, Energy Services entered into a series of AMAs with an investment grade public utility to release pipeline capacity associated with certain natural gas transportation contracts. The utility provides certain asset management services and Energy Services may deliver natural gas to the utility in exchange for aggregate net proceeds of approximately $500 million, payable through November 1, 2030. The AMAs include a series of initial and permanent releases, which commenced on November 1, 2021. NJR will receive approximately $260 million in cash from fiscal 2022 through fiscal 2024 and $34 million per year from fiscal 2025 through fiscal 2031 under the agreements. Energy Services recognized $10.3 million and $32.4 million of operating revenue during the three and six months ended March 31, 2022, respectively, on the Unaudited Condensed Consolidated Statements of Operations. Amounts received in excess of revenue totaling $54.4 million as of March 31, 2022, are included in deferred revenue on the Unaudited Condensed Consolidated Balance Sheets.
New Jersey Resources Corporation
Part I
ITEM 2. MANAGEMENT’S DISCUSSION AND ANALYSIS OF FINANCIAL CONDITION AND RESULTS OF
OPERATIONS (Continued)
Operating Results
Energy Services’ financial results are summarized as follows:
| | | | | | | | | | | | | | |
| Three Months Ended | Six Months Ended |
| March 31, | March 31, |
| (Thousands) | 2022 | 2021 | 2022 | 2021 |
Operating revenues (1) | $ | 412,645 | | $ | 462,569 | | $ | 781,889 | | $ | 692,046 | |
| Operating expenses | | | | |
Natural gas purchases (including demand charges (2)(3)) | 411,146 | | 330,280 | | 689,833 | | 504,117 | |
| Operation and maintenance | 4,599 | | 32,998 | | 8,350 | | 37,014 | |
| Depreciation and amortization | 32 | | 13 | | 60 | | 55 | |
| | | | |
| Total operating expenses | 415,777 | | 363,291 | | 698,243 | | 541,186 | |
| Operating (loss) income | (3,132) | | 99,278 | | 83,646 | | 150,860 | |
| Other income, net | 106 | | 87 | | 252 | | 179 | |
| Interest expense, net | 795 | | 575 | | 1,470 | | 1,255 | |
| Income tax (benefit) provision | (790) | | 23,128 | | 19,715 | | 35,250 | |
| Net (loss) income | $ | (3,031) | | $ | 75,662 | | $ | 62,713 | | $ | 114,534 | |
(1)Includes related party transactions of approximately $1.6 million and $2.8 million for the three months ended March 31, 2022 and 2021, respectively, and approximately $5.0 million and $4.9 million for the six months ended March 31, 2022 and 2021, respectively, which are eliminated in consolidation.
(2)Costs associated with pipeline and storage capacity are expensed over the term of the related contracts, which generally varies from less than one year to ten years.
(3)Includes related party transactions of approximately $270,000 and $226,000 for the three months ended March 31, 2022 and 2021, respectively, and approximately $495,000 and $391,000 for the six months ended March 31, 2022 and 2021, respectively, a portion of which is eliminated in consolidation.
Energy Services' portfolio of financial derivative instruments are composed of:
| | | | | | | | |
| Six Months Ended |
| March 31, |
| (in Bcf) | 2022 | 2021 |
| Net short futures contracts | 0.9 | | 12.4 | |
| | |
During the six months ended March 31, 2022 and 2021, the net short position resulted in an unrealized gain of $1.8 million and $5.8 million, respectively.
Operating Revenues and Natural Gas Purchases
Operating revenues decreased $49.9 million and natural gas purchases increased $80.9 million during the three months ended March 31, 2022, compared with the three months ended March 31, 2021. The decrease in operating revenues during the three months was due primarily to increased natural gas price volatility related to the extreme weather in the mid-continent and southern regions of the U.S. during February 2021, which did not reoccur to the same extent during 2022. The increase in gas purchases is due primarily to a 83.9 percent increase in natural gas prices.
Operating revenues and natural gas purchases increased $89.8 million and $185.7 million, respectively, during the six months ended March 31, 2022, compared with the six months ended March 31, 2021, due primarily to a 101.2 percent increase in natural gas prices. To a lesser extent, operating revenues also increased $32.4 million due to AMAs with an investment grade public utility that commenced in November 2021, partially offset by the extreme weather during February 2021, as previously discussed.
Future results at Energy Services are contingent upon natural gas market price volatility driven by variations in both the supply and demand balances caused by weather and other factors. As a result, variations in weather patterns in the key market areas served may affect earnings during the fiscal year. Changes in market fundamentals, such as an increase in supply and decrease in demand due to warmer temperatures, and reduced volatility can negatively impact Energy Services' earnings. See Item 2. Management's Discussion and Analysisof Financial Condition and Results of Operations - Natural Gas Distribution Segment forTETCO M-3 Daily Prices, which illustrates the daily natural gas prices in the Northeast market region.
New Jersey Resources Corporation
Part I
ITEM 2. MANAGEMENT’S DISCUSSION AND ANALYSIS OF FINANCIAL CONDITION AND RESULTS OF
OPERATIONS (Continued)
Operation and Maintenance Expense
O&M expense decreased $28.4 million and $28.7 million during the three and six months ended March 31, 2022, compared with the three and six months ended March 31, 2021, due primarily to decreased compensation costs, charitable contributions and bad debt expense.
Income Tax Provision
Income tax provision decreased $23.9 million and $15.5 million during the three and six months ended March 31, 2022, compared with the three and six months ended March 31, 2021, respectively, due primarily to decreased operating income related to the increased natural gas prices, partially offset by decreased O&M.
Net (Loss) Income
Net income decreased $78.7 million and $51.8 million during the three and six months ended March 31, 2022, compared with the three and six months ended March 31, 2021, respectively, due primarily to decreased operating income, partially offset by higher O&M expenses,lower income taxes, as previously discussed.
Non-GAAP Financial Measures
Management uses financial margin and NFE, non-GAAP financial measures, when evaluating the operating results of Energy Services. Financial margin and NFE are based on removing timing differences associated with certain derivative instruments. GAAP also requires us, during the interim periods, to estimate our annual effective tax rate and use this rate to calculate the year-to-date tax provision. We also determine an annual estimated effective tax rate for NFE purposes and calculate a quarterly tax adjustment based on the differences between our forecasted net income and our forecasted NFE for the fiscal year. This adjustment is applied to Energy Services, as the adjustment primarily relates to timing differences associated with certain derivative instruments which impacts the estimate of the annual effective tax rate for NFE. No adjustment is needed during the fourth quarter, since the actual effective tax rate is calculated at year end. Accordingly, for NFE purposes, the annual estimated effective tax rate is 18.8 percent for fiscal 2021 and 18.2 percent for fiscal 2020.
Management views these measures as representative of the overall expected economic result and uses these measures to compare Energy Services' results against established benchmarks and earnings targets as these measures eliminate the impact of volatility on GAAP earnings as a result of timing differences associated with the settlement of derivative instruments. To the extent that there are unanticipated impacts from changes in the market value related to the effectiveness of economic hedges, Energy Services' actual non-GAAP results can differ from the results anticipated at the outset of the transaction. Non-GAAP financial measures are not in accordance with, or an alternative to, GAAP and should be considered in addition to, and not as a substitute for, the comparable GAAP measure.
When Energy Services reconciles the most directly comparable GAAP measure to both financial margin and NFE, the current period unrealized gains and losses on derivatives are excluded as a reconciling item. Financial margin and NFE also exclude the effects of economic hedging of the value of our natural gas in storage and, therefore, only include realized gains and losses related to natural gas withdrawn from storage, effectively matching the full earnings effects of the derivatives with realized margins on the related physical natural gas flows. Financial margin differs from gross margin as defined on a GAAP basis as it excludes certain operations and maintenance expense and depreciation and amortization as well as the effects of derivatives as discussed above.
New Jersey Resources Corporation
Part I
ITEM 2. MANAGEMENT’S DISCUSSION AND ANALYSIS OF FINANCIAL CONDITION AND RESULTS OF
OPERATIONS (Continued)
Financial Margin
The following table is a computationA reconciliation of gross margin, the closest GAAP financial measure, to Energy Services' financial margin:margin is as follows:
| | | Three Months Ended | Six Months Ended | | Three Months Ended | Six Months Ended |
| | March 31, | | March 31, |
| (Thousands) | (Thousands) | 2021 | 2020 | 2021 | 2020 | (Thousands) | 2022 | 2021 | 2022 | 2021 |
Operating revenues (1) | Operating revenues (1) | $ | 462,569 | | $ | 313,701 | | $ | 692,046 | | $ | 684,116 | | Operating revenues (1) | $ | 412,645 | | $ | 462,569 | | $ | 781,889 | | $ | 692,046 | |
| Less: Natural gas purchases | 330,280 | | 318,912 | | 504,117 | | 636,636 | | |
| Less: | | Less: | |
| Natural gas purchases | | Natural gas purchases | 411,146 | | 330,280 | | 689,833 | | 504,117 | |
Operation and maintenance (2) | | Operation and maintenance (2) | 3,978 | | 20,924 | | 7,247 | | 24,608 | |
| Depreciation and amortization | | Depreciation and amortization | 32 | | 13 | | 60 | | 55 | |
| Gross margin | | Gross margin | (2,511) | | 111,352 | | 84,749 | | 163,266 | |
| Add: | Add: | | Add: | |
Operation and maintenance (2) | | Operation and maintenance (2) | 3,978 | | 20,924 | | 7,247 | | 24,608 | |
| Depreciation and amortization | | Depreciation and amortization | 32 | | 13 | | 60 | | 55 | |
| Unrealized loss (gain) on derivative instruments and related transactions | Unrealized loss (gain) on derivative instruments and related transactions | 29,348 | | (3,146) | | (9,433) | | (45,340) | | Unrealized loss (gain) on derivative instruments and related transactions | 40,446 | | 29,348 | | (45,201) | | (9,433) | |
Effects of economic hedging related to natural gas inventory (2) | (7,209) | | 14,622 | | (14,741) | | 5,735 | | |
Effects of economic hedging related to natural gas inventory (3) | | Effects of economic hedging related to natural gas inventory (3) | 1,155 | | (7,209) | | 24,732 | | (14,741) | |
| Financial margin | Financial margin | $ | 154,428 | | $ | 6,265 | | $ | 163,755 | | $ | 7,875 | | Financial margin | $ | 43,100 | | $ | 154,428 | | $ | 71,587 | | $ | 163,755 | |
(1)Includes unrealized (gains) losses related to an intercompany transaction between NJNG and Energy Services that have been eliminated in consolidation of approximately $(91,000)$1.6 million and $(626,000)$(91,000) for the three months ended March 31, 2022 and 2021, respectively, and 2020, respectively,approximately $5.0 million and $1.2 million and $(199,000) for the six months ended March 31, 20212022 and 2020,2021, respectively.
(2)Excludes selling, general and administrative expenses of approximately $621,000 and $12.1 million for the three months ended March 31, 2022 and 2021, respectively, and approximately $1.1 million and $12.4 million for the six months ended March 31, 2022 and 2021, respectively.
(3)Effects of hedging natural gas inventory transactions where the economic impact is realized in a future period.
A reconciliation of operating income, the closest GAAP financial measure, to Energy Services' financial margin is as follows:
| | | | | | | | | | | | | | |
| Three Months Ended | Six Months Ended |
| March 31, | March 31, |
| (Thousands) | 2021 | 2020 | 2021 | 2020 |
| Operating income (loss) | $ | 99,278 | | $ | (10,060) | | $ | 150,860 | | $ | 37,864 | |
| Add: | | | | |
| Operation and maintenance | 32,998 | | 4,822 | | 37,014 | | 9,560 | |
| Depreciation and amortization | 13 | | 27 | | 55 | | 56 | |
| | | | |
| Subtotal | 132,289 | | (5,211) | | 187,929 | | 47,480 | |
| Add: | | | | |
| Unrealized loss (gain) on derivative instruments and related transactions | 29,348 | | (3,146) | | (9,433) | | (45,340) | |
| Effects of economic hedging related to natural gas inventory | (7,209) | | 14,622 | | (14,741) | | 5,735 | |
| Financial margin | $ | 154,428 | | $ | 6,265 | | $ | 163,755 | | $ | 7,875 | |
Financial margin increased $148.2decreased $111.3 million and $155.9$92.2 million during the three and six months ended March 31, 2021,2022, compared with the three and six months ended March 31, 2020, due2021, respectively, resulting primarily to natural gasfrom the price volatility related to the extreme weather in the mid-continent and southern regions of the U.S. during February 2021, which did not reoccur to the same extent during 2022 and increased natural gas prices, partially offset by the AMAs, which commenced November 2021, as previously discussed compared to the prior period.discussed.
Net Financial Earnings
A reconciliation of Energy Services' net income, the most directly comparable GAAP financial measure, to NFE is as follows:
| | | Three Months Ended | Six Months Ended | | Three Months Ended | Six Months Ended |
| | March 31, | | March 31, |
| (Thousands) | (Thousands) | 2021 | 2020 | 2021 | 2020 | (Thousands) | 2022 | 2021 | 2022 | 2021 |
| Net income (loss) | $ | 75,662 | | $ | (8,435) | | $ | 114,534 | | $ | 27,590 | | |
| Net (loss) income | | Net (loss) income | $ | (3,031) | | $ | 75,662 | | $ | 62,713 | | $ | 114,534 | |
| Add: | Add: | | Add: | |
| Unrealized loss (gain) on derivative instruments and related transactions | Unrealized loss (gain) on derivative instruments and related transactions | 29,348 | | (3,146) | | (9,433) | | (45,340) | | Unrealized loss (gain) on derivative instruments and related transactions | 40,446 | | 29,348 | | (45,201) | | (9,433) | |
Tax effect (1) | Tax effect (1) | (6,976) | | 747 | | 2,243 | | 10,780 | | Tax effect (1) | (9,604) | | (6,976) | | 10,753 | | 2,243 | |
| Effects of economic hedging related to natural gas inventory | Effects of economic hedging related to natural gas inventory | (7,209) | | 14,622 | | (14,741) | | 5,735 | | Effects of economic hedging related to natural gas inventory | 1,155 | | (7,209) | | 24,732 | | (14,741) | |
| Tax effect | Tax effect | 1,713 | | (3,475) | | 3,503 | | (1,363) | | Tax effect | (274) | | 1,713 | | (5,877) | | 3,503 | |
| Net income to NFE tax adjustment | Net income to NFE tax adjustment | 3,990 | | 2,174 | | 1,922 | | (37) | | Net income to NFE tax adjustment | 1,248 | | 3,990 | | 387 | | 1,922 | |
| Net financial earnings (loss) | $ | 96,528 | | $ | 2,487 | | $ | 98,028 | | $ | (2,635) | | |
| Net financial earnings | | Net financial earnings | $ | 29,940 | | $ | 96,528 | | $ | 47,507 | | $ | 98,028 | |
(1)Includes taxes related to an intercompany transaction between NJNG and Energy Services that have been eliminated in consolidation of approximately $23,000$(375,000) and $150,000$23,000 for the three months ended March 31, 2022 and 2020,2021, respectively, and $(284,000)$(1.2) million and $48,000$(284,000) for the six months ended March 31, 20212022 and 2020,2021, respectively.
New Jersey Resources Corporation
Part I
ITEM 2. MANAGEMENT’S DISCUSSION AND ANALYSIS OF FINANCIAL CONDITION AND RESULTS OF
OPERATIONS (Continued)
NFE increased $94.0decreased $66.6 million and $100.7$50.5 million during the three and six months ended March 31, 2021,2022, compared with the three and six months ended March 31, 2020,2021, respectively, due primarily to higherlower financial margin, as previously discussed.
Future results are subject to Energy Services' ability to expand its wholesale sales and service activities and are contingent upon many other factors, including an adequate number of appropriate and credit qualified counterparties in an active and liquid natural marketplace, volatility in the natural gas market due to weather or other fundamental market factors impacting supply and/or demand, transportation, storage and/or other market arbitrage opportunities, sufficient liquidity in the overall energy trading market, and continued access to liquidity in the capital markets.
Storage and Transportation Segment
Overview
Our Storage and Transportation segment invests in natural gas assets, such as natural gas transportation and storage facilities. We believe that acquiring, owning and developing these storage and transportation assets, which operate under a tariff structure that has either regulatedcost- or market-based rates, can provide us a growth opportunity. Our Storage and Transportation segment is subject to various risks, including the construction, development and operation of our transportation and storage assets, obtaining necessary governmental, environmental and regulatory approvals, our ability to obtain necessary property rights and our ability to obtain financing at reasonable costs for the constructionsconstruction, operation and maintenance of our assets. In addition, our storage and transportation assets may be subject to risk associated with the COVID-19 pandemic, such as disruption to the supply chain and availability of critical equipment and supplies, disruptions to the availability of our specialized workforce and contractors and changes to demand for natural gas, transportation and other downstream activities.
Our Storage and Transportation segment is comprised of a 50 percent ownership interest in Steckman Ridge, a storage facility that operates under market-based rates and a 20 percent ownership interest in PennEast, a natural gas pipeline. NJR Pipeline Company acquired 100 percent of Leaf River, for $367.5 million, on October 11, 2019. Leaf River owns and operates a 32.2 million Dth salt dome natural gas storage facility that operates under market-based rates. In addition, on January 13, 2020,rates and Adelphia Gateway, acquired all of Talen’s membership interests in IEC, an existing 84-mile pipeline in southeastern Pennsylvania, including related assets and rights of way, for a base purchase price of $166.0 million.Pennsylvania. Adelphia Gateway operates under cost of service rates but can enter into negotiated rates with counterparties. The northern portion of the pipeline was operational upon acquisition and it currently serves two natural gas generation facilities. On October 5, 2020, we received a partial Notice to Proceed with construction from FERC and have begunbegan the conversion of the southern zone of the pipeline to natural gas.
Through our subsidiary NJR Pipeline Company, we areOur Storage and Transportation segment also has a 50 percent ownership interest in Steckman Ridge, a storage facility that operates under market-based rates and a 20 percent investorinterest in PennEast, a partnership whose purpose iswas to construct and operate a 120-mile natural gas pipeline that will extendwould have extended from northeast Pennsylvania to western New Jersey.
PennEast received a Certificate of Public Convenience and Necessity for the project from FERC onin January 19, 2018. However, because of numerous regulatory and legal challenges, we evaluated our equity investment in PennEast for impairment during fiscal 2021, and determined that it was other-than-temporarily impaired. We estimated the fair value of our investment in PennEast using probability weighted scenarios assigned to discounted future cash flows. The impairment was the result of management's estimates and assumptions regarding the likelihood of certain outcomes related to required regulatory approvals and pending legal matters, the timing and magnitude of construction costs and in-service dates, the evaluation of the current environmental and political climate as it relates to interstate pipeline development, and transportation capacity revenues and discount rates.
During the third quarter of fiscal 2021, the PennEast partnership determined that this project is no longer supported, and all further development ceased. The Company recognized an other-than-temporary impairment charge of $92.0 million, or approximately $74.5 million, net of income taxes, which represents the best estimate of the salvage value of the remaining assets of the project. Other-than-temporary impairments are recorded in equity in (losses) earnings from affiliates in the Unaudited Condensed Consolidated Statements of Operations.
On September 10, 2019,December 16, 2021, the Third Circuit issued anFERC dismissed PennEast’s pending applications. The order overturningvacates the certificate authorization for the PennEast pipeline project in light of PennEast’s response to FERC staff’s November 23, 2021 request for a status update, in which PennEast informed the Commission it is no longer developing the project. The order vacates the certificate authorization, subject to leave of the U.S. District Court of Appeals for the District of New Jersey’s order granting PennEast condemnationD.C. Circuit where the Commission’s certificate and immediate access in accordance with the Natural Gas Act to certain properties in which the State of New Jersey holds an interest. A Petition for Rehearing was denied by the Third Circuit on November 5, 2019.rehearing orders are under review.
On October 8, 2019, the NJDEP issued a letter indicating that it deemed PennEast’s freshwater wetlands permit application to be administratively incomplete and closed the matter without prejudice. On October 11, 2019, PennEast submitted a letter to the NJDEP objecting to its position that the application is administratively incomplete. PennEast's objections were rejected by the NJDEP on November 18, 2019.
On October 4, 2019, PennEast filed a petition for Declaratory Order with FERC requesting an interpretation of the eminent domain authority of a FERC certificate holder under the Natural Gas Act. The Declaratory Order was granted on January 30, 2020.
On January 30, 2020, PennEast filed an amendment with FERC to construct the PennEast pipeline in two phases. Phase one consists of construction of a 68-mile pipeline in Pennsylvania from the eastern Marcellus Shale region in Luzerne County that would end in Northampton County. Phase two includes construction of the remaining original certificated route in Pennsylvania and New Jersey. Construction is expected to begin following approval by FERC of the phased approach and receipt of any remaining governmental and regulatory permits.
New Jersey Resources Corporation
Part I
ITEM 2. MANAGEMENT’S DISCUSSION AND ANALYSIS OF FINANCIAL CONDITION AND RESULTS OF
OPERATIONS (Continued)
On February 18, 2020,March 10, 2022, following the sale of certain project related assets and refunds of interconnection fees received from interstate pipelines, the PennEast filedboard of managers approved a writ of certiorari with the Supreme Courtcash distribution to members of the United States to reviewpartnership totaling $4.0 million per partner. The distribution was received by the September 10, 2019 Third Circuit decision.
On June 29, 2020, the Supreme Court requested that the Solicitor General of the United States file a brief that expresses the viewsCompany on the question of the use of eminent domain to acquire state owned lands for pipeline construction. The Solicitor General filed its brief with the Supreme Court on December 9, 2020.
The State of New Jersey filed a brief with the Supreme Court on December 23, 2020, in response to the brief of the Solicitor General.
On February 3, 2021, the Supreme Court granted the petition for a writ of certiorari. The matter was argued before the Supreme Court on April 28, 2021.
We evaluated our investment in PennEast for an other-than-temporary impairment and determined an impairment charge was not necessary. It is reasonably possible that future unfavorable developments, such as a reduced likelihood of success from development options and legal outcomes, estimated increases in construction costs, increases in the discount rate, or further significant delays, could result in an impairment of our equity method investment. Also, the use of alternate judgments and assumptions could result in a different calculation of fair value, which could ultimately result in the recognition of an impairment charge in the Unaudited Condensed Consolidated Financial Statements.
Due to the expiration of a customer contract for Steckman Ridge, we evaluated our investment in Steckman Ridge for other-than-temporary impairment and determined an impairment charge was not necessary.
The fair value of our investment in Steckman Ridge was determined using a discounted cash flow method and utilized management’s best estimates and assumptions related to expected future results, including the price and capacity of firm natural gas storage contracting, operations and maintenance costs, the nature and timing of major maintenance and capital investment, and discount rates. Fair value determinations require considerable judgment and are sensitive to changes in underlying assumptions and other factors. As a result, it is reasonably possible that future unfavorable developments, such as the failure to execute storage contracts and other services for available capacity at anticipated price levels could result in an other-than temporary impairment charge in the Unaudited Condensed Consolidated Financial Statements.March 31, 2022.
As of March 31, 2021,2022, our investments in Steckman Ridge and PennEast were $111.4$108.5 million and $103.1$1.5 million, respectively.
Operating Results
The financial results of our Storage and Transportation segment are summarized as follows:
| | | Three Months Ended | Six Months Ended | | Three Months Ended | Six Months Ended |
| | March 31, | | March 31, |
| (Thousands) | (Thousands) | 2021 | 2020 | 2021 | 2020 | (Thousands) | 2022 | 2021 | 2022 | 2021 |
Operating revenues (1) | Operating revenues (1) | $ | 13,926 | | $ | 11,076 | | $ | 27,030 | | $ | 20,148 | | Operating revenues (1) | $ | 13,342 | | $ | 13,926 | | $ | 25,485 | | $ | 27,030 | |
| Operating expenses | Operating expenses | | Operating expenses | |
| Natural gas purchases | Natural gas purchases | 238 | | 193 | | 471 | | 539 | | Natural gas purchases | 337 | | 238 | | 1,041 | | 471 | |
| Operation and maintenance | Operation and maintenance | 7,139 | | 6,094 | | 13,681 | | 10,972 | | Operation and maintenance | 7,254 | | 7,139 | | 14,684 | | 13,681 | |
| Depreciation and amortization | Depreciation and amortization | 2,364 | | 2,397 | | 5,004 | | 4,078 | | Depreciation and amortization | 2,571 | | 2,364 | | 4,704 | | 5,004 | |
| Total operating expenses | Total operating expenses | 9,741 | | 8,684 | | 19,156 | | 15,589 | | Total operating expenses | 10,162 | | 9,741 | | 20,429 | | 19,156 | |
| Operating income | Operating income | 4,185 | | 2,392 | | 7,874 | | 4,559 | | Operating income | 3,180 | | 4,185 | | 5,056 | | 7,874 | |
| Other income, net | Other income, net | 1,591 | | 4,671 | | 2,845 | | 5,368 | | Other income, net | 2,750 | | 1,591 | | 5,259 | | 2,845 | |
| Interest expense, net | Interest expense, net | 3,578 | | 5,621 | | 7,560 | | 8,443 | | Interest expense, net | 1,847 | | 3,578 | | 3,983 | | 7,560 | |
| Income tax provision | Income tax provision | 873 | | 1,105 | | 1,519 | | 1,807 | | Income tax provision | 714 | | 873 | | 1,057 | | 1,519 | |
| Equity in earnings of affiliates | Equity in earnings of affiliates | 3,386 | | 3,921 | | 6,579 | | 7,585 | | Equity in earnings of affiliates | 1,256 | | 3,386 | | 2,312 | | 6,579 | |
| Net income | Net income | $ | 4,711 | | $ | 4,258 | | $ | 8,219 | | $ | 7,262 | | Net income | $ | 4,625 | | $ | 4,711 | | $ | 7,587 | | $ | 8,219 | |
(1)Includes related party transactions of approximately $669,000$536,000 and $675,000$669,000 for the three months ended March 31, 2022 and 2021, respectively, and 2020, respectively,$1.1 million and $1.3 million for both the six months ended March 31, 2022 and 2021, and 2020,respectively, which are eliminated in consolidation.
New Jersey Resources Corporation
Part I
ITEM 2. MANAGEMENT’S DISCUSSION AND ANALYSIS OF FINANCIAL CONDITION AND RESULTS OF
OPERATIONS (Continued)
Operating Revenues
Operating revenues increased $2.9 milliondecreased $584,000 and $6.9$1.5 million during the three and six months ended March 31, 2021,2022, compared with the three and six months ended March 31, 2020,2021, respectively, due primarily to increased operating revenuesa decrease in hub services revenue at Leaf River and Adelphia Gateway.River.
Equity in earnings of affiliates decreased $535,000$2.1 million and $1.0$4.3 million during the three and six months ended March 31, 2021,2022, compared with the three and six months ended March 31, 2020,2021, respectively, due primarily to decreasesdecreased AFUDC equity related to our investment in storage revenue at Steckman Ridge.PennEast, which ceased all further development.
Operation and Maintenance ExpenseOther Income, Net
O&MOther income increased $1.0$1.2 million and $2.7$2.4 million during the three and six months ended March 31, 2021,2022, compared with the three and six months ended March 31, 2020,2021, respectively, due primarily to operations ofincreased AFUDC equity related to the Adelphia Gateway and increases at Leaf River.
Depreciation Expense
Depreciation expense remained relatively flat during the three months ended March 31, 2021, compared with the three months ended March 31, 2020. Depreciation expense increased $926,000 during the six months ended March 31, 2021, compared with the six months ended March 31, 2020, due primarily to operations of Adelphia Gateway during the six months ended March 31, 2021, that were not present in the first quarter of fiscal 2020.project.
Interest Expense
Interest expense decreased $2.0$1.7 million and $883,000$3.6 million during the three and six months ended March 31, 2021,2022, compared with the three and six months ended March 31, 2020,2021, respectively, due primarily to higher interest expensereduced debt related to the acquisition of Leaf River and Adelphia during fiscal 2020.PennEast project.
Net Income
Net income increased $453,000 and $957,000remained relatively flat during the three andmonths ended March 31, 2022, compared with the three months ended March 31, 2021. Net income decreased $632,000 during the six months ended March 31, 2022, compared with the six months ended March 31, 2021, compared with the three and six months ended March 31, 2020, due primarily to increased operating revenue,lower equity in earnings of affiliates, partially offset by increased O&M and depreciationhigher AFUDC equity at Adelphia Gateway along with decreased interest expense, as previously discussed.
Home Services and Other Operations
New Jersey Resources Corporation
Part I
ITEM 2. MANAGEMENT’S DISCUSSION AND ANALYSIS OF FINANCIAL CONDITION AND RESULTS OF
OPERATIONS (Continued)
Overview
The financial results of Home Services and Other consist primarily of the operating results of NJRHS. NJRHS provides service, sales and installation of appliances to service contract customers and has been focused on growing its installation business and expanding its service contract customer base. Home Services and Other also includes organizational expenses incurred at NJR and rentalhome warranty contract income at CR&R.NJR Retail.
Operating Results
The condensed financial results of Home Services and Other are summarized as follows:
| | | Three Months Ended | Six Months Ended | | Three Months Ended | Six Months Ended |
| | March 31, | | March 31, |
| (Thousands) | (Thousands) | 2021 | 2020 | 2021 | 2020 | (Thousands) | 2022 | 2021 | 2022 | 2021 |
| Operating revenues | Operating revenues | $ | 12,773 | | $ | 12,365 | | $ | 25,350 | | $ | 25,272 | | Operating revenues | $ | 13,222 | | $ | 12,773 | | $ | 27,173 | | $ | 25,350 | |
| Operation and maintenance | $ | 9,254 | | $ | 8,926 | | $ | 19,575 | | $ | 19,459 | | |
| Interest expense, net | $ | 1,728 | | $ | 565 | | $ | 2,844 | | $ | 837 | | |
| Income tax (benefit) provision | $ | (59) | | $ | 1,956 | | $ | 59 | | $ | 2,175 | | |
| | | Income before income taxes | | Income before income taxes | $ | 707 | | $ | 688 | | $ | 1,400 | | $ | 744 | |
| Income tax provision (benefit) | | Income tax provision (benefit) | 256 | | (59) | | 502 | | 59 | |
| Net income | Net income | $ | 747 | | $ | 148 | | $ | 685 | | $ | 1,257 | | Net income | $ | 451 | | $ | 747 | | $ | 898 | | $ | 685 | |
Operating Revenues
Operating revenues increased $449,000 and $1.8 million during the three and six months ended March 31, 2022, compared with the three and six months ended March 31, 2021, respectively, due primarily to increased installation revenue at NJRHS.
Net Income
Net income decreased $296,000 during the three months ended March 31, 2022, compared with the three months ended March 31, 2021, due primarily to increased O&M, partially offset by increased revenue and other income along with decreased interest expense. Net income increased $213,000 during the six months ended March 31, 2022, compared with the six months ended March 31, 2021, respectively, due primarily to increased revenue and other income along with decreased interest expense, partially offset by increased O&M.
Liquidity and Capital Resources
Our objective is to maintain an efficient consolidated capital structure that reflects the different characteristics of each reporting segment and business operations and provides adequate financial flexibility for accessing capital markets as required.
Our consolidated capital structure was as follows:
| | | | | | | | |
| March 31, 2022 | September 30,
2021 |
| Common stock equity | 40 | % | 38 | % |
| Long-term debt | 52 | | 51 | |
| Short-term debt | 8 | | 11 | |
| Total | 100 | % | 100 | % |
New Jersey Resources Corporation
Part I
ITEM 2. MANAGEMENT’S DISCUSSION AND ANALYSIS OF FINANCIAL CONDITION AND RESULTS OF
OPERATIONS (Continued)
Operating Revenues
Operating revenues increased $408,000 during the three months ended March 31, 2021, compared with the three months ended March 31, 2020, due primarily to increased service contract and installation revenue at NJRHS. Operating revenues remained relatively flat during the six months ended March 31, 2021, compared with the six months ended March 31, 2020.
Net Income
Net income increased $599,000 during the three months ended March 31, 2021, compared with the three months ended March 31, 2020, due primarily to increased operating revenues as previously discussed along with decreased income tax expense, partially offset by higher interest expense. Net income decreased $572,000 during the six months ended March 31, 2021, compared with the six months ended March 31, 2020, due primarily to increased shared corporate costs and information technology expense.
Liquidity and Capital Resources
Our objective is to maintain an efficient consolidated capital structure that reflects the different characteristics of each business segment and business operations and provides adequate financial flexibility for accessing capital markets as required.
Our consolidated capital structure was as follows:
| | | | | | | | |
| March 31,
2021 | September 30,
2020 |
| Common stock equity | 44 | % | 43 | % |
| Long-term debt | 55 | | 53 | |
| Short-term debt | 1 | | 4 | |
| Total | 100 | % | 100 | % |
Common Stock Equity
We satisfy our external common equity requirements, if any, through issuances of our common stock, including the proceeds from stock issuances under our DRP. The DRP allows us, at our option, to use treasury shares or newly issued shares to raise capital. NJR raised approximately $3.7 million and $3.6 million of equity through the DRP by issuing 23,000 shares of common stock during the three months ended March 31, 2022 and 2021, and raised $5.2 million during the three months ended March 31, 2020 by issuing 143,000 shares of treasury stock.respectively. NJR raised approximately $7.5 million of equity through the DRP by issuing 23,000 sharesduring both of common stock and approximately 140,000 shares of treasury stock during the six months ended March 31, 2021,2022 and raised $8.8 million during the six months ended March 31, 2020, by issuing approximately 223,000 shares of treasury stock. There were no shares of common stock issued through the waiver discount feature of the DRP during the three and six months ended March 31, 2021 and 2020.2021.
On December 4, 2019, we completed an equity offering of 6,545,454 common shares, consisting of 5,333,334 common shares issued directly by NJR and 1,212,120 common shares issuable pursuant to forward sales agreements with investment banks. The issuance of 5,333,334 common shares resulted in proceeds of approximately $212.9 million, net of issuance costs, and was reflected in shareholders' equity and as a financing activity on the statement of cash flows.
Under the forward sale agreements, a total of 1,212,120 common shares were borrowed from third parties and sold to the underwriters. Each forward sale agreement allows us, at our election and prior to September 30, 2020, to physically settle the forward sale agreements by issuing common shares in exchange for net proceeds at the then-applicable forward sale price specified by the agreement, which was initially $40.0125 per share, or, alternatively, to settle the forward sale agreements in whole or in part through the delivery or receipt of shares or cash. The forward sale price is subject to adjustment daily based on a floating interest rate factor and will decrease with respect to certain fixed amounts specified in the agreements, such as dividends.
New Jersey Resources Corporation
Part I
ITEM 2. MANAGEMENT’S DISCUSSION AND ANALYSIS OF FINANCIAL CONDITION AND RESULTS OF
OPERATIONS (Continued)
On September 18, 2020, we amended our forward sale agreements to extend the maturity date of such forward sales agreements from September 30, 2020 to September 10, 2021. OnIn March 3, 2021, we cash settled a portion of thea forward sale agreement for a payout of approximately $388,000 for 727,272 common shares. As of March 31, 2021, if we had elected to net settle the remaining forward sale agreement, we would have paid approximately $1.4 million under a cash settlement or issued 31,607 common shares under a net share settlement.
In 1996, the Board of Directors authorized us to implement a share repurchase program, which was expanded seven times since the inception of the program, authorizing a total of 19.5 million shares of common stock for repurchase. As of March 31, 2021,2022, we had repurchased a total of approximately 17.117.8 million of those shares and may repurchase an additional 2.41.7 million shares under the approved program. There were no shares repurchased during the six months ended March 31, 20212022 and 2020.2021.
Debt
NJR and its unregulated subsidiaries generally rely on cash flows generated from operating activities and the utilization of committed credit facilities to provide liquidity to meet working capital and short-term debt financing requirements. NJNG also relies on the issuance of commercial paper for short-term funding. NJR and NJNG, as borrowers, respectively, periodically access the capital markets to fund long-life assets through the issuance of long-term debt securities.
We believe that our existing borrowing availability, equity proceeds and cash flowflows from operations will be sufficient to satisfy our working capital, capital expenditures and dividend requirements for at least the next 12 months. NJR, NJNG, Clean Energy Ventures, Storage and Transportation and Energy Services currently anticipate that each of their financing requirements for the next 12 months will be met primarily through the issuance of short and long-term debt and meter or solar asset sale leasebacks.
We believe that as of March 31, 2021,2022, NJR and NJNG were, and currently are, in compliance with all existing debt covenants, both financial and non-financial.
As a result of the COVID-19 pandemic there have been disruptions, uncertainty and volatility in the credit and capital markets. OurWe have been able to obtain sufficient financing to meet its funding requirements for operations and capital expenditures, however, our ability to access funds from financial institutions at a reasonable cost may impact the nature and timing of future capital market transactions.
Short-Term Debt
We use our short-term borrowings primarily to finance Energy Services' short-term liquidity needs, Storage and Transportation investments, and PennEast contributions, share repurchases and, on an initial basis, Clean Energy Ventures' investments. Energy Services' use of high-volume storage facilities and anticipated pipeline park-and-loan arrangements, combined with related economic hedging activities in the volatile wholesale natural gas market, create significant short-term cash requirements.
As of March 31, 2021,2022, NJR had a revolving credit facilitiesfacility and a term loan totaling $425$650 million, with $406.2$334.3 million available under the facilities.facility.
NJNG satisfies its debt needs by issuing short-term and long-term debt based on its financial profile. The seasonal nature of NJNG's operations creates large short-term cash requirements, primarily to finance natural gas purchases and customer accounts receivable. NJNG obtains working capital for these requirements, and for the temporary financing of construction and MGP remediation expenditures and energy tax payments, based on its financial profile, through the issuance of commercial paper supported by the NJNG Credit Facility or through short-term bank loans under the NJNG Credit Facility.
New Jersey Resources Corporation
Part I
ITEM 2. MANAGEMENT’S DISCUSSION AND ANALYSIS OF FINANCIAL CONDITION AND RESULTS OF
OPERATIONS (Continued)
NJNG’s commercial paper is sold through several commercial banks under an issuing and paying agency agreement and is supported by the $250 million NJNG Credit Facility. As of March 31, 2021,2022, the unused amount available under the NJNG Credit Facility, including amounts allocated to the backstop under the commercial paper program and the issuance of letters of credit, was $249.3 million.
New Jersey Resources Corporation
Part I
ITEM 2. MANAGEMENT’S DISCUSSION AND ANALYSIS OF FINANCIAL CONDITION AND RESULTS OF
OPERATIONS (Continued)
Short-term borrowings were as follows:
| | | Three Months Ended | Six Months Ended | | Three Months Ended | Six Months Ended |
| (Thousands) | (Thousands) | March 31, 2021 | (Thousands) | March 31, 2022 |
| NJR | NJR | | NJR | |
| Notes Payable to banks: | Notes Payable to banks: | | Notes Payable to banks: | |
| Balance at end of period | Balance at end of period | $ | 8,500 | | | $ | 8,500 | | Balance at end of period | $ | 302,210 | | | $ | 302,210 | |
| Weighted average interest rate at end of period | Weighted average interest rate at end of period | 1.75 | % | | 1.75 | % | Weighted average interest rate at end of period | 1.05 | % | | 1.05 | % |
| Average balance for the period | Average balance for the period | $ | 141,381 | | | $ | 123,582 | | Average balance for the period | $ | 385,205 | | | $ | 320,130 | |
| Weighted average interest rate for average balance | Weighted average interest rate for average balance | 1.04 | % | | 1.04 | % | Weighted average interest rate for average balance | 1.23 | % | | 1.01 | % |
| Month end maximum for the period | Month end maximum for the period | $ | 153,000 | | | $ | 153,000 | | Month end maximum for the period | $ | 401,750 | | | $ | 401,750 | |
| NJNG | NJNG | | NJNG | |
| Commercial Paper and Notes Payable to banks: | Commercial Paper and Notes Payable to banks: | | Commercial Paper and Notes Payable to banks: | |
| Balance at end of period | Balance at end of period | $ | — | | | $ | — | | Balance at end of period | $ | — | | | $ | — | |
| Weighted average interest rate at end of period | Weighted average interest rate at end of period | — | % | | — | % | Weighted average interest rate at end of period | — | % | | — | % |
| Average balance for the period | Average balance for the period | $ | 106 | | | $ | 292 | | Average balance for the period | $ | 3,309 | | | $ | 5,842 | |
| Weighted average interest rate for average balance | Weighted average interest rate for average balance | .06 | % | | .04 | % | Weighted average interest rate for average balance | 0.58 | % | | 0.43 | % |
| Month end maximum for the period | Month end maximum for the period | $ | 5,100 | | | $ | 14,350 | | Month end maximum for the period | $ | 138,025 | | | $ | 177,700 | |
Due to the seasonal nature of natural gas prices and demand, and because inventory levels are built up during its natural gas injection season (April through October), NJR and NJNG's short-term borrowings tend to peak in the November through January time frame.
NJR
Based on its average borrowings during the three and six months ended March 31, 2021,2022, NJR's average interest rate was 1.041.23 percent and 1.041.01 percent, resulting in interest expense of approximately $362,000$794,000 and $643,000,$1.6 million, respectively.
During fiscal 2021, NJR entered into a Second Amended and Restated Credit Agreement governing a $500 million NJR Credit Facility. The NJR Credit Facility expires on September 2, 2026, subject to two mutual options for a one-year extension beyond that date. The NJR Credit Facility permits the borrowing of revolving loans and swingline loans, as well as a $75 million sublimit for the issuance of letters of credit. The NJR Credit Facility also includes an accordion feature, which would allow NJR, in the absence of a default or event of default, to increase from time to time, with the existing or new lenders, the revolving credit commitments under the NJR Credit Facility in increments of $50 million up to a maximum of $250 million. Certain of NJR’s unregulated subsidiaries have guaranteed all of NJR’s obligations under the NJR Credit Facility. The credit facility is used primarily to finance its share repurchases, to satisfy Energy Services’ short-term liquidity needs and to finance, on an initial basis, unregulated investments. As of March 31, 2021,2022, NJR had sevennine letters of credit outstanding totaling $10.3$13.5 million, which reduced the amount available under the NJR Credit Facility by the same amount. NJR does not anticipate that these letters of credit will be drawn upon by the counterparties.
On February 8, 2022, NJR entered into a 364-day $150 million term loan credit agreement with an interest rate based on SOFR plus 0.85 percent, which expires on February 7, 2023. The Company borrowed $50 million on February 9, 2022 and $100 million on February 14, 2022.
Neither NJNG nor its assets are obligated or pledged to support the NJR Credit Facility.Facility or term loan credit agreement.
New Jersey Resources Corporation
Part I
ITEM 2. MANAGEMENT’S DISCUSSION AND ANALYSIS OF FINANCIAL CONDITION AND RESULTS OF
OPERATIONS (Continued)
NJNG
As noted above, based on its average borrowings during the three and six months ended March 31, 2021,2022, NJNG's average interest rate was 0.060.58 percent and 0.040.43 percent, respectively. NJNG'sresulting in interest expense was immaterialof approximately $27,000 and $159,000, respectively.
During fiscal 2021, NJNG entered into a Second Amended and Restated Credit Agreement governing a $250 million, NJNG Credit Facility. The NJNG Credit Facility expires on September 2, 2026, subject to two mutual options for a one-year extension beyond that date. The NJNG Credit Facility permits the borrowing of revolving loans and swingline loans, as well as a $30 million sublimit for the three and six months ended March 31, 2021.issuance of letters of credit. The NJNG Credit Facility also includes an accordion feature, which would allow NJNG, in the absence of a default or event of default, to increase from time to time, with the existing or new lenders, the revolving credit commitments under the NJNG Credit Facility in minimum increments of $50 million up to a maximum of $100 million.
As of March 31, 2021,2022, NJNG had two letters of credit outstanding for $731,000, which reduced the amount available under NJNG's committed credit facility by the same amount. NJNG does not anticipate that these letters of credit will be drawn upon by the counterparties.
Short-Term Debt Covenants
Borrowings under the NJR Credit FacilitiesFacility, term loan credit agreement and the NJNG Credit Facility are conditioned upon compliance with a maximum leverage ratio (consolidated total indebtedness to consolidated total capitalization as defined in the applicable agreements), of not more than .70 to 1.00 for NJR and .65 to 1.00 at any time.for NJNG. These revolving credit facilities and term loan credit agreement contain customary representations and warranties for transactions of this type. They also contain customary events of default and certain covenants that will limit NJR's or NJNG's ability, beyond agreed upon thresholds, to, among other things:
•incur additional debt;
•incur liens and encumbrances;
•make dispositions of assets;
•enter into transactions with affiliates; and
•merge, consolidate, transfer, sell or lease all or substantially all of the borrower's or guarantors' assets.
These covenants are subject to a number of exceptions and qualifications set forth in the applicable agreements.
New Jersey Resources Corporation
Part I
ITEM 2. MANAGEMENT’S DISCUSSION AND ANALYSIS OF FINANCIAL CONDITION AND RESULTS OF
OPERATIONS (Continued)
Default Provisions
The agreements governing our long-term and short-term debt obligations include provisions that, if not complied with, could require early payment or similar actions. Default events include, but are not limited to, the following:
•defaults for non-payment;
•defaults for breach of representations and warranties;
•defaults for insolvency;
•defaults for non-performance of covenants;
•cross-defaults to other debt obligations of the borrower; and
•guarantor defaults.
The occurrence of an event of default under these agreements could result in all loans and other obligations of the borrower becoming immediately due and payable and the termination of the credit facilities or term loan.
New Jersey Resources Corporation
Part I
ITEM 2. MANAGEMENT’S DISCUSSION AND ANALYSIS OF FINANCIAL CONDITION AND RESULTS OF
OPERATIONS (Continued)
Long-Term Debt
NJR
As of March 31, 2021,2022, NJR had the following outstanding:
•$50 million of 3.25 percent senior notes due September 17, 2022;
•$50 million of 3.20 percent senior notes due August 18, 2023;
•$100 million of 3.48 percent senior notes due November 7, 2024;
•$100 million of 3.54 percent senior notes due August 18, 2026;
•$100 million of 3.96 percent senior notes due June 8, 2028;
•$150 million of 3.29 percent senior notes due July 17, 2029;
•$130 million of 3.50 percent senior notes due July 23, 2030;
•$120 million of 3.13 percent senior notes due September 1, 2031;
•$130 million of 3.60 percent senior notes due July 23, 2032; and
•$80 million of 3.25 percent senior notes due September 1, 2033.
On February 16, 2022, NJR signed a commitment letter with a financial institution to refinance $50 million of its Senior Unsecured Notes that are currently scheduled to mature in September 2022, over a 12-year term with an interest rate of 3.64 percent maturing in September 2034.
Neither NJNG nor its assets are obligated or pledged to support NJR's long-term debt.
NJNG
As of March 31, 2021,2022, NJNG's long-term debt consisted of $1.1$1.2 billion in fixed-rate debt issuances secured by the Mortgage Indenture, with maturities ranging from 2024 to 2060,2061, and $58.3$27.0 million in finance leases with various maturities ranging from 2024 to 2028.
On October 28, 2021, to 2037.NJNG entered into a Note Purchase Agreement for $100 million of its senior notes, of which $50 million were issued at an interest rate of 2.97 percent, maturing in 2051, and $50 million were issued at an interest rate of 3.07 percent, maturing in 2061. The senior notes are secured by an equal principal amount of NJNG’s FMBs issued under NJNG’s Mortgage Indenture.
NJR is not obligated directly or contingently with respect to the NJNG’s fixed-rate debt issuances.
Long-Term Debt Covenants and Default Provisions
The NJR and NJNG long-term debt instruments contain customary representations and warranties for transactions of their type. They also contain customary events of default and certain covenants that will limit NJR or NJNG's ability beyond agreed upon thresholds to, among other things:
•incur additional debt (including a covenant that limits the amount of consolidated total debt of the borrower at the end of a fiscal quarter to 70 percent for NJR and 65 percent for NJNG of the consolidated total capitalization of the borrower, as those terms are defined in the applicable agreements, and a covenant limiting priority debt to 20 percent of the borrower's consolidated total capitalization, as those terms are defined in the applicable agreements);
•incur liens and encumbrances;
•make loans and investments;
•make dispositions of assets;
•make dividends or restricted payments;
•enter into transactions with affiliates; and
•merge, consolidate, transfer, sell or lease substantially all of the borrower's assets.
The aforementioned covenants are subject to a number of exceptions and qualifications set forth in the applicable note purchase agreements.
New Jersey Resources Corporation
Part I
ITEM 2. MANAGEMENT’S DISCUSSION AND ANALYSIS OF FINANCIAL CONDITION AND RESULTS OF
OPERATIONS (Continued)
The aforementioned covenants are subject to a number of exceptions and qualifications set forth in the applicable note purchase agreements.
In addition, the FMBs issued by NJNG under the Mortgage Indenture are subject to certain default provisions. Events of Default, as defined in the Mortgage Indenture, consist mainly of:
•failure for 30 days to pay interest when due;
•failure to pay principal or premium when due and payable;
•failure to make sinking fund payments when due;
•failure to comply with any other covenants of the Mortgage Indenture after 30 days' written notice from the Trustee;
•failure to pay or provide for judgments in excess of $30 million in aggregate amount within 60 days of the entry thereof; or
•certain events that are or could be the basis of a bankruptcy, reorganization, insolvency or receivership proceeding.
Upon the occurrence and continuance of such an Event of Default, the Mortgage Indenture, subject to any provisions of law applicable thereto, provides that the Trustee may take possession and conduct the business of NJNG, may sell the trust estate, or proceed to foreclose the lien pursuant toof the Mortgage Indenture. The interest rate on defaulted principal and interest, to the extent permitted by law, on the FMBs issued under the Mortgage Indenture is the rate stated in the applicable supplement or, if no such rate is stated, six percent per annum.
Sale Leaseback
NJNG
NJNG received $4.0$17.3 million in December 2019,during the six months ended March 31, 2022, in connection with the sale leaseback of its natural gas meters. NJNG records a capitalfinancing lease obligation that is paid over the term of the lease and has the option to purchase the meters back at fair value upon expiration of the lease. NJNG exercised early purchase options with respectcontinues to certain outstanding meter leases by making final principal payments of $1.2 million for bothevaluate this sale leaseback program based on current market conditions. Natural gas meters are excepted from the six months ended March 31, 2021 and 2020.lien on NJNG property under the Mortgage Indenture. There were no natural gas meter sale leasebacks recorded during the six months ended March 31, 2021.
Clean Energy Ventures
Clean Energy Ventures enters into transactions to sell the commercial solar assets concurrent with agreements to lease the assets back over a period of five to 15 years. These transactions are considered failed sale leasebacks for accounting purposes and are therefore treated as financing obligations, which are typically secured by the renewable energy facility asset and its future cash flows from SRECRECs and energy sales. ITCs and other tax benefits associated with these solar projects are transferred to the buyer, if applicable.applicable; however, the lease payments are structured so that Clean Energy Ventures is compensated for the transfer of the related tax incentives. Clean Energy Ventures continues to operate the solar assets, including related expenses, and retain the revenue generated from SRECsRECs and energy sales, and has the option to renew the lease or repurchase the assets sold at the end of the lease term. In December 2020,During the six months ended March 31, 2022 and 2021, Clean Energy Ventures received proceeds of $3.3 million and $12.1 million, respectively, in connection with the sale leaseback of two commercial solar projects. Clean Energy Ventures did not receiveThe proceeds related toreceived were recognized as a financing obligation on the sale leaseback of commercial solar assets during the six months ended March 31, 2020.Unaudited Condensed Consolidated Balance Sheets.
Contractual Obligations
As of March 31, 2022, there were NJR guarantees covering approximately $215.4 million of natural gas purchases and Energy Services demand fee commitments and eleven outstanding letters of credit totaling $14.2 million, as previously mentioned, not yet reflected in accounts payable on the Unaudited Condensed Consolidated Balance Sheets.
Estimated capital expenditures are reviewed on a regular basis and may vary based on the ongoing effects of regulatory constraints, environmental regulations, unforeseen events, and the ability to access capital.
NJNG's total capital expenditures are projected to be between $424$285 million and $454$335 million during fiscal 2021.2022. Total capital expenditures spent or accrued during the six months ended March 31, 2021,2022, were $188.4$119.3 million. NJNG expects to fund its obligations with a combination of cash flows from operations, cash on hand, issuance of commercial paper, available capacity under its revolving credit facility and the issuance of long-term debt. As of March 31, 2021,2022, NJNG's future MGP expenditures are estimated to be $143.5$121.6 million. For a more detailed description of MGP expenditures see Note 13. Commitments and Contingent Liabilities in the accompanying Unaudited Condensed Consolidated Financial Statements.
Estimated capital expenditures are reviewed on a regular basis and may vary based on the ongoing effects of regulatory constraints, environmental regulations, unforeseen events, and the ability to access capital.
New Jersey Resources Corporation
Part I
ITEM 2. MANAGEMENT’S DISCUSSION AND ANALYSIS OF FINANCIAL CONDITION AND RESULTS OF
OPERATIONS (Continued)
During the six months ended March 31, 2022, our Storage and Transportation segment had capital expenditures spent or accrued for the Adelphia Gateway project totaling $88.5 million and capital expenditures spent or accrued for Leaf River totaling $10.2 million. During fiscal 2022, we expect expenditures related to the Adelphia Gateway project to be between $115 million and $130 million and expenditures related to Leaf River to be between $7 million and $11 million.
During the six months ended March 31, 2022, total capital expenditures spent or accrued related to the purchase and installation of solar equipment were $67.7 million. Clean Energy Ventures' expenditures include clean energy projects that support our goal to promote renewable energy. Accordingly, Clean Energy Ventures enters into agreements to install solar equipment involving both residential and commercial projects. During the six months ended March 31, 2021, total capital expenditures spent or accrued related to the purchase and installation of solar equipment were $37.5 million. We estimate solar-related capital expenditures for projects during fiscal 20212022 to be between $96$139 million and $118$157 million.
During the six months ended March 31, 2021, our Storage and Transportation segment had capital expenditures for the Adelphia Gateway project totaling $27.4 million and capital expenditures for Leaf River totaling $2.6 million. During fiscal 2021, we expectCapital expenditures related to clean energy projects are subject to change due to a variety of factors that may affect our ability to commence operations at these projects on a timely basis or at all, including sourcing projects that meet our investment criteria, logistics associated with the Adelphia Gateway project to be between $110 millionstart-up of residential and $130 millioncommercial solar projects, such as timing of construction schedules, the permitting and expendituresregulatory process, any delays related to Leaf Riverelectric grid interconnection, economic trends or unforeseen events and the ability to be between $22 million and $23 million.access capital or allocation of capital to other investments or business opportunities.
Energy Services does not currently anticipate any significant capital expenditures during fiscal 20212022 and 2022.2023.
OnDuring December 16, 2020, Energy Services entered into a series of asset management agreementsAMAs with an investment grade public utility to release pipeline capacity associated with certain natural gas transportation contracts. The utility will provideprovides certain asset management services and Energy Services may deliver natural gas to the utility in exchange for aggregate net proceeds of approximately $500 million, payable through November 1, 2030. The asset management agreementsAMAs include a series of initial and permanent releases, commencingwhich commenced on November 1, 2021. NJR will receive approximately $260 million in cash from fiscal 2022 through fiscal 2024 and $34 million per year from fiscal 2025 through fiscal 2031 under the agreements. During the six months ended March 31, 2022, Energy Services recognized $32.4 million of operating revenue on the Unaudited Condensed Consolidated Statements of Operations. Amounts received in excess of revenue totaling $54.4 million as of March 31, 2022, are included in deferred revenue on the Unaudited Condensed Consolidated Balance Sheets.
More detailed information regarding contractual obligations is contained in Liquidity and Capital Resources - Contractual Obligations section of Part II, Item 7. Management's Discussion and Analysis of Financial Condition and Results of Operations of our Annual Report on Form 10-K for the period ended September 30, 2020.2021.
Off-Balance-Sheet Arrangements
As of March 31, 2021, our off-balance-sheet arrangements consist of guarantees covering approximately $196.5 million of natural gas purchases, SREC sales and demand fee commitments and outstanding letters of credit totaling $11.0 million.
Cash Flows
Operating Activities
Cash flows from operating activities during the six months ended March 31, 2021,2022, totaled $356.3$330.5 million, compared with $179.1$356.3 million during the six months ended March 31, 2020.2021. Operating cash flows are primarily affected by variations in working capital, which can be impacted by several factors, including:
•seasonality of our business;
•fluctuations in wholesale natural gas prices and other energy prices, including changes in derivative asset and liability values;
•timing of storage injections and withdrawals;
•the deferral and recovery of natural gas costs;
•changes in contractual assets utilized to optimize margins related to natural gas transactions;
•broker margin requirements;
•impact of unusual weather patterns on our wholesale business;
•timing of the collections of receivables and payments of current liabilities;
•volumes of natural gas purchased and sold; and
•timing of SREC deliveries.
The increase of $177.1 million in cash flows from operating activities during the six months ended March 31, 2021, compared with the six months ended March 31, 2020, was due primarily to higher net income due primarily to increased earnings at Energy Services along with increased working capital.
New Jersey Resources Corporation
Part I
ITEM 2. MANAGEMENT’S DISCUSSION AND ANALYSIS OF FINANCIAL CONDITION AND RESULTS OF
OPERATIONS (Continued)
The decrease of $25.8 million in operating cash flows during the six months ended March 31, 2022, compared with the six months ended March 31, 2021, was due primarily to outsized performance at Energy Services during February 2021 that did not reoccur during fiscal 2022, partially offset by the AMAs, which commenced November 2021, as previously discussed.
Investing Activities
Cash flows used in investing activities totaled $296.8 million during the six months ended March 31, 2022, compared with $245.5 million during the six months ended March 31, 2021, compared with $751.1 million during the six months ended March 31, 2020.2021. The decreaseincrease of $505.6$51.3 million was due primarily to the acquisition of Leaf River and Adelphia in the prior period that did not recur along with a decrease of $28.9 million in solar capital expenditures, partially offset by an increase in capital expenditures of $20.1 million for utility plant investments and $20.8 million for Storage and Transportation.Transportation related to the conversion of the southern portion of Adelphia Gateway's pipeline to natural gas along with increased solar expenditures, partially offset by decreased utility plant expenditures.
Financing Activities
Financing cash flows generally are seasonal in nature and are impacted by the volatility in pricing in the natural gas and other energy markets. NJNG's inventory levels are built up during its natural gas injection season (April through October) and reduced during withdrawal season (November through March) in response to the supply requirements of its customers. Changes in financing cash flows can also be impacted by natural gas management and marketing activities at Energy Services and clean energy investments at Clean Energy Ventures.
Cash flows used in financing activities totaled $24.5 million during the six months ended March 31, 2022, compared with $171.2 million during the six months ended March 31, 2021, compared with cash flows from financing activities of $596.3 million during the six months ended March 31, 2020.2021. The decrease of $767.6$146.8 million is due primarily to increased short-term debt activitythe new $150 million term loans at NJR, related to the acquisitions$100 million issuance of Leaf River and Adelphia in the prior period that did not recur and current periodlong-term debt at NJNG, along with proceeds of $17.3 million for meter sale leasebacks at NJNG, partially offset by increased payments of short-term debt partially offset byat NJNG and lower proceeds of $12.1 million from solar sale leasebacks at Clean Energy Ventures in the current period.Ventures.
Credit Ratings
The table below summarizes NJNG's credit ratings as of March 31, 2021,2022, issued by two rating entities, Moody's and Fitch:
| | | | | | | | | |
| | Moody's | Fitch |
| Corporate Rating | | N/A | A- |
| Commercial Paper | | P-2 | F-2 |
| Senior Secured | | A1 | A+ |
| Ratings Outlook | | Stable | Stable |
The Fitch ratings and outlook were reaffirmed on March 15,April 14, 2022. The Moody's ratings and outlook were reaffirmed on May 11, 2021. NJNG's Moody's and Fitch ratings are investment-grade ratings. NJR is not a rated entity.
On March 18, 2020, Moody’s revised NJNG's secured rating from Aa3 to A1 and its commercial paper rating from P-1 to P-2 resulting from higher debt levels to fund NJNG’s elevated capital program. The outlook was increased to stable from negative. This action does not currently affect any of NJNG’s long-term borrowing rates or credit facility pricing.
Although NJNG is not party to any lending agreements that would accelerate the maturity date of any obligation caused by a failure to maintain any specific credit rating, if such ratings are downgraded below investment grade, borrowing costs could increase, as would the costs of maintaining certain contractual relationships and future financing and our access to capital markets would be reduced. Even if ratings are downgraded without falling below investment grade, NJR and NJNG could face increased borrowing costs under their credit facilities. A rating set forth above is not a recommendation to buy, sell or hold NJR's or NJNG's securities and may be subject to revision or withdrawal at any time. Each rating set forth above should be evaluated independently of any other rating.
The timing and mix of any external financings will target a common equity ratio that is consistent with maintaining NJNG's current short-term and long-term credit ratings.
New Jersey Resources Corporation
Part I
ITEM 3. QUANTITATIVE AND QUALITATIVE DISCLOSURES ABOUT MARKET RISK
Financial Risk Management
Commodity Market Risks
Natural gas is a nationally traded commodity. Its prices are determined effectively by the NYMEX, ICE and over-the-counter markets. The prices on the NYMEX, CME, ICE and over-the-counter markets generally reflect the national balance of natural gas supply and demand, but are also significantly influenced from time to time by other events.
Our regulated and unregulated businesses are subject to market risk due to fluctuations in the price of natural gas. To economically hedge against such fluctuations, we have entered into forwards, futures, options and swap agreements. To manage these derivative instruments, we have well-defined risk management policies and procedures that include daily monitoring of volumetric limits and monetary guidelines. Our natural gas businesses are conducted through two of our operating subsidiaries. NJNG is a regulated utility that uses futures, options and swaps to provide relative price stability, and its recovery of natural gas costs is governed by the BPU. Energy Services uses futures, options, swaps and physical contracts to economically hedge purchases and sales of natural gas.
The following table reflects the changes in the fair market value of financial derivatives related to natural gas purchases and sales:
| | | Balance | Increase | Less | Balance | | Balance | Increase | Less | Balance |
| (Thousands) | (Thousands) | September 30, 2020 | (Decrease) in Fair
Market Value | Amounts
Settled | March 31,
2021 | (Thousands) | September 30, 2021 | (Decrease) in Fair
Market Value | Amounts
Settled | March 31, 2022 |
| Natural Gas Distribution | Natural Gas Distribution | | $ | (211) | | | (1,440) | | | (2,152) | | | $ | 501 | | Natural Gas Distribution | | $ | 2,033 | | | (3,421) | | | 388 | | | $ | (1,776) | |
| Energy Services | Energy Services | | 4,397 | | | 24,569 | | | 23,184 | | | 5,782 | | Energy Services | | (29,487) | | | (18,490) | | | (49,768) | | | 1,791 | |
| Total | Total | | $ | 4,186 | | | 23,129 | | | 21,032 | | | $ | 6,283 | | Total | | $ | (27,454) | | | (21,911) | | | (49,380) | | | $ | 15 | |
There were no changes in methods of valuations during the six months ended March 31, 2021.2022.
The following is a summary of fair market value of financial derivatives atas of March 31, 2021,2022, excluding foreign exchange contracts discussed below, by method of valuation and by maturity for each fiscal year period:
| | (Thousands) | (Thousands) | 2021 | 2022 | 2023 - 2025 | After 2025 | Total
Fair Value | (Thousands) | 2022 | 2023 | 2024 - 2026 | After 2026 | Total
Fair Value |
| Price based on NYMEX/CME | Price based on NYMEX/CME | $ | 139 | | 42 | | | 12 | | | $ | 193 | | Price based on NYMEX/CME | $ | (416) | | (122) | | | — | | | — | | | $ | (538) | |
| Price based on ICE | Price based on ICE | 4,658 | | 1,372 | | | 60 | | | 6,090 | | Price based on ICE | (1,224) | | (719) | | | 2,496 | | | — | | | 553 | |
| Total | Total | $ | 4,797 | | 1,414 | | | 72 | | | — | | | $ | 6,283 | | Total | $ | (1,640) | | (841) | | | 2,496 | | | — | | | $ | 15 | |
The following is a summary of financial derivatives by type as of March 31, 2021:2022:
| | | Volume Bcf | Price per MMBtu(1) | Amounts included in Derivatives (Thousands) | | Volume Bcf | Price per MMBtu(1) | Amounts included in Derivatives (Thousands) |
| Natural Gas Distribution | Natural Gas Distribution | Futures | 22.1 | | $0.00 - $3.03 | | $ | 501 | | Natural Gas Distribution | Futures | 29.6 | | $2.55-$11.54 | | $ | (1,776) | |
| | Energy Services | Energy Services | Futures | (11.6) | | $1.67 - $4.73 | | 5,589 | | Energy Services | Futures | (0.7) | | $2.41-$8.14 | | 2,329 | |
| | Swaps | (0.8) | | $2.72 - $3.08 | | 193 | | | Swaps | (0.2) | | $2.72-$3.03 | | (538) | |
| | Total | Total | | $ | 6,283 | | Total | | $ | 15 | |
(1) Million British thermal unit
The following table reflects the changes in the fair market value of physical commodity contracts:
| | | Balance | Increase | Less | Balance | | Balance | Increase | Less | Balance |
| (Thousands) | (Thousands) | September 30, 2020 | (Decrease) in Fair
Market Value | Amounts
Settled | March 31,
2021 | (Thousands) | September 30, 2021 | (Decrease) in Fair
Market Value | Amounts
Settled | March 31, 2022 |
| Natural Gas Distribution - Prices based on other external data | Natural Gas Distribution - Prices based on other external data | | $ | 2 | | | 782 | | | 608 | | | $ | 176 | | Natural Gas Distribution - Prices based on other external data | | $ | 20 | | | 4,381 | | | 4,316 | | | $ | 85 | |
| Energy Services - Prices based on other external data | Energy Services - Prices based on other external data | | (24,723) | | | (7,121) | | | (371) | | | (31,473) | | Energy Services - Prices based on other external data | | (34,678) | | | (12,085) | | | (7,521) | | | (39,242) | |
| Total | Total | | $ | (24,721) | | | (6,339) | | | 237 | | | $ | (31,297) | | Total | | $ | (34,658) | | | (7,704) | | | (3,205) | | | $ | (39,157) | |
New Jersey Resources Corporation
Part I
ITEM 3. QUANTITATIVE AND QUALITATIVE DISCLOSURES ABOUT MARKET RISK (Continued)
Our market price risk is predominately linked with changes in the price of natural gas at the Henry Hub, the delivery point for the NYMEX natural gas futures contracts. Based on price sensitivity analysis, an illustrative 10 percent movement in the natural gas futures contract price, for example, increases (decreases) the reported derivative fair value of all open, unadjusted Henry Hub natural gas futures and fixed price swap positions by approximately $2.4$2.5 million. This analysis does not include potential changes to reported credit adjustments embedded in the $0.4$(6.8) million reported fair value.
| | Derivative Fair Value Sensitivity Analysis | Derivative Fair Value Sensitivity Analysis | | Derivative Fair Value Sensitivity Analysis | |
| (Thousands) | (Thousands) | Henry Hub Futures and Fixed Price Swaps | (Thousands) | Henry Hub Futures and Fixed Price Swaps |
| Percent increase in NYMEX natural gas futures prices | Percent increase in NYMEX natural gas futures prices | 0% | 5% | 10% | 15% | 20% | Percent increase in NYMEX natural gas futures prices | 0% | 5% | 10% | 15% | 20% |
| Estimated change in derivative fair value | Estimated change in derivative fair value | $ | — | | $ | (1,179) | | $ | (2,357) | | $ | (3,536) | | $ | (4,715) | | Estimated change in derivative fair value | $ | — | | $ | (1,231) | | $ | (2,463) | | $ | (3,694) | | $ | (4,926) | |
| Ending derivative fair value | Ending derivative fair value | $ | 423 | | $ | (756) | | $ | (1,934) | | $ | (3,113) | | $ | (4,292) | | Ending derivative fair value | $ | (6,805) | | $ | (8,036) | | $ | (9,268) | | $ | (10,499) | | $ | (11,731) | |
| | Percent decrease in NYMEX natural gas futures prices | Percent decrease in NYMEX natural gas futures prices | 0% | (5)% | (10)% | (15)% | (20)% | Percent decrease in NYMEX natural gas futures prices | 0% | (5)% | (10)% | (15)% | (20)% |
| Estimated change in derivative fair value | Estimated change in derivative fair value | $ | — | | $ | 1,179 | | $ | 2,357 | | $ | 3,536 | | $ | 4,715 | | Estimated change in derivative fair value | $ | — | | $ | 1,231 | | $ | 2,463 | | $ | 3,694 | | $ | 4,926 | |
| Ending derivative fair value | Ending derivative fair value | $ | 423 | | $ | 1,602 | | $ | 2,780 | | $ | 3,959 | | $ | 5,138 | | Ending derivative fair value | $ | (6,805) | | $ | (5,574) | | $ | (4,342) | | $ | (3,111) | | $ | (1,879) | |
Wholesale Credit Risk
The following is a summary of gross and net credit exposures, grouped by investment and non-investment grade counterparties, as of March 31, 2021.2022. Gross credit exposure for Energy Services is defined as the unrealized fair value of derivative and energy trading contracts plus any outstanding wholesale receivable for the value of natural gas or power delivered and/or financial derivative commodity contract that has settled for which payment has not yet been received. Gross credit exposure for Storage and Transportation is defined as demand and estimated usage fees for contracted services and/or market value of loan balances for which payment has not yet been received. Net credit exposure is defined as gross credit exposure reduced by collateral received from counterparties and/or payables, where netting agreements exist. The amounts presented below exclude accounts receivable for NJNG retail natural gas sales and services.
Energy Services', Clean Energy Ventures' and Storage and Transportation's counterparty credit exposure as of March 31, 2021,2022, is as follows:
| | (Thousands) | (Thousands) | Gross Credit Exposure | Net Credit Exposure | (Thousands) | Gross Credit Exposure | Net Credit Exposure |
| Investment grade | Investment grade | | $ | 122,148 | | | $ | 107,865 | | Investment grade | | $ | 111,418 | | | $ | 88,099 | |
| Noninvestment grade | Noninvestment grade | | 9,445 | | | 1,114 | | Noninvestment grade | | 9,568 | | | 492 | |
| Internally rated investment grade | Internally rated investment grade | | 23,607 | | | 17,921 | | Internally rated investment grade | | 19,625 | | | 14,072 | |
| Internally rated noninvestment grade | Internally rated noninvestment grade | | 19,949 | | | 11,966 | | Internally rated noninvestment grade | | 21,250 | | | 9,980 | |
| Total | Total | | $ | 175,149 | | | $ | 138,866 | | Total | | $ | 161,861 | | | $ | 112,643 | |
NJNG's counterparty credit exposure as of March 31, 2021,2022, is as follows:
| | (Thousands) | (Thousands) | Gross Credit Exposure | Net Credit Exposure | (Thousands) | Gross Credit Exposure | Net Credit Exposure |
| Investment grade | Investment grade | | $ | 6,437 | | | $ | 6,182 | | Investment grade | | $ | 17,508 | | | $ | 15,343 | |
| Noninvestment grade | Noninvestment grade | | 26 | | | — | | Noninvestment grade | | 33 | | | — | |
| Internally rated investment grade | Internally rated investment grade | | 54 | | | 32 | | Internally rated investment grade | | 941 | | | 209 | |
| Internally rated noninvestment grade | Internally rated noninvestment grade | | 169 | | | 2 | | Internally rated noninvestment grade | | 975 | | | 66 | |
| Total | Total | | $ | 6,686 | | | $ | 6,216 | | Total | | $ | 19,457 | | | $ | 15,618 | |
Due to the inherent volatility in the market price for natural gas, electricity and SRECs, the market value of contractual positions with individual counterparties could exceed established credit limits or collateral provided by those counterparties. If a counterparty failed to perform the obligations under its contract (for example, failed to make payment for natural gas received), we could sustain a loss. This loss would comprise the loss on natural gas delivered but not paid for and/or the cost of replacing natural gas not delivered or received at a price that exceeds the original contract price. Any such loss could have a material impact on our financial condition, results of operations or cash flows.
New Jersey Resources Corporation
Part I
ITEM 3. QUANTITATIVE AND QUALITATIVE DISCLOSURES ABOUT MARKET RISK (Continued) ��
Effects of Interest Rate and Foreign Currency Rate Fluctuations
We are also exposed to changes in interest rates on our debt hedges, variable rate debt and changes in foreign currency rates for our business conducted in Canada using Canadian dollars. We do not believe an immediate 10 percent increase or decrease in interest rates or foreign currency rates would have a material effect on our operating results or cash flows.
Information regarding NJR's interest rate risk can be found in Item 7A. Quantitative and Qualitative Disclosures About Market Risks and the Liquidity and Capital Resources - Debt section of Item 7. Management's Discussion and Analysis of Financial Condition and Results of Operations of our Annual Report on Form 10-K for the period ended September 30, 20202021.
Effects of Inflation
Although inflation rates have been relatively low to moderate in recent years, including the three most recent fiscal years, any change in price levels has an effect on operating results due to the capital-intensive and regulated nature of our utility subsidiary. We attempt to minimize the effects of inflation through cost control, productivity improvements and regulatory actions, when appropriate.
ITEM 4. CONTROLS AND PROCEDURES
Disclosure Controls and Procedures
Under the supervision and with the participation of our management, including our principal executive officer and principal financial officer, we conducted an evaluation of the effectiveness of the design and operation of our disclosure controls and procedures (as defined in Rules 13a-15(e) and 15d-15(e) under the Exchange Act), as of the end of the period covered by this report. Based on this evaluation, our principal executive officer and principal financial officer concluded that, as of end of the period covered by this report, our disclosure controls and procedures are effective, to ensure that information required to be disclosed by us in the reports that we file or submit under the Exchange Act, is recorded, processed, summarized and reported, within the time periods specified in the SEC's rules and forms, and that such information is accumulated and communicated to our management, including our principal executive officer and principal financial officer, as appropriate, to allow timely decisions regarding required disclosure.
Changes in Internal Control over Financial Reporting
There has been no change in internal control over financial reporting (as such term is defined in Exchange Act Rule 13a-15(f)) that occurred during the quarter ended March 31, 2021,2022, that has materially affected, or is reasonably likely to materially affect, internal control over financial reporting.
New Jersey Resources Corporation
Part II
ITEM 1. LEGAL PROCEEDINGS
Information regarding reportable legal proceedings is contained in Part I, Item 3. Legal Proceedings in our Annual Report on Form 10-K for the year ended September 30, 2020,2021, and is set forth in Part I, Item 1, Note 13. Commitments and Contingent Liabilities-Legal Proceedings on the Unaudited Condensed Consolidated Financial Statements, which is incorporated by reference. No legal proceedings became reportable during the quarter ended March 31, 2021,2022, and there have been no material developments during such quarter regarding any previously reported legal proceedings, which have not been previously disclosed.
ITEM 1A. RISK FACTORS
While we attempt to identify, manage and mitigate risks and uncertainties associated with our business to the extent practical, under the circumstances, some level of risk and uncertainty will always be present. Part I, Item 1A. Risk Factors of our 20202021 Annual Report on Form 10-K includes a detailed discussion of our risk factors. Those risks and uncertainties have the potential to materially affect our financial condition and results of operations. There have been no material changes in our risk factors from those previously disclosed in Part I, Item 1A, of our 20202021 Annual Report on Form 10-K.10-K, except the following, which is an additional risk factor that should be read to supplement the previously disclosed risk factors:
Inflation and increased natural gas costs could adversely impact NJNG’s customer base and customer collections and increase its level of indebtedness.
Inflation has caused increases in certain operating and capital costs. NJR has a process in place to continually review the adequacy of NJNG’s rates in relation to the increasing cost of providing service and the inherent regulatory lag in adjusting those rates. The ability to control expenses is an important factor that will influence future results.
Rapid increases in the price of purchased gas may cause NJNG to experience a significant increase in short-term debt because it must pay suppliers for gas when it is purchased, which can be significantly in advance of when these costs may be recovered through the collection of monthly customer bills for gas delivered. Increases in purchased gas costs could also slow collection efforts as customers are more likely to delay the payment of their gas bills, leading to higher-than-normal accounts receivable. This situation could also result in higher short-term debt levels and increased bad debt expense.
ITEM 2. UNREGISTERED SALE OF EQUITY SECURITIES AND USE OF PROCEEDS
The following table sets forth our repurchase activity for the quarter ended March 31, 2021:2022:
| | | | | | | | | | | | | | | | | |
| Period | Total Number of Shares (or Units) Purchased | Average Price Paid per Share (or Unit) | Total Number of Shares (or Units) Purchased as Part of Publicly Announced Plans or Programs | Maximum Number (or Approximate Dollar Value) of Shares (or Units) That May Yet Be Purchased Under the Plans or Programs |
01/01/2122 - 01/31/21 | — | $ | — | | — | | | 2,431,053 |
02/01/21 - 02/28/2122 | — | — | | — | | | 2,431,0531,685,053 |
03/02/01/2122 - 03/31/2102/28/22 | — | — | | — | | | 2,431,0531,685,053 |
| 03/01/22 - 03/31/22 | — | — | | — | | | 1,685,053 |
| Total | — | $ | — | | — | | | 2,431,0531,685,053 |
The stock repurchase plan, which was authorized by our Board of Directors, became effective in September 1996 and as of March 31, 2021,2022, included 19.5 million shares of common stock for repurchase, of which, approximately 2.41.7 million shares remained available for repurchase. The stock repurchase plan will expire when we have repurchased all shares authorized for repurchase thereunder, unless the repurchase plan is earlier terminated by action of our Board of Directors or further shares are authorized for repurchase.
New Jersey Resources Corporation
Part II
ITEM 6. EXHIBITS
| | | | | |
Exhibit
Number | Exhibit Description |
| | | | | | |
| |
| | |
| | |
| | |
| | |
| | |
| | |
| | |
| | |
| | |
| | |
| | |
| | |
| | |
| | |
| | |
| | |
| | |
| | |
| |
| |
| |
| 10.1+ | |
| |
| 10.2 | $150,000,000 Term Loan Credit Agreement, dated as of February 8, 2022, by and among NJR, the guarantors thereto and PNC Bank, National Association, as Lender (incorporated by reference to Exhibit 10.1 to the Current Report on Form 8-K, as filed on February 11, 2021) |
| |
| 31.1+ | | |
| | |
| 31.2+ | | |
| | |
| 32.1+ † | | |
| | |
| 32.2+ † | | |
| | |
| 101+ | Interactive Data File (Form 10-Q, for the fiscal period ended March 31, 2021,2022, furnished in iXBRL (Inline eXtensible Business Reporting Language)) | |
| | |
| 104+ | Cover Page Interactive Data File included in Exhibit 101 | |
+ Filed herewith.
† This certificate accompanies this report pursuant to Section 906 of the Sarbanes-Oxley Act of 2002 and shall not be deemed filed by NJR for purposes of Section 18 or any other provision of the Securities Exchange Act of 1934, as amended.Act.
New Jersey Resources Corporation
Part II
SIGNATURES
Pursuant to the requirements of the Securities Exchange Act of 1934, the registrant has duly caused this report to be signed on its behalf by the undersigned, thereunto duly authorized.
| | | | | | | | |
| | NEW JERSEY RESOURCES CORPORATION |
| | (Registrant) |
| Date: | May 6, 20215, 2022 | |
| | By:/s/ Patrick MigliaccioRoberto F. Bel |
| | Patrick MigliaccioRoberto F. Bel |
| | Senior Vice President and |
| | Chief Financial Officer |