UNITED STATES
SECURITIES AND EXCHANGE COMMISSION
Washington, D.C. 20549
FORM 10-Q
|
| |
| ☒ | Quarterly Report Pursuant to Section 13 or 15(d) of the Securities Exchange Act of 1934 |
For Quarterly Period Endedthe quarterly period ended July 31, 2019April 30, 2020
|
| |
| ☐ | Transition Report Pursuant to Section 13 or 15(d) of the Securities Exchange Act of 1934 |
For the transition period from to
Commission File Number 1-8597
The Cooper Companies, Inc.
(Exact name of registrant as specified in its charter)
|
| |
| Delaware | 94-2657368 |
(State or other jurisdiction of incorporation or organization) | (I.R.S. Employer Identification No.) |
6140 Stoneridge Mall6101 Bollinger Canyon Road, Suite 590500,
San Ramon, Pleasanton, CACalifornia 9458894583
(Address of principal executive offices) (Zip Code)
Registrant’s telephone number, including area code (925) 460-3600
Securities registered pursuant to Section 12(b) of the Act:
|
| | | | |
| Title of each class | | Trading Symbol | | Name of each exchange on which registered |
| Common Stock, $.10 par value | | COO | | The New York Stock Exchange |
Indicate by check mark whether the registrant (1) has filed all reports required to be filed by Section 13 or 15(d) of the Securities Exchange Act of 1934 during the preceding 12 months (or for such shorter period that the registrant was required to file such reports), and (2) has been subject to such filing requirements for the past 90 days. Yes ☒ No ☐
Indicate by check mark whether the registrant has submitted electronically every Interactive Data File required to be submitted pursuant to Rule 405 of Regulation S-T (§232.405 of this chapter) during the preceding 12 months (or for such shorter period that the registrant was required to submit such files). Yes ☒ No ☐
Indicate by check mark whether the registrant is a large accelerated filer, an accelerated filer, a non-accelerated filer, a smaller reporting company, or emerging growth company. See definitions of “large accelerated filer,” “accelerated filer,” “smaller reporting company” and "emerging growth company" in Rule 12b-2 of the Exchange Act.
|
| | | | |
| Large accelerated filer | ☒ | | Accelerated filer | ☐ |
| Non-accelerated filer | ☐ | | Smaller reporting company | ☐ |
| Emerging growth company | ☐ | | | |
If an emerging growth company, indicate by check mark if the registrant has elected not to use the extended transition period for complying with any new or revised financial accounting standards provided pursuant to Section 13(a) of the Exchange Act. ☐
Indicate by check mark whether the registrant is a shell company (as defined in Rule 12b-2 of the Exchange Act.): Yes ☐ No ☒
Indicate the number of shares outstanding of each of issuer’s classes of common stock, as of the latest practicable date.
On August 23, 2019, 49,573,612May 29, 2020, 53,333,091 shares of Common Stock, $.10 par value, were outstanding.
INDEX
|
| | |
| | | Page No. |
| PART I. | | |
| | | |
| Item 1. | | |
| | | |
| | | |
| | | |
| | | |
| | | |
| | | |
| | |
| | |
| | | |
| | | |
| | | |
| | | |
| | | |
| Item 2. | | |
| | | |
| Item 3. | | |
| | | |
| Item 4. | | |
| | | |
| PART II. | | |
| | | |
| Item 1. | | |
| | | |
| Item 1A. | | |
| | | |
| Item 2. | | |
| | | |
| Item 3. | | |
| | | |
| Item 4. | | |
| | | |
| Item 5. | | |
| | | |
| Item 6. | | |
| | |
| |
PART I. FINANCIAL INFORMATION
Item 1. Unaudited Financial Statements
THE COOPER COMPANIES, INC. AND SUBSIDIARIES
Consolidated Statements of Income and Comprehensive Income (Loss)
Periods Ended July 31,
April 30,
(In millions, except for earnings per share)
(Unaudited)
| | | | Three Months | | Nine Months | Three Months | | Six Months |
| 2019 | | 2018 | | 2019 | | 2018 | 2020 | | 2019 | | 2020 | | 2019 |
| Net sales (Note 2) | $ | 679.4 |
| | $ | 660.0 |
| | $ | 1,961.8 |
| | $ | 1,881.3 |
| |
| Net sales | | $ | 524.9 |
| | $ | 654.3 |
| | $ | 1,171.1 |
| | $ | 1,282.4 |
|
| Cost of sales | 228.7 |
| | 233.2 |
| | 660.0 |
| | 679.1 |
| 201.4 |
| | 221.7 |
| | 421.1 |
| | 431.3 |
|
| Gross profit | 450.7 |
| | 426.8 |
| | 1,301.8 |
| | 1,202.2 |
| 323.5 |
| | 432.6 |
| | 750.0 |
| | 851.1 |
|
| Selling, general and administrative expense | 249.8 |
| | 251.0 |
| | 746.6 |
| | 724.7 |
| 237.2 |
| | 246.8 |
| | 495.5 |
| | 496.8 |
|
| Research and development expense | 21.5 |
| | 22.5 |
| | 63.4 |
| | 62.2 |
| 23.8 |
| | 21.0 |
| | 46.0 |
| | 42.0 |
|
| Amortization of intangibles | 37.2 |
| | 37.7 |
| | 110.7 |
| | 110.5 |
| 33.9 |
| | 36.9 |
| | 68.8 |
| | 73.5 |
|
| Impairment of intangibles | — |
| | — |
| | — |
| | 24.4 |
| |
| Gain on sale of an intangible (Note 5) | — |
| | — |
| | (19.0 | ) | | — |
| |
| Gain on sale of an intangible | | — |
| | (19.0 | ) | | — |
| | (19.0 | ) |
| Operating income | 142.2 |
| | 115.6 |
| | 400.1 |
| | 280.4 |
| 28.6 |
| | 146.9 |
| | 139.7 |
| | 257.8 |
|
| Interest expense | 16.7 |
|
| 22.8 |
|
| 53.3 |
|
| 59.9 |
| 12.8 |
|
| 18.5 |
|
| 24.4 |
|
| 36.6 |
|
| Other (income) expense, net | (1.5 | ) |
| 2.4 |
|
| (2.1 | ) |
| 1.3 |
| |
| Other expense (Income), net | | 6.8 |
|
| 0.3 |
|
| 8.9 |
|
| (0.7 | ) |
| Income before income taxes | 127.0 |
| | 90.4 |
| | 348.9 |
| | 219.2 |
| 9.0 |
| | 128.1 |
| | 106.4 |
| | 221.9 |
|
| Provision (benefit) for income taxes (Note 7) | 6.9 |
| | (10.4 | ) | | 3.2 |
| | 180.0 |
| |
| (Benefit) Provision for income taxes (Note 7) | | (2.5 | ) | | 5.7 |
| | 4.4 |
| | (3.6 | ) |
| Net income | $ | 120.1 |
| | $ | 100.8 |
| | $ | 345.7 |
| | $ | 39.2 |
| $ | 11.5 |
| | $ | 122.4 |
| | $ | 102.0 |
| | $ | 225.5 |
|
| Earnings per share - basic (Note 8) | $ | 2.43 |
| | $ | 2.05 |
| | $ | 7.00 |
| | $ | 0.80 |
| |
| Earnings per share - diluted (Note 8) | $ | 2.40 |
| | $ | 2.03 |
| | $ | 6.91 |
| | $ | 0.79 |
| |
| Earnings per share (Note 8): | | | | | | | | |
| Basic | | $ | 0.23 |
| | $ | 2.48 |
| | $ | 2.07 |
| | $ | 4.57 |
|
| Diluted | | $ | 0.23 |
| | $ | 2.45 |
| | $ | 2.05 |
| | $ | 4.52 |
|
| Number of shares used to compute earnings per share: |
| |
| |
| |
|
| |
| |
| |
|
| Basic | 49.5 |
| | 49.1 |
| | 49.4 |
| | 49.0 |
| 49.2 |
| | 49.4 |
| | 49.2 |
| | 49.3 |
|
| Diluted | 50.1 |
| | 49.7 |
| | 50.0 |
| | 49.6 |
| 49.6 |
| | 50.0 |
| | 49.7 |
| | 49.9 |
|
| Other comprehensive income, net of tax: | | | | | | | | |
| Cash flow hedge | | $ | (13.5 | ) | | — |
| | $ | (13.5 | ) | | — |
|
| Foreign currency translation adjustment | | (68.9 | ) | | (18.6 | ) | | (52.2 | ) | | 14.1 |
|
| Comprehensive (loss) income | | $ | (70.9 | ) | | $ | 103.8 |
| | $ | 36.3 |
| | $ | 239.6 |
|
See
The accompanying notes.notes are an integral part of these Consolidated Condensed Financial Statements.
THE COOPER COMPANIES, INC. AND SUBSIDIARIES
Consolidated Statements of Comprehensive Income
Periods Ended July 31,
(In millions)
(Unaudited)
|
| | | | | | | | | | | | | | | |
| | Three Months | | Nine Months |
| | 2019 | | 2018 | | 2019 | | 2018 |
| Net income | $ | 120.1 |
| | $ | 100.8 |
| | $ | 345.7 |
| | $ | 39.2 |
|
| Other comprehensive loss: | | | | | | | |
| Foreign currency translation adjustment, net of tax | (65.2 | ) | | (69.6 | ) | | (51.1 | ) | | (10.3 | ) |
| Comprehensive income | $ | 54.9 |
| | $ | 31.2 |
| | $ | 294.6 |
| | $ | 28.9 |
|
See accompanying notes.
THE COOPER COMPANIES, INC. AND SUBSIDIARIES
Consolidated Condensed Balance Sheets
(In millions)
(Unaudited)millions, unaudited)
| | | | July 31, 2019 | | October 31, 2018 | April 30, 2020 | | October 31, 2019 |
| ASSETS | | | | | | |
| Current assets: | | | | | | |
| Cash and cash equivalents | $ | 112.7 |
| | $ | 77.7 |
| $ | 79.8 |
| | $ | 89.0 |
|
| Trade accounts receivable, net of allowance for doubtful accounts of $17.1 at July 31, 2019 and $19.0 at October 31, 2018 | 404.7 |
| | 374.7 |
| |
| Trade accounts receivable, net of allowance for doubtful accounts of $13.4 at April 30, 2020 and $16.4 at October 31, 2019 | | 368.8 |
| | 435.3 |
|
| Inventories (Note 4) | 502.1 |
| | 468.8 |
| 568.2 |
| | 506.9 |
|
| Prepaid expense and other current assets | 131.3 |
| | 169.7 |
| 149.4 |
| | 132.2 |
|
| Total current assets | 1,150.8 |
| | 1,090.9 |
| 1,166.2 |
| | 1,163.4 |
|
| Property, plant and equipment, at cost | 2,086.9 |
| | 1,930.3 |
| 2,309.5 |
| | 2,193.9 |
|
| Less: accumulated depreciation and amortization | 1,021.5 |
| | 954.3 |
| 1,113.4 |
| | 1,061.8 |
|
| | 1,065.4 |
| | 976.0 |
| 1,196.1 |
| | 1,132.1 |
|
| Operating lease right-of-use assets (Note 2) | | 255.5 |
| | — |
|
| Goodwill (Note 5) | 2,391.4 |
| | 2,392.1 |
| 2,400.0 |
| | 2,428.9 |
|
| Other intangibles, net (Note 5) | 1,438.6 |
| | 1,521.3 |
| 1,337.7 |
| | 1,405.3 |
|
| Deferred tax assets | 63.1 |
| | 58.4 |
| 77.0 |
| | 78.0 |
|
| Other assets | 63.5 |
| | 74.1 |
| 77.5 |
| | 66.8 |
|
| | $ | 6,172.8 |
| | $ | 6,112.8 |
| |
| Total assets | | $ | 6,510.0 |
| | $ | 6,274.5 |
|
| LIABILITIES AND STOCKHOLDERS’ EQUITY | | | | | | |
| Current liabilities: | | | | | | |
| Short-term debt (Note 6) | $ | 390.0 |
| | $ | 37.1 |
| $ | 554.5 |
| | $ | 563.7 |
|
| Accounts payable | 141.5 |
| | 146.4 |
| 128.7 |
| | 150.1 |
|
| Employee compensation and benefits | 89.5 |
| | 94.0 |
| 86.3 |
| | 104.7 |
|
| Operating lease liabilities | | 31.5 |
| | — |
|
| Other current liabilities | 268.4 |
| | 259.0 |
| 224.3 |
| | 292.1 |
|
| Total current liabilities | 889.4 |
| | 536.5 |
| 1,025.3 |
| | 1,110.6 |
|
| Long-term debt (Note 6) | 1,422.6 |
| | 1,985.7 |
| 1,344.8 |
| | 1,262.6 |
|
| Deferred tax liabilities | 31.5 |
| | 31.0 |
| 26.8 |
| | 28.0 |
|
| Long-term tax payable | 124.8 |
| | 141.5 |
| 158.9 |
| | 124.8 |
|
| Operating lease liabilities | | 232.7 |
| | — |
|
| Accrued pension liability and other | 89.0 |
| | 110.3 |
| 94.0 |
| | 119.9 |
|
| Total liabilities | 2,557.3 |
| | 2,805.0 |
| $ | 2,882.5 |
| | $ | 2,645.9 |
|
| Contingencies (see Note 13) |
| |
| |
| Contingencies (Note 13) | |
| |
|
| Stockholders’ equity: |
| | | | | |
| Preferred stock, 10 cents par value, shares authorized: 1.0; zero shares issued or outstanding | — |
| | — |
| — |
| | — |
|
| Common stock, 10 cents par value, shares authorized: 120.0; issued 53.2 at July 31, 2019 and 52.8 at October 31, 2018 | 5.3 |
| | 5.3 |
| |
| Common stock, 10 cents par value, shares authorized: 120.0; issued 53.3 at April 30, 2020 and 53.2 at October 31, 2019 | | 5.3 |
| | 5.3 |
|
| Additional paid-in capital | 1,607.6 |
| | 1,572.1 |
| 1,626.5 |
| | 1,615.0 |
|
| Accumulated other comprehensive loss | (481.8 | ) | | (430.7 | ) | (512.8 | ) | | (447.1 | ) |
| Retained earnings | 2,905.4 |
| | 2,576.0 |
| 3,126.9 |
| | 3,026.4 |
|
| Treasury stock at cost: 3.6 shares at July 31, 2019 and 3.6 shares at October 31, 2018 | (421.2 | ) | | (415.1 | ) | |
| Treasury stock at cost: 4.2 shares at April 30, 2020 and 4.1 shares at October 31, 2019 | | (618.6 | ) | | (571.2 | ) |
| Total Cooper stockholders’ equity | | 3,627.3 |
| | 3,628.4 |
|
| Noncontrolling interests | 0.2 |
| | 0.2 |
| 0.2 |
| | 0.2 |
|
| Stockholders’ equity (Note 10) | 3,615.5 |
| | 3,307.8 |
| 3,627.5 |
| | 3,628.6 |
|
| | $ | 6,172.8 |
| | $ | 6,112.8 |
| |
| Total liabilities and stockholders’ equity | | $ | 6,510.0 |
| | $ | 6,274.5 |
|
See
The accompanying notes.notes are an integral part of these Consolidated Condensed Financial Statements.
THE COOPER COMPANIES, INC. AND SUBSIDIARIES
Consolidated Condensed Statements of Stockholders' Equity
| | | Consolidated Condensed Statements of Stockholders' Equity | |
| | Common Shares | | Treasury Stock | | Additional Paid-In Capital | | Accumulated
Other
Comprehensive
Income (Loss) | | Retained Earnings | | Treasury Stock | | Noncontrolling Interests | | Total
Stockholders'
Equity | Common Shares | | Treasury Stock | | Additional Paid-In Capital | | Accumulated
Other
Comprehensive
Income (Loss) | | Retained Earnings | | Treasury Stock | | Noncontrolling Interests | | Total
Stockholders'
Equity |
| (In millions) | Shares | | Amount | | Shares | | Amount | | | | | Shares | | Amount | | Shares | | Amount | | | | |
| Balance at November 1, 2017 | 48.8 |
| | $ | 4.9 |
| | 3.6 |
| | $ | 0.3 |
| | $ | 1,526.7 |
| | $ | (375.3 | ) | | $ | 2,434.2 |
| | $ | (415.1 | ) | | $ | 0.1 |
| | $ | 3,175.8 |
| |
| Net loss | — |
| | — |
| | — |
| | — |
| | — |
| | — |
| | (122.5 | ) | | — |
| | — |
| | (122.5 | ) | |
| Balance at November 1, 2018 | | 49.2 |
| | $ | 5.0 |
| | 3.6 |
| | $ | 0.3 |
| | $ | 1,572.1 |
| | $ | (430.7 | ) | | $ | 2,576.0 |
| | $ | (415.1 | ) | | $ | 0.2 |
| | $ | 3,307.8 |
|
| Net income | | — |
| | — |
| | — |
| | — |
| | — |
| | — |
| | 103.2 |
| | — |
| | — |
| | 103.2 |
|
| Other comprehensive income, net of tax | — |
| | — |
| | — |
| | — |
| | — |
| | 102.3 |
| | — |
| | — |
| | — |
| | 102.3 |
| — |
| | — |
| | — |
| | — |
| | — |
| | 32.7 |
| | — |
| | — |
| | — |
| | 32.7 |
|
| Issuance of common stock for stock plans, net | 0.2 |
| | 0.1 |
| | — |
| | — |
| | (10.6 | ) | | — |
| | — |
| | — |
| | — |
| | (10.5 | ) | 0.1 |
| | — |
| | — |
| | — |
| | (9.0 | ) | | — |
| | — |
| | — |
| | — |
| | (9.0 | ) |
| Dividends on common stock | — |
| | — |
| | — |
| | — |
| | — |
| | — |
| | (1.4 | ) | | — |
| | — |
| | (1.4 | ) | |
| Treasury stock repurchase | | — |
| | — |
| | — |
| | — |
| | — |
| | — |
| | — |
| | (6.1 | ) | | — |
| | (6.1 | ) |
| Dividends on common stock ($0.03 per share) | | — |
| | — |
| | — |
| | — |
| | — |
| | — |
| | (1.5 | ) | | — |
| | — |
| | (1.5 | ) |
| Share-based compensation expense | — |
| | — |
| | — |
| | — |
| | 12.7 |
| | — |
| | — |
| | — |
| | — |
| | 12.7 |
| — |
| | — |
| | — |
| | — |
| | 11.7 |
| | — |
| | — |
| | — |
| | — |
| | 11.7 |
|
| Balance at January 31, 2018 | 49.0 |
| | $ | 5.0 |
| | 3.6 |
| | $ | 0.3 |
| | $ | 1,528.8 |
| | $ | (273.0 | ) | | $ | 2,310.3 |
| | $ | (415.1 | ) | | $ | 0.1 |
| | $ | 3,156.4 |
| |
| ASU 2016-16 adoption | | — |
| | — |
| | — |
| | — |
| | — |
| | — |
| | (13.3 | ) | | — |
| | — |
| | (13.3 | ) |
| Balance at January 31, 2019 | | 49.3 |
| | $ | 5.0 |
| | 3.6 |
| | $ | 0.3 |
| | $ | 1,574.8 |
| | $ | (398.0 | ) | | $ | 2,664.4 |
| | $ | (421.2 | ) | | $ | 0.2 |
| | $ | 3,425.5 |
|
| Net income | — |
| | — |
| | — |
| | — |
| | — |
| | — |
| | 60.9 |
| | — |
| | — |
| | 60.9 |
| — |
| | — |
| | — |
| | — |
| | — |
| | — |
| | 122.4 |
| | — |
| | — |
| | 122.4 |
|
| Other comprehensive loss, net of tax | — |
| | — |
| | — |
| | — |
| | — |
| | (43.0 | ) | | — |
| | — |
| | — |
| | (43.0 | ) | — |
| | — |
| | — |
| | — |
| | — |
| | (18.6 | ) | | — |
| | — |
| | — |
| | (18.6 | ) |
| Issuance of common stock for stock plans, net | 0.1 |
| | — |
| | — |
| | — |
| | 0.1 |
| | — |
| | — |
| | — |
| | — |
| | 0.1 |
| 0.2 |
| | — |
| | — |
| | — |
| | 4.5 |
| | — |
| | — |
| | — |
| | — |
| | 4.5 |
|
| Share-based compensation expense | — |
| | — |
| | — |
| | — |
| | 13.6 |
| | — |
| | — |
| | — |
| | — |
| | 13.6 |
| — |
| | — |
| | — |
| | — |
| | 8.4 |
| | — |
| | — |
| | — |
| | — |
| | 8.4 |
|
| Balance at April 30, 2018 | 49.1 |
| | $ | 5.0 |
| | 3.6 |
| | $ | 0.3 |
| | $ | 1,542.5 |
| | $ | (316.0 | ) | | $ | 2,371.2 |
| | $ | (415.1 | ) | | $ | 0.1 |
| | $ | 3,188.0 |
| |
| Balance at April 30, 2019 | | 49.5 |
| | $ | 5.0 |
| | 3.6 |
| | $ | 0.3 |
| | $ | 1,587.7 |
| | $ | (416.6 | ) | | $ | 2,786.8 |
| | $ | (421.2 | ) | | $ | 0.2 |
| | $ | 3,542.2 |
|
| | | | | | | | | | | | | | | | | | | | | |
| Balance at November 1, 2019 | | 49.1 |
| | $ | 4.9 |
| | 4.1 |
| | $ | 0.4 |
| | $ | 1,615.0 |
| | $ | (447.1 | ) | | $ | 3,026.4 |
| | $ | (571.2 | ) | | $ | 0.2 |
| | $ | 3,628.6 |
|
| Net income | — |
| | — |
| | — |
| | — |
| | — |
| | — |
| | 100.8 |
| | — |
| | — |
| | 100.8 |
| — |
| | — |
| | — |
| | — |
| | — |
| | — |
| | 90.5 |
| | — |
| | — |
| | 90.5 |
|
| Other comprehensive loss, net of tax | — |
| | — |
| | — |
| | — |
| | — |
| | (69.6 | ) | | — |
| | — |
| | — |
| | (69.6 | ) | |
| Other comprehensive income, net of tax | | — |
| | — |
| | — |
| | — |
| | — |
| | 16.7 |
| | — |
| | — |
| | — |
| | 16.7 |
|
| Issuance of common stock for stock plans, net | — |
| | — |
| | — |
| | — |
| | 0.8 |
| | — |
| | — |
| | — |
| | — |
| | 0.8 |
| 0.1 |
| | — |
| | — |
| | — |
| | (13.2 | ) | | — |
| | — |
| | — |
| | — |
| | (13.1 | ) |
Dividends on common stock
| — |
| | — |
| | — |
| | — |
| | — |
| | — |
| | (1.5 | ) | | — |
| | — |
| | (1.5 | ) | |
| Dividends on common stock ($0.03 per share) | | — |
| | — |
| | — |
| | — |
| | — |
| | — |
| | (1.5 | ) | | — |
| | — |
| | (1.5 | ) |
| Share-based compensation expense | — |
| | — |
| | — |
| | — |
| | 8.1 |
| | — |
| | — |
| | — |
| | — |
| | 8.1 |
| — |
| | — |
| | — |
| | — |
| | 9.7 |
| | — |
| | — |
| | — |
| | — |
| | 9.7 |
|
| Balance at July 31, 2018 | 49.1 |
| | $ | 5.0 |
| | 3.6 |
| | $ | 0.3 |
| | $ | 1,551.4 |
| | $ | (385.6 | ) | | $ | 2,470.5 |
| | $ | (415.1 | ) | | $ | 0.1 |
| | $ | 3,226.6 |
| |
| Balance at January 31, 2020 | | 49.2 |
| | $ | 4.9 |
| | 4.1 |
| | $ | 0.4 |
| | $ | 1,611.6 |
| | $ | (430.4 | ) | | $ | 3,115.4 |
| | $ | (571.2 | ) | | $ | 0.2 |
| | $ | 3,730.9 |
|
| Net income | | — |
| | — |
| | — |
| | — |
| | — |
| | — |
| | 11.5 |
| | — |
| | — |
| | 11.5 |
|
| Other comprehensive income, net of tax | | — |
| | — |
| | — |
| | — |
| | — |
| | (82.4 | ) | | — |
| | — |
| | — |
| | (82.4 | ) |
| Issuance of common stock for stock plans, net | | 0.1 |
| | — |
| | — |
| | — |
| | 5.0 |
| | — |
| | — |
| | — |
| | — |
| | 5.0 |
|
| Treasury stock repurchase | | (0.2 | ) | | — |
| | 0.2 |
| | — |
| | — |
| | — |
| | — |
| | (47.8 | ) | | — |
| | (47.8 | ) |
| Issuance of common stock for employee stock purchase plan | | — |
| | — |
| | — |
| | — |
| | 0.6 |
| | — |
| | — |
| | 0.4 |
| | — |
| | 1.0 |
|
| Share-based compensation expense | | — |
| | — |
| | — |
| | — |
| | 9.3 |
| | — |
| | — |
| | — |
| | — |
| | 9.3 |
|
| Balance at April 30, 2020 | | 49.1 |
| | $ | 4.9 |
| | 4.3 |
| | $ | 0.4 |
| | $ | 1,626.5 |
| | $ | (512.8 | ) | | $ | 3,126.9 |
| | $ | (618.6 | ) | | $ | 0.2 |
| | $ | 3,627.5 |
|
THE COOPER COMPANIES, INC. AND SUBSIDIARIES
The accompanying notes are an integral part of these Consolidated Condensed Financial Statements.
|
| | | | | | | | | | | | | | | | | | | | | | | | | | | | | | | | | | | | | |
| Consolidated Condensed Statements of Stockholders' Equity |
| | Common Shares | | Treasury Stock | | Additional Paid-In Capital | | Accumulated
Other
Comprehensive
Income (Loss) | | Retained Earnings | | Treasury Stock | | Noncontrolling Interests | | Total
Stockholders'
Equity |
| (In millions) | Shares | | Amount | | Shares | | Amount | | | | | | |
| Balance at November 1, 2018 | 49.2 |
| | $ | 5.0 |
| | 3.6 |
| | $ | 0.3 |
| | $ | 1,572.1 |
| | $ | (430.7 | ) | | $ | 2,576.0 |
| | $ | (415.1 | ) | | $ | 0.2 |
| | $ | 3,307.8 |
|
| Net income | — |
| | — |
| | — |
| | — |
| | — |
| | — |
| | 103.2 |
| | — |
| | — |
| | 103.2 |
|
| Other comprehensive income, net of tax | — |
| | — |
| | — |
| | — |
| | — |
| | 32.7 |
| | — |
| | — |
| | — |
| | 32.7 |
|
| Issuance of common stock for stock plans, net | 0.1 |
| | — |
| | — |
| | — |
| | (9.0 | ) | | — |
| | — |
| | — |
| | — |
| | (9.0 | ) |
| Treasury stock repurchase | — |
| | — |
| | — |
| | — |
| | — |
| | — |
| | — |
| | (6.1 | ) | | — |
| | (6.1 | ) |
| Dividends on common stock | — |
| | — |
| | — |
| | — |
| | — |
| | — |
| | (1.5 | ) | | — |
| | — |
| | (1.5 | ) |
| Share-based compensation expense | — |
| | — |
| | — |
| | — |
| | 11.7 |
| | — |
| | — |
| | — |
| | — |
| | 11.7 |
|
| ASU 2016-16 adoption (1) | — |
| | — |
| | — |
| | — |
| | — |
| | — |
| | (13.3 | ) | | — |
| | — |
| | (13.3 | ) |
| Balance at January 31, 2019 | 49.3 |
| | $ | 5.0 |
| | 3.6 |
| | $ | 0.3 |
| | $ | 1,574.8 |
| | $ | (398.0 | ) | | $ | 2,664.4 |
| | $ | (421.2 | ) | | $ | 0.2 |
| | $ | 3,425.5 |
|
| Net income | — |
| | — |
| | — |
| | — |
| | — |
| | — |
| | 122.4 |
| | — |
| | — |
| | 122.4 |
|
| Other comprehensive loss, net of tax | — |
| | — |
| | — |
| | — |
| | — |
| | (18.6 | ) | | — |
| | — |
| | — |
| | (18.6 | ) |
| Issuance of common stock for stock plans, net | 0.2 |
| | — |
| | — |
| | — |
| | 4.5 |
| | — |
| | — |
| | — |
| | — |
| | 4.5 |
|
| Share-based compensation expense | — |
| | — |
| | — |
| | — |
| | 8.4 |
| | — |
| | — |
| | — |
| | — |
| | 8.4 |
|
| Balance at April 30, 2019 | 49.5 |
| | $ | 5.0 |
| | 3.6 |
| | $ | 0.3 |
| | $ | 1,587.7 |
| | $ | (416.6 | ) | | $ | 2,786.8 |
| | $ | (421.2 | ) | | $ | 0.2 |
| | $ | 3,542.2 |
|
| Net income | — |
| | — |
| | — |
| | — |
| | — |
| | — |
| | 120.1 |
| | — |
| | — |
| | 120.1 |
|
| Other comprehensive loss, net of tax | — |
| | — |
| | — |
| | — |
| | — |
| | (65.2 | ) | | — |
| | — |
| | — |
| | (65.2 | ) |
| Issuance of common stock for stock plans, net | 0.1 |
| | — |
| | — |
| | — |
| | 12.2 |
| | — |
| | — |
| | — |
| | — |
| | 12.2 |
|
| Dividends on common stock | — |
| | — |
| | — |
| | — |
| | — |
| | — |
| | (1.5 | ) | | — |
| | — |
| | (1.5 | ) |
| Share-based compensation expense | — |
| | — |
| | — |
| | — |
| | 7.7 |
| | — |
| | — |
| | — |
| | — |
| | 7.7 |
|
| Balance at July 31, 2019 | 49.6 |
| | $ | 5.0 |
| | 3.6 |
| | $ | 0.3 |
| | $ | 1,607.6 |
| | $ | (481.8 | ) | | $ | 2,905.4 |
| | $ | (421.2 | ) | | $ | 0.2 |
| | $ | 3,615.5 |
|
See accompanying notes to consolidated financial statements.
(1) We adopted ASU 2016-16, Income Taxes (Topic 740): Intra-Entity Transfers of Assets Other Than Inventory in the first quarter of fiscal 2019. Refer to “Note 1. General" for further information.
THE COOPER COMPANIES, INC. AND SUBSIDIARIES
Consolidated Condensed Statements of Cash Flows
NineSix Months Ended July 31,April 30,
(In millions)
(Unaudited)millions, unaudited)
| | | | 2019 | | 2018 | 2020 | | 2019 |
| Cash flows from operating activities: | | | | | | |
| Net income | $ | 345.7 |
| | $ | 39.2 |
| $ | 102.0 |
| | $ | 225.5 |
|
| Depreciation and amortization | 210.2 |
| | 204.6 |
| 139.4 |
| | 139.5 |
|
| Gain on sale of an intangible (Note 5) | (19.0 | ) | | — |
| |
| Impairment of intangibles | — |
| | 24.4 |
| |
| Increase in operating capital | (22.1 | ) | | (141.1 | ) | |
| Gain on sale of an intangible | | — |
| | (19.0 | ) |
| Decrease in operating capital | | (119.8 | ) | | (19.7 | ) |
| Other non-cash items | (1.5 | ) | | 305.2 |
| 33.9 |
| | (9.7 | ) |
| Net cash provided by operating activities | 513.3 |
| | 432.3 |
| 155.5 |
| | 316.6 |
|
| Cash flows from investing activities: | | | | | | |
| Purchases of property, plant and equipment | (207.3 | ) | | (150.2 | ) | (158.3 | ) | | (131.9 | ) |
| Acquisitions of businesses and assets, net of cash acquired, and other | (59.1 | ) | | (1,320.8 | ) | (11.2 | ) | | (50.8 | ) |
| Net cash used in investing activities | (266.4 | ) | | (1,471.0 | ) | (169.5 | ) | | (182.7 | ) |
| Cash flows from financing activities: | | | | | | |
| Proceeds from long-term debt | 576.8 |
| | 2,073.1 |
| 1,862.0 |
| | 424.8 |
|
| Repayments of long-term debt | (1,140.8 | ) | | (971.1 | ) | (1,781.3 | ) | | (938.8 | ) |
| Net proceeds from short-term debt | 351.8 |
| | 21.0 |
| |
| Net proceeds (payments) related to share-based compensation awards | 7.7 |
| | (9.8 | ) | |
| Net (repayments) proceeds from short-term debt | | (10.0 | ) | | 417.4 |
|
| Net payments related to share-based compensation awards | | (8.4 | ) | | (4.3 | ) |
| Dividends on common stock | (1.5 | ) | | (1.5 | ) | (1.5 | ) | | (1.5 | ) |
| Repurchase of common stock | (6.1 | ) | | — |
| (47.8 | ) | | (6.1 | ) |
| Debt acquisition costs | (0.2 | ) | | (3.9 | ) | |
| Payment of contingent consideration | — |
| | (0.1 | ) | |
| Net cash (used in) provided by financing activities | (212.3 | ) | | 1,107.7 |
| |
| Issuance of common stock for employee stock purchase plan | | 0.9 |
| | — |
|
| Debt issuance costs | | (5.5 | ) | | (0.2 | ) |
| Net cash provided by (used in) financing activities | | 8.4 |
| | (108.7 | ) |
| Effect of exchange rate changes on cash, cash equivalents and restricted cash | (1.6 | ) | | (2.2 | ) | (3.1 | ) | | (0.5 | ) |
| Net increase in cash, cash equivalents and restricted cash | 33.0 |
| | 66.8 |
| |
| Net (decrease) increase in cash, cash equivalents and restricted cash | | (8.7 | ) | | 24.7 |
|
| Cash, cash equivalents and restricted cash at beginning of period | 80.2 |
| | 88.8 |
| 89.5 |
| | 80.2 |
|
| Cash, cash equivalents and restricted cash at end of period | $ | 113.2 |
| | $ | 155.6 |
| $ | 80.8 |
| | $ | 104.9 |
|
| Reconciliation of cash flow information: | | | | | | |
| Cash and cash equivalents | $ | 112.7 |
| | $ | 155.6 |
| $ | 79.8 |
| | $ | 104.6 |
|
| Restricted cash included in other current assets | 0.5 |
| | — |
| 1.0 |
| | 0.3 |
|
| Total cash, cash equivalents, and restricted cash | $ | 113.2 |
| | $ | 155.6 |
| |
| Total cash, cash equivalents and restricted cash | | $ | 80.8 |
| | $ | 104.9 |
|
The accompanying notes are an integral part of these Consolidated Condensed Financial Statements.
6
See accompanying notes.
THE COOPER COMPANIES, INC. AND SUBSIDIARIES
Notes to Consolidated Condensed Financial Statements
(Unaudited)
Note 1. General
The accompanying unauditedConsolidated Condensed Financial Statements of the Cooper Companies, Inc. and its subsidiaries (the Company) have been prepared in accordance with U.S. GAAP for interim consolidated condensedfinancial information and with the requirements of Regulation S-X, Rule 10-01 for financial statements required to be filed as a part of this Quarterly Report on Form 10-Q. Unless the context requires otherwise, terms "the Company", "we", "us", and "our" are used to refer collectively to the Cooper Companies, Inc. and its subsidiaries.
The accompanying Consolidated Condensed Financial Statements and related notes should be read in conjunction with the audited Consolidated Financial Statements of the Cooper Companies, Inc. and its subsidiaries (the Company) and related notes as contained in the Company’s Annual Report on Form 10-K for the fiscal year ended October 31, 2018.2019. The unaudited interim financial statementsConsolidated Condensed Financial Statements include all adjustments (consisting only of normal recurring adjustments) and accruals necessary in the judgment of management for a fair statement of the results for the periods presented. Readers should not assume that the results reported here either indicate or guarantee future performance. The terms "the Company", "we", "us", and "our" are used to refer collectively to the Cooper Companies, Inc. and its subsidiaries.
Accounting Pronouncements Recently AdoptedPolicies
In JulyThere have been no material changes to our significant accounting policies described in our Annual Report on Form 10-K for the fiscal year ended October 31, 2019, except as it relates to the FASB issued ASU 2019-07, Codification Updates to SEC Sections. The ASU clarifies or improves the disclosure and presentation requirementsadoption of a variety of codification topics by aligning them with the SEC’s regulations, thereby eliminating redundancies and making the codification easier to apply. The Company adopted this guidance during third quarter of fiscal 2019, and it did not have a material impact on the Company’s reported consolidated financial results.
In March 2017, the Financial Accounting Standards Board (FASB) issued Accounting Standards Update (ASU) 2017-07,2016-02, Compensation - Retirement BenefitsLeases (Topic 715): Improving the Presentation of Net Periodic Pension Cost and Net Periodic Postretirement Benefit Cost. The ASU requires an entity to disaggregate the service cost component from the other components of net benefit cost. The service cost component is now presented in the same income statement line as other compensation costs arising from services rendered by the pertinent employees during the period and the other components of net benefit costs are presented separately as other income/expense below operating income. The Company adopted this guidance on November 1, 2018, and it did not have a material impact on the Company’s reported consolidated financial results.
In October 2016, the FASB issued ASU 2016-16, Income Taxes (Topic 740): Intra-Entity Transfers of Assets Other Than Inventory842), which requires entitiesis described below.
Leases
We consider an arrangement a lease if the arrangement transfers the right to recognizecontrol the income tax consequences on an intra-entity transferuse of an identified asset other than inventory whenin exchange for consideration. We have operating leases, but do not have material financing leases. Lease right-of-use assets represent the transfer occurs. The ASU changesright to use an underlying asset for the timinglease term, and lease liabilities represent the obligation to make payments arising from the lease agreement. These assets and liabilities are recognized at the commencement of the recognitionlease based upon the present value of the income tax consequencesfuture minimum lease payments over the lease term.
The lease term reflects the noncancelable period of non-inventory transfers which under previous guidance deferred the income tax consequences untillease together with periods covered by an option to extend or terminate the asset was sold to an outside party or otherwise recognized. The guidance for the amendments of ASU 2016-16 requires companies to apply a modified retrospective approach with a cumulative catch-up adjustment to opening retained earningslease when management is reasonably certain that it will exercise such option. Changes in the periodlease term assumption could impact the right-of-use assets and lease liabilities recognized on the balance sheet. As our leases typically do not contain a readily determinable implicit rate, we determine the present value of adoption. The Company adopted ASU 2016-16 in the first quarter of fiscal 2019lease liability using our incremental borrowing rate at the lease commencement date based on the lease term on a modified retrospectivecollateralized basis.
Estimates
The Company recordedWorld Health Organization has categorized the cumulative effectCoronavirus disease 2019 ("COVID-19") as a pandemic. The COVID-19 pandemic has caused a severe global health crisis, along with economic and societal disruptions and uncertainties, which have negatively impacted business and healthcare activity globally. As a result of healthcare systems responding to the demands of managing the pandemic, governments around the world imposing measures designed to reduce the transmission of the change as a decreaseCOVID-19 virus, and individuals responding to retained earningsthe concerns of approximately $13.3 million. contracting the COVID-19 virus, many of our optical retailers, hospital, medical office and fertility clinic customers have closed their facilities, restricted access, or delayed or cancelled patient visits, exams and elective medical procedures. This has had, and we believe will continue to have, an adverse effect on our sales, operating results and cash flows, although the extent of which is uncertain.
The cumulative effect adjustment representspreparation of Consolidated Condensed Financial Statements in conformity with GAAP requires management to make estimates and assumptions that affect the recognition of unrecognized income tax effects from intra-entity transfersreported amounts of assets other than inventory that occurred prior toand liabilities and disclosure of contingent assets and liabilities at the date of adoption.
In May 2014, the FASB issued ASU 2014-09, Revenuefinancial statements, as well as the reported amounts of revenue and expenses during the reporting period. Actual results could differ from Contracts with Customers (Topic 606).those estimates particularly as it relates to estimates reliant on forecasts and other assumptions reasonably available to the Company and the uncertain future impacts of the COVID-19 pandemic and related economic disruptions. The ASU requires revenue recognition to depict the transfer of goods or services to customers at an amount that reflects the considerationextent to which the entity expectsCOVID-19 pandemic and related economic disruptions impact our business and financial results will depend on future developments including, but not limited to, be entitled in exchange for those goodsthe continued spread, duration and severity of the COVID-19 pandemic; the occurrence, spread, duration and severity of any subsequent wave or services. The amendments inwaves of outbreaks after the ASU can be applied either retrospectivelyinitial outbreak has subsided; the actions taken by the U.S. and foreign governments to each prior reporting period presentedcontain the COVID-19 pandemic, address its impact or alternatively,respond to the modified retrospective transition method whereby the company recognizes the cumulative effect of initially applying the guidance as an opening balance sheet adjustment to equity in the period of initial application. This alternative approach must be supplemented by additional disclosures.reduction
We adopted ASU 2014-09 on November 1, 2018, using the modified retrospective transition method. We did not recognize any cumulative effect of initially applying the new revenue standard as an adjustment to our opening balance of retained earnings due to its immaterial impact. The comparative information has not been restated and continues to be reported under the accounting standards in effect for those periods. There was no material impact of ASU 2014-09 to our financial statements during the three and nine months ended July 31, 2019. We do not expect the adoption of the new revenue standard to have a material impact to our net income on an ongoing basis.7
THE COOPER COMPANIES, INC. AND SUBSIDIARIES
Notes to Consolidated Condensed Financial Statements
(Unaudited)
allowance for doubtful accounts and credit losses
the carrying value of the goodwill and other long-lived assets.
There was not a material impact to the above estimates in the Company’s Consolidated Condensed Financial Statements for the three and six months ended April 30, 2020. The Company appliesCompany’s future assessment of the provisionsmagnitude and duration of Accounting Standards Codification (ASC) 606-10 or ASU 2014-09, Revenue from Contracts with Customers,COVID-19, as well as other factors, could result in material changes to the estimates and all related appropriate guidance. The Company recognizes revenue under the core principle to depict the transfer of controlmaterial impacts to the Company’s customersConsolidated Condensed Financial Statements in an amount reflecting the consideration to which the Company expects to be entitled. In order to achieve that core principle, the Company applies the following five step approach: (1) identify the contract with a customer, (2) identify the performance obligations in the contract, (3) determine the transaction price, (4) allocate the transaction price to the performance obligations in the contract, and (5) recognize revenue when a performance obligation is satisfied. For a complete discussion of accounting for net product revenue, see Note 2. Revenue Recognition.future reporting periods.
Accounting Pronouncements Issued Not YetRecently Adopted
In November 2018, the FASB issued ASU 2018-18, ICollaborative Arrangements (Topic 808), Clarifying the Interaction between Topic 808 and Topic 606. This guidance amended Topic 808 and Topic 606 to clarify that transactions in a collaborative arrangement should be accounted for under Topic 606 when the counterparty is a customer for a distinct good or service (i.e., unit of account). The amendments preclude an entity from presenting consideration from a transaction in a collaborative arrangement as revenue from contracts with customers if the counterparty is not a customer for that transaction. We are currently evaluating the impact of ASU 2018-18 which is effective for the Company in our fiscal year and interim periods beginning on November 1, 2020.
In August 2018, the FASB issued ASU 2018-15, Intangibles-Goodwill and Other - Internal Use Software (Subtopic 350-40): Customer's Accounting for Implementation Costs Incurred in a Cloud Computing Arrangement That is a Service Contract. This guidance requires companies to apply the internal-use software guidance in ASC 350-40 to implementation costs incurred in a hosting arrangement that is a service contract to determine whether to capitalize certain implementation costs or expense them as incurred. We are currently evaluating the impact of ASU 2018-15 which is effective for the Company in our fiscal year and interim periods beginning on November 1, 2020.
Inn February 2016, the FASBFinancial Accounting Standards Board (FASB) issued ASU 2016-02, Leases (Topic 842). ASU 2016-02 requires that a lessee recognize the assets and liabilities that arise from operating leases. A lessee should recognize in the statement of financial position a liability to make lease payments (the lease liability) and a right-of-use (ROU) asset representing its right to use the underlying asset for the lease term. For leases with a term of 12 months or less, a lessee is permitted to make an accounting policy election by class of underlying asset not to recognize lease assets and lease liabilities. In transition, lessees and lessors are required to recognize and measure leases at the beginning of the earliest period presented using a modified retrospective approach. In July 2018, the FASB issued ASU 2018-10, Codification Improvements to Topic 842, Leases and ASU 2018-11, Leases Topic 842 Target improvements,, which provides an additional (and optional) transition method whereby the new lease standard is applied at the adoption date and recognized as an adjustment to retained earnings. In March 2019, the FASB issued ASU 2019-01, Leases (Topic 842) Codification Improvements, which further clarifies the determination of fair value of the underlying asset by lessors that are not manufacturers or dealers and modifies transition disclosure requirements for changes in accounting principles and other technical updates.
We adopted this standard using the optional transition method and recorded an adjustment to the Consolidated Condensed Balance Sheet on November 1, 2019. We have implemented changes to certain business processes, systems and internal controls to support adoption of the new standard and the related disclosure requirements, including the implementation of a third-party leasing software solution. We elected the package of transition expedients, which allows us to keep our existing lease classifications and not reassess whether any existing contracts as of the date of adoption are leases or contain leases and not reassess initial direct costs. In addition, we elected the practical expedients to combine lease and non-lease components for our leases, and for leases with an initial term of 12 months or less to recognize the associated lease payments in the Consolidated Statements of Income and Comprehensive Income on a straight-line basis over the lease term.
As of April 30, 2020, the aggregate balances of lease right-of-use assets and lease liabilities were $255.5 million and $264.2 million, respectively. The standard did not affect our Consolidated Statements of Income and Comprehensive Income or Consolidated Condensed Statements of Cash Flows. We will continue to disclose comparative reporting periods prior to November 1, 2019 under the previous accounting guidance, ASC 840 Leases.
THE COOPER COMPANIES, INC. AND SUBSIDIARIES
Notes to Consolidated Condensed Financial Statements
(Unaudited)
Accounting Pronouncements Issued Not Yet Adopted
In June 2016, the FASB issued ASU No. 2016-13, “Financial Instruments-Credit Losses (Topic 326): Measurement of Credit Losses on Financial Instruments” and subsequent amendments to the initial guidance: ASU 2018-19 “Codification Improvements to Topic 326, Financial Instruments-Credit Losses”, ASU 2019-04 “Codification Improvements to Topic 326, Financial Instruments-Credit Losses, Topic 815, Derivatives and Hedging, and Topic 825, Financial Instruments”, ASU 2019-05 “Financial Instruments-Credit Losses”, ASU 2019-11 “Codification Improvements to Topic 326, Financial Instruments - Credit Losses” (collectively, “Topic 326”), ASU 2020-02 Financial Instruments—Credit Losses (Topic 326) and Leases (Topic 842) and ASU 2020-03 CodificationImprovementstoFinancialInstruments. Topic 326 requires measurement and recognition of expected credit losses for financial assets held. Topic 326 is effective for fiscal years and interim periods within those fiscal years beginning after December 15, 2019, which means it will be effective for our fiscal year beginning November 01, 2020. Early adoption is permitted. We are currently evaluating the impact of Topic 326 on our Consolidated Condensed Financial Statements.
In November 2018, the FASB issued ASU 2018-18, Collaborative Arrangements (Topic 808), Clarifying the Interaction between Topic 808 and Topic 606. This guidance amended Topic 808 and Topic 606 to clarify that transactions in a collaborative arrangement should be accounted for under Topic 606 when the counterparty is a customer for a distinct good or service (i.e., unit of account). The amendments preclude an entity from presenting consideration from a transaction in a collaborative arrangement as revenue from contracts with customers if the counterparty is not a customer for that transaction. This guidance is effective for fiscal years, and interim periods within those fiscal years, beginning after December 15, 2019, which means it will be effective for our fiscal year beginning November 1, 2020. Early adoption is permitted. The adoption of this guidance will not have a material impact on our Consolidated Condensed Financial Statements.
In December 2019, the FASB issued ASU 2019-12, Income Taxes (Topic 740): Simplifying the Accounting for Income Taxes. This guidance removes certain exceptions to the general principles in Topic 740 and enhances and simplifies various aspects of the income tax accounting guidance, including requirements such as tax basis step-up in goodwill obtained in a transaction that is not a business combination, ownership changes in investments, and interim-period accounting for enacted changes in tax law. This standard is effective for fiscal years and interim periods within those fiscal years beginning after December 15, 2020. Early adoption is permitted. We are currently evaluating the impact of ASU 2019-12 on our Consolidated Condensed Financial Statements, which is effective for the Company in our fiscal year and interim periods beginning on November 1, 2019.2021.
In January 2020, the FASB issued ASU 2020-01 Investments-Equity Securities (Topic 321), Investments-Equity Method and Joint Ventures (Topic 323), and Derivatives and Hedging (Topic 815) - Clarifying the Interactions between Topic 321, Topic 323, and Topic 815. This guidance addresses accounting for the transition into and out of the equity method and provides clarification of the interaction of rules for equity securities, the equity method of accounting, and forward contracts and purchase options on certain types of securities. This standard is effective for fiscal years and interim periods within those fiscal years beginning after December 15, 2020. Early adoption is permitted. We anticipate this standardare currently evaluating the impact of ASU 2020-01 on our Consolidated Condensed Financial Statements, which is effective for the Company in our fiscal year and interim periods beginning on November 1, 2021.
In March 2020, the FASB issued ASU 2020-04, ReferenceRateReform (Topic848): Facilitation of the Effects of Reference Rate Reform on Financial Reporting. This guidance provides optional expedients and exceptions for applying generally accepted accounting principles (GAAP) to contracts, hedging relationships, and other transactions affected by reference rate reform if certain criteria are met. The amendments apply only to contracts, hedging relationships, and other transactions that reference LIBOR or another reference rate expected to be discontinued because of reference rate reform. This guidance is effective for all entities as of March 12, 2020 through December 31, 2022. We are currently evaluating the impact of ASU 2020-04 on our Consolidated Condensed Financial Statements.
No other recently issued accounting pronouncements had or are expected to have a material impact on our Consolidated Balance Sheets and related disclosures due to the recognition of ROU assets and lease liabilities for operating leases. However, we do not expect the adoption to have a material impact on our Consolidated Statements of Income. We are continuing to assess and evaluate the potential impacts of the standard as well as the election of transition method and certain practical expedients available within ASU 2019-01. We are in the process of documenting and analyzing our lease contracts, assessing business processes and controls, implementing a system solution and completing our analysis of information necessary to determine the impact to the consolidated financial statements.Condensed Financial Statements.
Note 2. Revenue Recognition
Product Revenue, Net
The Company sells its products principally to a limited number of distributors, group purchasing organizations, eye care or health care professionals including independent practices, corporate retailers, hospitals and clinics or authorized resellers (collectively, its Customers). These Customers subsequently resell the Company’s products to eye care or health care
THE COOPER COMPANIES, INC. AND SUBSIDIARIES
Notes to Consolidated Condensed Financial Statements
(Unaudited)
providers and patients. In addition to product supply and distribution agreements with Customers, the Company enters into arrangements with health care providers and payors that provide for government-mandated and/or privately-negotiated rebates, chargebacks and discounts with respect to the purchase of the Company’s products. The Company considers customer purchase orders, which in some cases are governed by master sales agreements, to be contracts with a customer. In situations where sales are to a distributor, the Company has concluded that its contracts are with the distributor. As part of its consideration of the contract, the Company evaluates certain factors including the customer’s ability to pay (or credit risk). For each contract, the Company considers the promise to transfer products, each of which is distinct, to be the identified performance obligations.
Revenues from product sales are recognized when the Customer obtains control of the Company’s product, which occurs at a point in time, typically upon shipment or delivery to the Customer. When the Company performs shipping and handling activities after the transfer of control to the Customer (e.g., when control transfers prior to delivery), they are considered as fulfillment activities, and accordingly, the costs are accrued for when the related revenue is recognized. Taxes collected from Customers relating to product sales and remitted to governmental authorities are excluded from revenues. The Company does not have any revenue recognized on payment expected to be received more than one year after the transfer of control of the products. The Company expenses incremental costs of obtaining a contract as and when incurred if the expected amortization period of the asset that the Company would have recognized is one year or less. See Note14. Business Segment Information, for disaggregation of revenue.
Reserves for Variable Consideration
Revenues from product sales are recorded at the net sales price (transaction price), which includes estimates of variable consideration for which reserves are established and which result from discounts, returns, chargebacks, rebates and other allowances that are offered within contracts between the Company and its Customers, health care providers, payors and other indirect customers relating to the Company’s sales of its products. These reserves are based on the amounts earned or to be claimed on the related sales and are classified primarily in current liabilities. Variable consideration is estimated based on the most likely amount or expected value approach, depending on which method the Company expects to better predict the amount of consideration to which it will be entitled. Once the Company elects one of the methods to estimate variable consideration for a particular type of performance obligation, the Company applies that method consistently.
Where appropriate, these estimates take into consideration a range of possible outcomes which are probability-weighted for relevant factors such as the Company’s historical experience, current contractual and statutory requirements, specific known market events and trends, industry data and forecasted customer buying and payment patterns. Overall, these reserves reflect the Company’s best estimates of the amount of consideration to which it is entitled based on the terms of the contract. Actual amounts of consideration ultimately received may differ from the Company’s estimates. If actual results in the future vary from the Company’s estimates, the Company adjusts these estimates, which would affect net product revenue and earnings in the period such variances become known.
Trade Discounts and AllowancesNote 2. Leases
The Company generally provides Customersprimarily has operating leases for office, manufacturing and warehouse space, vehicles, and office equipment. Our leases expire on various dates between 2020 and 2045, some of which could include options to extend the lease.
Lease right-of-use assets and liabilities are recognized at the commencement date based on the present value of lease payments over the lease term. As these leases do not provide an implicit rate, we use our incremental borrowing rate based on the information available at the lease's commencement date in determining the present value of lease payments. We consider information including, but not limited to, the lease term, our credit rating and interest rates of similar debt instruments with discounts, whichcomparable credit ratings and security interests. The lease right-of-use assets are increased by any lease prepayments made and reduced by any lease incentives such as tenant improvement allowances. Options to extend the lease term are included in the lease term when it is reasonably certain that we will exercise the extension option.
The Company’s operating leases typically include incentive feesnon-lease components such as common-area maintenance costs. We have elected to include non-lease components with lease payments for the purpose of calculating lease right-of-use assets and liabilities, to the extent that they are fixed. Non-lease components that are stated innot fixed are expensed as incurred as variable lease payments.
Leases with a term of one year or less are not recognized on our Consolidated Condensed Balance Sheet, while the Company’s contracts and are recorded as a reduction of revenue in the period the related product revenue is recognized. In addition, the Company receives sales order management, data and distribution services from certain Customers. To the extent the services received are distinct from the Company’s sale of products to the Customer and have readily determinable fair value, theseassociated lease payments are classified in selling, general and administrative expensesrecorded in the Consolidated Statements of Income ofand Comprehensive Income on a straight-line basis over the Company.
Product Returnslease term.
Consistent with industry practice, the Company generally offers Customers a limited rightCommitments under finance lease arrangements of return for a product that has been purchased from the Company. The Company estimates the amount$1.9 million as of its product sales that may be returned by its CustomersApril 30, 2020 are not significant and records this estimate as a reduction of revenueare not included in the perioddisclosure tables below.
The following table presents information about leases on the related product revenue is recognized. There is inherent judgmentConsolidated Condensed Balance Sheet:
|
| | | |
| (In millions) | April 30, 2020 |
| Operating Leases | |
| Operating lease right-of-use assets | $ | 255.5 |
|
| | |
| Operating lease liabilities, current | 31.5 |
|
| Operating lease liabilities, non-current | 232.7 |
|
| Total operating lease liabilities | $ | 264.2 |
|
| | |
Weighted average remaining lease term (in years)
| 11.6 |
|
| Weighted average discount rate | 3 | % |
The following table presents information about lease expense in estimating future refundsour Consolidated Statements of Income and Comprehensive Income:
|
| | | | | | | |
| Periods Ended April 30, | Three Months | | Six Months |
| (In millions) | 2020 | | 2020 |
| Operating lease expense | $ | 9.7 |
| | $ | 19.6 |
|
| Short-term lease expense | 1.5 |
| | 2.6 |
|
| Variable lease expense | 0.4 |
| | 0.8 |
|
THE COOPER COMPANIES, INC. AND SUBSIDIARIES
Notes to Consolidated Condensed Financial Statements
(Unaudited)
The following table presents supplemental cash flow information about the Company’s leases:
|
| | | | | | | |
| Periods Ended April 30, | Three Months | | Six Months |
| (In millions) | 2020 | | 2020 |
| Cash paid for amounts included in the measurement of lease liabilities: | | | |
| Operating cash flows from operating leases | $ | 9.7 |
| | $ | 19.6 |
|
Maturity of Lease Liabilities
The minimum rental payments required under operating leases that have initial or remaining noncancelable lease terms in excess of one year as they are susceptible to factors outside of our influence. However, we have significant experienceApril 30, 2020 are:
|
| | | |
| (In millions) | |
| Remainder of 2020 | $ | 19.1 |
|
| 2021 | 36.5 |
|
| 2022 | 32.6 |
|
| 2023 | 29.2 |
|
| 2024 | 27.1 |
|
| 2025 and thereafter | 173.9 |
|
| Total lease payments | 318.4 |
|
| Less: interest | 54.2 |
|
| Present value of lease liabilities | $ | 264.2 |
|
As previously disclosed in estimating the amount of refunds, based primarilyCompany’s Annual Report on historical data. Our refund liabilityForm 10-K for product returns was $9.9 million at Julythe fiscal year ended October 31, 2019, which is included in Accrued Liabilities on our Condensed Consolidated Balance Sheets and represents the expected value ofunder previous lease accounting standard ASC 840, Leases, the aggregate refunds that will be due to our customers.future noncancelable minimum rental payments on its operating leases, as of October 31, 2019, were as follows:
|
| | | |
| (In millions) | |
| 2020 | $ | 38.5 |
|
| 2021 | 34.9 |
|
| 2022 | 31.2 |
|
| 2023 | 28.0 |
|
| 2024 | 26.5 |
|
| 2025 and thereafter | 173.6 |
|
| Total future minimum lease payments | $ | 332.7 |
|
THE COOPER COMPANIES, INC. AND SUBSIDIARIES
Notes to Consolidated Condensed Financial Statements
(Unaudited)
Rebates and Chargebacks
Rebates are estimated based on contractual terms, historical experience, customer mix, trend analysis and projected market conditions in the various markets served.
Chargebacks for fees and discounts to providers represent the estimated obligations resulting from contractual commitments to sell products to qualified healthcare providers at prices lower than the list wholesale prices charged to the Company’s direct customers. For certain office and surgical products in CooperSurgical, customers charge the Company for the difference between what they pay for the product and the ultimate selling price to the qualified healthcare providers. These reserves are established in the same period that the related revenue is recognized, resulting in a reduction of product revenue. Chargeback amounts are generally determined at the time of resale to the qualified healthcare provider by Customers. CooperSurgical rebates are predominately related to the Medicaid rebate provision that is estimated based upon contractual terms, historical experience, and trend analysis.
Contract balances
The timing of billing and revenue recognition primarily occurs simultaneously. The Company does not have material contract assets or liabilities.
Note 3. Acquisitions
The following is a summary of the allocation of the total purchase consideration for business and asset acquisitions that the Company completed during fiscal 20192020 and 2018:2019: | | | (In millions) | July 31, 2019 | | October 31, 2018 | April 30, 2020 | | October 31, 2019 |
| Customer relationships | | $ | 6.5 |
| | $ | 7.5 |
|
| Technology | $ | 12.3 |
| | $ | — |
| — |
| | 12.3 |
|
| Customer relationships | 7.5 |
| | 23.5 |
| |
| Trademarks | 10.2 |
| | 100.0 |
| — |
| | 10.2 |
|
| Composite intangible asset | — |
| | 1,061.9 |
| |
| Other | 0.1 |
| | 4.2 |
| — |
| | 0.1 |
|
| Total identifiable intangible assets | $ | 30.1 |
| | $ | 1,189.6 |
| $ | 6.5 |
| | $ | 30.1 |
|
| Goodwill | 35.8 |
| | 70.6 |
| 1.9 |
| | 29.8 |
|
| Net tangible assets | 1.3 |
| | 59.6 |
| 0.8 |
| | 7.3 |
|
| Total purchase price | $ | 67.2 |
| | $ | 1,319.8 |
| $ | 9.2 |
| | $ | 67.2 |
|
All the acquisitions were funded by cash generated from operations or facility borrowings.
For business acquisitions, we recorded the tangible and intangible assets acquired and liabilities assumed at their fair values as of the applicable date of acquisition. For assetsasset acquisitions, we recorded the tangible and intangible assets acquired and liabilities assumed at their estimated and relative fair values as of the applicable date of acquisition.
We believe these acquisitions strengthen CooperSurgical's and CooperVision's businesses through the addition of new distributors or complementary products and services.
The pro forma results of operations have not been presented because the effect of the business combinations described below were not material to our consolidated results of operations.
Fiscal Year 20192020
On December 31, 2018,13, 2019, CooperSurgical completed the acquisition of Incisive Surgical Inc., a privately-held U.S.distributor of in vitro fertilization (IVF) medical device company that develops mechanical surgical solutions for skin closure.devices and systems. The purchase price allocation is preliminary and we are in the process of finalizing information primarily related to taxes and the corresponding impact on goodwill.
Fiscal Year 2019
On December 28, 2018, CooperVision completed the acquisition of Blanchard Contact Lenses. Blanchard is a privately-held scleral lens company, which expands CooperVision's specialty and scleral lens portfolio. The purchase price allocation is preliminary and we are in the process of finalizing information primarily related to property plant and equipment, taxes and the corresponding impact on goodwill.
THE COOPER COMPANIES, INC. AND SUBSIDIARIES
Notes to Consolidated Condensed Financial Statements
(Unaudited)
The pro forma results of operations of these acquisitions have not been presented because the effects of the business combinations described above, individually and in the aggregate, were not material to our reported consolidated financial results.
Fiscal Year 2018
PARAGARD
On November 1, 2017, CooperSurgical acquired the assets of the PARAGARD Intrauterine Device (IUD) business (PARAGARD) from Teva Pharmaceuticals Industries Limited for $1.1 billion. This asset acquisition broadened and strengthened CooperSurgical's product portfolio. PARAGARD® is the only hormone-free, long lasting, reversible contraceptive approved by the United States Food and Drug Administration (FDA) available in the United States.
The following table summarizes the relative fair values of net assets acquired and liabilities assumed using the cost accumulation and allocation model:
|
| | | |
| (In millions) | Relative Fair Value |
Composite intangible asset (1) | $ | 1,061.9 |
|
Assembled workforce intangible asset (2) | 1.2 |
|
| Property, plant and equipment | 2.0 |
|
Inventory (3) | 47.3 |
|
| Other assets | 9.4 |
|
| Total assets acquired | $ | 1,121.8 |
|
| Less: liabilities assumed | 16.4 |
|
| Total Purchase Price | $ | 1,105.4 |
|
The Company proportionally allocated the acquisition costs to the net assets acquired. The acquisition-related costs included advisory, legal, valuation and other professional fees.
(1) Composite Intangible asset consists of technology, trade name, New Drug Application (NDA) approval and physician relationships, which have been valued as a single composite intangible asset as they are inextricably linked. The composite asset was identified as the primary asset acquired, was valued using the Multi-Period Excess Earnings Method and will be amortized over 15 years.
(2) An assembled workforce was recognized as a separate acquired intangible asset, given the purchase of assets and will be amortized over 5 years.
(3) Inventory relative fair value includes step up of $45.4 million.
Other Acquisitions
On April 3,December 31, 2018, CooperSurgical completed the acquisition of The LifeGlobal Group (LifeGlobal). LifeGlobal wasIncisive Surgical Inc., a privately heldprivately-held U.S. medical device company that specializes primarily in in-vitro fertilization (IVF) media. LifeGlobal’s product categories include media products as well as IVF laboratory air filtration products and dishware. We have completed the purchase price allocationdevelops mechanical surgical solutions for this acquisition.
On January 4, 2018, CooperVision acquired Blueyes Ltd, a long-standing distribution partner, with a leading position in the distribution of contact lenses to the Optical and Pharmacy sector in Israel. We have completed the purchase price allocation for this acquisition.
On December 1, 2017, CooperVision acquired Paragon Vision Sciences, a leading provider of orthokeratology (ortho-k) specialty contact lenses and oxygen permeable rigid contact lens materials. Ortho-k contact lenses are overnight lenses which enable corneal topography correction for myopia (nearsightedness) patients. We have completed the purchase price allocation for this acquisition.
THE COOPER COMPANIES, INC. AND SUBSIDIARIES
Notes to Consolidated Condensed Financial Statements
(Unaudited)
Note 4. Inventories
| | | (In millions) | July 31, 2019 | | October 31, 2018 | April 30, 2020 | | October 31, 2019 |
| Raw materials | $ | 127.1 |
| | $ | 112.5 |
| $ | 141.1 |
| | $ | 131.4 |
|
| Work-in-process | 13.4 |
| | 12.6 |
| 13.0 | | 13.3 |
| Finished goods | 361.6 |
| | 343.7 |
| 414.1 | | 362.2 |
| | $ | 502.1 |
| | $ | 468.8 |
| |
| Total inventories | | $ | 568.2 |
| | $ | 506.9 |
|
Inventories are stated at the lower of cost and net realizable value. Cost is computed using standard cost that approximates actual cost, on a first-in, first-out basis.
THE COOPER COMPANIES, INC. AND SUBSIDIARIES
Notes to Consolidated Condensed Financial Statements
(Unaudited)
Note 5. Intangible Assets
Goodwill
|
| | | | | | | | | | | |
| (In millions) | CooperVision | | CooperSurgical | | Total |
| Balance at October 31, 2017 | $ | 1,735.7 |
| | $ | 619.1 |
| | $ | 2,354.8 |
|
| Net additions during the year ended October 31, 2018 | 36.8 |
| | 34.4 |
| | 71.2 |
|
| Translation | (29.6 | ) | | (4.3 | ) | | (33.9 | ) |
| Balance at October 31, 2018 | 1,742.9 |
| | 649.2 |
| | 2,392.1 |
|
| Net additions during the nine months ended July 31, 2019 | 13.8 |
| | 22.0 |
| | 35.8 |
|
| Translation | (33.0 | ) | | (3.5 | ) | | (36.5 | ) |
| Balance at July 31, 2019 | $ | 1,723.7 |
| | $ | 667.7 |
| | $ | 2,391.4 |
|
|
| | | | | | | | | | | |
| (In millions) | CooperVision | | CooperSurgical | | Total |
| Balance at October 31, 2019 | 1,765.4 |
| | 663.5 |
| | 2,428.9 |
|
| Current period additions | — |
| | 1.9 |
| | 1.9 |
|
| Foreign currency translation adjustment | (27.2 | ) | | (3.6 | ) | | (30.8 | ) |
| Balance at April 30, 2020 | $ | 1,738.2 |
| | $ | 661.8 |
| | $ | 2,400.0 |
|
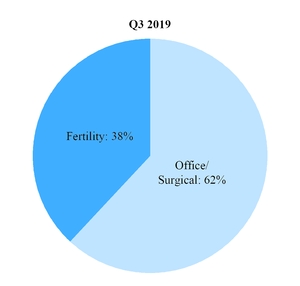
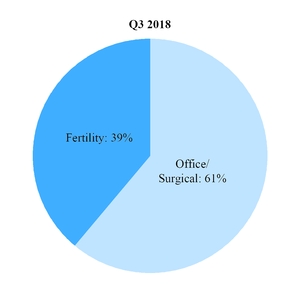
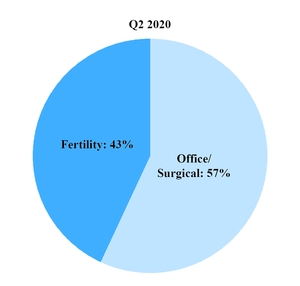
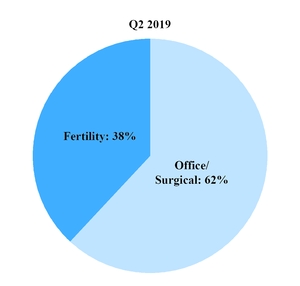
Effective April 30, 2019, there was a change in the reporting units as a result of realignment in the internal reporting structure of the business around markets and customers at CooperSurgical. As such, Cooper Surgical has evolved into 2 reporting units, namely, Office/Surgical and Fertility, which reflects management oversight of operations. The change in reporting units did not result in a change in operating segments. We allocated CooperSurgical's goodwill based on relative fair values utilizing the discounted cash flow method and guideline public company method as our allocation base, and the allocated fair values exceeded the carrying values for each of the 3 reporting units as of April 30, 2019.
We evaluateCompany evaluates goodwill for impairment annually during the fiscal third quarter and when an event occurs or circumstances change such that it is reasonably possible that impairment may exist. We accountThe Company accounts for goodwill, evaluates and evaluate ourtests goodwill balances and test them for impairment in accordance with related accounting standards. WeThe Company performed ouran annual impairment assessment in our third quarter of fiscal 2019, and 2018, and ourits analysis indicated that we hadthere was 0 impairment of goodwill in our reporting units.
Other Intangible Assets
|
| | | | | | | | | | | | | | | | | |
| | April 30, 2020 | | October 31, 2019 | | |
| (In millions) | Gross Carrying Amount | | Accumulated Amortization | | Gross Carrying Amount | | Accumulated Amortization | | Weighted Average Amortization Period (in years) |
| Intangible assets with definite lives: | | | | | | | | | |
| Trademarks | $ | 147.7 |
| | $ | 32.3 |
| | $ | 148.5 |
| | $ | 27.3 |
| | 14 |
| Composite intangible asset | 1,061.9 |
| | 177.0 |
| | 1,061.9 |
| | 141.6 |
| | 15 |
| Technology | 399.3 |
| | 236.2 |
| | 399.9 |
| | 221.2 |
| | 11 |
| Customer relationships | 357.7 |
| | 203.5 |
| | 357.6 |
| | 194.0 |
| | 13 |
| License and distribution rights and other | 27.9 |
| | 16.7 |
| | 27.9 |
| | 15.3 |
| | 11 |
| | 1,994.5 |
| | $ | 665.7 |
| | 1,995.8 |
| | $ | 599.4 |
| | 14 |
| Less: accumulated amortization and translation | 665.7 |
| | | | 599.4 |
| | | | |
| Intangible assets with definite lives, net | 1,328.8 |
| | | | 1,396.4 |
| | | | |
| | | | | | | | | | |
Intangible assets with indefinite lives, net (1) | 8.9 |
| | | | 8.9 |
| | | | |
| | | | | | | | | | |
| Total other intangibles, net | $ | 1,337.7 |
| | | | $ | 1,405.3 |
| | | | |
(1) Intangible assets with indefinite lives include technology and trademarks.
Balances include foreign currency translation adjustments.
We performed a qualitative assessment to test each reporting unit's goodwill for impairment. Qualitative factors considered in this assessment include industry and market considerations, overall financial performance and other relevant events and factors affecting each reporting unit. Based on our qualitative assessment, if we determine that the fair value of a reporting unit is more likely than not to be less than its carrying amount, the fair value of a reporting unit will be compared with its carrying amount and an impairment charge will be recognized for the amount that the carrying value exceeds the fair value of the reporting unit. A reporting unit is the level of reporting at which goodwill is tested for impairment. Our reporting units are CooperVision, Office/Surgical and Fertility reflecting the current way we manage our business. Goodwill impairment analysis and measurement is a process that requires significant judgment. If our common stock price trades below book value per share, there are changes in market conditions or a future downturn in our business, or a future goodwill impairment test indicates an impairment of our goodwill, we may have to recognize a non-cash impairment of goodwill that could be material and could adversely affect our results of operations in the period recognized and also adversely affect our total assets and stockholders' equity.
THE COOPER COMPANIES, INC. AND SUBSIDIARIES
Notes to Consolidated Condensed Financial Statements
(Unaudited)
Other Intangible Assets
|
| | | | | | | | | | | | | | | | | |
| | July 31, 2019 | | October 31, 2018 | | |
| (In millions) | Gross Carrying Amount | | Accumulated Amortization | | Gross Carrying Amount | | Accumulated Amortization | | Weighted Average Amortization Period (In years) |
| Intangible assets with definite lives: | | | | | | | | | |
| Trademarks | $ | 148.3 |
| | $ | 24.6 |
| | $ | 138.1 |
| | $ | 16.9 |
| | 14 |
| Composite intangible asset | 1,061.9 |
| | 123.9 |
| | 1,061.9 |
| | 70.8 |
| | 15 |
| Technology | 398.8 |
| | 213.0 |
| | 387.2 |
| | 190.7 |
| | 11 |
| Customer relationships | 356.1 |
| | 187.0 |
| | 350.0 |
| | 168.6 |
| | 13 |
License and distribution rights and other (1) | 27.8 |
| | 14.7 |
| | 74.9 |
| | 52.7 |
| | 11 |
| | 1,992.9 |
| | $ | 563.2 |
| | 2,012.1 |
| | $ | 499.7 |
| | 14 |
| Less: accumulated amortization and translation | 563.2 |
| | | | 499.7 |
| | | | |
| Intangible assets with definite lives, net | 1,429.7 |
| | | | 1,512.4 |
| | | | |
| | | | | | | | | | |
Intangible assets with indefinite lives, net (2) | 8.9 |
| | | | 8.9 |
| | | | |
| | | | | | | | | | |
| Total other intangible assets, net | $ | 1,438.6 |
| | | | $ | 1,521.3 |
| | | | |
(1) In the second quarter of fiscal 2019, CooperSurgical sold an exclusive distribution right to distribute Filshie Clip System in the U.S. for $21.0 million and recognized a gain of $19.0 million. In the third quarter of fiscal 2019, CooperVision removed $37.3 million of fully amortized non-compete agreements.
(2) Intangible assets with indefinite lives include trademark and technology intangible assets.
Balances include foreign currency translation adjustments.
As of July 31, 2019,April 30, 2020, the estimation of amortization expenses for intangible assets with definite lives is as follows:
| | | Fiscal years: | (In millions) | (In millions) |
| Remainder of 2019 | $ | 35.1 |
| |
| 2020 | 135.6 |
| |
| Remainder of 2020 | | $ | 67.4 |
|
| 2021 | 134.3 |
| 134.6 |
|
| 2022 | 132.4 |
| 132.7 |
|
| 2023 | 130.2 |
| 130.5 |
|
| 2024 | | 126.2 |
|
| Thereafter | 862.1 |
| 737.4 |
|
| Total remaining amortization for intangible assets with definite lives | $ | 1,429.7 |
| $ | 1,328.8 |
|
The Company assesses indefinite-lived intangible assets annually during the fiscal third quarter and both indefinite-lived and definite-lived intangible assets, whenever eventswhen an event occurs or changeschange in circumstances indicate that the carrying amount of a definite-lived intangible asset (asset group) may not be recoverable. When events or changes in circumstances indicate that the carrying amount of a definite-livedan intangible asset may not be recoverable, the Company evaluates whether the definite-lived intangible asset is impaired by comparing its carrying value to its undiscounted future cash flows.in accordance with related accounting standards. The Company assesses indefinite-lived intangible assets annuallyperformed an annual impairment assessment in the third quarter of fiscal 2019 and did not recognize any material intangible asset impairment charges.
Given the fiscal year, or whenever events or circumstances indicategeneral deterioration in economic and market conditions surrounding the COVID-19 pandemic, the Company considered the impact that the carrying amount of an indefinite-lived intangible asset (asset group)COVID-19 pandemic may have on its near and long-term forecasts and determined that it was not be recoverable. The Company evaluates whethermore likely than not that the indefinite-lived intangible asset is impaired by comparing its carrying value to its fair value.
If the carrying value of areporting units or relevant asset groups was below carrying amounts, and therefore the Company determined that there was 0 impairment to either its goodwill, definite-lived or indefinite-lived intangible asset is not recoverable,assets at April 30, 2020.
Note 6. Debt
|
| | | | | | | |
| (In millions) | April 30, 2020 | | October 31, 2019 |
| Overdraft and other credit facilities | $ | 54.6 |
| | $ | 63.7 |
|
| Term loan | 500.0 |
| | 500.0 |
|
| Less: unamortized debt issuance cost | (0.1 | ) | | — |
|
| Short-term debt | $ | 554.5 |
| | $ | 563.7 |
|
| | | | |
| Revolving credit | 495.0 |
| | 264.0 |
|
| Term loans | 850.0 |
| | 1,000.0 |
|
| Other | 0.2 |
| | 0.2 |
|
| Less: unamortized debt issuance cost | (0.4 | ) | | (1.6 | ) |
| Long-term debt | 1,344.8 |
| | 1,262.6 |
|
| Total debt | $ | 1,899.3 |
| | $ | 1,826.3 |
|
Revolving Credit and Term Loan Agreement on April 1, 2020
On April 1, 2020, the Company entered into a Revolving Credit and Term Loan Agreement (the 2020 Credit Agreement), among the Company, CooperVision International Holding Company, LP, CooperSurgical Netherlands B.V., CooperVision Holding Kft. the lenders from time to time party thereto, and KeyBank National Association, as administrative agent. The 2020 Credit Agreement provides for (a) a multicurrency revolving credit facility (the 2020 Revolving Credit Facility) in an impairment loss is recognized basedaggregate principal amount of $1.290 billion and (b) a term loan facility (the 2020 Term Loan Facility) in an aggregate principal amount of $850.0 million, each of which, unless terminated earlier, mature on April 1, 2025. In addition, the amount by whichCompany has the carrying value exceedsability from time to time to request an increase to the fair value. The inputs used in the fair value analysis fall within Level 3size of the fair value hierarchy duerevolving credit facility or establish one or more new term loans under the term loan facility in an aggregate amount up to $1.605 billion, subject to the usediscretionary participation of significant unobservable inputs to determine fairthe lenders.
Amounts outstanding under the 2020 Credit Agreement will bear interest, at the Company’s option, at either the base rate, or the adjusted LIBO rate or adjusted foreign currency rate, plus, in each case, an applicable rate of between 0.00% and 0.50%
THE COOPER COMPANIES, INC. AND SUBSIDIARIES
Notes to Consolidated Condensed Financial Statements
(Unaudited)
value. The Company did not recognize any material definite-lived or indefinite-lived intangible asset impairment charges duringpays an annual commitment fee that ranges from 0.10% to 0.20% of the unused portion of the 2020 Revolving Credit Facility based upon the Company’s Total Leverage Ratio, as defined in the 2020 Credit Agreement. In addition to the annual commitment fee, the Company is also required to pay certain letter of credit and related fronting fees and other administrative fees pursuant to the terms of the 2020 Credit Agreement.
On April 1, 2020, the Company borrowed $850.0 million under the 2020 Term Loan Facility and $445.0 million under the 2020 Revolving Credit Facility and used the proceeds to fully repay all borrowings outstanding under the 2017 Term Loan Agreement (as defined below) and transfer all letters of credit and borrowings outstanding under the 2016 Credit Agreement (as defined below) to the 2020 Credit Agreement, as further described below.
At April 30, 2020, the Company had $850.0 million outstanding under the 2020 Term Loan Facility and $495.0 million outstanding under the 2020 Revolving Credit Facility. The interest rate on the 2020 Term Loan Facility was 1.86% at April 30, 2020. During the three and ninesix months ended July 31, 2019.April 30, 2020, the Company expensed $1.7 million related to the debt issuance costs of the 2020 Term Loan Facility.
The 2020 Credit Agreement contains customary restrictive covenants, as well as financial covenants that require the Company to maintain a certain Total Leverage Ratio and Interest Coverage Ratio, each as defined in the 2020 Credit Agreement:
Note 6. DebtTotal Leverage Ratio, as defined, to be no higher than 3.75 to 1.00.
|
| | | | | | | |
| (In millions) | July 31, 2019 | | October 31, 2018 |
| Overdraft and other credit facilities | $ | 65.0 |
| | $ | 37.1 |
|
| Term loans | 325.0 |
| | — |
|
| Short-term Debt | $ | 390.0 |
| | $ | 37.1 |
|
| | | | |
| Revolving credit | $ | — |
| | $ | 439.0 |
|
| Term loans | 1,425.0 |
| | 1,550.0 |
|
| Other | 0.2 |
| | 0.2 |
|
| Less: unamortized debt issuance cost | (2.6 | ) | | (3.5 | ) |
| Long-term Debt | $ | 1,422.6 |
| | $ | 1,985.7 |
|
| | | | |
| Total Debt | $ | 1,812.6 |
| | $ | 2,022.8 |
|
$400500 million Term Loan on NovemberSeptember 27, 2019, amended on April 1, 20182020
On November 1, 2018,September 27, 2019, the Company entered into a 364-day, $400.0 million,amended its existing senior unsecured term loan agreement by and among the Company, the lenders party thereto and PNC Bank, National Association, as administrative agent which maturesentered into on October 31, 2019November 1, 2018 (the 2018 Term Loan Agreement). to establish a new 364-day senior unsecured term loan (the 2019 Term Loan Agreement) with the same parties as the 2018 Term Loan Agreement. The 2019 Term Loan Agreement modifies certain provisions of the 2018 Term Loan Agreement which, among other things, extended the maturity date to September 25, 2020 and increased the aggregate principal amount of the term loan facility from an original amount of $400 million to $500 million. The Company used the additional funds to partially repay outstanding borrowings under the 2016 Revolving2017 Term Loan Agreement (as defined below).
On April 1, 2020, the Company entered into Amendment No. 2 to the 2018 Term Loan Agreement (the Second Amendment to the 2018 Term Loan Agreement). The Second Amendment to the 2018 Term Loan Agreement further modifies the 2018 Term Loan Agreement by, among other things, conforming certain provisions therein to those contained in the 2020 Credit Facility. Agreement discussed above.
At July 31, 2019, weApril 30, 2020, the Company had $325.0$500.0 million outstanding under the 2019 Term Loan Agreement (including the Second Amendment to the 2018 Term Loan Agreement.Agreement).
Amounts outstanding under the 20182019 Term Loan Agreement will bear interest, at the Company's option, at either the base rate, or the adjusted LIBO rateLIBOR (each as defined in the Second Amendment to the 2018 Term Loan Agreement), plus, in each case, an applicable rate of 0.00% in respect of base rate loans and 0.60% in respect of adjusted LIBO rateLIBOR loans. The weighted average interest raterates for the three months and ninesix months ended July 31, 2019April 30, 2020 were 3.02%2.01% and 3.04%2.18%, respectively.
The 20182019 Term Loan Agreement contains customary restrictive covenants, as well as financial covenants that require the Company to maintain a certain Total Leverage Ratio and Interest Coverage Ratio (each as defined in the Second Amendment to the 2018 Term Loan Agreement) consistent with the 20162020 Credit Agreement discussed below.above.
$1.425 billion Term Loan on November 1, 2017
On November 1, 2017, in connection with the PARAGARD acquisition, wethe Company entered into a five-year, $1.425 billion, senior unsecured term loan agreement (the 2017 Term Loan Agreement) by and among the Company, the lenders party thereto and DNB Bank ASA, New York Branch, as administrative agent which matures on November 1, 2022. The
THE COOPER COMPANIES, INC. AND SUBSIDIARIES
Notes to Consolidated Condensed Financial Statements
(Unaudited)
Company used part of the facility to fund the PARAGARD acquisition and used the remainder of the funds to partially repay outstanding borrowings under ourthe Company's revolving credit agreement.
Amounts
On April 1, 2020, in connection with the Company’s entry into the 2020 Credit Agreement, the Company terminated the 2017 Term Loan Agreement. In connection with the termination, all borrowings outstanding under the 2017 Term Loan Agreement will bear interest, at our option, at eitherwere repaid. As a result of the base rate, orrepayment, the adjusted LIBO rate (each as defined in the 2017 Term Loan Agreement), plus, in each case, an applicable rateCompany incurred debt extinguishment charges of between 0.00% and 0.75% in respect of base rate loans and between 1.00% and 1.75% in respect of adjusted LIBO rate loans, in each case in accordance with a pricing grid tied$1.4 million due to the Total Leverage Ratio as defined in the 2017 Term Loan Agreement.
The 2017 Term Loan Agreement contains customary restrictive covenants, as well as financial covenants that require the Company to maintain a certain Total Leverage Ratio and Interest Coverage Ratio (each as defined in the 2017 Term Loan Agreement) consistent with the 2016 Credit Agreement discussed below. At July 31, 2019, we had $1.425 billion outstanding under the 2017 Term Loan Agreement. The interest rate on the 2017 term loan was 3.36% at July 31, 2019.
THE COOPER COMPANIES, INC. AND SUBSIDIARIES
Notes to Consolidated Condensed Financial Statements
(Unaudited)
Revolving Credit and Term Loan Agreement on March 1, 2016
On March 1, 2016, wethe Company entered into a Revolving Credit and Term Loan Agreement (the 2016 Credit Agreement), among the Company, CooperVision International Holding Company, LP, the lenders party thereto and KeyBank National Association, as administrative agent. The 2016 Credit Agreement provides for a multicurrencymulti-currency revolving credit facility in an aggregate principal amount of $1.0 billion (the 2016 Revolving Credit Facility) and a term loan facility in an aggregate principal amount of $830.0 million (the 2016 Term Loan Facility), each of which, unless.
On April 1, 2020, in connection with the Company’s entry into the 2020 Credit Agreement, the Company terminated earlier, mature on March 1, 2021. In addition, we have the ability from time to time to request an increase to the size of the 2016 Revolving Credit Facility or establish one or more new term loans underAgreement. In connection with the 2016 Term Loan Facility in an aggregate amount up to $750.0 million, subject to the discretionary participationtermination, all letters of the lenders.
Amountscredit outstanding under the 2016 Credit Agreement will bear interest, at our option, at either the base rate, or the adjusted LIBO rate or adjusted foreign currency rate (each as defined in the 2016 Credit Agreement), plus, in each case, an applicable rate of between 0.00% and 0.75% in respect of base rate loans and between 1.00% and 1.75% in respect of adjusted LIBO rate or adjusted foreign currency rate loans, in each case in accordance with a pricing grid tiedwere transferred to the Total Leverage Ratio, as defined in the 20162020 Credit Agreement.
We pay an annual commitment fee that ranges from 0.125% to 0.25% As a result of the unused portiontermination, the Company incurred debt extinguishment charges of the 2016 Revolving Credit Facility depending on certain financial ratios. In addition$0.8 million due to the annual commitment fee described above, we are also required to pay certain letteracceleration of credit and related fronting fees and other administrative fees pursuant to the termsamortization of the 2016 Credit Agreement.
At July 31, 2019, we had 0 outstanding balance under the 2016 Term Loan Facility and $998.8 million available under the 2016 Revolving Credit Facility.
The 2016 Credit Agreement contains customary restrictive covenants, as well as financial covenants that require us to maintain a certain Total Leverage Ratio and Interest Coverage Ratio (each as defined in the 2016 Credit Agreement):
Interest Coverage Ratio, as defined, to be at least 3.00 to 1.00 at all times.
Total Leverage Ratio, as defined, to be no higher than 3.75 to 1.00.
At July 31, 2019, we were in compliance with the Interest Coverage Ratio at 12.24 to 1.00 and the Total Leverage Ratio at 1.83 to 1.00 for 2018 Term Loan Agreement, the 2017 Term Loan Agreement, and the 2016 Credit Agreement.debt issuance costs.
Refer to our Annual Report on Form 10-K for the fiscal year ended October 31, 20182019 for more details.
The following is a summary of the maximum commitments and the net amounts available to us under credit facilities discussed above as of April 30, 2020:
|
| | | | | | | | | | | | | | | | | | |
| (In millions) | | Facility Limit | | Outstanding Borrowings | | Outstanding Letters of Credit | | Total Amount Available | | Maturity Date |
| 2020 Revolving Credit Facility | | $ | 1,290.0 |
| | $ | 495.0 |
| | $ | 1.2 |
| | $ | 793.8 |
| | April 1, 2025 |
| 2020 Term Loan Facility | | 850.0 |
| | 850.0 |
| | n/a |
| | — |
| | April 1, 2025 |
| 2019 Term Loan | | 500.0 |
| | 500.0 |
| | n/a |
| | — |
| | September 25, 2020 |
| Total | | $ | 2,640 |
| | $ | 1,845 |
| | $ | 1.2 |
| | $ | 793.8 |
| | |
Note 7. Income Taxes
Recent Tax Legislation
The 2017 Act was enacted into law on December 22, 2017 and significantly changed existing U.S. tax law. The 2017 Act adopted a territorial tax system, imposed a mandatory one-time transition tax on earnings of foreign subsidiaries that were previously indefinitely reinvested, and reduces the U.S. federal statutory tax rate from 35% to 21%. For third quarter of fiscal 2019, the Company has utilized the enacted U.S. federal statutory tax rate of 21%.
The 2017 Act includes several provisions that are effective for our fiscal 2019: (i) tax on global intangible low-taxed income (GILTI) of foreign subsidiaries, (ii) tax on certain payments between a U.S. corporation and its foreign subsidiaries referred to as the base erosion and anti-abuse tax (BEAT), (iii) limitation on the tax deduction for interest payments, and (iv) expanded limitation on the tax deduction for compensation paid to certain executives.
The 2017 Act was effective in the first quarter of fiscal 2018. During the first quarter of fiscal 2019, we recorded tax benefit of $4.4 million in our financial statements to finalize the tax effects of the 2017 Act pursuant to SAB 118. The Company is no longer asserting that earnings from our foreign subsidiaries are indefinitely reinvested.16
The 2017 Act imposes a new tax on foreign earnings and profits in excess of a deemed return on tangible assets of foreign subsidiaries referred to as GILTI which is effective in fiscal 2019. In accordance with FASB Staff Q&A, Topic 740, No. 5, Accounting for Global Intangible Low-Taxed Income, the Company made an accounting policy election to recognize the tax expense related to GILTI in the year the tax is incurred.THE COOPER COMPANIES, INC. AND SUBSIDIARIES
Notes to Consolidated Condensed Financial Statements
(Unaudited)
Recent Tax Legislation
On March 27, 2020, the Coronavirus Aid, Relief, and Economic Security Act (the CARES Act) was enacted and signed into law in response to the market volatility and instability resulting from the COVID-19 pandemic. It includes a significant number of tax provisions and lifts certain deduction limitations originally imposed by the Tax Cuts and Jobs Act of 2017. The changes are mainly related to: (1) the business interest expense disallowance rules for 2019 and 2020; (2) net operating loss rules; (3) charitable contribution limitations; (4) employee retention credit; and (5) the realization of corporate alternative minimum tax credits.
The Company continues to assess the impact and future implications of these provisions; however, it does not anticipate any amounts that could give rise to a material impact to the overall Consolidated Condensed Financial Statements.
Effective Tax Rate
The Company's income tax provision for the three and six months ended April 30, 2020 and 2019, were as follows:
|
| | | | | | | | | | | | | | | |
Periods Ended April 30,
| Three Months | | Six Months |
| (In millions) | 2020 | | 2019 | | 2020 | | 2019 |
Income tax (benefit) provision
| $ | (2.5 | ) | | $ | 5.7 |
| | $ | 4.4 |
| | $ | (3.6 | ) |
The Company's effective tax rates were an expense of 5.4% and a benefit of 11.5%27.7% and expense of 4.5% for the thirdsecond quarter of fiscal 20192020 and fiscal 2018,2019, respectively and an expense of 0.9%4.2% and 82.1%a benefit of 1.7% for the first ninesix months of fiscal 20192020 and 2018,2019, respectively. The increasedecrease in ourthe effective tax rate for the thirdsecond quarter of fiscal 20192020 compared to fiscal 20182019 was primarily due to the inclusionsignificant drop of earnings from our foreign subsidiaries pursuantactual quarterly PBT (Profit before tax) due to the GILTI provisions that became effective in fiscal 2019.market volatility and instability as a result of the COVID-19 pandemic. The decrease in ourCompany’s effective tax rate for the first ninesix months of fiscal year 2020 was higher than 2019, compared to fiscal 2018 was primarilymainly due to the provisional charge of $196.7 million relating to the 2017 Act that was recorded in fiscal 2018. Our effective tax rate for the first nine months of fiscal 2019 was lower than the U.S. statutory rate because of discrete tax benefits and a favorable mix of income from our foreign jurisdictions with lower tax rates. Total discrete tax benefits for the first nine months of fiscal 2019 were $26.7 million primarily relating to settlement of tax audits, revisions to the provisional tax charges relating to the 2017 Act and excess tax benefits from share-based compensation. Ourcompensation that favorably impacted the 2019 effective tax rate. The Company’s effective tax rate for the first nine monthssecond quarter of fiscal 20182020 was higherlower than the U.S. statutory tax rate becauseas a result of the discrete tax expense relating to the 2017 Act, which was partially offset bybenefits mainly from stock compensation excess tax benefit and a favorable mix of income from our foreign jurisdictions with lowerpreferential tax rates and an excess tax benefit from share-based compensation.
We recognize the benefit from a tax position only if it is more likely than not that the position would be sustained upon audit based solely on the technical merits of the tax position. As of July 31, 2019,April 30, 2020, and October 31, 2018,2019, Cooper had unrecognized tax benefits of $50.7$54.3 million and $68.9$49.7 million, respectively. The decreaseincrease is primarily related to settlingadditions to current and prior year tax audits,period transfer pricing reserves, partially offset by additionsrelease of reserves due to current period transfer pricing reserves.lapse of statute of limitations. It is our policy to recognize interest and penalties directly related to income taxes as additional income tax expense. It is reasonably possible that $8.1$14.5 million of unrecognized tax benefits could be settled during the next twelve months.
The Company is subject to U.S. Federal income tax examinations for fiscal 2015 through 20182019 and the Internal Revenue Service is currently auditing our U.S. Consolidated Corporation Income Tax Returns for fiscal 2015 and 2016. The Company remains subject to income tax examinations in other significant tax jurisdictions including the United Kingdom, Japan, France and Australia for the taxfiscal years 2014 through 2019. The Company is currently under audit in the United Kingdom for fiscal years 2015 through 2018.
THE COOPER COMPANIES, INC. AND SUBSIDIARIES
Notes to Consolidated Condensed Financial Statements
(Unaudited)
Note 8. Earnings Per Share
| | Periods Ended July 31,
| Three Months | | Nine Months | |
Periods Ended April 30,
| | Three Months | | Six Months |
| (In millions, except per share amounts) | 2019 | | 2018 | | 2019 | | 2018 | 2020 | | 2019 | | 2020 | | 2019 |
| Net income | $ | 120.1 |
| | $ | 100.8 |
| | $ | 345.7 |
| | $ | 39.2 |
| $ | 11.5 |
| | $ | 122.4 |
| | $ | 102.0 |
| | $ | 225.5 |
|
| Basic: | | | | | | | | | | | | | | |
| Weighted average common shares | 49.5 |
| | 49.1 |
| | 49.4 |
| | 49.0 |
| 49.2 |
| | 49.4 |
| | 49.2 |
| | 49.3 |
|
| Basic earnings per share | $ | 2.43 |
| | $ | 2.05 |
| | $ | 7.00 |
| | $ | 0.80 |
| $ | 0.23 |
| | $ | 2.48 |
| | $ | 2.07 |
| | $ | 4.57 |
|
| Diluted: | | | | | | | | | | | | | | |
| Weighted average common shares | 49.5 |
| | 49.1 |
| | 49.4 |
| | 49.0 |
| 49.2 |
| | 49.4 |
| | 49.2 |
| | 49.3 |
|
| Effect of potential dilutive shares | 0.6 |
| | 0.6 |
| | 0.6 |
| | 0.6 |
| |
| Effect of dilutive stock options | | 0.4 |
| | 0.6 |
| | 0.5 |
| | 0.6 |
|
| Diluted weighted average common shares | 50.1 |
| | 49.7 |
| | 50.0 |
| | 49.6 |
| 49.6 |
| | 50.0 |
| | 49.7 |
| | 49.9 |
|
| Diluted earnings per share attributable to Cooper stockholders | $ | 2.40 |
| | $ | 2.03 |
| | $ | 6.91 |
| | $ | 0.79 |
| |
| Diluted earnings per share | | $ | 0.23 |
| | $ | 2.45 |
| | $ | 2.05 |
| | $ | 4.52 |
|
THE COOPER COMPANIES, INC. AND SUBSIDIARIES
Notes to Consolidated Condensed Financial Statements
(Unaudited)
The following table sets forth stock options to purchase Cooper’sour common stock and restricted stock units that were not included in the diluted earnings per share calculation because their effect would have been antidilutive for the periods presented:
|
| | | | | | | | | | | | |
Periods Ended July 31,
| Three Months | | Nine Months |
| (In thousands, except exercise prices) | 2019 | | 2018 | | 2019 | | 2018 |
| Number of stock option shares excluded | — |
| | 257 |
| | 198 |
| | 257 |
|
| Range of exercise prices | n/a |
| | $226.30-$230.09 |
| | $ | 254.77 |
| | $226.30-$230.09 |
|
| Numbers of restricted stock units excluded | 18 |
| | 78 |
| | 19 |
| | 78 |
|
|
| | | | | | | | | | | | | |
| Periods Ended April 30, | Three Months | | Six Months |
| (In thousands, except exercise prices) | 2020 | | 2019 | | 2020 | | 2019 |
| Stock option shares excluded | 210 |
| | 198 |
| | 207 |
| | 322 |
|
| Range of exercise prices | $254.77-$304.54 |
| | $ | 254.77 |
| | $ | 304.54 |
| | $226.30-$254.77 |
|
| Restricted stock units excluded | 1 |
| | 25 |
| | 1 |
| | 26 |
|
Note 9. Share-Based Compensation Plans
The Company has several share-based compensation plans that are described in the Company’s Annual Report on Form 10‑K for the fiscal year ended October 31, 2018.2019. The compensation expense and related income tax benefit recognized in our Consolidated Condensed Statements of Income and Comprehensive Income for share-based awards were as follows:
| | Periods Ended July 31,
| Three Months | | Nine Months | |
Periods Ended April 30,
| | Three Months | | Six Months |
| (In millions) | 2019 | | 2018 | | 2019 | | 2018 | 2020 | | 2019 | | 2020 | | 2019 |
| Selling, general and administrative expense | $ | 6.8 |
| | $ | 6.7 |
| | $ | 22.1 |
| | $ | 30.3 |
| $ | 8.3 |
| | $ | 6.1 |
| | $ | 17.0 |
| | $ | 15.3 |
|
| Cost of sales | 1.0 |
| | 0.9 |
| | 3.9 |
| | 2.6 |
| 1.1 |
| | 1.4 |
| | 2.1 |
| | 2.9 |
|
| Research and development expense | 0.5 |
| | 0.5 |
| | 2.4 |
| | 1.6 |
| 0.6 |
| | 0.9 |
| | 1.2 |
| | 1.9 |
|
| Total share-based compensation expense | $ | 8.3 |
| | $ | 8.1 |
| | $ | 28.4 |
| | $ | 34.5 |
| $ | 10.0 |
| | $ | 8.4 |
| | $ | 20.3 |
| | $ | 20.1 |
|
| Related income tax benefit | $ | 1.1 |
| | $ | 1.5 |
| | $ | 4.0 |
| | $ | 7.1 |
| $ | 1.1 |
| | $ | 1.1 |
| | $ | 2.5 |
| | $ | 2.9 |
|
Employee Stock Purchase Plan
On March 18 2019, the Company received stockholder approval for the Employee Stock Purchase Plan (“ESPP”). The first offering period is for U.S. employees and is expected to begin on November 4, 2019. The purpose of the ESPP is to provide eligible employees of the Company with the opportunity to acquire shares of common stock at 85% of the market price on the last business day of each offering period by means of accumulated payroll deductions. Payroll deductions will be limited to maximum of 15% of the employee’s eligible compensation, not to exceed $21.3 thousand in any one calendar year. The ESPP would initially authorize the issuance of 1,000,000 shares of common stock. These shares will be made available from shares of common stock reacquired by the Company as Treasury Stock. At July 31, 2019, there were approximately 3.6 million shares of Treasury Stock.
THE COOPER COMPANIES, INC. AND SUBSIDIARIES
Notes to Consolidated Condensed Financial Statements
(Unaudited)
Note 10. Stockholders’ Equity
Analysis of Changes in Accumulated Other Comprehensive (Loss) Income:
|
| | | | | | | | | | | |
| (In millions) | Foreign Currency Translation Adjustment | | Minimum Pension Liability | | Total |
| Balance at October 31, 2017 | $ | (353.7 | ) | | $ | (21.6 | ) | | $ | (375.3 | ) |
| Gross change in value during the year ended October 31, 2018 | (58.5 | ) | | 11.0 |
| | (47.5 | ) |
| Tax effect for the period | — |
| | (3.1 | ) | | (3.1 | ) |
ASU 2018-02 adoption(1) | — |
| | (4.8 | ) | | (4.8 | ) |
| Balance at October 31, 2018 | $ | (412.2 | ) | | $ | (18.5 | ) | | $ | (430.7 | ) |
| Gross change in value during the nine months ended July 31, 2019 | (51.1 | ) | | — |
| | (51.1 | ) |
| Balance at July 31, 2019 | $ | (463.3 | ) | | $ | (18.5 | ) | | $ | (481.8 | ) |
|
| | | | | | | | | | | | | | | |
| (In millions) | Foreign Currency Translation Adjustment | | Minimum Pension Liability | | Derivative Instruments | | Total |
| Balance at October 31, 2018 | $ | (412.2 | ) | | $ | (18.5 | ) | | $ | — |
| | $ | (430.7 | ) |
| Gross change in value | 9.0 |
| | (33.4 | ) | | — |
| | (24.4 | ) |
| Tax effect for the period | — |
| | 8.0 |
| | — |
| | 8.0 |
|
| Balance at October 31, 2019 | $ | (403.2 | ) | | $ | (43.9 | ) | | $ | — |
| | $ | (447.1 | ) |
| Gross change in value | (52.2 | ) | | — |
| | (17.8 | ) | | (70.0 | ) |
| Tax effect for the period | $ | — |
| | $ | — |
| | $ | 4.3 |
| | $ | 4.3 |
|
| Balance at April 30, 2020 | $ | (455.4 | ) | | $ | (43.9 | ) | | $ | (13.5 | ) | | $ | (512.8 | ) |
| |
(1)
| Represents reclassification to retained earnings from adoption of ASU 2018-02. Refer to our Annual Report on Form 10-K for the fiscal year ended October 31, 2018 for more details. |
THE COOPER COMPANIES, INC. AND SUBSIDIARIES
Notes to Consolidated Condensed Financial Statements
(Unaudited)
Share Repurchases
In December 2011, our Board of Directors authorized the 2012 Share Repurchase Program and through subsequent amendments, the most recent in March 2017, the total repurchase authorization was increased from $500.0 million to $1.0 billion of the Company's common stock. This program has no expiration date and may be discontinued at any time. Purchases under the 2012 Share Repurchase Program are subject to a review of the circumstances in place at the time and may be made from time to time as permitted by securities laws and other legal requirements.
We did 0t repurchase shares in the third and second quarters of fiscal 2019. During the firstsecond quarter of fiscal 2019,2020, we repurchased 24.5160.8 thousand shares of the Company's common stock for $6.1$47.8 million, at an average purchase price of $248.70$296.88 per share. We did 0tThere was 0 share repurchase sharesactivity during the first quarter of fiscal 2020. During the fiscal year ended October 31, 2018.2019, we repurchased 537.0 thousand shares of our common stock for $156.1 million under the 2012 Share Repurchase Program. At July 31, 2019, $557.4April 30, 2020, $359.7 million remainsremained authorized for repurchase under the program.
Dividends
We paid a semiannual dividend of approximately $1.5 million or 3 cents per share, on February 8, 2019,10, 2020, to stockholders of record on January 22, 2019. We paid another semiannual dividend of approximately $1.5 million or 3 cents per share on August 7, 2019, to stockholders of record on July 23, 2019.2020.
Note 11. Fair Value Measurements
Accounting standards define fair value as the price that would be received to sell an asset or paid to transfer a liability in an orderly transaction between market participants at the measurement date. The fair value hierarchy prioritizes the inputs to valuation techniques used to measure fair value. An asset’s or liability’s level is based on the lowest level of input that is significant to the fair value measurement. Assets and liabilities carried at fair value are valued and disclosed in one of the following three levels of the valuation hierarchy:
Level 1: Quoted market prices in active markets for identical assets or liabilities.
Level 2: Observable market-based inputs or unobservable inputs that are corroborated by market data.
Level 3: Unobservable inputs reflecting the reporting entity’s own assumptions.
At July 31, 2019April 30, 2020 and October 31, 2018,2019, the carrying value of cash and cash equivalents, accounts receivable, prepaid expense and other current assets, lines of credit, accounts payable and other current liabilities approximate fair value due to the short-term nature of such instruments and the ability to obtain financing on similar terms.
The carrying value of our revolving credit facility and term loans approximates fair value estimated based on current market rates (Level 2). On April 6, 2020 the Company entered into 6 interest rate swap contracts which are used to hedge the Company’s exposure to changes in cash flows associated with its variable rate term loans and are designated as a derivative in a cash flow hedge. The payment streams are based on a total notional amount of $1.5 billion at the inception of the contracts. The interest rate swap contracts have maturities of seven years or less.
THE COOPER COMPANIES, INC. AND SUBSIDIARIES
Notes to Consolidated Condensed Financial Statements
(Unaudited)
There was no ineffectiveness related to the interest rate swap contracts. The gain or loss on the derivative is recorded as a component of accumulated other comprehensive income and subsequently reclassified into interest expense in the same period during which the hedged transaction affects earnings.
The fair value of the interest rate swap contracts are measured on a recurring basis by netting the discounted future fixed cash payments and the discounted expected variable cash receipts. The variable cash receipts are based on the expectation of future interest rates (forward curves) derived from observable market interest rate curves. The interest rate swap contracts were categorized as Level 2 in the fair value hierarchy, as the inputs to the derivative pricing model are generally observable and do not contain a high level of subjectivity. Refer to Note 15. Financial Derivatives and Hedging for further information.
The Company did 0t have any derivative assets or liabilities that may includeincluding interest rate swaps, cross currency swaps or foreign currency forward contracts as of July 31, 2019 and October 31, 2018.2019.
Nonrecurring fair value measurements
The Company uses fair value measures when determining assets and liabilities acquired in an acquisition as described in Note 3. Acquisitions which are considered a Level 3 measurement. The Company also used fair value measures to allocate goodwill upon the split of our reporting units as discussed in Note 5. Intangible Assets which was considered a Level 3 measurement.
Note 12. Employee Benefits
Cooper’s Retirement Income Plan (the Plan), a defined benefit plan, covers substantially all full-time United States employees. OurCooper's contributions are designed to fund normal cost on a current basis and to fund the estimated prior service cost of benefit improvements. The unit credit actuarial cost method is used to determine the annual cost. Cooper pays the entire cost of the Plan and funds such costs as they accrue. Virtually all of the assets of the Plan are comprised of equities and participation in equity and fixed income funds.
THE COOPER COMPANIES, INC. AND SUBSIDIARIES
Notes to Consolidated Condensed Financial Statements
(Unaudited)
Our results of operations for the three and ninesix months ended July 31,April 30, 2020 and 2019, and 2018, reflect the following components of net periodic defined benefit costs:
| | Periods Ended July 31,
| Three Months | | Nine Months | |
Periods Ended April 30,
| | Three Months | | Six Months |
| (In millions) | 2019 | | 2018 | | 2019 | | 2018 | 2020 | | 2019 | | 2020 | | 2019 |
| Service cost | $ | 2.2 |
| | $ | 2.7 |
| | $ | 7.6 |
| | $ | 8.1 |
| $ | 3.4 |
| | $ | 2.7 |
| | $ | 6.9 |
| | $ | 5.4 |
|
| Interest cost | 2.1 |
| | 1.3 |
| | 4.6 |
| | 3.8 |
| 1.4 |
| | 1.3 |
| | 2.6 |
| | 2.5 |
|
| Expected return on plan assets | (2.8 | ) | | (2.3 | ) | | (7.4 | ) | | (6.9 | ) | (2.7 | ) | | (2.3 | ) | | (5.4 | ) | | (4.6 | ) |
| Recognized net actuarial loss | (0.2 | ) | | 0.4 |
| | 0.6 |
| | 1.2 |
| 1.0 |
| | 0.4 |
| | 2.0 |
| | 0.8 |
|
| Net periodic pension cost | $ | 1.3 |
| | $ | 2.1 |
| | $ | 5.4 |
| | $ | 6.2 |
| |
Net periodic defined benefit plan cost | | $ | 3.1 |
| | $ | 2.1 |
| | $ | 6.1 |
| | $ | 4.1 |
|
We did 0t contribute to the Plan in the first half of fiscal 2020 and due to COVID-19 we are uncertain of the amount we will contribute during the remainder of the year. We contributed $5.0$2.5 million to the Plan in the first nine monthshalf of fiscal 2019 and 2018.2019. The expected rate of return on Plan assets for determining net periodic benefit plan cost is 8%.
Retirement Income Plan Soft Freeze
On June 18, 2019 the Board of Directors of the Company approved a soft freeze of the Plan effective August 1, 2019. The Plan was closed to employees hired on or after August 1, 2019, including former participants or employees rehired on or after August 1, 2019 and employees hired in connection with a stock or asset acquisition, merger or other similar transaction on or after August 1, 2019. Existing employees already covered by the Plan, continue to accrue their benefits. There is no material impact on the Company's results of operations, financial position and cash flows for the three and nine months ended July 31, 2019.
Note 13. Contingencies
Since March 2015, over 50 putative class action complaints were filed by contact lens consumers alleging that contact lens manufacturers, in conjunction with their respective Unilateral Pricing Policy (UPP), conspired to reach agreements between each other and certain distributors and retailers regarding the prices at which certain contact lenses could be sold to consumers. The plaintiffs are seeking damages against CooperVision, Inc., other contact lens manufacturers, distributors and retailers, in various courts around the United States. In June 2015, all of the class action cases were consolidated and transferred to the United States District Court for the Middle District of Florida. In August 2017, CooperVision entered into a settlement agreement with the plaintiffs, without any admission of liability, to settle all claims against CooperVision. In July 2018, the Court approved the plaintiffs’ motion for preliminary approval of the settlement, and the Company paid the $3.0 million settlement amount into an escrow account. TheIn March 2020, the Court issued an order providing final approval of the settlement remains subject to final Court approval at a future hearing to be set byand dismissing CooperVision from the Court.class action.
The Company is involved in various lawsuits, claims and other legal matters from time to time that arise in the ordinary course of conducting business, including matters involving our products, intellectual property, supplier relationships,
THE COOPER COMPANIES, INC. AND SUBSIDIARIES
Notes to Consolidated Condensed Financial Statements
(Unaudited)
distributors, competitor relationships, employees and other matters. The Company does not believe that the ultimate resolution of these proceedings or claims pending against it could have a material adverse effect on its financial condition or results of operations. At each reporting period, the Company evaluates whether or not a potential loss amount or a potential range of loss is probable and reasonably estimable under ASC 450, Contingencies. Legal fees are expensed as incurred.
Note 14. Business Segment Information
The Company discloses information about its operating segments, which were established based on the way that management organizes segments within the Company for making operating decisions and assessing financial performance. The Company's 2 operating segments are described below.
| |
| • | CooperVision. Competes in the worldwide contact lens market by developing, manufacturing and marketing a broad range of products for contact lens wearers, featuring advanced materials and optics. CooperVision designs its products to solve vision challenges such as astigmatism, presbyopia, myopia, ocular dryness and eye fatigues, with a broad collection of spherical, toric and multifocal contact lenses. |
| |
| • | CooperSurgical. Competes in the general health care market with a focus on advancing the health of women, babies and families through a diversified portfolio of products and services focusing on women's health, fertility, diagnostics and contraception. |
Cooper uses operating income, as presented in our financial reports, as the primary measure of segment profitability. We do not allocate costs from corporate functions to segment operating income. Items below operating income are not considered when measuring the profitability of a segment. We use the same accounting policies to generate segment results as we do for our consolidated results.
Total identifiable assets are those used in continuing operations except cash and cash equivalents, which we include as corporate assets.
Segment information:
|
| | | | | | | | | | | | | | | |
Periods Ended April 30,
| Three Months | | Six Months |
| (In millions) | 2020 | | 2019 | | 2020 | | 2019 |
| CooperVision net sales by category: | | | | | | | |
| Toric lens | $ | 133.6 |
| | $ | 155.3 |
| | $ | 288.7 |
| | $ | 301.3 |
|
| Multifocal lens | 45.1 |
| | 49.7 |
| | 96.9 |
| | 98.7 |
|
| Single-use sphere lens | 116.1 |
| | 135.3 |
| | 254.2 |
| | 267.3 |
|
| Non single-use sphere, other | 107.4 |
| | 143.9 |
| | 247.6 |
| | 287.0 |
|
| Total CooperVision net sales | $ | 402.2 |
| | $ | 484.2 |
| | 887.4 |
| | 954.3 |
|
| CooperSurgical net sales by category: | | | | | | | |
| Office and surgical products | 69.6 |
| | 105.7 |
| | 168.0 |
| | 201.4 |
|
| Fertility | 53.1 |
| | 64.4 |
| | 115.7 |
| | 126.7 |
|
| CooperSurgical net sales | 122.7 |
| | 170.1 |
| | 283.7 |
| | 328.1 |
|
| Total net sales | $ | 524.9 |
| | $ | 654.3 |
| | $ | 1,171.1 |
| | $ | 1,282.4 |
|
| Operating income: | | | | | | | |
| CooperVision | $ | 67.7 |
| | $ | 125.5 |
| | $ | 190.6 |
| | $ | 241.7 |
|
| CooperSurgical | (25.6 | ) | | 31.1 |
| | (23.9 | ) | | 38.3 |
|
| Corporate | (13.5 | ) | | (9.7 | ) | | (27.0 | ) | | (22.2 | ) |
| Total operating income | 28.6 |
| | 146.9 |
| | 139.7 |
| | 257.8 |
|
| Interest expense | 12.8 |
| | 18.5 |
| | 24.4 |
| | 36.6 |
|
| Other expense (income), net | 6.8 |
| | 0.3 |
| | 8.9 |
| | (0.7 | ) |
| Income before income taxes | $ | 9.0 |
| | $ | 128.1 |
| | $ | 106.4 |
| | $ | 221.9 |
|
THE COOPER COMPANIES, INC. AND SUBSIDIARIES
Notes to Consolidated Condensed Financial Statements
(Unaudited)
Segment information:
|
| | | | | | | | | | | | | | | |
Periods Ended July 31,
| Three Months | | Nine Months |
| (In millions) | 2019 | | 2018 | | 2019 | | 2018 |
| CooperVision net sales by category: | | | | | | | |
| Toric lens | $ | 163.1 |
| | $ | 153.6 |
| | $ | 464.4 |
| | $ | 442.2 |
|
| Multifocal lens | 52.4 |
| | 52.7 |
| | 151.1 |
| | 148.8 |
|
| Single-use sphere lens | 146.3 |
| | 137.6 |
| | 413.6 |
| | 378.3 |
|
| Non single-use sphere and other | 147.3 |
| | 145.2 |
| | 434.2 |
| | 432.1 |
|
| Total CooperVision net sales | 509.1 |
| | 489.1 |
| | 1,463.3 |
| | 1,401.4 |
|
| CooperSurgical net sales by category: | | | | | | | |
| Office and surgical products | 106.3 |
| | 104.4 |
| | 307.7 |
| | 290.4 |
|
| Fertility | 64.0 |
| | 66.5 |
| | 190.8 |
| | 189.5 |
|
| CooperSurgical net sales | 170.3 |
| | 170.9 |
| | 498.5 |
| | 479.9 |
|
| Total net sales | $ | 679.4 |
| | $ | 660.0 |
| | $ | 1,961.8 |
| | $ | 1,881.3 |
|
| Operating income (loss): | | | | | | | |
| CooperVision | $ | 134.2 |
| | $ | 125.4 |
| | $ | 375.9 |
| | $ | 361.1 |
|
| CooperSurgical | 20.6 |
| | 1.6 |
| | 59.0 |
| | (37.5 | ) |
| Corporate | (12.6 | ) | | (11.4 | ) | | (34.8 | ) | | (43.2 | ) |
| Total operating income | 142.2 |
| | 115.6 |
| | 400.1 |
| | 280.4 |
|
| Interest expense | 16.7 |
| | 22.8 |
| | 53.3 |
| | 59.9 |
|
| Other (income) expense, net | (1.5 | ) | | 2.4 |
| | (2.1 | ) | | 1.3 |
|
| Income before income taxes | $ | 127.0 |
| | $ | 90.4 |
| | $ | 348.9 |
| | $ | 219.2 |
|
| | | (In millions) [to update] | July 31, 2019 | | October 31, 2018 | |
| (In millions) | | April 30, 2020 | | October 31, 2019 |
| Total identifiable assets: | | | | | | |
| CooperVision | $ | 3,801.3 |
| | $ | 3,746.0 |
| $ | 4,140.3 |
| | $ | 3,911.6 |
|
| CooperSurgical | 2,184.4 |
| | 2,201.7 |
| 2,207.4 |
| | 2,189.8 |
|
| Corporate | 187.1 |
| | 165.1 |
| 162.2 |
| | 173.1 |
|
| Total | $ | 6,172.8 |
| | $ | 6,112.8 |
| $ | 6,510.0 |
| | $ | 6,274.5 |
|
Geographic information:
| | Periods Ended July 31,
| Three Months | | Nine Months | |
Periods Ended April 30,
| | Three Months | | Six Months |
| (In millions) | 2019 | | 2018 | | 2019 | | 2018 | 2020 | | 2019 | | 2020 | | 2019 |
| Net sales to unaffiliated customers by country of domicile: | | | | | | | | | | | | | | |
| United States | $ | 306.2 |
| | $ | 302.1 |
| | $ | 891.1 |
| | $ | 856.8 |
| $ | 222.5 |
| | $ | 305.9 |
| | $ | 516.0 |
| | $ | 584.9 |
|
| Europe | 222.7 |
| | 224.0 |
| | 642.0 |
| | 637.8 |
| 178.8 |
| | 209.5 |
| | 392.1 |
| | 419.2 |
|
| Rest of world | 150.5 |
| | 133.9 |
| | 428.7 |
| | 386.7 |
| 123.7 |
| | 138.9 |
| | 263.0 |
| | 278.3 |
|
| Total | $ | 679.4 |
| | $ | 660.0 |
| | $ | 1,961.8 |
| | $ | 1,881.3 |
| $ | 524.9 |
| | $ | 654.3 |
| | $ | 1,171.1 |
| | $ | 1,282.4 |
|
|
| | | | | | | |
| (In millions) | April 30, 2020 | | October 31, 2019 |
| Net property, plant and equipment by country of domicile: | | | |
| United States | $ | 674.4 |
| | $ | 626.5 |
|
| Europe | 354.3 |
| | 358.8 |
|
| Rest of world | 167.3 |
| | 146.8 |
|
| Total | $ | 1,196.1 |
| | $ | 1,132.1 |
|
THE COOPER COMPANIES, INC. AND SUBSIDIARIES
Notes to Consolidated Condensed Financial Statements
(Unaudited)
Note 15. Financial Derivatives and Hedging
As part of the Company’s overall risk management practices the Company enters into financial derivatives, interest rate swaps designated as cash flow hedges, to hedge the floating interest rate on its debt.
The Company records all derivatives on the consolidated balance sheets at fair value. The accounting for changes in the fair value of derivatives depends on the intended use of the derivative, whether the Company has elected to designate a derivative in a hedging relationship and apply hedge accounting, and whether the hedging relationship has satisfied the criteria necessary to apply hedge accounting. All of the Company's derivatives have satisfied the criteria necessary to apply hedge accounting.
The gain or loss on derivative instruments designated and qualifying for cash flow hedge accounting is deferred in other comprehensive income. The changes in fair value for all trades that are not designated for hedge accounting are recognized in current period earnings. Deferred gains or losses from designated cash flow hedges are reclassified into earnings in the period that the hedged interest expense affects earnings. The effectiveness of cash flow hedges is assessed at inception and quarterly thereafter. The Company does not offset fair value amounts recognized for derivative instruments in its balance sheet for presentation purposes.
Credit risk related to derivative transactions reflects the risk that a party to the transaction could fail to meet its obligation under the derivative contracts. Therefore, the Company’s exposure to the counterparty’s credit risk is generally limited to the amounts, if any, by which the counterparty’s obligations to the Company exceed the Company’s obligations to the counterparty. The Company’s policy is to enter into contracts only with financial institutions which meet certain minimum credit ratings to help mitigate counterparty credit risk.
As of April 30, 2020, the Company had the following outstanding derivatives designated as hedging instruments:
|
| | | | | | |
| (In millions, except for number of instruments) | Number of Instruments | | Notional Value |
Interest Rate Swap Contracts
| 6 |
| | $ | 1,500 |
|
These contracts have maturities of seven years or less.
The pre-tax impact of loss on derivatives designated for hedge accounting recognized in other comprehensive income (loss) was $17.8 million ($13.5 million, net of tax) as of April 30, 2020. The Company did 0t reclassify any amount from accumulated other comprehensive income (loss) during the three and six months ended April 30, 2020.
The Company did not have any derivatives designated as hedging instruments for the period ended April 30, 2019.
The Company expects that $6.8 million recorded as a component of accumulated other comprehensive income (loss) will be realized in the statements of earnings over the next twelve months and the amount will vary depending on prevailing interest rates.
The following table summarizes the fair values of derivative instruments as of the periods indicated and the line items in the accompanying consolidated balance sheets where the instruments are recorded:
|
| | | | | | | | | | |
| | | Derivative Liabilities |
| (In millions) | | | | April 30, 2020 | | April 30, 2019 |
| Derivatives designated as cash flow hedges | | Balance sheet location | | | | |
| Interest rate swap contracts | | Other current liabilities | | $ | 0.8 |
| | $ | — |
|
| Interest rate swap contracts | | Other non-current liabilities | | 17.0 |
| | — |
|
| | | | | $ | 17.8 |
| | $ | — |
|
|
| | | | | | | |
| (In millions) | July 31, 2019 | | October 31, 2018 |
| Net property, plant and equipment by country of domicile: | | | |
| United States | $ | 589.7 |
| | $ | 516.7 |
|
| Europe | 339.7 |
| | 340.7 |
|
| Rest of world | 136.0 |
| | 118.6 |
|
| Total | $ | 1,065.4 |
| | $ | 976.0 |
|
THE COOPER COMPANIES, INC. AND SUBSIDIARIES
Item 2. Management’s Discussion and Analysis of Financial Condition
and Results of Operations
Note numbers refer to “Notes to Consolidated Condensed Financial Statements” in Item 1. Unaudited Financial Statements.
Forward-Looking Statements
This Quarterly Report on Form 10-Q contains “forward-looking statements” within the meaning of Section 27A of the Securities Act of 1933, Section 21E of the Securities Exchange Act of 1934 and the Private Securities Litigation Reform Act of 1995. These include statements relating to plans, prospects, goals, strategies, future actions, events or performance and other statements which are other than statements of historical fact, including all statements regarding the expected impact of the ongoing COVID-19 pandemic on our business; and statements regarding acquisitions including the acquired companies' financial position, market position, product development and business strategy, expected cost synergies, expected timing and benefits of the transaction, difficulties in integrating entities or operations, as well as estimates of our and the acquired entities' future expenses, sales and earnings per share are forward-looking. In addition, all statements regarding anticipated growth in our revenue, anticipated effects of any product recalls, anticipated market conditions, planned product launches and expected results of operations and integration of any acquisition are forward-looking. To identify these statements, look for words like “believes,” “outlook,” “probable,” “expects,” “may,” “will,” “should,” “could,” “seeks,” “intends,” “plans,” “estimates” or “anticipates” and similar words or phrases. Forward-looking statements necessarily depend on assumptions, data or methods that may be incorrect or imprecise and are subject to risks and uncertainties. Among the factors that could cause our actual results and future actions to differ materially from those described in forward-looking statements are:
The effects of the ongoing COVID-19 pandemic and related economic disruptions and new governmental regulations on our business, results of operations, cash flow and financial condition, including but not limited to the potential impact on our sales, operations and supply chain.
Adverse changes in the global or regional general business, political and economic conditions, including the impact of continuing uncertainty and instability of certain countries, that could adversely affect our global markets, and the potential adverse economic impact and related uncertainty caused by these items, including but not limited to, the ongoing COVID-19 pandemic, and escalating global trade barriers including additional tariffs, by countries such as China.
Adverse changes in global political and economic conditions, and related uncertainty caused by the United Kingdom’s election to withdrawwithdrawal from the European Union and its potential impact on, among other things, the movement of goods and materials in our supply chain, additional regulatory approvals and requirements, and increased tariffs and duties.
Adverse changes in the global or regional general business, political and economic conditions, including the impact of continuing uncertainty and instability of certain countries, such as China, that could adversely affect our global markets, and the potential adverse economic impact and related uncertainty caused by these items, including but not limited to, escalating global trade barriers including additional tariffs.
Foreign currency exchange rate and interest rate fluctuations including the risk of fluctuations in the value of foreign currencies or interest rates that would decrease our revenues and earnings.
Changes in tax laws or their interpretation and changes in statutory tax rates, including but not limited to, the U.S., the United Kingdom and other countries may affect our taxation of earnings recognized in foreign jurisdictions and/or negatively impact our effective tax rate.
Foreign currency exchange rate and interest rate fluctuations including the risk of fluctuations in the value of foreign currencies or interest rates that would decrease our revenues and earnings.
Our existing and future variable rate indebtedness and associated interest expense most of which is variable and impacted by rate increases, which could adversely affect our financial health or limit our ability to borrow additional funds.
Acquisition-related adverse effects including the failure to successfully obtain the anticipated revenues, margins and earnings benefits of acquisitions, integration delays or costs and the requirement to record significant adjustments to the preliminary fair value of assets acquired and liabilities assumed within the measurement period, required regulatory approvals for an acquisition not being obtained or being delayed or subject to conditions that are not anticipated, adverse impacts of changes to accounting controls and reporting procedures, contingent liabilities or indemnification obligations, increased leverage and lack of access to available financing (including financing for the acquisition or refinancing of debt owed by us on a timely basis and on reasonable terms).
Compliance costs and potential liability in connection with U.S. and foreign laws and health care regulations pertaining to privacy and security of third- party information, such as HIPAA and the California Consumer Privacy
THE COOPER COMPANIES, INC. AND SUBSIDIARIES
Item 2. Management’s Discussion and Analysis of Financial Condition
and Results of Operations
Act in the U.S. and the General Data Protection Regulation requirements in Europe, including but not limited to those resulting from data security breaches.
A major disruption in the operations of our manufacturing, accounting and financial reporting, research and development, distribution facilities or raw material supply chain due to the ongoing COVID-19 pandemic, integration of acquisitions, man-made or natural disasters, cybersecurity incidents or other causes.
THE COOPER COMPANIES, INC. AND SUBSIDIARIES
Item 2. Management’s Discussion and Analysis of Financial Condition
and Results of Operations
A major disruption in the operations of our manufacturing, accounting and financial reporting, research and development or distribution facilities due to technological problems, including any related to our information systems maintenance, enhancements or new system deployments, integrations or upgrades.
Market consolidation of large customers globally through mergers or acquisitions resulting in a larger proportion or concentration of our business being derived from fewer customers.
Disruptions in supplies of raw materials, particularly components used to manufacture our silicone hydrogel lenses.
New U.S. and foreign government laws and regulations, and changes in existing laws, regulations and enforcement guidance, which affect areas of our operations including, but not limited to, those affecting the health care industry, including the contact lens industry specifically and the medical device or pharmaceutical industries generally.generally, including but not limited to the EU Medical Devices Regulation (MDR), the EU In Vitro Diagnostic Medical Devices Regulation (IVDR), and the medical device excise tax under the U.S. Affordable Care Act.
Legal costs, insurance expenses, settlement costs and the risk of an adverse decision, prohibitive injunction or settlement related to product liability, patent infringement or other litigation.
Limitations on sales following product introductions due to poor market acceptance.
New competitors, product innovations or technologies, including but not limited to, technological advances by competitors, new products and patents attained by competitors, and competitors' expansion through acquisitions.
Reduced sales, loss of customers and costs and expenses related to product recalls and warning letters.
Failure to receive, or delays in receiving, regulatory approvals for products.
Failure of our customers and end users to obtain adequate coverage and reimbursement from third-party payors for our products and services.
The requirement to provide for a significant liability or to write off, or accelerate depreciation on, a significant asset, including goodwill, other intangible assets and idle manufacturing facilities and equipment.
The success of our research and development activities and other start-up projects.
Dilution to earnings per share from acquisitions or issuing stock.
Impact and costs incurred from changes in accounting standards and policies.
Environmental risks, including increasing environmental legislation and the broader impacts of climate change.
Other events described in our Securities and Exchange Commission filings, including the “Business” and “Risk Factors” sections in our Annual Report on Form 10-K for the fiscal year ended October 31, 2018,2019, as such Risk Factors may be updated in quarterly filings.filings including updates made in this filing.
We caution investors that forward-looking statements reflect our analysis only on their stated date. We disclaim any intent to update them except as required by law.
THE COOPER COMPANIES, INC. AND SUBSIDIARIES
Item 2. Management’s Discussion and Analysis of Financial Condition
and Results of Operations
Results of Operations
In this section, we discuss the results of our operations for the thirdsecond quarter of fiscal 20192020 ended July 31, 2019April 30, 2020 and the ninesix months then ended and compare them with the same periods of fiscal 2018.2019. We discuss our cash flows and current financial condition under “Capital Resources and Liquidity.” Within the tables presented, percentages are calculated based on the underlying whole-dollar amounts and, therefore, may not recalculate exactly from the rounded numbers used for disclosure purposes.
Third Quarter HighlightsNon-GAAP Financial Measures
Gross profit $450.7 million, up 6% from $426.8 million
The succeeding sections of Management’s Discussion and Analysis (MD&A) may include certain financial measures that are not defined by accounting principles generally accepted in the prior year periodUnited States of America (U.S. GAAP). These measures, which are referred to as non-GAAP measures, are listed below:
| |
| • | Free Cash Flow - Free cash flow is calculated as net cash provided by operating activities less capital expenditures. |
| |
| • | Constant currency - Constant currency is defined as excluding the effect of foreign currency fluctuations. |
Operating income $142.2 million, up 23% from $115.6 millionFor a discussion of these measures and the reasons management believes they are useful to investors, refer to “Summary of Non-GAAP Financial Measures” below. To the extent applicable, this MD&A includes reconciliations of these non-GAAP measures to the most directly comparable financial measures calculated and presented in the prior year period
Diluted earnings per share of $2.40, up 18% from $2.03 per share in the prior year period
Cash provided by operations $ 196.7 million, compared to $235.3 million in the prior year period.accordance with U.S. GAAP.
Nine Months HighlightsThe presentation of these non-GAAP financial measures is not intended to be a substitute for, or superior to, the financial information prepared and presented in accordance with GAAP and may be different from non-GAAP financial measures used by other companies, and therefore, may not be comparable among companies.
Gross profit $1,301.8 million, up 8% from $1,202.2 million in
COVID-19 Considerations
The World Health Organization has categorized the prior year periodCoronavirus disease 2019 ("COVID-19") as a pandemic. The COVID-19 pandemic has caused a severe global health crisis, along with economic and societal disruptions and uncertainties, which have negatively impacted business and healthcare activity globally. As a result of healthcare systems responding to the demands of managing the pandemic, governments around the world imposing measures designed to reduce the transmission of the COVID-19 virus, and individuals responding to the concerns of contracting the COVID-19 virus, many of our optical retailer, hospital, medical office and fertility clinic customers have closed their facilities, restricted access, or delayed or cancelled patient visits, exams and elective medical procedures. This has had, and we believe will continue to have, an adverse effect on our sales, operating results and cash flows.
Operating income $400.1 million, up 43% from $280.4 million in the prior year period
Diluted earnings per share
Cash provided by operations $513.3 million, compared to $432.3 million in the prior year period.Contents
THE COOPER COMPANIES, INC. AND SUBSIDIARIES
Item 2. Management’s Discussion and Analysis of Financial Condition
and Results of Operations
We have taken an active role in addressing the ongoing pandemic’s impact on our employees, suppliers, distribution channels, operations and customers, including taking precautionary measures, such as implementing contingency plans, and making operational adjustments as necessary. In most locations, employees not directly involved in manufacturing and distribution are working remotely. We have taken measures to ensure the safety of our essential personnel in our manufacturing and distribution centers, and we have endeavored and continue to follow recommended actions of government and health authorities to protect our employees worldwide.
As of the date of this filing, we have not experienced any significant disruption in our manufacturing facilities. We had no significant disruption in our access to necessary raw materials and other supplies or with our distribution network; however, we have experienced higher unabsorbed fixed overhead costs, labor inefficiencies, higher cost of production and higher freight charges as a result of COVID-19. Our manufacturing and distribution operations have responded to the impacts related to COVID-19, and we have been able to continue to supply our products around the world without interruption. In the future, we may decide or need to implement additional precautionary measures or operational adjustments as we deem prudent to meet consumer demand or to help further ensure employee safety. We believe that the actions we are taking have enabled us to keep our employees safe and our supply chain intact and will help us emerge from this global pandemic operationally sound and well positioned for long-term growth.
The extent to which the global COVID-19 pandemic and related economic disruptions impact our business, results of operations, cash flow and financial condition will depend on future developments. At this time, future developments are highly uncertain, difficult to predict and largely outside of our control. These include, but are not limited to, the spread, duration and severity of the pandemic outbreak and any subsequent waves of additional outbreaks, actions taken by governments to contain the pandemic, address its impact or respond to the reduction in global and local economic activity, and how quickly and to what extent normal economic and operating conditions can resume. We have and will continue to closely monitor the developments relating to the COVID-19 pandemic and the responses from governments and private sector participants and their respective impacts on our Company and on our customers, suppliers, vendors and business partners.
For more information on the risks associated with the COVID-19 pandemic, refer to Part II, Item 1A, "Risk Factors" herein.
Second Quarter Highlights
Gross profit $323.5 million, down 25% from $432.6 million in the prior year period, primarily due to the negative impact of COVID-19 on revenue
Operating income $28.6 million down 81% from $146.9 million in the prior year period
Diluted earnings per share of $0.23, down 91% from $2.45 per share in the prior year period
Cash provided by operations $25.8 million, compared to $214.8 in the prior year period.
Six Months Highlights
Gross profit $750.0 million, down 12% from $851.1 million in the prior year period, primarily due to negative impact of COVID-19 on revenue
Operating income $139.7 million, down 46% from $257.8 million in the prior year period
Diluted earnings per share of $2.05, down 55% from $4.52 per share in the prior year period
Cash provided by operations $155.5 million, compared to $316.6 million in the prior year period.
Outlook
Overall, we remain optimistic about the long-term prospects for the worldwide contact lens and general health care markets. However, the impact, risks and uncertainty relating to the global COVID-19 pandemic and related economic disruptions, as further described in the “COVID-19 Considerations” section above and in the “Risk Factors” section in Part II, Item 1A of this filing, have adversely affected our sales, cash flow and current performance and are likely to further adversely affect our future sales, cash flow and performance. Additionally, other events affecting the economy as a whole, including but not limited to the uncertainty and instability of global markets driven by foreign currency volatility, changes in tax legislation,
THE COOPER COMPANIES, INC. AND SUBSIDIARIES
Item 2. Management’s Discussion and Analysis of Financial Condition
and Results of Operations
debt concerns, the uncertainty caused byduring and after the transition period following the United Kingdom's upcoming withdrawal from the European Union, changes to existing regulations and new regulations, global trade barriers including additional tariffs and the trend of consolidations within the health care industry could impact our current performance and continue to represent a risk to our future performance.
CooperVision - We compete in the worldwide contact lens market with our spherical, toric and multifocal contact lenses offered in a variety of materials including using silicone hydrogel Aquaform® technology and phosphorylcholine technology (PC) Technology™. We believe that there will be lower contact lens wearer dropout rates as technology improves and enhances the wearing experience through a combination of improved designs and materials and the growth of preferred modalities such as single-use and monthly wearing options. Recent acquisitionsCooperVision also expanded CooperVision's access tocompetes in the myopia management and specialty eye care markets with new products such as orthokeratology (ortho-k) and scleral lenses. In November 2019, CooperVision received United States Food & Drug Administration (FDA) approval for its MiSight® 1 day lens, which is the first and only FDA-approved product indicated to slow the progression of myopia in children with treatment initiated between the ages of 8-12 and became available in the United States during fiscal 2020. CooperVision is focused on greater worldwide market penetration using recently introduced products, and we continue to expand our presence in existing and emerging markets, including through acquisitions.
CooperVision acquired the following entity during the ninesix months ended July 31,April 30, 2019:
Blanchard Contact Lenses on December 28, 2018 - a privately-held scleral lens company, which expands CooperVision's specialty and scleral lens portfolio.
CooperVision acquired the following entities during the nine months ended July 31, 2018:
Blueyes on January 4, 2018 - a long-standing distribution partner, which had a leading position in the distribution of contact lenses to the optical and pharmacy sector in Israel
Paragon Vision Sciences on December 1, 2017 - a leading provider of orthokeratology (ortho-k) specialty contact lenses and oxygen permeable rigid contact lens materials.
Our ability to compete successfully with a full range of silicone hydrogel products is an important factor to achieving our desired future levels of sales growth and profitability. CooperVision manufactures and markets a wide variety of silicone hydrogel contact lenses. Our single-use silicone hydrogel product franchises, clariti® and MyDay®, remain a focus as we expect increasing demand for these products as well as future single-use products as the global contact lens market continues to shift to this modality. Outside of single-use, the Biofinity® and Avaira Vitality® product families comprise our focus in the FRP, or frequent replacement product, market which encompasses the 2-week and monthly modalities. Included in this segment are unique products such as Biofinity Energys®, which helps individuals with digital eye fatigue.
CooperSurgical - Our CooperSurgical business competes in the general health care market with a focus oncommitment to advancing the health of women, babies and families through aits diversified portfolio of products and services focusing on women's health, fertility, diagnostics and contraception. CooperSurgical has established its market presence and distribution system by developing products and acquiring companies, products and services that complement its business model.
CooperSurgical acquired the following entity during the ninesix months ended July 31,April 30, 2020:
A privately-held distributor of IVF medical devices and systems on December 13, 2019.
CooperSurgical acquired the following entity during the six months ended April 30, 2019:
Incisive Surgical Inc. on December 31, 2018 - a privately-held U.S. medical device company that develops mechanical surgical solutions for skin closure.
CooperSurgical acquired the following entities and assets during the nine months ended July 31, 2018:
LifeGlobal Group on April 3, 2018 - a privately held company that specializes primarily in IVF media. LifeGlobal’s product categories include media products, IVF laboratory air filtration products and dishware
PARAGARD on November 1, 2017 - CooperSurgical acquired the assets of the PARAGARD IUD business from Teva Pharmaceuticals Industries Limited for $1.1 billion. PARAGARD broadened and strengthened CooperSurgical's women's health product portfolio and it is the only non-hormonal, long lasting, reversible contraceptive option approved by the FDA and available in the United States. IUDs represent a large and growing segment of the Long Acting Reversible Contraceptive market.
THE COOPER COMPANIES, INC. AND SUBSIDIARIES
Item 2. Management’s Discussion and Analysis of Financial Condition
and Results of Operations
We intend to continue investing in CooperSurgical's business with the goal of expanding our integrated solutions model within the areas of women's health, fertility, diagnostics and contraception.
Capital Resources - At July 31, 2019,April 30, 2020, we had $112.7$79.8 million in unrestricted cash, primarily held outside the United States, and $998.8$793.8 million available under our 2016 Revolving2020 Credit Facility (as defined below). Term loans of $1,750.0Agreement. The $850.0 million remained outstanding at July 31, 2019.
On November 1, 2018, the Companyterm loan entered into a 364-day, $400.0on April 1, 2020, and the $500.0 million senior unsecured term loan agreement by and among the Company, the lenders party thereto and PNC Bank, National Association, as administrative agent which matures on October 31, 2019 (the 2018 Term Loan Agreement). The Company used the funds to partially repay outstanding borrowings under the 2016 Revolving Credit Facility. At July 31, 2019, we had $325.0 million outstanding under the 2018 Term Loan Agreement.
On November 1, 2017, we entered into a $1.425 billion syndicated Term Loan Agreement (the 2017 Term Loan Agreement) which matures on NovemberSeptember 27, 2019 and amended on April 1, 2022, to fund the acquisition2020, remain outstanding as of PARAGARD, to partially repay outstanding amounts under the 2016 Revolving Credit Facility, and for general corporate purposes. At July 31, 2019, we had $1.425 billion outstanding under the 2017 Term Loan Agreement.April 30, 2020.
On March 1, 2016, we entered into a syndicated revolving Credit and Term Loan Agreement (the 2016 Credit Agreement). This agreement, maturing on March 1, 2021, provides for a multi-currency revolving credit facility in an aggregate principal amount of $1.0 billion (the 2016 Revolving Credit Facility) and a term loan facility in the aggregate principal amount of $830.0 million (the 2016 Term Loan Facility). At July 31, 2019, we had no outstanding balance under the 2016 Term Loan Facility. See Note 6. Debt of the Consolidated Condensed Financial Statements for additional information.
The Company believesConsidering recent market conditions and the ongoing COVID-19 pandemic crisis, we have re-evaluated our operating cash flows and cash requirements and continue to believe that current cash, cash equivalents, and future cash flow from operating activities and cash available under our 2020 Credit Agreement will be sufficient to meet the Company’sour anticipated cash needs, including working capital needs, capital expenditures and contractual obligations for at least 12 months from the issuance date of the consolidated condensed financial statements included in this quarterly report. To the extent additional funds are necessary to meet our liquidity needs such as that for acquisitions, share repurchases, cash dividends or other activities as we execute our business strategy, we anticipate that additional funds will be obtained through the incurrence of additional
THE COOPER COMPANIES, INC. AND SUBSIDIARIES
Item 2. Management’s Discussion and Analysis of Financial Condition
and Results of Operations
indebtedness, additional equity financings or a combination of these potential sources of funds; however, such financing may not be available on favorable terms, or at all.
Transition from LIBOR
The United Kingdom’s Financial Conduct Authority, which regulates the London Interbank Offered Rate (LIBOR), announced in July 2017 that it will no longer persuade or require banks to submit rates for LIBOR after 2021. Further, in March 2020, the FASB issued ASU 2020-04, ReferenceRateReform (Topic848): Facilitation of the Effects of Reference Rate Reform on Financial Reporting. This guidance provides optional expedients and exceptions for applying generally accepted accounting principles (GAAP) to contracts, hedging relationships, and other transactions affected by reference rate reform if certain criteria are met. The Company has material contracts that are indexed to LIBOR and is continuing to monitor this activity and evaluate the related risk. We are continuing to evaluate the scope of impacted contracts and the potential impact. We are also monitoring the developments regarding alternative rates and may amend certain contracts to accommodate those rates if the contract does not already specify a replacement rate. While the notional value of agreements potentially indexed to LIBOR is material, we are not yet able to reasonably estimate the expected impact.
Selected Statistical Information – Percentage of Net Sales
|
| | | | | | | | | | | | | | | | | |
| | Three Months | | Nine Months |
| | Percentage of Sales | | 2019 vs 2018 % Change in Absolute Values | | Percentage of Sales | | 2019 vs 2018 % Change in Absolute Values |
Periods Ended July 31,
| 2019 | | 2018 | | | 2019 | | 2018 | |
| Net sales | 100 | % | | 100 | % | | 3 | % | | 100 | % | | 100 | % | | 4 | % |
| Cost of sales | 34 | % | | 35 | % | | (2 | )% | | 34 | % | | 36 | % | | (3 | )% |
| Gross profit | 66 | % | | 65 | % | | 6 | % | | 66 | % | | 64 | % | | 8 | % |
| Selling, general and administrative expense | 37 | % | | 38 | % | | — | % | | 38 | % | | 39 | % | | 3 | % |
| Research and development expense | 3 | % | | 3 | % | | (5 | )% | | 3 | % | | 3 | % | | 2 | % |
| Amortization of intangibles | 5 | % | | 6 | % | | (1 | )% | | 6 | % | | 6 | % | | — | % |
| Impairment of intangibles | — | % | | — | % | | — | % | | — | % | | 1 | % | | — | % |
| Gain on sale of an intangible | — | % | | — | % | | — | % | | 1 | % | | — | % | | — | % |
| Operating income | 21 | % | | 18 | % | | 23 | % | | 20 | % | | 15 | % | | 43 | % |
THE COOPER COMPANIES, INC. AND SUBSIDIARIES
Item 2. Management’s Discussion and Analysis of Financial Condition
and Results of Operations
|
| | | | | | | | | | | | | | | | | |
| | Three Months | | Six Months |
| | Percentage of Net Sales | | 2020 vs 2019 % Change in Absolute Values | | Percentage of Net Sales | | 2020 vs 2019 % Change in Absolute Values |
| Periods Ended April 30, | 2020 | | 2019 | | | 2020 | | 2019 | |
| Net sales | 100 | % | | 100 | % | | (20 | )% | | 100 | % | | 100 | % | | (9 | )% |
| Cost of sales | 38 | % | | 34 | % | | (9 | )% | | 36 | % | | 34 | % | | (2 | )% |
| Gross profit | 62 | % | | 66 | % | | (25 | )% | | 64 | % | | 66 | % | | (12 | )% |
| Selling, general and administrative expense | 45 | % | | 38 | % | | (4 | )% | | 42 | % | | 39 | % | | — | % |
| Research and development expense | 5 | % | | 3 | % | | 13 | % | | 4 | % | | 3 | % | | 10 | % |
| Amortization of intangibles | 6 | % | | 6 | % | | (8 | )% | | 6 | % | | 6 | % | | (6 | )% |
| Gain on sale of an intangible | — | % | | 3 | % | | — | % | | — | % | | 1 | % | | — | % |
| Operating income | 5 | % | | 22 | % | | (81 | )% | | 12 | % | | 20 | % | | (46 | )% |
Net Sales Growth by Business Unit
| | | Periods Ended July 31, | Three Months | | Nine Months | |
| Periods Ended April 30, | | Three Months | | Six Months |
| ($ in millions) | 2019 | | 2018 | | Increase (Decrease) | 2019 vs 2018 % Change | | 2019 | | 2018 | | Increase | 2019 vs 2018
% Change | 2020 | | 2019 | | Increase / (Decrease) | 2020 vs 2019 % Change | | 2020 | | 2019 | | Increase / (Decrease) | 2020 vs 2019 % Change |
| CooperVision | $ | 509.1 |
| | $ | 489.1 |
| | $ | 20.0 |
| 4 | % | | $ | 1,463.3 |
| | $ | 1,401.4 |
| | $ | 61.9 |
| 4 | % | $ | 402.2 |
| | $ | 484.2 |
| | $ | (82.0 | ) | (17 | )% | | $ | 887.4 |
| | $ | 954.3 |
| | $ | (66.9 | ) | (7 | )% |
| CooperSurgical | 170.3 |
| | 170.9 |
| | (0.6 | ) | — | % | | 498.5 |
| | 479.9 |
| | 18.6 |
| 4 | % | 122.7 |
| | 170.1 |
| | (47.4 | ) | (28 | )% | | 283.7 |
| | 328.1 |
| | (44.4 | ) | (14 | )% |
| Net sales | $ | 679.4 |
| | $ | 660.0 |
| | $ | 19.4 |
| 3 | % | | $ | 1,961.8 |
| | $ | 1,881.3 |
| | $ | 80.5 |
| 4 | % | $ | 524.9 |
| | $ | 654.3 |
| | $ | (129.4 | ) | (20 | )% | | $ | 1,171.1 |
| | $ | 1,282.4 |
| | $ | (111.3 | ) | (9 | )% |
CooperVision Net Sales
The contact lens market has two major product categories:
Spherical lenses including lenses that correct near- and farsightedness uncomplicated by more complex visual defects
Toric and multifocal lenses including lenses that, in addition to correcting near- and farsightedness, address more complex visual defects such as astigmatism and presbyopia by adding optical properties of cylinder and axis, which correct for irregularities in the shape of the cornea.
CooperVision Net Sales by Category
|
| | | | | | | | | | | | |
| Three Months Ended July 31, | | | | | | |
| ($ in millions) | | 2019 | | | 2018 | | 2019 vs 2018
% Change |
| Toric | | $ | 163.1 |
| | | $ | 153.6 |
| | 6 | % |
| Multifocal | | 52.4 |
| | | 52.7 |
| | (1 | )% |
| Single-use spheres | | 146.3 |
| | | 137.6 |
| | 6 | % |
| Non single-use sphere, other | | 147.3 |
| | | 145.2 |
| | 1 | % |
| | | $ | 509.1 |
| | | $ | 489.1 |
| | 4 | % |
THE COOPER COMPANIES, INC. AND SUBSIDIARIES
Item 2. Management’s Discussion and Analysis of Financial Condition
and Results of Operations
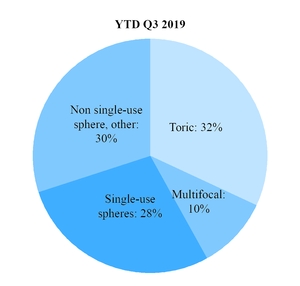
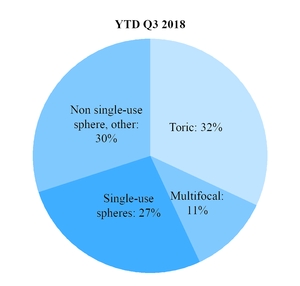
| | | Nine Months Ended July 31, | | | | | | |
| ($ in millions) | | 2019 | | 2018 | | 2019 vs 2018
% Change | |
Three Months Ended April 30,
($ in millions) | | 2020 | | 2019 | | 2020 vs 2019
% Change |
| Toric | | $ | 464.4 |
| | $ | 442.2 |
| | 5 | % | $ | 133.6 |
| | $ | 155.3 |
| | (14 | )% |
| Multifocal | | 151.1 |
| | 148.8 |
| | 2 | % | 45.1 |
| | 49.7 |
| | (9 | )% |
| Single-use spheres | | 413.6 |
| | 378.3 |
| | 9 | % | 116.1 |
| | 135.3 |
| | (14 | )% |
| Non single-use sphere, other | | 434.2 |
| | 432.1 |
| | — | % | 107.4 |
| | 143.9 |
| | (25 | )% |
| | | $ | 1,463.3 |
| | $ | 1,401.4 |
| | 4 | % | $ | 402.2 |
| | $ | 484.2 |
| | (17 | )% |
In the three and nine months ended July 31, 2019: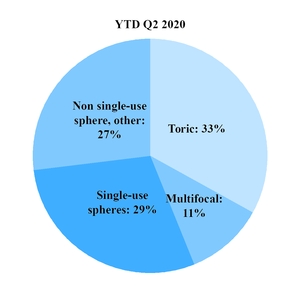
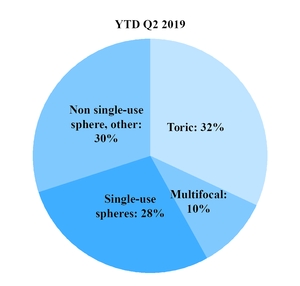
Toric lenses grew primarily through the success
Multifocal lenses decreased in three months ended and increased in nine months ended, compared to fiscal 2018 due to higher Biofinity and clariti sales, partially offset by decrease in sales of Proclear and negative impact of foreign exchange rates
Single-use sphere lenses growth was primarily attributed to clariti and MyDay lenses
Non-single-use spheres increased in three months ended and remained relatively flat in nine months ended, compared to fiscal 2018 due to higher Biofinity sales, partially offset by the negative impact of foreign exchange rates
"Other" products primarily include lens care which represent approximately 2% of net sales in the three and nine months ended, compared to 2% and 3% in the three and nine months ended July 31, 2018, respectively
Increased sales of silicone hydrogel products were partially offset by lower sales of older hydrogel products. Total silicone hydrogel products grew 9% and 10% in three and nine months ended, respectively, representing 72% and 71% of net sales in the three and nine months ended July 31, 2019 compared to 69% and 68% in the three and nine months ended July 31, 2018
Foreign exchange rates negatively impacted sales by approximately $11.0 million and $46.6 million in the three and nine months ended, respectively, primarily attributable to the Euro and British Pound
Sales growth was primarily driven by increases in the volume of lenses sold. Average realized prices by product did not materially influence sales growth.Contents
THE COOPER COMPANIES, INC. AND SUBSIDIARIES
Item 2. Management’s Discussion and Analysis of Financial Condition
and Results of Operations
|
| | | | | | | | | | | |
| Six Months Ended April 30, | | | | | |
| ($ in millions) | | 2020 | | 2019 | | 2020 vs 2019
% Change |
| Toric | | $ | 288.7 |
| | $ | 301.3 |
| | (4 | )% |
| Multifocal | | 96.9 |
| | 98.7 |
| | (2 | )% |
| Single-use spheres | | 254.2 |
| | 267.3 |
| | (5 | )% |
| Non single-use sphere, other | | 247.6 |
| | 287.0 |
| | (14 | )% |
| | | $ | 887.4 |
| | $ | 954.3 |
| | (7 | )% |
In the three and six months ended April 30, 2020:
The COVID-19 pandemic has negatively impacted our business and has resulted in reduction of revenues in both the three and six month periods of 17% and 7%, respectively, compared to the corresponding periods in the prior year. Customers have either slowed down purchases or delayed orders due to a desire to reduce inventories, reduced contact lens wear driven by limited social interaction and lack of patient access on account of office closures. We experienced downward pressure on revenue when major markets started closing as social restrictions were put in place and the offices of many health care providers were closed.
Toric lenses declined primarily due to lower sales of Biofinity, Biomedics, Proclear and partially offset by higher sales of MyDay
Multifocal lenses declined primarily due to lower sales of Biofinity and Proclear
Single-use sphere lenses reduction was primarily attributed to decrease in Proclear, Biomedics, clariti lenses partially offset by an increase in MiSight sales
Non-single-use spheres decreased due to lower Biofinity and Biomedics sphere sales
"Other" products primarily include lens care which represented approximately 2% of net sales in the three and six months ended April 30, 2020, and in prior year comparative periods
There was a decrease in sales of silicone hydrogel products including older hydrogel products. Total silicone hydrogel products decreased by 15% and 4% in three and six months ended, respectively, representing 73% of net sales in the three and six months ended April 30, 2020 compared to 71% in the three and six months ended April 30, 2019
Foreign exchange rates negatively impacted sales by approximately $7.5 million and $9.7 million in the three and six months ended, respectively, primarily attributable to fluctuations in the Euro, compared to $22.3 million and $35.6 million in prior year periods. In the three and six months ended April 30, 2020, net sales decreased 15% and 6% in constant currency over the prior year periods
Sales reduction was primarily driven by a decrease in the volume of lenses sold. Average realized prices by product did not materially influence sales
We expect to continue seeing downward pressure on revenues if the COVID-19 pandemic continues, optical retailers and healthcare centers continue to restrict access, and social distancing measures continue.
CooperVision Net Sales by Geography
CooperVision competes in the worldwide soft contact lens market and services in three primary regions: the Americas, EMEA (Europe, Middle East and Africa) and Asia Pacific.
THE COOPER COMPANIES, INC. AND SUBSIDIARIES
Item 2. Management’s Discussion and Analysis of Financial Condition
and Results of Operations
| | | Periods Ended July 31, |
| Three Months |
| Nine Months | |
| Periods Ended April 30, | | | Three Months | | Six Months |
| ($ in millions) |
| 2019 |
| 2018 |
| 2019 vs 2018 % Change |
| 2019 |
| 2018 |
| 2019 vs 2018
% Change |
| 2020 |
| 2019 |
| 2020 vs 2019
% Change |
| 2020 | | 2019 |
| 2020 vs 2019
% Change |
| Americas |
| $ | 195.0 |
|
| $ | 184.4 |
|
| 6 | % |
| $ | 564.4 |
| | $ | 537.1 |
| | 5 | % |
| $ | 149.6 |
|
| $ | 193.4 |
|
| (23 | )% |
| $ | 339.0 |
| | $ | 369.4 |
| | (8 | )% |
| EMEA |
| 196.0 |
|
| 199.2 |
|
| (2 | )% |
| 561.4 |
| | 560.4 |
| | — | % |
| 154.1 |
|
| 181.1 |
|
| (15 | )% |
| 341.1 |
| | 365.4 |
| | (7 | )% |
| Asia Pacific |
| 118.1 |
|
| 105.5 |
|
| 12 | % |
| 337.5 |
| | 303.9 |
| | 11 | % |
| 98.5 |
|
| 109.7 |
|
| (10 | )% |
| 207.3 |
| | 219.5 |
| | (6 | )% |
|
| $ | 509.1 |
|
| $ | 489.1 |
|
| 4 | % |
| $ | 1,463.3 |
| | $ | 1,401.4 |
| | 4 | % |
| $ | 402.2 |
|
| $ | 484.2 |
|
| (17 | )% |
| $ | 887.4 |
| | $ | 954.3 |
| | (7 | )% |
CooperVision's regional growthreduction in Americas, EMEA and Asia Pacific was primarily attributable to market gainsdisruption from COVID-19 pandemic. The COVID-19 virus had spread beyond Asia into different geographies including the United States and Europe, and the number of silicone hydrogel contact lenses. However, theshelter-in-place directives issued by local authorities increased, resulting in negative impact of foreign exchange rates resulted in reduction of EMEA growth. on regional revenues. We expect to continue seeing downward pressure on revenues if the COVID-19 pandemic continues, optical retailers and healthcare centers continue to restrict access, and social distancing measures continue.
Refer to CooperVision Net Sales by Category above for further discussion.
CooperSurgical Net Sales by Category
CooperSurgical supplies the family health care market with a diversified portfolio of products and services. Our office and surgical offerings include products that facilitate surgical and non-surgical procedures that are commonly performed primarily by obstetricians and gynecologists in hospitals, surgical centers, fertility clinics and medical offices. Fertility offerings include highly specialized products and services that target the IVF process, including diagnostics testing with a goal to make fertility treatment safer, more efficient and convenient.
The chart below shows the percentage of net sales of office and surgical products and fertility.
| | | Three Months Ended July 31, | | | | | |
| ($ in millions) | | 2019 | | 2018 | | 2019 vs 2018
% Change | | |
Three Months Ended April 30,
($ in millions) | | | 2020 | | 2019 | | 2020 vs 2019
% Change |
| Office and surgical products | | $ | 106.3 |
| | $ | 104.4 |
| | 2 | % | | | $ | 69.6 |
| | $ | 105.7 |
| | (34 | )% |
| Fertility | | 64.0 |
| | 66.5 |
| | (4 | )% | | | 53.1 |
| | 64.4 |
| | (17 | )% |
| | | $ | 170.3 |
| | $ | 170.9 |
| | — | % | | | $ | 122.7 |
| | $ | 170.1 |
| | (28 | )% |
THE COOPER COMPANIES, INC. AND SUBSIDIARIES
Item 2. Management’s Discussion and Analysis of Financial Condition
and Results of Operations
| | | Nine Months Ended July 31, | | | | |
| Six Months Ended April 30, | | | | |
| ($ in millions) | | 2019 | | 2018 | | 2019 vs 2018
% Change | | | 2020 | | 2019 | | 2020 vs 2019
% Change | |
| Office and surgical products | | $ | 307.7 |
| | $ | 290.4 |
| | 6 | % | | | $ | 168.0 |
| | $ | 201.4 |
| | (17 | )% | |
| Fertility | | 190.8 |
| | 189.5 |
| | 1 | % | | | $ | 115.7 |
| | $ | 126.7 |
| | (9 | )% | |
| | | $ | 498.5 |
| | $ | 479.9 |
| | 4 | % | | | $ | 283.7 |
| | $ | 328.1 |
| | (14 | )% | |
In the three and ninesix months ended July 31, 2019:April 30, 2020:
We have experienced COVID-19 pandemic-related economic disruptions and decline in revenues during the three and six months ended April 30, 2020. We experienced downward pressure on revenue when major markets started closing as social restrictions were put in place and the offices of many health care providers were closed. In response to the COVID-19 pandemic, as a precautionary measure, many health care facilities and medical offices were closed or restricted access and many surgeries and elective medical procedures and exams have been deferred or cancelled. Further, there has been a significant reduction in physician office visits, and healthcare centers have postponed or cancelled capital purchases.
Office and surgical products increaseddecreased compared to the prior year periods mainly due to reduction in Paragard sales compared to prior year periods due to continued growthperiods. Further, there has been a reduction in PARAGARD andrevenue from other surgical products primarilysuch as Uterine Manipulators, Surgical Retractors, Closure products and recentlyFilshie Clip system, partially offset by an increase in revenue from acquired products of Incisive Surgical partially offset by decrease in revenue on Filshie Clip system. On February 1, 2019, the Company agreed to the early termination of an exclusive distribution agreement which had given CooperSurgical the rights to distribute the Filshie Clip System in the United States.and Endosee products
In the three months ended July 31, 2019, Fertility net sales decreaseddeclined compared to the prior year periods mainly due to the exit of the carrier screening and non-invasive prenatalreduction in revenue from PGS/PGD testing, (NIPT) product lines on June 1, 2018. However, Fertility net sales increased in nine months ended July 31, 2019 compared to fiscal 2018, primarily due to increased sales of IVF consumables and IVF equipment and LifeGlobal products, partially offset by a decrease in diagnostics revenue.
Unit growth and product mix positivelyForeign exchange rates negatively impacted sales growth.
Gross Profit
|
| | | | | | | | | | | | |
| Gross Profit Percentage of Net Sales | | Three Months | | Nine Months |
Periods Ended July 31,
| 2019 | | 2018 | | 2019 | | 2018 |
| CooperVision | | 65 | % | | 66 | % | | 65 | % | | 66 | % |
| CooperSurgical | | 71 | % | | 62 | % | | 69 | % | | 58 | % |
| Consolidated | | 66 | % | | 65 | % | | 66 | % | | 64 | % |
CooperVision's gross margin decreasedby approximately $1.4 million and $2.1 million in the three and ninesix months ended, July 31, 2019 compared to fiscal 2018 due to:
the unfavorable impact to revenue from exchange rate fluctuations,respectively, primarily attributable to fluctuations in the Euro and British Pound; and product mix;
$3.6Danish Krone, compared to $3.7 million and $6.5$6.0 million in the prior year periods. In the three and six months of integration2020, net sales decreased 27% and manufacturing related cost;13% in constant currency over the prior year periods
We expect to continue seeing downward pressure on revenues if the COVID-19 pandemic continues, hospitals and healthcare centers continue to restrict access, and social distancing measures continue.
THE COOPER COMPANIES, INC. AND SUBSIDIARIES
Item 2. Management’s Discussion and Analysis of Financial Condition
and Results of Operations
partially offset by an increase inGross Margin
|
| | | | | | | | | | | | |
| Gross Profit Percentage of Net Sales | | Three Months | | Six Months |
| Periods Ended April 30, | | 2020 | | 2019 | | 2020 | | 2019 |
| CooperVision | | 62 | % | | 66 | % | | 64 | % | | 66 | % |
| CooperSurgical | | 61 | % | | 67 | % | | 65 | % | | 68 | % |
| Consolidated | | 62 | % | | 66 | % | | 64 | % | | 66 | % |
Our gross margins have declined across our businesses mainly from lower sales volume of higherhigh margin products including Biofinity.and some unabsorbed fixed overhead costs, labor inefficiencies, higher manufacturing costs and higher freight costs as a result of the economic impact of the COVID-19 pandemic.
CooperVision's gross margin decreased in the three and ninesix months ended July 31, 2018 included $1.9April 30, 2020 compared to fiscal 2019 due to:
$16.2 million and $11.8$22.0 million of costs respectively, of product transition, integration andprimarily related to incremental costs associated with the impact of Hurricane Maria on our Puerto Ricothe COVID-19 pandemic and other manufacturing facilityrelated costs
the unfavorable impact to margin from changes in product mix; and
acquisition, integration and manufacturing related costs of $3.6 million and $4.7 million included in three and six months ended April 30, 2019, respectively.
CooperSurgical's increasedecrease in gross margin in the three and ninesix months ended July 31, 2019April 30, 2020 compared to fiscal 20182019 due to:
an increase in sales of PARAGARD IUD product and inclusion of LifeGlobal products with higher gross margin;
partially offset by $2.9$5.9 million and $11.2$8.5 million of costs respectively, primarily incremental costs associated with the impact of the COVID-19, integration costs and higher inventory reserves; and
acquisition, integration and manufacturing related costs
of $4.1 million and $8.3 million included in the three and ninesix months ended July 31, 2018 included $12.7 million and $49.3 million, respectively, of PARAGARD and LifeGlobal acquisitions inventory step-up charges.
three and nine months ended July 31, 2018 included $3.6 million and $11.5 million, respectively, of integration and acquisitions costs.April 30, 2019.
Selling, General and Administrative Expense (SGA) | | Three Months Ended July 31,
($ in millions) | | 2019 | | % Net Sales | | 2018 | | % Net Sales | | 2019 vs 2018 % Change | |
Three Months Ended April 30,
($ in millions) | | | 2020 | | % Net Sales | | 2019 | | % Net Sales | | 2020 vs 2019 % Change |
| CooperVision | | 171.9 |
| | 34 | % | | $ | 168.9 |
| | 35 | % | | 2 | % | | $ | 160.8 |
| | 40 | % | | $ | 169.0 |
| | 35 | % | | (5 | )% |
| CooperSurgical | | 65.3 |
| | 38 | % | | 70.7 |
| | 41 | % | | (8 | )% | | 62.9 |
| | 51 | % | | 68.1 |
| | 40 | % | | (7 | )% |
| Corporate | | 12.6 |
| | — |
| | 11.4 |
| | — |
| | 10 | % | | 13.5 |
| | — |
| | 9.7 |
| | — |
| | 40 | % |
| | | $ | 249.8 |
| | 37 | % | | $ | 251.0 |
| | 38 | % | | — | % | | $ | 237.2 |
| | 45 | % | | $ | 246.8 |
| | 38 | % | | (4 | )% |
Nine Months Ended July 31, ($ in millions) | | 2019 | | % Net Sales | | 2018 | | % Net Sales | | 2019 vs 2018 % Change | |
| | | | | | | | | | | | |
Six Months Ended April 30, ($ in millions) | | | 2020 | | % Net Sales | | 2019 | | % Net Sales | | 2020 vs 2019 % Change |
| CooperVision | | $ | 509.7 |
| | 35 | % | | $ | 490.9 |
| | 35 | % | | 4 | % | | $ | 333.2 |
| | 38 | % | | $ | 337.7 |
| | 35 | % | | (1 | )% |
| CooperSurgical | | 202.1 |
| | 41 | % | | 190.6 |
| | 40 | % | | 6 | % | | 135.3 |
| | 48 | % | | 136.9 |
| | 42 | % | | (1 | )% |
| Corporate | | 34.8 |
| | — |
| | 43.2 |
| | — |
| | (19 | )% | | 27.0 |
| | — |
| | 22.2 |
| | — |
| | 22 | % |
| | | $ | 746.6 |
| | 38 | % | | $ | 724.7 |
| | 39 | % | | 3 | % | | $ | 495.5 |
| | 42 | % | | $ | 496.8 |
| | 39 | % | | — | % |
CooperVision's
SGA expense decreased and remained relatively flat in the three and six months ended April 30, 2020, respectively, mainly due to reductions in advertising & marketing initiatives, lower distribution costs and lower travel expenses as a result of the COVID-19 pandemic. As a percentage of sales, SGA increased in the three and ninesix months ended July 31, 2019April 30, 2020 compared to fiscal 20182019.
CooperVision's SGA decreased in the three and six months ended April 30, 2020 compared to fiscal 2019 due to investments to support our long-term objectives, including increased headcount in SGAlower distribution, selling expenses and higher distribution expenses to support revenue growth.lower integration activities. CooperVision's SGA in the three and ninesix months ended July 31, 2019April 30, 2020 included $1.2costs primarily related to integration activities of $0.8 million and $3.8$1.4 million of integration and third-party consulting costs, respectively. CooperVision's SGA in the prior year periods included $1.3 million and $6.7 million of integration and third-party consulting costs, in the three and nine months ended July 31, 2018, respectively.
CooperSurgical's SGA decreased in the three months ended July 31, 2019 compared to fiscal 2018 due to lower advertising and administrative expenses. The increase in CooperSurgical's SGA in the nine months ended July 31, 2019 compared to fiscal 2018 was primarily due to higher PARAGARD advertising and marketing expenses. CooperSurgical's SGA in the three and nine months ended July 31, 2019, included $3.5 million and $15.9 million
The Corporate SGA increase in the three months ended July 31, 2019 compared to fiscal 2018 was primarily due to share-based compensation related expenses and higher professional services costs. The decrease in Corporate SGA in the nine months ended July 31, 2019 compared to fiscal 2018 was primarily due to $6.2 million of compensation costs related to executives' retirements in fiscal 2018.Contents
THE COOPER COMPANIES, INC. AND SUBSIDIARIES
Item 2. Management’s Discussion and Analysis of Financial Condition
and Results of Operations
CooperVision's SGA in the prior year periods included $2.1 million and $4.5 million of integration and third-party consulting costs, in the three and six months ended April 30, 2019, respectively.
The decrease in CooperSurgical's SGA in the three and six months ended April 30, 2020 compared to fiscal 2019 was primarily due to lower selling expenses and savings from reduced headcount and lower travel expenses. CooperSurgical's SGA in the three and six months ended April 30, 2020, included integration expenses and European Medical Devices Regulation costs of $4.4 million and $10.5 million respectively. CooperSurgical's SGA in the prior year periods included $4.0 million and $12.4 million of primarily acquisition and integration expenses of acquired companies, as well as third-party consulting costs, in the three and six months ended April 30, 2019 respectively.
The increase in Corporate SGA in the three and six months ended April 30, 2020 compared to fiscal 2019 was primarily due to higher share-based compensation expense.
Research and Development Expense (R&D) | | Three Months Ended July 31,
($ in millions) | | 2019 | | % Net
Sales | | 2018 | | % Net
Sales | | 2019 vs 2018
% Change | |
Three Months Ended April 30,
($ in millions)
| | | 2020 | | % Net
Sales | | 2019 | | % Net
Sales | | 2020 vs 2019
% Change |
| CooperVision | | $ | 13.6 |
| | 3 | % | | $ | 14.6 |
| | 3 | % | | (7 | )% | | $ | 12.8 |
| | 3 | % | | $ | 12.9 |
| | 3 | % | | (1 | )% |
| CooperSurgical | | 7.9 |
| | 5 | % | | 7.9 |
| | 5 | % | | — | % | | 11.0 |
| | 9 | % | | 8.1 |
| | 5 | % | | 35 | % |
| | | $ | 21.5 |
| | 3 | % | | $ | 22.5 |
| | 3 | % | | (5 | )% | | $ | 23.8 |
| | 5 | % | | $ | 21.0 |
| | 3 | % | | 13 | % |
Nine Months Ended July 31, ($ in millions) | | 2019 | | % Net
Sales | | 2018 | | % Net
Sales | | 2019 vs 2018
% Change | |
| | | | | | | | | | | | |
Six Months Ended April 30, ($ in millions) | | | 2020 | | % Net
Sales | | 2019 | | % Net
Sales | | 2020 vs 2019
% Change |
| CooperVision | | $ | 40.1 |
| | 3 | % | | $ | 39.7 |
| | 3 | % | | 1 | % | | $ | 25.9 |
| | 3 | % | | $ | 26.5 |
| | 3 | % | | (2 | )% |
| CooperSurgical | | 23.3 |
| | 5 | % | | 22.5 |
| | 5 | % | | 4 | % | | 20.1 |
| | 7 | % | | 15.5 |
| | 5 | % | | 30 | % |
| | | $ | 63.4 |
| | 3 | % | | $ | 62.2 |
| | 3 | % | | 2 | % | | $ | 46.0 |
| | 4 | % | | $ | 42.0 |
| | 3 | % | | 10 | % |
In the three months and ninesix months ended July 31, 2019:April 30, 2020:
CooperVision's R&D decreased in the three and six months ended July 31, 2019April 30, 2020 compared to fiscal 2018 due to lower head count and timing of clinical spend. The increase in absolute dollars in the nine months ended July 31, 2019, compared to fiscal 2018 is mainly due to increased costs fromtiming of clinical studies. As a percentage of sales, R&D expense remained flat. CooperVision's R&D activities are primarily focused on the development of contact lenses, manufacturing technology and process enhancements.
The increase in CooperSurgical's R&D in the ninethree and six months ended July 31, 2019April 30, 2020 compared to fiscal 20182019 was primarily due to acquisitions, increased investment and activities in developing new products and services and upgrades of existing products. CooperSurgical has not paused research programs during the COVID-19 pandemic and has increased its spend to accelerate innovations in key investment areas and support our long term objectives. As a percentage of sales, R&D expense remained flat.increased. CooperSurgical's R&D activities include diagnostics, IVF product development and the design and upgrade of surgical procedure devices.
|
| | | | | | | | | | | | | | | | |
Three Months Ended July 31,
($ in millions) | 2019 | | % Net
Sales | | 2018 | | % Net
Sales | | 2019 vs 2018
% Change |
| CooperVision | $ | 10.7 |
| | 2 | % | | $ | 11.8 |
| | 2 | % | | (10 | )% |
| CooperSurgical | 26.5 |
| | 16 | % | | 25.9 |
| | 15 | % | | 2 | % |
| | $ | 37.2 |
| | 5 | % | | $ | 37.7 |
| | 6 | % | | (1 | )% |
Nine Months Ended July 31, ($ in millions) | 2019 | | % Net
Sales | | 2018 | | % Net
Sales | | 2019 vs 2018
% Change |
| CooperVision | $ | 31.9 |
| | 2 | % | | $ | 33.2 |
| | 2 | % | | (4 | )% |
| CooperSurgical | 78.8 |
| | 16 | % | | 77.3 |
| | 16 | % | | 2 | % |
| | $ | 110.7 |
| | 6 | % | | $ | 110.5 |
| | 6 | % | | — | % |
CooperVision amortization expense decreased during three and nine months ended July 31, 2019 compared to fiscal 2018 due to certain intangible assets becoming fully amortized.
CooperSurgical's amortization expense remained relatively flat in the three and nine months ended July 31, 2019. |
| | | | | | | | | | | | | | | | |
Three Months Ended April 30,
($ in millions) | 2020 | | % Net
Sales | | 2019 | | % Net
Sales | | 2020 vs 2019
% Change |
| CooperVision | $ | 7.8 |
| | 2 | % | | $ | 10.8 |
| | 2 | % | | (28 | )% |
| CooperSurgical | 26.1 |
| | 21 | % | | 26.1 |
| | 15 | % | | — | % |
| | $ | 33.9 |
| | 6 | % | | $ | 36.9 |
| | 6 | % | | (8 | )% |
| | | | | | | | | | |
Six Months Ended April 30, ($ in millions) | 2020 | | % Net
Sales | | 2019 | | % Net
Sales | | 2020 vs 2019
% Change |
| CooperVision | $ | 16.4 |
| | 2 | % | | $ | 21.2 |
| | 2 | % | | (23 | )% |
| CooperSurgical | 52.4 |
| | 18 | % | | 52.3 |
| | 16 | % | | — | % |
| | $ | 68.8 |
| | 6 | % | | $ | 73.5 |
| | 6 | % | | (6 | )% |
In the second quarter of fiscal 2018, CooperSurgical recognized an impairment charge of $24.4 million on the intangible assets acquired from Recombine Inc. In fiscal 2016, CooperSurgical acquired Recombine Inc., a clinical genetic testing company specializing in carrier screening. In connection with the impairment charge, on June 1, 2018, CooperSurgical announced the exit of the carrier screening and non-invasive prenatal testing (NIPT) product lines. Both product lines were categorized in Fertility.
THE COOPER COMPANIES, INC. AND SUBSIDIARIES
Item 2. Management’s Discussion and Analysis of Financial Condition
and Results of Operations
CooperVision amortization expense decreased in the three and six months ended April 30, 2020 compared to fiscal 2019 due to certain intangible assets becoming fully amortized.
CooperSurgical's amortization expense remained relatively flat.
Gain on Salesale of an Intangible Asset
In the second quarter of fiscal 2019, CooperSurgical sold an exclusive distribution right to distribute Filshie Clip System in the U.S. for $21.0 million and recognized a gain of $19.0 million.
Operating Income (Loss)
| | Three Months Ended July 31,
($ in millions) | | 2019 | | % Net
Sales | | 2018 | | % Net
Sales | | 2019 vs 2018
% Change | |
Three Months Ended April 30,
($ in millions) | | | 2020 | | % Net
Sales | | 2019 | | % Net
Sales | | 2020 vs 2019
% Change |
| CooperVision | | $ | 134.2 |
| | 26 | % | | $ | 125.4 |
| | 26 | % | | 7 | % | | $ | 67.7 |
| | 17 | % | | $ | 125.5 |
| | 26 | % | | (46 | )% |
| CooperSurgical | | 20.6 |
| | 12 | % | | 1.6 |
| | 1 | % | | 1,205 | % | | (25.6 | ) | | (21 | )% | | 31.1 |
| | 18 | % | | (182 | )% |
| Corporate | | (12.6 | ) | | — |
| | (11.4 | ) | | — |
| | (10 | )% | | (13.5 | ) | | — |
| | (9.7 | ) | | — |
| | 40 | % |
| | | $ | 142.2 |
| | 21 | % | | $ | 115.6 |
| | 18 | % | | 23 | % | | $ | 28.6 |
| | 5 | % | | $ | 146.9 |
| | 22 | % | | (81 | )% |
Nine Months Ended July 31, ($ in millions) | | 2019 | | % Net
Sales | | 2018 | | % Net
Sales | | 2019 vs 2018
% Change | |
| | | | | | | | | | | | |
Six Months Ended April 30, ($ in millions) | | | 2020 | | % Net
Sales | | 2019 | | % Net
Sales | | 2020 vs 2019
% Change |
| CooperVision | | $ | 375.9 |
| | 26 | % | | $ | 361.1 |
| | 26 | % | | 4 | % | | $ | 190.6 |
| | 21 | % | | $ | 241.7 |
| | 25 | % | | (21 | )% |
| CooperSurgical | | 59.0 |
| | 12 | % | | (37.5 | ) | | (8 | )% | | 257 | % | | (23.9 | ) | | (8 | )% | | 38.3 |
| | 12 | % | | (162 | )% |
| Corporate | | (34.8 | ) | | — |
| | (43.2 | ) | | — |
| | 19 | % | | (27.0 | ) | | — |
| | (22.2 | ) | | — |
| | 22 | % |
| | | $ | 400.1 |
| | 20 | % | | $ | 280.4 |
| | 15 | % | | 43 | % | | $ | 139.7 |
| | 12 | % | | $ | 257.8 |
| | 20 | % | | (46 | )% |
The operating income for the three and six months ended April 30, 2020 was primarily impacted by the COVID-19 pandemic which resulted in a decrease to revenue and additional expenses due to COVID-19 related costs as discussed above.
CooperVision operating income remained relatively flatdecreased as a percentage of net sales but increasedand in absolute dollars in the three and ninesix months ended July 31, 2019April 30, 2020 compared to fiscal 20182019 primarily due to improveda decrease in net sales of higher margin products, including Biofinity, partially offset by the negative impact of foreign exchange rates.a decrease in operating expenses and a decrease in amortization expenses.
CooperSurgical operating income increaseddecreased as a percentage of net sales and in absolute dollars in the three and ninesix months ended July 31, 2019April 30, 2020 compared to fiscal 2018,2019 primarily due to an increasea decrease in net sales ofand higher margin products, gain ofR&D expenses to support growth partially offset by a decrease in operating expenses. Prior year CooperSurgical three and six months operating income included a $19.0 million gain realized on the sale of an intangible asset, as discussed above, and recent acquisitions. CooperSurgical operating income in the three and nine months ended July 31, 2018 included $12.7 million and $49.3 million, respectively, of PARAGARD and LifeGlobal acquisitions inventory step-up charges and an intangible asset impairment charge of $24.4exclusive distribution right for $21.0 million.
Corporate operating loss increased in three months ended July 31, 2019 compared to fiscal 2018 due to higher professional services cost. The decreaseincrease of Corporate operating loss in the ninethree and six months ended July 31, 2019April 30, 2020 compared to fiscal 2018 is2019 was primarily due to higher stock-based compensation costs related to executives' retirements which impacted the prior year periods.expense.
On a consolidated basis, operating income increaseddecreased in absolute dollars and as a percentage of net sales primarily due to the factorsnegative impact of COVID-19, as discussed above.
|
| | | | | | | | | | | | | | | | |
Three Months Ended July 31,
($ in millions) | 2019 | | % Net
Sales | | 2018 | | % Net
Sales | | 2019 vs 2018
% Change |
| Interest expense | $ | 16.7 |
| | 2 | % | | $ | 22.8 |
| | 3 | % | | (27 | )% |
Nine Months Ended July 31, ($ in millions) | 2019 | | % Net Sales | | 2018 | | % Net Sales | | 2019 vs 2018
% Change |
| Interest expense | $ | 53.3 |
| | 3 | % | | $ | 59.9 |
| | 3 | % | | (11 | )% |
Interest expense remained relatively flat as a percentage of net sales and decreased in absolute dollar, primarily due to lower average debt balances, partially offset by higher interest rates compared to prior year period. |
| | | | | | | | | | | | | | | | |
Three Months Ended April 30,
($ in millions) | 2020 | | % Net
Sales | | 2019 | | % Net
Sales | | 2020 vs 2019
% Change |
| Interest expense | $ | 12.8 |
| | 2 | % | | $ | 18.5 |
| | 3 | % | | (31 | )% |
| | | | | | | | | | |
Six Months Ended April 30, ($ in millions) | 2020 | | % Net Sales | | 2019 | | % Net Sales | | 2020 vs 2019
% Change |
| Interest expense | $ | 24.4 |
| | 2 | % | | $ | 36.6 |
| | 3 | % | | (33 | )% |
THE COOPER COMPANIES, INC. AND SUBSIDIARIES
Item 2. Management’s Discussion and Analysis of Financial Condition
and Results of Operations
Interest expense decreased as a percentage of net sales and in absolute dollars primarily due to lower average debt balances and lower interest rates compared to the prior year period, partially offset by the write-off of debt issuance costs.
Other Expense (Income) Expense,, Net
|
| | | | | | | | | | | | | | | | |
| Periods Ended July 31, | | Three Months | | Nine Months |
| ($ in millions) | | 2019 | | 2018 | | 2019 | | 2018 |
| Foreign exchange (gain) loss | | $ | (1.1 | ) | | $ | 2.7 |
| | $ | (1.1 | ) | | $ | 1.7 |
|
| Other, net | | (0.4 | ) | | (0.3 | ) | | (1.0 | ) | | (0.4 | ) |
| | | $ | (1.5 | ) | | $ | 2.4 |
| | $ | (2.1 | ) | | $ | 1.3 |
|
|
| | | | | | | | | | | | | | | | |
| Periods Ended April 30, | | Three Months | | Six Months |
| ($ in millions) | | 2020 | | 2019 | | 2020 | | 2019 |
| Foreign exchange loss (gain) | | $ | 2.4 |
| | $ | 0.4 |
| | $ | 3.8 |
| | $ | (0.1 | ) |
| Other Expense (Income), net | | 4.4 |
| | (0.1 | ) | | 5.1 |
| | (0.6 | ) |
| | | $ | 6.8 |
| | $ | 0.3 |
| | $ | 8.9 |
| | $ | (0.7 | ) |
Foreign exchange loss (gain) loss primarily resulted from the revaluation and settlement of foreign currencies-denominatedcurrency-denominated balances.
Other expense (income) increased in the three and six months ended April 30, 2020, primarily due to non-consolidated subsidiary investments charges during the period.
Provision for Income Taxes
The Company's effective tax rates were a benefit of 27.7% and expense of 4.5% for the second quarter of fiscal 2020 and 2019, respectively and an expense of 5.4%4.2% and a benefit of 11.5% for the third quarter of fiscal 2019 and fiscal 2018, respectively, and expense of 0.9% and 82.1%1.7% for the first ninesix months of fiscal 20192020 and 2018,2019, respectively. The increasedecrease in ourthe effective tax rate for the thirdsecond quarter of fiscal 20192020 compared to fiscal 20182019 was primarily due to the inclusionsignificant drop of earnings from our foreign subsidiaries pursuantactual quarterly PBT (Profit before tax) due to the GILTI provisions that became effective in fiscal 2019.market volatility and instability as a result of the COVID-19 pandemic. The decrease in ourCompany’s effective tax rate for the first ninesix months of fiscal year 2020 was higher than 2019, compared to fiscal 2018 was primarilymainly due to the provisional charge of $196.7 million relating to the 2017 Act that was recorded in fiscal 2018. Our effective tax rate for the nine months of fiscal 2019 was lower than the U.S. statutory rate because of discrete tax benefits and a favorable mix of income from our foreign jurisdictions with lower tax rates. Total discrete tax benefits for the first nine months of fiscal 2019 were $26.7 million primarily relating to settlement of tax audits, revisions to the provisional tax charges relating to the 2017 Act and excess tax benefits from share-based compensation. Ourcompensation that favorably impacted the 2019 effective tax rate. The Company’s effective tax rate for the first nine monthssecond quarter of fiscal 20182020 was higherlower than the U.S.U.S statutory tax rate becauseas a result of the discrete tax expense relating to the 2017 Act, which was partially offset bybenefits mainly from stock compensation excess tax benefit and a favorable mix of income from our foreign jurisdictions with lowerpreferential tax rates and an excess tax benefit from share-based compensation.rates.
Share-Based Compensation Plans
The Company has several share-based compensation plans that are described in our Annual Report on Form 10-K for the fiscal year ended October 31, 2018.2019. The compensation expense and related income tax benefit recognized in our Consolidated Condensed Statements of Income and Comprehensive Income for share-based awards were as follows:
| | | Periods Ended July 31, | | Three Months | | Nine Months | |
| Periods Ended April 30, | | | Three Months | | Six Months |
| ($ in millions) | | 2019 | | 2018 | | 2019 | | 2018 | | 2020 | | 2019 | | 2020 | | 2019 |
| Selling, general and administrative expense | | $ | 6.8 |
| | $ | 6.7 |
| | $ | 22.1 |
| | $ | 30.3 |
| | $ | 8.3 |
| | $ | 6.1 |
| | $ | 17.0 |
| | $ | 15.3 |
|
| Cost of sales | | 1.0 |
| | 0.9 |
| | 3.9 |
| | 2.6 |
| | 1.1 |
| | 1.4 |
| | 2.1 |
| | 2.9 |
|
| Research and development expense | | 0.5 |
| | 0.5 |
| | 2.4 |
| | 1.6 |
| | 0.6 |
| | 0.9 |
| | 1.2 |
| | 1.9 |
|
| Total share-based compensation expense | | $ | 8.3 |
| | $ | 8.1 |
| | $ | 28.4 |
| | $ | 34.5 |
| | $ | 10.0 |
| | $ | 8.4 |
| | $ | 20.3 |
| | $ | 20.1 |
|
| Related income tax benefit | | $ | 1.1 |
| | $ | 1.5 |
| | $ | 4.0 |
| | $ | 7.1 |
| | $ | 1.1 |
| | $ | 1.1 |
| | $ | 2.5 |
| | $ | 2.9 |
|
Employee Stock Purchase Plan
On March 18, 2019, the Company received stockholder approval37
THE COOPER COMPANIES, INC. AND SUBSIDIARIES
Item 2. Management’s Discussion and Analysis of Financial Condition
and Results of Operations
Capital Resources and Liquidity
ThirdSecond Quarter Highlights
Operating cash flow was $196.7$25.8 million compared to $235.3 million in the third quarter of fiscal 2018
Expenditures for purchases of property, plant and equipment were $75.4 million compared to $52.3 million in the prior year period.
Nine-Month Highlights
Operating cash flow was $513.3 million compared to $432.3$214.8 million in the prior year period
Expenditures for purchases of property, plant and equipment were $207.3$89.3 million compared to $150.2$52.7 million in the prior year period
Cash provided by operations $25.8 million offset by capital expenditures $89.3 million resulted in negative free cash flow of $(63.5) million, down 139% compared to the prior year period.
Six-Month Highlights
Operating cash flow was $155.5 million compared to $316.6 million in the prior year period
Expenditures for purchases of property, plant and equipment were $158.3 million compared to $131.9 million in the prior year period
Cash payments for acquisitions and others, of $59.1$11.2 million, compared to $1,320.8$50.8 million in the prior year period.
Cash provided by operations $155.5 million offset by capital expenditures $158.3 million resulted in negative free cash flow of $(2.8) million, down 102% compared to the prior year period.
Comparative Statistics
| | | ($ in millions) | | July 31, 2019 | | October 31, 2018 | | April 30, 2020 | | October 31, 2019 |
| Cash and cash equivalents | | $ | 112.7 |
| | $ | 77.7 |
| | $ | 79.8 |
| | $ | 89.0 |
|
| Total assets | | $ | 6,172.8 |
| | $ | 6,112.8 |
| | $ | 6,510.0 |
| | $ | 6,274.5 |
|
| Working capital | | $ | 261.4 |
| | $ | 554.4 |
| | $ | 140.9 |
| | $ | 52.8 |
|
| Total debt | | $ | 1,812.6 |
| | $ | 2,022.8 |
| | $ | 1,899.3 |
| | $ | 1,826.3 |
|
| Stockholders' equity | | $ | 3,615.5 |
| | $ | 3,307.8 |
| | $ | 3,627.4 |
| | $ | 3,628.6 |
|
| Ratio of debt to equity | | 0.50:1 |
| | 0.61:1 |
| | 0.52:1 |
| | 0.50:1 |
|
| Debt as a percentage of total capitalization | | 33 | % | | 38 | % | | 34 | % | | 33 | % |
Working Capital
The decreaseincrease in working capital at July 31, 2019April 30, 2020 from the end of fiscal 20182019 was primarily due to:
increasedecrease in short-term debt $352.9other current liabilities $67.8 million primarily due to timing of payments and a reduction in fiscal 2020 customer rebate accruals due to the decrease in sales resulting from the $400COVID-19 pandemic
decrease in accounts payable $21.4 million 2018 Term Loan Agreement entered into on November 1, 2018, partially offset by;due to timing of payments
increasedecrease in cash $35.0employee compensation and benefits of $18.4 million
increase in accounts receivables $30.0 million from increased revenueinventories $61.3 million; and
increase in inventories $33.3 million.prepaid expense and other current assets $17.2 million; partially offset by
decrease in trade accounts receivable $66.5 million due to lower sales and timing of collections; and
recognition of current operating lease liabilities $31.5 million on adoption of ASC 842 Leases
At July 31, 2019,April 30, 2020, our inventory months on hand were 6.68.5 compared to 6.36.4 at October 31, 2018.2019. The $33.3$61.3 million increase in inventories was primarily due to increase in finished goods and raw materials to support demand and production levels.lower sales.
Our days sales outstanding (DSO) was 54increased to 67 days at July 31, 2019, 53April 30, 2020, compared to 56 days at October 31, 2018 and 56 days at July 31, 2018. The decrease in DSO from July 31, 2018 to July 31, 2019, was primarily due to increased revenuelower sales and timing of collections.
Operating Cash Flow
Cash provided by operating activities increased by $81.0 million from $432.3 million in the first nine months38
increase in net income of $306.5 million from a net income of $39.2 million in the first nine months of fiscal 2018 to $345.7 million in the first nine months of fiscal 2019
increase of $119.0 million in net cash flow from changes in operating capital, from $141.1 million outflow in the first nine months of fiscal 2018 to $22.1 million outflow in fiscal 2019, partially offset by;Contents
THE COOPER COMPANIES, INC. AND SUBSIDIARIES
Item 2. Management’s Discussion and Analysis of Financial Condition
and Results of Operations
Operating Cash Flow
Cash provided by operating activities decreased by $161.1 million from $316.6 million during the first half of fiscal 2019 to $155.5 million in the first half of fiscal 2020. This decrease in cash flow provided by operating activities primarily consists of:
decrease in net income of $306.7$123.5 million from a net income of $225.5 million in the first half of fiscal 2019 to $102.0 million in the first half of fiscal 2020; and
increase of $100.1 million in net cash outflow from changes in operating capital, from $19.7 million outflow in the first half of fiscal 2019 to $119.8 million outflow in the first half of fiscal 2020, partially offset by;
increase of $43.6 million in non-cash items, from $305.2$(9.7) million induring the first nine monthshalf of fiscal 20182019 to $(1.5)$33.9 million in fiscal 2019
decrease of $24.4 million in impairment of intangibles, from $24.4 million induring the first nine monthshalf of fiscal 2018 to nil in fiscal 2019. Impairment charge was recognized by CooperSurgical on its exit of the carrier screening and non-invasive prenatal testing (NIPT) product lines in prior year period
increase of $19.0 million from gain on sale of an intangible asset by CooperSurgical of the Filshie Clip exclusive distribution right.2020.
The increasedecrease in net income of $306.5$123.5 million iswas caused primarily due to a $196.7 million provisional tax expense charge related toby the 2017 Act which unfavorably impacted fiscal 2018.negative impact of COVID-19 on sales, higher unabsorbed fixed overhead costs, labor inefficiencies, higher cost of production and higher freight charges, partially offset by decrease in operating expenses.
The $119.0$100.1 million increasedecrease in the net cash flow from changes in operating capital compared to the prior year period is primarily due to:
$70.871.7 million increasedecrease in the net changes in accountsaccrued liabilities and other receivablesprimarily due to impact from increased revenueadoption of ASC 842, Leases and a reduction in customer rebate accruals as a result of the decrease in sales
$89.543.6 million increasedecrease in the net changes in prepayments and other assets primarily due to a $42.0 million paymentthe refund of the prepayment made to the U.K. Tax Authorities in the prior year period compared to a $29.0
$36.8 million refunddecrease in the current yearnet changes in inventories primarily due to lower sales
$12.424.9 million decrease in the net changes in income tax payable, partially offset by;
$88.7 million increase in the net changes in accounts payable, partially offset by;
$16.9 milliontrade and other receivables primarily from decrease in the net changes in inventories
$36.9 million decrease in the net changes in accrued liabilities.accounts receivable due to lower sales and timing of collections.
The $306.7$43.6 million decrease fromincrease in non-cash items compared to the prior year period iswas primarily due to:
decreaseincrease of $238.2$26.1 million driven by net changes in long term tax liabilities, deferred taxes and defined benefit pension
$50.216.0 million of step-up charges related to inventory acquired mainly from PARAGARD in the prior year period
decrease of $6.8 million driven by net changes in other long-term assets.non-cash lease expense
Investing Cash Flow
Cash used in investing activities decreased by $1,204.6$13.2 million to $266.4$169.5 million in the first nine monthshalf of fiscal 2020 from $182.7 million in the first half of fiscal 2019 from $1,471.0 million in fiscal 2018 due to:
decrease of $1,261.7 million in payments made for acquisitions in the first nine months | |
| • | decrease of $39.6 million in payments made for acquisitions in the first half of fiscal 2020 compared to the prior year period, largely due to the acquisition of Incisive Surgical Inc. and Blanchard Contact Lensesin the first half of fiscal 2019, compared to the prior year period, largely due to the acquisition of PARAGARD at $1.1 billion in first quarter of fiscal 2018, partially offset by; |
increase of $57.1$26.4 million in capital expenditures primarily used to invest in the expansion of our manufacturing capacity.
Financing Cash Flow
Cash provided byflows from financing activities decreasedincreased by $1,320.0$117.1 million to $212.3$8.4 million cash inflow in the first half of fiscal 2020 compared to $108.7 million outflow in the first nine monthshalf of fiscal 2019, compared to $1,107.7 million inflow in first nine months of fiscal 2018, primarily due to:
THE COOPER COMPANIES, INC. AND SUBSIDIARIES
Item 2. Management’s Discussion and Analysis of Financial Condition
and Results of Operations
$1,666.01,437.2 million decrease of netincrease in proceeds from long-term debt, primarily due to additional debt takenfunds received from the Revolving Credit and Term Loan Agreement entered into on to fund the PARAGARD acquisition in prior year period
$6.1 million share repurchases were made in the first nine months of fiscal 2019 compared to nil in the fiscal 2018,April 1, 2020, partially offset by;
$330.8842.5 million increase in repayments of long-term debt, primarily related to termination of 2017 Term Loan Agreement and the 2016 Credit Agreement
$427.4 million decrease in net proceeds from short-term notes payable,debt, primarily due to $400 million short term loan taken on November 1, 20182018.
$17.5On April 1, 2020, the Company entered into a Revolving Credit and Term Loan Agreement (the 2020 Credit Agreement), among the Company and KeyBank National Association, as administrative agent. The 2020 Credit Agreement provides for (a) a multicurrency revolving credit facility (the 2020 Revolving Credit Facility) in an aggregate principal amount of $1.290 billion and (b) a term loan facility (the 2020 Term Loan Facility) in an aggregate principal amount of $850.0 million, each of which, unless terminated earlier, mature on April 1, 2025. In addition, the Company has the ability from time to time to request an increase to the size of the revolving credit facility or establish one or more new term loans under the term loan facility in net changes inan aggregate amount up to $1.605 billion, subject to the net proceeds related to share-based compensation awards.discretionary participation of the lenders.
TheOn April 1, 2020, in connection with the Company’s entry into the 2020 Credit Agreement, the Company terminated the 2017 Term Loan Agreement containsand the 2016 Credit Agreement. In connection with the termination, all borrowings outstanding under the 2017 Term Loan Agreement and the 2016 Credit Agreement were repaid.
The following is a summary of the maximum commitments and the net amounts available to us under different credit facilities as of April 30, 2020:
|
| | | | | | | | | | | | | | | | | | |
| (In millions) | | Facility Limit | | Outstanding Borrowings | | Outstanding Letters of Credit | | Total Amount Available | | Maturity Date |
| 2020 Revolving Credit Facility | | $ | 1,290.0 |
| | $ | 495.0 |
| | $ | 1.2 |
| | $ | 793.8 |
| | April 1, 2025 |
| 2020 Term Loan Facility | | 850.0 |
| | 850.0 |
| | n/a |
| | — |
| | April 1, 2025 |
| 2019 Term Loan | | 500.0 |
| | 500.0 |
| | n/a |
| | — |
| | September 25, 2020 |
| Total | | $ | 2,640 |
| | $ | 1,845 |
| | $ | 1.2 |
| | $ | 793.8 |
| | |
The 2020 Credit Agreement and the 2019 Term Loan Agreement contain customary restrictive covenants, as well as financial covenants that require the Company to maintain a certain Total Leverage Ratio and Interest Coverage Ratio (each as defined in the 2017 Term Loan Agreement) consistent with the 2016 Credit Agreement.Ratio. As defined, in the 2018 Term Loan Agreement, the 2017 Term Loan2020 Credit Agreement and the 2016 Credit2019 Term Loan Agreement, we are required to maintain an Interest Coverage Ratio of at least 3.00 to 1.00, and a Total Leverage Ratio of no higher than 3.75 to 1.00. At April 30, 2020, we were in compliance with the Interest Coverage Ratio at 15.00 to 1.00 and the Total Leverage Ratio at 2.18 to 1.00.
See Note 6. Debt of the Consolidated Condensed Financial Statements for additional information.
While the potential economic impact resulting from the COVID-19 pandemic and the duration of the pandemic's impact are difficult to assess or predict, the impact of the COVID-19 pandemic on the global financial markets may reduce our ability to access capital, which could negatively impact our short-term and long-term liquidity. In consideration of the significant uncertainty created by the COVID-19 pandemic, we are continuing to assess our liquidity and anticipated capital requirements. Notwithstanding the significant uncertainty created by the COVID-19 pandemic, we believe future cash flow from operating activities and availability under our 2020 Credit Agreement will be sufficient to meet our anticipated cash needs, including working capital needs, capital expenditures and contractual obligations for at least 12 months from the issuance date of the consolidated condensed financial statements included in this quarterly report. To the extent additional funds are necessary to meet our liquidity needs such as that for acquisitions, share repurchases, cash dividends or other activities as we execute our business strategy, we anticipate that additional funds will be obtained through the incurrence of additional indebtedness, additional equity financings or a combination of these potential sources of funds; however, such financing may not be available on favorable terms, or at all.
THE COOPER COMPANIES, INC. AND SUBSIDIARIES
Item 2. Management’s Discussion and Analysis of Financial Condition
and Results of Operations
At July 31, 2019, we had $998.8 million available under the 2016 Credit Agreement. We are in compliance with our financial covenants including the Interest Coverage Ratio at 12.24 to 1.00 and the Total Leverage Ratio at 1.83 to 1.00 for the 2018 Term Loan Agreement, the 2017 Term Loan Agreement and the 2016 Credit Agreement.
Share Repurchase
In December 2011, our Board of Directors authorized the 2012 Share Repurchase Program and through subsequent amendments, the most recent in March 2017, the total repurchase authorization was increased from $500.0 million to $1.0 billion of the Company's common stock. The program has no expiration date and may be discontinued at any time. Purchases under the 2012 Share Repurchase Program are subject to a review of the circumstances in place at the time and may be made from time to time as permitted by securities laws and other legal requirements.
We did not repurchase shares in
During the third and second quartersquarter of fiscal 2019.2020, we repurchased 160.8 thousand shares of the Company's common stock for $47.8 million, at an average purchase price of $296.88 per share. There was no share repurchase activity during the first quarter of fiscal 2020. During the first quarterhalf of fiscal 2019, we repurchased 24.5 thousand shares of the Company'sour common stock for $6.1 million at an average purchase price of $248.70 per share. We did not repurchase shares during the nine months ended July 31, 2018. At July 31, 2019, $557.4April 30, 2020, $359.7 million remains authorized for repurchase under the program.
Summary of Non-GAAP Financial Measures
The non-GAAP financial measures that may be included in this MD&A and the reasons management believes they are useful to investors are described below. These measures should be considered supplemental in nature and are not intended to be a substitute for the related financial information prepared in accordance with U.S. GAAP. In addition, these measures may not be the same as similarly named measures presented by other companies.
Free cash flow is defined as cash provided by operating activities less capital expenditures. Management believes free cash flow is useful for investors as an additional measure of liquidity because it represents cash that is available to grow the business, make strategic acquisitions, repay debt, buyback common stock or fund the dividend. We use free cash flow internally to understand, manage, make operating decisions and evaluate our business. In addition, we use free cash flow to help plan and forecast future periods.
Constant currency is defined as excluding the effect of foreign currency rate fluctuations. In order to assist with the assessment of how our underlying businesses performed, we compare the percentage change in revenues from one period to another, excluding the effect of foreign currency fluctuations. To present this information, current period revenue for entities reporting in currencies other than the United States dollar are converted into United States dollars at the average foreign exchange rates for the corresponding period in the prior year.
Estimates and Critical Accounting Policies
Information regarding estimates and critical accounting policies is included in Management's Discussion and Analysis on Form 10-K for the fiscal year ended October 31, 2018.2019. There have been no material changes in our policies from those previously discussed in our Form 10-K for the fiscal year October 31, 2018, with the exception of our critical accounting policies related to the adoption of ASU 2014-09, Revenue from Contracts with Customers (ASC 606) effective November 1, 2018. See Note 2. Revenue Recognition of the Consolidated Financial Statements for additional information.2019.
Accounting Pronouncements
Information regarding new accounting pronouncements is included in Note 1. General of the Consolidated Condensed Financial Statements.Statements of this Quarterly Report on Form 10-Q.
Trademarks
Aquaform®, Avaira®, Avaira Vitality®, Biofinity®, MyDay®, MiSight®, ActiveControl® and Proclear® are registered trademarks of The Cooper Companies, Inc., its affiliates and/or subsidiaries. PC Technology™, and FIPS™, and A Quality of Life Company™ are trademarks of The Cooper Companies, Inc., its affiliates and/or subsidiaries. The clariti® mark is a registered trademark of The Cooper Companies, Inc., its affiliates and/or subsidiaries worldwide except in the United States where the use of clariti® is licensed. PARAGARD® is a registered trademark of CooperSurgical, Inc.
THE COOPER COMPANIES, INC. AND SUBSIDIARIES
Item 3. Quantitative and Qualitative Disclosure About Market Risk
Most of our operations outside the United States have their local currency as their functional currency. We are exposed to risks caused by changes in foreign exchange, principally our British pound sterling, euro, Japanese yen, Danish krone Swedish krona and Australian dollar denominated debt and receivables denominated in currencies other than the United States dollar, and from operations in other foreign currencies. Although we may enter into foreign exchange agreements with financial institutions to reduce our exposure to fluctuations in foreign currency values relative to our debt or receivables obligations, these hedging transactions do not eliminate that risk entirely. We are also exposed to risks associated with changes in interest rates, as the interest rates on our revolving lines of credit and term loans may vary with the federal funds rate and LIBO rate.LIBOR. We may decrease this interest rate risk by hedging a portion of variable rate debt effectively converting it to fixed rate debt for varying periods. On April 6, 2020, we entered into six interest rate swap contracts to hedge variable cash flows associated with LIBOR. The interest rate swap contracts became effective on April 6, 2020 and have maturities of seven years or less with a total notional amount of $1.5 billion. The Company did not have any derivative assets or liabilities that may include interest rate swaps, cross currency swaps or foreign currency forward contracts as of July 31, 2019 and October 31, 2018.
On November 1, 2018,September 27, 2019, we extended the Company entered into a 364-day, $400.0 million, senior unsecured term loan agreement by and amongmaturity of the Company, the lenders party thereto and PNC Bank, National Association, as administrative agent which matures on October 31, 2019 (the 2018 Term Loan Agreement to September 25, 2020 and increased the amount to $500.0 million (as so amended, the 2019 Term Loan Agreement). The CompanyWe used the additional funds to partially repay outstanding borrowings under the 2016 Revolving Credit Facility.2017 Term Loan Agreement. At July 31, 2019, weApril 30, 2020, the Company had $325.0$500 million outstanding under the 20182019 Term Loan Agreement.
On November 1, 2017, in connection with the PARAGARD acquisition, we entered into a five-year, $1.425 billion, senior unsecured term loan agreement (the 2017 Term Loan Agreement) by and among the Company,us, the lenders party thereto and DNB Bank ASA, New York Branch, as administrative agent which matures on November 1, 2022. The CompanyWe used part of the facility to fund the PARAGARD acquisition and used the remainder of the funds to partially repay outstanding borrowings under our revolving credit agreement. At July 31, 2019, we had $1.425 billionOn April 1, 2020, in connection with the Company’s entry into the 2020 Credit Agreement, the Company terminated the 2017 Term Loan Agreement. In connection with the termination, all borrowings outstanding under the 2017 Term Loan Agreement.
On March 1, 2016, wethe Company entered into a syndicated Revolving Credit and Term Loan Agreement (the 2016 Credit Agreement) with, among the Company, CooperVision International Holding Company, LP, the lenders party thereto and KeyBank National Association, as administrative agent. The agreement2016 Credit Agreement provides for a multicurrencymulti-currency revolving credit facility in an aggregate principal amount of $1.0 billion (the 2016 Revolving Credit Facility) and a term loan facility in thean aggregate principal amount of $830.0 million (the 2016 Term Loan Facility). The 2016 Credit Agreement replaced our previous credit agreement and funds, each of which, unless terminated earlier, mature on March 1, 2021. In addition, the Company has the ability from time to time to request an increase to the size of the 2016 Term LoanRevolving Credit Facility were used to repay the outstanding amounts under the previous credit agreement, to partially repay our other outstandingor establish one or more new term loans and for general corporate purposes. At July 31, 2019, we had no outstanding balance under the 2016 Term Loan Facility and $998.8in an aggregate amount up to $750.0 million, availablesubject to the discretionary participation of the lenders. On April 1, 2020, in connection with the Company’s entry into the 2020 Credit Agreement, the Company terminated the 2016 Credit Agreement. In connection with the termination, all letters of credit outstanding under the 2016 Revolving Credit Facility.Agreement were transferred to the 2020 Credit Agreement.
If interest rates were to increase or decrease by 1% or 100 basis points, quarterly interest expense would increase or decrease by approximately $4.8$0.7 million based on average debt outstanding, after consideration of our interest rate swap contracts, for the thirdsecond quarter of fiscal 2019.2020.
See Note 6. Debt of the Consolidated Condensed Financial Statements for additional information.
THE COOPER COMPANIES, INC. AND SUBSIDIARIES
Item 4. Controls and Procedures
Evaluation of Disclosure Controls and Procedures
Based on management’s evaluation (with the participation of our Chief Executive Officer (our Principal Executive Officer) and Chief Financial Officer (our Principal Financial Officer)), as of the end of the period covered by this report, our Chief Executive Officer and Chief Financial Officer have concluded that our disclosure controls and procedures (as defined in Rules 13a-15(e) and 15d-15(e) under the Securities Exchange Act of 1934, as amended, (the Exchange Act)) are effective to provide reasonable assurance that information required to be disclosed by us in reports that we file or submit under the Exchange Act is recorded, processed, summarized and reported within the time periods specified in Securities and Exchange Commission rules and forms and is accumulated and communicated to management, including our Chief Executive Officer and Chief Financial Officer, as appropriate to allow timely decisions regarding required disclosure.
Changes in Internal Control over Financial Reporting
There has been no change in our internal control over financial reporting identified in connection with the evaluation required by Rule 13a-15(d) and 15d-15(d) of the Exchange Act that occurred during our thirdsecond quarter of fiscal 2019,2020, that has materially affected, or is reasonably likely to materially affect, our internal control over financial reporting.
THE COOPER COMPANIES, INC. AND SUBSIDIARIES
PART II—OTHER INFORMATION
Item 1. Legal Proceedings
Since March 2015, over 50 putative class action complaints were filed by contact lens consumers alleging that contact lens manufacturers,Information regarding legal proceedings is included in conjunction with their respective Unilateral Pricing Policy (UPP), conspired to reach agreements between each other and certain distributors and retailers regarding the prices at which certain contact lenses could be sold to consumers. The plaintiffs are seeking damages against CooperVision, Inc., other contact lens manufacturers, distributors and retailers, in various courts around the United States. In June 2015, allNote 13. Contingencies of the class action cases were consolidated and transferred to the United States District Court for the Middle District of Florida. In August 2017, CooperVision entered into a settlement agreement with the plaintiffs, without any admission of liability, to settle all claims against CooperVision. In July 2018, the Court approved the plaintiffs’ motion for preliminary approval of the settlement, and the Company paid the $3.0 million settlement amount into an escrow account. The settlement remains subject to final Court approval at a future hearing to be set by the Court.this Quarterly Report on Form 10-Q.
The Company is involved in various lawsuits, claims and other legal matters from time to time that arise in the ordinary course of conducting business, including matters involving our products, intellectual property, supplier relationships, distributors, competitor relationships, employees and other matters. The Company does not believe that the ultimate resolution of these proceedings or claims pending against it could have a material adverse effect on its financial condition or results of operations. At each reporting period, the Company evaluates whether or not a potential loss amount or a potential range of loss is probable and reasonably estimable under Financial Accounting Standards Board (FASB) Accounting Standards Codification (ASC) 450, Contingencies. Legal fees are expensed as incurred.
Item 1A. Risk Factors
Our business faces significant risks. These risks include those described below and may include additional risks and uncertainties not presently known to us or that we currently deem immaterial. Our business, financial condition and results of operations could be materially adversely affected by any of these risks, and the trading prices of our common stock could decline by virtue of these risks. These risks should be read in conjunction with the other information in this report.
Risk factors describing the major risks to our business can be found under Item 1A. Risk Factors in our Annual Report on Form 10-K for the fiscal year ended October 31, 2018.2019. In the first half of fiscal 2020, we updated some of our risk factors as described below. There have beenare no other material changes in our risk factors from those previously discussed in our Form 10-K for the fiscal year ended October 31, 2018.2019.
Our substantial and expanding international operations are subject to uncertainties which could affect our operating results.
A significant portion of our current operations are conducted and located outside the United States, and our growth strategy involves expanding our existing foreign operations and entering into new foreign jurisdictions. We have significant manufacturing and distribution sites in North America, Latin America and Europe. Over half of our net sales for the fiscal years ended October 31, 2019 and 2018, were derived from the sale of products outside the United States. We believe that sales outside the United States will continue to account for a material portion of our total net sales for the foreseeable future. International operations and business expansion plans are subject to numerous additional risks, including:
we may have difficulty enforcing intellectual property rights in some foreign countries;
we may have difficulty gaining market share in countries such as Japan and China because of regulatory restrictions and customer preferences;
we may find it difficult to grow in emerging markets such as China, India, Russia, Brazil and other developing nations due to, among other things, customer acceptance, undeveloped and/or unfamiliar distribution channels, regulatory restrictions and changes, and business knowledge of these new markets;
tax rates in some foreign countries may exceed those of the United States, and foreign earnings may be subject to withholding requirements or the imposition of tariffs, exchange controls or other restrictions, including the tariffs enacted by the U.S. government on various imports from China and by the Chinese government on certain U.S. goods, the scope and duration of which remain uncertain;
we may find it difficult to comply with a variety of United States and foreign legal, compliance and regulatory requirements such as the Foreign Corrupt Practices Act, the Dodd-Frank Wall Street Reform and Consumer Protection Act, the United Kingdom (U.K.) Bribery Act and international data security and privacy laws and MDR and IVDR;
we may find it difficult to manage a large organization spread throughout various countries;
fluctuations in currency exchange rates could adversely affect our results;
foreign customers may have longer payment cycles than customers in the United States;
failure to comply with United States Department of Commerce and other nations' import-export controls may result in fines and/or penalties;
general economic and political conditions in the countries where we operate may have an adverse effect on our operations in those countries or not be favorable to our growth strategy;
natural disasters (including pandemics), war, terrorism, labor disruptions and international conflicts may cause significant economic disruption and political and social instability, resulting in decreased demand for our products, adversely affecting our manufacturing and distribution capabilities, or causing interruptions in our supply chain;
foreign governments may adopt regulations, including those similar to MDR and IVDR or take other actions that would have a direct or indirect adverse impact on our business and market opportunities, including but not limited to increased enforcement of potentially conflicting and ambiguous anti-bribery laws;
we may have difficulty enforcing agreements and collecting receivables through some foreign legal systems; and
we may be subject to unforeseen economic or political events in certain countries that may have an impact on our customers' ability or preferences to buy our products.
As we continue to expand our business globally, our success will depend, in large part, on our ability to anticipate and effectively manage these and other risks associated with our international operations. However, any of these factors could adversely affect our international operations and, consequently, our operating results.
Our results of operations have been adversely affected, and our results of operations, cash flow and financial condition could be materially adversely affected in the future, by the global COVID-19 coronavirus pandemic and related economic disruptions.
The current global pandemic caused by the spread of the novel strain of coronavirus referred to as “COVID-19" has negatively impacted business and healthcare activity globally and has created significant volatility, uncertainty and economic disruption within the markets in which we operate. The pandemic has adversely affected and is likely to further adversely affect nearly all aspects of our business and markets, including our sales, operations, cash flow and workforce and the operations of our customers, suppliers, vendors and business partners. Among other things, many of our optical retailer, hospital, medical office and fertility clinic customers have closed their facilities, restricted access, or delayed or cancelled patient visits, exams and elective medical procedures in response to the pandemic, which has resulted in reduced demand for and sales of our products and services.
If the COVID-19 pandemic continues and conditions worsen, our results of operations, cash flow and financial condition could be materially adversely affected in numerous ways, including, but not limited to, decreased revenues from sales of our products and services due to customer facility closures, restricted access and reduced patient visits, exams and elective medical procedures; disruption in the manufacture and distribution of our products, including increased manufacturing and distribution costs, reduced manufacturing capacity and inadequate inventory levels; increased risk of inventory that may expire; write-offs or obsolescence of inventory, equipment or other assets; disruptions to our raw material and product suppliers and broader supply chain and distribution systems; delays in our clinical trials which could negatively impact our new product pipeline milestones and regulatory clearances and approvals; extended delays in or defaults on payments of outstanding receivables; insolvency of customers, suppliers, vendors and business partners; an inability to access lending, capital markets and other sources of liquidity when needed on reasonable terms or at all; an inability to comply with financial covenants in our debt agreements; and future restructuring, impairment and other charges.
The extent to which the COVID-19 pandemic and related economic disruptions impact our business, results of operations, cash flow and financial condition will depend on future developments, which are highly uncertain, difficult to predict and largely outside of our control, including, but not limited to, the continued spread, duration and severity of the pandemic outbreak; the occurrence, spread, duration and severity of any subsequent wave or waves of outbreaks after the initial outbreak has subsided; the impact on our customers and suppliers; the actions taken by the U.S. and foreign governments to contain the pandemic, address its impact or respond to the reduction in global and local economic activity; the occurrence, duration and severity of a global, regional or national recession, depression or other sustained adverse market event; and how quickly and to what extent normal economic and operating conditions can resume. Even after the COVID-19 pandemic has subsided, we may continue to experience materially adverse effects on our results of operations and financial condition. In addition to the other information set forth in this report, you should carefully consider the known risks described in the “Risk Factors” section of our Annual Report on Form 10-K for the year ended October 31, 2019 which may be heightened by the COVID-19 pandemic and related economic disruption and could materially adversely affect our business.
The results of the United Kingdom’s withdrawal from the European Union may have a negative effect on global economic conditions, financial markets and our business.
We are a multinational company headquartered in the United States with worldwide operations, with significant business operations in Europe, including in the United Kingdom. In June 2016, a majority of voters in the United Kingdom elected to withdraw from the European Union in a national referendum (Brexit). In March 2017, the government of the United Kingdom formally gave notice of its intent to withdraw from the European Union (EU). On January 31, 2020, the United Kingdom ceased to be a member state of the EU. EU law applicable to the United Kingdom continues to apply to and in the United Kingdom for the duration of a transition period which is presently scheduled to expire on December 31, 2020 (the
“Transition Period”). During the Transition Period, the EU and the United Kingdom will negotiate the terms of their future relationship. There is no assurance that such negotiations will be successful and it is uncertain what, if any, laws similar to those of the EU will continue to apply in and to the United Kingdom following the expiration of the Transition Period. Since a significant proportion of the United Kingdom’s regulatory framework is derived from EU directives and regulations, EU law ceasing to apply in and to the United Kingdom following the expiration of the Transition Period could materially impact the regulatory regime with respect to the movement and approval of our products to and from the United Kingdom and EU. We could face new regulatory costs and challenges that could have a material adverse effect on our business, financial condition, cash flows and results of operations. Until expiration of the Transition Period and the future relationship between the EU and the United Kingdom is established, it is difficult to anticipate Brexit’s potential impact.
Cybersecurity threats continue to increase in frequency and sophistication; a successful cybersecurity attack could interrupt or disrupt our information technology systems or cause the loss of confidential or protected data which could disrupt our business, force us to incur excessive costs or cause reputational harm.
The size and complexity of our information systems make such systems potentially vulnerable to service interruptions or to security breaches from inadvertent or intentional actions by our employees or vendors, or from attacks by malicious third parties. Such attacks are of ever-increasing levels of sophistication and are made by groups and individuals with a wide range of motives and expertise. Like many other companies, we experience attempted cybersecurity actions on a frequent basis, and the frequency of such attempts could increase in the future. While we have invested in the protection of data and information technology, there can be no assurance that our efforts will prevent or quickly identify service interruptions or security breaches. Any such interruption or breach of our systems could adversely affect our business operations and/or result in the loss of critical or sensitive confidential information or intellectual property, and could result in financial, legal, business and reputational harm to us. We maintain cyber liability insurance; however, this insurance may not be sufficient to cover the financial, legal, business or reputational losses that may result from an interruption or breach of our systems.
THE COOPER COMPANIES, INC. AND SUBSIDIARIES
Item 2. Unregistered Sales of Equity Securities and Use of Proceeds
Issuer Purchases of Equity Securities
There was noThe Company's share repurchase activity during the three-month period ended July 31, 2019.April 30, 2020, was as follows:
|
| | | | | | | | | | | | | | |
| Period | | Total Number of Shares Purchased | | Average Price Paid Per Share | | Total Number of Shares Purchased as Part of Publicly Announced Plans or Programs | | Maximum Approximate Dollar Value of Shares that May Yet Be Purchased Under Publicly Announced Plans or Programs |
| 2/1/20 - 2/29/20 | | — |
| | $ | — |
| | — |
| | $ | 407,400,000 |
|
| 3/1/20 - 3/31/20 | | — |
| | $ | — |
| | — |
| | $ | 407,400,000 |
|
| 4/1/20 - 4/30/20 | | 160,850 |
| | $ | 296.88 |
| | 160,850 |
| | $ | 359,700,000 |
|
| Total | | 160,850 |
| | $ | 296.88 |
| | 160,850 |
| | |
The Share Repurchase Program wastransactions described in the table above represent the repurchase of the Company’s common stock on the New York Stock Exchange as part of the share repurchase program approved by the Company’s Board of Directors in December 2011 (the 2012 Share Repurchase Program). The program as amended in December 2012, December 2013 and March 2017 provides authorization to repurchase up to a total of $1.0 billion of the Company's common stock. Purchases under the 2012 Share Repurchase Program may be made from time-to-time on the open market at prevailing market prices or in privately negotiated transactions and are subject to a review of the circumstances in place at the time and will be made from time to time as permitted by securities laws and other legal requirements. This program has no expiration date and may be discontinued at any time.
During the second quarter of fiscal 2020, we repurchased 160.8 thousand shares of the Company's common stock for $47.8 million, at an average purchase price of $296.88 per share. There was no share repurchase activity during the first quarter of fiscal 2020. There was no share repurchase activity during the six months ended April 30, 2019.
At July 31, 2019,April 30, 2020, approximately $557.4$359.7 million remained authorized under the 2012 Share Repurchase Program.
Item 3. Defaults Upon Senior Securities
None.
Item 4. Mine Safety Disclosures
Not applicable.
Item 5. Other Information
None.
THE COOPER COMPANIES, INC. AND SUBSIDIARIES
Item 6. Exhibits
|
| |
Exhibit Number | Description |
| |
| 10.1 | Revolving Credit and Term Loan Agreement, dated as of April 1, 2020, among the Company, CooperVision International Holding Company, LP, CooperSurgical Netherlands B.V., CooperVision Holding Kft., the lenders from time to time party thereto and KeyBank National Association, as administrative agent, incorporated by reference to Exhibit 10.1 to the Company’s Current Report on Form 8-K dated April 2, 2020.
|
| |
| 10.2 |
|
| |
| 10.3 |
|
| | |
| 31.1 | |
| | |
| 31.2 | |
| | |
| 32.1 | |
| | |
| 32.2 | |
| | |
| 101.1 | The following materials from the Company's Quarterly Report on Form 10-Q for the three and ninesix months period ended July 31, 2019,April 30, 2020 formatted in Inline XBRL (Extensible Business Reporting Language): (i) Consolidated Statements of Income for the three and nine months ended July 31, 2019 and 2018, (ii) Consolidated Statements of Comprehensive Income, for the three and nine months ended July 31, 2019 and 2018, (iii)(ii) Consolidated Condensed Balance Sheets, at July 31, 2019 and October 31, 2018, (iv)(iii) Consolidated Condensed Statements of Stockholders' Equity, for the three and nine months period ended July 31, 2019 and 2018 (v)(iv) Consolidated Condensed Statements of Cash Flows for the nine months ended July 31, 2019 and 2018 and (vi)(v) related Notes to Consolidated Condensed Financial Statements. |
| | |
| 104.1 | Cover Page Interactive Data File (embedded within the Inline XBRL document) |
THE COOPER COMPANIES, INC. AND SUBSIDIARIES
SIGNATURE
Pursuant to the requirements of the Securities Exchange Act of 1934, the Registrant has duly caused this report to be signed on its behalf by the undersigned thereunto duly authorized.
|
| |
| | The Cooper Companies, Inc. |
| | (Registrant) |
| | |
Date: August 30, 2019June 5, 2020 | /s/ Brian G. Andrews |
| | Brian G. Andrews |
| | Senior Vice President, Chief Financial Officer & Treasurer (Principal Financial Officer) |
| | |
| | |
| | |
Date: August 30, 2019June 5, 2020 | /s/ Agostino Ricupati |
| | Agostino Ricupati |
| | Chief Accounting Officer & Senior Vice President, Finance & Tax (Principal Accounting Officer) |