UNITED STATES
SECURITIES AND EXCHANGE COMMISSION
Washington, DC 20549
FORM 10-Q
|
| |
| ☒ | QUARTERLY REPORT PURSUANT TO SECTION 13 OR 15(d) OF THE SECURITIES EXCHANGE ACT OF 1934 |
For the quarterly period ended March 31, 20182019
or
|
| |
☐
| TRANSITION REPORT PURSUANT TO SECTION 13 OR 15(d) OF THE SECURITIES EXCHANGE ACT OF 1934 |
For the transition period from to
Commission file number 001-09718
The PNC Financial Services Group, Inc.
(Exact name of registrant as specified in its charter)
|
| | |
| Pennsylvania | | 25-1435979 |
(State or other jurisdiction of incorporation or organization) | | (I.R.S. Employer Identification No.) |
The Tower at PNC Plaza, 300 Fifth Avenue, Pittsburgh, Pennsylvania 15222-2401
(Address of principal executive offices, including zip code)
(888) 762-2265
(Registrant’s telephone number including area code)
(Former name, former address and former fiscal year, if changed since last report)
Indicate by check mark whether the registrant: (1) has filed all reports required to be filed by Section 13 or 15(d) of the Securities Exchange Act of 1934 during the preceding 12 months (or for such shorter period that the registrant was required to file such reports), and (2) has been subject to such filing requirements for the past 90 days. Yes ☒ No ☐
Indicate by check mark whether the registrant has submitted electronically and posted on its corporate Web site, if any, every Interactive Data File required to be submitted and posted pursuant to Rule 405 of Regulation S-T (§232.405 of this chapter) during the preceding 12 months (or for such shorter period that the registrant was required to submit and post such files). Yes ☒ No ☐
Indicate by check mark whether the registrant is a large accelerated filer, an accelerated filer, a non-accelerated filer, a smaller reporting company, or an emerging growth company. See the definitions of “large accelerated filer”, “accelerated filer”, “smaller reporting company”, and “emerging growth company” in Rule 12b-2 of the Exchange Act.
|
| | | | | | |
| Large accelerated filer | | ☒ | | Accelerated filer | | ☐ |
| Non-accelerated filer | | ☐ | | Smaller reporting company | | ☐ |
| | | | | Emerging growth company | | ☐ |
If an emerging growth company, indicate by check mark if the registrant has elected not to use the extended transition period for complying with any new or revised financial accounting standards provided pursuant to Section 7(a)(2)(B) of the Securities Act. ☐
Indicate by check mark whether the registrant is a shell company (as defined in Rule 12b-2 of the Exchange Act).
Yes ☐ No ☒
Securities registered pursuant to Section 12(b) of the Act:
|
| | |
| Title of Each Class | Trading Symbol(s) | Name of Each Exchange on Which Registered |
| Common Stock, par value $5.00 | PNC | New York Stock Exchange |
Depositary Shares Each Representing a 1/4,000 Interest in a Share of Fixed-to- Floating Rate Non-Cumulative Perpetual Preferred Stock, Series P | PNC P | New York Stock Exchange |
Depositary Shares Each Representing a 1/4,000 Interest in a Share of 5.375% Non-Cumulative Perpetual Preferred Stock, Series Q | PNC Q | New York Stock Exchange |
As of April 20, 2018,19, 2019, there were 469,498,755451,437,916 shares of the registrant’s common stock ($5 par value) outstanding.
THE PNC FINANCIAL SERVICES GROUP, INC.
Cross-Reference Index to First Quarter 20182019 Form 10-Q
|
| |
| |
| | Pages |
| PART I – FINANCIAL INFORMATION | |
| Item 1. Financial Statements (Unaudited). | |
| |
| |
| |
| |
|
| |
| |
| |
| |
| |
| |
| |
| |
| |
| |
| |
| |
| |
| |
| |
| |
| |
| |
| |
| |
| |
| Item 2. Management’s Discussion and Analysis of Financial Condition and Results of Operations (MD&A). | |
| |
| |
| |
| |
| |
| |
| |
| |
| |
| |
| |
| |
| |
| Item 3. Quantitative and Qualitative Disclosures about Market Risk. | 20-37, 64-7318-33, 55-61 and 76-8164-69 |
| Item 4. Controls and Procedures. | |
| |
| |
| |
| |
| |
| |
| |
| |
THE PNC FINANCIAL SERVICES GROUP, INC.
Cross-Reference Index to First Quarter 20182019 Form 10-Q (continued)
| | | | | |
| MD&A TABLE REFERENCE | MD&A TABLE REFERENCE | | MD&A TABLE REFERENCE | |
| Table | Description | Page | Description | Page |
| 1 | | | | |
| 2 | | | | |
| 3 | | | | |
| 4 | | | | |
| 5 | | | | |
| 6 | | | | |
| 7 | | | | |
| 8 | | | | |
| 9 | | | | |
| 10 | | | | |
| 11 | | | | |
| 12 | | | | |
| 13 | | | | |
| 14 | | | | |
| 15 | | | | |
| 16 | | | | |
| 17 | | | | |
| 18 | | | | |
| 19 | | | | |
| 20 | | | | |
| 21 | | | | |
| 22 | | | | |
| 23 | | | | |
| 24 | | | | |
| 25 | | | | |
| 26 | | | | |
| 27 | | | | |
| 28 | | | | |
| 29 | | | | |
| 30 | | | | |
| 31 | | | | |
| 32 | | | | |
| 33 | | | |
| 34 | | | |
NOTES TO CONSOLIDATED FINANCIAL STATEMENTS TABLE REFERENCE | | |
| Table | Description | Page | |
| 35 | | | |
| 36 | | | |
| 37 | | | |
| 38 | | | |
| 39 | | | |
| 40 | | | |
| 41 | | | |
| 42 | | | |
| 43 | | | |
| 44 | | | |
| 45 | | | |
| 46 | | | |
| 47 | | | |
THE PNC FINANCIAL SERVICES GROUP, INC.
Cross-Reference Index to First Quarter 20182019 Form 10-Q (continued)
| | | | | |
NOTES TO CONSOLIDATED FINANCIAL STATEMENTS TABLE REFERENCE (Continued) | | |
| NOTES TO CONSOLIDATED FINANCIAL STATEMENTS TABLE REFERENCE | | NOTES TO CONSOLIDATED FINANCIAL STATEMENTS TABLE REFERENCE | |
| Table | Description | Page | Description | Page |
| 33 | | | |
| 34 | | | |
| 35 | | | |
| 36 | | | |
| 37 | | | |
| 38 | | | |
| 39 | | | |
| 40 | | | |
| 41 | | | |
| 42 | | | |
| 43 | | | |
| 44 | | | |
| 45 | | | |
| 46 | | | |
| 47 | | | |
| 48 | | | | |
| 49 | | | | |
| 50 | | | | |
| 51 | | | | |
| 52 | | | | |
| 53 | | | | |
| 54 | | | | |
| 55 | | | | |
| 56 | | | | |
| 57 | | | | |
| 58 | | | | |
| 59 | | | | |
| 60 | | | | |
| 61 | | | | |
| 62 | | | | |
| 63 | | | | |
| 64 | | | | |
| 65 | | | | |
| 66 | | | | |
| 67 | | | | |
| 68 | | | | |
| 69 | | | | |
| 70 | | | | |
| 71 | | | | |
| 72 | | | | |
| 73 | | | | |
| 74 | | | | |
| 75 | | | | |
| 76 | | | | |
| 77 | | | |
| 78 | | | |
FINANCIAL REVIEW
THE PNC FINANCIAL SERVICES GROUP, INC.
This Financial Review, including the Consolidated Financial Highlights, should be read together with our unaudited Consolidated Financial Statements and unaudited Statistical Information included elsewhere in this Quarterly Report on Form 10-Q (the Report or Form 10-Q) and with Items 6, 7, 8 and 9A of our 20172018 Annual Report on Form 10-K (2017(2018 Form 10-K). We have reclassified certain prior period amounts to conform with the current period presentation, which we believe is more meaningful to readers of our consolidated financial statements. For information regarding certain business, regulatory and legal risks, see the following: the Risk Management section of this Financial Review and of Item 7 in our 20172018 Form 10-K; Item 1A Risk Factors included in our 20172018 Form 10-K; and the Legal Proceedings and Commitments Notes of the Notes To Consolidated Financial Statements included in Item 1 of this Report and Item 8 of our 20172018 Form 10-K. Also, see the Cautionary Statement Regarding Forward-Looking Information section in this Financial Review and the Critical Accounting Estimates And Judgments section in this Financial Review and in our 20172018 Form 10-K for certain other factors that could cause actual results or future events to differ, perhaps materially, from historical performance and from those anticipated in the forward-looking statements included in this Report. See Note 14 Segment Reporting in the Notes To Consolidated Financial Statements included in this Report for a reconciliation of total business segment earnings to total PNC consolidated net income as reported on a generally accepted accounting principles (GAAP) basis. In this Report, “PNC”, “we” or “us” refers to The PNC Financial Services Group, Inc. and its subsidiaries on a consolidated basis (except when referring to PNC as a public company, its common stock or other securities issued by PNC, which just refer to The PNC Financial Services Group, Inc.). References to The PNC Financial Services Group, Inc. or to any of its subsidiaries are specifically made where applicable.
Table 1: Consolidated Financial Highlights
| | Dollars in millions, except per share data Unaudited | Three months ended March 31 | | Three months ended
March 31 |
| 2018 | 2017 | | 2019 | 2018 |
| Financial Results (a) | | | | |
| Revenue | | | | |
| Net interest income | $ | 2,361 |
| $ | 2,160 |
| | $ | 2,475 |
| $ | 2,361 |
|
| Noninterest income | 1,750 |
| 1,724 |
| | 1,811 |
| 1,750 |
|
| Total revenue | 4,111 |
| 3,884 |
| | 4,286 |
| 4,111 |
|
| Provision for credit losses | 92 |
| 88 |
| | 189 |
| 92 |
|
| Noninterest expense | 2,527 |
| 2,402 |
| | 2,578 |
| 2,527 |
|
| Income before income taxes and noncontrolling interests | $ | 1,492 |
| $ | 1,394 |
| | $ | 1,519 |
| $ | 1,492 |
|
| Net income | $ | 1,239 |
| $ | 1,074 |
| | $ | 1,271 |
| $ | 1,239 |
|
| Less: | | | | |
| Net income attributable to noncontrolling interests | 10 |
| 17 |
| | 10 |
| 10 |
|
| Preferred stock dividends | 63 |
| 63 |
| | 63 |
| 63 |
|
| Preferred stock discount accretion and redemptions | 1 |
| 21 |
| | 1 |
| 1 |
|
| Net income attributable to common shareholders | 1,165 |
| 973 |
| | 1,197 |
| 1,165 |
|
| Less: | | | | |
| Dividends and undistributed earnings allocated to nonvested restricted shares | 5 |
| 6 |
| | |
| Dividends and undistributed earnings allocated to participating securities | | 5 |
| 5 |
|
| Impact of BlackRock earnings per share dilution | 2 |
| 4 |
| | 3 |
| 2 |
|
| Net income attributable to diluted common shares | $ | 1,158 |
| $ | 963 |
| | $ | 1,189 |
| $ | 1,158 |
|
| Diluted earnings per common share | $ | 2.43 |
| $ | 1.96 |
| | $ | 2.61 |
| $ | 2.43 |
|
| Cash dividends declared per common share | $ | .75 |
| $ | .55 |
| | $ | .95 |
| $ | .75 |
|
| Effective tax rate (b) | 17.0 | % | 23.0 | % | | 16.3 | % | 17.0 | % |
| Performance Ratios | | | | |
| Net interest margin (c) | 2.91 | % | 2.77 | % | | 2.98 | % | 2.91 | % |
| Noninterest income to total revenue | 43 | % | 44 | % | | 42 | % | 43 | % |
| Efficiency | 61 | % | 62 | % | | 60 | % | 61 | % |
| Return on: | | | | |
| Average common shareholders’ equity | 11.04 | % | 9.50 | % | | 11.13 | % | 11.04 | % |
| Average assets | 1.34 | % | 1.19 | % | | 1.34 | % | 1.34 | % |
| |
| (a) | The Executive Summary and Consolidated Income Statement Review portions of this Financial Review section provide information regarding items impacting the comparability of the periods presented. |
| |
| (b) | The effective income tax rates are generally lower than the statutory rate due to the relationship of pretax income to tax credits and earnings that are not subject to tax. The first quarter 2018 results reflected the change in the statutory federal income tax rate from 35% to 21%, effective as of January 1, 2018, as a result of the new federal tax legislation. |
| |
| (c) | Calculated as annualized taxable-equivalent net interest income divided by average earninginterest-earning assets. To provide more meaningful comparisons of net interest margins, we use net interest income on a taxable-equivalent basis in calculating net interest margin by increasing the interest income earned on tax-exempt assets to make it fully equivalent to interest income earned on taxable investments. This adjustment is not permitted under GAAP in the Consolidated Income Statement. For additional information, see Reconciliation of Taxable-Equivalent Net Interest Income (Non-GAAP) in the Statistical Information (Unaudited) section in Item 1 of this Report. |
The PNC Financial Services Group, Inc. – Form 10-Q 1
Table 1: Consolidated Financial Highlights (Continued) (a)
| | | Unaudited | March 31
2018 |
| December 31
2017 |
| March 31
2017 |
| | March 31
2019 |
| December 31
2018 |
| March 31
2018 |
| |
Balance Sheet Data (dollars in millions, except per share data) | | | | |
| Assets | $ | 379,161 |
| $ | 380,768 |
| $ | 370,944 |
| | $ | 392,837 |
| $ | 382,315 |
| $ | 379,161 |
| |
| Loans | $ | 221,614 |
| $ | 220,458 |
| $ | 212,826 |
| | $ | 232,293 |
| $ | 226,245 |
| $ | 221,614 |
| |
| Allowance for loan and lease losses | $ | 2,604 |
| $ | 2,611 |
| $ | 2,561 |
| | $ | 2,692 |
| $ | 2,629 |
| $ | 2,604 |
| |
| Interest-earning deposits with banks (b) | $ | 28,821 |
| $ | 28,595 |
| $ | 27,877 |
| | $ | 15,261 |
| $ | 10,893 |
| $ | 28,821 |
| |
| Investment securities | $ | 74,562 |
| $ | 76,131 |
| $ | 76,432 |
| | $ | 83,869 |
| $ | 82,701 |
| $ | 74,562 |
| |
| Loans held for sale | $ | 965 |
| $ | 2,655 |
| $ | 1,414 |
| | $ | 686 |
| $ | 994 |
| $ | 965 |
| |
| Equity investments (c) | $ | 12,008 |
| $ | 11,392 |
| $ | 10,900 |
| | $ | 12,567 |
| $ | 12,894 |
| $ | 12,008 |
| |
| Mortgage servicing rights | $ | 1,979 |
| $ | 1,832 |
| $ | 1,867 |
| | $ | 1,812 |
| $ | 1,983 |
| $ | 1,979 |
| |
| Goodwill | $ | 9,218 |
| $ | 9,173 |
| $ | 9,103 |
| | $ | 9,218 |
| $ | 9,218 |
| $ | 9,218 |
| |
| Other assets | $ | 27,949 |
| $ | 27,894 |
| $ | 28,083 |
| | $ | 34,761 |
| $ | 34,408 |
| $ | 27,949 |
| |
| Noninterest-bearing deposits | $ | 78,303 |
| $ | 79,864 |
| $ | 79,246 |
| | $ | 71,606 |
| $ | 73,960 |
| $ | 78,303 |
| |
| Interest-bearing deposits | $ | 186,401 |
| $ | 185,189 |
| $ | 181,464 |
| | $ | 199,615 |
| $ | 193,879 |
| $ | 186,401 |
| |
| Total deposits | $ | 264,704 |
| $ | 265,053 |
| $ | 260,710 |
| | $ | 271,221 |
| $ | 267,839 |
| $ | 264,704 |
| |
| Borrowed funds | $ | 58,039 |
| $ | 59,088 |
| $ | 55,062 |
| | $ | 59,860 |
| $ | 57,419 |
| $ | 58,039 |
| |
| Total shareholders’ equity | $ | 46,969 |
| $ | 47,513 |
| $ | 45,754 |
| | $ | 48,536 |
| $ | 47,728 |
| $ | 46,969 |
| |
| Common shareholders’ equity | $ | 42,983 |
| $ | 43,530 |
| $ | 41,774 |
| | $ | 44,546 |
| $ | 43,742 |
| $ | 42,983 |
| |
| Accumulated other comprehensive income (loss) | $ | (699 | ) | $ | (148 | ) | $ | (279 | ) | | $ | (5 | ) | $ | (725 | ) | $ | (699 | ) | |
| Book value per common share | $ | 91.39 |
| $ | 91.94 |
| $ | 86.14 |
| | $ | 98.47 |
| $ | 95.72 |
| $ | 91.39 |
| |
| Period-end common shares outstanding (in millions) | 470 |
| 473 |
| 485 |
| | 452 |
| 457 |
| 470 |
| |
| Loans to deposits | 84 | % | 83 | % | 82 | % | | 86 | % | 84 | % | 84 | % | |
| Common shareholders’ equity to total assets | | 11.3 | % | 11.4 | % | 11.3 | % | |
Client Assets (in billions) | | | | |
| Discretionary client assets under management | $ | 148 |
| $ | 151 |
| $ | 141 |
| | $ | 158 |
| $ | 148 |
| $ | 148 |
| |
| Nondiscretionary client assets under administration | 129 |
| 131 |
| 123 |
| | 130 |
| 124 |
| 129 |
| |
| Total client assets under administration | 277 |
| 282 |
| 264 |
| | 288 |
| 272 |
| 277 |
| |
| Brokerage account client assets | 49 |
| 49 |
| 46 |
| | 51 |
| 47 |
| 49 |
| |
| Total client assets | $ | 326 |
| $ | 331 |
| $ | 310 |
| | $ | 339 |
| $ | 319 |
| $ | 326 |
| |
| Capital Ratios | | | |
| Basel III (d) (e) (f) | | | |
| Basel III Capital Ratios (d) | | | |
| Common equity Tier 1 | 9.6 | % | N/A |
| N/A |
| | 9.8 | % | 9.6 | % | 9.6 | % | |
| Tier 1 risk-based | 10.8 | % | N/A |
| N/A |
| | 10.9 | % | 10.8 | % | 10.8 | % | |
Total capital risk-based | 12.8 | % | N/A |
| N/A |
| | 13.0 | % | 13.0 | % | 12.8 | % | |
| Leverage | 9.4 | % | N/A |
| N/A |
| | 9.6 | % | 9.4 | % | 9.4 | % | |
| Supplementary leverage | 7.9 | % | N/A |
| N/A |
| | 8.0 | % | 7.8 | % | 7.9 | % | |
| Fully Phased-In Basel III (Non-GAAP) (f) (g) | | | |
| Common equity Tier 1 | N/A |
| 9.8 | % | 10.0 | % | | |
| 2017 Transitional Basel III (d) (f) | | | |
| Common equity Tier 1 | N/A |
| 10.4 | % | 10.5 | % | | |
| Tier 1 risk-based | N/A |
| 11.6 | % | 11.8 | % | | |
| Total capital risk-based | N/A |
| 13.7 | % | 14.1 | % | | |
| Leverage | N/A |
| 9.9 | % | 9.9 | % | | |
| Common shareholders’ equity to total assets | 11.3 | % | 11.4 | % | 11.3 | % | | |
| Asset Quality | | | | |
| Nonperforming loans to total loans | .83 | % | .85 | % | .94 | % | | .71 | % | .75 | % | .83 | % | |
| Nonperforming assets to total loans, OREO, foreclosed and other assets | .90 | % | .92 | % | 1.04 | % | | |
| Nonperforming assets to total loans, OREO and foreclosed assets | | .77 | % | .80 | % | .90 | % | |
| Nonperforming assets to total assets | .53 | % | .53 | % | .60 | % | | .45 | % | .47 | % | .53 | % | |
| Net charge-offs to average loans (for the three months ended) (annualized) | .21 | % | .22 | % | .23 | % | | .24 | % | .19 | % | .21 | % | |
| Allowance for loan and lease losses to total loans | 1.18 | % | 1.18 | % | 1.20 | % | | 1.16 | % | 1.16 | % | 1.18 | % | |
| Allowance for loan and lease losses to total nonperforming loans | 141 | % | 140 | % | 128 | % | | 163 | % | 155 | % | 141 | % | |
| Accruing loans past due 90 days or more (in millions) | $ | 628 |
| $ | 737 |
| $ | 699 |
| | $ | 590 |
| $ | 629 |
| $ | 628 |
| |
| |
| (a) | The Executive Summary and Consolidated Balance Sheet Review portions of this Financial Review provide information regarding items impacting the comparability of the periods presented. |
| |
| (b) | Amounts include balances held with the Federal Reserve Bank of Cleveland (Federal Reserve Bank) of $28.6$15.0 billion, $28.3$10.5 billion and $27.5$28.6 billion as of March 31, 2018,2019, December 31, 20172018 and March 31, 2017,2018, respectively. |
| |
| (c) | Amounts include our equity interest in BlackRock. The amount at March 31, 2018 includes $.6 billion of trading and available for sale securities that were reclassified to Equity investments on January 1, 2018 in accordance with the adoption of Accounting Standard Update 2016-01. See the Recently Adopted Accounting Standards portion of Note 1 Accounting Policies in the Notes To Consolidated Financial Statements of this Report for additional detail on this adoption. |
| |
| (d) | All ratios are calculated using the regulatory capital methodology applicable to PNC during each period presented and calculated based on the standardized approach. |
| |
(e) | The Basel III ratios for common equity Tier 1 capital, Tier 1 risk-based capital, Leverage and Supplementary leverage reflect the full phase-in of all Basel III adjustments to these metrics applicable to PNC. The Basel III total risk-based capital ratio includes $80 million of nonqualifying trust preferred capital securities that are subject to a phase-out period that runs through 2022. |
| |
(f) | See Basel III Capital discussion in the Capital Management portion of the Risk Management section of this Financial Review and the capital discussion in the Banking Regulation and Supervision section of Item 1 Business and Item 1A Risk Factors in our 20172018 Form 10-K. See also the Transitional Basel III and Fully Phased-In Basel III Common Equity Tier 1 Capital Ratios (Non-GAAP) – March 31, 2017 table in the Statistical Information section of this Report for a reconciliation of the March 31, 2017 ratios. |
| |
(g)(e) | 2017 Fully Phased-inThe 2019 and 2018 Basel III resultsTotal risk-based capital ratios include nonqualifying trust preferred capital securities of $60 million and $80 million, respectively, that are presented as Pro forma estimates.subject to a phase-out period that runs through 2021. |
2 The PNC Financial Services Group, Inc. – Form 10-Q
EXECUTIVE SUMMARY
The PNC Financial Services Group, Inc. isHeadquartered in Pittsburgh, Pennsylvania, we are one of the largest diversified financial services companies in the United States and is headquartered in Pittsburgh, Pennsylvania.
States. We have businesses engaged in retail banking, including residential mortgage, corporate and institutional banking and asset management, providing many of our products and services nationally. Our primary geographicretail branch network is located in markets are located inacross the Mid-Atlantic, Midwest and Southeast. We also provide certain products and services internationally.have strategic international offices in four countries outside the U.S.
Key Strategic Goals
At PNC we manage our company for the long term. We are focused on the fundamentals of growing customers, loans, deposits and revenue and improving profitability, while investing for the future and managing risk, expenses and capital. We continue to invest in our products, markets and brand, and embrace our commitments to our customers, shareholders, employees and the communities where we do business.
We strive to expand and deepen customer relationships by offering a broad range of deposit, credit and fee-based products and services. We are focused on delivering those products and services to our customers with the goal of addressing their financial objectives and putting customers’ needs first. Our business model is built on customer loyalty and engagement, understanding our customers’ financial goals and offering our diverse products and services to help them achieve financial well-being. Our approach is concentrated on organically growing and deepening client relationships across our businesses that meet our risk/return measures.
We are focused on our strategic priorities, which are designed to enhance value over the long term, and consist of:
Expanding our leading banking franchise to new markets and digital platforms;
Deepening customer relationships by delivering a superior banking experience and financial solutions; and
Leveraging technology to innovate and enhance products, services, security and processes.
Our capital priorities are to support client growth and business investment, maintain appropriate capital in light of economic conditions, and the Basel III framework, and other regulatory expectations, and return excess capital to shareholders, in accordance with the currently effective capital plan included in our Comprehensive Capital Analysis and Review (CCAR) submission to the Board of Governors of the Federal Reserve System (Federal Reserve).shareholders. For more detail, see the Capital Highlights portion of this Executive Summary and the Liquidity and Capital Management portion of the Risk Management section of this Financial Review and the Supervision and Regulation section in Item 1 Business of our 20172018 Form 10-K.
Income Statement Highlights
Net income for the first quarter of 20182019 increased 15%3% to $1.3 billion, or $2.61 per diluted common share, compared to $1.2 billion, or $2.43 per diluted common share, compared to $1.1 billion, or $1.96 per diluted common share, for the first quarter of 2017.2018.
Total revenue increased $227$175 million, or 6%4%, to $4.1$4.3 billion.
Net interest income increased $201$114 million, or 9%5%, to $2.4$2.5 billion.
Net interest margin increased to 2.91%2.98% compared to 2.77%2.91% for the first quarter of 2017.2018.
Noninterest income increased $26$61 million, or 2%3%, to $1.8 billion.
Provision for credit losses was $92$189 million compared to $88$92 million for the first quarter of 2017.2018.
Noninterest expense increased $125$51 million, or 5%2%, to $2.5$2.6 billion.
Income tax expense decreased to $253 million compared to $320 million for the first quarter of 2017.
Federal tax reform legislation, the Tax Cuts and Jobs Act, lowered the statutory federal income tax rate for corporations to 21% from 35% effective January 1, 2018.
For additional detail, see the Consolidated Income Statement Review section inof this Financial Review.
Balance Sheet Highlights
Our balance sheet was strong and well positioned at March 31, 20182019 and December 31, 2017.2018. In comparison to December 31, 2017:2018:
Total assets increased $10.5 billion to $392.8 billion.
Total loans increased $6.0 billion, or 3%, to $232.3 billion.
Total commercial lending grew $6.1 billion, or 4%.
Total consumer lending decreased $.1 billion.
Investment securities increased $1.2 billion, or 1%, to $221.6$83.9 billion.
Total commercial lending grew $1.5Interest-earning deposits with banks, primarily with the Federal Reserve Bank, increased $4.4 billion, or 1%.
Total consumer lending decreased $.340%, to $15.3 billion.
Total deposits decreased $.3 billion to $264.7 billion.
Investment securities decreased $1.6increased $3.4 billion, or 2%1%, to $74.6$271.2 billion.
For additional detail, see the Consolidated Balance Sheet Review section of this Financial Review.
The PNC Financial Services Group, Inc. – Form 10-Q 3
Credit Quality Highlights
Overall credit quality remained stable.strong.
At March 31, 20182019 compared to December 31, 2017:2018:
Nonperforming assets decreased $31$23 million, or 2%, to $2.0 billion.1%.
Overall loan delinquencies decreased $131$49 million, or 9%.3%, to $1.4 billion.
Net charge-offs of $113were $136 million in the first quarter of 2018 decreased 4%2019 compared to net charge-offs of $118$113 million for the first quarter of 2017.2018.
The allowance for loan and lease losses to total loans of 1.16% at March 31, 2019 was unchanged compared to December 31, 2018.
For additional detail, see the Credit Risk Management portion of the Risk Management section of this Financial Review.
Capital Highlights
We maintained a strong capital position and continued to return capital to shareholders.
The Basel III common equity Tier 1 capital ratio which includes the full phase-in of all Basel III adjustments and became effective for PNC as of January 1, 2018, was 9.6%9.8% at March 31, 2018,2019, compared with 9.8%9.6% at December 31, 2017, calculated on the same basis.2018.
In the first quarter of 2018,2019, we returned $1.1$1.2 billion of capital to shareholders through repurchases of 4.85.9 million common shares for $.7 billion$725 million and dividends on common shares of $.4 billion.$438 million.
Common shareholders' equity increased to $44.5 billion at March 31, 2019 compared to $43.7 billion at December 31, 2018.
See the Liquidity and Capital Management portion of the Risk Management section of this Financial Review for more detail on our 20182019 liquidity and capital actions as well as our capital ratios.
Our ability to take certain capital actions, including plans to pay or increase common stock dividends or to repurchase shares under current or future programs, is subject to the results of the supervisory assessment of capital adequacy undertaken by the Board of Governors of the Federal Reserve System (Federal Reserve) as part of the CCARComprehensive Capital Analysis and Review (CCAR) process. For additional information, see the Supervision and Regulation section in Item 1 Business of our 20172018 Form 10-K.
Business Outlook
Our forward-looking financial statements are subject to the risk that economic and financial market conditions will be substantially different than those we are currently expecting and do not take into account potential legal and regulatory contingencies. These statements are based on our current view that that:
U.S. economic growth will accelerate somewhat in 2018, in light of stimulus from corporate and personal income tax cuts passed in late 2017 that arehas accelerated over the past two years to above its long-run trend.
Growth is expected to support business investmentrebound in the second quarter following a soft first quarter 2019, and consumer spending, respectively. We expect an increase in federal government spending will also support economic growth in 2018. slow over the remaining course of 2019 and into 2020.
Further gradual improvement in the labor market will occur this year, including job gains and rising wages, is anotherwhich would be a positive indicator for consumer spending. Other sources of growth for the U.S. economy in 2018 will be the global economic expansion
Trade restrictions and the housing market, although trade restrictionsgeopolitical concerns are a downside riskrisks to the forecast. Although inflation
Inflation has slowed in 2017, it should pick up as the labor market continuesearly 2019, to tighten. Short-term interest rates and bond yields are expected to rise throughout 2018; afterbelow the Federal Open Market Committee raisedCommittee's (FOMC) 2% objective, but is expected to rise in the second half of the year.
Our baseline forecast is for no change to the federal funds rate in March, our baseline forecast is for two additional2019 and 2020, with the rate hikesstaying in June and December 2018, pushing the federal funds rate to aits current range of 2.002.25% to 2.25% by the end of the year. Longer-term rates are also expected to increase as the Federal Reserve slowly reduces the size of its balance sheet and the federal government borrows more. Long-term rates will rise more slowly than short-term rates, so we anticipate that the yield curve will flatten but not invert.2.50%.
For the second quarter of 20182019 compared to the first quarter of 2018,2019, we expect:
ModestAverage loan growth;growth to be up approximately 1%;
Net interest income to increase by low singlelow-single digits, on a percentage basis;
Fee income to increase by mid-single digits, on a percentage basis. Fee income consists of asset management, consumer services, corporate services, residential mortgage and service charges on deposits;
Provision for credit losses to be between $100 million and $150 million; and
Noninterest expense to increase by low single digits, on a percentage basis.
We expect theThe quarterly run rate forof other noninterest income to be in the range of $225$275 million to $275$325 million, excluding net securities gains (losses) and Visa activity.activity;
Provision for credit losses to be between $125 million and $200 million; and
Noninterest expense to increase by low-single digits, on a percentage basis.
Our outlook for certain financial information forFor full year 2018 is2019 compared to full year 2017 results as adjusted for2018, we expect:
Average loan growth to be between 3% and 4%;
Revenue growth on the following fourth quarter 2017higher end of low-single digits, on a percentage basis;
Noninterest expense to increase on the lower end of low-single digits, on a percentage basis;
The effective tax legislationrate to be approximately 17%; and significant items: $26 million in lower net interest income from the impact of tax legislation on leveraged leases; a total of $54 million of higher noninterest income, consisting of the flow through impact of tax legislation on our equity investment in BlackRock, Visa Class B derivative fair value adjustments, and the appreciation of BlackRock stock contributed to the PNC Foundation, partially offset by negative adjustments for residential mortgage servicing rights fair value assumption updates; a total of $502 million of higher noninterest expense, consisting of a contribution to the PNC Foundation, charges for real estate dispositions and exits, and employee cash payments and pension account credits; and a $1.2 billion tax benefit recognized as a result of the federal tax legislation, primarily attributable to revaluation of net deferred tax liabilities and $230 million from the tax
To generate positive operating leverage.
4 The PNC Financial Services Group, Inc. – Form 10-Q
effect of the aforementioned significant items. For additional information on these fourth quarter 2017 items, see the Income Statement Highlights portion of the Executive Summary section in Item 7 of our 2017 Form 10-K.
For full year 2018 compared to full year 2017 on an adjusted basis, we expect:
Loan growth to be up mid-single digits, on a percentage basis;
Revenue to increase mid-single digits, on a percentage basis;
Noninterest expense to increase by low single digits, on a percentage basis; and
The effective tax rate to be approximately 17%.
See the Cautionary Statement Regarding Forward-Looking Information section in this Financial Review and Item 1A Risk Factors in our 20172018 Form 10-K for other factors that could cause future events to differ, perhaps materially, from those anticipated in these forward-looking statements.
CONSOLIDATED INCOME STATEMENT REVIEW
Our Consolidated Income Statement is presented in Part I, Item 1 of this Report.
Net income for the first quarter of 20182019 was $1.2$1.3 billion, or $2.43$2.61 per diluted common share, an increase of 15%3% compared to $1.1$1.2 billion, or $1.96$2.43 per diluted common share, for the first quarter of 2017. 2018.The increase was driven by a 6%4% increase in revenue, and a lower effective tax rate, partially offset by a 5%higher provision for credit losses and a 2% increase in noninterest expense. Higher revenue in the comparison reflected a 9%5% increase in net interest income and a 2%3% increase in noninterest income.
Net Interest Income
Table 2: Summarized Average Balances and Net Interest Income (a) | | | | | 2018 |
| 2017 | | | 2019 |
| 2018 | |
Three months ended March 31
Dollars in millions | | Average Balances |
| | Average Yields/ Rates |
| | Interest Income/ Expense |
| | Average Balances |
| | Average Yields/ Rates |
| | Interest Income/ Expense |
| | | Average Balances |
| | Average Yields/ Rates |
| | Interest Income/ Expense |
| | Average Balances |
| | Average Yields/ Rates |
| | Interest Income/ Expense |
| |
| Assets | | | | | | | | | | | | | | | | | | | | | | | | | | |
| Interest-earning assets | | | | | | | | | | | | | | | | | | | | | | | | | | |
| Investment securities | | $ | 74,656 |
| | 2.78 | % | | $ | 519 |
| | $ | 76,253 |
| | 2.67 | % | | $ | 508 |
| | | $ | 82,318 |
| | 3.05 | % | | $ | 627 |
| | $ | 74,656 |
| | 2.78 | % | | $ | 519 |
| |
| Loans | | 221,104 |
| | 4.09 | % | | 2,250 |
| | 212,253 |
| | 3.67 | % | | 1,941 |
| | | 228,545 |
| | 4.61 | % | | 2,622 |
| | 221,104 |
| | 4.09 | % | | 2,250 |
| |
| Interest-earning deposits with banks | | 25,667 |
| | 1.52 | % | | 98 |
| | 24,192 |
| | .81 | % | | 49 |
| | | 15,017 |
| | 2.43 | % | | 91 |
| | 25,667 |
| | 1.52 | % | | 98 |
| |
| Other | | 7,904 |
| | 4.11 | % | | 80 |
| | 8,395 |
| | 3.54 | % | | 74 |
| | | 11,068 |
| | 4.14 | % | | 115 |
| | 7,904 |
| | 4.11 | % | | 80 |
| |
| Total interest-earning assets/interest income | | $ | 329,331 |
| | 3.59 | % | | 2,947 |
| | $ | 321,093 |
| | 3.22 | % | | 2,572 |
| | | $ | 336,948 |
| | 4.11 | % | | 3,455 |
| | $ | 329,331 |
| | 3.59 | % | | 2,947 |
| |
| Liabilities | | | | | | | | | | | | | | | | | | | | | | | | | | |
| Interest-bearing liabilities | | | | | | | | | | | | | | | | | | | | | | | | | | |
| Interest-bearing deposits | | $ | 183,438 |
| | .47 | % | | 213 |
| | $ | 176,871 |
| | .28 | % | | 120 |
| | | $ | 195,816 |
| | .98 | % | | 472 |
| | $ | 183,438 |
| | .47 | % | | 213 |
| |
| Borrowed funds | | 59,638 |
| | 2.31 | % | | 344 |
| | 54,942 |
| | 1.74 | % | | 240 |
| | | 59,783 |
| | 3.21 | % | | 481 |
| | 59,638 |
| | 2.31 | % | | 344 |
| |
| Total interest-bearing liabilities/interest expense | | $ | 243,076 |
| | .91 | % | | 557 |
| | $ | 231,813 |
| | .62 | % | | 360 |
| | | $ | 255,599 |
| | 1.50 | % | | 953 |
| | $ | 243,076 |
| | .91 | % | | 557 |
| |
| Net interest margin/income (Non-GAAP) | | | | 2.91 | % | | 2,390 |
| | | | 2.77 | % | | 2,212 |
| | | | | 2.98 | % | | 2,502 |
| | | | 2.91 | % | | 2,390 |
| |
| Taxable-equivalent adjustments | | | | | | (29 | ) | | | | | | (52 | ) | | | | | | | (27 | ) | | | | | | (29 | ) | |
| Net interest income (GAAP) | | | | | | $ | 2,361 |
| | | | | | $ | 2,160 |
| | | | | | | $ | 2,475 |
| | | | | | $ | 2,361 |
| |
| |
| (a) | Interest income calculated as taxable-equivalent interest income. To provide more meaningful comparisons of interest income and yields for all interest-earning assets, as well as net interest margins, we use interest income on a taxable-equivalent basis in calculating average yields and net interest margins by increasing the interest income earned on tax-exempt assets to make it fully equivalent to interest income earned on taxable investments. This adjustment is not permitted under GAAP on the Consolidated Income Statement. For more information, see Reconciliation of Taxable-Equivalent Net Interest Income (Non-GAAP) in the Statistical Information (Unaudited) section of this Report. |
Changes in net interest income and margin result from the interaction of the volume and composition of interest-earning assets and related yields, interest-bearing liabilities and related rates paid, and noninterest-bearing sources of funding. See the Statistical Information (Unaudited) – Average Consolidated Balance Sheet And Net Interest Analysis section of this Report for additional information.
Net interest income increased by $201$114 million, or 9%5%, in the first quarter of 20182019 compared with the first quarter of 2017,2018. This increase reflected higher loan and netsecurities yields and balances, partially offset by higher deposit and borrowing costs and balances. Net interest margin increased 147 basis points. These increases reflected higher loans and securities yields from higher interest rates, partially offset by increased balances and rates paid on borrowed funds and deposits. Net interest income also benefited from higher loan balances in the comparison.
Higher average rates on borrowed funds reflectedpoints reflecting the impact of an increase in three-month LIBOR. Interest rates on our borrowed funds portfolio are largely indexed to three-month LIBOR, either issued at this floating rate or throughhigher interest rate swaps.
The PNC Financial Services Group, Inc. – Form 10-Q5
rates.
Average investment securities decreased $1.6increased $7.7 billion, or 2%10%, reflecting portfolio runoff and lower reinvestments, including declines in average commercialdriven by net purchase activity of agency residential mortgage-backed securities of $1.9$4.4 billion and asset-backed securities of $1.2 billion, partially offset by net purchases of U.S. Treasury and government agency securities of $1.4 billion and residential mortgage-backed securities of $1.3$3.9 billion.
The decline in averageAverage investment securities also reflected the January 1, 2018 reclassification of $.6 billion of available for sale securitiesincreased to equity investments in accordance with the adoption of Accounting Standards Update (ASU) 2016-01. See the Recently Adopted Accounting Standards portion of Note 1 Accounting Policies in the Notes To Consolidated Financial Statements of this Report for additional detail on this adoption.
Total investment securities were 23%24% of average interest-earning assets for the first quarter of 20182019 compared to 24%23% for the first quarter of 2017.2018.
Average loans grew $8.9$7.4 billion, or 4%3%, reflecting an increase in average commercial lending of $8.5$6.5 billion, or 4%, driven by broad-based growth in ourthe Corporate Banking Equipment Finance and Business Credit businesses in our Corporate & Institutional Banking segment. Growth in Equipment Finance included the impact of the acquisition of a commercial and vendor finance business with $1.0 billion of loans and leases in the second quarter of 2017.
Average consumer lending increased $.4$.9 billion, in the comparison, as growthor 1%. Growth in residential real estate, automobile and credit card loans was largelypartially offset by declines in home equity and education loans. Lower home equity loans reflected paydowns and payoffs exceeding new originated volume. In addition, run-off in the non-strategic consumer loan portfoliosrunoff of brokered home equity and government guaranteed education loans contributed to the
The PNC Financial Services Group, Inc. – Form 10-Q5
declines. Average loans represented 67%68% of average interest-earning assets for the first quarter of 20182019 compared to 66%67% for the first quarter of 2017.2018.
Average totalinterest-earning deposits increased $5.7with banks decreased $10.7 billion, or 2%. 41%, reflecting lower average balances held with the Federal Reserve Bank as investment of liquidity continued.
Average interest-bearing deposits grew $6.6$12.4 billion, or 4%7%, reflecting the higher interest rate environmentoverall deposit and customer growth. Average savingsAdditionally, the increase reflects a shift of commercial deposits to interest-bearing from noninterest-bearing deposits, which declined $5.8 billion to $71.4 billion, as deposit rates have risen. In total, average interest-bearing deposits increased $9.4 billion due in part to a shift to relationship-based savings products from money market deposits, which decreased $5.4 billion. Additionally, average interest-bearing demand deposits grew $2.8 billion. Average interest-bearing deposits represented 75%77% of average interest-bearing liabilities compared to 75% for the first quarter of 2018 compared to 76% for the same period in 2017. Average noninterest-bearing deposits declined $.9 billion to $77.2 billion.2018.
Further details regarding average loans and deposits are included in the Business Segments Review section of this Financial Review.
Average borrowed funds increased $4.7 billion, or 9%, largely reflecting higher average bank notes and senior debt, partially offset by a decline in average subordinated debt. See the Consolidated Balance Sheet Review portion of this Financial Review for additional detail on the level and composition of borrowed funds.
Noninterest Income
Table 3: Noninterest Income
| | | | | Three months ended March 31 |
|
| Three months ended March 31 | |
| | | | | | | Change | | | | | | | Change | |
| Dollars in millions | | 2018 |
|
| 2017 |
| | $ | | % | | | 2019 |
| | 2018 |
| | $ |
| | % |
| |
| Noninterest income | | | | | | | | | | | | | | | | | | |
| Asset management | | $ | 455 |
| | $ | 403 |
| | $ | 52 |
| | 13 | % | | | $ | 437 |
| | $ | 455 |
| | $ | (18 | ) | | (4 | )% | |
| Consumer services | | 357 |
| | 332 |
| | 25 |
| | 8 | % | | | 371 |
| | 357 |
| | 14 |
| | 4 | % | |
| Corporate services | | 429 |
| | 414 |
| | 15 |
| | 4 | % | | | 462 |
| | 429 |
| | 33 |
| | 8 | % | |
| Residential mortgage | | 97 |
| | 113 |
| | (16 | ) | | (14 | )% | | | 65 |
| | 97 |
| | (32 | ) | | (33 | )% | |
| Service charges on deposits | | 167 |
| | 161 |
| | 6 |
| | 4 | % | | | 168 |
| | 167 |
| | 1 |
| | 1 | % | |
| Other | | 245 |
| | 301 |
| | (56 | ) | | (19 | )% | | | 308 |
| | 245 |
| | 63 |
| | 26 | % | |
| Total noninterest income | | $ | 1,750 |
|
| $ | 1,724 |
|
| $ | 26 |
| | 2 | % | | | $ | 1,811 |
|
| $ | 1,750 |
|
| $ | 61 |
| | 3 | % | |
Noninterest income as a percentage of total revenue was 43%42% for the first quarter of 20182019 compared to 44%43% for the same period in 2017.2018.
Asset management revenue increased reflecting higherdeclined due to changes in the mix of assets under management and lower earnings from our equity investment in BlackRock and stronger equity markets.BlackRock. PNC's discretionary client assets under management increased to $158 billion at March 31, 2019 compared to $148 billion at March 31, 2018 compared with $141 billion at March 31, 2017.
6 The PNC Financial Services Group, Inc. – Form 10-Q
Growth in consumer service fees included a $13 million increaseresulted from increases in debit card, credit card, fees, net of rewards, and debit cardbrokerage fees which reflectedreflecting continued momentum in customer activity in both transaction trends and customer growth. In addition, brokerage fees increased $10 million,
Higher corporate services revenue was primarily driven by higher brokerage assets under management.
Corporate services revenue reflected growth in treasury managementmerger and acquisition advisory fees of $15 million and treasury management product revenue of $14 million.
Residential mortgage revenue decreased as a $13 million increase in operating lease income related to the commercial and vendor finance business acquired in the second quarterresult of 2017. These increases were partially offset by a $12 million lower benefit from commercialnegative adjustment for residential mortgage servicing rights valuation, net of economic hedge.
Lower residential mortgage revenue was driven byhedge, compared with a $12 million declinebenefit in first quarter 2018, and lower loan sales revenue, which reflected compressed pricing margins and lower refinancing origination volume.revenue.
The decreaseincrease in other noninterest income was driven by an $88 million decline inlargely attributable to higher gains on asset sales and higher revenue from private equity investments, which included the impact of first quarter 2017 positive valuation adjustments related to the Volcker Rule provisions of the Dodd-Frank Act. This decrease was partially offset by a $14 million decline in negative derivative fair value adjustments related to Visa Class B common shares of $31 million in the comparison.
In the first quarter of 2018, and as a result of the commercial and vendor finance business we acquired2019 compared to $2 million in the second quarter of 2017, we have reclassified operating lease income to corporate services noninterest income from other noninterest income on the Consolidated Income Statement. Operating lease income was $34 million for the first quarter of 2018. First quarter 2017 operating lease income was $21 million and was reclassified to reflect this change.
Provision For Credit Losses
The provision for credit losses was $92increased $97 million for the first quarter of 2018 compared with $88to $189 million in the first quarter of 2017.2019 compared to $92 million in the first quarter of 2018 reflecting loan growth, including new loans and increased utilization, and reserve increases in the auto loan portfolio.
The Credit Risk Management portion of the Risk Management section of this Financial Review includes additional information regarding factors impacting the provision for credit losses.
6 The PNC Financial Services Group, Inc. – Form 10-Q
Noninterest Expense
Table 4: Noninterest Expense
| | | | | Three months ended March 31 | | | Three months ended March 31 | |
| | | | | | | Change | | | | | | | Change | |
| Dollars in millions | | 2018 |
|
| 2017 |
| | $ | | % | | | 2019 |
| | 2018 |
| | $ |
| | % |
| |
| Noninterest expense | | | | | | | | | | | | | | | | | | |
| Personnel | | $ | 1,354 |
| | $ | 1,257 |
| | $ | 97 |
| | 8 | % | | | $ | 1,414 |
| | $ | 1,354 |
| | $ | 60 |
| | 4 | % | |
| Occupancy | | 218 |
| | 222 |
| | (4 | ) | | (2 | )% | | | 215 |
| | 218 |
| | (3 | ) | | (1 | )% | |
| Equipment | | 273 |
| | 251 |
| | 22 |
| | 9 | % | | | 273 |
| | 273 |
| | — |
| | — |
| |
| Marketing | | 55 |
| | 55 |
| | — |
| | — |
| | | 65 |
| | 55 |
| | 10 |
| | 18 | % | |
| Other | | 627 |
| | 617 |
| | 10 |
| | 2 | % | | | 611 |
| | 627 |
| | (16 | ) | | (3 | )% | |
| Total noninterest expense | | $ | 2,527 |
|
| $ | 2,402 |
|
| $ | 125 |
| | 5 | % | | | $ | 2,578 |
| | $ | 2,527 |
| | $ | 51 |
| | 2 | % | |
The increaseNoninterest expense increased in noninterest expense was due to our ongoingthe comparison as investments in technology andsupport of business growth were reflected in our businesses and employees, and was reflected primarily inhigher personnel and equipment expense.marketing expense, which included costs for PNC's national retail digital strategy. These increases included operating expense related towere offset in part by a decrease in Federal Deposit Insurance Corporation (FDIC) deposit insurance as a result of the second quarter 2017 acquisitionelimination of a commercial and vendor finance business, as well as the investments we have made in new markets and our announced increase in hourly wages for eligible employees and in enhanced employee benefits.surcharge assessment.
PNC continued to focus on disciplined expense management. As of March 31, 2018,management, and for full-year 2019 we were on track to achieve our full-year 2018have a goal of $250$300 million in cost savings through our continuous improvement program, which we expect will partiallyhelp fund a portion of our ongoing business and technologystrategic investments.
Effective Income Tax Rate
The effective income tax rate was 16.3% in the first quarter of 2019 compared to 17.0% in the first quarter of 2018 compared to 23.0% in the same period of 2017. First quarter 2018 reflected the change in the statutory federal income tax rate from 35% to 21%, effective as of January 1, 2018, as a result of the new federal tax legislation.2018.
The PNC Financial Services Group, Inc. – Form 10-Q7
CONSOLIDATED BALANCE SHEET REVIEW
Table 5: Summarized Balance Sheet Data
| | | | March 31 |
| | December 31 |
| | Change | | March 31 |
| | December 31 |
| | Change | |
| Dollars in millions | 2018 |
| | 2017 |
| | $ | % | | 2019 |
| | 2018 |
| | $ | % | |
| Assets | | | | | | | | | | | | | | |
| Interest-earning deposits with banks | $ | 28,821 |
| | $ | 28,595 |
| | $ | 226 |
| 1 | % | | $ | 15,261 |
| | $ | 10,893 |
| | $ | 4,368 |
| 40 | % | |
| Loans held for sale | 965 |
| | 2,655 |
| | (1,690 | ) | (64 | )% | | 686 |
| | 994 |
| | (308 | ) | (31 | )% | |
| Investment securities | 74,562 |
| | 76,131 |
| | (1,569 | ) | (2 | )% | | 83,869 |
| | 82,701 |
| | 1,168 |
| 1 | % | |
| Loans | 221,614 |
| | 220,458 |
| | 1,156 |
| 1 | % | | 232,293 |
| | 226,245 |
| | 6,048 |
| 3 | % | |
| Allowance for loan and lease losses | (2,604 | ) | | (2,611 | ) | | 7 |
| — |
| | (2,692 | ) | | (2,629 | ) | | (63 | ) | (2 | )% | |
| Mortgage servicing rights | 1,979 |
| | 1,832 |
| | 147 |
| 8 | % | | 1,812 |
| | 1,983 |
| | (171 | ) | (9 | )% | |
| Goodwill | 9,218 |
| | 9,173 |
| | 45 |
| — |
| | 9,218 |
| | 9,218 |
| | — |
| — |
| |
| Other, net | 44,606 |
| | 44,535 |
| | 71 |
| — |
| | 52,390 |
| | 52,910 |
| | (520 | ) | (1 | )% | |
| Total assets | $ | 379,161 |
| | $ | 380,768 |
| | $ | (1,607 | ) | — |
| | $ | 392,837 |
| | $ | 382,315 |
| | $ | 10,522 |
| 3 | % | |
| Liabilities | | | | |
|
|
|
| | | | | |
|
|
|
| |
| Deposits | $ | 264,704 |
| | $ | 265,053 |
| | $ | (349 | ) | — |
| | $ | 271,221 |
| | $ | 267,839 |
| | $ | 3,382 |
| 1 | % | |
| Borrowed funds | 58,039 |
| | 59,088 |
| | (1,049 | ) | (2 | )% | | 59,860 |
| | 57,419 |
| | 2,441 |
| 4 | % | |
| Other | 9,383 |
| | 9,042 |
| | 341 |
| 4 | % | | 13,181 |
| | 9,287 |
| | 3,894 |
| 42 | % | |
| Total liabilities | 332,126 |
| | 333,183 |
| | (1,057 | ) | — |
| | 344,262 |
| | 334,545 |
| | 9,717 |
| 3 | % | |
| Equity | | | | |
|
|
|
| | | | | |
|
|
|
| |
| Total shareholders’ equity | 46,969 |
| | 47,513 |
| | (544 | ) | (1 | )% | | 48,536 |
| | 47,728 |
| | 808 |
| 2 | % | |
| Noncontrolling interests | 66 |
| | 72 |
| | (6 | ) | (8 | )% | | 39 |
| | 42 |
| | (3 | ) | (7 | )% | |
| Total equity | 47,035 |
| | 47,585 |
| | (550 | ) | (1 | )% | | 48,575 |
| | 47,770 |
| | 805 |
| 2 | % | |
| Total liabilities and equity | $ | 379,161 |
| | $ | 380,768 |
| | $ | (1,607 | ) | — |
| | $ | 392,837 |
| | $ | 382,315 |
| | $ | 10,522 |
| 3 | % | |
The summarized balance sheet data in Table 5 is based upon our Consolidated Balance Sheet in Part 1, Item 1 of this Report.
Our balance sheet was strong and well positioned at both March 31, 20182019 and December 31, 2017.2018.
Total assets decreased due to lower loans held for saleincreased driven by loan growth, higher interest-earning deposits with banks and higher investment securities, partially offset by higher loans;securities;
Total liabilities decreasedincreased due to lower borrowed funds;deposit growth, higher federal funds purchased and timing of securities purchases;
Total equity decreased due to share repurchases and lower accumulated other comprehensive income (loss) related to net unrealized securities losses, partially offset byincreased as higher retained earnings driven by net income.income and higher accumulated other comprehensive income (AOCI) was partially offset by share repurchases.
The PNC Financial Services Group, Inc. – Form 10-Q7
The following discussion provides additional information about the major components of our balance sheet. Information regarding our capital and regulatory compliance is included in the Liquidity and Capital Management portion of the Risk Management section in this Financial Review and in Note 18 Regulatory Matters in the Notes To Consolidated Financial Statements included in our 20172018 Form 10-K.
Loans
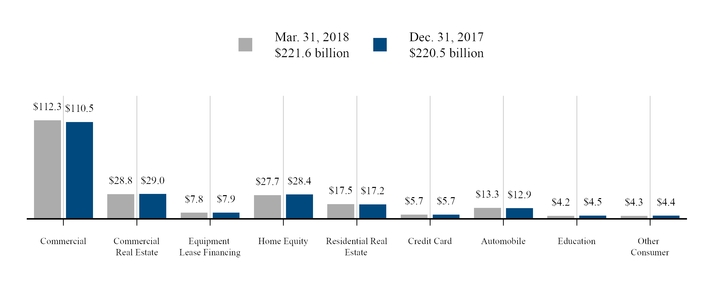
Table 6: Loans
|
| | | | | | | | | | | | | | |
| | March 31 |
| | December 31 |
| | Change | |
| Dollars in millions | 2018 |
| | 2017 |
| | $ | % | |
| Commercial lending | | | | | | | |
| Commercial | $ | 112,308 |
| | $ | 110,527 |
| | $ | 1,781 |
| 2 | % | |
| Commercial real estate | 28,835 |
| | 28,978 |
| | (143 | ) | — |
| |
| Equipment lease financing | 7,802 |
| | 7,934 |
| | (132 | ) | (2 | )% | |
| Total commercial lending | 148,945 |
| | 147,439 |
| | 1,506 |
| 1 | % | |
| Consumer lending | | | | |
|
|
|
| |
| Home equity | 27,699 |
| | 28,364 |
| | (665 | ) | (2 | )% | |
| Residential real estate | 17,456 |
| | 17,212 |
| | 244 |
| 1 | % | |
| Credit card | 5,657 |
| | 5,699 |
| | (42 | ) | (1 | )% | |
| Other consumer | | | | |
|
|
|
| |
| Automobile | 13,295 |
| | 12,880 |
| | 415 |
| 3 | % | |
| Education | 4,228 |
| | 4,454 |
| | (226 | ) | (5 | )% | |
| Other | 4,334 |
| | 4,410 |
| | (76 | ) | (2 | ) | |
| Total consumer lending | 72,669 |
| | 73,019 |
| | (350 | ) | — |
| |
| Total loans | $ | 221,614 |
| | $ | 220,458 |
| | $ | 1,156 |
| 1 | % | |
8 The PNC Financial Services Group, Inc. – Form 10-Q
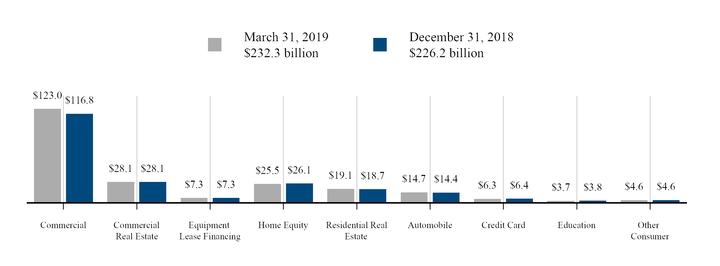
Loan growth was driven by commercial lending partially offset by a decline in consumer lending balances. |
| | | | | | | | | | | | | | |
| | March 31 |
| | December 31 |
| | Change | |
| Dollars in millions | 2019 |
| | 2018 |
| | $ | % | |
| Commercial lending | | | | | | | |
| Commercial | $ | 122,993 |
| | $ | 116,834 |
| | $ | 6,159 |
| 5 | % | |
| Commercial real estate | 28,101 |
| | 28,140 |
| | (39 | ) | — |
| |
| Equipment lease financing | 7,348 |
| | 7,308 |
| | 40 |
| 1 | % | |
| Total commercial lending | 158,442 |
| | 152,282 |
| | 6,160 |
| 4 | % | |
| Consumer lending | | | | |
|
|
|
| |
| Home equity | 25,500 |
| | 26,123 |
| | (623 | ) | (2 | )% | |
| Residential real estate | 19,107 |
| | 18,657 |
| | 450 |
| 2 | % | |
| Automobile | 14,707 |
| | 14,419 |
| | 288 |
| 2 | % | |
| Credit card | 6,267 |
| | 6,357 |
| | (90 | ) | (1 | )% | |
| Education | 3,707 |
| | 3,822 |
| | (115 | ) | (3 | )% | |
| Other consumer | 4,563 |
| | 4,585 |
| | (22 | ) | — |
| |
| Total consumer lending | 73,851 |
| | 73,963 |
| | (112 | ) | — |
| |
| Total loans | $ | 232,293 |
| | $ | 226,245 |
| | $ | 6,048 |
| 3 | % | |
Commercial loans increased reflecting broad-based growth across our Corporate Banking, Business Credit and Real Estate and Business Credit businesses within our Corporate & Institutional Banking segment. In Corporate Banking, commercial loans increased $.8 billion, or 1%, largely due to strong growth inprimarily driven by asset-backed finance securitizations as well as middle marketincreased lending to large and largemidsize corporate lending. Commercialclients. In Business Credit, commercial loans in ourincreased driven by new originations and higher utilization. In the Real Estate business, increased $.6 billion, or 5%, primarily driven by higher multifamily agency warehouse lending. In Business Credit, higher utilization resulted in an increaselending also contributed to the growth in commercial loans of $.4 billion, or 3%.loans.
For commercial loans by industry and commercial real estate loans by geography, see Loan Portfolio Characteristics and Analysis in the Credit Risk Management portion of the Risk Management section in this Financial Review.
Consumer lending balances declineddecreased as lower home equity loans, education loans, and credit card balances were partially offset by growth in automobile and residential real estate loans were more than offset by lower home equity and educationautomobile loans.
Home equity loans declined as paydowns and payoffs exceeded new originated volume. In addition, the declines in both home equityvolume and education loans included the continued runoff in our non-strategic brokered home equity and governmentloans continued to runoff. Education loans declined primarily due to runoff of the guaranteed education loan portfolios.portfolio. Credit card balances declined due to seasonally lower consumer spending.
Residential real estate loans increased as a result of growth inprimarily from originations of nonconforming residential mortgage loans, both nationwide and within our branch network. Nonconforming residential mortgage loanswhich are loans that do not meet government agency standards such as a maximum loan amount, property type or credit requirements, among other factors. The growth in residential real estate loans was primarily due to nonconforming loans that exceededresult of exceeding agency conforming loan limits. AutomobileThe growth in automobile loans grew in partwas due to higher indirect auto loans as a result of continued new loan growth and expansion into franchised dealers in our Southeastnew markets.
For information on home equity and residential real estate loans, including by geography, and automobile loans, see Loan Portfolio Characteristics and Analysis in the Credit Risk Management portion of the Risk Management section in this Financial Review.
See the Credit Risk Management portion of the Risk Management section of this Financial Review, and Note 1 Accounting Policies, Note 3 Asset Quality and Note 4 Allowance for Loan and Lease Losses in our Notes To Consolidated Financial Statements included in this Report, and Note 1 Accounting Policies in our 2018 Form 10-K for additional information regarding our loan portfolio.
8 The PNC Financial Services Group, Inc. – Form 10-Q
Investment Securities
Investment securities of $83.9 billion at March 31, 2019 increased $1.2 billion, or 1%, compared to December 31, 2018, driven by net purchases of U.S. Treasury and government agency securities of $.9 billion and asset-backed securities of $.6 billion, partially offset by a decline of other securities of $.5 billion.
The level and composition of the investment securities portfolio fluctuates over time based on many factors including market conditions, loan and deposit growth, and balance sheet management activities. We manage our investment securities portfolio to optimize returns, while providing a reliable source of liquidity for our banking and other activities, considering the Liquidity Coverage Ratio (LCR) and other internal and external guidelines and constraints.
Table 7: Investment Securities
| | | | March 31, 2018 | | December 31, 2017 | | Ratings (a) as of March 31, 2018 | | March 31, 2019 | | December 31, 2018 | | Ratings (a) as of March 31, 2019 | |
| Dollars in millions | Amortized Cost |
| | Fair Value |
| | Amortized Cost |
| | Fair Value |
| | AAA/ AA |
| | A |
| | BBB |
| | BB and Lower |
| | No Rating |
| | Amortized Cost |
| | Fair Value |
| | Amortized Cost |
| | Fair Value |
| | AAA/ AA |
| | A |
| | BBB |
| | BB and Lower |
| | No Rating |
| |
| U.S. Treasury and government agencies | $ | 14,390 |
| | $ | 14,335 |
| | $ | 15,173 |
| | $ | 15,286 |
| | 100 | % | |
| |
| |
| |
| | $ | 19,621 |
| | $ | 19,778 |
| | $ | 18,862 |
| | $ | 18,863 |
| | 100 | % | |
| |
| |
| |
| |
| Agency residential mortgage-backed | 41,175 |
| | 40,301 |
| | 40,037 |
| | 39,847 |
| | 100 | % | |
| |
| |
| |
| | 44,866 |
| | 44,750 |
| | 45,153 |
| | 44,407 |
| | 100 | % | |
| |
| |
| |
| |
| Non-agency residential mortgage-backed | 2,483 |
| | 2,802 |
| | 2,610 |
| | 2,932 |
| | 11 | % | |
| | 3 | % | | 66 | % | | 20 | % | | 1,983 |
| | 2,278 |
| | 2,076 |
| | 2,365 |
| | 13 | % | | 2 | % | | 2 | % | | 48 | % | | 35 | % | |
| Agency commercial mortgage-backed | 2,222 |
| | 2,146 |
| | 2,367 |
| | 2,315 |
| | 100 | % | |
| |
| |
| |
| | 2,705 |
| | 2,681 |
| | 2,773 |
| | 2,720 |
| | 100 | % | |
| |
| |
| |
| |
| Non-agency commercial mortgage-backed (b) | 3,109 |
| | 3,098 |
| | 3,141 |
| | 3,161 |
| | 84 | % | | 6 | % | |
|
| |
|
| | 10 | % | | 3,304 |
| | 3,308 |
| | 3,177 |
| | 3,145 |
| | 88 | % | | 5 | % | |
|
| |
|
| | 7 | % | |
| Asset-backed (c) | 5,325 |
| | 5,380 |
| | 5,531 |
| | 5,598 |
| | 84 | % | | 3 | % | | 6 | % | | 7 | % | |
| | 5,682 |
| | 5,739 |
| | 5,115 |
| | 5,155 |
| | 88 | % | | 3 | % | | 3 | % | | 5 | % | | 1 | % | |
| Other debt (d) | 6,081 |
| | 6,179 |
| | 6,279 |
| | 6,459 |
| | 74 | % | | 15 | % | | 7 | % | | 1 | % | | 3 | % | | |
| Other (e) | | | | | 587 |
| | 585 |
| | | | | | | | | | | | |
Total investment securities (f) | $ | 74,785 |
| | $ | 74,241 |
| | $ | 75,725 |
| | $ | 76,183 |
| | 93 | % | | 2 | % | | 1 | % | | 3 | % | | 1 | % | | |
| Other (d) | | 5,181 |
| | 5,325 |
| | 5,670 |
| | 5,753 |
| | 72 | % | | 15 | % | | 9 | % | | 1 | % | | 3 | % | |
Total investment securities (e) | | $ | 83,342 |
| | $ | 83,859 |
| | $ | 82,826 |
| | $ | 82,408 |
| | 95 | % | | 1 | % | | 1 | % | | 2 | % | | 1 | % | |
| |
| (a) | Ratings percentages allocated based on amortized cost. |
| |
| (b) | Collateralized primarily by retail properties, office buildings, lodging properties and multi-family housing. |
| |
| (c) | Collateralized primarily by corporate debt, government guaranteed education loans and other consumer credit products. |
| |
| (d) | Includes state and municipal securities. |
| |
| (e) | On January 1, 2018, $.6 billion of available for sale securities, primarily money market funds, were reclassified to equity investments in accordance with the adoption of ASU 2016-01. See the Recently Adopted Accounting Standards portion of Note 1 Accounting Policies in the Notes To Consolidated Financial Statements of this Report for additional detail on this adoption. |
| |
(f) | Includes available for sale and held to maturity securities, which are recorded on our balance sheet at fair value and amortized cost, respectively. |
The PNC Financial Services Group, Inc. – Form 10-Q9
Investment securities decreased $1.6 billion at March 31, 2018 compared to December 31, 2017, driven by declines in U.S. Treasury and government agencies securities of $.9 billion, other debt securities of $.3 billion, commercial mortgage-backed securities of $.2 billion and asset-backed securities of $.2 billion. These declines were partially offset by net purchases of agency residential mortgage-backed securities of $.8 billion. The overall decrease includes a $.6 billion decline in the valuation of our available for sale securities portfolio reflecting the impact of higher interest rates, primarily for U.S. Treasury and government agencies and agency residential mortgage-backed securities.
The decline in total investment securities at March 31, 2018 compared to December 31, 2017 also reflected the reclassification of $.6 billion of available for sale securities, primarily money market funds, to equity investments as part of the adoption of ASU 2016-01. See Note 1 Accounting Policies in the Notes To Consolidated Financial Statements for additional detail on our adoption of this ASU.
The level and composition of the investment securities portfolio fluctuates over time based on many factors including market conditions, loan and deposit growth, and balance sheet management activities. We manage our investment securities portfolio to optimize returns, while providing a reliable source of liquidity for our banking and other activities, considering LCR and other internal and external guidelines and constraints.
Table 7 presents the distribution of our total investment securities portfolio by amortized cost and fair value, as well as by credit rating. We have included credit ratings information because we believe that the information is an indicator of the degree of credit risk to which we are exposed, which could affect our risk-weighted assets and, therefore, our risk-based regulatory capital ratios under the current regulatory capital rules. Changes in credit ratings classifications could indicate increased or decreased credit risk and could be accompanied by a reduction or increase in the fair value of our investment securities portfolio.
At least quarterly, we conduct a comprehensive security-level impairment assessment on all securities. If economic conditions, including home prices, were to deteriorate from current levels, and if market volatility and liquidity were to deteriorate from current levels, or if market interest rates were to increase or credit spreads were to widen appreciably, the valuation of our investment securities portfolio would likely be adversely affected and we could incur additional other than temporary impairment (OTTI) credit losses that would impact our Consolidated Income Statement.
The duration of investment securities was 3.73.1 years at March 31, 2018.2019. We estimate that at March 31, 20182019 the effective duration of investment securities was 3.83.3 years for an immediate 50 basis points parallel increase in interest rates and 3.52.9 years for an immediate 50 basis points parallel decrease in interest rates.
Based on expected prepayment speeds, the weighted-average expected maturity of the investment securities portfolio (excluding other) was 5.74.9 years at March 31, 20182019 compared to 5.25.3 years at December 31, 2017.2018.
Table 8: Weighted-Average Expected Maturities of Mortgage and Other Asset-Backed Debt Securities
|
| | | |
March 31, 20182019 | Years |
| |
| Agency residential mortgage-backed | 6.65.6 |
| |
| Non-agency residential mortgage-backed | 6.36.2 |
| |
| Agency commercial mortgage-backed | 3.54.1 |
| |
| Non-agency commercial mortgage-backed | 3.12.7 |
| |
| Asset-backed | 2.52.1 |
| |
Additional information regarding our investment securities is included in Note 5 Investment Securities and Note 6 Fair Value in the Notes To Consolidated Financial Statements included in this Report.
10The PNC Financial Services Group, Inc. – Form 10-Q9
Funding Sources
Table 9: Details of Funding Sources | | | | March 31 |
| | December 31 |
| | Change | | March 31 |
| | December 31 |
| | Change | |
| Dollars in millions | 2018 |
| | 2017 |
| | $ | % | | 2019 |
| | 2018 |
| | $ | % | |
| Deposits | | | | | | | | | | | | | | |
| Noninterest-bearing | $ | 78,303 |
| | $ | 79,864 |
| | $ | (1,561 | ) | (2 | )% | | $ | 71,606 |
| | $ | 73,960 |
| | $ | (2,354 | ) | (3 | )% | |
| Interest-bearing | | | | |
|
|
|
| | | | | |
|
|
|
| |
| Money market | 57,260 |
| | 59,735 |
| | (2,475 | ) | (4 | )% | | 53,037 |
| | 53,368 |
| | (331 | ) | (1 | )% | |
| Demand | 62,289 |
| | 61,213 |
| | 1,076 |
| 2 | % | | 65,643 |
| | 65,211 |
| | 432 |
| 1 | % | |
| Savings | 50,582 |
| | 46,980 |
| | 3,602 |
| 8 | % | | 61,315 |
| | 56,793 |
| | 4,522 |
| 8 | % | |
| Time deposits | 16,270 |
| | 17,261 |
| | (991 | ) | (6 | )% | | 19,620 |
| | 18,507 |
| | 1,113 |
| 6 | % | |
| Total interest-bearing deposits | 186,401 |
| | 185,189 |
| | 1,212 |
| 1 | % | | 199,615 |
| | 193,879 |
| | 5,736 |
| 3 | % | |
| Total deposits | 264,704 |
| | 265,053 |
| | (349 | ) | — |
| | 271,221 |
| | 267,839 |
| | 3,382 |
| 1 | % | |
| Borrowed funds | | | | |
|
|
|
| | | | | |
|
|
|
| |
| Federal Home Loan Bank (FHLB) borrowings | 19,537 |
| | 21,037 |
| | (1,500 | ) | (7 | )% | | 20,501 |
| | 21,501 |
| | (1,000 | ) | (5 | )% | |
| Bank notes and senior debt | 28,773 |
| | 28,062 |
| | 711 |
| 3 | % | | 25,598 |
| | 25,018 |
| | 580 |
| 2 | % | |
| Subordinated debt | 5,121 |
| | 5,200 |
| | (79 | ) | (2 | )% | | 5,977 |
| | 5,895 |
| | 82 |
| 1 | % | |
| Other | 4,608 |
| | 4,789 |
| | (181 | ) | (4 | )% | | 7,784 |
| | 5,005 |
| | 2,779 |
| 56 | % | |
| Total borrowed funds | 58,039 |
| | 59,088 |
| | (1,049 | ) | (2 | )% | | 59,860 |
| | 57,419 |
| | 2,441 |
| 4 | % | |
| Total funding sources | $ | 322,743 |
| | $ | 324,141 |
| | $ | (1,398 | ) | — |
| | $ | 331,081 |
| | $ | 325,258 |
| | $ | 5,823 |
| 2 | % | |
Total deposits declined slightly in the comparisonincreased as growth in interest-bearing deposits was more thanpartially offset by decreasesa decrease in noninterest-bearing deposits.
The increase in interest-bearing deposits reflected consumer deposit growth, including from the national retail digital strategy. Noninterest-bearing deposits decreased due to seasonal declines in commercial deposits. Within interest-bearing deposits savings deposits grew reflecting, in part, a shift from consumer money market to relationship-based savings products, as well as growth in consumer demand deposit balances. The decline in timea shift of commercial deposits largely reflected lower certificates of depositto interest-bearing.
Borrowed funds increased due to the net runoff of maturing accounts.
The declinehigher federal funds purchased, included in other borrowed funds, in the comparison was primarily due to lower FHLB borrowings, partially offset by growth inand bank notes and senior debt, including $2.0 billion issuedwhich were partially offset by decreases in January 2018.FHLB borrowings. The level and composition of borrowed funds fluctuates over time based on many factors including market conditions, loan, investment securities and deposit growth, and capital considerations. We manage our borrowed funds to provide a reliable source of liquidity for our banking and other activities, considering our LCR and other internal and external guidelines and constraints.
See the Liquidity and Capital Management portion of the Risk Management section of this Financial Review for additional information regarding our 20182019 liquidity and capital activities.
Shareholders’ Equity
Total shareholders’ equity was $47.0$48.5 billion at March 31, 2018, a decrease2019, an increase of $.5$.8 billion compared to December 31, 2017.2018. The decreaseincrease resulted from common share repurchasesnet income of $1.3 billion and higher AOCI of $.7 billion lower accumulated other comprehensive income (loss) related to net unrealized securities lossesgains, partially offset by common share repurchases of $.6 billion$725 million and common and preferred dividends of $.4 billion, partially offset by net income of $1.2 billion.$438 million.
Common shares outstanding were 470452 million and 473457 million at March 31, 20182019 and December 31, 2017,2018, respectively, as repurchases of 4.85.9 million shares during the period were partially offset by share issuances from treasury stock related to warrants exercised and stock-based compensation activity.
The PNC Financial Services Group, Inc. – Form 10-Q11
BUSINESS SEGMENTS REVIEW
We have four reportable business segments:
Retail Banking
Corporate & Institutional Banking
Asset Management Group
BlackRock
Business segment results and a description of each business are included in Note 14 Segment Reporting included in the Notes To Consolidated Financial Statements in this Report. Certain amounts included in this Business Segments Review differ from those amounts shown in Note 14, primarily due to the presentation in this Financial Review of business net interest income on a taxable-equivalent basis.
Net interest income in business segment results reflects our internal funds transfer pricing methodology. Assets receive a funding charge and liabilities and capital receive a funding credit based on a transfer pricing methodology that incorporates product repricing characteristics, tenor and other factors.
Retail Banking
(Unaudited)
Table 10: Retail Banking Table
|
| | | | | | | | | | | | | | |
| Three months ended March 31 | | | | | Change | |
| Dollars in millions, except as noted | 2018 | | 2017 | | $ | % | |
| Income Statement | | | | | | | |
| Net interest income | $ | 1,218 |
| | $ | 1,121 |
| | $ | 97 |
| 9 | % | |
| Noninterest income | 635 |
| | 603 |
| | 32 |
| 5 | % | |
| Total revenue | 1,853 |
| | 1,724 |
| | 129 |
| 7 | % | |
| Provision for credit losses | 69 |
| | 71 |
| | (2 | ) | (3 | )% | |
| Noninterest expense | 1,395 |
| | 1,315 |
| | 80 |
| 6 | % | |
| Pretax earnings | 389 |
| | 338 |
| | 51 |
| 15 | % | |
| Income taxes | 93 |
| | 125 |
| | (32 | ) | (26 | )% | |
| Earnings | $ | 296 |
| | $ | 213 |
| | $ | 83 |
| 39 | % | |
| Average Balance Sheet | | | | | | | |
| Loans held for sale | $ | 652 |
| | $ | 843 |
| | $ | (191 | ) | (23 | )% | |
| Loans | | | | | | | |
| Consumer | | | | | | | |
| Home equity | $ | 24,608 |
| | $ | 25,601 |
| | $ | (993 | ) | (4 | )% | |
| Automobile | 13,105 |
| | 12,146 |
| | 959 |
| 8 | % | |
| Education | 4,409 |
| | 5,131 |
| | (722 | ) | (14 | )% | |
| Credit cards | 5,619 |
| | 5,121 |
| | 498 |
| 10 | % | |
| Other | 1,765 |
| | 1,756 |
| | 9 |
| 1 | % | |
| Total consumer | 49,506 |
| | 49,755 |
| | (249 | ) | (1 | )% | |
| Commercial and commercial real estate | 10,527 |
| | 11,006 |
| | (479 | ) | (4 | )% | |
| Residential mortgage | 13,420 |
| | 11,688 |
| | 1,732 |
| 15 | % | |
| Total loans | $ | 73,453 |
| | $ | 72,449 |
| | $ | 1,004 |
| 1 | % | |
| Total assets | $ | 88,734 |
| | $ | 87,109 |
| | $ | 1,625 |
| 2 | % | |
| Deposits | | | | | | | |
| Noninterest-bearing demand | $ | 29,779 |
| | $ | 29,010 |
| | $ | 769 |
| 3 | % | |
| Interest-bearing demand | 41,939 |
| | 40,649 |
| | 1,290 |
| 3 | % | |
| Money market | 32,330 |
| | 39,321 |
| | (6,991 | ) | (18 | )% | |
| Savings | 43,838 |
| | 35,326 |
| | 8,512 |
| 24 | % | |
| Certificates of deposit | 12,082 |
| | 13,735 |
| | (1,653 | ) | (12 | )% | |
| Total deposits | $ | 159,968 |
| | $ | 158,041 |
| | $ | 1,927 |
| 1 | % | |
| Performance Ratios | | | | | | | |
| Return on average assets | 1.35 | % | | .99 | % | | | | |
| Noninterest income to total revenue | 34 | % | | 35 | % | | | | |
| Efficiency | 75 | % | | 76 | % | | | | |
1210 The PNC Financial Services Group, Inc. – Form 10-Q
Total business segment financial results differ from total consolidated net income. The impact of these differences is reflected in the “Other” category as shown in Table 71 in Note 14 Segment Reporting in Item 1 of this Report. “Other” includes residual activities that do not meet the criteria for disclosure as a separate reportable business, such as asset and liability management activities including net securities gains or losses, other-than-temporary impairment of investment securities, certain trading activities, certain runoff consumer loan portfolios, private equity investments, intercompany eliminations, certain corporate overhead, tax adjustments that are not allocated to business segments, gains or losses related to BlackRock transactions, exited businesses, and differences between business segment performance reporting and financial statement reporting (GAAP), including the presentation of net income attributable to noncontrolling interests as the segments’ results exclude their portion of net income attributable to noncontrolling interests.
Retail Banking
Retail Banking's core strategy is to acquire and retain customers who maintain their primary checking and transaction relationships with us. We seek to deepen relationships by meeting the broad range of our customers’ financial needs with savings, liquidity, lending, investment and retirement solutions. A strategic priority for us is to differentiate the customer experience and drive transformation and automation. A key element of our strategy is to expand the use of lower-cost alternative distribution channels, with an emphasis on digital capabilities, while continuing to optimize the traditional branch network. In addition, we have a disciplined process to continually improve the engagement of both our employees and customers, which is a strong driver of customer growth, retention and relationship expansion. In 2018, we launched our national retail digital strategy designed to grow customers with digitally-led banking and an ultra-thin branch network in markets outside of our existing retail branch network.
Table 10: Retail Banking Table |
| | | | | | | | | | | | | | |
| Three months ended March 31 | | | | | Change | |
| Dollars in millions, except as noted | 2018 |
| | 2017 |
| | $ | % | |
| Supplemental Noninterest Income Information | | | | | | | |
| Consumer services | $ | 266 |
| | $ | 250 |
| | $ | 16 |
| 6 | % | |
| Brokerage | $ | 86 |
| | $ | 76 |
| | $ | 10 |
| 13 | % | |
| Residential mortgage | $ | 97 |
| | $ | 113 |
| | $ | (16 | ) | (14 | )% | |
| Service charges on deposits | $ | 160 |
| | $ | 154 |
| | $ | 6 |
| 4 | % | |
| Residential Mortgage Information | | | | | | | |
| Residential mortgage servicing statistics (in billions, except as noted) (a) | | | | | | | |
| Serviced portfolio balance (b) | $ | 125 |
| | $ | 130 |
| | $ | (5 | ) | (4 | )% | |
| Serviced portfolio acquisitions | $ | 1 |
| | $ | 8 |
| | $ | (7 | ) | (88 | )% | |
| MSR asset value (b) | $ | 1.3 |
| | $ | 1.3 |
| | — |
| — |
| |
| MSR capitalization value (in basis points) (b) | 101 |
| | 97 |
| | 4 |
| 4 | % | |
| Servicing income: (in millions) | | | | | | | |
| Servicing fees, net (c) | $ | 51 |
| | $ | 52 |
| | $ | (1 | ) | (2 | )% | |
| Mortgage servicing rights valuation, net of economic hedge | $ | 9 |
| | $ | 12 |
| | $ | (3 | ) | (25 | )% | |
| Residential mortgage loan statistics | | | | | | | |
| Loan origination volume (in billions) | $ | 1.7 |
| | $ | 1.9 |
| | $ | (.2 | ) | (11 | )% | |
| Loan sale margin percentage | 2.83 | % | | 2.96 | % | | | | |
| Percentage of originations represented by: | | | | | | | |
| Purchase volume (d) | 56 | % | | 43 | % | | | | |
| Refinance volume | 44 | % | | 57 | % | | | | |
| Other Information (b) | | | | | | | |
| Customer-related statistics (average) | | | | | | | |
| Non-teller deposit transactions (e) | 54 | % | | 52 | % | | | | |
| Digital consumer customers (f) | 64 | % | | 61 | % | | | | |
| Credit-related statistics | | | | | | | |
| Nonperforming assets (g) | $ | 1,131 |
| | $ | 1,209 |
| | $ | (78 | ) | (6 | )% | |
| Net charge-offs | $ | 100 |
| | $ | 100 |
| | — |
| — |
| |
| Other statistics | | | | | | | |
| ATMs | 9,047 |
| | 8,976 |
| | 71 |
| 1 | % | |
| Branches (h) | 2,442 |
| | 2,508 |
| | (66 | ) | (3 | )% | |
| Brokerage account client assets (in billions) (i) | $ | 49 |
| | $ | 46 |
| | $ | 3 |
| 7 | % | |
|
| | | | | | | | | | | | | | |
| (Unaudited) | | | | | | | |
| Three months ended March 31 | | | | | Change | |
| Dollars in millions, except as noted | 2019 | | 2018 | | $ | % | |
| Income Statement | | | | | | | |
| Net interest income | $ | 1,349 |
| | $ | 1,218 |
| | $ | 131 |
| 11 | % | |
| Noninterest income | 595 |
| | 635 |
| | (40 | ) | (6 | )% | |
| Total revenue | 1,944 |
| | 1,853 |
| | 91 |
| 5 | % | |
| Provision for credit losses | 128 |
| | 69 |
| | 59 |
| 86 | % | |
| Noninterest expense | 1,468 |
| | 1,456 |
| | 12 |
| 1 | % | |
| Pretax earnings | 348 |
| | 328 |
| | 20 |
| 6 | % | |
| Income taxes | 84 |
| | 79 |
| | 5 |
| 6 | % | |
| Earnings | $ | 264 |
| | $ | 249 |
| | $ | 15 |
| 6 | % | |
| Average Balance Sheet | | | | | | | |
| Loans held for sale | $ | 441 |
| | $ | 652 |
| | $ | (211 | ) | (32 | )% | |
| Loans | | | | | | | |
| Consumer | | | | | | | |
| Home equity | $ | 22,990 |
| | $ | 24,608 |
| | $ | (1,618 | ) | (7 | )% | |
| Automobile | 14,608 |
| | 13,105 |
| | 1,503 |
| 11 | % | |
| Education | 3,816 |
| | 4,409 |
| | (593 | ) | (13 | )% | |
| Credit cards | 6,204 |
| | 5,619 |
| | 585 |
| 10 | % | |
| Other | 2,068 |
| | 1,765 |
| | 303 |
| 17 | % | |
| Total consumer | 49,686 |
| | 49,506 |
| | 180 |
| — |
| |
| Commercial and commercial real estate | 10,461 |
| | 10,527 |
| | (66 | ) | (1 | )% | |
| Residential mortgage | 15,034 |
| | 13,420 |
| | 1,614 |
| 12 | % | |
| Total loans | $ | 75,181 |
| | $ | 73,453 |
| | $ | 1,728 |
| 2 | % | |
| Total assets | $ | 91,255 |
| | $ | 88,734 |
| | $ | 2,521 |
| 3 | % | |
| Deposits | | | | | | | |
| Noninterest-bearing demand | $ | 30,389 |
| | $ | 29,779 |
| | $ | 610 |
| 2 | % | |
| Interest-bearing demand | 42,477 |
| | 41,939 |
| | 538 |
| 1 | % | |
| Money market | 26,773 |
| | 32,330 |
| | (5,557 | ) | (17 | )% | |
| Savings | 53,100 |
| | 43,838 |
| | 9,262 |
| 21 | % | |
| Certificates of deposit | 12,381 |
| | 12,082 |
| | 299 |
| 2 | % | |
| Total deposits | $ | 165,120 |
| | $ | 159,968 |
| | $ | 5,152 |
| 3 | % | |
| Performance Ratios | | | | | | | |
| Return on average assets | 1.17 | % | | 1.14 | % | | | | |
| Noninterest income to total revenue | 31 | % | | 34 | % | | | | |
| Efficiency | 76 | % | | 79 | % | | | | |
The PNC Financial Services Group, Inc. – Form 10-Q11
|
| | | | | | | | | | | | | | |
| Three months ended March 31 | | | | | Change | |
| Dollars in millions, except as noted | 2019 |
| | 2018 |
| | $ | % | |
| Supplemental Noninterest Income Information | | | | | | | |
| Consumer services | $ | 277 |
| | $ | 266 |
| | $ | 11 |
| 4 | % | |
| Brokerage | $ | 89 |
| | $ | 86 |
| | $ | 3 |
| 3 | % | |
| Residential mortgage | $ | 65 |
| | $ | 97 |
| | $ | (32 | ) | (33 | )% | |
| Service charges on deposits | $ | 162 |
| | $ | 160 |
| | $ | 2 |
| 1 | % | |
| Residential Mortgage Information | | | | | | | |
| Residential mortgage servicing statistics (in billions, except as noted) (a) | | | | | | | |
| Serviced portfolio balance (b) | $ | 123 |
| | $ | 125 |
| | $ | (2 | ) | (2 | )% | |
| Serviced portfolio acquisitions | $ | 1 |
| | $ | 1 |
| | — |
| — |
| |
| MSR asset value (b) | $ | 1.1 |
| | $ | 1.3 |
| | $ | (.2 | ) | (15 | )% | |
| MSR capitalization value (in basis points) (b) | 92 |
| | 101 |
| | (9 | ) | (9 | )% | |
| Servicing income: (in millions) | | | | | | | |
| Servicing fees, net (c) | $ | 53 |
| | $ | 51 |
| | $ | 2 |
| 4 | % | |
| Mortgage servicing rights valuation, net of economic hedge | $ | (9 | ) | | $ | 9 |
| | $ | (18 | ) | (200 | )% | |
| Residential mortgage loan statistics | | | | | | | |
| Loan origination volume (in billions) | $ | 1.7 |
| | $ | 1.7 |
| | — |
| — |
| |
| Loan sale margin percentage | 2.35 | % | | 2.83 | % | | | | |
| Percentage of originations represented by: | | | | | | | |
| Purchase volume (d) | 56 | % | | 56 | % | | | | |
| Refinance volume | 44 | % | | 44 | % | | | | |
| Other Information (b) | | | | | | | |
| Customer-related statistics (average) | | | | | | | |
| Non-teller deposit transactions (e) | 57 | % | | 54 | % | | | | |
| Digital consumer customers (f) | 68 | % | | 64 | % | | | | |
| Credit-related statistics | | | | | | | |
| Nonperforming assets (g) | $ | 1,109 |
| | $ | 1,131 |
| | $ | (22 | ) | (2 | )% | |
| Net charge-offs | $ | 132 |
| | $ | 100 |
| | $ | 32 |
| 32 | % | |
| Other statistics | | | | | | | |
| ATMs | 9,112 |
| | 9,047 |
| | 65 |
| 1 | % | |
| Branches (h) | 2,347 |
| | 2,442 |
| | (95 | ) | (4 | )% | |
| Brokerage account client assets (in billions) (i) | $ | 51 |
| | $ | 49 |
| | $ | 2 |
| 4 | % | |
| |
| (a) | Represents mortgage loan servicing balances for third parties and the related income. |
| |
| (b) | Presented as of March 31, except for customer-related statistics, which are quarterly averages for the three months ended, and net charge-offs, which are for the three months ended. |
| |
| (c) | Servicing fees net of impact of decrease in MSR value due to passage of time, including the impact from both regularly scheduled loan prepayments and loans that were paid down or paid off during the period. |
| |
| (d) | Mortgages with borrowers as part of residential real estate purchase transactions. |
| |
| (e) | Percentage of total consumer and business banking deposit transactions processed at an ATM or through our mobile banking application. |
| |
| (f) | Represents consumer checking relationships that process the majority of their transactions through non-teller channels. |
| |
| (g) | Includes nonperforming loans of $1.0 billion and $1.1 billion at bothMarch 31, 2019 and March 31, 2018, and March 31, 2017.respectively. |
| |
| (h) | Excludes stand-alone mortgage offices and satellite offices (e.g., drive-ups, electronic branches and retirement centers) that provide limited products and/or services. |
| |
| (i) | Includes cash and money market balances. |
Retail Banking earned $296$264 million in the first three months of 20182019 compared with $213$249 million for the same period in 2017.2018. The increase in earnings was driven byattributable to higher net interest and noninterest income partially offset by an increase inlower noninterest expense. First quarter 2018 earnings also benefited from the lower statutory federal income tax rate.and increased noninterest expense and provision for credit losses.
Net interest income increased primarily due to wider interest rate spreads on the value of deposits.
The increasedecrease in noninterest income was largely attributed to lower residential mortgage noninterest income, reflecting a negative adjustment for residential mortgage servicing rights valuation, net of economic hedge, compared with a benefit in first quarter 2018, and a decline in loan sales revenue. The decline in loan sales revenue reflected growthlower gain on sales margins as a result of increased competition in credit card, brokerage, and debit card fees, higher service charges on deposits and lowerthe marketplace. In addition, the impact of negative derivative fair value adjustments related to swap agreements with purchasers of Visa Class B common shares of $31 million for the first quarter of 2019 compared with $2 million in connection with all prior salesthe same period in 2018 also contributed to date.the decrease in noninterest income. These increasesdecreases were partially offset by lower residential mortgage loan sales revenue, which reflected compressed pricing marginsgrowth in consumer service fees, including higher debit and lower refinancing origination volume.credit card fees, as well as higher brokerage fees and service charges on deposits.
12 The PNC Financial Services Group, Inc. – Form 10-Q
Provision for credit losses increased in 2019 compared to 2018 primarily due to portfolio growth and reserve increases in the auto portfolio.
Higher noninterest expense primarily resulted from an increase in personnel expense,marketing activity, customer-related transactional costs and investments in technologyequipment and compliance expense.technology.
The deposit strategy of Retail Banking is to remain disciplined on pricing and focused on growing and retaining relationship-based balances, executing on market-specific deposit growth strategies and providing a source of low-cost funding and liquidity to PNC. In the first quarter of 2019, average total deposits increased compared to the same period in 2018, as both interest-bearing and noninterest-bearing demand deposits increased. Savings deposits increased, reflecting, in part, a shift from money market deposits to relationship-based savings products as well as growth in consumer deposits, including from the national retail digital strategy. Certificates of deposit increased slightly due to shifts in consumer preferences to time deposits.
Retail Banking average total loans increased in the first quarter of 2019 compared with the same period in 2018.
The PNC Financial Services Group, Inc. – Form 10-Q13Average residential mortgages increased as a result of growth in nonconforming residential mortgage loans.
Average automobile loans increased primarily due to strong new indirect auto loan volumes, including in our Southeast and new markets, as well as growth in direct auto loans.
Average credit card balances increased as we continued to focus on our long-term objective of deepening penetration within our existing customer base.
Average home equity loans decreased as paydowns and payoffs on loans exceeded new originated volume.
Average education loans decreased driven by a decline in the runoff portfolio of government guaranteed education loans.
Average commercial and commercial real estate loans declined as paydowns and payoffs on loans exceeded new volume.
Retail Banking continues to enhance the customer experience with refinements to product and service offerings that drive value for consumers and small businesses. We are focused on meeting the financial needs of our customers by providing a broad range of liquidity, banking and investment products.
The deposit strategy of In 2018, Retail Banking is to remain disciplined on pricing and focused on growing and retaining relationship-based balances, executing on market-specific deposit growth strategies and providinglaunched its national retail digital strategy by offering a sourcehigh yield savings account in markets outside of low-cost funding and liquidity to PNC. In the first quarter of 2018, average total deposits increased compared to the same period a year ago, as both interest-bearing and noninterest-bearing deposits increased. Savings deposits grew, reflecting, in part, a shift from money market deposits to relationship-based savings products. Additionally, interest-bearing demand deposits increased, while certificates of deposit declined due to the net runoff of maturing accounts.
Retail Banking average total loans increased in the first quarter of 2018 compared with the first quarter of 2017.
Average residential mortgages increased as a result of growth in originations of nonconforming residential mortgage loans, both nationwide and within our branch network.
Average automobile loans, which consisted of both direct and indirect auto loans, increased primarily due to portfolio growth, including in our Southeast markets.
Average credit card balances increased as we continued to focus on our long-term objective of deepening penetration within our existing customer base.
Average home equity loans decreasedretail branch network and opened a retail location in Kansas City. Deposit balances generated through the national retail digital strategy totaled $1.2 billion as paydowns and payoffs on loans exceeded new originated volume.
Average commercial and commercial real estate loans declined as paydowns and payoffs on loans exceeded new volume.
Average education loans decreased driven by a decline in the runoff portfolio of government guaranteed education loans.
Nonperforming assets decreased compared to March 31, 2017 due to declines in both consumer and commercial nonperforming loans.2019.
Retail Banking continued to focus on its strategy of transforming the customer experience through transaction migration, branch network and home lending transformations and multi-channel engagement and service strategies.
Approximately 64%68% of consumer customers used non-teller channels for the majority of their transactions in the first quarterthree months of 20182019 compared with 61%64% for the same period in the first quarter of 2017.2018.
Deposit transactions via ATM and mobile channels increased to 54%57% of total deposit transactions versus 52%54% for the same period in the comparison.
Instant debit card issuance, which enables us to print a customer’s debit card in minutes, was available in 91% of our branch network as of March 31, 2018.
Retail Banking continuedcontinues to make progress on its multi-year initiative to redesign the home lending process by integrating mortgage andprocess. In 2019, the home equity lending into a common platformorigination cycle will be the focus as we enhance current capabilities in order to enhance product capability and improve speed of delivery and convenience.
We converted home equity loans to the new servicing platform in the first quarter of 2018. Both residential mortgage and home equity loans are now serviced on a single platform.
We implemented a new mortgage origination system in 2017.convenience for customers.
The PNC Financial Services Group, Inc. – Form 10-Q13
Corporate & Institutional Banking
Corporate & Institutional Banking’s strategy is to be the leading relationship-based provider of traditional banking products and services to its customers through the economic cycles. We aim to grow our market share and drive higher returns by delivering value-added solutions that help our clients better run their organizations, all while maintaining prudent risk and expense management. We continue to focus on building client relationships where the risk-return profile is attractive.
Table 11: Corporate & Institutional Banking Table
|
| | | | | | | | | | | | | | |
| (Unaudited) | | | | | | | |
| Three months ended March 31 | | | | | Change | |
| Dollars in millions | 2019 | | 2018 | | $ | % | |
| Income Statement | | | | | | | |
| Net interest income | $ | 898 |
| | $ | 882 |
| | $ | 16 |
| 2 | % | |
| Noninterest income | 576 |
| | 547 |
| | 29 |
| 5 | % | |
| Total revenue | 1,474 |
| | 1,429 |
| | 45 |
| 3 | % | |
| Provision for credit losses | 71 |
| | 41 |
| | 30 |
| 73 | % | |
| Noninterest expense | 686 |
| | 653 |
| | 33 |
| 5 | % | |
| Pretax earnings | 717 |
| | 735 |
| | (18 | ) | (2 | )% | |
| Income taxes | 165 |
| | 172 |
| | (7 | ) | (4 | )% | |
| Earnings | $ | 552 |
| | $ | 563 |
| | $ | (11 | ) | (2 | )% | |
| Average Balance Sheet | | | | | | | |
| Loans held for sale | $ | 347 |
| | $ | 1,189 |
| | $ | (842 | ) | (71 | )% | |
| Loans | | | | | | | |
| Commercial | $ | 108,641 |
| | $ | 100,802 |
| | $ | 7,839 |
| 8 | % | |
| Commercial real estate | 25,971 |
| | 26,732 |
| | (761 | ) | (3 | )% | |
| Equipment lease financing | 7,264 |
| | 7,845 |
| | (581 | ) | (7 | )% | |
| Total commercial lending | 141,876 |
| | 135,379 |
| | 6,497 |
| 5 | % | |
| Consumer | 20 |
| | 77 |
| | (57 | ) | (74 | )% | |
| Total loans | $ | 141,896 |
| | $ | 135,456 |
| | $ | 6,440 |
| 5 | % | |
| Total assets | $ | 157,169 |
| | $ | 151,909 |
| | $ | 5,260 |
| 3 | % | |
| Deposits | | | | | | | |
| Noninterest-bearing demand | $ | 39,551 |
| | $ | 45,896 |
| | $ | (6,345 | ) | (14 | )% | |
| Money market | 25,630 |
| | 23,406 |
| | 2,224 |
| 10 | % | |
| Other | 23,374 |
| | 18,592 |
| | 4,782 |
| 26 | % | |
| Total deposits | $ | 88,555 |
| | $ | 87,894 |
| | $ | 661 |
| 1 | % | |
| Performance Ratios | | | | | | | |
| Return on average assets | 1.42 | % | | 1.50 | % | | | | |
| Noninterest income to total revenue | 39 | % | | 38 | % | | | | |
| Efficiency | 47 | % | | 46 | % | | | | |
| Other Information | | | | | | | |
| Consolidated revenue from: (a) | | | | | | | |
| Treasury Management (b) | $ | 445 |
| | $ | 419 |
| | $ | 26 |
| 6 | % | |
| Capital Markets (b) | $ | 246 |
| | $ | 258 |
| | $ | (12 | ) | (5 | )% | |
| Commercial mortgage banking activities: | | | | | | | |
| Commercial mortgage loans held for sale (c) | $ | 15 |
| | $ | 14 |
| | $ | 1 |
| 7 | % | |
| Commercial mortgage loan servicing income (d) | 54 |
| | 55 |
| | (1 | ) | (2 | )% | |
| Commercial mortgage servicing rights valuation, net of economic hedge (e) | 5 |
| | 4 |
| | 1 |
| 25 | % | |
| Total | $ | 74 |
| | $ | 73 |
| | $ | 1 |
| 1 | % | |
| Commercial mortgage servicing rights asset value (f) | $ | 681 |
| | $ | 723 |
| | $ | (42 | ) | (6 | )% | |
| Average Loans by C&IB business (g) | | | | | | | |
| Corporate Banking | $ | 71,089 |
| | $ | 65,548 |
| | $ | 5,541 |
| 8 | % | |
| Real Estate | 36,357 |
| | 37,252 |
| | (895 | ) | (2 | )% | |
| Business Credit | 21,728 |
| | 20,197 |
| | 1,531 |
| 8 | % | |
| Commercial Banking | 8,118 |
| | 8,118 |
| | — |
| — |
| |
| Other | 4,604 |
| | 4,341 |
| | 263 |
| 6 | % | |
| Total average loans | $ | 141,896 |
| | $ | 135,456 |
| | $ | 6,440 |
| 5 | % | |
| Credit-related statistics | | | | | | | |
| Nonperforming assets (f) (h) | $ | 388 |
| | $ | 508 |
| | $ | (120 | ) | (24 | )% | |
| Net charge-offs | $ | 5 |
| | $ | 9 |
| | $ | (4 | ) | (44 | )% | |
14 The PNC Financial Services Group, Inc. – Form 10-Q
Corporate & Institutional Banking
(Unaudited)
Table 11: Corporate & Institutional Banking Table |
| | | | | | | | | | | | | | |
| Three months ended March 31 | | | | | Change | |
| Dollars in millions | 2018 | | 2017 | | $ | % | |
| Income Statement | | | | | | | |
| Net interest income | $ | 882 |
| | $ | 839 |
| | $ | 43 |
| 5 | % | |
| Noninterest income | 547 |
| | 524 |
| | 23 |
| 4 | % | |
| Total revenue | 1,429 |
| | 1,363 |
| | 66 |
| 5 | % | |
| Provision for credit losses | 41 |
| | 25 |
| | 16 |
| 64 | % | |
| Noninterest expense | 626 |
| | 584 |
| | 42 |
| 7 | % | |
| Pretax earnings | 762 |
| | 754 |
| | 8 |
| 1 | % | |
| Income taxes | 178 |
| | 270 |
| | (92 | ) | (34 | )% | |
| Earnings | $ | 584 |
| | $ | 484 |
| | $ | 100 |
| 21 | % | |
| Average Balance Sheet | | | | | | | |
| Loans held for sale | $ | 1,189 |
| | $ | 1,116 |
| | $ | 73 |
| 7 | % | |
| Loans | | | | | | | |
| Commercial | $ | 100,802 |
| | $ | 92,116 |
| | $ | 8,686 |
| 9 | % | |
| Commercial real estate | 26,732 |
| | 27,091 |
| | (359 | ) | (1 | )% | |
| Equipment lease financing | 7,845 |
| | 7,497 |
| | 348 |
| 5 | % | |
| Total commercial lending | 135,379 |
| | 126,704 |
| | 8,675 |
| 7 | % | |
| Consumer | 77 |
| | 331 |
| | (254 | ) | (77 | )% | |
| Total loans | $ | 135,456 |
| | $ | 127,035 |
| | $ | 8,421 |
| 7 | % | |
| Total assets | $ | 151,909 |
| | $ | 142,592 |
| | $ | 9,317 |
| 7 | % | |
| Deposits | | | | | | | |
| Noninterest-bearing demand | $ | 45,896 |
| | $ | 47,423 |
| | $ | (1,527 | ) | (3 | )% | |
| Money market | 23,406 |
| | 21,086 |
| | 2,320 |
| 11 | % | |
| Other | 18,592 |
| | 15,391 |
| | 3,201 |
| 21 | % | |
| Total deposits | $ | 87,894 |
| | $ | 83,900 |
| | $ | 3,994 |
| 5 | % | |
| Performance Ratios | | | | | | | |
| Return on average assets | 1.56 | % | | 1.38 | % | | | | |
| Noninterest income to total revenue | 38 | % | | 38 | % | | | | |
| Efficiency | 44 | % | | 43 | % | | | | |
| Other Information | | | | | | | |
| Consolidated revenue from: (a) | | | | | | | |
| Treasury Management (b) | $ | 419 |
| | $ | 359 |
| | $ | 60 |
| 17 | % | |
| Capital Markets (b) | $ | 258 |
| | $ | 247 |
| | $ | 11 |
| 4 | % | |
| Commercial mortgage banking activities | | | | | | | |
| Commercial mortgage loans held for sale (c) | $ | 14 |
| | $ | 13 |
| | $ | 1 |
| 8 | % | |
| Commercial mortgage loan servicing income (d) | 55 |
| | 58 |
| | (3 | ) | (5 | )% | |
| Commercial mortgage servicing rights valuation, net of economic hedge (e) | 4 |
| | 16 |
| | (12 | ) | (75 | )% | |
| Total | $ | 73 |
| | $ | 87 |
| | $ | (14 | ) | (16 | )% | |
| MSR asset value (f) | $ | 723 |
| | $ | 606 |
| | $ | 117 |
| 19 | % | |
| Average Loans by C&IB business | | | | | | | |
| Corporate Banking | $ | 57,856 |
| | $ | 53,839 |
| | $ | 4,017 |
| 7 | % | |
| Real Estate | 37,252 |
| | 37,136 |
| | 116 |
| — |
| |
| Business Credit | 16,818 |
| | 14,839 |
| | 1,979 |
| 13 | % | |
| Equipment Finance | 14,243 |
| | 12,478 |
| | 1,765 |
| 14 | % | |
| Commercial Banking | 7,066 |
| | 7,041 |
| | 25 |
| — |
| |
| Other | 2,221 |
| | 1,702 |
| | 519 |
| 30 | % | |
| Total average loans | $ | 135,456 |
| | $ | 127,035 |
| | $ | 8,421 |
| 7 | % | |
| Credit-related statistics | | | | | | | |
| Nonperforming assets (f) (g) | $ | 508 |
| | $ | 546 |
| | $ | (38 | ) | (7 | )% | |
| Net charge-offs | $ | 9 |
| | $ | 21 |
| | $ | (12 | ) | (57 | )% | |
(continued on following page)
The PNC Financial Services Group, Inc. – Form 10-Q15
(continued from previous page)
| |
| (a) | Represents consolidated amounts. See the additional revenue discussion regarding treasury management, capital markets-related products and services, and commercial mortgage banking activities in the Product Revenue section of this Corporate & Institutional Banking section. |
| |
| (b) | Includes amounts reported in net interest income and noninterest income. |
| |
| (c) | Includes other noninterest income for valuations on commercial mortgage loans held for sale and related commitments, derivative valuations, originations fees, gains on sale of loans held for sale and net interest income on loans held for sale. |
| |
| (d) | Includes net interest income and noninterest income (primarily in corporate service fees) from loan servicing net of reduction in commercial mortgage servicing rights due to amortization expense and payoffs. Commercial mortgage servicing rights valuation, net of economic hedge is shown separately. |
| |
| (e) | Amounts are reported in corporate service fees. |
| |
| (g) | As a result of our first quarter 2019 C&IB business realignment, average loans previously reported as Equipment Finance were reclassified to other C&IB businesses for all periods presented. |
| |
| (h) | Includes nonperforming loans of $.4 billion at both March 31, 20182019 and March 31, 2017.2018. |
Corporate & Institutional Banking earned $584$552 million in the first quarterthree months of 20182019 compared to $484$563 million for the same period in 2017.2018. The increasedecrease was primarily due to the impact ofhigher noninterest expense and a lower statutory federal income tax rate and higher revenue,provision for credit losses, partially offset by higher noninterest expense. We continue to focus on building client relationships where the risk-return profile is attractive.revenue.
Net interest income increased in the comparison, reflecting higher average loan and deposit balances, as well as fromprimarily due to wider interest rate spreads on the value of deposits and higher average loan balances, partially offset by narrower interest rate spreads on the value of loans.
Growth in noninterest income in the comparison was primarily driven by higher merger and acquisition advisory fees and treasury management fees, increased operating lease income, mainly dueproduct revenue. An equity investment gain in the first quarter of 2019 also contributed to the commercial and vendor finance business acquiredincrease in the second quarter of 2017, and higher capital markets-related revenue.noninterest income. These increases were partially offset by a lower benefitrevenue from commercial mortgage servicing rights valuation, net of economic hedge, and lower commercial mortgage servicing income mostly due to higher amortization expense as a result of higher interest rates.credit valuations on customer-related derivative activities.
The increase in provision for credit losses in the comparison reflected specific reserves for certain nonperforming credits in the first quarter of 2018loan growth, including new loans and loan growth.increased utilization. Overall, credit quality remained stable, as nonperforming assets and net charge-offs declined in the comparison to the prior year quarter.comparison.
Noninterest expense increased in the comparison largely driven by operating expenses relateddue to the acquired business and continued investments in technologystrategic initiatives and risk management activities.variable costs associated with increased business activity.
Average loans increased in the comparison primarily due to strong growth in Corporate Banking and Business Credit and Equipment Finance businesses:Credit:
Corporate Banking provides lending, treasury management and capital markets-related products and services to midsizedmid-sized and large corporations, and government and not-for-profit entities. Average loans for this business grew in the comparison reflecting increased lending to large and midsizedmid-sized corporate clients as well as strong production in asset-backed finance securitizations.financing.
PNC Real Estate provides banking, financing and servicing solutions for commercial real estate clients across the country. Average loans for this business increased slightly as growth indecreased primarily driven by project loan payoffs, partially offset by higher commercial mortgage loans was mostly offset by a decrease in project loans.balances.
PNC Business Credit provides asset-based lending. The loan portfolio is relatively high yielding, with acceptable risk as the loans are mainly secured by short-term assets. Average loans for this business increased in the comparison as increased utilization and new originations and increased utilization were partially offset by payoffs.
PNC Equipment Finance provides equipment financing solutions for clients throughout the U.S. and Canada. Average loans, including commercial loans and finance leases, and operating leases were $15.3 billion in the first quarter of 2018, an increase of $2.0 billion in the year over year comparison due to strong new production and the acquisition of the commercial and vendor finance business with $1.0 billion of loans and leases in the second quarter of 2017.
Commercial Banking provides lending, treasury management and capital markets-related products and services to smaller corporations and businesses. Average loans for this business increased slightly as new production outpaced payoffs and maturities.were relatively unchanged.
The deposit strategy of Corporate & Institutional Banking is to remain disciplined on pricing and focused on growing and retaining relationship-based balances over time, executing on customer and segment-specific deposit growth strategies and continuing to provide funding and liquidity to PNC. Average total deposits increased in the first quarter of 2018 compared to the prior year quartercomparison driven by growth in interest-bearing deposits reflecting, in part, a shift from noninterest-bearing deposits in the rising rate environment. We continue to monitor and balance the relationship between increases to rates paid and the overall profitability of our deposit balances.
In 2017, Corporate & Institutional Banking opened officesis expanding its Corporate Banking business, focused on the middle market and larger sectors. We plan to expand into the Boston and Phoenix markets in 2019. This follows expansion into Denver, Houston and Nashville in 2018 and Dallas, Kansas City and Minneapolis as part of a multi-year expansion of our middle market banking business.in 2017. These locations complement national Corporate & Institutional Banking national businesses with operationsa significant presence in these cities, and build on past successsuccesses in the markets where PNC’s retail banking presence was limited, such as in the Southeast. We plan to offer our entireOur full suite of commercial products and services. In 2018, similar efforts have begun to expand our middle market business into the Denver, Houston and Nashville markets.services is offered in these locations.
16 The PNC Financial Services Group, Inc. – Form 10-Q
Product Revenue
In addition to credit and deposit products for commercial customers, Corporate & Institutional Banking offers other services, including treasury management, capital markets-related products and services, and commercial mortgage banking activities, for customers of all business segments. On a consolidated basis, the revenue from these other services is included in net interest income, corporate service fees and other noninterest income. From a business segment perspective, the majority of the revenue and expense related to these services is reflected in the Corporate & Institutional Banking segment results and the remainder is reflected in the results of other businesses. The Other Information section in Table 11 includes the consolidated revenue to PNC for these services. A discussion of the consolidated revenue from these services follows.
The PNC Financial Services Group, Inc. – Form 10-Q15
The Treasury Management business provides payables, receivables, deposit and account services, liquidity and investments, and online and mobile banking products and services to our clients. Treasury management revenue comprises fees from products and servicesis reported in noninterest income and net interest income. Noninterest income includes treasury management product revenue less earnings credits provided to customers on compensating deposit balances used to pay for products and services. Net interest income primarily includes revenue from all treasury management customer deposit balances. Compared with the first quarterthree months of 2017,2018, treasury management revenue increased primarily due to liquidity-related revenue associated with customer deposit balances, including interest rate spread expansion on deposit balances and higher fee income.product revenue.
Capital markets-related products and services include foreign exchange, derivatives, securities underwriting, loan syndications, mergers and acquisitions advisory and equity capital markets advisory related services. The increase inCapital markets-related revenue decreased in the comparison, was broad based across most products and services and included higher foreign exchange,primarily due to lower revenue from credit valuations on customer-related derivatives activities, loan syndications underwriting and corporate securities, partially offset by higher merger and acquisition advisory fees, partially offset by lower fixed income revenue.fees.
Commercial mortgage banking activities include revenue derived from commercial mortgage servicing (including net interest income and noninterest income) and revenue derived from commercial mortgage loans held for sale and related hedges. Total revenue from commercial mortgage banking activities decreased inwas stable with the comparison primarily due to a lower benefit from commercial mortgage servicing rights valuation, netfirst quarter of economic hedge.2018.
16The PNC Financial Services Group, Inc. – Form 10-Q17
Asset Management Group
(Unaudited)
Asset Management Group is focused on being a premier bank-held individual and institutional asset manager in each of the markets it serves. The business seeks to deliver high quality banking, trust and investment management services to our high net worth, ultra high net worth and institutional client sectors through a broad array of products and services. Asset Management Group’s priorities are to serve our clients' financial objectives, grow and deepen customer relationships and deliver solid financial performance with prudent risk and expense management.
Table 12: Asset Management Group Table
| | | (Unaudited) | | | | | | | | |
| Three months ended March 31 | | | | | Change | | | | | | Change | |
| Dollars in millions, except as noted | 2018 | | 2017 | | $ | % | | 2019 | | 2018 | | $ | % | |
| Income Statement | | | | | | | | | | | | | | |
| Net interest income | $ | 74 |
| | $ | 71 |
| | $ | 3 |
| 4 | % | | $ | 70 |
| | $ | 74 |
| | $ | (4 | ) | (5 | )% | |
| Noninterest income | 226 |
| | 218 |
| | 8 |
| 4 | % | | 217 |
| | 226 |
| | (9 | ) | (4 | )% | |
| Total revenue | 300 |
| | 289 |
| | 11 |
| 4 | % | | 287 |
| | 300 |
| | (13 | ) | (4 | )% | |
| Provision for credit losses (benefit) | (7 | ) | | (2 | ) | | (5 | ) | * |
| | (1 | ) | | (7 | ) | | 6 |
| * |
| |
| Noninterest expense | 218 |
| | 217 |
| | 1 |
| — |
| | 230 |
| | 225 |
| | 5 |
| 2 | % | |
| Pretax earnings | 89 |
| | 74 |
| | 15 |
| 20 | % | | 58 |
| | 82 |
| | (24 | ) | (29 | )% | |
| Income taxes | 21 |
| | 27 |
| | (6 | ) | (22 | )% | | 13 |
| | 20 |
| | (7 | ) | (35 | )% | |
| Earnings | $ | 68 |
| | $ | 47 |
| | $ | 21 |
| 45 | % | | $ | 45 |
| | $ | 62 |
| | $ | (17 | ) | (27 | )% | |
| Average Balance Sheet | | | | | | | | | | | | | | |
| Loans | | | | | | | | | | | | | | |
| Consumer | $ | 4,785 |
| | $ | 5,113 |
| | $ | (328 | ) | (6 | )% | | $ | 4,362 |
| | $ | 4,785 |
| | $ | (423 | ) | (9 | )% | |
| Commercial and commercial real estate | 733 |
| | 728 |
| | 5 |
| 1 | % | | 752 |
| | 733 |
| | 19 |
| 3 | % | |
| Residential mortgage | 1,517 |
| | 1,190 |
| | 327 |
| 27 | % | | 1,723 |
| | 1,517 |
| | 206 |
| 14 | % | |
| Total loans | $ | 7,035 |
| | $ | 7,031 |
| | $ | 4 |
| — |
| | $ | 6,837 |
| | $ | 7,035 |
| | $ | (198 | ) | (3 | )% | |
| Total assets | $ | 7,499 |
| | $ | 7,476 |
| | $ | 23 |
| — |
| | $ | 7,259 |
| | $ | 7,499 |
| | $ | (240 | ) | (3 | )% | |
| Deposits | | | | | | | | | | | | | | |
| Noninterest-bearing demand | $ | 1,466 |
| | $ | 1,433 |
| | $ | 33 |
| 2 | % | | $ | 1,388 |
| | $ | 1,466 |
| | $ | (78 | ) | (5 | )% | |
| Interest-bearing demand | 3,540 |
| | 3,829 |
| | (289 | ) | (8 | )% | | 3,076 |
| | 3,540 |
| | (464 | ) | (13 | )% | |
| Money market | 2,577 |
| | 3,500 |
| | (923 | ) | (26 | )% | | 2,036 |
| | 2,577 |
| | (541 | ) | (21 | )% | |
| Savings | 4,613 |
| | 3,768 |
| | 845 |
| 22 | % | | 5,723 |
| | 4,613 |
| | 1,110 |
| 24 | % | |
| Other | 305 |
| | 246 |
| | 59 |
| 24 | % | | 697 |
| | 305 |
| | 392 |
| 129 | % | |
| Total deposits | $ | 12,501 |
| | $ | 12,776 |
| | $ | (275 | ) | (2 | )% | | $ | 12,920 |
| | $ | 12,501 |
| | $ | 419 |
| 3 | % | |
| Performance Ratios | | | | | | | | | | | | | | |
| Return on average assets | 3.68 | % | | 2.55 | % | | | | | 2.51 | % | | 3.35 | % | | | | |
| Noninterest income to total revenue | 75 | % | | 75 | % | | | | | 76 | % | | 75 | % | | | | |
| Efficiency | 73 | % | | 75 | % | | | | | 80 | % | | 75 | % | | | | |
| Supplemental Noninterest Income Information | | | | | | | | | | | | | | |
| Asset management fees | $ | 222 |
| | $ | 215 |
| | $ | 7 |
| 3 | % | | $ | 212 |
| | $ | 222 |
| | $ | (10 | ) | (5 | )% | |
| Other Information | | | | | | | | | | | | | | |
| Nonperforming assets (a) (b) | $ | 52 |
| | $ | 51 |
| | $ | 1 |
| 2 | % | | $ | 48 |
| | $ | 52 |
| | $ | (4 | ) | (8 | )% | |
| Net charge-offs | $ | 6 |
| | $ | 1 |
| | $ | 5 |
| * |
| | $ | 1 |
| | $ | 6 |
| | $ | (5 | ) | (83 | )% | |
Client Assets Under Administration (in billions) (a) (c) | | | | | | | | | | | | | | |
| Discretionary client assets under management | $ | 148 |
| | $ | 141 |
| | $ | 7 |
| 5 | % | | $ | 158 |
| | $ | 148 |
| | $ | 10 |
| 7 | % | |
| Nondiscretionary client assets under administration | 129 |
| | 123 |
| | 6 |
| 5 | % | | 130 |
| | 129 |
| | 1 |
| 1 | % | |
| Total | $ | 277 |
| | $ | 264 |
| | $ | 13 |
| 5 | % | | $ | 288 |
| | $ | 277 |
| | $ | 11 |
| 4 | % | |
| Discretionary client assets under management | | | | | | | | | | | | | | |
| Personal | $ | 92 |
| | $ | 87 |
| | $ | 5 |
| 6 | % | | $ | 95 |
| | $ | 92 |
| | $ | 3 |
| 3 | % | |
| Institutional | 56 |
| | 54 |
| | 2 |
| 4 | % | | 63 |
| | 56 |
| | 7 |
| 13 | % | |
| Total | $ | 148 |
| | $ | 141 |
| | $ | 7 |
| 5 | % | | $ | 158 |
| | $ | 148 |
| | $ | 10 |
| 7 | % | |
* - Not meaningful
| |
| (b) | Includes nonperforming loans of $47 million and $45 million at both March 31, 20182019 and March 31, 2017, respectively.2018. |
| |
| (c) | Excludes brokerage account client assets. |
Asset Management Group earned $68 million in the first quarter of 2018 and $47 million in the first quarter of 2017. Earnings increased due to higher noninterest income and net interest income, as well as an increased benefit from the provision for credit losses. First quarter 2018 earnings also benefited from the lower statutory federal income tax rate.
18The PNC Financial Services Group, Inc. – Form 10-Q17
Higher net interest incomeAsset Management Group earned $45 million in the comparison wasfirst three months of 2019 compared to $62 million for the same period in 2018. Earnings decreased due to wider interest rate spreads ona decline in revenue and an increase in noninterest expense and the value of deposits, partially offsetprovision for credit losses.
Lower revenue was driven by declines in loan balances and narrower interest rate spreads on the value of loans. Higher noninterest income reflected growtha decline in asset management fees driven by stronger average equity markets.due to changes in the mix of assets under management.
Noninterest expense increased primarily attributable to higher personnel expenses.
Asset Management Group’s discretionary client assets under management increased in the comparison to the prior year, primarily attributable to higher equity markets as of March 31, 2018.2019 and the impact of net business activities.
The Asset Management Group strives to be the leading relationship-based provider of investment, planning, banking and fiduciary services to wealthy individuals and institutions by proactively delivering value-added ideas, and solutions and exceptional service.
Wealth Management and Hawthorn have nearly 100 offices operating in seven out of the ten most affluent states in the U.S., with a majority co-located with retail banking branches. The businesses provide customized investments, wealth planning, trust and estate administration and private banking solutions to affluent individuals and ultra-affluent families.
Institutional Asset Management provides advisory, custody and retirement administration services to institutional clients such as corporations, unions, municipalities, non-profits, foundations and endowments. The business also offers PNC proprietary mutual funds and investment strategies. Institutional Asset Management is strengthening its partnership with Corporate & Institutional Banking to drive growth and is focused on building retirement capabilities and expanding product solutions for all customers.
BlackRock
(Unaudited)
We hold an equity investment in BlackRock, a leading publicly-traded investment management firm. Information related to our equity investment in BlackRock follows:
Table 13: BlackRock Table
| | | (Unaudited) | | | |
| Three months ended March 31 | | | | | | |
| Dollars in millions | 2018 | | 2017 | | 2019 | 2018 | |
| Business segment earnings (a) |
| $197 |
| |
| $145 |
| | $ | 197 |
| $ | 197 |
| |
| PNC’s economic interest in BlackRock (b) | 22 | % | | 22 | % | | 22 | % | 22 | % | |
| |
| (a) | Includes our share of BlackRock’s reported GAAP earnings net of income taxes on those earnings incurred by us. |
| | | In billions | March 31
2018 |
| December 31
2017 |
| | March 31, 2019 |
| December 31, 2018 |
| |
| Carrying value of our investment in BlackRock (c) |
| $7.7 |
|
| $7.7 |
| | $ | 8.2 |
| $ | 8.2 |
| |
| Market value of our investment in BlackRock (d) |
| $18.8 |
|
| $17.9 |
| | $ | 14.9 |
| $ | 13.7 |
| |
| |
| (c) | We account for our investment in BlackRock under the equity method of accounting, exclusive of a related deferred tax liability of $1.6$1.7 billion at both March 31, 20182019 and December 31, 2017.2018. Our voting interest in BlackRock common stock was approximately 21%22% at March 31, 2018.2019. |
| |
| (d) | Does not include liquidity discount. |
Earnings for our BlackRock segment increased compared withIn addition, in the first three monthsquarter of 2017, and included the impact of the lower statutory federal income tax rate.
In addition2019 we transferred to BlackRock our investment in BlackRock reflected in Table 13, at March 31, 2018, we heldremaining 143,458 shares of BlackRock Series C Preferred Stock, valued at $62 million, which arewere available to fund our obligation in connection with certain BlackRock long-term incentive plan (LTIP) programs.
On January 31,Our 2018 we transferred 103,064 shares of Series C Preferred Stock to BlackRock to satisfy a portion of our LTIP obligation. The transfer reduced Other assets and Other liabilities on our Consolidated Balance Sheet by $42 million, representing the fair value of the shares transferred.
Our 2017 Form 10-K includes additional information about our investment in BlackRock.
The PNC Financial Services Group, Inc. – Form 10-Q19
RISK MANAGEMENT
The Risk Management section included in Item 7 of our 20172018 Form 10-K describes our enterprise risk management framework including risk culture, enterprise strategy, risk governance and framework, risk identification, risk assessment, risk controls and monitoring, and risk aggregation and reporting. Additionally, our 20172018 Form 10-K provides an analysis of our key areas of risk, which include but are not limited to credit, liquidity and capital, market, operational and compliance. Our use of financial derivatives as part of our overall asset and liability risk management process is also addressed within the Risk Management section.
The following information updates our 2017 Form 10-K risk management disclosures.
Credit Risk Management
See the Credit Risk Management portion of the Risk Management section in our 20172018 Form 10-K for additional discussion regarding credit risk.
18 The PNC Financial Services Group, Inc. – Form 10-Q
Loan Portfolio Characteristics and Analysis
Table 14: Details of Loans
In billions
We use several asset quality indicators, as further detailed in Note 3 Asset Quality, to monitor and measure our exposure to credit risk within our loan portfolio. The following provides additional information about our significant loan classes.
Commercial
Commercial loans comprised 51%53% and 50%52% of our total loan portfolio at March 31, 20182019 and December 31, 2017,2018, respectively. MostThe majority of our commercial loans are secured by collateral that provides a secondary source of repayment for the loan should the borrower experience cash generation difficulties. Examples of this collateral include short-term assets, such as accounts receivable, inventory and securities, and long-lived assets, such as equipment, real estate and other business assets.
We actively manage our commercial loans to assess any changes (both positive and negative) in the level of credit risk at both the borrower and portfolio level. To evaluate the level of credit risk, we assign an internal risk ratingratings reflecting our estimates of the borrower’s probability of default (PD) and loss given default (LGD). for each related credit facility. This two-dimensional credit risk rating methodology provides granularity in the risk monitoring process and is updated on an ongoing basis through our credit risk management processes. In addition to continual monitoring of the level of credit risk, we also monitor concentrations of credit risk pertaining to both specific industries and geography that may exist in our portfolio. Our portfolio remains stable and well-diversified as shown in the following table which provides a breakout of our commercial loans by industry classification (classified based on the North American Industry Classification System (NAICS)).
20 The PNC Financial Services Group, Inc. – Form 10-Q
Table 15: Commercial Loans by Industry
| | | | March 31, 2018 | | | December 31, 2017 | | March 31, 2019 | | | December 31, 2018 | |
| Dollars in millions | Amount | | % of Total | | | Amount | | % of Total | | Amount | | % of Total | | | Amount | | % of Total | |
| Commercial | | | | | | | | | | | | | | | | | | |
| Manufacturing | $ | 21,367 |
| | 19 | % | | | $ | 20,578 |
| | 19 | % | | $ | 22,575 |
| | 18 | % | | | $ | 21,207 |
| | 18 | % | |
| Retail/wholesale trade | 18,232 |
| | 16 |
| | | 17,846 |
| | 16 |
| | 21,655 |
| | 18 |
| | | 20,850 |
| | 18 |
| |
| Service providers | 14,554 |
| | 13 |
| | | 15,100 |
| | 14 |
| | 15,266 |
| | 12 |
| | | 14,869 |
| | 13 |
| |
| Real estate related (a) | 12,701 |
| | 11 |
| | | 12,496 |
| | 11 |
| | 12,287 |
| | 10 |
| | | 12,312 |
| | 11 |
| |
| Financial services | | 10,475 |
| | 9 |
| | | 9,500 |
| | 8 |
| |
| Health care | 9,937 |
| | 9 |
| | | 9,739 |
| | 9 |
| | 8,731 |
| | 7 |
| | | 8,886 |
| | 8 |
| |
| Financial services | 9,479 |
| | 8 |
| | | 8,532 |
| | 8 |
| | |
| Transportation and warehousing | 5,488 |
| | 5 |
| | | 5,609 |
| | 5 |
| | 6,744 |
| | 5 |
| | | 5,781 |
| | 5 |
| |
| Other industries | 20,550 |
| | 19 |
| | | 20,627 |
| | 18 |
| | 25,260 |
| | 21 |
| | | 23,429 |
| | 19 |
| |
| Total commercial loans | $ | 112,308 |
| | 100 | % | | | $ | 110,527 |
| | 100 | % | | $ | 122,993 |
| | 100 | % | | | $ | 116,834 |
| | 100 | % | |
(a) Includes loans to customers in the real estate and construction industries.
Commercial Real Estate
Commercial real estate loans comprised $15.0$6.3 billion of real estate project loans, $6.9 billion of intermediate term financing loans and $13.8$14.9 billion related to commercial mortgages as of March 31, 2018.2019. Comparable amounts were $15.3$6.6 billion, $7.1 billion and $13.7$14.4 billion, respectively, as of December 31, 2017. Our recent experience is that the competition for commercial real estate loans has become more aggressive in pricing and structure and is, at times, outside of our risk tolerance. As payoffs and maturities continue at a steady pace, the balance of our commercial real estate portfolio may decline.2018.
The PNC Financial Services Group, Inc. – Form 10-Q19
We monitor credit risk associated with our commercial real estate projects and commercial mortgagesloans similar to commercial loans by analyzing PD and LGD. Additionally, risks associated with these types of credit activities tend to be correlated to the loan structure, collateral location, project progress and business environment. These attributes are also monitored and utilized in assessing credit risk. The portfolio is geographically diverse due to the nature of our business involving clients throughout the U.S. The following table presents our commercial real estate loans by geographic market.market and property type.
Table 16: Commercial Real Estate Loans by Geography and Property Type
| | | | March 31, 2018 | | | December 31, 2017 | | March 31, 2019 | | | December 31, 2018 | |
| Dollars in millions | Amount | | % of Total | | | Amount | | % of Total | | Amount | | % of Total | | | Amount | | % of Total | |
| Geography | | | | | | | | | | | | | | | | | | |
| California | $ | 4,239 |
| | 15 | % | | | $ | 4,192 |
| | 14 | % | | $ | 4,131 |
| | 15 | % | | | $ | 4,154 |
| | 15 | % | |
| Florida | 2,263 |
| | 8 |
| | | 2,221 |
| | 8 |
| | 2,235 |
| | 8 |
| | | 2,157 |
| | 8 |
| |
| Maryland | 2,116 |
| | 7 |
| | | 2,104 |
| | 7 |
| | 1,922 |
| | 7 |
| | | 1,966 |
| | 7 |
| |
| Virginia | 1,667 |
| | 6 |
| | | 1,609 |
| | 5 |
| | 1,683 |
| | 6 |
| | | 1,682 |
| | 6 |
| |
| Texas | 1,592 |
| | 5 |
| | | 1,639 |
| | 6 |
| | 1,689 |
| | 6 |
| | | 1,531 |
| | 5 |
| |
| Illinois | | 1,211 |
| | 4 |
| | | 1,368 |
| | 5 |
| |
| Pennsylvania | 1,382 |
| | 5 |
| | | 1,394 |
| | 5 |
| | 1,068 |
| | 4 |
| | | 1,214 |
| | 4 |
| |
| Illinois | 1,333 |
| | 5 |
| | | 1,325 |
| | 5 |
| | |
| New York | 1,183 |
| | 4 |
| | | 1,163 |
| | 4 |
| | 1,065 |
| | 4 |
| | | 1,151 |
| | 4 |
| |
| Ohio | 1,149 |
| | 4 |
| | | 1,134 |
| | 4 |
| | 1,146 |
| | 4 |
| | | 1,053 |
| | 4 |
| |
| New Jersey | 972 |
| | 3 |
| | | 964 |
| | 3 |
| | |
| North Carolina | | 899 |
| | 3 |
| | | 915 |
| | 3 |
| |
| All other states | 10,939 |
| | 38 |
| | | 11,233 |
| | 39 |
| | 11,052 |
| | 39 |
| | | 10,949 |
| | 39 |
| |
| Total commercial real estate loans | $ | 28,835 |
| | 100 | % | | | $ | 28,978 |
| | 100 | % | | $ | 28,101 |
| | 100 | % | | | $ | 28,140 |
| | 100 | % | |
| Property Type | | | | | | | | | | |
| Multifamily | | $ | 8,588 |
| | 31 | % | | | $ | 8,770 |
| | 31 | % | |
| Office | | 7,398 |
| | 26 |
| | | 7,279 |
| | 26 |
| |
| Retail | | 3,980 |
| | 14 |
| | | 4,065 |
| | 14 |
| |
| Hotel/Motel | | 1,666 |
| | 6 |
| | | 1,686 |
| | 6 |
| |
| Industrial/Warehouse | | 1,803 |
| | 6 |
| | | 1,678 |
| | 6 |
| |
| Senior Housing | | 1,201 |
| | 4 |
| | | 1,092 |
| | 4 |
| |
| Mixed Use | | 964 |
| | 3 |
| | | 933 |
| | 3 |
| |
| Other | | 2,501 |
| | 10 |
| | | 2,637 |
| | 10 |
| |
| Total commercial real estate loans | | $ | 28,101 |
| | 100 | % | | | $ | 28,140 |
| | 100 | % | |
Home Equity
Home equity loans comprised $16.4$15.0 billion of primarily variable-rate home equity lines of credit and $11.3$10.5 billion of closed-end home equity installment loans at March 31, 2018.2019. Comparable amounts were $16.8$15.5 billion and $11.6$10.6 billion, respectively, as of December 31, 2017.2018.
We track borrower performance monthly, including obtaining original loan-to-value ratios (LTV), updated FICO scores at least quarterly, updated LTVs at least semi-annually, and other credit metrics at least quarterly, including the historical performance of any related mortgage loans regardless of lien position that we do or do not hold. This information is used for internal reporting and risk management. For internal reporting and risk management we also segment the population into pools based on product type (e.g., home equity loans, brokered home equity loans, home equity lines of credit, brokered home equity lines of credit). As part of our overall risk
The PNC Financial Services Group, Inc. – Form 10-Q21
analysis and monitoring, we also segment the portfolio based upon the loan delinquency, nonperforming status, modification and bankruptcy status, FICO scores, LTV, lien position and geographic concentration.
The portfolio is primarily originated within our primary geographic markets located in the Mid-Atlantic, Midwest, and Southeast, with onlyless than 5% of the portfolio in states outside of those markets at both March 31, 2018 and December 31, 2017.2019. The credit quality of newly originated loans over the last twelve months was strong overall as evidenced by a weighted-average LTV on originations of 67% and a weighted-average FICO score of 776.772.
The credit performance of the majority of the home equity portfolio where we hold the first lien position is superior to the portion of the portfolio where we hold the second lien position, but do not hold the first lien. Lien position information is generally based upon original LTV at the time of origination. We use an industry-leading third-party service provider to obtain updated loan, lien and collateral data that is aggregated from public and private sources.
The PNC Financial Services Group, Inc. – Form 10-Q20
The following table presents our home equity loans by geographic market and lien type.
Table 17: Home Equity Loans by Geography and by Lien Priority
| | | | March 31, 2018 | | | December 31, 2017 | | March 31, 2019 | | | December 31, 2018 | |
| Dollars in millions | Amount | | % of Total | | | Amount | | % of Total | | Amount | | % of Total | | | Amount | | % of Total | |
| Geography | | | | | | | | | | | | | | | | | | |
| Pennsylvania | $ | 6,602 |
| | 24 | % | | | $ | 6,792 |
| | 24 | % | | $ | 5,989 |
| | 23 | % | | | $ | 6,160 |
| | 24 | % | |
| New Jersey | 4,172 |
| | 15 |
| | | 4,252 |
| | 15 |
| | 3,837 |
| | 15 |
| | | 3,935 |
| | 15 |
| |
| Ohio | 3,316 |
| | 12 |
| | | 3,413 |
| | 12 |
| | 3,012 |
| | 12 |
| | | 3,095 |
| | 12 |
| |
| Illinois | 1,755 |
| | 6 |
| | | 1,801 |
| | 6 |
| | 1,587 |
| | 6 |
| | | 1,634 |
| | 6 |
| |
| Maryland | 1,544 |
| | 6 |
| | | 1,572 |
| | 6 |
| | 1,450 |
| | 6 |
| | | 1,481 |
| | 6 |
| |
| Michigan | 1,414 |
| | 5 |
| | | 1,442 |
| | 5 |
| | 1,311 |
| | 5 |
| | | 1,340 |
| | 5 |
| |
| Florida | 1,245 |
| | 5 |
| | | 1,255 |
| | 4 |
| | 1,216 |
| | 5 |
| | | 1,227 |
| | 5 |
| |
| North Carolina | 1,236 |
| | 4 |
| | | 1,266 |
| | 5 |
| | 1,126 |
| | 4 |
| | | 1,161 |
| | 4 |
| |
| Kentucky | 1,111 |
| | 4 |
| | | 1,138 |
| | 4 |
| | 1,012 |
| | 4 |
| | | 1,040 |
| | 4 |
| |
| Indiana | 895 |
| | 3 |
| | | 924 |
| | 3 |
| | 826 |
| | 3 |
| | | 845 |
| | 3 |
| |
| All other states | 4,409 |
| | 16 |
| | | 4,509 |
| | 16 |
| | 4,134 |
| | 17 |
| | | 4,205 |
| | 16 |
| |
| Total home equity loans | $ | 27,699 |
| | 100 | % | | | $ | 28,364 |
| | 100 | % | | $ | 25,500 |
| | 100 | % | | | $ | 26,123 |
| | 100 | % | |
| Lien type | | | | | | | | | | | | | | | | | | |
| 1st lien | | | 58 | % | | | | | 58 | % | | | | 58 | % | | | | | 58 | % | |
| 2nd lien | | | 42 |
| | | | | 42 |
| | | | 42 |
| | | | | 42 |
| |
| Total home equity loans | | | 100 | % | | | | | 100 | % | | |
| Total | | | | 100 | % | | | | | 100 | % | |
Residential Real Estate
Residential real estate loans primarily consisted of residential mortgage loans at both March 31, 20182019 and December 31, 2017.2018.
We track borrower performance of this portfolio monthly similar to home equity loans. This information is used for internal reporting and risk management. For internal reporting and risk management we also segment the mortgage portfolio into pools based on product type (e.g., Federal Housing Administration (FHA), conforming, etc.)nonconforming, conforming). As part of our overall risk analysis and monitoring, we also segment the portfolio based upon loan delinquency, nonperforming status, modification and bankruptcy status, FICO scores, LTV and geographic concentrations. Loan performance is evaluated by source originators and loan servicers.
The credit quality of newly originated loans that we retained on our balance sheet over the last twelve months was strong overall as evidenced by a weighted-average LTV on originations of 71% and a weighted-average FICO score of 769.
22 The PNC Financial Services Group, Inc. – Form 10-Q
The following table presents our residential real estate loans by geographic market.
Table 18: Residential Real Estate Loans by Geography
| | | | March 31, 2018 | | | December 31, 2017 | | March 31, 2019 | | | December 31, 2018 | |
| Dollars in millions | Amount | | % of Total | | | Amount | | % of Total | | Amount | | % of Total | | | Amount | | % of Total | |
| Geography | | | | | | | | | | | | | | | | | | |
| California | $ | 3,858 |
| | 22 | % | | | $ | 3,676 |
| | 21 | % | | $ | 4,975 |
| | 26 | % | | | $ | 4,666 |
| | 25 | % | |
| New Jersey | 1,538 |
| | 9 |
| | | 1,503 |
| | 9 |
| | 1,679 |
| | 9 |
| | | 1,649 |
| | 9 |
| |
| Florida | 1,533 |
| | 9 |
| | | 1,529 |
| | 9 |
| | 1,540 |
| | 8 |
| | | 1,544 |
| | 8 |
| |
| Illinois | 1,206 |
| | 7 |
| | | 1,230 |
| | 7 |
| | 1,145 |
| | 6 |
| | | 1,161 |
| | 6 |
| |
| Pennsylvania | 965 |
| | 5 |
| | | 962 |
| | 5 |
| | 1,039 |
| | 5 |
| | | 1,031 |
| | 6 |
| |
| New York | | 955 |
| | 5 |
| | | 956 |
| | 5 |
| |
| Maryland | 903 |
| | 5 |
| | | 902 |
| | 5 |
| | 906 |
| | 5 |
| | | 913 |
| | 5 |
| |
| New York | 862 |
| | 5 |
| | | 847 |
| | 5 |
| | |
| North Carolina | 831 |
| | 5 |
| | | 821 |
| | 5 |
| | 850 |
| | 4 |
| | | 854 |
| | 5 |
| |
| Virginia | 822 |
| | 5 |
| | | 824 |
| | 5 |
| | 834 |
| | 4 |
| | | 825 |
| | 4 |
| |
| Ohio | 678 |
| | 4 |
| | | 684 |
| | 4 |
| | 681 |
| | 4 |
| | | 682 |
| | 4 |
| |
| All other states | 4,260 |
| | 24 |
| | | 4,234 |
| | 25 |
| | 4,503 |
| | 24 |
| | | 4,376 |
| | 23 |
| |
| Total residential real estate loans | $ | 17,456 |
| | 100 | % | | | $ | 17,212 |
| | 100 | % | | $ | 19,107 |
| | 100 | % | | | $ | 18,657 |
| | 100 | % | |
We originate residential mortgage loans nationwide through our national mortgage business as well as within our branch network. Residential mortgage loans underwritten to government agency standards, including conforming loan amount limits, are typically sold
21 The PNC Financial Services Group, Inc. – Form 10-Q
with servicing retained by us. We also originate nonconforming residential mortgage loans that do not meet government agency standards, which we retain on our balance sheet. Growth in residential mortgage loans in the first quarter of 2018 was primarily due to nonconforming loans that exceeded agency conforming loan limits. Our portfolio of nonconforming residential mortgage loans totaled $10.9 billion at March 31, 2018, with 27% located in California. The nonconforming residential mortgage portfolio had strong credit quality at March 31, 20182019 with an average original LTV of 70% and an average original FICO score of 771.772. Our portfolio of nonconforming residential mortgage loans totaled $13.1 billion at March 31, 2019 with 32% located in California.
Automobile
Within auto loans, $11.8$13.2 billion resided in the indirect auto portfolio while $1.5 billion were in the direct auto portfolio as of March 31, 2018.2019. Comparable amounts as of December 31, 20172018 were $11.4$12.9 billion and $1.4$1.5 billion, respectively, and also included $.1 billion of securitized loans.respectively. The indirect auto portfolio relates to loan applications generated fromoriginated through franchised automobile dealers. This business is strategically aligned with our core retail banking business.
We continue to focus on borrowers with strong credit profiles as evidenced by a weighted-average loan origination FICO score over the last twelve months of 743742 for indirect auto loans and 766763 for direct auto loans. The weighted-average term of loan originations over the last twelve months was 7374 months for indirect auto loans and 62 months for direct auto loans. We offer both new and used automobile financing to customers through our various channels. At both March 31, 2019 and December 31, 2018, the portfolio was composed of 53% new vehicle loans and 47% used vehicle loans. Comparable amounts were 54% and 46% at December 31, 2017, respectively.
The auto loan portfolio's performance is measured monthly, including updated collateral values that are obtained monthly and updated FICO scores that are obtained at least quarterly. For internal reporting and risk management, we analyze the portfolio by product channel and product type and regularly evaluate default and delinquency experience. As part of our overall risk analysis and monitoring, we segment the portfolio by loan structure, collateral attributes and credit metrics which include FICO score, LTV and term.
Nonperforming Assets and Loan Delinquencies
Nonperforming Assets
Nonperforming assets include nonperforming loans and leases for which ultimate collectability of the full amount of contractual principal and interest is not probable and include nonperforming troubled debt restructurings (TDRs), other real estate owned (OREO), and foreclosed and other assets. Loans held for sale, certain government insured or guaranteed loans, purchased impaired loans and loans accounted for under the fair value option are excluded from nonperforming loans. Additional information regarding our nonperforming loans and nonaccrual policies is included in Note 1 Accounting Policies in the Notes To Consolidated Financial Statements in our 20172018 Form 10-K. A summary of the major categories of nonperforming assets are presented in Table 19. See Note 3 Asset Quality in the Notes To Consolidated Financial Statements in this Report for further detail of nonperforming asset categories.
The PNC Financial Services Group, Inc. – Form 10-Q23
Table 19: Nonperforming Assets by Type
| | | | March 31, 2018 |
| December 31, 2017 |
| | Change | March 31, 2019 |
| December 31, 2018 |
| | Change |
| Dollars in millions | $ | | % | $ | | % |
| Nonperforming loans | | | | | | | | | | |
| Commercial lending | $ | 537 |
| $ | 554 |
| | $ | (17 | ) | | (3 | )% | $ | 430 |
| $ | 432 |
| | $ | (2 | ) | | — |
|
| Consumer lending (a) | 1,305 |
| 1,311 |
| | (6 | ) | | — |
| 1,223 |
| 1,262 |
| | (39 | ) | | (3 | )% |
| Total nonperforming loans | 1,842 |
| 1,865 |
| | (23 | ) | | (1 | )% | 1,653 |
| 1,694 |
| | (41 | ) | | (2 | )% |
| OREO, foreclosed and other assets | 162 |
| 170 |
| | (8 | ) | | (5 | )% | |
| OREO and foreclosed assets | | 132 |
| 114 |
| | 18 |
| | 16 | % |
| Total nonperforming assets | $ | 2,004 |
| $ | 2,035 |
| | $ | (31 | ) | | (2 | )% | $ | 1,785 |
| $ | 1,808 |
| | $ | (23 | ) | | (1 | )% |
| Amount of TDRs included in nonperforming loans | $ | 939 |
| $ | 964 |
| | $ | (25 | ) | | (3 | )% | |
| TDRs included in nonperforming loans | | $ | 869 |
| $ | 863 |
| | $ | 6 |
| | 1 | % |
| Percentage of total nonperforming loans | 51 | % | 52 | % | | | | | 53 | % | 51 | % | | | | |
| Nonperforming loans to total loans | .83 | % | .85 | % | | | | | .71 | % | .75 | % | | | | |
| Nonperforming assets to total loans, OREO, foreclosed and other assets | .90 | % | .92 | % | | | | | |
| Nonperforming assets to total loans, OREO and foreclosed assets | | .77 | % | .80 | % | | | | |
| Nonperforming assets to total assets | .53 | % | .53 | % | | | | | .45 | % | .47 | % | | | | |
| Allowance for loan and lease losses to total nonperforming loans | 141 | % | 140 | % | | | | | 163 | % | 155 | % | | | | |
| |
| (a) | Excludes most consumer loans and lines of credit not secured by residential real estate, which are charged off after 120 to 180 days past due and are not placed on nonperforming status. |
The PNC Financial Services Group, Inc. – Form 10-Q22
Table 20: Change in Nonperforming Assets
| | | In millions | | 2018 |
| | 2017 |
| | | 2019 |
| | 2018 |
| |
| January 1 | | $ | 2,035 |
| | $ | 2,374 |
| | | $ | 1,808 |
| | $ | 2,035 |
| |
| New nonperforming assets | | 249 |
| | 330 |
| | | 287 |
| | 249 |
| |
| Charge-offs and valuation adjustments | | (137 | ) | | (150 | ) | | | (164 | ) | | (137 | ) | |
| Principal activity, including paydowns and payoffs | | (81 | ) | | (228 | ) | | | (92 | ) | | (81 | ) | |
| Asset sales and transfers to loans held for sale | | (29 | ) | | (42 | ) | | | (13 | ) | | (29 | ) | |
| Returned to performing status | | (33 | ) | | (72 | ) | | | (41 | ) | | (33 | ) | |
| March 31 | | $ | 2,004 |
| | $ | 2,212 |
| | | $ | 1,785 |
| | $ | 2,004 |
| |
As of March 31, 2018,2019, approximately 87% of total nonperforming loans were secured by collateral which lessened reserve requirements and is expected to reduce credit losses in the event of default. As of March 31, 2018,2019, commercial lending nonperforming loans were carried at approximately 67%72% of their unpaid principal balance, due to charge-offs recorded to date, before consideration of the Allowance for loan and lease losses (ALLL).
Within consumer lending nonperforming loans, residential real estate TDRs comprise 74%comprised 77% and 81% of total residential real estate nonperforming loans at March 31, 2018, down from 75% at2019 and December 31, 2017.2018, respectively. Home equity TDRs comprise 50%comprised 47% of home equity nonperforming loans at both March 31, 2018 at2019 and December 31, 2017.2018. TDRs generally remain in nonperforming status until a borrower has made at least six consecutive months of both principal and interest payments under the modified terms or ultimate resolution occurs. Loans where borrowers have been discharged from personal liability through Chapter 7 bankruptcy and have not formally reaffirmed their loan obligations to us and loans to borrowers not currently obligated to make both principal and interest payments under the restructured terms are not returned to accrual status.
At March 31, 2018,2019, our largest nonperforming asset was $41$35 million in the Wholesale TradeInformation industry and the ten largest individual nonperforming assets represented 12%11% of total nonperforming assets.
Loan Delinquencies
We regularly monitor the level of loan delinquencies and believe these levels may be a key indicator of loan portfolio asset quality. Measurement of delinquency status is based on the contractual terms of each loan. Loans that are 30 days or more past due in terms of payment are considered delinquent. Loan delinquencies exclude loans held for sale and purchased impaired loans, but include government insured or guaranteed loans and loans accounted for under the fair value option.
24 The PNC Financial Services Group, Inc. – Form 10-Q
Table 21: Accruing Loans Past Due (a)
| | | | | Amount | | | | Percentage of Total Loans Outstanding | | | Amount | | | | Percentage of Total Loans Outstanding | |
| | | March 31
2018 |
| | December 31
2017 |
| | Change | | March 31
2018 |
| | December 31
2017 |
| | | March 31
2019 |
| | December 31
2018 |
| | Change | | March 31
2019 |
| | December 31
2018 |
| |
| Dollars in millions | | $ |
| | % |
| | | | $ | | % | | |
| Early stage loan delinquencies | | | | | | | | | | | | | | | | | | | | | | | | | | |
| Accruing loans past due 30 to 59 days | | $ | 527 |
| | $ | 545 |
| | $ | (18 | ) | | (3 | )% | | .24 | % | | .25 | % | | | $ | 634 |
| | $ | 585 |
| | $ | 49 |
| | 8 | % | | .27 | % | | .26 | % | |
| Accruing loans past due 60 to 89 days | | 234 |
| | 238 |
| | (4 | ) | | (2 | )% | | .11 | % | | .11 | % | | | 212 |
| | 271 |
| | (59 | ) | | (22 | )% | | .09 | % | | .12 | % | |
| Total | | 761 |
| | 783 |
| | (22 | ) | | (3 | )% | | .34 | % | | .36 | % | | | 846 |
| | 856 |
| | (10 | ) | | (1 | )% | | .36 | % | | .38 | % | |
| Late stage loan delinquencies | | | | | | | | | | | | | | | | | | | | | | | | | | |
| Accruing loans past due 90 days or more | | 628 |
| | 737 |
| | (109 | ) | | (15 | )% | | .28 | % | | .33 | % | | | 590 |
| | 629 |
| | (39 | ) | | (6 | )% | | .25 | % | | .28 | % | |
| Total | | $ | 1,389 |
| | $ | 1,520 |
| | $ | (131 | ) | | (9 | )% | | .63 | % | | .69 | % | | | $ | 1,436 |
| | $ | 1,485 |
| | $ | (49 | ) | | (3 | )% | | .62 | % | | .66 | % | |
| |
| (a) | Past due loan amounts include government insured or guaranteed loans of $.8$.6 billion at March 31, 20182019 and $.9$.7 billion at December 31, 2017.2018. |
Accruing loans past due 90 days or more decreased at March 31, 2018 compared to December 31, 2017 primarily driven by a decline in government insured residential real estate loans. Accruing loans past due 90 days or more are not included in nonperforming loans and continue to accrue interest because they are well secured by collateral and are in the process of collection, or are managed in homogeneous portfolios with specified charge-off timeframes adhering to regulatory guidelines, or are certain government insured or guaranteed loans.
Loan Modifications and Troubled Debt Restructurings
Consumer and Loan Modifications
We modify loans under government and PNC-developed programs based upon our commitment to help eligible homeowners and borrowers avoid foreclosure, where appropriate. Initially, a borrower is evaluated for a modification under a government program. If a borrower does not qualify under a government program, the borrower is then evaluated under a PNC program. Our programs utilize both temporary and permanent modifications and typically reduce the interest rate, extend the term and/or defer principal. Loans that are either temporarily or permanently modified under programs involving a change to loan terms are generally classified as TDRs. Further, loans that have certain types of payment plans and trial payment arrangements which do not include a contractual change to loan terms may be classified as TDRs.
A temporary modification, with a term up to 24 months, involves a change in original loan terms for a period of time and reverts to a calculated exit rate for the remaining term of the loan as of a specific date. A permanent modification, with a term greater than 24 months, is a modification in which the terms of the original loan are changed. Permanent modification programs generally result in principal forgiveness, interest rate reduction, term extension, capitalization of past due amounts, interest-only period or deferral of principal.
We also monitor the success rates and delinquency status of our loan modification programs to assess their effectiveness in serving our borrowers’ and servicing customers’ needs while mitigating credit losses. Table 22 provides the number of accounts and unpaid principal balance of modified consumer real estate related loans as of each date presented.
Table 22: Consumer Real Estate Related Loan Modifications
|
| | | | | | | | | | | | | | | |
| | | March 31, 2018 | | December 31, 2017 | |
| Dollars in millions | | Number of Accounts |
| | Unpaid Principal Balance |
| | Number of Accounts |
| | Unpaid Principal Balance |
| |
| Temporary modifications | | 2,890 |
| | $ | 203 |
| | 3,033 |
| | $ | 217 |
| |
| Permanent modifications | | 22,989 |
| | 2,530 |
| | 23,270 |
| | 2,581 |
| |
| Total consumer real estate related loan modifications | | 25,879 |
| | $ | 2,733 |
| | 26,303 |
| | $ | 2,798 |
| |
Commercial Loan Modifications
Modifications of terms for commercial loans are based on individual facts and circumstances. Commercial loan modifications may involve reduction of the interest rate, extension of the loan term and/or forgiveness of principal. Modified commercial loans are usually already nonperforming prior to modification. We evaluate these modifications for TDR classification based upon whether we granted a concession to a borrower experiencing financial difficulties.
The PNC Financial Services Group, Inc. – Form 10-Q25
Troubled Debt Restructurings
A TDR is a loan whose terms have been restructured in a manner that grants a concession to a borrower experiencing financial difficulties. TDRs result from our loss mitigation activities and include rate reductions, principal forgiveness, postponement/reduction of scheduled amortization and extensions, which are intended to minimize economic loss and to avoid foreclosure or repossession of
The PNC Financial Services Group, Inc. – Form 10-Q23
collateral. Additionally, TDRs also result from court imposed concessions (e.g., a Chapter 7 bankruptcy where the debtor is discharged from personal liability to us and a court approved Chapter 13 bankruptcy repayment plan).
Table 23:22: Summary of Troubled Debt Restructurings (a)
| | | | | March 31
2018 |
| | December 31
2017 |
| | Change | | | March 31
2019 |
| | December 31
2018 |
| | Change | |
| Dollars in millions | | $ | | % | | | $ | | % | |
| Total commercial lending | | $ | 384 |
| | $ | 409 |
| | $ | (25 | ) | | (6 | )% | | | $ | 456 |
| | $ | 409 |
| | $ | 47 |
| | 11 | % | |
| Total consumer lending | | 1,608 |
| | 1,652 |
| | (44 | ) | | (3 | )% | | | 1,412 |
| | 1,442 |
| | (30 | ) | | (2 | )% | |
| Total TDRs | | $ | 1,992 |
| | $ | 2,061 |
| | $ | (69 | ) | | (3 | )% | | | $ | 1,868 |
| | $ | 1,851 |
| | $ | 17 |
| | 1 | % | |
| Nonperforming | | $ | 939 |
| | $ | 964 |
| | $ | (25 | ) | | (3 | )% | | | $ | 869 |
| | $ | 863 |
| | $ | 6 |
| | 1 | % | |
| Accruing (b) | | 1,053 |
| | 1,097 |
| | (44 | ) | | (4 | )% | | | 999 |
| | 988 |
| | 11 |
| | 1 | % | |
| Total TDRs | | $ | 1,992 |
| | $ | 2,061 |
| | $ | (69 | ) | | (3 | )% | | | $ | 1,868 |
| | $ | 1,851 |
| | $ | 17 |
| | 1 | % | |
| |
| (a) | Amounts in table represent recorded investment, which includes the unpaid principal balance plus net accounting adjustments, less any charge-offs. Recorded investment does not include any associated valuation allowance. |
| |
| (b) | Accruing loans include consumer credit card loans and loans that have demonstrated a period of at least six months of performance under the restructured terms and are excluded from nonperforming loans. |
Excluded from TDRs are $1.2$1.1 billion of consumer loans held for sale, loans accounted for under the fair value option and pooled purchased impaired loans, as well as certain government insured or guaranteed loans at both March 31, 20182019 and December 31, 2017.2018. Nonperforming TDRs represented approximately 51%53% and 52%51% of total nonperforming loans at March 31, 20182019 and December 31, 2017,2018, respectively, andwhile representing 47% of total TDRs at both March 31, 20182019 and December 31, 2017.2018. The remaining portion of TDRs represents TDRs that have been returned to accrual accountingstatus after performing under the restructured terms for at least six consecutive months.
See Note 3 Asset Quality in the Notes to Consolidated Financial Statements in this Report for additional information on TDRs. See the Credit Risk Management portion of the Risk Management section in our 2018 Form 10-K for information related to loan modifications.
Allowances for Loan and Lease Losses and Unfunded Loan Commitments and Letters of Credit
We maintain an ALLL to absorb losses from the loan and lease portfolio and determine this allowance based on quarterly assessments of the estimated probable credit losses incurred in the loan and lease portfolio. Our total ALLL of $2.6$2.7 billion at March 31, 20182019 consisted of $1.6$1.7 billion and $1.0 billion established for the commercial lending and consumer lending categories, respectively. We maintain the ALLL at a level that we believe to be appropriate to absorb estimated probable credit losses incurred in the loan and lease portfolio as of the balance sheet date. The reserve calculation and determination process is dependent on the use of key assumptions. Key reserve assumptions and estimation processes react to and are influenced by observed changes in loan and lease portfolio performance experience, the financial strength of the borrower and economic conditions. Key reserve assumptions and estimation processes are periodically updated.
AllowancesReserves are established for non-impaired commercial loan classes based primarily on PD and LGD.
Our commercial pool reserve methodology is sensitive to changes in key risk parameters such as PD and LGD. The results of these parameters are then applied to the loan balance and unfunded loan commitments and letters of credit to determine the amount of the respective reserves. The majority of the commercial portfolio is secured by collateral, including loans to asset-based lending customers, which generally demonstrate lower LGD compared to loans not secured by collateral. Our PDs and LGDs are primarily determined using internal commercial loan loss data. This internal data is supplemented with third-party data and management judgment, as deemed necessary. We continue to evaluate and enhance our use of internal commercial loss data and will periodically update our PDs and LGDs as well as consider third-party data, regulatory guidance and management judgment.
Allowances for non-impaired consumer loan classes are primarily based upon transition matrices, including using a roll-rate model. The roll-rate model uses statistical relationships, calculated from historical data that estimate the movement of loan outstandings through the various stages of delinquency and ultimately charge-off.
We establish specific allowances for loans considered impaired using methods prescribed by GAAP. All impaired loans are subject to individual analysis, except leases and large groups of smaller-balance homogeneous loans which may include, but are not limited to, credit card, residential real estate secured and consumer installment loans. Specific allowances for individual loans (including commercial and consumer TDRs) are determined based on an analysis of the present value of expected future cash flows from the loans discounted at their effective interest rate, observable market price or the fair value of the underlying collateral.
2624 The PNC Financial Services Group, Inc. – Form 10-Q
A portion of the ALLL is related to qualitative measurement factors. These factors may include, but are not limited to, the following:
Industry concentrations and conditions,
Changes in market conditions,
Recent credit quality trends,
Recent loss experience in particular portfolios, including specific and unique events,
Recent macro-economic factors,
Model imprecision,
Changes in lending policies and procedures,
Timing of available information, including the performance of first lien positions, and
Limitations of available historical data.
Our determination of the ALLL for non-impaired loans is sensitive to the risk grades assigned to commercial loans and loss rates for consumer loans. There are several other qualitative and quantitative factors considered in determining the ALLL. Periodically, reserve sensitivity analyses are performed. Such analyses provide insight into the impact of adverse changes to risk grades and loss rates. Given the current processes used, we believe the risk grades and loss rates currently assigned are appropriate.
Purchased impaired loans are initially recorded at fair value and applicable accounting guidance prohibits the carryover or creation of valuation allowances at acquisition. Because the initial fair values of these loans already reflect a credit component, additional reserves are established when performance is expected to be worse than our expectations as of the acquisition date. At March 31, 2018,2019, we had established reserves of $.3 billion for purchased impaired loans. In addition, loans (purchased impaired and non-impaired) acquired after January 1, 2009 were recorded at fair value. No allowance for loan losses was carried over and no allowance was created at the date of acquisition.
In determining the appropriateness of the ALLL, we make specific allocations to impaired loans and allocations to portfolios of commercial and consumer loans. We also allocate reserves to provide coverage for probable losses incurred in the portfolio at the balance sheet date based upon current market conditions, which may not be reflected in historical loss data. Commercial lending is the largest category of credits and is sensitive to changes in assumptions and judgments underlying the determination of the ALLL.
In addition to the ALLL, we maintain an allowance for unfunded loan commitments and letters of credit. We report this allowance as a liability on our Consolidated Balance Sheet. We maintain the allowance for unfunded loan commitments and letters of credit at a level we believe is appropriate to absorb estimated probable losses on these unfunded credit facilities. We determine this amount using estimates of the probability of the ultimate funding and losses related to those credit exposures. Other than the estimation of the probability of funding, this methodology is very similar to the one we use for determining our ALLL.
See Note 1 Accounting Policies in our 20172018 Form 10-K and Note 3 Asset Quality in the Notes To Consolidated Financial Statements in this Report for further information on certain key asset quality indicators that we use to evaluate our portfolios and establish the allowances.
Table 24:23: Allowance for Loan and Lease Losses
|
| | | | | | | | | |
| Dollars in millions | | 2018 | | 2017 | |
| January 1 | | $ | 2,611 |
| | $ | 2,589 |
| |
| Total net charge-offs | | (113 | ) | | (118 | ) | |
| Provision for credit losses | | 92 |
| | 88 |
| |
| Net decrease / (increase) in allowance for unfunded loan commitments and letters of credit | | 7 |
| | (4 | ) | |
| Other | | 7 |
| | 6 |
| |
| March 31 | | $ | 2,604 |
| | $ | 2,561 |
| |
| Net charge-offs to average loans (for the three months ended) (annualized) | | .21 | % | | .23 | % | |
| Total allowance for loan and lease losses to total loans | | 1.18 | % | | 1.20 | % | |
| Commercial lending net charge-offs | | $ | (10 | ) | | $ | (23 | ) | |
| Consumer lending net charge-offs | | (103 | ) | | (95 | ) | |
| Total net charge-offs | | $ | (113 | ) | | $ | (118 | ) | |
| Net charge-offs to average loans (for the three months ended) (annualized) | | | | | |
| Commercial lending | | .03 | % | | .07 | % | |
| Consumer lending | | .57 | % | | .53 | % | |
At March 31, 2018, total ALLL to total nonperforming loans was 141%. The comparable amount for December 31, 2017 was 140%. These ratios are 101% and 102% when excluding the $.7 billion of ALLL at both March 31, 2018 and December 31, 2017 allocated to consumer loans and lines of credit not secured by residential real estate and purchased impaired loans. We have excluded these amounts from ALLL in these ratios as these asset classes are not included in nonperforming loans. See Table 19 within this Credit Risk Management section for additional information. |
| | | | | | | | | |
| Dollars in millions | | 2019 | | 2018 | |
| January 1 | | $ | 2,629 |
| | $ | 2,611 |
| |
| Total net charge-offs | | (136 | ) | | (113 | ) | |
| Provision for credit losses | | 189 |
| | 92 |
| |
| Net decrease / (increase) in allowance for unfunded loan commitments and letters of credit | | 6 |
| | 7 |
| |
| Other | | 4 |
| | 7 |
| |
| March 31 | | $ | 2,692 |
| | $ | 2,604 |
| |
| Net charge-offs to average loans (for the three months ended) (annualized) | | .24 | % | | .21 | % | |
| Ratio of ALLL to total loans | | 1.16 | % | | 1.18 | % | |
| Commercial lending net charge-offs | | $ | (12 | ) | | $ | (10 | ) | |
| Consumer lending net charge-offs | | (124 | ) | | (103 | ) | |
| Total net charge-offs | | $ | (136 | ) | | $ | (113 | ) | |
| Net charge-offs to average loans (for the three months ended) (annualized) | | | | | |
| Commercial lending | | .03 | % | | .03 | % | |
| Consumer lending | | .68 | % | | .57 | % | |
The ALLL balance increases or decreases across periods in relation to fluctuating risk factors, including asset quality trends, net charge-offs and changes in aggregate portfolio balances. During the first three months of 2018,2019, overall credit quality remained stable,strong, which resulted in an essentially flat ALLL balance as of March 31, 20182019 compared to December 31, 2017.2018.
The PNC Financial Services Group, Inc. – Form 10-Q 2725
The following table summarizes our loan charge-offs and recoveries.
Table 25:24: Loan Charge-Offs and Recoveries
| | | Three months ended March 31 | | Gross Charge-offs |
| | Recoveries |
| | Net Charge-offs / (Recoveries) |
| | Percent of Average Loans (Annualized) |
| | | Gross Charge-offs |
| | Recoveries |
| | Net Charge-offs / (Recoveries) |
| | Percent of Average Loans (Annualized) |
| |
| Dollars in millions |
| 2019 | | | | | | | | | | |
| Commercial | | | $ | 25 |
| | $ | 14 |
| | $ | 11 |
| | .04 | % | |
| Commercial real estate | | | 3 |
| | 3 |
| |
|
| | | |
| Equipment lease financing | | | 3 |
| | 2 |
| | 1 |
| | .06 | % | |
| Home equity | | | 23 |
| | 18 |
| | 5 |
| | .08 | % | |
| Residential real estate | | | 2 |
| | 3 |
| | (1 | ) | | (.02 | )% | |
| Automobile | | | 58 |
| | 26 |
| | 32 |
| | .89 | % | |
| Credit card | | | 67 |
| | 7 |
| | 60 |
| | 3.91 | % | |
| Education | | | 6 |
| | 2 |
| | 4 |
| | .43 | % | |
| Other consumer | | | 28 |
| | 4 |
| | 24 |
| | 2.13 | % | |
| Total | | | $ | 215 |
| | $ | 79 |
| | $ | 136 |
| | .24 | % | |
| 2018 | | | | | | | | | | | | | | | | | | |
| Commercial | | $ | 28 |
| | $ | 16 |
| | $ | 12 |
| | .04 | % | | | $ | 28 |
| | $ | 16 |
| | $ | 12 |
| | .04 | % | |
| Commercial real estate | | 6 |
| | 6 |
| |
|
| | | | | 6 |
| | 6 |
| |
|
| |
|
| |
| Equipment lease financing | | 2 |
| | 4 |
| | (2 | ) | | (.10 | )% | | | 2 |
| | 4 |
| | (2 | ) | | (.10 | )% | |
| Home equity | | 28 |
| | 21 |
| | 7 |
| | .10 | % | | | 28 |
| | 21 |
| | 7 |
| | .10 | % | |
| Residential real estate | | 2 |
| | 4 |
| | (2 | ) | | (.05 | )% | | | 2 |
| | 4 |
| | (2 | ) | | (.05 | )% | |
| Automobile | | | 38 |
| | 17 |
| | 21 |
| | .65 | % | |
| Credit card | | 56 |
| | 6 |
| | 50 |
| | 3.60 | % | | | 56 |
| | 6 |
| | 50 |
| | 3.60 | % | |
| Education | | | 9 |
| | 2 |
| | 7 |
| | .64 | % | |
| Other consumer | | | | | |
|
| | | | | 24 |
| | 4 |
| | 20 |
| | 1.85 | % | |
| Automobile | | 38 |
| | 17 |
| | 21 |
| | .65 | % | | |
| Education | | 9 |
| | 2 |
| | 7 |
| | .64 | % | | |
| Other | | 24 |
| | 4 |
| | 20 |
| | 1.85 | % | | |
| Total | | $ | 193 |
| | $ | 80 |
| | $ | 113 |
| | .21 | % | | | $ | 193 |
| | $ | 80 |
| | $ | 113 |
| | .21 | % | |
| 2017 | | | | | | | | | | |
| Commercial | | $ | 53 |
| | $ | 24 |
| | $ | 29 |
| | .11 | % | | |
| Commercial real estate | | 1 |
| | 7 |
| | (6 | ) | | (.08 | )% | | |
| Equipment lease financing | | 1 |
| | 1 |
| |
|
| | | | |
| Home equity | | 34 |
| | 20 |
| | 14 |
| | .19 | % | | |
| Residential real estate | | 4 |
| | 4 |
| |
|
| | | | |
| Credit card | | 46 |
| | 5 |
| | 41 |
| | 3.24 | % | | |
| Other consumer | | | | | |
|
| | | | |
| Automobile | | 30 |
| | 13 |
| | 17 |
| | .56 | % | | |
| Education | | 7 |
| | 2 |
| | 5 |
| | .40 | % | | |
| Other | | 22 |
| | 4 |
| | 18 |
| | 1.64 | % | | |
| Total | | $ | 198 |
| | $ | 80 |
| | $ | 118 |
| | .23 | % | | |
See Note 1 Accounting Policies in our 20172018 Form 10-K and Note 4 Allowance for Loan and Lease Losses in the Notes To Consolidated Financial Statements in this Report for additional information on the ALLL.
Liquidity and Capital Management
Liquidity risk, including our liquidity monitoring measures and tools, is described in further detail in the Liquidity and Capital Management section of our 20172018 Form 10-K.
One of the ways we monitor our liquidity is by reference to the Liquidity Coverage Ratio (LCR),LCR, a regulatory minimum liquidity requirement designed to ensure that covered banking organizations maintain an adequate level of liquidity to meet net liquidity needs over the course of a hypothetical 30-day stress scenario. The LCR is calculated by dividing the amount of an institution’s high quality, unencumbered liquid assets (HQLA), as defined and calculated in accordance with the LCR rules, by its estimated net cash outflows, with net cash outflows determined by applying the assumed outflow factors in the LCR rules. The resulting quotient is expressed as a percentage. The minimum LCR that PNC and PNC Bank are required to maintain is 100% in 2018.. PNC and PNC Bank calculate the LCR daily, and as of March 31, 2018,2019, the LCR for PNC and PNC Bank exceeded the requirement of 100%.
We provide additional information regarding regulatory liquidity requirements and their potential impact on us in the Supervision and Regulation section of Item 1 Business and Item 1A Risk Factors of our 20172018 Form 10-K.
28 The PNC Financial Services Group, Inc. – Form 10-Q
Sources of Liquidity
Our largest source of liquidity on a consolidated basis is the customer deposit base generated by our banking businesses. These deposits provide relatively stable and low-cost funding. Total deposits decreasedincreased to $264.7$271.2 billion at March 31, 20182019 from $265.1$267.8 billion at December 31, 2017,2018 driven by decreasesgrowth in noninterest-bearinginterest-bearing deposits partially offset by growtha decrease in interest-bearingnoninterest-bearing deposits. See the Funding Sources portion of the Consolidated Balance Sheet Review section of this Financial Review for additional information related to our deposits. Additionally, certain assets determined by us to be liquid andas well as unused borrowing capacity from a number of sources are also available to manage our liquidity position.
At March 31, 2018,2019, our liquid assets consisted of short-term investments (Federal(federal funds sold, resale agreements, trading securities and interest-earning deposits with banks) totaling $32.7$21.3 billion and securities available for sale totaling $56.0$65.1 billion. The level of liquid assets fluctuates over time based on many factors, including market conditions, loan and deposit growth and balance sheet
26 The PNC Financial Services Group, Inc. – Form 10-Q
management activities. Our liquid assets included $3.3$1.6 billion of securities available for sale and trading securities pledged as collateral to secure public and trust deposits, repurchase agreements and for other purposes. In addition, $5.0$4.4 billion of securities held to maturity were also pledged as collateral for these purposes.
We also obtain liquidity through various forms of funding, including long-term debt (senior notes, subordinated debt and FHLB borrowings) and short-term borrowings (securities sold under repurchase agreements, commercial paper and other short-term borrowings). See Note 10 Borrowed Funds in our 20172018 Form 10-K and the Funding Sources section of the Consolidated Balance Sheet Review for additional information related to our borrowings.
Total senior and subordinated debt, on a consolidated basis, increased due to the following activity:
Table 26:25: Senior and Subordinated Debt
| | | In billions | 2018 |
| | 2019 |
| |
| January 1 | $ | 33.3 |
| | $ | 30.9 |
| |
| Issuances | 2.0 |
| | 2.1 |
| |
| Calls and maturities | (1.0 | ) | | (1.8 | ) | |
| Other | (0.4 | ) | | .4 |
| |
| March 31 | $ | 33.9 |
| | $ | 31.6 |
| |
Bank Liquidity
Under PNC Bank’s 2014 bank note program, as amended, PNC Bank may from time to time offer up to $40.0 billion aggregate principal amount outstanding at any one time of its unsecured senior and subordinated notes with maturity dates more than nine months (in the case of senior notes) and five years or more (in the case of subordinated notes) from their date of issue. At March 31, 2018,2019, PNC Bank had $27.7$23.8 billion of notes outstanding under this program of which $24.1$19.6 billion were senior bank notes and $3.6$4.2 billion were subordinated bank notes. The following table details issuances for the three months ended March 31, 2018.
2019.
Table 27:26: PNC Bank Notes Issued During First Quarter 2018
|
| | |
| Issuance Date | Amount | Description of Issuance |
January 22, 2018March 12, 2019 | $900 million | Senior notes with a maturity date of January 22, 2021. Interest is payable semi-annually at a fixed rate of 2.500% per annum on January 22 and July 22 of each year, beginning July 22, 2018. |
January 22, 2018 | $700 million | Senior notes with a maturity date of January 22, 2028. Interest is payable semi-annually at a fixed rate of 3.250% per annum on January 22 and July 22 of each year, beginning July 22, 2018. |
January 22, 2018 | $400 million1.1 billion | Floating rate senior notes with a maturity date of January 22,March 12, 2021. Interest is payable at the 3-month LIBOR rate, reset quarterly, plus a spread of .25%.35% on January 22, April 22, July 22March 12, June 12, September 12 and October 22December 12 of each year, beginning on April 22, 2018.June 12, 2019. |
PNC Bank maintains additional secured borrowing capacity with the FHLB-Pittsburgh and through the Federal Reserve Bank discount window. The Federal Reserve Bank, however, is not viewed as a primary means of funding our routine business activities, but rather as a potential source of liquidity in a stressed environment or during a market disruption. At March 31, 2018,2019, our unused secured borrowing capacity at the FHLB-Pittsburgh and the Federal Reserve Bank totaled $44.6$42.1 billion.
PNC Bank has the ability to offer up to $10.0 billion of its commercial paper to provide additional liquidity. As of March 31, 2018,2019, there were no issuances outstanding under this program.
The PNC Financial Services Group, Inc. – Form 10-Q29
Parent Company Liquidity
In addition to managing liquidity risk at the bank level, we monitor the parent company’s liquidity. The parent company’s contractual obligations consist primarily of debt service related to parent company borrowings and funding non-bank affiliates. Additionally, the parent company maintains adequate liquidity to fund discretionary activities such as paying dividends to our shareholders, share repurchases and acquisitions.
As of March 31, 2018,2019, available parent company liquidity totaled $5.9$5.2 billion. Parent company liquidity is primarily held in intercompany short-term investments, the terms of which provide for the availability of cash in 31 days or less. Investments with longer durations may also be acquired, but if so, the related maturities are aligned with scheduled cash needs, such as the maturity of parent company debt obligations.
The principal source of parent company liquidity is the dividends it receives from PNC Bank, which may be impacted by the following:
Bank-level capital needs,
Laws and regulations,
Corporate policies,
Contractual restrictions, and
Other factors.
27 The PNC Financial Services Group, Inc. – Form 10-Q
There are statutory and regulatory limitations on the ability of a national bank to pay dividends or make other capital distributions or to extend credit to the parent company or its non-bank subsidiaries. The amount available for dividend payments by PNC Bank to the parent company without prior regulatory approval was approximately $1.4$2.7 billion at March 31, 2018.2019. See Note 18 Regulatory Matters in the Notes To Consolidated Financial Statements in our 20172018 Form 10-K for a further discussion of these limitations.
In addition to dividends from PNC Bank, other sources of parent company liquidity include cash and investments, as well as dividends and loan repayments from other subsidiaries and dividends or distributions from equity investments. We can also generate liquidity for the parent company and PNC’s non-bank subsidiaries through the issuance of debt and equity securities, including certain capital instruments, in public or private markets and commercial paper. The parent company has the ability to offer up to $5.0 billion of commercial paper to provide additional liquidity. As of March 31, 2018,2019, there were no commercial paper issuances outstanding.
The parent company has an effective shelf registration statement pursuant to which we can issue additional debt, equity and other capital instruments. Under this shelf registration statement, on January 23, 2019, the parent company issued $750 million in senior notes with a maturity date of January 23, 2024. Interest is payable semi-annually at a fixed rate of 3.50% per annum, on January 23 and July 23 of each year, beginning July 23, 2019. On February 15, 2019 the parent company issued an additional $300 million of these notes bringing the outstanding principal amount of the series to $1.05 billion.
Parent company senior and subordinated debt outstanding totaled $6.8$7.8 billion and $6.7 billion at both March 31, 20182019 and December 31, 2017.2018, respectively.
Contractual Obligations and Commitments
We have contractual obligations representing required future payments on borrowed funds, time deposits, leases, pension and postretirement benefits and purchase obligations. See the Liquidity and Capital Management portion of the Risk Management section in our 20172018 Form 10-K for more information on these future cash outflows. Additionally, in the normal course of business we have various commitments outstanding, certain of which are not included on our Consolidated Balance Sheet. We provide information on our commitments in Note 13 Commitments in the Notes To Consolidated Financial Statements of this Report.
30 The PNC Financial Services Group, Inc. – Form 10-Q
Credit Ratings
PNC’s credit ratings affect the cost and availability of short and long-term funding, collateral requirements for certain derivative instruments and the ability to offer certain products.
In general, rating agencies base their ratings on many quantitative and qualitative factors, including capital adequacy, liquidity, asset quality, business mix, level and quality of earnings, and the current legislative and regulatory environment, including implied government support. In addition, rating agencies themselves have been subject to scrutiny arising from the most recent financial crisis and could make or be required to make substantial changes to their ratings policies and practices, particularly in response to legislative and regulatory changes. Potential changes in the legislative and regulatory environment and the timing of those changes could impact our ratings, which as noted above, could impact our liquidity and financial condition. A decrease, or potential decrease, in credit ratings could impact access to the capital markets and/or increase the cost of debt, and thereby adversely affect liquidity and financial condition.
Table 28:27: Credit Ratings as of March 31, 2018 for PNC and PNC Bank
|
| | | |
| March 31, 2019 |
| Moody’s | Standard & Poor’s | Fitch |
| PNC | | | |
| Senior debt | A3 | A- | A+ |
| Subordinated debt | A3 | BBB+ | A |
| Preferred stock | Baa2 | BBB- | BBB- |
| PNC Bank | | | |
| Senior debt | A2 | A | A+ |
| Subordinated debt | A3 | A- | A |
| Long-term deposits | Aa2 | A | AA- |
| Short-term deposits | P-1 | A-1 | F1+ |
| Short-term notes | P-1 | A-1 | F1 |
Capital Management
Detailed information on our capital management processes and activities, including additional information on our previous CCAR submissions and capital plans, is included in the Capital Management portion of the Risk Management section in our 20172018 Form 10-K.
We manage our funding and capital positions by making adjustments to our balance sheet size and composition, issuing or redeeming debt, issuing equity or other capital instruments, executing treasury stock transactions and capital redemptions or repurchases, and managing dividend policies and retaining earnings.
28 The PNC Financial Services Group, Inc. – Form 10-Q
In connection with the capital plan accepted by the Federal Reserve as part of our 20172018 CCAR submission, we repurchased 4.85.9 million common shares for $.7 billion$725 million in the first quarter of 2018 as part2019. As of our common stock repurchase programs for the four quarter period ending June 30, 2018.March 31, 2019, PNC has repurchased a total of 12.715.3 million shares for $1.8$2.0 billion under current share repurchase programs as of March 31, 2018.that will end June 30, 2019.
We paid dividends on common stock of $.4 billion,$438 million, or 75 cents$.95 per common share, during the first quarter of 2018.2019. On April 4, 2018,2019, the PNC Board of Directors declared a quarterly common stock cash dividend of 75 cents$.95 per share with a payment date of May 5, 2018.2019.
The PNC Financial Services Group, Inc. – Form 10-Q31
Table 29:28: Basel III Capital
| | | Dollars in millions | Basel III March 31, 2018 (a) (b) | | | Fully Phased-In Basel III (Non-GAAP) December 31, 2017 (c) | | | 2017 Transitional Basel III December 31, 2017 (a) | | Basel III March 31, 2019 | |
| Common equity Tier 1 capital | | | | | | | | | | |
| Common stock plus related surplus, net of treasury stock | $ | 7,416 |
| | | $ | 8,195 |
| | | $ | 8,195 |
| | $ | 4,810 |
| |
| Retained earnings | 36,265 |
| | | 35,481 |
| | | 35,481 |
| | 39,742 |
| |
Accumulated other comprehensive income for securities currently and those transferred from available for sale | (151 | ) | | | 337 |
| | | 270 |
| | |
Accumulated other comprehensive income for pension and other postretirement plans | (494 | ) | | | (544 | ) | | | (436 | ) | | |
| Accumulated other comprehensive income (loss) for securities currently, and those transferred from, available for sale | | 419 |
| |
| Accumulated other comprehensive income (loss) for pension and other postretirement plans | | (418 | ) | |
| Goodwill, net of associated deferred tax liabilities | (9,028 | ) | | | (8,988 | ) | | | (8,988 | ) | | (9,021 | ) | |
| Other disallowed intangibles, net of deferred tax liabilities | (315 | ) | | | (319 | ) | | | (255 | ) | | (239 | ) | |
| Other adjustments/(deductions) | (121 | ) | | | (141 | ) | | | (138 | ) | | (163 | ) | |
Total common equity Tier 1 capital before threshold deductions | 33,572 |
| | | 34,021 |
| | | 34,129 |
| | 35,130 |
| |
Total threshold deductions (d) | (3,272 | ) | | | (2,928 | ) | | | (1,983 | ) | | (3,074 | ) | |
| Common equity Tier 1 capital | 30,300 |
| | | 31,093 |
| | | 32,146 |
| | $ | 32,056 |
| |
| Additional Tier 1 capital | | | | | | | | | | |
| Preferred stock plus related surplus | 3,986 |
| | | 3,985 |
| | | 3,985 |
| | 3,990 |
| |
| Other adjustments/(deductions) | (148 | ) | | | (146 | ) | | | (124 | ) | | (157 | ) | |
| Tier 1 capital | 34,138 |
| | | 34,932 |
| | | 36,007 |
| | $ | 35,889 |
| |
| Additional Tier 2 capital | | | | | | | | | | |
| Qualifying subordinated debt | 3,324 |
| | | 3,433 |
| | | 3,482 |
| | 3,731 |
| |
| Trust preferred capital securities | 80 |
| | | | | | 100 |
| | 60 |
| |
| Eligible credit reserves includable in Tier 2 capital | 2,893 |
| | | 2,907 |
| | | 2,907 |
| | 2,971 |
| |
| Total Basel III capital | $ | 40,435 |
| | | $ | 41,272 |
| | | $ | 42,496 |
| | $ | 42,651 |
| |
| Risk-weighted assets | | | | | | | | | | |
Basel III standardized approach risk-weighted assets (e)(a) | $ | 314,922 |
| | | $ | 316,120 |
| | | $ | 309,460 |
| | $ | 328,128 |
| |
Basel III advanced approaches risk-weighted assets (f)(b) | $ | 280,385 |
| | | $ | 285,226 |
| | | N/A |
| | $ | 298,889 |
| |
| Average quarterly adjusted total assets | $ | 364,242 |
| | | $ | 363,967 |
| | | $ | 364,999 |
| | $ | 373,374 |
| |
Supplementary leverage exposure (g)(c) | $ | 433,233 |
| | | $ | 434,698 |
| | | $ | 435,731 |
| | $ | 448,129 |
| |
Basel III risk-based capital and leverage ratios | | | | | | | | | | |
Common equity Tier 1 (i) | 9.6 | % | | | 9.8 | % | | (h) | | | 10.4 | % | | 9.8 | % | |
Tier 1 (j) | 10.8 | % | | | 11.1 | % | | (h) | | | 11.6 | % | | 10.9 | % | |
| Total (k) (l) (m) | 12.8 | % | | | 13.1 | % | | (h) | | | 13.7 | % | | |
| Total (e) | | 13.0 | % | |
Leverage (n)(f) | 9.4 | % | | | 9.6 | % | | | 9.9 | % | | 9.6 | % | |
Supplementary leverage ratio (o)(g) | 7.9 | % | | | 8.0 | % | | | 8.3 | % | | 8.0 | % | |
| |
| (a) | All ratios are calculated using the regulatory capital methodology applicable to PNC during each period presented and calculated based on the standardized approach. |
| |
(b) | The Basel III Common equity Tier 1 capital, Tier 1 risk-based capital, Leverage and Supplementary ratios as of March 31, 2018 reflect the full phase-in of all Basel III adjustments to these metrics applicable to PNC. |
| |
(c) | 2017 Fully Phased-In Basel III results are presented as Pro forma estimates. |
| |
(d) | Under the Basel III rules, certain items such as significant common stock investments in unconsolidated financial institutions (primarily BlackRock), mortgage servicing rights and deferred tax assets must be deducted from capital (subject to a phase-in schedule that ended December 31, 2017 and net of associated deferred tax liabilities) to the extent they individually exceed 10%, or in the aggregate exceed 15%, of PNC's adjusted common equity Tier 1 capital. |
| |
(e) | Includes credit and market risk-weighted assets. |
| |
(f)(b) | Basel III advanced approaches risk-weighted assets are calculated based on the Basel III advanced approaches rules, and include credit, market, and operational risk-weighted assets. During the parallel run qualification phase, PNC has refined the data, models, and internal processes used as part of the advanced approaches for determining risk-weighted assets. We anticipate additional refinements to this calculation through the parallel run qualification phase. |
| |
(g)(c) | Supplementary leverage exposure is the sum of Adjusted average assets and certain off-balance sheet exposures including undrawn credit commitments and derivative potential future exposures. |
| |
(h) | Pro forma fully phased-in Basel III capital ratios based on Basel III standardized approach risk-weighted assets and rules. |
| |
(i)(d) | For comparative purposes only, the advanced approaches Basel III Common equity Tier 1, capital ratioTier 1 risk-based and Total risk-based ratios for March 31, 2018 is 10.8%2019 were 10.7%, 12.0% and for December 31, 2017 is 10.9% (estimated). This capital ratio is calculated using Common equity Tier 1 capital and dividing by Basel III advanced approaches risk-weighted assets.13.3%, respectively. |
| |
(j)(e) | For comparative purposes only, the advanced approachesThe 2019 Basel III Tier 1 risk-based capital ratio for March 31, 2018 is 12.2% and for December 31, 2017 is 12.2% (estimated). This capital ratio is calculated using Tier 1 capital and dividing by Basel III advanced approaches risk-weighted assets. |
| |
(k) | For comparative purposes only, the advanced approaches Basel III Total capital risk-based capital ratio for March 31, 2018 is 13.5% and for December 31, 2017 is 13.5% (estimated). This ratio is calculated using Total Basel III capital, which under the advanced approaches, Additional Tier 2 capital includes allowance for loan and lease losses in excess of Basel expected credit losses, if any, up to 0.6% of credit risk-weighted assets, and dividing by Basel III advanced approaches risk-weighted assets. |
| |
(l) | The Basel III total risk-based capital ratio includes $80 million of nonqualifying trust preferred capital securities of $60 million that are subject to a phase-out period that runs through 2022. |
| |
(m) | 2021. For comparative purposes only, as of March 31, 20182019 the ratio is 12.8%was 13.0%, assuming nonqualifying trust preferred capital securities are phased out. |
| |
(n)(f) | Leverage ratio is calculated based on Tier 1 capital divided by Average quarterly adjusted total assets. |
| |
(o)(g) | Supplementary leverage ratio is calculated based on Tier 1 capital divided by Supplementary leverage exposure. As advanced approaches banking organizations, PNC and PNC Bank became subject to a 3% minimum supplementary leverage ratio effective January 1, 2018. |
32 The PNC Financial Services Group, Inc. – Form 10-Q
The decline in our Basel III Common equity Tier 1 capital ratio at March 31, 2018 compared to December 31, 2017 was driven by a decline in AOCI related to the impact of higher interest rates on the valuation of our available for sale securities portfolio.
Because PNC remains in the parallel run qualification phase for the advanced approaches, our regulatory risk-based capital ratios in 2018 and 20172019 are calculated using the standardized approach for determining risk-weighted assets. Under the standardized approach for determining credit risk-weighted assets, exposures are generally assigned a pre-defined risk weight. Exposures to high volatility commercial real estate, past due exposures and equity exposures are generally subject to higher risk weights than other types of
The PNC Financial Services Group, Inc. – Form 10-Q29
exposures. Once we exit parallel run, our regulatory risk-based capital ratios will be the lower of the ratios calculated under the standardized approach and the advanced approaches.
Under the Basel III rules applicable to PNC, significant common stock investments in unconsolidated financial institutions (primarily(for PNC, primarily BlackRock), mortgage servicing rights and deferred tax assets must be deducted from capital (subject to a phase-in schedule that ended December 31, 2017 and net(net of associated deferred tax liabilities) to the extent they individually exceed 10%, or in the aggregate exceed 15%, of the institution's adjusted common equity Tier 1 capital. Also, Basel III regulatory capital includes (subject to a phase-in schedule that ended December 31, 2017) accumulated other comprehensive incomeAOCI related to securities currently, and previously held asthose transferred from, available for sale, as well as pension and other postretirement plans. With the exception of certain nonqualifiying trust preferred capital securities included in PNC’s Total risk-based capital, the transitions and multi-year phase-in of the definition of capital under the Basel III rules were complete as of January 1, 2018. Accordingly, we refer to the capital ratios calculated using the definition of capital in effect as of January 1, 2018 and, for the risk-based ratios, standardized approach risk-weighted assets, as the Basel III ratios. The Basel III Total risk-based capital includes trust preferred capital securities in the amount of $80 million that are subject to a phase-out that runs through 2022. We refer to the capital ratios calculated using the phased-in Basel III provisions in effect for 2017 and, for the risk-based ratios, standardized approach risk-weighted assets, as the 2017 Transitional Basel III ratios. All current period capital ratios are calculated using the regulatory capital methodology applicable to us during 2018.
Federal banking regulators have stated that they expect the largest U.S. bank holding companies (BHCs), including PNC, to have a level of regulatory capital well in excess of the regulatory minimum and have required the largest U.S. bank holding companies (BHCs),BHCs, including PNC, to have a capital buffer sufficient to withstand losses and allow them to meet the credit needs of their customers through estimated stress scenarios. We seek to manage our capital consistent with these regulatory principles, and believe that our March 31, 20182019 capital levels were aligned with them.
At March 31, 2018,2019, PNC and PNC Bank, our sole bank subsidiary, were both considered “well capitalized,” based on applicable U.S. regulatory capital ratio requirements. To qualify as “well capitalized”, PNC must have Basel III capital ratios of at least 6% for Tier 1 risk-based capital and 10% for Total risk-based capital, and PNC Bank must have Basel III capital ratios of at least 6.5% for Common equity Tier 1 risk-based capital, 8% for Tier 1 risk-based capital, 10% for Total risk-based capital and a Leverage ratio of at least 5%.
We provide additional information regarding regulatory capital requirements and some of their potential impacts on us in the Supervision and Regulation section of Item 1 Business, Item 1A Risk Factors and Note 18 Regulatory Matters in our 20172018 Form 10-K. See the Statistical Information (Unaudited) section of this Report for details on our March 31, 2017 Transitional Basel III and Fully Phased-In Basel III Common equity Tier 1 capital ratios.
The PNC Financial Services Group, Inc. – Form 10-Q33
Market Risk Management
Market risk isSee the risk of a loss in earnings or economic value due to adverse movements in market factors such as interest rates, credit spreads, foreign exchange rates, commodity prices and equity prices. We are exposed to market risk primarily by our involvement in the following activities, among others:
Traditional banking activities of gathering deposits and extending loans,
Equity and other investments and activities whose economic values are directly impacted by market factors, and
Fixed income securities, derivatives and foreign exchange activities, as a result of customer activities and securities underwriting.
We have established enterprise-wide policies and methodologies to identify, measure, monitor and report market risk. Market Risk Management provides independent oversight by monitoring compliance with established guidelines and reporting significant risks in the business toportion of the Risk Committee of the Board of Directors.Management Section in our 2018 Form 10-K for additional discussion regarding market risk.
Market Risk Management – Interest Rate Risk
Interest rate risk results primarily from our traditional banking activities of gathering deposits and extending loans. Many factors, including economic and financial conditions, movements in interest rates and consumer preferences, affect the difference between the interest that we earn on assets and the interest that we pay on liabilities and the level of our noninterest-bearing funding sources. Due to the repricing term mismatches and embedded options inherent in certain of these products, changes in market interest rates not only affect expected near-term earnings, but also the economic values of these assets and liabilities.
The interest rates that we pay on customer deposits have risen in recent quarters in part as a result of higher short-term market interest rates. The rates paid on commercial deposits have had a higher correlation to the increaseincreases in short-term interest rates, as compared to the rates paid on consumer deposits. During the remainder of 2019, we anticipate that the rates paid on our consumer deposits will continue to reflect any increases in short-term interest rates, although at a slower pace than previous years given the current Federal Reserve interest rate outlook. The rates paid on customer deposits are also impacted by many factors including the level of interest rates, competition for deposits, new product offerings, and changes in business strategies. During the remainder of 2018, we anticipate that the rates paid on our consumer deposits will have astrategies and customer migration to higher correlation to changes in short-term in interest rates.
A portion of our loans are indexed to one-month LIBOR, while the majority of our wholesale borrowings are indexed to three-month LIBOR. During the first quarter of 2018, the spread between three-month LIBOR and one-month LIBOR widened, resulting in a compression of net interest income and margin from what would have otherwise been recognized had the spread remained unchanged.rate accounts.
Our Asset and Liability Management group centrally manages interest rate risk as prescribed in our risk management policies, which are approved by management’s Asset and Liability Committee and the Risk Committee of the Board of Directors.
30 The PNC Financial Services Group, Inc. – Form 10-Q
Sensitivity results and market interest rate benchmarks for the first quarters of 2019 and 2018 and 2017 follow:follow.
Table 30:29: Interest Sensitivity Analysis
| | | | First Quarter 2018 |
| | First Quarter 2017 |
| | First Quarter 2019 |
| | First Quarter 2018 |
| |
| Net Interest Income Sensitivity Simulation (a) | | | | | | | | |
Effect on net interest income in first year from gradual interest rate change over the following 12 months of: | | | | | | | | |
| 100 basis point increase | 2.5 | % | | 2.5 | % | | 1.5 | % | | 2.5 | % | |
| 100 basis point decrease | (3.1 | )% | | (4.5 | )% | | (2.2 | )% | | (3.1 | )% | |
Effect on net interest income in second year from gradual interest rate change over the preceding 12 months of: | | | | | | | | |
| 100 basis point increase | 4.3 | % | | 4.0 | % | | 4.0 | % | | 4.3 | % | |
| 100 basis point decrease | (7.0 | )% | | (8.8 | )% | | (6.6 | )% | | (7.0 | )% | |
| Duration of Equity Model (a) | | | | | | | | |
| Base case duration of equity (in years) | (.7 | ) | | (2.3 | ) | | (3.7 | ) | | (.7 | ) | |
| Key Period-End Interest Rates | | | | | | | | |
| One-month LIBOR | 1.88 | % | | .98 | % | | 2.49 | % | | 1.88 | % | |
| Three-month LIBOR | 2.31 | % | | 1.15 | % | | 2.60 | % | | 2.31 | % | |
| Three-year swap | 2.66 | % | | 1.81 | % | | 2.31 | % | | 2.66 | % | |
| |
| (a) | Given the inherent limitations in certain of these measurement tools and techniques, results become less meaningful as interest rates approach zero. |
In addition to measuring the effect on net interest income assuming parallel changes in current interest rates, we routinely simulate the effects of a number of nonparallel interest rate environments. Table 3130 reflects the percentage change in net interest income over the next two 12-month periods assuming (i) the PNC Economist’s most likely rate forecast, (ii) implied market forward rates and
34 The PNC Financial Services Group, Inc. – Form 10-Q
(iii) yield curve slope flattening (a 100 basis point yield curve slope flattening between one-month and ten-year rates superimposed on current base rates) scenario.
Table 31: Net Interest Income Sensitivity to Alternative Rate Scenarios (First Quarter 2018)
|
| | | | | | | |
| | PNC Economist |
| Market Forward |
| Slope Flattening |
| |
| First year sensitivity | .7 | % | 1.8 | % | (.8 | )% | |
| Second year sensitivity | 1.3 | % | .4 | % | (3.5 | )% | |
All changes in forecasted net interest income are relative to results in a base rate scenario where current market rates are assumed to remain unchanged over the forecast horizon.
Table 30: Net Interest Income Sensitivity to Alternative Rate Scenarios
|
| | | | | | | |
| | March 31, 2019 | |
| | PNC Economist |
| Market Forward |
| Slope Flattening |
| |
| First year sensitivity | .3 | % | .3 | % | (.8 | )% | |
| Second year sensitivity | 1.4 | % | (.3 | )% | (3.7 | )% | |
When forecasting net interest income, we make assumptions about interest rates and the shape of the yield curve, the volume and characteristics of new business and the behavior of existing on- and off-balance sheet positions. These assumptions determine the future level of simulated net interest income in the base interest rate scenario and the other interest rate scenarios presented in Tables 3029 and 31.30. These simulations assume that as assets and liabilities mature, they are replaced or repriced at then current market rates.
The following graph presents the LIBOR/Swap yield curves for the base rate scenario and each of the alternate scenarios one year forward.
The PNC Financial Services Group, Inc. – Form 10-Q31
Table 32:31: Alternate Interest Rate Scenarios: One Year Forward
The first quarter 20182019 interest sensitivity analyses indicate that our Consolidated Balance Sheet is positioned to benefit from an increase in interest rates and an upward sloping interest rate yield curve. We believe that we have the deposit funding base and balance sheet flexibility to adjust, where appropriate and permissible, to changing interest rates and market conditions.
Market Risk Management – Customer-Related Trading Risk
We engage in fixed income securities, derivatives and foreign exchange transactions to support our customers’ investing and hedging activities. These transactions, related hedges and the credit valuation adjustment related to our customer derivatives portfolio are marked-to-market daily and reported as customer-related trading activities. We do not engage in proprietary trading of these products.
We use value-at-risk (VaR) as the primary means to measure and monitor market risk in customer-related trading activities. VaR is used to estimate the probability of portfolio losses based on the statistical analysis of historical market risk factors. A diversified VaR reflects empirical correlations across different asset classes. We calculate a diversified VaR at a 95% confidence interval and the results for the first three months of 20182019 and 20172018 were within our acceptable limits.
See the Market Risk Management – Customer-Related Trading Risk section of our 20172018 Form 10-K for more information on our models used to calculate VaR and our backtesting process.
Customer related trading revenue was $48 million for the first quarter of 2019 compared to $77 million for the first quarter of 2018 compared to $68 million for the first quarter of 2017.in 2018. The increasedecrease was primarily due to higherthe impact of changes in credit valuations for customer-related derivative activities and lower foreign exchange and derivative client sales revenues.
The PNC Financial Services Group, Inc. – Form 10-Q35
revenue.
Market Risk Management – Equity And Other Investment Risk
Equity investment risk is the risk of potential losses associated with investing in both private and public equity markets. In addition to extending credit, taking deposits, underwriting securities and trading financial instruments, we make and manage direct investments in a variety of transactions, including management buyouts, recapitalizations and growth financings in a variety of industries. We also have investments in affiliated and non-affiliated funds that make similar investments in private equity. The economic and/or book value of these investments and other assets are directly affected by changes in market factors.
Various PNC business units manage our equity and other investment activities. Our businesses are responsible for making investment decisions within the approved policy limits and associated guidelines.
A summary of our equity investments follows:
Table 33:32: Equity Investments Summary
| | | | March 31
2018 |
| | December 31
2017 |
| | Change | | March 31
2019 |
| | December 31
2018 |
| | Change | |
| Dollars in millions | | $ |
| | % |
| | | $ |
| | % |
| |
| BlackRock | $ | 7,642 |
| | $ | 7,576 |
| | $ | 66 |
| | 1 | % | | $ | 8,080 |
| | $ | 8,016 |
| | $ | 64 |
| | 1 | % | |
| Tax credit investments | 2,071 |
| | 2,148 |
| | (77 | ) | | (4 | )% | | 2,057 |
| | 2,219 |
| | (162 | ) | | (7 | )% | |
| Private equity and other | 2,295 |
| | 1,668 |
| | 627 |
| | 38 | % | | 2,430 |
| | 2,659 |
| | (229 | ) | | (9 | )% | |
| Total | $ | 12,008 |
| | $ | 11,392 |
| | $ | 616 |
| | 5 | % | | $ | 12,567 |
| | $ | 12,894 |
| | $ | (327 | ) | | (3 | )% | |
BlackRock
We owned approximately 35 million common stock equivalent shares of BlackRock equity at March 31, 2018,2019, accounted for under the equity method. The Business Segments Review section of this Financial Review includes additional information about BlackRock.
32 The PNC Financial Services Group, Inc. – Form 10-Q
Tax Credit Investments
Included in our equity investments are direct tax credit investments and equity investments held by consolidated entities. These tax credit investment balances included unfunded commitments totaling $.7 billion and $.8 billion at March 31, 20182019 and December 31, 2017,2018, respectively. These unfunded commitments are included in Other liabilities on our Consolidated Balance Sheet.
Note 2 Loan Sale and Servicing Activities and Variable Interest Entities in the Notes To Consolidated Financial Statements in our 20172018 Form 10-K has further information on Tax Credit Investments.
Private Equity and Other
The majority of our other equity investments consists of our private equity portfolio. The private equity portfolio is an illiquid portfolio consisting of mezzanine and equity investments that vary by industry, stage and type of investment. Private equity investments carried at estimated fair value totaled $1.4 billion and $1.3$1.5 billion at March 31, 2018 at2019 and December 31, 2017,2018, respectively. As of March 31, 2018,2019, $1.2 billion was invested directly in a variety of companies and $.2 billion was invested indirectly through various private equity funds. See Item 1 Business -the Supervision and Regulation section in Item 1 of our 20172018 Form 10-K for discussion of the potential impacts of the Volcker Rule provisions of Dodd-Frank on our interests in and of private funds covered by the Volcker Rule.
Effective January 1, 2018, $.6 billion of available for sale securities were reclassified to equity investments as part of the adoption of ASU 2016-01. These securities were primarily money market funds.
Included in our other equity investments are Visa Class B common shares, which are recorded at cost. At March 31, 2018, the estimated value of our investment in Visa Class B common shares was approximately $693 million and our cost basis was not significant. Visa Class B common shares that we own are transferable only under limited circumstances until they can be converted into shares of the publicly-traded class of stock,Class A common shares, which cannot happen until the settlementresolution of the pending interchange litigation. Based upon the March 31, 2019 per share closing price of $156.19 for a Visa Class A common share, the estimated value of our total investment in the Class B common shares was approximately $895 million at the current conversion rate of Visa B shares to Visa A shares, while our cost basis was not significant. See Note 6 Fair Value and Note 19 Legal Proceedings in the Notes To Consolidated Financial Statements in Item 8 of our 2017 Form2018 10-K for additional information regarding our Visa agreements. The estimated value does not represent fair value of the Visa B common shares given the share’s limited transferability and the lack of observable transactions in the marketplace.
We also have certain other equity investments, the majority of which represent investments in affiliated and non-affiliated funds with both traditional and alternative investment strategies. Net gains related to these investments were not significant at March 31, 20182019 and March 31, 2017.
36 The PNC Financial Services Group, Inc. – Form 10-Q
Financial Derivatives
We use a variety of financial derivatives as part of the overall asset and liability risk management process to help manage exposure to market (primarily interest rate) and credit risk inherent in our business activities. Substantially all such instruments are used to manage risk related to changes in interest rates. Interest rate swaps, interest rate caps and floors, swaptions, options, forwards and futures contracts are the primary instruments we use for risk management. We also enter into derivatives with customers to facilitate their risk management activities.
Financial derivatives involve, to varying degrees, market and credit risk. PeriodicDerivatives represent contracts between parties that usually require little or no initial net investment and result in one party delivering cash payments are exchanged for interest rate swaps, optionsor another type of asset to the other party based on a notional and futures contracts. Premiums are also exchanged for options contracts.an underlying as specified in the contract. Therefore, cash requirements and exposure to credit risk are significantly less than the notional amount on these instruments.
Further information on our financial derivatives is presented in Note 1 Accounting Policies and Note 6 Fair Value in our Notes To Consolidated Financial Statements in our 20172018 Form 10-K and in Note 6 Fair Value and Note 9 Financial Derivatives in the Notes To Consolidated Financial Statements in this Report.
Not all elements of market and credit risk are addressed through the use of financial derivatives, and such instruments may be ineffective for their intended purposes due to unanticipated market changes, among other reasons.
RECENT REGULATORY DEVELOPMENTS
On April 10, 2018,March 6, 2019, the Federal Reserve requested public comment onreleased a proposal that would integratefinal rule amending its capital plan rule. Under the final rule, stress test rules andthe capital plan that PNC files in connection with the annual CCAR exercise, including the capital plan submitted on April 5, 2019 in connection with its Basel III regulatory capital rules. The proposal would apply to BHCs with $50 billion or more in assets (including PNC). Among other things, the proposal would introduce new common equity Tier 1 (CET1) and Tier 1 leverage stress capital buffers. The CET1 and Tier 1 leverage stress capital buffers for a covered BHC would equal (i) the percentage decline in the BHC’s CET1 and Tier 1 leverage ratios, respectively, in the most recently completed2019 CCAR exercise, as projectedis no longer subject to a potential objection by the Federal Reserve under its Supervisory Severely Adverse scenario, plus (ii) the BHC’s projected common stock dividends in the fourth through seventh quarter of that exercise (expressed as a ratio to the BHC’s total risk-weighted assets or average total consolidated assets, as applicable). The CET1 stress capital buffer would have a minimum “floor” of 2.5 percent.based on qualitative factors.
UnderIn a separate action on the proposal, PNC would be subject tosame date, the Basel III capital conservation buffer limitations on capital distributions and discretionary incentive compensation payments to senior management if PNC’s CET1 ratio fell below (i) 4.5%, plus (ii) PNC’s applicable CET1 stress capital buffer, plus (iii) any applicableFederal Reserve also affirmed a countercyclical capital buffer (which is currently set at zero in the United States). Global systemically important banks (GSIBs) and BHCs that have exited parallel runof 0% applicable under the advanced approaches would be subject to additional capital buffer requirements. In connection with these changes, the Federal Reserve proposes to make a number of changes to the CCAR process, including eliminating (i) the quantitative “pass-fail” component, (ii) the required assumption that a BHC continues its base case capital actions in the Supervisory Adverse and Severely Adverse scenarios, and (iii) the stricter scrutiny applied by the Federal Reserve to common dividend payout ratios of greater than 30 percent. The proposal also would make changes to the capital action assumptions that the Federal Reserve and covered BHCs apply in conducting stress tests under the Dodd-Frank Wall Street Reform and Consumer Protection Act (DFAST). The Federal Reserve has proposed implementing these changes for the 2019 CCAR exercise.
Also in April, the Federal Reserve, Office of the Comptroller of the Currency and Federal Deposit Insurance Corporation requested public comment on a joint proposal that would, among other things, revise the agencies’ Basel III regulatory capital rules to allow banking organizations to elect to phase-in, over a three-year period,PNC and other BHCs with at least $250 billion in total consolidated assets or more than $10 billion in on-balance sheet foreign exposure. For more information on the regulatory capital effectsplan rule, the CCAR exercise and the countercyclical capital buffer see the Supervision and Regulation section in Item 1 Business of implementingour 2018 Form 10-K.
On March 29, 2019, the Financial Accounting Standards Board’s (FASB) Accounting Standards Update (ASU) 2016-13 Financial Instruments - Credit Losses (Topic 326), commonly referred to as the Current Expected Credit Losses (CECL) standard. The proposal also would generally replace references to the ALLL in the regulatory capital and certain other rules of the agencies with references to the allowanceFDIC released two proposals for credit losses (ACL) for institutionspublic comment that have adopted CECL. As defined, ACL would include credit loss allowances established for on- and off-balance sheet assets in accordance with CECL through a charge against earnings, other than credit losses on purchased credit-deteriorated assets and available for sale securities and allocated transfer risk reserves. Under the proposal, an institution that has adopted CECL could include ACL in its regulatory Tier 2 capital to the same extent as ALLL is includable in Tier 2 capital currently (i.e., up to 1.25% of Standardized Approach risk-weighted assets). An institution that calculates capital under the advanced approaches and has implemented CECL also would use ACL to determine whether its expected credit losses exceed the institution’s eligible credit reserves (which would be defined as ACL), with the difference deducted from CET1. The proposal also would amend the agencies’ capital stress test rules to provide that covered banking organizations that have adopted CECL must include the effects of CECL in their stress tests conducted after January 1, 2020.its (i) enhanced deposit insurance recordkeeping requirements for insured depository institutions (IDIs) with at least 2 million deposit accounts, including PNC Bank,
The PNC Financial Services Group, Inc. – Form 10-Q 3733
and (ii) deposit insurance recordkeeping requirements for joint deposit accounts applicable to all IDIs. Among other things, the proposals would revise the attestation requirement under the deposit insurance recordkeeping rules and allow covered IDIs to elect to extend the April 1, 2020 compliance date for the deposit insurance recordkeeping requirements by up to one year.
In April, the Federal Reserve and FDIC requested public comment on proposed rules that would tailor the resolution plan requirements for BHCs with at least $100 billion in total consolidated assets under Sec. 165(d) of the Dodd-Frank Wall Street Reform and Consumer Protection Act. Under the proposal, PNC generally would be required to submit a resolution plan to the Federal Reserve and FDIC on a triennial cycle, with the scope of the submissions alternating between a full and a targeted submission from one triennial cycle to the next. The agencies, however, could jointly adjust the timeline for submissions or request interim updates between filings. As proposed, these changes would become effective no later than November 24, 2019 and, once effective, PNC’s first full resolution plan submission under the proposal would be due July 1, 2021.
On April 16, 2019, the FDIC requested comment on an advance notice of proposed rulemaking that would alter the FDIC’s separate resolution plan requirements for IDIs with total consolidated assets of at least $50 billion (covered IDIs), including PNC Bank. Under the proposal, covered IDIs would potentially be grouped into three categories. The proposal requests comment on what metrics or characteristics could be used to classify covered IDIs into these groups. The proposal would also potentially change the content and submission requirements of resolution plans for some of the groups. The proposal also would delay the requirement for PNC Bank (as well as other covered IDIs) to file a resolution plan under the FDIC’s current rules until a future date to be specified by the FDIC. For more information on the resolution planning requirements applicable to PNC and PNC Bank see the Supervision and Regulation section in Item 1 Business of our 2018 Form 10-K.
CRITICAL ACCOUNTING ESTIMATES AND JUDGMENTS
Note 1 Accounting Policies of our 20172018 Form 10-K describes the most significant accounting policies that we use to prepare our consolidated financial statements. Certain of these policies require us to make estimates or economic assumptions that may vary under different assumptions or conditions and such variations may significantly affect our reported results and financial position for the period or in future periods.
The following critical accounting policies and judgments are described in more detail in Critical Accounting Estimates and Judgments in Item 7 of our 20172018 Form 10-K:
Fair Value Measurements
Allowances for Loan and Lease Losses and Unfunded Loan Commitments and Letters of Credit
Goodwill
Residential and Commercial Mortgage Servicing Rights
Income Taxes
Legal Contingencies
Fair Value Measurements
The following table summarizes the assets and liabilities measured at fair value on a recurring basis at March 31, 2018 and December 31, 2017, respectively, and the portions of such assets and liabilities that are classified within Level 3 of the valuation hierarchy. Level 3 assets and liabilities are those where the fair value is estimated using significant unobservable inputs.
Table 34: Fair Value Measurements – Summary
|
| | | | | | | | | | | | | | | | | |
| | March 31, 2018 | | | December 31, 2017 | |
| Dollars in millions | Total Fair Value |
| | Level 3 |
| | | Total Fair Value |
| | Level 3 |
| |
| Total assets | $ | 66,580 |
| | $ | 6,546 |
| | | $ | 69,673 |
| | $ | 6,475 |
| |
| Total assets at fair value as a percentage of consolidated assets | 18 | % | | | | | 18 | % | | | |
| Level 3 assets as a percentage of total assets at fair value | | | 10 | % | | | | | 9 | % | |
| Level 3 assets as a percentage of consolidated assets | | | 2 | % | | | | | 2 | % | |
| Total liabilities | $ | 4,161 |
| | $ | 488 |
| | | $ | 4,233 |
| | $ | 531 |
| |
| Total liabilities at fair value as a percentage of consolidated liabilities | 1 | % | | | | | 1 | % | | | |
| Level 3 liabilities as a percentage of total liabilities at fair value | | | 12 | % | | | | | 13 | % | |
| Level 3 liabilities as a percentage of consolidated liabilities | | | <1 | % | | | | | <1 | % | |
The majority of assets recorded at fair value are included in the securities available for sale portfolio. The majority of Level 3 assets represent non-agency residential mortgage-backed securities in the available for sale portfolio, equity investments and mortgage servicing rights. For further information on fair value, see Note 6 Fair Value in the Notes To Consolidated Financial Statements in this Report.
Income Taxes
See the Critical Accounting Estimates and Judgments section in Item 7 of our 2017 Form 10-K for information on our accounting of certain income tax effects of the Tax Cuts and Jobs Act enacted on December 22, 2017. Where certain income tax effects could be reasonably estimated, these were included as provisional amounts as of December 31, 2017. During the measurement period, which will end in December 2018, these estimates may be adjusted upon obtaining or analyzing additional information about facts and circumstances or clarifications of uncertain aspects of the newly enacted tax law, which if known would have affected the initially reported provisional amounts. No changes were made to these provisional amounts during the first quarter of 2018.
3834 The PNC Financial Services Group, Inc. – Form 10-Q
Recently Issued Accounting Standards
|
| | |
| Accounting Standards Update (ASU) | Description | Financial Statement Impact |
Leases - ASU 2016-02
Issued February 2016
| • Required effective date of January 1, 2019.(a)
• Requires lessees to recognize a right-of-use asset and related lease liability for all leases with lease terms of more than 12 months.
• Recognition, measurement and presentation of expenses and cash flows arising from a lease by a lessee will depend on its classification as a finance or operating lease.
• May be adopted using a modified retrospective approach through a cumulative-effect adjustment.
• FASB approved an amendment which would permit the option to adopt the new standard prospectively as of the effective date, without adjusting comparative periods presented.
| • We plan to adopt the guidance in the first quarter of 2019.
• Implementation efforts are ongoing, including the deployment of a lease accounting software solution.
• We are currently evaluating the impact of various accounting policy elections, the discount rate to present value the future minimum payments under operating leases, and the impact of new disclosure requirements.
• We are substantially complete with the evaluation of our initial lease population. We will continue to review service contracts through the effective date and may identify additional leases embedded within those arrangements that are within the scope of the ASU.
• We expect, at a minimum, to recognize lease liabilities and corresponding right-of-use assets commensurate with the present value of the future minimum payments. Future minimum lease payments under operating leases totaled $2.6 billion as of December 31, 2017 as disclosed in Note 8 Premises, Equipment and Leasehold Improvements in our 2017 Form 10-K.
• We do not expect a material change to the timing of our expense recognition.
|
Credit Losses - ASU 2016-13
Issued June 2016 | • Required effective date of January 1, 2020.(a) • Requires the use of an expected credit loss methodology; specifically, current expected credit losses (CECL) for the remaining life of the asset will be recognized at the time of origination or acquisition. • Methodology will apply to loans, debt securities, and other financial assets and net investment in leases not accounted for at fair value through net income. It will also apply to off-balance sheet credit exposures except for unconditionally cancellable commitments. • In-scope assets will be presented at the net amount expected to be collected after deducting the allowance for credit losses from the amortized cost basis of the assets. • Requires enhanced credit quality disclosures including disaggregation of credit quality indicators by vintage. • Requires a modified retrospective approach through a cumulative-effect adjustment to retained earnings as of the beginning of the year of adoption. | • We dodid not plan to adopt the standard at its early adoption date in the first quarter of January 2019. • We established a company-wide, cross-functional governance structure in the third quarter of 2016, which oversees overall strategy for implementation of Topic 326, including model methodology, technology, development, data enhancements and governance issues.CECL. • We have prepared preliminary CECL accounting policies and interpretations, and continue to designrefine and developtest our models, estimation techniques, data, operational processes and controls to be used in preparing the CECL estimation methodologies and technological solutions.estimates. • Concurrently,We expect that we are assessingwill be able to test-run our key processes by the end of the second quarter of 2019, pending any unforeseen circumstances or significant changes to the requirements. During 2019, we expect to continually address any gaps in our interpretations, methodology, data and analyzing whether data that is required to comply with the standard is availableoperational processes based upon our reviews and accurate.tests. • We are also participating in the FASB’s standard setting activity related to CECL. The FASB has issued a proposed ASU for technical corrections related to financial instruments, which has an impact on the implementation of CECL related to treatment of recoveries, accrued interest receivables and some disclosure requirements. We are awaiting final guidance from the FASB, and expect to be able to implement any changes. • We believe that given current conditions, our credit loss reserves will increase primarily for longer duration consumer loans, due to the difference between loss emergence periods currently used versus the remaining life of the asset required under CECL. We will continue to refine our estimates throughout 2019, as CECL models and techniques are implemented and the results are vetted. We continue to believe that total credit loss reserves will increase at the adoption of the standard will result in an overall increase in the allowance for loan losses to cover credit losses over the estimated life of the financial assets. However,date and that the magnitude of the increase in our allowance for loan losses at the adoption date will depend upon the nature and characteristics of the portfolio at the adoption date, as well as macroeconomic conditions and forecasts at that date.
|
Goodwill - ASU 2017-04
Issued January 2017 | • Required effective date of January 1, 2020.(a) • Eliminates Step 2 from the goodwill impairment test to simplify the subsequent measurement of goodwill under which a loss was recognized only if the estimated implied fair value of the goodwill is below its carrying value. • Requires impairment to be recognized if the carrying amount exceeds the reporting unit’s fair value.
| • We plan to adopt the standard on its effective date and we do not expect the adoption of this standard to impact our consolidated results of operations or our consolidated financial position.
|
(a) Early adoption is permitted.
Recently Adopted Accounting Standards
See Note 1 Accounting Policies in the Notes To Consolidated Financial Statements in this Report regarding the impact of new accounting pronouncements adopted in the first quarter of 2018.pronouncements.
The PNC Financial Services Group, Inc. – Form 10-Q39
OFF-BALANCE SHEET ARRANGEMENTS AND VARIABLE INTEREST ENTITIES
We engage in a variety of activities that involve entities that are not consolidated or otherwise reflected in our Consolidated Balance Sheet that are generally referred to as off-balance sheet arrangements. Additional information on these types of activities is included in our 20172018 Form 10-K and in Note 2 Loan Sale and Servicing Activities and Variable Interest Entities and Note 13 Commitments in the Notes To Consolidated Financial Statements included in this Report.
A summary and further description of variable interest entities (VIEs), including those in which we hold variable interests but have not consolidated into our financial statements, is included in Note 1 Accounting Policies and Note 2 Loan Sale and Servicing Activities and Variable Interest Entities in our 20172018 Form 10-K.
The PNC Financial Services Group, Inc. – Form 10-Q35
Trust Preferred Securities and REIT Preferred Securities
See Note 10 Borrowed Funds and Note 15 Equity in the Notes To Consolidated Financial Statements in our 20172018 Form 10-K for additional information on trust preferred securities issued by PNC Capital Trust C including information on contractual limitations potentially imposed on payments (including dividends) with respect to PNC's equity securities and for additional information on the 2017 redemption of the REIT preferred securities issued by PNC Preferred Funding Trust I and PNC Preferred Funding Trust II.securities.
INTERNAL CONTROLS AND DISCLOSURE CONTROLS AND PROCEDURES
As of March 31, 2018,2019, we performed an evaluation under the supervision of and with the participation of our management, including the Chairman, President and Chief Executive Officer and the Executive Vice President and Chief Financial Officer, of the effectiveness of the design and operation of our disclosure controls and procedures and of changes in our internal control over financial reporting.
Based on that evaluation, our Chairman, President and Chief Executive Officer and our Executive Vice President and Chief Financial Officer concluded that our disclosure controls and procedures (as defined in Rule 13a-15(e) under the Securities Exchange Act of 1934) were effective as of March 31, 2018,2019, and that there has been no change in PNC’s internal control over financial reporting that occurred during the first quarter of 20182019 that has materially affected, or is reasonably likely to materially affect, our internal control over financial reporting.
GLOSSARY OF TERMS
For a glossary of terms commonly used in our filings, please see the glossary of terms included in our 20172018 Form 10-K.
CAUTIONARY STATEMENT REGARDING FORWARD-LOOKING INFORMATION
We make statements in this Report, and we may from time to time make other statements, regarding our outlook for earnings, revenues, expenses, tax rates, capital and liquidity levels and ratios, asset levels, asset quality, financial position, and other matters regarding or affecting us and our future business and operations that are forward-looking statements within the meaning of the Private Securities Litigation Reform Act. Forward-looking statements are typically identified by words such as “believe,” “plan,” “expect,” “anticipate,” “see,” “look,” “intend,” “outlook,” “project,” “forecast,” “estimate,” “goal,” “will,” “should” and other similar words and expressions. Forward-looking statements are subject to numerous assumptions, risks and uncertainties, which change over time.
Forward-looking statements speak only as of the date made. We do not assume any duty to update forward-looking statements. Actual results or future events could differ, possibly materially, from those anticipated in forward-looking statements, as well as from historical performance.
Our forward-looking statements are subject to the following principal risks and uncertainties.
Our businesses, financial results and balance sheet values are affected by business and economic conditions, including the following:
| |
| – | Changes in interest rates and valuations in debt, equity and other financial markets. |
| |
| – | Disruptions in the U.S. and global financial markets. |
| |
| – | Actions by the Federal Reserve Board, U.S. Treasury and other government agencies, including those that impact money supply and market interest rates. |
| |
| – | Changes in customer behavior due to newlyrecently enacted tax legislation, changing business and economic conditions or legislative or regulatory initiatives. |
| |
| – | Changes in customers’, suppliers’ and other counterparties’ performance and creditworthiness. |
| |
| – | Impact of tariffs and other trade policies of the U.S. and its global trading partners. |
| |
| – | Slowing or reversal of the current U.S. economic expansion. |
| |
| – | Commodity price volatility. |
Our forward-looking financial statements are subject to the risk that economic and financial market conditions will be substantially different than those we are currently expecting and do not take into account potential legal and regulatory contingencies. These statements are based on our current view that the U.S. economic growth will accelerate somewhat inviews that:
| |
| – | U.S. economic growth has accelerated over the past two years to above its long-run trend. |
| |
| – | Growth is expected to rebound in the second quarter following a soft first quarter 2019, and slow over the remaining course of 2019 and into 2020. |
| |
| – | Further gradual improvement in the labor market will occur this year, including job gains and rising wages, which would be a positive indicator for consumer spending. |
| |
| – | Trade restrictions and geopolitical concerns are downside risks to the forecast. |
| |
| – | Inflation has slowed in early 2019, to below the FOMC’s 2% objective, but is expected to rise in the second half of the year. |
| |
| – | Our baseline forecast is for no change to the federal funds rate in 2019 and 2020, with the rate staying in its current range of 2.25 to 2.50%. |
4036 The PNC Financial Services Group, Inc. – Form 10-Q
2018, in light of stimulus from corporate and personal income tax cuts passed in late 2017 that are expected to support business investment and consumer spending, respectively. We expect an increase in federal government spending will also support economic growth in 2018. Further gradual improvement in the labor market this year, including job gains and rising wages, is another positive for consumer spending. Other sources of growth for the U.S. economy in 2018 will be the global economic expansion and the housing market, although trade restrictions are a downside risk to the forecast. Although inflation slowed in 2017, it should pick up as the labor market continues to tighten. Short-term interest rates and bond yields are expected to rise throughout 2018; after the Federal Open Market Committee raised the federal funds rate in March, our baseline forecast is for two additional rate hikes in June and December 2018, pushing the rate to a range of 2.00 to 2.25% by the end of the year. Longer-term rates are also expected to increase as the Federal Reserve slowly reduces the size of its balance sheet and the federal government borrows more. Long-term rates will rise more slowly than short-term rates, so we anticipate that the yield curve will flatten but not invert.
Our ability to take certain capital actions, including returning capital to shareholders, is subject to review by the Federal Reserve Board as part of our comprehensive capital plan for the applicable period in connection with the Federal Reserve Board’s Comprehensive Capital Analysis and Review (CCAR)CCAR process and to the acceptance of such capital plan and non-objection to such capital actions by the Federal Reserve Board.
Our regulatory capital ratios in the future will depend on, among other things, the company’s financial performance, the scope and terms of final capital regulations then in effect (particularly those implementing the international regulatory capital framework developed by the Basel Committee on Banking Supervision (Basel Committee), and management actions affecting the composition of our balance sheet. In addition, our ability to determine, evaluate and forecast regulatory capital ratios, and to take actions (such as capital distributions) based on actual or forecasted capital ratios, will be dependent at least in part on the development, validation and regulatory approval of related models.
Legal and regulatory developments could have an impact on our ability to operate our businesses, financial condition, results of operations, competitive position, reputation, or pursuit of attractive acquisition opportunities. Reputational impacts could affect matters such as business generation and retention, liquidity, funding, and ability to attract and retain management. These developments could include:
| |
| – | Changes resulting from legislative and regulatory reforms, including changes affecting oversight of the financial services industry, consumer protection, pension, bankruptcy and other industry aspects, and changes in accounting policies and principles. |
| |
| – | Changes to regulations governing bank capital and liquidity standards, including due to the Dodd-Frank Act and initiatives of the Basel Committee.standards. |
| |
| – | Unfavorable resolution of legal proceedings or other claims and regulatory and other governmental investigations or other inquiries. These matters may result in monetary judgments or settlements or other remedies, including fines, penalties, restitution or alterations in our business practices, and in additional expenses and collateral costs, and may cause reputational harm to us. |
| |
| – | Results of the regulatory examination and supervision process, including our failure to satisfy requirements of agreements with governmental agencies. |
| |
| – | Impact on business and operating results of any costs associated with obtaining rights in intellectual property claimed by others and of adequacy of our intellectual property protection in general. |
Business and operating results are affected by our ability to identify and effectively manage risks inherent in our businesses, including, where appropriate, through effective use of systems and controls, third-party insurance, derivatives, and capital management techniques, and to meet evolving regulatory capital and liquidity standards.
Business and operating results also include impacts relating to our equity interest in BlackRock, Inc. and rely to a significant extent on information provided to us by BlackRock. Risks and uncertainties that could affect BlackRock are discussed in more detail by BlackRock in its Securities and Exchange Commission (SEC)SEC filings.
We grow our business in part through acquisitions. Acquisition risksacquisitions and new strategic initiatives. Risks and uncertainties include those presented by the nature of the business acquired and strategic initiative, including in some cases those associated with our entry into new businesses or new geographic or other markets and risks resulting from our inexperience in those new areas, as well as risks and uncertainties related to the acquisition transactions themselves, regulatory issues, and the integration of the acquired businesses into PNC after closing.
Competition can have an impact on customer acquisition, growth and retention and on credit spreads and product pricing, which can affect market share, deposits and revenues. Our ability to anticipate and respond to technological changes can also impact our ability to respond to customer needs and meet competitive demands.
Business and operating results can also be affected by widespread natural and other disasters, pandemics, dislocations, terrorist activities, system failures, security breaches, cyberattacks or international hostilities through impacts on the economy and financial markets generally or on us or our counterparties specifically.
We provide greater detail regarding these as well as other factors in our 20172018 Form 10-K and elsewhere in this Report, including Item 1Ain the Risk Factors in our 2017 Form 10-K, theand Risk Management section of this Financial Review and of Item 7 in our 2017 Form 10-Ksections and the Legal Proceedings and Commitments Notes of the Notes To Consolidated Financial Statements included in Item 1 of this Report and Item 8 of our 2017 Form 10-K.these reports. Our forward-looking statements may also be subject to other risks and uncertainties, including those discussed elsewhere in this Report or in our other filings with the SEC.
The PNC Financial Services Group, Inc. – Form 10-Q 4137
CONSOLIDATED INCOME STATEMENT
THE PNC FINANCIAL SERVICES GROUP, INC.
| | | Unaudited | Three months ended
March 31 | Three months ended
March 31 |
| In millions, except per share data | 2018 |
| | 2017 |
| 2019 |
| | 2018 |
|
| Interest Income | | | | | | |
| Loans | $ | 2,228 |
| | $ | 1,904 |
| $ | 2,602 |
| | $ | 2,228 |
|
| Investment securities | 512 |
| | 493 |
| 620 |
| | 512 |
|
| Other | 178 |
| | 123 |
| 206 |
| | 178 |
|
| Total interest income | 2,918 |
| | 2,520 |
| 3,428 |
| | 2,918 |
|
| Interest Expense | | | | | | |
| Deposits | 213 |
| | 120 |
| 472 |
| | 213 |
|
| Borrowed funds | 344 |
| | 240 |
| 481 |
| | 344 |
|
| Total interest expense | 557 |
| | 360 |
| 953 |
| | 557 |
|
| Net interest income | 2,361 |
| | 2,160 |
| 2,475 |
| | 2,361 |
|
| Noninterest Income | | | | | | |
| Asset management | 455 |
| | 403 |
| 437 |
| | 455 |
|
| Consumer services | 357 |
| | 332 |
| 371 |
| | 357 |
|
| Corporate services | 429 |
| | 414 |
| 462 |
| | 429 |
|
| Residential mortgage | 97 |
| | 113 |
| 65 |
| | 97 |
|
| Service charges on deposits | 167 |
| | 161 |
| 168 |
| | 167 |
|
| Other | 245 |
| | 301 |
| 308 |
| | 245 |
|
| Total noninterest income | 1,750 |
| | 1,724 |
| 1,811 |
| | 1,750 |
|
| Total revenue | 4,111 |
| | 3,884 |
| 4,286 |
| | 4,111 |
|
| Provision For Credit Losses | 92 |
| | 88 |
| 189 |
| | 92 |
|
| Noninterest Expense | | | | | | |
| Personnel | 1,354 |
| | 1,257 |
| 1,414 |
| | 1,354 |
|
| Occupancy | 218 |
| | 222 |
| 215 |
| | 218 |
|
| Equipment | 273 |
| | 251 |
| 273 |
| | 273 |
|
| Marketing | 55 |
| | 55 |
| 65 |
| | 55 |
|
| Other | 627 |
| | 617 |
| 611 |
| | 627 |
|
| Total noninterest expense | 2,527 |
| | 2,402 |
| 2,578 |
| | 2,527 |
|
| Income before income taxes and noncontrolling interests | 1,492 |
| | 1,394 |
| 1,519 |
| | 1,492 |
|
| Income taxes | 253 |
| | 320 |
| 248 |
| | 253 |
|
| Net income | 1,239 |
| | 1,074 |
| 1,271 |
| | 1,239 |
|
| Less: Net income attributable to noncontrolling interests | 10 |
| | 17 |
| 10 |
| | 10 |
|
| Preferred stock dividends | 63 |
| | 63 |
| 63 |
| | 63 |
|
| Preferred stock discount accretion and redemptions | 1 |
| | 21 |
| 1 |
| | 1 |
|
| Net income attributable to common shareholders | $ | 1,165 |
| | $ | 973 |
| $ | 1,197 |
| | $ | 1,165 |
|
| Earnings Per Common Share | | | | | | |
| Basic | $ | 2.45 |
| | $ | 1.99 |
| $ | 2.62 |
| | $ | 2.45 |
|
| Diluted | $ | 2.43 |
| | $ | 1.96 |
| $ | 2.61 |
| | $ | 2.43 |
|
| Average Common Shares Outstanding | | | | | | |
| Basic | 473 |
| | 487 |
| 455 |
| | 473 |
|
| Diluted | 476 |
| | 492 |
| 456 |
| | 476 |
|
See accompanying Notes To Consolidated Financial Statements.
4238 The PNC Financial Services Group, Inc. – Form 10-Q
CONSOLIDATED STATEMENT OF COMPREHENSIVE INCOME
THE PNC FINANCIAL SERVICES GROUP, INC.
| | Unaudited In millions | | Three months ended
March 31 | | | Three months ended
March 31 | |
| 2018 |
| | 2017 |
| | 2019 |
| | 2018 |
| |
| Net income | | $ | 1,239 |
| | $ | 1,074 |
| | | $ | 1,271 |
| | $ | 1,239 |
| |
| Other comprehensive income (loss), before tax and net of reclassifications into Net income: | | | | | | | | | | |
| Net unrealized gains (losses) on non-OTTI securities | | (646 | ) | | 69 |
| | | 639 |
| | (646 | ) | |
| Net unrealized gains (losses) on OTTI securities | | 14 |
| | 35 |
| | | 9 |
| | 14 |
| |
| Net unrealized gains (losses) on cash flow hedge derivatives | | (193 | ) | | (77 | ) | | | 100 |
| | (193 | ) | |
| Pension and other postretirement benefit plan adjustments | | 63 |
| | (62 | ) | | | 145 |
| | 63 |
| |
| Other | | 27 |
| | 4 |
| | | 34 |
| | 27 |
| |
| Other comprehensive income (loss), before tax and net of reclassifications into Net income | | (735 | ) |
| (31 | ) |
| | 927 |
|
| (735 | ) | |
| Income tax benefit (expense) related to items of other comprehensive income | | 178 |
| | 17 |
| | | (207 | ) | | 178 |
| |
| Other comprehensive income (loss), after tax and net of reclassifications into Net income | | (557 | ) |
| (14 | ) |
| | 720 |
|
| (557 | ) | |
| Comprehensive income | | 682 |
| | 1,060 |
| | | 1,991 |
| | 682 |
| |
| Less: Comprehensive income (loss) attributable to noncontrolling interests | | 10 |
| | 17 |
| | | 10 |
| | 10 |
| |
| Comprehensive income attributable to PNC | | $ | 672 |
|
| $ | 1,043 |
|
| | $ | 1,981 |
|
| $ | 672 |
| |
See accompanying Notes To Consolidated Financial Statements.
The PNC Financial Services Group, Inc. – Form 10-Q 4339
CONSOLIDATED BALANCE SHEET
THE PNC FINANCIAL SERVICES GROUP, INC.
| | | Unaudited | March 31
2018 |
| | December 31
2017 |
| March 31
2019 |
| | December 31
2018 |
|
| In millions, except par value |
| Assets | | | | | | |
| Cash and due from banks | $ | 4,649 |
| | $ | 5,249 |
| $ | 5,062 |
| | $ | 5,608 |
|
| Interest-earning deposits with banks | 28,821 |
| | 28,595 |
| 15,261 |
| | 10,893 |
|
| Loans held for sale (a) | 965 |
| | 2,655 |
| 686 |
| | 994 |
|
| Investment securities – available for sale | 56,018 |
| | 57,618 |
| 65,051 |
| | 63,389 |
|
| Investment securities – held to maturity | 18,544 |
| | 18,513 |
| 18,818 |
| | 19,312 |
|
| Loans (a) | 221,614 |
| | 220,458 |
| 232,293 |
| | 226,245 |
|
| Allowance for loan and lease losses | (2,604 | ) | | (2,611 | ) | (2,692 | ) | | (2,629 | ) |
| Net loans | 219,010 |
| | 217,847 |
| 229,601 |
| | 223,616 |
|
| Equity investments (b) | 12,008 |
| | 11,392 |
| 12,567 |
| | 12,894 |
|
| Mortgage servicing rights | 1,979 |
| | 1,832 |
| 1,812 |
| | 1,983 |
|
| Goodwill | 9,218 |
| | 9,173 |
| 9,218 |
| | 9,218 |
|
| Other (a) | 27,949 |
| | 27,894 |
| 34,761 |
| | 34,408 |
|
| Total assets | $ | 379,161 |
| | $ | 380,768 |
| $ | 392,837 |
| | $ | 382,315 |
|
| Liabilities | | | | | | |
| Deposits | | | | | | |
| Noninterest-bearing | $ | 78,303 |
| | $ | 79,864 |
| $ | 71,606 |
| | $ | 73,960 |
|
| Interest-bearing | 186,401 |
| | 185,189 |
| 199,615 |
| | 193,879 |
|
| Total deposits | 264,704 |
| | 265,053 |
| 271,221 |
| | 267,839 |
|
| Borrowed funds | | | | | | |
| Federal Home Loan Bank borrowings | 19,537 |
| | 21,037 |
| 20,501 |
| | 21,501 |
|
| Bank notes and senior debt | 28,773 |
| | 28,062 |
| 25,598 |
| | 25,018 |
|
| Subordinated debt | 5,121 |
| | 5,200 |
| 5,977 |
| | 5,895 |
|
| Other (c) | 4,608 |
| | 4,789 |
| 7,784 |
| | 5,005 |
|
| Total borrowed funds | 58,039 |
| | 59,088 |
| 59,860 |
| | 57,419 |
|
| Allowance for unfunded loan commitments and letters of credit | 290 |
| | 297 |
| 279 |
| | 285 |
|
| Accrued expenses and other liabilities | 9,093 |
| | 8,745 |
| 12,902 |
| | 9,002 |
|
| Total liabilities | 332,126 |
| | 333,183 |
| 344,262 |
| | 334,545 |
|
| Equity | | | | | | |
| Preferred stock (d) |
| | |
| | |
| Common stock ($5 par value, Authorized 800 shares, issued 542 shares) | 2,710 |
| | 2,710 |
| 2,711 |
| | 2,711 |
|
| Capital surplus | 16,227 |
| | 16,374 |
| 16,173 |
| | 16,277 |
|
| Retained earnings | 36,266 |
| | 35,481 |
| 39,742 |
| | 38,919 |
|
| Accumulated other comprehensive income (loss) | (699 | ) | | (148 | ) | (5 | ) | | (725 | ) |
| Common stock held in treasury at cost: 72 and 69 shares | (7,535 | ) | | (6,904 | ) | |
| Common stock held in treasury at cost: 90 and 85 shares | | (10,085 | ) | | (9,454 | ) |
| Total shareholders’ equity | 46,969 |
| | 47,513 |
| 48,536 |
| | 47,728 |
|
| Noncontrolling interests | 66 |
| | 72 |
| 39 |
| | 42 |
|
| Total equity | 47,035 |
| | 47,585 |
| 48,575 |
| | 47,770 |
|
| Total liabilities and equity | $ | 379,161 |
| | $ | 380,768 |
| $ | 392,837 |
| | $ | 382,315 |
|
| |
| (a) | Our consolidated assets included the following for which we have elected the fair value option: Loans held for sale of $.6 billion, Loans of $.8 billion and Other assets of $.1 billion at March 31, 2019 and Loans held for sale of $.9 billion, Loans of $.8 billion and Other assets of $.3 billion at March 31, 2018 and Loans held for sale of $1.7 billion, Loans of $.9 billion and Other assets of $.3$.2 billion at December 31, 2017.2018. |
| |
| (b) | Amounts include our equity interest in BlackRock. The amount at March 31, 2018 includes $.6 billion of trading and available for sale securities, primarily money market funds, that were reclassified to Equity investments on January 1, 2018 in accordance with the adoption of Accounting Standards Update 2016-01, Financial Instruments - Overall: Recognition and Measurement of Financial Assets and Financial Liabilities. |
| |
| (c) | Our consolidated liabilities at both March 31, 20182019 and December 31, 20172018 included Other borrowed funds of $.1 billion for which we have elected the fair value option. |
| |
| (d) | Par value less than $.5 million at each date. |
See accompanying Notes To Consolidated Financial Statements.
4440 The PNC Financial Services Group, Inc. – Form 10-Q
CONSOLIDATED STATEMENT OF CASH FLOWS
THE PNC FINANCIAL SERVICES GROUP, INC.
| | Unaudited In millions | | Three months ended
March 31 | | | Three months ended
March 31 | |
| 2018 |
| | 2017 |
| | 2019 |
| | 2018 |
| |
| Operating Activities | | | | | | | | | | |
| Net income | | $ | 1,239 |
| | $ | 1,074 |
| | | $ | 1,271 |
| | $ | 1,239 |
| |
| Adjustments to reconcile net income to net cash provided (used) by operating activities | | | | | | | | | | |
| Provision for credit losses | | 92 |
| | 88 |
| | | 189 |
| | 92 |
| |
| Depreciation and amortization | | 280 |
| | 279 |
| | | 272 |
| | 280 |
| |
| Deferred income taxes | | 81 |
| | 21 |
| | | 111 |
| | 81 |
| |
| Changes in fair value of mortgage servicing rights | | (85 | ) | | 33 |
| | | 210 |
| | (85 | ) | |
| Undistributed earnings of BlackRock | | (133 | ) | | (100 | ) | | | (111 | ) | | (133 | ) | |
| Net change in | | | | | | | | | | |
| Trading securities and other short-term investments | | 176 |
| | (405 | ) | | | 358 |
| | 176 |
| |
| Loans held for sale | | 1,675 |
| | 1,065 |
| | | 320 |
| | 1,675 |
| |
| Other assets | | (1,217 | ) | | 541 |
| | | (2,931 | ) | | (1,217 | ) | |
| Accrued expenses and other liabilities | | 710 |
| | (884 | ) | | | 1,796 |
| | 710 |
| |
| Other | | 104 |
| | (122 | ) | | | (84 | ) | | 104 |
| |
| Net cash provided (used) by operating activities | | $ | 2,922 |
| | $ | 1,590 |
| | | $ | 1,401 |
| | $ | 2,922 |
| |
| Investing Activities | | | | | | | | | | |
| Sales | | | | | | | | | | |
| Securities available for sale | | $ | 4,461 |
| | $ | 3,202 |
| | | $ | 840 |
| | $ | 4,461 |
| |
| Loans | | 479 |
| | 338 |
| | | 306 |
| | 479 |
| |
| Repayments/maturities | | | | | | | | | | |
| Securities available for sale | | 2,027 |
| | 2,790 |
| | | 2,103 |
| | 2,027 |
| |
| Securities held to maturity | | 598 |
| | 504 |
| | | 510 |
| | 598 |
| |
| Purchases | | | | | | | | | | |
| Securities available for sale | | (5,905 | ) | | (5,142 | ) | | | (3,861 | ) | | (5,905 | ) | |
| Securities held to maturity | | (662 | ) | | (1,778 | ) | | | (23 | ) | | (662 | ) | |
| Loans | | (224 | ) | | (177 | ) | | | (468 | ) | | (224 | ) | |
| Net change in | | | | | | | | | | |
| Federal funds sold and resale agreements | | 97 |
| | (674 | ) | | | 4,810 |
| | 97 |
| |
| Interest-earning deposits with banks | | (226 | ) | | (2,166 | ) | | | (4,368 | ) | | (226 | ) | |
| Loans | | (1,611 | ) | | (2,359 | ) | | | (6,085 | ) | | (1,611 | ) | |
| Other | | (284 | ) | | (158 | ) | | | 213 |
| | (284 | ) | |
| Net cash provided (used) by investing activities | | $ | (1,250 | ) | | $ | (5,620 | ) | | | $ | (6,023 | ) | | $ | (1,250 | ) | |
(continued on following page)
The PNC Financial Services Group, Inc. – Form 10-Q 4541
CONSOLIDATED STATEMENT OF CASH FLOWS
THE PNC FINANCIAL SERVICES GROUP, INC.
(continued from previous page)
| | Unaudited In millions | | Three Months Ended
March 31 | | | Three Months Ended
March 31 | |
| 2018 |
| | 2017 |
| | 2019 |
| | 2018 |
| |
| Financing Activities | | | | | | | | | | |
| Net change in | | | | | | | | | | |
| Noninterest-bearing deposits | | $ | (1,683 | ) | | $ | (944 | ) | | | $ | (2,337 | ) | | $ | (1,683 | ) | |
| Interest-bearing deposits | | 1,212 |
| | 4,530 |
| | | 5,736 |
| | 1,212 |
| |
| Federal funds purchased and repurchase agreements | | 87 |
| | 8 |
| | | 2,232 |
| | 87 |
| |
| Commercial paper | | (100 | ) | | | | | | | (100 | ) | |
| Other borrowed funds | | (11 | ) | | 795 |
| | | 250 |
| | (11 | ) | |
| Sales/issuances | | | | | | | | | | |
| Federal Home Loan Bank borrowings | |
|
| | 4,500 |
| | | 5,000 |
| |
|
| |
| Bank notes and senior debt | | 1,991 |
| | 1,820 |
| | | 2,147 |
| | 1,991 |
| |
| Other borrowed funds | | 123 |
| | 26 |
| | | 397 |
| | 123 |
| |
| Common and treasury stock | | 33 |
| | 60 |
| | | 22 |
| | 33 |
| |
| Repayments/maturities | | | | | | | | | | |
| Federal Home Loan Bank borrowings | | (1,500 | ) | | (2,500 | ) | | | (6,000 | ) | | (1,500 | ) | |
| Bank notes and senior debt | | (1,000 | ) | | (1,000 | ) | | | (1,750 | ) | | (1,000 | ) | |
| Subordinated debt | |
|
| | (1,100 | ) | | |
| Other borrowed funds | | (163 | ) | | (19 | ) | | | (296 | ) | | (163 | ) | |
| Redemption of noncontrolling interests | |
|
| | (1,000 | ) | | |
| Acquisition of treasury stock | | (840 | ) | | (688 | ) | | | (826 | ) | | (840 | ) | |
| Preferred stock cash dividends paid | | (63 | ) | | (63 | ) | | | (63 | ) | | (63 | ) | |
| Common stock cash dividends paid | | (358 | ) | | (271 | ) | | | (436 | ) | | (358 | ) | |
| Net cash provided (used) by financing activities | | (2,272 | ) | | 4,154 |
| | | $ | 4,076 |
| | $ | (2,272 | ) | |
| Net Increase (Decrease) In Cash And Due From Banks | | (600 | ) | | 124 |
| | | (546 | ) | | (600 | ) | |
| Cash and due from banks at beginning of period | | 5,249 |
| | 4,879 |
| | | 5,608 |
| | 5,249 |
| |
| Cash and due from banks at end of period | | $ | 4,649 |
| | $ | 5,003 |
| | | $ | 5,062 |
| | $ | 4,649 |
| |
| Supplemental Disclosures | | | | | | | | | | |
| Interest paid | | $ | 501 |
| | $ | 347 |
| | | $ | 907 |
| | $ | 501 |
| |
| Income taxes paid | | $ | 7 |
| | $ | 8 |
| | | $ | 30 |
| | $ | 7 |
| |
| Income taxes refunded | | $ | 11 |
| | $ | 9 |
| | | $ | 2 |
| | $ | 11 |
| |
| Leased assets obtained in exchange for new finance lease liabilities | | | $ | 25 |
| | | |
| Leased assets obtained in exchange for new operating lease liabilities | | | $ | 155 |
| | | |
| Right-of-use assets recognized at adoption of ASU 2016-02 | | | $ | 2,004 |
| | | |
| Non-cash Investing and Financing Items | | | | | | | | | | |
| Transfer from loans to loans held for sale, net | | $ | 173 |
| | $ | 107 |
| | | $ | 139 |
| | $ | 173 |
| |
| Transfer from loans to foreclosed assets | | $ | 45 |
| | $ | 57 |
| | | $ | 48 |
| | $ | 45 |
| |
See accompanying Notes To Consolidated Financial Statements.
4642 The PNC Financial Services Group, Inc. – Form 10-Q
NOTES TO CONSOLIDATED FINANCIAL STATEMENTS
THE PNC FINANCIAL SERVICES GROUP, INC.
Unaudited
BUSINESS
The PNC Financial Services Group, Inc. (PNC) is one of the largest diversified financial services companies in the United States and is headquartered in Pittsburgh, Pennsylvania.
We have businesses engaged in retail banking, including residential mortgage, corporate and institutional banking and asset management, providing many of our products and services nationally. Our primary geographicretail branch network is located in markets are located inacross the Mid-Atlantic, Midwest and Southeast. We also provide certain products and services internationally.
have strategic international offices in four countries outside the U.S.
NOTE 1 ACCOUNTING POLICIES
Basis of Financial Statement Presentation
Our consolidated financial statements include the accounts of the parent company and its subsidiaries, most of which are wholly-owned, certain partnership interests and variable interest entities.
We prepared these consolidated financial statements in accordance with accounting principles generally accepted in the United States of America (GAAP). We have eliminated intercompany accounts and transactions. We have also reclassified certain prior year amounts to conform to the current period presentation, which did not have a material impact on our consolidated financial condition or results of operations.
In our opinion, the unaudited interim consolidated financial statements reflect all normal, recurring adjustments needed to present fairly our results for the interim periods. The results of operations for interim periods are not necessarily indicative of the results that may be expected for the full year or any other interim period.
We have also considered the impact of subsequent events on these consolidated financial statements.
When preparing these unaudited interim consolidated financial statements, we have assumed that you have read the audited consolidated financial statements included in our 20172018 Form 10-K. Reference is made to Note 1 Accounting Policies in our 20172018 Form 10-K for a detailed description of significant accounting policies. There have been no significant changes to our accounting policies as disclosed in our 20172018 Form 10-K, except for those accounting policiesthe adoption of the new leasing standard included in this Note as a result of the adoption of new accounting standards that were effective1 in the first quarter of 2018.2019. These interim consolidated financial statements serve to update our 20172018 Form 10-K and may not include all information and Notes necessary to constitute a complete set of financial statements.
Use of Estimates
We prepared these consolidated financial statements using financial information available at the time of preparation, which requires us to make estimates and assumptions that affect the amounts reported. Our most significant estimates pertain to our fair value measurements and allowances for loan and lease losses and unfunded loan commitments and letters of credit. Actual results may differ from the estimates and the differences may be material to the consolidated financial statements.
Revenue RecognitionLeases
We earn interestprovide financing for various types of equipment, including aircraft, energy and power systems, and vehicles through a variety of lease arrangements. Direct financing leases are carried at the aggregate of lease payments plus estimated residual value of the leased equipment, less unearned income. We recognize income over the term of the lease using the constant effective yield method. Direct financing lease residual values are reviewed for impairment in accordance with the Allowance for Loan and Lease (ALLL) processes. Gains or losses on the sale of leased assets are included in Other noninterest income fromwhile impairment on the net investment of leases is included in Provision for credit losses.
We also enter into various sources, including:
Lending,
Securities portfolio,
Asset management,
Customer deposits,
Loan sales, loan securitizations,lease arrangements, primarily involving real estate, and servicing,
Brokerage services,
Saleother equipment, as the lessee. For those classified as operating leases, we recognize a lease liability, representing the present value of securities,
Certain private equity activities,the minimum lease payments, and
Securities, derivatives a corresponding right of use (ROU) asset. On the consolidated balance sheet, the ROU asset and foreign exchange activitieslease liability are included in Other assets and Other liabilities, respectively.
The PNC Financial Services Group, Inc. – Form 10-Q 4743
When we adopted the Accounting Standards Update (ASU) 2016-02 - Leases as of January 1, 2019, we recognized lease liabilities and right-of-use assets of $2.1 billion and $2.0 billion, respectively. In addition, we earn fees and commissions from:
Issuing loan commitments, standby lettersrecognized a one-time pretax adjustment of credit and financial guarantees,
Deposit account services,
Merchant services,
Selling various insurance products,
Providing treasury management services,
Providing merger and acquisition advisory and$83 million to retained earnings, related services
Debit and credit card transactions, and
Participating in certain capital marketsprimarily to deferred gains on previous sale-leaseback transactions.
Our Asset management noninterest income also includes our share of the earnings of BlackRock recognized under the equity method of accounting.
We record private equity income or loss based on changes in the valuation of the underlying investments or when we dispose of our interest.
We recognize gain/(loss) on changes in the fair value of certain financial instruments where we have elected the fair value option. These financial instruments include certain commercial and residential mortgage loans originated See Note 16 Leases for sale, certain residential mortgage portfolio loans, resale agreements and our investment in BlackRock Series C preferred stock. We also recognize gain/(loss) on changes in the fair value of residential and commercial mortgage servicing rights (MSRs).
We recognize revenue from servicing residential mortgages, commercial mortgages and other consumer loans as earned based on the specific contractual terms. These revenues are reported on the Consolidated Income Statement in the line items Residential mortgage, Corporate services and Consumer services. We recognize revenue from securities, derivatives and foreign exchange customer-related trading, as well as securities underwriting activities, as these transactions occur or as services are provided. We generally recognize gains from the sale of loans upon receipt of cash. Mortgage revenue recognized is reported net of mortgage repurchase reserves.
For the fee-based revenueadditional information related to leases within the scope of ASC Topic 606 - Revenue from Contracts with Customers (Topic 606), revenue is recognized when or as those services are transferred to the customer. See Note 15 Fee-based Revenue from Contracts with Customers for additional information related to revenue within the scope of Topic 606.842.
Equity Securities and Partnership Interests
We account for equity securities and equity investments other than BlackRock and private equity investments under one of the following methods:
Equity securities that have a readily determinable fair value are included in Equity investments on our Consolidated Balance Sheet. Both realized and unrealized gains and losses are included in Noninterest income. Dividend income on these equity securities is included in Other interest income on our consolidated income statement.
For investments in limited partnerships, limited liability companies and other investments that are not required to be consolidated, we use either the equity method of accounting or the practicability exception to fair value. We use the equity method for general and limited partner ownership interests and limited liability companies in which we are considered to have significant influence over the operations of the investee. Under the equity method, we record our equity ownership share of net income or loss of the investee in Noninterest income and any dividends received on equity method investments are recorded as a reduction to the investment balance. When an equity investment experiences an other-than-temporary decline in value, we may be required to record a loss on the investment.
We generally use the practicability exception to fair value for all other investments. When we elect this alternative measurement method, the carrying value is adjusted for impairment, if any, plus or minus changes in value resulting from observable price changes in orderly transactions for identical or similar instruments of the same issuer. These investments are written down to fair value if a qualitative assessment indicates impairment and the fair value is less than the carrying value. The amount of the write-down is accounted for as a loss included in Noninterest income. Distributions received on these investments are included in Noninterest income.
Investments described above are included in Equity investments on our Consolidated Balance Sheet.
See Note 1 Accounting Policies of our 2017 Form 10-K for a discussion on our accounting for our investment in BlackRock and private equity investments.
48 The PNC Financial Services Group, Inc. – Form 10-Q
Derivative Instruments and Hedging Activities
We use a variety of financial derivatives as part of our overall asset and liability risk management process to help manage exposure to interest rate, market and credit risk inherent in our business activities. Interest rate and total return swaps, swaptions, interest rate caps and floors, options, forwards, and futures contracts are the primary instruments we use for risk management. Financial derivatives involve, to varying degrees, interest rate, market and credit risk. We manage these risks as part of our asset and liability management process and through credit policies and procedures.
We recognize all derivative instruments at fair value as either Other assets or Other liabilities on the Consolidated Balance Sheet and the related cash flows in the Operating Activities section of the Consolidated Statement of Cash Flows. Adjustments for counterparty credit risk are included in the determination of fair value. The accounting for changes in the fair value of a derivative instrument depends on whether it has been designated and qualifies as part of a cash flow or net investment hedging relationship. For all other derivatives, changes in fair value are recognized in earnings.
We utilize a net presentation for derivative instruments on the Consolidated Balance Sheet taking into consideration the effects of legally enforceable master netting agreements. Cash collateral exchanged with counterparties is also netted against the applicable derivative exposures by offsetting obligations to return, or general rights to reclaim, cash collateral against the fair values of the net derivatives being collateralized.
For those derivative instruments that are designated and qualify as accounting hedges, we designate the hedging instrument, based on the exposure being hedged, as a fair value hedge, a cash flow hedge or a hedge of the net investment in a foreign operation.
We formally document the relationship between the hedging instruments and hedged items, as well as the risk management objective and strategy, before undertaking an accounting hedge. To qualify for hedge accounting, the derivatives and related hedged items must be designated as a hedge at inception of the hedge relationship. In addition, a derivative must be highly effective at reducing the risk associated with the exposure being hedged. For accounting hedge relationships, we formally assess, both at the inception of the hedge and on an ongoing basis, if the derivatives are highly effective in offsetting designated changes in the fair value or cash flows of the hedged item. If it is determined that the derivative instrument is not highly effective, hedge accounting is discontinued. We assess effectiveness using statistical regression analysis. Where the critical terms of the derivative and hedged item match, effectiveness may be assessed qualitatively.
For derivatives that are designated as fair value hedges (i.e., hedging the exposure to changes in the fair value of an asset or a liability attributable to a particular risk, such as changes in LIBOR), changes in the fair value of the hedging instrument are recognized in earnings and offset by also recognizing in earnings the changes in the fair value of the hedged item attributable to the hedged risk. To the extent the change in fair value of the derivative does not offset the change in fair value of the hedged item, the difference is reflected in the Consolidated Income Statement in the same income statement line as the hedged item.
For derivatives designated as cash flow hedges (i.e., hedging the exposure to variability in expected future cash flows), the gain or loss on derivatives is reported as a component of Accumulated other comprehensive income (loss) and subsequently reclassified to income in the same period or periods during which the hedged cash flows affect earnings and recorded in the same income statement line item as the hedged cash flows. For derivatives designated as a hedge of net investment in a foreign operation, the gain or loss on the derivatives are reported as a component of Accumulated other comprehensive income (loss).
We discontinue hedge accounting when it is determined that the derivative no longer qualifies as an effective hedge; the derivative expires or is sold, terminated or exercised; or the derivative is de-designated as a fair value or cash flow hedge or, for a cash flow hedge, it is no longer probable that the forecasted transaction will occur by the end of the originally specified time period.
We purchase or originate financial instruments that contain an embedded derivative. For financial instruments not measured at fair value with changes in fair value reported in earnings, we assess, at inception of the transaction, if the economic characteristics of the embedded derivative are clearly and closely related to the economic characteristics of the host contract and whether a separate instrument with the same terms as the embedded derivative would be a derivative. If the embedded derivative is not clearly and closely related to the host contract and meets the definition of a derivative, the embedded derivative is recorded separately from the host contract with changes in fair value recorded in earnings, unless we elect to account for the hybrid instrument at fair value.
We have elected, on an instrument-by-instrument basis, fair value measurement for certain financial instruments with embedded derivatives.
We enter into commitments to originate residential and commercial mortgage loans for sale. We also enter into commitments to purchase or sell commercial and residential real estate loans. These commitments are accounted for as free-standing derivatives which are recorded at fair value in Other assets or Other liabilities on the Consolidated Balance Sheet. Any gain or loss from the change in fair value after the inception of the commitment is recognized in Noninterest income.
The PNC Financial Services Group, Inc. – Form 10-Q49
Recently Adopted Accounting Standards |
| | |
Accounting Standards Update (ASU) | Description | Financial Statement Impact |
Revenue Recognition -
ASU 2014-09
ASU 2015-14
ASU 2016-08
ASU 2016-10
ASU 2016-12
ASU 2016-20
Issued May 2014
| • Replaces nearly all existing revenue recognition guidance in U.S. GAAP.
• Revenue recognized when an entity satisfies its performance obligation by transferring a promised good or service to a customer.
• Additional qualitative and quantitative disclosures relating to the nature, amount, timing and uncertainty of revenue and cash flows arising from contracts with customers.
| • Adopted January 1, 2018 under the modified retrospective approach.
• Cumulative-effect adjustment was immaterial to our consolidated results of operations and financial position.
• Most significant impact of adoption is expanded disclosures related to disaggregation of in-scope revenue, see Note 15 Fee-based Revenue from Contracts with Customers.
|
Financial Instruments -
ASU 2016-01
ASU 2018-03
Issued January 2016
| • Changes the accounting for certain equity investments, financial liabilities under the fair value option and presentation and disclosure requirements for financial instruments.
• Equity investments not accounted for under the equity method of accounting are required to be measured at fair value with any changes in fair value recognized in net income.
• For an equity investment which does not have a readily determinable fair value, an election can be made to measure the investment at cost, less any impairment, plus or minus changes in value resulting from observable price changes in identical or similar instruments of the issuer.
• Simplifies the impairment assessment of equity investments for which fair value is not readily determinable.
• Changes the presentation of certain fair value changes for financial liabilities measured at fair value and amends certain disclosure requirements relating to the fair value of financial instruments. In addition, separate presentation is required of financial assets and financial liabilities by measurement category and form of financial asset on the balance sheet or the notes to the financial statements.
| • Adopted January 1, 2018 under the modified retrospective approach, except for the amendment related to equity securities without readily determinable fair values, which is applied prospectively.
• Cumulative-effect adjustment was immaterial to our consolidated results of operations and financial position.
• For the standard’s requirement for a separate presentation of financial assets and financial liabilities by measurement category, refer to the disclosures in this Note 1, and Note 6 Fair Value and Note 1 Accounting Policies in our 2017 Form 10-K for further discussion of our measurement categories.
|
Statement of Cash Flows -
ASU 2016-15
Issued August 2016
| • Provides guidance on eight specific issues related to classification within the statement of cash flows with the objective of reducing existing diversity in practice.
• The specific issues cover:
• cash payments for debt prepayment or debt extinguishment costs;
• cash outflows for settlement of zero-coupon debt instruments or other debt instruments with coupon interest rates that are insignificant;
• contingent consideration payments that are not made soon after a business combination;
• proceeds from the settlement of insurance claims;
• proceeds from the settlement of corporate-owned life insurance policies, including bank-owned life insurance policies;
• distributions received from equity method investees;
• beneficial interests received in securitization transactions; and
• clarifies that when no specific GAAP guidance exists and the source of the cash flows are not separately identifiable, then the predominant source of cash flows should be used to determine the classification for the item.
| • Adopted January 1, 2018 under the retrospective transition method.
• Impact of adoption was immaterial to our consolidated statement of cash flows.
|
Compensation-Retirement Benefits - ASU 2017-07
Issued March 2017
| • Requires the service cost component of net periodic pension cost and net periodic postretirement benefit cost (net benefit cost) to be included in the same income statement line as other employee compensation cost arising from services rendered during the period.
• Other components of net benefit cost are required to be presented separately from the line item that includes the service cost component and outside a subtotal of income from operations, if one is presented.
• Allows only the service cost component to be eligible for capitalization when applicable.
| • Adopted January 1, 2018.
• Presentation requirements in our Consolidated Income Statement have been applied retrospectively.
• Impact of adoption was immaterial to our consolidated results of operations and financial position.
|
50 The PNC Financial Services Group, Inc. – Form 10-Q
|
| | |
| Accounting Standards Update (ASU) | Description
| Financial Statement Impact |
Derivatives and Hedging -
ASU 2017-12
Issued August 2017
| • Simplifies the application of hedge accounting by easing the requirements for effectiveness testing, hedge documentation and the application of the critical terms match method.
• Provides new alternatives for applying hedge accounting to additional hedging strategies and measuring the hedged item in fair value hedges of interest rate risk.
| • Adopted January 1, 2018 using the modified retrospective approach.
• Amended presentation and disclosures are required prospectively.
• One-time transition elections were available to modify existing hedge documentation.
• Cumulative-effect adjustment was immaterial to our consolidated results of operations and financial position.
|
Comprehensive Income -Leases
ASU 2018-022016-02
Issued February 20182016
| • PermitsRequires lessees to recognize a right-of-use asset and related lease liability for all leases with lease terms of more than 12 months. • Recognition, measurement and presentation of expenses and cash flows arising from a lease by a lessee will depend on its classification as a finance or operating lease. • Targeted changes have been made to the reclassificationlessor accounting model to align the guidance with the new lessee model and revenue recognition guidance. • May be adopted using a modified retrospective approach through a cumulative-effect adjustment. • Financial Accounting Standards Board (FASB) issued an ASU which permits the option to adopt the new standard prospectively as of the effective date, without adjusting comparative periods presented. Under this new transition method, an entity initially applies the new leases standard at the effective date and recognizes a cumulative-effect adjustment to the opening balance of retained earnings of the income tax effects stranded within Accumulated other comprehensive income (loss) (AOCI) as a result of the enactment of the Tax Cuts and Jobs Act. • Requires qualitative disclosures of the accounting policy relating to releasing income tax effects from AOCI and if the reclassification election is made, the impacts of the change on the financial statements.
| • Adopted January 1, 2018 and elected to reclassify the income tax effects from AOCI to Retained earnings at the beginning ofin the period of adoption.
| • We adopted this standard under the modified retrospective approach as of January 1, 2019, without adjusting comparative periods presented. We recognized lease liabilities and right-of-use assets of $2.1 billion and $2.0 billion respectively, as of January 1, 2019. We recognized a one-time pretax adjustment of $83 million to retained earnings, related primarily to deferred gains on previous sale-leaseback transactions. • The impact of adoption was immaterial to PNC’s consolidated income statement. • The impact of adoption of the changes to the lessor accounting model did not have a material impact on our consolidated financial position.statements.
|
NOTE 2 LOAN SALE AND SERVICING ACTIVITIES AND VARIABLE INTEREST ENTITIES
Loan Sale and Servicing Activities
As more fully described in Note 2 Loan Sale and Servicing Activities and Variable Interest Entities in our 20172018 Form 10-K, we have transferred residential and commercial mortgage loans in securitization or sales transactions in which we have continuing involvement. Our continuing involvement generally consists of servicing, repurchasing previously transferred loans under certain conditions and loss share arrangements, and, in limited circumstances, holding of mortgage-backed securities issued by the securitization special purpose entities (SPEs).
We earn servicing and other ancillary fees for our role as servicer and, depending on the contractual terms of the servicing arrangement, we can be terminated as servicer with or without cause. At the consummation date of each type of loan transfer where we retain the servicing, we recognize a servicing right at fair value. See Note 6 Fair Value and Note 7 Goodwill and Mortgage Servicing Rights for information on our servicing rights, including the carrying value of servicing assets.
44 The PNC Financial Services Group, Inc. – Form 10-Q
The following table provides cash flows associated with our loan sale and servicing activities.activities:
Table 35:33: Cash Flows Associated with Loan Sale and Servicing Activities
| | | In millions | Residential
Mortgages |
| | Commercial
Mortgages (a) | | | Residential
Mortgages |
| | Commercial
Mortgages (a) | | |
| Cash Flows - Three months ended March 31, 2019 | | | | | | |
| Sales of loans (b) | | $ | 715 |
| | | $ | 644 |
| |
| Repurchases of previously transferred loans (c) | | $ | 93 |
| | |
|
| |
| Servicing fees (d) | | $ | 87 |
| | | $ | 30 |
| |
| Servicing advances recovered/(funded), net | | $ | 18 |
| | | $ | (23 | ) | |
| Cash flows on mortgage-backed securities held (e) | | $ | 507 |
| | | $ | 14 |
| |
| Cash Flows - Three months ended March 31, 2018 | | | | | | | | | | |
| Sales of loans (b) | $ | 1,193 |
| | | $ | 1,202 |
| | $ | 1,193 |
| | | $ | 1,202 |
| |
| Repurchases of previously transferred loans (c) | $ | 119 |
| | |
|
| | $ | 119 |
| | |
|
| |
| Servicing fees (d) | $ | 92 |
| | | $ | 31 |
| | $ | 92 |
| | | $ | 31 |
| |
| Servicing advances recovered/(funded), net | $ | 4 |
| | | $ | 17 |
| | $ | 4 |
| | | $ | 17 |
| |
| Cash flows on mortgage-backed securities held (e) | $ | 422 |
| | | $ | 21 |
| | $ | 422 |
| | | $ | 21 |
| |
| Cash Flows - Three months ended March 31, 2017 | | | | | | |
| Sales of loans (b) | $ | 1,594 |
| | | $ | 1,617 |
| | |
| Repurchases of previously transferred loans (c) | $ | 131 |
| | |
|
| | |
| Servicing fees (d) | $ | 94 |
| | | $ | 33 |
| | |
| Servicing advances recovered/(funded), net | $ | 42 |
| | | $ | 31 |
| | |
| Cash flows on mortgage-backed securities held (e) | $ | 349 |
| | | $ | 129 |
| | |
| |
| (a) | Represents cash flow information associated with both commercial mortgage loan transfertransfers and servicing activities. |
| |
| (b) | Gains/losses recognized on sales of loans were insignificant for the periods presented. |
| |
| (c) | Includes both residential and commercial mortgage government insured or guaranteed loans eligible for repurchase through the exercise of our removal of account provision option, andas well as residential mortgage loans repurchased due to alleged breaches of origination covenants or representations and warranties made to purchasers. |
| |
| (d) | Includes contractually specified servicing fees, late charges and ancillary fees. |
| |
| (e) | Represents cash flows on securities where we hold issued bytransferred to and/or service loans for a securitization SPE in whichand we transferred to and services loans.hold securities issued by that SPE. The carrying values of such securities held were $14.6 billion, $13.3 billion, and $9.4 billion in residential mortgage-backed securities and $.6 billion, $.6 billion, and $.7 billion in commercial mortgage-backed securities at March 31, 2019, December 31, 2018, and $6.9 billion in residential mortgage-backed securities and $.7 billion in commercial mortgage-backed securities at March 31, 2017. Additionally, at December 31, 2017, the carrying values of such securities held were $8.8 billion in residential mortgage-backed securities and $.6 billion in commercial mortgage-backed securities.2018, respectively. |
The PNC Financial Services Group, Inc. – Form 10-Q51
Table 3634 presents information about the principal balances of transferred loans that we service and are not recorded on our Consolidated Balance Sheet. We would only experience a loss on these transferred loans if we were required to repurchase a loan, where the repurchase price exceeded the loan's fair value, due to a breach in representations and warranties or a loss sharing arrangement associated with our continuing involvement with these loans. The estimate of losses related to breaches in representations and warranties was insignificant at March 31, 2018.2019.
Table 36:34: Principal Balance, Delinquent Loans and Net Charge-offs Related to Serviced Loans For Others
| | | In millions | Residential
Mortgages |
| | | Commercial
Mortgages (a) |
| | Residential Mortgages |
| | | Commercial Mortgages (a) |
| |
| March 31, 2018 | | | | | | |
| March 31, 2019 | | | | | | |
| Total principal balance | $ | 57,339 |
| | | $ | 47,480 |
| | $ | 53,055 |
| | | $ | 46,767 |
| |
| Delinquent loans (b) | $ | 796 |
| | | $ | 298 |
| | $ | 599 |
| | | $ | 131 |
| |
| December 31, 2017 | | | | | | |
| December 31, 2018 | | | | | | |
| Total principal balance | $ | 58,320 |
| | | $ | 49,116 |
| | $ | 54,028 |
| | | $ | 47,969 |
| |
| Delinquent loans (b) | $ | 899 |
| | | $ | 355 |
| | $ | 622 |
| | | $ | 234 |
| |
| Three months ended March 31, 2019 | | | | | | |
| Net charge-offs (c) | | $ | 11 |
| | | $ | 119 |
| |
| Three months ended March 31, 2018 | | | | | | | | | | |
| Net charge-offs (c) | $ | 12 |
| | | $ | 30 |
| | $ | 12 |
| | | $ | 30 |
| |
| Three months ended March 31, 2017 | | | | | | |
| Net charge-offs (c) | $ | 25 |
| | | $ | 355 |
| | |
| |
| (a) | Represents information at the securitization level in which we have sold loans and we are the servicer for the securitization. |
| |
| (b) | Serviced delinquent loans are 90 days or more past due or are in process of foreclosure. |
| |
| (c) | Net charge-offs for Residential mortgages represent credit losses less recoveries distributed and as reported to investors during the period. Net charge-offs for Commercial mortgages represent credit losses less recoveries distributed and as reported by the trustee for commercial mortgage backed securitizations. Realized losses for Agency securitizations are not reflected as we do not manage the underlying real estate upon foreclosure and, as such, do not have access to loss information. |
Variable Interest Entities (VIEs)
As discussed in Note 2 Loan Sale and Servicing Activities and Variable Interest Entities in our 20172018 Form 10-K, we are involved with various entities in the normal course of business that are deemed to be VIEs.
The following table provides a summary of non-consolidated VIEs with which we have significant continuing involvement but are not the primary beneficiary. We have excluded certain transactions with non-consolidated VIEs from the balances presented in Table 35 where we have determined that our continuing involvement is not significant. We do not consider our continuing involvement to be significant when it relates to a VIE where we only invest in securities issued by the VIE and were not involved in the design of the VIE or where no transfers have occurred between us and the VIE. We have excluded certain transactions with non-consolidated VIEs from the balances presented in Table 37 where we have determined that our continuing involvement is not significant. In addition, where we only have lending arrangements in the normal
The PNC Financial Services Group, Inc. – Form 10-Q45
course of business with entities that could be VIEs, we have excluded these transactions with non-consolidated entities from the balances presented in Table 37.35. These loans are included as part of the asset quality disclosures that we make in Note 3 Asset Quality.
Table 37:35: Non-Consolidated VIEs
|
| | | | | | | | | | | | | | | |
| In millions | PNC Risk of Loss (a) |
| | | Carrying Value of Assets
Owned by PNC |
| | | | Carrying Value of Liabilities
Owned by PNC |
| |
| March 31, 2018 | | | | | | | | | |
| Mortgage-Backed Securitizations (b) | $ | 10,481 |
| | | $ | 10,481 |
| (c) | | | | |
| Tax Credit Investments and Other | 3,033 |
| | | 2,979 |
| (d) | | | $ | 799 |
| (e) |
| Total | $ | 13,514 |
| | | $ | 13,460 |
| | | | $ | 799 |
| |
| December 31, 2017 | | | | | | | | | |
| Mortgage-Backed Securitizations (b) | $ | 9,738 |
| | | $ | 9,738 |
| (c) | | | | |
| Tax Credit Investments and Other | 3,069 |
| | | 3,001 |
| (d) | | | $ | 858 |
| (e) |
| Total | $ | 12,807 |
| | | $ | 12,739 |
| | | | $ | 858 |
| |
|
| | | | | | | | | | | | | | | |
| In millions | PNC Risk of Loss (a) |
| | | Carrying Value of Assets
Owned by PNC |
| | | | Carrying Value of Liabilities
Owned by PNC |
| |
| March 31, 2019 | | | | | | | | | |
| Mortgage-backed securitizations (b) | $ | 15,551 |
| | | $ | 15,551 |
| (c) | | | | |
| Tax credit investments and other | 2,854 |
| | | 2,826 |
| (d) | | | $ | 763 |
| (e) |
| Total | $ | 18,405 |
| | | $ | 18,377 |
| | | | $ | 763 |
| |
| December 31, 2018 | | | | | | | | | |
| Mortgage-backed securitizations (b) | $ | 14,266 |
| | | $ | 14,266 |
| (c) | | |
| |
| Tax credit investments and other | 2,949 |
| | | 2,911 |
| (d) | | | $ | 806 |
| (e) |
| Total | $ | 17,215 |
| | | $ | 17,177 |
| | | | $ | 806 |
| |
| |
| (a) | This representsRepresents loans, investments and other assets related to non-consolidated VIEs, net of collateral (if applicable). The risk of loss excludes any potential tax recapture associated with tax creditcredits investments. |
| |
| (b) | Amounts reflect involvement with securitization SPEs where we transferred to and/or service loans for an SPE and we hold securities issued by that SPE. Values disclosed in the PNC Risk of Loss column represent our maximum exposure to loss for those securities’ holdings. |
| |
| (c) | Included in Investment securities, Mortgage servicing rights and Other assets on our Consolidated Balance Sheet. |
| |
| (d) | Included in Investment securities, Loans, Equity investments and Other assets on our Consolidated Balance Sheet. |
| |
| (e) | Included in Deposits and Other liabilities on our Consolidated Balance Sheet. |
52 The PNC Financial Services Group, Inc. – Form 10-Q
We make certain equity investments in various tax credit limited partnerships or limited liability companies (LLCs). The purpose of these investments is to achieve a satisfactory return on capital and to assist us in achieving goals associated with the Community Reinvestment Act. During the three months ended March 31, 2018,2019, we recognized $56$55 million of amortization, $60$57 million of tax credits and $13 million of other tax benefits associated with qualified investments in low income housing tax credits within Income taxes.
NOTE 3 ASSET QUALITY
We closely monitor economic conditions and loan performance trends to manage and evaluate our exposure to credit risk. Trends in delinquency rates may be a key indicator, among other considerations, of credit risk within the loan portfolios. The measurement of delinquency status is based on the contractual terms of each loan. Loans that are 30 days or more past due in terms of payment are considered delinquent.
Nonperforming assets include nonperforming loans and leases, OREO foreclosed and otherforeclosed assets. Nonperforming loans are those loans accounted for at amortized cost whose credit quality has deteriorated to the extent that full collection of contractual principal and interest is not probable. Interest income is not recognized on these loans. Loans accounted for under the fair value option are reported as performing loans as these loans are accounted for at fair value. However, when nonaccrual criteria is met, interest income is not recognized on these loans. Additionally, certain government insured or guaranteed loans for which we expect to collect substantially all principal and interest are not reported as nonperforming loans and continue to accrue interest. Purchased impaired loans are excluded from nonperforming loans as we are currently accreting interest income over the expected life of the loans.
See Note 1 Accounting Policies in our 20172018 Form 10-K for additional information on our loan related policies.
46The PNC Financial Services Group, Inc. – Form 10-Q53
The following tables displaypresent the delinquency status of our loans and our nonperforming assets at March 31, 20182019 and December 31, 2017,2018, respectively.
Table 38:36: Analysis of Loan Portfolio (a)
| | | | Accruing | | | | Accruing | | | |
| Dollars in millions | Current or Less Than 30 Days Past Due |
| 30-59 Days Past Due |
| 60-89 Days Past Due |
| 90 Days Or More Past Due |
| Total Past Due (b) |
| | Nonperforming Loans |
| Fair Value Option Nonaccrual Loans (c) |
| Purchased Impaired Loans |
| Total Loans (d) |
| | Current or Less Than 30 Days Past Due |
| 30-59 Days Past Due |
| 60-89 Days Past Due |
| 90 Days Or More Past Due |
| Total Past Due (b) |
| | Nonperforming Loans |
| Fair Value Option Nonaccrual Loans (c) |
| Purchased Impaired Loans |
| Total Loans (d) |
| |
| March 31, 2018 | | | | | | |
| March 31, 2019 | | | | | | |
| Commercial Lending | | | | | | | | | | |
| Commercial | $ | 111,754 |
| $ | 53 |
| $ | 22 |
| $ | 53 |
| $ | 128 |
| | $ | 426 |
| | $ | 112,308 |
| | $ | 122,448 |
| $ | 80 |
| $ | 25 |
| $ | 71 |
| $ | 176 |
| | $ | 369 |
| | $ | 122,993 |
| |
| Commercial real estate | 28,695 |
| 21 |
| 12 |
|
|
| 33 |
| | 107 |
| | 28,835 |
| | 28,003 |
| 43 |
| 1 |
| | 44 |
| | 54 |
| | 28,101 |
| |
| Equipment lease financing | 7,779 |
| 18 |
| 1 |
| | 19 |
| | 4 |
| | | 7,802 |
| | 7,252 |
| 84 |
| 5 |
| | 89 |
| | 7 |
| | | 7,348 |
| |
| Total commercial lending | 148,228 |
| 92 |
| 35 |
| 53 |
| 180 |
| | 537 |
| |
|
| 148,945 |
| | 157,703 |
| 207 |
| 31 |
| 71 |
| 309 |
| | 430 |
| |
|
| 158,442 |
| |
| Consumer Lending | | | | | |
| | | | | |
| Home equity | 25,919 |
| 94 |
| 31 |
| | 125 |
| | 820 |
| | $ | 835 |
| 27,699 |
| | 24,011 |
| 59 |
| 21 |
|
| 80 |
| | 763 |
| | $ | 646 |
| 25,500 |
| |
| Residential real estate | 14,824 |
| 130 |
| 70 |
| 373 |
| 573 |
| (b) | 391 |
| $ | 189 |
| 1,479 |
| 17,456 |
| | 16,743 |
| 153 |
| 62 |
| 323 |
| 538 |
| (b) | 339 |
| $ | 184 |
| 1,303 |
| 19,107 |
| |
| Automobile | | 14,467 |
| 97 |
| 26 |
| 10 |
| 133 |
| | 107 |
| | 14,707 |
| |
| Credit card | 5,540 |
| 40 |
| 26 |
| 45 |
| 111 |
| | 6 |
| | 5,657 |
| | 6,134 |
| 45 |
| 28 |
| 53 |
| 126 |
| | 7 |
| | 6,267 |
| |
| Education | | 3,480 |
| 63 |
| 38 |
| 126 |
| 227 |
| (b) | | | 3,707 |
| |
| Other consumer | | | | | | 4,533 |
| 10 |
| 6 |
| 7 |
| 23 |
| | 7 |
| | 4,563 |
| |
| Automobile | 13,112 |
| 77 |
| 18 |
| 9 |
| 104 |
| | 79 |
| | 13,295 |
| | |
| Education and other | 8,257 |
| 94 |
| 54 |
| 148 |
| 296 |
| (b) | 9 |
| | | 8,562 |
| | |
| Total consumer lending | 67,652 |
| 435 |
| 199 |
| 575 |
| 1,209 |
| | 1,305 |
| 189 |
| 2,314 |
| 72,669 |
| | 69,368 |
| 427 |
| 181 |
| 519 |
| 1,127 |
| | 1,223 |
| 184 |
| 1,949 |
| 73,851 |
| |
| Total | $ | 215,880 |
| $ | 527 |
| $ | 234 |
| $ | 628 |
| $ | 1,389 |
| | $ | 1,842 |
| $ | 189 |
| $ | 2,314 |
| $ | 221,614 |
| | $ | 227,071 |
| $ | 634 |
| $ | 212 |
| $ | 590 |
| $ | 1,436 |
| | $ | 1,653 |
| $ | 184 |
| $ | 1,949 |
| $ | 232,293 |
| |
| Percentage of total loans | 97.41 | % | .24 | % | .11 | % | .28 | % | .63 | % | | .83 | % | .09 | % | 1.04 | % | 100.00 | % | | 97.75 | % | .27 | % | .09 | % | .25 | % | .62 | % | | .71 | % | .08 | % | .84 | % | 100.00 | % | |
| December 31, 2017 | | | | | | |
| December 31, 2018 | | | | | | |
| Commercial Lending | | | | | | | | | | |
| Commercial | $ | 109,989 |
| $ | 45 |
| $ | 25 |
| $ | 39 |
| $ | 109 |
| | $ | 429 |
| |
|
| $ | 110,527 |
| | $ | 116,300 |
| $ | 82 |
| $ | 54 |
| $ | 52 |
| $ | 188 |
| | $ | 346 |
| | $ | 116,834 |
| |
| Commercial real estate | 28,826 |
| 27 |
| 2 |
| | 29 |
| | 123 |
| |
|
| 28,978 |
| | 28,056 |
| 6 |
| 3 |
| | 9 |
| | 75 |
| | 28,140 |
| |
| Equipment lease financing | 7,914 |
| 17 |
| 1 |
| | 18 |
| | 2 |
| | 7,934 |
| | 7,229 |
| 56 |
| 12 |
| | 68 |
| | 11 |
| | 7,308 |
| |
| Total commercial lending | 146,729 |
| 89 |
| 28 |
| 39 |
| 156 |
| | 554 |
| | | 147,439 |
| | 151,585 |
| 144 |
| 69 |
| 52 |
| 265 |
| | 432 |
| | | 152,282 |
| |
| Consumer Lending | | | | | | | | | | | | | |
| Home equity | 26,561 |
| 78 |
| 26 |
| | 104 |
| | 818 |
| | $ | 881 |
| 28,364 |
| | 24,556 |
| 66 |
| 25 |
|
|
| 91 |
| | 797 |
| | $ | 679 |
| 26,123 |
| |
| Residential real estate | 14,389 |
| 151 |
| 74 |
| 486 |
| 711 |
| (b) | 400 |
| $ | 197 |
| 1,515 |
| 17,212 |
| | 16,216 |
| 135 |
| 73 |
| 363 |
| 571 |
| (b) | 350 |
| $ | 182 |
| 1,338 |
| 18,657 |
| |
| Automobile | | 14,165 |
| 113 |
| 29 |
| 12 |
| 154 |
| | 100 |
| | 14,419 |
| |
| Credit card | 5,579 |
| 43 |
| 26 |
| 45 |
| 114 |
| | 6 |
| | 5,699 |
| | 6,222 |
| 46 |
| 29 |
| 53 |
| 128 |
| | 7 |
| | 6,357 |
| |
| Education | | 3,571 |
| 69 |
| 41 |
| 141 |
| 251 |
| (b) |
|
| | 3,822 |
| |
| Other consumer | | | | | | 4,552 |
| 12 |
| 5 |
| 8 |
| 25 |
| | 8 |
| | 4,585 |
| |
| Automobile | 12,697 |
| 79 |
| 20 |
| 8 |
| 107 |
| | 76 |
| | 12,880 |
| | |
| Education and other | 8,525 |
| 105 |
| 64 |
| 159 |
| 328 |
| (b) | 11 |
| | 8,864 |
| | |
| Total consumer lending | 67,751 |
| 456 |
| 210 |
| 698 |
| 1,364 |
| | 1,311 |
| 197 |
| 2,396 |
| 73,019 |
| | 69,282 |
| 441 |
| 202 |
| 577 |
| 1,220 |
| | 1,262 |
| 182 |
| 2,017 |
| 73,963 |
| |
| Total | $ | 214,480 |
| $ | 545 |
| $ | 238 |
| $ | 737 |
| $ | 1,520 |
| | $ | 1,865 |
| $ | 197 |
| $ | 2,396 |
| $ | 220,458 |
| | $ | 220,867 |
| $ | 585 |
| $ | 271 |
| $ | 629 |
| $ | 1,485 |
| | $ | 1,694 |
| $ | 182 |
| $ | 2,017 |
| $ | 226,245 |
| |
| Percentage of total loans | 97.29 | % | .25 | % | .11 | % | .33 | % | .69 | % | | .85 | % | .09 | % | 1.08 | % | 100.00 | % | | 97.62 | % | .26 | % | .12 | % | .28 | % | .66 | % | | .75 | % | .08 | % | .89 | % | 100.00 | % | |
| |
| (a) | Amounts in table represent recorded investment and exclude loans held for sale. Recorded investment in a loan includes the unpaid principal balance plus net accounting adjustments, less any charge-offs. Recorded investment does not include any associated valuation allowance. |
| |
| (b) | Past due loan amounts exclude purchased impaired loans, even if contractually past due (or if we do not expect to receive payment in full based on the original contractual terms), as we are currently accreting interest income over the expected life of the loans. Past due loan amounts include government insured or guaranteed Residential real estate mortgages totaling $.5$.4 billion and $.6$.5 billion at March 31, 20182019 and December 31, 2017,2018, respectively, and Education and other consumer loans totaling $.3$.2 billion at both March 31, 20182019 and December 31, 2017.2018. |
| |
| (c) | Consumer loans accounted for under the fair value option for which we do not expect to collect substantially all principal and interest are subject to nonaccrual accounting and classification upon meeting any of our nonaccrual policies. Given that these loans are not accounted for at amortized cost, these loans have been excluded from the nonperforming loan population. |
| |
| (d) | Net of unearned income, net deferred loan fees, unamortized discounts and premiums, and purchase discounts and premiums totaling $1.2 billion at both March 31, 2018 and2019 December 31, 2017.2018. |
54 The PNC Financial Services Group, Inc. – Form 10-Q
At March 31, 2018,2019, we pledged $19.1$16.9 billion of commercial loans to the Federal Reserve Bank (FRB) and $64.6$64.5 billion of residential real estate and other loans to the Federal Home Loan Bank (FHLB) as collateral for the ability to borrow, if necessary. The comparable amounts at December 31, 20172018 were $18.7$17.3 billion and $62.8$63.2 billion, respectively. Amounts pledged reflect the unpaid principal balances.
The PNC Financial Services Group, Inc. – Form 10-Q47
Table 39:37: Nonperforming Assets
| | | Dollars in millions | | March 31
2018 |
| | December 31
2017 |
| | | March 31
2019 |
| | December 31
2018 |
| |
| Nonperforming loans | | | | | | | | | | |
| Total commercial lending | | $ | 537 |
| | $ | 554 |
| | | $ | 430 |
| | $ | 432 |
| |
| Total consumer lending (a) | | 1,305 |
| | 1,311 |
| | | 1,223 |
| | 1,262 |
| |
| Total nonperforming loans | | 1,842 |
| | 1,865 |
| | | 1,653 |
| | 1,694 |
| |
| OREO, foreclosed and other assets | | 162 |
| | 170 |
| | |
| OREO and foreclosed assets | | | 132 |
| | 114 |
| |
| Total nonperforming assets | | $ | 2,004 |
| | $ | 2,035 |
| | | $ | 1,785 |
| | $ | 1,808 |
| |
| Nonperforming loans to total loans | | .83 | % | | .85 | % | | | .71 | % | | .75 | % | |
| Nonperforming assets to total loans, OREO, foreclosed and other assets | | .90 | % | | .92 | % | | |
| Nonperforming assets to total loans, OREO and foreclosed assets | | | .77 | % | | .80 | % | |
| Nonperforming assets to total assets | | .53 | % | | .53 | % | | | .45 | % | | .47 | % | |
| |
| (a) | Excludes most consumer loans and lines of credit not secured by residential real estate, which are charged off after 120 to 180 days past due and are not placed on nonperforming status. |
Nonperforming loans also include certain loans whose terms have been restructured in a manner that grants a concession to a borrower experiencing financial difficulties. In accordance with applicable accounting guidance, these loans are considered troubled debt restructurings (TDRs). See Note 1 Accounting Policies in our 20172018 Form 10-K and the TDR section of this Note 3.3 for additional information on TDRs.
Total nonperforming loans in Table 3937 include TDRs of $.9 billion at both March 31, 20182019 and $1.0 billion at December 31, 2017.2018. TDRs that are performing, including consumer credit card TDR loans, totaled $1.1$1.0 billion at both March 31, 20182019 and December 31, 2017,2018, and are excluded from nonperforming loans. Nonperforming TDRs are returned to accrual status and classified as performing after demonstrating a period of at least six months of consecutive performance under the restructured terms. Loans where borrowers have been discharged from personal liability through Chapter 7 bankruptcy and have not formally reaffirmed their loan obligations to us and loans to borrowers not currently obligated to make both principal and interest payments under the restructured terms are not returned to accrual status. See the TDRs section of this Note 3 for more information on TDRs.
Additional Asset Quality Indicators
We have two overall portfolio segments – Commercial Lending and Consumer Lending. Each of these two segments comprises multiple loan classes. Classes are characterized by similarities in initial measurement, risk attributes and the manner in which we monitor and assess credit risk. The Commercial Lending segment is composed of the commercial, commercial real estate and equipment lease financing loan classes. The Consumer Lending segment is composed of the home equity, residential real estate, automobile, credit card, education and other consumer loan classes.
Commercial Lending Loan Classes
The following table presents asset quality indicators for the Commercial Lending loan classes. See Note 3 Asset Quality in our 20172018 Form 10-K for additional information related to our Commercial Lending loan classes, including discussion around the asset quality indicators that we use to monitor and manage the credit risk associated with each loan class.
The PNC Financial Services Group, Inc. – Form 10-Q55
Table 40:38: Commercial Lending Asset Quality Indicators (a)
| | | | | | | Criticized Commercial Loans | | | | | | | | | | |
| In millions | | Pass Rated |
| | Special Mention (b) |
| | Substandard (c) |
| | Doubtful (d) |
| | Total Loans |
| | | Pass Rated |
| | Criticized |
| | Total Loans |
| |
| March 31, 2018 | | | | | | | | | | | | |
| March 31, 2019 | | | | | | | | |
| Commercial | | $ | 106,681 |
| | $ | 2,075 |
| | $ | 3,449 |
| | $ | 103 |
| | $ | 112,308 |
| | | $ | 117,366 |
| | $ | 5,627 |
| | $ | 122,993 |
| |
| Commercial real estate | | 28,274 |
| | 163 |
| | 397 |
| | 1 |
| | 28,835 |
| | | 27,251 |
| | 850 |
| | 28,101 |
| |
| Equipment lease financing | | 7,606 |
| | 91 |
| | 102 |
| | 3 |
| | 7,802 |
| | | 7,206 |
| | 142 |
| | 7,348 |
| |
| Total commercial lending | | $ | 142,561 |
| | $ | 2,329 |
| | $ | 3,948 |
| | $ | 107 |
| | $ | 148,945 |
| | | $ | 151,823 |
| | $ | 6,619 |
| | $ | 158,442 |
| |
| December 31, 2017 | | | | | | | | | | | | |
| December 31, 2018 | | | | | | | | |
| Commercial | | $ | 105,280 |
| | $ | 1,858 |
| | $ | 3,331 |
| | $ | 58 |
| | $ | 110,527 |
| | | $ | 111,276 |
| | $ | 5,558 |
| | $ | 116,834 |
| |
| Commercial real estate | | 28,380 |
| | 148 |
| | 435 |
| | 15 |
| | 28,978 |
| | | 27,682 |
| | 458 |
| | 28,140 |
| |
| Equipment lease financing | | 7,754 |
| | 77 |
| | 102 |
| | 1 |
| | 7,934 |
| | | 7,180 |
| | 128 |
| | 7,308 |
| |
| Total commercial lending | | $ | 141,414 |
| | $ | 2,083 |
| | $ | 3,868 |
| | $ | 74 |
| | $ | 147,439 |
| | | $ | 146,138 |
| | $ | 6,144 |
| | $ | 152,282 |
| |
| |
| (a) | Loans are classified as “Pass”, “Special Mention”, “Substandard”Pass and “Doubtful”Criticized based on the Regulatory Classification definitions. The Criticized classification includes loans that were rated Special Mention, Substandard or Doubtful as of March 31, 2019 and December 31, 2018. We use PDsprobability of default and LGDsloss given default to rate loans in the commercial loans.lending portfolio. |
| |
(b) | Special Mention rated loans have a potential weakness that deserves management’s close attention. If left uncorrected, these potential weaknesses may result in deterioration of repayment prospects at some future date. These loans do not expose us to sufficient risk to warrant a more adverse classification at the reporting date. |
| |
(c) | Substandard rated loans have a well-defined weakness or weaknesses that jeopardize the collection or liquidation of debt. They are characterized by the distinct possibility that we will sustain some loss if the deficiencies are not corrected. |
| |
(d) | Doubtful rated loans possess all the inherent weaknesses of a Substandard rated loan with the additional characteristics that the weakness makes collection or liquidation in full improbable due to existing facts, conditions and values. |
48 The PNC Financial Services Group, Inc. – Form 10-Q
Consumer Lending Loan Classes
See Note 3 Asset Quality in our 20172018 Form 10-K for additional information related to our Consumer Lending loan classes, including discussion around the asset quality indicators that we use to monitor and manage the credit risk associated with each loan class.
Home Equity and Residential Real Estate Loan Classes
The following table presents asset quality indicators for the home equity and residential real estate loan classes, excluding consumer purchased impaired loans of $2.3 billion and $2.4 billion at March 31, 2018 and December 31, 2017, respectively, and government insured or guaranteed residential real estate mortgages of $.7 billion and $.8 billion at March 31, 2018 and December 31, 2017, respectively.classes.
56 The PNC Financial Services Group, Inc. – Form 10-Q
Table 41:39: Asset Quality Indicators for Home Equity and Residential Real Estate Loans – Excluding Purchased Impaired and Government Insured or Guaranteed Loans (a)
|
| | | | | | | | | | | | | | | | | |
| | | Home Equity | | Residential Real Estate |
| | Total |
| |
| March 31, 2018 - in millions | | 1st Liens |
| | 2nd Liens |
| | |
| Current estimated LTV ratios | | | | | | | | | |
| Greater than or equal to 125% and updated FICO scores: | | | | | | | | | |
| Greater than 660 | | $ | 99 |
| | $ | 359 |
| | $ | 123 |
| | $ | 581 |
| |
| Less than or equal to 660 (b) | | 16 |
| | 58 |
| | 24 |
| | 98 |
| |
| Missing FICO | | 1 |
| | 4 |
| | 1 |
| | 6 |
| |
| Greater than or equal to 100% to less than 125% and updated FICO scores: | | | | | | | | | |
| Greater than 660 | | 277 |
| | 794 |
| | 249 |
| | 1,320 |
| |
| Less than or equal to 660 (b) | | 45 |
| | 133 |
| | 49 |
| | 227 |
| |
| Missing FICO | | 1 |
| | 8 |
| | 5 |
| | 14 |
| |
| Greater than or equal to 90% to less than 100% and updated FICO scores: | | | | | | | | | |
| Greater than 660 | | 333 |
| | 853 |
| | 300 |
| | 1,486 |
| |
| Less than or equal to 660 | | 51 |
| | 132 |
| | 51 |
| | 234 |
| |
| Missing FICO | | 2 |
| | 8 |
| | 3 |
| | 13 |
| |
| Less than 90% and updated FICO scores: | | | | | | | | | |
| Greater than 660 | | 13,678 |
| | 7,877 |
| | 13,795 |
| | 35,350 |
| |
| Less than or equal to 660 | | 1,212 |
| | 775 |
| | 555 |
| | 2,542 |
| |
| Missing FICO | | 42 |
| | 56 |
| | 97 |
| | 195 |
| |
| Total home equity and residential real estate loans | | $ | 15,757 |
| | $ | 11,057 |
| | $ | 15,252 |
| | $ | 42,066 |
| |
|
| | | | | | | | | | | | |
| | March 31, 2019 | December 31, 2018 |
| | Home equity |
| Residential real estate |
| Home equity |
| Residential real estate |
|
| In millions |
| Current estimated LTV ratios | | | | |
| Greater than or equal to 125% | $ | 464 |
| $ | 119 |
| $ | 461 |
| $ | 116 |
|
| Greater than or equal to 100% to less than 125% | 1,012 |
| 261 |
| 1,020 |
| 255 |
|
| Greater than or equal to 90% to less than 100% | 1,201 |
| 358 |
| 1,174 |
| 335 |
|
| Less than 90% | 22,014 |
| 16,337 |
| 22,644 |
| 15,922 |
|
| No LTV ratio available | 163 |
| 71 |
| 145 |
| 6 |
|
| Government insured or guaranteed loans | | 658 |
| | 685 |
|
| Purchased impaired loans | 646 |
| 1,303 |
| 679 |
| 1,338 |
|
| Total loans | $ | 25,500 |
| $ | 19,107 |
| $ | 26,123 |
| $ | 18,657 |
|
| Updated FICO Scores | | | | |
| Greater than 660 | $ | 22,378 |
| $ | 16,396 |
| $ | 22,996 |
| $ | 15,956 |
|
| Less than or equal to 660 | 2,207 |
| 602 |
| 2,210 |
| 585 |
|
| No FICO score available | 269 |
| 148 |
| 238 |
| 93 |
|
| Government insured or guaranteed loans | | 658 |
| | 685 |
|
| Purchased impaired loans | 646 |
| 1,303 |
| 679 |
| 1,338 |
|
| Total loans | $ | 25,500 |
| $ | 19,107 |
| $ | 26,123 |
| $ | 18,657 |
|
|
| | | | | | | | | | | | | | | | | |
| December 31, 2017 - in millions | | Home Equity | | Residential Real Estate |
| | Total |
| |
| 1st Liens |
| | 2nd Liens |
| | |
| Current estimated LTV ratios | | | | | | | | | |
| Greater than or equal to 125% and updated FICO scores: | | | | | | | | | |
| Greater than 660 | | $ | 108 |
| | $ | 385 |
| | $ | 126 |
| | $ | 619 |
| |
| Less than or equal to 660 (b) | | 21 |
| | 64 |
| | 23 |
| | 108 |
| |
| Missing FICO | | 1 |
| | 5 |
| | 1 |
| | 7 |
| |
| Greater than or equal to 100% to less than 125% and updated FICO scores: | | | | | | | | | |
| Greater than 660 | | 300 |
| | 842 |
| | 253 |
| | 1,395 |
| |
| Less than or equal to 660 (b) | | 46 |
| | 143 |
| | 45 |
| | 234 |
| |
| Missing FICO | | 2 |
| | 9 |
| | 5 |
| | 16 |
| |
| Greater than or equal to 90% to less than 100% and updated FICO scores: | | | | | | | | | |
| Greater than 660 | | 331 |
| | 890 |
| | 324 |
| | 1,545 |
| |
| Less than or equal to 660 | | 55 |
| | 134 |
| | 55 |
| | 244 |
| |
| Missing FICO | | 2 |
| | 9 |
| | 4 |
| | 15 |
| |
| Less than 90% and updated FICO scores: | | | | | | | | | |
| Greater than 660 | | 13,954 |
| | 8,066 |
| | 13,445 |
| | 35,465 |
| |
| Less than or equal to 660 | | 1,214 |
| | 774 |
| | 507 |
| | 2,495 |
| |
| Missing FICO | | 42 |
| | 57 |
| | 95 |
| | 194 |
| |
| Total home equity and residential real estate loans | | $ | 16,076 |
| | $ | 11,378 |
| | $ | 14,883 |
| | $ | 42,337 |
| |
| |
(a) | Amounts shown represent recorded investment. |
| |
(b) | Higher risk loans are defined as loans with both an updated FICO score of less than or equal to 660 and an updated LTV greater than or equal to 100%. The following states had the highest percentage of higher risk loans at March 31, 2018: New Jersey 16%, Pennsylvania 13%, Illinois 12%, Ohio 10%, Maryland 8%, Florida 6%, North Carolina 5% and Michigan 4%. The remainder of the states had lower than 4% of the higher risk loans individually, and collectively they represent approximately 26% of the higher risk loans. The following states had the highest percentage of higher risk loans at December 31, 2017: New Jersey 17%, Pennsylvania 13%, Illinois 13%, Ohio 9%, Maryland 8%, Florida 6%, North Carolina 5% and Michigan 4%. The remainder of the states had lower than 4% of the higher risk loans individually, and collectively they represent approximately 25% of the higher risk loans. |
The PNC Financial Services Group, Inc. – Form 10-Q57
Automobile, Credit Card, Education and Other Consumer Loan Classes
The following table presents asset quality indicators for the automobile, credit card, education and other consumer loan classes.
Table 42:40: Asset Quality Indicators for Automobile, Credit Card, Education and Other Consumer Loan Classes Asset Quality IndicatorsLoans
| | | | | Credit Card | | Other Consumer (a) | | | |
| Dollars in millions | | Amount |
| | % of Total Loans Using FICO Credit Metric |
| | Amount |
| | % of Total Loans Using FICO Credit Metric |
| | | Automobile | Credit Card | Education | Other Consumer |
| March 31, 2018 | | | | | | | | | | |
| March 31, 2019 | | | | |
| FICO score greater than 719 | | $ | 3,368 |
| | 60 | % | | $ | 10,235 |
| | 61 | % | | | $ | 7,694 |
| $ | 3,753 |
| $ | 1,245 |
| $ | 1,306 |
|
| 650 to 719 | | 1,603 |
| | 28 | % | | 4,611 |
| | 27 | % | | | 4,452 |
| 1,781 |
| 192 |
| 678 |
|
| 620 to 649 | | 254 |
| | 5 | % | | 815 |
| | 5 | % | | | 1,071 |
| 284 |
| 25 |
| 111 |
|
| Less than 620 | | 297 |
| | 5 | % | | 844 |
| | 5 | % | | | 1,191 |
| 336 |
| 26 |
| 109 |
|
| No FICO score available or required (b) | | 135 |
| | 2 | % | | 316 |
| | 2 | % | | |
| No FICO score available or required (a) | | | 299 |
| 113 |
| 46 |
| 25 |
|
| Total loans using FICO credit metric | | 5,657 |
| | 100 | % | | 16,821 |
| | 100 | % | | | 14,707 |
| 6,267 |
| 1,534 |
| 2,229 |
|
| Consumer loans using other internal credit metrics (a) | | | | | | 5,036 |
| | | | |
| Total loan balance | | $ | 5,657 |
| | | | $ | 21,857 |
| | | | |
| Consumer loans using other internal credit metrics | | | | | 2,173 |
| 2,334 |
|
| Total loans | | | $ | 14,707 |
| $ | 6,267 |
| $ | 3,707 |
| $ | 4,563 |
|
| Weighted-average updated FICO score (b) | | | | 733 |
| | | | 737 |
| | | 723 |
| 733 |
| 774 |
| 731 |
|
| December 31, 2017 | | | | | | | | | | |
| December 31, 2018 | | | | |
| FICO score greater than 719 | | $ | 3,457 |
| | 61 | % | | $ | 10,366 |
| | 63 | % | | | $ | 7,740 |
| $ | 3,809 |
| $ | 1,240 |
| $ | 1,280 |
|
| 650 to 719 | | 1,596 |
| | 28 | % | | 4,352 |
| | 27 | % | | | 4,365 |
| 1,759 |
| 194 |
| 641 |
|
| 620 to 649 | | 250 |
| | 4 | % | | 659 |
| | 4 | % | | | 1,007 |
| 280 |
| 26 |
| 106 |
|
| Less than 620 | | 272 |
| | 5 | % | | 715 |
| | 4 | % | | | 1,027 |
| 332 |
| 24 |
| 105 |
|
| No FICO score available or required (b) | | 124 |
| | 2 | % | | 314 |
| | 2 | % | | |
| No FICO score available or required (a) | | | 280 |
| 177 |
| 57 |
| 25 |
|
| Total loans using FICO credit metric | | 5,699 |
| | 100 | % | | 16,406 |
| | 100 | % | | | 14,419 |
| 6,357 |
| 1,541 |
| 2,157 |
|
| Consumer loans using other internal credit metrics (a) | | | | | | 5,338 |
| | | | |
| Total loan balance | | $ | 5,699 |
| | | | $ | 21,744 |
| | | | |
| Consumer loans using other internal credit metrics | | | | | 2,281 |
| 2,428 |
|
| Total loans | | | $ | 14,419 |
| $ | 6,357 |
| $ | 3,822 |
| $ | 4,585 |
|
| Weighted-average updated FICO score (b) | | | | 735 |
| | | | 741 |
| | | 726 |
| 733 |
| 774 |
| 732 |
|
| |
| (a) | We use updated FICO scores as an asset quality indicator for non-government guaranteed or insured education loans, automobile loans and other secured and unsecured lines and loans. We use internal credit metrics, such as delinquency status, geography or other factors, as an asset quality indicator for government guaranteed or insured education loans and consumer loans to high net worth individuals, as internal credit metrics are more relevant than FICO scores for these types of loans. |
| |
(b) | Credit card loans and other consumer loansLoans with no FICO score available or required generally refers to new accounts issued to borrowers with limited credit history, accounts for which we cannot obtain an updated FICO score (e.g.(e.g., recent profile changes), cards issued with a business name and/or cards secured by collateral. Management proactively assesses the risk and size of this loan portfoliocategory and, when necessary, takes actions to mitigate the credit risk.
|
| |
| (b) | Weighted-average updated FICO score excludes accounts with no FICO score available or required. |
The PNC Financial Services Group, Inc. – Form 10-Q49
Troubled Debt Restructurings (TDRs)
Table 4341 quantifies the number of loans that were classified as TDRs, as well as the change in the loans’ recorded investment as a result of becoming a TDR during the three months ended March 31, 20182019 and March 31, 2017.2018. Additionally, the table provides information about the types of TDR concessions. See Note 3 Asset Quality in our 20172018 Form 10-K for additional discussion of TDRs.
Table 43:41: Financial Impact and TDRs by Concession Type (a)
| | | | | | Pre-TDR Recorded Investment (b) |
| | Post-TDR Recorded Investment (c) | | | | Pre-TDR Recorded Investment (b) |
| | Post-TDR Recorded Investment (c) | |
During the three months ended March 31, 2019
Dollars in millions | | Number of Loans | | | Principal Forgiveness | | Rate Reduction |
| | Other |
| | Total |
| |
| Total commercial lending | | | 22 |
| | $ | 105 |
| | | | | | $ | 109 |
| | $ | 109 |
| |
| Total consumer lending | | | 3,814 |
| | 42 |
| | | | $ | 24 |
| | 16 |
| | 40 |
| |
| Total TDRs | | | 3,836 |
| | $ | 147 |
| |
| | $ | 24 |
| | $ | 125 |
| | $ | 149 |
| |
During the three months ended March 31, 2018
Dollars in millions | Number of Loans | | | Pre-TDR Recorded Investment (b) |
| | Principal Forgiveness |
| | Rate Reduction |
| | Other |
| | Total |
| | | | | | | | | | | | | | |
| Total commercial lending | | 32 |
| |
|
| | $ | 1 |
| | $ | 7 |
| | $ | 8 |
| | | 32 |
| | $ | 10 |
| |
| | $ | 1 |
| | $ | 7 |
| | $ | 8 |
| |
| Total consumer lending | | 2,979 |
| | 49 |
| | | | 30 |
| | 16 |
| | 46 |
| | | 2,979 |
| | 49 |
| | | | 30 |
| | 16 |
| | 46 |
| |
| Total TDRs | | 3,011 |
| | $ | 59 |
| |
| | $ | 31 |
| | $ | 23 |
| | $ | 54 |
| | | 3,011 |
| | $ | 59 |
| |
| | $ | 31 |
| | $ | 23 |
| | $ | 54 |
| |
During the three months ended March 31, 2017
Dollars in millions | | | | | | | | | | | | | | |
| Total commercial lending | | 49 |
| | $ | 35 |
| | $ | 4 |
| | $ | 6 |
| | $ | 5 |
| | $ | 15 |
| | |
| Total consumer lending | | 2,899 |
| | 73 |
| | | | 37 |
| | 31 |
| | 68 |
| | |
| Total TDRs | | 2,948 |
| | $ | 108 |
| | $ | 4 |
| | $ | 43 |
| | $ | 36 |
| | $ | 83 |
| | |
| |
| (a) | Impact of partial charge-offs at TDR date are included in this table. |
| |
| (b) | Represents the recorded investment of the loans as of the quarter end prior to TDR designation, and excludes immaterial amounts of accrued interest receivable. |
| |
| (c) | Represents the recorded investment of the TDRs as of the end of the quarter in which the TDR occurs, and excludes immaterial amounts of accrued interest receivable. |
58 The PNC Financial Services Group, Inc. – Form 10-Q
After a loan is determined to be a TDR, we continue to track its performance under its most recent restructured terms. We consider a TDR to have subsequently defaulted when it becomes 60 days past due after the most recent date the loan was restructured. The recorded investment of loans that were both (i) classified as TDRs or were subsequently modified during each 12-month period preceding January 1, 20182019 and January 1, 2017,2018, respectively, and (ii) subsequently defaulted during the three months ended March 31, 20182019 and March 31, 20172018 totaled $21$18 million and $32$21 million, respectively.
Impaired Loans
Impaired loans include commercial and consumer nonperforming loans and TDRs, regardless of nonperforming status. TDRs that were previously recorded at amortized cost and are now classified and accounted for as held for sale are also included. Excluded from impaired loans are nonperforming leases, loans accounted for as held for sale other than the TDRs described in the preceding sentence, loans accounted for under the fair value option, smaller balance homogeneous type loans and purchased impaired loans. We did not recognize any interest income on impaired loans that have not returned to performing status, while they were impaired during the three months ended March 31, 20182019 and March 31, 2017.2018. Table 4442 provides further detail on impaired loans individually evaluated for impairment and the associated allowance for loan and lease losses (ALLL).ALLL. Certain commercial and consumer impaired loans do not have a related ALLL as the valuation of these impaired loans exceeded the recorded investment.
Table 44:42: Impaired Loans
| | | In millions | | Unpaid Principal Balance |
| | Recorded Investment |
| | Associated Allowance |
| | Average Recorded Investment (a) |
| | | Unpaid Principal Balance |
| | Recorded Investment |
| | Associated Allowance |
| | Average Recorded Investment (a) |
| |
| March 31, 2018 | | | | | | | | | | |
| March 31, 2019 | | | | | | | | | | |
| Impaired loans with an associated allowance | | | | | | | | | | | | | | | | | | |
| Total commercial lending | | $ | 537 |
| | $ | 371 |
| | $ | 101 |
| | $ | 363 |
| | | $ | 481 |
| | $ | 383 |
| | $ | 87 |
| | $ | 349 |
| |
| Total consumer lending | | 980 |
| | 915 |
| | 152 |
| | 964 |
| | | 855 |
| | 808 |
| | 130 |
| | 813 |
| |
| Total impaired loans with an associated allowance | | 1,517 |
| | 1,286 |
| | 253 |
| | 1,327 |
| | | 1,336 |
| | 1,191 |
| | 217 |
| | 1,162 |
| |
| Impaired loans without an associated allowance | | | | | | | | | | | | | | | | | | |
| Total commercial lending | | 427 |
| | 326 |
| | | | 345 |
| | | 358 |
| | 263 |
| | | | 295 |
| |
| Total consumer lending | | 1,158 |
| | 693 |
| | | | 666 |
| | | 1,014 |
| | 604 |
| | | | 614 |
| |
| Total impaired loans without an associated allowance | | 1,585 |
| | 1,019 |
| |
|
| | 1,011 |
| | | 1,372 |
| | 867 |
| |
|
| | 909 |
| |
| Total impaired loans | | $ | 3,102 |
| | $ | 2,305 |
| | $ | 253 |
| | $ | 2,338 |
| | | $ | 2,708 |
| | $ | 2,058 |
| | $ | 217 |
| | $ | 2,071 |
| |
| December 31, 2017 | | | | | | | | | | |
| December 31, 2018 | | | | | | | | | | |
| Impaired loans with an associated allowance | | | | | | | | | | | | | | | | | | |
| Total commercial lending | | $ | 580 |
| | $ | 353 |
| | $ | 76 |
| | $ | 419 |
| | | $ | 440 |
| | $ | 315 |
| | $ | 73 |
| | $ | 349 |
| |
| Total consumer lending | | 1,061 |
| | 1,014 |
| | 195 |
| | 1,072 |
| | | 863 |
| | 817 |
| | 136 |
| | 904 |
| |
| Total impaired loans with an associated allowance | | 1,641 |
| | 1,367 |
| | 271 |
| | 1,491 |
| | | 1,303 |
| | 1,132 |
| | 209 |
| | 1,253 |
| |
| Impaired loans without an associated allowance | | | | | | | | | | | | | | | | | | |
| Total commercial lending | | 494 |
| | 366 |
| | | | 330 |
| | | 413 |
| | 326 |
| | | | 294 |
| |
| Total consumer lending | | 1,019 |
| | 638 |
| | | | 648 |
| | | 1,042 |
| | 625 |
| | | | 645 |
| |
| Total impaired loans without an associated allowance | | 1,513 |
| | 1,004 |
| | | | 978 |
| | | 1,455 |
| | 951 |
| | | | 939 |
| |
| Total impaired loans | | $ | 3,154 |
| | $ | 2,371 |
| | $ | 271 |
| | $ | 2,469 |
| | | $ | 2,758 |
| | $ | 2,083 |
| | $ | 209 |
| | $ | 2,192 |
| |
| |
| (a) | Average recorded investment is for the three months ended March 31, 20182019 and the year ended December 31, 2017,2018, respectively. |
50 The PNC Financial Services Group, Inc. – Form 10-Q
NOTE 4 ALLOWANCE FOR LOAN AND LEASE LOSSES
We maintain the ALLL at levels that we believe to be appropriate to absorb estimated probable credit losses incurred in the portfolios as of the balance sheet date. We use thehave two main portfolio segments – Commercial Lending and Consumer Lending, and develop and document the ALLL under separate methodologies for each of these portfolio segments. See Note 1 Accounting Policies in our 20172018 Form 10-K for a description of the accounting policies for ALLL.
The PNC Financial Services Group, Inc. – Form 10-Q59
A rollforward of the ALLL and associated loan data follows:
Table 45:43: Rollforward of Allowance for Loan and Lease Losses and Associated Loan Data
| | | Dollars in millions | | Commercial Lending |
| | Consumer Lending |
| | Total |
| | |
| March 31, 2018 | | | | | | | | |
| | | | 2019 | | 2018 | |
At or for the three months ended March 31 Dollars in millions | | | Commercial Lending |
| | Consumer Lending |
| | Total |
| | Commercial Lending |
| | Consumer Lending |
| | Total |
| |
| Allowance for Loan and Lease Losses | | | | | | | | | | | | | | | | | | | | |
| January 1 | | $ | 1,582 |
| | $ | 1,029 |
| | $ | 2,611 |
| | | $ | 1,663 |
| | $ | 966 |
| | $ | 2,629 |
| | $ | 1,582 |
| | $ | 1,029 |
| | $ | 2,611 |
| |
| Charge-offs | | (36 | ) | | (157 | ) | | (193 | ) | | | (31 | ) | | (184 | ) | | (215 | ) | | (36 | ) | | (157 | ) | | (193 | ) | |
| Recoveries | | 26 |
| | 54 |
| | 80 |
| | | 19 |
| | 60 |
| | 79 |
| | 26 |
| | 54 |
| | 80 |
| |
| Net (charge-offs) | | (10 | ) | | (103 | ) | | (113 | ) | | | (12 | ) | | (124 | ) | | (136 | ) | | (10 | ) | | (103 | ) | | (113 | ) | |
| Provision for credit losses | | 37 |
| | 55 |
| | 92 |
| | | 80 |
| | 109 |
| | 189 |
| | 37 |
| | 55 |
| | 92 |
| |
| Net (increase) / decrease in allowance for unfunded loan commitments and letters of credit | | 5 |
| | 2 |
| | 7 |
| | |
Net decrease / (increase) in allowance for unfunded loan commitments and letters of credit | | | 5 |
| | 1 |
| | 6 |
| | 5 |
| | 2 |
| | 7 |
| |
| Other | | | | 7 |
| | 7 |
| | | | | 4 |
| | 4 |
| | | | 7 |
| | 7 |
| |
| March 31 | | $ | 1,614 |
|
| $ | 990 |
|
| $ | 2,604 |
| | | $ | 1,736 |
|
| $ | 956 |
|
| $ | 2,692 |
| | $ | 1,614 |
| | $ | 990 |
| | $ | 2,604 |
| |
| TDRs individually evaluated for impairment | | $ | 34 |
| | $ | 152 |
| | $ | 186 |
| | | $ | 27 |
| | $ | 130 |
| | $ | 157 |
| | $ | 34 |
| | $ | 152 |
| | $ | 186 |
| |
| Other loans individually evaluated for impairment | | 67 |
| | | | 67 |
| | | 60 |
| | | | 60 |
| | 67 |
| | | | 67 |
| |
| Loans collectively evaluated for impairment | | 1,513 |
| | 556 |
| | 2,069 |
| | | 1,649 |
| | 551 |
| | 2,200 |
| | 1,513 |
| | 556 |
| | 2,069 |
| |
| Purchased impaired loans | | | | 282 |
| | 282 |
| | | | | 275 |
| | 275 |
| | | | 282 |
| | 282 |
| |
| March 31 | | $ | 1,614 |
| | $ | 990 |
| | $ | 2,604 |
| | | $ | 1,736 |
| | $ | 956 |
| | $ | 2,692 |
| | $ | 1,614 |
| | $ | 990 |
| | $ | 2,604 |
| |
| Loan Portfolio | | | | | | | | | | | | | | | | | | | | |
| TDRs individually evaluated for impairment | | $ | 384 |
| | $ | 1,608 |
| | $ | 1,992 |
| | | $ | 456 |
| | $ | 1,412 |
| | $ | 1,868 |
| | $ | 384 |
| | $ | 1,608 |
| | $ | 1,992 |
| |
| Other loans individually evaluated for impairment | | 313 |
| | | | 313 |
| | | 190 |
| | | | 190 |
| | 313 |
| | | | 313 |
| |
| Loans collectively evaluated for impairment | | 148,248 |
| | 67,934 |
| | 216,182 |
| | | 157,796 |
| | 69,732 |
| | 227,528 |
| | 148,248 |
| | 67,934 |
| | 216,182 |
| |
| Fair value option loans (a) | | | | 813 |
| | 813 |
| | | | | 758 |
| | 758 |
| | | | 813 |
| | 813 |
| |
| Purchased impaired loans | | | | 2,314 |
| | 2,314 |
| | | | | 1,949 |
| | 1,949 |
| | | | 2,314 |
| | 2,314 |
| |
| March 31 | | $ | 148,945 |
| | $ | 72,669 |
| | $ | 221,614 |
| | | $ | 158,442 |
| | $ | 73,851 |
| | $ | 232,293 |
| | $ | 148,945 |
| | $ | 72,669 |
| | $ | 221,614 |
| |
| Portfolio segment ALLL as a percentage of total ALLL | | 62 | % | | 38 | % | | 100 | % | | | 64 | % | | 36 | % | | 100 | % | | 62 | % | | 38 | % | | 100 | % | |
| Ratio of ALLL to total loans | | 1.08 | % | | 1.36 | % | | 1.18 | % | | | 1.10 | % | | 1.29 | % | | 1.16 | % | | 1.08 | % | | 1.36 | % | | 1.18 | % | |
| March 31, 2017 | | | | | | | | |
| Allowance for Loan and Lease Losses | | | | | | | | |
| January 1 | | $ | 1,534 |
| | $ | 1,055 |
| | $ | 2,589 |
| | |
| Charge-offs | | (55 | ) | | (143 | ) | | (198 | ) | | |
| Recoveries | | 32 |
| | 48 |
| | 80 |
| | |
| Net (charge-offs) | | (23 | ) | | (95 | ) | | (118 | ) | | |
| Provision for credit losses | | 23 |
| | 65 |
| | 88 |
| | |
| Net (increase) / decrease in allowance for unfunded loan commitments and letters of credit | | (5 | ) | | 1 |
| | (4 | ) | | |
| Other | | 1 |
| | 5 |
| | 6 |
| | |
| March 31 | | $ | 1,530 |
| | $ | 1,031 |
| | $ | 2,561 |
| | |
| TDRs individually evaluated for impairment | | $ | 37 |
| | $ | 215 |
| | $ | 252 |
| | |
| Other loans individually evaluated for impairment | | 53 |
| | | | 53 |
| | |
| Loans collectively evaluated for impairment | | 1,412 |
| | 526 |
| | 1,938 |
| | |
| Purchased impaired loans | | 28 |
| | 290 |
| | 318 |
| | |
| March 31 | | $ | 1,530 |
| | $ | 1,031 |
| | $ | 2,561 |
| | |
| Loan Portfolio | | | | | | | | |
| TDRs individually evaluated for impairment | | $ | 366 |
| | $ | 1,764 |
| | $ | 2,130 |
| | |
| Other loans individually evaluated for impairment | | 351 |
| | | | 351 |
| | |
| Loans collectively evaluated for impairment | | 139,863 |
| | 66,797 |
| | 206,660 |
| | |
| Fair value option loans (a) | | | | 874 |
| | 874 |
| | |
| Purchased impaired loans | | 82 |
| | 2,729 |
| | 2,811 |
| | |
| March 31 | | $ | 140,662 |
| | $ | 72,164 |
| | $ | 212,826 |
| | |
| Portfolio segment ALLL as a percentage of total ALLL | | 60 | % | | 40 | % | | 100 | % | | |
| Ratio of ALLL to total loans | | 1.09 | % | | 1.43 | % | | 1.20 | % | | |
| |
| (a) | Loans accounted for under the fair value option are not evaluated for impairment as these loans are accounted for at fair value. Accordingly, there is no allowance recorded on these loans. |
60The PNC Financial Services Group, Inc. – Form 10-Q51
NOTE 5 INVESTMENT SECURITIES
Table 46:44: Investment Securities Summary
|
| | | | | | | | | | | | | | | | | |
| In millions | | Amortized Cost |
| | Unrealized | | Fair Value |
| |
| Gains |
| | Losses |
| | |
| March 31, 2018 | | | | | | | | | |
| Securities Available for Sale | | | | | | | | | |
| Debt securities | | | | | | | | | |
| U.S. Treasury and government agencies | | $ | 13,645 |
| | $ | 123 |
| | $ | (179 | ) | | $ | 13,589 |
| |
| Residential mortgage-backed | | | | | | | | | |
| Agency | | 26,512 |
| | 74 |
| | (584 | ) | | 26,002 |
| |
| Non-agency | | 2,320 |
| | 333 |
| | (17 | ) | | 2,636 |
| |
| Commercial mortgage-backed | | | | | | | | | |
| Agency | | 1,884 |
| | 1 |
| | (78 | ) | | 1,807 |
| |
| Non-agency | | 2,585 |
| | 9 |
| | (24 | ) | | 2,570 |
| |
| Asset-backed | | 5,129 |
| | 71 |
| | (17 | ) | | 5,183 |
| |
| Other debt | | 4,166 |
| | 103 |
| | (38 | ) | | 4,231 |
| |
| Total securities available for sale | | $ | 56,241 |
| | $ | 714 |
| | $ | (937 | ) | | $ | 56,018 |
| |
| Securities Held to Maturity | | | | | | | | | |
| Debt securities | | | | | | | | | |
| U.S. Treasury and government agencies | | $ | 745 |
| | $ | 28 |
| | $ | (27 | ) | | $ | 746 |
| |
| Residential mortgage-backed | | | | | | | | | |
| Agency | | 14,663 |
| | 18 |
| | (382 | ) | | 14,299 |
| |
| Non-agency | | 163 |
| | 3 |
| | | | 166 |
| |
| Commercial mortgage-backed | | | | | | | | | |
| Agency | | 338 |
| | 2 |
| | (1 | ) | | 339 |
| |
| Non-agency | | 524 |
| | 4 |
| | | | 528 |
| |
| Asset-backed | | 196 |
| | 1 |
| | | | 197 |
| |
| Other debt | | 1,915 |
| | 59 |
| | (26 | ) | | 1,948 |
| |
| Total securities held to maturity | | $ | 18,544 |
| | $ | 115 |
| | $ | (436 | ) | | $ | 18,223 |
| |
| December 31, 2017 | | | | | | | | | |
| Securities Available for Sale | | | | | | | | | |
| Debt securities | | | | | | | | | |
| U.S. Treasury and government agencies | | $ | 14,432 |
| | $ | 173 |
| | $ | (84 | ) | | $ | 14,521 |
| |
| Residential mortgage-backed | | | | | | | | | |
| Agency | | 25,534 |
| | 121 |
| | (249 | ) | | 25,406 |
| |
| Non-agency | | 2,443 |
| | 336 |
| | (21 | ) | | 2,758 |
| |
| Commercial mortgage-backed | | | | | | | | | |
| Agency | | 1,960 |
| | 2 |
| | (58 | ) | | 1,904 |
| |
| Non-agency | | 2,603 |
| | 19 |
| | (9 | ) | | 2,613 |
| |
| Asset-backed | | 5,331 |
| | 74 |
| | (8 | ) | | 5,397 |
| |
| Other debt | | 4,322 |
| | 129 |
| | (17 | ) | | 4,434 |
| |
| Total debt securities | | 56,625 |
| | 854 |
| | (446 | ) | | 57,033 |
| |
| Other (a) | | 587 |
| | | | (2 | ) | | 585 |
| |
| Total securities available for sale | | $ | 57,212 |
| | $ | 854 |
| | $ | (448 | ) | | $ | 57,618 |
| |
| Securities Held to Maturity | | | | | | | | | |
| Debt securities | | | | | | | | | |
| U.S. Treasury and government agencies | | $ | 741 |
| | $ | 37 |
| | $ | (13 | ) | | $ | 765 |
| |
| Residential mortgage-backed | | | | | | | | | |
| Agency | | 14,503 |
| | 77 |
| | (139 | ) | | 14,441 |
| |
| Non-agency | | 167 |
| | 7 |
| | | | 174 |
| |
| Commercial mortgage-backed | | | | | | | | | |
| Agency | | 407 |
| | 4 |
| | | | 411 |
| |
| Non-agency | | 538 |
| | 10 |
| | | | 548 |
| |
| Asset-backed | | 200 |
| | 1 |
| |
|
| | 201 |
| |
| Other debt | | 1,957 |
| | 88 |
| | (20 | ) | | 2,025 |
| |
| Total securities held to maturity | | $ | 18,513 |
| | $ | 224 |
| | $ | (172 | ) | | $ | 18,565 |
| |
| |
(a) | On January 1, 2018, $.6 billion of available for sale securities, primarily money market funds, were reclassified to equity investments in accordance with the adoption of ASU 2016-01. See the Recently Adopted Accounting Standards portion of Note 1 for additional detail on this adoption. |
The PNC Financial Services Group, Inc. – Form 10-Q61
|
| | | | | | | | | | | | | | | | | | | | | | | | | | | | | | | | | |
| | | March 31, 2019 | | | December 31, 2018 |
| In millions | | Amortized Cost |
| | Unrealized | | Fair Value |
| | | Amortized Cost |
| | Unrealized | | Fair Value |
|
| Gains |
| | Losses |
| | | | Gains |
| | Losses |
| |
| Securities Available for Sale | | | | | | | | | | | | | | | | | |
| U.S. Treasury and government agencies | | $ | 18,858 |
| | $ | 200 |
| | $ | (67 | ) | | $ | 18,991 |
| | | $ | 18,104 |
| | $ | 133 |
| | $ | (137 | ) | | $ | 18,100 |
|
| Residential mortgage-backed | | | | | | | | | | | | | | | | | |
| Agency | | 29,549 |
| | 229 |
| | (250 | ) | | 29,528 |
| | | 29,413 |
| | 104 |
| | (524 | ) | | 28,993 |
|
| Non-agency | | 1,834 |
| | 302 |
| | (11 | ) | | 2,125 |
| | | 1,924 |
| | 300 |
| | (13 | ) | | 2,211 |
|
| Commercial mortgage-backed | | | | | | | | | | | | | | | | | |
| Agency | | 2,598 |
| | 27 |
| | (52 | ) | | 2,573 |
| | | 2,630 |
| | 13 |
| | (66 | ) | | 2,577 |
|
| Non-agency | | 2,831 |
| | 16 |
| | (15 | ) | | 2,832 |
| | | 2,689 |
| | 5 |
| | (37 | ) | | 2,657 |
|
| Asset-backed | | 5,508 |
| | 69 |
| | (12 | ) | | 5,565 |
| | | 4,933 |
| | 59 |
| | (20 | ) | | 4,972 |
|
| Other | | 3,346 |
| | 104 |
| | (13 | ) | | 3,437 |
| | | 3,821 |
| | 96 |
| | (38 | ) | | 3,879 |
|
| Total securities available for sale | | $ | 64,524 |
| | $ | 947 |
| | $ | (420 | ) | | $ | 65,051 |
| | | $ | 63,514 |
| | $ | 710 |
| | $ | (835 | ) | | $ | 63,389 |
|
| Securities Held to Maturity | | | | | | | | | | | | | | | | | |
| U.S. Treasury and government agencies | | $ | 763 |
| | $ | 35 |
| | $ | (11 | ) | | $ | 787 |
| | | $ | 758 |
| | $ | 28 |
| | $ | (23 | ) | | $ | 763 |
|
| Residential mortgage-backed | | | | | | | | | | | | | | | | | |
| Agency | | 15,317 |
| | 90 |
| | (185 | ) | | 15,222 |
| | | 15,740 |
| | 32 |
| | (358 | ) | | 15,414 |
|
| Non-agency | | 149 |
| | 4 |
| | | | 153 |
| | | 152 |
| | 2 |
| | | | 154 |
|
| Commercial mortgage-backed | | | | | | | | | | | | | | | | | |
| Agency | | 107 |
| | 1 |
| | | | 108 |
| | | 143 |
| | 1 |
| | (1 | ) | | 143 |
|
| Non-agency | | 473 |
| | 3 |
| | | | 476 |
| | | 488 |
| | 1 |
| | (1 | ) | | 488 |
|
| Asset-backed | | 174 |
| | | | | | 174 |
| | | 182 |
| | 1 |
| | | | 183 |
|
| Other | | 1,835 |
| | 75 |
| | (22 | ) | | 1,888 |
| | | 1,849 |
| | 53 |
| | (28 | ) | | 1,874 |
|
| Total securities held to maturity | | $ | 18,818 |
| | $ | 208 |
| | $ | (218 | ) | | $ | 18,808 |
| | | $ | 19,312 |
| | $ | 118 |
| | $ | (411 | ) | | $ | 19,019 |
|
The fair value of investment securities is impacted by interest rates, credit spreads, market volatility and liquidity conditions. Net unrealized gains and losses in the securities available for sale portfolio are included in Shareholders’ equity as AOCI, unless credit-related. Securities held to maturity are carried at amortized cost. Investment securities at March 31, 2019 included $623 million of net unsettled purchases which represent non-cash investing activity, and accordingly, are not reflected on the Consolidated Statement of Cash Flows.
At March 31, 2018,2019, AOCI included pretax gains of $50$25 million from derivatives that hedged the purchase of investment securities classified as held to maturity. The gains will be accreted into interest income as an adjustment of yield on the securities.
Table 4745 presents gross unrealized losses and fair value of debt securities at March 31, 20182019 and December 31, 2017.2018. The securities are segregated between investments that have been in a continuous unrealized loss position for less than twelve months and twelve months or more based on the point in time that the fair value declined below the amortized cost basis. The table includes debt securities where a portion of other than temporary impairment (OTTI) has been recognized in AOCI.
52 The PNC Financial Services Group, Inc. – Form 10-Q
Table 47:45: Gross Unrealized Loss and Fair Value of Debt Securities
| | | | | Unrealized loss position less than 12 months | | Unrealized loss position 12 months or more | | Total | | | Unrealized loss position less than 12 months | | Unrealized loss position 12 months or more | | Total | |
| In millions | | Unrealized Loss |
| | Fair Value |
| | Unrealized Loss |
| | Fair Value |
| | Unrealized Loss |
| | Fair Value |
| | | Unrealized Loss |
| | Fair Value |
| | Unrealized Loss |
| | Fair Value |
| | Unrealized Loss |
| | Fair Value |
| |
| March 31, 2018 | | | | | | | | | | | | | | |
| March 31, 2019 | | | | | | | | | | | | | | |
| Securities Available for Sale | | | | | | | | | | | | | | | | | | | | | | | | | | |
| Debt securities | | | | | | | | | | | | | | |
| U.S. Treasury and government agencies | | $ | (120 | ) | | $ | 6,937 |
| | $ | (59 | ) | | $ | 1,142 |
| | $ | (179 | ) | | $ | 8,079 |
| | | $ | (2 | ) | | $ | 1,699 |
| | $ | (65 | ) | | $ | 5,908 |
| | $ | (67 | ) | | $ | 7,607 |
| |
| Residential mortgage-backed | | | | | | | | | | | | | | | | | | | | | | | | | | |
| Agency | | (229 | ) | | 11,684 |
| | (355 | ) | | 8,965 |
| | (584 | ) | | 20,649 |
| | | (2 | ) | | 1,230 |
| | (248 | ) | | 14,184 |
| | (250 | ) | | 15,414 |
| |
| Non-agency | | (1 | ) | | 94 |
| | (16 | ) | | 352 |
| | (17 | ) | | 446 |
| | | | | | | (11 | ) | | 332 |
| | (11 | ) | | 332 |
| |
| Commercial mortgage-backed | | | | | | | | | | | | | | | | | | | | | | | | | | |
| Agency | | (16 | ) | | 499 |
| | (62 | ) | | 1,243 |
| | (78 | ) | | 1,742 |
| | | | | | | (52 | ) | | 1,500 |
| | (52 | ) | | 1,500 |
| |
| Non-agency | | (15 | ) | | 1,284 |
| | (9 | ) | | 325 |
| | (24 | ) | | 1,609 |
| | | (3 | ) | | 801 |
| | (12 | ) | | 646 |
| | (15 | ) | | 1,447 |
| |
| Asset-backed | | (14 | ) | | 2,366 |
| | (3 | ) | | 383 |
| | (17 | ) | | 2,749 |
| | | (5 | ) | | 1,108 |
| | (6 | ) | | 1,178 |
| | (11 | ) | | 2,286 |
| |
| Other debt | | (16 | ) | | 1,675 |
| | (22 | ) | | 787 |
| | (38 | ) | | 2,462 |
| | |
| Total debt securities available for sale | | $ | (411 | ) | | $ | 24,539 |
| | $ | (526 | ) | | $ | 13,197 |
| | $ | (937 | ) | | $ | 37,736 |
| | |
| Other | | | | | | | (14 | ) | | 1,324 |
| | (14 | ) | | 1,324 |
| |
| Total securities available for sale | | | $ | (12 | ) | | $ | 4,838 |
| | $ | (408 | ) | | $ | 25,072 |
| | $ | (420 | ) | | $ | 29,910 |
| |
| Securities Held to Maturity | | | | | | | | | | | | | | | | | | | | | | | | | | |
| Debt securities | | | | | | | | | | | | | | |
| U.S. Treasury and government agencies | | $ | (7 | ) | | $ | 191 |
| | $ | (20 | ) | | $ | 246 |
| | $ | (27 | ) | | $ | 437 |
| | | | | | | $ | (11 | ) | | $ | 460 |
| | $ | (11 | ) | | $ | 460 |
| |
| Residential mortgage-backed - Agency | | (133 | ) | | 7,080 |
| | (249 | ) | | 5,830 |
| | (382 | ) | | 12,910 |
| | | | | | | (185 | ) | | 9,778 |
| | (185 | ) | | 9,778 |
| |
| Commercial mortgage-backed - Agency | | (1 | ) | | 170 |
| | | | | | (1 | ) | | 170 |
| | |
| Other debt | | (7 | ) | | 105 |
| | (19 | ) | | 85 |
| | (26 | ) | | 190 |
| | |
| Total debt securities held to maturity | | $ | (148 | ) | | $ | 7,546 |
| | $ | (288 | ) | | $ | 6,161 |
| | $ | (436 | ) | | $ | 13,707 |
| | |
| December 31, 2017 | | | | | | | | | | | | | | |
| Other | | | $ | (1 | ) | | $ | 38 |
| | (21 | ) | | 137 |
| | (22 | ) | | 175 |
| |
| Total securities held to maturity | | | $ | (1 | ) | | $ | 38 |
| | $ | (217 | ) | | $ | 10,375 |
| | $ | (218 | ) | | $ | 10,413 |
| |
| December 31, 2018 | | | | | | | | | | | | | | |
| Securities Available for Sale | | | | | | | | | | | | | | | | | | | | | | | | | | |
| Debt securities | | | | | | | | | | | | | | |
| U.S. Treasury and government agencies | | $ | (42 | ) | | $ | 6,099 |
| | $ | (42 | ) | | $ | 1,465 |
| | $ | (84 | ) | | $ | 7,564 |
| | | $ | (21 | ) | | $ | 4,125 |
| | $ | (116 | ) | | $ | 5,423 |
| | $ | (137 | ) | | $ | 9,548 |
| |
| Residential mortgage-backed | | | | | | | | | | | | | | | | | | | | | | | | | | |
| Agency | | (47 | ) | | 8,151 |
| | (202 | ) | | 9,954 |
| | (249 | ) | | 18,105 |
| | | (57 | ) | | 4,823 |
| | (467 | ) | | 13,830 |
| | (524 | ) | | 18,653 |
| |
| Non-agency | |
| |
| | (21 | ) | | 383 |
| | (21 | ) | | 383 |
| | | (1 | ) | | 74 |
| | (12 | ) | | 310 |
| | (13 | ) | | 384 |
| |
| Commercial mortgage-backed | | | | | | | | | | | | | | | | | | | | | | | | | | |
| Agency | | (11 | ) | | 524 |
| | (47 | ) | | 1,302 |
| | (58 | ) | | 1,826 |
| | | (1 | ) | | 65 |
| | (65 | ) | | 1,516 |
| | (66 | ) | | 1,581 |
| |
| Non-agency | | (3 | ) | | 400 |
| | (6 | ) | | 333 |
| | (9 | ) | | 733 |
| | | (23 | ) | | 1,809 |
| | (14 | ) | | 498 |
| | (37 | ) | | 2,307 |
| |
| Asset-backed | | (4 | ) | | 1,697 |
| | (4 | ) | | 462 |
| | (8 | ) | | 2,159 |
| | | (11 | ) | | 2,149 |
| | (9 | ) | | 1,032 |
| | (20 | ) | | 3,181 |
| |
| Other debt | | (3 | ) | | 966 |
| | (14 | ) | | 798 |
| | (17 | ) | | 1,764 |
| | |
| Total debt securities available for sale | | $ | (110 | ) | | $ | 17,837 |
| | $ | (336 | ) | | $ | 14,697 |
| | $ | (446 | ) | | $ | 32,534 |
| | |
| Other | | | (12 | ) | | 868 |
| | (26 | ) | | 1,293 |
| | (38 | ) | | 2,161 |
| |
| Total securities available for sale | | | $ | (126 | ) | | $ | 13,913 |
| | $ | (709 | ) | | $ | 23,902 |
| | $ | (835 | ) | | $ | 37,815 |
| |
| Securities Held to Maturity | | | | | | | | | | | | | | | | | | | | | | | | | | |
| Debt securities | | | | | | | | | | | | | | |
| U.S. Treasury and government agencies | | $ | (3 | ) | | $ | 195 |
| | $ | (10 | ) | | $ | 255 |
| | $ | (13 | ) | | $ | 450 |
| | | | | | | $ | (23 | ) | | $ | 446 |
| | $ | (23 | ) | | $ | 446 |
| |
| Residential mortgage-backed - Agency | | (10 | ) | | 3,167 |
| | (129 | ) | | 6,168 |
| | (139 | ) | | 9,335 |
| | | $ | (58 | ) | | $ | 4,191 |
| | (300 | ) | | 7,921 |
| | (358 | ) | | 12,112 |
| |
| Other debt | | (12 | ) | | 83 |
| | (8 | ) | | 67 |
| | (20 | ) | | 150 |
| | |
| Total debt securities held to maturity | | $ | (25 | ) | | $ | 3,445 |
| | $ | (147 | ) | | $ | 6,490 |
| | $ | (172 | ) | | $ | 9,935 |
| | |
| Commercial mortgage-backed | | | | | | | | | | | | | | |
| Agency | | | (1 | ) | | 88 |
| | | | | | (1 | ) | | 88 |
| |
| Non-agency | | | (1 | ) | | 152 |
| | | | | | (1 | ) | | 152 |
| |
| Other | | | (2 | ) | | 75 |
| | (26 | ) | | 123 |
| | (28 | ) | | 198 |
| |
| Total securities held to maturity | | | $ | (62 | ) | | $ | 4,506 |
| | $ | (349 | ) | | $ | 8,490 |
| | $ | (411 | ) | | $ | 12,996 |
| |
Evaluating Investment Securities for OTTI
For the securities in Table 47,45, as of March 31, 20182019 we do not intend to sell and believe we will not be required to sell the securities prior to recovery of the amortized cost basis.
62 The PNC Financial Services Group, Inc. – Form 10-Q
On at least a quarterly basis, we review all debt securities that are in an unrealized loss position for OTTI, as discussed in Note 1 Accounting Policies of our 20172018 Form 10-K. For those securities on our Consolidated Balance Sheet at March 31, 2018,2019, where during our quarterly security-level impairment assessments we determined losses represented OTTI, we have recorded cumulative credit losses of $1.1 billion in earnings and accordingly have reduced the amortized cost of our securities.
The majority of these cumulative impairment charges related to non-agency residential mortgage-backed and asset-backed securities rated BB or lower. During the first quartersthree months of 20182019 and 2017,2018, the OTTI credit losses recognized in noninterest income and the OTTI noncredit losses recognized in AOCI on securities were not significant.
Information relating to gross realized securities gains and losses from the sales of securities is set forth in the following table:
Table 48:46: Gains (Losses) on Sales of Securities Available for Sale
| | Three months ended March 31
In millions | Proceeds |
| Gross Gains |
| Gross Losses |
| Net Losses |
| Tax Benefit |
| Gross Gains |
| Gross Losses |
| Net Gains (Losses) |
| Tax Expense |
| |
| 2019 | | $ | 27 |
| $ | (14 | ) | $ | 13 |
| $ | 3 |
| |
| 2018 | $ | 4,490 |
| $ | 37 |
| $ | (38 | ) | $ | (1 | ) | | $ | 37 |
| $ | (38 | ) | $ | (1 | ) |
|
| |
| 2017 | $ | 3,222 |
| $ | 14 |
| $ | (16 | ) | $ | (2 | ) | $ | (1 | ) | |
The PNC Financial Services Group, Inc. – Form 10-Q53
The following table presents, by remaining contractual maturity, the amortized cost, fair value and weighted-average yield of debt securities at March 31, 2018.2019.
Table 49:47: Contractual Maturity of Debt Securities
|
| | | | | | | | | | | | | | | | | | | | | | | |
March 31, 2018
Dollars in millions | | 1 Year or Less |
| | After 1 Year through 5 Years |
| | After 5 Years through 10 Years |
| | After 10 Years |
| | Total |
| |
| Securities Available for Sale | | | | | | | | | | | |
| U.S. Treasury and government agencies | | $ | 85 |
| | $ | 7,752 |
| | $ | 5,335 |
| | $ | 473 |
| | $ | 13,645 |
| |
| Residential mortgage-backed | | | | | | | | | | | |
| Agency | | 3 |
| | 50 |
| | 568 |
| | 25,891 |
| | 26,512 |
| |
| Non-agency | | | | | | | | 2,320 |
| | 2,320 |
| |
| Commercial mortgage-backed | | | | | | | | | | | |
| Agency | | | | 313 |
| | 560 |
| | 1,011 |
| | 1,884 |
| |
| Non-agency | | | | | | 450 |
| | 2,135 |
| | 2,585 |
| |
| Asset-backed | | 19 |
| | 1,877 |
| | 1,940 |
| | 1,293 |
| | 5,129 |
| |
| Other debt | | 683 |
| | 1,784 |
| | 632 |
| | 1,067 |
| | 4,166 |
| |
| Total debt securities available for sale | | $ | 790 |
| | $ | 11,776 |
| | $ | 9,485 |
| | $ | 34,190 |
| | $ | 56,241 |
| |
| Fair value | | $ | 789 |
| | $ | 11,676 |
| | $ | 9,462 |
| | $ | 34,091 |
| | $ | 56,018 |
| |
| Weighted-average yield, GAAP basis | | 2.39 | % | | 2.18 | % | | 2.40 | % | | 3.05 | % | | 2.75 | % | |
| Securities Held to Maturity | | | | | | | | | | | |
| U.S. Treasury and government agencies | | | | | | $ | 478 |
| | $ | 267 |
| | $ | 745 |
| |
| Residential mortgage-backed | | | | | | | | | | | |
| Agency | | | | $ | 79 |
| | 334 |
| | 14,250 |
| | 14,663 |
| |
| Non-agency | | | | | | | | 163 |
| | 163 |
| |
| Commercial mortgage-backed | | | | | | | | | | | |
| Agency | | $ | 156 |
| | 125 |
| | 5 |
| | 52 |
| | 338 |
| |
| Non-agency | | | | | | | | 524 |
| | 524 |
| |
| Asset-backed | | | | | | 113 |
| | 83 |
| | 196 |
| |
| Other debt | | 14 |
| | 431 |
| | 848 |
| | 622 |
| | 1,915 |
| |
| Total debt securities held to maturity | | $ | 170 |
| | $ | 635 |
| | $ | 1,778 |
| | $ | 15,961 |
| | $ | 18,544 |
| |
| Fair value | | $ | 170 |
| — |
| $ | 646 |
| — |
| $ | 1,821 |
| | $ | 15,586 |
| | $ | 18,223 |
| |
| Weighted-average yield, GAAP basis | | 3.53 | % | | 3.84 | % | | 3.52 | % | | 3.21 | % | | 3.26 | % | |
The PNC Financial Services Group, Inc. – Form 10-Q63
|
| | | | | | | | | | | | | | | | | | | | | |
March 31, 2019
Dollars in millions | | 1 Year or Less |
| | After 1 Year through 5 Years |
| | After 5 Years through 10 Years |
| | After 10 Years |
| | Total |
| |
| Securities Available for Sale | | | | | | | | | | | |
| U.S. Treasury and government agencies | | $ | 679 |
| | $ | 13,599 |
| | $ | 3,795 |
| | $ | 785 |
| | $ | 18,858 |
| |
| Residential mortgage-backed | | | | | | | | | | | |
| Agency | | 2 |
| | 52 |
| | 867 |
| | 28,628 |
| | 29,549 |
| |
| Non-agency | | | | | | | | 1,834 |
| | 1,834 |
| |
| Commercial mortgage-backed | | | | | | | | | | | |
| Agency | | | | 590 |
| | 309 |
| | 1,699 |
| | 2,598 |
| |
| Non-agency | | | | | | 332 |
| | 2,499 |
| | 2,831 |
| |
| Asset-backed | | 31 |
| | 2,529 |
| | 1,616 |
| | 1,332 |
| | 5,508 |
| |
| Other | | 476 |
| | 1,522 |
| | 475 |
| | 873 |
| | 3,346 |
| |
| Total securities available for sale | | $ | 1,188 |
| | $ | 18,292 |
| | $ | 7,394 |
| | $ | 37,650 |
| | $ | 64,524 |
| |
| Fair value | | $ | 1,188 |
| | $ | 18,294 |
| | $ | 7,484 |
| | $ | 38,085 |
| | $ | 65,051 |
| |
| Weighted-average yield, GAAP basis | | 2.58 | % | | 2.29 | % | | 2.98 | % | | 3.25 | % | | 2.93 | % | |
| Securities Held to Maturity | | | | | | | | | | | |
| U.S. Treasury and government agencies | | | | | | $ | 490 |
| | $ | 273 |
| | $ | 763 |
| |
| Residential mortgage-backed | | | | | | | | | | | |
| Agency | | | | $ | 78 |
| | 523 |
| | 14,716 |
| | 15,317 |
| |
| Non-agency | | | | | | | | 149 |
| | 149 |
| |
| Commercial mortgage-backed | | | | | | | | | | | |
| Agency | | $ | 11 |
| | 42 |
| | 4 |
| | 50 |
| | 107 |
| |
| Non-agency | | | | | | | | 473 |
| | 473 |
| |
| Asset-backed | | | | 7 |
| | 100 |
| | 67 |
| | 174 |
| |
| Other | | 23 |
| | 621 |
| | 749 |
| | 442 |
| | 1,835 |
| |
| Total securities held to maturity | | $ | 34 |
| | $ | 748 |
| | $ | 1,866 |
| | $ | 16,170 |
| | $ | 18,818 |
| |
| Fair value | | $ | 34 |
| | $ | 768 |
| | $ | 1,928 |
| | $ | 16,078 |
| | $ | 18,808 |
| |
| Weighted-average yield, GAAP basis | | 4.87 | % | | 3.84 | % | | 3.45 | % | | 3.27 | % | | 3.31 | % | |
Weighted-average yields are based on amortized cost with effective yields weighted for the contractual maturity of each security. At March 31, 2018,2019, there were no securities of a single issuer, other than the Federal National Mortgage Association (FNMA), that exceeded 10% of Total shareholders’ equity. The FNMA investments had a total amortized cost of $32.7$37.1 billion and fair value of $31.9$37.0 billion.
The following table presents the fair value of securities that have been either pledged to or accepted from others to collateralize outstanding borrowings.
Table 50:48: Fair Value of Securities Pledged and Accepted as Collateral
| | | In millions | March 31
2018 |
| December 31
2017 |
| March 31
2019 |
| December 31
2018 |
|
| Pledged to others | $ | 8,264 |
| $ | 8,175 |
| $ | 6,055 |
| $ | 7,597 |
|
| Accepted from others: | | | �� | |
Permitted by contract or custom to sell or repledge | $ | 1,134 |
| $ | 1,152 |
| $ | 2,235 |
| $ | 6,905 |
|
| Permitted amount repledged to others | $ | 1,098 |
| $ | 1,097 |
| $ | 1,151 |
| $ | 923 |
|
| |
| (a) | Includes $6.0 billion in fair value of securities accepted from others to collateralize short-term investments in resale agreements at December 31, 2018 that were not repledged to others. |
The securities pledged to others include positions held in our portfolio of investment securities, trading securities and securities accepted as collateral from others that we are permitted by contract or custom to sell or repledge, and were used to secure public and trust deposits, repurchase agreements and for other purposes.
54 The PNC Financial Services Group, Inc. – Form 10-Q
NOTE 6 FAIR VALUE
Fair Value Measurement
We measure certain financial assets and liabilities at fair value. Fair value is defined as the price that would be received to sell an asset or the price that would be paid to transfer a liability on the measurement date, determined using an exit price in the principal or most advantageous market for the asset or liability in an orderly transaction between market participants. The fair value hierarchy established by GAAP requires us to maximize the use of observable inputs when measuring fair value. For more information regarding the fair value hierarchy, see Note 6 Fair Value in our 20172018 Form 10-K.
Assets and Liabilities Measured at Fair Value on a Recurring Basis
For more information on the valuation methodologies used to measure assets and liabilities at fair value on a recurring basis, see Note 6 Fair Value in our 20172018 Form 10-K. The following table summarizes our assets and liabilities measured at fair value on a recurring basis, including instruments for which we have elected the fair value option.
64 The PNC Financial Services Group, Inc. – Form 10-Q
Table 51:49: Fair Value Measurements – Recurring Basis Summary
| | | | March 31, 2018 | | | December 31, 2017 | | March 31, 2019 | | | December 31, 2018 | |
| In millions | Level 1 |
| | Level 2 |
| | Level 3 |
| | Total Fair Value |
| | | Level 1 |
| | Level 2 |
| | Level 3 |
| | Total Fair Value |
| | Level 1 |
| | Level 2 |
| | Level 3 |
| | Total Fair Value |
| | | Level 1 |
| | Level 2 |
| | Level 3 |
| | Total Fair Value |
| |
| Assets | | | | | | | | | | | | | | | | | | | | | | | | | | | | | | | | | | |
| Residential mortgage loans held for sale | | | $ | 615 |
| | $ | 2 |
| | $ | 617 |
| | | | | $ | 829 |
| | $ | 3 |
| | $ | 832 |
| | | | $ | 471 |
| | $ | 2 |
| | $ | 473 |
| | | | | $ | 493 |
| | $ | 2 |
| | $ | 495 |
| |
| Commercial mortgage loans held for sale | | | 153 |
| | 92 |
| | 245 |
| | | | | 723 |
| | 107 |
| | 830 |
| | | | 90 |
| | 73 |
| | 163 |
| | | | | 309 |
| | 87 |
| | 396 |
| |
| Securities available for sale | | | | | | | | | | | | | | | | | | | | | | | | | | | | | | | | |
|
| |
| U.S. Treasury and government agencies | $ | 13,158 |
| | 431 |
| | | | 13,589 |
| | | $ | 14,088 |
| | 433 |
| | | | 14,521 |
| | $ | 18,642 |
| | 349 |
| | | | 18,991 |
| | | $ | 17,753 |
| | 347 |
| | | | 18,100 |
| |
| Residential mortgage-backed | | | | | | | | | | | | | | | | | | | | | | | | | | | | | | | | |
|
| |
| Agency | | | 26,002 |
| | | | 26,002 |
| | | | | 25,406 |
| | | | 25,406 |
| | | | 29,528 |
| | | | 29,528 |
| | | | | 28,993 |
| | | | 28,993 |
| |
| Non-agency | | | 91 |
| | 2,545 |
| | 2,636 |
| | | | | 97 |
| | 2,661 |
| | 2,758 |
| | | | 83 |
| | 2,042 |
| | 2,125 |
| | | | | 83 |
| | 2,128 |
| | 2,211 |
| |
| Commercial mortgage-backed | | | | | | | | | | | | | | | | | | | | | | | | | | | | | | | | |
|
| |
| Agency | | | 1,807 |
| | | | 1,807 |
| | | | | 1,904 |
| | | | 1,904 |
| | | | 2,573 |
| | | | 2,573 |
| | | | | 2,577 |
| | | | 2,577 |
| |
| Non-agency | | | 2,570 |
| | | | 2,570 |
| | | | | 2,613 |
| | | | 2,613 |
| | | | 2,832 |
| | | | 2,832 |
| | | | | 2,657 |
| | | | 2,657 |
| |
| Asset-backed | | | 4,862 |
| | 321 |
| | 5,183 |
| | | | | 5,065 |
| | 332 |
| | 5,397 |
| | | | 5,299 |
| | 266 |
| | 5,565 |
| | | | | 4,698 |
| | 274 |
| | 4,972 |
| |
| Other debt | | | 4,137 |
| | 94 |
| | 4,231 |
| | | | | 4,347 |
| | 87 |
| | 4,434 |
| | |
| Total debt securities | 13,158 |
| | 39,900 |
| | 2,960 |
| | 56,018 |
| | | 14,088 |
| | 39,865 |
| | 3,080 |
| | 57,033 |
| | |
| Other (a) | | | | | | |
|
| | | 524 |
| | 61 |
| | | | 585 |
| | |
| Other | | | | 3,352 |
| | 85 |
| | 3,437 |
| | | | | 3,795 |
| | 84 |
| | 3,879 |
| |
| Total securities available for sale | 13,158 |
| | 39,900 |
| | 2,960 |
| | 56,018 |
| | | 14,612 |
| | 39,926 |
| | 3,080 |
| | 57,618 |
| | 18,642 |
| | 44,016 |
| | 2,393 |
| | 65,051 |
| | | 17,753 |
| | 43,150 |
| | 2,486 |
| | 63,389 |
| |
| Loans | | | 511 |
| | 302 |
| | 813 |
| | | | | 571 |
| | 298 |
| | 869 |
| | | | 486 |
| | 272 |
| | 758 |
| | | | | 510 |
| | 272 |
| | 782 |
| |
| Equity investments (b) | 489 |
| | 60 |
| | 1,129 |
| | 1,905 |
| | | | | | | 1,036 |
| | 1,265 |
| | |
| Equity investments (a) | | 569 |
| | | | 1,217 |
| | 1,974 |
| | | 751 |
| | | | 1,255 |
| | 2,209 |
| |
| Residential mortgage servicing rights | | | | | 1,256 |
| | 1,256 |
| | | | | | | 1,164 |
| | 1,164 |
| | | | | | 1,131 |
| | 1,131 |
| | | | | | | 1,257 |
| | 1,257 |
| |
| Commercial mortgage servicing rights | | | | | 723 |
| | 723 |
| | | | | | | 668 |
| | 668 |
| | | | | | 681 |
| | 681 |
| | | | | | | 726 |
| | 726 |
| |
| Trading securities (c) | 827 |
| | 1,678 |
| | 2 |
| | 2,507 |
| | | 1,243 |
| | 1,670 |
| | 2 |
| | 2,915 |
| | |
| Financial derivatives (c) (d) | 2 |
| | 1,889 |
| | 12 |
| | 1,903 |
| | |
|
| | 2,864 |
| | 10 |
| | 2,874 |
| | |
| Trading securities (b) | | 1,991 |
| | 1,552 |
| | 2 |
| | 3,545 |
| | | 2,137 |
| | 1,777 |
| | 2 |
| | 3,916 |
| |
| Financial derivatives (b) (c) | | 4 |
| | 2,308 |
| | 56 |
| | 2,368 |
| | | 3 |
| | 2,053 |
| | 25 |
| | 2,081 |
| |
| Other assets | 275 |
| | 250 |
| | 68 |
| | 593 |
| | | 278 |
| | 253 |
| | 107 |
| | 638 |
| | 318 |
| | 129 |
| | | | 447 |
| | | 291 |
| | 157 |
| | 45 |
| | 493 |
| |
| Total assets | $ | 14,751 |
| | $ | 45,056 |
| | $ | 6,546 |
| | $ | 66,580 |
| | | $ | 16,133 |
| | $ | 46,836 |
| | $ | 6,475 |
| | $ | 69,673 |
| | $ | 21,524 |
| | $ | 49,052 |
| | $ | 5,827 |
| | $ | 76,591 |
| | | $ | 20,935 |
|
| $ | 48,449 |
|
| $ | 6,157 |
|
| $ | 75,744 |
| |
| Liabilities | | | | | | | | | | | | | | | | | | | | | | | | | | | | | | | | |
|
| |
| Other borrowed funds | $ | 963 |
| | $ | 205 |
| | $ | 9 |
| | $ | 1,177 |
| | | $ | 1,079 |
| | $ | 254 |
| | $ | 11 |
| | $ | 1,344 |
| | $ | 1,389 |
| | $ | 99 |
| | $ | 6 |
| | $ | 1,494 |
| | | $ | 868 |
| | $ | 132 |
| | $ | 7 |
| | $ | 1,007 |
| |
| Financial derivatives (d) (e) |
|
| | 2,505 |
| | 437 |
| | 2,942 |
| | |
|
| | 2,369 |
| | 487 |
| | 2,856 |
| | |
| Financial derivatives (c) (d) | | 3 |
| | 1,672 |
| | 230 |
| | 1,905 |
| | | 1 |
| | 2,021 |
| | 268 |
| | 2,290 |
| |
| Other liabilities | | | | | 42 |
| | 42 |
| | | | | | | 33 |
| | 33 |
| | | | | | 62 |
| | 62 |
| | | | | | | 58 |
| | 58 |
| |
| Total liabilities | $ | 963 |
| | $ | 2,710 |
| | $ | 488 |
| | $ | 4,161 |
| | | $ | 1,079 |
| | $ | 2,623 |
| | $ | 531 |
| | $ | 4,233 |
| | $ | 1,392 |
| | $ | 1,771 |
| | $ | 298 |
| | $ | 3,461 |
| | | $ | 869 |
| | $ | 2,153 |
| | $ | 333 |
| | $ | 3,355 |
| |
| |
| (a) | Prior period amounts included $.6 billion of available for sale securities, primarily money market funds, that were reclassified to equity investments on January 1, 2018 as the result of the adoption of ASU 2016-01. See the Recently Adopted Accounting Standards portion of Note 1 for additional details on this adoption. |
| |
(b) | Certain investments that are measured at fair value using the net asset value (NAV) per share (or its equivalent) practical expedient have not been classified in the fair value hierarchy. The fair value amounts presented in this table are intended to permit reconciliation of the fair value hierarchy to the amounts presented on the Consolidated Balance Sheet. |
| |
(c)(b) | Included in Other assets on the Consolidated Balance Sheet. |
| |
(d)(c) | Amounts at March 31, 20182019 and December 31, 20172018 are presented gross and are not reduced by the impact of legally enforceable master netting agreements that allow us to net positive and negative positions and cash collateral held or placed with the same counterparty. See Note 9 Financial Derivatives for additional information related to derivative offsetting. |
| |
(e)(d) | Included in Other liabilities on the Consolidated Balance Sheet. |
The PNC Financial Services Group, Inc. – Form 10-Q 6555
Reconciliations of assets and liabilities measured at fair value on a recurring basis using Level 3 inputs for the three months ended March 31, 20182019 and 20172018 follow:
Table 52:50: Reconciliation of Level 3 Assets and Liabilities
Three Months Ended March 31, 2018 2019
| | | | | Total realized / unrealized
gains or losses for the
period (a) | | | | Unrealized
gains / losses
on assets and
liabilities held on
Consolidated
Balance Sheet at
Mar. 31, 2018
(a) (b) | | Total realized / unrealized
gains or losses for the
period (a) | | | | | Unrealized
gains / losses
on assets and
liabilities held on
Consolidated
Balance Sheet at
Mar. 31, 2019
(a) (b) |
Level 3 Instruments Only In millions | Fair
Value
Dec. 31,
2017 |
| Included in
Earnings |
| Included
in Other
comprehensive
income | | Purchases |
| Sales |
| Issuances |
| Settlements |
| Transfers
into
Level 3 |
| Transfers
out of
Level 3 |
| | Fair
Value
Mar. 31,
2018 |
| Fair
Value
Dec. 31,
2018 |
| Included in
Earnings |
| Included
in Other
comprehensive
income | | Purchases |
| Sales |
| Issuances |
| Settlements |
| Transfers
into
Level 3 |
| | Transfers
out of
Level 3 |
| Fair
Value Mar. 31, 2019 |
|
| Assets | | | | | | | | | | | | | | | |
Residential mortgage loans
held for sale | $ | 3 |
| | | | $ | 1 |
| $ | (1 | ) | | $ | 2 |
| $ | (3 | ) | | $ | 2 |
| | | $ | 2 |
| | | | $ | 1 |
| $ | (1 | ) | | $ | 3 |
| | $ | (3 | ) | $ | 2 |
| | |
Commercial mortgage
loans held for sale | 107 |
|
| | |
| $ | (15 | ) | | | 92 |
|
| | 87 |
| $ | 1 |
| | | $ | (15 | ) | | | | 73 |
| $ | 1 |
| |
| Securities available for sale | | | | | | | | | | | | | | | |
Residential mortgage-
backed non-agency | 2,661 |
| $ | 19 |
| | $ | 3 |
| | (138 | ) | | | 2,545 |
|
| | 2,128 |
| 18 |
| | $ | 2 |
| | (106 | ) | | | | 2,042 |
| | |
| Asset-backed | 332 |
| (1 | ) | | 5 |
| |
| | (15 | ) | | | 321 |
| | | 274 |
| | | 2 |
| | (10 | ) | | | | 266 |
| | |
| Other debt | 87 |
| 5 |
| | 1 |
| 2 |
|
| | (1 | ) | | | 94 |
| | | |
| Other | | 84 |
| | | | 1 |
| | | | 85 |
| | |
Total securities
available for sale | 3,080 |
| 23 |
| | 9 |
| 2 |
|
| | (154 | ) | | | 2,960 |
|
| | 2,486 |
| 18 |
|
| 4 |
| 1 |
|
|
|
|
| (116 | ) |
|
|
|
|
| 2,393 |
| | |
| Loans | 298 |
| 2 |
| | | 37 |
| (7 | ) | | (18 | ) | 2 |
| (12 | ) | | 302 |
| $ | 2 |
| | 272 |
| 3 |
| | | 20 |
| (3 | ) | | (14 | ) | 2 |
| | (8 | ) | 272 |
| 1 |
| |
| Equity investments | 1,036 |
| 26 |
| | | 82 |
| (15 | ) | |
| | 1,129 |
| 25 |
| | 1,255 |
| 52 |
| | | 45 |
| (135 | ) | | | | 1,217 |
| | |
Residential mortgage
servicing rights | 1,164 |
| 107 |
| | | 9 |
| | $ | 13 |
| (37 | ) | | | 1,256 |
| 105 |
| | 1,257 |
| (106 | ) | | | 6 |
| | 7 |
| (33 | ) | | | | 1,131 |
| (106 | ) | |
Commercial mortgage
servicing rights | 668 |
| 48 |
| | | 23 |
| | 17 |
| (33 | ) | | | 723 |
| 48 |
| | 726 |
| (33 | ) | | | 19 |
| | 7 |
| (38 | ) | | | | 681 |
| (33 | ) | |
| Trading securities | 2 |
| | | | | 2 |
| | | 2 |
| | | | | | 2 |
| | |
| Financial derivatives | 10 |
| 7 |
| | | 1 |
| | (6 | ) | | | 12 |
| 9 |
| | 25 |
| 39 |
| | | 2 |
| | (10 | ) | | | | 56 |
| 41 |
| |
| Other assets | 107 |
| 3 |
| | | (42 | ) | | | 68 |
| 3 |
| | 45 |
| | | | (45 | ) | | | |
|
| | |
| Total assets | $ | 6,475 |
| $ | 216 |
| | $ | 9 |
| $ | 155 |
| $ | (23 | ) | $ | 30 |
| $ | (305 | ) | $ | 4 |
| $ | (15 | ) | | $ | 6,546 |
| $ | 192 |
| | $ | 6,157 |
| $ | (26 | ) |
| $ | 4 |
| $ | 94 |
| $ | (139 | ) | $ | 14 |
| $ | (271 | ) | $ | 5 |
|
| $ | (11 | ) | $ | 5,827 |
| $ | (96 | ) | |
| Liabilities | | | | | | | | | | | | | | | |
| Other borrowed funds | $ | 11 |
| | | | $ | 19 |
| $ | (21 | ) | | | $ | 9 |
| | | $ | 7 |
| | | | $ | 14 |
| $ | (15 | ) | | | | $ | 6 |
| | |
| Financial derivatives | 487 |
| $ | 10 |
| | | $ | 3 |
| | (63 | ) | | | 437 |
| $ | 5 |
| | 268 |
| $ | 30 |
| | | $ | 2 |
| | (70 | ) | | | | 230 |
| $ | 34 |
| |
| Other liabilities | 33 |
| 2 |
| | | $ | 12 |
| | 5 |
| (10 | ) | | | 42 |
| 2 |
| | 58 |
| 9 |
| | | 2 |
| (7 | ) | | | | 62 |
| 9 |
| |
| Total liabilities | $ | 531 |
| $ | 12 |
| | | $ | 12 |
| $ | 3 |
| $ | 24 |
| $ | (94 | ) | | | $ | 488 |
| $ | 7 |
| | $ | 333 |
| $ | 39 |
|
|
|
|
|
| $ | 2 |
| $ | 16 |
| $ | (92 | ) |
|
|
|
|
| $ | 298 |
| $ | 43 |
| |
| Net gains (losses) | | $ | 204 |
| (c) | | | | $ | 185 |
| (d) | | $ | (65 | ) | (c) | | | | | $ | (139 | ) | (d) |
6656 The PNC Financial Services Group, Inc. – Form 10-Q
Three Months Ended March 31, 20172018
| | | | | Total realized / unrealized
gains or losses for the
period (a) | | | | Unrealized
gains / losses
on assets and
liabilities held on
Consolidated
Balance Sheet at
Mar. 31, 2017
(a) (b) | | Total realized / unrealized
gains or losses for the
period (a) | | | | Unrealized gains/losses on assets and liabilities held on Consolidated Balance Sheet at Mar. 31, 2018
(a) (b) |
Level 3 Instruments Only In millions | Fair
Value
Dec. 31,
2016 |
| Included in
Earnings |
| Included
in Other
comprehensive
income | | Purchases |
| Sales |
| Issuances |
| Settlements |
| Transfers
into
Level 3 |
| Transfers
out of
Level 3 |
| | Fair
Value
Mar.
31,
2017 |
| Dec. 31, 2017 |
| Included in Earnings |
| Included in Other comprehensive income | | Purchases |
| Sales |
| Issuances |
| Settlements |
| Transfers into Level 3 |
| Transfers out of Level 3 |
| | Fair Value Mar. 31, 2018 |
|
| Assets | | | | | | | | | | | | | | | |
Residential mortgage loans
held for sale | $ | 2 |
| | | | $ | 2 |
|
| | $ | 2 |
| $ | (2 | ) | | $ | 4 |
| | | $ | 3 |
| | | | $ | 1 |
| $ | (1 | ) | | $ | 2 |
| $ | (3 | ) | | $ | 2 |
| | |
Commercial mortgage
loans held for sale | 1,400 |
| $ | 9 |
| | | $ | (1,617 | ) | $ | 801 |
| $ | (12 | ) | | | 581 |
| $ | (5 | ) | | 107 |
|
| | |
| $ | (15 | ) | | | 92 |
|
| |
| Securities available for sale | | | | | | | | | | | | | | |
Residential mortgage-
backed non-agency | 3,254 |
| 26 |
| | $ | 18 |
| |
| | (202 | ) | | | 3,096 |
|
| | 2,661 |
| $ | 19 |
| | $ | 3 |
| | (138 | ) | | | 2,545 |
| | |
| Asset-backed | 403 |
| 4 |
| | 4 |
| | (25 | ) | | (20 | ) | | | 366 |
| | | 332 |
| (1 | ) | | 5 |
| |
| | (15 | ) | | | 321 |
| | |
| Other debt | 66 |
|
| | 9 |
| 1 |
| (1 | ) | |
| | | 75 |
| | | |
| Other | | 87 |
| 5 |
| | 1 |
| 2 |
|
| | (1 | ) | | | 94 |
| | |
Total securities
available for sale | 3,723 |
| 30 |
| | 31 |
| 1 |
| (26 | ) | | (222 | ) | | | 3,537 |
|
| | 3,080 |
| 23 |
| | 9 |
| 2 |
|
| | (154 | ) | | | 2,960 |
| | |
| Loans | 335 |
| 1 |
| | | 22 |
| (4 | ) | | (19 | ) | 2 |
| (14 | ) | | 323 |
|
| | 298 |
| 2 |
| | | 37 |
| (7 | ) | | (18 | ) | 2 |
| (12 | ) | | 302 |
| $ | 2 |
| |
| Equity investments | 1,331 |
| 96 |
| | | 37 |
| (175 | ) | |
| (183 | ) | (e) | 1,106 |
| 67 |
| | 1,036 |
| 26 |
| | | 82 |
| (15 | ) | | | 1,129 |
| 25 |
| |
Residential mortgage
servicing rights | 1,182 |
| 18 |
| | | 83 |
| | 17 |
| (39 | ) | | | 1,261 |
| 17 |
| | 1,164 |
| 107 |
| | | 9 |
| | $ | 13 |
| (37 | ) | | | 1,256 |
| 105 |
| |
Commercial mortgage
servicing rights | 576 |
| 13 |
| | | 13 |
| | 29 |
| (25 | ) | | | 606 |
| 13 |
| | 668 |
| 48 |
| | | 23 |
| | 17 |
| (33 | ) | | | 723 |
| 48 |
| |
| Trading securities | 2 |
| | | |
| | | 2 |
| | | 2 |
| | | | | 2 |
| | |
| Financial derivatives | 40 |
| (1 | ) | | |
| | (15 | ) | | | 24 |
| 22 |
| | 10 |
| 7 |
| | | 1 |
| | (6 | ) | | | 12 |
| 9 |
| |
| Other assets | 239 |
| (2 | ) | |
| |
| | (155 | ) | | | 82 |
| (2 | ) | | 107 |
| 3 |
| | | (42 | ) | | | 68 |
| 3 |
| |
| Total assets | $ | 8,830 |
| $ | 164 |
| | $ | 31 |
| $ | 158 |
| $ | (1,822 | ) | $ | 847 |
| $ | (487 | ) | $ | 4 |
| $ | (199 | ) | | $ | 7,526 |
| $ | 112 |
| | $ | 6,475 |
| $ | 216 |
| | $ | 9 |
| $ | 155 |
| $ | (23 | ) | $ | 30 |
| $ | (305 | ) | $ | 4 |
| $ | (15 | ) | | $ | 6,546 |
| $ | 192 |
| |
| Liabilities | | | | | | | | | | | | | | |
| Other borrowed funds | $ | 10 |
| | | | $ | 19 |
| $ | (22 | ) | | | $ | 7 |
| | | $ | 11 |
| | | | $ | 19 |
| $ | (21 | ) | | | $ | 9 |
| | |
| Financial derivatives | 414 |
| $ | 9 |
| | | $ | 2 |
| | (171 | ) | | | 254 |
| $ | 7 |
| | 487 |
| $ | 10 |
| | | $ | 3 |
| | (63 | ) | | | 437 |
| $ | 5 |
| |
| Other liabilities | 9 |
| 16 |
| | | 77 |
| (71 | ) | | | 31 |
| 16 |
| | 33 |
| 2 |
| | | $ | 12 |
| | 5 |
| (10 | ) | | | 42 |
| 2 |
| |
| Total liabilities | $ | 433 |
| $ | 25 |
| | | $ | 2 |
| $ | 96 |
| $ | (264 | ) | | | $ | 292 |
| $ | 23 |
| | $ | 531 |
| $ | 12 |
| | | $ | 12 |
| $ | 3 |
| $ | 24 |
| $ | (94 | ) | | | $ | 488 |
| $ | 7 |
| |
| Net gains (losses) | | $ | 139 |
| (c) | | | | $ | 89 |
| (d) | | $ | 204 |
| (c) | | | | $ | 185 |
| (d) |
| |
| (a) | Losses for assets are bracketed while losses for liabilities are not. |
| |
| (b) | The amount of the total gains or losses for the period included in earnings that is attributable to the change in unrealized gains or losses related to those assets and liabilities held at the end of the reporting period. |
| |
| (c) | Net gains (losses) realized and unrealized included in earnings related to Level 3 assets and liabilities included amortization and accretion. The amortization and accretion amounts were included in Interest income on the Consolidated Income Statement and the remaining net gains (losses) realized and unrealized were included in Noninterest income on the Consolidated Income Statement. |
| |
| (d) | Net unrealized gains (losses) related to assets and liabilities held at the end of the reporting period were included in Noninterest income on the Consolidated Income Statement. |
| |
(e) | Reflects transfer out of Level 3 associated with change in valuation methodology for certain equity investments subject to the Volcker Rule provisions of the Dodd-Frank Act. |
An instrument’sinstrument's categorization within the hierarchy is based on the lowest level of input that is significant to the fair value measurement. Changes from one quarter to the next related to the observability of inputs to a fair value measurement may result in a reclassification (transfer) of assets or liabilities between hierarchy levels. Our policy is to recognize transfers in and transfers out as of the end of the reporting period.
The PNC Financial Services Group, Inc. – Form 10-Q 6757
Quantitative information about the significant unobservable inputs within Level 3 recurring assets and liabilities follows:
Table 53:51: Fair Value Measurements – Recurring Quantitative Information
March 31, 20182019
| | Level 3 Instruments Only Dollars in millions | Fair Value |
| Valuation Techniques | Unobservable Inputs | Range (Weighted-Average) | Fair Value |
| Valuation Techniques | Unobservable Inputs | Range (Weighted-Average) |
| Commercial mortgage loans held for sale | $ | 92 |
| Discounted cash flow | Spread over the benchmark curve (a) | 525bps - 1,580bps (1,069bps) | $ | 73 |
| Discounted cash flow | Spread over the benchmark curve (a) | 530bps - 2,060bps (1,368bps) |
Residential mortgage-backed
non-agency securities | 2,545 |
| Priced by a third-party vendor using a discounted cash flow pricing model | Constant prepayment rate (CPR) | 1.0% - 33.0% (10.9%) | 2,042 |
| Priced by a third-party vendor using a discounted cash flow pricing model | Constant prepayment rate | 1.0% - 36.2% (10.5%) |
| Constant default rate (CDR) | 0.0% - 17.8% (5.7%) | Constant default rate | 0.0% - 15.9% (5.0%) |
| Loss severity | 20.0% - 100.0% (50.5%) | Loss severity | 10.0% - 95.7% (49.3%) |
| Spread over the benchmark curve (a) | 196bps weighted-average | Spread over the benchmark curve (a) | 206bps weighted-average |
| Asset-backed securities | 321 |
| Priced by a third-party vendor using a discounted cash flow pricing model | Constant prepayment rate (CPR) | 1.0% - 19.0% (7.9%) | 266 |
| Priced by a third-party vendor using a discounted cash flow pricing model | Constant prepayment rate | 1.0% - 22.0% (8.2%) |
| Constant default rate (CDR) | 2.0% - 11.8% (5.1%) | Constant default rate | 1.0% - 18.5% (3.6%) |
| Loss severity | 16.0% - 100.0% (67.1%) | Loss severity | 15.0% - 100.0% (58.0%) |
| Spread over the benchmark curve (a) | 126bps weighted-average | Spread over the benchmark curve (a) | 220bps weighted-average |
| Loans | 142 |
| Consensus pricing (b) | Cumulative default rate | 11.0% - 100.0% (82.5%) | 131 |
| Consensus pricing (b) | Cumulative default rate | 11.0% - 100.0% (79.8%) |
| Loss severity | 0.0% - 100.0% (18.5%) | Loss severity | 0.0% - 100.0% (16.5%) |
| Discount rate | 5.5% - 8.0% (5.7%) | Discount rate | 5.5% - 8.3% (5.8%) |
| | 99 |
| Discounted cash flow | Loss severity | 8.0% weighted-average | 90 |
| Discounted cash flow | Loss severity | 8.0% weighted-average |
| Discount rate | 5.4% weighted-average | Discount rate | 5.5% weighted-average |
| | 61 |
| Consensus pricing (b) | Credit and Liquidity discount | 0.0% - 99.0% (61.1%) | 51 |
| Consensus pricing (b) | Credit and Liquidity discount | 0.0% - 99.0% (61.2%) |
| Equity investments | 1,129 |
| Multiple of adjusted earnings | Multiple of earnings | 4.9x - 29.7x (8.3x) | 1,217 |
| Multiple of adjusted earnings | Multiple of earnings | 5.0x - 19.7x (8.5x) |
| Residential mortgage servicing rights | 1,256 |
| Discounted cash flow | Constant prepayment rate (CPR) | 0.0% - 44.4% (8.7%) | 1,131 |
| Discounted cash flow | Constant prepayment rate | 0.0% - 60.3% (10.5%) |
| Spread over the benchmark curve (a) | 346bps - 1,811bps (831bps) | Spread over the benchmark curve (a) | 280bps - 1,438bps (805bps) |
| Commercial mortgage servicing rights | 723 |
| Discounted cash flow | Constant prepayment rate (CPR) | 7.0% - 13.7% (7.9%) | 681 |
| Discounted cash flow | Constant prepayment rate | 4.3% - 15.7% (5.5%) |
| Discount rate | 6.3% - 8.3% (8.1%) | Discount rate | 6.2% - 8.3% (8.2%) |
Financial derivatives - Swaps related to
sales of certain Visa Class B
common shares | (363 | ) | Discounted cash flow | Estimated conversion factor of Visa
Class B shares into Class A shares | 163.8% weighted-average | (216 | ) | Discounted cash flow | Estimated conversion factor of Visa Class B shares into Class A shares | 163.0% weighted-average |
Estimated growth rate of Visa
Class A share price | 16.0% | Estimated annual growth rate of Visa Class A share price | 16.0% |
Estimated length of litigation
resolution date | Q2 2021
| Estimated length of litigation resolution date | Q4 2020 |
Insignificant Level 3 assets, net of
liabilities (c) | 53 |
| | | 63 |
| | |
| Total Level 3 assets, net of liabilities (d) | $ | 6,058 |
| | | $ | 5,529 |
| | |
6858 The PNC Financial Services Group, Inc. – Form 10-Q
December 31, 20172018
| | Level 3 Instruments Only Dollars in millions | Fair Value |
| Valuation Techniques | Unobservable Inputs | Range (Weighted-Average) | Fair Value |
| Valuation Techniques | Unobservable Inputs | Range (Weighted-Average) |
| Commercial mortgage loans held for sale | $ | 107 |
| Discounted cash flow | Spread over the benchmark curve (a) | 525bps - 1,470bps (1020bps) | $ | 87 |
| Discounted cash flow | Spread over the benchmark curve (a) | 535bps - 1,900bps (1,217bps) |
Residential mortgage-backed
non-agency securities | 2,661 |
| Priced by a third-party vendor using a discounted cash flow pricing model | Constant prepayment rate (CPR) | 1.0% - 31.6% (10.8%) | 2,128 |
| Priced by a third-party vendor using a discounted cash flow pricing model | Constant prepayment rate | 1.0% - 33.0% (11.8%) |
| Constant default rate (CDR) | 0.1% - 18.8% (5.4%) | Constant default rate | 0.0% - 18.8% (5.1%) |
| Loss severity | 15.0% - 100.0% (51.5%) | Loss severity | 10.0% - 100.0% (50.8%) |
| Spread over the benchmark curve (a) | 190bps weighted-average | Spread over the benchmark curve (a) | 216bps weighted-average |
| Asset-backed securities | 332 |
| Priced by a third-party vendor using a discounted cash flow pricing model | Constant prepayment rate (CPR) | 1.0% - 19.0% (7.9%) | 274 |
| Priced by a third-party vendor using a discounted cash flow pricing model | Constant prepayment rate | 1.0% - 19.0% (8.5%) |
| Constant default rate (CDR) | 2.0% - 11.8% (5.4%) | Constant default rate | 1.0% - 18.5% (4.0%) |
| Loss severity | 15.0% - 100.0% (68.5%) | Loss severity | 15.0% - 100.0% (63.8%) |
| Spread over the benchmark curve (a) | 179bps weighted-average | Spread over the benchmark curve (a) | 198bps weighted-average |
| Loans | 133 |
| Consensus pricing (b) | Cumulative default rate | 11.0% - 100.0% (85.7%) | 129 |
| Consensus pricing (b) | Cumulative default rate | 11.0% - 100.0% (81.8%) |
| Loss severity | 0.0% - 100.0% (20.6%) | Loss severity | 0.0% - 100.0% (17.2%) |
| Discount rate | 5.5% - 8.0% (5.7%) | Discount rate | 5.5% - 8.3% (5.8%) |
| | 104 |
| Discounted cash flow | Loss severity | 8.0% weighted-average | 90 |
| Discounted cash flow | Loss severity | 8.0% weighted-average |
| Discount rate | 4.9% weighted-average | Discount rate | 5.8% weighted-average |
| | 61 |
| Consensus pricing (b) | Credit and Liquidity discount | 0.0% - 99.0% (61.1%) | 53 |
| Consensus pricing (b) | Credit and Liquidity discount | 0.0% - 99.0% (61.3%) |
| Equity investments | 1,036 |
| Multiple of adjusted earnings | Multiple of earnings | 4.5x - 29.7x (8.3x) | 1,255 |
| Multiple of adjusted earnings | Multiple of earnings | 4.5x - 16.0x (8.4x) |
| Residential mortgage servicing rights | 1,164 |
| Discounted cash flow | Constant prepayment rate (CPR) | 0.0% - 36.7% (10.0%) | 1,257 |
| Discounted cash flow | Constant prepayment rate | 0.0% - 54.5% (8.7%) |
| Spread over the benchmark curve (a) | 390bps - 1,839bps (830bps) | Spread over the benchmark curve (a) | 492bps - 1,455bps (806bps) |
| Commercial mortgage servicing rights | 668 |
| Discounted cash flow | Constant prepayment rate (CPR) | 7.7% - 14.2% (8.5%) | 726 |
| Discounted cash flow | Constant prepayment rate | 4.6% - 14.7% (5.7%) |
| Discount rate | 6.4% - 7.9% (7.8%) | Discount rate | 6.9% - 8.5% (8.4%) |
Financial derivatives - Swaps related to
sales of certain Visa Class B
common shares | (380 | ) | Discounted cash flow | Estimated conversion factor of Visa Class B shares into Class A shares | 163.8% weighted-average | (210 | ) | Discounted cash flow | Estimated conversion factor of Visa Class B shares into Class A shares | 163.0% weighted-average |
Estimated growth rate of Visa Class
A share price | 16.0% | Estimated annual growth rate of Visa Class A share price | 16.0% |
Estimated length of litigation
resolution date | Q2 2021 | Estimated length of litigation
resolution date | Q4 2020 |
Insignificant Level 3 assets, net of
liabilities (c) | 58 |
| | | 35 |
| | |
| Total Level 3 assets, net of liabilities (d) | $ | 5,944 |
| | | $ | 5,824 |
| | |
| |
| (a) | The assumed yield spread over the benchmark curve for each instrument is generally intended to incorporate non-interest rate risks, such as credit and liquidity risks. |
| |
| (b) | Consensus pricing refers to fair value estimates that are generally internally developed using information such as dealer quotes or other third-party provided valuations or comparable asset prices. |
| |
| (c) | Represents the aggregate amount of Level 3 assets and liabilities measured at fair value on a recurring basis that are individually and in the aggregate insignificant. The amount includes certain financial derivative assets and liabilities, trading securities, other debt securities, residential mortgage loans held for sale, other assets, other borrowed funds and other liabilities. |
| |
| (d) | Consisted of total Level 3 assets of $6.5$5.8 billion and total Level 3 liabilities of $.5$.3 billion as of March 31, 20182019 and $6.4$6.1 billion and $.5$.3 billion as of December 31, 2017,2018, respectively. |
The PNC Financial Services Group, Inc. – Form 10-Q69
Financial Assets Accounted for at Fair Value on a Nonrecurring Basis
We may be required to measure certain financial assets at fair value on a nonrecurring basis. These adjustments to fair value usually result from the application of lower of amortized cost or fair value accounting or write-downs of individual assets due to impairment and are included in Table 54 and Table 55.52. For more information regarding the valuation methodologies of our financial assets measured at fair value on a nonrecurring basis, see Note 6 Fair Value in our 20172018 Form 10-K.
Table 54:52: Fair Value Measurements – Nonrecurring (a) (b) (c)
| | | | Fair Value (a) | | Gains (Losses) Three months ended | | Fair Value | | Gains (Losses) Three months ended | | |
| In millions | March 31
2018 |
| | December 31
2017 |
| | March 31
2018 |
| | March 31
2017 |
| | March 31
2019 |
| | December 31
2018 |
| | March 31
2019 |
| | March 31
2018 |
| | |
| Assets | | | | | | | | | | | | | | | | | |
| Nonaccrual loans | $ | 137 |
| | $ | 100 |
| | $ | (23 | ) | | $ | (6 | ) | | $ | 127 |
| | $ | 128 |
| | $ | (18 | ) | | $ | (23 | ) | | |
| OREO, foreclosed and other assets | 35 |
| | 70 |
| | | | (4 | ) | | |
| OREO and foreclosed assets | | 31 |
| | 59 |
| | (2 | ) | | | | |
| Long-lived assets | 15 |
| | 80 |
| | (2 | ) | | 3 |
| | 8 |
| | 11 |
| | (4 | ) | | (2 | ) | | |
| Total assets | $ | 187 |
| | $ | 250 |
| | $ | (25 | ) | | $ | (7 | ) | | $ | 166 |
| | $ | 198 |
| | $ | (24 | ) | | $ | (25 | ) | | |
| |
| (a) | All Level 3 asfor the periods presented. |
| |
| (b) | Valuation techniques applied were fair value of March 31, 2018 and December 31, 2017.property or collateral. |
Quantitative information about the significant unobservable inputs within Level 3 nonrecurring assets follows:
Table 55: Fair Value Measurements – Nonrecurring Quantitative Information
|
| | | | | | |
Level 3 Instruments Only In millions | Fair Value |
| | Valuation Techniques | Unobservable Inputs |
| March 31, 2018 | | | | |
| Assets | | | | |
| Nonaccrual loans | $ | 137 |
| | Fair value of property or collateral | Appraised value/sales price |
| OREO, foreclosed and other assets | 35 |
| | Fair value of property or collateral | Appraised value/sales price |
| Long-lived assets | 15 |
| | Fair value of property or collateral | Appraised value/sales price |
| Total assets | $ | 187 |
| | | |
| December 31, 2017 | | | | |
| Assets | | | | |
| Nonaccrual loans | $ | 100 |
| | Fair value of property or collateral | Appraised value/sales price |
| OREO, foreclosed and other assets | 70 |
| | Fair value of property or collateral | Appraised value/sales price |
| Long-lived assets | 47 |
| | Fair value of property or collateral | Appraised value/sales price |
| | 20 |
| | Fair value of property or collateral | Broker opinion |
| | 13 |
| | Fair value of property or collateral | Projected income/required improvement costs |
| Total assets | $ | 250 |
| | | |
| |
| (c) | Unobservable inputs used were appraised value/sales price, broker opinions or projected income/required improvement costs. Additional quantitative information was not meaningful for the periods presented. |
70The PNC Financial Services Group, Inc. – Form 10-Q59
Financial Instruments Accounted for under Fair Value Option
We elect the fair value option to account for certain financial instruments. For more information on these financial instruments for which the fair value option election has been made, see Note 6 Fair Value in our 20172018 Form 10-K.
Fair values and aggregate unpaid principal balances of certain items for which we elected the fair value option follow:
Table 56:53: Fair Value Option – Fair Value and Principal Balances
| | | | | | | | | | March 31, 2019 | | December 31, 2018 | |
| In millions | Fair Value |
| | Aggregate Unpaid Principal Balance |
| | Difference |
| | Fair Value |
| | Aggregate Unpaid Principal Balance |
| | Difference |
| | Fair Value |
| | Aggregate Unpaid Principal Balance |
| | Difference |
| |
| March 31, 2018 | | | | | | | |
| Assets | | | | | | | | | | | | | | | | | | |
| Residential mortgage loans held for sale | | | | | | | | | | | | | | | | | | |
| Performing loans | $ | 604 |
| | $ | 591 |
| | $ | 13 |
| | $ | 467 |
| | $ | 450 |
| | $ | 17 |
| | $ | 489 |
| | $ | 472 |
| | $ | 17 |
| |
| Accruing loans 90 days or more past due | 3 |
| | 3 |
| |
|
| | 3 |
| | 3 |
| |
|
| | 2 |
| | 2 |
| |
|
| |
| Nonaccrual loans | 10 |
| | 11 |
| | (1 | ) | | 3 |
| | 4 |
| | (1 | ) | | 4 |
| | 4 |
| |
| |
| Total | $ | 617 |
| | $ | 605 |
| | $ | 12 |
| | $ | 473 |
| | $ | 457 |
| | $ | 16 |
| | $ | 495 |
| | $ | 478 |
| | $ | 17 |
| |
| Commercial mortgage loans held for sale (a) | | | | | | | | | | | | | | | | | | |
| Performing loans | $ | 244 |
| | $ | 264 |
| | $ | (20 | ) | | $ | 163 |
| | $ | 183 |
| | $ | (20 | ) | | $ | 396 |
| | $ | 411 |
| | $ | (15 | ) | |
| Nonaccrual loans | 1 |
| | 2 |
| | (1 | ) | |
|
| |
|
| |
|
| |
| |
| |
| |
| Total | $ | 245 |
| | $ | 266 |
| | $ | (21 | ) | | $ | 163 |
| | $ | 183 |
| | $ | (20 | ) | | $ | 396 |
| | $ | 411 |
| | $ | (15 | ) | |
| Residential mortgage loans | | | | | | | | | | | | | | | | | | |
| Performing loans | $ | 290 |
| | $ | 319 |
| | $ | (29 | ) | | $ | 288 |
| | $ | 306 |
| | $ | (18 | ) | | $ | 279 |
| | $ | 298 |
| | $ | (19 | ) | |
| Accruing loans 90 days or more past due | 334 |
| | 344 |
| | (10 | ) | | 286 |
| | 294 |
| | (8 | ) | | 321 |
| | 329 |
| | (8 | ) | |
| Nonaccrual loans | 189 |
| | 307 |
| | (118 | ) | | 184 |
| | 291 |
| | (107 | ) | | 182 |
| | 292 |
| | (110 | ) | |
| Total | $ | 813 |
| | $ | 970 |
| | $ | (157 | ) | | $ | 758 |
| | $ | 891 |
| | $ | (133 | ) | | $ | 782 |
| | $ | 919 |
| | $ | (137 | ) | |
| Other assets | $ | 216 |
| | $ | 221 |
| | $ | (5 | ) | | $ | 128 |
| | $ | 127 |
| | $ | 1 |
| | $ | 156 |
| | $ | 176 |
| | $ | (20 | ) | |
| Liabilities | | | | | | | | | | | | | | | | | | |
| Other borrowed funds | $ | 56 |
| | $ | 57 |
| | $ | (1 | ) | | $ | 49 |
| | $ | 50 |
| | $ | (1 | ) | | $ | 64 |
| | $ | 65 |
| | $ | (1 | ) | |
| December 31, 2017 | | | | | | | |
| Assets | | | | | | | |
| Residential mortgage loans held for sale | | | | | | | |
| Performing loans | $ | 822 |
| | $ | 796 |
| | $ | 26 |
| | |
| Accruing loans 90 days or more past due | 3 |
| | 3 |
| |
|
| | |
| Nonaccrual loans | 7 |
| | 8 |
| | (1 | ) | | |
| Total | $ | 832 |
| | $ | 807 |
| | $ | 25 |
| | |
| Commercial mortgage loans held for sale (a) | | | | | | | |
| Performing loans | $ | 828 |
| | $ | 842 |
| | $ | (14 | ) | | |
| Nonaccrual loans | 2 |
| | 3 |
| | (1 | ) | | |
| Total | $ | 830 |
| | $ | 845 |
| | $ | (15 | ) | | |
| Residential mortgage loans | | | | | | | |
| Performing loans | $ | 251 |
| | $ | 280 |
| | $ | (29 | ) | | |
| Accruing loans 90 days or more past due | 421 |
| | 431 |
| | (10 | ) | | |
| Nonaccrual loans | 197 |
| | 317 |
| | (120 | ) | | |
| Total | $ | 869 |
| | $ | 1,028 |
| | $ | (159 | ) | | |
| Other assets | $ | 216 |
| | $ | 212 |
| | $ | 4 |
| | |
| Liabilities | | | | | | | |
| Other borrowed funds | $ | 84 |
| | $ | 85 |
| | $ | (1 | ) | | |
| |
| (a) | There were no accruing loans 90 days or more past due within this category at March 31, 20182019 or December 31, 2017.2018. |
The PNC Financial Services Group, Inc. – Form 10-Q71
The changes in fair value for items for which we elected the fair value option are as follows:
Table 57:54: Fair Value Option – Changes in Fair Value (a)
| | | | Gains (Losses) | | Gains (Losses) | | |
| | Three months ended | | Three months ended | | |
| | Mar. 31 |
| | Mar. 31 |
| | March 31 |
| | March 31 |
| | |
| In millions | 2018 |
| | 2017 |
| | 2019 |
| | 2018 |
| | |
| Assets | | | | | | | | | |
| Residential mortgage loans held for sale | $ | 4 |
| | $ | 30 |
| | $ | 14 |
| | $ | 4 |
| | |
| Commercial mortgage loans held for sale | $ | 14 |
| | $ | 18 |
| | $ | 5 |
| | $ | 14 |
| | |
| Residential mortgage loans | $ | 3 |
| | $ | 4 |
| | $ | 4 |
| | $ | 3 |
| | |
| Other assets | $ | 11 |
| | $ | 7 |
| | $ | 9 |
| | $ | 11 |
| | |
| Liabilities | | | | | |
| Other liabilities | $ | (2 | ) | | $ | (16 | ) | | |
| |
| (a) | The impact on earnings of offsetting hedged items or hedging instruments is not reflected in these amounts. |
Additional Fair Value Information Related to Financial Instruments Not Recorded at Fair Value
The following table presents the carrying amounts and estimated fair values, as well as the level within the fair value hierarchy, of all other financial instruments that are not recorded on our Consolidated Balance Sheet at fair value as of March 31, 20182019 and December 31, 2017.
2018. For more information regarding the methods and assumptions used to estimate the fair values of financial instruments included in Table 58: Additional55, see Note 6 Fair Value Information Related to Other Financial Instrumentsin our 2018 Form 10-K.
|
| | | | | | | | | | | | | | | | | | | | |
| | Carrying |
| | Fair Value | |
| In millions | Amount |
| | Total |
| | Level 1 |
| | Level 2 |
| | Level 3 |
| |
| March 31, 2018 | | | | | | | | | | |
| Assets | | | | | | | | | | |
| Cash and due from banks | $ | 4,649 |
| | $ | 4,649 |
| | $ | 4,649 |
| | | | | |
| Interest-earning deposits with banks | 28,821 |
| | 28,821 |
| | | | $ | 28,821 |
| | | |
| Securities held to maturity | 18,544 |
| | 18,223 |
| | 746 |
| | 17,333 |
| | $ | 144 |
| |
| Net loans (excludes leases) | 210,395 |
| | 211,926 |
| | | | | | 211,926 |
| |
| Other assets | 4,954 |
| | 4,954 |
| | | | 4,940 |
| | 14 |
| |
| Total assets | $ | 267,363 |
| | $ | 268,573 |
| | $ | 5,395 |
| | $ | 51,094 |
| | $ | 212,084 |
| |
| Liabilities | | | | | | | | | | |
| Time deposits (a) | $ | 16,270 |
| | $ | 15,976 |
| | | | $ | 15,976 |
| | | |
| Borrowed funds | 56,862 |
| | 57,514 |
| | | | 55,838 |
| | $ | 1,676 |
| |
| Unfunded loan commitments and letters of credit | 290 |
| | 290 |
| | | | | | 290 |
| |
| Other liabilities | 416 |
| | 416 |
| | | | 416 |
| | | |
| Total liabilities | $ | 73,838 |
| | $ | 74,196 |
| | | | $ | 72,230 |
| | $ | 1,966 |
| |
| December 31, 2017 | | | | | | | | | | |
| Assets | | | | | | | | | | |
| Cash and due from banks | $ | 5,249 |
| | $ | 5,249 |
| | $ | 5,249 |
| | | | | |
| Interest-earning deposits with banks | 28,595 |
| | 28,595 |
| | | | $ | 28,595 |
| | | |
| Securities held to maturity | 18,513 |
| | 18,565 |
| | 765 |
| | 17,658 |
| | $ | 142 |
| |
| Net loans (excludes leases) | 209,044 |
| | 211,175 |
| | | | | | 211,175 |
| |
| Other assets | 6,078 |
| | 6,736 |
| | | | 5,949 |
| | 787 |
| |
| Total assets | $ | 267,479 |
| | $ | 270,320 |
| | $ | 6,014 |
| | $ | 52,202 |
| | $ | 212,104 |
| |
| Liabilities | | | | | | | | | | |
| Deposits | $ | 265,053 |
| | $ | 264,854 |
| | | | $ | 264,854 |
| | | |
| Borrowed funds | 57,744 |
| | 58,503 |
| | | | 56,853 |
| | $ | 1,650 |
| |
| Unfunded loan commitments and letters of credit | 297 |
| | 297 |
| | | | | | 297 |
| |
| Other liabilities | 399 |
| | 399 |
| | | | 399 |
| | | |
| Total liabilities | $ | 323,493 |
| | $ | 324,053 |
| | | | $ | 322,106 |
| | $ | 1,947 |
| |
| |
(a) | The amount at March 31, 2018 excludes deposit liabilities with no defined or contractual maturities in accordance with the adoption of ASU 2016-01. See the Recently Adopted Accounting Standards portion of Note 1 for additional details on this adoption. |
7260 The PNC Financial Services Group, Inc. – Form 10-Q
Table 55: Additional Fair Value Information Related to Other Financial Instruments
|
| | | | | | | | | | | | | | | | | | | | |
| | Carrying |
| | Fair Value | |
| In millions | Amount |
| | Total |
| | Level 1 |
| | Level 2 |
| | Level 3 |
| |
| March 31, 2019 | | | | | | | | | | |
| Assets | | | | | | | | | | |
| Cash and due from banks | $ | 5,062 |
| | $ | 5,062 |
| | $ | 5,062 |
| | | | | |
| Interest-earning deposits with banks | 15,261 |
| | 15,261 |
| | | | $ | 15,261 |
| | | |
| Securities held to maturity | 18,818 |
| | 18,808 |
| | 787 |
| | 17,859 |
| | $ | 162 |
| |
| Net loans (excludes leases) | 221,495 |
| | 223,547 |
| | | | | | 223,547 |
| |
| Other assets | 6,268 |
| | 6,267 |
| | | | 6,262 |
| | 5 |
| |
| Total assets | $ | 266,904 |
| | $ | 268,945 |
| | $ | 5,849 |
| | $ | 39,382 |
| | $ | 223,714 |
| |
| Liabilities | | | | | | | | | | |
| Time deposits | $ | 19,620 |
| | $ | 19,428 |
| | | | $ | 19,428 |
| | | |
| Borrowed funds | 58,365 |
| | 58,907 |
| | | | 57,002 |
| | $ | 1,905 |
| |
| Unfunded loan commitments and letters of credit | 279 |
| | 279 |
| | | | | | 279 |
| |
| Other liabilities | 447 |
| | 447 |
| | | | 447 |
| | | |
| Total liabilities | $ | 78,711 |
| | $ | 79,061 |
| | | | $ | 76,877 |
| | $ | 2,184 |
| |
| December 31, 2018 | | | | | | | | | | |
| Assets | | | | | | | | | | |
| Cash and due from banks | $ | 5,608 |
| | $ | 5,608 |
| | $ | 5,608 |
| | | | | |
| Interest-earning deposits with banks | 10,893 |
| | 10,893 |
| | | | $ | 10,893 |
| | | |
| Securities held to maturity | 19,312 |
| | 19,019 |
| | 763 |
| | 18,112 |
| | $ | 144 |
| |
| Net loans (excludes leases) | 215,525 |
| | 216,492 |
| | | | | | 216,492 |
| |
| Other assets | 11,065 |
| | 11,065 |
| | | | 11,060 |
| | 5 |
| |
| Total assets | $ | 262,403 |
| | $ | 263,077 |
| | $ | 6,371 |
| | $ | 40,065 |
| | $ | 216,641 |
| |
| Liabilities | | | | | | | | | | |
| Time deposits | $ | 18,507 |
| | $ | 18,246 |
| | | | $ | 18,246 |
| | | |
| Borrowed funds | 56,412 |
| | 56,657 |
| | | | 54,872 |
| | $ | 1,785 |
| |
| Unfunded loan commitments and letters of credit | 285 |
| | 285 |
| | | | | | 285 |
| |
| Other liabilities | 393 |
| | 393 |
| | | | 393 |
| | | |
| Total liabilities | $ | 75,597 |
| | $ | 75,581 |
| |
| | $ | 73,511 |
| | $ | 2,070 |
| |
The aggregate fair values in Table 5855 represent only a portion of the total market value of our assets and liabilities as, in accordance with the guidance related to fair values about financial instruments, we exclude the following:
financial instruments recorded at fair value on a recurring basis (as they are disclosed in Table 51),49);
investments accounted for under the equity method,method;
equity securities without a readily determinable fair value that apply for the alternative measurement approach to fair value under ASU 2016-01,2016-01;
real and personal property,property;
lease financing,financing;
loan customer relationships,relationships;
deposit customer intangibles,intangibles;
mortgage servicing rights (MSRs);
retail branch networks,networks;
fee-based businesses, such as asset management and brokerage,brokerage;
trademarks and brand names,names;
trade receivables and payables due in one year or less,less; and
deposit liabilities with no defined or contractual maturities.maturities under ASU 2016-01.
The balance of equity securities without a readily determinable fair value that apply the alternative measurement approach to fair value was $105 million and $106 million at March 31, 2018 and December 31, 2017, respectively. Impairment taken on those equity securities was immaterial in the first quarter of 2018.PNC Financial Services Group, Inc. – Form 10-Q61
For more information regarding the methods and assumptions used to estimate the fair values of financial instruments included in Table 58, see Note 6 Fair Value in our 2017 Form 10-K.
NOTE 7 GOODWILL AND MORTGAGE SERVICING RIGHTS
Goodwill
See Note 7 Goodwill and Mortgage Servicing Rights in our 20172018 Form 10-K for more information regarding our goodwill.
Mortgage Servicing Rights
We recognize the right to service mortgage loans for others when we recognize it as an intangible asset and the servicing income we receive is more than adequate compensation. MSRs totaled $2.0$1.8 billion and $1.8$2.0 billion at March 31, 20182019 and December 31, 2017,2018, respectively, and consisted of loan servicing contracts for commercial and residential mortgages measured at fair value.
MSRs are subject to declines in value from actual or expected prepayment of the underlying loans and defaults as well as market driven changes in interest rates. We manage this risk by economically hedging the fair value of MSRs with securities and derivative instruments which are expected to increase (or decrease) in value when the value of MSRs decreases (or increases).
See the Sensitivity Analysis section of this Note 7, as well as Note 6 Fair Value in our 20172018 Form 10-K for more detail on our fair value measurement of MSRs. Refer to Note 7 Goodwill and Mortgage Servicing Rights in our 20172018 Form 10-K for more information on our accounting and measurement of MSRs.
The PNC Financial Services Group, Inc. – Form 10-Q73
Changes in the commercial and residential MSRs follow:
Table 59:56: Mortgage Servicing Rights
| | | | Commercial MSRs | | Residential MSRs | | Commercial MSRs | | Residential MSRs | |
| In millions | 2018 |
| 2017 |
| | 2018 |
| 2017 |
| | 2019 |
| 2018 |
| | 2019 |
| 2018 |
| |
| January 1 | $ | 668 |
| $ | 576 |
| | $ | 1,164 |
| $ | 1,182 |
| | $ | 726 |
| $ | 668 |
| | $ | 1,257 |
| $ | 1,164 |
| |
| Additions: | | | | | | | | | | |
| From loans sold with servicing retained | 17 |
| 29 |
| | 13 |
| 17 |
| | 7 |
| 17 |
| | 7 |
| 13 |
| |
| Purchases | 23 |
| 13 |
| | 9 |
| 83 |
| | 19 |
| 23 |
| | 6 |
| 9 |
| |
| Changes in fair value due to: | | | | | | | | | | |
| Time and payoffs (a) | (33 | ) | (25 | ) | | (37 | ) | (39 | ) | | (38 | ) | (33 | ) | | (33 | ) | (37 | ) | |
| Other (b) | 48 |
| 13 |
| | 107 |
| 18 |
| | (33 | ) | 48 |
| | (106 | ) | 107 |
| |
| March 31 | $ | 723 |
| $ | 606 |
| | $ | 1,256 |
| $ | 1,261 |
| | $ | 681 |
| $ | 723 |
| | $ | 1,131 |
| $ | 1,256 |
| |
| Related unpaid principal balance at March 31 | $ | 169,172 |
| $ | 143,908 |
| | $ | 124,696 |
| $ | 130,382 |
| | $ | 186,946 |
| $ | 169,172 |
| | $ | 123,079 |
| $ | 124,696 |
| |
| Servicing advances at March 31 | $ | 200 |
| $ | 234 |
| | $ | 197 |
| $ | 260 |
| | $ | 243 |
| $ | 200 |
| | $ | 138 |
| $ | 197 |
| |
| |
| (a) | Represents decrease in MSR value due to passage of time, including the impact from both regularly scheduled loan principal payments and loans that were paid down or paid off during the period. |
| |
| (b) | Represents MSR value changes resulting primarily from market-driven changes in interest rates. |
Sensitivity Analysis
The fair value of commercial and residential MSRs and significant inputs to the valuation models as of March 31, 20182019 are shown in Tables 6057 and 61.58. The expected and actual rates of mortgage loan prepayments are significant factors driving the fair value. Management uses both internal proprietary models and a third-party model to estimate future commercial mortgage loan prepayments and a third-party model to estimate future residential mortgage loan prepayments. These models have been refined based on current market conditions and management judgment. Future interest rates are another important factor in the valuation of MSRs. Management utilizes market implied forward interest rates to estimate the future direction of mortgage and discount rates. The forward rates utilized are derived from the current yield curve for U.S. dollar interest rate swaps and are consistent with pricing of capital markets instruments. Changes in the shape and slope of the forward curve in future periods may result in volatility in the fair value estimate.
A sensitivity analysis of the hypothetical effect on the fair value of MSRs to adverse changes in key assumptions is presented in Tables 6057 and 61.58. These sensitivities do not include the impact of the related hedging activities. Changes in fair value generally cannot be extrapolated because the relationship of the change in the assumption to the change in fair value may not be linear. Also, the effect of a variation in a particular assumption on the fair value of the MSRs is calculated independently without changing any other assumption. In reality, changes in one factor may result in changes in another (e.g., changes in mortgage interest rates, which drive changes in prepayment rate estimates, could result in changes in the interest rate spread), which could either magnify or counteract the sensitivities.
The PNC Financial Services Group, Inc. – Form 10-Q62
The following tables set forth the fair value of commercial and residential MSRs and the sensitivity analysis of the hypothetical effect on the fair value of MSRs to immediate adverse changes of 10% and 20% in those assumptions.
Table 60:57: Commercial Mortgage Loan Servicing Rights – Key Valuation Assumptions
| | | Dollars in millions | March 31
2018 |
| | December 31
2017 |
| | March 31
2019 |
| | December 31
2018 |
| |
| Fair value | $ | 723 |
| | $ | 668 |
| | $ | 681 |
| | $ | 726 |
| |
| Weighted-average life (years) | 4.4 |
| | 4.4 |
| | 4.1 |
| | 4.1 |
| |
| Weighted-average constant prepayment rate | 7.89 | % | | 8.51 | % | | 5.45 | % | | 5.65 | % | |
| Decline in fair value from 10% adverse change | $ | 12 |
| | $ | 12 |
| | $ | 10 |
| | $ | 10 |
| |
| Decline in fair value from 20% adverse change | $ | 22 |
| | $ | 23 |
| | $ | 19 |
| | $ | 19 |
| |
| Effective discount rate | 8.09 | % | | 7.81 | % | | 8.23 | % | | 8.39 | % | |
| Decline in fair value from 10% adverse change | $ | 19 |
| | $ | 18 |
| | $ | 18 |
| | $ | 19 |
| |
| Decline in fair value from 20% adverse change | $ | 39 |
| | $ | 36 |
| | $ | 36 |
| | $ | 39 |
| |
74 The PNC Financial Services Group, Inc. – Form 10-Q
Table 61:58: Residential Mortgage Loan Servicing Rights – Key Valuation Assumptions
| | | Dollars in millions | March 31
2018 |
| | December 31
2017 |
| | March 31
2019 |
| | December 31
2018 |
| |
| Fair value | $ | 1,256 |
| | $ | 1,164 |
| | $ | 1,131 |
| | $ | 1,257 |
| |
| Weighted-average life (years) | 7.0 |
| | 6.4 |
| | 6.2 |
| | 6.9 |
| |
| Weighted-average constant prepayment rate | 8.72 | % | | 10.04 | % | | 10.46 | % | | 8.69 | % | |
| Decline in fair value from 10% adverse change | $ | 40 |
| | $ | 44 |
| | $ | 43 |
| | $ | 41 |
| |
| Decline in fair value from 20% adverse change | $ | 78 |
| | $ | 85 |
| | $ | 83 |
| | $ | 79 |
| |
| Weighted-average option adjusted spread | 831 |
| bps | 830 |
| bps | 805 |
| bps | 806 |
| bps |
| Decline in fair value from 10% adverse change | $ | 38 |
| | $ | 35 |
| | $ | 32 |
| | $ | 37 |
| |
| Decline in fair value from 20% adverse change | $ | 74 |
| | $ | 67 |
| | $ | 63 |
| | $ | 73 |
| |
Fees from mortgage loan servicing, which includes contractually specified servicing fees, late fees and ancillary fees were $.1 billion for both the three months ended March 31, 20182019 and 2017.2018. We also generate servicing fees from fee-based activities provided to others for which we do not have an associated servicing asset. Fees from commercial and residential MSRs are reported within Noninterest income on our Consolidated Income Statement in the line items Corporate services and Residential mortgage, respectively.
NOTE 8 EMPLOYEE BENEFIT PLANS
Pension and Postretirement Plans
As described in Note 11 Employee Benefit Plans in our 20172018 Form 10-K, we have a noncontributory, qualified defined benefit pension plan covering eligible employees. Benefits are determined using a cash balance formula where earnings credits are a percentage of eligible compensation. Beginning in 2018, these earnings creditscompensation and are subject to a minimum annual amount. Any pension contributions to the plan are based on an actuarially determined amount necessary to fund total benefits payable to plan participants.
We also maintain nonqualified supplemental retirement plans for certain employees and provide certain health care and life insurance benefits for qualifying retired employees (postretirement benefits) through various plans. We reserve the right to terminate or make changes to these plans at any time.
The components of our net periodic benefit cost for the three months ended March 31, 20182019 and 2017,2018, respectively, were as follows:
The PNC Financial Services Group, Inc. – Form 10-Q63
Table 62:59: Components of Net Periodic Benefit Cost (a)
| | | | Qualified Pension Plan | | | Nonqualified Pension Plan | | | Postretirement Benefits | | Qualified Pension Plan | | | Nonqualified Pension Plan | | | Postretirement Benefits | |
Three months ended March 31
In millions | 2018 |
| | 2017 |
| | | 2018 |
| | 2017 |
| | | 2018 |
| | 2017 |
| | 2019 |
| | 2018 |
| | | 2019 |
| | 2018 |
| | | 2019 |
| | 2018 |
| |
| Net periodic cost consists of: | | | | | | | | | | | | | | | | | | | | | | | | | | | | |
| Service cost | $ | 28 |
| | $ | 26 |
| | | $ | 1 |
| | $ | 1 |
| | | $ | 1 |
| | $ | 1 |
| | $ | 28 |
| | $ | 28 |
| | | $ | 1 |
| | $ | 1 |
| | | $ | 1 |
| | $ | 1 |
| |
| Interest cost | 43 |
| | 45 |
| | | 2 |
| | 3 |
| | | 3 |
| | 4 |
| | 46 |
| | 43 |
| | | 2 |
| | 2 |
| | | 3 |
| | 3 |
| |
| Expected return on plan assets | (76 | ) | | (71 | ) | | | | | | | | (1 | ) | | (1 | ) | | (72 | ) | | (76 | ) | | | | | | | | (1 | ) | | (1 | ) | |
| Amortization of prior service credit | | | (1 | ) | | | | | | | | | | | | 1 |
| | | | | | | | | | | | | |
| Amortization of actuarial losses | | | 12 |
| | | 1 |
| | 1 |
| | | | | | | | | | | | 1 |
| | 1 |
| | | | | | |
| Net periodic cost/(benefit) | $ | (5 | ) | | $ | 11 |
| | | $ | 4 |
| | $ | 5 |
| | | $ | 3 |
| | $ | 4 |
| | $ | 3 |
| | $ | (5 | ) | | | $ | 4 |
| | $ | 4 |
| | | $ | 3 |
| | $ | 3 |
| |
| |
| (a) | The service cost component is included in Personnel expense on the Consolidated Income Statement. All other components are included in Other noninterest expense on the Consolidated Income Statement. |
The PNC Financial Services Group, Inc. – Form 10-Q75
NOTE 9 FINANCIAL DERIVATIVES
We use derivativea variety of financial instruments primarilyderivatives as part of our overall asset and liability risk management process to help manage exposure to market (primarily interest rate, marketrate) and credit risk and reduce the effects that changesinherent in interest rates may have on net income, the fair value of assets and liabilities and cash flows.our business activities. We also enter into derivatives with customers to facilitate their risk management activities. Derivatives represent contracts between parties that usually require little or no initial net investment and result in one party delivering cash or another type of asset to the other party based on a notional amount and an underlying as specified in the contract.
For more information regarding derivatives see Note 1 Accounting Policies and Note 13 Financial Derivatives in our 20172018 Form 10-K.
The following table presents the notional amounts and gross fair values of all derivative assets and liabilities held by us.
64 The PNC Financial Services Group, Inc. – Form 10-Q
Table 63:60: Total Gross Derivatives
| | | | March 31, 2018 | | December 31, 2017 | March 31, 2019 | December 31, 2018 |
| In millions | Notional / Contract Amount |
| | Asset Fair Value (a) |
| | Liability Fair Value (b) |
| | Notional / Contract Amount |
| | Asset Fair Value (a) |
| | Liability Fair Value (b) |
| Notional / Contract Amount |
| Asset Fair Value (a) |
| Liability Fair Value (b) |
| Notional / Contract Amount |
| Asset Fair Value (a) |
| Liability Fair Value (b) |
|
| Derivatives used for hedging under GAAP | | | | | | | | | | | | | | | |
| Interest rate contracts (c): | | | | | | | | | | | | | | | |
| Fair value hedges | $ | 32,810 |
| | $ | 75 |
| | $ | 105 |
| | $ | 34,059 |
| | $ | 114 |
| | $ | 94 |
| $ | 30,701 |
| $ | 7 |
| | $ | 30,919 |
| $ | 7 |
|
|
|
| Cash flow hedges | 25,647 |
| | 54 |
| | 9 |
| | 23,875 |
| | 60 |
| | 6 |
| 21,946 |
| 3 |
| | 17,337 |
| 1 |
|
|
|
| Foreign exchange contracts: | | | | | | | | | | | | | | | |
| Net investment hedges | 1,112 |
| | | | 51 |
| | 1,060 |
| |
|
| | 11 |
| 1,008 |
| | $ | 29 |
| 1,012 |
|
|
| $ | 10 |
|
| Total derivatives designated for hedging | $ | 59,569 |
|
| $ | 129 |
|
| $ | 165 |
|
| $ | 58,994 |
|
| $ | 174 |
|
| $ | 111 |
| |
| Total derivatives designated for hedging under GAAP | | $ | 53,655 |
| $ | 10 |
| $ | 29 |
| $ | 49,268 |
| $ | 8 |
| $ | 10 |
|
| Derivatives not used for hedging under GAAP | | | | | | | | | | | | | | | |
| Derivatives used for mortgage banking activities (d): | | | | | | | | | | | | | | | |
| Interest rate contracts: | | | | | | | | | | | | | | | |
| Swaps | $ | 54,578 |
| | | | $ | 4 |
| | $ | 48,335 |
| | $ | 162 |
| | $ | 42 |
| $ | 41,334 |
| $ | 14 |
| $ | 4 |
| $ | 43,084 |
|
|
| $ | 3 |
|
| Futures (e) | 52,555 |
| | | | | | 47,494 |
| |
| |
| 4,535 |
| | | 10,658 |
|
|
|
| Mortgage-backed commitments | 6,796 |
| | $ | 30 |
| | 18 |
| | 8,999 |
| | 19 |
| | 9 |
| 6,277 |
| 64 |
| 57 |
| 5,771 |
| $ | 47 |
| 39 |
|
| Other | 6,370 |
| | 15 |
| | 3 |
| | 2,530 |
| | 11 |
| | 2 |
| 9,880 |
| 26 |
| 12 |
| 6,509 |
| 10 |
| 3 |
|
| Subtotal | 120,299 |
|
| 45 |
|
| 25 |
|
| 107,358 |
|
| 192 |
|
| 53 |
| 62,026 |
| 104 |
| 73 |
| 66,022 |
| 57 |
| 45 |
|
| Derivatives used for customer-related activities: | | | | | | | | | | | | | | | |
| Interest rate contracts: | | | | | | | | | | | | | | | |
| Swaps | 200,489 |
| | 1,182 |
| | 1,807 |
| | 194,042 |
| | 2,079 |
| | 1,772 |
| 224,133 |
| 1,780 |
| 1,213 |
| 218,496 |
| 1,352 |
| 1,432 |
|
| Futures (e) | 3,274 |
| | | | | | 3,453 |
| |
| |
| 564 |
| | | 914 |
|
|
|
| Mortgage-backed commitments | 1,894 |
| | 6 |
| | 4 |
| | 2,228 |
| | 2 |
| | 2 |
| 2,708 |
| 6 |
| 9 |
| 2,246 |
| 7 |
| 10 |
|
| Other | 18,784 |
| | 70 |
| | 64 |
| | 17,775 |
| | 75 |
| | 36 |
| 22,059 |
| 83 |
| 25 |
| 20,109 |
| 77 |
| 33 |
|
| Subtotal | 224,441 |
|
| 1,258 |
|
| 1,875 |
| | 217,498 |
| | 2,156 |
| | 1,810 |
| 249,464 |
| 1,869 |
| 1,247 |
| 241,765 |
| 1,436 |
| 1,475 |
|
| Commodity contracts: | | | | | |
| Swaps | | 4,620 |
| 144 |
| 139 |
| 4,813 |
| 244 |
| 238 |
|
| Other | | 1,387 |
| 15 |
| 15 |
| 1,418 |
| 67 |
| 67 |
|
| Subtotal | | 6,007 |
| 159 |
| 154 |
| 6,231 |
| 311 |
| 305 |
|
| Foreign exchange contracts and other | 30,043 |
| | 451 |
| | 432 |
| | 27,330 |
| | 349 |
| | 332 |
| 23,624 |
| 186 |
| 180 |
| 23,253 |
| 194 |
| 192 |
|
| Subtotal | 254,484 |
|
| 1,709 |
|
| 2,307 |
| | 244,828 |
| | 2,505 |
| | 2,142 |
| 279,095 |
| 2,214 |
| 1,581 |
| 271,249 |
| 1,941 |
| 1,972 |
|
| Derivatives used for other risk management activities: | | | | | | | | | | | | | | | |
| Foreign exchange contracts and other (f) | 7,142 |
| | 20 |
| | 445 |
| | 7,445 |
| | 3 |
| | 550 |
| |
| Total derivatives not designated for hedging | $ | 381,925 |
|
| $ | 1,774 |
|
| $ | 2,777 |
|
| $ | 359,631 |
|
| $ | 2,700 |
|
| $ | 2,745 |
| |
| Foreign exchange contracts and other | | 8,711 |
| 40 |
| 222 |
| 7,908 |
| 75 |
| 263 |
|
| Total derivatives not designated for hedging under GAAP | | $ | 349,832 |
| $ | 2,358 |
| $ | 1,876 |
| $ | 345,179 |
| $ | 2,073 |
| $ | 2,280 |
|
| Total gross derivatives | $ | 441,494 |
|
| $ | 1,903 |
|
| $ | 2,942 |
|
| $ | 418,625 |
|
| $ | 2,874 |
|
| $ | 2,856 |
| $ | 403,487 |
| $ | 2,368 |
| $ | 1,905 |
| $ | 394,447 |
| $ | 2,081 |
| $ | 2,290 |
|
| Less: Impact of legally enforceable master netting agreements | | | 795 |
| | 795 |
| | | | 1,054 |
| | 1,054 |
| | 695 |
| 695 |
|
| 688 |
| 688 |
|
| Less: Cash collateral received/paid | | | 45 |
| | 648 |
| | | | 636 |
| | 763 |
| | 302 |
| 626 |
| | 341 |
| 539 |
|
| Total derivatives | | | $ | 1,063 |
|
| $ | 1,499 |
|
|
|
|
| $ | 1,184 |
|
| $ | 1,039 |
| | $ | 1,371 |
| $ | 584 |
|
|
| $ | 1,052 |
| $ | 1,063 |
|
| |
| (a) | Included in Other assets on our Consolidated Balance Sheet. |
| |
| (b) | Included in Other liabilities on our Consolidated Balance Sheet. |
| |
| (c) | Represents primarily swaps. |
| |
| (d) | Includes both residential and commercial mortgage banking activities. |
| |
| (e) | Futures contracts settle in cash daily and, therefore, no derivative asset or derivative liability is recognized on our Consolidated Balance Sheet. |
| |
(f) | Includes our obligation to fund a portion of certain BlackRock LTIP programs and the swaps entered into in connection with sales of a portion of Visa Class B common shares. |
76 The PNC Financial Services Group, Inc. – Form 10-Q
All derivatives are carried on our Consolidated Balance Sheet at fair value. Derivative balances are presented on the Consolidated Balance Sheet on a net basis taking into consideration the effects of legally enforceable master netting agreements and, when appropriate, any related cash collateral exchanged with counterparties. Further discussion regarding the offsetting rights associated with these legally enforceable master netting agreements is included in the Offsetting, Counterparty Credit Risk and Contingent Features section of this Note 9. Any nonperformance risk, including credit risk, is included in the determination of the estimated net fair value of the derivatives. Exchange-traded and over-the-counter cleared derivative instruments are typically settled in cash each day based on the prior day value. In the first quarter of 2018, we changed our presentation for variation margin related to derivative instruments cleared through a central clearinghouse as a result of changes made by that clearinghouse to its rules governing such instruments with its counterparties. This variation margin is now recorded as a settlement payment instead of collateral. The impact at March 31, 2018 was a reduction of gross derivative assets and gross derivative liabilities of $1.3 billion and $.5 billion, respectively. The accounting change had no impact on the net fair value of the derivative assets and liabilities that otherwise would have been reported on our Consolidated Balance Sheet. See Table 67 for more information.
Derivatives Designated As Hedging Instruments under GAAP
Certain derivatives used to manage interest rate and foreign exchange risk as part of our asset and liability risk management activities are designated as accounting hedges under GAAP. Derivatives hedging the risks associated with changes in the fair value of assets or liabilities are considered fair value hedges, derivatives hedging the variability of expected future cash flows are considered cash flow hedges, and derivatives hedging a net investment in a foreign subsidiary are considered net investment hedges. Designating
The PNC Financial Services Group, Inc. – Form 10-Q65
derivatives as accounting hedges allows for gains and losses on those derivatives to be recognized in the same period and in the same income statement line item as the earnings impact of the hedged items.
Fair Value Hedges
We enter into receive-fixed, pay-variable interest rate swaps to hedge changes in the fair value of outstanding fixed-rate debt caused by fluctuations in market interest rates. We also enter into pay-fixed, receive-variable interest rate swaps and zero-coupon swaps to hedge changes in the fair value of fixed rate and zero-coupon investment securities caused by fluctuations in market interest rates. Gains and losses on the interest rate swaps designated in these hedge relationships, along with the offsetting gains and losses on the hedged items attributable to the hedged risk, are recognized in current earnings within the same income statement line item.
Cash Flow Hedges
We enter into receive-fixed, pay-variable interest rate swaps to modify the interest rate characteristics of designated commercial loans from variable to fixed in order to reduce the impact of changes in future cash flows due to market interest rate changes. We also periodically enter into forward purchase and sale contracts to hedge the variability of the consideration that will be paid or received related to the purchase or sale of investment securities. The forecasted purchase or sale is consummated upon gross settlement of the forward contract itself. For these cash flow hedges, gains and losses on the interest rate swaps and forward contracts are recorded in Accumulated other comprehensive incomeAOCI and are then reclassified into earnings in the same period the hedged cash flows affect earnings and within the same income statement line as the hedged cash flows.
In the 12 months that follow March 31, 2018,2019, we expect to reclassify net derivative gainslosses of $38$7 million pretax, or $30$5 million after-tax, from Accumulated other comprehensive incomeAOCI to interest income for both cash flow hedge strategies. This reclassified amount could differ from amounts actually recognized due to changes in interest rates, hedge de-designations and the addition of other hedges subsequent to March 31, 2018.2019. As of March 31, 2018,2019, the maximum length of time over which forecasted transactions are hedged is seventen years.
The amount of cash flow hedge ineffectiveness recognized in income was not significant for the 2017 period presented.
The PNC Financial Services Group, Inc. – Form 10-Q77
DetailFurther detail regarding the net gains (losses) related to our fair value and cash flow hedge derivatives is presented in the following table.
Table 64:61: Gains (Losses) Recognized on Fair Value and Cash Flow Hedges in the Consolidated Income Statement (a) (b)
| | | | Location and Amount of Gains (Losses) Recognized in Income | Location and Amount of Gains (Losses) Recognized in Income |
| | Interest Income | Interest Expense | Noninterest Income | Interest Income | Interest Expense | Noninterest Income |
| In millions | Loans | Investment Securities | Borrowed Funds | Other | Loans | Investment Securities | Borrowed Funds | Other |
| For the three months ended March 31, 2019 | | | |
| Total amounts on the Consolidated Income Statement | | $ | 2,602 |
| $ | 620 |
| $ | 481 |
| $ | 308 |
|
| Gains (losses) on fair value hedges recognized on: | | | |
| Hedged items (c) | | | $ | 58 |
| $ | (274 | ) | |
| Derivatives | | | $ | (55 | ) | $ | 228 |
| |
| Amounts related to interest settlements on derivatives | | | $ | 5 |
| $ | 11 |
| |
| Gains (losses) on cash flow hedges (d): | | | |
| Amount of derivative gains (losses) reclassified from AOCI | | $ | (8 | ) | $ | 1 |
|
|
| $ | 15 |
|
| For the three months ended March 31, 2018 | | | | | |
| Total amounts on the Consolidated Income Statement | $ | 2,228 |
| $ | 512 |
| $ | 344 |
| $ | 245 |
| $ | 2,228 |
| $ | 512 |
| $ | 344 |
| $ | 245 |
|
| Gains (losses) on fair value hedges recognized on: | | | | |
| Hedged items (c) |
|
| $ | (90 | ) | $ | 370 |
|
|
| | $ | (90 | ) | $ | 370 |
| |
| Derivatives |
|
| $ | 92 |
| $ | (370 | ) |
|
| | $ | 92 |
| $ | (370 | ) | |
| Amounts related to interest settlements on derivatives |
|
| $ | (3 | ) | $ | 26 |
|
|
| | $ | (3 | ) | $ | 26 |
| |
| Gains (losses) on cash flow hedges (d): | | | | |
| Amount of derivative gains (losses) reclassified from accumulated OCI | $ | 26 |
| $ | 4 |
|
|
| $ | 2 |
| |
| For the three months ended March 31, 2017 | | | | |
| Total amounts on the Consolidated Income Statement | $ | 1,904 |
| $ | 493 |
| $ | 240 |
| $ | 301 |
| |
| Gains (losses) on fair value hedges recognized on: | | | |
| Hedged items | | $ | (21 | ) | $ | 86 |
| | |
| Derivatives | | $ | 22 |
| $ | (95 | ) | | |
| Amounts related to interest settlements on derivatives | | $ | (15 | ) | $ | 76 |
| | |
| Gains (losses) on cash flow hedges - interest rate contracts (d): | | | |
| Amount of derivative gains (losses) reclassified from accumulated OCI | $ | 46 |
| $ | 6 |
| | $ | 3 |
| |
| Amount of derivative gains (losses) reclassified from AOCI | | $ | 26 |
| $ | 4 |
| | $ | 2 |
|
| |
| (a) | For all periods presented, there were no components of derivative gains or losses excluded from the assessment of hedge effectiveness for any of the fair value or cash flow hedge strategies. |
| |
| (b) | All cash flow and fair value hedge derivatives were interest rate contracts for the periods presented. |
| |
| (c) | Includes an insignificant amount of fair value hedge adjustments primarily related to discontinued borrowed funds hedge relationships. |
| |
| (d) | For all periods presented, there were no gains or losses from cash flow hedge derivatives reclassified to income because it became probable that the original forecasted transaction would not occur. |
66 The PNC Financial Services Group, Inc. – Form 10-Q
Detail regarding the impact of fair value hedge accounting on the carrying value of the hedged items is presented in the following table.
Table 65:62: Hedged Items - Fair Value Hedges
| | | | March 31, 2018 | | March 31, 2019 | | December 31, 2018 |
| In millions | Carrying Value of the Hedged Items |
| | Cumulative Fair Value Hedge Adjustment included in the Carrying Value of Hedged Items (a) |
| | Carrying Value of the Hedged Items |
| | Cumulative Fair Value Hedge Adjustment included in the Carrying Value of Hedged Items (a) |
| | Carrying Value of the Hedged Items |
| | Cumulative Fair Value Hedge Adjustment included in the Carrying Value of Hedged Items (a) |
| |
| Investment securities - Available for Sale (b) | $ | 6,228 |
| | $ | (178 | ) | | |
| Investment securities - available for sale (b) | | $ | 6,418 |
| | $ | (54 | ) | | $ | 6,216 |
| | $ | (103 | ) | |
| Borrowed funds | $ | 28,788 |
| | $ | (480 | ) | | $ | 26,740 |
| | $ | 14 |
| | $ | 27,121 |
| | $ | (260 | ) | |
| |
| (a) | Includes an insignificant amount$(.5) billion of fair value hedge adjustments primarily related to discontinued relationships.borrowed funds hedge relationships for both periods presented. |
| |
| (b) | Carrying value shown represents amortized cost. |
Net Investment Hedges
We enter into foreign currency forward contracts to hedge non-U.S. dollar net investments in foreign subsidiaries against adverse changes in foreign exchange rates. We assess whether the hedging relationship is highly effective in achieving offsetting changes in the value of the hedge and hedged item by qualitatively verifying that the critical terms of the hedge and hedged item match at the inception of the hedging relationship and on an ongoing basis. Net investment hedge derivatives are classified as foreign exchange contracts. There were no components of derivative gains or losses excluded from the assessment of the hedge effectiveness for all periods presented. During the first three months of 2017 there was no net investment hedge ineffectiveness. Net losses on net investment hedge derivatives recognized in OCI were $18 million and $39 million for the three months ended March 31, 2019 and 2018, compared with $14 million for the three months ended March 31, 2017.
78 The PNC Financial Services Group, Inc. – Form 10-Q
Derivatives Not Designated As Hedging Instruments under GAAP
We also enter into derivatives that are not designated as accounting hedges under GAAP. For additional information on derivatives not designated as hedging instruments under GAAP, see Note 13 Financial Derivatives in our 20172018 Form 10-K.
Further detail regarding the gains (losses) on derivatives not designated in hedging relationships is presented in the following table.
Table 66:63: Gains (Losses) on Derivatives Not Designated for Hedging under GAAP
| | | | | Three months ended
March 31 | | Three months ended
March 31 | |
| In millions | | 2018 |
| 2017 |
| | 2019 |
| 2018 |
| |
| Derivatives used for mortgage banking activities: | | | | | |
| Interest rate contracts (a) | | $ | (114 | ) | $ | (7 | ) | | $ | 128 |
| $ | (114 | ) | |
| Derivatives used for customer-related activities: | | | | | |
| Interest rate contracts | | 56 |
| 34 |
| | (2 | ) | 56 |
| |
Foreign exchange contracts and other | | 44 |
| 32 |
| | 23 |
| 44 |
| |
Gains (losses) from customer-related activities (b)(c) |
| 100 |
| 66 |
| | 21 |
| 100 |
| |
| Derivatives used for other risk management activities: | | | | | |
| Foreign exchange contracts and other (b) (c) | | (17 | ) | (50 | ) | | |
| Foreign exchange contracts and other (c) | | (54 | ) | (17 | ) | |
| Total gains (losses) from derivatives not designated as hedging instruments |
| $ | (31 | ) | $ | 9 |
| | $ | 95 |
| $ | (31 | ) | |
| |
| (a) | Included in Residential mortgage, Corporate services and Other noninterest income on our Consolidated Income Statement. |
| |
| (b) | Includes an insignificant amount of gains (losses) on commodity contracts for all periods presented. |
| |
| (c) | Included in Other noninterest income on our Consolidated Income Statement. |
| |
(c) | Includes BlackRock LTIP funding obligation and the swaps entered into in connection with sales of a portion of Visa Class B common shares. |
Offsetting, Counterparty Credit Risk and Contingent Features
We generally utilize a net presentation on the Consolidated Balance Sheet for those derivative financial instruments entered into with counterparties under legally enforceable master netting agreements. The master netting agreements reduce credit risk by permitting the closeout netting of all outstanding derivative instruments under the master netting agreement with the same counterparty upon the occurrence of an event of default. The master netting agreement also may require the exchange of cash or marketable securities to collateralize either party’s net position. For additional information on derivative offsetting, counterparty credit risk and contingent features, see Note 13 Financial Derivatives in our 20172018 Form 10-K.
Table 6764 shows the impact legally enforceable master netting agreements had on our derivative assets and derivative liabilities as of March 31, 20182019 and December 31, 2017.2018. The table includes cash collateral held or pledged under legally enforceable master netting agreements. The table also includes the fair value of any securities collateral held or pledged under legally enforceable master netting agreements. Cash and securities collateral amounts are included in the table only to the extent of the related net derivative fair values.
The PNC Financial Services Group, Inc. – Form 10-Q 7967
Table 67: Derivative Assets and Liabilities Offsetting
|
| | | | | | | | | | | | | | | | | | | | | | | | | | | |
| In millions | | | | Amounts Offset on the Consolidated Balance Sheet | | | | | | Securities Collateral Held / (Pledged) Under Master Netting Agreements |
| | | |
Gross Fair Value |
| | Fair Value Offset Amount |
| | Cash Collateral |
| | Net Fair Value |
| | | | Net Amounts |
| |
| March 31, 2018 | | | | | | | | | | | | | | | |
| Derivative assets | | | | | | | | | | | | | | | |
| Interest rate contracts: | | | | | | | | | | | | | | | |
| Over-the-counter cleared (a) | | $ | 24 |
| | | | | | $ | 24 |
| | | | | | $ | 24 |
| |
| Exchange-traded | | 2 |
| | | | | | 2 |
| | | | | | 2 |
| |
| Over-the-counter | | 1,406 |
| | $ | 602 |
| | $ | 41 |
| | 763 |
| | | | $ | 12 |
| | 751 |
| |
| Foreign exchange and other contracts | | 471 |
| | 193 |
| | 4 |
| | 274 |
| | | | | | 274 |
| |
| Total derivative assets | | $ | 1,903 |
|
| $ | 795 |
|
| $ | 45 |
|
| $ | 1,063 |
| | (b) | | $ | 12 |
| | $ | 1,051 |
| |
| Derivative liabilities | | | | | | | | | | | | | | | |
| Interest rate contracts: | | | | | | | | | | | | | | | |
| Over-the-counter cleared (a) | | $ | 18 |
| | | | | | $ | 18 |
| | | | | | $ | 18 |
| |
| Over-the-counter | | 1,996 |
| | $ | 629 |
| | $ | 570 |
| | 797 |
| | | | | | 797 |
| |
| Foreign exchange and other contracts | | 928 |
| | 166 |
| | 78 |
| | 684 |
| | | | | | 684 |
| |
| Total derivative liabilities | | $ | 2,942 |
| | $ | 795 |
| | $ | 648 |
| | $ | 1,499 |
| | (c) | |
|
| | $ | 1,499 |
| |
| December 31, 2017 | | | | | | | | | | | | | | | |
| Derivative assets | | | | | | | | | | | | | | | |
| Interest rate contracts: | | | | | | | | | | | | | | | |
| Over-the-counter cleared | | $ | 827 |
| | $ | 251 |
| | $ | 567 |
| | $ | 9 |
| | | | | | $ | 9 |
| |
| Over-the-counter | | 1,695 |
| | 668 |
| | 67 |
| | 960 |
| | | | $ | 32 |
| | 928 |
| |
| Foreign exchange and other contracts | | 352 |
| | 135 |
| | 2 |
| | 215 |
| | | | | | 215 |
| |
| Total derivative assets | | $ | 2,874 |
|
| $ | 1,054 |
|
| $ | 636 |
|
| $ | 1,184 |
| | (b) | | $ | 32 |
| | $ | 1,152 |
| |
| Derivative liabilities | | | | | | | | | | | | | | | |
| Interest rate contracts: | | | | | | | | | | | | | | | |
| Over-the-counter cleared | | $ | 260 |
| | $ | 251 |
| |
|
| | $ | 9 |
| | | | | | $ | 9 |
| |
| Over-the-counter | | 1,703 |
| | 662 |
| | 669 |
| | 372 |
| | | | | | 372 |
| |
| Foreign exchange and other contracts | | 893 |
| | 141 |
| | 94 |
| | 658 |
| | | | | | 658 |
| |
| Total derivative liabilities | | $ | 2,856 |
| | $ | 1,054 |
| | $ | 763 |
| | $ | 1,039 |
| | (c) | |
|
| | $ | 1,039 |
| |
| |
(a) | Reflects our first quarter 2018 change in accounting presentation for variation margin for certain derivative instruments cleared through a central clearing house. The accounting change reduced the asset and liability gross fair values with corresponding reductions to the fair value and cash collateral offsets, resulting in no changes to the net fair value amounts. |
| |
(b) | Represents the net amount of derivative assets included in Other assets on our Consolidated Balance Sheet. |
| |
(c) | Represents the net amount of derivative liabilities included in Other liabilities on our Consolidated Balance Sheet. |
Table 6764 includes over-the-counter (OTC) derivatives and OTC cleared derivatives and exchange-traded derivatives. OTC derivatives represent contracts executed bilaterally with counterparties that are not settled through an organized exchange or cleared through a central clearing house. The majority of OTC derivatives are governed by the International Swaps and Derivatives Association (ISDA) documentation or other legally enforceable master netting agreements. OTC cleared derivatives represent contracts executed bilaterally with counterparties in the OTC market that are novated to a central clearing house who then becomes our counterparty. Exchange-traded derivatives represent standardized futuresOTC cleared derivative instruments are typically settled in cash each day based on the prior day value.
Table 64: Derivative Assets and options contracts executed directly on an organized exchange.Liabilities Offsetting
|
| | | | | | | | | | | | | | | | | | | | | | | | | | | |
| In millions | | | | Amounts Offset on the Consolidated Balance Sheet | | | | | | Securities Collateral Held/Pledged Under Master Netting Agreements |
| | | |
Gross Fair Value |
| | Fair Value Offset Amount |
| | Cash Collateral |
| | Net Fair Value |
| | | | Net Amounts |
| |
| March 31, 2019 | | | | | | | | | | | | | | | |
| Derivative assets | | | | | | | | | | | | | | | |
| Interest rate contracts: | | | | | | | | | | | | | | | |
| Over-the-counter cleared | | $ | 18 |
| | | | | | $ | 18 |
| | | | | | $ | 18 |
| |
| Over-the-counter | | 1,965 |
| | $ | 431 |
| | $ | 295 |
| | 1,239 |
| | | | $ | 70 |
| | 1,169 |
| |
| Commodity contracts | | 159 |
| | 117 |
| | 1 |
| | 41 |
| | | | | | 41 |
| |
| Foreign exchange and other contracts | | 226 |
| | 147 |
| | 6 |
| | 73 |
| | | | | | 73 |
| |
| Total derivative assets | | $ | 2,368 |
|
| $ | 695 |
|
| $ | 302 |
|
| $ | 1,371 |
| | (a) | | $ | 70 |
| | $ | 1,301 |
| |
| Derivative liabilities | | | | | | | | | | | | | | | |
| Interest rate contracts: | | | | | | | | | | | | | | | |
| Over-the-counter cleared | | $ | 23 |
| | | | | | $ | 23 |
| | | | | | $ | 23 |
| |
| Over-the-counter | | 1,297 |
| | $ | 543 |
| | $ | 537 |
| | 217 |
| | | | | | 217 |
| |
| Commodity contracts | | 154 |
| | 90 |
| | 39 |
| | 25 |
| | | | | | 25 |
| |
| Foreign exchange and other contracts | | 431 |
| | 62 |
| | 50 |
| | 319 |
| | | | | | 319 |
| |
| Total derivative liabilities | | $ | 1,905 |
| | $ | 695 |
| | $ | 626 |
| | $ | 584 |
| | (b) | |
|
| | $ | 584 |
| |
| December 31, 2018 | | | | | | | | | | | | | | | |
| Derivative assets | | | | | | | | | | | | | | | |
| Interest rate contracts: | | | | | | | | | | | | | | | |
| Over-the-counter cleared | | $ | 29 |
| | | | | | $ | 29 |
| | | | | | $ | 29 |
| |
| Over-the-counter | | 1,472 |
| | $ | 450 |
| | $ | 117 |
| | 905 |
| | | | $ | 25 |
| | 880 |
| |
| Commodity contracts | | 311 |
| | 76 |
| | 210 |
| | 25 |
| | | | | | 25 |
| |
| Foreign exchange and other contracts | | 269 |
| | 162 |
| | 14 |
| | 93 |
| | | | | | 93 |
| |
| Total derivative assets | | $ | 2,081 |
|
| $ | 688 |
|
| $ | 341 |
|
| $ | 1,052 |
| | (a) | | $ | 25 |
| | $ | 1,027 |
| |
| Derivative liabilities | | | | | | | | | | | | | | | |
| Interest rate contracts: | | | | | | | | | | | | | | | |
| Over-the-counter cleared | | $ | 24 |
| | | | | | $ | 24 |
| | | | | | $ | 24 |
| |
| Over-the-counter | | 1,496 |
| | $ | 557 |
| | $ | 489 |
| | 450 |
| | | | $ | 11 |
| | 439 |
| |
| Commodity contracts | | 305 |
| | 56 |
| | 17 |
| | 232 |
| | | | | | 232 |
| |
| Foreign exchange and other contracts | | 465 |
| | 75 |
| | 33 |
| | 357 |
| | | | | | 357 |
| |
| Total derivative liabilities | | $ | 2,290 |
| | $ | 688 |
| | $ | 539 |
| | $ | 1,063 |
| | (b) | | $ | 11 |
| | $ | 1,052 |
| |
| |
| (a) | Represents the net amount of derivative assets included in Other assets on our Consolidated Balance Sheet. |
| |
| (b) | Represents the net amount of derivative liabilities included in Other liabilities on our Consolidated Balance Sheet. |
In addition to using master netting agreements and other collateral agreements to reduce credit risk associated with derivative instruments, we also seek to manage credit risk by evaluating credit ratings of counterparties and by using internal credit analysis, limits and monitoring procedures.
80 The PNC Financial Services Group, Inc. – Form 10-Q
At March 31, 2018,2019, we held cash, U.S. government securities and mortgage-backed securities totaling $.2$.5 billion under master netting agreements and other collateral agreements to collateralize net derivative assets due from counterparties, and we pledged cash totaling $1.4 billion under these agreements to collateralize net derivative liabilities owed to counterparties and to meet initial margin requirements. These totals may differ from the amounts presented in the preceding offsetting table because these totals may include collateral exchanged under an agreement that does not qualify as a master netting agreement or because the total amount of collateral
68 The PNC Financial Services Group, Inc. – Form 10-Q
held or pledged exceeds the net derivative fair values with the counterparty as of the balance sheet date due to timing or other factors, such as initial margin. To the extent not netted against the derivative fair values under a master netting agreement, the receivable for cash pledged is included in Other assets and the obligation for cash held is included in Other liabilities on our Consolidated Balance Sheet. Securities held from counterparties are not recognized on our balance sheet. Likewise securities we have pledged to counterparties remain on our balance sheet.
Certain derivative agreements contain various credit-risk related contingent provisions, such as those that require our debt to maintain a specified credit rating from one or more of the major credit rating agencies. If our debt ratings were to fall below such specified ratings, the counterparties to the derivative instruments could request immediate payment or demand immediate and ongoing full collateralization on derivative instruments in net liability positions. The aggregate fair value of all derivative instruments with credit-risk-related contingent features that were in a net liability position on March 31, 20182019 was $1.9$1.1 billion for which we had posted collateral of $.7$.6 billion in the normal course of business. The maximum additional amount of collateral we would have been required to post if the credit-risk-related contingent features underlying these agreements had been triggered on March 31, 20182019 would be $1.2$.5 billion.
NOTE 10 EARNINGS PER SHARE
Table 68:65: Basic and Diluted Earnings Per Common Share
| | | | | Three months ended
March 31 | | | Three months ended
March 31 |
| In millions, except per share data | | 2018 |
| | 2017 |
| | | 2019 |
| | 2018 |
|
| Basic | | | | | | | | | |
| Net income | | $ | 1,239 |
| | $ | 1,074 |
| | | $ | 1,271 |
| | $ | 1,239 |
|
| Less: | | | | | | | | | |
| Net income (loss) attributable to noncontrolling interests | | 10 |
| | 17 |
| | |
| Net income attributable to noncontrolling interests | | | 10 |
| | 10 |
|
| Preferred stock dividends | | 63 |
| | 63 |
| | | 63 |
| | 63 |
|
| Preferred discount accretion and redemptions | | 1 |
| | 21 |
| | |
| Preferred stock discount accretion and redemptions | | | 1 |
| | 1 |
|
| Net income attributable to common shares | | 1,165 |
|
| 973 |
| | | 1,197 |
|
| 1,165 |
|
| Less: | | | | | | |
| Dividends and undistributed earnings allocated to participating securities | | 5 |
| | 6 |
| | |
| Less: Dividends and undistributed earnings allocated to participating securities | | | 5 |
| | 5 |
|
| Net income attributable to basic common shares | | $ | 1,160 |
|
| $ | 967 |
| | | $ | 1,192 |
|
| $ | 1,160 |
|
| Basic weighted-average common shares outstanding | | 473 |
| | 487 |
| | | 455 |
| | 473 |
|
| Basic earnings per common share (a) | | $ | 2.45 |
| | $ | 1.99 |
| | | $ | 2.62 |
| | $ | 2.45 |
|
| Diluted | | | | | | | | | |
| Net income attributable to basic common shares | | $ | 1,160 |
| | $ | 967 |
| | | $ | 1,192 |
| | $ | 1,160 |
|
| Less: Impact of BlackRock earnings per share dilution | | 2 |
| | 4 |
| | | 3 |
| | 2 |
|
| Net income attributable to diluted common shares | | $ | 1,158 |
|
| $ | 963 |
| | | $ | 1,189 |
|
| $ | 1,158 |
|
| Basic weighted-average common shares outstanding | | 473 |
| | 487 |
| | | 455 |
| | 473 |
|
| Dilutive potential common shares | | 3 |
| | 5 |
| | | 1 |
| | 3 |
|
| Diluted weighted-average common shares outstanding | | 476 |
| | 492 |
| | | 456 |
| | 476 |
|
| Diluted earnings per common share (a) | | $ | 2.43 |
| | $ | 1.96 |
| | | $ | 2.61 |
| | $ | 2.43 |
|
| |
| (a) | Basic and diluted earnings per share under the two-class method are determined on net income reported on the income statement less earnings allocated to nonvested restricted shares and restricted share units with nonforfeitable dividends and dividend rights (participating securities). |
The PNC Financial Services Group, Inc. – Form 10-Q 8169
NOTE 11 TOTAL EQUITY AND OTHER COMPREHENSIVE INCOME
Activity in total equity for the three months ended March 31, 2019 and 2018 and 2017 follows:follows.
Table 69:66: Rollforward of Total Equity
| | | | | | Shareholders’ Equity | | | | | | Shareholders’ Equity | | | |
| In millions | Shares Outstanding Common Stock |
| | Common Stock |
| Capital Surplus - Preferred Stock |
| Capital Surplus - Common Stock and Other |
| Retained Earnings |
| Accumulated Other Comprehensive Income (Loss) |
| Treasury Stock |
| | Non- controlling Interests |
| Total Equity |
| | Shares Outstanding Common Stock |
| | Common Stock |
| Capital Surplus - Preferred Stock |
| Capital Surplus - Common Stock and Other |
| Retained Earnings |
| Accumulated Other Comprehensive Income (Loss) |
| Treasury Stock |
| | Non- controlling Interests |
| Total Equity |
| |
| Balance at January 1, 2017 | 485 |
| | $ | 2,709 |
| $ | 3,977 |
| $ | 12,674 |
| $ | 31,670 |
| $ | (265 | ) | $ | (5,066 | ) | | $ | 1,155 |
| $ | 46,854 |
| | |
| Balance at December 31, 2017 (a) | | 473 |
| | $ | 2,710 |
| $ | 3,985 |
| $ | 12,389 |
| $ | 35,481 |
| $ | (148 | ) | $ | (6,904 | ) | | $ | 72 |
| $ | 47,585 |
| |
| Cumulative effect of ASU adoptions (b) | | | | | | (22 | ) | 6 |
| | | | (16 | ) | |
| Balance at January 1, 2018 (a) | | 473 |
| | $ | 2,710 |
| $ | 3,985 |
| $ | 12,389 |
| $ | 35,459 |
| $ | (142 | ) | $ | (6,904 | ) | | $ | 72 |
| $ | 47,569 |
| |
| Net income | | | | 1,057 |
| | | 17 |
| 1,074 |
| | | | | 1,229 |
| | | 10 |
| 1,239 |
| |
| Other comprehensive income (loss), net of tax | | | | (14 | ) | | | | (14 | ) | | | | | (557 | ) | | | | (557 | ) | |
| Cash dividends declared | | | | | |
|
| | | | | | |
|
| |
| Common ($.55 per share) | | | | (271 | ) | | | | (271 | ) | | |
| Preferred | | | | (63 | ) | | | | (63 | ) | | |
| Preferred stock discount accretion | | | | 2 |
| | (2 | ) | | | |
|
| | |
| Redemption of noncontrolling interests (a) | | |
|
| |
|
| (19 | ) | | | (981 | ) | (1,000 | ) | | |
| Treasury stock activity (b) |
|
| | | (216 | ) | | (257 | ) | | | (473 | ) | | |
| Other | | | | (162 | ) | | | (42 | ) | (204 | ) | | |
| Balance at March 31, 2017 (c) | 485 |
| | $ | 2,709 |
| $ | 3,979 |
| $ | 12,296 |
| $ | 32,372 |
| $ | (279 | ) | $ | (5,323 | ) | | $ | 149 |
| $ | 45,903 |
| | |
| Balance at December 31, 2017 | 473 |
| | $ | 2,710 |
| $ | 3,985 |
| $ | 12,389 |
| $ | 35,481 |
| $ | (148 | ) | $ | (6,904 | ) | | $ | 72 |
| $ | 47,585 |
| | |
| Cumulative effect of ASU adoptions (d) | | | | (22 | ) | 6 |
| | | | (16 | ) | | |
| Balance at January 1, 2018 | 473 |
| | $ | 2,710 |
| $ | 3,985 |
| $ | 12,389 |
| $ | 35,459 |
| $ | (142 | ) | $ | (6,904 | ) | | $ | 72 |
| $ | 47,569 |
| | |
| Net income | | | | 1,229 |
| | | 10 |
| 1,239 |
| | |
| Other comprehensive income (loss), net of tax | | | | (557 | ) | | | | (557 | ) | | |
| Cash dividends declared | | | | | | | |
| Common ($.75 per share) | | | | (358 | ) | | | | (358 | ) | | |
| Common | | | | | (358 | ) | | | | (358 | ) | |
| Preferred | | | | (63 | ) | | | | (63 | ) | | | | | (63 | ) | | | | (63 | ) | |
| Preferred stock discount accretion | | | | 1 |
| | (1 | ) | | | | | | | | 1 |
| | (1 | ) | | | |
|
| |
| Treasury stock activity | (3 | ) | | | 6 |
| | (631 | ) | | | (625 | ) | | (3 | ) | | | 6 |
| | (631 | ) | | | (625 | ) | |
| Other | | | | (154 | ) | | | (16 | ) | (170 | ) | | | | | (154 | ) | | | (16 | ) | (170 | ) | |
| Balance at March 31, 2018 (c) | 470 |
| | $ | 2,710 |
| $ | 3,986 |
| $ | 12,241 |
| $ | 36,266 |
| $ | (699 | ) | $ | (7,535 | ) | | $ | 66 |
| $ | 47,035 |
| | |
| Balance at March 31, 2018 (a) | | 470 |
| | $ | 2,710 |
| $ | 3,986 |
| $ | 12,241 |
| $ | 36,266 |
| $ | (699 | ) | $ | (7,535 | ) | | $ | 66 |
| $ | 47,035 |
| |
| Balance at December 31, 2018 (a) | | 457 |
| | $ | 2,711 |
| $ | 3,986 |
| $ | 12,291 |
| $ | 38,919 |
| $ | (725 | ) | $ | (9,454 | ) | | $ | 42 |
| $ | 47,770 |
| |
| Cumulative effect of ASU 2016-02 adoption (c) | | | | | 62 |
| | | | 62 |
| |
| Balance at January 1, 2019 (a) | | 457 |
| | $ | 2,711 |
| $ | 3,986 |
| $ | 12,291 |
| $ | 38,981 |
| $ | (725 | ) | $ | (9,454 | ) | | $ | 42 |
| $ | 47,832 |
| |
| Net income | | | | | 1,261 |
| | | 10 |
| 1,271 |
| |
| Other comprehensive income (loss), net of tax | | | | | 720 |
| | | | 720 |
| |
| Cash dividends declared | | | | | | | |
| Common | | | | | (436 | ) | | | | (436 | ) | |
| Preferred | | | | | (63 | ) | | | | (63 | ) | |
| Preferred stock discount accretion | | | | | 1 |
| | (1 | ) | | | | |
| Treasury stock activity | | (5 | ) | | | 10 |
| | (631 | ) | | | (621 | ) | |
| Other | | | | | 3 |
| (118 | ) | | | (13 | ) | (128 | ) | |
| Balance at March 31, 2019 (a) | | 452 |
| | $ | 2,711 |
| $ | 3,990 |
| $ | 12,183 |
| $ | 39,742 |
| $ | (5 | ) | $ | (10,085 | ) | | $ | 39 |
| $ | 48,575 |
| |
| |
| (a) | See Note 15 Equity in our 2017 Form 10-K for additional information on the redemption of Perpetual Trust Securities. |
| |
(b) | Treasury stock activity totaled less than .5 million shares issued. |
| |
(c) | The par value of our preferred stock outstanding was less than $.5 million at each date and, therefore, is excluded from this presentation. |
| |
(d)(b) | Represents the cumulative effect of adopting ASU 2014-09, ASU 2016-01, ASU 2017-12 and ASU 2018-02. See the Recently Adopted Accounting Standards portion of Note 1 Accounting Policies in this Reportour 2018 Form 10-K for additional detail on the adoption of these ASUs.ASUs. |
| |
| (c) | Represents the impact of the adoption of ASU 2016-02 related primarily to deferred gains on previous sale-leaseback transactions. See the Recently Adopted Accounting Standards portion of Note 1 Accounting Policies in this Report for additional detail. |
WarrantsThe following table provides the dividends per share for PNC's common and preferred stock.
Table 67: Dividends Per Share (a)
|
| | | | | | |
| | March 31, 2019 |
| March 31, 2018 |
|
| Common Stock | $ | .95 |
| $ | .75 |
|
| Preferred Stock |
|
|
| Series B | $ | .45 |
| $ | .45 |
|
| Series O | $ | 3,375 |
| $ | 3,375 |
|
| Series P | $ | 1,531 |
| $ | 1,531 |
|
| Series Q | $ | 1,344 |
| $ | 1,344 |
|
| Series R | — |
| — |
|
| Series S | — |
| — |
|
(a) Dividends are payable quarterly other than Series O, Series R, and 3.5 million warrants outstanding at March 31, 2018 and December 31, 2017, respectively. As of March 31, 2018, each warrant entitles the holder to purchase one share of PNC commonSeries S preferred stock, at an exercise price of $67.20 per share. In accordancewhich are payable semiannually, with the terms ofSeries O payable in different quarters
than the warrants, the warrants are exercised on a non-cash net basis with the warrant holder receiving PNC common shares determined based on the excess of the market price of PNC commonSeries R and Series S preferred stock on the exercise date over the exercise price of the warrant. The outstanding warrants will expire as of December 31, 2018 and are considered in the calculation of diluted earnings per common share in Note 10 Earnings Per Share in this Report.
On April 4, 2018, PNC2019, we declared a quarterly common stock cash dividend of $.75$.95 per share to shareholders of record as of April 16, 2018. In accordance with the terms of the warrants, the declaration of a dividend in excess of $.66 per share may result in an adjustment to the warrant exercise price and to the warrant share number. As a result of this dividend, the warrant exercise price was reduced from $67.20 to $67.16 per sharepayable on April 16, 2018 and the warrant share number remained 1.00.May 5, 2019.
8270 The PNC Financial Services Group, Inc. – Form 10-Q
Other Comprehensive Income
Details of other comprehensive income (loss) are as follows:
Table 70:68: Other Comprehensive Income (Loss)
| | | | | Three months ended
March 31 | | Three months ended
March 31 |
| In millions | | 2018 |
| 2017 |
| | 2019 |
| 2018 |
|
| Net unrealized gains (losses) on non-OTTI securities | | | | | |
| Increase in net unrealized gains (losses) on non-OTTI securities | | $ | (645 | ) | $ | 67 |
| | $ | 640 |
| $ | (645 | ) |
| Less: Net gains (losses) realized as a yield adjustment reclassified to investment securities interest income | | 4 |
| 5 |
| | 3 |
| 4 |
|
| Less: Net gains (losses) realized on sales of securities reclassified to noninterest income | | (3 | ) | (7 | ) | | (2 | ) | (3 | ) |
| Net increase (decrease), pre-tax | | (646 | ) | 69 |
| | 639 |
| (646 | ) |
| Effect of income taxes | | 150 |
| (25 | ) | | (147 | ) | 150 |
|
| Net increase (decrease), after-tax | | (496 | ) | 44 |
| | 492 |
| (496 | ) |
| Net unrealized gains (losses) on OTTI securities | | | | | |
| Increase in net unrealized gains (losses) on OTTI securities | | 14 |
| 37 |
| | 9 |
| 14 |
|
| Less: Net gains (losses) realized on sales of securities reclassified to noninterest income | | | 2 |
| | |
| Net increase (decrease), pre-tax | | 14 |
| 35 |
| | 9 |
| 14 |
|
| Effect of income taxes | | (4 | ) | (13 | ) | | (2 | ) | (4 | ) |
| Net increase (decrease), after-tax | | 10 |
| 22 |
| | 7 |
| 10 |
|
| Net unrealized gains (losses) on cash flow hedge derivatives | | | | | |
| Increase in net unrealized gains (losses) on cash flow hedge derivatives | | (161 | ) | (22 | ) | | 108 |
| (161 | ) |
| Less: Net gains (losses) realized as a yield adjustment reclassified to loan interest income | | 26 |
| 46 |
| | (8 | ) | 26 |
|
| Less: Net gains (losses) realized as a yield adjustment reclassified to investment securities interest income | | 4 |
| 6 |
| | 1 |
| 4 |
|
| Less: Net gains (losses) realized on sales of securities reclassified to noninterest income | | 2 |
| 3 |
| | 15 |
| 2 |
|
| Net increase (decrease), pre-tax | | (193 | ) | (77 | ) | | 100 |
| (193 | ) |
| Effect of income taxes | | 44 |
| 28 |
| | (23 | ) | 44 |
|
| Net increase (decrease), after-tax | | (149 | ) | (49 | ) | | 77 |
| (149 | ) |
| Pension and other postretirement benefit plan adjustments | | | | | |
| Net pension and other postretirement benefit activity | | 61 |
| (74 | ) | | 143 |
| 61 |
|
| Amortization of actuarial loss (gain) reclassified to other noninterest expense | | 1 |
| 13 |
| | 1 |
| 1 |
|
| Amortization of prior service cost (credit) reclassified to other noninterest expense | | 1 |
| (1 | ) | | 1 |
| 1 |
|
| Net increase (decrease), pre-tax | | 63 |
| (62 | ) | | 145 |
| 63 |
|
| Effect of income taxes | | (15 | ) | 23 |
| | (33 | ) | (15 | ) |
| Net increase (decrease), after-tax | | 48 |
| (39 | ) | | 112 |
| 48 |
|
| Other | | | | | |
| PNC’s portion of BlackRock’s OCI | | 22 |
| 2 |
| | 29 |
| 22 |
|
| Net investment hedge derivatives | | (39 | ) | (14 | ) | | (18 | ) | (39 | ) |
| Foreign currency translation adjustments and other | | 44 |
| 16 |
| | 23 |
| 44 |
|
| Net increase (decrease), pre-tax | | 27 |
| 4 |
| | 34 |
| 27 |
|
| Effect of income taxes | | 3 |
| 4 |
| | (2 | ) | 3 |
|
| Net increase (decrease), after-tax | | 30 |
| 8 |
| | 32 |
| 30 |
|
| Total other comprehensive income, pre-tax | | (735 | ) | (31 | ) | | |
| Total other comprehensive income, tax effect | | 178 |
| 17 |
| | |
| Total other comprehensive income, after-tax | | $ | (557 | ) | $ | (14 | ) | | |
| Total other comprehensive income (loss), pre-tax | | 927 |
| (735 | ) |
| Total other comprehensive income (loss), tax effect | | (207 | ) | 178 |
|
| Total other comprehensive income (loss), after-tax | | $ | 720 |
| $ | (557 | ) |
The PNC Financial Services Group, Inc. – Form 10-Q 8371
Table 71:69: Accumulated Other Comprehensive Income (Loss) Components
| | | In millions, after-tax | Net unrealized gains (losses) on non-OTTI securities |
| | Net unrealized gains (losses) on OTTI securities |
| | Net unrealized gains (losses) on cash flow hedge derivatives |
| | Pension and other postretirement benefit plan adjustments |
| | Other |
| | Total |
| | Net unrealized gains (losses) on non-OTTI securities |
| | Net unrealized gains (losses) on OTTI securities |
| | Net unrealized gains (losses) on cash flow hedge derivatives |
| | Pension and other postretirement benefit plan adjustments |
| | Other |
| | Total |
| |
| Balance at December 31, 2016 | $ | 52 |
| | $ | 106 |
| | $ | 333 |
| | $ | (553 | ) | | $ | (203 | ) | | $ | (265 | ) | | |
| Net activity | 44 |
| | 22 |
| | (49 | ) | | (39 | ) | | 8 |
| | (14 | ) | | |
| Balance at March 31, 2017 | $ | 96 |
| | $ | 128 |
| | $ | 284 |
| | $ | (592 | ) | | $ | (195 | ) | | $ | (279 | ) | | |
| Balance at December 31, 2017 | $ | 62 |
| | $ | 215 |
| | $ | 151 |
| | $ | (446 | ) | | $ | (130 | ) | | $ | (148 | ) | | $ | 62 |
| | $ | 215 |
| | $ | 151 |
| | $ | (446 | ) | | $ | (130 | ) | | $ | (148 | ) | |
| Cumulative effect of adopting ASU 2018-02 (a) | 59 |
| | | | 33 |
| | (96 | ) | | 10 |
| | 6 |
| | 59 |
| | | | 33 |
| | (96 | ) | | 10 |
| | 6 |
| |
| Balance at January 1, 2018 | $ | 121 |
| | $ | 215 |
| | $ | 184 |
| | $ | (542 | ) | | $ | (120 | ) | | $ | (142 | ) | | 121 |
| | 215 |
| | 184 |
| | (542 | ) | | (120 | ) | | (142 | ) | |
| Net activity | (496 | ) | | 10 |
| | (149 | ) | | 48 |
| | 30 |
| | (557 | ) | | (496 | ) | | 10 |
| | (149 | ) | | 48 |
| | 30 |
| | (557 | ) | |
| Balance at March 31, 2018 | $ | (375 | ) | | $ | 225 |
| | $ | 35 |
| | $ | (494 | ) | | $ | (90 | ) | | $ | (699 | ) | | $ | (375 | ) | | $ | 225 |
| | $ | 35 |
| | $ | (494 | ) | | $ | (90 | ) | | $ | (699 | ) | |
| Balance at December 31, 2018 | | $ | (284 | ) | | $ | 204 |
| | $ | 47 |
| | $ | (530 | ) | | $ | (162 | ) | | $ | (725 | ) | |
| Net activity | | 492 |
| | 7 |
| | 77 |
| | 112 |
| | 32 |
| | 720 |
| |
| Balance at March 31, 2019 | | $ | 208 |
| | $ | 211 |
| | $ | 124 |
| | $ | (418 | ) | | $ | (130 | ) | | $ | (5 | ) | |
| |
| (a) | Represents the cumulative impact of adopting ASU 2018-02 which permits the reclassification to retained earnings of the income tax effects stranded within AOCI. See the Recently Adopted Accounting Standards portion of Note 1 Accounting Policies in this Reportour 2018 Form 10-K for additional detail on this adoption. |
NOTE 12 LEGAL PROCEEDINGS
We establish accruals for legal proceedings, including litigation and regulatory and governmental investigations and inquiries, when information related to the loss contingencies represented by those matters indicates both that a loss is probable and that the amount of loss can be reasonably estimated. Any such accruals are adjusted thereafter as appropriate to reflect changed circumstances. When we are able to do so, we also determine estimates of possible losses or ranges of possible losses, whether in excess of any related accrued liability or where there is no accrued liability, for disclosed legal proceedings (“Disclosed Matters,” which are those matters disclosed in this Note 12 as well as those matters disclosed in Note 19 Legal Proceedings in Part II, Item 8 of our 20172018 Form 10-K (such prior disclosure referred to as “Prior Disclosure”)). For Disclosed Matters where we are able to estimate such possible losses or ranges of possible losses, as of March 31, 2018,2019, we estimate that it is reasonably possible that we could incur losses in an aggregate amount of up to approximatelyless than $100 million. The estimates included in this amount are based on our analysis of currently available information and are subject to significant judgment and a variety of assumptions and uncertainties. As new information is obtained we may change our estimates. Due to the inherent subjectivity of the assessments and unpredictability of outcomes of legal proceedings, any amounts accrued or included in this aggregate amount may not represent the ultimate loss to us from the legal proceedings in question. Thus, our exposure and ultimate losses may be higher, and possibly significantly so, than the amounts accrued or this aggregate amount.
As a result of the types of factors described in Note 19 in our 20172018 Form 10-K, we are unable, at this time, to estimate the losses that it isare reasonably possible that we could incurto be incurred or ranges of such losses with respect to some of the matters disclosed, and the aggregate estimated amount provided above does not include an estimate for every Disclosed Matter. Therefore, as the estimated aggregate amount disclosed above does not include all of the Disclosed Matters, the amount disclosed above does not represent our maximum reasonably possible loss exposure for all of the Disclosed Matters. The estimated aggregate amount also does not reflect any of our exposure to matters not so disclosed, as discussed below under “Other.”
We include in some of the descriptions of individual Disclosed Matters certain quantitative information related to the plaintiff’s claim against us as alleged in the plaintiff’s pleadings or other public filings or otherwise publicly available information. While information of this type may provide insight into the potential magnitude of a matter, it does not necessarily represent our estimate of reasonably possible loss or our judgment as to any currently appropriate accrual.
Some of our exposure in Disclosed Matters may be offset by applicable insurance coverage. We do not consider the possible availability of insurance coverage in determining the amounts of any accruals (although we record the amount of related insurance recoveries that are deemed probable up to the amount of the accrual) or in determining any estimates of possible losses or ranges of possible losses.
Captive Mortgage Reinsurance Litigation
PNC has reached an agreement in principle with the plaintiffs to settle White et. al v. The PNC Financial Services Group, Inc. et al. (Civil Action No. 11-7928), pending in the U.S. District Court for the Eastern District of Pennsylvania. This settlement is subject to, among other things, final documentation. The financial impact of the settlement will not be material to PNC.
84 The PNC Financial Services Group, Inc. – Form 10-Q
Residential Mortgage-Backed Securities Indemnification DemandsDD Growth Premium Master Fund
In March 2018, one2019, the parties to the proceedings brought by the liquidator of the entities asserting a right to indemnification from us against claims in lawsuits brought by purchasers of residential mortgage-backed securities allegedly including loans sold by National City Mortgage submitted a demand for our purported share of the settlement amount of some of these lawsuits.
Mortgage Foreclosure False Claims Act Lawsuit
PNC Bank was named as a defendant, along with 13 other mortgage servicersDD Growth Premium Master Fund (DD Growth) and several law firms and affiliated entities, in a qui tam lawsuit broughtpending in the United States DistrictHigh Court, for the Southern District of New York by an individual plaintiff on behalf of the United States under the federal False Claims Act (United States ex rel. Grubea v. Rosicki, Rosicki & Associates, P.C., et al. (12 Civ. 7199 (JSR)).Dublin, Ireland entered into a settlement agreement to resolve this lawsuit. The lawsuit was originally filed under seal, with a second amended complaint unsealed by the district court in March 2018 and a third amended complaint filed in April 2018. A related lawsuit was filed against two other mortgage servicers at the same time.
In the third amended complaint, the plaintiff alleges, as relevant to PNC Bank and the other mortgage servicers, that the mortgage servicers made excessive claims for reimbursement from the Federal National Mortgage Association (FNMA), the Federal Home Loan Mortgage Corporation (FHLMC) and the Federal Housing Administration (FHA) for costs incurred in connection with foreclosures on residential mortgage loans purchased or guaranteed by FNMA or FHLMC or insured by FHA in violation of the relevant regulations and applicable contractual reimbursement terms. The plaintiff seeks,settlement is conditioned, among other things, unspecified damages equal to the damage to the United States (including treble damages under the False Claims Act), unspecified civil penalties, and attorneys’ fees and other costs of bringing this lawsuit. The government declined to interveneon court approval in the action, butCayman Islands where DD Growth is prosecuting a related suit against oneorganized. PNC and BNY Mellon have agreed on the amount of the law firms and certain affiliated entities. The district court has set a trial date for March 2019.
This lawsuitPNC’s contribution to this settlement, which is related to the subject matter of the 2013 subpoena from the U.S. Attorney’s Office for the Southern District of New York described in Note 19 in our 2017 Form 10-K under “Other Regulatory and Governmental Inquiries.”not material.
Other Regulatory and Governmental Inquiries
We are the subject of investigations, audits and other forms of regulatory and governmental inquiry covering a broad range of issues in our consumer, mortgage, brokerage, securities and other financial services businesses, as well as other aspects of our operations. In some
72 The PNC Financial Services Group, Inc. – Form 10-Q
cases, these inquiries are part of reviews of specified activities at multiple industry participants; in others, they are directed at PNC individually. These inquiries, including those described in Prior Disclosure, may lead to administrative, civil or criminal proceedings, and possibly result in remedies including fines, penalties, restitution, or alterations in our business practices, and in additional expenses and collateral costs and other consequences. These inquiries may result in significant reputational harm or other adverse collateral consequences even if direct resulting remedies are not material to us.
Our practice is to cooperate fully with regulatory and governmental investigations, audits and other inquiries, including those described in Prior Disclosure.
Other
In addition to the proceedings or other matters described above and in Prior Disclosure, PNC and persons to whom we may have indemnification obligations, in the normal course of business, are subject to various other pending and threatened legal proceedings in which claims for monetary damages and other relief are asserted. We do not anticipate, at the present time, that the ultimate aggregate liability, if any, arising out of such other legal proceedings will have a material adverse effect on our financial position. However, we cannot now determine whether or not any claims asserted against us or others to whom we may have indemnification obligations, whether in the proceedings or other matters described above or otherwise, will have a material adverse effect on our results of operations in any future reporting period, which will depend on, among other things, the amount of the loss resulting from the claim and the amount of income otherwise reported for the reporting period.
The PNC Financial Services Group, Inc. – Form 10-Q85
NOTE 13 COMMITMENTS
In the normal course of business, we have various commitments outstanding, certain of which are not included on our Consolidated Balance Sheet. The following table presents our outstanding commitments to extend credit along with significant other commitments as of March 31, 20182019 and December 31, 2017,2018, respectively.
Table 72:70: Commitments to Extend Credit and Other Commitments
| | | In millions | March 31
2018 |
| | December 31
2017 |
| | March 31
2019 |
| | December 31
2018 |
| |
| Commitments to extend credit | | | | | | | | |
| Total commercial lending | $ | 113,268 |
| | $ | 112,125 |
| | $ | 122,014 |
| | $ | 120,165 |
| |
| Home equity lines of credit | 16,888 |
| | 17,852 |
| | 17,094 |
| | 16,944 |
| |
| Credit card | 25,861 |
| | 24,911 |
| | 28,187 |
| | 27,100 |
| |
| Other | 4,812 |
| | 4,753 |
| | 5,844 |
| | 5,069 |
| |
| Total commitments to extend credit | 160,829 |
| | 159,641 |
| | 173,139 |
| | 169,278 |
| |
| Net outstanding standby letters of credit (a) | 8,350 |
| | 8,651 |
| | 9,236 |
| | 8,655 |
| |
| Reinsurance agreements (b) | 1,622 |
| | 1,654 |
| | 1,492 |
| | 1,549 |
| |
| Standby bond purchase agreements (c) | 1,014 |
| | 843 |
| | 1,145 |
| | 1,000 |
| |
| Other commitments (d) | 1,129 |
| | 1,732 |
| | 1,472 |
| | 1,130 |
| |
| Total commitments to extend credit and other commitments | $ | 172,944 |
| | $ | 172,521 |
| | $ | 186,484 |
| | $ | 181,612 |
| |
| |
| (a) | Net outstanding standby letters of credit include $3.1 billion and $3.5$3.7 billion at both March 31, 20182019 and December 31, 2017, respectively,2018, which support remarketing programs. |
| |
| (b) | Represents aggregate maximum exposure up to the specified limits of the reinsurance contracts provided by our wholly-owned captive insurance subsidiary. These amounts reflect estimates based on availability of financial information from insurance carriers. As of both March 31, 2019 and December 31, 2018, the aggregate maximum exposure amount comprised $1.4$1.3 billion for accidental death & dismemberment contracts and $.2 billion for credit life, accident and health contracts. Comparable amounts at December 31, 2017 were $1.5 billion and $.2 billion, respectively. |
| |
| (c) | We enter into standby bond purchase agreements to support municipal bond obligations. |
| |
| (d) | Includes $.5 billion related to investments in qualified affordable housing projects at both March 31, 20182019 and December 31, 2017.2018. |
Commitments to Extend Credit
Commitments to extend credit, or net unfunded loan commitments, represent arrangements to lend funds or provide liquidity subject to specified contractual conditions. These commitments generally have fixed expiration dates, may require payment of a fee, and generally contain termination clauses in the event the customer’s credit quality deteriorates.
Net Outstanding Standby Letters of Credit
We issue standby letters of credit and share in the risk of standby letters of credit issued by other financial institutions, in each case to support obligations of our customers to third-parties,third parties, such as insurance requirements and the facilitation of transactions involving capital markets product execution. Approximately 90% and 91%98% of our net outstanding standby letters of credit were rated as Pass as of March 31, 2018 and December 31, 2017, respectively,2019, with the remainder rated as Below Pass.Criticized. An internal credit rating of Pass indicates the expected risk of loss is currently low, while a rating of Below PassCriticized indicates a higher degree of risk.
The PNC Financial Services Group, Inc. – Form 10-Q73
If the customer fails to meet its financial or performance obligation to the third-partythird party under the terms of the contract or there is a need to support a remarketing program, then upon a draw by a beneficiary, subject to the terms of the letter of credit, we would be obligated to make payment to them. The standby letters of credit outstanding on March 31, 20182019 had terms ranging from less than one year to sevensix years.
As of March 31, 2018,2019, assets of $1.2$1.0 billion secured certain specifically identified standby letters of credit. In addition, a portion of the remaining standby letters of credit issued on behalf of specific customers is also secured by collateral or guarantees that secure the customers’ other obligations to us. The carrying amount of the liability for our obligations related to standby letters of credit and participations in standby letters of credit was $.2 billion at March 31, 20182019 and is included in Other liabilities on our Consolidated Balance Sheet.
86 The PNC Financial Services Group, Inc. – Form 10-Q
NOTE 14 SEGMENT REPORTING
We have four reportable business segments:
• Retail Banking
• Corporate & Institutional Banking
• Asset Management Group
• BlackRock
Results of individual businesses are presented based on our internal management reporting practices. There is no comprehensive, authoritative body of guidance for management accounting equivalent to GAAP; therefore, the financial results of our individual businesses are not necessarily comparable with similar information for any other company. We periodically refine our internal methodologies as management reporting practices are enhanced. To the extent significant and practicable, retrospective application of new methodologies is made to prior period reportable business segment results and disclosures to create comparability with the current period.
Net interest income in business segment results reflects our internal funds transfer pricing methodology. Assets receive a funding charge and liabilities and capital receive a funding credit based on a transfer pricing methodology that incorporates product repricing characteristics, tenor and other factors.
Total business segment financial results differ from total consolidated net income. The impact of these differences is reflected in the “Other” category in the business segment tables. “Other” includes residual activities that do not meet the criteria for disclosure as a separate reportable business, such as asset and liability management activities including net securities gains or losses, other-than-temporary impairment of investment securities, certain trading activities, certain non-strategic runoff consumer loan portfolios, private equity investments, intercompany eliminations, mostcertain corporate overhead, tax adjustments that are not allocated to business segments, gains or losses related to BlackRock transactions, integration costs, exited businesses and differences between business segment performance reporting and financial statement reporting (GAAP), including the presentation of net income attributable to noncontrolling interests as the segments’ results exclude their portion of net income attributable to noncontrolling interests. Assets, revenue and earnings attributable to foreign activities were not material in the periods presented for comparative purposes.
Financial results are presented, to the extent practicable, as if each business operated on a stand-alone basis. Additionally, we have aggregated the results for corporate support functions within “Other” for financial reporting purposes.
Our allocation of the costs incurred by shared support areas not directly aligned with the businesses is primarilyNet interest income in business segment results reflects our internal funds transfer pricing methodology. Assets receive a funding charge and liabilities and capital receive a funding credit based on the use of services.a transfer pricing methodology that incorporates product repricing characteristics, tenor and other factors.
A portion of capital is intended to cover unexpected losses and is assigned to our business segments using our risk-based economic capital model, including consideration of the goodwill at those business segments, as well as the diversification of risk among the business segments, ultimately reflecting our portfolio risk adjusted capital allocation.
We have allocated the allowances for loan and lease losses and for unfunded loan commitments and letters of credit based on the loan exposures within each business segment’s portfolio. Key reserve assumptions and estimation processes react to and are influenced by observed changes in loan portfolio performance experience, the financial strength of the borrower and economic conditions. Key reserve assumptions are periodically updated.
74 The PNC Financial Services Group, Inc. – Form 10-Q
Business Segment Results
Table 71: Results of Businesses
|
| | | | | | | | | | | | | | | | | | | | | | | | |
Three months ended March 31
In millions | | Retail Banking |
| | Corporate &
Institutional
Banking |
| | Asset
Management
Group |
| | BlackRock |
| | Other |
| | Consolidated (a) |
|
| 2019 | | | | | | | | | | | | |
| Income Statement | | | | | | | | | | | | |
| Net interest income | | $ | 1,349 |
| | $ | 877 |
| | $ | 70 |
| | | | $ | 179 |
| | $ | 2,475 |
|
| Noninterest income | | 595 |
| | 576 |
| | 217 |
| | $ | 233 |
| | 190 |
| | 1,811 |
|
| Total revenue | | 1,944 |
| | 1,453 |
| | 287 |
| | 233 |
| | 369 |
| | 4,286 |
|
| Provision for credit losses (benefit) | | 128 |
| | 71 |
| | (1 | ) | | | | (9 | ) | | 189 |
|
| Depreciation and amortization | | 51 |
| | 50 |
| | 12 |
| | | | 121 |
| | 234 |
|
| Other noninterest expense | | 1,417 |
| | 636 |
| | 218 |
| | | | 73 |
| | 2,344 |
|
| Income before income taxes and noncontrolling interests | | 348 |
| | 696 |
| | 58 |
| | 233 |
| | 184 |
| | 1,519 |
|
| Income taxes (benefit) | | 84 |
| | 144 |
| | 13 |
| | 36 |
| | (29 | ) | | 248 |
|
| Net income | | $ | 264 |
| | $ | 552 |
| | $ | 45 |
| | $ | 197 |
| | $ | 213 |
| | $ | 1,271 |
|
| Average Assets (b) | | $ | 91,255 |
| | $ | 157,169 |
| | $ | 7,259 |
| | $ | 8,080 |
| | $ | 122,135 |
| | $ | 385,898 |
|
| 2018 | | | | | | | | | | | | |
| Income Statement | | | | | | | | | | | | |
| Net interest income | | $ | 1,218 |
| | $ | 861 |
| | $ | 74 |
| | | | $ | 208 |
| | $ | 2,361 |
|
| Noninterest income | | 635 |
| | 547 |
| | 226 |
| | $ | 235 |
| | 107 |
| | 1,750 |
|
| Total revenue | | 1,853 |
| | 1,408 |
| | 300 |
| | 235 |
| | 315 |
| | 4,111 |
|
| Provision for credit losses (benefit) | | 69 |
| | 41 |
| | (7 | ) | | | | (11 | ) | | 92 |
|
| Depreciation and amortization | | 45 |
| | 48 |
| | 12 |
| | | | 128 |
| | 233 |
|
| Other noninterest expense | | 1,411 |
| | 605 |
| | 213 |
| | | | 65 |
| | 2,294 |
|
| Income before income taxes and noncontrolling interests | | 328 |
| | 714 |
| | 82 |
| | 235 |
| | 133 |
| | 1,492 |
|
| Income taxes (benefit) | | 79 |
| | 151 |
| | 20 |
| | 38 |
| | (35 | ) | | 253 |
|
| Net income | | $ | 249 |
| | $ | 563 |
| | $ | 62 |
| | $ | 197 |
| | $ | 168 |
| | $ | 1,239 |
|
| Average Assets (b) | | $ | 88,734 |
| | $ | 151,909 |
| | $ | 7,499 |
| | $ | 7,704 |
| | $ | 120,429 |
| | $ | 376,275 |
|
| |
| (a) | There were no material intersegment revenues for the three months ended March 31, 2019 and 2018. |
| |
| (b) | Period-end balances for BlackRock. |
Business Segment Products and Services
Retail Banking provides deposit, lending, brokerage, insurance services, investment management and cash management products and services to consumer and small business customers within our primary geographic markets.customers. Our customers are serviced through our branch network, ATMs, call centers, online banking and mobile channels. The branch network is located primarily in Pennsylvania, Ohio, New Jersey, Michigan, Illinois, Maryland, Indiana, Florida, North Carolina, Kentucky, Washington, D.C., Delaware, Virginia, Georgia, Alabama, Missouri, Wisconsinmarkets across the Mid-Atlantic, Midwest and South Carolina.Southeast. In 2018, Retail Banking launched its national retail digital strategy designed to grow customers with digitally-led banking and an ultra-thin branch network in markets outside of our existing retail branch network. Deposit products include checking, savings and money market accounts and certificates of deposit. Lending products include residential mortgages, home equity loans and lines of credit, auto loans, credit cards, education loans and personal and small business loans and lines of credit. The residential mortgage loans are directly originated within our branch network and nationwide, and are typically underwritten to government agency and/or third-party standards, and either sold, servicing retained, or held on our balance sheet. Brokerage, investment management and cash management products and services include managed, education, retirement and trust accounts.
Corporate & Institutional Banking provides lending, treasury management and capital markets-related products and services to mid-sized and large corporations, and government and not-for-profit entities. Lending products include secured and unsecured loans, letters of credit and equipment leases. Treasury management services include cash and investment management, receivables
The PNC Financial Services Group, Inc. – Form 10-Q87
management, disbursement services, funds transfer services, information reporting and global trade services. Capital markets-related products and services include foreign exchange, derivatives, securities underwriting, loan syndications, mergers and acquisitions advisory and equity capital markets advisory related services. We also provide commercial loan servicing and technology solutions for the commercial real estate finance industry. Products and services are provided nationally. We offer certain products and services internationally.
Asset Management Group provides personal wealth management for high net worth and ultra high net worth clients and institutional asset management. Wealth management products and services include investment and retirement planning, customized investment management, private banking, tailored credit solutions, and trust management and administration for individuals and their families. Our Hawthorn unit provides multi-generational family planning including estate, financial, tax planning, fiduciary, investment management and consulting, private banking, personal administrative services, asset custody and customized performance reporting to
The PNC Financial Services Group, Inc. – Form 10-Q75
ultra high net worth families. Institutional asset management provides advisory,outsourced chief investment officer, custody, private real estate, cash and fixed income client solutions, and retirement administration services.services to institutional clients such as corporations, healthcare systems, insurance companies, unions, municipalities and non-profits. The business also offers PNC proprietary mutual funds. Institutional clients include corporations, unions, municipalities, non-profits, foundationsfunds and endowments, largely within our primary geographic markets.investment strategies.
BlackRock, in which we hold an equity investment, is a leading publicly-traded investment management firm providing a broad range of investment risk management and technology services to institutional and retail clients worldwide. Using a diverse platform of alpha-seeking active, index and indexcash management investment strategies across asset classes, BlackRock developstailors investment outcomes and asset allocation solutions for clients. Product offerings include single- and multi-asset class portfolios investing in equities, fixed income, alternatives and money market instruments. BlackRock also offers technology services, including an investment and risk management technology platform, risk analytics,as well as advisory and technology services and solutions to a broad base of institutional and wealth management investors.clients.
Our equity investment in BlackRock is significant and accounted for under the equity method. It provides us with an additional source of noninterest income and increases our overall revenue diversification. At March 31, 2019, our economic interest in BlackRock was 22%. We received cash dividends from BlackRock of $115 million and $101 million during the first three months of 2019 and 2018, respectively. BlackRock is a publicly-traded company, and additional information regarding its business is available in its filings with the Securities and Exchange Commission (SEC). At March 31, 2018, our economic interest in BlackRock was 22%. We received cash dividends from BlackRock of $101 million and $89 million during the first three months of 2018 and 2017, respectively.
Table 73: Results of Businesses
|
| | | | | | | | | | | | | | | | | | | | | | | | |
Three months ended March 31
In millions | | Retail
Banking |
| | Corporate &
Institutional
Banking |
| | Asset
Management
Group |
| | BlackRock |
| | Other |
| | Consolidated (a) |
|
| 2018 | | | | | | | | | | | | |
| Income Statement | | | | | | | | | | | | |
| Net interest income | | $ | 1,218 |
| | $ | 861 |
| | $ | 74 |
| | | | $ | 208 |
| | $ | 2,361 |
|
| Noninterest income | | 635 |
| | 547 |
| | 226 |
| | $ | 235 |
| | 107 |
| | 1,750 |
|
| Total revenue | | 1,853 |
| | 1,408 |
| | 300 |
| | 235 |
| | 315 |
| | 4,111 |
|
| Provision for credit losses (benefit) | | 69 |
| | 41 |
| | (7 | ) | | | | (11 | ) | | 92 |
|
| Depreciation and amortization | | 45 |
| | 48 |
| | 12 |
| | | | 128 |
| | 233 |
|
| Other noninterest expense | | 1,350 |
| | 578 |
| | 206 |
| | | | 160 |
| | 2,294 |
|
| Income before income taxes and noncontrolling interests | | 389 |
| | 741 |
| | 89 |
| | 235 |
| | 38 |
| | 1,492 |
|
| Income taxes (benefit) | | 93 |
| | 157 |
| | 21 |
| | 38 |
| | (56 | ) | | 253 |
|
| Net income | | $ | 296 |
| | $ | 584 |
| | $ | 68 |
| | $ | 197 |
| | $ | 94 |
| | $ | 1,239 |
|
| Average Assets (b) | | $ | 88,734 |
| | $ | 151,909 |
| | $ | 7,499 |
| | $ | 7,704 |
| | $ | 120,429 |
| | $ | 376,275 |
|
| 2017 | | | | | | | | | | | | |
| Income Statement | | | | | | | | | | | | |
| Net interest income | | $ | 1,120 |
| | $ | 802 |
| | $ | 71 |
| | | | $ | 167 |
| | $ | 2,160 |
|
| Noninterest income | | 603 |
| | 524 |
| | 218 |
| | $ | 186 |
| | 193 |
| | 1,724 |
|
| Total revenue | | 1,723 |
| | 1,326 |
| | 289 |
| | 186 |
| | 360 |
| | 3,884 |
|
| Provision for credit losses (benefit) | | 71 |
| | 25 |
| | (2 | ) | | | | (6 | ) | | 88 |
|
| Depreciation and amortization | | 42 |
| | 36 |
| | 11 |
| | | | 125 |
| | 214 |
|
| Other noninterest expense | | 1,273 |
| | 548 |
| | 206 |
| | | | 161 |
| | 2,188 |
|
| Income before income taxes and noncontrolling interests | | 337 |
| | 717 |
| | 74 |
| | 186 |
| | 80 |
| | 1,394 |
|
| Income taxes (benefit) | | 124 |
| | 233 |
| | 27 |
| | 41 |
| | (105 | ) | | 320 |
|
| Net income | | $ | 213 |
| | $ | 484 |
| | $ | 47 |
| | $ | 145 |
| | $ | 185 |
| | $ | 1,074 |
|
| Average Assets (b) | | $ | 87,109 |
| | $ | 142,592 |
| | $ | 7,476 |
| | $ | 6,983 |
| | $ | 122,256 |
| | $ | 366,416 |
|
| |
(a) | There were no material intersegment revenues for the three months ended March 31, 2018 and 2017. |
| |
(b) | Period-end balances for BlackRock. |
The following table presents summarized income statement information for BlackRock, Inc.
88Table The PNC72: BlackRock, Inc. Summarized Financial Services Group, Inc. – DataForm 10-Q
|
| | | | | | |
| | Three months ended
March 31 |
| In millions | 2019 |
| 2018 |
|
| Total revenue | $ | 3,346 |
| $ | 3,583 |
|
| Total expense | 2,113 |
| 2,208 |
|
| Operating income | 1,233 |
| 1,375 |
|
| Total nonoperating income (expense) | 125 |
| (16 | ) |
| Income before income taxes | 1,358 |
| 1,359 |
|
| Income tax expense | 298 |
| 265 |
|
| Net income | 1,060 |
| 1,094 |
|
| Less: Net income attributable to noncontrolling interests | 7 |
| 5 |
|
| Net income attributable to BlackRock, Inc. | $ | 1,053 |
| $ | 1,089 |
|
NOTE 15 FEE-BASED REVENUE FROM CONTRACTS WITH CUSTOMERS
AAs more fully described in Note 23 Fee-based Revenue from Contracts with Customers in our 2018 Form 10-K, a subset of our noninterest income relates to certain fee-based revenue within the scope of ASC Topic 606 - Revenue from Contracts with Customers (Topic 606). The objective of the standard is to clarify the principles for recognizing revenue from contracts with customers across all industries and to develop a common revenue standard under U.S. GAAP. The standard requires the application of a five-step recognition model to contracts, allocating the amount of consideration we expect to be entitled to across distinct promises in the contract, called performance obligations, and recognizing revenue when or as those services are transferred to the customer.
Fee-based revenue within the scope of Topic 606 is recognized within three of our reportable business segments, Retail Banking, Corporate & Institutional Banking (C&IB) and Asset Management Group. Income recognized from our investment in BlackRock, also a reportable segment, is outside of the scope of the standard. The standardTopic 606 also excludes interest income, income from lease contracts, fair value gains from financial instruments (including derivatives), income from mortgage servicing rights and guarantee products, letter of credit fees, non-refundable fees associated with acquiring or originating a loan and gains from the sale of financial assets.
The following tables present noninterest income within the scope of Topic 606 disaggregated by segment. A description of the fee-based revenue and how it is recognized for each segment’s principal services and products follows each table.
76 The PNC Financial Services Group, Inc. – Form 10-Q
Retail Banking
Table 74:73: Retail Banking Noninterest Income Disaggregation
| | | | | | Three months ended
March 31 |
| In millions | Three months ended March 31, 2018 |
| | 2019 |
| 2018 |
|
| Product | | | | |
| Deposit account fees | $ | 144 |
| | $ | 148 |
| $ | 144 |
|
| Debit card fees | 117 |
| | 124 |
| 117 |
|
| Brokerage fees | 86 |
| | 89 |
| 86 |
|
| Merchant services | 47 |
| | 48 |
| 47 |
|
| Net credit card fees (a) | 45 |
| | 48 |
| 45 |
|
| Other | 70 |
| | 66 |
| 70 |
|
| Total in-scope noninterest income by product | $ | 509 |
| | $ | 523 |
| $ | 509 |
|
| Reconciliation to total Retail Banking noninterest income | | | | |
| Total in-scope noninterest income | $ | 509 |
| | $ | 523 |
| $ | 509 |
|
| Total out-of-scope noninterest income (b) | 126 |
| | 72 |
| 126 |
|
| Total Retail Banking noninterest income | $ | 635 |
| | $ | 595 |
| $ | 635 |
|
| |
| (a) | Net credit card fees consists of interchange fees of $112 million and $102 million and credit card reward costs of $64 million and $57 million for the three months ended March 31, 2018.2019 and 2018, respectively. |
| |
| (b) | Out-of-scope noninterest income includes revenue streams that fall under the scope of other accounting and disclosure requirements outside of Topic 606. |
Deposit Account Fees
Retail Banking provides demand deposit, money market and savings account products for consumer and small business customers. Services include online and branch banking, overdraft and wire transfer services, imaging services and cash alternative services such as money orders and cashier's checks. We recognize fee income at the time these services are performed for the customer.
Debit Card and Net Credit Card Fees
As an issuing bank, Retail Banking earns interchange fee revenue from debit and credit card transactions. By offering card products, we maintain and administer card-related services, such as credit card reward programs, account data and statement information, card activation, card renewals, and card suspension and blockage. Interchange fees are earned when cardholders make purchases and are presented net of credit card reward costs.
Brokerage Fees
Retail Banking earns fee revenue by providing its customers a wide range of investment options through its brokerage services including mutual funds, annuities, stocks, bonds, long-term care and insurance products, and managed accounts. We earn fee revenue for transaction-based brokerage services, such as the execution of market trades, once the transaction has been completed as of the trade date. In other cases, such as investment management services, we earn fee revenue over the term of the customer contract.
Merchant Services
Retail Banking earns fee revenue for debit and credit card processing services. We provide these services to merchant businesses including point-of-sale payment acceptance capabilities and customized payment processing built around the merchant’s specific requirements. We earn fee revenue as the merchant's customers make purchases.
The PNC Financial Services Group, Inc. – Form 10-Q89
Other
Other noninterest income primarily includes ATM fees earned from our customers and non-PNC customers. These fees are recognized as transactions occur.
77 The PNC Financial Services Group, Inc. – Form 10-Q
Corporate & Institutional Banking
Table 75:74: Corporate & Institutional Banking Noninterest Income Disaggregation
| |
In millions | | Three months ended
March 31 |
| In millions | Three months ended March 31, 2018 |
| | 2019 |
| 2018 |
|
| Product | | | | |
| Treasury management fees | $ | 185 |
| | $ | 199 |
| $ | 185 |
|
| Capital markets fees | 115 |
| | 127 |
| 115 |
|
| Commercial mortgage banking activities | 21 |
| | 25 |
| 21 |
|
| Other | 16 |
| | 17 |
| 16 |
|
| Total in-scope noninterest income by product | $ | 337 |
| | $ | 368 |
| $ | 337 |
|
| Reconciliation to total Corporate & Institutional Banking noninterest income | | | | |
| Total in-scope noninterest income | $ | 337 |
| | $ | 368 |
| $ | 337 |
|
| Total out-of-scope noninterest income (a) | 210 |
| | 208 |
| 210 |
|
| Total Corporate & Institutional Banking noninterest income | $ | 547 |
| | $ | 576 |
| $ | 547 |
|
| |
| (a) | Out-of-scope noninterest income includes revenue streams that fall under the scope of other accounting and disclosure requirements outside of Topic 606. |
Treasury Management Fees
C&IBCorporate & Institutional Banking provides corporations with cash and investment management services, receivables and disbursement management services, funds transfer services and access to online/mobile information management and reporting services. Treasury management fees are recognized over time as we perform these services.
Capital Markets Fees
Capital markets fees include securities underwriting fees, merger and acquisition advisory fees and other advisory related fees. We recognize these fees when the related transaction closes.
Commercial Mortgage Banking Activities
Commercial mortgage banking activities include servicing responsibilities where we do not own the servicing rights. Servicing responsibilities typically consist of collecting and remitting monthly borrower principal and interest payments, maintaining escrow deposits, performing loss mitigation and foreclosure activities, and, in certain instances, funding of servicing advances. We recognize servicing fees over time as we perform these activities.
Other
Other noninterest income within C&IBCorporate & Institutional Banking primarily comprised fees from collateral management and asset management services. We earn these fees over time as we perform these services.
Asset Management Group
Table 76:75: Asset Management Group Noninterest Income Disaggregation
| | | | | | Three months ended
March 31 |
| In millions | Three months ended March 31, 2018 |
| | 2019 |
| 2018 |
|
| Customer Type | | | | |
| Personal | $ | 154 |
| | $ | 147 |
| $ | 154 |
|
| Institutional | 68 |
| | 65 |
| 68 |
|
| Total in-scope noninterest income by customer type | $ | 222 |
| | $ | 212 |
| $ | 222 |
|
| Reconciliation to Asset Management Group noninterest income | | | | |
| Total in-scope noninterest income | $ | 222 |
| | $ | 212 |
| $ | 222 |
|
| Total out-of-scope noninterest income (a) | 4 |
| | 5 |
| 4 |
|
| Total Asset Management Group noninterest income | $ | 226 |
| | $ | 217 |
| $ | 226 |
|
| |
| (a) | Out-of-scope noninterest income includes revenue streams that fall under the scope of other accounting and disclosure requirements outside of Topic 606. |
Asset Management Services
Asset Management Group provides both personal wealth and institutional asset management services including investment management, custody services, retirement planning, family planning, trust management and retirement administration services. We recognize fee revenue over the term of the customer contract based on the value of assets under management at a point in time.
90The PNC Financial Services Group, Inc. – Form 10-Q78
NOTE16 LEASES
We lease retail branches, ATMs, datacenters, office space, land and equipment under operating and finance leases. Our leases have remaining lease terms of one year to sixty-two years, some of which may include options to renew the leases for up to ninety-nine years, and some of which may include options to terminate the leases prior to the end date. Certain leases also include options to purchase the leased asset. The exercise of lease renewal, termination and purchase options is at our sole discretion.
At adoption of ASU 2016-02 on January 1, 2019, we elected to account for the lease and nonlease components of existing real estate leases and leases of advertising assets, such as signage, as a single lease component. Effective January 1, 2019, lease and nonlease components of new lease agreements will be accounted for separately. Lease components include fixed payments including rent, real estate taxes and insurance costs and nonlease components include common-area maintenance costs. Generally, we have elected to use the Overnight Indexed Swap rate corresponding to the term of the lease at the lease measurement date as our incremental borrowing rate to measure the right-of-use asset and lease liability. Leases with an initial term of 12 months or less are not recorded on the balance sheet; we recognize lease expense for these leases on a straight-line basis over the lease term.
Certain of our lease agreements include rental payments based on a percentage of revenue and others include rental payments if certain bank deposit levels are met. Our lease agreements do not contain any material residual value guarantees or material restrictive covenants. Subleases to third parties were not material.
Operating and finance lease assets and liabilities at March 31, 2019 were as follows:
Table 76: Leases
|
| | | |
| In millions | March 31, 2019 |
| Assets | |
| Operating | $ | 2,041 |
|
| Finance | 103 |
|
| Total lease assets | $ | 2,144 |
|
| Liabilities | |
| Operating | $ | 2,198 |
|
| Finance | 109 |
|
| Total lease liabilities | $ | 2,307 |
|
Future undiscounted cash flows on our operating and finance leases are as follows:
Table 77: Maturity of Lease Liabilities
|
| | | | | | | | | |
| | March 31, 2019 |
| In millions | Operating Leases | Finance Leases | Total Leases |
| Remainder of 2019 | $ | 266 |
| $ | 31 |
| $ | 297 |
|
| 2020 | 342 |
| 36 |
| 378 |
|
| 2021 | 313 |
| 27 |
| 340 |
|
| 2022 | 275 |
| 6 |
| 281 |
|
| 2023 | 243 |
| 2 |
| 245 |
|
| After 2023 | 1,015 |
| 12 |
| 1,027 |
|
| Total lease payments | $ | 2,454 |
| $ | 114 |
| $ | 2,568 |
|
| Less: Interest | (256 | ) | (5 | ) |
|
| Present value of lease liabilities | $ | 2,198 |
| $ | 109 |
|
|
At December 31, 2018, operating lease commitments under lesee arrangements were $374 million, $346 million, $308 million, $258 million, $228 million for 2019 through 2023, respectively, and $941 million in the aggregate for all years thereafter.
The PNC Financial Services Group, Inc. – Form 10-Q79
Lease term and discount rates at March 31, 2019 were as follows:
Table 78: Lease Term and Discount Rates
|
| | |
| March 31, 2019 |
| Weighted-average remaining lease term (years) | |
| Operating leases | 9.2 |
|
| Finance leases | 4.2 |
|
| Weighted-average discount rate | |
| Operating leases | 2.34 | % |
| Finance leases | 2.31 | % |
NOTE 17 SUBSEQUENT EVENTS
On April 22, 2019, the parent company issued $1.5 billion of senior notes with a maturity date of April 23, 2029. Interest is payable semi-annually at a fixed rate of 3.45% per annum, on April 23 and October 23 of each year, beginning on October 23, 2019.
The PNC Financial Services Group, Inc. – Form 10-Q80
STATISTICAL INFORMATION (UNAUDITED)
THE PNC FINANCIAL SERVICES GROUP, INC.
Average Consolidated Balance Sheet And Net Interest Analysis (a) (b) (c)
| | | | Three months ended March 31 | | Three months ended March 31 | |
| | 2018 | | 2017 | | 2019 | | 2018 | |
Taxable-equivalent basis Dollars in millions | Average Balances |
| | Interest Income/ Expense |
| | Average Yields/ Rates |
| | Average Balances |
| | Interest Income/ Expense |
| | Average Yields/ Rates |
| | Average Balances |
| | Interest Income/ Expense |
| | Average Yields/ Rates |
| | Average Balances |
| | Interest Income/Expense |
| | Average Yields/ Rates |
| |
| Assets | | | | | | | | | | | | | | | | | | | | | | | | |
| Interest-earning assets: | | | | | | | | | | | | | | | | | | | | | | | | |
| Investment securities | | | | | | | | | | | | | | | | | | | | | | | | |
| Securities available for sale | | | | | | | | | | | | | | | | | | | | | | | | |
| Residential mortgage-backed | | | | | | | | | | | | | | | | | | | | | | | | |
| Agency | $ | 25,438 |
| | $ | 165 |
| | 2.60 | % | | $ | 26,385 |
| | $ | 169 |
| | 2.57 | % | | $ | 29,002 |
| | $ | 213 |
| | 2.94 | % | | $ | 25,438 |
| | $ | 165 |
| | 2.60 | % | |
| Non-agency | 2,398 |
| | 36 |
| | 5.99 | % | | 3,127 |
| | 44 |
| | 5.59 | % | | 1,890 |
| | 35 |
| | 7.31 | % | | 2,398 |
| | 36 |
| | 5.99 | % | |
| Commercial mortgage-backed | 4,534 |
| | 31 |
| | 2.75 | % | | 5,919 |
| | 35 |
| | 2.35 | % | | 5,368 |
| | 42 |
| | 3.13 | % | | 4,534 |
| | 31 |
| | 2.75 | % | |
| Asset-backed | 5,158 |
| | 37 |
| | 2.87 | % | | 5,992 |
| | 37 |
| | 2.50 | % | | 5,136 |
| | 43 |
| | 3.35 | % | | 5,158 |
| | 37 |
| | 2.87 | % | |
| U.S. Treasury and government agencies | 14,307 |
| | 74 |
| | 2.07 | % | | 13,101 |
| | 54 |
| | 1.66 | % | | 18,240 |
| | 114 |
| | 2.49 | % | | 14,307 |
| | 74 |
| | 2.07 | % | |
| Other | 4,233 |
| | 34 |
| | 3.17 | % | | 5,293 |
| | 39 |
| | 2.93 | % | | 3,671 |
| | 30 |
| | 3.34 | % | | 4,233 |
| | 34 |
| | 3.17 | % | |
| Total securities available for sale | 56,068 |
| | 377 |
| | 2.69 | % | | 59,817 |
| | 378 |
| | 2.53 | % | | 63,307 |
| | 477 |
| | 3.01 | % | | 56,068 |
| | 377 |
| | 2.69 | % | |
| Securities held to maturity | | | | | | | | | | | | | | | | | | | | | | | | |
| Residential mortgage-backed | 14,818 |
| | 105 |
| | 2.84 | % | | 11,852 |
| | 83 |
| | 2.79 | % | | 15,627 |
| | 118 |
| | 3.01 | % | | 14,818 |
| | 105 |
| | 2.84 | % | |
| Commercial mortgage-backed | 902 |
| | 8 |
| | 3.76 | % | | 1,458 |
| | 13 |
| | 3.50 | % | | 600 |
| | 5 |
| | 3.53 | % | | 902 |
| | 8 |
| | 3.76 | % | |
| Asset-backed | 199 |
| | 1 |
| | 2.90 | % | | 556 |
| | 3 |
| | 2.21 | % | | 177 |
| | 2 |
| | 3.83 | % | | 199 |
| | 1 |
| | 2.90 | % | |
| U.S. Treasury and government agencies | 743 |
| | 5 |
| | 2.80 | % | | 529 |
| | 4 |
| | 3.07 | % | | 760 |
| | 5 |
| | 2.81 | % | | 743 |
| | 5 |
| | 2.80 | % | |
| Other | 1,926 |
| | 23 |
| | 4.44 | % | | 2,041 |
| | 27 |
| | 5.34 | % | | 1,847 |
| | 20 |
| | 4.40 | % | | 1,926 |
| | 23 |
| | 4.44 | % | |
| Total securities held to maturity | 18,588 |
| | 142 |
| | 3.05 | % | | 16,436 |
| | 130 |
| | 3.16 | % | | 19,011 |
| | 150 |
| | 3.16 | % | | 18,588 |
| | 142 |
| | 3.05 | % | |
| Total investment securities | 74,656 |
| | 519 |
| | 2.78 | % | | 76,253 |
| | 508 |
| | 2.67 | % | | 82,318 |
| | 627 |
| | 3.05 | % | | 74,656 |
| | 519 |
| | 2.78 | % | |
| Loans | | | | | | | | | | | | | | | | | | | | | | | | |
| Commercial | 111,462 |
| | 1,044 |
| | 3.74 | % | | 103,084 |
| | 835 |
| | 3.24 | % | | 119,345 |
| | 1,291 |
| | 4.33 | % | | 111,462 |
| | 1,044 |
| | 3.74 | % | |
| Commercial real estate | 28,901 |
| | 276 |
| | 3.81 | % | | 29,178 |
| | 239 |
| | 3.27 | % | | 28,147 |
| | 307 |
| | 4.37 | % | | 28,901 |
| | 276 |
| | 3.81 | % | |
| Equipment lease financing | 7,845 |
| | 73 |
| | 3.68 | % | | 7,497 |
| | 63 |
| | 3.34 | % | | 7,263 |
| | 71 |
| | 3.93 | % | | 7,845 |
| | 73 |
| | 3.68 | % | |
| Consumer | 55,588 |
| | 667 |
| | 4.87 | % | | 56,843 |
| | 626 |
| | 4.47 | % | | 54,996 |
| | 751 |
| | 5.54 | % | | 55,588 |
| | 667 |
| | 4.87 | % | |
| Residential real estate | 17,308 |
| | 190 |
| | 4.40 | % | | 15,651 |
| | 178 |
| | 4.55 | % | | 18,794 |
| | 202 |
| | 4.29 | % | | 17,308 |
| | 190 |
| | 4.40 | % | |
| Total loans | 221,104 |
| | 2,250 |
| | 4.09 | % | | 212,253 |
| | 1,941 |
| | 3.67 | % | | 228,545 |
| | 2,622 |
| | 4.61 | % | | 221,104 |
| | 2,250 |
| | 4.09 | % | |
| Interest-earning deposits with banks | 25,667 |
| | 98 |
| | 1.52 | % | | 24,192 |
| | 49 |
| | .81 | % | | 15,017 |
| | 91 |
| | 2.43 | % | | 25,667 |
| | 98 |
| | 1.52 | % | |
| Other interest-earning assets | 7,904 |
| | 80 |
| | 4.11 | % | | 8,395 |
| | 74 |
| | 3.54 | % | | 11,068 |
| | 115 |
| | 4.14 | % | | 7,904 |
| | 80 |
| | 4.11 | % | |
| Total interest-earning assets/interest income | 329,331 |
| | $ | 2,947 |
| | 3.59 | % | | 321,093 |
| | $ | 2,572 |
| | 3.22 | % | | 336,948 |
| | 3,455 |
| | 4.11 | % | | 329,331 |
| | 2,947 |
| | 3.59 | % | |
| Noninterest-earning assets | 46,944 |
| | | | | | 45,323 |
| | | | | | 48,950 |
| | | | | | 46,944 |
| | | | | |
| Total assets | $ | 376,275 |
| | | | | | $ | 366,416 |
| | | | | | $ | 385,898 |
| | | | | | $ | 376,275 |
| | | | | |
| Liabilities and Equity | | | | | | | | | | | | | | | | | | | | | | | | |
| Interest-bearing liabilities: | | | | | | | | | | | | | | | | | | | | | | | | |
| Interest-bearing deposits | | | | | | | | | | | | | | | | | | | | | | | | |
| Money market | $ | 58,523 |
| | $ | 78 |
| | .54 | % | | $ | 63,921 |
| | $ | 36 |
| | .23 | % | | $ | 54,702 |
| | 155 |
| | 1.15 | % | | $ | 58,523 |
| | $ | 78 |
| | .54 | % | |
| Demand | 59,620 |
| | 31 |
| | .21 | % | | 56,797 |
| | 14 |
| | .10 | % | | 63,480 |
| | 81 |
| | .52 | % | | 59,620 |
| | 31 |
| | .21 | % | |
| Savings | 48,451 |
| | 68 |
| | .57 | % | | 39,095 |
| | 41 |
| | .42 | % | | 58,821 |
| | 164 |
| | 1.13 | % | | 48,451 |
| | 68 |
| | .57 | % | |
| Time deposits | 16,844 |
| | 36 |
| | .88 | % | | 17,058 |
| | 29 |
| | .69 | % | | 18,813 |
| | 72 |
| | 1.55 | % | | 16,844 |
| | 36 |
| | .88 | % | |
| Total interest-bearing deposits | 183,438 |
| | 213 |
| | .47 | % | | 176,871 |
| | 120 |
| | .28 | % | | 195,816 |
| | 472 |
| | .98 | % | | 183,438 |
| | 213 |
| | .47 | % | |
| Borrowed funds | | | | | | | | | | | | | | | | | | | | | | | | |
| Federal Home Loan Bank borrowings | 20,721 |
| | 91 |
| | 1.76 | % | | 20,416 |
| | 56 |
| | 1.09 | % | | 21,491 |
| | 149 |
| | 2.77 | % | | 20,721 |
| | 91 |
| | 1.76 | % | |
| Bank notes and senior debt | 28,987 |
| | 176 |
| | 2.43 | % | | 22,992 |
| | 107 |
| | 1.85 | % | | 25,418 |
| | 223 |
| | 3.50 | % | | 28,987 |
| | 176 |
| | 2.43 | % | |
| Subordinated debt | 5,179 |
| | 51 |
| | 3.91 | % | | 7,102 |
| | 62 |
| | 3.49 | % | | 5,883 |
| | 66 |
| | 4.50 | % | | 5,179 |
| | 51 |
| | 3.91 | % | |
| Other | 4,751 |
| | 26 |
| | 2.18 | % | | 4,432 |
| | 15 |
| | 1.36 | % | | 6,991 |
| | 43 |
| | 2.44 | % | | 4,751 |
| | 26 |
| | 2.18 | % | |
| Total borrowed funds | 59,638 |
| | 344 |
| | 2.31 | % | | 54,942 |
| | 240 |
| | 1.74 | % | | 59,783 |
| | 481 |
| | 3.21 | % | | 59,638 |
| | 344 |
| | 2.31 | % | |
| Total interest-bearing liabilities/interest expense | 243,076 |
| | 557 |
| | .91 | % | | 231,813 |
| | 360 |
| | .62 | % | | 255,599 |
| | 953 |
| | 1.50 | % | | 243,076 |
| | 557 |
| | .91 | % | |
| Noninterest-bearing liabilities and equity: | | | | | | | | | | | | | | | | | | | | | | | | |
| Noninterest-bearing deposits | 77,222 |
| | | | | | 78,050 |
| | | | | | 71,402 |
| | | | | | 77,222 |
| | | | | |
| Accrued expenses and other liabilities | 9,118 |
| | | | | | 10,081 |
| | | | | | 11,242 |
| | | | | | 9,118 |
| | | | | |
| Equity | 46,859 |
| | | | | | 46,472 |
| | | | | | 47,655 |
| | | | | | 46,859 |
| | | | | |
| Total liabilities and equity | $ | 376,275 |
| | | | | | $ | 366,416 |
| | | | | | $ | 385,898 |
| | | | | | $ | 376,275 |
| | | | | |
| Interest rate spread | | | | | 2.68 | % | | | | | | 2.60 | % | | | | | | 2.61 | % | | | | | | 2.68 | % | |
| Impact of noninterest-bearing sources | | | | | .23 |
| | | | | | .17 |
| | | | | | .37 |
| | | | | | .23 |
| |
| Net interest income/margin | | | $ | 2,390 |
| | 2.91 | % | | | | $ | 2,212 |
| | 2.77 | % | | | | $ | 2,502 |
| | 2.98 | % | | | | $ | 2,390 |
| | 2.91 | % | |
(continued on following page)
The PNC Financial Services Group, Inc. – Form 10-Q 9181
Average Consolidated Balance Sheet And Net Interest Analysis (a) (b) (c) (Continued)
| | | | Three months ended December 31 | | Three months ended December 31 | |
| | 2017 | | 2018 | |
Taxable-equivalent basis Dollars in millions | Average Balances |
| | Interest Income/ Expense |
| | Average Yields/ Rates |
| | Average
Balances |
| | Interest Income/
Expense |
| | Average Yields/
Rates |
| |
| Assets | | | | | | | | | | | | |
| Interest-earning assets: | | | | | | | | | | | | |
| Investment securities | | | | | | | | | | | | |
| Securities available for sale | | | | | | | | | | | | |
| Residential mortgage-backed | | | | | | | | | | | | |
| Agency | $ | 25,338 |
| | $ | 164 |
| | 2.58 | % | | $ | 28,375 |
| | $ | 203 |
| | 2.86 | % | |
| Non-agency | 2,577 |
| | 27 |
| | 4.29 | % | | 1,993 |
| | 35 |
| | 7.08 | % | |
| Commercial mortgage-backed | 4,542 |
| | 53 |
| | 4.68 | % | | 4,830 |
| | 36 |
| | 2.99 | % | |
| Asset-backed | 5,330 |
| | 38 |
| | 2.82 | % | | 5,186 |
| | 42 |
| | 3.24 | % | |
| U.S. Treasury and government agencies | 13,646 |
| | 62 |
| | 1.79 | % | | 18,443 |
| | 113 |
| | 2.41 | % | |
| Other | 4,940 |
| | 42 |
| | 3.32 | % | | 3,920 |
| | 33 |
| | 3.37 | % | |
| Total securities available for sale | 56,373 |
| | 386 |
| | 2.73 | % | | 62,747 |
| | 462 |
| | 2.93 | % | |
| Securities held to maturity | | | | | | | | | | | | |
| Residential mortgage-backed | 13,976 |
| | 96 |
| | 2.74 | % | | 15,941 |
| | 119 |
| | 2.98 | % | |
| Commercial mortgage-backed | 963 |
| | 10 |
| | 4.11 | % | | 648 |
| | 6 |
| | 3.68 | % | |
| Asset-backed | 220 |
| | 2 |
| | 2.66 | % | | 185 |
| | 2 |
| | 3.76 | % | |
| U.S. Treasury and government agencies | 739 |
| | 5 |
| | 2.85 | % | | 756 |
| | 5 |
| | 2.86 | % | |
| Other | 1,974 |
| | 25 |
| | 5.28 | % | | 1,856 |
| | 21 |
| | 4.41 | % | |
| Total securities held to maturity | 17,872 |
| | 138 |
| | 3.10 | % | | 19,386 |
| | 153 |
| | 3.14 | % | |
| Total investment securities | 74,245 |
| | 524 |
| | 2.82 | % | | 82,133 |
| | 615 |
| | 2.98 | % | |
| Loans | | | | | | | | | | | | |
| Commercial | 111,365 |
| | 1,020 |
| | 3.59 | % | | 116,596 |
| | 1,243 |
| | 4.17 | % | |
| Commercial real estate | 29,432 |
| | 277 |
| | 3.68 | % | | 28,382 |
| | 320 |
| | 4.42 | % | |
| Equipment lease financing | 7,670 |
| | 45 |
| | 2.33 | % | | 7,216 |
| | 68 |
| | 3.77 | % | |
| Consumer | 55,814 |
| | 665 |
| | 4.72 | % | | 55,331 |
| | 742 |
| | 5.32 | % | |
| Residential real estate | 16,840 |
| | 186 |
| | 4.41 | % | | 18,405 |
| | 203 |
| | 4.41 | % | |
| Total loans | 221,121 |
| | 2,193 |
| | 3.91 | % | | 225,930 |
| | 2,576 |
| | 4.49 | % | |
| Interest-earning deposits with banks | 25,567 |
| | 85 |
| | 1.33 | % | | 16,691 |
| | 93 |
| | 2.25 | % | |
| Other interest-earning assets | 8,759 |
| | 77 |
| | 3.55 | % | | 10,431 |
| | 103 |
| | 3.93 | % | |
| Total interest-earning assets/interest income | 329,692 |
| | $ | 2,879 |
| | 3.45 | % | | 335,185 |
| | 3,387 |
| | 3.99 | % | |
| Noninterest-earning assets | 47,136 |
| | | | | | 47,906 |
| | | | | |
| Total assets | $ | 376,828 |
| | | | | | $ | 383,091 |
| | | | | |
| Liabilities and Equity | | | | | | | | | | | | |
| Interest-bearing liabilities: | | | | | | | | | | | | |
| Interest-bearing deposits | | | | | | | | | | | | |
| Money market | $ | 60,954 |
| | $ | 69 |
| | .45 | % | | $ | 55,228 |
| | $ | 137 |
| | .99 | % | |
| Demand | 57,128 |
| | 25 |
| | .17 | % | | 62,207 |
| | 73 |
| | .46 | % | |
| Savings | 45,817 |
| | 59 |
| | .51 | % | | 55,065 |
| | 144 |
| | 1.04 | % | |
| Time deposits | 17,438 |
| | 37 |
| | .85 | % | | 18,743 |
| | 65 |
| | 1.38 | % | |
| Total interest-bearing deposits | 181,337 |
| | 190 |
| | .42 | % | | 191,243 |
| | 419 |
| | .87 | % | |
| Borrowed funds | | | | | | | | | | | | |
| Federal Home Loan Bank borrowings | 19,565 |
| | 75 |
| | 1.48 | % | | 20,683 |
| | 136 |
| | 2.57 | % | |
| Bank notes and senior debt | 27,778 |
| | 145 |
| | 2.04 | % | | 26,380 |
| | 224 |
| | 3.31 | % | |
| Subordinated debt | 5,433 |
| | 48 |
| | 3.49 | % | | 5,874 |
| | 65 |
| | 4.44 | % | |
| Other | 5,261 |
| | 22 |
| | 1.74 | % | | 5,847 |
| | 34 |
| | 2.36 | % | |
| Total borrowed funds | 58,037 |
| | 290 |
| | 1.96 | % | | 58,784 |
| | 459 |
| | 3.07 | % | |
| Total interest-bearing liabilities/interest expense | 239,374 |
| | 480 |
| | .79 | % | | 250,027 |
| | 878 |
| | 1.38 | % | |
| Noninterest-bearing liabilities and equity: | | | | | | | | | | | | |
| Noninterest-bearing deposits | 80,152 |
| | | | | | 75,228 |
| | | | | |
| Accrued expenses and other liabilities | 10,801 |
| | | | | | 10,833 |
| | | | | |
| Equity | 46,501 |
| | | | | | 47,003 |
| | | | | |
| Total liabilities and equity | $ | 376,828 |
| | | | | | $ | 383,091 |
| | | | | |
| Interest rate spread | | | | | 2.66 | % | | | | | | 2.61 | % | |
| Impact of noninterest-bearing sources | | | | | .22 |
| | | | | | .35 |
| |
| Net interest income/margin | | | $ | 2,399 |
| | 2.88 | % | | | | $ | 2,509 |
| | 2.96 | % | |
| |
| (a) | Nonaccrual loans are included in loans, net of unearned income. The impact of financial derivatives used in interest rate risk management is included in the interest income/expense and average yields/rates of the related assets and liabilities. Basis adjustments related to hedged items are included in noninterest-earning assets and noninterest-bearing liabilities. Average balances of securities are based on amortized historical cost (excluding adjustments to fair value, which are included in other assets). Average balances for certain loans and borrowed funds accounted for at fair value are included in noninterest-earning assets and noninterest-bearing liabilities, with changes in fair value recorded in Noninterest income, are included in noninterest-earning assets and noninterest-bearing liabilities.income. |
| |
| (b) | Loan fees for the three months ended March 31, 2018,2019, December 31, 20172018 and March 31, 20172018 were $32$28 million, $37$40 million and $24$32 million, respectively. |
| |
| (c) | Interest income calculated as taxable-equivalent interest income. To provide more meaningful comparisons of interest income and yields for all interest-earning assets, as well as net interest margins, we use interest income on a taxable-equivalent basis in calculating average yields and net interest margin by increasing the interest income earned on tax-exempt assets to make it fully equivalent to interest income earned on taxable investments. This adjustment is not permitted under GAAP. See Reconciliation of Taxable-Equivalent Net Interest Income in this Statistical Information section for more information. |
9282 The PNC Financial Services Group, Inc. – Form 10-Q
RECONCILIATION OF TAXABLE-EQUIVALENT NET INTEREST INCOME (NON-GAAP) (a)
| | | | | Three months ended | | | Three months ended | |
| In millions | | March 31, 2018 |
| | December 31, 2017 |
| | March 31, 2017 |
| | | March 31, 2019 |
| | December 31, 2018 |
| | March 31, 2018 |
| |
| Net interest income (GAAP) | | $ | 2,361 |
| | $ | 2,345 |
| | $ | 2,160 |
| | | $ | 2,475 |
| | $ | 2,481 |
| | $ | 2,361 |
| |
| Taxable-equivalent adjustments | | 29 |
| | 54 |
| | 52 |
| | | 27 |
| | 28 |
| | 29 |
| |
| Net interest income (Non-GAAP) | | $ | 2,390 |
| | $ | 2,399 |
| | $ | 2,212 |
| | | $ | 2,502 |
| | $ | 2,509 |
| | $ | 2,390 |
| |
| |
| (a) | The interest income earned on certain earninginterest-earning assets is completely or partially exempt from federal income tax. As such, these tax-exempt instruments typically yield lower returns than taxable investments. To provide more meaningful comparisons of net interest income, we use interest income on a taxable-equivalent basis by increasing the interest income earned on tax-exempt assets to make it fully equivalent to interest income earned on taxable investments. This adjustment is not permitted under GAAP. As a result of the Tax Cuts and Jobs Act, which was enacted into law during the fourth quarter of 2017, the statutory tax rate for corporations was lowered to 21% from 35%, effective January 1, 2018. Amounts for the 2017 periods were calculated using the previously applicable statutory federal income tax rate of 35%. |
TRANSITIONAL BASEL III AND FULLY PHASED-IN BASEL III COMMON EQUITY TIER 1 CAPITAL RATIOS (NON-GAAP) – MARCH 31, 2017
|
| | | | | | | | | | |
| | | 2017 Transitional Basel III (a) | | | Fully Phased-In Basel III (Non-GAAP) (b) | |
| Dollars in millions | | March 31
2017 |
| | | March 31
2017 |
| |
| Common stock, related surplus and retained earnings, net of treasury stock | | $ | 42,053 |
| | | $ | 42,053 |
| |
| Less regulatory capital adjustments: | | | | | | |
| Goodwill and disallowed intangibles, net of deferred tax liabilities | | (9,007 | ) | | | (9,052 | ) | |
| Basel III total threshold deductions | | (1,064 | ) | | | (1,585 | ) | |
| Accumulated other comprehensive income (c) | | (295 | ) | | | (369 | ) | |
| All other adjustments | | (183 | ) | | | (180 | ) | |
| Basel III Common equity Tier 1 capital | | $ | 31,504 |
| | | $ | 30,867 |
| |
| Basel III standardized approach risk-weighted assets (d) | | $ | 300,233 |
| | | $ | 308,392 |
| |
| Basel III advanced approaches risk-weighted assets (e) | | N/A |
| | | $ | 278,938 |
| |
| Basel III Common equity Tier 1 capital ratio | | 10.5 | % | | | 10.0 | % | |
| Risk weight and associated rules utilized | | Standardized (with 2017 transition adjustments) |
| | | Standardized |
| |
| |
(a) | Calculated using the regulatory capital methodology applicable to PNC during 2017. |
| |
(b) | 2017 Fully Phased-In Basel III results are presented as Pro forma estimates. |
| |
(c) | Represents net adjustments related to accumulated other comprehensive income for securities currently and previously held as available for sale, as well as pension and other postretirement plans. |
| |
(d) | Includes credit and market risk-weighted assets. |
| |
(e) | Basel III advanced approaches risk-weighted assets are calculated based on the Basel III advanced approaches rules, and include credit, market, and operational risk-weighted assets. During the parallel run qualification phase, PNC has refined the data, models, and internal processes used as part of the advanced approaches for determining risk-weighted assets. We anticipate additional refinements to this calculation through the parallel run qualification phase. |
PART II – OTHER INFORMATION
ITEM 1. LEGAL PROCEEDINGS
See the information set forth in Note 12 Legal Proceedings in the Notes To Consolidated Financial Statements under Part I, Item 1 of this Report, which is incorporated by reference in response to this item.
ITEM 1A. RISK FACTORS
There are no material changes in our risk factors from those previously disclosed in PNC’s 20172018 Form 10-K in response to Part I, Item 1A.
The PNC Financial Services Group, Inc. – Form 10-Q93
ITEM 2. UNREGISTERED SALES OF EQUITY SECURITIES AND USE OF PROCEEDS
Details of our repurchases of PNC common stock during the first quarter of 20182019 are included in the following table:
| | 2018 period
In thousands, except per share data | Total shares purchased (a) |
| Average price paid per share |
| Total shares purchased as part of publicly announced programs (b) |
| Maximum number of shares that may yet be purchased under the programs (b) |
| |
2019 period
In thousands, except per share data | | Total shares purchased (a) |
| Average price paid per share |
| Total shares purchased as part of publicly announced programs (b) |
| Maximum number of shares that may yet be purchased under the programs (b) |
|
| January 1 - 31 | 1,708 |
| $ | 152.08 |
| 1,698 |
| 38,939 |
| 4,014 |
| $ | 121.50 |
| 4,010 |
| 16,704 |
|
| February 1 - 28 | 2,001 |
| $ | 155.77 |
| 1,493 |
| 37,446 |
| 1,481 |
| $ | 122.97 |
| 914 |
| 15,790 |
|
| March 1 - 31 | 1,660 |
| $ | 157.08 |
| 1,629 |
| 35,817 |
| 992 |
| $ | 125.83 |
| 992 |
| 14,798 |
|
| Total | 5,369 |
| $ | 155.00 |
| | | 6,487 |
| $ | 122.50 |
| | |
| |
| (a) | Includes PNC common stock purchased in connection with our various employee benefit plans generally related to shares used to cover employee payroll tax withholding requirements. Note 11 Employee Benefit Plans and Note 12 Stock Based Compensation Plans in the Notes To Consolidated Financial Statements of our 20172018 Annual Report on Form 10-K include additional information regarding our employee benefit and equity compensation plans that use PNC common stock. |
| |
| (b) | On March 11, 2015, we announced that our Board of Directors approved the establishment of a stock repurchase program authorization in the amount of 100 million shares of PNC common stock, effective April 1, 2015. Repurchases are made in open market or privately negotiated transactions and the timing and exact amount of common stock repurchases will depend on a number of factors including, among others, market and general economic conditions, regulatory capital considerations, alternative uses of capital, the potential impact on our credit ratings, and contractual and regulatory limitations, including the results of the supervisory assessment of capital adequacy and capital planning processes undertaken by the Federal Reserve as part of the CCAR process. In June 2017,2018, we announced share repurchase programs of up to $2.7$2.0 billion for the four quarter period beginning with the third quarter of 2017,2018, including repurchases of up to $300 million related to employee benefit plans, in accordance with PNC's 20172018 capital plan. In the first quarter of 2018,2019, we repurchased 4.85.9 million shares of common stock on the open market, with an average price of $155.07$122.54 per share and an aggregate repurchase price of $.7 billion. |
ITEM 6. EXHIBITS
The following exhibit index lists Exhibits filed, or in the case of Exhibits 32.1 and 32.2 furnished, with this Quarterly Report on Form 10-Q:
|
| | |
EXHIBIT INDEX |
12.1 | | |
| |
12.2 | | |
| |
| 31.1 | | |
| | |
| 31.2 | | |
| | |
| 32.1 | | |
| | |
| 32.2 | | |
| | | |
| 101 | | Interactive Data File (XBRL) |
You can obtain copies of these Exhibits electronically at the SEC’s website at www.sec.gov or by mail from the Public Reference Section of the SEC at 100 F Street, N.E., Washington, DC 20549 at prescribed rates.www.sec.gov. The Exhibits are also available as part of this Form 10-Q on PNC’s corporate website at www.pnc.com/secfilings. Shareholders and bondholders may also obtain copies of Exhibits, without charge, by contacting Shareholder Relations at 800-843-2206 or via e-mail at investor.relations@pnc.com. The interactive data file (XBRL) exhibit is only available electronically.
The PNC Financial Services Group, Inc. – Form 10-Q83
CORPORATE INFORMATION
The PNC Financial Services Group, Inc.
Corporate Headquarters
The PNC Financial Services Group, Inc.
The Tower at PNC Plaza
300 Fifth Avenue
Pittsburgh, Pennsylvania 15222-2401
888-762-2265
Stock Listing
The common stock of The PNC Financial Services Group, Inc. is listed on the New York Stock Exchange under the symbol “PNC”.
94 The PNC Financial Services Group, Inc. – Form 10-Q
Internet Information
Our financial reports and information about our products and services are available on the internet at www.pnc.com. We provide information for investors on our corporate website under “About Us – Investor Relations.” We use our Twitter account, @pncnews, as an additional way of disseminating to the public information that may be relevant to investors.
We generally post the following under “About Us – Investor Relations” shortly before or promptly following its first use or release: financially-related press releases, including earnings releases and supplemental financial information, various SEC filings, including annual, quarterly and current reports and proxy statements, presentation materials associated with earnings and other investor conference calls or events, and access to live and recorded audio from earnings and other investor conference calls or events. In some cases, we may post the presentation materials for other investor conference calls or events several days prior to the call or event. When warranted, we will also use our website to expedite public access to time-critical information regarding PNC in advance of distribution of a press release or a filing with the SEC disclosing the same information. For earnings and other conference calls or events, we generally include in our posted materials a cautionary statement regarding forward-looking and adjustednon-GAAP financial information, and we provide GAAP reconciliations when we refer to adjusted information and results. Where applicable, we provideinclude non-GAAP financial information. Such GAAP reconciliations for such additional informationmay be in materials for that event orthe applicable presentation, in materials for other prior investor presentations or in our annual, quarterly or current reports.
We may on occasion use our corporate website to expedite public access to time-critical information regarding PNC instead of using a press release or a filing with the SEC for first disclosure of the information. In some circumstances, the information may be relevant to investors but directed at customers, in which case it may be accessed directly through the home page rather than "About Us--Investor Relations."
We are required periodically to provide additional public disclosure regarding estimated income, losses and pro forma regulatory capital ratios under supervisory and PNC-developed hypothetical severely adverse economic scenarios, as well as information concerning our capital stress testing processes, pursuant to the stress testing regulations adopted by the Federal Reserve and the OCC. We are also required to make certain additional regulatory capital-related public disclosures about our capital structure, risk exposures, risk assessment processes, risk-weighted assets and overall capital adequacy, including market risk-related disclosures and certain public disclosures regarding our liquidity position and liquidity risk management, under the regulatory capital rules adopted by the Federal banking agencies. Under these regulations, we may satisfy these requirements through postings on our website, and we have done so and expect to continue to do so without also providing disclosure of this information through filings with the SEC.
Other information posted on our corporate website that may not be available in our filings with the SEC includes information relating to our corporate governance and annual communications from our chairman to shareholders, as well as our corporate social responsibility activities under “About"About Us – Corporate Responsibility.”"
Where we have included web addresses in this Report, such as our web address and the web address of the SEC, we have included those web addresses as inactive textual references only. Except as specifically incorporated by reference into this Report, information on those websites is not part hereof.
Financial Information
We are subject to the informational requirements of the Securities Exchange Act of 1934 (Exchange Act) and, in accordance with the Exchange Act, we file annual, quarterly and current reports, proxy statements and other information with the SEC. Our SEC File Number is 001-09718. You can obtain copies of these and other filings, including exhibits, electronically at the SEC’s internet website at www.sec.gov or on our corporate internet website at www.pnc.com/secfilings. Shareholders and bond holders may also obtain copies of these filings without charge by contacting Shareholder Services at 800-982-7652 or via the online contact form at www.computershare.com/contactus for copies without exhibits, and by contacting Shareholder Relations at 800-843-2206 or via email atto investor.relations@pnc.com for copies of exhibits, including financial statement and schedule exhibits where applicable. The interactive data file (XBRL) exhibit is only available electronically.
84 The PNC Financial Services Group, Inc. – Form 10-Q
Corporate Governance at PNC
Information about our Board of Directors and its committees and corporate governance, atincluding our PNC Code of Business Conduct and Ethics (as amended from time to time), is available on our corporate website at www.pnc.com/corporategovernance including our PNC Code of Business Conduct and Ethics.corporategovernance. In addition, any future amendments to, or waivers from, a provision of the PNC Code of Business Conduct and Ethics that applies to our directors or executive officers (including our principal executive officer, principal financial officer and principal accounting officer or controller) will be posted at this internet address.
Shareholders who would like to request printed copies of the PNC Code of Business Conduct and Ethics or our Corporate Governance Guidelines or the charters of our Board’s Audit, Nominating and Governance, Personnel and Compensation, or Risk Committees (all of which are posted on the PNC corporate website) may do so by sending their requests to our Corporate Secretary at corporate headquarters at the above address. Copies will be provided without charge to shareholders.
Inquiries
For financial services call 888-762-2265.
Registered shareholders should contact Shareholder Services at 800-982-7652.
The PNC Financial Services Group, Inc. – Form 10-Q95
Analysts and institutional investors should contact Bryan Gill, Executive Vice President, Director of Investor Relations, at 412-768-4143 or via email at investor.relations@pnc.com.
News media representatives should contact Diane Zappas, Vice President, Corporate Communications,PNC Media Relations at 412-762-4550 or via email at media.relations@pnc.com.
Common Stock Prices/Dividends Declared
The table below sets forth by quarter the range of high and low sale and quarter-end closing prices for our common stock and the cash dividends declared per common share.
|
| | | | | | | | | | | | | | | | |
| | High |
| | Low |
| | Close |
| | Cash Dividends Declared (a) |
| |
| 2018 Quarter | | | | | | | | |
| First | $ | 163.59 |
| | $ | 143.94 |
| | $ | 151.24 |
| | $ | .75 |
| |
| 2017 Quarter | | | | | | | | |
| First | $ | 131.83 |
| | $ | 113.66 |
| | $ | 120.24 |
| | $ | .55 |
| |
| Second | $ | 128.25 |
| | $ | 115.45 |
| | $ | 124.87 |
| | .55 |
| |
| Third | $ | 135.73 |
| | $ | 119.77 |
| | $ | 134.77 |
| | .75 |
| |
| Fourth | $ | 147.28 |
| | $ | 130.46 |
| | $ | 144.29 |
| | .75 |
| |
| Total | | | | | | | $ | 2.60 |
| |
| |
(a) | Our Board approved a second quarter 2018 cash dividend of $.75 per common share, with a payment date of May 5, 2018. |
Dividend Policy
Holders of PNC common stock are entitled to receive dividends when declared by the Board of Directors out of funds legally available for this purpose. Our Board of Directors may not pay or set apart dividends on the common stock until dividends for all past dividend periods on any series of outstanding preferred stock have been paid or declared and set apart for payment. The Board presently intends to continue the policy of paying quarterly cash dividends. The amount of any future dividends will depend on economic and market conditions, our financial condition and operating results, and other factors, including contractual restrictions and applicable government regulations and policies (such as those relating to the ability of bank and non-bank subsidiaries to pay dividends to the parent company and regulatory capital limitations). The amount of our dividend is also currently subject to the results of the supervisory assessment of capital adequacy and capital planning processes undertaken by the Federal Reserve as part of the CCAR process as described in the Capital Management portion of the Risk Management section of the Financial Review of this Report and in the Supervision and Regulation section in Item 1 of our 20172018 Form 10-K.
Dividend Reinvestment and Stock Purchase Plan
The PNC Financial Services Group, Inc. Dividend Reinvestment and Stock Purchase Plan enables holders of our common stock to conveniently purchase additional shares of common stock. You can obtain a prospectus and enrollment form by contacting Shareholder Services at 800-982-7652. Registered shareholders may also contact this phone number regarding dividends and other shareholder services.
Stock Transfer Agent and Registrar
Computershare Trust Company, N.A.
250 Royall Street
Canton, MA 02021
800-982-7652
www.computershare.com/pnc
SIGNATURE
Pursuant to the requirements of the Securities Exchange Act of 1934, the registrant has duly caused this report to be signed on May 3, 20182019 on its behalf by the undersigned thereunto duly authorized.
|
|
| Robert Q. Reilly |
| Executive Vice President and Chief Financial Officer |
| (Principal Financial Officer) |
96The PNC Financial Services Group, Inc. – Form 10-Q85